12.1 | Certifications pursuant to Rule 13a-14(a) or Rule 15d-14(a) under the Securities Exchange Act of | |
|
| |
13.1 | Certifications Pursuant to 18 | |
|
| |
| Consent of Independent Registered Public Accounting Firm (filed herewith). |
Pursuant to Instruction 2(b) (i) in the “Instructions as to Exhibits” in Form 20-F, various instruments defining the rights of holders of long-term debt securities issued by the Company are not being filed herewith because such debt securities are not registered with the Commission and the total amount of debt securities authorized under each such instrument does not exceed 10% of the total assets of the Company. The Company hereby agrees to furnish a copy of any such instrument to the Commission upon request.
AB SVENSK EXPORTKREDIT (Swedish Export Credit Corporation)
To the Board of Directors and shareholder of
AB Svensk Exportkredit:
We have audited the accompanying consolidated statements of financial position of AB Svensk Exportkredit (Swedish Export Credit Corporation) (the “Company”) as of December 31, 20112012 and 2010,2011, and the related consolidated statements of comprehensive income, equity and cash flows for each of the three years in the period ended December 31, 2011.2012. These consolidated financial statements are the responsibility of the Company’s management. Our responsibility is to express an opinion on these consolidated financial statements based on our audits.
We conducted our auditaudits in accordance with the standards of the Public Company Accounting Oversight Board (United States). Those standards require that we plan and perform the audit to obtain reasonable assurance about whether the financial statements are free of material misstatement. We were not engaged to perform an audit of the Company’s internal controls over financial reporting. Our auditaudits included consideration of internal control over financial reporting as a basis for designing audit procedures that are appropriate in the circumstances, but not for the purpose of expressing an opinion on the effectiveness of the Company’s internal control over financial reporting. Accordingly, we express no such opinion. An audit also includes examining, on a test basis, evidence supporting the amounts and disclosures in the financial statements, assessing the accounting principles used and significant estimates made by management and evaluating the overall financial statement presentation. We believe that our audit providesaudits provide a reasonable basis for our opinion.
In our opinion, the financial statements referred to above present fairly, in all material respects, the consolidated financial position of AB Svensk Exportkredit at December 31, 20112012 and 2010,2011, and the consolidated results of its operations and itsit’s cash flows for each of the three years in the period ended December 31, 2011,2012, in conformity with International Financial Reporting Standards as issued by the International Accounting Standards Board.
| Ernst & Young AB | ||
|
|
| |
| By | /s/ Jan Birgerson | |
|
| Jan Birgerson | |
|
| Authorized Public Accountant | |
|
| ||
|
| ||
Stockholm, Sweden |
| ||
| February 27, 2013 |
| |
CONSOLIDATED STATEMENT OF COMPREHENSIVE INCOME
Skr mn |
| Note |
| 2011 |
| 2010 |
| 2009 |
|
| Note |
| 2012 |
| 2011 |
| 2010 |
|
Interest revenues |
|
|
| 10,223.0 |
| 12,183.1 |
| 13,306.4 |
|
|
|
| 10,352.3 |
| 10,223.0 |
| 12,183.1 |
|
Interest expenses |
|
|
| -8,352.2 |
| -10,284.6 |
| -11,312.1 |
|
|
|
| -8,472.4 |
| -8,352.2 |
| -10,284.6 |
|
Net interest revenues |
| 2 |
| 1,870.8 |
| 1,898.5 |
| 1,994.3 |
|
| 2 |
| 1,879.9 |
| 1,870.8 |
| 1,898.5 |
|
|
|
|
|
|
|
|
|
|
|
|
|
|
|
|
|
|
|
|
Commissions earned |
| 3 |
| 12.3 |
| 19.7 |
| 26.2 |
|
| 3 |
| 11.1 |
| 12.3 |
| 19.7 |
|
Commissions incurred |
| 3 |
| -14.9 |
| -19.9 |
| -26.4 |
|
| 3 |
| -10.9 |
| -14.9 |
| -19.9 |
|
Net results of financial transactions |
| 4 |
| 523.4 |
| 2,497.6 |
| 1,103.1 |
|
| 4 |
| -507.7 |
| 523.4 |
| 2,497.6 |
|
Other operating income |
| 7 |
| 108.8 |
| — |
| — |
|
| 7 |
| 19.9 |
| 108.8 |
| — |
|
Operating income |
|
|
| 2,500.4 |
| 4,395.9 |
| 3,097.2 |
|
|
|
| 1,392.3 |
| 2,500.4 |
| 4,395.9 |
|
|
|
|
|
|
|
|
|
|
|
|
|
|
|
|
|
|
|
|
Personnel expenses |
| 5 |
| -282.8 |
| -259.4 |
| -312.2 |
|
| 5 |
| -292.2 |
| -282.8 |
| -259.4 |
|
Other expenses |
| 6 |
| -203.1 |
| -191.9 |
| -159.0 |
|
| 6 |
| -232.8 |
| -203.1 |
| -191.9 |
|
Depreciations and amortizations of non-financial assets |
| 7 |
| -14.5 |
| -13.1 |
| -11.1 |
|
| 7 |
| -19.5 |
| -14.5 |
| -13.1 |
|
Net credit losses |
| 9 |
| -110.9 |
| 8.2 |
| -246.3 |
|
| 9 |
| -23.4 |
| -110.9 |
| 8.2 |
|
Operating profit |
|
|
| 1,889.1 |
| 3,939.7 |
| 2,368.6 |
|
|
|
| 824.4 |
| 1,889.1 |
| 3,939.7 |
|
|
|
|
|
|
|
|
|
|
|
|
|
|
|
|
|
|
|
|
Taxes |
| 10 |
| -489.6 |
| -1,048.0 |
| -641.3 |
|
| 10 |
| -115.6 |
| -489.6 |
| -1,048.0 |
|
Net profit for the year (after taxes)(1) |
|
|
| 1,399.5 |
| 2,891.7 |
| 1,727.3 |
|
|
|
| 708.8 |
| 1,399.5 |
| 2,891.7 |
|
|
|
|
|
|
|
|
|
|
|
|
|
|
|
|
|
|
|
|
Other comprehensive income related to: |
|
|
|
|
|
|
|
|
|
|
|
|
|
|
|
|
|
|
Available-for-sale securities (2),(3) |
|
|
| 12.1 |
| -1,653.0 |
| 1,784.5 |
|
|
|
| 7.5 |
| 12.1 |
| -1,653.3 |
|
Derivatives in cash flow hedges (3) |
|
|
| 394.7 |
| -205.6 |
| 25.0 |
|
|
|
| 168.2 |
| 394.7 |
| -205.6 |
|
Tax on other comprehensive income |
| 10 |
| -107.0 |
| 488.6 |
| -475.9 |
|
| 10 |
| -20.4 |
| -107.0 |
| 488.9 |
|
Total other comprehensive income |
|
|
| 299.8 |
| -1,370.0 |
| 1,333.6 |
|
|
|
| 155.3 |
| 299.8 |
| -1,370.0 |
|
Total comprehensive income (1) |
|
|
| 1,699.3 |
| 1,521.7 |
| 3,060.9 |
|
|
|
| 864.1 |
| 1,699.3 |
| 1,521.7 |
|
Skr |
|
|
|
|
|
|
|
Basic and diluted earnings per share(4) |
| 177.6 |
| 350.8 |
| 724.7 |
|
(1) The entire profit is attributable to the shareholder of the Parent Company.
(2) Changes in the value of the shares in Swedbank are included in 2010. See Note 4 and 23.4.
(3) See Consolidated statement of changes in equityequity.
|
|
|
|
(1)(4) The average number of shares in 20112012 amounts to 3,990,000 (year-end 2010:2011: 3,990,000, year-end 2009:2010: 3,990,000).
The accompanying notes are an integral part of these statements.
CONSOLIDATED STATEMENT OF FINANCIAL POSITION
Skr mn |
| Note |
| December 31, 2011 |
| December 31, 2010 |
|
| Note |
| December 31, 2012 |
| December 31, 2011 |
|
Assets |
|
|
|
|
|
|
|
|
|
|
|
|
|
|
Cash and cash equivalents |
| 11,12 |
| 3,749.6 |
| 8,798.0 |
|
| 11,12 |
| 2,338.2 |
| 3,749.6 |
|
Treasuries/government bonds |
| 11,12 |
| 2,033.4 |
| 5,431.3 |
|
| 11,12 |
| 5,111.5 |
| 2,033.4 |
|
Other interest-bearing securities except loans |
| 11,12 |
| 74,738.5 |
| 100,533.0 |
|
| 11,12 |
| 77,693.3 |
| 74,738.5 |
|
Loans in the form of interest-bearing securities |
| 11,12 |
| 66,204.5 |
| 71,805.8 |
|
| 11,12 |
| 57,889.8 |
| 66,204.5 |
|
Loans to credit institutions |
| 9,11,12 |
| 25,791.6 |
| 22,538.9 |
|
| 9,11,12 |
| 22,083.6 |
| 25,791.6 |
|
Loans to the public |
| 9,11,12 |
| 107,938.1 |
| 87,101.9 |
|
| 8,9,11,12 |
| 115,478.2 |
| 107,938.1 |
|
Derivatives |
| 14 |
| 31,467.0 |
| 37,659.8 |
|
| 14 |
| 25,711.2 |
| 31,467.0 |
|
Property, plant, equipment and intangible assets |
| 7 |
| 128.4 |
| 159.3 |
|
| 7 |
| 150.3 |
| 128.4 |
|
Other assets |
| 16 |
| 3,909.8 |
| 1,704.1 |
|
| 16 |
| 4,024.5 |
| 3,909.8 |
|
Prepaid expenses and accrued revenues |
| 17 |
| 3,741.0 |
| 3,955.5 |
|
| 17 |
| 2,655.0 |
| 3,741.0 |
|
Total assets |
|
|
| 319,701.9 |
| 339,687.6 |
|
|
|
| 313,135.6 |
| 319,701.9 |
|
|
|
|
|
|
|
|
|
|
|
|
|
|
|
|
Liabilities and equity |
|
|
|
|
|
|
|
|
|
|
|
|
|
|
Borrowing from credit institutions |
| 12,18 |
| 15,833.9 |
| 14,342.8 |
|
| 12,18 |
| 14,490.3 |
| 15,833.9 |
|
Borrowing from the public |
| 12,18 |
| 59.1 |
| 19.3 |
|
| 12,18 |
| 56.9 |
| 59.1 |
|
Senior securities issued |
| 12,18 |
| 257,352.4 |
| 286,309.5 |
|
| 12,18 |
| 258,090.1 |
| 257,352.4 |
|
Derivatives |
| 14 |
| 22,604.8 |
| 18,057.4 |
|
| 14 |
| 16,421.0 |
| 22,604.8 |
|
Other liabilities |
| 19 |
| 2,497.0 |
| 1,640.6 |
|
| 19 |
| 3,462.3 |
| 2,497.0 |
|
Accrued expenses and prepaid revenues |
| 20 |
| 3,351.0 |
| 3,443.4 |
|
| 20 |
| 2,407.6 |
| 3,351.0 |
|
Deferred tax liabilities |
| 10 |
| 811.6 |
| 660.9 |
|
| 10 |
| 728.1 |
| 811.6 |
|
Provisions |
| 5,21 |
| 49.6 |
| 53.6 |
|
| 5,21 |
| 54.4 |
| 49.6 |
|
Subordinated securities issued |
| 11,22 |
| 3,174.4 |
| 2,590.3 |
|
| 12,22 |
| 3,012.7 |
| 3,174.4 |
|
Total liabilities |
|
|
| 305,733.8 |
| 327,117.8 |
|
|
|
| 298,723.4 |
| 305,733.8 |
|
|
|
|
|
|
|
|
|
|
|
|
|
|
|
|
Share capital |
|
|
| 3,990.0 |
| 3,990.0 |
|
|
|
| 3,990.0 |
| 3,990.0 |
|
Reserves |
|
|
| 294.6 |
| -5.2 |
|
|
|
| 449.9 |
| 294.6 |
|
Retained earnings |
|
|
| 9,683.5 |
| 8,585.0 |
|
|
|
| 9,972.3 |
| 9,683.5 |
|
Total equity |
|
|
| 13,968.1 |
| 12,569.8 |
|
| 23 |
| 14,412.2 |
| 13,968.1 |
|
|
|
|
|
|
|
|
|
|
|
|
|
|
|
|
Total liabilities and equity |
|
|
| 319,701.9 |
| 339,687.6 |
|
|
|
| 313,135.6 |
| 319,701.9 |
|
|
|
|
|
|
|
|
|
|
|
|
|
|
|
|
Collateral provided etc. |
|
|
|
|
|
|
|
|
|
|
|
|
|
|
Collateral provided |
|
|
| None |
| None |
|
|
|
| None |
| None |
|
Interest-bearing securities: |
|
|
|
|
|
|
|
|
|
|
|
|
|
|
Subject to lending |
|
|
| 123.0 |
| 229.7 |
|
|
|
| 39.8 |
| 123.0 |
|
|
|
|
|
|
|
|
|
|
|
|
|
|
|
|
Contingent assets and liabilities |
| 23 |
| 1.1 |
| 4.5 |
|
| 24 |
| 1.1 |
| 1.1 |
|
|
|
|
|
|
|
|
|
|
|
|
|
|
|
|
Commitments |
|
|
|
|
|
|
|
|
|
|
|
|
|
|
Committed undisbursed loans |
| 23 |
| 25,071.8 |
| 38,205.2 |
|
| 24 |
| 25,915.1 |
| 25,071.8 |
|
Binding offers(1) |
| 24 |
| 33,841.2 |
| n.a |
| |||||||
(1)During 2012, SEK has changed its approach to providing offers. The revised method involves providing binding or non-binding offers. Binding offers are included in commitments.
CONSOLIDATED STATEMENT OF CHANGES IN EQUITY
|
|
|
|
|
| Reserves |
|
|
|
|
|
|
|
| Reserves |
|
|
| ||||
Skr mn |
| Equity |
| Share capital(1) |
| Hedge |
| Fair value |
| Retained earnings |
|
| Equity |
| Share capital |
| Hedge |
| Fair value |
| Retained earnings |
|
Opening balance of equity 2009 |
| 10,394.3 |
| 3,990.0 |
| 161.5 |
| -130.3 |
| 6,373.1 |
| |||||||||||
Net profit for the year |
| 1,727.3 |
|
|
|
|
|
|
| 1,727.3 |
| |||||||||||
Other comprehensive income: |
|
|
|
|
|
|
|
|
|
|
| |||||||||||
Changes in fair-value |
|
|
|
|
|
|
|
|
|
|
| |||||||||||
Available-for-sale securities |
| 1,711.3 |
|
|
|
|
| 1,711.3 |
|
|
| |||||||||||
Derivatives in cash flow hedges |
| -388.6 |
|
|
| -388.6 |
|
|
|
|
| |||||||||||
Reclassified to profit or loss |
| 486.8 |
|
|
| 413.6 |
| 73.2 |
|
|
| |||||||||||
Tax on other comprehensive income |
| -475.9 |
|
|
| -6.5 |
| -469.4 |
|
|
| |||||||||||
Total other comprehensive income |
| 1,333.6 |
|
|
| 18.5 |
| 1,315.1 |
|
|
| |||||||||||
Total comprehensive income |
| 3,060.9 |
|
|
| 18.5 |
| 1,315.1 |
| 1,727.3 |
| |||||||||||
Dividend |
| — |
|
|
|
|
|
|
|
|
| |||||||||||
Closing balance of equity 2009 |
| 13,455.2 |
| 3,990.0 |
| 180.0 |
| 1,184.8 |
| 8,100.4 |
| |||||||||||
|
|
|
|
|
|
|
|
|
|
|
| |||||||||||
Opening balance of equity 2010 |
| 13,456.1 |
| 3,990.0 |
| 180.0 |
| 1,184.8 |
| 8,101.3 |
|
| 13,456.1 |
| 3,990.0 |
| 180.0 |
| 1,184.8 |
| 8,101.3 |
|
Net profit for the year |
| 2,891.7 |
|
|
|
|
|
|
| 2,891.7 |
|
| 2,891.7 |
|
|
|
|
|
|
| 2,891.7 |
|
Other comprehensive income: |
|
|
|
|
|
|
|
|
|
|
|
|
|
|
|
|
|
|
|
|
|
|
Changes in fair-value |
|
|
|
|
|
|
|
|
|
|
|
|
|
|
|
|
|
|
|
|
|
|
Available-for-sale securities |
| 835.5 |
|
|
|
|
| 835.5 |
|
|
|
| 835.5 |
|
|
|
|
| 835.5 |
|
|
|
Derivatives in cash flow hedges |
| -2.9 |
|
|
| -2.9 |
|
|
|
|
|
| -2.9 |
|
|
| -2.9 |
|
|
|
|
|
Reclassified to profit or loss |
| -2,691.5 |
|
|
| -202.7 |
| -2,488.8 |
|
|
|
| -2,691.5 |
|
|
| -202.7 |
| -2,488.8 |
|
|
|
Tax on other comprehensive income |
| 488.9 |
|
|
| 54.1 |
| 434.8 |
|
|
|
| 488.9 |
|
|
| 54.1 |
| 434.8 |
|
|
|
Total other comprehensive income |
| -1,370.0 |
|
|
| -151.5 |
| -1,218.5 |
|
|
|
| -1,370.0 |
|
|
| -151.5 |
| -1,218.5 |
|
|
|
Total comprehensive income |
| 1,521.7 |
|
|
| -151.5 |
| -1,218.5 |
| 2,891.7 |
|
| 1,521.7 |
|
|
| -151.5 |
| -1,218.5 |
| 2,891.7 |
|
Dividend |
| -2,408.0 |
|
|
|
|
|
|
| -2,408.0 |
|
| -2,408.0 |
|
|
|
|
|
|
| -2,408.0 |
|
Closing balance of equity 2010(4),(5) |
| 12,569.8 |
| 3,990.0 |
| 28.5 |
| -33.7 |
| 8,585.0 |
| |||||||||||
Closing balance of equity 2010(1) |
| 12,569.8 |
| 3,990.0 |
| 28.5 |
| -33.7 |
| 8,585.0 |
| |||||||||||
|
|
|
|
|
|
|
|
|
|
|
| |||||||||||
Opening balance of equity 2011 |
| 12,569.8 |
| 3,990.0 |
| 28.5 |
| -33.7 |
| 8,585.0 |
|
| 12,569.8 |
| 3,990.0 |
| 28.5 |
| -33.7 |
| 8,585.0 |
|
Net profit for the year |
| 1,399.5 |
|
|
|
|
|
|
| 1,399.5 |
|
| 1,399.5 |
|
|
|
|
|
|
| 1,399.5 |
|
Other comprehensive income: |
|
|
|
|
|
|
|
|
|
|
|
|
|
|
|
|
|
|
|
|
|
|
Changes in fair-value |
|
|
|
|
|
|
|
|
|
|
|
|
|
|
|
|
|
|
|
|
|
|
Available-for-sale securities |
| -0.8 |
|
|
|
|
| -0.8 |
|
|
|
| -0.8 |
|
|
|
|
| -0.8 |
|
|
|
Derivatives in cash flow hedges |
| 546.9 |
|
|
| 546.9 |
|
|
|
|
|
| 546.9 |
|
|
| 546.9 |
|
|
|
|
|
Reclassified to profit or loss |
| -139.3 |
|
|
| -152.2 |
| 12.9 |
|
|
|
| -139.3 |
|
|
| -152.2 |
| 12.9 |
|
|
|
Tax on other comprehensive income |
| -107.0 |
|
|
| -103.8 |
| -3.2 |
|
|
|
| -107.0 |
|
|
| -103.8 |
| -3.2 |
|
|
|
Total other comprehensive income |
| 299.8 |
|
|
| 290.9 |
| 8.9 |
|
|
|
| 299.8 |
|
|
| 290.9 |
| 8.9 |
|
|
|
Total comprehensive income |
| 1,699.3 |
|
|
| 290.9 |
| 8.9 |
| 1,399.5 |
|
| 1,699.3 |
|
|
| 290.9 |
| 8.9 |
| 1,399.5 |
|
Dividend |
| -301.0 |
|
|
|
|
|
|
| -301.0 |
|
| -301.0 |
|
|
|
|
|
|
| -301.0 |
|
Closing balance of equity 2011(4),(5) |
| 13,968.1 |
| 3,990.0 |
| 319.4 |
| -24.8 |
| 9,683.5 |
| |||||||||||
Closing balance of equity 2011(1),(2) |
| 13,968.1 |
| 3,990.0 |
| 319.4 |
| -24.8 |
| 9,683.5 |
| |||||||||||
Opening balance of equity 2012 |
| 13,968.1 |
| 3,990.0 |
| 319.4 |
| -24.8 |
| 9,683.5 |
| |||||||||||
Net profit for the year |
| 708.8 |
|
|
|
|
|
|
| 708.8 |
| |||||||||||
Other comprehensive income: |
|
|
|
|
|
|
|
|
|
|
| |||||||||||
Changes in fair-value |
|
|
|
|
|
|
|
|
|
|
| |||||||||||
Available-for-sale securities |
| 6.6 |
|
|
|
|
| 6.6 |
|
|
| |||||||||||
Derivatives in cash flow hedges |
| 358.2 |
|
|
| 358.2 |
|
|
|
|
| |||||||||||
Reclassified to profit or loss |
| -189.1 |
|
|
| -190.0 |
| 0.9 |
|
|
| |||||||||||
Tax on other comprehensive income |
| -20.4 |
|
|
| -18.4 |
| -2.0 |
|
|
| |||||||||||
Total other comprehensive income |
| 155.3 |
|
|
| 149.8 |
| 5.5 |
|
|
| |||||||||||
Total comprehensive income |
| 864.1 |
|
|
| 149.8 |
| 5.5 |
| 708.8 |
| |||||||||||
Dividend |
| -420.0 |
|
|
|
|
|
|
| -420.0 |
| |||||||||||
Closing balance of equity 2012(1),(2) |
| 14,412.2 |
| 3,990.0 |
| 469.2 |
| -19.3 |
| 9,972.3 |
| |||||||||||
(1) The total number of shares is 3,990,000.
(2) Hedge reserve is shown as net after-tax difference between fair value and amortized cost recognized through other comprehensive income related to derivatives in cash flow hedges.
(3) Fair value reserve is shown as after-tax difference between fair value and amortized cost recognized through other comprehensive income related to available-for-sale securities. After reclassification as of July 1, 2008, the fair value reserves are amortized over the remaining life of these reclassified assets. During 2009 to 2011 new assets in the category available-for-sale have been acquired. Fair value reserve amounted to Skr -24.8 (year-end 2010: Skr -33.7 million; year-end 2009: Skr 1,184.8 million), of which Skr 2.2 million (year-end 2010: Skr 6.4 million; year-end 2009: Skr 7.6 million) represented interest-bearing securities with positive changes in fair value, Skr -10.1 million, (year-end 2010: Skr -1.7 million; year-end 2009: Skr -8.5 million) represented interest-bearing securities with negative changes in fair value and Skr -16.9 million (year-end 2010: Skr -38.4 million; year-end 2009: Skr -76.4) remained from the reclassification in 2008.
(4) According to the Swedish Annual Accounts Act for Credit Institutions and Securities Companies, the non-distributable capital for the Consolidated Group at year-end amounted to Skr 6,176.9 million (year-end 2010: Skr 5,965.4 million; year-end 2009: Skr 5,211.2 million) and distributable capital amounted to Skr 7,791.2 million (year-end 2010: Skr 6,604.4 million; year-end 2009: Skr 8,244.0 million).
(5) The entire equity is attributable to the shareholder of the Parent CompanyCompany.
(2) See Note 23
CONSOLIDATED STATEMENT OF CASH FLOWS
|
| Consolidated Group |
|
| Consolidated Group |
| ||||||||
Skr mn |
| 2011 |
| 2010 |
| 2009 |
|
| 2012 |
| 2011(3) |
| 2010(3) |
|
Operating activities |
|
|
|
|
|
|
|
|
|
|
|
|
|
|
Operating profit (1) |
| 1,889.1 |
| 3,939.7 |
| 2,368.6 |
|
| 824.4 |
| 1,889.1 |
| 3,939.7 |
|
|
|
|
|
|
|
|
|
|
|
|
|
|
|
|
Adjustments to convert operating profit to cash flow: |
|
|
|
|
|
|
|
|
|
|
|
|
|
|
Write-down of impaired financial instruments |
| 43.4 |
| 81.7 |
| 283.0 |
|
| 23.4 |
| 110.9 |
| -8.2 |
|
Depreciation |
| 14.5 |
| 10.6 |
| 11.1 |
|
| 19.5 |
| 14.5 |
| 10.6 |
|
Derivatives |
| 567.6 |
| 3,289.8 |
| -1,570.9 |
|
| 833.0 |
| 567.6 |
| 3,289.8 |
|
Gain on sales of subsidiaries |
| -105.1 |
| — |
|
|
|
| — |
| -105.1 |
| — |
|
Exchange rate differences |
| -4.6 |
| 0.9 |
| -33.2 |
|
| -3.8 |
| -4.6 |
| 0.9 |
|
Unrealized changes in fair value |
| 1,151.7 |
| -41.5 |
| 175.0 |
| |||||||
Other |
| 62.4 |
| 32.8 |
| 144.8 |
|
| 127.7 |
| 36.4 |
| -52.3 |
|
Income tax paid |
| -1,187.5 |
| -387.8 |
| -174.6 |
|
| -285.7 |
| -1,187.5 |
| -387.8 |
|
Total adjustments to convert operating profit to cash flow |
| -609.3 |
| 3,028.0 |
| -1,339.8 |
|
| 1,865.8 |
| -609.3 |
| 3,028.0 |
|
|
|
|
|
|
|
|
|
|
|
|
|
|
|
|
Disbursements of loans |
| -57,673.4 |
| -39,007.8 |
| -74,310.9 |
|
| -50,370.8 |
| -57,673.4 |
| -39,007.8 |
|
Repayments of loans |
| 41,113.1 |
| 37,517.5 |
| 39,577.8 |
|
| 48,843.3 |
| 41,113.1 |
| 37,517.5 |
|
Net decrease in bonds and securities held |
| 29,211.8 |
| 9,914.4 |
| -5,274.1 |
| |||||||
Net change in bonds and securities held |
| -9,469.4 |
| 30,975.3 |
| 9,914.4 |
| |||||||
Other changes - net |
| 378.9 |
| 130.1 |
| 1,645.6 |
|
| -453.6 |
| -66.0 |
| 130.1 |
|
Cash flow from operating activities |
| 14,310.2 |
| 15,521.9 |
| -37,332.8 |
|
| -8,760.3 |
| 15,628.8 |
| 15,521.9 |
|
|
|
|
|
|
|
|
|
|
|
|
|
|
|
|
Investing activities |
|
|
|
|
|
|
|
|
|
|
|
|
|
|
Capital expenditures |
| 139.1 |
| -42.2 |
| -3.2 |
|
| -41.7 |
| 139.1 |
| -42.2 |
|
Cash flow from investing activities |
| 139.1 |
| -42.2 |
| -3.2 |
|
| -41.7 |
| 139.1 |
| -42.2 |
|
|
|
|
|
|
|
|
|
|
|
|
|
|
|
|
Financing activities |
|
|
|
|
|
|
|
|
|
|
|
|
|
|
Proceeds from issuance of short-term senior debt |
| 3,403.6 |
| 46,931.5 |
| 93,478.5 |
|
| 11,842.7 |
| 3,403.6 |
| 46,931.5 |
|
Proceeds from issuance of long-term senior debt |
| 51,486.4 |
| 76,667.5 |
| 111,831.5 |
|
| 45,801.1 |
| 50,167.8 |
| 76,667.5 |
|
Repayments of debt |
| -37,565.7 |
| -111,742.0 |
| -138,975.6 |
|
| -27,141.6 |
| -37,565.7 |
| -111,742.0 |
|
Repurchase and early redemption of own long-term debt |
| -36,522.6 |
| -33,759.5 |
| -35,141.7 |
|
| -22,694.4 |
| -36,522.6 |
| -33,759.5 |
|
Dividend paid |
| -301.0 |
| -2,408.0 |
|
|
|
| -420.0 |
| -301.0 |
| -2,408.0 |
|
Cash flow from financing activities |
| -19,499.3 |
| -24,310.5 |
| 31,192.7 |
|
| 7,387.8 |
| -20,817.9 |
| -24,310.5 |
|
|
|
|
|
|
|
|
|
|
|
|
|
|
|
|
Net cash flow for the year |
| -5,050.0 |
| -8,830.8 |
| -6,143.3 |
|
| -1,414.2 |
| -5,050.0 |
| -8,830.8 |
|
Exchange rate differences on cash and cash equivalents |
| 1.6 |
| -7.7 |
| 8.7 |
|
| 2.8 |
| 1.6 |
| -7.7 |
|
Cash and cash equivalents at beginning of year |
| 8,798.0 |
| 17,636.5 |
| 23,771.1 |
|
| 3,749.6 |
| 8,798.0 |
| 17,636.5 |
|
Cash and cash equivalents at end of year (2) |
| 3,749.6 |
| 8,798.0 |
| 17,636.5 |
|
| 2,338.2 |
| 3,749.6 |
| 8,798.0 |
|
Comments on the cash flow statement:
(1) Interest payments received and expenses paid
|
| Consolidated Group |
|
| Consolidated Group |
| ||||||||
Skr mn |
| 2011 |
| 2010 |
| 2009 |
|
| 2012 |
| 2011 |
| 2010 |
|
Interest payments received |
| 10,446.9 |
| 12,684.1 |
| 14,960.5 |
|
| 11,437.6 |
| 10,446.9 |
| 12,684.1 |
|
Interest expenses paid |
| 8,534.9 |
| 10,786.7 |
| 12,851.2 |
|
| 9,422.7 |
| 8,534.9 |
| 10,786.7 |
|
(2) Cash and cash equivalents:
|
| Consolidated Group |
| ||||
Skr mn |
| 2011 |
| 2010 |
| 2009 |
|
Cash at banks |
| 231.8 |
| 225.0 |
| 384.3 |
|
Cash equivalents |
| 3,517.8 |
| 8,573.0 |
| 17,252.2 |
|
Total cash and cash equivalents |
| 3,749.6 |
| 8,798.0 |
| 17,636.5 |
|
|
| Consolidated Group |
| ||||
Skr mn |
| 2012 |
| 2011 |
| 2010 |
|
Cash at banks |
| 148.2 |
| 231.8 |
| 225.0 |
|
Cash equivalents |
| 2,190.0 |
| 3,517.8 |
| 8,573.0 |
|
Total cash and cash equivalents |
| 2,338.2 |
| 3,749.6 |
| 8,798.0 |
|
Cash and cash equivalents include, in this context, cash at banks where amounts can be immediately converted immediately into cash and short-term deposits where the time to maturity does not exceed three months onfrom the trade date. See Note 11.
(3)Some comparative figures have been restated to ensure comparability between years.
NOTES TO THE CONSOLIDATED FINANCIAL STATEMENTS
All amounts are in Skr million, unless otherwise indicated.
Introductory Note
REPORTING ENTITY
AB Svensk Exportkredit (“SEK” or “the Parent Company”) is a company domiciled in Sweden. The address of the company’s registered office is Klarabergsviadukten 61-63, P.O. Box 194, SE-101 23 Stockholm, Sweden. The consolidated financial statements of SEK as of December 31, 20112012 encompass SEK and its wholly owned subsidiaries AB SEK Securities, SEK Financial Advisors AB, SEK Financial Services AB, SEK Customer Finance AB, SEK Exportlånet AB and Venantius AB, including the latter’s wholly owned subsidiary VF Finans AB (“the Subsidiaries”). These are together referred to as the “Consolidated Group” or “the Group”.
AB SEK Securities is a securities company under the supervision of the Swedish Financial Supervisory Authority. SEK Financial Advisors AB, SEK Customer Finance AB and Venantius AB are no longer engaged in any active business. SEK Financial Services AB and SEK Exportlånet AB are inactive companies. On April 13, 2011, the Parent Company in the Consolidated Group sold all of the shares in the wholly owned subsidiary AB SEKTIONEN to a company in the LMK Industri AB Group. AB SEKTIONEN’s main asset was its building, which served as SEK’s headquarters up to December 17, 2010, when SEK moved its headquarters to new, rented, premises. AB SEKTIONEN’s operating business prior to the sale was to rent its building to the Parent Company.
BASIS OF PRESENTATION
(i) Statement of compliance
Since January 1, 2007, SEK has applied International Financial Reporting Standards (IFRS) as issued by the International Accounting Standards Board (IASB). The IFRS standards applied by SEK are all endorsed by the European Union (EU). Additional standards, consistent with IFRS, are imposed by the Swedish Annual Accounts Act for Credit Institutions and Securities Companies (1995:1559) (ÅRKL), Recommendation RFR 1, Supplementary Accounting Principles for Groups, issued by the Swedish Financial Reporting Board (RFR) and the accounting regulations of the Financial Supervisory Authority (FFFS 2008:25), all of which have been complied with in preparing the consolidated financial statements, of which these notes form part. SEK also follows the Swedish Government’s general guidelines regarding external reporting in accordance with its corporate governance policy and guidelines for state-owned companies.
The consolidated financial statements were approved for issuance by SEK’s Board of Directors (the Board of Directors) on March 16, 2012.February 22, 2013. The Group’s statements of comprehensive income and financial position are subject to approval by SEK’s shareholder, at the annual general meeting to be held on April 26, 2012.23, 2013.
(ii) Basis of measurement
The consolidated financial statements have been prepared on a historical cost basis, except for the following;
· derivative financial instruments are measured at fair value,
· financial instruments at fair value through profit or loss are measured at fair value,
· available-for-sale financial assets are measured at fair value, and
· hedged items in fair-value hedges are recorded at amortized cost, adjusted for changes in fair value with regard to the hedged risks.
(iii) Functional and presentation currency
SEK has determined that the Swedish krona (Skr) is its functional and presentation currency under IFRS. This determination is based on several factors, the significant factors being that SEK’s equity is denominated in Swedish kronor, its performance is evaluated based on a result expressed in Swedish kronor, and that a large portion of expenses, especially personnel expenses, other expenses and its taxes, are denominated in Swedish kronor. SEK manages its foreign currency risk by hedging certain of the exposureexposures between the Swedish kronor and other currencies.
(iv) Going concern
SEK’s Board of Directors and management have made an assessment of SEK’s ability to continue as a going concern and are satisfied that SEK has the resources to continue in business for the foreseeable future. Furthermore, the Board of Directors and management are not aware of any material uncertainties that may cast significant doubt upon SEK’s ability to continue as a going concern. Therefore, the financial statements continue to be prepared on a going-concern basis.
Note 1. Significant accounting policies
The accounting policies set out below have been applied consistently to all periods presented in these consolidated financial
statements, unless otherwise stated.
TABLE OF CONTENTS
(a) Changes to accounting policies and disclosure requirements and standards not yet adopted
(b) Basis of consolidation
(c) Segment reporting
(d) Recognition of operating income and expenses
(e) Foreign currency transactions
(f) Financial instruments
(g) Tangible assets
(h) Intangible assets
(i) Employee benefits
(j) Equity
(k) Income tax
(l) Earnings per share
(m) Statement of Cash Flows
(n) Critical accounting policies, assumptions and estimates
(a) Changes to accounting policies and disclosure requirements and standards not yet adopted
The accounting policies, in all material aspects, are unchanged in comparison with the financial statements included in SEK’s 20102011 Annual Report on formForm 20-F, with the exceptions stated below. Certain amounts reported in prior periods have been reclassified to conform to the current presentation.
The Group has adopted the following amendments to standards and interpretations from IASB as from January 1, 2011,2012, but they have had little or no impact on SEK’s financial reporting:
IAS 32IFRS 7 Financial Instruments: Presentation — Classification of Rights Issues.The definition of a liability has been amended with the effect that rights issues fixed in a currency other than their functional currency and issued pro rata to existing owners are classified as equity instruments.
IFRIC 19 Extinguishing Financial Liabilities with Equity Instruments. This interpretation clarifies how an entity shall account for renegotiated terms of a financial liability resulting in the issuing of equity instruments to the creditor to fully, or partially, extinguish a financial liability.
IFRIC 14 Prepayments of a minimum funding requirement — amendment.Disclosures. This amendment provides guidance in assessing the recoverability of pension assets and allows the early payment of contributions to cover the minimum funding requirements to be accounted for as an asset.
IFRS 7 Financial Instruments: Disclosures. Amendmentsrequires additional disclosures relating to the disclosuretransfer of financial assets emphasizing the interaction between quantitativewhen financial assets are not derecognized in their entirety and qualitative disclosure about the nature and extent of risks associated withwhen financial instruments.
IAS 1 Presentations of Financial Statements. Clarification of content ofasset are derecognized in their entirety from the statement of changesfinancial position but the entity has a continuing involvement in equity.
IAS 34 Interim Financial Reporting.Thisthem. The amendment clarifies disclosure requirements, including that disclosures regarding financial instruments might be required.
The Segment Reporting has been changed to better reflect the present internal reporting structure. Comparative figures have been reclassified. Following this change, SEK reports two segments: direct customer financing and end-customer financing.. Previously, SEK reported the segments “granting of loans” and “other segments”. SEK has recently, as previously announced, analyzed its business strategies, resulting in an increased focus on the core business; lending to Swedish export companies. An analysis with the same conclusions has also been conducted by the government, resulting in
the adoption of the owner’s instructionis applicable for SEK at the annual general meeting in 2011. Consequently, focus has been shifted from the segments previously identified as separate, and the previous assessment that they would gradually constitute an increasing portion of SEK’s business is no longer prevailing.repurchase agreements.
The following new standards and changes in standards and interpretations not yet adopted are considered to be relevant to SEK:
IFRS 7 Financial Instruments: Disclosures. This amendment requires additional quantitative and qualitative disclosures relating to the transfer of financial assets when financial assets are derecognized from the statement of financial position but the entity has a continuing involvement in them. SEK’s preliminary conclusion is that the amendment of this standard will not affect the financial disclosure provided by SEK in any material way. The amendment must be applied for annual periods beginning on or after July 1, 2011.
IFRS 7 Financial Instruments: Disclosures. The amendments contain new disclosure requirements for financial assets and liabilities that are offset in the statement of financial position or subject to master netting arrangements or similar agreements. SEK has not yet evaluatedThe amendment will increase the effect of the amendment.disclosure requirements for SEK. The amendment must be applied for annual periods beginning on or after January 1, 2013.
IAS 32 Financial Instruments: Presentation — Offsetting Financial Assets and Financial Liabilities. The amendments clarify that an entity currently has a legally enforceable right to set-off if that right is not contingent on a future event, and enforceable both in the normal course of business and in the event of default, insolvency or bankruptcy of the entity and all counterparties. SEK has not yet evaluated the effect of the amendment. The amendment must be applied for annual periods beginning on or after January 1, 2014.
IAS 19 Employee Benefits. This standard was amended in June 2011. The impact on SEK will be as follows: SEK will no longer apply the corridor approach and will instead recognize all actuarial gains and losses under other comprehensive income as they occur; all past service costs will be recognized immediately; and interest cost on pension obligations and expected return on plan assets will be replaced by a net interest amount that is calculated by applying the discount rate to the net defined benefit liability (asset). SEK’s preliminary conclusion is that the amendment will not have a material impact on SEK’s financial statements. The unrecognized actuarial losses amounted to Skr 40.5 million as of December 31, 2011. If SEK has unrecognized actuarial losses at transition there will be a negative impact on equity. The amendment must be applied for annual periods beginning January 1, 2013.
IFRS 9 Financial Instruments. This standard is part of a complete overhaul of the existing IAS 39 standard and reduces the number of valuation categories for financial assets, leaving the number of categories of financial liabilities unamended and implements new rules for how changes in own credit spread should be recorded when own debt is measured at fair value. The standard will be supplemented by rules on impairment of financial instruments and hedge accounting. IFRS 9 must be applied for annual periods beginning January 1, 2015. .Early application is permitted, although not for publicly listed companies within the EU. Since not all parts of the standard are yet complete, SEK has not yet evaluated their effects.
IFRS 10 Consolidated Financial Statements, IFRS 11 Joint Arrangements, IFRS 12 Disclosure of Involvement with Other Entities, IAS 27 Separate Financial Statements and IAS 28 Investments in Associates and Joint Ventures. IASB has issued three new standards for consolidation (IFRS 10, IFRS 11 and IFRS 12) as well as amended IAS 27 and IAS 28. SEK’s conclusion is that the new standards and the amendments will not have a material impact on SEK’s financial statements. The standards and the amendments become effective for annual periods beginning on or after 1 January 2013.
IFRS 13 Fair valueFair-value measurement. This standard aims to improve consistency and reduce complexity by providing a precise definition of fair value and a single source of fair value measurement and disclosure requirements for use across IFRSs. The requirements do not extend the use of fair-value accounting, but provide guidance on how it should be applied where its use is already required or permitted by other standards within IFRS. SEK’s conclusion is that the amendment will not have a material impact on SEK’s financial statements except for additional disclosure requirements. The standard must be applied for annual periods beginning January 1, 2013.
IAS 1 Presentation of Financial Statements: amendments to presentation of items of other comprehensive income. The amendment changes the grouping of items presented in other comprehensive income. Items that could be reclassified to profit or loss would be presented separately from items that will never be reclassified to profit or loss. The amendment affects presentation only and has no impact on SEK’s financial position or performance. The amendment becomes effective for SEK for the annual period beginning January 1, 2013.
IAS 19 Employee Benefits. The IASB has amended IAS 19. These changes are mainly related to defined benefit plans. The amendments to IAS 19 remove the option to defer the recognition of actuarial gains and losses, i.e. the corridor mechanism. The impact on SEK will be as follows: SEK will no longer apply the corridor approach (see section (i) below) and will instead recognize all actuarial gains and losses under other comprehensive income as they occur; all past service costs will be recognized immediately; and interest cost on pension obligations and expected return on plan assets will be replaced by a net interest amount that is yetcalculated by applying the discount rate to assess the fullnet defined benefit liability (asset). SEK’s conclusion is that the amendment will not have a material impact on SEK’s financial statements. The unrecognized actuarial losses amounted to Skr 36.7 million before taxes as of IFRS 13December 31, 2012, which will have a negative impact on equity. The amendment must be applied for annual periods beginning January 1, 2013.
IAS 32 Financial Instruments: Presentation — Offsetting Financial Assets and intendsFinancial Liabilities. The amendments clarify that an entity currently has a legally enforceable right to adopt IFRS 13 no later thanset-off if that right is not contingent on a future event, and enforceable both in the accounting periodnormal course of business and in the event of default, insolvency or bankruptcy of the entity and all counterparties. SEK’s conclusion is that the amendment will not have a material impact on SEK’s financial statements. The amendment must be applied for annual periods beginning on or after January 1, 2013.2014.
There are no other IFRS or IFRIC interpretations that are not yet applicable that would be expected to have a material impact on the group.
(b) Basis of consolidation
Subsidiaries are entities controlled by the Group. Control exists when the Group has the power to govern the financial and operating policies of an entity so as to obtain benefits from its activities. The consolidated financial statements have been prepared using the purchase method. The financial statements of subsidiaries are included in the consolidated financial statements from the date that control commences until the date that control ceases. The accounting policies of subsidiaries are consistent with Group policies. Intra-group transactions and balances, and any unrealized income and expenses arising from intra-group transactions, are eliminated in preparing the consolidated financial statements. Unless otherwise stated or it is clear from the context, the information in these notes relates to both the Consolidated Group and the Parent Company.
At the date of the acquisition of a company, the assets and liabilities in the acquired company are recognized at fair value. The difference between the acquisition value of the shares in the company and the net assets in the company is recorded as
goodwill. The fair value of assets and liabilities in the acquired company is determined by management, in part by taking account of independent valuation. In cases where the shares have been acquired without any exchange of cash remuneration, the fair value of the shares in the acquired company is also determined by management, in part by taking account of independent valuation.
Goodwill is not depreciated, but is subject to impairment testing.
(c) Segment reporting
Segment information is presented from a management perspective and segments are identified based on internal reporting to the Executive Management Committee, which servesOfficers, who serve as the chief operating decision maker.makers. SEK has the following two segments: direct customer financing and end customer financing. Direct financing concerns financing that SEK arranges directly to, or for the benefit of, Swedish export companies. End customer financing refers to financing that SEK arranges for buyers of Swedish goods and services. Evaluation of the segments’ profitability, accounting policies and allocations between segments follows the information reported to the executive management. Profit or loss and interest-bearing assets that are not directly assigned to the segments are allocated under an allocation formula according to internal policies which management believes provide an equitable allocation to the segments.
(d) Recognition of operating income and expenses
(i) Net interest income
Interest revenues and interest expenses related to all financial assets and liabilities, regardless of classification, are recognized in net interest income. The reporting of all interest income and interest expenses is made on a gross basis, with the exception of interest income and interest expenses related to derivatives,derivative instruments, which are reported on a net basis. Interest income and interest expenses are calculated and recognized based on the effective interest rate method or based on a method that results in interest income or interest expenses that are a reasonable approximation of the result that would be obtained using the effective interest method as the basis for the calculation.
The state-supported system (“S-system”). SEK’s net compensation for administrating the S-system is recognized as part of interest revenues in the statement of comprehensive income. SEK administers, in return for compensation, the Swedish State’s export credit support system, and the State’s related aid credit program (together referred to as the “S-system”). Pursuant to agreements between SEK andthe instruction from the State, the State reimburses SEK for all interest differentials, financing costs and net foreign exchange losses under the S-system as long as any loans or borrowings remain outstanding.S-system. SEK has determined that the S-system should be considered an assignment whereby SEK acts as an agent on behalf of the Swedish State, rather than being the principal in the individual transactions. This assessment has been made based on a number of factors, such as the following: (i) although it does in form, SEK does not in substance bear the risks and decisionsbenefits associated with ownership; (ii) SEK does not have discretion in establishing prices; and (iii) SEK receives compensation in the form of a fixed commission. Accordingly, the costs reimbursed by the State are not accounted for in SEK’s statement of comprehensive income. The State’s reimbursements are made on a quarterly basis. Unrealized fair value changes on derivatives related to the S-system are presented net as a claim from the State under other assets. Assets and liabilities related to the S-system are included in the statement of financial position for the Consolidated Group. SEK’s net compensation for administrating the S-system is recognized as part of interest revenues in the statement of comprehensive income.position.
(ii) Net fee and commission income
Net fee and commission income is presented as commissions earned or commissions incurred. The recognition of commission income depends on the purpose for which the fee is received. Fees are either recognized as revenue when services are provided or amortized over the period of a specific business transaction. Commissions incurred are transaction-based, and are recognized in the period in which the services are received.
(iii) Net result of financial transactions
Net results of financial transactions include realized gains and losses related to all financial instruments and unrealized gains and losses related to all financial instruments carried at fair value in the statement of financial position, except when fair-value changes are recorded in other comprehensive income. Gains and losses comprise gains and losses related to currency exchange effects, interest rate changes, changes in credit spreads on SEK’s own debt, changes in basis-spreads and changes in the creditworthiness of the counterparty to the financial contract. The item also includes market value changes attributable to hedged risks in fair-value hedges and inefficiency in cash flow hedges. Interest differential compensation on early repayment of fixed interest rate loans is recognized directly under “Net results of financial transactions”. The compensation is equal to the fair-value adjustment arising from change in applicable interest rates.
(e) Foreign currency transactions
Monetary assets and liabilities in foreign currencies have been translated into the functional currency (Swedish krona) at the exchange rates applicable on the last day of each relevant reporting period. Revenues and costs in foreign currencies are
translated into Swedish kronor at the current exchange rate as of the respective date of accrual. Any changes in the exchange rates between the relevant currencies and the Swedish krona relating to the period between the day of accrual and the day of settlement are reported as currency exchange effects. Currency exchange effects are included as one component of “Net results of financial transactions”.
(f) Financial instruments
(i) Recognition and derecognition in the statement of financial position
The recognition of financial instruments in, and their derecognition from, the statement of financial position is based on the trade dates for securities bought, as well as for securities issued and for derivatives. All other financial instruments are recognized and derecognized in the statement of financial position on their respective settlement date. The difference between the carrying amount of a financial liability or an asset (or part of a financial liability or an asset) that is extinguished or transferred to another party and the consideration paid is recognized in the statement of total income as one component of “Net results of financial transactions”.
(ii) Measurement on initial recognition
When financial instruments are initially recognized, they are measured at fair value plus, in the case of a financial assets or financial liabilities not carried at fair value through profit or loss, transaction costs that are directly attributable to the acquisition or issuance of the financial asset or financial liability.
(iii) Offsetting
Financial assets and liabilities are offset and the net amount presented in the statement of financial position when the Group has a legal right to offset the amounts and intends either to settle on a net basis or to realize the asset and settle the liability simultaneously. This offsetting generally occurs in only a limited number of cases.
(iv) Classification of financial assets and liabilities
Financial assets are categorized into three categories for valuation purposes: loans and receivables, financial assets at fair value through profit or loss and financial assets available-for-sale. Financial liabilities are categorized into two categories for valuation purposes: financial liabilities at fair value through profit or loss and other financial liabilities.
Loans and receivablesreceivables.. With regard to financial assets, the category of loans and receivables constitutes the main category for SEK. This category is used not only for loans originated by SEK but also for securities acquired by SEKsecurities that are not quoted on an active market. From December 1, 2012 the category is prospectively only used for loans and loans in the form of interest bearing securities. Transactions in the category of loans and receivables are measured at amortized cost, using the effective interest rate method. When a derivative isone, or multiple, derivatives are used to hedge a currency and/or interest rate exposure relating to a loan or receivable, fair-value hedge accounting is applied. Furthermore, cash flow hedge accounting is applied for certain transactions classified as loans and receivables. This is the case when SEK wishes to hedge against variability in the cash flow from these assets.
Financial assets at fair value through profit or lossloss.. There are two main subcategories in the category of financial assets at fair value through profit or loss: financial assets designated upon initial recognition at fair value through profit or loss; and assets held for trading.held-for-trading. Where two or more derivatives hedge both interest rate and credit exposures in a financial asset, such transactions may be classified irrevocably as a financial asset at fair value through profit or loss. Making such designations eliminates or significantly reduces an accounting mismatch that would otherwise arise from measuring assets or liabilities or recognizing the gains or losses on them on different bases. Derivatives are always classified as financial assets or liabilities at fair value through profit or loss, except when they are subject to hedge accounting.
Financial assets available-for-saleavailable-for-sale.. Assets that are classified as available-for-sale securities are carried at fair value, with changes in fair value recognized in other comprehensive income. If assets are sold, changes in fair value are transferred from other comprehensive income to profit or loss. Among other things,From December 1, 2012 the category is used for all new interest bearing securities acquired as SEK’s liquidity placements. Earlier this category iswas used for securities quoted on an active market that would otherwise be classified in the category of loans and receivables. Listed shares that are available-for-sale are also included in this category.
Financial liabilities at fair value through profit or lossloss.. There are two main subcategories in the category of financial liabilities at fair value through profit or loss: financial liabilities designated upon initial recognition at fair value through profit or loss; and liabilities held-for-trading. Senior securities issued by SEK are irrevocably classified as financial liabilities at fair value through profit or loss if they contain embedded derivatives that otherwise would be bifurcated and accounted for separately. Derivatives are always classified as financial assets or liabilities at fair value through profit or loss, except when they are subject to hedge accounting.
Other financial liabilitiesliabilities.. All senior securities issued by SEK other than those classified as financial liabilities at fair value through profit or loss are classified as other financial liabilities and measured at amortized cost, using the effective interest rate method. Where one or more derivative is hedging currency, interest rate, and/or other exposures, fair-value hedge accounting is applied. Subordinated debt is classified within other financial liabilities and is mainly subject to fair-value hedge accounting. When applying fair-value hedge accounting on perpetual subordinated debt, hedging of the subordinated debt is made for the time period corresponding to the derivative’s time to maturity.
(v) Presentation of certain financial instruments in the statement of financial position
The presentation of financial instruments in the statement of financial position differs in certain respects from the categorization of financial instruments made for valuation purposes. Loans in the form of interest-bearing securities comprise loans granted to customers that are contractually documented in the form of interest-bearing securities, as opposed to bilateral loan agreements, which are classified in the statement of financial position either as loans to credit institutions or loans to the public. All other securities, which are not classified in the statement of financial position as loans in the form of interest-bearing securities, are classified as either cash and cash equivalents, treasuries/government bonds or other interest-bearing securities except for loans.
(vi) Measurement of certain financial instruments
Derivatives. In the ordinary course of its business, SEK uses, and is a party to, different types of derivatives for the purpose of hedging or eliminating SEK’s interest-rate, currency-exchange-rate and other exposures. Derivatives are always classified as financial assets or liabilities at fair value through profit or loss, except in connection with hedge accounting. Where SEK decides to categorize a financial asset or liability at fair value through profit or loss, the purpose is always to
avoid the mismatch that would otherwise arise from the fact that the changes in the value of the derivative, measured at fair value, would not match the changes in value of the underlying asset or liability, measured at amortized cost.
Guarantees. SEK is holder of financial guarantee contracts in connection with certain loans. Such guarantees are ordinarily accounted for as guarantees in accordance with SEK’s established accounting policy and therefore are not recorded in the statement of financial position (except for the deferred costs of related guarantee fees paid in advance for future periods). In limited situations, the relevant risk-mitigating instruments do not fulfill the requirements to be considered guarantees and are therefore recorded as derivatives and valued at fair value through profit or loss. When SEK classifies a risk-mitigating instrument as a financial guarantee, SEK always owns the specific asset whose risk the financial guarantee mitigates and the potential amount that SEK can receive from the counterparty under the guarantee represents only the actual loss incurred by SEK related to its holding.
Embedded derivatives.In the ordinary course of its business, SEK issues or acquires financial assets or liabilities that contain embedded derivatives. Where financial assets or financial liabilities contain embedded derivatives, it is the company’s policy to select the option to recognize and measure the embedded derivatives together with the underlying instruments, rather than bifurcating and separately measuring the embedded derivatives at fair value.
Leasing assetsassets. . SEK, in the ordinary course of its business, acquires leases which are classified as finance leases (as opposed to operating leases). When making such a classification, all aspects of the leasing contract, including third-party guarantees, are taken into account. Financial leases are reported as receivables from the lessees in the category of loans and receivables. Any lease payment that is received from a lessee is divided into two components for the purposes of measurement; one component constituting an amortization of the loan and the other component recorded as interest revenues.
Committed undisbursed loans and binding offers. . Committed undisbursed loans and binding offers, disclosed under the heading “Commitments” below the statement of financial position, are measured as the undiscounted future cash flow concerning loan payments related to loans committed but not yet disbursed at the period end date.date as well as binding offers.
Repurchase agreements and securities lendinglending.. Repurchase agreements are reported as financial transactions in the statement of financial position. Securities or other assets sold subject to repurchase agreements and securities or other assets lent to other parties are reported under the heading “Collateral provided” below the statement of financial position. Cash received from the relevant counterparties is recognized in the statement of financial position as borrowing. Cash advanced to the counterparties is recognized in the statement of financial position under “loans to credit institutions” or “loans to the public”.
Reacquired debt. SEK reacquires its own debt instruments from time to time. Gains or losses that SEK realizes when reacquiring own debt instruments are accounted for in the statement of comprehensive income as one component of “Net results of financial transactions”.transactions.”
(vii) Hedge accounting
SEK applies hedge accounting in cases where derivatives are used to create economic hedging and the hedge relationship is eligible for hedge accounting. The method used for hedge accounting is either fair-value hedge accounting or cash flow hedge accounting. In order to be able to apply hedge accounting, the hedging relationships must be highly effective in offsetting changes in fair values attributable to the hedged risks, both at inception of the hedge and on an ongoing basis. If the hedge efficiency does not fall within established boundaries, the hedge relationship is ended.
Fair-value hedge accountingaccounting. . Fair-value hedge accounting is used for transactions in which one or several derivatives hedge interest rate risk that has arisen from a fixed-rate financial asset or liability. When applying fair-value hedging, the hedged item is revalued at fair value with regard to the risk being hedged. SEK defines the risk being hedged in fair-value hedge accounting as the risk of a change in fair value with regard to a chosen reference rate (referred to as interest rate risk). The hedging instrument may consist of one or several derivatives exchanging fixed interest for floating interest in the same currency (interest rate swap)sswaps) or one or several instruments exchanging fixed interest in one currency for floating interest in another currency (interest and currency swaps.swaps) in which case the currency risk is a part of the fair value hedge.
If a fair-value hedge relationship no longer fulfills the requirements for hedge accounting, the hedged item ceases to be measured at fair value and is measured at amortized cost, and the previously recorded fair-value changes for the hedged item are amortized over the remaining maturity of the previously hedged item.
Cash flow hedge accountingaccounting. . Cash flow hedge accounting is used for transactions in which one or several derivatives hedge risk for variability in the cash flows from a floating-rate financial asset or liability. When hedging cash flows, the hedged asset or liability is measured at amortized cost and changes in fair value in the hedging instrument are reported in other comprehensive income. When the hedged cash flow is reported in operating profit, the fair-value changes in the hedging instrument are reclassified from other comprehensive income to operating profit. SEK defines the risk hedged in a cash flow hedge as the risk of variability of cash flows with regard to a chosen reference rate (referred to as cash flow risk). The hedging instrument may consist of one or several derivatives exchanging floating interest for fixed interest in the same currency (interest rate swaps) or one or several instruments exchanging floating interest in one currency for fixed interest in another currency (interest and currency swaps).
If a cash flow hedge relationship no longer fulfills the requirements for hedge accounting and accumulated gains or losses related to the hedge have been recorded in equity, such gains or losses remain in equity and are amortized through other comprehensive to profit over the remaining maturity of the previously hedged item.
(viii) Principles for determination of fair value of financial instruments
Fair-value measurements are categorized using a fair-value hierarchy. The financial instruments carried at fair value in the statement of financial position have been categorized under the three levels of the IFRS fair-value hierarchy that reflect the significance of inputs. The categorization of these instruments is based on the lowest level input that is significant to the fair-value measurement in its entirety.
SEK uses the following hierarchy for determining and disclosing the fair value of financial instruments, based on valuation techniques:
Level 1: quoted (unadjusted) prices in active markets for identical assets or liabilities;
Level 2: valuation models for which all inputs with a significant effect on the recorded fair value are observable, either directly or indirectly; and
Level 3: techniques that use inputs with a significant effect on the recorded fair value that are not based on observable market data.
The best evidence of fair value is quoted prices in an active market. The majority of SEK’s financial instruments are not publicly traded, and quoted market values are not readily available.
For all classes of financial instruments (assets and liabilities), fair value is established by using internally established valuation models, externally established valuation models, and quotations furnished by external parties and dealers in such instruments or market quotations.parties. If the market for a financial instrument is not active, fair value is established by using a valuation technique. The objective of using a valuation technique is to establish what the transaction price would have been at the measurement date in an arm’s length exchange based on normal business terms and conditions. Valuation techniques include using recent arm’s length market transactions between knowledgeable, willing parties, if available, reference to the current fair value of another instrument that is substantially the same, discounted cash flow analysis and option pricing
models. Periodically, the valuation techniques are calibrated and tested for validity using prices from observable current market transactions in the same instruments or based on any available observable market data.
In calculating fair value, SEK seeks to use observable market quotes (market data) to best reflect the market’s view on prices. These market quotes are used, directly or indirectly, in quantitative models for the calculation of fair value. Examples of the indirect use of market data are:
·the derivation of discount curves from observable market data, which is interpolated to calculate the non-observable data points, and
·quantitative models, which are used to calculate the fair value of a financial instrument, where the model is calibrated so that available market data can be used to recreate observable market prices on similar instruments.
In some cases, due to low liquidity in the market, there is no access to observable market data. In these cases, SEK follows market practice by basing its valuations on:
·historically observed market data. One example is a valuation depending on the correlation between two exchange rates, where the correlation is determined by time series analysis.analysis,
·similar observable market data. One example is SEK’s valuation of the volatility of a stock option whose maturity is longer than the longest option for which observable market quotes are available. In such a case, SEK extrapolates a value based on the observable market quotes for shorter maturities.
For observable market data, SEK uses third-party information based on purchased contracts (such as Reuters and Bloomberg). This type of information can be divided into two groups, with the first group consisting of directly observable prices and the second of market data calculated from the observed prices.
Examples from the first group are — for various currencies and maturities — currency rates, stock prices, share index levels, swap prices, future prices, basis spreads and bond prices. The discount curves that SEK uses, which are a cornerstone of valuation at fair value, are constructed from observable market data.
Examples from the second group are the standard forms of quotes, such as call options in the foreign exchange market quoted through volatility which is calculated so that the “Black-Scholes model” recreates observable prices. Further examples from this group are — for various currencies and maturities — currency volatility, swap volatility, cap/floor volatilities, stock volatility, dividend schedules for equity and CDS spreads. SEK ensure continuously the high quality of market data, and quarterly in connection with the financial reporting a thorough validation of market data is exercised.
For transactions that cannot be valued based on observable market data, the use of non-observable market data is necessary. One example of non-observable market data that SEK uses consists of discountdiscounts curves created using observable market data, which is then extrapolated to calculate the non-observable data. Another example of non-observable data is when market correlation used in valuation models is based on transactions with low liquidity, such as spread options.
(ix) Determination of fair value of certain types of financial instruments
DerivativesDerivative instruments. DerivativesDerivative instruments are carried at fair value, and fair value is calculated based upon internally established valuations, external valuation models, quotations furnished by external parties or dealers in such instruments or market quotations. When calculating fair value for derivatives,derivative instruments, the impact on the fair value of the instrument related to counterparty credit risk is based on publicly quoted prices on credit default swaps of the counterparty, if such prices are available.
Issued debt instrumentsinstruments.. When calculating the fair value of issued debt instruments, the effect on the fair value of SEK’s own credit risk is assessed based on internally established models founded on observations from different markets. Furthermore, certain assumptions are made about the expected duration of certain liabilities carried at fair value and the derivatives that hedge the debt instruments. Assumptions on expected duration are evaluated and reconsidered on a quarterly basis. The models used include both observable and non-observable parameters for valuation.
Issued debt instruments that are hybrid instruments with embedded derivatives. SEK issues debt instruments in many financial markets. A large portion of these are hybrid instruments with embedded derivates. SEK’s policy is to hedge the risks in these instruments using derivatives in order to obtain effective economic hedges. These hybrid debt instruments are classified as financial liabilities measured at fair value through profit or loss. As there are no quoted market prices for these instruments, valuation models valuations established by external parties or quotes furnished by dealers in such instruments are used to calculate fair value. The same valuation model is used for both hybrid debtgross value of these instruments and the derivative hedging such instruments, except with regard to adjustments due to counterparty or own credit risk.
See further information in Note 13derivatives which effectively hedge each other requires complex judgments regarding the most appropriate valuation techniques applied for certain typestechnique, assumptions and estimates. If different valuation models or assumption were used, or if assumptions changed, this could produce different valuation results. Excluding the impact on valuation of financial instruments.
Table of Contentscredit spreads on SEK’s own debt and basis spreads, such changes in fair value would generally offset each other.
(x) Impairment of financial assets
SEK monitors loans and receivables and other assets for impairment as described below. Loans and other financial assets are identified as impaired if there is objective evidence of impairment and an impairment test indicates a loss.
Provisions for incurred impairment losseslosses. . Provisions for incurred impairment losses are recorded if and when SEK determines it is probable that the counterparty to a loan or another financial asset held by SEK, along with existing guarantees and collateral, will fail to cover SEK’s full claim. Such determinations are made for each individual loan or other financial asset. Objective evidence consists of the issuer or debtor suffering significant financial difficulties, outstanding or delayed payments or other observable facts which suggest a measurable decrease in expected future cash flow. If there is objective evidence that an impairment loss on a loan or other financial asset has been incurred, the amount of the loss is measured as the difference between the asset’s carrying amount and the present value of estimated future cash flows (excluding future credit losses that have not been incurred) discounted to the relevant period end date at the financial asset’s original effective interest rate. The amount of the loss is recognized in profit or loss.
After an individual determination has been made, and if there is no objective evidence for impairment of an individually assessed financial asset, regardless of whether the asset is individually material or not, the company includes the asset in a group of financial assets with similar credit risk characteristics and determines, collectively, the need for the impairment of such assets based on quantitative and qualitative analyses. The need for impairment is related to loan losses that have occurred as of a period-end date but which have not yet been identified as individual loan losses.
Impairment of an asset is made to a reserve account which, in the consolidated statement of financial position, reduces the line item to which it relates.
If and when a decline in the fair value of an available-for-sale financial asset has been recognized in other comprehensive income and there is objective evidence that the asset is impaired, the cumulative loss that has been recognized is removed from other comprehensive income and recognized in profit or loss, even though the financial asset has not been derecognized in the statement of financial position.
Charge-offs are recorded when it is evident that it is highly unlikely that any remaining part of SEK’s claim on a
counterparty will be reimbursed within the foreseeable future and when there exists no guarantee or collateral covering the claim. Charge-offs may also be made once bankruptcy proceedings have been concluded and a final loss can be established, taking into account the value of any assets held by the bankruptcy estate and SEK’s share of these assets.
Recoveries are recorded only if there is virtual certainty of collection, such as in the aftermath of a bankruptcy proceeding when the payment due to be paid to SEK has been finally determined.
When a loan is classified as impaired, is past due or is otherwise non-performing, the interest is accounted for in the same manner as the principal amount. Thus, the interest related to any portion of a loan that is expected to be repaid in the future is recorded in earnings, discounted at the original effective interest rate, while the interest related to any portion of a loan that is not expected to be collected in accordance with the relevant loan agreement will not be recorded in earnings.
(g) Tangible assets
Items of property and equipment are measured at cost, less accumulated depreciation and accumulated impairment losses. Costs include expenditures that are directly attributable to the acquisition of the asset. When parts of an item of property or equipment have different useful lives, they are accounted for as separate items (major components) of property and equipment. Office equipment, buildings and equipment relating to the building are depreciated using the straight-line method over their estimated useful lives. Land is not depreciated. Average useful lives, depreciation methods and bookresidual values are evaluated and reconsidered on a yearly basis. No depreciation is carried out from the time that an asset is classified as an asset held-for-sale.
(h) Intangible assets
Intangible assets comprise mainly the capitalized portion of investments in IT systems, which include expenses related to the intangible assets, such as consulting fees and expenses for Group personnel contributing to producing such intangible assets. Each intangible asset is depreciated using the straight-line method over an estimated useful life from the date the asset is available for use. Average useful lives are evaluated and reconsidered on a yearly basis. An annual impairment test is performed on intangible assets not yet used.
(i) Employee benefits
SEK sponsors both defined benefitcontribution and defined contributionbenefit pension plans.
Defined contribution plans
A defined contribution plan is a post-employment benefit plan under which an entity (SEK, in this case) pays fixed contributions into a separate entity and will have no legal or constructive obligation to pay further amounts. Obligations for
contributions to defined contribution pension plans are recognized as an employee benefit expense in profit or loss at the rate at which they are accrued by employees providing services to the entity during a period. Prepaid contributions are recognized as an asset to the extent that a cash refund or a reduction in future payments is available.
Defined benefit plans
Defined benefit plans are post-employment benefit plans other than defined contribution plans.
The net obligation in respect of defined benefit plans is calculated separately for each plan by estimating the amount of future benefits that employees have earned in return for their service in the current and prior periods. This benefit is discounted to determine its present value and the fair value of any plan assets is deducted.
The cost for defined benefit plans is calculated using the “projected unit credit method”, which distributes the cost of a plan over a covered employee’s service period. The calculation is performed annually by independent actuaries. The obligations are valued at the present value of the expected future disbursements, taking into consideration assumptions such as expected future pay increases, rate of inflation, and changes in mortality rates. The discount rate used is the equivalent of the interest rate for government bonds, with a remaining term approximating that of the actual commitments.
Changes in actuarial assumptions may result in actuarial gains or losses affecting the fair value of plan obligations. Such gains or losses, within a 10 percent “corridor,” are not immediately recognized. Gains or losses exceeding the 10 percent corridor are amortized over the remaining estimated service period of the employees.
The companies of the Group supportparticipate in various public pension plans covering all employees. Defined benefit accounting should also be applied for public pension plans, provided that sufficient information is available to enable the company to calculate its proportional share of the defined benefit liabilities, assets and costs associated with the plan. Such information has been made available to all companies within the Group since 2009. The future costs of the planplans may change accordingly if the underlying assumptions of the planplans change. In addition to this there are individual pension solutions for two former employees that are being disbursed. These have been accounted for in the same way as the company’s other pension obligations.
(j) Equity
Equity in the Consolidated Group consists of the following items: share capital; reserves; retained earnings; and net profit
for the year. Reserves consist of the following items: reserve for fair-value changes in respect of available-for-sale securities (Fair(fair value reserve) and reserve for fair-value changes in respect of derivatives in cash flow hedges (Hedge(hedge reserve).
(k) Income tax
Income tax on the profit or loss for the year comprises current and deferred taxes. Current tax is tax expected to be payable on taxable income for the financial year. Deferred tax includes deferred tax in the untaxed reserves of the individual Group companies and deferred taxes on other taxable temporary differences. Deferred taxes on taxable temporary differences are calculated with an expected tax rate of 22.0 percent (2011: 26.3 percent. 2010: 26.3 percent). Deferred taxes are calculated on all taxable temporary differences, regardless of whether a given temporary difference is recognized in the income statement or through other comprehensive income.
(l) Earnings per share
Earnings per share are calculated as Net profit for the year divided by the average number of shares. There is no dilution of shares.
(m) Statement of Cash Flows
The Statement of Cash Flows shows inflows and outflows of cash and cash equivalents during the year. SEK’s Statement of Cash FlowFlows has been prepared in accordance with the indirect method, whereby operating profit is adjusted for effects of non-cash transactions such as depreciation and loan losses. The cash flows are classified by operating, investing and financing activities. Cash and cash equivalents include, in this context, cash at banks where amounts can be immediately converted into cash and short-term deposits where the time to maturity does not exceed three months from trade date. See Note 1111.
(n) Critical accounting policies, judgments and estimates
When applying the Group’s accounting policies, management makes judgments and estimates that have a significant effect on the amounts recognized in the financial statements. These estimates are based on past experience and assumptions that the company believes are fair and reasonable. These estimates and the judgments behind them affect the reported amounts of assets, liabilities and off-balance sheet items, as well as income and expenses in the financial statements presented. Actual outcomes can later differ from the estimates and the assumptions made. Please see below for items for which critical estimates have been made. The companySEK assesses that the judgments made related to the following critical accounting
policies are the most significant:
·The functional currency of the Parent Company,
·Classifications of securities as quoted on an active market,
·The selection of the appropriate valuation techniques when prices from active markets are not available for derivatives and other financial instruments carried at fair value,
·The judgment that SEK should be regarded as an agent with respect to the S-system
Furthermore, SEK has identified the following key sources of estimation uncertainty when applying IFRS:
·Provisions for probable credit losses,
·Estimates of fair values when quoted market prices are not available,
·Valuation of derivatives without observable market prices
The functional currency of the Parent Company
SEK has determined that the Swedish krona (Skr) is its functional currency under IFRS. Large portions of its assets, liabilities and related derivatives are denominated in foreign currency. Under IFRS, both assets and liabilities are translated at closing exchange rates and the differences between historical book values and current values are recognized as foreign exchange effects in the statement of comprehensive income. These differences largely offset each other, causing the net result not to be of material amount in relation to total assets and liabilities in foreign currency. This reflects the economic substance of SEK’s policy of holding assets financed by liabilities denominated in, or hedged into, the same currency. See Note 2728 for information on SEK’s positions in foreign currency.
Classifications of securities as quoted on an active market
When classifying securities as loans and receivables, SEK makes judgments as to whether these securities are quoted on active markets, based on a number of pre-established factors. SEK has, based on the regulation and guidance in the existing IFRS standards and established an operational definition of when a transaction should be regarded as quoted on an active market. An instrument is regarded as quoted on an active market if there are sufficient numbers of parties offering bid
and/or ask prices. All other transactions are regarded as not quoted on an active market. In the case of uncertainty, additional qualitative criteria are taken into consideration in accordance with a predefined process. The definition is based on the markets in which SEK invests. If a larger number of securities were deemed to be quoted on an active market, these securities would be classified as assets available for saleavailable-for-sale and carried at fair value, with changes in value after tax reported under other comprehensive income. From December 1, 2012 all new interest bearing securities acquired as SEK’s liquidity placements are classified as assets available-for-sale. See Note 12 for information on SEK’s classification of financial assets and liabilities.
The selection of the appropriate valuation techniques when prices from active markets are not available for derivatives and other financial instruments carried at fair value
When reporting the amounts of its assets, liabilities and derivatives, as well as its revenues and expenses, assumptions and estimates must be made in assessing the fair value of financial instruments and derivatives, especially where unquoted or illiquid securities or other debt instruments are involved. SEK makes judgments regarding what the most appropriate valuation techniques are for the different financial instruments held by the Group. If the conditions underlying these assumptions and estimates were to change, the amounts reported could be different. When financial instruments are carried at fair value, fair value is calculated through the use of market quotations, pricing models, valuations established by external parties and discounted cash flows. The majority of SEK’s financial instruments are not publicly traded, and quoted market prices are not readily available. Different pricing models or assumptions could produce different valuation results. Furthermore, the estimated fair value of a financial instrument may, under certain market conditions, differ significantly from the amount that could be realized if the security were sold immediately. See Note 2728 for disclosure of change in value of assets and liabilities if the market interest rate rises or falls by one percentage point.
The judgment that SEK should be regarded as an agent with respect to the S-system
SEK has determined that the S-system should be considered to be an assignment where SEK acts as an agent on behalf of the Swedish State rather than being the principal in the individual transactions. This assessment has been made based on a number of factors such as the following: (i) although it does in form, SEK does not in substance bear risks and make decisions associated with ownership; (ii) SEK does not have discretion in establishing prices; and (iii) SEK receives compensation in the form of a fixed commission. SEK has consequently presented the economic activities of the S-system on a net basis in the statement of comprehensive income, recording the net commission received, rather than the gross amounts collected, in accordance with the agreement withinstruction from the Swedish State. If SEK were regarded as a principal with respect to the S-system, all revenues and expenses in the S-system would be revenues and expenses of SEK. However, the
net effect on SEK’s operating profit would be unchanged. Please seeSee more information regarding the S-system in Note 24.25.
Provisions for probable credit losses
Provisions for probable credit losses are made if and when SEK determines that it is probable that the obligor under a loan or another asset held by SEK, in each case together with existing guarantees and collateral, will fail to cover SEK’s full claim. If the judgment underlying this determination were to change, this could result in a material change in provisions for probable credit losses.
Impairment is recognized as the difference between the carrying value of a loan and the discounted value of SEK’s best estimate of future cash repayments. This estimate takes into account a number of factors related to the obligor. The actual amounts of future cash flows and the dates they are received may differ from these estimates and consequently actual losses incurred may differ from those recognized in the financial statements. If, for example, the actual amount of total future cash flow were 10 percent higher or lower than the estimate, this would affect operating profit for the financial year ended December 31, 20112012 by Skr 60-7070—80 million (2010:(2011: Skr 60—70 million. 2010: Skr 50-60 million) and equity by Skr 40-5050—60 million (2010:(2011: Skr 40—50 million. 2010: Skr 30-40 million) aton that date. A higher total future cash flow would affect operating profit and equity positively, and a lower total future cash flow would affect operating profit and equity negatively.
Estimates of fair value when quoted market prices are not available
If a transaction is classified as assetsan asset or liabilitiesliability at fair value through profit or loss, fair value must include any impact of credit spreads. When quoted market prices are not available for such instruments, certain assumptions must be made about the credit spread of either the counterparty or one’s own credit spread, depending on whether the instrument is an asset or a liability. If these assumptions were to be changed, this could result in a material change in the fair value of these instruments.
If the assumption related to the valuation of assets classified at fair value through profit or loss were changed such that the average credit spread applied to such assets were 0.10 percent higher or lower than the average spread actually used in the calculations, this would affect operating profit for the fiscal year ended December 31, 20112012 by approximately Skr 20-3010-20 million (2010:(2011: Skr 20—30 million. 2010: Skr 20-30 million) and equity, at such date, by approximately Skr 30-4040-50 million (2010:
(2011: Skr 30—40 million. 2010: Skr 30-40 million). A higher credit spread would affect operating profit and equity negatively, and a lower credit spread would affect operating profit and equity positively.
If the assumption related to the valuation of liabilities classified at fair value through profit or loss were changed such that the average credit spread applied to such liabilities were 0.10 percent higher or lower than the average spread actually used in the calculations, this would affect operating profit for the fiscal year ended December 31, 20112012 by approximately Skr 300-400250-350 million (2010:(2011: Skr 300—400 million. 2010: Skr 400-500 million) and equity, at such date, by approximately Skr 200-300 million (2010:(2011: Skr 300-400200-300 million. 2010: Skr 200-300 million). A higher credit spread would affect operating profit and equity positively, and a lower credit spread would affect operating profit and equity negatively.
SEK issues debt instruments in many financial markets. A large portion of these are hybrid instruments with embedded derivatives. SEK’s policy is to hedge the risks in these instruments using swaps with corresponding structures in order to obtain effective economic hedges. These hybrid debt instruments are classified as financial liabilities measured at fair value. As there are no market quotes for this group of transactions, valuation models valuations established by external parties or quotations furnished by dealers in such instruments are used to calculate fair value. The same model isgross value of these instruments and derivatives which effectively hedge each other requires complex judgments regarding the most appropriate valuation technique, assumptions and estimates. If different valuation models or assumption were used, for a hybrid liability andor if assumptions changed, this could produce different valuation results. Excluding the structured swap hedging the instrument, except for adjustments due to counterparty orimpact on valuation of credit spreads on SEK’s own credit risk. Thus, with the exception of effects fromdebt and basis spreads, such changes in counterparty and SEK’s own credit risk valuations, fair-value changes in a hybrid liability are always matched by corresponding changes in the fair value of the swap that hedges that liability. would generally offset each other.
Developments on the financial markets have to some extent affected the prices at which SEK’s debt is issued. These changes, which are different in different markets, have been included in the calculation of fair value for these liabilities. The models used include both directly observable and implied market parameters. Please see further information regarding valuation techniques in Note 13.
Valuation of derivatives without observable market prices
A large part of SEK’s portfolio of senior securities issued and related derivatives is in the form of structured products, in which the fair value of certain embedded derivatives (though not bifurcated) sometimes requires sophisticated models in order to value these instruments. If the assumptions used in these models were to change, this could result in a material change in the fair value of these instruments. Since SEK only enters into market-matched hedge relationships (economic or accounting hedges), the onlya potential material effect on profit or loss or equity would result only if there were changes in the credit spreads or basis spreads.
SEK uses swap agreements (primarily)derivative instruments to hedge risk exposures inmitigate and reduce risks attributable to financial assets and liabilities. In order to mitigate counterparty risk, i.e. the form of credit risk generated from derivative transactions, SEK enters into swap agreementssuch transactions only underwith counterparties with good creditworthiness. Moreover, SEK endeavors to enter into ISDA master agreementsMaster Agreements with Credit Support Annexes with its counterparties, which obligate counterparties to post collateral in certain circumstances. This means that the greatest permitted risk level is established in advance, regardless of what changes in market value may occur. Swaps are valued at fair value with reference to listed market prices where available. If market prices are not available, valuation models are used instead. For counterparties for which SEK has a positive portfolio value, SEK uses a model to adjust the fair value of the net exposure for changes in the counterparty’s creditworthiness. The models used cover both directly observable and all swap contracts are with financial institutions as counterparties. Counterparty risks are managed by using a credit support annex or other agreement whereby the credit exposure is mitigatedderived market parameters.
on at least a monthly basis. Swaps are measured at fair value by using market quoted rates, where available. If market quotes are not available, valuation models are used. For counterparties in respect of which SEK has a positive swap portfolio value, SEK uses a model to adjust the net exposure fair value for changes in the counterparty’s credit quality. The models used include both directly observable and implied market parameters. Please see further information regarding valuation techniques in Note 13.
Note 2. Net interest revenues
|
| Consolidated Group |
|
| Consolidated Group |
| ||||||||
Skr mn |
| 2011 |
| 2010 |
| 2009 |
|
| 2012 |
| 2011 |
| 2010 |
|
Interest revenues were related to: |
|
|
|
|
|
|
|
|
|
|
|
|
|
|
Loans to credit institutions |
| 1,197.3 |
| 1,191.9 |
| 1,635.2 |
|
| 993.8 |
| 1,197.3 |
| 1,191.9 |
|
Loans to the public |
| 3,679.2 |
| 3,018.1 |
| 2,983.6 |
|
| 3,736.6 |
| 3,679.2 |
| 3,018.1 |
|
Interest-bearing securities |
| 1,950.0 |
| 1,679.8 |
| 3,043.6 |
|
| 1,259.7 |
| 1,950.0 |
| 1,679.8 |
|
Impaired financial assets |
| 3.1 |
| 3.1 |
| 34.4 |
|
| 3.2 |
| 3.1 |
| 3.1 |
|
Derivatives |
| 3,393.4 |
| 6,290.2 |
| 5,609.6 |
|
| 4,359.0 |
| 3,393.4 |
| 6,290.2 |
|
Total interest revenues |
| 10,223.0 |
| 12,183.1 |
| 13,306.4 |
|
| 10,352.3 |
| 10,223.0 |
| 12,183.1 |
|
Total interest expenses |
| -8,352.2 |
| -10,284.6 |
| -11,312.1 |
|
| -8,472.4 |
| -8,352.2 |
| -10,284.6 |
|
Net interest revenues |
| 1,870.8 |
| 1,898.5 |
| 1,994.3 |
|
| 1,879.9 |
| 1,870.8 |
| 1,898.5 |
|
|
| Consolidated Group |
|
| Consolidated Group |
| ||||||||
Skr mn |
| 2011 |
| 2010 |
| 2009 |
|
| 2012 |
| 2011 |
| 2010 |
|
Interest revenues were related to: |
|
|
|
|
|
|
|
|
|
|
|
|
|
|
Financial assets available-for-sale |
| 211.9 |
| 66.8 |
| 5.2 |
|
| 143.2 |
| 211.9 |
| 66.8 |
|
Financial assets at fair value through profit or loss |
| 3,801.8 |
| 6,715.4 |
| 6,340.8 |
|
| 4,633.8 |
| 3,801.8 |
| 6,715.4 |
|
Loans and receivables |
| 6,209.3 |
| 5,400.9 |
| 6,960.4 |
|
| 5,575.3 |
| 6,209.3 |
| 5,400.9 |
|
Total interest revenues |
| 10,223.0 |
| 12,183.1 |
| 13,306.4 |
|
| 10,352.3 |
| 10,223.0 |
| 12,183.1 |
|
|
|
|
|
|
|
|
|
|
|
|
|
|
|
|
Interest expenses were related to: |
|
|
|
|
|
|
|
|
|
|
|
|
|
|
Financial liabilities at fair value through profit or loss |
| -3,945.4 |
| -4,149.9 |
| -4,391.9 |
|
| -4,088.8 |
| -3,945.4 |
| -4,149.9 |
|
Financial guarantees |
| -216.9 |
| -248.6 |
| -212.5 |
|
| -147.1 |
| -216.9 |
| -248.6 |
|
Other financial liabilities |
| -4,189.9 |
| -5,886.1 |
| -6,707.7 |
|
| -4,236.5 |
| -4,189.9 |
| -5,886.1 |
|
Total interest expenses |
| -8,352.2 |
| -10,284.6 |
| -11,312.1 |
|
| -8,472.4 |
| -8,352.2 |
| -10,284.6 |
|
|
|
|
|
|
|
|
|
|
|
|
|
|
|
|
Net interest revenues |
| 1,870.8 |
| 1,898.5 |
| 1,994.3 |
|
| 1,879.9 |
| 1,870.8 |
| 1,898.5 |
|
In interest revenues Skr 89.4 million (2011: Skr 72.4 million (2010:million; 2010: Skr 48.7 million; 2009: Skr 27.3 million) represent remuneration from the S-system (see Note 24)25).
Interest revenues in the Consolidated Group by geographic market are approximately33.9 percent (2011: 36.2 percent (2010:percent; 2010: 24.2 percent; 2009: 21.7 percent) from Sweden, 18.1 percent (2011: 24.7 percent (2010:percent; 2010: 52.4 percent; 2009: 9.1 percent)) from other European countries and 48.0 percent (2011: 39.1 percent (2010:percent; 2010: 24.4 percent; 2009: 69.2 percent) from other countries outside of Europe.
Note 3. Net commissions
|
| Consolidated Group |
|
| Consolidated Group |
| ||||||||
Skr mn |
| 2011 |
| 2010 |
| 2009 |
|
| 2012 |
| 2011 |
| 2010 |
|
Commissions earned were related to: |
|
|
|
|
|
|
|
|
|
|
|
|
|
|
Capital market commissions |
| 8.6 |
| 6.8 |
| 2.5 |
|
| 5.5 |
| 8.6 |
| 6.8 |
|
Financial consultants’ commissions |
| 2.3 |
| 12.7 |
| 23.2 |
|
| 4.1 |
| 2.3 |
| 12.7 |
|
Other commissions earned |
| 1.4 |
| 0.2 |
| 0.5 |
|
| 1.5 |
| 1.4 |
| 0.2 |
|
Total commissions earned |
| 12.3 |
| 19.7 |
| 26.2 |
|
| 11.1 |
| 12.3 |
| 19.7 |
|
|
|
|
|
|
|
|
|
|
|
|
|
|
|
|
Commissions incurred were related to: |
|
|
|
|
|
|
|
|
|
|
|
|
|
|
Depot and bank fees |
| -8.2 |
| -10.1 |
| -11.2 |
|
| -7.4 |
| -8.2 |
| -10.1 |
|
Brokerage |
| -2.8 |
| -3.6 |
| -3.2 |
|
| -2.8 |
| -2.8 |
| -3.6 |
|
Risk capital guarantee from shareholder(1) |
| -1.8 |
| -3.6 |
| -3.6 |
|
| — |
| -1.8 |
| -3.6 |
|
Financial consultants’ commissions |
| -0.8 |
| -1.5 |
| -6.1 |
|
| -0.3 |
| -0.8 |
| -1.5 |
|
Other commissions incurred |
| -1.3 |
| -1.1 |
| -2.3 |
|
| -0.4 |
| -1.3 |
| -1.1 |
|
Total commissions incurred |
| -14.9 |
| -19.9 |
| -26.4 |
|
| -10.9 |
| -14.9 |
| -19.9 |
|
Net commissions |
| -2.6 |
| -0.2 |
| -0.2 |
|
| 0.2 |
| -2.6 |
| -0.2 |
|
(1) SEK has had access to a guarantee of Skr 600 million, issued by the owner, the Swedish state, from which SEK has had the right to draw on the guarantee if SEK deems it bedeemed necessary to be able to fulfill its obligations. Given that SEK’s owner, the Swedish state, in 2008 contributed substantial amounts of new equity to SEK, the abovementioned guarantee has been deemed by SEK no longer to be required and expired at June 30, 2011.
Commissions earned in the Consolidated Group by geographic market isare divided as follows: 73.8 percent (2011: 43.6 percent (2010:percent; 2010: 51.2 percent) are from Sweden, 56.517.2 percent (2010:(2011: 56.5; 2010: 34.2 percent) are from Europe except Sweden and 9.0 percent (2011: 0.0 percent (2010:percent; 2010: 14.7 percent) are from countries outside of Europe.
Commissions incurred in the Consolidated Group by geographic market isare divided as follows: 20.6 percent (2011: 34.7 percent (2010:percent; 2010: 34.5 percent) are from Sweden, 78.2 percent (2011: 65.0 percent (2010:percent; 2010: 59.9 percent) are from Europe except Sweden and 1.2 percent (2011: 0.3 percent (2010:percent; 2010: 5.5 percent) are from countries outside of Europe.
Commissions earned from financial assets and liabilities not measured at fair value through profit or loss amounts,amount, for the Consolidated Group, to Skr 0.0 million (2011: 0.2 million (2010:million; 2010: Skr 0.2 million).
Commissions incurred from financial assets and liabilities not measured at fair value through profit or loss amounts,amount, for the Consolidated Group, to Skr 0.1 million (2011: 0.2 million (2010:million; 2010: Skr 0.7 million).
Note 4. Net result of financial transactions
|
| Consolidated Group |
| ||||
Skr mn |
| 2011 |
| 2010 |
| 2009 |
|
Net results of financial transactions were related to: |
|
|
|
|
|
|
|
Currency exchange effects on assets and liabilities excluding assets and liabilities valued at fair value |
| 4.8 |
| -0.8 |
| 31.5 |
|
Interest compensation (1) |
| 42.2 |
| 99.4 |
| — |
|
Realized results on settled assets and repurchased debt |
| 434.9 |
| 2,574.0 |
| 302.3 |
|
Total net results of financial transactions, before certain fair value changes |
| 481.9 |
| 2,672.6 |
| 333.8 |
|
|
|
|
|
|
|
|
|
Unrealized changes in fair value related to financial assets, financial liabilities and related derivatives |
| 41.5 |
| -175.0 |
| 769.3 |
|
Total net results of financial transactions |
| 523.4 |
| 2,497.6 |
| 1,103.1 |
|
Realized results on settled assets and repurchased debt |
| Consolidated Group |
| ||||
Skr mn |
| 2011 |
| 2010 |
| 2009 |
|
Financial assets or liabilities at fair value through profit or loss |
| 403.3 | (2) | 140.1 |
| 190.3 |
|
Financial assets available-for-sale |
| — |
| 2,565.0 | (3) | 0.0 |
|
Loans and receivables |
| — |
| -137.9 |
| -2.2 |
|
Other financial liabilities |
| 31.6 |
| 6.8 |
| 114.2 |
|
Total |
| 434.9 |
| 2,574.0 |
| 302.3 |
|
Unrealized changes in fair value related to financial assets, financial liabilities and |
| Consolidated Group |
| ||||
Skr mn |
| 2011 |
| 2010 |
| 2009 |
|
Financial assets or liabilities at fair value through profit or loss |
|
|
|
|
|
|
|
of which designated upon initial recognition (FVO) |
| 14,019.7 |
| -280.7 |
| -3,573.5 |
|
of which held-for-trading |
| -13,971.6 |
| 45.2 |
| 3,973.2 |
|
Derivatives used for hedge accounting |
| 2,253.2 |
| 799.9 |
| -2,877.2 |
|
Financial assets available-for-sale (4) |
| -43.9 |
| -31.7 |
| -1.2 |
|
Loans and receivables (4) |
| 415.0 |
| -149.1 |
| -611.7 |
|
Other financial liabilities (4) |
| -2,630.9 |
| -558.6 |
| 3,859.7 |
|
Ineffectiveness of cash flow hedges that have been reported in the profit or loss |
| 0.0 |
| 0.0 |
| 0.0 |
|
Total |
| 41.5 |
| -175.0 |
| 769.3 |
|
|
|
|
|
|
|
|
|
of which total amount of the changes in fair value estimated using valuation techniques based on assumptions that are not supported by prices from observable current market transactions in the instruments recognized in profit or loss during the period |
| 41.5 |
| -175.0 |
| 770.5 |
|
|
| Consolidated Group |
| ||||
Skr mn |
| 2012 |
| 2011 |
| 2010 |
|
Net results of financial transactions were related to: |
|
|
|
|
|
|
|
Currency exchange effects on all assets and liabilities excl. Currency exchange effects related to revaluation at fair value |
| 3.0 |
| 4.8 |
| -0.8 |
|
Interest compensation |
| 1.1 |
| 42.2 |
| 99.4 |
|
Realized results on settled assets and repurchased debt |
| 639.9 | (1) | 434.9 | (2) | 2,574.0 | (3) |
Total net results of financial transactions, before certain fair value changes |
| 644.0 |
| 481.9 |
| 2,672.6 |
|
|
|
|
|
|
|
|
|
Unrealized changes in fair value related to financial assets, financial liabilities and related derivatives |
| -1,151.7 | (1) | 41.5 |
| -175.0 |
|
Total net results of financial transactions |
| -507.7 |
| 523.4 |
| 2,497.6 |
|
(1) The compensation represents the change in fair value due to changes in applicable interest rates for early redemption of loans. The compensation was previously reported as realizedRealized results on settled assets and repurchased debt.debt
|
| Consolidated Group |
| ||||
Skr mn |
| 2012 |
| 2011 |
| 2010 |
|
Financial assets or liabilities at fair value through profit or loss |
| 247.0 | (1) | 403.3 | (2) | 140.1 |
|
Financial assets available-for-sale |
| — |
| — |
| 2,565.0 | (3) |
Loans and receivables |
| 1.4 |
| — |
| -137.9 |
|
Other financial liabilities |
| 391.5 |
| 31.6 |
| 6.8 |
|
Total |
| 639.9 |
| 434.9 |
| 2,574.0 |
|
Unrealized changes in fair value related to financial assets, financial liabilities and related derivatives, for categories of financial instruments
|
| Consolidated Group |
| ||||
Skr mn |
| 2012 |
| 2011 |
| 2010 |
|
Financial assets or liabilities at fair value through profit or loss |
|
|
|
|
|
|
|
of which designated upon initial recognition (FVO) |
| -13,443.6 |
| 14,019.7 |
| -280.7 |
|
of which held-for-trading |
| 12,967.9 |
| -13,971.6 |
| 45.2 |
|
Derivatives used for hedge accounting |
| -1,308.2 | (1) | 2,253.2 |
| 799.9 |
|
Financial assets available-for-sale (4) |
| -8.1 |
| -43.9 |
| -31.7 |
|
Loans and receivables (4) |
| 260.6 |
| 415.0 |
| -149.1 |
|
Other financial liabilities (4) |
| 409.8 |
| -2,630.9 |
| -558.6 |
|
Ineffectiveness of cash flow hedges that have been reported in the profit or loss |
| -30.1 |
| 0.0 |
| 0.0 |
|
Total |
| -1,151.7 |
| 41.5 |
| -175.0 |
|
(1) A previously recognized unrealized gain was realized during third quarter of 2012 when a few large interest rate and currency derivatives were closed out in order to prepare for the new regulatory framework for large exposures which comes into force January 1, 2013. The net loss in operating profit amounted to Skr 30,1 million. Realized profit amounted to Skr 323.5 million, which was offset by the reversal of previously recognized unrealized losses amounting to Skr 353.6 million. The derivatives were replaced with new derivative instruments at market terms.
(2) The result includes2011 included a realized gain from a sale regarding a receivable of Skr 279.3 million from a sale of a receivable related to Lehman Brothers. The claim has earlierreceivable had been previously reported as a contingent asset.
(3)The disposal of the shares in Swedbank in the fourth quarter of 2010 is reported in the line item Realized results onin settled assets and repurchased debt with a value of Skr 2,565.0 million, which correspondcorresponds to the changes in fair value that has been reported previously as other comprehensive income and has been included in the fair value reserve within equity. See Note 23 for further information.
(4) Changes in fair value of financial assets available-for-sale, loans and receivables and other financial liabilities have been accounted for through profit and loss when such asset or liability is subject to fair value hedging in terms of changes in fair value related to the hedged risk. See Note 13 for information on the portion of those assets or liabilities that are subject to fair value hedging.hedging and gains and losses on hedging instruments and the hedged risk.
Note 5. Personnel expenses
|
| Consolidated Group |
|
| Consolidated Group |
| ||||||||
Skr mn |
| 2011 |
| 2010 |
| 2009 |
|
| 2012 |
| 2011 |
| 2010 |
|
Personnel expenses: |
|
|
|
|
|
|
|
|
|
|
|
|
|
|
Salaries and remuneration to the Board of Directors and the Presidents |
| -7.4 |
| -6.9 |
| -11.4 |
|
| -7.5 |
| -7.4 |
| -6.9 |
|
Salaries and remuneration to Senior Executives |
| -17.1 |
| -10.9 |
| -10.5 |
|
| -11.8 |
| -17.1 |
| -10.9 |
|
Salaries and remuneration to other employees |
| -140.0 |
| -113.1 |
| -156.2 |
|
| -145.8 |
| -140.0 |
| -113.1 |
|
Pensions |
| -49.1 |
| -67.0 |
| -67.6 |
|
| -55.8 |
| -49.1 |
| -67.0 |
|
Social insurance |
| -54.6 |
| -45.1 |
| -53.1 |
|
| -57.3 |
| -54.6 |
| -45.1 |
|
Other personnel expenses |
| -14.6 |
| -16.4 |
| -13.4 |
|
| -14.0 |
| -14.6 |
| -16.4 |
|
Total personnel expenses |
| -282.8 |
| -259.4 |
| -312.2 |
|
| -292.2 |
| -282.8 |
| -259.4 |
|
(1) The remuneration to Jane Lundgren Ericsson is recognized,Personnel expenses include an estimated cost, including social fees, for the position as Presidentgeneral personnel incentive system, GIS, of AB SEK Securities, in the item “Salaries and remuneration to the Board of Directors and the Presidents” for the Consolidated Group.
Salaries and remuneration to senior executives (excluding the President) include Skr 5.827.5 million (2010:(2011: Skr 25.5 million; 2010: Skr 0.0 million; 2009: Skr 0.0 million). GIS, is the only type of variable remuneration relatedat SEK and constitutes a unilateral offer by the Company, which the Company may alter or withdraw from time to 2008. Salariestime at its discretion. The content, scope and remunerationvalidity of GIS, as well as any amendments or supplements thereof, can only be decided by the Board. The amount paid to other employees include Skr 19.4 million (2010: Skr 0.0 million; 2009: Skr 0.0)participants generally corresponds to a maximum of variabletwo months’ salary (including relevant social costs, which are paid by the company and reduce the remuneration related to 2011. Variable remuneration is not paid to the Presidents oremployee). GIS covers all permanent employees, except the CEO, other senior executives formembers of the years 2010Executive Committee, Head of Financial Control and 2011. Head of Risk Control.
The combined total of the remuneration to senior executives, excluding the President of the Parent Company, amounted to Skr 13.7 million (2011: Skr 19.2 million (2010:million; 2010: Skr 12.7 million; 2009: Skr 12.1 million). Of the remuneration to senior executives, Skr 13.2 million (2011: Skr 14.8 million (2010:million; 2010: Skr 12.4 million; 2009: Skr 12.1 million) is pensionable. Of the remuneration to the President of the Parent Company, Skr 4.3 million (2010:(2011: Skr 4.14.3 million; 2009:2010: Skr 4.24.1 million) is pensionable.
|
| Consolidated Group |
|
| Consolidated Group |
| ||||||||
Average number of employees |
| 2011 |
| 2010 |
| 2009 |
|
| 2012 |
| 2011 |
| 2010 |
|
Women |
| 104 |
| 100 |
| 93 |
|
| 109 |
| 108 |
| 100 |
|
Men |
| 124 |
| 128 |
| 118 |
|
| 122 |
| 126 |
| 128 |
|
Total |
| 228 |
| 228 |
| 211 |
|
| 231 |
| 234 |
| 228 |
|
|
| Consolidated Group |
| ||||
Number of employees at year-end |
| 2011 |
| 2010 |
| 2009 |
|
Women |
| 111 |
| 106 |
| 101 |
|
Men |
| 121 |
| 129 |
| 126 |
|
Total |
| 232 |
| 235 |
| 227 |
|
|
| Consolidated Group |
| ||||
Average number of employees, geographically located |
| 2012 |
| 2011 |
| 2010 |
|
Sweden |
| 230 |
| 233 |
| 227 |
|
Singapore |
| 1 |
| 1 |
| 1 |
|
Total |
| 231 |
| 234 |
| 228 |
|
Women in the Board of Directors and among the Senior Executives, % |
| 2011 |
| 2010 |
| 2009 |
|
Board of Directors |
| 50 |
| 44 |
| 50 |
|
Senior Executives |
| 38 |
| 43 |
| 43 |
|
|
| Consolidated Group |
| ||||
Number of employees at year-end |
| 2012 |
| 2011 |
| 2010 |
|
Women |
| 114 |
| 111 |
| 106 |
|
Men |
| 121 |
| 121 |
| 129 |
|
Total |
| 235 |
| 232 |
| 235 |
|
2012 |
| Fee, |
| Fixed |
| Variable |
| Other |
| Pension fee (3) |
| Total |
|
Chairman of the Board of Directors: |
|
|
|
|
|
|
|
|
|
|
|
|
|
Lars Linder-Aronson |
| -398 |
| — |
| — |
| — |
| — |
| -398 |
|
Other members of the Board of Directors: |
|
|
|
|
|
|
|
|
|
|
|
|
|
Cecilia Ardström |
| -166 |
| — |
| — |
| — |
| — |
| -166 |
|
Jan Belfrage |
| -165 |
| — |
| — |
| — |
| — |
| -165 |
|
Ulla Nilsson |
| -168 |
| — |
| — |
| — |
| — |
| -168 |
|
Jan Roxendal |
| -176 |
| — |
| — |
| — |
| — |
| -176 |
|
Åke Svensson |
| -163 |
| — |
| — |
| — |
| — |
| -163 |
|
Lotta Mellström(4) |
| — |
| — |
| — |
| — |
| — |
| — |
|
Eva Walder(4) |
| — |
| — |
| — |
| — |
| — |
| — |
|
Senior Executives: |
|
|
|
|
|
|
|
|
|
|
|
|
|
Peter Yngwe, President and CEO |
| — |
| -4,203 |
| — |
| -131 |
| -2,506 | (5) | -6,840 |
|
Jane Lundgren-Ericsson, President for AB SEK Securities and deputy COO |
|
|
| -1,911 |
| — |
| -57 |
| -637 |
| -2,605 |
|
Sirpa Rusanen, Executive Director-Human Resources |
| — |
| -1,192 |
| — |
| -113 |
| -423 |
| -1,728 |
|
Per Jedefors, Executive Director-Chief Risk Officer |
| — |
| -2,923 |
| — |
| -53 |
| -905 |
| -3,881 |
|
Per Åkerlind, Executive Director-Chief Operating Officer |
| — |
| -2,940 |
| — |
| -112 |
| -2,079 | (6) | -5,131 |
|
Sven-Olof Söderlund, Executive Director-Strategic Analysis |
| — |
| -2,212 |
| — |
| -97 |
| -720 |
| -3,029 |
|
Susanna Rystedt, Executive Director-Chief Administrative Officer |
| — |
| -1,850 |
| — |
| -91 |
| -599 |
| -2,540 |
|
Johan Winlund, Executive Director-Communications quit February 29, 2012 |
| — |
| -167 |
| — |
| -16 |
| -38 |
| -221 |
|
Total |
| -1,236 |
| -17,398 |
| — |
| -670 |
| -7,907 |
| -27,211 |
|
2011 |
| Fee, |
| Fixed |
| Variable |
| Other |
| Pension |
| Total |
|
| Fee, |
| Fixed |
| Variable |
| Other |
| Pension fee (3) |
| Total |
|
Chairman of the Board of Directors: |
|
|
|
|
|
|
|
|
|
|
|
|
|
|
|
|
|
|
|
|
|
|
|
|
|
|
Lars Linder-Aronson |
| -268 |
|
|
|
|
|
|
|
|
| -268 |
|
| -268 |
| — |
| — |
| — |
| — |
| -268 |
|
Other members of the Board of Directors: |
|
|
|
|
|
|
|
|
|
|
|
|
|
|
|
|
|
|
|
|
|
|
|
|
|
|
Cecilia Ardström |
| -112 |
|
|
|
|
|
|
|
|
| -112 |
|
| -112 |
| — |
| — |
| — |
| — |
| -112 |
|
Jan Belfrage |
| -148 |
| — |
| — |
| — |
| — |
| -148 |
| |||||||||||||
Ulla Nilsson |
| -70 |
| — |
| — |
| — |
| — |
| -70 |
| |||||||||||||
Jan Roxendal |
| -164 |
| — |
| — |
| — |
| — |
| -164 |
| |||||||||||||
Åke Svensson |
| -58 |
|
|
|
|
|
|
|
|
| -58 |
|
| -58 |
| — |
| — |
| — |
| — |
| -58 |
|
Jan Roxendal |
| -164 |
|
|
|
|
|
|
|
|
| -164 |
| |||||||||||||
Ulla Nilsson |
| -70 |
|
|
|
|
|
|
|
|
| -70 |
| |||||||||||||
Jan Belfrage |
| -148 |
|
|
|
|
|
|
|
|
| -148 |
| |||||||||||||
Lotta Mellström(4) |
| — |
| — |
| — |
| — |
| — |
| — |
| |||||||||||||
Eva Walder(4) |
| — |
| — |
| — |
| — |
| — |
| — |
| |||||||||||||
Board members who resigned at the AGM 2011: |
|
|
|
|
|
|
|
|
|
|
|
|
|
|
|
|
|
|
|
|
|
|
|
|
|
|
Ulf Berg, Chairman of the Board of Directors |
| -64 |
|
|
|
|
|
|
|
|
| -64 |
|
| -64 |
| — |
| — |
| — |
| — |
| -64 |
|
Karin Apelman |
| -50 |
|
|
|
|
|
|
|
|
| -50 |
|
| -50 |
| — |
| — |
| — |
| — |
| -50 |
|
Christina Liffner |
| -45 |
|
|
|
|
|
|
|
|
| -45 |
|
| -45 |
| — |
| — |
| — |
| — |
| -45 |
|
Helena Levander |
| -37 |
|
|
|
|
|
|
|
|
| -37 |
|
| -37 |
| — |
| — |
| — |
| — |
| -37 |
|
Risto Silander |
| -39 |
|
|
|
|
|
|
|
|
| -39 |
|
| -39 |
| — |
| — |
| — |
| — |
| -39 |
|
Senior Executives: |
|
|
|
|
|
|
|
|
|
|
|
|
|
|
|
|
|
|
|
|
|
| — |
|
|
|
Peter Yngwe, President and CEO |
|
|
| -4,125 |
| — |
| -137 |
| -2,377 |
| -6,639 |
|
| — |
| -4,125 |
| — |
| -137 |
| -2,377 | (5) | -6,639 |
|
Jane Lundgren-Ericsson, President-AB SEK Securities |
|
|
| -1,788 |
| -293 |
| -49 |
| -508 |
| -2,638 |
| |||||||||||||
Måns Höglund, retired with pension 05-31-11 |
|
|
| -1,276 |
| -2,399 |
| -52 |
| -716 |
| -4,443 |
| |||||||||||||
Per Jedefors, Executive Director-Chief Risk Officer |
|
|
| -959 |
| — |
| -3 |
| -304 |
| -1,266 |
| |||||||||||||
Jane Lundgren-Ericsson, President for AB SEK Securities and deputy COO |
| — |
| -1,788 |
| -293 |
| -49 |
| -508 |
| -2,638 |
| |||||||||||||
Sirpa Rusanen, Executive Director-Human Resources |
|
|
| -1,128 |
| -205 |
| -93 |
| -398 |
| -1,824 |
|
| — |
| -1,128 |
| -205 |
| -93 |
| -398 |
| -1,824 |
|
Susanna Rystedt, Executive Director-Administration |
|
|
| -1,789 |
| — |
| -70 |
| -550 |
| -2,409 |
| |||||||||||||
Sven-Olof Söderlund, Executive Director-Strategic Analysis & Planning |
|
|
| -2,258 |
| -420 |
| -97 |
| -898 |
| -3,673 |
| |||||||||||||
Johan Winlund, Executive Director-Communications |
|
|
| -805 |
| — |
| -36 |
| -222 |
| -1,063 |
|
| — |
| -805 |
| — |
| -36 |
| -222 |
| -1,063 |
|
Per Åkerlind, Executive Director-Capital Markets |
|
|
| -2,890 |
| -2,497 |
| -103 |
| -2,024 |
| -7,514 |
| |||||||||||||
Måns Höglund, retired with pension May 31, 2011 |
| — |
| -1,276 |
| -2,399 |
| -52 |
| -716 |
| -4,443 |
| |||||||||||||
Per Jedefors, employed September 2, 2011, Executive Director-Chief Risk Officer |
| — |
| -959 |
| — |
| -3 |
| -304 |
| -1,266 |
| |||||||||||||
Per Åkerlind, Executive Director-Chief Operating Officer |
| — |
| -2,890 |
| -2,497 |
| -103 |
| -2,024 | (6) | -7,514 |
| |||||||||||||
Sven-Olof Söderlund, Executive Director-Strategic Analysis |
| — |
| -2,258 |
| -420 |
| -97 |
| -898 |
| -3,673 |
| |||||||||||||
Susanna Rystedt, Executive Director-Chief Administrative Officer |
| — |
| -1,789 |
| — |
| -70 |
| -550 |
| -2,409 |
| |||||||||||||
Total |
| -1,055 |
| -17,018 |
| -5,814 |
| -640 |
| -7,997 |
| -32,524 |
|
| -1,055 |
| -17,018 |
| -5,814 |
| -640 |
| -7,997 |
| -32,524 |
|
2010 |
| Fee, |
| Fixed |
| Variable |
| Other |
| Pension fee (3) |
| Total |
|
Chairman of the Board of Directors: |
|
|
|
|
|
|
|
|
|
|
|
|
|
Ulf Berg |
| -185 |
| — |
| — |
| — |
| — |
| -185 |
|
Vice Chairman of the Board of Directors: |
|
|
|
|
|
|
|
|
|
|
|
|
|
Christina Liffner |
| -132 |
| — |
| — |
| — |
| — |
| -132 |
|
Other members of the Board of Directors: |
|
|
|
|
|
|
|
|
|
|
|
|
|
Karin Apelman |
| -160 |
| — |
| — |
| — |
| — |
| -160 |
|
Jan Belfrage |
| -77 |
| — |
| — |
| — |
| — |
| -77 |
|
Helena Levander |
| -114 |
| — |
| — |
| — |
| — |
| -114 |
|
Jan Roxendal |
| -138 |
| — |
| — |
| — |
| — |
| -138 |
|
Risto Silander |
| -118 |
| — |
| — |
| — |
| — |
| -118 |
|
Eva Walder(4) |
| -37 |
| — |
| — |
| — |
| — |
| -37 |
|
Board members who resigned at the AGM 2010: |
|
|
|
|
|
|
|
|
|
|
|
|
|
Bo Netz |
| -35 |
| — |
| — |
| — |
| — |
| -35 |
|
Senior Executives: |
|
|
|
|
|
|
|
|
|
|
|
|
|
Peter Yngwe, President and CEO |
| — |
| -4,047 |
| — |
| -144 |
| -3,398 | (5) | -7,590 |
|
Jane Lundgren-Ericsson, President AB SEK Securities and deputy COO |
| — |
| -1,699 |
| — |
| -55 |
| -340 |
| -2,094 |
|
Sirpa Rusanen, Executive Director-Human Resources |
| — |
| -1,128 |
| — |
| -83 |
| -375 |
| -1,585 |
|
Måns Höglund, Executive Director-Corporate & Structured Finance |
| — |
| -2,862 |
| — |
| -124 |
| -2,212 |
| -5,198 |
|
Per Åkerlind, Executive Director-Chief Operating Officer |
| — |
| -2,717 |
| — |
| -123 |
| -2,154 | (6) | -4,994 |
|
Sven-Olof Söderlund, Executive Director-Strategic Analysis |
| — |
| -1,992 |
| — |
| -101 |
| -836 |
| -2,929 |
|
Susanna Rystedt, Executive Director-Chief Administrative Officer |
| — |
| -1,735 |
| — |
| -68 |
| -498 |
| -2,301 |
|
Total |
| -996 |
| -16,180 |
| — |
| -697 |
| -9,813 |
| -27,687 |
|
(1) See additional information on page F-27.Predetermined salary or other compensation such as holiday pay and allowances.
(2) Other benefits consists of, for example, car allowances and subsistence benefits for the use of a cottage in the mountains.
(3) Includes the effect of reallocation of salary reduction plans,to pension contribution, premiums for insurance covering sickness benefit for prolonged illness, other public risk insurance as a result fromof collective agreements and retroactive effects from 2010 due to renegotiated insurance contracts.agreements.
(4) Since April 29, 2010 remuneration is not paid to a director of the boardrepresentatives on the Board who isare employed by the Government Offices of Sweden.owner, the Swedish Government.
2010 |
| Fee, |
| Fixed |
| Other |
| Pension |
| Total |
|
Chairman of the Board of Directors: |
|
|
|
|
|
|
|
|
|
|
|
Ulf Berg |
| -185 |
|
|
|
|
|
|
| -185 |
|
Vice Chairman of the Board of Directors: |
|
|
|
|
|
|
|
|
|
|
|
Christina Liffner |
| -132 |
|
|
|
|
|
|
| -132 |
|
Other members of the Board of Directors: |
|
|
|
|
|
|
|
|
|
|
|
Karin Apelman |
| -160 |
|
|
|
|
|
|
| -160 |
|
Jan Belfrage |
| -77 |
|
|
|
|
|
|
| -77 |
|
Helena Levander |
| -114 |
|
|
|
|
|
|
| -114 |
|
Jan Roxendal |
| -138 |
|
|
|
|
|
|
| -138 |
|
Risto Silander |
| -118 |
|
|
|
|
|
|
| -118 |
|
Eva Walder |
| -37 |
|
|
|
|
|
|
| -37 |
|
Board members who resigned at the AGM 2010: |
|
|
|
|
|
|
|
|
|
|
|
Bo Netz |
| -35 |
|
|
|
|
|
|
| -35 |
|
Senior Executives: |
|
|
|
|
|
|
|
|
|
|
|
Peter Yngwe, President and CEO |
|
|
| -4,047 |
| -144 |
| -3,398 |
| -7,590 |
|
Jane Lundgren Ericsson, President-AB SEK Securities |
|
|
| -1,699 |
| -55 |
| -340 |
| -2,094 |
|
Sirpa Rusanen, Executive Director-Human Resources |
|
|
| -1,128 |
| -83 |
| -375 |
| -1,585 |
|
Måns Höglund, Executive Director-Corporate & Structured Finance |
|
|
| -2,862 |
| -124 |
| -2,212 |
| -5,198 |
|
Per Åkerlind, Executive Director-Capital Markets |
|
|
| -2,717 |
| -123 |
| -2,154 |
| -4,994 |
|
Sven-Olof Söderlund, Executive Director-Strategic Analysis & Planning |
|
|
| -1,992 |
| -101 |
| -836 |
| -2,929 |
|
Susanna Rystedt, Executive Director-Administration |
|
|
| -1,735 |
| -68 |
| -498 |
| -2,301 |
|
Total |
| -996 |
| -16,180 |
| -697 |
| -9,813 |
| -27,687 |
|
(1) Includes the effect of salary reduction plans, premiums for insurance covering sickness benefit for prolonged illness, other public risk insurance as a result from collective agreements.
2009 |
| Fee, |
| Fixed |
| Other |
| Pension |
| Total |
|
Chairman of the Board of Directors: |
|
|
|
|
|
|
|
|
|
|
|
Ulf Berg |
| -165 |
|
|
|
|
|
|
| -165 |
|
Vice Chairman of the Board of Directors: |
|
|
|
|
|
|
|
|
|
|
|
Christina Liffner |
| -135 |
|
|
|
|
|
|
| -135 |
|
Other members of the Board of Directors: |
|
|
|
|
|
|
|
|
|
|
|
Karin Apelman |
| -131 |
|
|
|
|
|
|
| -131 |
|
Pirkko Juntti |
| -36 |
|
|
|
|
|
|
| -36 |
|
Helena Levander |
| -114 |
|
|
|
|
|
|
| -114 |
|
Bo Netz |
| -108 |
|
|
|
|
|
|
| -108 |
|
Harald Sandberg |
| -39 |
|
|
|
|
|
|
| -39 |
|
Risto Silander |
| -118 |
|
|
|
|
|
|
| -118 |
|
Jan Roxendal |
| -138 |
|
|
|
|
|
|
| -138 |
|
Eva Walder |
| -75 |
|
|
|
|
|
|
| -75 |
|
Senior Executives: |
|
|
|
|
|
|
|
|
|
|
|
Peter Yngwe, President and CEO |
|
|
| -4,018 |
| -133 |
| -2,718 |
| -6,868 |
|
Jane Lundgren Ericsson, President-AB SEK Securities |
|
|
| -1,597 |
| -37 |
| -340 |
| -1,974 |
|
Sirpa Rusanen, Executive Director-Human Resources |
|
|
| -1,133 |
| -80 |
| -319 |
| -1,532 |
|
Måns Höglund, Executive Director-Corporate & Structured Finance |
|
|
| -2,862 |
| -130 |
| -2,143 |
| -5,134 |
|
Per Åkerlind, Executive Director-Capital Markets |
|
|
| -2,674 |
| -113 |
| -1,221 |
| -4,007 |
|
Sven-Olof Söderlund, Executive Director-Strategic Analysis & Planning |
|
|
| -1,957 |
| -95 |
| -864 |
| -2,917 |
|
Susanna Rystedt, Executive Director-Administration |
|
|
| -1,386 |
| -53 |
| -387 |
| -1,826 |
|
Total |
| -1,059 |
| -15,627 |
| -640 |
| -7,992 |
| -25,318 |
|
Comprehensive information on the company’s remuneration policy in accordance with the Swedish Financial Supervisory Authority’s Regulations and General Guideline’s governing remuneration policies in credit institutions, investment firms and fund management companies (Chapter 5. FFFS 2009:6), is disclosed in connection with the publication of annual accounts on March 16th, 2012 in the Pillar 3 report. SEK’s disclosure provides information about the principles applied for remuneration earned in 2011. The disclosure also describes the design of the remuneration policy, as adopted by the company.
Pension provisions for executive directors in SEK should not amount to more than 30 percent of pensionable salary for retirement and survivor’s pension. The contribution for retirement and survivor’s pension can exceed 30 percent on account of SEK putting into practice a defined benefit pension plan resulting from an agreement between the Banking Institutions Employers’ Organization (BAO) and the Finance Association, covering employees in the banking and finance industries. The retirement for all senior executives is 65 years. Contracts for the President and other senior executives are following the Senior Executives to the Governmental Guidelines (April 20, 2009) where the BTP plan is included as an approved collective agreed defined pension plan.
(5)The retirement age of the President, Peter Yngwe, is 65 years and the pension fee is 30 percent of his fixed salary. Pension fees for the full year 2011,2012 exceeding 30 percent pertain to additional pension contributions negotiated in 2010 underregarding the prior benefit plan. These contributions amount to Skr 3.0 million of which Skr 1.0 million was disbursed in 2010, Skr 1.0 million was disbursed in 2011 and Skr 1.0 million will bewas disbursed in 2012. The additional pension contributions are conditionalwere conditioned on Peter Yngwe remaining employed by SEK, and willwould not behave been disbursed in case of resignation prior to the dates of each payment. Payments for the additional pension contributions are now completed.
(6) Pension fees for Per Åkerlind for the full year 2011,2012 exceeding 30 percent of his fixed salary pertain to additional pension contributions negotiated in 2010 underregarding the prior benefit plan. These contributions amount to Skr 3.0 million of which Skr 1.0 million was disbursed in 2010, Skr 1.0 million was disbursed in 2011 and Skr 1.0 million will bewas disbursed in 2012. The additional pension contributions are conditionalwere conditioned on Per Åkerlind remaining employed by SEK, and willwould not behave been disbursed in case of resignation prior to the dates of each payment. Payments for the additional pension contributions are now completed.
Comprehensive information on the company’s remuneration policy in accordance with the Swedish Financial Supervisory Authority’s Regulations and General Guidelines governing remuneration policies in credit institutions, investment firms and fund management companies licensed to conduct discretionary portfolio management (FFFS 2011:1), is disclosed in connection with the publication of annual accounts on February 22, 2013 in the Pillar 3 report. SEK’s disclosure provides information about the principles applied for remuneration earned in 2012. The disclosure also describes the design of the remuneration policy, as adopted by the company.
Retirement age is 65 for all senior executives. Retirement benefits, termination conditions and other terms of employment for the CEO and other senior executives follow current guidelines for senior executives in state-owned enterprises (Guidelines for the employment of senior executives 2009-04-20) where the BTP plan (as described below) is included as an approved public agreed defined benefit pension plan. Pension provisions for senior executives in SEK shall be limited to
30 percent of pensionable salary for retirement and survivor benefits. The contribution for retirement and survivor’s pension can exceed 30 percent on account of SEK’s implementation of a defined benefit pension plan resulting from an agreement between the Banking Institutions Employers’ Organization (BAO) and the Finance Association, covering employees in the banking and finance industries.
For all the senior executives at SEK, including the President Peter Yngwe, the company pays premiums for insurance for sickness benefits for prolonged illness, other public risk insurance arising out of collective agreements, travel insurance and health insurance. Other benefits consist of for example car allowances, subsistence benefit and benefits for the use of a cottage in the mountains.
Peter Yngwe, Per Åkerlind and Sven-Olof Söderlund have the right of 6 months’ notice period uponprior to termination initiated by SEK and are, in addition, entitled to severance pay corresponding to 18 monthly salaries. Deduction is made for income obtained from new employment. TheFor all other senior executives, the notice period upon termination initiated by SEK follows collective agreements. Upon resignation initiated by the employee, the notice period is 3 or 6 months.
At the beginning of 2011 there was an employment contract that deviated from the General Guidelines, related to a senior executive who retired during the first half of 2011. This agreement was drawn up before the current guidelines was established and included the retirement age of 60 years and had individually designed occupational pension schemes. This agreement included a benefit-based insurance where a pension was paid in salary between 30 and 70 base amounts. The pension obligation was covered by regular premium payments and was converted to a defined-contribution agreement in connection with the retirement in 2011. SEK has no further pension obligations to the former employee in concern.
In 2009 the Board of Directors made a decision not to pay the variable remuneration of 2008 to five senior executives. The Board of Directors revised this decision in 2011 after further assessment because the employment contracts of these five leading executives entitled them to the earned variable remuneration from 2008. Consequently, SEK disbursed, and recognized, this remuneration this year to Jane Lundgren Ericsson (Skr 293 thousand), Sirpa Rusanen (Skr 205 thousand), Måns Höglund (Skr 2,399 thousand), Per Åkerlind (Skr 2,497 thousand) and Sven-Olof Söderlund (Skr 420 thousand). Because of this non-pensionable one-time payment their total remuneration increased this year compared to 2010.
The Consolidated Group
SEK’s
The employees at SEK have a collectively bargained pension through the BTP plan, which is the most significant pension plan for salaried bank employees in Sweden. The BTP plan is funded by means of insurance with the insurance company SPP.
The total pension cost for defined benefit and defined contribution obligations are shown below
Skr mn |
| 2011 |
| 2010 |
| 2009 |
|
| 2012 |
| 2011 |
| 2010 |
|
Service cost |
| -6.5 |
| -7.3 |
| -20.6 |
|
| -7.4 |
| -6.5 |
| -7.3 |
|
Prior service cost |
| 0.0 |
| -5.8 |
| 0 |
| |||||||
Prior Service cost |
| 0.0 |
| 0.0 |
| -5.8 |
| |||||||
Interest cost |
| -6.6 |
| -7.1 |
| -7.2 |
|
| -4.9 |
| -6.6 |
| -7.1 |
|
Expected return on plan assets |
| 3.3 |
| 5.0 |
| 5.2 |
|
| 4.0 |
| 3.3 |
| 5.0 |
|
Amortization of actuarial gains and losses |
| 5.1 |
| -4.5 |
| -1.1 |
|
| 0.5 |
| 5.1 |
| -4.5 |
|
Settlement |
| 0.0 |
| -3.0 |
| 0 |
|
| 0.0 |
| 0.0 |
| -3.0 |
|
Net defined benefit pension cost |
| -4.7 |
| -22.7 |
| -23.7 |
|
| -7.8 |
| -4.7 |
| -22.7 |
|
Special employer’s contribution for defined benefit pension commitments |
| -1.1 |
| -5.5 |
| -5.7 |
| |||||||
Net defined contribution pension cost, including special employer’s contribution |
| -43.3 |
| -38.8 |
| -38.2 |
| |||||||
Special payroll tax for defined benefit pension commitments |
| -1.9 |
| -1.1 |
| -5.5 |
| |||||||
Net defined contribution pension cost, including special payroll tax |
| -46.1 |
| -43.3 |
| -38.8 |
| |||||||
Net pension cost |
| -49.1 |
| -67.0 |
| -67.6 |
|
| -55.8 |
| -49.1 |
| -67.0 |
|
The following table specifies the net value of defined benefit pension obligations
Skr mn |
| 2012 |
| 2011 |
| 2010 |
|
Defined benefit obligations |
| 259.5 |
| 251.8 |
| 211.7 |
|
Plan assets |
| -178.3 |
| -164.3 |
| -171.3 |
|
Net value |
| 81.2 |
| 87.5 |
| 40.4 |
|
Unrecognised actuarial losses, net |
| -36.7 |
| -40.5 |
| 9.8 |
|
Provision for pensions, net obligation (see Note 21) |
| 44.5 |
| 47.0 |
| 50.2 |
|
The following table shows the development of defined benefit obligations
Skr mn |
| 2012 |
| 2011 |
| 2010 |
|
Defined benefit obligation, opening balance |
| 251.8 |
| 211.7 |
| 210.7 |
|
Prior service cost |
| 0.0 |
| 0.0 |
| 5.8 |
|
Service cost |
| 7.4 |
| 6.5 |
| 7.3 |
|
Interest cost |
| 4.9 |
| 6.6 |
| 7.1 |
|
Benefits paid |
| -7.5 |
| -7.4 |
| -6.9 |
|
Settlement |
| 0.0 |
| -12.4 |
| -21.2 |
|
Actuarial (gains and) losses, experience effects |
| 3.0 |
| -6.4 |
| 6.7 |
|
Actuarial (gains and) losses, due to changed assumptions |
| -0.1 |
| 53.2 |
| 2.2 |
|
Defined benefit obligation, closing balance |
| 259.5 |
| 251.8 |
| 211.7 |
|
The following table specifies the net value of defined benefit pension obligations
Skr mn |
| 2011 |
| 2010 |
| 2009 |
|
Defined benefit obligations |
| 251.8 |
| 211.7 |
| 210.7 |
|
Plan assets |
| -164.3 |
| -171.3 |
| -176.3 |
|
Net value |
| 87.5 |
| 40.4 |
| 34.4 |
|
Unrecognised actuarial gains (and losses), net |
| -40.5 |
| 9.8 |
| 3.1 |
|
Provision for pensions, net obligation (see Note 21) |
| 47.0 |
| 50.2 |
| 37.5 |
|
The following table shows the development of defined benefit obligations
Skr mn |
| 2011 |
| 2010 |
| 2009 |
|
Defined benefit obligation, opening balance |
| 211.7 |
| 210.7 |
| 214.0 |
|
Prior service cost |
| 0.0 |
| 5.8 |
| — |
|
Service cost |
| 6.5 |
| 7.3 |
| 8.6 |
|
Interest cost |
| 6.6 |
| 7.1 |
| 7.2 |
|
Benefits paid |
| -7.4 |
| -6.9 |
| -6.1 |
|
Settlement |
| -12.4 |
| -21.2 |
| — |
|
Actuarial (gains and) losses |
| 46.8 |
| 8.9 |
| -13.0 |
|
Defined benefit obligation, closing balance |
| 251.8 |
| 211.7 |
| 210.7 |
|
The following table shows the development of plan assets
Skr mn |
| 2011 |
| 2010 |
| 2009 |
|
| 2012 |
| 2011 |
| 2010 |
|
Fair value of plan assets, opening balance |
| 171.3 |
| 176.3 |
| 164.7 |
|
| 164.3 |
| 171.3 |
| 176.3 |
|
Expected return on plan assets |
| 3.3 |
| 5.0 |
| 5.2 |
|
| 4.0 |
| 3.3 |
| 5.0 |
|
Contributions by the employer |
| 7.5 |
| 8.6 |
| 8.6 |
|
| 9.0 |
| 7.5 |
| 8.6 |
|
Benefits paid |
| -6.0 |
| -5.5 |
| -4.8 |
|
| -6.2 |
| -6.0 |
| -5.5 |
|
Settlement |
| -13.4 |
| -21.0 |
| 0.0 |
|
| 0.0 |
| -13.4 |
| -21.0 |
|
Actuarial gains (and losses) |
| 1.6 |
| 7.9 |
| 2.6 |
| |||||||
Actuarial gains |
| 7.2 |
| 1.6 |
| 7.9 |
| |||||||
Fair value of plan assets, closing balance |
| 164.3 |
| 171.3 |
| 176.3 |
|
| 178.3 |
| 164.3 |
| 171.3 |
|
The following table shows principal actuarial assumptions used end of year
% |
| 2011 |
| 2010 |
| 2009 |
|
| 2012 |
| 2011 |
| 2010 |
|
Discount rate |
| 2.0 |
| 3.3-3.8 |
| 3,5-3,8 |
|
| 2.1 |
| 2.0 |
| 3.3-3.8 |
|
Expected return on plan assets |
| 2.4 |
| 2.0-5.0 |
| 5.0 |
|
| n.a. | (1) | 2.4 |
| 2.0-5.0 |
|
Expected salary increase |
| 3.5 |
| 3.4-3.5 |
| 3.5 |
|
| 3.5 |
| 3.5 |
| 3.4-3.5 |
|
Expected inflation |
| 1.5 |
| 2.0 |
| 2.0 |
|
| 1.6 |
| 1.5 |
| 2.0 |
|
Expected turnover |
| 4.0 |
| 2.0 |
| 2.0 |
|
| 4.0 |
| 4.0 |
| 2.0 |
|
(1) Not applicable due to changes in regulations.
Reconciliation of pension liabilities
Skr mn |
| 2011 |
| 2010 |
| 2009 |
|
| 2012 |
| 2011 |
| 2010 |
|
Pension liabilities, opening balance |
| 50.2 |
| 37.5 |
| 23.7 |
|
| 47.0 |
| 50.2 |
| 37.5 |
|
Relates to costs when the BTP plan was accounted for as a defined benefit pension plan |
|
|
|
|
| 12.0 |
| |||||||
Net periodic pension cost |
| 4.7 |
| 22.7 |
| 11.7 |
|
| 7.8 |
| 4.7 |
| 22.7 |
|
Net contribution, plan assets |
| -7.5 |
| -8.6 |
| -8.6 |
|
| -9.0 |
| -7.5 |
| -8.6 |
|
Net pension payments |
| -1.4 |
| -1.4 |
| -1.3 |
|
| -1.3 |
| -1.4 |
| -1.4 |
|
Reductions and adjustments |
| 1.0 |
| 0.0 |
| 0.0 |
|
| 0.0 |
| 1.0 |
| 0.0 |
|
Pension liabilities, closing balance |
| 47.0 |
| 50.2 |
| 37.5 |
|
| 44.5 |
| 47.0 |
| 50.2 |
|
Pension expense in 20112012 for defined benefit pensions amounts to Skr -4.77.8 million (2010:(2011: Skr -22.74.7 million; 2009:2010: Skr -23.722.7 million). The difference in pension cost relates primarily to extra costs associated with the regulation of two defined benefit pension promises to managers and the cost of earnings during the previous period relates BTP pension for all employees in 2010. In 2011,2012, there is also an actuarial gain of Skr 0.5 million (2011: gain of Skr 5.1 million (2010:million; 2010: loss of Skr -4.5million; 2009: Skr -1.14.5 million).The. The actuarial gain arises whenbecause there are no longer any active employees in athe defined benefit pension plan.
Discount rate
The discount rate is based on the market expectations at the end of the accounting period for government bonds with the same duration as the pension liability. The valuation has been based on an interest curve estimated after Swedish
government bonds.
Expected return on plan assets
Expected return on plan assets is based on SEK’s assessment of expected return on plan assets.
Expected salary increase
Assumption of salary increase is based on SEK’s assessment.
Expected inflation
The assumption of expected inflation levels with Swedish bonds at the real interestinflated adjusted rate.
Expected employee turnover
The assumption reflects the expected level of employees leaving service each year.
Note 6. Other expenses
|
| Consolidated Group |
|
| Consolidated Group |
| ||||||||
Skr mn |
| 2011 |
| 2010 |
| 2009 |
|
| 2012 |
| 2011 |
| 2010 |
|
Travel expenses and marketing |
| -20.5 |
| -18.1 |
| -17.1 |
|
| -20.9 |
| -20.5 |
| -18.1 |
|
IT and information system |
| -65.3 |
| -57.9 |
| -54.2 |
|
| -91.9 | (1) | -65.3 |
| -57.9 |
|
Fees |
| -75.5 |
| -86.8 |
| -62.5 |
|
| -76.9 |
| -75.5 |
| -86.8 |
|
Real estate and premises expenses |
| -30.3 |
| -15.9 |
| -12.2 |
|
| -31.3 |
| -30.3 |
| -15.9 |
|
Other |
| -11.5 |
| -13.2 |
| -13.0 |
|
| -11.8 |
| -11.5 |
| -13.2 |
|
Total other expenses |
| -203.1 |
| -191.9 |
| -159.0 |
|
| -232.8 |
| -203.1 |
| -191.9 |
|
(1) The increase is mainly due to an increase in expenses for IT development related to mandatory regulations.
(2) SEK is a partner in rental agreements of office space in Stockholm and Singapore. As of December 1, 2010 SEK rents office space in Waterfront Building, Stockholm, Sweden
Cost of operating leases
|
| Consolidated Group |
|
| Consolidated Group |
| ||||||||
Skr mn |
| 2011 |
| 2010 |
| 2009 |
|
| 2012 |
| 2011 |
| 2010 |
|
Leases |
| -27.9 |
| -9.8 |
| -5.6 |
|
| -29.9 |
| -27.9 |
| -9.8 |
|
The major part relates to office premisespremises.
Future minimum rentals payable under non-cancellable operating leases are as follows
|
| Consolidated Group |
|
| Consolidated Group |
| ||||||||
Skr mn |
| December 31, |
| December 31, |
| December 31, |
|
| December 31, |
| December 31, |
| December 31, |
|
Within 1 year |
| -30.0 |
| -28.7 |
| -8.1 |
|
| -25.8 |
| -30.0 |
| -28.7 |
|
Between 1 and 5 years |
| -105.7 |
| -135.1 |
| -11.3 |
|
| -72.9 |
| -105.7 |
| -135.1 |
|
More than 5 years |
| — |
| — |
| — |
|
| — |
| — |
| — |
|
Total future minimum rentals payable under non-cancellable operating leases |
| -135.7 |
| -163.8 |
| -19.4 |
|
| -98.7 |
| -135.7 |
| -163.8 |
|
Remuneration to auditors and related audit companies
|
| Consolidated Group |
| ||||
Skr mn |
| 2011 |
| 2010 |
| 2009 |
|
Ernst & Young: |
|
|
|
|
|
|
|
Audit fee |
| -13.4 | (1) | -13.5 |
| -16.4 |
|
Audit related fee |
| -0.7 |
| -0.5 |
| -0.2 |
|
Tax related fee |
| -0.2 |
| -0.2 |
| -0.3 |
|
Other fees |
| -0.1 |
| -1.2 |
| -5.8 |
|
The Swedish National Audit Office: |
|
|
|
|
|
|
|
Audit fee |
| -0.8 |
| -0.2 |
|
|
|
Total |
| -15.2 |
| -15.6 |
| -22.7 |
|
|
| Consolidated Group |
| ||||
Skr mn |
| 2012 |
| 2011 |
| 2010 |
|
Ernst & Young: |
|
|
|
|
|
|
|
Audit fee |
| -14.0 |
| -13.4 | (1) | -13.5 |
|
Audit related fee |
| -0.9 |
| -0.7 |
| -0.5 |
|
Tax related fee |
| -0.2 |
| -0.2 |
| -0.2 |
|
Other fees |
| — |
| -0.1 |
| -1.2 |
|
|
|
|
|
|
|
|
|
The Swedish National Audit Office: |
|
|
|
|
|
|
|
Audit fee |
| — |
| -0.8 |
| -0.2 |
|
Total |
| -15.1 |
| -15.2 |
| -15.6 |
|
(1) of which 1.5 million refer to year 2010
Audit fee also includes auditing of reporting to authorities and issued prospectuses. Remuneration to auditors may for accounting reasons be included in other items than “Other expenses”. Other fees consist primarily
Note 77. Tangible and intangible assets
|
| Consolidated Group |
|
| Consolidated Group |
| ||||
|
| December 31, |
| December 31, |
|
| December |
| December |
|
Skr mn |
| 2011 |
| 2010 |
|
|
|
|
|
|
Buildings |
|
|
|
|
|
|
|
|
|
|
Acquisition cost at the befinning of the year |
| 142.8 |
| 142.8 |
|
| 0.7 |
| 142.8 |
|
Sales or disposals of the year |
| -142.1 | (1) | 0.0 |
|
| 0.0 |
| -142.1 | (1) |
Accumulated depreciations at the beginning of the year |
| -41.4 |
| -39.1 |
|
| -0.4 |
| -41.4 |
|
Depreciations of the year |
| -0.5 |
| -2.3 |
|
| 0.0 |
| -0.5 |
|
Reversed depreciations due to sale or disposal |
| 41.5 |
| 0.0 |
|
| 0.0 |
| 41.5 |
|
Book value (2) |
| 0.3 |
| 101.4 | (2) | |||||
Book value |
| 0.3 |
| 0.3 |
| |||||
|
|
|
|
|
|
|
|
|
|
|
Land |
|
|
|
|
|
|
|
|
|
|
Acquisition cost |
| 0.1 |
| 0.1 |
|
| 0.1 |
| 0.1 |
|
Book value (2) |
| 0.1 |
| 0.1 | (2) | |||||
Book value |
| 0.1 |
| 0.1 |
| |||||
|
|
|
|
|
|
|
|
|
|
|
Office and building equipment |
|
|
|
|
|
|
|
|
|
|
Acquisition cost at the beginning of the year |
| 90.2 |
| 64.6 |
|
| 64.4 |
| 90.2 |
|
Acquisitions of the year |
| 16.2 |
| 30.4 |
|
| 7.2 |
| 16.2 |
|
Sales or disposals of the year |
| -42.0 |
| -4.8 |
|
| -2.4 |
| -42.0 |
|
Accumulated depreciations at the beginning of the year |
| -49.7 |
| -48.4 |
|
| -24.0 |
| -49.7 |
|
Reversed depreciations due to sale or disposals |
| 35.1 |
| 3.9 |
|
| 1.9 |
| 35.1 |
|
Depreciations during the year |
| -9.4 |
| -5.2 |
|
| -11.5 |
| -9.4 |
|
Currency differences |
| -0.1 |
| 0.2 |
|
| -0.1 |
| -0.1 |
|
Book value |
| 40.3 |
| 40.7 |
|
| 35.5 |
| 40.3 |
|
|
|
|
|
|
|
|
|
|
|
|
Intangible assets |
|
|
|
|
|
|
|
|
|
|
Acquisition cost at beginning of the year |
| 130.2 |
| 118.0 |
|
| 205.3 |
| 130.2 |
|
Acquisitions of the year |
| 75.1 |
| 12.2 |
|
| 34.7 |
| 75.1 |
|
Accumulated depreciations at the beginning of the year |
| -113.1 |
| -107.3 |
|
| -117.6 |
| -113.1 |
|
Depreciations of the year |
| -4.5 |
| -5.8 |
|
| -8.0 |
| -4.5 |
|
Book value |
| 87.7 |
| 17.1 |
|
| 114.4 |
| 87.7 |
|
|
|
|
|
|
|
|
|
|
|
|
Net book value |
|
|
|
|
|
|
|
|
|
|
Property, land and equipment |
| 40.7 |
| 142.2 |
|
| 35.9 |
| 40.7 |
|
Intangible assets |
| 87.7 |
| 17.1 |
|
| 114.4 |
| 87.7 |
|
Total net book value |
| 128.4 |
| 159.3 |
|
| 150.3 |
| 128.4 |
|
|
|
|
|
|
|
|
|
|
|
|
Depreciations during the year according to Consolidated Statement of Comprehensive Income |
| -14.5 |
| -13.1 |
| |||||
Depreciations during the year according to the Consolidated Statement of Comprehensive Income |
| -19.5 |
| -14.5 |
| |||||
(1) The subsidiary AB SEKTIONEN, owner of SEK’s former office building was sold during the second quarter 2011 and generated a positive result of Skr 105.1 million which is reported as other operating income in the consolidated statement of comprehensive income.
(2) Buildings and Land in the Consolidated Group with a net book value of Skr 101.1 million for December 31, 2010 represent assets held-for-sale.
Intangible assets consist mainly of the capitalized portion of investments in IT systems.
The average useful life for the building is 70 years, and for other property and equipment 5 years.
The average useful life for intangible assets is 5 years.
Note 8. Leasing
Financial leases — lessors
All SEK’s leasing transactions are classified as financial leases. When making such classification all aspects regarding the leasing contract, including third party guarantees, are taken into account.
A reconciliation between the gross investment in the leases and the present value of minimum lease payments receivable at the end of the reporting period can be found below. Future lease payments receivable will mature in the following periods.
|
| Consolidated Group |
|
| Consolidated Group |
| ||||||||||||
|
| December 31, 2011 |
| December 31, 2010 |
|
| December 31, 2012 |
| December 31, 2011 |
| ||||||||
Skr mn |
| Gross |
| Present value |
| Gross |
| Present value |
|
| Gross |
| Present |
| Gross |
| Present |
|
Not later than one year |
| 692.2 |
| 666.8 |
| 86.5 |
| 56.1 |
| |||||||||
Later than one year and not later than five years |
| 300.5 |
| 245.0 |
| 823.8 |
| 779.4 |
| |||||||||
No later than one year |
| 672.9 |
| 652.2 |
| 692.2 |
| 666.8 |
| |||||||||
Later than one year and no later than five years |
| 246.4 |
| 207.4 |
| 300.5 |
| 245.0 |
| |||||||||
Later than five years |
| 102.5 |
| 93.4 |
| 75.7 |
| 71.2 |
|
| 71.5 |
| 67.0 |
| 102.5 |
| 93.4 |
|
Total |
| 1,095.2 |
| 1,005.2 |
| 986.0 |
| 906.7 |
|
| 990.8 |
| 926.6 |
| 1,095.2 |
| 1,005.2 |
|
|
|
|
|
|
|
|
|
|
|
|
|
|
|
|
|
|
|
|
Unearned finance income |
| 0.0 |
| 90.0 |
| 0.0 |
| 79.3 |
|
| — |
| 64.2 |
| — |
| 90.0 |
|
Unguaranteed residual value |
| 0.0 |
| 0.0 |
| 0.0 |
| 0.0 |
|
| — |
| — |
| — |
| — |
|
Total |
| 1,095.2 |
| 1,095.2 |
| 986.0 |
| 986.0 |
|
| 990.8 |
| 990.8 |
| 1,095.2 |
| 1,095.2 |
|
All lease agreements are classified as Loans and receivables. The leases are included in the line item “Loans to the public” in the statement of financial position.
Note 9. Impairment and past-due receivables
|
| Consolidated Group |
|
| Consolidated Group |
| ||||||||
Skr mn |
| 2011 |
| 2010 |
| 2009 |
|
| 2012 |
| 2011 |
| 2010 |
|
Net credit losses (1),(2) |
| -125.1 |
| -119.7 |
| -436.0 |
| |||||||
Reversal of previous write-downs (2),(3) |
| 10.0 |
| 126.9 |
| 153.0 |
| |||||||
Credit losses (1), (2) |
| -71.7 |
| -125.1 |
| -119.7 |
| |||||||
Reversal of previous write-downs (1),(2),(3) |
| 34.6 |
| 10.0 |
| 126.9 |
| |||||||
Net impairment and reversals |
| -115.1 |
| 7.2 |
| -283.0 |
|
| -37.1 |
| -115.1 |
| 7.2 |
|
Recovered credit losses |
| 4.2 |
| 1.0 |
| 36.7 |
|
| 13.7 |
| 4.2 |
| 1.0 |
|
Net credit losses |
| -110.9 |
| 8.2 |
| -246.3 |
|
| -23.4 |
| -110.9 |
| 8.2 |
|
of which related to loans (4) |
| 12.9 |
| 92.8 |
| 56.7 |
| |||||||
of which related to liquidity placements (4) |
| -123.8 |
| -84.6 |
| -303.0 |
| |||||||
of which related to loans(4) |
| -48.7 |
| -78.4 |
| 92.8 |
| |||||||
of which related to liquidity placements(4) |
| 25.3 |
| -32.5 |
| -84.6 |
| |||||||
|
|
|
|
|
|
|
|
|
|
|
|
|
|
|
Changes in reserves of financial assets |
|
|
|
|
|
|
|
|
|
|
|
|
|
|
Balance brought forward |
| -561.1 |
| -939.9 |
| -1,028.5 |
|
| -683.7 |
| -568.6 |
| -939.9 |
|
Impaired financial assets sold |
| — |
| 371.6 |
| 371.6 |
|
| — |
| — |
| 364.1 |
|
Net impairments and reversals |
| -115.1 |
| 7.2 |
| -283.0 |
|
| -37.1 |
| -115.1 |
| 7.2 |
|
Balance carried forward |
| -676.2 |
| -561.1 |
| -939.9 |
|
| -720.8 |
| -683.7 |
| -568.6 |
|
of which related to loans (4) |
| -33.5 |
| -41.6 |
| -472.4 |
| |||||||
of which related to loans(4) |
| -235.1 |
| -172.7 |
| -49.1 |
| |||||||
of which related to liquidity placements (4) |
| -642.7 |
| -519.5 |
| -467.5 |
|
| -485.7 |
| -511.0 |
| -519.5 |
|
(1) SEK has two assets in the form of CDOs. These two CDOs are first-priority-tranches with end-exposure to the U.S. sub-prime market. AnA reversal of Skr 31.5 million was recorded in 2012 in relation to these two CDOs (2011: impairment of Skr 16.0 million was recorded in 2011 in relation to the two CDOs (2010:million; 2010: impairment of Skr 119.4 million; 2009: Skr 217.9 million), bringing the total of such impairment to Skr 462.6 million (2011: Skr 491.4 million (year-endmillion; 2010: Skr 475.4 million; year-end 2009: Skr 352.9 million). The assets have a gross book value gross before impairment of Skr 641.4594.4 million (year-end 2010:2011: Skr 638.4 million; year-end 2009: Skr 683.5641.4 million).
(2) The amount for 20112012 includes a provision of Skr 110.040.0 million (2010: dissolution of Skr 35.0 million; 2009:(year-end 2011: provision of Skr 80.0110.0 million) related to bad debts not linked to a specific counterparty. This means that the provision for bad debt not linked to a specific counterparty amounted to Skr 160.0200.0 million (year-end 2010:2011: Skr 50.0 million; year-end 2009: Skr 85.0160.0 million). The provision for bad debts not linked to a specific counterparty relates to deterioration in credit quality related to assets not individually reserved for. The increase in the reserve resulted from the higher inherent credit risk in SEK’s portfolio as a whole due to uncertainties in the European financial markets and related adverse economic conditions. The reserve was increased due to the risk of losses that are currently unknown to SEK. SEK has made an assessment of the reserve according to a methodology based on both quantitative and qualitative analysis of all exposures accounted for at amortized cost.
(3) During 2010Of which Skr 28.0 million (2011: Skr — million; 2010: Skr - million) refers to unrealized currency effects during the exposure to Glitnir Bank was settled, which resulted in a Skr 87.4 million reversal of previous write-downs in connection to the disposal of the asset.period January-December 2012.
(4) See Note 11 for definitions.
Past-due receivables
Receivables past due have been recorded to reflect the amounts expected to actually be received at settlement.
Past-due and doubtful receivables at year-end: |
| Consolidated Group |
| |||||||||||
| Consolidated Group |
| ||||||||||||
Skr mn |
| 2011 |
| 2010 |
| 2009 |
|
| 2012 |
| 2011 |
| 2010 |
|
Past-due receivables: |
|
|
|
|
|
|
|
|
|
|
|
|
|
|
Aggregate amount less than 90 days past-due |
| 154,2 | (1) | 154,6 | (1) | — |
|
| 155.4 | (1) | 154.2 | (1) | 154.6 | (1) |
Aggregate amount of principal and interest more than 90 days past-due [on such receivables] |
| 891,8 | (1),(2) | 273,2 | (1),(2) | — |
| |||||||
Principal amount not past-due on such receivables |
| 2,079.4 | (1) | 2, 682.9 | (1) | — |
| |||||||
Aggregate amount of principal and interest more than 90 days past-due |
| 1,418.7 | (1),(2) | 891.8 | (1),(2) | 273.2 | (1),(2) | |||||||
Principle amount not past-due on such receivables |
| 1,552.4 | (1) | 2 079.4 | (1) | 2 682.9 | (1) | |||||||
(1) Past-due receivables consist primarily of amortization related to one loan in respect of which discussion of restructuring has been initiated but not concluded. For this loan interest has been paid in full and is therefore not past-due. The credit is fully covered by adequate guarantees and therefore no loan loss reservation has been made. SEK has no other restructured receivables.
(2) Of the aggregate amount of principal and interest past due Skr 144.5 million (2011: Skr 153.5 million (year-endmillion; 2010: Skr 273.2 million; year-end 2009: Skr 0.0 million) was due for payment more than three but less than six months before the balance-sheet date, and Skr 144.5 million (2011: Skr 153.5 million (year-endmillion; 2010: Skr - million; year-end 2009: Skr 0.0 million) was due for payment more than six but less than nine months before the balance-sheet date.
Note 1010. Taxes
|
| Consolidated Group |
|
| Consolidated Group |
| ||||||||
Skr mn |
| 2011 |
| 2010 |
| 2009 |
|
| 2012 |
| 2011 |
| 2010 |
|
Income tax |
|
|
|
|
|
|
|
|
|
|
|
|
|
|
Adjustment previous year |
| -15.9 |
| 0.0 |
| 0.0 |
|
| -1.7 |
| -15.9 |
| 0.0 |
|
Current tax |
| -403.6 |
| -1,038.8 |
| -398.0 |
|
| -216.0 |
| -403.6 |
| -1,038.8 |
|
Deferred tax |
| -70.1 |
| -9.2 |
| -243.3 |
|
| 102.1 |
| -70.1 |
| -9.2 |
|
Total income tax |
| -489.6 |
| -1,048.0 |
| -641.3 |
|
| -115.6 |
| -489.6 |
| -1,048.0 |
|
|
|
|
|
|
|
|
|
|
|
|
|
|
|
|
Income tax related to other comprehensive income |
|
|
|
|
|
|
|
|
|
|
|
|
|
|
Current tax |
| -3.2 |
| 0.0 |
| 0.0 |
|
| -2.0 |
| -3.2 |
| 0.0 |
|
Deferred tax |
| -103.8 |
| 488.6 |
| -475.9 |
|
| -44.3 |
| -103.8 |
| 488.6 |
|
Adjustment of deferred taxes due to reduced tax rate(1) |
| 25.9 |
| — |
| — |
| |||||||
|
|
|
|
|
|
|
|
|
|
|
|
|
|
|
Income tax related to other comprehensive income |
| -107.0 |
| 488.6 |
| -475.9 |
|
| -20.4 |
| -107.0 |
| 488.6 |
|
Reconciliation of effective tax rate |
|
|
|
|
|
|
|
|
|
|
|
|
|
|
The Swedish corporate tax rate, % |
| 26.3 |
| 26.3 |
| 26.3 |
|
| 26.3 |
| 26.3 |
| 26.3 |
|
Profit before taxes |
| 1,889.1 |
| 3,939.7 |
| 2,368.6 |
|
| 824.3 |
| 1,889.1 |
| 3,939.7 |
|
|
|
|
|
|
|
|
|
|
|
|
|
|
|
|
National tax based on profit before taxes 26.3 % |
| -496.8 |
| -1036.1 |
| -622.9 |
|
| -216.8 |
| -496.8 |
| -1,036.1 |
|
Tax effects of: |
|
|
|
|
|
|
|
|
|
|
|
|
|
|
Non-taxable income |
| 27.6 |
| 0.0 |
| — |
|
| 0.2 |
| 27.6 |
| 0.0 |
|
Non-deductible expenses |
| -1.4 |
| -1.8 |
| -1.8 |
|
| -5.3 |
| -1.4 |
| -1.8 |
|
Imputed interest on tax allocation reserve |
| -12.9 |
| -8.3 |
| -6.2 |
|
| -8.4 |
| -12.9 |
| -8.3 |
|
Dividend received |
| — |
| — |
| — |
| |||||||
Adjustment previous year |
| -15.9 |
| -0.9 |
|
|
|
| -1.7 |
| -15.9 |
| -0.9 |
|
Adjustment of deferred taxes due to reduced tax rate(1) |
| 116.4 |
| — |
| — |
| |||||||
Other |
| 9.8 |
| -0.9 |
| -10.4 |
|
| 0.0 |
| 9.8 |
| -0.9 |
|
Total tax |
| -489.6 |
| -1,048.0 |
| -641.3 |
|
| -115.6 |
| -489.6 |
| -1,048.0 |
|
Effective tax expense in % |
| 25.9 |
| 26.6 |
| 27.1 |
|
| 14.0 |
| 25.9 |
| 26.6 |
|
|
| Consolidated Group |
| ||||
Skr mn |
| 2011 |
| 2010 |
| 2009 |
|
Deferred tax assets concerning: |
|
|
|
|
|
|
|
Loss carry forwards |
| — |
| — |
| 1.0 |
|
Other temporary differences |
| 14.5 |
| 29.8 |
| 20.6 |
|
Total deferred tax assets |
| 14.5 |
| 29.8 |
| 21.6 |
|
|
|
|
|
|
|
|
|
Deferred tax liabilities concerning: |
|
|
|
|
|
|
|
Untaxed reserves |
| 709.7 |
| 634.3 |
| 365.1 |
|
Temporary differences, real estate |
| 0.0 |
| 26.0 |
| 26.5 |
|
Temporary differences, financial instruments |
|
|
|
|
|
|
|
- Cash flow hedges |
| 114.0 |
| 10.2 |
| 64.2 |
|
- Assets-held-for-sale |
| — |
|
|
| 469.4 |
|
- Valuation over profit or loss |
| — |
| — |
| 202.2 |
|
- Other temporary differences |
| 2.4 |
| -9.6 |
| -3.6 |
|
Total deferred tax liabilities |
| 826.1 |
| 660.9 |
| 1,123.8 |
|
Net deferred tax liabilities (+) / tax assets (-) |
| 811.6 |
| 631.1 |
| 1,102.2 |
|
(1) The effective tax rate is lower than the nominal tax rate because in 2012 the Swedish parliament decided to lower the corporate income tax from 26.3 percent to 22.0 percent, taking effect on January 1, 2013.
|
| Consolidated Group |
| ||||
Skr mn |
| 2012 |
| 2011 |
| 2010 |
|
Deferred tax assets concerning: |
|
|
|
|
|
|
|
Other temporary differences |
| 9.7 |
| 14.5 |
| 29.8 |
|
Total deferred tax assets |
| 9.7 |
| 14.5 |
| 29.8 |
|
|
|
|
|
|
|
|
|
Deferred tax liabilities concerning: |
|
|
|
|
|
|
|
Untaxed reserves |
| 605.5 |
| 709.7 |
| 634.3 |
|
Temporary differences, real estate |
| 0.0 |
| 0.0 |
| 26.0 |
|
Temporary differences, financial instruments |
|
|
|
|
|
|
|
- Cash flow hedges |
| 132.3 |
| 114.0 |
| 10.2 |
|
- Other temporary differences |
| 0.0 |
| 2.4 |
| -9.6 |
|
Total deferred tax liabilities |
| 737.8 |
| 826.1 |
| 660.9 |
|
Net deferred tax liabilities (+) / tax assets (-) |
| 728.1 |
| 811.6 |
| 631.1 |
|
No deductable loss carry forwards existed as of December 31, 2012; December 31, 2011 or December 31, 2010.
Change in deferred taxes |
| Consolidated Group |
| ||
Skr mn |
| 2011 |
| 2010 |
|
Opening balance |
| -631.1 |
| -1,102.2 |
|
Change through profit or loss |
| -70.1 |
| -9.2 |
|
Change in other comprehensive income |
| -103.8 |
| 488.6 |
|
Other |
| -6.6 |
| -8.3 |
|
Total |
| -811.6 |
| -631.1 |
|
In the financial statements of the Consolidated Group, the untaxed reserves of the Group companies are allocated 73.7 percent to equity and 26.3 percent to deferred taxes included as deferred tax liabilities in the statement of financial position. Changes in the amounts reported as deferred taxes are included in taxes in the statement of comprehensive income.
Change in deferred taxes |
| Consolidated Group |
| ||||
Skr mn |
| 2012 |
| 2011 |
| 2010 |
|
Opening balance |
| -811.6 |
| -631.1 |
| -1,102.2 |
|
Change through profit or loss |
| 102.1 |
| -70.1 |
| -9.2 |
|
Change in other comprehensive income |
| -18.4 |
| -103.8 |
| 488.6 |
|
Other |
| -0.2 |
| -6.6 |
| -8.3 |
|
Total |
| -728.1 |
| -811.6 |
| -631.1 |
|
Note 11. Loans and liquidity placements
SEK treats loans in the form of interest-bearing securities as a part of SEK’s total loans. SEK’s total loans and liquidity placements are calculated as follows:
|
| Consolidated Group |
|
| Consolidated Group |
| ||||
Skr mn |
| December 31, |
| December 31, |
|
| December 31, |
| December |
|
Loans: |
|
|
|
|
|
|
|
|
|
|
Loans in the form of interest-bearing securities |
| 66,204.5 |
| 71,805.8 |
|
| 57,889.8 |
| 66,204.5 |
|
Loans to credit institutions |
| 25,791.6 |
| 22,538.9 |
|
| 22,083.6 |
| 25,791.6 |
|
Loans to the public |
| 107,938.1 |
| 87,101.9 |
|
| 115,478.2 |
| 107,938.1 |
|
Less: |
|
|
|
|
|
|
|
|
|
|
Deposits with time to maturity exceeding three months |
| -4,334.3 |
| -1,790.2 |
|
| -2,544.4 |
| -4,334.3 |
|
Total loans |
| 195,599.9 |
| 179,656.4 |
|
| 192,907.2 |
| 195,599.9 |
|
|
|
|
|
|
|
|
|
|
|
|
Liquidity placements: |
|
|
|
|
|
|
|
|
|
|
Cash and cash equivalents (1) |
| 3,749.6 |
| 8,798.0 |
|
| 2,338.2 |
| 3,749.6 |
|
Deposits with time to maturity exceeding three months |
| 4,334.3 |
| 1,790.2 |
|
| 2,544.4 |
| 4,334.3 |
|
Treasuries/government bonds |
| 2,033.4 |
| 5,431.3 |
|
| 5,111.5 |
| 2,033.4 |
|
Other interest-bearing securities except loans |
| 74,738.5 |
| 100,533.0 |
|
| 77,693.3 |
| 74,738.5 |
|
Total liquidity placements |
| 84,855.8 |
| 116,552.5 |
|
| 87,687.4 |
| 84,855.8 |
|
|
|
|
|
|
|
|
|
|
|
|
of which |
|
|
|
|
|
|
|
|
|
|
- issued by public authorities |
| 29,004.1 |
| 40,129.4 |
|
| 62,432.3 |
| 29,004.1 |
|
- quoted on an exchange |
| 139,901.7 |
| 172,313.2 |
|
| 123,688.5 |
| 139,901.7 |
|
(1) Cash and cash equivalents include, in this context, cash at banks where amounts can be immediately converted into cash and short-term deposits where the time to maturity does not exceed three months from trade date.
Regarding reservations,reserves, impairments and recovery see Note 9.
Interest-bearing securities not carried at fair value and that exceed or fall short of the amount contractually required to be at maturity are reported below with the amount that exceeds or fall short of the nominal amount.
|
| Consolidated Group |
|
| Consolidated Group |
| ||||
Skr mn |
| December 31, |
| December 31, |
|
| December 31, |
| December 31, |
|
Sum of amounts exceeding nominal |
| 136.4 |
| 61.8 |
|
| 246.4 |
| 136.4 |
|
Sum of amounts falling below nominal |
| -29.9 |
| -47.4 |
|
| -13.7 |
| -29.9 |
|
Volume Development, Lending
|
| Consolidated Group |
| of which S-system |
| ||||||||
|
| Total |
| Total |
| Of which |
| ||||||
|
|
|
|
|
|
|
|
|
| CIRR- |
| Concessionary |
|
Skr mn |
| 2012 |
| 2011 |
| 2012 |
| 2011 |
| 2012 |
| 2012 |
|
Offers of long-term loans accepted |
| 56,235 |
| 51,249 |
| 19,919 |
| 7,965 |
| 19,919 |
| 0 |
|
Syndicated customer transactions |
| — |
| 39 |
| — |
| — |
| — |
| — |
|
Total customer financial transactions |
| 56,235 |
| 51,288 |
| 19,919 |
| 7,965 |
| 19,919 |
| 0 |
|
Undisbursed loans at year-end |
| 25,915 |
| 25,072 |
| 12,675 |
| 9,036 |
| 12,586 |
| 89 |
|
Loans outstanding at year-end |
| 192,907 |
| 195,600 |
| 39,499 |
| 34,227 |
| 38,647 |
| 852 |
|
Outstanding loans as per loan type
|
| Consolidated Group |
| of which the S-system |
| ||||
Skr mn |
| December 31, |
| December 31, |
| December 31, |
| December 31, |
|
Total lending for export of capital products |
| 105,145 |
| 102,566 |
| 39,499 |
| 34,227 |
|
Other lending related to export |
| 72,601 |
| 71,729 |
| — |
| — |
|
Lending related to infrastructure |
| 15,161 |
| 21,305 |
| — |
| — |
|
Total lending |
| 192,907 |
| 195,600 |
| 39,499 |
| 34,227 |
|
Outstanding loans as per business area
|
| Consolidated Group |
| of which the S-system |
| ||||
Skr mn |
| December |
| December 31, |
| December 31, |
| December 31, |
|
End customer financing |
| 103,957 |
| 101,122 |
| 39,499 |
| 34,227 |
|
Direct customer financing |
| 88,913 |
| 94,430 |
| — |
| — |
|
Other |
| 37 |
| 48 |
| — |
| — |
|
Total lending |
| 192,907 |
| 195,600 |
| 39,499 |
| 34,227 |
|
Note 12 Classification of financial assets and liabilities
|
| Consolidated Group, December 31, 2012 |
| ||||||||||
|
|
|
| Financial assets at fair |
|
|
|
|
|
|
| ||
Financial assets by accounting category |
| Total |
| Held-for-trading (2) |
| Designated |
| Derivatives |
| Available- |
| Loans and |
|
Cash and cash equivalents |
| 2,338.2 |
| — |
| — |
| — |
| — |
| 2,338.2 |
|
Treasuries/government bonds |
| 5,111.5 |
| — |
| — |
| — |
| 4,261.1 |
| 850.4 |
|
Other interest-bearing securities except loans |
| 77,693.3 |
| — |
| 2,996.8 |
| — |
| 13,118.2 |
| 61,578.3 |
|
Loans in the form of interest-bearing securities |
| 57,889.8 |
| — |
| 2,136.4 |
| — |
| — |
| 55,753.4 |
|
Loans to credit institutions |
| 22,083.6 |
| — |
| — |
| — |
| — |
| 22,083.6 |
|
Loans to the public |
| 115,478.2 |
| — |
| — |
| — |
| — |
| 115,478.2 |
|
Derivatives |
| 25,711.2 |
| 11,319.7 |
| — |
| 14,391.5 |
| — |
| — |
|
Total financial assets |
| 306,305.8 |
| 11,319.7 |
| 5,133.2 |
| 14,391.5 |
| 17,379.3 |
| 258,082.1 |
|
|
| Consolidated Group |
| of which S-system |
| ||||||||
|
| Total |
| Total |
| Of which |
| ||||||
Volume Development, Lending |
|
|
|
|
|
|
|
|
| CIRR- |
| Concessionary |
|
Skr mn |
| 2011 |
| 2010 |
| 2011 |
| 2010 |
| 2011 |
| 2011 |
|
Offers of long-term loans accepted |
| 51,249 |
| 48,749 |
| 7,965 |
| 8,760 |
| 7,965 |
| 0 |
|
Syndicated customer transactions |
| 39 |
| 19 |
| — |
| — |
| — |
| — |
|
Total customer financial transactions |
| 51,288 |
| 48,768 |
| 7,965 |
| 8,760 |
| 7,965 |
| 0 |
|
Undisbursed loans at year-end |
| 25,072 |
| 38,205 |
| 9,036 |
| 16,570 |
| 8,829 |
| 207 |
|
Loans outstanding at year-end |
| 195,600 |
| 179,656 |
| 34,227 |
| 23,989 |
| 33,386 |
| 841 |
|
|
| Consolidated Group, December 31, 2012 |
| ||||||||
|
|
|
| Financial liabilities at fair |
|
|
|
|
| ||
Financial liabilities by accounting category Skr mn |
| Total |
| Held-for-trading (2) |
| Designated |
| Derivatives |
| Other financial |
|
Borrowing from credit institutions |
| 14,490.3 |
| — |
| — |
| — |
| 14,490.3 |
|
Borrowing from the public |
| 56.9 |
| — |
| — |
| — |
| 56.9 |
|
Senior securities issued |
| 258,090.1 |
| — |
| 116,478.7 |
| — |
| 141,611.4 |
|
Derivatives |
| 16,421.0 |
| 13,567.3 |
| — |
| 2,853.7 |
| — |
|
Subordinated securities issued |
| 3,012.7 |
| — |
| — |
| — |
| 3,012.7 |
|
Total financial liabilities |
| 292,071.0 |
| 13,567.3 |
| 116,478.7 |
| 2,853.7 |
| 159,171.3 |
|
|
| Consolidated Group, December 31, 2011 |
| ||||||||||
|
|
|
| Financial assets at fair |
|
|
|
|
|
|
| ||
Financial assets by accounting category Skr mn |
| Total |
| Held-for-trading (2) |
| Designated |
| Derivatives |
| Available- |
| Loans and |
|
Cash and cash equivalents |
| 3,749.6 |
| — |
| — |
| — |
| — |
| 3,749.6 |
|
Treasuries/government bonds |
| 2,033.4 |
| — |
| — |
| — |
| — |
| 2,033.4 |
|
Other interest-bearing securities except loans |
| 74,738.5 |
| — |
| 4,477.4 |
| — |
| 9,197.6 |
| 61,063.5 |
|
Loans in the form of interest-bearing securities |
| 66,204.5 |
| — |
| 2,288.8 |
| — |
| — |
| 63,915.7 |
|
Loans to credit institutions |
| 25,791.6 |
| — |
| — |
| — |
| — |
| 25,791.6 |
|
Loans to the public |
| 107,938.1 |
| — |
| — |
| — |
| — |
| 107,938.1 |
|
Derivatives |
| 31,467.0 |
| 12,696.7 |
| — |
| 18,770.3 |
| — |
| — |
|
Total financial assets |
| 311,922.7 |
| 12,696.7 |
| 6,766.2 |
| 18,770.3 |
| 9,197.6 |
| 264,491.9 |
|
Outstanding loans as per loan type
|
| Consolidated Group |
| of which the S-system |
| ||||
Skr mn |
| December 31, |
| December 31, |
| December 31, |
| December 31, |
|
Total lending for export of capital products |
| 102,566 |
| 80,050 |
| 34,227 |
| 23,989 |
|
Other lending related to export |
| 71,729 |
| 76,809 |
| — |
| — |
|
Lending related to infrastructure |
| 21,305 |
| 22,797 |
| — |
| — |
|
Total lending |
| 195,600 |
| 179,656 |
| 34,227 |
| 23,989 |
|
Outstanding loans as per business area
|
| Consolidated Group |
| of which the S-system |
| ||||
Skr mn |
| December |
| December 31, |
| December 31, |
| December 31, |
|
End customer financing |
| 101,122 |
| 83,034 |
| 34,227 |
| 23,989 |
|
Direct customer financing |
| 94,430 |
| 96,442 |
| — |
| — |
|
Other |
| 48 |
| 180 |
| — |
| — |
|
Total lending |
| 195,600 |
| 179,656 |
| 34,227 |
| 23,989 |
|
|
| Consolidated Group, December 31, 2011 |
| ||||||||
|
|
|
| Financial liabilities at fair |
|
|
|
|
| ||
Financial liabilities by accounting category Skr mn |
| Total |
| Held-for-trading (2) |
| Designated |
| Derivatives |
| Other financial |
|
Borrowing from credit institutions |
| 15,833.9 |
| — |
| — |
| — |
| 15,833.9 |
|
Borrowing from the public |
| 59.1 |
| — |
| — |
| — |
| 59.1 |
|
Senior securities issued |
| 257,352.4 |
| — |
| 130,317.6 |
| — |
| 127,034.8 |
|
Derivatives |
| 22,604.8 |
| 19,954.8 |
| — |
| 2,650.0 |
| — |
|
Subordinated securities issued |
| 3,174.4 |
| — |
| — |
| — |
| 3,174.4 |
|
Total financial liabilities |
| 299,024.6 |
| 19,954.8 |
| 130,317.6 |
| 2,650.0 |
| 146,102.2 |
|
Note 12 Classification of financial assets and liabilities
|
| Consolidated Group, December 31, 2011 |
| ||||||||||
|
|
|
| Financial assets at fair value |
|
|
|
|
|
|
| ||
Financial assets by accounting category |
| Total |
| Held-for-trading (2) |
| Designated |
| Derivatives |
| Available- |
| Loans and |
|
Cash and cash equivalents |
| 3,749.6 |
| — |
| — |
| — |
| — |
| 3,749.6 |
|
Treasuries/government bonds |
| 2,033.4 |
| — |
| — |
| — |
| — |
| 2,033.4 |
|
Other interest-bearing securities except loans |
| 74,738.5 |
| — |
| 4,477.4 |
| — |
| 9,197.6 |
| 61,063.5 |
|
Loans in the form of interest-bearing securities |
| 66,204.5 |
| — |
| 2,288.8 |
| — |
| — |
| 63,915.7 |
|
Loans to credit institutions |
| 25,791.6 |
| — |
| — |
| — |
| — |
| 25,791.6 |
|
Loans to the public |
| 107,938.1 |
| — |
| — |
| — |
| — |
| 107,938.1 |
|
Derivatives |
| 31,467.0 |
| 12,696.7 |
| — |
| 18,770.3 |
| — |
| — |
|
Total financial assets |
| 311,922.7 |
| 12,696.7 |
| 6,766.2 |
| 18,770.3 |
| 9,197.6 |
| 264,491.9 |
|
|
| Consolidated Group, December 31, 2011 |
| ||||||||
|
|
|
| Financial liabilities at fair |
|
|
|
|
| ||
Financial liabilities by accounting category |
| Total |
| Held-for-trading (2) |
| Designated |
| Derivatives |
| Other |
|
Borrowing from credit institutions |
| 15,833.9 |
| — |
| — |
| — |
| 15,833.9 |
|
Borrowing from the public |
| 59.1 |
| — |
| — |
| — |
| 59.1 |
|
Senior securities issued |
| 257,352.4 |
| — |
| 130,317.6 |
| — |
| 127,034.8 |
|
Derivatives |
| 22,604.8 |
| 19,954.8 |
| — |
| 2,650.0 |
| — |
|
Subordinated securities issued |
| 3,174.4 |
| — |
| — |
| — |
| 3,174.4 |
|
Total financial liabilities |
| 299,024.6 |
| 19,954.8 |
| 130,317.6 |
| 2,650.0 |
| 146,102.2 |
|
|
| Consolidated Group, December 31, 2010 |
| ||||||||||
|
|
|
| Financial assets at fair value |
|
|
|
|
|
|
| ||
Financial assets by accounting category |
| Total |
| Held-for- |
| Designated |
| Derivatives |
| Available- |
| Loans and |
|
Cash and cash equivalents |
| 8,798.0 |
| — |
| — |
| — |
| — |
| 8,798.0 |
|
Treasuries/government bonds |
| 5,431.3 |
| — |
| — |
| — |
| — |
| 5,431.3 |
|
Other interest-bearing securities except loans |
| 100,533.0 |
| — |
| 5,522.7 |
| — |
| 9,082.6 |
| 85,927.7 |
|
Loans in the form of interest-bearing securities |
| 71,805.8 |
| — |
| 2,383.9 |
| — |
| — |
| 69,421.9 |
|
Loans to credit institutions |
| 22,538.9 |
| — |
| — |
| — |
| — |
| 22,538.9 |
|
Loans to the public |
| 87,101.9 |
| — |
| — |
| — |
| — |
| 87,101.9 |
|
Derivatives |
| 37,659.8 |
| 22,775.9 |
| — |
| 14,883.9 |
| — |
| — |
|
Total financial assets |
| 333,868.7 |
| 22,775.9 |
| 7,906.6 |
| 14,883.9 |
| 9,082.6 |
| 279,219.7 |
|
|
| Consolidated Group, December 31, 2010 |
| ||||||||
|
|
|
| Financial liabilities at fair |
|
|
|
|
| ||
Financial liabilities by accounting category |
| Total |
| Held-for- |
| Designated |
| Derivatives |
| Other |
|
Borrowing from credit institutions |
| 14,342.8 |
| — |
| — |
| — |
| 14,342.8 |
|
Borrowing from the public |
| 19.3 |
| — |
| — |
| — |
| 19.3 |
|
Senior securities issued |
| 286,309.5 |
| — |
| 162,595.0 |
| — |
| 123,714.5 |
|
Derivatives |
| 18,057.4 |
| 16,050.3 |
| — |
| 2,007.1 |
| — |
|
Subordinated securities issued |
| 2,590.3 |
| — |
| — |
| — |
| 2,590.3 |
|
Total financial liabilities |
| 321,319.3 |
| 16,050.3 |
| 162,595.0 |
| 2,007.1 |
| 140,666.9 |
|
(1) Of loans and receivables, approximately8.1 percent (year-end 2011: 9.5 percent (2010: 10.9 percent) are subject to fair valuefair-value hedge accounting and 5.76.6 percent (2010: 5.0(year-end 2011: 5.7 percent) are subject to cash flowcash-flow hedge accounting, the remaining 85.3 percent (year-end 2011: 84.8 percent) are not subject to hedge accounting.
(2) No assets were classified as held-for-trading other than derivatives held for economic hedging in accordance with IAS39.
(3) Of other financial liabilities, approximately73.4 percent (year-end 2011: 86.2 percent (2010: 87.6 percent) are subject to fair valuefair-value hedge accounting, the remaining 26.6 percent (year-end 2011: 13.8 percent) are not subject to hedge accounting.
(4) The difference between carrying and nominal amount is Skr -48,468.9 million (2010: Skr —36,428.8 million). Nominal amount is Skr 178,786.5 million (2010: Skr 199,023.7 million).
See Note 13 for a more detailed breakdown on assets and liabilities carried at fair value.
During 2011, in2012, fair value hedges gainslosses on hedging instruments amountsamounted to a loss of Skr 1,308.2 million (2011: a gain of Skr 2,253.2 million (2010:million; 2010: a gain of Skr 799.9 million; 2009: Skr -2,877.2 million) and lossesgains on hedged items attributable to the hedged risk amountsamounted to Skr -2.249.2665.9 million (2010:(2011: a loss of Skr -750.32,249.2 million; 2009:2010: a loss of Skr 3,244.6750.3 million).
Accumulated changes in the fair value of financial liabilities attributable to changes in credit risk amounted to a loss of Skr 753.9 million (year-end 2011: a gain of Skr 209.4 million (2010: Skr 107.9 million), which represents a cumulative decrease ofincrease in the book value.value of liabilities. For the period January 1 to December 31, 2012 the credit risk component has decreased by Skr 963.3 million, which increased the value of financial liabilities and affected operating profit negatively. For the period January 1 to December 31, 2011 the credit risk component has increased by Skr 101.5 million (2010: decrease of Skr -102.8102.8 million), which decreased the value of financial liabilities and affected operating profit positively.
The accumulated changes for derivatives originating from credit risk amount to Skr -6.3 million (year-end 2010: Skr -23.6 million), period changes amounted to Skr 17.3 million (2010: Skr -2.0 million) which has a positive effect on operating profit. The change in subordinated debt is related to a change in values. No new subordinated debt has been issued.
The amount of cumulative change in the fair value of financial assets attributable to changes in the credit risk was
Skr 17.6 million (2011: a loss of Skr 125.7 million (2010:million; 2010: a loss of Skr -350.6350.6 million). which decrease the value of financial assets and affects operating profit negatively. The amount of change during the period was a gain of Skr 108.1 million (2011: a gain of Skr 224.9 million (2010:million; 2010: a loss of Skr -38.938.9 million). which increased the value of financial assets and affected operating profit positively.
The amount of total assets as of December 31, 2011,2012, Skr 313.1 billion (year-end 2011: Skr 319.7 billion (2010: Skr 339.7 billion), has been affecteddecreased by approximately Skr 11.9 billion (2011: an increase of Skr 0.7 billion (2010: Skr —24.1billion; 2010: a decrease of 24.1 billion) byrelating to exchange rates changes since December 31, 2010,2011, had been unchanged.
Repayments of long-term debt amounting to approximately Skr 27.1 billion (2011: Skr 37.6 billion (2010:billion; 2010: Skr 111.7 billion) havehas been effectuated, and SEK’s own debt repurchase and early redemption amounted to approximately Skr 22.7 billion (2011: Skr 36.5 billion (2010:billion; 2010: Skr 33.8 billion).
Reclassification
As of July 1, 2008, and October 1, 2008, SEK reclassified certain assets, moving those assets to the category “loans and receivables” from the categories “held-for-trading” and “assets available-for-sale”. The reason for the reclassification was that those assets had becomebeen illiquid due to the extraordinary market conditions which existed during late 2008 dueowing to the global financial crisis, and the companySEK assessed itself to be able to hold the assets to maturity. Therefore there was no need for impairment of such securities held-for-tradingheld for trading or securities available-for-sale.available for sale. The reclassified assets consist of interest-bearing fixed rate bonds. At the time of the reclassification, the expected cash flows of the reclassified assets were equal to the contractual amounts, including principal and interest.
The aforementioned reclassification of the fair value of assets, previously accounted for as held-for-trading securities, to the category “loans and receivables” occurred on October 1, 2008 with retroactive effect from July 1, 2008. If SEK had not chosenDuring the reclassification option it would have had a positive effectfirst quarter of Skr 0.4 million on operating profit for2012, the period January 1 to December 31, 2011 and a positive effect on operating profit of Skr 4.8 million for the period January 1 to December 31, 2010 (2009: positive effect of Skr 142.0 million).remaining asset was sold. With respect to the period January 1 to December 31, 2011,2012, total interest revenues of Skr 32.15.2 million were derived from these reclassified assets, whereas, with respect tofor 2011 the period January 1 to December 31, 2010, total interest revenuesamount was Skr 32.1 million (2010: Skr 72.0 million were derived from the reclassified assets. The weighted average effective interest rate for these assets amounted to 1.8 percent.million).
|
| December 31, 2011 |
| December 31, 2010 |
|
| December 31, 2012 |
| December 31, 2011 |
| ||||||||||||||||
Reclassified financial assets |
| Nominal |
| Book value |
| Fair value |
| Nominal |
| Book value |
| Fair value |
| |||||||||||||
Skr mn Reclassified financial assets |
| Nominal value |
| Book value |
| Fair value |
| Nominal |
| Book value |
| Fair value |
| |||||||||||||
Other interest-bearing securities except loans |
| 241.5 |
| 245.4 |
| 245.5 |
| 3,348.9 |
| 3,368.9 |
| 3,368.6 |
|
| — |
| — |
| — |
| 241.5 |
| 245.4 |
| 245.5 |
|
The aforementioned reclassification of assets earlier accounted for as “available-for-sale” to the category “loans and receivables” occurred as of October 1, 2008. If SEK had not chosen the reclassification option the effect reported in other comprehensive income would have hadbeen a positive effect of Skr 29.02.5 million for the period January 1 to December 31, 2011.2012. For the period January 1 to December 31, 20102011 the reclassification affected other comprehensive income by a positive effect of Skr 11.129.0 million (2009: avoiding positive effect of(2010: Skr 360.211.1 million). With respect to the period January 1 to December 31, 2011,2012, total interest revenues of Skr 90.922.0 million were derived from these reclassified assets and during the period January 1 to December 31, 2010,2011, total interest revenues of Skr 90.9 million (2010: Skr 129.4 millionmillion) were derived from the reclassified assets. The weighted average effective interest rate for these assets amounted to 2.20.7 percent.
|
| December 31, 2011 |
| December 31, 2010 |
|
| December 31, 2012 |
| December 31, 2011 |
| ||||||||||||||||
Reclassified financial assets |
| Nominal |
| Book value |
| Fair value |
| Nominal |
| Book value |
| Fair value |
| |||||||||||||
Skr mn Reclassified financial assets |
| Nominal |
| Book value |
| Fair value |
| Nominal |
| Book value |
| Fair value |
| |||||||||||||
Other interest-bearing securities except loans |
| 1,122.6 |
| 1,130.7 |
| 1,128.2 |
| 4,209.5 |
| 4,235.6 |
| 4,203.9 |
|
| — |
| — |
| — |
| 1,122.6 |
| 1,130.7 |
| 1,128.2 |
|
Loans in the form of interest-bearing securities |
| 930.2 |
| 1,019.8 |
| 1,019.8 |
| 1,710.4 |
| 1,783.2 |
| 1,783.4 |
|
| 766.9 |
| 850.7 |
| 850.7 |
| 930.2 |
| 1,019.8 |
| 1,019.8 |
|
Total |
| 2,052.8 |
| 2,150.5 |
| 2,148.0 |
| 5,919.9 |
| 6,018.8 |
| 5,987.3 |
|
| 766.9 |
| 850.7 |
| 850.7 |
| 2,052.8 |
| 2,150.5 |
| 2,148.0 |
|
Note 13 Financial assets and liabilities at fair value
|
| December 31, 2011 |
|
| December 31, 2012 |
| ||||||||
Consolidated Group |
| Book value |
| Fair value |
| Surplus value (+)/ |
|
| Book value |
| Fair value |
| Surplus value (+)/ |
|
Cash and cash equivalents |
| 3,749.6 |
| 3,749.6 |
| 0.0 |
|
| 2,338.2 |
| 2,338.2 |
| 0.0 |
|
Treasuries/governments bonds |
| 2,033.4 |
| 2,026.1 |
| -7.3 |
|
| 5,111.5 |
| 5,114.0 |
| 2.5 |
|
Other interest-bearing securities except loans |
| 74,738.5 |
| 72,919.8 |
| -1,818.7 |
|
| 77,693.3 |
| 76,399.2 |
| -1,294.1 |
|
Loans in the form of interest-bearing securities |
| 66,204.5 |
| 66,706.5 |
| 502.0 |
|
| 57,889.8 |
| 59,109.2 |
| 1,219.4 |
|
Loans to credit institutions |
| 25,791.6 |
| 26,008.6 |
| 217.0 |
|
| 22,083.6 |
| 22,274.4 |
| 190.8 |
|
Loans to the public |
| 107,938.1 |
| 111,201.6 |
| 3,263.5 |
|
| 115,478.2 |
| 119,054.6 |
| 3,576.4 |
|
Derivatives |
| 31,467.0 |
| 31,467.0 |
| 0.0 |
|
| 25,711.2 |
| 25,711.2 |
| 0.0 |
|
Total financial assets |
| 311,922.7 |
| 314,079.2 |
| 2,156.5 |
|
| 306,305.8 |
| 310,000.8 |
| 3,695.0 |
|
|
|
|
|
|
|
|
|
|
|
|
|
|
|
|
Borrowing from credit institutions |
| 15,833.9 |
| 15,816.7 |
| -17.2 |
|
| 14,490.3 |
| 14,490.3 |
| 0.0 |
|
Borrowing from the public |
| 59.1 |
| 59.1 |
| 0.0 |
|
| 56.9 |
| 56.9 |
| 0.0 |
|
Senior securities issued |
| 257,352.4 |
| 257,380.5 |
| 28.1 |
|
| 258,090.1 |
| 258,189.6 |
| 99.5 |
|
Derivatives |
| 22,604.8 |
| 22,604.8 |
| 0.0 |
|
| 16,421.0 |
| 16,421.0 |
| 0.0 |
|
Subordinated securities issued |
| 3,174.4 |
| 3,174.4 |
| 0.0 |
|
| 3,012.7 |
| 2,282.9 |
| -729.8 |
|
Total financial liabilities |
| 299,024.6 |
| 299,035.5 |
| 10.9 |
|
| 292,071.0 |
| 291,440.7 |
| -630.3 |
|
|
| December 31, 2010 |
|
| December 31, 2011 |
| ||||||||
Consolidated Group |
| Book value |
| Fair value |
| Surplus value (+)/ |
|
| Book value |
| Fair value |
| Surplus value (+)/ |
|
Cash and cash equivalents |
| 8,798.0 |
| 8,798.0 |
| 0.0 |
|
| 3,749.6 |
| 3,749.6 |
| 0.0 |
|
Treasuries/governments bonds |
| 5,431.3 |
| 5,434.7 |
| 3.4 |
|
| 2,033.4 |
| 2,026.1 |
| -7.3 |
|
Other interest-bearing securities except loans |
| 100,533.0 |
| 98,383.7 |
| -2,149.3 |
|
| 74,738.5 |
| 72,919.8 |
| -1,818.7 |
|
Loans in the form of interest-bearing securities |
| 71,805.8 |
| 73,723.4 |
| 1,917.6 |
|
| 66,204.5 |
| 66,706.5 |
| 502.0 |
|
Loans to credit institutions |
| 22,538.9 |
| 22,757.3 |
| 218.4 |
|
| 25,791.6 |
| 26,008.6 |
| 217.0 |
|
Loans to the public |
| 87,101.9 |
| 88,703.5 |
| 1,601.6 |
|
| 107,938.1 |
| 111,201.6 |
| 3,263.5 |
|
Derivatives |
| 37,659.8 |
| 37,659.8 |
| 0.0 |
|
| 31,467.0 |
| 31,467.0 |
| 0.0 |
|
Total financial assets |
| 333,868.7 |
| 335,460.4 |
| 1,591.7 |
|
| 311,922.7 |
| 314,079.2 |
| 2,156.5 |
|
|
|
|
|
|
|
|
|
|
|
|
|
|
|
|
Borrowing from credit institutions |
| 14,342.8 |
| 14,342.8 |
| 0.0 |
|
| 15,833.9 |
| 15,816.7 |
| -17.2 |
|
Borrowing from the public |
| 19.3 |
| 19.3 |
| 0.0 |
|
| 59.1 |
| 59.1 |
| 0.0 |
|
Senior securities issued |
| 286,309.5 |
| 286,354.3 |
| 44.8 |
|
| 257,352.4 |
| 257,380.5 |
| 28.1 |
|
Derivatives |
| 18,057.4 |
| 18,057.4 |
| 0.0 |
|
| 22,604.8 |
| 22,604.8 |
| 0.0 |
|
Subordinated securities issued |
| 2,590.3 |
| 2,590.3 |
| 0.0 |
|
| 3,174.4 |
| 3,174.4 |
| 0.0 |
|
Total financial liabilities |
| 321,319.3 |
| 321,364.1 |
| 44.8 |
|
| 299,024.6 |
| 299,035.5 |
| 10.9 |
|
The majority of financial liabilities and some of the financial assets in the statement of financial position are measured at full fair value or at a value that represents fair value for the components hedged in a hedging relationship. However, loans and receivables and other financial liabilities which are neither subject to hedge accounting nor carried at fair value using fair value option, are measured at amortized cost. For principles for impairment of financial assets, see Note 1.
In the process of estimating or deriving fair values for items measured at fair value in the statement of financial position, certain simplifying assumptions have been made. In those cases where quoted market values for the relevant items are available such market values have been used. However, for a large portion of the items there are no such quoted market values. In such cases the fair value has been estimated or derived. The process of deriving such values naturally involves
uncertainty. Accordingly, the fair values reported do to a large extent represent values that have been estimated by the company.
The book value of derivatives,derivative instruments, which here represents maximum exposure to credit risk in accordance with certain regulations, does not reflect real exposures. In the case where a collateral agreement has been negotiated with the counterparty, the threshold amount under the collateral agreement represents real exposures. Where no collateral agreement has been negotiated with the counterparty, the positive fair value represents the real exposure. In almost all cases SEK has negotiated collateral agreements.
Determining fair value of financial instruments
Fair value measurements are categorized using a fair value hierarchy. The financial instruments carried at fair value have been categorized under the three levels of the IFRS fair value hierarchy that reflects the significance of inputs. The categorization of these instruments is based on the lowest level input that is significant to the fair value measurement in its entirety.
SEK uses the following hierarchy for determining and disclosing the fair value of financial instruments based on valuation techniques:
Level 1: quoted (unadjusted) prices in active markets for identical assets or liabilities;
Level 2: other techniques for which all inputs which have a significant effect on the recorded fair value are observable, either directly or indirectly; and
Level 3: techniques which use inputs which have a significant effect on the recorded fair value that are not based on observable market data.
For more information on fair value of financial instruments, see Note 1.
Financial assets in fair value hierarchy
|
| December 31, 2011 |
|
| December 31, 2012 |
| ||||||||||||||||||||||||||||
Consolidated Group |
| Financial assets at fair value through profit or loss or through other |
| Available-for-sale |
|
| Financial assets at fair value through profit or loss or through |
| Available-for-sale |
| ||||||||||||||||||||||||
Skr mn |
| Level 1 |
| Level 2 |
| Level 3 |
| Total |
| Level 1 |
| Level 2 |
| Level 3 |
| Total |
|
| Level 1 |
| Level 2 |
| Level 3 |
| Total |
| Level 1 |
| Level 2 |
| Level 3 |
| Total |
|
Cash and cash equivalents |
| — |
| — |
| — |
| — |
| — |
| — |
| — |
| — |
|
| — |
| — |
| — |
| — |
| — |
| — |
| — |
| — |
|
Treasuries/governments bonds |
| — |
| — |
| — |
| — |
| — |
| — |
| — |
| — |
|
| — |
| — |
| — |
| — |
| — |
| 4,261.1 |
| — |
| 4,261.1 |
|
Other interest-bearing securities except loans |
| — |
| 3,905.8 |
| 571.6 |
| 4,477.4 |
| — |
| 9,197.6 |
| — |
| 9,197.6 |
|
| — |
| 2,476.2 |
| 520.6 |
| 2,996.8 |
| — |
| 13,118.2 |
| — |
| 13,118.2 |
|
Loans in the form of interest-bearing securities |
| — |
| 1,779.4 |
| 509.5 |
| 2,288.9 |
| — |
| — |
| — |
| — |
|
| — |
| 1,630.1 |
| 506.3 |
| 2,136.4 |
| — |
| — |
| — |
| — |
|
Loans to credit institutions |
| — |
| — |
| — |
| — |
| — |
| — |
| — |
| — |
|
| — |
| — |
| — |
| — |
| — |
| — |
| — |
| — |
|
Loans to the public |
| — |
| — |
| — |
| — |
| — |
| — |
| — |
| — |
|
| — |
| — |
| — |
| — |
| — |
| — |
| — |
| — |
|
Shares and participation |
| — |
| — |
| — |
| — |
| — |
| — |
| — |
| — |
| |||||||||||||||||
Derivatives |
| — |
| 21,022.1 |
| 10,444.9 |
| 31,467.0 |
| — |
| — |
| — |
| — |
|
| — |
| 16,706.4 |
| 9,004.8 |
| 25,711.2 |
| — |
| — |
| — |
| — |
|
Total financial assets in fair value hierarchy |
| — |
| 26,707.3 |
| 11,526.0 |
| 38,233.3 |
| — |
| 9,197.6 |
| — |
| 9,197.6 |
|
| — |
| 20,812.7 |
| 10,031.7 |
| 30,844.4 |
| — |
| 17,379.3 |
| — |
| 17,379.3 |
|
Financial liabilities in fair value hierarchy
|
| December 31, 2012 |
| ||||||
Consolidated Group |
| Financial liabilities at fair value through profit or loss or |
| ||||||
Skr mn |
| Level 1 |
| Level 2 |
| Level 3 |
| Total |
|
Borrowing from credit institutions |
| — |
| — |
| — |
| — |
|
Borrowing from the public |
| — |
| — |
| — |
| — |
|
Senior securities issued |
| — |
| 27,271.2 |
| 89,207.5 |
| 116,478.7 |
|
Derivatives |
| — |
| 11,308.5 |
| 5,112.5 |
| 16,421.0 |
|
Subordinated securities issued |
| — |
| — |
| — |
| — |
|
Total financial liabilities in fair value hiearchy |
| — |
| 38,579.7 |
| 94,320.0 |
| 132,899.7 |
|
During 2012 no financial assets or liabilities at fair value have been moved from level 1 to level 2.
Financial assets in fair value hierarchy
|
| December 31, 2011 |
| ||||||||||||||
Consolidated Group |
| Financial assets at fair value through profit or loss or |
| Available-for-Sale |
| ||||||||||||
Skr mn |
| Level 1 |
| Level 2 |
| Level 3 |
| Total |
| Level 1 |
| Level 2 |
| Level 3 |
| Total |
|
Cash and cash equivalents |
| — |
| — |
| — |
| — |
| — |
| — |
| — |
| — |
|
Treasuries/governments bonds |
| — |
| — |
| — |
| — |
| — |
| — |
| — |
| — |
|
Other interest-bearing securities except loans |
| — |
| 3,905.8 |
| 571.6 |
| 4,477.4 |
| — |
| 9,197.6 |
| — |
| 9,197.6 |
|
Loans in the form of interest-bearing securities |
| — |
| 1,779.4 |
| 509.5 |
| 2,288.9 |
| — |
| — |
| — |
| — |
|
Loans to credit institutions |
| — |
| — |
| — |
| — |
| — |
| — |
| — |
| — |
|
Loans to the public |
| — |
| — |
| — |
| — |
| — |
| — |
| — |
| — |
|
Derivatives |
| — |
| 21,022.1 |
| 10,444.9 |
| 31,467.0 |
| — |
| — |
| — |
| — |
|
Total financial assets in fair value hierarchy |
| — |
| 26,707.3 |
| 11,526.0 |
| 38,233.3 |
| — |
| 9,197.6 |
| — |
| 9,197.6 |
|
Financial liabilities in fair value hierarchy
|
| December 31, 2011 |
| ||||||
Consolidated Group |
| Financial liabilities at fair value through profit or loss or |
| ||||||
Skr mn |
| Level 1 |
| Level 2 |
| Level 3 |
| Total |
|
Borrowing from credit institutions |
| — |
| — |
| — |
| — |
|
Borrowing from the public |
| — |
| — |
| — |
| — |
|
Senior securities issued |
| — |
| 8,641.3 |
| 121,676.3 |
| 130,317.6 |
|
Derivatives |
| — |
| 9,134.8 |
| 13,470.0 |
| 22,604.8 |
|
Subordinated securities issued |
| — |
| — |
| — |
| — |
|
Total financial liabilities in fair value hiearchy |
| — |
| 17,776.1 |
| 135,146.3 |
| 152,922.4 |
|
During 2011 no “Financialfinancial assets or liabilities at fair value through profit or loss or other comprehensive income have been moved from level 1 to level 2.
Financial liabilities in fair value hierarchy
|
| December 31, 2011 |
| ||||||
Consolidated Group |
| Financial liabilities at fair value through profit or loss or |
| ||||||
Skr mn |
| Level 1 |
| Level 2 |
| Level 3 |
| Total |
|
Borrowing from credit institutions |
| — |
| — |
| — |
| — |
|
Borrowing from the public |
| — |
| — |
| — |
| — |
|
Senior securities issued |
| — |
| 8,641.3 |
| 121,676.3 |
| 130,317.6 |
|
Derivatives |
| — |
| 9,134.8 |
| 13,470.0 |
| 22,604.8 |
|
Subordinated securities issued |
| — |
| — |
| — |
| — |
|
Total financial liabilities in fair value hiearchy |
| — |
| 17,776.1 |
| 135,146.3 |
| 152,922.4 |
|
Financial assets in fair value hierarchy
|
| December 31, 2010 |
| ||||||||||||||
Consolidated Group |
| Financial assets at fair value through profit or loss or |
| Available-for-Sale |
| ||||||||||||
Skr mn |
| Level 1 |
| Level 2 |
| Level 3 |
| Total |
| Level 1 |
| Level 2 |
| Level 3 |
| Total |
|
Cash and cash equivalents |
| — |
| — |
| — |
| — |
| — |
| — |
| — |
| — |
|
Treasuries/governments bonds |
| — |
| — |
| — |
| — |
| — |
| — |
| — |
| — |
|
Other interest-bearing securities except loans |
| — |
| 5,522.5 |
| 0.2 |
| 5,522.7 |
| — |
| 9,082.6 |
| — |
| 9,082.6 |
|
Loans in the form of interest-bearing securities |
| — |
| 2,383.9 |
| — |
| 2,383.9 |
| — |
|
|
| — |
|
|
|
Loans to credit institutions |
| — |
| — |
| — |
| — |
| — |
| — |
| — |
| — |
|
Loans to the public |
| — |
| — |
| — |
| — |
| — |
| — |
| — |
| — |
|
Shares and participation |
| — |
| — |
| — |
| — |
| — |
| — |
| — |
| — |
|
Derivatives |
| — |
| 16,872.0 |
| 20,787.8 |
| 37,659.8 |
| — |
| — |
| — |
| — |
|
Total financial assets in fair value hierarchy |
| — |
| 24,778.4 |
| 20,788.0 |
| 45,566.4 |
| — |
| 9,082.6 |
| — |
| 9,082.6 |
|
Financial liabilities in fair value hierarchy
|
| December 31, 2010 |
| ||||||
Consolidated Group |
| Financial liabilities at fair value through profit or loss or |
| ||||||
Skr mn |
| Level 1 |
| Level 2 |
| Level 3 |
| Total |
|
Borrowing from credit institutions |
| — |
| — |
| — |
| — |
|
Borrowing from the public |
| — |
| — |
| — |
| — |
|
Senior securities issued |
| — |
| 9,286.3 |
| 153,308.7 |
| 162,595.0 |
|
Derivatives |
| — |
| 8,021.4 |
| 10,036.0 |
| 18,057.4 |
|
Subordinated securities issued |
| — |
| — |
| — |
| — |
|
Total financial liabilities in fair value hiearchy |
| — |
| 17,307.7 |
| 163,344.7 |
| 180,652.4 |
|
Financial assets at fair value in level 3
|
| 2011 |
|
| 2012 |
| ||||||||||||||||||||||||||||||
Consolidated Group |
| January 1, 2011 |
| Purchases |
| Sales |
| Settlements |
| Transfers from |
| Transfers |
| Gains and |
| Gains and |
| December 31, |
|
| January 1, 2012 |
| Purchases |
| Settlements |
| Transfers |
| Transfers |
| Gains and |
| Gains and |
| December |
|
Other interest-bearing securities except loans |
| 0.2 |
| 6.1 |
| — |
| 0.0 |
| 504.4 |
| — |
| 60.9 |
| — |
| 571.6 |
|
| 571.6 |
| — |
| 0.0 |
| — |
| — |
| -51.0 |
| — |
| 520.6 |
|
Loans in the form of interest-bearing securities |
| — |
| — |
| — |
| — |
| 509.5 |
| — |
| — |
| — |
| 509.5 |
|
| 509.5 |
| — |
| — |
| — |
| — |
| -3.2 |
| — |
| 506.3 |
|
Derivatives |
| 20,787.8 |
| 1,587.7 |
| -2,427.7 |
| -7,977.9 |
| 32.2 |
| -42.6 |
| -1,514.6 |
| — |
| 10,444.9 |
|
| 10,444.9 |
| 492.8 |
| -1,945.4 |
| — |
| -394.8 |
| 407.3 |
| — |
| 9,004.8 |
|
Total financial assets at fair value in level 3 |
| 20,788.0 |
| 1,593.8 |
| -2,427.7 |
| -7,977.9 |
| 1,046.1 |
| -42.6 |
| -1,453.7 |
| — |
| 11,526.0 |
|
| 11,526.0 |
| 492.8 |
| -1,945.4 |
| — |
| -394.8 |
| 353.1 |
| — |
| 10,031.7 |
|
Financial liabilities at fair value in level 3
|
| 2011 |
|
| 2012 |
| ||||||||||||||||||||||||||||||
Consolidated Group |
| January 1, 2011 |
| Issues |
| Buy-backs |
| Settlements |
| Transfers from |
| Transfers |
| Gains and |
| Gains and |
| December 31, |
|
| January 1, 2012 |
| Issues |
| Settlements |
| Transfers |
| Transfers |
| Gains and |
| Gains and |
| December |
|
Senior securities issued |
| 153,308.7 |
| 25,292.9 |
| -21,206.7 |
| -31,150.8 |
| — |
| — |
| -4,567.8 |
| — |
| 121,676.3 |
|
| 121,676.3 |
| 8,668.5 |
| -29,081.4 |
| — |
| -12,716.6 |
| 660.7 |
| — |
| 89,207.5 |
|
Derivatives |
| 10,036.0 |
| 3,455.8 |
| -206.9 |
| -800.2 |
| 144.0 |
| -90.3 |
| 931.6 |
| — |
| 13,470.0 |
|
| 13,470.0 |
| 133.0 |
| -2,832.7 |
| — |
| -1,184.9 |
| -4,472.9 |
| — |
| 5,112.5 |
|
Total financial liabilities at fair value in level 3 |
| 163,344.7 |
| 28,748.7 |
| -21,413.6 |
| -31,951.0 |
| 144.0 |
| -90.3 |
| -3,636.2 |
| — |
| 135,146.3 |
|
| 135,146.3 |
| 8,801.5 |
| -31,914.1 |
| — |
| -13,901.5 |
| -3,812.2 |
| — |
| 94,320.0 |
|
Financial assets at fair value in level 3(3)
|
| 2011 |
| ||||||||||||||
Consolidated Group |
| January 1, 2011 |
| Purchases |
| Settlements |
| Transfers |
| Transfers |
| Gains and |
| Gains and |
| December |
|
Other interest-bearing securities except loans |
| 0.2 |
| 6.1 |
| 0.0 |
| 504.4 |
| — |
| 60.9 |
| — |
| 571.6 |
|
Loans in the form of interest-bearing securities |
| — |
| — |
| — |
| 509.5 |
| — |
| — |
| — |
| 509.5 |
|
Derivatives |
| 20,787.8 |
| 1,508.8 |
| -10,419.9 |
| 32.2 |
| -42.6 |
| -1,421.4 |
| — |
| 10,444.9 |
|
Total financial assets at fair value in level 3 |
| 20,788.0 |
| 1,514.9 |
| -10,419.9 |
| 1,046.1 |
| -42.6 |
| -1,360.5 |
| — |
| 11,526.0 |
|
Financial liabilities at fair value in level 3(3)
|
| 2011 |
| ||||||||||||||
Consolidated Group |
| January 1, 2011 |
| Issues |
| Settlements |
| Transfers |
| Transfers |
| Gains and |
| Gains and |
| December |
|
Senior securities issued |
| 153,308.7 |
| 24,899.8 |
| -59,198.1 |
| — |
| — |
| 2,665.9 |
| — |
| 121,676.3 |
|
Derivatives |
| 10,036.0 |
| 3,133.6 |
| -930.3 |
| 144.0 |
| -90.3 |
| 1,177.0 |
| — |
| 13,470.0 |
|
Total financial liabilities at fair value in level 3 |
| 163,344.7 |
| 28,033.4 |
| -60,128.4 |
| 144.0 |
| -90.3 |
| 3,842.9 |
| — |
| 135,146.3 |
|
(1) The unrealized fair value change (profit)changes for assets and liabilities held as of December 31, 2011 amounts2012 amount to a loss of Skr 2.20.5 billion (2010:(2011: a gain of Skr 8.90.02 billion) reported as Net results of financial transactions.
During 2010, “Financial assets at(2) The transfer from level 3 to level 2 during 2012 is due to the fact that the valuation system support has been refined and the fair value through profit or loss or other comprehensive income” amounting to Skr 6,406.4 millionis now provided by valuation models for which the market data that have a significant effect on the recorded fair value are observable.
(3) Comparative figures for 2011 have been moved from level 1restated to level 2.ensure comparability between years.
Financial assets at fair value in level 3
|
| 2010 |
| ||||||||||||||||
Consolidated Group |
| January 1, 2010 |
| Purchases |
| Sales |
| Settlements |
| Transfers from |
| Transfers |
| Gains and |
| Gains and |
| December 31, |
|
Other interest-bearing securities except loans |
| 293.1 |
| — |
| — |
| -64.5 |
| — |
| -228.5 |
| 0.1 |
| — |
| 0.2 |
|
Derivatives |
| 11,533.4 |
| 7,709.1 |
| -787.3 |
| -2,765.3 |
| 320.6 |
| -42.0 |
| 4,819.3 |
| — |
| 20,787.8 |
|
Total financial assets at fair value in level 3 |
| 11,826.5 |
| 7,709.1 |
| -787.3 |
| -2,829.8 |
| 320.6 |
| -270.5 |
| 4,819.4 |
| — |
| 20,788.0 |
|
Financial liabilities at fair value in level 3
|
| 2010 |
| ||||||||||||||||
Consolidated Group |
| January 1, 2010 |
| Issues |
| Buy-backs |
| Settlements |
| Transfers from |
| Transfers |
| Gains and |
| Gains and |
| December 31, |
|
Senior securities issued |
| 131,840.9 |
| 53,821.9 |
| -12,321.2 |
| -19,125.4 |
| 6,052.9 |
| -6,116.5 |
| -843.9 |
| — |
| 153,308.7 |
|
Derivatives |
| 15,456.1 |
| 571.2 |
| -449.8 |
| -1,144.9 |
| 441.3 |
| -1,412.9 |
| -3,425.0 |
| — |
| 10,036.0 |
|
Total financial liabilities at fair value in level 3 |
| 147,297.0 |
| 54,393.1 |
| -12,771.0 |
| -20,270.3 |
| 6,494.2 |
| -7,529.4 |
| -4,268.9 |
| — |
| 163,344.7 |
|
Uncertainty of valuation of Level 3 instruments
As the estimation of the parameters used in the valuation of level 3 transactions is an uncertain and subjective process SEK has, in accordance with IFRS 7, conducted an analysis on the difference in fair value of level 3 instruments using other reasonable parameter values. The fair value of level 3 instruments significantly affected by different types of correlations, which are not based on observable market data. The base for this sensitivity analysis hasis therefore revaluation of the portfolio, where the correlations have been conducted by adjustingadjusted +/- 10 percentage. After the volatilities relevant forrevaluation is performed, the uncertainty analysis +/– 5 percent and all correlations +/– 10 percent and then choosing the highest and lowestmax/min value for each transaction.transaction is singled out. All transactions in level 3 are part of a structured product.
The result is in accordance with SEKsSEK’s business model where the structured packagesproducts are hedged with derivatives where one leg matches the cash flows of the structured product and the other leg is floating with a spread against a reference rate. This means that an increase or decrease in the value of the structured product is offset by an equally large increase or decrease of the derivative’s matching leg. In the scenario with maximum market value below, the value of both the structured product and the derivative’s matched leg are maximized regardless if it is an asset or a liability. In the scenario with minimum market value, the value of both the structured product and the derivative’s matched leg are minimized. After accounting for the effect of collateral provided under ISDA agreements, only the exposure remaining after collateral payments is affected by the credit value adjustment. Any positive/negative figure in the uncertainty analysis will have a positive/negative effect on profit or loss.
Uncertainty analysis - Level 3 assets and liabilities
|
| December 31, 2011 |
|
| December 31, 2012 |
| ||||
Consolidated Group |
| Scenario |
| Scenario |
|
| Scenario |
| Scenario |
|
Skr mn |
| Change |
|
| Change |
| ||||
Assets |
|
|
|
|
|
|
|
|
|
|
|
|
|
|
|
| |||||
Other interest-bearing securities except loans |
| — |
| — |
|
| — |
| — |
|
Derivatives |
| 36.7 |
| -36.8 |
|
| 204.5 |
| -156.3 |
|
|
|
|
|
|
| |||||
Total change in fair value of level 3 assets |
| 36.7 |
| -36.8 |
|
| 204.5 |
| -156.3 |
|
|
|
|
|
|
|
|
|
|
|
|
Liabilities |
|
|
|
|
|
|
|
|
|
|
Senior securities issued |
| -135.7 |
| 197.2 |
|
| -300.2 |
| 456.9 |
|
Derivatives |
| 99.0 |
| -160.4 |
|
| 220.3 |
| -206.9 |
|
|
|
|
|
|
| |||||
Total change in fair value of level 3 liabilities |
| -36.7 |
| 36.8 |
|
| -79.9 |
| 250.0 |
|
|
|
|
|
|
|
|
|
|
|
|
Credit Value Adjustment |
| -0.3 |
| 0.2 |
| |||||
|
|
|
|
|
| |||||
Total effect on profit or loss |
| -0.3 |
| 0.2 |
|
| 124.6 |
| 93.7 |
|
Uncertainty analysis - Level 3 assets and liabilities
|
| December 31, 2010 |
|
| December 31, 2011 |
| ||||
Consolidated Group |
| Scenario |
| Scenario |
|
| Scenario |
| Scenario |
|
Skr mn |
| Change |
|
| Change |
| ||||
Assets |
|
|
|
|
|
|
|
|
|
|
|
|
|
|
|
| |||||
Other interest-bearing securities except loans |
| — |
| — |
|
| — |
| — |
|
Derivatives |
| 2,983.9 |
| -3,480.0 |
|
| 36.7 |
| -36.8 |
|
|
|
|
|
|
| |||||
Total change in fair value of level 3 assets |
| 2,983.9 |
| -3,480.0 |
|
| 36.7 |
| -36.8 |
|
|
|
|
|
|
|
|
|
|
|
|
Liabilities |
|
|
|
|
|
|
|
|
|
|
Senior securities issued |
| -4,474.0 |
| 6,169.8 |
|
| -135.7 |
| 197.2 |
|
Derivatives |
| 1,490.1 |
| -2,689.8 |
|
| 99.0 |
| -160.4 |
|
|
|
|
|
|
| |||||
Total change in fair value of level 3 liabilities |
| -2,983.9 |
| 3,480.0 |
|
| -36.7 |
| 36.8 |
|
|
|
|
|
|
|
|
|
|
|
|
Credit Value Adjustment |
| -1.7 |
| 0.7 |
| |||||
Credit value adjustment |
| -0.3 |
| 0.2 |
| |||||
|
|
|
|
|
|
|
|
|
|
|
Total effect on profit or loss |
| -1.7 |
| 0.7 |
|
| -0.3 |
| 0.2 |
|
Note 14. Derivatives
Consolidated Group |
| December 31, 2011 |
| December 31, 2010 |
|
| December 31, 2012 |
| December 31, 2011 |
| ||||||||||||||||
Derivatives by categories |
| Assets |
| Liabilities |
| Nominal |
| Assets |
| Liabilities |
| Nominal |
|
| Assets |
| Liabilities |
| Nominal |
| Assets |
| Liabilities |
| Nominal |
|
Skr mn |
| Fair value |
| Fair value |
| amounts |
| Fair value |
| Fair value |
| amounts |
|
| Fair value |
| Fair value |
| amounts |
| Fair value |
| Fair value |
| amounts |
|
Interest rate-related contracts |
| 6,169.6 |
| 7,226.2 |
| 143,469.3 |
| 3,846.8 |
| 7,003.8 |
| 148,043.8 |
|
| 6,528.0 |
| 6,868.6 |
| 150,547.6 |
| 6,169.6 |
| 7,226.2 |
| 143,469.3 |
|
Currency-related contracts |
| 23,182.5 |
| 5,089.8 |
| 231,600.0 |
| 24,815.3 |
| 6,456.4 |
| 253,930.1 |
|
| 16,823.1 |
| 4,974.7 |
| 207,056.2 |
| 23,182.5 |
| 5,089.8 |
| 231,600.0 |
|
Equity-related contracts |
| 1,952.9 |
| 8,747.5 |
| 58,498.7 |
| 7,085.1 |
| 3,958.0 |
| 73,069.0 |
|
| 2,228.0 |
| 3,234.5 |
| 40,363.3 |
| 1,952.9 |
| 8,747.5 |
| 58,498.7 |
|
Contracts rel. to commodities, credit risk, etc. |
| 162.0 |
| 1,541.3 |
| 20,377.5 |
| 1,912.6 |
| 639.2 |
| 20,611.9 |
| |||||||||||||
Contracts related to commodities, credit risk, etc. |
| 132.1 |
| 1,343.2 |
| 16,094.7 |
| 162.0 |
| 1,541.3 |
| 20,377.5 |
| |||||||||||||
Total derivatives |
| 31,467.0 |
| 22,604.8 |
| 453,945.5 |
| 37,659.8 |
| 18,057.4 |
| 495,654.8 |
|
| 25,711.2 |
| 16,421.0 |
| 414,061.8 |
| 31,467.0 |
| 22,604.8 |
| 453,945.5 |
|
Consolidated Group |
| December 31, 2011 |
| December 31, 2010 |
| |||||||||||||||||||||
under IAS39 |
| Assets |
| Liabilities |
| Nominal |
| Assets |
| Liabilities |
| Nominal |
| |||||||||||||
Consolidated Group |
| December 31, 2012 |
| December 31, 2011 |
| |||||||||||||||||||||
of which derivatives used for economic hedges, |
| Assets |
| Liabilities |
| Nominal |
| Assets |
| Liabilities |
| Nominal |
| |||||||||||||
Skr mn |
| Fair value |
| Fair value |
| amounts |
| Fair value |
| Fair value |
| amounts |
|
| Fair value |
| Fair value |
| amounts |
| Fair value |
| Fair value |
| amounts |
|
Interest rate-related contracts |
| 1,663.1 |
| 5,559.8 |
| 70,695.7 |
| 841.5 |
| 5,729.5 |
| 71,658.7 |
|
| 2,153.3 |
| 4,974.1 |
| 67,613.6 |
| 1,663.1 |
| 5,559.8 |
| 70,695.7 |
|
Currency-related contracts |
| 8,918.7 |
| 4,106.1 |
| 141,522.1 |
| 12,936.6 |
| 5,723.6 |
| 165,512.5 |
|
| 6,806.3 |
| 4,015.5 |
| 141,337.0 |
| 8,918.7 |
| 4,106.1 |
| 141,522.1 |
|
Equity-related contracts |
| 1,952.9 |
| 8,747.5 |
| 58,498.7 |
| 7,085.1 |
| 3,958.0 |
| 73,069.0 |
|
| 2,228.0 |
| 3,234.5 |
| 40,363.3 |
| 1,952.9 |
| 8,747.5 |
| 58,498.7 |
|
Contracts rel. to commodities, credit risk, etc. |
| 162.0 |
| 1,541.3 |
| 20,377.5 |
| 1,912.6 |
| 639.2 |
| 20,611.9 |
| |||||||||||||
Contracts related to commodities, credit risk, etc. |
| 132.1 |
| 1,343.2 |
| 16,094.7 |
| 162.0 |
| 1,541.3 |
| 20,377.5 |
| |||||||||||||
Total derivatives |
| 12,696.7 |
| 19,954.7 |
| 291,094.0 |
| 22,775.8 |
| 16,050.3 |
| 330,852.1 |
|
| 11,319.7 |
| 13,567.3 |
| 265,408.6 |
| 12,696.7 |
| 19,954.7 |
| 291,094.0 |
|
Consolidated Group |
| December 31, 2012 |
| December 31, 2011 |
| ||||||||
of which derivatives used for hedge accounting |
| Assets |
| Liabilities |
| Nominal |
| Assets |
| Liabilities |
| Nominal |
|
Skr mn |
| Fair value |
| Fair value |
| amounts |
| Fair value |
| Fair value |
| amounts |
|
Interest rate-related contracts |
| 4,374.7 |
| 1,894.5 |
| 82,934.0 |
| 4,506.5 |
| 1,666.4 |
| 72,773.6 |
|
Currency-related contracts |
| 10,016.8 |
| 959.2 |
| 65,719.2 |
| 14,263.8 |
| 983.7 |
| 90,077.9 |
|
Equity-related contracts |
| — |
| — |
| — |
| — |
| — |
| — |
|
Contracts related to commodities, credit risk, etc. |
| — |
| — |
| — |
| — |
| — |
| — |
|
Total derivatives |
| 14,391.5 |
| 2,853.7 |
| 148,653.2 |
| 18,770.3 |
| 2,650.1 |
| 162,851.5 |
|
Consolidated Group |
| December 31, 2012 |
| ||||||||
Derivatives used as cash flow hedges |
|
|
| 1 month < |
| 3 months < |
| 1 year < |
|
|
|
Skr mn |
| < 1 month |
| 3 months |
| 1 year |
| 5 years |
| > 5 years |
|
Cash inflows (assets) |
| 79.2 |
| 38.3 |
| 179.1 |
| 894.8 |
| -2.9 |
|
Cash outflows (liabilities) |
| 0.0 |
| 0.0 |
| 0.0 |
| 0.0 |
| 0.0 |
|
Net cash inflow |
| 79.2 |
| 38.3 |
| 179.1 |
| 894.8 |
| -2.9 |
|
Consolidated Group |
| December 31, 2011 |
| ||||||||
Derivatives used as cash flow hedges |
|
|
| 1 month < |
| 3 months < |
| 1 year < |
|
|
|
Skr mn |
| < 1 month |
| 3 months |
| 1 year |
| 5 years |
| > 5 years |
|
Cash inflows (assets) |
| 69.0 |
| 8.8 |
| 79.0 |
| 687.4 |
| 64.6 |
|
Cash outflows (liabilities) |
| 0.0 |
| -4.8 |
| 13.3 |
| 0.0 |
| 0.0 |
|
Net cash inflow |
| 69.0 |
| 4.0 |
| 92.3 |
| 687.4 |
| 64.6 |
|
Consolidated Group |
| December 31, 2012 |
| ||||||||
Derivatives used as fair-value hedge |
|
|
| 1 month < |
| 3 months < |
| 1 year < |
|
|
|
Skr mn |
| < 1 month |
| 3 months |
| 1 year |
| 5 years |
| > 5 years |
|
Cash inflows (assets) |
| 241.1 |
| 663.0 |
| 3,137.2 |
| 8,438.5 |
| 2,840.0 |
|
Cash outflows (liabilities) |
| -48.9 |
| -100.5 |
| -420.5 |
| -1,553.3 |
| -347.5 |
|
Net cash inflow |
| 192.2 |
| 562.5 |
| 2,716.7 |
| 6,885.2 |
| 2,492.5 |
|
Consolidated Group |
| December 31, 2011 |
| December 31, 2010 |
| ||||||||
accounting |
| Assets |
| Liabilities |
| Nominal |
| Assets |
| Liabilities |
| Nominal |
|
Skr mn |
| Fair value |
| Fair value |
| amounts |
| Fair value |
| Fair value |
| amounts |
|
Interest rate-related contracts |
| 4,506.5 |
| 1,666.4 |
| 72,773.6 |
| 3,005.3 |
| 1,274.3 |
| 76,385.2 |
|
Currency-related contracts |
| 14,263.8 |
| 983.7 |
| 90,077.9 |
| 11,878.7 |
| 732.8 |
| 88,417.5 |
|
Equity-related contracts |
| — |
| — |
| — |
| — |
| — |
| — |
|
Contracts rel. to commodities, credit risk, etc. |
| — |
| — |
| — |
| — |
| — |
| — |
|
Total derivatives |
| 18,770.3 |
| 2,650.1 |
| 162,851.5 |
| 14,884.0 |
| 2,007.1 |
| 164,802.7 |
|
Consolidated Group |
| December 31, 2011 |
| ||||||||
Derivatives used as cash flow hedges |
|
|
| 1 month < |
| 3 months < |
| 1 year < |
|
|
|
Skr mn |
| < 1 month |
| 3 months |
| 1 year |
| 5 years |
| > 5 years |
|
Cash inflows (assets) |
| 69.0 |
| 8.8 |
| 79.0 |
| 687.4 |
| 64.6 |
|
Cash outflows (liabilities) |
| 0.0 |
| -4.8 |
| 13.3 |
| 0.0 |
| 0.0 |
|
Net cash inflow |
| 69.0 |
| 4.0 |
| 92.3 |
| 687.4 |
| 64.6 |
|
Consolidated Group |
| December 31, 2010 |
| ||||||||
Derivatives used as cash flow hedges |
|
|
| 1 month < |
| 3 months < |
| 1 year < |
|
|
|
Skr mn |
| < 1 month |
| 3 months |
| 1 year |
| 5 years |
| > 5 years |
|
Cash inflows (assets) |
| 39.7 |
| 46.7 |
| 47.0 |
| 273.3 |
| 33.9 |
|
Cash outflows (liabilities) |
| 68.1 |
| -6.5 |
| -24.0 |
| 43.1 |
| 30.7 |
|
Net cash inflow |
| 107.8 |
| 40.2 |
| 23.0 |
| 316.4 |
| 64.6 |
|
Consolidated Group |
| December 31, 2011 |
| ||||||||
Derivatives used as fair-value hedge |
|
|
| 1 month < |
| 3 months < |
| 1 year < |
|
|
|
Skr mn |
| < 1 month |
| 3 months |
| 1 year |
| 5 years |
| > 5 years |
|
Cash inflows (assets) |
| 120.0 |
| 489.9 |
| 3,131.4 |
| 10,900.0 |
| 4,662.8 |
|
Cash outflows (liabilities) |
| -70.6 |
| -147.2 |
| -379.4 |
| -1,588.7 |
| -345.7 |
|
Net cash inflow |
| 49.4 |
| 342.7 |
| 2,752.0 |
| 9,311.3 |
| 4,317.1 |
|
Consolidated Group |
| December 31, 2010 |
| ||||||||
Derivatives used as fair-value hedge |
|
|
| 1 month < |
| 3 months < |
| 1 year < |
|
|
|
Skr mn |
| < 1 month |
| 3 months |
| 1 year |
| 5 years |
| > 5 years |
|
Cash inflows (assets) |
| 88.0 |
| 808.0 |
| 1,845.9 |
| 10,210.8 |
| 5,212.1 |
|
Cash outflows (liabilities) |
| -89.4 |
| -214.4 |
| -636.5 |
| -1,958.1 |
| -73.3 |
|
Net cash inflow |
| -1.4 |
| 593.6 |
| 1,209.4 |
| 8,252.7 |
| 5,138.8 |
|
Net losses on cash flow hedges reclassified to the statement of comprehensive income during the year
Net losses on cash flow hedges reclassified to |
|
|
|
|
|
|
| |||||||
Skr mn |
| 2011 |
| 2010 |
| 2009 |
|
| 2012 |
| 2011 |
| 2010 |
|
Interest income |
| 353.6 |
| 283.7 |
| 516.6 |
|
| 405.2 |
| 353.6 |
| 283.7 |
|
Interest expense |
| -201.4 |
| -81.1 |
| -103.0 |
|
| -215.2 |
| -201.4 |
| -81.1 |
|
Total |
| 152.2 |
| 202.6 |
| 413.6 |
|
| 190.0 |
| 152.2 |
| 202.6 |
|
In accordance with SEK’s policies with regard to counterparty, interest rate, currency exchange, and other exposures, SEK uses, and is a party to, different kinds of derivative instruments, mostly various interest rate-related and currency exchange-related contracts (swaps, et cetera.). These contracts are carried at fair value in the statements of financial position on a contract-by-contract basis.
SEK uses swap agreements (primarily) to hedge risk exposure inherent in financial assets and liabilities. SEK enters into swap agreements only under ISDA master agreements and all swap contracts are with financial institutions as
counterparties. Counterparty risks are managed by using an ISDA Credit Support Annex. Swaps are measured at fair value by using market quoted rates where available. If market quotes are not available, valuation models are used. SEK uses models to adjust the net exposure fair value for changes in counterparties’ credit quality. The models used include both directly observable and non-observable market parameters.
SEK issues debt instruments in many financial markets. A large portion of these are hybrid instruments with embedded derivatives. SEK’s policy is to hedge the risks in these instruments using swaps with offsetting termscorresponding structures in order to obtain effective economic hedges. These hybrid debt instruments are classified as financial liabilities measured at fair value. As there are no market quotes for this group of instruments, internal valuation models external valuation models, prices from external sources or prices from external parties or brokers for such instruments are used to calculate fair value. The model used is the same for a hybrid liability and the structured swap hedging it, except for adjustments due to the counterparty’s or SEK’s own credit risk. Thus, with the exception of effects from changes in the counterparty’s and SEK’s own credit risk, fair value changes in a hybrid liability are always matched by corresponding changes in the fair value of the swap that is hedging that liability. Such developments, which differ in different markets, have been taken into account when calculating the fair values for such liabilities. The models used include both directly observable and non-observable market parameters.
The nominal amounts of derivative instruments do not reflect real exposures. In the case in which a collateral agreement has been negotiated with the counterparty, the threshold amount under the collateral agreement represents real exposure. In the case in which no collateral agreement has been negotiated with the counterparty, the positive fair value represents the real exposure. In almost all cases SEK has negotiated collateral agreements. See the table “Total net exposures” in Note 27,28, for information regarding amounts of risk exposures related to derivatives.
SomeDue to their terms and conditions, some credit default swap contractsprotection instruments are considered derivatives and accordingly classified as financial assets or liabilities at fair value through profit or loss, whereas others are classified as financial guarantees and therefore carried at amortized cost. As of December 31, 20112012 the nominal amount of credit default swap contractsprotection instruments based on terms and conditions classified as financial guarantees were Skr 15,371.79,233.1 million (year-end 2010:2011: Skr 20,020.7 million; year-end 2009: Skr 25,225.615,371.7 million).
Note 15. Shares
All subsidiaries are domiciled in Stockholm, Sweden, and are wholly owned by AB Svensk Exportkredit. The net profit for the year after taxes, related to the subsidiaries, amounted to Skr 14.0 million (2011: Skr 10.1 million (2010:million; 2010: Skr 9.8 million; 2009: Skr 134.4 million).
|
| December 31, 2011 |
| December 31, 2010 |
|
Shares in subsidiaries |
| Number of |
| Number of |
|
AB SEKTIONEN (reg. no. 556121-0252)(1) |
| — |
| 4,000 |
|
AB SEK Securities (reg. no. 556608-8885) |
| 100,000 |
| 100,000 |
|
SEK Financial Advisors AB (reg. no. 556660-2420) |
| 5,000 |
| 5,000 |
|
SEK Financial Services AB (reg. no. 556683-3462) |
| 1,000 |
| 1,000 |
|
SEK Customer Finance AB (reg. no. 556726-7587) |
| 1,000 |
| 1,000 |
|
SEK Exportlånet AB (reg. no. 556761-7617) |
| 1,000 |
| 1,000 |
|
Venantius AB (reg. no. 556449-5116) |
| 5,000,500 |
| 5,000,500 |
|
Total |
|
|
|
|
|
(1)The subsidiary AB SEKTIONEN was sold during the second quarterTable of Contents
Shares in subsidiaries |
| December 31, 2012 |
| December 31, 2011 |
| ||||
Skr mn |
| Book |
| Number of |
| Book |
| Number of |
|
AB SEK Securities (reg no 556608-8885) |
| 10.0 |
| 100,000 |
| 10.0 |
| 100,000 |
|
SEK Financial Advisors AB (reg no 556660-2420) |
| 0.8 |
| 5,000 |
| 0.8 |
| 5,000 |
|
SEK Financial Services AB (reg no 556683-3462) |
| 0.1 |
| 1,000 |
| 0.1 |
| 1,000 |
|
SEK Customer Finance AB (reg no 556726-7587) |
| 16.6 |
| 1,000 |
| 16.6 |
| 1,000 |
|
SEK Exportlånet AB (reg no 556761-7617) |
| 0.1 |
| 1,000 |
| 0.1 |
| 1,000 |
|
Venantius AB (reg no 556449-5116) |
| 54.7 |
| 5,000,500 |
| 54.7 |
| 5,000,500 |
|
Total |
| 82.3 |
|
|
| 82.3 |
|
|
|
Note 16. Other assets
|
| Consolidated Group |
| ||
|
| December 31, |
| December 31, |
|
Skr mn |
| 2012 |
| 2011 |
|
Realized claim from the state |
| 13.4 |
| 10.7 |
|
Unrealized claims from the state regarding revaluation effects on derivatives in the S-system |
| 2,147.6 |
| 2,103.1 |
|
Current tax claim |
| 13.6 |
| — |
|
Receivables for trade that has not settled |
| 1,632.2 |
| 1,711.0 |
|
Other |
| 217.7 |
| 85.0 |
|
Total |
| 4,024.5 |
| 3,909.8 |
|
Note 17. Prepaid expenses and generated a positive result of Skr 105.1 million which is reported as other operating income in the consolidated statement of comprehensive income.accrued revenues
|
| Consolidated Group |
| ||
Skr mn |
| December 31, |
| December 31, |
|
Interest revenues accrued |
| 2,623.4 |
| 3,708.8 |
|
Prepaid expenses and other accrued revenues |
| 31.6 |
| 32.2 |
|
Total |
| 2,655.0 |
| 3,741.0 |
|
Note 16. Other assets
|
| Consolidated Group |
| ||
|
| December 31, |
| December 31, |
|
Skr mn |
| 2011 |
| 2010 |
|
Due from the State |
| 2,113.8 |
| 1,155.6 |
|
Current tax claim |
| 0.0 |
| 0.5 |
|
Deferred tax claim (see Note 10) |
| 0.0 |
| 29.8 |
|
Receivables for trade that has not settled |
| 1,711.0 |
| 392.4 |
|
Other |
| 85.0 |
| 125.8 |
|
Total |
| 3,909.8 |
| 1,704.1 |
|
Note 17. Prepaid expenses and accrued revenues
|
| Consolidated Group |
| ||
|
| December 31, |
| December 31, |
|
Skr mn |
| 2011 |
| 2010 |
|
Interest revenues accrued |
| 3,708.8 |
| 3,932.6 |
|
Prepaid expenses and other accrued revenues |
| 32.2 |
| 22.9 |
|
Total |
| 3,741.0 |
| 3,955.5 |
|
Note 18. Debt
DEBT AS PER CATEGORIES
|
| Consolidated Group |
|
| Consolidated Group |
| ||||||||
|
| December 31, 2011 |
|
| December 31, 2012 |
| ||||||||
Skr mn |
| Total |
| Total debt |
| Total senior |
|
| Total |
| Total debt |
| Total senior |
|
|
|
|
|
|
|
|
|
|
|
|
|
|
|
|
Exchange rate related contracts |
| 127,790.3 |
| — |
| 127,790.3 |
|
| 100,256.5 |
| — |
| 100,256.5 |
|
Interest rate related contracts |
| 83,730.5 |
| 15,893.0 |
| 67,837.5 |
|
| 109,893.1 |
| 14,547.2 |
| 95,345.9 |
|
Equity related contracts |
| 45,256.2 |
| — |
| 45,256.2 |
|
| 38,389.2 |
| — |
| 38,389.2 |
|
Contracts related to raw materials, credit risk etc |
| 16,468.4 |
| — |
| 16,468.4 |
|
| 24,098.5 |
| — |
| 24,098.5 |
|
Total debt outstanding |
| 273,245.4 |
| 15,893.0 |
| 257,352.4 |
|
| 272,637.3 |
| 14,547.2 |
| 258,090.1 |
|
|
|
|
|
|
|
|
|
|
|
|
|
|
|
|
Of which denominated in: |
|
|
|
|
|
|
|
|
|
|
|
|
|
|
Swedish Kronor |
| 9,550.2 |
|
|
|
|
|
| 8,641.4 |
|
|
|
|
|
Other currencies |
| 263,695.2 |
|
|
|
|
|
| 263,995.9 |
|
|
|
|
|
Total |
| 273,245.4 |
|
|
|
|
|
| 272,637.3 |
|
|
|
|
|
|
| Consolidated Group |
|
| Consolidated Group |
| ||||||||
|
| December 31, 2010 |
|
| December 31, 2011 |
| ||||||||
Skr mn |
| Total |
| Total debt |
| Total senior |
|
| Total |
| Total debt |
| Total senior |
|
|
|
|
|
|
|
|
|
|
|
|
|
|
|
|
Exchange rate related contracts |
| 129,987.0 |
| — |
| 129,987.0 |
|
| 127,790.3 |
| — |
| 127,790.3 |
|
Interest rate related contracts |
| 81,561.9 |
| 14,362.1 |
| 67,199.8 |
|
| 83,730.5 |
| 15,893.0 |
| 67,837.5 |
|
Equity related contracts |
| 68,787.1 |
| — |
| 68,787.1 |
|
| 45,256.2 |
| — |
| 45,256.2 |
|
Contracts related to raw materials, credit risk etc |
| 20,335.6 |
| — |
| 20,335.6 |
|
| 16,468.4 |
| — |
| 16,468.4 |
|
Total debt outstanding |
| 300,671.6 |
| 14,362.1 |
| 286,309.5 |
|
| 273,245.4 |
| 15,893.0 |
| 257,352.4 |
|
|
|
|
|
|
|
|
|
|
|
|
|
|
|
|
Of which denominated in: |
|
|
|
|
|
|
|
|
|
|
|
|
|
|
Swedish Kronor |
| 12,374.3 |
|
|
|
|
|
| 9,550.2 |
|
|
|
|
|
Other currencies |
| 288,297.3 |
|
|
|
|
|
| 263,695.2 |
|
|
|
|
|
Total |
| 300,671.6 |
|
|
|
|
|
| 273,245.4 |
|
|
|
|
|
Contracts have been categorized based on the contract’scontracts’ main properties. If all properties were taken into account, a transaction could be contained in several categories.
SEK has the following major funding programs in place:
Skr mn |
| Value outstanding (1) |
| ||
Funding programs |
| December 31, 2011 |
| December 31, 2010 |
|
Medium-term note programs: |
|
|
|
|
|
Unlimited Euro Medium-Term Note Programme |
| 195,197.7 |
| 215,998.4 |
|
Unlimited SEC-registered U.S. Medium-Term Note Programme |
| 61,981.4 |
| 57,103.6 |
|
Unlimited Swedish Medium-Term Note Programme |
| 830.1 |
| 1,464.5 |
|
Skr 8,000,000,000 Swedish Medium-Term Note Programme |
| 4,262.5 |
| 4,217.0 |
|
Unlimited MTN/STN AUD Debt Issuance Programme |
| 49.9 |
| 1,477.4 |
|
Commercial paper programs: |
|
|
|
|
|
USD 3,000,000,000 U.S. Commercial Paper Programme |
| — |
| — |
|
USD 4,000,000,000 Euro-Commercial Paper Programme |
| — |
| — |
|
Skr mn |
| Value outstanding (1) |
| ||
Funding programs |
| December 31, 2012 |
| December 31, 2011 |
|
Medium-term note programs: |
|
|
|
|
|
Unlimited Euro Medium-Term Note Programme |
| 171,981.7 |
| 195,197.7 |
|
Unlimited SEC-registered U.S. Medium-Term Note Programme |
| 60,733.6 |
| 61,981.4 |
|
Unlimited Swedish Medium-Term Note Programme |
| 452.2 |
| 830.1 |
|
Skr 8,000,000,000 Swedish Medium-Term Note Programme |
| 3,449.0 |
| 4,262.5 |
|
Unlimited MTN/STN AUD Debt Issuance Programme |
| 40.6 |
| 49.9 |
|
Commercial paper programs: |
|
|
|
|
|
USD 3,000,000,000 U.S. Commercial Paper Programme |
| 10,520.3 |
| — |
|
USD 4,000,000,000 Euro-Commercial Paper Programme |
| — |
| — |
|
(1) Amortized cost excluding fair value adjustments
Note 19. Other liabilities
|
| Consolidated Group |
| ||
|
| December 31, |
| December 31, |
|
Skr mn |
| 2012 |
| 2011 |
|
Current tax liability |
| — |
| 67.8 |
|
Liabilities related to assets acquired though not yet delivered and paid for |
| 2,836.7 |
| 1,848.3 |
|
Other |
| 625.6 |
| 580.9 |
|
Total |
| 3,462.3 |
| 2,497.0 |
|
Note 20. Accrued expenses and prepaid revenues
|
| Consolidated Group |
| ||
|
| December 31, |
| December 31, |
|
Skr mn |
| 2012 |
| 2011 |
|
Interest expenses accrued |
| 2,204.7 |
| 3,154.9 |
|
Other accrued expenses |
| 202.9 |
| 196.1 |
|
Total |
| 2,407.6 |
| 3,351.0 |
|
Note 21. Provisions
|
| Consolidated Group |
| ||
|
| December 31, |
| December 31, |
|
Skr mn |
| 2012 |
| 2011 |
|
Pension liabilities (see Note 5) |
| 44.5 |
| 47.0 |
|
Termination reserve |
| 9.9 |
| 2.6 |
|
Total |
| 54.4 |
| 49.6 |
|
Note 19. Other liabilities
|
| Consolidated Group |
| ||
|
| December 31, |
| December 31, |
|
Skr mn |
| 2011 |
| 2010 |
|
Current tax liability |
| 67.8 |
| 819.7 |
|
Liabilities related to assets acquired though not yet delivered and paid for |
| 1,848.3 |
| 84.8 |
|
Other |
| 580.9 |
| 736.1 |
|
Total |
| 2,497.0 |
| 1,640.6 |
|
Note 20. Accrued expenses and prepaid revenues
|
| Consolidated Group |
| ||
|
| December 31, |
| December 31, |
|
Skr mn |
| 2011 |
| 2010 |
|
Interest expenses accrued |
| 3,154.9 |
| 3,337.7 |
|
Other accrued expenses |
| 196.1 |
| 105.7 |
|
Total |
| 3,351.0 |
| 3,443.4 |
|
Note 21. Provisions
|
| Consolidated Group |
| ||
|
| December 31, |
| December 31, |
|
Skr mn |
| 2011 |
| 2010 |
|
Pension liabilities (see Note 5) |
| 47.0 |
| 50.2 |
|
Termination reserve |
| 2.6 |
| 3.4 |
|
Total |
| 49.6 |
| 53.6 |
|
Note 22. Subordinated debt securities
|
| Consolidated Group |
|
| Consolidated Group |
| ||||
|
| December 31, |
| December 31, |
|
| December 31, |
| December 31, |
|
Skr mn |
| 2011 |
| 2010 |
|
| 2012 |
| 2011 |
|
Perpetual, non-cumulative subordinated loan, foreign currency (1),(2) |
| 3,174.4 |
| 2,590.3 |
|
| 3,012.7 |
| 3,174.4 |
|
|
|
|
|
|
|
|
|
|
|
|
Total subordinated debt outstanding |
| 3,174.4 |
| 2,590.3 |
|
| 3,012.7 |
| 3,174.4 |
|
|
|
|
|
|
|
|
|
|
|
|
Of which denominated in: |
|
|
|
|
|
|
|
|
|
|
Swedish kronor |
| — |
| — |
|
| — |
| — |
|
Foreign currencies |
| 3,174.4 |
| 2,590.3 |
|
| 3,012.7 |
| 3,174.4 |
|
(1) Nominal value USD 200 million. Interest payments quarterly in arrears at a rate of 5.40 percent per annum. Redeemable, at SEK’s option only, on or after December 27, 2008, and quarterly thereafter at 100 percent of the nominal value. Redemption requires the prior approval of the Swedish Financial Supervisory Authority. Interest payment will not be made if SEK does not have available distributable capital for making such a payment. The investor’s right to receive accrued but unpaid interest will thereafter be lost (noncumulative). In order to avoid the issuer being obliged to enter into liquidation the general meeting together with the approval of the Swedish Financial Supervisory Authority may decide that the principal amount and any unpaid interest will be utilized in the meeting of losses. However, SEK cannot thereafter pay any dividend to its shareholders before the principal amount has been reinstated as debt in full in the statement of financial position or been redeemed with approval by the Swedish Financial Supervisory Authority and such accrued but unpaid interest has been paid.
(2) Nominal value USD 150 million. Interest payments quarterly in arrears at a rate of 6.375 percent per annum. Redeemable, at SEK’s option only, on or after December 27, 2008, and quarterly thereafter at 100 percent of the nominal value. Redemption requires the prior approval of the Swedish Financial Supervisory Authority. Interest payment will not be made if SEK does not have available distributable capital for making such a payment. The investor’s right to receive accrued but unpaid interest will thereafter be lost (noncumulative). In order to avoid the issuer being obliged to enter into liquidation the general meeting together with the approval of the Swedish Financial Supervisory Financial Authority may decide that the principal amount and any unpaid interest will be utilized in the meeting of losses. However, SEK cannot thereafter pay any dividend to its shareholders before the principal amount has been reinstated as debt in full in the statement of financial position or been redeemed with approval by the Swedish Financial Supervisory Authority and such accrued but unpaid interest has been paid.
The accrued interest related to the subordinated debt, at year-end Skr 1.61.5 million (year-end 2010:2011: Skr 1.51.6 million), has been included in the item “Accrued expenses and prepaid revenues”.revenues.”
The subordinated loans are subordinated to the company’s other debts, which means that payment will not be performed until other creditors have received repayment.
Note 23. Equity
|
| Consolidated Group |
| ||
Skr mn |
| December 31, |
| December 31, |
|
Share capital |
| 3,990.0 |
| 3,990.0 |
|
Reserves |
|
|
|
|
|
Hedge reserve |
| 469.2 |
| 319.4 |
|
Fair value reserve |
| -19.3 |
| -24.8 |
|
Retained earnings |
| 9,972.3 |
| 9,683.5 |
|
|
|
|
|
|
|
Total Equity |
| 14,412.2 |
| 13,968.1 |
|
The total number of shares is 3,990,000 with a quota value of Skr 1,000.
The hedge reserve comprises the cumulative effective portion of hedging derivatives in connection with cash flow hedges and is reported in other comprehensive income. The hedge reserve is reported net after-tax.
The fair value reserve is displayed as after-tax difference between fair value and amortized cost recognized through other comprehensive income related to available-for-sale securities. After reclassification as of July 1, 2008, the fair value
reserves are amortized over the remaining life of these reclassified assets. From 2009 new assets in the category available-for-sale have been acquired. Of the reserve represented interest-bearing securities with positive changes in fair value amounted to Skr 4.4 million (year-end 2011: Skr 2.2 million), Skr 12.1 million, (year-end 2011: Skr 10.1 million) represented interest-bearing securities with negative changes in fair value and a negative change of Skr 11.6 million (year-end 2011: negative change of Skr 16.9 million) remained from the reclassification in 2008.
The entire equity is attributable to the shareholder of the Parent Company.
According to the Swedish Annual Accounts Act for Credit Institutions and Securities Companies, the non-distributable capital for the Consolidated Group at year-end amounted to Skr 6,334.7 million (year-end 2011: Skr 6,176.9 million) and distributable capital amounted to Skr 8,077.5 million (year-end 2011: Skr 7,791.2 million).
Note 24. Contingent liabilities, contingent assets and commitments
Contingent liabilities and commitments are disclosed in connection with the consolidated statements of financial position as of December 31, 2011.2012. Contingent liabilities consist of liabilities related to previous loans made by Venantius AB amounting to Skr 1.1 million (year-end 2010:2011: Skr 4.51.1 million). Commitments consist of committed undisbursed loans. Such committed undisbursed loans represent loan offers that have been accepted by the customer but not yet disbursed. Of the Skr 25,071.825,915.1 million of committed undisbursed loans at December 31, 20112012 (year-end 2010:2011: Skr 38,205.225,071.8 million), committed undisbursed loans under the S-system represented Skr 9,036.012,675.4 million (year-end 2010:2011: Skr 16,570.19,036.0 million). Such commitments under the S-system sometimes include a fixed-rate option, the cost of which is reimbursed by the Swedish state in accordance with an agreement with the state (see Note 24).
SEK makes indicative loan offers to its customers, i.e. offers at a specified interest rate subject to change prior to the acceptance of the offer. When a borrower accepts the loan offer, the interest rate is stipulated. The volume of outstanding offers amounted to Skr 64.3 billion at year-end 2011 (year-end 2010: Skr 86.6 billion)25).
As of December 31, 2011,2012 the aggregate amount of outstanding offers amounted to Skr 59.5 billion, a decrease of 7.5 percent since year end 2011(year-end 2011: Skr 64.3 billion). Skr 47.9 billion (year-end 2011: Skr 57.6 billion) of outstanding offers derived from the S-system. During 2012, SEK has changed its approach to providing offers. The revised method means that either binding or non-binding offers are provided. Binding offers are included in commitments. Skr 33.8 billion of outstanding offers represents binding offers and Skr 25.7 billion represents non-binding offers.
As of December 31, 2012, SEK had, under the security agreements for derivative contracts, made deposits amounting to Skr 4.32.5 billion (year-end 2010:2011: Skr 0.74.3 billion).
Lehman Brothers Holdings Inc.Finance AG
Following Lehman Brothers Holdings Inc.’s (the Parent Company in
On April 11, 2012, the Lehman Brothers Group) request for bankruptcy protection on September 15, 2008, SEK replaced most of the outstanding derivative contracts the Parent Company had entered into with three different Lehman Brothers entities. In accordance with the terms of the original contracts (which generally took the form of ISDA Master Agreements), SEK prepared statements of claim (“Calculation Statements”) in relation to all of these Lehman Brothers entities. The Calculation Statements were delivered to the respective counterparties in the beginning of October 2008.
The majority of the contracts SEK had with different Lehman Brothers entities served primarily to hedge SEK against market risk. Those contracts have been replaced with new contracts. In addition, SEK had entered into credit default swaps with Lehman Brothers entities that were accounted for as financial guarantee and therefore recorded at amortized cost. The underlying counterparties covered by these credit default swaps all had such creditworthiness as to qualify under SEK’s policies to be held without credit default swap coverage. SEK has therefore not replaced these credit default swaps. The Calculation Statements include claims for calculated costs related to the replacement of these financial guarantees. SEK’s claims against Lehman Brothers associated with these financial guarantees has not previously been recognized in the statement of financial position due to the requirement that contingent assets only should be recognized when there is virtual certainty of collection.
During the beginning of 2011, SEK reached an agreement with one subsidiary in the former Lehman Brothers Group with regard to the parties’ respective claims. On November 16, 2011, an agreement was concluded with a third party for the sale of the said claim on the subsidiary in the former Lehman Brothers Group. The sale has resulted in a realized gain of Skr 279.3 million, of which Skr 100.0 million was already recorded as an unrealized gain in the second quarter of 2011 and Skr 127.0 million as an unrealized gain in the third quarter of 2011.
During the third quarter of 2011, SEK reached an agreement with Lehman Brothers Special Financing Inc. that resolved the parties’ respective claims. Based on that agreement, a portion of the previously recognized contingent asset are considered virtually certain to have a positive fair value and have therefore been recognized in the statement of financial position based on an assessment of the present value of future cash flows. On November 16, 2011, an agreement was concluded for the sale to a third party of SEK’s agreed claim against Lehman Brothers International (Europe) (in administration) (“LBIE-Claim”), together with the contingent claim against Lehman Brothers Holding, Inc. in its capacity as guarantor, in relation to the LBIE-Claim. The purchase price of approximately USD 41.1 million was credited to SEK’s account the same day. Based on these agreements, SEK believes that it no longer should report any contingent asset related to this particular Lehman Brothers subsidiary.
In June 2009,Swiss company Lehman Brothers Finance S.A.AG. (in liquidation, with PricewaterhouseCoopers as appointed liquidators) (“LBF”(‘LBF’) notifiedfiled a lawsuit against SEK in the Stockholm District Court. LBF claims that SEK miscalculated the termination payment that was due to LBF when certain derivative transactions were terminated following the September 2008 bankruptcy of LBF’s parent company, Lehman Brothers Holding Inc. LBF also claims that SEK was demandinglate in paying the amount that SEK calculated as being due. In its lawsuit, LBF is seeking a payment of approximately USD 37 million, plus default interest of approximately USD 45 million through March 30, 2012, for a total of USD 82 million. SEK filed a response with the Stockholm District Court on August 31, 2012, stating that it has already paid all amounts that LBF claimed were properly due under one ofto LBF. A first hearing at the original ISDA Master Agreements (the “LBF Agreement”), plus interest, rejecting SEK’sStockholm District Court for the litigation is scheduled for April 2013. SEK believes that LBF’s claims for cross-affiliate set-off, interest and damages, as reflected in the relevant Calculation Statements. SEK rejected LBF’s claim for payment and its other objections to the relevant Calculation Statements. SEK made a payment to LBF, during the fourth quarter, representing SEK’s debt including interest in accordance with the Calculation Statements. SEK disagrees with LBF’s position,are without merit and intends to continue to vigorously defend its position.
SEK believes thatdoes not believe it will not suffer any significant losses related to the bankruptcy of Lehman Brothers. SEK’s set-off and damage claims have however not been settled, and no assurance can be given that they will be compensated in full. Nor can anyBrothers, including the current lawsuit filing. No guarantees on the outcome of SEK’s dispute with LBF can be given.
Sparbanksstiftelsernas Förvaltnings AB
In March 2009, in connection with the settlement of a claim against Sparbanksstiftelsernas Förvaltnings AB (“SFAB”), SEK came to an agreement with SFAB by which SEK, through a purchase, assumed ownership of 25,520,000 shares in Swedbank AB representing 3.3 percent of Swedbank’s total share capital and votes. On June 16, 2009 SEK received a claim from SFAB challenging the agreement related to the transfer of ownership in the shares of Swedbank AB, which has been rejected by SEK. SEK subsequently subscribed for new shares in a rights offering of Swedbank AB in the autumn of 2009. Payment for new shares of Skr 497.6 million was delivered on October 6, 2009. SEK’s holding in Swedbank AB amounted to 3.3 percent and the number of shares amounted to 38,280,000 after participating in the rights offering.
On October 26, 2009, SEK received an additional claim from SFAB relating to the value of SEK’s entire current stake in Swedbank (38,280,000 shares), including fair valuation changes. These shares had an acquisition cost of a total of Skr 997.6 million, and, as of September 30, 2010, had a book value of Skr 3,592.0 million, which corresponded to the fair value. The aforementioned additional claim does not affect SEK’s previous conclusion that SFAB has no valid claim, and, therefore, it has been rejected.
On November 11, 2009, SFAB announced that it had initiated arbitration proceedings. On March 1, 2010, SFAB submitted a statement of claim against SEK at the Arbitration Institute of the Stockholm Chamber of Commerce. The statement of claim has subsequently (after SEK filed its defense) been supplemented and developed. On March 5, 2010, SFAB also submitted an application for summons against SEK in the said dispute to the City Court of Stockholm. On March 14, 2012, the arbitration proceedings were concluded in SEK’s favor. SFAB has also been ordered to reimburse SEK for the expenses it incurred during the arbitration proceedings. SEK has therefore not made any financial provisions in respect of any of the actions taken by SFAB as described above.
On October 28, 2010, SEK sold its entire stake in Swedbank AB. The holding was privately placed with a number of Swedish and international institutional investors. SEK, a holder of shares in Swedbank since March 2009, had previously announced that it should not be regarded as a long-term owner but rather had the intention to sell the stake in a responsible way. The shares, which had been acquired at a cost of Skr 997.6 million, were sold for a total of Skr 3,562.7 million resulting in a profit of Skr 2,565.0 million before taxes. At the board meeting held on October 29, 2010, SEK’s Board of Directors resolved to call an extraordinary general meeting with the purpose to propose an extra dividend amounting to Skr 1,890.0 million, equal to the realized profit from the sale after tax. The extraordinary general meeting was held on December 1, 2010, and a decision on a special dividend amounting to Skr 1,890.0 million was made. The dividend was paid to SEK’s owner, the Swedish state, on December 15, 2010. On March 14, 2012, the arbitration proceedings, which can not be appealed, were concluded in SEK’s favor with regard to the dispute between SEK and SFAB. SFAB has also been ordered to reimburse SEK for the expenses it incurred during the arbitration proceedings.
Note 24.25. S-system
SEK administers, for compensation, the Swedish State’s export credit support system, and the State’s related aid credit program (together referred to as the “S-system”). PursuantIn accordance with its assignment in an owner’s instruction to an agreement between SEK andthe company issued by the Swedish state,State, SEK has specific conditions formanages the granting of loans in the S-system. See Note 1(d) (i). The remuneration from the S-system to SEK in accordance with the agreement,owner’s instruction, which amounted to Skr 89.4 million (2011: Skr 72.4 million for the year (2010:million; 2010: Skr 48.7 million; 2009: Skr 27.3 million), is shown as a part of interest revenues in the Statements of Comprehensive Income for SEK. The assets and liabilities of the S-system are included in SEK’s statements of financial position.
CIRR loans (Commercial Interest Reference Rate) represent one of the two loan types in the S-system, the other being concessionary loans. The net result in the S-system for 20112012 amounted to a gain of Skr 83.0 million (2011: a gain of Skr
81.8 million (2010:million; 2010: a loss of Skr -27.8 million; 2009: Skr -43.227.8 million), of which the net result for the CIRR loans representedwas Skr 128.4 million (2011: Skr 123.7 million (2010:million; 2010: Skr 11.6 million; 2009: Skr -5.5 million).
Statement of comprehensive income for the S-system
Skr mn |
| 2011 |
| 2010 |
| 2009 |
|
Interest revenues |
| 862.9 |
| 680.2 |
| 493.6 |
|
Interest expenses |
| -802.5 |
| -710.7 |
| -507.2 |
|
Net interest revenues |
| 60.4 |
| -30.5 |
| -13.6 |
|
Interest compensation (1) |
| 92.4 |
| 50.8 |
| — |
|
Remuneration to SEK |
| -72.4 |
| -48.7 |
| -27.3 |
|
Foreign exchange effects |
| 1.4 |
| 0.6 |
| -2.3 |
|
Reimbursement to (-) / from (+) the State |
| -81.8 |
| 27.8 |
| 43.2 |
|
Net result |
| 0.0 |
| 0.0 |
| 0.0 |
|
Skr mn |
| 2012 |
| 2011 |
| 2010 |
|
Interest revenues |
| 1,083.3 |
| 862.9 |
| 680.2 |
|
Interest expenses |
| -913.6 |
| -802.5 |
| -710.7 |
|
Net interest revenues |
| 169.7 |
| 60.4 |
| -30.5 |
|
Interest compensation |
| 0.7 |
| 92.4 |
| 50.8 |
|
Remuneration to SEK |
| -89.4 |
| -72.4 |
| -48.7 |
|
Foreign exchange effects |
| 2.0 |
| 1.4 |
| 0.6 |
|
Reimbursement to (-) / from (+) the State |
| -83.0 |
| -81.8 |
| 27.8 |
|
Net result |
| 0.0 |
| 0.0 |
| 0.0 |
|
Statement of financial position for the S-system (included in SEK’s statements of financial position)
Skr mn |
| December 31, 2011 |
| December 31, 2010 |
|
| December 31, 2012 |
| December 31, 2011 |
|
Cash and cash equivalents |
| 20.1 |
| 55.9 |
|
| 6.6 |
| 20.1 |
|
Loans |
| 34,226.9 |
| 23,989.0 |
|
| 39,499.1 |
| 34,226.9 |
|
Derivatives |
| 4.6 |
| 16.9 |
|
| 11.6 |
| 4.6 |
|
Other assets |
| 2,459.0 |
| 1,466.8 |
|
| 2,470.5 |
| 2,459.0 |
|
Total assets |
| 36,710.6 |
| 25,528.6 |
|
| 41,987.8 |
| 36,710.6 |
|
|
|
|
|
|
|
|
|
|
|
|
Liabilities |
| 34,591.8 |
| 24,353.6 |
|
| 39,821.3 |
| 34,591.8 |
|
Derivatives |
| 2,118.8 |
| 1,175.0 |
|
| 2,166.5 |
| 2,118.8 |
|
Equity |
| — |
| — |
|
|
|
| — |
|
Total liabilities and equity |
| 36,710.6 |
| 25,528.6 |
|
| 41,987.8 |
| 36,710.6 |
|
|
|
|
|
|
|
|
|
|
|
|
Commitments |
|
|
|
|
|
|
|
|
|
|
Committed undisbursed loans (Note 23) |
| 9,036.0 |
| 16,570.1 |
| |||||
Committed undisbursed loans (Note 24) |
| 12,675.4 |
| 9,036.0 |
| |||||
Binding offers (see Note 24)(1) |
| 30,497.7 |
| n.a. |
| |||||
(1) During 2012, SEK has changed its approach to providing offers. The revised method involves providing binding or non-binding offers. Binding offers are included in commitments.
Results under the S-System by type of loan
|
| CIRR loans |
| Concessionary loans |
|
| CIRR loans |
| Concessionary loans |
| ||||||||||||||||
Skr mn |
| 2011 |
| 2010 |
| 2009 |
| 2011 |
| 2010 |
| 2009 |
|
| 2012 |
| 2011 |
| 2010 |
| 2012 |
| 2011 |
| 2010 |
|
Net interest revenues |
| 100.3 |
| 7.0 |
| 22.3 |
| -39.9 |
| -37.5 |
| -35.9 |
|
| 212.9 |
| 100.3 |
| 7.0 |
| -43.2 |
| -39.9 |
| -37.5 |
|
Interest compensation |
| 92.4 |
| 50.8 |
| — |
| — |
| — |
| — |
|
| 0.7 |
| 92.4 |
| 50.8 |
| — |
| — |
| — |
|
Remuneration to SEK |
| -70.4 |
| -46.8 |
| -25.5 |
| -2.0 |
| -1.9 |
| -1.8 |
|
| -87.2 |
| -70.4 |
| -46.8 |
| -2.2 |
| -2.0 |
| -1.9 |
|
Foreign exchange effects |
| 1.4 |
| 0.6 |
| -2.3 |
| — |
| — |
| — |
|
| 2.0 |
| 1.4 |
| 0.6 |
| — |
| — |
| — |
|
Total |
| 123.7 |
| 11.6 |
| -5.5 |
| -41.9 |
| -39.4 |
| -37.7 |
|
| 128.4 |
| 123.7 |
| 11.6 |
| -45.4 |
| -41.9 |
| -39.4 |
|
(1) During 2011, interest compensation has been reclassified to the line item “Interest compensation”. The compensation represents the change in fair value due to changes in applicable interest rates for early redemptionTable of loans. The compensation was previously reported as a commissions earned.Contents
Note 25.26. Segment Reporting
The Segment Reporting has been changed from the fourth quarter of 2011 to better reflect the present internal reporting structure. Comparative figures have been restated. In accordance with IFRS 8, SEK has the following two segments: direct customer financing and end customer financing. Direct customer financing concerns financing that SEK arranges directly to, or for the benefit of, Swedish exports companies. End customer financing refers to financing that SEK arranges for buyers of Swedish goods and services. Previously, SEK reported the segments granting of loans and other segments (including advisory services and capital market products). See Note 1 (c) for further information about Segment Reporting.
SEK’s management evaluates its business mainly on the basis of the non-IFRS income measure, operating profit excluding some fair valuation effects recorded according to IFRS.effects. Evaluation of the segments profitability, accounting policies and allocations between segments follows, in accordance with IFRS 8, the information reported to the executive management.
Profit or loss and interest-bearing assets that are not directly assigned to the segments are allocated to an allocation formula, according to internal policies that management believes provide an equitable allocation to the segments.
Consolidated Statement of Comprehensive Income |
| 2012 |
| ||||||
| Direct customer |
| End customer |
| Reconciliation with the |
| Total |
| |
Net interest revenues and net commissions |
| 1,098.7 |
| 781.4 |
| — |
| 1,880.1 |
|
Net results of financial transactions |
| 169.6 |
| 150.9 |
| — |
| 320.5 |
|
Other operating income |
| — |
| — |
| 19.9 |
| 19.9 |
|
Operating expenses |
| -220.0 |
| -324.5 |
| — |
| -544.5 |
|
Net credit losses |
| -13.1 |
| -10.3 |
| — |
| -23.4 |
|
Operating profit excl. unrealized changes in fair value |
| 1,035.2 |
| 597.5 |
| 19.9 |
| 1,652.6 |
|
Unrealized changes in value |
| — |
| — |
| -828.2 | (1) | -828.2 |
|
Operating profit |
| 1,035.2 |
| 597.5 |
| -808.3 |
| 824.4 |
|
(1) The value consists of unrealized changes in fair value amounting to a loss of Skr 1,151.7 million and a gain amounting to Skr 323.5 million that was realized when a few large interest rate and currency derivatives were closed out in order to prepare for the new regulatory framework for large exposures.
|
| 2011 |
| ||||||
Consolidated Statement of Comprehensive Income |
| Direct customer |
| End customer |
| Reconciliation with the |
| Total |
|
Net interest revenues and net commissions |
| 1,098.1 |
| 770.1 |
| — |
| 1,868.2 |
|
Net results of financial transactions |
| 227.3 |
| 254.6 |
| — |
| 481.9 |
|
Other operating income |
| — |
| — |
| 108.8 |
| 108.8 |
|
Operating expenses |
| -211.5 |
| -288.9 |
| — |
| -500.4 |
|
Net credit losses |
| -71.9 |
| -39.0 |
| — |
| -110.9 |
|
Operating profit excl. unrealized changes in fair value |
| 1,042.0 |
| 696.8 |
| 108.8 |
| 1,847.6 |
|
Unrealized changes in value |
| — |
| — |
| 41.5 |
| 41.5 |
|
Operating profit |
| 1,042.0 |
| 696.8 |
| 150.3 |
| 1,889.1 |
|
|
| Jan-Dec, 2011 |
| ||||||||
Consolidated Statement of Comprehensive Income |
| Direct customer |
| End customer |
| Reconciliation with the |
| Unrealized |
| Total |
|
Net interest revenues and net commissions |
| 1,098.1 |
| 770.1 |
| — |
| — |
| 1,868.2 |
|
Net results of financial transactions |
| 227.3 |
| 254.6 |
| — |
| — |
| 481.9 |
|
Other operating income |
| — |
| — |
| 108.8 |
| — |
| 108.8 |
|
Operating expenses |
| -211.5 |
| -288.9 |
| — |
| — |
| -500.4 |
|
Net credit losses |
| -71.9 |
| -39.0 |
| — |
| — |
| -110.9 |
|
Operating profit excl. unrealized changes in fair value |
| 1,042.0 |
| 696.8 |
| 108.8 |
| — |
| 1,847.6 |
|
Unrealized changes in value |
| — |
| — |
| — |
| 41.5 |
| 41.5 |
|
Operating profit |
| 1,042.0 |
| 696.8 |
| 108.8 |
| 41.5 |
| 1,889.1 |
|
|
| Jan-Dec, 2010 |
| ||||||||
Consolidated Statement of Comprehensive Income |
| Direct customer |
| End customer |
| Reconciliation with the |
| Unrealized |
| Total |
|
Net interest revenues and net commissions |
| 1,110.7 |
| 787.6 |
| — |
| — |
| 1,898.3 |
|
Net results of financial transactions |
| 124.4 |
| -16.8 |
| 2,565.0 |
| — |
| 2,672.6 |
|
Other operating income |
| — |
| — |
| — |
| — |
|
|
|
Operating expenses |
| -185.7 |
| -278.7 |
| — |
| — |
| -464.4 |
|
Net credit losses |
| 72.6 |
| -64.4 |
| — |
| — |
| 8.2 |
|
Operating profit excl. unrealized changes in fair value |
| 1,122.0 |
| 427.7 |
| 2,565.0 |
|
|
| 4,114.7 |
|
Unrealized changes in value |
| — |
| — |
| — |
| -175.0 |
| -175.0 |
|
Operating profit |
| 1,122.0 |
| 427.7 |
| 2,565.0 |
| -175.0 |
| 3,939.7 |
|
|
| Jan-Dec, 2009 |
|
| 2010 |
| ||||||||||||||
Consolidated Statement of Comprehensive Income |
| Direct customer |
| End customer |
| Reconciliation with the |
| Unrealized |
|
|
|
| Direct customer |
| End customer |
| Reconciliation with the |
| Total |
|
Net interest revenues and net commissions |
| 1,200.8 |
| 793.3 |
| — |
| — |
| 1,994.1 |
|
| 1,110.7 |
| 787.6 |
| — |
| 1,898.3 |
|
Net results of financial transactions |
| 179.6 |
| 154.2 |
| — |
| — |
| 333.8 |
|
| 124.4 |
| -16.8 |
| 2,565.0 | (2) | 2,672.6 |
|
Other operating income |
| — |
| — |
| — |
| — |
|
|
|
| — |
| — |
| — |
| — |
|
Operating expenses |
| -198.6 |
| -283.7 |
| — |
| — |
| -482.3 |
|
| -185.7 |
| -278.7 |
| — |
| -464.4 |
|
Net credit losses |
| -156.6 |
| -89.7 |
| — |
| — |
| -246.3 |
|
| 72.6 |
| -64.4 |
| — |
| 8.2 |
|
Operating profit excl. unrealized changes in fair value |
| 1,025.2 |
| 574.1 |
| — |
|
|
| 1,599.3 |
|
| 1,122.0 |
| 427.7 |
| 2,565.0 |
| 4,114.7 |
|
Unrealized changes in value |
| — |
| — |
| — |
| 769.3 |
| 769.3 |
|
| — |
| — |
| -175.0 |
| -175.0 |
|
Operating profit |
| 1,025.2 |
| 574.1 |
| — |
| 769.3 |
| 2,368.6 |
|
| 1,122.0 |
| 427.7 |
| 2,390.0 |
| 3,939.7 |
|
(1)(2) The item consists of other operating income primarily due to the sale of AB SEKTIONEN and realized net profit due to the disposal of the shares in Swedbank.
|
| December 31, 2012 |
| December 31, 2011 |
| ||||||||
Interest-bearing assets and Committed undisbursed loans |
| Direct |
| End customer |
| Sum of segments |
| Direct customer |
| End customer |
| Sum of |
|
Interest-bearing assets |
| 115.5 |
| 160.6 |
| 276.1 |
| 127.5 |
| 147.5 |
| 275.0 |
|
Committed undisbursed loans |
| — |
| 25.9 |
| 25.9 |
| 2.5 |
| 22.6 |
| 25.1 |
|
Reconciliation between sum of segments and Consolidated Statement of Financial Position |
|
|
|
|
|
Skr billion |
| December 31, 2012 |
| December 31, 2011 |
|
Sum of segments |
| 276.1 |
| 275.0 |
|
Cash and cash equivalents |
| 2.3 |
| 3.7 |
|
Derivatives |
| 25.7 |
| 31.5 |
|
Property, plant, equipment and intangible assets |
| 0.2 |
| 0.1 |
|
Other assets |
| 4.0 |
| 3.9 |
|
Prepaid expenses and accrued revenues |
| 2.7 |
| 3.7 |
|
Other (1) |
| 2.1 |
| 1.8 |
|
Total |
| 313.1 |
| 319.7 |
|
Consolidated statement of financial position |
| 313.1 |
| 319.7 |
|
(1) The line item consists of unrealized changes in value.
Income geographical areas |
| 2012 |
| 2011 |
| 2010 |
| ||||||||||||
| Interest- |
| Commissions |
| Total |
| Interest- |
| Commissions |
| Total |
| Interest- |
| Commissions |
| Total |
| |
Sweden |
| 3,510.5 |
| 2.3 |
| 3,512.8 |
| 3,697.0 |
| 5.4 |
| 3,702.4 |
| 2,943.9 |
| 10.1 |
| 2,954.0 |
|
Europe except Sweden |
| 1,868.3 |
| 8.7 |
| 1,877.0 |
| 2,527.0 |
| 6.9 |
| 2,533.9 |
| 6,265.2 |
| 6.7 |
| 6,271.9 |
|
Countries outside of Europe |
| 4,973.5 |
| 0.1 |
| 4,973.6 |
| 3,999.0 |
| 0.0 |
| 3,999.0 |
| 2,974.0 |
| 2.9 |
| 2,976.9 |
|
Total |
| 10,352.3 |
| 11.1 |
| 10,363.4 |
| 10,223.0 |
| 12.3 |
| 10,235.3 |
| 12,183.1 |
| 19.7 |
| 12,202.8 |
|
|
| December 31, 2011 |
| December 31, 2010 |
| ||||||||
Skr billion |
| Direct |
| End customer financing |
| Sum of segments |
| Direct customer |
| End |
| Sum of |
|
Interest-bearing assets |
| 127.5 |
| 147.5 |
| 275.0 |
| 136.7 |
| 158.0 |
| 294.7 |
|
Committed undisbursed loans |
| 2.5 |
| 22.6 |
| 25.1 |
| 4.7 |
| 33.5 |
| 38.2 |
|
Reconciliation between sum of segments and Consolidated statement of financial position |
|
|
|
|
|
Skr billion |
| December 31, 2011 |
| December 31, 2010 |
|
Sum of segments |
| 275.0 |
| 294.7 |
|
Derivates |
| 31.5 |
| 37.7 |
|
Property, plant, equipment and intangible assets |
| 0.1 |
| 0.2 |
|
Other assets |
| 3.9 |
| 1.7 |
|
Prepaid expenses and accrued revenues |
| 3.7 |
| 4.0 |
|
Other (2) |
| 5.5 |
| 1.4 |
|
Total |
| 319.7 |
| 339.7 |
|
Consolidated statement of financial position |
| 319.7 |
| 339.7 |
|
(2) Other consists mainly of call deposits.
|
| Jan-Dec, 2011 |
| Jan-Dec, 2010 |
| Jan-Dec, 2009 |
| ||||||||||||
Income geographical areas |
| Interest- revenues |
| Commissions- earned |
| Total |
| Interest- revenues |
| Commissions |
| Total |
| Interest- revenues |
| Commissions |
| Total |
|
Sweden |
| 3,697.0 |
| 5.4 |
| 3,702.4 |
| 2,943.9 |
| 10.1 |
| 2,954.0 |
| 2,883.8 |
| 11.5 |
| 2,895.3 |
|
Europe except Sweden |
| 2,527.0 |
| 6.9 |
| 2,533.9 |
| 6,265.2 |
| 6.7 |
| 6,271.9 |
| 1,211.0 |
| 11.3 |
| 1,222.3 |
|
Countries outside of Europe |
| 3,999.0 |
| 0.0 |
| 3,999.0 |
| 2,974.0 |
| 2.9 |
| 2,976.9 |
| 9,211.6 |
| 3.4 |
| 9,215.0 |
|
Total |
| 10,223.0 |
| 12.3 |
| 10,235.3 |
| 12,183.1 |
| 19.7 |
| 12,202.8 |
| 13,306.4 |
| 26.2 |
| 13,332.6 |
|
Note 26.27. Capital Adequacy
The capital adequacy ratio of SEK as a consolidated financial entity, calculated according to Basel II, Pillar 1, as of December 31, 20112012 was 23.323.1 percent (year-end 2010: 22.42011: 22.5 percent) without taking into account the effects of currently applicable transitional rules (see below).
Capital Base
|
| Consolidated Group |
| ||
Skr mn |
| December 31, 2011 |
| December 31, 2010 |
|
Tier-1 capital |
| 15,375 |
| 14,432 |
|
Total Capital base(1) |
| 15,375 |
| 14,432 |
|
|
| Consolidated Group |
| ||
Skr mn |
| 31 december 2012 |
| December 31, 2011 |
|
Common Equity Tier-1 (1) |
| 14,171 |
| 12,952 |
|
Additional Tier-1 |
| 2,281 |
| 2,423 |
|
Total Tier-1 capital |
| 16,452 |
| 15,375 |
|
Tier-2 capital |
| 49 |
| n.a. |
|
Total capital base(2) |
| 16,501 |
| 15,375 |
|
(1)According to SEK’s definition, Common Equity Tier-1 is equal to Tier-1 capital excluding additional Tier-1 capital in the form of perpetual subordinated debt. The definition of what is to be included in Common Equity Tier-1 capital in future capital adequacy regulations has not yet been determined.
(2) Total capital base, including expected loss surplus in accordance with the IRB approach.
Capital base - Adjusting items
|
| Consolidated Group |
| ||
Skr mn |
| December 31, 2011 |
| December 31, 2010 |
|
Equity |
| 13,968 |
| 12,570 |
|
Equity-portions of untaxed reserves |
| n.a. |
| n.a. |
|
Expected dividend |
| -420 |
| -301 |
|
Items recognized at fair value |
| -475 |
| -75 |
|
Intangible assets and other adjustements |
| -88 |
| -58 |
|
Deduction from Tier-1 |
| -33 |
| n.a. |
|
Tier-1 eligible subordinated debt |
| 2,423 |
| 2,381 |
|
100% of expected loss in accordance with IRB-calculation |
| 0 |
| -85 |
|
Total Tier 1 Capital |
| 15,375 |
| 14,432 |
|
|
| Consolidated Group |
| ||
Skr mn |
| 31 december 2012 |
| December 31, 2011 |
|
Equity |
| 3,990 |
| 3,990 |
|
Retained earnings |
| 9,972 |
| 9,684 |
|
Other reserves |
| 450 |
| 294 |
|
Total shareholders’ equity per accounting balance sheet |
| 14,412 |
| 13,968 |
|
Expected dividend |
| -213 |
| -420 |
|
Other deduction |
| -21 |
| -33 |
|
Intangible assets |
| -113 |
| -88 |
|
100% of deficits in accordance with IRB-calculation |
| — |
| — |
|
Total regulatory adjustments to accounting basis |
| -347 |
| -541 |
|
|
|
|
|
|
|
Adjustments Available-for-sale securities |
| 19 |
| -2 |
|
Adjustment own credit spread |
| 556 |
| -154 |
|
Adjustments cash flow hedges |
| -469 |
| -319 |
|
Total prudential filters |
| 106 |
| -475 |
|
Total Common Equity Tier 1 capital |
| 14,171 |
| 12,952 |
|
Tier-1 eligible subordinated debt |
| 2,281 |
| 2,423 |
|
Total Tier-1 capital |
| 16,452 |
| 15,375 |
|
|
|
|
|
|
|
Tier-2-eligible subordinated debt |
| n.a. |
| n.a. |
|
Deduction from Tier-2 capital |
| n.a. |
| n.a. |
|
100 % of surplus in accordance with IRB-calculation |
| 49 |
| n.a. |
|
Total Tier-2 capital |
| 49 |
| — |
|
Impact on the capital base from expected loss
Expected loss is calculated according to law and regulations, based on information from SEK’s internal ratings-based approach (IRB-approach). Such an expected loss does not represent real, individually anticipated losses, but reflects a
theoretically calculated amount. Expected loss is a gross deduction from the capital base. This deduction is decreased by impairments of financial assets for which expected loss is calculated. The difference between recorded impairment and expected loss will adjust the capital base, by a reduction or an addition, as the case might be. As of December 31, 2012 the addition to the capital base amounted to Skr 49 million. The amount increased Tier-2 capital. As of December 31, 2011, the deduction from the capital base amounted to Skr 0 million. As
Capital base - change
|
| Consolidated Group |
| ||
Skr mn |
| 2012 |
| 2011 |
|
Opening Common Equity-Tier 1 |
| 12,952 |
| 12,051 |
|
Expected dividend |
| -213 |
| -420 |
|
Profit for the year |
| 709 |
| 1,400 |
|
Intangible assets |
| -25 |
| -71 |
|
Other, of which |
| 748 |
| -8 |
|
- Adjustment own credit spread |
| 710 |
| -75 |
|
- Price adjustment |
| 12 |
| -32 |
|
- IRB-calculation, deficits |
| 0 |
| 85 |
|
- Other |
| 26 |
| 14 |
|
Closing Common Equity-Tier 1 |
| 14,171 |
| 12,952 |
|
Opening Tier-1 eligible subordinated debt |
| 2,423 |
| 2,381 |
|
Currency exchange effects |
| -142 |
| 42 |
|
Closing Tier-1 capital |
| 16,452 |
| 15,375 |
|
|
|
|
|
|
|
Opening Tier-2-eligible subordinated debt |
| — |
| — |
|
IRB-calculation, surplus/deficits |
| 49 |
| — |
|
Closing Tier-2-eligible subordinated debt |
| 49 |
| — |
|
|
|
|
|
|
|
Total capital base |
| 16,501 |
| 15,375 |
|
Capital Requirements in Accordance with Pillar 1
|
| Consolidated Group |
|
| Consolidated Group |
| ||||||||||||||||
|
| December 31, 2011 |
| December 31, 2010 |
|
| December 31, 2012 |
| December 31, 2011 |
| ||||||||||||
Skr mn |
| Weighted claims |
| Required capital |
| Weighted claims |
| Required capital |
|
| EAD(3) |
| Risk weighted |
| Required |
| EAD |
| Risk |
| Required |
|
Credit risk standardized method |
| 1,767 |
| 141 |
| 925 |
| 74 |
|
|
|
|
|
|
|
|
|
|
|
|
|
|
Central governments |
| 9,607 |
| 820 |
| 66 |
| 12,246 |
| 1,341 |
| 107 |
| |||||||||
Government export credit agencies |
| 138,987 |
| 315 |
| 25 |
| 112,361 |
| 178 |
| 14 |
| |||||||||
Regional governments |
| 23,510 |
| — |
| — |
| 19,002 |
| — |
| — |
| |||||||||
Multilateral development banks |
| 422 |
| — |
| — |
| 423 |
| — |
| — |
| |||||||||
Householdexposures |
| 1 |
| 1 |
| 0 |
| 1 |
| 1 |
| 0 |
| |||||||||
Corporates |
| 373 |
| 373 |
| 30 |
| 247 |
| 247 |
| 20 |
| |||||||||
Total credit risk standardized method |
| 172,900 |
| 1,509 |
| 121 |
| 144,280 |
| 1,767 |
| 141 |
| |||||||||
Credit risk IRB method |
| 59,349 |
| 4,748 |
| 58,157 |
| 4,653 |
|
|
|
|
|
|
|
| 0 |
|
|
|
|
|
Financial institutions 1 |
| 76,789 |
| 19,612 |
| 1,569 |
| 86,188 |
| 22,335 |
| 1,787 |
| |||||||||
Corporates |
| 61,977 |
| 36,202 |
| 2,896 |
| 53,898 |
| 31,119 |
| 2,489 |
| |||||||||
Securitization positions |
| 10,021 |
| 8,254 |
| 660 |
| 16,115 |
| 5,807 |
| 465 |
| |||||||||
Without counterparty |
| 149 |
| 149 |
| 12 |
| 128 |
| 128 |
| 10 |
| |||||||||
Total credit risk IRB method |
| 148,936 |
| 64,217 |
| 5,137 |
| 156,329 |
| 59,389 |
| 4,751 |
| |||||||||
Currency exchange risks |
| — |
| — |
| — |
| — |
|
| n.a. |
| 2,221 |
| 178 |
| n.a |
| 2,486 |
| 199 |
|
Operational risk |
| 4,799 |
| 384 |
| 5,371 |
| 430 |
|
| n.a. |
| 3,549 |
| 284 |
| n.a |
| 4,799 |
| 384 |
|
Total Basel II |
| 65,915 |
| 5,273 |
| 64,453 |
| 5,157 |
|
| 321,836 |
| 71,496 |
| 5,720 |
| 300,609 |
| 68,441 |
| 5,475 |
|
|
|
|
|
|
|
|
|
|
|
|
|
|
|
|
|
|
|
|
|
|
|
|
Basel I based additional requirement (1) |
| — |
| — |
| 26 |
| 2 |
| |||||||||||||
Basel I-based additional requirement(2) |
| n.a. |
| — |
| — |
| n.a. |
| — |
| — |
| |||||||||
Total Basel II incl. additional requirement |
| 65,915 |
| 5,273 |
| 64,479 |
| 5,159 |
|
| 321,836 |
| 71,496 |
| 5,720 |
| 300,609 |
| 68,441 |
| 5,475 |
|
|
|
|
|
|
|
|
|
|
|
|
|
|
|
|
|
|
|
|
|
|
|
|
Total Basel I |
| 81,146 |
| 6,492 |
| 80,599 |
| 6,448 |
|
| n.a. |
| 84,754 |
| 6,780 |
| n.a. |
| 81,146 |
| 6,492 |
|
(1) Of which counterparty risk in derivatives: Exposure at default (“EAD”) Skr 9,269 million (year-end 2011: Skr 11,279 million), Weighted claims Skr 3,442 million (year-end 2011: Skr 4,082 million) and Required capital Skr 275 million (year-end 2011: Skr 327 million).
(2)The item “Basel I based additional requirements” is calculated in accordance with § 5 of the law (2006:1372) on implementation of the capital adequacy requirements (2006:1371).
(3) EAD shows the size of the outstanding exposure at default.
Credit risk by PD grade
The tables illustrate the exposure at default (EAD), the portion of the exposure that will be lost in the event of a default (LGD) and the probability of default or cessation of payments by a counterparty (PD) for the exposure classes where PD is estimated internally.
|
| 31 december 2012 |
| 31 december 2011 |
| ||||||||||||||||
Consolidated Group |
| AAA |
| AA+ to A- |
| BBB+ to BBB- |
| BB+ to B-0,79 |
| CCC to D |
| AAA |
| AA+ to A- 0,02 |
| BBB+ to BBB- |
| BB+to B- 0,79- |
| CCC to D |
|
Financial institutions |
|
|
|
|
|
|
|
|
|
|
|
|
|
|
|
|
|
|
|
|
|
EAD |
| 899 |
| 70,969 |
| 4,678 |
| 243 |
| — |
| — |
| 80,089 |
| 5,836 |
| 263 |
| — |
|
Average PD in % |
| 0.02 |
| 0.08 |
| 0.27 |
| 0.79 |
| — |
| — |
| 0.08 |
| 0.28 |
| 1.09 |
| — |
|
Average LGD in % |
| 45.00 |
| 42.22 |
| 45.00 |
| 45.00 |
| — |
| — |
| 43.53 |
| 45.00 |
| 45.00 |
| — |
|
Average riskweight in % |
| 15.30 |
| 23.80 |
| 50.70 |
| 89.40 |
| — |
| — |
| 23.60 |
| 54.10 |
| 99.80 |
| — |
|
Corporates |
|
|
|
|
|
|
|
|
|
|
|
|
|
|
|
|
|
|
|
|
|
EAD |
| 898 |
| 19,062 |
| 29,482 |
| 12,344 |
| 191 |
| 70 |
| 15,871 |
| 27,243 |
| 10,497 |
| 217 |
|
Average PD in % |
| 0.02 |
| 0.11 |
| 0.30 |
| 1.09 |
| 33.79 |
| 0.02 |
| 0.11 |
| 0.29 |
| 1.02 |
| 33.37 |
|
Average LGD in % |
| 45.0 |
| 45.0 |
| 45.0 |
| 45.0 |
| 45.0 |
| 45.0 |
| 45.0 |
| 45.0 |
| 45.0 |
| 45.0 |
|
Average riskweight in % |
| 15.3 |
| 33.9 |
| 57.8 |
| 98.2 |
| 235.8 |
| 19.0 |
| 33.1 |
| 55.9 |
| 96.2 |
| 237.3 |
|
Credit risks
For risk classification and quantification of credit risk SEK uses an internal ratings-based (IRB) approach. The Swedish Financial Supervisory Authority has approved SEK’s IRB approach. Specifically, SEK applies the Foundation Approach. Under the Foundation Approach, the company determines the probability of default within one year (PD) of each of its counterparties, while the Swedish Financial Supervisory Authority establishes the remaining parameters. The Swedish Financial Supervisory Authority has, however exempted the company, until December 31, 2012,2015, for some exposures. For exposure exempted from the IRB approach, SEK applies the standardized approach when calculating the capital requirement for credit risk.
Exchange rate risks
The exchange rate risks are calculated on reported values according to the so called two-step method. As of December 31, 2012 the method for calculating the exchange rate positions have been improved as to assets and liabilities related to unrealized change in fair-values.
Operational risks
The regulations provide opportunities for companies to use different methods for the calculation of capital
requirements for operational risks. Until the third quarter of 2011 SEK used the basic indicator approach. As of the third quarter of 2011, SEK is applying the Standardized Approach. Under the standardized approach the capital requirement for operational risk is based on the company´scompany’s operations being divided into business areas in accordance with capital adequacy regulations. The capital requirement for respective areas is calculated by multiplying a factor of 12 percent, 15 percent or 18 percent (depending on the business area) by an income indicator. This income indicator consists of the average operating income for the past three financial years. Operational income is calculated as the sum of the following items: interest and leasing income, interest and leasing costs, dividends received, commission income, commission expense, net profit from financial transactions and other operating income.
Transitional rules
Since 2007, the capital requirement has been determined, primarily, based on Basel II rules. The Swedish legislature has, however, chosen not to immediately allow the full effect of the Basel II regulations if these rules result in a lower capital requirement than that calculated on the basis of the earlier, less risk-sensitive, Basel I rules. During the transition period of 2007 to 2009, the capital requirement was therefore calculated in parallel on the basis of the Basel I rules. To the extent that the Basel I-based capital requirement — reduced to 95 percent in 2007, 90 percent in 2008, and 80 percent in 2009 — has exceeded the capital requirement based on the Basel II rules, the capital requirement under the abovementioned Basel I-based rules has constituted the minimum capital requirement. In 2009 the Swedish legislature decided to extend the transitional rules to apply until the end of 2011. In 2011 the legislatorlegislature has determined to further extend the transitional rules. For 2012, therefore, the capital requirement will continue to correspond to the highest capital requirement under the Basel II rules and 80 percent of the capital requirements under Basel I rules.
Capital Adequacy Analysis (Pillar 1)
|
| Consolidated Group |
| ||||||
|
| December 31, 2011 |
| December 31, 2010 |
| ||||
|
| Excl. Basel I based |
| Incl. Basel I |
| Excl. Basel I |
| Incl. Basel I |
|
Total capital adequacy |
| 23.3 | % | 23.3 | % | 22.4 | % | 22.4 | % |
...Of which related to Tier-1 Capital |
| 23.3 | % | 23.3 | % | 22.4 | % | 22.4 | % |
|
|
|
|
|
|
|
|
|
|
Capital adequacy quota (total capital base/total required capital) |
| 2.92 |
| 2.92 |
| 2.80 |
| 2.80 |
|
According to SEK’s definition Common Equity Tier-1 constitutes of Tier-1 capital excluding additional Tier-1 capital in the form of perpetual subordinated debt. SEK’s Common Equity Tier-1 capital adequacy ratio amounted to 19.6 percent as of December 31, 2011 (year-end 2010: 18.7 percent). The definition of what to be computed in Common Equity Tier-1 capital in future capital adequacy regulations has not yet been determined.
|
| Consolidated Group |
| ||||||
|
| December 31, 2012 |
| December 31, 2011 |
| ||||
|
| Excl. Basel I based add. |
| Incl. Basel I |
| Excl. Basel I |
| Incl. Basel I |
|
Total capital adequacy |
| 23.1 | % | 23.1 | % | 22.5 | % | 22.5 | % |
of which related to Common Equity Tier-1 capital |
| 19.8 | % | 19.8 | % | 18.9 | % | 18.9 | % |
of which related to Tier-1 capital |
| 23.0 | % | 23.0 | % | 22.5 | % | 22.5 | % |
of which related to Tier-2 capital |
| 0.1 | % | 0.1 | % | n.a |
| n.a |
|
Capital adequacy quota (total capital base/total required capital) |
| 2.89 |
| 2.89 |
| 2.81 |
| 2.81 |
|
Note 27.28. Risk information
For further risk information, see Note 30, Risk and Capital management.31.
The table of credit quality as per category in the statement of financial position and the table illustrating the link between statement of financial position categories and exposures according to Basel II contain book values. Other tables contain nominal values.
Credit risk
The table below shows the maximum exposure to credit risk. The amounts are nominal values.values except for derivatives which are reported at book value.
|
| December 31, 2012 |
| ||||
|
| Maximum exposure to Credit Risk |
| ||||
Consolidated Group |
| Financial assets at fair |
| Assets available |
| Loans and |
|
Cash and cash equivalents |
| — |
| — |
| 2,338.2 |
|
Treasuries/government bonds |
| — |
| 4,245.0 |
| 848.9 |
|
Other interest-bearing securities except loans |
| 2,764.0 |
| 13,095.3 |
| 61,880.9 |
|
Loans in the form of interest-bearing securities |
| 1,951.2 |
| — |
| 55,147.3 |
|
Loans to credit institutions |
| — |
| — |
| 24,157.3 |
|
Loans to the public |
| — |
| — |
| 130,142.6 |
|
Derivatives |
| 25,711.2 |
| — |
| — |
|
Total financial assets |
| 30,426.4 |
| 17,340.3 |
| 274,515.2 |
|
|
| December 31, 2011 |
| ||||
|
| Maximum exposure to Credit Risk |
| ||||
Consolidated Group |
| Financial assets at |
| Assets |
| Loans and |
|
Cash and cash equivalents |
| — |
| — |
| 3,749.6 |
|
Treasuries/government bonds |
| — |
| — |
| 2,035.8 |
|
Other interest-bearing securities except loans |
| 4,268.7 |
| 9,198.5 |
| 61,653.2 |
|
Loans in the form of interest-bearing securities |
| 2,114.5 |
| — |
| 63,427.5 |
|
Loans to credit institutions |
| — |
| — |
| 27,267.1 |
|
Loans to the public |
| — |
| — |
| 126,946.9 |
|
Derivatives |
| 31,467.0 |
| — |
| — |
|
Total financial assets |
| 37,850.2 |
| 9,198.5 |
| 285,080.1 |
|
|
| December 31, 2010 |
|
| December 31, 2011 |
| ||||||||
|
| Maximum exposure to Credit Risk |
|
| Maximum exposure to Credit Risk |
| ||||||||
Consolidated Group Skr mn |
| Financial assets at |
| Assets |
| Loans and |
|
| Financial assets at fair |
| Assets available |
| Loans and |
|
Cash and cash equivalents |
| — |
| — |
| 8,798.0 |
|
| — |
| — |
| 3,749.6 |
|
Treasuries/government bonds |
| — |
| — |
| 5,437.2 |
|
| — |
| — |
| 2,035.8 |
|
Other interest-bearing securities except loans |
| 5,316.5 |
| 9,056.9 |
| 86,358.5 |
|
| 4,268.7 |
| 9,198.5 |
| 61,653.2 |
|
Loans in the form of interest-bearing securities |
| 2,214.9 |
| — |
| 69,040.4 |
|
| 2,114.5 |
| — |
| 63,427.5 |
|
Loans to credit institutions |
| — |
| — |
| 25,281.3 |
|
| — |
| — |
| 27,267.1 |
|
Loans to the public |
| — |
| — |
| 121,718.9 |
|
| — |
| — |
| 126,946.9 |
|
Derivatives |
| 37,659.8 |
| — |
| — |
|
| 31,467.0 |
| — |
| — |
|
Total financial assets |
| 45,191.2 |
| 9,056.9 |
| 316,634.3 |
|
| 37,850.2 |
| 9,198.5 |
| 285,080.1 |
|
Maximum exposure to credit risk for “Loans to credit institutions” and “Loans to the public” includeincludes undisbursed loans at year-end, entered at nominal value.
The table below displays the credit quality after risk mitigation (net) as per category in the statement of financial positions.position. The amounts are book values.
Consolidated Group |
| December 31, 2011 |
|
| December 31, 2012 |
| ||||||||||||||||||||
Skr mn |
| Book value |
| AAA |
| AA+ to A- |
| BBB+ to BBB- |
| BB+ to B- |
| CCC to D |
|
| Book value |
| AAA |
| AA+ to A- |
| BBB+ to BBB- |
| BB+ to B- |
| CCC to D |
|
Cash and cash equivalents |
| 3,749.6 |
| — |
| 3,749.6 |
| — |
| — |
| — |
|
| 2,338.2 |
| — |
| 2,338.2 |
| — |
| — |
| — |
|
Treasuries/government bonds |
| 2,033.4 |
| 1,995.3 |
| — |
| 38.1 |
| — |
| — |
|
| 5,111.5 |
| 4,261.0 |
| 814.4 |
| 36.0 |
| — |
| — |
|
Other interest-bearing securities except loans |
| 74,738.5 |
| 16,294.0 |
| 57,437.7 |
| 860.1 |
| 77.0 |
| 69.7 |
|
| 77,693.3 |
| 10,896.8 |
| 65,089.2 |
| 439.1 |
| 1,170.7 |
| 97.6 |
|
Loans in the form of interest-bearing securities |
| 66,204.5 |
| 19,730.4 |
| 26,818.4 |
| 15,690.4 |
| 3,965.3 |
| — |
|
| 57,889.8 |
| 15,498.5 |
| 19,358.4 |
| 13,094.3 |
| 9,938.6 |
| — |
|
Loans to credit institutions |
| 25,791.6 |
| 8,362.5 |
| 13,682.1 |
| 3,732.6 |
| 14.4 |
| — |
|
| 22,083.6 |
| 2,127.6 |
| 19,271.8 |
| 657.4 |
| 26.7 |
| — |
|
Loans to the public |
| 107,938.1 |
| 49,903.1 |
| 35,368.1 |
| 14,916.9 |
| 7,611.9 |
| 138.1 |
|
| 115,478.2 |
| 20,428.9 |
| 57,765.2 |
| 25,961.6 |
| 11,195.7 |
| 126.7 |
|
Derivatives |
| 31,467.0 |
| — |
| 24,602.7 |
| 6,864.3 |
| — |
| — |
|
| 25,711.2 |
| — |
| 21,560.6 |
| 4,150.6 |
| — |
| — |
|
|
|
|
|
|
|
|
|
|
|
|
|
|
| |||||||||||||
Total financial assets |
| 311,922.7 |
| 96,285.3 |
| 161,658.6 |
| 42,102.4 |
| 11,668.6 |
| 207.8 |
|
| 306,305.8 |
| 53,212.9 |
| 186,197.8 |
| 44,339.2 |
| 22,331.8 |
| 224.3 |
|
|
|
|
|
|
|
|
|
|
|
|
|
|
| |||||||||||||
Committed undisbursed loans |
| 25,071.8 |
| 14,274.9 |
| 8,211.1 |
| 1,318.0 |
| 1,256.3 |
| 11.5 |
|
| 25,915.1 |
| 7,848.0 |
| 7,641.7 |
| 3,926.1 |
| 6,486.4 |
| 12.9 |
|
Consolidated Group |
| December 31, 2010 |
|
| December 31, 2011 |
| ||||||||||||||||||||
Skr mn |
| Book value |
| AAA |
| AA+ to A- |
| BBB+ to BBB- |
| BB+ to B- |
| CCC to D |
|
| Book value |
| AAA |
| AA+ to A- |
| BBB+ to BBB- |
| BB+ to B- |
| CCC to D |
|
Cash and cash equivalents |
| 8,798.0 |
| — |
| 8,798.0 |
| — |
| — |
| — |
|
| 3,749.6 |
| — |
| 3,749.6 |
| — |
| — |
| — |
|
Treasuries/government bonds |
| 5,431.2 |
| 899.0 |
| 4,494.0 |
| — |
| 38.2 |
| — |
|
| 2,033.4 |
| 1,995.3 |
| — |
| 38.1 |
| — |
| — |
|
Other interest-bearing securities except loans |
| 100,532.9 |
| 24,263.6 |
| 72,852.0 |
| 3,114.1 |
| 140.4 |
| 162.8 |
|
| 74,738.5 |
| 16,294.0 |
| 57,437.7 |
| 860.1 |
| 77.0 |
| 69.7 |
|
Loans in the form of interest-bearing securities |
| 71,805.9 |
| 23,399.5 |
| 30,488.4 |
| 15,798.7 |
| 2,119.3 |
| — |
|
| 66,204.5 |
| 19,730.4 |
| 26,818.4 |
| 15,690.4 |
| 3,965.3 |
| — |
|
Loans to credit institutions |
| 22,539.0 |
| 10,572.9 |
| 10,664.8 |
| 588.5 |
| 712.8 |
| — |
|
| 25,791.6 |
| 8,362.5 |
| 13,682.1 |
| 3,732.6 |
| 14.4 |
| — |
|
Loans to the public |
| 87,101.9 |
| 59,430.7 |
| 14,780.4 |
| 9,208.5 |
| 3,548.9 |
| 133.4 |
|
| 107,938.1 |
| 49,903.1 |
| 35,368.1 |
| 14,916.9 |
| 7,611.9 |
| 138.1 |
|
Derivatives |
| 37,659.8 |
| 65.7 |
| 28,788.0 |
| 8,806.1 |
| — |
| — |
|
| 31,467.0 |
| — |
| 24,602.7 |
| 6,864.3 |
| — |
| — |
|
Total financial assets |
| 333,868.7 |
| 118,631.4 |
| 170,865.6 |
| 37,515.9 |
| 6,559.6 |
| 296.2 |
|
| 311,922.7 |
| 96,285.3 |
| 161,658.6 |
| 42,102.4 |
| 11,668.6 |
| 207.8 |
|
|
|
|
|
|
|
|
|
|
|
|
|
|
| |||||||||||||
Committed undisbursed loans |
| 38,205.2 |
| 18,248.8 |
| 16,337.1 |
| 3,598.7 |
| 14.5 |
| 6.1 |
|
| 25,071.8 |
| 14,274.9 |
| 8,211.1 |
| 1,318.0 |
| 1,256.3 |
| 11.5 |
|
The credit quality of financial assets is evaluated by use of internal or external rating.
The table below illustrates the link between the statement of financial position categories and net exposures according to Basel II.
|
| December 31, 2011 |
|
| December 31, 2012 |
| ||||||||||||||||||||
Consolidated Group Skr billion |
| Book value |
| Adjustment |
| Adjustment to |
| Amendment |
| Exposure |
| Exposure class |
| |||||||||||||
Consolidated Group |
| Book value |
| Adjustment from |
| Adjustment to |
| Amendment for |
| Exposure |
| Exposure class |
| |||||||||||||
Treasuries/government bonds |
| 2.0 |
| — |
| 9.5 |
| 1.5 |
| 13.0 |
| Central governments |
|
| 5.1 |
| — |
| 3.9 |
| 0.8 |
| 9.8 |
| Central governments |
|
Other interest-bearing securities except loans |
| 74.7 |
| — |
| 27.0 |
| 21.4 |
| 123.1 |
| Government export credit agencies |
|
| 77.7 |
| — |
| 29.3 |
| 55.0 |
| 162.0 |
| Government export credit agencies |
|
Loans in the form of interest-bearing securities |
| 66.2 |
| -0.3 |
| -47.1 |
| 0.3 |
| 19.1 |
| Regional governments |
|
| 57.9 |
| -0.8 |
| -33.7 |
| 0.2 |
| 23.6 |
| Regional governments |
|
Loans to credit institutions including cash and cash equivalents(1) |
| 29.5 |
| -4.7 |
| -24.4 |
| — |
| 0.4 |
| Multilateral development banks |
|
| 24.4 |
| -2.8 |
| -21.2 |
| — |
| 0.4 |
| Multilateral development banks |
|
Loans to the public |
| 107.9 |
| -0.7 |
| -33.2 |
| 12.5 |
| 86.5 |
| Financial institutions, including equity exposures |
|
| 115.5 |
| -0.8 |
| -48.4 |
| 10.9 |
| 77.2 |
| Financial institutions |
|
Shares and participation |
| — |
| — |
| 52.1 |
| 3.3 |
| 55.4 |
| Corporates |
| |||||||||||||
|
| — |
| — |
| 60.1 |
| 3.5 |
| 63.6 |
| Corporates |
| |||||||||||||
Derivatives |
| 31.5 |
| -14.8 |
| -16.7 |
| — |
| — |
|
|
|
| 25.7 |
| -12.9 |
| -12.8 |
| — |
| — |
|
|
|
|
| — |
| — |
| 16.1 |
| — |
| 16.1 |
| Securitization positions |
|
|
|
| — |
| 10.0 |
| — |
| 10.0 |
| Securitization positions |
|
Total financial assets |
| 311.8 |
| -20.5 |
| -16.7 |
| 39.0 |
| 313.6 |
|
|
|
| 306.3 |
| -17.3 |
| -12.8 |
| 70.4 |
| 346.6 |
|
|
|
|
| December 31, 2010 |
|
| December 31, 2011 |
| ||||||||||||||||||||
Consolidated Group |
| Book value |
| Adjustment |
| Adjustment to |
| Amendment |
| Exposure |
| Exposure class |
| |||||||||||||
Consolidated Group |
| Book value |
| Adjustment from |
| Adjustment to |
| Amendment for |
| Exposure |
| Exposure class |
| |||||||||||||
Treasuries/government bonds |
| 5.4 |
| 0.0 |
| 9.1 |
| 2.0 |
| 16.5 |
| Central governments |
|
| 2.0 |
| — |
| 9.5 |
| 1.5 |
| 13.0 |
| Central governments |
|
Other interest-bearing securities except loans |
| 100.5 |
| -0.3 |
| -9.2 |
| 32.8 |
| 123.8 |
| Government export credit agencies |
|
| 74.7 |
| — |
| 27.0 |
| 21.4 |
| 123.1 |
| Government export credit agencies |
|
Loans in the form of interest-bearing securities |
| 71.8 |
| -0.5 |
| -48.1 |
| 0.5 |
| 23.7 |
| Regional governments |
|
| 66.2 |
| -0.3 |
| -47.1 |
| 0.3 |
| 19.1 |
| Regional governments |
|
Loans to credit institutions including cash and cash equivalents(1) |
| 31.3 |
| -0.3 |
| -30.6 |
| 0.0 |
| 0.4 |
| Multilateral development banks |
|
| 29.5 |
| -4.7 |
| -24.4 |
| — |
| 0.4 |
| Multilateral development banks |
|
Loans to the public |
| 87.1 |
| -0.6 |
| 15.1 |
| 12.5 |
| 114.1 |
| Financial institutions, including equity exposures |
|
| 107.9 |
| -0.7 |
| -33.2 |
| 12.5 |
| 86.5 |
| Financial institutions |
|
Shares and participation |
| — |
| — |
| 39.7 |
| 3.6 |
| 43.3 |
| Corporates |
| |||||||||||||
|
| — |
| — |
| 52.1 |
| 3.3 |
| 55.4 |
| Corporates |
| |||||||||||||
Derivatives |
| 37.7 |
| -14.1 |
| -23.6 |
| — |
| — |
|
|
|
| 31.5 |
| -14.8 |
| -16.7 |
| — |
| — |
|
|
|
|
| — |
| — |
| 24.0 |
| — |
| 24.0 |
| Securitization positions |
|
| — |
| — |
| 16.1 |
| — |
| 16.1 |
| Securitization positions |
|
Total financial assets |
| 333.8 |
| -15.8 |
| -23.6 |
| 51.4 |
| 345.8 |
|
|
|
| 311.8 |
| -20.5 |
| -16.7 |
| 39.0 |
| 313.6 |
|
|
|
(1)Skr 2.5 billion (2011: Skr 4.3 billion (2010: Skr 0.7 billion) of the book value for Loans to credit institutions are cash collateral provided by SEK.
Reduction in derivative exposures from applying netting under current ISDA Master Agreements according to Basel II regulations regarding counterparty risk in derivative transactions amounts to 14.8Skr 12.9 billion (2010:(2011: Skr 14.114.8 billion). For further information regarding counterparty risk in derivative transactions under Basel II, see Note 30, Risk and Capital management.31.
Total credit exposures Consolidated Group
Amounts expressing gross exposures are shown before guarantees and credit derivatives (CDSs) while net exposures, according to Basel II, are reported after taking guarantees and credit derivatives into consideration. The amounts are nominal values.
Total net exposures
|
| Total |
| Loans & |
| Undisbursed loans, derivatives, etc |
| ||||||||||||||||||
Skr billion |
| December 31, 2011 |
| December 31, 2010 |
| December 31, 2011 |
| December 31, 2010 |
| December 31, 2011 |
| December 31, 2010 |
| ||||||||||||
Classified by type of exposure class |
| Amount |
| % |
| Amount |
| % |
| Amount |
| % |
| Amount |
| % |
| Amount |
| % |
| Amount |
| % |
|
Central governments |
| 13.0 |
| 4 |
| 16.5 |
| 5 |
| 11.5 |
| 4 |
| 14.4 |
| 5 |
| 1.5 |
| 4 |
| 2.1 |
| 4 |
|
Government export credit agencies |
| 123.1 |
| 39 |
| 123.8 |
| 36 |
| 101.7 |
| 37 |
| 91.1 |
| 31 |
| 21.4 |
| 55 |
| 32.7 |
| 64 |
|
Regional governments |
| 19.1 |
| 6 |
| 23.7 |
| 7 |
| 18.8 |
| 7 |
| 23.2 |
| 8 |
| 0.3 |
| 1 |
| 0.5 |
| 1 |
|
Multilateral development banks |
| 0.4 |
| 0 |
| 0.4 |
| 0 |
| 0.4 |
| 0 |
| 0.4 |
| 0 |
| — |
| — |
| — |
| — |
|
Financial institutions |
| 86.5 |
| 28 |
| 114.1 |
| 33 |
| 74.0 |
| 27 |
| 101.6 |
| 35 |
| 12.5 |
| 32 |
| 12.5 |
| 24 |
|
Corporates |
| 55.4 |
| 18 |
| 43.3 |
| 12 |
| 52.1 |
| 19 |
| 39.7 |
| 13 |
| 3.3 |
| 8 |
| 3.6 |
| 7 |
|
Securitization positions |
| 16.1 |
| 5 |
| 24.0 |
| 7 |
| 16.1 |
| 6 |
| 24.0 |
| 8 |
| — |
| — |
| — |
| — |
|
Total |
| 313.6 |
| 100 |
| 345.8 |
| 100 |
| 274.6 |
| 100 |
| 294.4 |
| 100 |
| 39.0 |
| 100 |
| 51.4 |
| 100 |
|
The table above displays net exposures.
|
| Total |
| Loans and |
| Undisbursed loans, derivatives, etc |
| ||||||||||||||||||
Skr bn |
| December 31, 2012 |
| December 31, 2011 |
| December 31, 2012 |
| December 31, 2011 |
| December 31, 2012 |
| December 31, 2011 |
| ||||||||||||
Classified by type of exposure class |
| Amount |
| % |
| Amount |
| % |
| Amount |
| % |
| Amount |
| % |
| Amount |
| % |
| Amount |
| % |
|
Central governments |
| 9.8 |
| 3 |
| 13.0 |
| 4 |
| 9.0 |
| 3 |
| 11.5 |
| 4 |
| 0.8 |
| 1 |
| 1.5 |
| 4 |
|
Government export credit agencies |
| 162.0 |
| 47 |
| 123.1 |
| 39 |
| 107.0 |
| 39 |
| 101.7 |
| 37 |
| 55.0 |
| 78 |
| 21.4 |
| 55 |
|
Regional governments |
| 23.6 |
| 7 |
| 19.1 |
| 6 |
| 23.4 |
| 8 |
| 18.8 |
| 7 |
| 0.2 |
| 0 |
| 0.3 |
| 1 |
|
Multilateral development banks |
| 0.4 |
| 0 |
| 0.4 |
| 0 |
| 0.4 |
| 0 |
| 0.4 |
| 0 |
| — |
| — |
| — |
| — |
|
Financial institutions |
| 77.2 |
| 22 |
| 86.5 |
| 28 |
| 66.3 |
| 24 |
| 74.0 |
| 27 |
| 10.9 |
| 16 |
| 12.5 |
| 32 |
|
Corporates |
| 63.6 |
| 18 |
| 55.4 |
| 18 |
| 60.1 |
| 22 |
| 52.1 |
| 19 |
| 3.5 |
| 5 |
| 3.3 |
| 8 |
|
Securitization positions |
| 10.0 |
| 3 |
| 16.1 |
| 5 |
| 10.0 |
| 4 |
| 16.1 |
| 6 |
| — |
| — |
| — |
| — |
|
Total |
| 346.6 |
| 100 |
| 313.6 |
| 100 |
| 276.2 |
| 100 |
| 274.6 |
| 100 |
| 70.4 |
| 100 |
| 39.0 |
| 100 |
|
Credit exposures allocation between IRB-approach and the standardized approach
|
| December 31, 2011 |
| December 31, 2010 |
|
| December 31, 2012 |
| December 31, 2011 |
| ||||||||
Skr billion |
| Net exposures |
| Share |
| Net exposures |
| Share |
| |||||||||
Skr bn |
| Net exposures |
| Share |
| Net exposures |
| Share |
| |||||||||
Standardized approach |
|
|
|
|
|
|
|
|
|
|
|
|
|
|
|
|
|
|
Central governments |
| 13.0 |
| 4 |
| 16.5 |
| 5 |
|
| 9.8 |
| 3 |
| 13.0 |
| 4 |
|
Government export credit agencies |
| 123.1 |
| 39 |
| 123.8 |
| 36 |
|
| 162.0 |
| 47 |
| 123.1 |
| 39 |
|
Regional governments |
| 19.1 |
| 6 |
| 23.7 |
| 7 |
|
| 23.6 |
| 7 |
| 19.1 |
| 6 |
|
Multilateral development banks |
| 0.4 |
| 0 |
| 0.4 |
| 0 |
|
| 0.4 |
| 0 |
| 0.4 |
| 0 |
|
Corporates |
| 0.4 |
| 0 |
| 0.1 |
| 0 |
|
| 0.4 |
| 0 |
| 0.4 |
| 0 |
|
Sum Standardized approach |
| 156.0 |
| 49 |
| 164.5 |
| 48 |
|
| 196.2 |
| 57 |
| 156.0 |
| 49 |
|
IRB method |
|
|
|
|
|
|
|
|
|
|
|
|
|
|
|
|
|
|
Financial institutions |
| 86.5 |
| 28 |
| 114.1 |
| 33 |
|
| 77.2 |
| 22 |
| 86.5 |
| 28 |
|
Corporates |
| 55.0 |
| 18 |
| 43.2 |
| 12 |
|
| 63.2 |
| 18 |
| 55.0 |
| 18 |
|
Securitization positions |
| 16.1 |
| 5 |
| 24.0 |
| 7 |
|
| 10.0 |
| 3 |
| 16.1 |
| 5 |
|
Sum IRB method |
| 157.6 |
| 51 |
| 181.3 |
| 52 |
|
| 150.4 |
| 43 |
| 157.6 |
| 51 |
|
Total |
| 313.6 |
| 100 |
| 345.8 |
| 100 |
|
| 346.6 |
| 100 |
| 313.6 |
| 100 |
|
Credit exposures by region and exposure class
Gross exposure by region and exposure class, as of December 31, 20112012
Skr billion |
| Africa |
| Asia |
| North America |
| Oceania |
| South America |
| Sweden |
| Other Nordic |
| Other |
| Total |
| |||||||||||||||||||
Skr bn |
| Africa |
| Asia |
| North America |
| Oceania |
| South America |
| Sweden |
| Other Nordic |
| Other European |
| Total |
| |||||||||||||||||||
Central governments |
| 0.0 |
| 7.6 |
| — |
| — |
| 0.2 |
| 3.3 |
| 2.5 |
| 1.8 |
| 15.4 |
|
| 0.9 |
| 6.9 |
| — |
| — |
| 30.2 |
| 3.9 |
| 0.8 |
| 0.0 |
| 42.7 |
|
Government export credit agencies |
| 0.7 |
| — |
| — |
| — |
| — |
| — |
| 0.0 |
| — |
| 0.7 |
|
| — |
| — |
| — |
| — |
| — |
| — |
| 0.0 |
| 2.9 |
| 2.9 |
|
Regional governments |
| — |
| — |
| — |
| — |
| — |
| 9.7 |
| 1.3 |
| — |
| 11.0 |
|
| — |
| — |
| — |
| — |
| — |
| 9.9 |
| 1.5 |
| 4.9 |
| 16.3 |
|
Multilateral development banks |
| — |
| — |
| — |
| — |
| — |
| — |
| — |
| 0.0 |
| 0.0 |
|
| — |
| — |
| — |
| — |
| — |
| — |
| — |
| 0.0 |
| 0.0 |
|
Financial institutions |
| 0.6 |
| 1.2 |
| 6.7 |
| 4.4 |
| — |
| 22.0 |
| 10.6 |
| 30.3 |
| 75.8 |
|
| 0.5 |
| 0.9 |
| 9.1 |
| 8.8 |
| — |
| 18.6 |
| 10.1 |
| 22.6 |
| 70.6 |
|
Corporates |
| 2.0 |
| 34.8 |
| 18.6 |
| 0.8 |
| 3.9 |
| 71.1 |
| 17.1 |
| 46.3 |
| 194.6 |
|
| 1.5 |
| 42.4 |
| 24.1 |
| 0.6 |
| 7.6 |
| 71.1 |
| 13.4 |
| 43.4 |
| 204.1 |
|
Securitization positions |
| — |
| — |
| 3.4 |
| 3.6 |
| — |
| — |
| — |
| 9.1 |
| 16.1 |
|
| — |
| — |
| 2.6 |
| 2.5 |
| — |
| — |
| — |
| 4.9 |
| 10.0 |
|
Total |
| 3.3 |
| 43.6 |
| 28.7 |
| 8.8 |
| 4.1 |
| 106.1 |
| 31.5 |
| 87.5 |
| 313.6 |
|
| 2.9 |
| 50.2 |
| 35.8 |
| 11.9 |
| 37.8 |
| 103.5 |
| 25.8 |
| 78.7 |
| 346.6 |
|
Gross exposure by region and exposure class, as of December 31, 2011
Skr bn |
| Africa |
| Asia |
| North America |
| Oceania |
| South America |
| Sweden |
| Other Nordic |
| Other European |
| Total |
|
Central governments |
| 0.0 |
| 7.6 |
| — |
| — |
| 0.2 |
| 3.3 |
| 2.5 |
| 1.8 |
| 15.4 |
|
Government export credit agencies |
| 0.7 |
| — |
| — |
| — |
| — |
| — |
| 0.0 |
| — |
| 0.7 |
|
Regional governments |
| — |
| — |
| — |
| — |
| — |
| 9.7 |
| 1.3 |
| — |
| 11.0 |
|
Multilateral development banks |
| — |
| — |
| — |
| — |
| — |
| — |
| — |
| 0.0 |
| 0.0 |
|
Financial institutions |
| 0.6 |
| 1.2 |
| 6.7 |
| 4.4 |
| — |
| 22.0 |
| 10.6 |
| 30.3 |
| 75.8 |
|
Corporates |
| 2.0 |
| 34.8 |
| 18.6 |
| 0.8 |
| 3.9 |
| 71.1 |
| 17.1 |
| 46.3 |
| 194.6 |
|
Securitization positions |
| — |
| — |
| 3.4 |
| 3.6 |
| — |
| — |
| — |
| 9.1 |
| 16.1 |
|
Total |
| 3.3 |
| 43.6 |
| 28.7 |
| 8.8 |
| 4.1 |
| 106.1 |
| 31.5 |
| 87.5 |
| 313.6 |
|
GrossNet exposure by region and exposure class, as of December 31, 20102012
Skr billion |
| Africa |
| Asia |
| North America |
| Oceania |
| South America |
| Sweden |
| Other Nordic |
| Other |
| Total |
| |||||||||||||||||||
Skr bn |
| Africa |
| Asia |
| North America |
| Oceania |
| South America |
| Sweden |
| Other Nordic |
| Other European |
| Total |
| |||||||||||||||||||
Central governments |
| 0.0 |
| 7.8 |
| — |
| — |
| 0.3 |
| 2.1 |
| 3.6 |
| 6.6 |
| 20.4 |
|
| — |
| — |
| — |
| — |
| — |
| 4.2 |
| 2.0 |
| 3.6 |
| 9.8 |
|
Government export credit agencies |
| — |
| — |
| — |
| — |
| — |
| — |
| 0.0 |
| — |
| 0.0 |
|
| — |
| 0.6 |
| 5.3 |
| — |
| — |
| 140.3 |
| 1.9 |
| 13.9 |
| 162.0 |
|
Regional governments |
| — |
| — |
| — |
| — |
| — |
| 12.9 |
| 1.6 |
| — |
| 14.5 |
|
| — |
| — |
| — |
| — |
| — |
| 17.5 |
| 1.7 |
| 4.4 |
| 23.6 |
|
Multilateral development banks |
| — |
| — |
| — |
| — |
| — |
| — |
| — |
| 0.0 |
| 0.0 |
|
| — |
| — |
| — |
| — |
| — |
| — |
| — |
| 0.4 |
| 0.4 |
|
Financial institutions |
| 0.6 |
| 0.9 |
| 11.7 |
| 5.5 |
| — |
| 31.8 |
| 12.2 |
| 36.1 |
| 98.8 |
|
| — |
| 1.0 |
| 11.9 |
| 8.8 |
| — |
| 13.6 |
| 13.6 |
| 28.3 |
| 77.2 |
|
Corporates |
| 2.2 |
| 26.7 |
| 20.5 |
| 0.9 |
| 3.9 |
| 68.2 |
| 17.6 |
| 46.7 |
| 186.7 |
|
| 0.3 |
| 3.7 |
| 3.1 |
| 0.1 |
| 2.3 |
| 40.6 |
| 6.2 |
| 7.3 |
| 63.6 |
|
Securitization positions |
| — |
| 0.0 |
| 4.3 |
| 4.6 |
| — |
| — |
| — |
| 16.5 |
| 25.4 |
|
| — |
| 0.0 |
| 2.6 |
| 2.5 |
| — |
| — |
| — |
| 4.9 |
| 10.0 |
|
Total |
| 2.8 |
| 35.4 |
| 36.5 |
| 11.0 |
| 4.2 |
| 115.0 |
| 35.0 |
| 105.9 |
| 345.8 |
|
| 0.3 |
| 5.3 |
| 22.9 |
| 11.4 |
| 2.3 |
| 216.2 |
| 25.4 |
| 62.8 |
| 346.6 |
|
Net exposure by region and exposure class, as of December 31, 2011
Skr billion |
| Africa |
| Asia |
| North America |
| Oceania |
| South America |
| Sweden |
| Other Nordic |
| Other |
| Total |
|
Central governments |
| — |
| 0.7 |
| — |
| — |
| — |
| 3.9 |
| 2.5 |
| 5.9 |
| 13.0 |
|
Government export credit agencies |
| — |
| — |
| 6.4 |
| — |
| — |
| 99.2 |
| 2.4 |
| 15.1 |
| 123.1 |
|
Regional governments |
| — |
| — |
| — |
| — |
| — |
| 17.5 |
| 1.6 |
| — |
| 19.1 |
|
Multilateral development banks |
| — |
| — |
| — |
| — |
| — |
| — |
| — |
| 0.4 |
| 0.4 |
|
Financial institutions |
| — |
| 0.8 |
| 9.7 |
| 4.4 |
| — |
| 19.1 |
| 13.3 |
| 39.2 |
| 86.5 |
|
Corporates |
| — |
| 1.6 |
| 0.5 |
| — |
| 0.2 |
| 39.1 |
| 9.0 |
| 5.0 |
| 55.4 |
|
Securitization positions |
| — |
| — |
| 3.4 |
| 3.6 |
| — |
| — |
| — |
| 9.1 |
| 16.1 |
|
Total |
| — |
| 3.1 |
| 20.0 |
| 8.0 |
| 0.2 |
| 178.8 |
| 28.8 |
| 74.7 |
| 313.6 |
|
Net exposure by region and exposure class, as of December 31, 2010
Skr billion |
| Africa |
| Asia |
| North America |
| Oceania |
| South America |
| Sweden |
| Other Nordic |
| Other |
| Total |
| |||||||||||||||||||
Skr bn |
| Africa |
| Asia |
| North America |
| Oceania |
| South America |
| Sweden |
| Other Nordic |
| Other European |
| Total |
| |||||||||||||||||||
Central governments |
| — |
| — |
| — |
| — |
| — |
| 2.9 |
| 3.6 |
| 10.0 |
| 16.5 |
|
| — |
| 0.7 |
| — |
| — |
| — |
| 3.9 |
| 2.5 |
| 5.9 |
| 13.0 |
|
Government export credit agencies |
| — |
| — |
| 8.4 |
| — |
| — |
| 96.2 |
| 1.5 |
| 17.7 |
| 123.8 |
|
| — |
| — |
| 6.4 |
| — |
| — |
| 99.2 |
| 2.4 |
| 15.1 |
| 123.1 |
|
Regional governments |
| — |
| — |
| — |
| — |
| — |
| 21.8 |
| 1.9 |
| — |
| 23.7 |
|
| — |
| — |
| — |
| — |
| — |
| 17.5 |
| 1.6 |
| — |
| 19.1 |
|
Multilateral development banks |
| — |
| — |
| — |
| — |
| — |
| — |
| — |
| 0.4 |
| 0.4 |
|
| — |
| — |
| — |
| — |
| — |
| — |
| — |
| 0.4 |
| 0.4 |
|
Financial institutions |
| — |
| 0.7 |
| 17.5 |
| 5.5 |
| — |
| 29.0 |
| 13.0 |
| 48.4 |
| 114.1 |
|
| — |
| 0.8 |
| 9.7 |
| 4.4 |
| — |
| 19.1 |
| 13.3 |
| 39.2 |
| 86.5 |
|
Corporates |
| — |
| 0.6 |
| 1.4 |
| — |
| 0.1 |
| 28.9 |
| 7.3 |
| 5.0 |
| 43.3 |
|
| — |
| 1.6 |
| 0.5 |
| — |
| 0.2 |
| 39.1 |
| 9.0 |
| 5.0 |
| 55.4 |
|
Securitization positions |
| — |
| 0.0 |
| 4.4 |
| 4.6 |
| — |
| — |
| — |
| 15.0 |
| 24.0 |
|
| — |
| — |
| 3.4 |
| 3.6 |
| — |
| — |
| — |
| 9.1 |
| 16.1 |
|
Total |
| — |
| 1.3 |
| 31.7 |
| 10.1 |
| 0.1 |
| 178.8 |
| 27.3 |
| 96.5 |
| 345.8 |
|
| — |
| 3.1 |
| 20.0 |
| 8.0 |
| 0.2 |
| 178.8 |
| 28.8 |
| 74.7 |
| 313.6 |
|
Credit exposures to European countries, countries by exposure class and risk mitigation method
In light of the ongoing European sovereign debt crisis, the tables below aim to describe SEK’s exposures to European countries. The effects of the crisis are observed and analyzed using scenario analyses as part of the internal capital adequacy assessment (ICAAP), described in note 30, Risk and Capital management.Note 31. In order to avoid refinancing risk, it is SEK’s policy states that for all credit commitments —- outstanding credits andas well as agreed, but undisbursed credits —- there must be fundedfunding available through maturity. For CIRR credits, which SEK manages on behalf of the Swedish state, when evaluating whether it has positive availability the company counts its credit facility with the Swedish National Debt Office, which entitles it to maturity and SEK therefore does not hold any unfunded exposures.draw on funding with a tenor of up to 10 years, as available funding, despite the fact that no funds have been drawn under this facility. SEK ensures that it does not purchase credit derivatives (CDSs) with shorter maturities than the assets whose risk the credit derivatives are intended to mitigate. The first column of the risk mitigation tables shows gross exposures, i.e. exposures excluding guarantees and credit risk derivatives, for respective countries. The next two columns show outgoing risk mitigation, in the form of guarantees and credit risk derivatives. Outgoing risk mitigation results in a decrease in the exposure in the respective country as the original gross exposure is transferred to another country by means of risk mitigation. Additional risk mitigation means that an exposure, in the form of guarantees and credit risk derivatives, increases in the respective country as a result of including credit protection that is not reflected in the gross exposure. Additional risk mitigation results in increased exposure to the respective country. Figures in the column for net exposures, i.e. exposures after including guarantees and credit risk derivatives, are the sum of gross exposure, outgoing risk mitigation and additional risk mitigation, for the respective country.
Gross and net exposures European countries, excluding Nordic countries by risk mitigation method, as of December 31, 20112012
|
|
|
| Outgoing risk mitigation |
| Additional risk mitigation |
|
|
|
|
|
| Outgoing risk mitigation |
| Additional risk mitigation |
|
|
| ||||||||
Skr billion |
| Gross exposure |
| Guarantee |
| CDS |
| Guarantee |
| CDS |
| Net exposure |
| |||||||||||||
Skr bn |
| Gross exposure |
| Guarantee |
| CDS |
| Guarantee |
| CDS |
| Net exposure |
| |||||||||||||
United Kingdom |
|
|
|
|
|
|
|
|
|
|
|
|
|
|
|
|
|
|
|
|
|
|
|
|
|
|
Sovereign |
| — |
| — |
| — |
| 4.9 |
| — |
| 4.9 |
|
| — |
| — |
| — |
| 3.1 |
| — |
| 3.1 |
|
Non-sovereign |
| 18.4 |
| -4.5 |
| -1.9 |
| 0.4 |
| 4.7 |
| 17.1 |
|
| 12.3 |
| -3.5 |
| -1.1 |
| 1.0 |
| 3.8 |
| 12.5 |
|
France |
|
|
|
|
|
|
|
|
|
|
|
|
|
|
|
|
|
|
|
|
|
|
|
|
|
|
Sovereign |
| — |
| — |
| — |
| 3.5 |
| — |
| 3.5 |
|
| — |
| — |
| — |
| 2.9 |
| 0.0 |
| 2.9 |
|
Non-sovereign |
| 8.0 |
| -4.2 |
| — |
| 0.4 |
| 3.7 |
| 7.9 |
|
| 5.4 |
| -3.8 |
| — |
| 0.3 |
| 2.2 |
| 4.1 |
|
Germany |
|
|
|
|
|
|
|
|
|
|
|
|
|
|
|
|
|
|
|
|
|
|
|
|
|
|
Sovereign |
| 1.3 |
| — |
| — |
| 6.7 |
| — |
| 8.0 |
|
| 5.4 |
| — |
| — |
| 4.5 |
| 0.0 |
| 9.9 |
|
Non-sovereign |
| 5.3 |
| -1.5 |
| -0.3 |
| 0.5 |
| 1.7 |
| 5.7 |
|
| 1.7 |
| — |
| — |
| 1.1 |
| 1.1 |
| 3.9 |
|
The Netherlands |
|
|
|
|
|
|
|
|
|
|
|
|
|
|
|
|
|
|
|
|
|
|
|
|
|
|
Sovereign |
| — |
| — |
| — |
| — |
| — |
| — |
|
| — |
| — |
| — |
| — |
| — |
| — |
|
Non-sovereign |
| 7.3 |
| -0.3 |
| — |
| 1.1 |
| — |
| 8.1 |
|
| 11.2 |
| -1.6 |
| -0.3 |
| 0.2 |
| — |
| 9.5 |
|
Belgium |
|
|
|
|
|
|
|
|
|
|
|
|
|
|
|
|
|
|
|
|
|
|
|
|
|
|
Sovereign |
| — |
| — |
| — |
| — |
| — |
| — |
|
| — |
| — |
| — |
| — |
| — |
| — |
|
Non-sovereign |
| 2.0 |
| -0.2 |
| — |
| 0.0 |
| — |
| 1.8 |
|
| 0.3 |
| — |
| — |
| 0.0 |
| — |
| 0.3 |
|
Ireland |
|
|
|
|
|
|
|
|
|
|
|
|
|
|
|
|
|
|
|
|
|
|
|
|
|
|
Sovereign |
| — |
| — |
| — |
| — |
| — |
| — |
|
| — |
| — |
| — |
| — |
| — |
| — |
|
Non-sovereign |
| 5.9 |
| -1.6 |
| — |
| — |
| — |
| 4.3 |
|
| 4.9 |
| -1.4 |
| -0.6 |
| — |
| — |
| 2.9 |
|
Spain |
|
|
|
|
|
|
|
|
|
|
|
|
|
|
|
|
|
|
|
|
|
|
|
|
|
|
Sovereign |
| — |
| — |
| — |
| — |
| — |
| — |
|
| — |
| — |
| — |
| — |
| — |
| — |
|
Non-sovereign |
| 10.7 |
| -7.6 |
| — |
| — |
| 0.2 |
| 3.3 |
|
| 9.5 |
| -6.6 |
| — |
| 0.1 |
| 0.1 |
| 3.1 |
|
Poland |
|
|
|
|
|
|
|
|
|
|
|
|
|
|
|
|
|
|
|
|
|
|
|
|
|
|
Sovereign |
| — |
| — |
| — |
| 3.1 |
| — |
| 3.1 |
|
| — |
| — |
| — |
| 3.0 |
| — |
| 3.0 |
|
Non-sovereign |
| 3.1 |
| -3.1 |
| — |
| — |
| — |
| — |
|
| 3.0 |
| -3.0 |
| — |
| — |
| — |
| — |
|
Switzerland |
|
|
|
|
|
|
|
|
|
|
|
|
|
|
|
|
|
|
|
|
|
|
|
|
|
|
Sovereign |
| — |
| — |
| — |
| 0.1 |
| — |
| 0.1 |
|
| — |
| — |
| — |
| 0.0 |
| — |
| 0.0 |
|
Non-sovereign |
| 2.0 |
| — |
| -0.2 |
| 0.0 |
| 1.4 |
| 3.2 |
|
| — |
| — |
| — |
| 0.4 |
| — |
| 0.4 |
|
Italy |
|
|
|
|
|
|
|
|
|
|
|
|
|
|
|
|
|
|
|
|
|
|
|
|
|
|
Sovereign |
| — |
| — |
| — |
| 0.9 |
| — |
| 0.9 |
|
| — |
| — |
| — |
| 0.6 |
| — |
| 0.6 |
|
Non-sovereign |
| 3.2 |
| -3.2 |
| — |
| — |
| — |
| — |
|
| 2.9 |
| -2.9 |
| — |
| 0.1 |
| — |
| 0.1 |
|
Portugal |
|
|
|
|
|
|
|
|
|
|
|
|
|
|
|
|
|
|
|
|
|
|
|
|
|
|
Sovereign |
| 0.5 |
| -0.5 |
| — |
| 0.5 |
| — |
| 0.5 |
|
| — |
| — |
| — |
| 0.4 |
| — |
| 0.4 |
|
Non-sovereign |
| 0.3 |
| — |
| — |
| 0.0 |
| — |
| 0.3 |
|
| 0.5 |
| -0.4 |
| — |
| — |
| — |
| 0.1 |
|
Turkey |
|
|
|
|
|
|
|
|
|
|
|
|
|
|
|
|
|
|
|
|
|
|
|
|
|
|
Sovereign |
| 0.0 |
| — |
| — |
| — |
| — |
| — |
|
| 0.6 |
| -0.6 |
| — |
| — |
| — |
| — |
|
Non-sovereign |
| 5.6 |
| -5.6 |
| — |
| — |
| — |
| — |
|
| 4.4 |
| -3.8 |
| — |
| — |
| — |
| 0.6 |
|
Russia |
|
|
|
|
|
|
|
|
|
|
|
|
|
|
|
|
|
|
|
|
|
|
|
|
|
|
Sovereign |
| — |
| — |
| — |
| — |
| — |
| — |
|
| — |
| — |
| — |
| — |
| — |
| — |
|
Non-sovereign |
| 11.4 |
| -11.4 |
| — |
| — |
| — |
| 0.0 |
|
| 10.7 |
| -10.7 |
| — |
| — |
| — |
| 0.0 |
|
Greece |
|
|
|
|
|
|
|
|
|
|
|
|
|
|
|
|
|
|
|
|
|
|
|
|
|
|
Sovereign |
| — |
| — |
| — |
| — |
| — |
| — |
|
| — |
| — |
| — |
| — |
| — |
| — |
|
Non-sovereign |
| — |
| — |
| — |
| — |
| — |
| — |
|
| 0.1 |
| -0.1 |
| — |
| — |
| — |
| — |
|
Austria |
|
|
|
|
|
|
|
|
|
|
|
|
| |||||||||||||
Sovereign |
| 0.2 |
| — |
| — |
| — |
| — |
| 0.2 |
| |||||||||||||
Non-sovereign |
| 1.3 |
| — |
| — |
| 0.0 |
| — |
| 1.3 |
| |||||||||||||
Luxembourg |
|
|
|
|
|
|
|
|
|
|
|
|
| |||||||||||||
Sovereign |
| 1.7 |
| — |
| — |
| 0.5 |
| — |
| 2.2 |
| |||||||||||||
Non-sovereign |
| 0.6 |
| -0.1 |
| — |
| — |
| — |
| 0.5 |
| |||||||||||||
Other countries |
|
|
|
|
|
|
|
|
|
|
|
|
|
|
|
|
|
|
|
|
|
|
|
|
|
|
Sovereign |
| 0.0 |
| — |
| — |
| 0.4 |
| — |
| 0.4 |
|
| 0.0 |
| 0.0 |
| — |
| — |
| — |
| 0.0 |
|
Non-sovereign |
| 2.5 |
| -0.9 |
| — |
| 0.0 |
| — |
| 1.6 |
|
| 2.0 |
| -0.6 |
| -0.2 |
| 0.0 |
| — |
| 1.2 |
|
Total |
| 87.5 |
| -44.6 |
| -2.4 |
| 22.5 |
| 11.7 |
| 74.7 |
|
| 78.7 |
| -39.1 |
| -2.2 |
| 18.2 |
| 7.2 |
| 62.8 |
|
Gross and net exposures European countries, excluding Nordic countries by risk mitigation method, as of December 31, 20102011
|
|
|
| Outgoing risk mitigation |
| Additional risk mitigation |
|
|
|
|
|
| Outgoing risk mitigation |
| Additional risk mitigation |
|
|
| ||||||||
Skr billion |
| Gross exposure |
| Guarantee |
| CDS |
| Guarantee |
| CDS |
| Net exposure |
| |||||||||||||
Skr bn |
| Gross exposure |
| Guarantee |
| CDS |
| Guarantee |
| CDS |
| Net exposure |
| |||||||||||||
United Kingdom |
|
|
|
|
|
|
|
|
|
|
|
|
|
|
|
|
|
|
|
|
|
|
|
|
|
|
Sovereign |
| — |
| — |
| — |
| 6.4 |
| — |
| 6.4 |
|
| — |
| — |
| — |
| 4.9 |
| — |
| 4.9 |
|
Non-sovereign |
| 25.8 |
| -6.1 |
| -2.0 |
| 0.5 |
| 7.4 |
| 25.6 |
|
| 18.4 |
| -4.5 |
| -1.9 |
| 0.4 |
| 4.7 |
| 17.1 |
|
France |
|
|
|
|
|
|
|
|
|
|
|
|
|
|
|
|
|
|
|
|
|
|
|
|
|
|
Sovereign |
| 0.1 |
| — |
| — |
| 4.0 |
| — |
| 4.1 |
|
| — |
| — |
| — |
| 3.5 |
| — |
| 3.5 |
|
Non-sovereign |
| 10.2 |
| -3.2 |
| — |
| 0.4 |
| 4.4 |
| 11.8 |
|
| 8.0 |
| -4.2 |
| — |
| 0.4 |
| 3.7 |
| 7.9 |
|
Germany |
|
|
|
|
|
|
|
|
|
|
|
|
|
|
|
|
|
|
|
|
|
|
|
|
|
|
Sovereign |
| 0.6 |
| — |
| — |
| 7.1 |
| — |
| 7.7 |
|
| 1.3 |
| — |
| — |
| 6.7 |
| — |
| 8.0 |
|
Non-sovereign |
| 5.2 |
| -1.3 |
| -0.3 |
| 0.5 |
| 2.0 |
| 6.1 |
|
| 5.3 |
| -1.5 |
| -0.3 |
| 0.5 |
| 1.7 |
| 5.7 |
|
The Netherlands |
|
|
|
|
|
|
|
|
|
|
|
|
|
|
|
|
|
|
|
|
|
|
|
|
|
|
Sovereign |
| — |
| — |
| — |
| — |
| — |
| — |
|
| — |
| — |
| — |
| — |
| — |
| — |
|
Non-sovereign |
| 8.3 |
| -0.4 |
| — |
| 1.1 |
| — |
| 9.0 |
|
| 7.3 |
| -0.3 |
| — |
| 1.1 |
| — |
| 8.1 |
|
Belgium |
|
|
|
|
|
|
|
|
|
|
|
|
|
|
|
|
|
|
|
|
|
|
|
|
|
|
Sovereign |
| 4.5 |
| — |
| — |
| — |
| — |
| 4.5 |
|
| — |
| — |
| — |
| — |
| — |
| — |
|
Non-sovereign |
| 3.7 |
| — |
| — |
| — |
| — |
| 3.7 |
|
| 2.0 |
| -0.2 |
| — |
| 0.0 |
| — |
| 1.8 |
|
Ireland |
|
|
|
|
|
|
|
|
|
|
|
|
|
|
|
|
|
|
|
|
|
|
|
|
|
|
Sovereign |
| 0.9 |
| — |
| — |
| — |
| — |
| 0.9 |
|
| — |
| — |
| — |
| — |
| — |
| — |
|
Non-sovereign |
| 6.1 |
| -2.3 |
| -1.5 |
| 0.5 |
| — |
| 2.8 |
|
| 5.9 |
| -1.6 |
| — |
| — |
| — |
| 4.3 |
|
Spain |
|
|
|
|
|
|
|
|
|
|
|
|
|
|
|
|
|
|
|
|
|
|
|
|
|
|
Sovereign |
| — |
| — |
| — |
| — |
| — |
| — |
|
| — |
| — |
| — |
| — |
| — |
| — |
|
Non-sovereign |
| 11.1 |
| -7.3 |
| -0.3 |
| — |
| — |
| 3.5 |
|
| 10.7 |
| -7.6 |
| — |
| — |
| 0.2 |
| 3.3 |
|
Poland |
|
|
|
|
|
|
|
|
|
|
|
|
|
|
|
|
|
|
|
|
|
|
|
|
|
|
Sovereign |
| — |
| — |
| — |
| 2.5 |
| — |
| 2.5 |
|
| — |
| — |
| — |
| 3.1 |
| — |
| 3.1 |
|
Non-sovereign |
| 3.1 |
| -2.5 |
| — |
| — |
| — |
| 0.6 |
|
| 3.1 |
| -3.1 |
| — |
| — |
| — |
| — |
|
Switzerland |
|
|
|
|
|
|
|
|
|
|
|
|
|
|
|
|
|
|
|
|
|
|
|
|
|
|
Sovereign |
| — |
| — |
| — |
| 0.1 |
| — |
| 0.1 |
|
| — |
| — |
| — |
| 0.1 |
| — |
| 0.1 |
|
Non-sovereign |
| 2.0 |
| — |
| -0.7 |
| — |
| 1.3 |
| 2.6 |
|
| 2.0 |
| — |
| -0.2 |
| 0.0 |
| 1.4 |
| 3.2 |
|
Italy |
|
|
|
|
|
|
|
|
|
|
|
|
|
|
|
|
|
|
|
|
|
|
|
|
|
|
Sovereign |
| — |
| — |
| — |
| 1.0 |
| — |
| 1.0 |
|
| — |
| — |
| — |
| 0.9 |
| — |
| 0.9 |
|
Non-sovereign |
| 4.1 |
| -3.4 |
| — |
| — |
| — |
| 0.7 |
|
| 3.2 |
| -3.2 |
| — |
| — |
| — |
| — |
|
Portugal |
|
|
|
|
|
|
|
|
|
|
|
|
|
|
|
|
|
|
|
|
|
|
|
|
|
|
Sovereign |
| 0.5 |
| -0.5 |
| — |
| 0.5 |
| — |
| 0.5 |
|
| 0.5 |
| -0.5 |
| — |
| 0.5 |
| — |
| 0.5 |
|
Non-sovereign |
| 0.4 |
| — |
| — |
| — |
| — |
| 0.4 |
|
| 0.3 |
| — |
| — |
| 0.0 |
| — |
| 0.3 |
|
Turkey |
|
|
|
|
|
|
|
|
|
|
|
|
|
|
|
|
|
|
|
|
|
|
|
|
|
|
Sovereign |
| — |
| — |
| — |
| — |
| — |
| — |
|
| — |
| — |
| — |
| — |
| — |
| — |
|
Non-sovereign |
| 6.3 |
| -6.3 |
| — |
| — |
| — |
| — |
|
| 5.6 |
| -5.6 |
| — |
| — |
| — |
| — |
|
Russia |
|
|
|
|
|
|
|
|
|
|
|
|
|
|
|
|
|
|
|
|
|
|
|
|
|
|
Sovereign |
| — |
| — |
| — |
| — |
| — |
| — |
|
| — |
| — |
| — |
| — |
| — |
| — |
|
Non-sovereign |
| 10.8 |
| -10.7 |
| — |
| — |
| — |
| 0.1 |
|
| 11.4 |
| -11.4 |
| — |
| — |
| — |
| 0.0 |
|
Greece |
|
|
|
|
|
|
|
|
|
|
|
|
|
|
|
|
|
|
|
|
|
|
|
|
|
|
Sovereign |
| — |
| — |
| — |
| — |
| — |
| — |
|
| — |
| — |
| — |
| — |
| — |
| — |
|
Non-sovereign |
| — |
| — |
| — |
| — |
| — |
| — |
|
| — |
| — |
| — |
| — |
| — |
| — |
|
Austria |
|
|
|
|
|
|
|
|
|
|
|
|
| |||||||||||||
Sovereign |
| — |
| — |
| — |
| — |
| — |
| — |
| |||||||||||||
Non-sovereign |
| 0.5 |
| — |
| — |
| 0.0 |
| — |
| 0.5 |
| |||||||||||||
Luxembourg |
|
|
|
|
|
|
|
|
|
|
|
|
| |||||||||||||
Sovereign |
| — |
| — |
| — |
| 0.4 |
| — |
| 0.4 |
| |||||||||||||
Non-sovereign |
| 0.3 |
| -0.2 |
| — |
| — |
| — |
| 0.1 |
| |||||||||||||
Other countries |
|
|
|
|
|
|
|
|
|
|
|
|
|
|
|
|
|
|
|
|
|
|
|
|
|
|
Sovereign |
| 0.0 |
| — |
| — |
| 0.4 |
| — |
| 0.4 |
|
| 0.0 |
| — |
| — |
| — |
| — |
| 0.0 |
|
Non-sovereign |
| 2.2 |
| -0.9 |
| — |
| 0.2 |
| — |
| 1.5 |
|
| 1.7 |
| -0.7 |
| — |
| 0.0 |
| — |
| 1.0 |
|
Total |
| 105.9 |
| -44.9 |
| -4.8 |
| 25.2 |
| 15.1 |
| 96.5 |
|
| 87.5 |
| -44.6 |
| -2.4 |
| 22.5 |
| 11.7 |
| 74.7 |
|
Gross and net exposures Nordic countries by risk mitigation, as of December 31, 20112012
|
|
|
| Outgoing risk mitigation |
| Additional risk mitigation |
|
|
|
|
|
| Outgoing risk mitigation |
| Additional risk mitigation |
|
|
| ||||||||
Skr billion |
| Gross exposure |
| Guarantee |
| CDS |
| Guarantee |
| CDS |
| Net exposure |
| |||||||||||||
Skr bn |
| Gross exposure |
| Guarantee |
| CDS |
| Guarantee |
| CDS |
| Net exposure |
| |||||||||||||
Sweden |
|
|
|
|
|
|
|
|
|
|
|
|
|
|
|
|
|
|
|
|
|
|
|
|
|
|
Sovereign |
| 13.0 |
| — |
| — |
| 107.6 |
| — |
| 120.6 |
|
| 13.8 |
| — |
| — |
| 148.2 |
| — |
| 162.0 |
|
Non-sovereign |
| 93.1 |
| -34.1 |
| -12.2 |
| 7.5 |
| 3.9 |
| 58.2 |
|
| 89.7 |
| -31.4 |
| -5.9 |
| 1.8 |
| 0.0 |
| 54.2 |
|
Norway |
|
|
|
|
|
|
|
|
|
|
|
|
|
|
|
|
|
|
|
|
|
|
|
|
|
|
Sovereign |
| — |
| — |
| — |
| 0.7 |
| — |
| 0.7 |
|
| — |
| — |
| — |
| 0.6 |
| — |
| 0.6 |
|
Non-sovereign |
| 5.0 |
| 0.0 |
| -0.9 |
| 1.3 |
| — |
| 5.4 |
|
| 4.5 |
| 0.0 |
| -0.9 |
| 1.3 |
| — |
| 4.9 |
|
Finland |
|
|
|
|
|
|
|
|
|
|
|
|
|
|
|
|
|
|
|
|
|
|
|
|
|
|
Sovereign |
| 2.3 |
| -1.1 |
| — |
| 2.8 |
| — |
| 4.0 |
|
| 0.9 |
| — |
| — |
| 2.0 |
| — |
| 2.9 |
|
Non-sovereign |
| 15.5 |
| -3.0 |
| -3.3 |
| 0.4 |
| — |
| 9.6 |
|
| 11.1 |
| -3.6 |
| -1.5 |
| 0.3 |
| 0.6 |
| 6.9 |
|
Iceland |
|
|
|
|
|
|
|
|
|
|
|
|
|
|
|
|
|
|
|
|
|
|
|
|
|
|
Sovereign |
| 0.5 |
| — |
| — |
| — |
| — |
| 0.5 |
|
| — |
| — |
| — |
| 0.5 |
| — |
| 0.5 |
|
Non-sovereign |
| 0.5 |
| -0.3 |
| — |
| — |
| — |
| 0.2 |
|
| 1.0 |
| -0.8 |
| — |
| — |
| — |
| 0.2 |
|
Denmark |
|
|
|
|
|
|
|
|
|
|
|
|
|
|
|
|
|
|
|
|
|
|
|
|
|
|
Sovereign |
| 1.0 |
| — |
| — |
| 0.3 |
| — |
| 1.3 |
|
| 1.4 |
| — |
| — |
| 0.2 |
| — |
| 1.6 |
|
Non-sovereign |
| 6.7 |
| -0.3 |
| -0.3 |
| 0.7 |
| 0.3 |
| 7.1 |
|
| 6.9 |
| — |
| -0.3 |
| 1.0 |
| 0.2 |
| 7.8 |
|
Total |
| 137.6 |
| -38.8 |
| -16.7 |
| 121.3 |
| 4.2 |
| 207.6 |
|
| 129.3 |
| -35.8 |
| -8.6 |
| 155.9 |
| 0.8 |
| 241.6 |
|
Gross and net exposures Nordic countries by risk mitigation, as of December 31, 20102011
|
|
|
| Outgoing risk mitigation |
| Additional risk mitigation |
|
|
|
|
|
| Outgoing risk mitigation |
| Additional risk mitigation |
|
|
| ||||||||
Skr billion |
| Gross exposure |
| Guarantee |
| CDS |
| Guarantee |
| CDS |
| Net exposure |
| |||||||||||||
Skr bn |
| Gross exposure |
| Guarantee |
| CDS |
| Guarantee |
| CDS |
| Net exposure |
| |||||||||||||
Sweden |
|
|
|
|
|
|
|
|
|
|
|
|
|
|
|
|
|
|
|
|
|
|
|
|
|
|
Sovereign |
| 15.0 |
| — |
| — |
| 105.9 |
| — |
| 120.9 |
|
| 13.0 |
| — |
| — |
| 107.6 |
| — |
| 120.6 |
|
Non-sovereign |
| 100.0 |
| -38.3 |
| -14.7 |
| 6 |
| 4.9 |
| 57.9 |
|
| 93.1 |
| -34.1 |
| -12.2 |
| 7.5 |
| 3.9 |
| 58.2 |
|
Norway |
|
|
|
|
|
|
|
|
|
|
|
|
|
|
|
|
|
|
|
|
|
|
|
|
|
|
Sovereign |
| — |
| — |
| — |
| — |
| — |
| — |
|
| — |
| — |
| — |
| 0.7 |
| — |
| 0.7 |
|
Non-sovereign |
| 4.8 |
| 0.0 |
| -1.1 |
| — |
| — |
| 3.7 |
|
| 5.0 |
| 0.0 |
| -0.9 |
| 1.3 |
| — |
| 5.4 |
|
Finland |
|
|
|
|
|
|
|
|
|
|
|
|
|
|
|
|
|
|
|
|
|
|
|
|
|
|
Sovereign |
| 3.9 |
| -1.3 |
| — |
| 2.8 |
| — |
| 5.4 |
|
| 2.3 |
| -1.1 |
| — |
| 2.8 |
| — |
| 4.0 |
|
Non-sovereign |
| 18.1 |
| -3.0 |
| -5.8 |
| 0.0 |
| — |
| 9.3 |
|
| 15.5 |
| -3.0 |
| -3.3 |
| 0.4 |
| — |
| 9.6 |
|
Iceland |
|
|
|
|
|
|
|
|
|
|
|
|
|
|
|
|
|
|
|
|
|
|
|
|
|
|
Sovereign |
| 0.5 |
| — |
| — |
| — |
| — |
| 0.5 |
|
| 0.5 |
| — |
| — |
| — |
| — |
| 0.5 |
|
Non-sovereign |
| 0.2 |
| — |
| — |
| — |
| — |
| 0.2 |
|
| 0.5 |
| -0.3 |
| — |
| — |
| — |
| 0.2 |
|
Denmark |
|
|
|
|
|
|
|
|
|
|
|
|
|
|
|
|
|
|
|
|
|
|
|
|
|
|
Sovereign |
| 0.8 |
| — |
| — |
| 0.3 |
| — |
| 1.1 |
|
| 1.0 |
| — |
| — |
| 0.3 |
| — |
| 1.3 |
|
Non-sovereign |
| 6.7 |
| — |
| -0.4 |
| 0.5 |
| 0.3 |
| 7.1 |
|
| 6.7 |
| -0.3 |
| -0.3 |
| 0.7 |
| 0.3 |
| 7.1 |
|
Total |
| 150.0 |
| -42.6 |
| -22.0 |
| 115.5 |
| 5.2 |
| 206.1 |
|
| 137.6 |
| -38.8 |
| -16.7 |
| 121.3 |
| 4.2 |
| 207.6 |
|
Sovereign consists of central governments, government export credit agencies, regional governments and multilateral development banks. Non-sovereign consists of financial institutions, corporatescorporate and securitization positions.
AB SVENSK EXPORTKREDIT (Swedish Export Credit Corporation)
Gross exposures European countries, excluding Nordic countries by exposure classes, as of December 31, 2012
Skr bn |
| Central governments |
| Government export |
| Regional governments |
| Multilateral development |
| Financial |
| Corporates |
| Securitization positions |
| Total |
|
United Kingdom |
| — |
| — |
| — |
| — |
| 6.0 |
| 5.7 |
| 0.6 |
| 12.3 |
|
The Netherlands |
| — |
| — |
| — |
| — |
| 8.7 |
| 1.8 |
| 0.7 |
| 11.2 |
|
Russia |
| — |
| — |
| — |
| — |
|
|
| 10.7 |
| — |
| 10.7 |
|
Spain |
| — |
| — |
| — |
| — |
| 0.1 |
| 8.4 |
| 1.0 |
| 9.5 |
|
Germany |
| — |
| 1.0 |
| 4.3 |
| — |
| 1.6 |
| 0.2 |
| — |
| 7.1 |
|
France |
| — |
| — |
| — |
| — |
| 3.7 |
| 1.7 |
| — |
| 5.4 |
|
Turkey |
| — |
| — |
| 0.6 |
| — |
| — |
| 4.4 |
| — |
| 5.0 |
|
Ireland |
| — |
| — |
| — |
| — |
| 0.6 |
| 1.8 |
| 2.5 |
| 4.9 |
|
Poland |
| — |
| — |
| — |
| — |
| — |
| 3.0 |
| — |
| 3.0 |
|
Italy |
| — |
| — |
| — |
| — |
| — |
| 2.9 |
| — |
| 2.9 |
|
Luxembourg |
| — |
| 1.7 |
| — |
| 0.0 |
| 0.1 |
| 0.5 |
| — |
| 2.3 |
|
Austria |
| — |
| 0.2 |
| — |
| — |
| 1.3 |
| 0.0 |
| — |
| 1.5 |
|
Portugal |
| — |
| — |
| — |
| — |
| — |
| 0.4 |
| 0.1 |
| 0.5 |
|
Belgium |
| — |
| — |
| — |
| — |
| — |
| 0.3 |
| — |
| 0.3 |
|
Greece |
| — |
| — |
| — |
| — |
| — |
| 0.1 |
| — |
| 0.1 |
|
Switzerland |
| — |
| — |
| — |
| — |
| — |
| — |
| — |
| — |
|
Other countries |
| 0.0 |
| — |
| — |
| — |
| 0.5 |
| 1.5 |
| — |
| 2.0 |
|
Total |
| 0.0 |
| 2.9 |
| 4.9 |
| 0.0 |
| 22.6 |
| 43.4 |
| 4.9 |
| 78.7 |
|
Gross exposures European countries, excluding Nordic countries by exposure classes, as of December 31, 2011
Skr billion |
| Central governments |
| Government |
| Regional |
| Multilateral development |
| Financial |
| Corporates |
| Securitization positions |
| Total |
|
United Kingdom |
| — |
| — |
| — |
| — |
| 8.9 |
| 6.3 |
| 3.2 |
| 18.4 |
|
Russia |
| — |
| — |
| — |
| — |
| 0.0 |
| 11.4 |
| — |
| 11.4 |
|
Spain |
| — |
| — |
| — |
| — |
| 0.5 |
| 8.9 |
| 1.3 |
| 10.7 |
|
France |
| — |
| — |
| — |
| — |
| 6.1 |
| 1.9 |
| 0.0 |
| 8.0 |
|
The Netherlands |
| — |
| — |
| — |
| — |
| 5.1 |
| 1.3 |
| 0.9 |
| 7.3 |
|
Germany |
| 1.3 |
| — |
| — |
| — |
| 4.7 |
| 0.6 |
| — |
| 6.6 |
|
Ireland |
| — |
| — |
| — |
| — |
| 1.3 |
| 2.0 |
| 2.6 |
| 5.9 |
|
Turkey |
| — |
| — |
| — |
| — |
| 0.1 |
| 5.5 |
| — |
| 5.6 |
|
Italy |
| — |
| — |
| — |
| — |
| — |
| 3.2 |
| — |
| 3.2 |
|
Poland |
| — |
| — |
| — |
| — |
| — |
| 3.1 |
| — |
| 3.1 |
|
Switzerland |
| — |
| — |
| — |
| — |
| 1.7 |
| 0.3 |
| — |
| 2.0 |
|
Belgium |
| — |
| — |
| — |
| — |
| 0.9 |
| 0.3 |
| 0.8 |
| 2.0 |
|
Portugal |
| 0.5 |
| — |
| — |
| — |
| — |
| — |
| 0.3 |
| 0.8 |
|
Greece |
| — |
| — |
| — |
| — |
| — |
| — |
| — |
| — |
|
Other countries |
| — |
| — |
| — |
| 0.0 |
| 1.0 |
| 1.5 |
| — |
| 2.5 |
|
Total |
| 1.8 |
| — |
| — |
| 0.0 |
| 30.3 |
| 46.3 |
| 9.1 |
| 87.5 |
|
Gross exposures European countries, excluding Nordic countries by exposure classes, as of December 31, 2010
Skr billion |
| Central governments |
| Government |
| Regional |
| Multilateral development |
| Financial |
| Corporates |
| Securitization positions |
| Total |
| |||||||||||||||||
Skr bn |
| Central governments |
| Government export |
| Regional governments |
| Multilateral development |
| Financial |
| Corporates |
| Securitization positions |
| Total |
| |||||||||||||||||
United Kingdom |
| — |
| — |
| — |
| — |
| 8.9 |
| 7.6 |
| 9.3 |
| 25.8 |
|
| — |
| — |
| — |
| — |
| 8.9 |
| 6.3 |
| 3.2 |
| 18.4 |
|
Russia |
| — |
| — |
| — |
| — |
| 0.0 |
| 11.4 |
| — |
| 11.4 |
| |||||||||||||||||
Spain |
| — |
| — |
| — |
| — |
| 1.3 |
| 8.1 |
| 1.7 |
| 11.1 |
|
| — |
| — |
| — |
| — |
| 0.5 |
| 8.9 |
| 1.3 |
| 10.7 |
|
Russia |
| — |
| — |
| — |
| — |
| 0.1 |
| 10.7 |
| — |
| 10.8 |
| |||||||||||||||||
France |
| 0.1 |
| — |
| — |
| — |
| 9.4 |
| 0.6 |
| 0.2 |
| 10.3 |
|
| — |
| — |
| — |
| — |
| 6.1 |
| 1.9 |
| 0.0 |
| 8.0 |
|
The Netherlands |
| — |
| — |
| — |
| — |
| 5.5 |
| 1.5 |
| 1.3 |
| 8.3 |
|
| — |
| — |
| — |
| — |
| 5.1 |
| 1.3 |
| 0.9 |
| 7.3 |
|
Belgium |
| 4.5 |
| — |
| — |
| — |
| 2.6 |
| 0.3 |
| 0.8 |
| 8.2 |
| |||||||||||||||||
Germany |
| 1.3 |
| — |
| — |
| — |
| 4.7 |
| 0.6 |
| — |
| 6.6 |
| |||||||||||||||||
Ireland |
| 0.9 |
| — |
| — |
| — |
| 1.0 |
| 2.3 |
| 2.8 |
| 7.0 |
|
| — |
| — |
| — |
| — |
| 1.3 |
| 2.0 |
| 2.6 |
| 5.9 |
|
Turkey |
| — |
| — |
| — |
| — |
| 0.1 |
| 6.2 |
| — |
| 6.3 |
|
| — |
| — |
| — |
| — |
| 0.1 |
| 5.5 |
| — |
| 5.6 |
|
Germany |
| 0.6 |
| — |
| — |
| — |
| 4.7 |
| 0.5 |
| 0.0 |
| 5.8 |
| |||||||||||||||||
Italy |
| — |
| — |
| — |
| — |
| 0.7 |
| 3.4 |
| — |
| 4.1 |
|
| — |
| — |
| — |
| — |
| — |
| 3.2 |
| — |
| 3.2 |
|
Poland |
| — |
| — |
| — |
| — |
| — |
| 3.1 |
| — |
| 3.1 |
|
| — |
| — |
| — |
| — |
| — |
| 3.1 |
| — |
| 3.1 |
|
Switzerland |
| — |
| — |
| — |
| — |
| 1.2 |
| 0.8 |
| — |
| 2.0 |
|
| — |
| — |
| — |
| — |
| 1.7 |
| 0.3 |
| — |
| 2.0 |
|
Belgium |
| — |
| — |
| — |
| — |
| 0.9 |
| 0.3 |
| 0.8 |
| 2.0 |
| |||||||||||||||||
Portugal |
| 0.5 |
| — |
| — |
| — |
| — |
| — |
| 0.4 |
| 0.9 |
|
| 0.5 |
| — |
| — |
| — |
| — |
| — |
| 0.3 |
| 0.8 |
|
Luxembourg |
| — |
| — |
| — |
| 0.0 |
| — |
| 0.3 |
| — |
| 0.3 |
| |||||||||||||||||
Austria |
| — |
| — |
| — |
| — |
| 0.5 |
| — |
| — |
| 0.5 |
| |||||||||||||||||
Greece |
| — |
| — |
| — |
| — |
| — |
| — |
| — |
| — |
|
| — |
| — |
| — |
| — |
| — |
| — |
| — |
| — |
|
Other countries |
| 0.0 |
| — |
| — |
| 0.0 |
| 0.6 |
| 1.6 |
| — |
| 2.2 |
|
| — |
| — |
| — |
| — |
| 0.5 |
| 1.2 |
| — |
| 1.7 |
|
Total |
| 6.6 |
| — |
| — |
| 0.0 |
| 36.1 |
| 46.7 |
| 16.5 |
| 105.9 |
|
| 1.8 |
| — |
| — |
| 0.0 |
| 30.3 |
| 46.3 |
| 9.1 |
| 87.5 |
|
Net exposures European countries, excluding Nordic countries by exposure classes, as of December 31, 20112012
Skr billion |
| Central governments |
| Government |
| Regional |
| Multilateral development |
| Financial |
| Corporates |
| Securitization positions |
|
|
| |||||||||||||||||
United Kingdom |
| — |
| 4.9 |
| — |
| — |
| 13.2 |
| 0.7 |
| 3.2 |
| 22.0 |
| |||||||||||||||||
Skr bn |
| Central governments |
| Government export |
| Regional governments |
| Multilateral development |
| Financial |
| Corporates |
| Securitization positions |
| Total |
| |||||||||||||||||
United kingdom |
| — |
| 3.1 |
| — |
| — |
| 10.8 |
| 1.1 |
| 0.6 |
| 15.6 |
| |||||||||||||||||
Germany |
| 2.3 |
| 5.7 |
| — |
| — |
| 5.3 |
| 0.4 |
| — |
| 13.7 |
|
| — |
| 5.5 |
| 4.4 |
| — |
| 2.9 |
| 1.0 |
| — |
| 13.8 |
|
The Netherlands |
| — |
| — |
| — |
| — |
| 8.0 |
| 0.8 |
| 0.7 |
| 9.5 |
| |||||||||||||||||
France |
| — |
| 3.5 |
| — |
| — |
| 7.9 |
| — |
| 0.0 |
| 11.4 |
|
| — |
| 2.9 |
| — |
| — |
| 4.1 |
| — |
| — |
| 7.0 |
|
The Netherlands |
| — |
| — |
| — |
| — |
| 5.9 |
| 1.3 |
| 0.9 |
| 8.1 |
| |||||||||||||||||
Ireland |
| — |
| — |
| — |
| — |
| 1.2 |
| 0.5 |
| 2.6 |
| 4.3 |
| |||||||||||||||||
Switzerland |
| — |
| 0.1 |
| — |
| — |
| 3.1 |
| 0.1 |
| — |
| 3.3 |
| |||||||||||||||||
Spain |
| — |
| — |
| — |
| — |
| 0.7 |
| 1.3 |
| 1.3 |
| 3.3 |
|
| — |
| — |
| — |
| — |
| 0.3 |
| 1.8 |
| 1.0 |
| 3.1 |
|
Poland |
| 3.1 |
| — |
| — |
| — |
| — |
| — |
| — |
| 3.1 |
|
| 3.0 |
| — |
| — |
| — |
| — |
| — |
| — |
| 3.0 |
|
Belgium |
| — |
| — |
| — |
| — |
| 0.9 |
| 0.1 |
| 0.8 |
| 1.8 |
| |||||||||||||||||
Ireland |
| — |
| — |
| — |
| — |
| — |
| 0.4 |
| 2.5 |
| 2.9 |
| |||||||||||||||||
Luxembourg |
| — |
| 1.8 |
| — |
| 0.4 |
| 0.0 |
| 0.5 |
| — |
| 2.7 |
| |||||||||||||||||
Austria |
| 0.2 |
| — |
| — |
| — |
| 1.3 |
| — |
| — |
| 1.5 |
| |||||||||||||||||
Italy |
| — |
| 0.9 |
| — |
| — |
| — |
| 0.0 |
| — |
| 0.9 |
|
| 0.0 |
| 0.6 |
| — |
| — |
| — |
| 0.1 |
| — |
| 0.7 |
|
Portugal |
| 0.5 |
| — |
| — |
| — |
| — |
| — |
| 0.3 |
| 0.8 |
|
| 0.4 |
| — |
| — |
| — |
| — |
| — |
| 0.1 |
| 0.5 |
|
Switzerland |
| — |
| 0.0 |
| — |
| — |
| 0.4 |
| — |
| — |
| 0.4 |
| |||||||||||||||||
Belgium |
| — |
| — |
| — |
| — |
| 0.0 |
| 0.3 |
| — |
| 0.3 |
| |||||||||||||||||
Greece |
| — |
| — |
| — |
| — |
| — |
| — |
| — |
| — |
|
| — |
| — |
| — |
| — |
| — |
| — |
| — |
| — |
|
Other countries |
| 0.0 |
| — |
| — |
| 0.4 |
| 1.0 |
| 0.6 |
| — |
| 2.0 |
|
| 0.0 |
| — |
| — |
| — |
| 0.5 |
| 1.3 |
| — |
| 1.8 |
|
Total |
| 5.9 |
| 15.1 |
| — |
| 0.4 |
| 39.2 |
| 5.0 |
| 9.1 |
| 74.7 |
|
| 3.6 |
| 13.9 |
| 4.4 |
| 0.4 |
| 28.3 |
| 7.3 |
| 4.9 |
| 62.8 |
|
Net exposures European countries, excluding Nordic countries by exposure classes, as of December 31, 20102011
Skr billion |
| Central governments |
| Government |
| Regional |
| Multilateral development |
| Financial |
| Corporates |
| Securitization positions |
|
|
| |||||||||||||||||
United Kingdom |
| — |
| 6.4 |
| — |
| — |
| 15.6 |
| 0.7 |
| 9.3 |
| 32.0 |
| |||||||||||||||||
Skr bn |
| Central governments |
| Government export |
| Regional governments |
| Multilateral development |
| Financial |
| Corporates |
| Securitization positions |
| Total |
| |||||||||||||||||
United kingdom |
| — |
| 4.9 |
| — |
| — |
| 13.2 |
| 0.7 |
| 3.2 |
| 22.0 |
| |||||||||||||||||
Germany |
| 2.3 |
| 5.7 |
| — |
| — |
| 5.3 |
| 0.4 |
| — |
| 13.7 |
| |||||||||||||||||
France |
| 0.1 |
| 4.0 |
| — |
| — |
| 11.7 |
| — |
| 0.1 |
| 15.9 |
|
| — |
| 3.5 |
| — |
| — |
| 7.9 |
| — |
| 0.0 |
| 11.4 |
|
Germany |
| 1.4 |
| 6.2 |
| — |
| — |
| 5.8 |
| 0.4 |
| 0.0 |
| 13.8 |
| |||||||||||||||||
The Netherlands |
| — |
| — |
| — |
| — |
| 6.5 |
| 1.2 |
| 1.3 |
| 9.0 |
|
| — |
| — |
| — |
| — |
| 5.9 |
| 1.3 |
| 0.9 |
| 8.1 |
|
Belgium |
| 4.5 |
| — |
| — |
| — |
| 2.6 |
| 0.3 |
| 0.8 |
| 8.2 |
| |||||||||||||||||
Ireland |
| 0.9 |
| — |
| — |
| — |
| 0.9 |
| 0.5 |
| 1.4 |
| 3.7 |
|
| — |
| — |
| — |
| — |
| 1.2 |
| 0.5 |
| 2.6 |
| 4.3 |
|
Switzerland |
| — |
| 0.1 |
| — |
| — |
| 3.1 |
| 0.1 |
| — |
| 3.3 |
| |||||||||||||||||
Spain |
| — |
| — |
| — |
| — |
| 1.3 |
| 0.5 |
| 1.7 |
| 3.5 |
|
| — |
| — |
| — |
| — |
| 0.7 |
| 1.3 |
| 1.3 |
| 3.3 |
|
Poland |
| 2.5 |
| — |
| — |
| — |
| — |
| 0.6 |
| — |
| 3.1 |
|
| 3.1 |
| — |
| — |
| — |
| — |
| — |
| — |
| 3.1 |
|
Switzerland |
| — |
| 0.1 |
| — |
| — |
| 2.5 |
| 0.1 |
| — |
| 2.7 |
| |||||||||||||||||
Belgium |
| — |
| — |
| — |
| — |
| 0.9 |
| 0.1 |
| 0.8 |
| 1.8 |
| |||||||||||||||||
Italy |
| — |
| 1.0 |
| — |
| — |
| 0.7 |
| — |
| — |
| 1.7 |
|
| — |
| 0.9 |
| — |
| — |
| — |
| 0.0 |
| — |
| 0.9 |
|
Portugal |
| 0.5 |
| — |
| — |
| — |
| — |
| — |
| 0.4 |
| 0.9 |
|
| 0.5 |
| — |
| — |
| — |
| — |
| — |
| 0.3 |
| 0.8 |
|
Luxembourg |
| — |
| — |
| — |
| 0.4 |
| — |
| 0.1 |
| — |
| 0.5 |
| |||||||||||||||||
Austria |
| — |
| — |
| — |
| — |
| 0.5 |
| — |
| — |
| 0.5 |
| |||||||||||||||||
Greece |
| — |
| — |
| — |
| — |
| — |
| — |
| — |
| — |
|
| — |
| — |
| — |
| — |
| — |
| — |
| — |
| — |
|
Other countries |
| 0.1 |
| — |
| — |
| 0.4 |
| 0.8 |
| 0.7 |
| — |
| 2.0 |
|
| 0.0 |
| — |
| — |
| — |
| 0.5 |
| 0.5 |
| — |
| 1.0 |
|
Total |
| 10.0 |
| 17.7 |
| — |
| 0.4 |
| 48.4 |
| 5.0 |
| 15.0 |
| 96.5 |
|
| 5.9 |
| 15.1 |
| — |
| 0.4 |
| 39.2 |
| 5.0 |
| 9.1 |
| 74.7 |
|
Corporate exposures by industry (GICS)
|
| December 31, 2011 |
| December 31, 2010 |
|
| December 31, 2012 |
| December 31, 2011 |
| ||||||||
Skr billion |
| Gross exposure |
| Net exposure |
| Gross exposure |
| Net exposure |
| |||||||||
Skr bn |
| Gross exposure |
| Net exposure |
| Gross exposure |
| Net exposure |
| |||||||||
IT and telecom |
| 75.3 |
| 6.8 |
| 66.4 |
| 6.2 |
| |||||||||
Financials |
| 31.7 |
| 13.4 |
| 20.9 |
| 2.5 |
| |||||||||
Industrials |
| 28.8 |
| 15.0 |
| 39.2 |
| 22.3 |
| |||||||||
Materials |
| 28.4 |
| 10.3 |
| 26.3 |
| 8.2 |
| |||||||||
Consumer goods |
| 14.8 |
| 10.3 |
| 14.6 |
| 6.9 |
| |||||||||
Utilities |
| 15.8 |
| 5.7 |
| 13.4 |
| 6.4 |
|
| 12.4 |
| 3.6 |
| 15.8 |
| 5.7 |
|
Health Care |
| 7.3 |
| 2.8 |
| 6.8 |
| 2.1 |
| |||||||||
Energy |
| 3.3 |
| 1.3 |
| 1.9 |
| 0.7 |
|
| 4.9 |
| 1.4 |
| 3.3 |
| 1.3 |
|
Finance |
| 20.9 |
| 2.5 |
| 26.4 |
| 2.7 |
| |||||||||
Health care |
| 6.8 |
| 2.1 |
| 5.7 |
| 1.0 |
| |||||||||
Industrials |
| 39.2 |
| 22.3 |
| 31.5 |
| 12.9 |
| |||||||||
IT and telecom |
| 66.4 |
| 6.2 |
| 64.7 |
| 6.2 |
| |||||||||
Consumer goods |
| 14.6 |
| 6.9 |
| 14.7 |
| 5.3 |
| |||||||||
Materials |
| 26.3 |
| 8.2 |
| 27.4 |
| 8.1 |
| |||||||||
Other |
| 1.3 |
| 0.2 |
| 1.0 |
| 0.0 |
|
| 0.5 |
| 0.0 |
| 1.3 |
| 0.2 |
|
Total |
| 194.6 |
| 55.4 |
| 186.7 |
| 43.3 |
|
| 204.1 |
| 63.6 |
| 194.6 |
| 55.4 |
|
Asset-Backed Securities held
The tables below include current aggregated information regarding SEK’s total net exposures (after effects related to risk-coverage) related to securitization positionsasset-backed securities held and to current ratings.rating. Ratings in the table as of December 31, December 20112012 are stated as the second lowest of the ratings from Standard & Poor’s, Moody’s and Fitch. When only two ratings are available the lowest is stated. All of these assets represent first-priority tranches, and they have all been rated ‘AAA’/’Aaa’ by Standard & Poor’s or Moody’s at acquisition.
|
| December 31, 2011 |
|
|
| …of which |
| …of which |
| …of which |
| …of which |
| …of which |
| …of which |
| …of which |
| …of which |
| …of which |
| …of which |
| …of which |
|
|
|
|
|
|
|
|
|
|
|
|
|
|
|
| ...of which |
| ...of which |
| ...of which |
| ...of which |
| ...of which |
| ...of which |
| ...of which |
| ...of which |
| ...of which |
| ...of which |
| ...of which |
| ...of which |
| ||||||||||
Net exposures Skr mn |
|
|
| Auto |
|
|
| Consumer |
|
|
|
|
|
|
| rated |
| rated |
| rated |
| rated |
| rated |
| rated |
| rated |
| rated |
| rated |
| rated |
| CDO rated |
|
| December 31, 2012 |
|
|
| rated |
| rated |
| rated |
| rated |
| rated |
| rated |
| rated |
| rated |
| rated |
| rated |
| rated |
| CDO rated |
| ||||||||||
Exposure (1) |
| RMBS (2) |
| Loans |
| CMBS (2) |
| Loans |
| CDO (2) |
| CLO (2) |
| Total |
| ‘AAA’ |
| ‘AA+’ |
| ‘AA’ |
| ‘AA-’ |
| ‘A+’ |
| ‘A’ |
| ‘BBB+’ |
| ‘BBB’ |
| ‘BBB-’ |
| ‘BB’ |
| ‘CCC’ |
| |||||||||||||||||||||||||||||||||||||||
Exposure(1) |
| RMBS(2) |
| Auto Loans |
| CMBS(2) |
| Consumer loans |
| CDO(2) |
| CLO(2) |
| Total |
| ‘AAA’ |
| ‘AA+’ |
| ‘AA’ |
| ‘AA-’ |
| ‘A+’ |
| ‘A’ |
| ‘A-’ |
| ‘BBB+’ |
| ‘BBB-’ |
| ‘BB’ |
| ‘B+’ |
| ‘CCC’ |
| |||||||||||||||||||||||||||||||||||||
Australia |
| 3,550 |
| — |
| — |
| — |
| — |
| — |
| 3,550 |
| 3,550 |
| — |
| — |
| — |
| — |
| — |
| — |
| — |
| — |
| — |
| — |
|
| 2,555 |
| — |
| — |
| — |
| — |
| — |
| 2,555 |
| 2,555 |
| — |
| — |
| — |
| — |
| — |
| — |
| — |
| — |
| — |
| — |
| — |
|
Belgium |
| 760 |
| — |
| — |
| — |
| — |
| — |
| 760 |
| 760 |
| — |
| — |
| — |
| — |
| — |
| — |
| — |
| — |
| — |
| — |
| |||||||||||||||||||||||||||||||||||||||
France |
| — |
| 24 |
| — |
| — |
| — |
| — |
| 24 |
| 24 |
| — |
| — |
| — |
| — |
| — |
| — |
| — |
| — |
| — |
| — |
| |||||||||||||||||||||||||||||||||||||||
Germany |
| — |
| 102 |
| 70 |
| — |
| — |
| — |
| 172 |
| 102 |
| 70 | (4) | — |
| — |
| — |
| — |
| — |
| — |
| — |
| — |
| — |
|
| — |
| 26 |
| 66 |
| — |
| — |
| — |
| 92 |
| 26 |
| 66 | (3) | — |
| — |
| — |
| — |
| — |
| — |
| — |
| — |
| — |
| — |
|
Ireland |
| 920 |
| — |
| — |
| — |
| — |
| 1,465 | (3) | 2,385 |
| 1,465 |
| — |
| — |
| 45 | (4) | — |
| — |
| 592 | (4) | 283 | (4) | — |
| — |
| — |
|
| 815 |
| — |
| — |
| — |
| — |
| 1,408 |
| 2,223 |
| 1,408 |
| — |
| — |
| — |
| — |
| — |
| — |
| — |
| 379 | (3) | 258 | (3) | 178 | (3) | — |
|
Netherlands |
| 834 |
| — |
| — |
| — |
| — |
| — |
| 834 |
| 834 |
| — |
| — |
| — |
| — |
| — |
| — |
| — |
| — |
| — |
| — |
|
| 652 |
| — |
| — |
| — |
| — |
| — |
| 652 |
| 652 |
| — |
| — |
| — |
| — |
| — |
| — |
| — |
| — |
| — |
| — |
| — |
|
Portugal |
| 351 |
| — |
| — |
| — |
| — |
| — |
| 351 |
| — |
| — |
| — |
| — |
| — |
| 171 | (4) | — |
| — |
| 180 | (4) | — |
| — |
|
| 315 |
| — |
| — |
| — |
| — |
| — |
| 315 |
| — |
| — |
| — |
| — |
| — |
| — |
| 156 | (3) | — |
| 159 | (3) | — |
| — |
| — |
|
Spain |
| 962 |
| 65 |
| — |
| 66 |
| — |
| 209 |
| 1,302 |
| 452 |
| 50 | (4) | 16 | (4) | 496 | (4) | 44 | (4) | 24 | (4) | — |
| — |
| — |
| 220 | (4) | — |
|
| 819 |
| 28 |
| — |
| 23 |
| — |
| 131 |
| 1,001 |
| — |
| — |
| — |
| 28 | (3) | 57 | (3) | 225 | (3) | 97 | (3) | 393 | (3) | — |
| 201 | (3) | — |
| — |
|
United Kingdom |
| 3,246 |
| — |
| — |
| — |
| — |
| 57 |
| 3,303 |
| 3,044 |
| — |
| 259 | (4) | — |
| — |
| — |
| — |
| — |
| — |
| — |
| — |
|
| 598 |
| — |
| — |
| — |
| — |
| 17 |
| 615 |
| 437 |
| — |
| 161 | (3) | 17 | (3) | — |
| — |
| — |
| — |
| — |
| — |
| — |
| — |
|
United States |
| — |
| — |
| — |
| — |
| 151 |
| 2,790 |
| 2,941 |
| 2,132 |
| 658 | (4) | — |
| — |
| — |
| — |
| — |
| — |
| — |
| — |
| 151 | (5) |
| — |
| — |
| — |
| — |
| 133 |
| 1,978 |
| 2,111 |
| 1,978 |
| — |
| — |
| — |
| — |
| — |
| — |
| — |
| — |
| — |
| — |
| 133 | (4) |
Total |
| 10,623 |
| 191 |
| 70 |
| 66 |
| 151 |
| 4,521 |
| 15,622 |
| 12,363 |
| 778 |
| 275 |
| 541 |
| 44 |
| 195 |
| 592 |
| 283 |
| 180 |
| 220 |
| 151 |
|
| 5,754 |
| 54 |
| 66 |
| 23 |
| 133 |
| 3,534 |
| 9,564 |
| 7,056 |
| 66 |
| 161 |
| 45 |
| 57 |
| 225 |
| 253 |
| 393 |
| 538 |
| 459 |
| 178 |
| 133 |
|
(1)Exposures are assessed on the domicile of the issuance which is consistent with the underlying assets,assets’ domicile except for Ireland where the majority of the underlying assets are in France, United Kingdom and GermanyGermany.
(2)RMBS = Residential Mortgage-Backed Securities
CMBS = Commercial=Commercial Mortgage-Backed Securities
CDO = Collateralized Debt Obligations
CLO = Collateralized Loan Obligations
(3)Of these assets amounting to Skr 2,375 million, Skr 244 million have the highest-possible rating from at least one of the rating institutions.
(4)These assets consist of two CDOs (senior tranches) with end-exposure to the U.S market. There have been no delays with payments under the tranches. However, the ratings of the assets have been downgraded significantly during 2008 to 2012 by Standard & Poor’s from ‘AAA’ to ‘NR’ (after being
downgraded to ‘D’), by Moody’s from ‘Aaa’ to ‘Ca’ and by Fitch from ‘AAA’ to ‘C’. Due to the significant rating downgrades, SEK has analyzed the expected cash flows of the assets and has recorded related impairments. The impairments amount to Skr 462 million in total as of December 31, 2012.
Net exposures Skr mn |
| December 31, 2011 |
|
|
| ...of which |
| ...of which |
| ...of which |
| ...of which |
| ...of which |
| ...of which |
| ...of which |
| ...of which |
| ...of which |
| ...of which |
| ...of which |
| ||||||||||
Exposure(1) |
| RMBS(2) |
| Auto Loans |
| CMBS(2) |
| Consumer loans |
| CDO(2) |
| CLO(2) |
| Total |
| ‘AAA’ |
| ‘AA+’ |
| ‘AA’ |
| ‘AA-’ |
| ‘A+’ |
| ‘A’ |
| ‘BBB+’ |
| ‘BBB’ |
| ‘BBB-’ |
| ‘BB’ |
| ‘CCC’ |
|
Australia |
| 3,550 |
| — |
| — |
| — |
| — |
| — |
| 3,550 |
| 3,550 |
| — |
| — |
| — |
| — |
| — |
| — |
| — |
| — |
| — |
| — |
|
Belgium |
| 760 |
| — |
| — |
| — |
| — |
| — |
| 760 |
| 760 |
| — |
| — |
| — |
| — |
| — |
| — |
| — |
| — |
| — |
| — |
|
France |
| — |
| 24 |
| — |
| — |
| — |
| — |
| 24 |
| 24 |
| — |
| — |
| — |
| — |
| — |
| — |
| — |
| — |
| — |
| — |
|
Germany |
| — |
| 102 |
| 70 |
| — |
| — |
| — |
| 172 |
| 102 |
| 70 | (4) | — |
| — |
| — |
| — |
| — |
| — |
| — |
| — |
| — |
|
Ireland |
| 920 |
| — |
| — |
| — |
| — |
| 1,465 | (3) | 2,385 |
| 1,465 |
| — |
| — |
| 45 | (4) | — |
| — |
| 592 | (4) | 283 | (4) | — |
| — |
| — |
|
Netherlands |
| 834 |
| — |
| — |
| — |
| — |
| — |
| 834 |
| 834 |
| — |
| — |
| — |
| — |
| — |
| — |
| — |
| — |
| — |
| — |
|
Portugal |
| 351 |
| — |
| — |
| — |
| — |
| — |
| 351 |
| — |
| — |
| — |
| — |
| — |
| 171 | (4) | — |
| — |
| 180 | (4) | — |
| — |
|
Spain |
| 962 |
| 65 |
| — |
| 66 |
| — |
| 209 |
| 1,302 |
| 452 |
| 50 | (4) | 16 | (4) | 496 | (4) | 44 | (4) | 24 | (4) | — |
| — |
| — |
| 220 | (4) | — |
|
United Kingdom |
| 3,246 |
| — |
| — |
| — |
| — |
| 57 |
| 3,303 |
| 3,044 |
| — |
| 259 | (4) | — |
| — |
| — |
| — |
| — |
| — |
| — |
| — |
|
United States |
| — |
| — |
| — |
| — |
| 151 |
| 2,790 |
| 2,941 |
| 2,132 |
| 658 | (4) | — |
| — |
| — |
| — |
| — |
| — |
| — |
| — |
| 151 |
|
Total |
| 10,623 |
| 191 |
| 70 |
| 66 |
| 151 |
| 4,521 |
| 15,622 |
| 12,363 |
| 778 |
| 275 |
| 541 |
| 44 |
| 195 |
| 592 |
| 283 |
| 180 |
| 220 |
| 151 |
|
(1)Exposures are assessed on the domicile of the issuance which is consistent with the underlying assets’ except for Ireland where the majority of the underlying assets are in France, United Kingdom and Germany.
(2)RMBS = Residential Mortgage-Backed Securities
CMBS =Commercial Mortgage-Backed Securities
CDO = Collateralized Debt Obligations
CLO = Collateralized Loan Obligations
(3)In the fourth quarter of 2011 SEK decided not to take account of a credit derivative to cover the risk of an Irish CLO amounting to Skr 1,465 million at 31 December 2011. The issuer of this credit derivative has a lower rating than the underlying CLO, which is rated ‘AAA’.
(4)Of these assets amounting to Skr 3,108 million, still Skr 1,535 million have the highest-possible rating from at least one of the rating institutions.
(5) These assets consist of two CDOs (first-priority tranches) with end-exposure to the U.S market. There have been no delays with payments under the tranches. However, the ratings of the assets have been downgraded dramatically during 2008 to 2011, by Standard & Poor’s from ‘AAA’ to ‘NR’ (after being downgraded to ‘D’), by Moody’s from ‘Aaa’ to ‘Ca’ and by Fitch from ‘AAA’ to ‘C’. Due to the dramatic rating downgrades, SEK has analyzed the expected cash flows of the assets and has recorded related impairments. The impairments amount to Skr 491 million in total as of December 31, 2011.
|
| December 31, 2010 |
|
|
| …of which |
| …of which |
| …of which |
| …of which |
| …of which |
| …of which |
| …of which |
| ||||||||||||
Net exposures Skr mn |
|
|
| Credit |
| Auto |
|
|
| Consumer |
|
|
|
|
|
|
| rated |
| rated |
| rated |
| rated |
| rated |
| rated |
| CDO rated |
|
Exposure (1) |
| RMBS(2) |
| Cards |
| Loans |
| CMBS(2) |
| Loans |
| CDO(2) |
| CLO(2) |
| Total |
| ‘AAA’ |
| ‘AA+’ |
| ‘AA’ |
| ‘AA-’ |
| ‘A+’ |
| ‘A’ |
| ‘CCC’ |
|
Australia |
| 4,620 |
| — |
| — |
| — |
| — |
| — |
| — |
| 4,620 |
| 4,620 |
| — |
| — |
| — |
| — |
| — |
| — |
|
Belgium |
| 765 |
| — |
| — |
| — |
| — |
| — |
| — |
| 765 |
| 765 |
| — |
| — |
| — |
| — |
| — |
| — |
|
France |
| — |
| — |
| 146 |
| — |
| — |
| — |
| — |
| 146 |
| 146 |
| — |
| — |
| — |
| — |
| — |
| — |
|
Germany |
| — |
| — |
| 388 |
| 73 |
| — |
| — |
| — |
| 461 |
| 461 |
| — |
| — |
| — |
| — |
| — |
| — |
|
Ireland |
| 999 |
| — |
| — |
| — |
| — |
| — |
| 41 |
| 1,040 |
| 484 |
| — |
| — |
| 212 | (3) | 41 | (3) | 303 | (3) | — |
|
Japan |
| — |
| — |
| 9 |
| — |
| — |
| — |
| — |
| 9 |
| 9 |
| — |
| — |
| — |
| — |
| — |
| — |
|
Netherlands |
| 1,157 |
| — |
| — |
| — |
| — |
| — |
| 142 |
| 1,299 |
| 1,299 |
| — |
| — |
| — |
| — |
| — |
| — |
|
Portugal |
| 382 |
| — |
| — |
| — |
| — |
| — |
| — |
| 382 |
| 382 |
| — |
| — |
| — |
| — |
| — |
| — |
|
Spain |
| 1,096 |
| — |
| 120 |
| — |
| 154 |
| — |
| 306 |
| 1,676 |
| 1,027 |
| 347 | (3) | 302 | (3) | — |
| — |
| — |
| — |
|
United Kingdom |
| 9,216 |
| — |
| — |
| — |
| — |
| — |
| — |
| 9,216 |
| 9,216 |
| — |
| — |
| — |
| — |
| — |
| — |
|
United States |
| — |
| 450 |
| — |
| — |
| — |
| 163 |
| 3,270 |
| 3,883 |
| 2,717 |
| 1,003 | (3) | — |
| — |
| — |
| — |
| 163 | (4) |
Total |
| 18,235 |
| 450 |
| 663 |
| 73 |
| 154 |
| 163 |
| 3,759 |
| 23,497 |
| 21,126 |
| 1,350 |
| 302 |
| 212 |
| 41 |
| 303 |
| 163 |
|
(1) Exposures are assessed on the domicile of the issuance which is consistent with the underlying assets, except for Ireland where the majority of the underlying assets are in France, United Kingdom and Germany.
(2) RMBS = Residential Mortgage-Backed Securities
CMBS = Commercial Mortgage-Backed Securities
CDO = Collateralized Debt Obligations
CLO = Collateralized Loan Obligations
(3) Of these assets amounting to Skr 2,208 million, still Skr 1,748 million have the highest-possible rating from at least one of the rating institutions.
(4) These assets consist of two CDOs (first-priority tranches) with end-exposure to the U.S market. There have been no delays with payments under the tranches. However, the ratings of the assets have been downgraded dramatically during 2008 and 2009, by Standard & Poor’s from ‘AAA’ to ‘CC’, by Moody’s from ‘Aaa’ to ‘Ca’ and by Fitch from ‘AAA’ to ‘CCC’. Due to the dramatic rating downgrades, SEK has analyzed the expected cash flows of the assets and recorded related impairments. The impairments amount to Skr 475 million in total as of December 31, 2010.
Market risk
The positions that SEK secure, relating to market risk, can be positions that are not valued at fair value in the statement of financial position due to of accounting reasons. Thus, the financial risk estimated by SEK may differ from the changes in value recognized in operating profit or in other comprehensive income.
SEK assumes a one-percentage-point change in the market rate, as a parallel shift, for the sensitivity analyses relating to interest rate risk.SEKrisk. SEK assesses a reasonable assumption to be that the average change in market rates will not exceed one percentage point over the next year.
Change in value if the market interest rate rises by one percentage point as of December 31, 2012
The impact on the value of assets and liabilities, including derivatives, when market interest rates rise by one percentage point (+1%).
Consolidated Group |
| M < 1 years |
| 1 years < M < 3 |
| 3 years < M < 5 years |
| M > 5 years |
| Total |
|
Foreign currency |
| -8.8 |
| -1.0 |
| -1.5 |
| 281.5 |
| 270.2 |
|
Swedish Skr |
| -3.9 |
| -77.6 |
| -198.3 |
| -288.8 |
| -568.6 |
|
|
| -12.7 |
| -78.6 |
| -199.8 |
| -7.3 |
| -298.4 |
|
of which financial instruments measured at fair value through profit or loss
Skr mn |
| M < 1 years |
| 1 years < M < 3 |
| 3 years < M < 5 years |
| M > 5 years |
| Total |
|
Foreign currency |
| 257.0 |
| 10.0 |
| 17.3 |
| 301.0 |
| 585.2 |
|
Swedish Skr |
| 83.9 |
| 0.2 |
| 0.0 |
| -8.2 |
| 75.8 |
|
|
| 340.9 |
| 10.1 |
| 17.3 |
| 292.8 |
| 661.1 |
|
of which financial instruments measured at fair value through comprehensive income
Skr mn |
| M < 1 years |
| 1 years < M < 3 |
| 3 years < M < 5 years |
| M > 5 years |
| Total |
|
Foreign currency |
| -26.6 |
| 0.0 |
| 0.0 |
| 0.0 |
| -26.6 |
|
Swedish Skr |
| -15.4 |
| -73.7 |
| -195.4 |
| -280.6 |
| -565.1 |
|
|
| -41.9 |
| -73.7 |
| -195.4 |
| -280.6 |
| -591.6 |
|
Change in value if the market interest rate rises by one percentage point as of December 31, 2011
The impact on the value of assets and liabilities, including derivatives, when market interest rates rise by one percentage point (+1%).
Consolidated Group |
|
|
| 1 years < M < 3 |
| 3 years < M < 5 |
|
|
|
|
| |||||||||||
Skr mn |
| M < 1 years |
| years |
| years |
| M > 5 years |
| Total |
| |||||||||||
Consolidated Group |
| M < 1 years |
| 1 years < M < 3 |
| 3 years < M < 5 years |
| M > 5 years |
| Total |
| |||||||||||
Foreign currency |
| -2.2 |
| -4.7 |
| -7.8 |
| 277.7 |
| 263.0 |
|
| -2.2 |
| -4.7 |
| -7.8 |
| 277.7 |
| 263.0 |
|
Swedish Skr |
| -6.0 |
| -87.4 |
| -151.1 |
| -264.9 |
| -509.4 |
|
| -6.0 |
| -87.4 |
| -151.1 |
| -264.9 |
| -509.4 |
|
|
| -8.2 |
| -92.1 |
| -158.9 |
| 12.8 |
| -246.4 |
|
| -8.2 |
| -92.1 |
| -158.9 |
| 12.8 |
| -246.4 |
|
of which financial instruments measured at fair value through profit or loss
Skr mn |
| M < 1 years |
| 1 years < M < 3 |
| 3 years < M < 5 |
| M > 5 years |
| Total |
|
| M < 1 years |
| 1 years < M < 3 |
| 3 years < M < 5 years |
| M > 5 years |
| Total |
|
Foreign currency |
| 316.1 |
| 4.5 |
| 8.7 |
| 294.9 |
| 624.2 |
|
| 316.1 |
| 4.5 |
| 8.7 |
| 294.9 |
| 624.2 |
|
Swedish Skr |
| 89.1 |
| 0.2 |
| 0.1 |
| -9,3 |
| 80.1 |
|
| 89.1 |
| 0.2 |
| 0.1 |
| -9,3 |
| 80.1 |
|
|
| 405.2 |
| 4.7 |
| 8.8 |
| 285.6 |
| 704.3 |
|
| 405.2 |
| 4.7 |
| 8.8 |
| 285.6 |
| 704.3 |
|
of which financial instruments measured at fair value through comprehensive income
Skr mn |
| M < 1 years |
| 1 years < M < 3 |
| 3 years < M < 5 |
| M > 5 years |
| Total |
|
Foreign currency |
| -5.3 |
| — |
| — |
| — |
| -5.3 |
|
Swedish Skr |
| -9.6 |
| -83.0 |
| -145.4 |
| -254.8 |
| -492.8 |
|
|
| -14.9 |
| -83.0 |
| -145.4 |
| -254.8 |
| -498.1 |
|
Change in value if the market interest rate rises by one percentage point as of December 31, 2010
The impact on the value of assets and liabilities, including derivatives, when market interest rates rise by one percentage point (+1%).
Consolidated Group |
|
|
| 1 years < M < 3 |
| 3 years < M < 5 |
|
|
|
|
|
Skr mn |
| M < 1 years |
| years |
| years |
| M > 5 years |
| Total |
|
Foreign currency |
| -1.3 |
| -5.3 |
| -7.6 |
| 140.3 |
| 126.1 |
|
Swedish Skr |
| -4.0 |
| -58.7 |
| -151.4 |
| -216.1 |
| -430.2 |
|
|
| -5.3 |
| -64.0 |
| -159.0 |
| -75.8 |
| -304.1 |
|
of which financial instruments measured at fair value through profit or loss
Skr mn |
| M < 1 years |
| 1 years < M < 3 |
| 3 years < M < 5 |
| M > 5 years |
| Total |
|
Foreign currency |
| 315.8 |
| 4.2 |
| 4.5 |
| 165.2 |
| 489.7 |
|
Swedish Skr |
| 87.9 |
| 2.0 |
| 0.3 |
| -9.3 |
| 80.9 |
|
|
| 403.7 |
| 6.2 |
| 4.8 |
| 155.9 |
| 570.6 |
|
of which financial instruments measured at fair value through comprehensive income
Skr mn |
| M < 1 years |
| 1 years < M < 3 |
| 3 years < M < 5 |
| M > 5 years |
| Total |
|
| M < 1 years |
| 1 years < M < 3 |
| 3 years < M < 5 years |
| M > 5 years |
| Total |
|
Foreign currency |
| -8.3 |
| — |
| — |
| — |
| -8.3 |
|
| -5.3 |
| — |
| — |
| — |
| -5.3 |
|
Swedish Skr |
| -5.6 |
| -55.0 |
| -145.2 |
| -202.8 |
| -408.6 |
|
| -9.6 |
| -83.0 |
| -145.4 |
| -254.8 |
| -492.8 |
|
|
| -13.9 |
| -55.0 |
| -145.2 |
| -202.8 |
| -416.9 |
|
| -14.9 |
| -83.0 |
| -145.4 |
| -254.8 |
| -498.1 |
|
Change in value if the market interest rate declines by one percentage point as of December 31, 20112012
The impact on the value of assets and liabilities, including derivatives, when market interest rates declines by one percentage point (-1%).
Consolidated Group |
| M < 1 years |
| 1 years < M < 3 |
| 3 years < M < 5 |
| M > 5 years |
| Total |
|
| M < 1 years |
| 1 years < M < 3 |
| 3 years < M < 5 years |
| M > 5 years |
| Total |
|
Foreign currency |
| 15.0 |
| 4.1 |
| 6.1 |
| -391.8 |
| -366.6 |
|
| 15.4 |
| 0.6 |
| -0.5 |
| -388.4 |
| -372.8 |
|
Swedish Skr |
| 6.0 |
| 90.2 |
| 158.7 |
| 284.4 |
| 539.3 |
|
| 3.9 |
| 79.9 |
| 208.9 |
| 315.9 |
| 608.5 |
|
|
| 21.0 |
| 94.3 |
| 164.8 |
| -107.4 |
| 172.7 |
|
| 19.3 |
| 80.5 |
| 208.4 |
| -72.5 |
| 235.7 |
|
of which financial instruments measured at fair value through profit or loss
Skr mn |
| M < 1 years |
| 1 years < M < 3 |
| 3 years < M < 5 |
| M > 5 years |
| Total |
|
| M < 1 years |
| 1 years < M < 3 |
| 3 years < M < 5 years |
| M > 5 years |
| Total |
|
Foreign currency |
| -218.9 |
| -4.5 |
| -9.1 |
| -409.5 |
| -642.0 |
|
| -56.7 |
| -5.3 |
| -10.8 |
| -408.9 |
| -481.7 |
|
Swedish Skr |
| -90.3 |
| -0.2 |
| -0.1 |
| 10.2 |
| -80.4 |
|
| -84.9 |
| -0.2 |
| 0.0 |
| 8.9 |
| -76.2 |
|
|
| -309.2 |
| -4.7 |
| -9.2 |
| -399.3 |
| -722.4 |
|
| -141.6 |
| -5.5 |
| -10.8 |
| -400.0 |
| -557.9 |
|
of which financial instruments measured at fair value through comprehensive income
Skr mn |
| M < 1 years |
| 1 years < M < 3 |
| 3 years < M < 5 |
| M > 5 years |
| Total |
|
| M < 1 years |
| 1 years < M < 3 |
| 3 years < M < 5 years |
| M > 5 years |
| Total |
|
Foreign currency |
| 4.7 |
| — |
| — |
| — |
| 4.7 |
|
| 11.9 |
| 0.0 |
| 0.0 |
| 0.0 |
| 11.9 |
|
Swedish Skr |
| 9.8 |
| 85.7 |
| 152.7 |
| 273.4 |
| 521.6 |
|
| 15.6 |
| 75.8 |
| 205.8 |
| 307.0 |
| 604.1 |
|
|
| 14.5 |
| 85.7 |
| 152.7 |
| 273.4 |
| 526.3 |
|
| 27.5 |
| 75.8 |
| 205.8 |
| 307.0 |
| 616.0 |
|
Change in value if the market interest rate declines by one percentage point as of December 31, 20102011
The impact on the value of assets and liabilities, including derivatives, when market interest rates declines by one percentage point (–(—1%).
Consolidated Group |
| M < 1 years |
| 1 years < M < 3 |
| 3 years < M < 5 |
| M > 5 years |
| Total |
|
Foreign currency |
| 5.4 |
| 5.0 |
| 8.0 |
| -209.5 |
| -191.1 |
|
Swedish Skr |
| 4.0 |
| 60.3 |
| 158.5 |
| 231.8 |
| 454.6 |
|
|
| 9.4 |
| 65.3 |
| 166.5 |
| 22.3 |
| 263.5 |
|
Consolidated Group |
| M < 1 years |
| 1 years < M < 3 |
| 3 years < M < 5 years |
| M > 5 years |
| Total |
|
Foreign currency |
| 15.0 |
| 4.1 |
| 6.1 |
| -391.8 |
| -366.6 |
|
Swedish Skr |
| 6.0 |
| 90.2 |
| 158.7 |
| 284.4 |
| 539.3 |
|
|
| 21.0 |
| 94.3 |
| 164.8 |
| -107.4 |
| 172.7 |
|
of which financial instruments measured at fair value through profit or loss
Skr mn |
| M < 1 years |
| 1 years < M < 3 |
| 3 years < M < 5 |
| M > 5 years |
| Total |
|
| M < 1 years |
| 1 years < M < 3 |
| 3 years < M < 5 years |
| M > 5 years |
| Total |
|
Foreign currency |
| -201.7 |
| -4.3 |
| -4.7 |
| -236.1 |
| -446.8 |
|
| -218.9 |
| -4.5 |
| -9.1 |
| -409.5 |
| -642.0 |
|
Swedish Skr |
| -88.9 |
| -2.1 |
| -0.3 |
| 10.2 |
| -81.1 |
|
| -90.3 |
| -0.2 |
| -0.1 |
| 10.2 |
| -80.4 |
|
|
| -290.6 |
| -6.4 |
| -5.0 |
| -225.9 |
| -527.9 |
|
| -309.2 |
| -4.7 |
| -9.2 |
| -399.3 |
| -722.4 |
|
of which financial instruments measured at fair value through comprehensive income
Skr mn |
| M < 1 years |
| 1 years < M < 3 |
| 3 years < M < 5 |
| M > 5 years |
| Total |
|
| M < 1 years |
| 1 years < M < 3 |
| 3 years < M < 5 years |
| M > 5 years |
| Total |
|
Foreign currency |
| 6.6 |
| — |
| — |
| — |
| 6.6 |
|
| 4.7 |
| — |
| — |
| — |
| 4.7 |
|
Swedish Skr |
| 5.7 |
| 56.5 |
| 152.0 |
| 217.3 |
| 431.5 |
|
| 9.8 |
| 85.7 |
| 152.7 |
| 273.4 |
| 521.6 |
|
|
| 12.3 |
| 56.5 |
| 152.0 |
| 217.3 |
| 438.1 |
|
| 14.5 |
| 85.7 |
| 152.7 |
| 273.4 |
| 526.3 |
|
Assets, liabilities and derivatives denominated in foreign currenciescurrencies.
Assets, liabilities and derivatives denominated in foreign currencies (i.e., currencies other than Swedish kronor) have been converted to Swedish kronor at the year-end exchange rates between such currencies and Swedish kronor. The relevant exchange rates for the currencies representing the largest portions of the Consolidated Group in the statement of financial
position reported assets and liabilities are presented in table below (expressed in Swedish kronor per unit of each foreign currency). The portion at year-end represents the portion of aggregated volumes of assets and liabilities denominated in foreign currency. Foreign currency positions at year-end represent the net of all assets and liabilities in the statement of financial position in each currency. The amounts are book values.
|
| December 31, 2011 |
| December 31, 2010 |
| |||||||||||||||||||||
|
|
|
| Portion at |
|
|
|
|
| Portion at |
|
|
|
| December 31, 2012 |
| December 31, 2011 |
| ||||||||
|
| Exchange |
| year-end, |
| Foreign currency |
| Exchange |
| year-end, |
| Foreign currency |
|
|
|
| Portion a year-end |
| Foreign currency |
|
|
| Portion at |
| Foreign |
|
Currency |
| rate |
| % |
| position |
| rate |
| % |
| position |
|
| Exchange rate |
| % |
| position |
| Exchange rate |
| % |
| position |
|
SKR |
| 1 |
| 70.8 |
| n.a. |
| 1 |
| 68.8 |
| n.a. |
|
| 1 |
| 76.9 |
| e.t. |
| 1 |
| 77.1 |
| n.a. |
|
EUR |
| 8.9447 |
| 7.6 |
| -1,400.5 |
| 9.0020 |
| 9.3 |
| -1,595.7 |
|
| 8.6166 |
| 6.1 |
| -842.9 |
| 8.9447 |
| 2.3 |
| -455.7 |
|
USD |
| 6.9234 |
| 10.5 |
| 1,948.0 |
| 6.8025 |
| 8.4 |
| 1,433.9 |
|
| 6.5156 |
| 5.7 |
| 797.1 |
| 6.9234 |
| 10.4 |
| 2,045.5 |
|
JPY |
| 0.08918 |
| 8.6 |
| -1,588.4 |
| 0.08345 |
| 9.3 |
| -1,594.1 |
|
| 0.07563 |
| 7.3 |
| -1025.0 |
| 0.08918 |
| 7.9 |
| -1,545.7 |
|
CHF |
| 7.3556 |
| 1.4 |
| 261.1 |
| 7.2355 |
| 1.9 |
| 329.1 |
|
| 7.1306 |
| 2.8 |
| 387.4 |
| 7.3556 |
| 1.3 |
| 263.8 |
|
MXN |
| 0.4942 |
| 1.0 |
| -193.6 |
| 0.5500 |
| 1.6 |
| -273.3 |
|
| 0.5020 |
| 0.3 |
| -38.8 |
| 0.4942 |
| 1.0 |
| -193.6 |
|
Others |
| — |
| 0.1 |
| -18.5 |
| — |
| 0.7 |
| -110.5 |
|
| — |
| 0.9 |
| -132.8 |
| — |
| 0.0 |
| 3.4 |
|
Total foreign currency position |
|
|
| 100.0 |
| -991.9 |
|
|
| 100.0 |
| -1,810.6 |
|
|
|
| 100.0 |
| -855.0 |
|
|
| 100.0 |
| 117.7 |
|
The FX risk is limited to the accrued net income in foreign currency and is hedged regularly. In accordance with SEK’s policies for risk management, foreign currency positions related to unrealized fair value changes are not hedged. At year-end, foreign currency positions excluding unrealized changes in fair value amounted to a liability of Skr 4.4 million (year-end 2011: an asset of Skr 80.0 million (year-end 2010: Skr 160.1 million). Assets and liabilities that are denominated in foreign currency are included in the total volume of assets and liabilities with the following amounts (in millions of Swedish kronor).
Consolidated Group |
| December 31, 2011 |
| December 31, 2010 |
|
Skr mn |
| Consolidated Group |
| Consolidated Group |
|
Total assets |
| 319,701.9 |
| 339,687.6 |
|
of which denominated in foreign currencies |
| 285,628.4 |
| 284,816.0 |
|
Total liabilities |
| 305,733.8 |
| 327,117.8 |
|
of which denominated in foreign currencies |
| 284,849.0 |
| 284,581.2 |
|
|
| December 31, 2012 |
| December 31, 2011 |
|
Skr mn |
| Consolidated Group |
| Consolidated Group |
|
Total assets |
| 313,135.6 |
| 319,701.9 |
|
of which denominated in foreign currencies |
| 242,135.8 |
| 296,324.8 |
|
Total liabilities |
| 298,723.4 |
| 305,733.8 |
|
of which denominated in foreign currencies |
| 242,990.8 |
| 296,207.1 |
|
Liquidity risk
Contractual flows
|
| As at 31 December 2011 |
|
| As at 31 December 2012 |
| ||||||||||||||||||||||||||||
Consolidated Group |
| Sum |
| Maturity < 1 |
| Maturity 1 month |
| Maturity 3 months < 1 |
| Maturity 1 |
| Maturity > 5 |
| No |
| Book value |
|
| Sum |
| Maturity < 1 |
| Maturity 1 month < |
| Maturity 3 months < 1 |
| Maturity 1 |
| Maturity > 5 |
| Discount effect |
| Book value |
|
Financial Assets |
|
|
|
|
|
|
|
|
|
|
|
|
|
|
|
|
|
|
|
|
|
|
|
|
|
|
|
|
|
|
|
|
|
|
Cash and cash equivalents |
| 3,749.6 |
| 3,749.6 |
| — |
| — |
| — |
| — |
| — |
| 3,749.6 |
|
| 2,338.2 |
| 2,338.2 |
| — |
| — |
| — |
| — |
| — |
| 2,338.2 |
|
Treasuries/government bonds |
| 2,040.3 |
| — |
| 2,000.0 |
| 1.5 |
| 38.8 |
| — |
| -6.9 |
| 2,033.4 |
|
| 5,132.6 |
| 1.1 |
| 2,058.6 |
| 2,062.2 |
| 1,010.6 |
| 0.0 |
| -21.1 |
| 5,111.5 |
|
Other interest-bearing securities except loans |
| 80,376.2 |
| 8,754.9 |
| 16,437.3 |
| 26,249.5 |
| 21,515.0 |
| 7,419.5 |
| -5,637.7 |
| 74,738.5 |
|
| 84,893.7 |
| 10,936.2 |
| 17,350.1 |
| 30,676.7 |
| 20,995.1 |
| 4,935.6 |
| -7,200.4 |
| 77,693.3 |
|
Loans in the form of interest-bearing securities |
| 75,818.2 |
| 512.1 |
| 1,692.5 |
| 11,581.6 |
| 45,554.6 |
| 16,477.4 |
| -9,613.7 |
| 66,204.5 |
|
| 63,797.9 |
| -18.8 |
| 1,296.3 |
| 5,337.3 |
| 45,350.7 |
| 11,832.4 |
| -5,908.1 |
| 57,889.8 |
|
Loans to credit institutions |
| 26,348.0 |
| 8,182.3 |
| 1,003.0 |
| 2,187.4 |
| 10,309.1 |
| 4,666.2 |
| -556.4 |
| 25,791.6 |
|
| 23,732.9 |
| 5,303.8 |
| 787.2 |
| 2,082.9 |
| 7,882.1 |
| 7,677.0 |
| -1,649.3 |
| 22,083.6 |
|
Loans to the public |
| 125,039.8 |
| 1,756.9 |
| 5,306.9 |
| 17,738.1 |
| 64,710.1 |
| 35,527.8 |
| -17,101.7 |
| 107,938.1 |
|
| 115,126.8 |
| 2,855.3 |
| 5,728.0 |
| 17,544.5 |
| 63,251.4 |
| 25,747.6 |
| 351.4 |
| 115,478.2 |
|
Derivatives |
| 50,044.3 |
| 763.2 |
| 7,646.3 |
| 15,554.1 |
| 17,374.8 |
| 8,705.9 |
| -18,577.3 |
| 31,467.0 |
|
| 40,843.7 |
| 607.7 |
| 6,756.7 |
| 14,662.7 |
| 12,010.4 |
| 6,806.2 |
| -15,132.5 |
| 25,711.2 |
|
Total |
| 363,416.4 |
| 23,719.0 |
| 34,086.0 |
| 73,312.2 |
| 159,502.4 |
| 72,796.8 |
| -51,493.7 |
| 311,922.7 |
|
| 335,865.8 |
| 22,023.6 |
| 33,976.9 |
| 72,366.3 |
| 150,500.2 |
| 56,998.8 |
| -29,560.0 |
| 306,305.8 |
|
|
| As at 31 December 2012 |
| ||||||||||||||
Consolidated Group |
| Sum |
| Maturity < 1 |
| Maturity 1 month < |
| Maturity 3 months < 1 |
| Maturity 1 |
| Maturity > 5 |
| Discount effect |
| Book value |
|
Financial Liabilities |
|
|
|
|
|
|
|
|
|
|
|
|
|
|
|
|
|
Borrowing from credit institutions |
| -14,287.3 |
| -14,276.4 |
| -0.7 |
| -10.1 |
| — |
| — |
| -203.0 |
| 14,490.3 |
|
Borrowing from the public |
| -82.8 |
| — |
| -65.2 |
| -17.6 |
| — |
| — |
| 25.9 |
| 56.9 |
|
Senior securities issued |
| -290,244.5 |
| -5,100.6 |
| -34,879.6 |
| -75,187.0 |
| -142,981.2 |
| -32,096.0 |
| 32,154.4 |
| 258,090.1 |
|
Derivatives |
| -9,492.1 |
| -711.9 |
| -589.6 |
| -1,165.7 |
| -5,455.7 |
| -1,569.2 |
| -6,928.9 |
| 16,421.0 |
|
Subordinated securities issued |
| -2,313.6 |
| 0.0 |
| -10.0 |
| -45.1 |
| -240.7 |
| -2,017.8 |
| -699.1 |
| 3,012.7 |
|
Total |
| -316,420.4 |
| -20,089.0 |
| -35,545.2 |
| -76,425.5 |
| -148,677.6 |
| -35,683.0 |
| 24,349.4 |
| 292,071.0 |
|
|
|
|
|
|
|
|
|
|
|
|
|
|
|
|
|
|
|
Commitments |
|
|
|
|
|
|
|
|
|
|
|
|
|
|
|
|
|
Committed undisbursed loans |
| 5,893.3 |
| -6,651.2 |
| -4,752.4 |
| -3,584.0 |
| 11,924.2 |
| 8,956.7 |
| 20,021.8 |
| 25,915.1 |
|
|
|
|
|
|
|
|
|
|
|
|
|
|
|
|
|
|
|
Cash flow surplus (+) / deficit (-) |
| 25,338.7 |
| -4,716.6 |
| -6,320.8 |
| -7,643.3 |
| 13,746.8 |
| 30,272.5 |
|
|
|
|
|
|
|
|
|
|
|
|
|
|
|
|
|
|
|
|
|
|
|
Accumulated cash flow surplus (+) / deficit (-) |
| 25,338.7 |
| -4,716.6 |
| -11,037.4 |
| -18,680.7 |
| -4,933.9 |
| 25,338.7 |
|
|
|
|
|
In addition to the instruments in the statement of financial position and committed undisbursed loans, SEK has outstanding binding offers of Skr 33.8 billion as well as additional available funds consisting of a credit facility with the Swedish National Debt Office of Skr 100 billion. With regard to deficit with a maturity less than one month and up to five years, SEK has the intention to refinance these through borrowing on the financial markets.
|
| As at 31 December 2011 |
| ||||||||||||||
Consolidated Group |
| Sum |
| Maturity < 1 |
| Maturity 1 month < |
| Maturity 3 months < 1 |
| Maturity 1 |
| Maturity > 5 |
| Discount effect |
| Book value |
|
Financial Assets |
|
|
|
|
|
|
|
|
|
|
|
|
|
|
|
|
|
Cash and cash equivalents |
| 3,749.6 |
| 3,749.6 |
| — |
| — |
| — |
| — |
| — |
| 3,749.6 |
|
Treasuries/government bonds |
| 2,040.3 |
| — |
| 2,000.0 |
| 1.5 |
| 38.8 |
| — |
| -6.9 |
| 2,033.4 |
|
Other interest-bearing securities except loans |
| 80,376.2 |
| 8,754.9 |
| 16,437.3 |
| 26,249.5 |
| 21,515.0 |
| 7,419.5 |
| -5,637.7 |
| 74,738.5 |
|
Loans in the form of interest-bearing securities |
| 75,818.2 |
| 512.1 |
| 1,692.5 |
| 11,581.6 |
| 45,554.6 |
| 16,477.4 |
| -9,613.7 |
| 66,204.5 |
|
Loans to credit institutions |
| 26,348.0 |
| 8,182.3 |
| 1,003.0 |
| 2,187.4 |
| 10,309.1 |
| 4,666.2 |
| -556.4 |
| 25,791.6 |
|
Loans to the public |
| 125,039.8 |
| 1,756.9 |
| 5,306.9 |
| 17,738.1 |
| 64,710.1 |
| 35,527.8 |
| -17,101.7 |
| 107,938.1 |
|
Derivatives |
| 50,044.3 |
| 763.2 |
| 7,646.3 |
| 15,554.1 |
| 17,374.8 |
| 8,705.9 |
| -18,577.3 |
| 31,467.0 |
|
Total |
| 363,416.4 |
| 23,719.0 |
| 34,086.0 |
| 73,312.2 |
| 159,502.4 |
| 72,796.8 |
| -51,493.7 |
| 311,922.7 |
|
|
| As at 31 December 2011 |
| ||||||||||||||
Consolidated Group |
| Sum |
| Maturity < 1 |
| Maturity 1 month |
| Maturity 3 months < 1 |
| Maturity 1 |
| Maturity > 5 |
| No |
| Book value |
|
Financial Liabilities |
|
|
|
|
|
|
|
|
|
|
|
|
|
|
|
|
|
Borrowing from credit institutions |
| -15,655.1 |
| -1,033.7 |
| -6,181.3 |
| -2,582.2 |
| -5,857.9 |
| 0.0 |
| -178.8 |
| -15,833.9 |
|
Borrowing from the public |
| -59.1 |
| -59.1 |
| — |
| — |
| — |
| — |
| — |
| -59.1 |
|
Senior securities issued |
| -290,300.2 |
| -1,707.5 |
| -43,201.5 |
| -63,691.0 |
| -132,965.5 |
| -48,734.7 |
| 32,947.8 |
| -257,352.4 |
|
Derivatives |
| 2,525.2 |
| -507.6 |
| 3,256.3 |
| 6,268.0 |
| -3,817.9 |
| -2,673.6 |
| -25,130.0 |
| -22,604.8 |
|
Subordinated securities issued |
| -2,737.6 |
| 0.0 |
| -10.7 |
| -48.0 |
| -255.7 |
| -2,423.2 |
| -436.8 |
| -3,174.4 |
|
Total |
| -306,226.8 |
| -3,307.9 |
| -46,137.2 |
| -60,053.2 |
| -142,897.0 |
| -53,831.5 |
| 7,202.2 |
| -299,024.6 |
|
|
|
|
|
|
|
|
|
|
|
|
|
|
|
|
|
|
|
Commitments |
|
|
|
|
|
|
|
|
|
|
|
|
|
|
|
|
|
Committed undisbursed loans |
| 3,743.4 |
| -2,955.5 |
| -3,216.4 |
| -11,029.7 |
| 6,676.2 |
| 14,268.8 |
| 21,328.4 |
| 25,071.8 |
|
|
|
|
|
|
|
|
|
|
|
|
|
|
|
|
|
|
|
Cash flow surplus (+) / deficit (-) |
| 60,933.0 |
| 17,455.6 |
| -15,267.6 |
| 2,229.3 |
| 23,281.6 |
| 33,234.1 |
|
|
|
|
|
|
|
|
|
|
|
|
|
|
|
|
|
|
|
|
|
|
|
Accumulated cash flow surplus (+) / deficit (-) |
| 60,933.0 |
| 17,455.6 |
| 2,188.0 |
| 4,417.3 |
| 27,698.9 |
| 60,933.0 |
|
|
|
|
|
With regard to liabilities with maturity between one and three months, SEK has the intention to refinance these through borrowing on the financial markets
|
| As at 31 December 2010 |
| ||||||||||||||
Consolidated Group |
| Sum |
| Maturity < 1 |
| Maturity 1 month |
| Maturity 3 months < 1 |
| Maturity 1 |
| Maturity > 5 |
| No |
| Book value |
|
Financial Assets |
|
|
|
|
|
|
|
|
|
|
|
|
|
|
|
|
|
Cash and cash equivalents |
| 8,798.0 |
| 8,798.0 |
| — |
| — |
| — |
| — |
| — |
| 8,798.0 |
|
Treasuries/government bonds |
| 7,201.6 |
| — |
| 7,201.6 |
| — |
| — |
| — |
| -1,770.3 |
| 5,431.3 |
|
Other interest-bearing securities except loans |
| 110,020.3 |
| 5,027.7 |
| 19,953.0 |
| 39,706.4 |
| 36,562.6 |
| 8,770.6 |
| -9,487.3 |
| 100,533.0 |
|
Loans in the form of interest-bearing securities |
| 85,243.7 |
| 417.5 |
| 4,873.3 |
| 11,846.4 |
| 41,018.2 |
| 27,088.3 |
| -13,437.9 |
| 71,805.8 |
|
Loans to credit institutions |
| 25,357.2 |
| 680.1 |
| 1,626.2 |
| 4,810.8 |
| 8,142.0 |
| 10,098.1 |
| -2,818.3 |
| 22,538.9 |
|
Loans to the public |
| 94,568.4 |
| 3,071.2 |
| 4,980.7 |
| 10,804.4 |
| 52,807.2 |
| 22,904.9 |
| -7,466.5 |
| 87,101.9 |
|
Derivatives |
| 46,880.7 |
| 2,020.6 |
| 8,411.6 |
| 14,953.7 |
| 15,786.4 |
| 5,708.4 |
| -9,220.9 |
| 37,659.8 |
|
Total |
| 378,069.9 |
| 20,015.1 |
| 47,046.4 |
| 82,121.7 |
| 154,316.4 |
| 74,570.3 |
| -44,201.2 |
| 333,868.7 |
|
|
| As at 31 December 2010 |
|
| As at 31 December 2011 |
| ||||||||||||||||||||||||||||
Consolidated Group |
| Sum |
| Maturity < 1 |
| Maturity 1 month |
| Maturity 3 months < 1 |
| Maturity 1 |
| Maturity > 5 |
| No |
| Book value |
|
| Sum |
| Maturity < 1 |
| Maturity 1 month < |
| Maturity 3 months < 1 |
| Maturity 1 |
| Maturity > 5 |
| Discount effect |
| Book value |
|
Financial Liabilities |
|
|
|
|
|
|
|
|
|
|
|
|
|
|
|
|
|
|
|
|
|
|
|
|
|
|
|
|
|
|
|
|
|
|
Borrowing from credit institutions |
| -14,336.2 |
| -3,141.2 |
| -2,122.9 |
| -2,129.6 |
| -6,942.5 |
| — |
| -6.6 |
| -14,342.8 |
|
| -15,655.1 |
| -1,033.7 |
| -6,181.3 |
| -2,582.2 |
| -5,857.9 |
| — |
| -178.8 |
| -15,833.9 |
|
Borrowing from the public |
| — |
| — |
| — |
| — |
| — |
| — |
| -19.3 |
| -19.3 |
|
| -59.1 |
| -59.1 |
| — |
| — |
| — |
| — |
| — |
| -59.1 |
|
Senior securities issued |
| -321,632.7 |
| -6,669.6 |
| -40,956.7 |
| -74,292.3 |
| -151,959.1 |
| -47,755.0 |
| 35,323.2 |
| -286,309.5 |
|
| -290,300.2 |
| -1,707.5 |
| -43,201.5 |
| -63,691.0 |
| -132,965.5 |
| -48,734.7 |
| 32,947.8 |
| -257,352.4 |
|
Derivatives |
| 2,823.4 |
| 207.6 |
| 1,237.1 |
| 2,095.2 |
| 701.3 |
| -1,417.8 |
| -20,880.8 |
| -18,057.4 |
|
| 2,525.2 |
| -507.6 |
| 3,256.3 |
| 6,268.0 |
| -3,817.9 |
| -2,673.6 |
| -25,130.0 |
| -22,604.8 |
|
Subordinated securities issued |
| -4,155.5 |
| — |
| -34.6 |
| -103.9 |
| -554.1 |
| -3,462.9 |
| 1,565.2 |
| -2,590.3 |
|
| -2,737.6 |
| 0.0 |
| -10.7 |
| -48.0 |
| -255.7 |
| -2,423.2 |
| -436.8 |
| -3,174.4 |
|
Total |
| -337,301.0 |
| -9,603.2 |
| -41,877.1 |
| -74,430.6 |
| -158,754.4 |
| -52,635.7 |
| 15,981.7 |
| -321,319.3 |
|
| -306,226.8 |
| -3,307.9 |
| -46,137.2 |
| -60,053.2 |
| -142,897.0 |
| -53,831.5 |
| 7,202.2 |
| -299,024.6 |
|
|
|
|
|
|
|
|
|
|
|
|
|
|
|
|
|
|
|
|
|
|
|
|
|
|
|
|
|
|
|
|
|
|
|
|
Commitments |
|
|
|
|
|
|
|
|
|
|
|
|
|
|
|
|
|
|
|
|
|
|
|
|
|
|
|
|
|
|
|
|
|
|
Committed undisbursed loans |
| 3,341.5 |
| -4,006.9 |
| -4,439.8 |
| -6,821.3 |
| 7,250.9 |
| 11,358.6 |
| 34,863.7 |
| 38,205.2 |
|
| 3,743.4 |
| -2,955.5 |
| -3,216.4 |
| -11,029.7 |
| 6,676.2 |
| 14,268.8 |
| 21,328.4 |
| 25,071.8 |
|
|
|
|
|
|
|
|
|
|
|
|
|
|
|
|
|
|
|
|
|
|
|
|
|
|
|
|
|
|
|
|
|
|
|
|
Cash flow surplus (+) / deficit (-) |
| 44,110.4 |
| 6,405.0 |
| 729.5 |
| 869.8 |
| 2,812.9 |
| 33,293.2 |
|
|
|
|
|
| 60,933.0 |
| 17,455.6 |
| -15,267.6 |
| 2,229.3 |
| 23,281.6 |
| 33,234.1 |
|
|
|
|
|
|
|
|
|
|
|
|
|
|
|
|
|
|
|
|
|
|
|
|
|
|
|
|
|
|
|
|
|
|
|
|
|
|
|
|
Accumulated cash flow surplus (+) / deficit (-) |
| 44,110.4 |
| 6,405.0 |
| 7,134.5 |
| 8,004.3 |
| 10,817.2 |
| 44,110.4 |
|
|
|
|
| |||||||||||||||||
Accumulated cash flow surplus |
| 60,933.0 |
| 17,455.6 |
| 2,188.0 |
| 4,417.3 |
| 27,698.9 |
| 60,933.0 |
|
|
|
|
| |||||||||||||||||
Repayments which are subject to notice are treated as if notice were to be given immediately, except for “Loans to credit institutions”, “Loans to the public”, “Borrowing from credit institutions”,” “ and “Borrowing from the public” where repayments are assumed to occur on maturity date. “Subordinated securities issued” which consists of subordinated debt without maturity date are assumed not to be repaid at the time of the first redemption date. Regarding the subordinated debt, SEK determinescontrols whether the loansinstruments will be redeemed in advance whichof maturity, something SEK does not intend to do.
Differences between book values and future cash flows for financial assets and financial liabilities are reported in the column “No maturity/discount effect”.
Items other than financial instruments with an approximate expected recovery time within less than 12 months:months include: other assets; prepaid expenses and accrued revenues, other liabilities; and accrued expenses and prepaid revenues. All other balance sheet items, other than financial instruments, have an approximate expected recovery time of 12 months or more. For information regarding liquidity risk, see Note 31. The amounts above contain interest.
Liquidity(1) reserve as of December 31, 2012
Market value |
|
|
|
|
|
|
|
|
|
|
|
Skr mn |
| Total |
| SKR |
| EUR |
| USD |
| Other |
|
Cash and holdings in banks available overnight |
| 2,190.2 |
| 2,190.2 |
| — |
| — |
| — |
|
Securities issued or guaranteed by sovereigns, central banks or multilateral development banks |
| 6,156.1 |
| 1,247.5 |
| 1,965.0 |
| 2,135.1 |
| 808.4 |
|
Securities issued or guaranteed by municipalities or other public entities |
| 9,840.6 |
| 4,799.0 |
| 2,776.0 |
| 2,157.3 |
| 108.4 |
|
Covered bonds issued by other institutions |
| 5,026.2 |
| 4,688.5 |
| 337.6 |
| — |
| — |
|
Securities issued by non-financial corporates |
| 848.9 |
| 848.9 |
| — |
| — |
| — |
|
Total |
| 24,062.0 |
| 13,774.1 |
| 5,078.6 |
| 4,292.4 |
| 916.8 |
|
Liquidity(1) reserve as of 31 December, 2011
Market value |
| Total |
| SKR |
| EUR |
| USD |
| Other |
|
Cash and holdings in banks available overnight |
| 3,517.9 |
| 1,550.1 |
| 1,967.8 |
| — |
| — |
|
Securities issued or guaranteed by sovereigns, central banks or multilateral development banks |
| 1,989.9 |
| 1,989.9 |
| — |
| — |
| — |
|
Securities issued or guaranteed by municipalities or other public entities |
| 5,624.3 |
| 4,799.9 |
| 824.4 |
| — |
| — |
|
Covered bonds issued by other institutions |
| 3,155.5 |
| 3,155.5 |
| — |
| — |
| — |
|
Securities issued by non-financial corporates |
| 64.9 |
| 64.9 |
| — |
| — |
| — |
|
Total |
| 14,352.5 |
| 11,560.2 |
| 2,792.2 |
| — |
| — |
|
(1)The Liquidity reserve is a part of SEK’s liquidity placements.
For information regarding liquidity risk, see Note 30, Risk and Capital management.31. The amounts above contain interest.
Note 28.29. Transactions with related parties
SEK defines related parties to the Consolidated Group as:
·shareholder, i.e. the Swedish State
·companies and organizations that are controlled through a common owner, the Swedish State
·key management personnel
The Swedish State owns 100 percent of the company’s share capital. By means of direct guarantees extended by the National Debt Office and EKN — The Swedish Export Credits Guarantee Board, supported by the full faith and credit of Sweden, 31.629.9 percent (year-end 2010: 25.42011: 31.6 percent) of the company’s outstanding loans on December 31, 2011,2012, were guaranteed by the State. The remuneration for these guarantees during 2012 amounted to Skr 212.3 million (2011: Skr 238.7 million; 2010: Skr 328.7 million). SEK administers, in return for compensation, the State’s export credit support system, and the State’s tied aid credit program (the “S-system”). Pursuant to an agreement between SEK and the State, SEK is reimbursed for certain costs under the S-system (see Note 1(d) and Note 24)25).
SEK has a Skr 100 billion credit facility with the Swedish National Debt Office. The remuneration for this credit facility during 2012 amounted to Skr 17.0 million (2011: Skr 17.0 million; 2010: Skr 17.0 million). The Swedish parliament has also authorized the government to enable SEK to purchase state guarantees on commercial terms for new borrowing of up to Skr 250 billion. In JanuaryDecember 2012, both the loan facility and the ability to purchase state guarantees were extended for 2012.2013.
SEK enters into transactions in the ordinary course of business with entities that are partially or wholly owned or controlled by the State. The company also extends export credits (in the form of direct or pass-through loans) to entities related to the State. Transactions with such parties are conducted on the same terms (including interest rates and repayment schedules) as transactions with unrelated parties.
Key management personnel include the following positions:
·The Board of Directors
·The President and CEO
·Other members in the Executive Committee
For information about remuneration and other benefits to key management personnel see Note 5, “Personnel costs”.
The following table summarizes the Consolidated Group’s transactions with its related parties:
|
| 2011 |
|
| 2012 |
| ||||||||||||||||||||
|
| Shareholder, the |
| Companies and |
| Total |
|
| The shareholder, i.e. |
| Companies and |
| Total |
| ||||||||||||
Skr mn |
| Assets/ |
| Interest |
| Assets/ |
| Interest |
| Assets/ |
| Interest |
|
| Assets/ |
| Interest |
| Assets/ |
| Interest |
| Assets/ |
| Interest |
|
Treasuries/government bonds |
| 1,995.3 |
| 13.2 |
| — |
| — |
| 1,995.3 |
| 13.2 |
|
| 3,452.6 |
| 28.5 |
| — |
| — |
| 3,452.6 |
| 28.5 |
|
Other interest-bearing securities except loans |
| — |
| — |
| 3,369.7 |
| 79.4 |
| 3,369.7 |
| 79.4 |
|
| — |
| — |
| 2,571.5 |
| 68.4 |
| 2,571.5 |
| 68.4 |
|
Loans in the form of interest-bearing securities |
| — |
| — |
| 1,200.4 |
| 30.1 |
| 1,200.4 |
| 30.1 |
|
| — |
| — |
| 1,100.0 |
| 36.8 |
| 1,100.0 |
| 36.8 |
|
Loans to credit institutions |
| — |
| — |
| 1,959.9 |
| 24.0 |
| 1,959.9 |
| 24.0 |
|
| — |
| — |
| 1,708.8 |
| 13.8 |
| 1,708.8 |
| 13.8 |
|
Loans to the public |
| — |
| — |
| 538.1 |
| 8.0 |
| 538.1 |
| 8.0 |
|
| — |
| — |
| 451.8 |
| 12.3 |
| 451.8 |
| 12.3 |
|
Due from the State |
| 2,113.8 |
| — |
| — |
| — |
| 2,113.8 |
| — |
|
| 2,161.0 |
| — |
| — |
| — |
| 2,161.0 |
| — |
|
Total |
| 4,109.1 |
| 13.2 |
| 7,068.1 |
| 141.5 |
| 11,177.2 |
| 154.7 |
|
| 5,613.6 |
| 28.5 |
| 5,832.1 |
| 131.3 |
| 11,445.7 |
| 159.8 |
|
Borrowing from credit institutions |
| — |
| — |
| — |
| — |
| — |
| — |
|
| — |
| — |
| — |
| — |
| — |
| — |
|
Borrowing from the public |
| — |
| — |
| — |
| — |
| — |
| — |
|
| — |
| — |
| — |
| — |
| — |
| — |
|
Senior securities issued |
| — |
| — |
| — |
| — |
| — |
| — |
|
| — |
| — |
| — |
| — |
| — |
| — |
|
Other liabilities |
| 115.7 |
| — |
| — |
| — |
| 115.7 |
| — |
|
| 128.4 |
| — |
| — |
| — |
| 128.4 |
| — |
|
Total |
| 115.7 |
| — |
| — |
| — |
| 115.7 |
| — |
|
| 128.4 |
| — |
| — |
| — |
| 128.4 |
| — |
|
|
| 2010 |
|
| 2011 |
| ||||||||||||||||||||
|
| Shareholder, the |
| Companies and |
| Total |
|
| The shareholder, i.e.��the |
| Companies and |
| Total |
| ||||||||||||
Skr mn |
| Assets/ |
| Interest |
| Assets/ |
| Interest |
| Assets/ |
| Interest |
|
| Assets/ |
| Interest |
| Assets/ |
| Interest |
| Assets/ |
| Interest |
|
Treasuries/government bonds |
| — |
| — |
| — |
| 1.0 |
| — |
| 1.0 |
| |||||||||||||
Treasuries/government bonds |
| 1,995.3 |
| 13.2 |
| — |
| — |
| 1,995.3 |
| 13.2 |
| |||||||||||||
Other interest-bearing securities except loans |
| — |
| — |
| 4,314.4 |
| 49.8 |
| 4,314.4 |
| 49.8 |
|
| — |
| — |
| 3,369.7 |
| 79.4 |
| 3,369.7 |
| 79.4 |
|
Loans in the form of interest-bearing securities |
| — |
| — |
| 1,541.8 |
| 26.8 |
| 1,541.8 |
| 26.8 |
|
| — |
| — |
| 1,200.4 |
| 30.1 |
| 1,200.4 |
| 30.1 |
|
Loans to credit institutions |
| — |
| — |
| 1,790.5 |
| 132.0 |
| 1,790.5 |
| 132.0 |
|
| — |
| — |
| 1,959.9 |
| 24.0 |
| 1,959.9 |
| 24.0 |
|
Loans to the public |
| — |
| — |
| 629.6 |
| 12.4 |
| 629.6 |
| 12.4 |
|
| — |
| — |
| 538.1 |
| 8.0 |
| 538.1 |
| 8.0 |
|
Due from the State |
| 1,155.6 |
| — |
| — |
| — |
| 1,155.6 |
| — |
|
| 2,113.8 |
| — |
| — |
| — |
| 2,113.8 |
| — |
|
Total |
| 1,155.6 |
| — |
| 8,276.3 |
| 222.0 |
| 9,431.9 |
| 222.0 |
|
| 4,109.1 |
| 13.2 |
| 7,068.1 |
| 141.5 |
| 11,177.2 |
| 154.7 |
|
Borrowing from credit institutions |
| — |
| — |
| — |
| — |
| — |
| — |
|
| — |
| — |
| — |
| — |
| — |
| — |
|
Borrowing from the public |
| — |
| — |
| — |
| — |
| — |
| — |
|
| — |
| — |
| — |
| — |
| — |
| — |
|
Senior securities issued |
| — |
| — |
| — |
| — |
| — |
| — |
|
| — |
| — |
| — |
| — |
| — |
| — |
|
Other liabilities |
| — |
| — |
| — |
| — |
| — |
| — |
|
| 115.7 |
| — |
| — |
| — |
| 115.7 |
| — |
|
Total |
| — |
| — |
| — |
| — |
| — |
| — |
|
| 115.7 |
| — |
| — |
| — |
| 115.7 |
| — |
|
|
| 2009 |
|
| 2010 |
| ||||||||||||||||||||
|
| Shareholder, the |
| Companies and |
| Total |
|
| The shareholder, i.e. the |
| Companies and |
| Total |
| ||||||||||||
Skr mn |
| Assets/ |
| Interest |
| Assets/ |
| Interest |
| Assets/ |
| Interest |
|
| Assets/ |
| Interest |
| Assets/ |
| Interest |
| Assets/ |
| Interest |
|
Treasuries/government bonds |
| 99.8 |
| 20.9 |
| — |
| — |
| 99.8 |
| 20.9 |
|
| — |
| — |
| — |
| 1.0 |
| — |
| 1.0 |
|
Other interest-bearing securities except credits |
| — |
| — |
| 5,157.7 |
| 77.9 |
| 5,157.7 |
| 77.9 |
|
| — |
| — |
| 4,314.4 |
| 49.8 |
| 4,314.4 |
| 49.8 |
|
Credits in the form of interest-bearing securities |
| — |
| — |
| 1,602.5 |
| 41.0 |
| 1,602.5 |
| 41.0 |
|
| — |
| — |
| 1,541.8 |
| 26.8 |
| 1,541.8 |
| 26.8 |
|
Credits to credit institutions |
| — |
| — |
| 1,963.7 |
| 195.4 |
| 1,963.7 |
| 195.4 |
|
| — |
| — |
| 1,790.5 |
| 132.0 |
| 1,790.5 |
| 132.0 |
|
Credits to the public |
| — |
| — |
| 685.6 |
| 15.6 |
| 685.6 |
| 15.6 |
|
| — |
| — |
| 629.6 |
| 12.4 |
| 629.6 |
| 12.4 |
|
Due from the State |
| 344.5 |
| — |
| — |
| — |
| 344.5 |
| — |
|
| 1,155.6 |
| — |
| — |
| — |
| 1,155.6 |
| — |
|
Total |
| 444.3 |
| 20.9 |
| 9,409.5 |
| 329.9 |
| 9,853.8 |
| 350.8 |
|
| 1,155.6 |
| — |
| 8,276.3 |
| 222.0 |
| 9,431.9 |
| 222.0 |
|
Borrowing from credit institutions |
| — |
| — |
| — |
| — |
| — |
| — |
|
| — |
| — |
| — |
| — |
| — |
| — |
|
Borrowing from the public |
| — |
| 1.4 |
| — |
| — |
| — |
| 1.4 |
|
| — |
| — |
| — |
| — |
| — |
| — |
|
Senior securities issued |
| — |
| — |
| — |
| — |
| — |
| — |
|
| — |
| — |
| — |
| — |
| — |
| — |
|
Other liabilities |
| — |
| — |
| — |
| — |
| — |
| — |
|
| — |
| — |
| — |
| — |
| — |
| — |
|
Total |
| — |
| 1.4 |
| — |
| — |
| — |
| 1.4 |
|
| — |
| — |
| — |
| — |
| — |
| — |
|
Note 29.30. Events after the reporting period
SEK has a Skr 100 billion loan facility
No events with significant impact on the Swedish National Debt Office. The Swedish parliament has also authorizedinformation in this report have occurred after the government to enable SEK to purchase state guaranties on commercial terms for new borrowingend of up to Skr 250 billion. On January 31, 2012, both the loan facility and the ability to purchase state guarantees were extended for 2012. On March 14, 2012, an arbitration proceeding, which can not be appealed, was concluded, to the favor of SEK, with regard to the dispute between SEK and Sparbanksstiftelsernas Förvaltnings AB (SFAB). The dispute relates to SEK’s purchase of shares in Swedbank from SFAB in March 2009. SFAB has also been ordered to reimburse SEK for the expenses it incurred during the arbitration proceedings.reporting period.
Note 30.31. Risk and Capital management.
During 2011,2012, there were no significant changes to SEK’s objectives, principles, risk management methods or methods of measuring risk. Furthermore, neither the types of risk exposures nor the origins of these exposures have changed materially. UncertaintyHowever, during 2012 the reported exposure to different types of spread risks, such as credits spread risk, credits spread risk on own debt and risks, especiallycurrency basis spread risk, increased, primarily as a result of refined methods for calculating market values in SEK’s accounting. As a result, SEK has implemented additional market risk measures for spread risks. See the financial system, increased further in 2011, which may lead to increased losses over time.section “Market Risk” below.
At December 31, 2011,2012, SEK’s risk-weighted assetsamount (RWA), as calculated in accordance with Basel II (without taking into consideration the transitional rules applicable during the current period of transition from Basel I to Basel II), were equal to Skr 65.971.5 billion (year-end 2010:2011: Skr 64.568.4 billion), which implies a Common Equity Tier-1 ratio of 19.619.8 percent (year-end 2010: 18.72011: 18.9 percent), a Tier-1 ratio of 23.323.0 percent (year-end 2010: 22.42011: 22.5 percent) and a total capital adequacy ratio of 23.323.1 percent (year-end 2010: 22.42011: 22.5 percent). In 2009, the Swedish legislature decided to extend the transitional rules until the end of 2011, and in 2011, the legislature determined to further extend the transitional rules. For 2012, therefore, the capital requirement will continue to correspond to the highest capital requirement under the Basel II rules and 80 percent of the capital requirement under Basel I rules. The above-mentioned transitional rules have had no impact on SEK’s risk-weighted assets and capital adequacy ratios, either at the end of 2011 or 2010. For further information on capital adequacy, see Note 26.27.
SEK’s capital adequacy assessment process is deemed to be well in line with the Basel II framework’s underlying principles and concepts. In summary, SEK’s assessment is that SEK’s expected available capital amply covers the expected risks in
the different scenarios that SEK envisages, in a way that supports SEK’s high creditworthiness.
Risk, liquidity and capital management
Risk management is a key factor in SEK’s ability to offer its customers competitive financing solutions and develop SEK’s business activities, and thus contribute to the company’s long-term development.
Providing its customers with financial solutions and products causes SEK to expose itself to various risks that have to be managed. The company’s profitability is directly dependent on its ability to assess, manage and price these risks, while at the same time retaining sufficient capital strength to be able to cope with unforeseen developments. For this reason, risk management is a constant priority for SEK and is continually being developed. Support from SEK’s Board of Directors (the Board), a clear line of decision-making, awareness of risk among our employees, uniform definitions and principles, control of risks incurred within an approved framework and transparency in external accounts form the cornerstones of SEK’s risk and capital management.
It is not only in transactions with customers that risk management skills are vital for success. Based on SEK’s strategy, which has been used for many years, SEK’s borrowing activities benefit from the market’s variousdifferent types of risk preferences. By being flexible and accepting new types of structures at an early stage — while also being able to manage the risks that these imply — the company can satisfy investor demands regarding risk exposure while also obtaining funding on favorable terms. SEK has a conservative policy on liquidity and funding risk, which means, for example, that for all credit commitments —- outstanding credits as well as agreed, but undisbursed credits — will at all times- there must be fully funded throughoutfunding available through maturity. For CIRR credits, which SEK manages on behalf of the maturity period.Swedish state, when evaluating whether it has positive availability the company counts its credit facility with the Swedish National Debt Office, which entitles it to draw on funding with a tenor of up to 10 years, as available funding, despite the fact that no funds have been drawn under this facility.
SEK annually assesses the development of its future capital requirements and available capital, primarily in connection with its yearly three-year business plan. One of the aims of this internal capital adequacy assessment (ICAAP) is to ensure that the size of SEK’s capital is sufficiently in line with risks and supports a high level of creditworthiness. In summary, the conclusion of this assessment is that the expected available capital amply covers the company’s expected risks in the various scenarios envisaged by the company.
Risk management and risk control
SEK defines risk in terms of the probability of a negative deviation from an expected financial outcome. Risk is a balancing of the probability of and consequence of any given event. The term “risk” is generally only used when there is at least one negative consequence of an event. This balancing means that the overall risk may be high, even if the probability is low, if the consequences are serious. Risk management includes all activities that affect the assumption of risk, i.e., SEK’s processes and systems that identify, measure, analyze, monitor and report risks at an early stage. Adequate internal control, consisting of a set of rules, systems and routines,procedures, as well as monitoring adherence to these, is designed to ensure that the company is run in a reliable, efficient and controlled manner. We understand risk control to comprise all activities for measuring, reporting and addressing risks, independent of the (risk-taking) commercial units. SEK exercises risk control from two different perspectives: (i) through risk-related management and control that primarily includes risk management and limits, and (ii) through management and control that is carried out at the company level and that includes organization, corporate governance and internal control.
The chart “General Principles for Governance”, displays SEK’s organization for management and control.
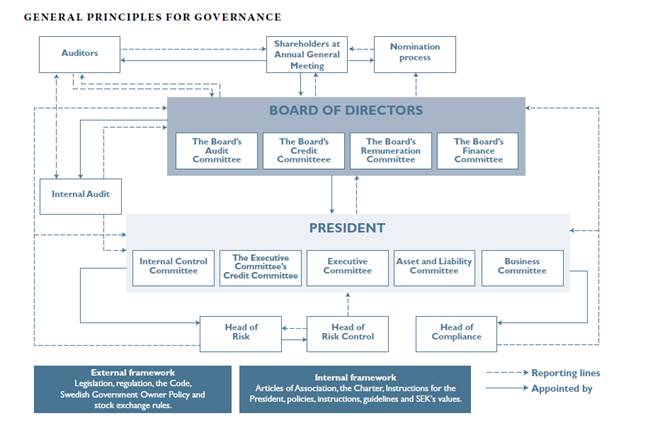
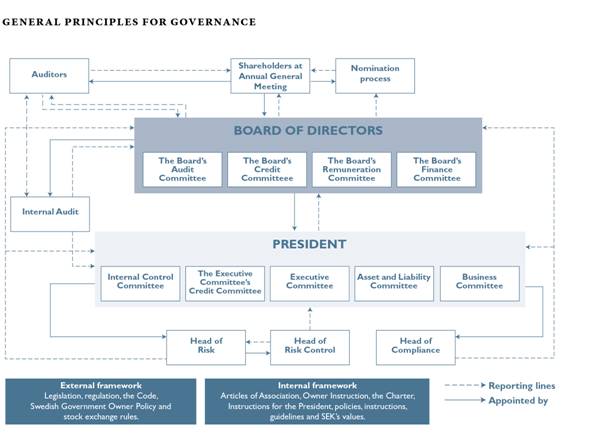
Ultimate responsibility for SEK’s business and for ensuring that it is carried out with adequate internal control lies with the Board. The Board has an annual process of establishing instructions for all of its committees. Minutes from all the committee meetings are furnishedprovided and reported to the Board at its meetingsmeetings. The Board has established a dedicated Finance Committee, which assists the Board with overall issues regarding the company’s financial operations. These financial operations include long- and short-term funding, liquidity management, risk measurement and risk limits, as well as matters regarding policy and quality control. The Finance Committee can make decisions on interest rate and currencymarket risk limits. The Board’s Credit Committee is the Board’s working groupbody for matters relating to loans and credit decisions and matters that are of fundamental significance or generally of great importance to SEK. The Board’s Audit Committee is the Board’s preparatory body for matters relating to the company’s financial reporting and corporate governance report (including the Board’s internal control report).governance. The Board’s Remuneration Committee is the Board’s preparatory committee for matters relating to salaries, pensions and other benefits for the PresidentSenior Executives and overall issues relating to salaries, pensions and other benefits. The Remuneration Committee also prepares proposals on salaries and other benefits for the executive management and on the terms for and outcome of the general incentive system.
The Board draws up central policy documents and, at every meeting, receives a summary report of the risk position. For further information regarding the Board’s work, see Item 6 of this Annual Report on Form 20-F. The President is responsible for day-to-day management. Under the level of the Board and the President, there are committees with various powers to make decisions depending on the type of risks. The Executive Committee’s Credit Committee is responsible for matters relating to credits and credit risk management within SEK. The Executive Committee’s Credit Committee has the right to make credit decisions within the scope of its mandate and on the basis of the order of delegation decided by the Board. The Asset and Liability Committee manages issues such as those regarding SEK’s overall risk level and proposes market risk limits and methods for risk measurement and the allocation of internal capital. Within the framework of the Board’s overall capital policy, the Asset and Liability Committee draws up guidelines for the distribution of responsibility, the handling of SEK’s risk types and for the relationship between risk and capital. The Internal Control Committee is responsible for managing and addressing operational risk and following up on incident reports, and also constitutes the drafting and decision-making body for new products. The Board’s Business Committee assesses, among other things, whether individual transactions fulfill the criteria set out in the instruction from the state. The
President chairs all of the above-mentioned committees, with the exception of the Business Committee, which is chaired by the COO.
SEK’s risk-related management and control is directed at credit, market, liquidity, and operational risks. Management and control at the corporate level includes the entire company, i.e., all risks, but they are directed especially at risk appetite, capital targets and business environment risk.
Within SEK, responsibility for risk management is based on the principle of three “lines of defense,” the aim of which is to clarify roles and responsibility for risk management. The first line of defense consists of business units (including support functions) that “own” and manage risks. The Risk Control and Compliance function constitutes the second line of defense and it is responsible for the monitoring and control of risk and ensuring compliance. The third line of defense consists of Internal Audit, whose task is to undertake independent inspection and supervision of both the first and second lines of defense.
Independent risk control is carried out by SEK’s Risk Control function, which is the second line of defense. This function reports to SEK’s Head of Risk but is also obliged to report to the President. The Head of Risk reports to the Board. Based on a portfolio perspective, Risk Control is responsible for the control, analysis and reporting of financial risks and monitoring, analyzing and reporting of operational risk. Risk Control is also responsible for ensuring that the company complies with the framework for operational risk. The financial risks primarily consist of credit and counterparty risks, market risks, as well as liquidity and funding risk. This function oversees the company’s scope and alignment regarding risk strategy, risk management and rating methodology for credit risk classification, as well as calculating, analyzing and forecasting regulatory capital adequacy and the need for economic capital. This function is also responsible for the choice of methods and models and acts as a center of excellence with the aim of contributing to increasing SEK’s risk management capacity in order to analyze the effects of diversification and risk mitigation. An important part of Risk Control’s work consists in ensuring that the function is keeping pace with the business functions in terms of its knowledge of the risks that occur in the company, enabling it to manage new issues that arise within this area.
The second line of defense also consists of aan independent Compliance function. This function supports the organization in ensuring that operations are run according to applicable regulations, and also monitors compliance with regulations within the company. The Compliance function reports to the President but is also obliged to report to the Board. Internal Audit, which is the third line of defense, investigates and assesses the efficiency and integrity of the risk management described above. Internal Audit reports to the Board. Internal Audit performs auditing activities in accordance with by the Board approved audit plan. Internal Audit reports regularly to the Board, the Board’s Audit Committee and to the President and also informs SEK’s executive managementthe Internal Control Committee on a regular basis.
To further strengthen the third line of defense, in In 2011 the Board took the decision to outsource the Internal Audit function to an external party as of January 1, 2012.party. This is in order to ensure access to specialist expertise and global networks, which are considered to be of particular importance at a time of extensive regulatory changes.
It is a fundamental principle for all control functions to be independent ofin relation to commercial activities.
Aim, focus and objectives of risk management
As stated above, risk management is a central part of SEK’s business model and activities. Meeting customers’ financing needs does not rely only on efficient and innovative risk management in respect of the credit transactions themselves. It is equally important to be able to take advantage of market opportunities in order to obtain funding and manage liquidity on attractive terms. This in turn provides the basis for favorable conditions for granting credits. The focus of risk management is mainly to reduce and limit risks to a set extent. The objective of risk management is to create conditions under which SEK is able to meet the needs of its customers for financial solutions. SEK also wishes to take advantage of business opportunities in such a way that net risks are at levels that are sustainable in the long term in relation to SEK’s risk capital. Risk management comprises two important components. One is to manage risks so that net risks are kept at the right level. The other is to assess the capital requirement and ensure a level for and composition of risk capital that is aligned with business activities.
During 2011, there were no significant changes to SEK’s objectives, principles, risk management methods or methods of measuring risk. Furthermore, the exposure to various types of risk, or their origins, has not changed materially. Uncertaintybusiness model is, in essence, simple and risks, especiallytransparent. The company borrows money in the financial system, increased furtherform of bonds. Regardless of the conditions with regard to debt investors, borrowings are swapped to a floating interest rate. Funds that are not used immediately for lending (at a floating rate of interest) are retained to provide lending capacity in 2011, which may leadthe form of liquidity placements (at a floating rate of interest). Market risks are therefore limited and primarily occur in the form of unrealized changes in value as a result of various spread risks that can have significant impact on both overall market risk and earnings. The company does not assume any refinancing risk. To ensure access to increased losses over time. Thiscompetitive funding in both good and difficult times, the company’s funding is diversified. The company’s strategy is to be flexible and available on all markets, and, using derivatives, to “create” borrowing in the reason forcurrency that the increase in credit loss reserves not linked to specific counterparties.customer (and ultimately the exporter)
requires. This enables the company to take advantage of the best funding opportunities irrespective of market, which contributes to diversification and risk reduction.
Core Principles for Risk Management
SEK shall carry out its business in such a manner that SEK is perceived by its business counterparties as a first-class counterparty.
SEK shall be selective in its choice of counterparties in order to ensure high creditworthiness.
AllIn order to avoid refinancing risk, it is SEK’s policy that for all credit commitments shall at all times- outstanding credits as well as agreed, but undisbursed credits — there must be fully funded throughoutfunding available through maturity. For CIRR credits, which SEK manages on behalf of the Swedish state, when evaluating whether it has positive availability the company counts its credit facility with the Swedish National Debt Office, which entitles it to draw on funding with a tenor of up to 10 years, as available funding, despite the fact that no funds have been drawn under this facility.
SEK shall at all times have risk capital well above regulatory requirements.
SEK’s risk management
SEK’s risk management primarily involves using various techniques to transform and reduce gross risks into net risks that are at an acceptable level for SEK.levels that are sustainable in the long term in relation to SEK’s risk capital. The matrix below describes management’s view on risk management for SEK’s most significant risk categories.
|
|
|
|
|
|
|
|
|
|
Credit risk |
|
|
|
|
|
|
|
|
|
Counterparty risk in derivative transactions |
| In order to keep counterparty risks at a controlled and acceptable level, SEK methodically chooses counterparties with good credit quality for derivative transactions. To further reduce these risks, SEK strives to obtain collateral agreements from counterparties before entering into a derivative transaction. This means that the highest permitted risk level is decided in advance, regardless of market value changes that may occur. |
| The combination of a choice of counterparties and collateral agreements leads to limited net risk. All exposures related to counterparty risk in derivative transactions must be contained within set limits. |
|
|
|
|
|
Market risks — Interest rates In order to be able to offer credits — often with complex disbursement and repayment structures — with fixed interest at attractive terms, it is cost-efficient for SEK to take on some interest rate risk. SEK’s borrowing is also often made at fixed interest. SEK primarily sets interest rate terms based on the various needs and preferences of customers and counterparties. Consequently, assets and liabilities can to some extent have different fixed interest periods, which leads to interest rate risk. |
| SEK uses various techniques for measuring and managing interest rate risks which are designed to provide a clear picture and good control of these risks. Using different derivatives, the original interest rate risks in assets and liabilities are normally transformed from long-term to short-term interest terms in currencies with well-functioning markets. |
| The net risk is limited. Market-related counterparty risk remains in respect of counterparties in derivative transactions to the extent that derivatives are used to manage interest rate risk. |
Market risks — Currency SEK’s lending and a large proportion of its borrowing can take place in the currencies chosen by the borrower and investor, respectively. It seldom happens that borrowing and lending are made in the same currency and therefore directly balance each other. Liquidity placements and some borrowing may, insofar as market conditions allow, be made in the currencies SEK chooses in order to match assets and liabilities. |
|
|
|
|
|
|
|
|
|
Market risks — Other A large portion of SEK’s funding is carried out on terms that are adapted to investor requirements regarding exposure to different risks. Such adjustments provide exposure not only to credit risk but also to changes in different market prices and other market-related variables, such as indices. These adjustments result in funding transactions that contain embedded derivatives. The risk in these derivatives must be managed to avoid undesirable exposures for SEK. SEK’s business model gives rise to spread risks, such as credit spread risk, currency basis spread risk and credit spread risk on own debt. |
|
|
|
|
|
|
|
|
|
Liquidity and funding risk |
|
|
|
|
|
|
|
|
|
Operational risk SEK’s transactions often have long maturities and a high degree of complexity, which creates operational risk. The extensive risk management carried out by SEK for different types of risk is often complex and therefore leads to additional operational risk. |
|
|
|
|
New regulations
Authorities are requiring financial institutions to improve both capital and liquidity levels to ensure that institutions are strong and able to also cope with stressed situations. The overall aim of the regulatory reforms is to contribute to a stable and well-functioning financial system. The new regulatory requirements are being phased in. The table below provides a brief summary of new and proposed regulations and how these affect SEK.
New CRR/CRD IV and EMIR regulations
Purpose | Method | Date | SEK status | |||
Capital base | ||||||
The purpose is to improve the quality and size of banks’ capital base. The new regulations also aim to increase transparency regarding the different components that make up the capital base. | Most of Tier-1 Capital is to consist of shareholders' funds. Additional capital requirements, buffers, are being introduced in addition to minimum requirements. | The intention was to introduce the new regulations on January 1, 2013. However, the finalization of CRD IV has been delayed and no new establishment date had been announced at the time of publication. | In conjunction with its annual internal capital adequacy assessment, SEK is conducting a number of analyses that indicate SEK will amply meet the capital requirements as currently defined in CRD IV. | |||
Adjusted risk weights for financial institutions | ||||||
The aim is for the Basel Formula to reflect the fact that the correlation between financial institutions is higher than expressed in current calculations according to the IRB approach under Basel II. | The correlation in the Basel formula, for all exposures to financial institutions, is to increase by 25 percent. | The intention was to introduce the new regulations on January 1, 2013. However, the finalization of CRD IV has been delayed and no new establishment date had been announced at the time of publication. | In conjunction with its annual internal capital adequacy assessment, SEK is conducting a number of analyses that indicate SEK will amply meet the capital requirements as currently defined in CRD IV. | |||
Credit valuation adjustment (CVA) | ||||||
Basel III will also include capital requirements for potential changes in the creditwothiness of derivative counterparties (credit valuation adjustment risk). | Credit valuation adjustment risk is to be calculated for all OTC derivative contracts, except for credit derivatives used as credit protection. | The intention was to introduce the new regulations on January 1, 2013. However, the finalization of CRD IV has been delayed and no new establishment date had been announced at the time of publication. | In conjunction with its annual internal capital adequacy assessment, SEK is conducting a number of analyses that indicate SEK will amply meet the capital requirements as currently defined in CRD IV. | |||
Leverage ratio | ||||||
In addition to the risk-based capital adequacy requirements, a leverage ratio measure is to be introduced. Unlike traditional capital requirements, the leverage ratio does not take account of the differences in risk weights between assets. The purpose is to limit the size of assets in relation to capital. | The leverage ratio measure means that banks must have Tier-1 Capital of more than 3 percent of their total assets and their off-balance-sheet commitments. | The aim is to introduce a mandatory leverage ratio measure from January 1, 2018. This measure is to be reported to the supervisory authority from 2013 to 2017 and disclosed from 2015. | In conjunction with its annual internal capital adequacy assessment, SEK is conducting a number of analyses that indicate SEK will amply meet the requirements. | |||
Liquidity coverage ratio | ||||||
The purpose of this measure is to ensure that banks have sufficient liquid assets to cope with real and standardized simulated cash flows under a stressed period of 30 days. | Banks are being required to maintain sufficiently high-quality assets, which can be converted into cash in order to be sufficient for a 30-day stress scenario. This scenario has been defined by the supervisory authority. | In November 2012 the Swedish Financial Supervisory Authority released the final version of the new binding metric representing the Swedish version of LCR. In this version, which is binding as of January 1, 2013, a ratio of 100 percent is needed for all currencies combined, as well as for EUR and USD, respectively. | At January 1, 2013 SEK amply meets the capital requirements as defined by the Swedish Financial Supervisory Authority. | |||
Long-term liquidity measure | ||||||
The purpose of this measure is to ensure that a financial institution funds its illiquid assets with long-term and stable financing in order to reduce liquidity risk. | Requirements for long-term assets to be funded by certain minimum levels of stable financing. | The long-term liquidity measure should be at least 100 percent, but unlike the liquidity coverage ratio it is not yet a binding measure in Sweden. The proposed EU implementation date for this measure is January 1, 2018. | The ratio for December 2012 was 100 percent. As a result of its conservative policy on liquidity and financing risk, SEK has no need to change the current financing structure in order to meet this structural quantitative liquidity measure. It is, however, worth noting that there is considerable uncertainty regarding the final format of this measure. | |||
OTC derivatives | ||||||
As a result of the financial crisis, it was noted that there was a need for a regulation to manage OTC derivatives, as the lack of regulation was considered to be a contributory factor to the crisis. | All standardized OTC derivative contracts are to be cleared by a central counterparty, CCP. Derivative contracts will also be reported to central trade repositories. Derivative contracts that are not cleared will be subject to higher capital requirements. Robust risk mitigation techniques must be applied for non-centrally cleared transactions. An EU proposed framework has been developed in the form of the European Market Infrastructure Regulation (EMIR), for a which a regulation has been adopted. Work is ongoing to strengthen this act with a large number of technical standards. | Some of the EMIR obligations could begin to apply in the first quarter of 2013 but in some cases obligations are deferred. It is unlikely that the first clearing obligation will come into force before 2014. | SEK has a relatively large derivative portfolio and the new regulations will therefore have an impact on SEK’s operations. Preparations for the OTC derivative reform have been undertaken in project form since November 2011. |
Credit risk
Credit risk represents the risk of the loss that would occur if a borrower or other party in another contract involving counterparty risk and any guarantors were unable to fulfill their obligations in accordance with contractual terms and conditions. Exposure to credit risk can be related to lending, liquidity placement and other assets, as well as guarantees, other risk-mitigating instruments, and positive market values in other contracts. Credit risk exposure to a counterparty is always preceded by a decision on a credit or counterparty limit, which the exposure must not exceed. Credit risks are SEK’s largest risk. Credit risks are inherent in all assets and other contracts in which a counterparty is obliged to fulfill obligations. Credit risks are limited through the methodical and risk-based selection of counterparties, and they are managed, for example, through the use of guarantees and credit derivatives.
Events in 20112012
In 2011,2012, the level of risk in SEK’s total net exposures, defined as the average risk weighting,weight, increased marginally and the total volume of risk-weighted assetsamount (RWA) increased slightly. During the year,2012, SEK has changed its approach to providing offers. The revised method involves providing binding or non-binding offers. Binding offers are included in commitments and in SEK’s total net exposures. Furthermore there have been minor changes in the composition of SEK’s total net exposures. ExposuresDuring 2012 the exposures to corporates have increased, while exposures to financial institutions have declined. The main reason of the reduction in exposures to financial institutions is that CDS-covered exposures to corporates have matured during the year. The increase in net exposures to government export credit agencies is mainly due to the revised method for providing offers.
The migration matrix below based on internal risk classification, overall shows a marginally positivenegative migration for risk classes A+AAA to BB-BBB and a more neutral trend for other risk classes. The number of counterparties that received a modified risk class is moreless than in 2010.2011.
Migration matrix; corporates and financial institutions under the IRB approach at December 31, 20112012
The migration matrix displays the rating breakdown as of December 31, 20112012 for counterparties for which SEK applies the IRB method, relative to ratings as of December 31, 2010. For information regarding rating linked to financial assets as well as the part of the credit exposures where SEK applies the IRB method, see page F-59 under Note 27.
2011. The table should be read row by row. The first row displays the percentage breakdown by rating as of December 31, 20112012 for the counterparties that as of December 31, 20102011 were rated ‘AAA’. The second row displays the percentage breakdown by rating as of December 31, 20112012 for the counterparties that as of December 31, 20102011 were rated ‘AA+’, and so on. The shaded diagonal thus displays the percentage of counterparties whose rating was unchanged as of December 31, 2011,2012, compared with December 31, 2010.2011.
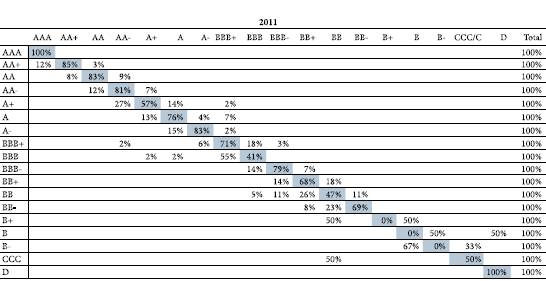
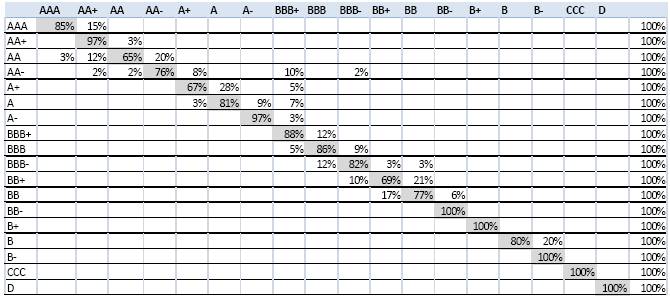
Risk management
SEK applies the Foundation internal ratings-based approach (IRB approach) to calculate the capital requirement for credit risks. The Swedish Financial Supervisory Authority has, however, exempted SEK until December 31, 20122015 for the below-mentioned exposures.exposures mentioned below.
·Exemption from the IRB approach for export credits guaranteed by the Swedish Export Credits Guarantee Board (EKN) or equivalent foreign entities within the OECD.
·Exemption from the IRB approach for the central governments exposure class.
·Exemption from the IRB approach for exposures in the Customer Finance businessFinance(1) area.
The standardized approach is used to calculate the capital requirement for credit risks for exposures that are exempted from the IRB approach. It is possible to request an extension of the approved exemptions. InIf, in the event thatof a request, the Swedish Financial Supervisory Authority does not grant an extension, SEK will have a three yearthree-year period in which to implement the IRB approach.
All of SEK’s counterparties must be assigned a risk classification or rating internally. For exposures that are included in the exemptions from the IRB approach, granted to SEK by the Swedish Financial Supervisory Authority, external rating isratings are used. External rating isratings are also used for securitization positions. The decision concerning an internal rating for a counterparty is taken by SEK’s Rating Committee. The members of the Rating Committee are appointed by the President
based on the members’ previous experience of risk assessment and experience of credit rating.ratings. The Rating Committee members come from various functions within SEK, with a majority of the members representing non-commercial functions within the company. SEK aims to maintain continuity within the Rating Committee. The design of the company’s IRB system includes a number of both operational and analytical aspects. The operational design concerns the organizational process for and control of how counterparties are assigned risk classifications. Important operational aspects include where in the company the risk classification is made and established, and how the responsibility for monitoring, validation and control is distributed throughout the organization. The analytical design concerns how risk is measured and assessed. This includes how loss concepts are defined and measured, and which methods and models are used for risk classification and the calculation of risk. The analytical design of risk classification systems often differentiates significantly between different financial institutions. A common factor among the systems, however, is that every credit exposure within a specific risk class is associated with a number of quantifiable risk expressions. The two terms that together primarily express the credit risk of an exposure are the probability of default or cessation of payments by a borrower (Probability of Default, PD) and the portion of the loan that will be lost in the event of a default (Loss Given Default, LGD). Using these two parameters and the size of the outstanding exposure at default (Exposure at Default, EAD);, it is possible to calculate the statistically expected loss (Expected Loss, EL) for a given counterparty exposure. By using what is known as the Basel formula, the unexpected loss (UL) can also be estimated. In the Foundation IRB approach, only the PD is estimated internally. The values of the other parameters are set by the supervisory authority.(1)(2)
An internal risk classification system is a tool for improving the precision of credit assessments and making them consistent. By storing historical data of counterparties’ defaults and credit rating history, SEK is able to monitor its credit assessments and create a clearer “institutional memory” within the organization. This historical data helps SEK in revealing and correcting systematic erroneous assessments. By allocating each counterparty an explicit (cardinal) default probability,In order to identify the company can check its owndifferences between SEK’s risk classification againstand the ratings of external sources.rating agencies, SEK conducts outcome analyses showing the correlation between the company’s internal risk classification and the ratings of rating agencies. These differences can be due to both differences in the analytical assessment and the date of the analyses.
SEK’s methodology for internal risk classification is based on both qualitative and quantitative factors. Within SEK, risk classification is based, to a great extent, on analyst assessments. Individual counterparties are rated through the use of different methods for corporate and financial institutions. The aim of using a common rating scale for all counterparties is essentially to be able to correctly price and quantify risk over time for SEK’s counterparties and thereby maintain the desired level of risk in the company. The tool used for this is the credit rating, which is an ordinal ranking system. Risk classification within SEK is therefore largely an issue of relative assessment. This risk classification does not aim to estimate the precise probability of default, but rather to place counterparties in a category of comparable counterparties, based on a risk perspective.
SEK intends to start using insurance solutions for risk mitigation. In 2011, SEK applied for approval by the Swedish Financial Supervisory Authority to use the Foundation internal rating-based approach to calculate risk-weighted exposures to insurance companies. On January 12, 2012 the Swedish Financial Supervisory Authority granted SEK permission to use the Foundation internal rating-based approach.approach to calculate risk weighted exposures to insurance companies. During the year two insurance companies have been given an internal rating and limit.
SEK’s IRB system comprises all of the various methods, working and decision-making processes, control mechanisms,
(1) Customer Finance is an area where SEK under cooperation agreements with export companies provides cross-border financing, primarily in the form of leasing and installment credits to the exporting companies customers.
(2) Under normal circumstances the maturity will be 2.5 years and the LGD will be 45 percent.
guideline documents, IT systems, and processes and procedures that support risk classification and the quantification of credit risk.
SEK’s IRB system is evaluated on an annual basis by means of quantitative and qualitative validations.
Credit decision process
In order to clarify the credit process, SEK has during 2012 developed and introduced a standard credit policy, which is referred to within the company as “the Standard”. Since September 2012, the standard credit policy has been a central part of the company’s lending in line with SEK’s mandate based on the owner’s directive. The Standard specifies a number of requirements, all of which must be met in order for a limit or credit proposal to be deemed to come within the Standard. If these requirements are not met and consequently fall outside the Standard, the decision is escalated to a higher decision-making authority. The aim of introducing the standard credit policy is to achieve a more efficient, effective and clearer credit process.
Limits and monitoring
SEK uses different types of limits to manage lending and to limit risks to a set extent. ThisThe limit expresses the highest acceptable exposure to a risk counterparty and type of credit risk for each future date. For example, SEK has sublimits that restrict exposures resulting from derivative contracts in respect of a risk counterparty. A limit granted by the appropriate committee permits SEK’s business functions to;to conclude, within such limit, business transactions in SEK’s name that imply credit risk in respect of the relevant counterpart.counterparty. All limits and risk classifications are reviewed at least once a year. Exposures judgeddeemed to be problem credits(2)credits(3) are subject to more frequent reviews, and the limit is blocked(3)blocked(4) for identified problem credits. The purpose of this is to be able to identify, at an early stage, commitments with elevated loss risk and ensure that the risk classification reflects the actual risk of the risk counterparty.
Counterparty risk in derivative transactions
Counterparty risk in derivative transactions — which is a kindtype of credit risk — arises when derivative transactions are used
(1)Under normal circumstances the maturity will be 2.5 years and the LGD will be 45 percent.
(2)An exposure (receivable) to a risk counterparty that is judged by SEK to have a high probability of not fulfilling all of its commitments in accordance with the original contractual terms at the due date.
(3)A blocked limit means that no new deals may be concluded with the counterparty.
to manage risks. In order to limit this risk, SEK enters into such transactions solely with counterparties with good creditworthiness. Risk is further reduced by SEK’s entering into ISDA Master Agreements, with associated collateral agreements, known as Credit Support Annex, with its counterparties before entering into derivative transactions. Any exemptions to this require a special decision, which is taken as a part of the credit process for the relevant counterparty. These collateralbilateral agreements mean that the highest permitted risk levels, in relation to each individual counterparty, are agreed in advance. The formulation of these agreements is designed to ensure that agreed risk levels (known as threshold amounts) will not be exceeded, regardless of market value changes that may occur.
For counterparty exposures that exceed the threshold amounts under the relevant Credit Support Annex as a result of market value changes, credit support is demanded so that the counterparty exposure is reduced to the pre-agreed level. The positive gross value of all derivative transactions in the balance sheet as of December 31, 20112012 was Skr 31.5 billon25.7 billion (year-end 2010:2011: Skr 37.731.5 billion). After netting on the basis of the current Credit Support Annex (by counterparty), the exposure was Skr 16.712.8 billion (year-end 2010:2011: Skr 23.616.7 billion), i.e., Skr 14.812.9 billion less than the gross exposure (year-end 2010:2011: Skr 14.114.8 billion less than gross exposure). As of December 31, 20112012 counterparties had paid Skr 15.614.3 billion (year-end 2010:2011: Skr 14.315.6 billon). At the end of 2011,2012, SEK had provided credit support under a Credit Support Annex with different counterparties amounting to Skr 4.32.5 billion (year-end 2010:2011: Skr 0.74.3 billion), reducing total counterparty risk exposure for SEK by the corresponding amount. At the end of 2012, SEK had counterparty risk in derivative contracts in respect of 46 counterparties (year-end 2011: 50).
The majority of SEK’s derivative contracts are what are known as OTC (over the counter) derivatives, i.e. derivative contracts that are not settled on a stock exchange. At the end of 2012, SEK’s OTC derivative contracts were not subject to central clearing, for further information on OTC derivatives see “New regulations”.
Credit risk protection
SEK’s credit risks are limited by the methodical and risk-based selection of counterparties and are managed, among other things, by the use of guarantees and credit derivatives (“CDSs”). A purchased CDS entitles the holder under certain circumstances — including the default of the underlying risk-covered counterparty — to sell an asset, with implied risk for the underlying counterparty, at its nominal value to the issuer of the CDS. Accordingly, credit derivative transactions
(3) An exposure (receivable) to a risk counterparty that is judged by SEK to have a high probability of not fulfilling all of its commitments in accordance with the original contractual terms at the due date.
(4) A blocked limit means that no new deals may be concluded with the counterparty.
make it possible for the buyer to create a combined risk of the underlying counterparty and the issuer of the CDS. SEK uses CDSs to convert exposures to individual counterparties into combined exposures, in which one counterparty (the issuer of the CDS) is a financial institution.
Overall risk is further reduced through the use of contractsISDA Master Agreements with associated Credit Support Annexes that require individual issuers of CDSs to provide collateral in the event that the market value of the issued credit derivative transactions exceeds a certain level. The market value of a CDS is, among other things, derived from the change in creditworthiness of the underlying risk-covered counterparty. As a result, if there is a deterioration in the creditworthiness of the underlying counterparty whose credit risk is covered by the CDS, SEK successively receives collateral for the risks covered. This risk mitigation technique is, therefore, effective from a risk management perspective.
Guarantees
SEK relies to a large extent on guarantees in its lending. The guarantors are principally made up of government export credit agencies, such as the Swedish Exports Credit Guarantee Board (EKN), the Export Import Bank of the United States (USEXIM), the Exports Credits Guarantee Department of the United Kingdom (ECGD), Compagnie Financière pour la Commerce Exterieure (Coface) of France and Euler Hermes Kreditversicherungs AG of Germany, as well as financial institutions and, to a lesser extent, non-financial corporations. Credit risk is allocated to a guarantor in accordance with SEK’s policy and therefore, when disclosing net credit risk exposures, the majority of SEK’s guaranteed credit exposure is shown as exposure to sovereign counterparties. As of December 31, 2011,2012, government export credit agencies guaranteed a total of Skr 123.1159.4 billion, or 39.346.0 percent, of SEK’s total credit exposures (year-end 2010:2011: Skr 123.8123.1 billion, or 35.839.3 percent). Skr 110.0116.3 billion covered corporate exposures, Skr 5.34.7 billion covered exposures to financial institutions, Skr 0.5 billion covered regional government exposures and Skr 7.837.9 billion covered government exposures (year-end 2010:2011: Skr 109.6110.0 billion, Skr 6.15.3 billion, Skr 0.0 billion and Skr 8.17.8 billion, respectively). The increase in government export credit agencies covering exposures to sovereign counterparties is due to SEK switching in 2012 to a revised method for providing offers, which is described in the Events in 2012 section above. The guaranteed corporate exposures are included in the class of financial instruments referred to as “Loans to the public”, the guaranteed exposures to financial institutions are in the class “Loans to credit institutions” and the guaranteed exposures to governments are in the class “Loans to the public”.
Credit derivatives
At year-end 2011,2012, Skr 19.411.6 billion of SEK’s assets waswere secured through CDS coverage obtained from 1918 different financial institutions (year-end 2010:2011: Skr 26.819.4 billion, obtained from 19 different financial institutions). Skr 19.411.6 billion covered corporate exposures and(year-end 2011: Skr 0.0 billion covered exposures in securitization positions (year-end 2010: Skr 25.3 billion and Skr 1.519.4 billion). All exposures covered by CDSs are included in the class of financial instruments known as “Other interest-bearing securities, except loans”, “Loans in the form of interest-bearing securities” or “Loans to the public”. SEK has what are referred to asISDA Master Agreements with associated collateral agreements in place with issuers of credit derivatives.
Collateral
SEK uses various types of collateral or risk mitigation to reduce or transfer credit risks. Approved risk mitigation
methods under ISDA Master Agreements with Credit Support Annex generally consist of cash and, to a limited extent, government bonds. Any collateral that SEK demands must be managed and documented in a manner such that the collateral fulfills its function and can be used in the intended manner when needed.
When a credit decision is made, the creditor’s assessed creditworthiness and ability to repay are taken into account, together — where applicable — with the value of any collateral. The credit decision may be made on condition that certain collateral is provided.
Concentration risks
SEK’s exposures are regularly analyzed and reported in respect of risk concentration dependent on (i) the size of individual commitments, (ii) domicile and (iii) sector. The analysis refers to both direct and indirect exposures from, for example, credit derivatives. The previously described concentration risks mentioned above are reflected in SEK’s calculation of economic capital for credit risks where they contribute to a higher capital need than the capital requirement calculated under Pillar 1. Pillar 1 does not take concentration risks into account when calculating capital requirements. For further information about concentration risks, see the Internal Capital Adequacy Assessment section on page F-96.
Large exposures
According to Swedish Financial Supervisory Authority regulations FFFS 2007:1, a large exposure refers to an exposure that accounts for at least 10 percent of an institution’s capital base. The aggregate amount of SEK’s large exposures as of December 31, 2011,2012, was 307.9282.2 percent of SEK’s total capital base, and consisted of risk-weighted exposures to 22 21
different counterparties, or counterparty groups, of which the majority relate to combined exposures for which more than one counterparty is responsible for the same payments (year-end 2010: 277.52011: 307.9 percent and 2022 different counterparties or counterparty groups). The changes in large exposure rules came into force on December 31, 2010, with transitional rules applicable through to the end of 2012. According to these rules, financial institution exposures are treated in the same way as corporate exposures. A 100 percent weighting is applied for these exposures, instead of the previous 20 percent weighting. SEK applies the transitional rules, which enable the previous method of treatment to be applied to those financial institution exposures incurred no later than 2009. Exposures to financial institutions incurred since December 31, 2009, however, have 100 percent weighting. SEK complies with these rules and reports its large exposures to the Swedish Financial Supervisory Authority on a quarterly basis. In order to ensure that the company can meet the new rules at the point that the transitionary rules are no longer applicable, which is January 1, 2013, SEK has successfully adapted the size of its exposures to different counterparties in the financial institutions category.
In order to monitor large exposures, SEK has defined internal limits, which are as well asmonitored daily together with other limits monitored daily.limits. The internal limits are approved by the Executive Committee’s Credit Committee or the Board’s Credit Committee.
Market risks
Market risk occurs when the terms of a contract are such that the size of the payments linked to the contract or the value of the contract vary due to a market variable, such as an interest rate or exchange rate. The resulting market risks are known as interest rate risk and currency risk, which are also the market risks to which SEK is primarily exposed. SEK’s business model leads to exposure to interest rate risk, currency risk and different types of spread risk.
Events in 2012
During 2012 SEK has consequently worked on developing and expanding the company’s market risk measures. The development work is expected to continue throughout 2013. This development work has, for example, resulted in SEK implementing a number of spread risk measures. The market risk measures basis risk, which is related to forward rate agreements (FRAs), and interest rate risk in positions related to shareholders’ funds have also been restricted though defined limits.
Risk management
SEK’s management of market risks is regulated by steering documents established by the Board’s Finance Committee. These clearly definedefines and circumscribe the net market risks to which SEK is permitted to be exposed. In addition to these steering documents, SEK has instructions defining methodology for the calculation of interest rate risk.market risk and an instruction whereby areas of responsibility, work duties and information flows are detailed in the event of limit breaches. The instructions are re-established yearlyannually by the Asset and Liability Committee. The calculated market risks are reported regularly to the Asset and Liability Committee and the Board’s Finance Committee.
Measurement and reporting
The following describes how SEK internally measures and reports market risk. For the impact on results and other comprehensive income due to interest rate risk, see Note 27.28.
Risk neutrality for interest rate risk in debt-financed assets and debt excluding perpetual subordinated debt can only be achieved if the currency, interest rate terms and the overall maturity period for the liabilities all matches the corresponding assets. Conditions are different with regard to shareholders’ funds as interest rate terms cannot be matched. According to SEK’s approach, risk neutrality should beis based around the aim of minimizing the impact ofon earnings in the long term and forming a link with the shareholder’s required return on equity.owner’s return-on-equity target. According to prevalent capital market theory, the required return on equity consists of two separate parts; the risk-free rate and a risk premium. If the required return on equityreturn-on-equity target is to follow this theory, it means that the nominal rate of return will vary over time, depending on the current market conditions. In addition to this theory, SEK has taken as its starting point an assessment of the average maturity in theof its credits and has also taken reinvestment risk into consideration. On this basis, SEK has defined zero risk (so called(known as zero-risk definition) in assets funded withpositions related to shareholder’s funds as a maturity structure where 1/7(4)10 of the total
(4) As of 2012, the new return target will be based on 1/10 instead of 1/7.
portfolio matures every year from year 1 to year 7.10.
Currency risksIn accordance with SEK’s policies for risk management, foreign currency positions related to unrealized fair value changes are kept at a low level since SEK matches assets and liabilities in terms of currencies.not hedged. The limited remaining currency risk, according to SEK’s definition, mainly arises on an ongoing basis due to differences between revenues and costs (net interest margins) related to assets and liabilities in the respective currency. This currency risk is kept at a low level since SEK endeavors to match assets and liabilities in terms of currencies or by matching taking place through the use of derivatives.
Interest rate risk
Interest rate risk in debt-financed assets and debt excluding perpetual subordinatedsenior debt
Interest rate risk in debt-financed assets and debt excluding perpetual subordinatedsenior debt is measured by a stress test as the highest of the risks calculated from a positive one-percentage-point parallel shift in the yield curve and the risk from a half-percentage-point rotation of the yield curve. Perpetual subordinated debt with related hedging transactions, as well as assets in whichpositions related to shareholders’ equity, and untaxed reserves are invested, are excluded from these calculations. The limit for interest rate risk in debt-financed assets and debt excluding perpetual subordinated debt was Skr 70 million at the end of 20112012 (year-end 2010:2011: Skr 70 million). The risk amounted to Skr 3742 million at the end of 20112012 (year-end 2010:2011: Skr 4737 million).
Basis risk
The differences in the interest rate basis for different currencies lead to a risk in the case of surpluses or deficits in borrowings in relation to loans in individual currencies over a specific period. The basis risk is calculated (with the exception of surpluses in Skr, USD and EUR) as the change in present value due to changes in interest rate bases by a certain number of basis points (according to a standardized method). Surpluses in Skr, USD and EUR are excluded from the calculation of basis risk since the majority of SEK’s lending is made in these currencies. Surpluses in these currencies may fairly swiftly be used to finance lending, if desired. The limit for basis risk was Skr 190 million at the end of 2011 (year-end 2010: Skr 190 million). Total basis risk amounted to Skr 102 million at the end of 2011 (year-end 2010: Skr 91 million).
Interest rate risk in perpetual subordinated debt
The volume of perpetual subordinated debt at December 31, 20112012 amounted to USD 350 million (year-end 2010:2011: USD 350 million), corresponding to Skr 2,4232,280 million (year-end 2010:2011: Skr 2,3812,423 million). The interest rate risk relating to this volume was hedged with interest rate swaps, with maturities between 2019 and 2034. The interest rate risk in perpetual subordinated debt is measured as the highest of the risks calculated from a positive one-percentage-point parallel shift in the yield curve and the risk from a half-percentage-point rotation of the yield curve. The maturity for perpetual subordinated debt has been approximated at 30 years. SEK thus measures an approximated interest rate risk related to perpetual subordinated debt. The interest rate risk in perpetual subordinated debt was Skr 280262 million at the end of 20112012 (year-end 2010:2011: Skr 144280 million). There is no specific limit for this risk.
Interest rate risk in assets correspondingpositions related to shareholders’ funds
In order to ensure a long-term stable return on equity, SEK’s policy is to investSEK manages shareholders’ funds in a such a way that fixed interest rates contribute to creating stable net interest revenues over time. The desired fixed interest rate be achieved by means of investments in securities with medium-term maturities.or in the form of derivative transactions. At year-end 2011,2012, the volume of securitiestransactions for this purpose amounted to Skr 14.7 billion, with an average outstanding maturity of 3.04.1 years (year-end 2010:2011: Skr 13.614.7 billion, with an average outstanding maturity of 3.43.0 years). The interest rate risk in assets correspondingpositions related to shareholders’ funds is calculated as a change in present value at a one-percentage-point parallel upward shift in the yield curve compared with a benchmark portfolio according to the zero-risk definition. According to this definition, which aims to reflect the risk taking into account the shareholder’s demand for long-term return on shareholders’ funds, the interest rate risk was Skr 136 million at December 31, 2012 (year-end 2011: Skr 45 million).
SEK’s return-on-equity target changed in 2012, which impacted risk management for positions related to shareholders’ funds. The investment horizon for the benchmark portfolio has been changed from seven to ten years, which is the main reason for the significantly higher interest rate risk compared with December 31, 2011. Adjustment of the maturity structure in line with the new benchmark portfolio has begun and will take place gradually. In 2012 the Board’s Finance Committee also decided to limit the interest rate risk for positions related to shareholders’ funds. The limit amounts to Skr 300 million (year-end 2011: —no such limit).
Basis risk
Basis risk measures a potential impact on SEK’s net interest income due to a change in currency basis spreads. Where borrowing or lending are not currency matched, the future cost of converting borrowing to the desired currency depends on the currency basis spread. Changes in the currency basis spread will consequently impact SEK’s future net interest income. The basis risk is calculated (with the exception of surpluses in Skr, USD and EUR) as the change in present value due to changes in the currency basis spread by a certain number of basis points (according to a standardized method). Surpluses in Skr, USD and EUR are excluded from the calculation of basis risk since the majority of SEK’s lending is made in these currencies. Surpluses in these currencies may fairly swiftly be used to finance lending, if desired. The limit for basis risk was Skr 190 million at the end of 20112012 (year-end 2010:2011: Skr 48190 million). Total basis risk amounted to Skr 85 million at the end of 2012 (year-end 2011: Skr 102 million).
Spread risks
SEK’s business model implies that assets and liabilities usually are held to maturity. Unrealized fair value changes due to changes in credit spreads, currency basis spreads and changes in SEK’s own credit spread, are therefore, for SEK, accrual effects that may impact SEK’s shareholders’ funds and, for some of the fair value changes, also the capital base. During 2012 the reported sensitivity of SEK’s shareholders’ funds to different types of spread risks has increase, primarily as a result of refined methods for calculating market values in SEK’s accounting. SEK has therefore, during 2012, developed and refined additional market risk measures for spread risks. The development will continue during 2013.
Credit spead risk
Credit spread risk indicates a potential impact on SEK’s shareholders’ funds, in the form of unrealized gains or losses, as a result of changes in credit spreads. Credit spread risk is measured and has been limited for assets classified as financial assets measured at fair value through profit or loss and for assets classified as financial assets available-for-sale. Credit spread risk is measured as the difference between a calculated market value in a scenario where the credit spread has increased by 100 basis points and the current market value. At the end of 2012 the credit spread risk was Skr 196 million (year-end 2011: Skr - million) and the limit was Skr 500 million (year-end 2011: Skr - million). This credit spread measure was introduced in 2012 and there are consequently no comparative figures for 2011.
Credit spread risk on own debt
Credit spread risk on own debt indicates a potential impact on SEK’s shareholders’ funds, in the form of unrealized gains or losses, as a result of changes in SEK’s own credit spread. Credit spread risk on own debt is measured on the bonds issued by SEK that are classified as financial liabilities at fair value through profit or loss. Credit spread risk on own debt is measured as the difference between a calculated market value in a scenario where the credit spread on own debt has increased by 10 basis points and the current market value. At the end of 2012 the credit spread risk on own debt was Skr 497 million (year-end 2011: Skr - million). No special limit applies. This credit spread risk measure was introduced in 2012 and there are consequently no comparative figures for 2011.
Currency basis spread risk
Unlike the basis risk, the Currency basis spread risk measures a potential impact on SEK’s shareholders’ funds, in the form of unrealized gains or losses, as a result of changes in currency basis spreads. Currency basis spread risk includes financial transactions whose market value is impacted by changes in currency basis spread curves. Currency basis spread risk is measured as the difference between a calculated market value in a scenario where the currency basis spread has increased by 10 basis points and the current market value. The risk for each currency basis spread curve is totaled as an absolute figures. At the end of 2012 the currency spread risk was Skr 293 million (year-end 2011: Skr - million). No special limit applies. The currency basis spread risk measure was introduced in 2012 and there are consequently no comparative figures for 2011.
Currency risk
TheThis risk is calculated as athe change in the value of all foreign currency positions resulting from a 10-percentage-pointat an assumed 10 percentage-point change in the exchange rate forbetween the respective currency and the Swedish krona. When calculating the risk foreign currency positions related to unrealized fair value changes are excluded. The limit for currency risksrisk was Skr 15 million at the end of 20112012 (year-end 2010:2011: Skr 15 million). The currencyCurrency risk amounted to Skr 43 million at the end of 20112012 (year-end 2010:2011: Skr 24 million).
Other price risk
Where SEK is responsible for the secondary market of bonds (distributed by SEK itself), the individual repurchases may be too small to be hedged due to practical reasons. SEK’s policy is for market risk due to such repurchases to be hedged as soon as market practiceconditions allows. This risk is undesirable, but it is a consequence of maintaining a liquid secondary market. SEK has adopted a conservative approach regarding the risk of these products and defines the market risk as the aggregate nominal value of the given repurchases. The limit for these products at the end of 20112012 was Skr 2 million (year-end 2011: Skr 2 million) and
the actual risk was Skr 0.6 million (year-end 2011: Skr 0.5 million.million).
Liquidity and funding risk
Liquidity and funding risk is defined as the risk, within a defined period of time, of the company not being able to settlerefinance its existing assets or being unable to meet increased demands for liquid funds. Liquidity risk also includes the risk of the company being forced to lend at an unfavorable interest rate or needing to sell assets at a loss in order to be able to meet its payment obligations immediately when due.commitments.
Events in 20112012
In 20112012 the Swedish Financial Supervisory Authority published a numberproposal regarding quantitative requirements for the liquidity coverage ratio (LCR). The final regulation, FFFFS 2012:6, was published later in autumn 2012. This establishes that a quantitative requirement for the LCR will be introduced in Sweden as of the new regulations developed by regulatorsJanuary 1, 2013. The requirement covers all currencies, both combined and separately, in 2010 became partEUR and USD.
SEK has also further developed the company’s liquidity risk management in 2011. As a result of2012 and the new regulations that have come into force over the past year, both the management and reporting of liquidity risk havefocus has primarily been reviewed and adapted in line with the new regulations. There has also been additional focus on the introduction of new quantitative requirements for liquidity risk, with an expected implementation date for the Liquidity Coverage Ratio (LCR) of January 1, 2013.risk.
Risk management
The management of SEK’s liquidity and funding risk is regulated by steering documents established by the Board’s Finance Committee. SEK has a conservative policy for liquidity and funding risk. The policy requires that for all credit commitments —- outstanding credits as well as agreed, but undisbursed credits —- there must be funded throughoutfunding available through maturity. For CIRR credits, which SEK manages on behalf of the Swedish state, when evaluating whether it has positive availability the company counts its credit facility with the Swedish National Debt Office, which entitles it to draw on funding with a tenor of up to 10 years, as available funding, despite the fact that no funds have been drawn under this facility. This policy means that no refinancing risk is allowed. This strategy also means that borrowed funds not yet used to finance credits need to be invested in securities, known as liquidity placements. Liquidity and fundingrefunding risk are measured and reported regularly to the Asset and Liability Committee and the Board’s Finance Committee.
SEK’s conservative policy for liquidity and fundingrefunding risk is measured and reported on the basis of various forecasts regarding the development of available funds in comparison with all credit commitments —- outstanding credits as well as agreed, but undisbursed credits. Available funds are defined as shareholder’s funds, borrowing and credit facilities with the Swedish National Debt Office. Excess funds, i.e. the portion of available funds not already used to finance loans, must be invested in assets with good credit quality. See the Liquidity placements section for further details. The creditloan facility with the Swedish National Debt Office(5), which amounted to 100 billion, (year-end 2010:2011: Skr 100 billion) is valid through to December 31, 20122013 and distributed as follows: 80 percent may be used for funding in the purpose of financing lending within the S-system and 20 percent may be used for funding in the purpose of financing lending in SEK. See the chart “Development over time of SEK’s available funds.” Part of SEK’s structured long-term borrowing includes early redemption clauses that will be triggered if certain market conditions are met. Thus, the actual maturity for such contracts is associated with uncertainty. In the chart “Development over time of SEK’s available funds,” such borrowing has been assumed to be due at the first possible redemption opportunity. This assumption is an expression of the precautionary principle that the company applies concerning liquidity and funding management. In addition, SEK also carries out various sensitivity analyses with regard to such instruments, in which different market conditionsscenarios are simulated.
Development over time of SEK’s available funds
Borrowing, credit facility with Swedish National Debt Office, shareholder’s funds and lending, as of December 31, 2011.2012


(5) The loan facility with the Swedish National Debt Office allows SEK to receive funding with maturities of up to 10 years, which are assumed to be used in this scenario.
Measurement and reporting
SEK measures liquidity risk based on a number of estimates of the development of available funds compared with outstanding credit commitments. For both measurement and reporting, liquidity risks are divided into short-term and long-term risks. Deficits should be avoided in the short term. This is regulated by means of limits and liquidity estimates, per currency, for the coming eight days. Longer liquidity estimates for periods of up to one year are produced on a regular basis. During more turbulent periods, a greater share of available liquid funds are invested in overnight placements to ensure short-term access to liquid funds.
Long-term, structural liquidity risk is measured and reported regularly as described in section “Risk Management”.
Funding
SEK’s funding strategy is defined in the steering document Financing Strategy, which is established by the Board’s Finance Committee. The Financing Strategy, among other things, aims to ensure that SEK’s funding is well-diversified with regard to markets, investors, counterparties and currencies. As previously mentioned, SEK has a conservative policy on maturities which means that for all credit commitments - outstanding credits as well as agreed, but undisbursed credits - there must be funding available through maturity. For CIRR credits, which SEK manages on behalf of the Swedish state, when evaluating whether it has positive availability the company counts its credit facility with the Swedish National Debt Office, which entitles it to draw on funding with a tenor of up to 10 years, as available funding, despite the fact that no funds have been drawn under this facility.
Short-term funding
For the purpose of ensuring access to funding, SEK has several revolving funding programs for maturities of less than one year. These include a US Commercial Paper program (UCP) and a European Commercial Paper program (ECP), with the latter allowing borrowing in multiple currencies. Since the fourth quarter of 2012 SEK has once again issued debt under the US Commercial Paper program after remaining outside this market for a long time. The reason for SEK once again issuing debt under this program is because the company believes it is important to have access to the the Commercial Paper program in the US. The table “Short-term funding programs” illustrates these funding sources. The total volume of short-term programs was USD 7.0 billion, of which USD 0.01.6 billion had been utilized as of December 31, 20112012 (year-end 2010:2011: total volume of USD 7.0 billion, USD 0.0 billion utilized). SEK also has swing lines that function as back-up facilities for the commercial paper programs.SEK’s revolving funding program for maturities of less than one year.
Short-term funding programs
Program type |
| UCP |
| ECP |
| UCP |
| ECP |
Currency |
| USD |
| Multi currencies |
| USD |
| Multi currencies |
Number of dealers |
| 4 |
| 4 |
| 4 |
| 4 |
Dealer of the day facility |
| No |
| Yes |
| No |
| Yes |
Program size |
| USD 3,000 mil. |
| USD 4,000 mil. |
| USD 3,000 mil. |
| USD 4,000 mil. |
Usage as of Dec. 31, 2012 |
| USD 1,616 mil. |
| USD 0 mil. | ||||
Usage as of Dec. 31, 2011 |
| USD 0 mil. |
| USD 0 mil. |
| USD 0 mil. |
| USD 0 mil. |
Usage as of Dec. 31, 2010 |
| USD 0 mil. |
| USD 0 mil. | ||||
Maturity |
| Maximum 270 days |
| Maximum 364 days |
| Maximum 270 days |
| Maximum 364 days |
Long-term funding
To secure access to large volumes of funding, and to ensure that insufficient liquidity among individual funding sources does not constitute an obstacle to operations, SEK issues bonds with different structures, currencies and maturities. In addition, SEK carries out issues in many different geographic markets. The following charts illustrate some of the aspects of the diversification of SEK’s funding. Figures in the first chart are not comparable to amounts shown on page F-46in tables “Debt as per categories” under Note 18 since (i) the definition of structure types, that are in accordance with internal reporting, are different from the definition applied in Note 18 and (ii) the chart displays nominal amounts and not book
values. The third chart gives a breakdown of long-term borrowing by market in 2012. The chart shows that Europe increased as a funding market during the year, which was due in part to increased investor interest in the UK. The chart also shows that the US accounted for a more normal share of funding in 2012 but that this market has decreased in relative terms since 2011, when SEK issued an usually large amount of debt to the US retail market. SEK’s long-term funding issued during 20112012 amounted to Skr 47.743.2. billion (2010:(year-end 2011: Skr 76.647.7 billion).
F-86(6) Dealer of the Day offers an opportunity for a market actor, which is not an issuing agent, to arrange individual issues under the Commercial Paper program.
Total Long-term funding by structure type as of December 31, 2012
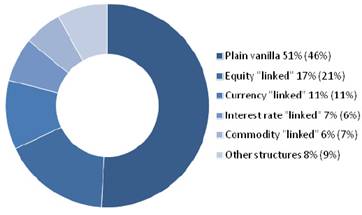
Total Long-term funding by currency as of December 31, 2012
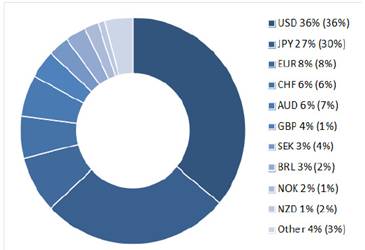
Total Long-term funding by structure type

Total Long-term funding by currency
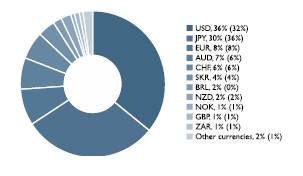
Long-term funding in 20112012 by market

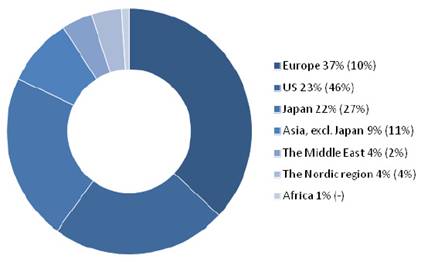
Liquidity placements
To meet the financing requirementsSEK’s policy for long-term lending,liquidity and funding risk, borrowed funds, which have not yet used to financebeen disbursed in the form of credits, need tomust be invested in securities, known as liquidity placements. These placements are subject to regulations specified in the Liquidity Strategy established by the Board’s Finance Committee. The size of SEK’s liquidity placements depends on a number of factors. SEK’s Finance Policy, established by the Board, stipulates that for all SEK’s credit commitments —- outstanding credits as well as agreed, but undisbursed credits —- there must be fundedfunding available through maturity.
For CIRR credits, which SEK manages on behalf of the Swedish state, when evaluating whether it has positive availability the company counts its credit facility with the Swedish National Debt Office, which entitles it to draw on funding with a tenor of up to 10 years, as available funding, despite the fact that no funds have been drawn under this facility. One of the largest contributing factors to the size of liquidity placements is the amount of agreed but undisbursed credits. At the end of 2011,2012, agreed but undisbursed credits amounted to 29.5Skr 25.9 billion (year-end 2011: Skr 25.1 billion), corresponding to 29.6 percent of total liquidity placements (year-end 2010: 32.82011: 29.5 percent). As part of its liquidity placements, SEK also requires a bufferliquidity buffer(4) to ensure that SEK can fulfill payments related to collateral agreements that the company has with its derivative counterparties in order to reciprocally manage counterparty risk in derivative transactions. The company allocates Skr 15 billion (year-end 2011: Skr 15 billion) for this purpose. In addition, the liquidity placements also ensuresensure that SEK maintains readiness to meet its assessed new lending requirements, enabling SEK to continue for a certain periodat least 6 months to grant new credits to the normal extent, even if funding markets were entirely or party closed. At December 31, 2012 this capacity amounted to Skr 44.3 billion (year-end 2011: Skr 40.5 billion), which corresponded to approximately 9 months’ new lending capacity. The maturity profile of the liquidity placements must reflect the net maturity of funding and lending. Investments must be made in assets of good credit quality. When making such investments, the liquidity of the investment under normal market conditions should be taken into account. The currency should also be in accordance with established guidelines. Furthermore, the duration of the assets must be in accordance with defined guidelines. SEK assesses that the assets will be held to maturity, according to plan. The volume of the liquidity placements slightly increased during the year and amounted to Skr 84.987.7 billion at the end of 20112012 (year-end 2010:2011: Skr 116.684.9 billion). The decrease in volume of SEK’s liquidity placements is primarily due to a lower volume of agreed but undisbursed credit commitments. The decrease in volume is also a result of, and in line with, a strategic decision to reduce the volume of liquidity placements by not refinancing all
maturing debt — hence, reducing the expected timeframe the company can continue to grant new loans to the usual extent even if the funding markets are completely closed. The following charts provide a breakdown of the liquidity placements by exposure type, maturity and rating as of December 31, 2011.2012. The remaining maturity in the liquidity investments decreased further in 2011. Furthermore,2012.Moreover, the credit quality declinedof holdings has been stable and, on average, actually improved slightly in 2011 owing2012. This was mainly due to the build-upcompany having increased its holdings in high-quality liquid assets. This was a result of the liquidity investments, which mainly consists of financials that in general have had their credit ratings downgraded during 2011.
Liquidity by type of exposure
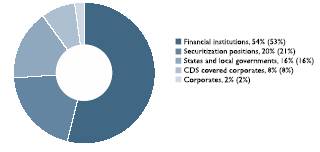
Liquidity placements by Remaining maturity (“M”)
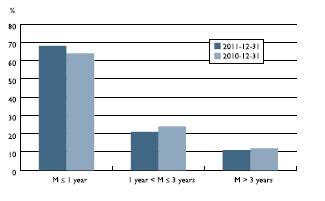
Liquidity placements by rating(7) The liquidity buffer is an internal assessment of how large potential payments under collateral agreements may be, which means it is not made up of specific contracts, unlike the liquidity reserve.
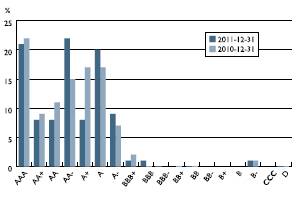
SEK and the new liquidity regulations under Basel III
During 2011, SEK continued preparing for future regulations in the field of liquidity. The focus has mainly been on studying the effects and preparing for the two new quantitative measures proposed by the Basel Committee on Banking Supervision, Liquidity Coverage Ratio (LCR) and Net Stable Funding Ratio (NSFR).
Liquidity Coverage Ratio
The liquidity ratio LCR requires banks to maintain high quality liquid assets sufficient enough to cover net cumulative cash outflows at a stressed scenario during a 30-day period. In accordance with the new liquidity risk reporting framework in Sweden, the quantitative liquidity risk measure, LCR, is reported monthly to the regulatory authority. In addition, the regulatory authority in Sweden has declared its intention to make LCR binding as of January 2013, two years ahead of the timetable proposed by the Basel Committee.
Asquantitative liquidity coverage ratio (LCR) requirement, which is being introduced in Sweden and is binding from January 1, 2013.
Liquidity by type of the endexposure as of 2011, SEK does not report an LCR ratio above the, according to the regulations, proposed levelDecember 31, 2012
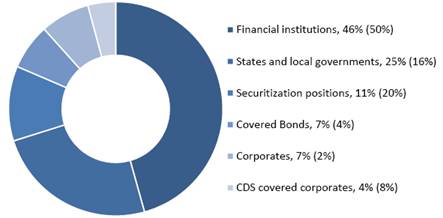
Liquidity PLACEMENTS by Remaining maturity (“M”)
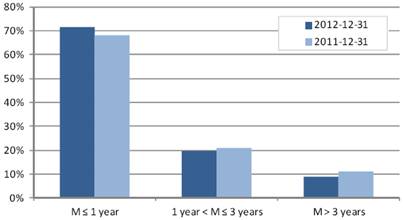
Liquidity PLACEMENTS by rating

Net Stable Funding Ratio
As described above, SEK has a conservative policy for liquidity and funding risk. The policy requires that all credit commitments — outstanding credits as well as agreed but undisbursed credits — are financed through maturity. As a result, the company does not have to change its present funding structure in order to adjust to the long-term, structural, quantitative liquidity risk measure NSFR. The aim of NSFR is for banks to finance illiquid assets with long-term stable funding. This liquidity risk measure confirms SEK’s conservative policy, which has been used for a long time. This means that SEK is already able to report a ratio above the required level of 100 percent for NSFR. However, it is important to point out that there is still some uncertainty about when this ratio will be binding, as well as about what the final version of the ratio will look like. SEK will continue to follow developments and evaluate any changes and their consequences for SEK’s current business model.
Contingency plan
SEK has a contingency funding plan for the management of liquidity crises. The plan describes what constitutes a liquidity crisis according to SEK and what measures SEK intends to take if such a crisis is deemed to have occurred. The plan also describes the decision-making organization during a liquidity crisis. An internal and external communication plan is also included. The contingency funding plan design and procedures are closely integrated with the results of the scenario analysis and assumptions used in stress tests.analyses that are performed, as described below.
Scenario analyses
SEK regularly performs scenario analyses with the aim of increasing its preparedness and of ensuring that the company can cope with situations such as the partial or complete cessation of various funding sources. The scenarios cover company-specific and market-related problems, both individually and in combination. The outcome of the scenarios are in line with SEK’s conservative Finance Policy in whichfor liquidity and funding risk. In addition, SEK should have a cash surplusliquidity reserve(8) of satisfactory size for the situation in order to ensure financing ofits ability to make payments in the form of agreed but undisbursed credits. The cash surplus should also serve as a buffer forlarge acceptances or payments under collateral agreements as well asand for the repurchase of its own bonds in order to ensure readiness for a potential increase in demand for lending.manage its own debt.
The “Market Stress Scenario” chart below shows the development of accumulated cash flows for a stressed market scenario. Assumptions for this scenario include, but are not limited to, the following: not all funding that matures can be refinanced; cash needs to be paid out under collateral agreements; and SEK meets all credit commitments —- outstanding credits as well as agreed, but undisbursed credits. In addition to the above, SEK also continues to grant new credits in accordance with the business plan. Account is also taken of the fact that a part of SEK’s liquidity reserveplacements can be quickly converted into liquid funds. In addition to this, SEK holds a significant amount of assets that are eligible to be held as collateral at central banks. These have not been utilized in the stressed scenario below. Instead, they serve as an additional reserve in case market conditions should become even more disadvantageous than anticipated. This extra reserve would be used to offset the potential small deficit in accumulated cash flows under the stressed scenario. Due to new regulatory principles from the Swedish National Bank, concerning which assets that are eligible and which haircuts to use, this extra reserve has decreased considerably compared to 2011. Analysis shows that the deficit emerging in the stress scenario in April 2013 is primarily a consequence of the assumption regarding payments under collateral agreements. The extra reserve combined with the credit facility that SEK holds with the Swedish National Debt Office ensures that the outcome of the scenario is in line with SEK’s Finance Policy.
(8) The liquidity reserve is a portion of liquidity placements. The liquidity reserve consists of high-quality liquid assets, see Note 28.
Market stress scenario
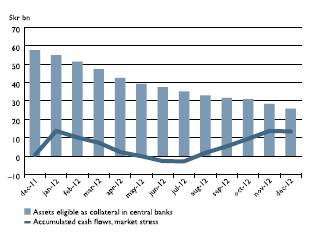

Operational risk
Operational risk is defined as the risk of loss resulting from inadequate internal processes, human error, faulty systems or from external events. This definition also includes legal risk.
Events in 2011
Up until the second quarter of 2011, the company applied the Basic Indicator Approach for calculating capital requirement SEK’s appetite for operational risk accordingis low(9). For compliance risk, SEK has zero tolerance. Risks that are assessed to Pillar 1. Sincebe at medium or high level must be mitigated.
Events in 2012
The intensified work to manage operational risks and increase awareness of operational risk among SEK’s employees, which began in 2011, continued in 2012. Procedures have been improved and there is greater reporting of operational risks, including to the third quarterBoard of 2011Directors. In addition, the company has appliedresults of the Standardized -Approach.annual risk analysis of operational risks have been incorporated into the business planning for respective functions.
SEK works proactively and continuously to prevent incidents and to plan for the handling of potential major incidents and crisis.crises. As a part of this work, a detailed continuity plan was developed and documented during the company’s crisis management group practiced the management of various crisis scenarios. In addition, the most critical functions conducted a businessyear. This continuity exerciseplan aims to ensure that at any given point in time the company is preparedable to manage its most critical processes, irrespective of what resources are unavailable. SEK also conducted an exercise as part of the continuity plan based on a scenario including the simulation of the loss of business-critical IT resources. The exercise resulted in providing the company with greater insight and in the eventupdating and expansion of a crisis.its continuity plan.
During the year, there were a total of 111 incidents (2011: 150). The absolute sum of the direct impact on earnings amounted to Skr 3.8 million (2011: Skr 6.2 million).
Risk management
Responsibility and Internal Governance
Operational risk exists in potentially all business and support activities within SEK. This means that all functions within the company serve as part of the first line of defense in terms of operational risks. Each function is therefore responsible for operational risks that occur within their own function. Responsibility for monitoring, analyzing and reporting operational risk lies with Risk Control. In addition, Risk Control is responsible for ensuring that the company complies
(9) SEK uses a 3-pont scale for assessing operational risk; low, medium and high.
with the operational risk framework. The Internal Control Committee, which is chaired by the President, is the company committee that is responsible for managing and monitoring operational risk.
In order to support risk management, the company works in accordance with the framework that has been further developed in 2011. SEK’sfor the management of operational risk. This framework for managing operational risk is based on the company’s risk appetite and risk management objectives.objective. The risk appetite specifies the direction and framework for the management of risk, which is set out in the management of the business by the policy for operational risk, instructions, manuals and the corporate culture of the company. These steering documents describe the risk management process and define which activities and operations are included in the process and how they should be performed. The steering documents also indicate how responsibility is structured for the execution and monitoring of and compliance with risk management. The policy is issued by the Board and the instructions are issued by the President.
Risk management process
SEK identifies, assesses, manages and reports operational risks in accordance with a risk management process consisting of 6 main stages. (1) Risk identification: Events that could jeopardize the company’s objectives at the overall or individual level should constantly be identified at a specified regular interval. Identification should be performed (i) constantly in the operational work, (ii) upon the introduction of new or amended products, services or IT systems, (iii) in connection with incidents that occur, and (iv) by means of an annual risk analysis of all functions and processes within the company. (2) Risk assessment: The identified risks are then assessed. Assessment is performed based on seriousness of the consequences of such risks’ for the company if they were to occur and the probability of such risk occurring. Assessment is based on SEK’s appetite for operational risk. (3) Decision: Once risks have been identified and assessed, a decision is taken as to how the risks should be handled “on the basis of” the risk assessment. The company has observed three main options; (i) to eliminate, (ii) to reduce or, (iii) to accept the risk. Based on the overall risk appetite and taking account of the assessment of a particular risk, the company has clarified those risks that are within the risk appetite and acceptable and those risks that are not within the risk appetite and must be eliminated or reduced. (4) Implementation: The decision regarding the management of risk exposures should be implemented which means that (i) the measures adopted to reduce risk exposures are developed and implemented, (ii) incidents are analyzed, reported and rectified, and that (iii) continuity for mission-critical processes and systems is planned, documented, practiced and taught. (5) Monitoring: Analysis and monitoring should be performed to (i) capture changes in the risk profile/risk exposure over
time, (ii) to ensure that existing measures and preventive controls are effective, (iii) to ensure that the level of risk is within the risk appetite and (iv) ensure that the size of capital is adequate. The effectiveness of the Risk Framework should be reviewed annually. (6) Reporting and feedback: Reporting is based on the reports sent from the first line of defense, risk owners, to Risk Control. Risk Control analyzes, compiles and forwards the reports to certain decision-makers in the company, including the Internal Control Committee, and to the Board.Board of Directors. There is also an order established for providing feedback from the decision-making bodies to those people who perform the risk management.
Measurement
The company measures the level of operational risk on an ongoing basis. The company’s conclusion regarding the level of risk is based on an assessment of primarily four components. In brief, these are:
(i) whether there are risks that have been assessed as primarily “high risk”, but also whether there are risks that are assessed as “medium risk”. Risks assessed as “high risk” fall well outside the risk appetite. It is interesting, for example, to note how many risks there are in these two categories, how well the risks are managed and the consequences if the risk were to occur.
(ii) whether severe incidents have been reported that are not acceptable.
(iii) the conclusion reached by management in its annual assessment of internal control in accordance with SOX Section 404. This requires that the company’s management must, on an annual basis, assess, and express its opinion on, the effectiveness of the company’s internal controls relating to financial reporting and report its assessment to the SEC. Its statement of opinion must be based on testing of the internal controls carried out within SEK. As a result of this, extensive work is carried out each year to identify and manage risks that would result in the company not fulfilling its objective of providing reliable financial reporting. These well-established and extensive procedures, which are part of internal controls within SEK, provide basis for meeting the company’s objectives to prevent operational risk.
(iv) executive management’s qualitative assessment of the level of risk.
Continual measures are taken to ensure that the level of risk falls within the appetite for operational risk. Work is undertaken relating directly to operational risk, including activities that are part of the risk management process for operational risk, described in section above, along with methodical and extensive work to maintain a high level of quality in internal control. In addition, SEK’s system environment and processes are being developed and will include such improvements as the introduction of a higher degree of automation and more effective processes, which are expected to have a positive effect on the level of operational risk.
Internal capital adequacy assessment
Under Basel II Pillar 2, companies are responsible for designing their own internal capital adequacy assessment processes (ICAAP). This requires institutions to identify their risks and assess their risk management in an extensive and comprehensive manner and, based on this, to assess their capital needs. They must also communicate their analyses and conclusions to the Swedish Financial Supervisory Authority. The ICAAP must be documented and disclosed throughout the company. As part of its strategic planning process, SEK’s Board and executive management establish the company’s risk appetite and clear objectives with regard to the capital structure. An important part of the company’s capital planning is the performance of a scenario analysis. A scenario analysis provides a summary of how capital needs would be affected by unfavorable developments in the business environment. Among other things, the effects of the current market uncertainty and the ongoing European sovereign debt crisis and the prevailing uncertainty in the financial markets are observed and analyzed. SEK’s sovereign exposures are small in relation to the total balance sheet and SEK is essentially not exposed to market valuation effects related to credit risk. SEK’s sovereign exposures to European countries are shown in Note 27,28, see tables under “Credit exposures to European countries, by exposure class and risk mitigation method”. SEK’s capital adequacy assessment process also includes an evaluation of the impact on SEK due to the envisaged Basel III rules.future regulatory reforms. The evaluation shows that SEK will be able to meet the Basel III rulesboth requirements under CRR/CRD IV and EMIR regulation at the time they come into force.
SEK’s ICAAP is assessed as being well in line with the underlying principles, intentions and values of the regulations.
To calculate capital requirements in accordance with Pillar 2, SEK uses other methods than those used to calculate the capital requirements under Pillar 1. Under Pillar 2, a number of other risks are analyzed in addition to those risks covered by capital under Pillar 1. These risks are analyzed based on a perspective of proportionality, with the greatest focus being placed on those risks that are of most significance for SEK. For example, for internal evaluation and assessment of capital requirements regarding credit risks under Pillar 2, SEK works with what is referred to as economic capital. This is a more exact and risk-sensitive measure than the regulatory capital requirement under Pillar 1.The1. The need for economic capital is based on a calculation of Value at Risk (VaR) and forms a central part of the company’s internal assessment. SEK’s assessment of whether, in addition to the capital requirement calculated under Pillar 1, the company needs to allocate capital for credit risk under Pillar 2 is mainly based on a quantitative approach. This quantitative estimate is performed using a simulation-based tool that produces a probability distribution of the value of the credit portfolio over a determined time horizon (usually one year). VaR is estimated based on this probability distribution (at a confidence level of 99.9 percent), which forms the company’s economic capital need. This quantitative approach is also complemented by a comparative analysis of the capital requirement under the Basel formula and the necessary economic capital, (calculated with a confidence level of 99.9 percent). This quantitative approach is further complementedas well as by qualitative assessments. The primary aim of the analysis is to assess whether the total capital requirements under Pillar 2 should be set higher than the automaticallycapital requirement calculated under Pillar 1. The total capital requirement under Pillar 1.2 was Skr 7,243 million at December 31, 2012 (year-end 2011: Skr 7,077 million), which can be compared to the capital requirements under Pillar 1 that amounted to Skr 5,258 million (year-end 2011: Skr 4,892 million).
In addition, it is considered important to be able to break down the difference down according toby the various individual factors. Although the (net) difference may be small, the analysis shows that the difference between the approaches under Pillar 1 and Pillar 2, respectively, for individual factors may have a large impact on the quantification of risk. Factors that increase the capital requirement in the overall internal assessment include the company’s view on the loss proportion in the event of default (LGD), which is more conservative than the Basel formula. Another factor that increases the need for capital consists in the company, under Pillar 2, taking into account concentration risks caused by (i) name concentration and (ii) high correlations between counterparties in the portfolio due to domicile and sector. The regulations also permit certain types of exposure to be exempted from capital requirements under Pillar 1. However, it is SEK’s assessment that there is also a capital requirement for such exposures. The regulations do not — under Pillar 1 — take into account the risk reduction resulting from a very short maturity. The company’s model for the calculation of economic capital does, however, take this effect into consideration. A positive factor, from which the company is not permitted to benefit under Pillar 1, is the full effect of risk reduction through the use of guarantees and credit derivatives (i.e., combined risks, or “double default”), as well as collateral agreements with issuers of credit derivatives. Overall, with regard to credit risk, concentration risk, caused by high correlations between counterparties, comprises the single largest contribution to risk in the company’s comparative analysis.
SIGNATURES
The registrant hereby certifies that it meets all requirements for filing on Form 20-F and that it has duly caused and authorized the undersigned to sign this annual report on its behalf.
| AKTIEBOLAGET SVENSK EXPORTKREDIT (publ) | |
| (Swedish Export Credit Corporation) | |
| (Registrant) | |
|
| |
|
| |
| By | /s/ Peter Yngwe |
|
| Peter Yngwe, President |
Stockholm, Sweden | ||
February 27, 2013 | ||
Stockholm, Sweden
March 19, 2012
EXHIBIT INDEX
Exhibit index
1.1 Articles of Association of the Registrant in effect as of the date of this annual report (filed as Exhibit 1.1 to the Company’s Annual Report on Form 20-F (No. 001-08382) for the year ended December 31, 2010 filed by the Company on March 25, 2011 and incorporated herein by reference).
2.1 Indenture, dated as of August 15, 1991, between the Company and J.P. Morgan Trust Company, National Association (as successor in interest to the First National Bank of Chicago) as Trustee, providing for the issuance of debt securities, in one or more series, by the Company (filed as Exhibit 4(a) to the Company’s Report of Foreign Issuer on Form 6-K (No.: 001-08382) dated September 30, 1991 and incorporated herein by reference).
2.2 First Supplemental Indenture dated as of June 2, 2004 between the Company and J.P. Morgan Trust Company, National Association (filed as Exhibit 4(b) to the Company’s Registration Statement on Form F-3 (No. 333-131369) dated January 30, 2006 and incorporated herein by reference).
2.3 Second Supplemental Indenture, dated as of January 30, 2006, between the Company and J.P. Morgan Trust Company, National Association (filed as Exhibit 4(c) to the Company’s Registration Statement on Form F-3 (No. 333-131369) dated January 30, 2006 and incorporated herein by reference).
2.4 Third Supplemental Indenture, dated as of October 23, 2008, relating to the Debt Securities (filed as Exhibit 4 to the Company’s Report of Foreign Issuer on Form 6-K dated October 23, 2008 (No. 001-08382) and incorporated herein by reference).
2.5 Form of Warrant Agreement for Index Warrants, with Form of Index Warrant Certificate attached thereto (filed as Exhibit 4(e) to the Company’s Registration Statement on Form F-3 (No. 333- 156118) dated December 15, 2008)2008 and incorporated herein by reference).
2.6 Fiscal Agency Agreement dated April 8, 20114, 2012 relating to an unlimited aggregate principal amount of debt securities authorized to be issued under the Company’s Program for the Continuous Issuance of Debt Instruments (filed herewith).
2.7 Deed of Covenant dated April 8, 2011 relating to an unlimited aggregate principalamount of securities of SEK authorized to be issued under the Company’s Program for theContinuous Issuance of Debt Instruments (filed herewith)as Exhibit 2.7 to the Company’s Annual Report on Form 20-F (No. 001-08382) for the year ended December 31, 2011 filed by the Company on March 19, 2012 and incorporated herein by reference).
2.8 Fourth Supplemental Indenture, dated as of March 8, 2010, relating to the Debt Securities (filed as Exhibit 4(f) to the Company’s Post-Effective Amendment (No. 333-156118) to the Company’s Registration Statement on Form F-3, filed by the Company on March 10, 2010 and filed as Exhibit 2.8 to the Company’s Annual Report on Form 20-F (No. 001-08382) for the year ended December 31, 2009, filed by the Company on March 31, 2010 (No. 001-8382)) and incorporated herein by reference).
2.9 English-language summary of the Terms and Conditions dated 22 February 2012 relating an unlimited principal amount of debt securities authorized to be issued under the Company´s Swedish MTN Programme (filed herewith)as Exhibit 2.9 to the Company’s Annual Report on Form 20-F (No.001-08382) for the year ended December 31, 2011, filed by the Company on March 19, 2012 and incorporated herein by reference).
2.10 ASX Austraclear Registry and IPA Services Agreement dated 14 October 2009 relating an unlimited principal amount of debt securities authorized to be issued under the Company´s Australian Dollar Debt Issue Programme (filed as Exhibit 2.10 to the Company’s Annual Report on Form 20-F (No. 001-08382) for the year ended December 31, 2009, filed by the Company on March 31, 2010)2010 and incorporated herein by reference).
2.11 Note Deed Poll dated 2 June 2006 relating to an unlimited principal amount of debt securities authorized to be issued under the Company´s Australian Dollar Debt Issue Program (filed as Exhibit 2.11 to the Company’s Annual Report on Form 20-F (No. 001-08382) for the year ended December 31, 2009, filed by the Company on March 31, 2010 and incorporated herein by reference).
7.1 Statement of Calculation of Ratios of Earnings to Fixed Charges (filed herewith).
7.28.1 List of Subsidiaries (filed herewith).
12.1 Certifications pursuant to Rule 13a-14(a) or Rule 15d-14(a) under the Securities Exchange Act of 1934(filed1934 (filed herewith).
13.1 Certifications Pursuant to 18 U.S.C Section 1350, as adopted Pursuant to Section 906 of the Sarbanes-Oxley Act of 2002 (filed herewith).
15.1.Consent of Independent Registered Public Accounting Firm (filed herewith).
15.2 Consent of Independent Registered Public Accounting Firm (filed herewith).
Pursuant to Instruction 2(b) (i) in the “Instructions as to Exhibits” in Form 20-F, various instruments defining the rights of holders of long-term debt securities issued by the Company are not being filed herewith because such debt securities are not registered with the Commission and the total amount of debt securities authorized under each such instrument does not exceed 10% of the total assets of the Company. The Company hereby agrees to furnish a copy of any such instrument to the Commission upon request.