UNITED STATES
SECURITIES AND EXCHANGE COMMISSION
WASHINGTON, D.C. 20549
FORM 20-F
o | REGISTRATION STATEMENT PURSUANT TO SECTION 12(b) OR (g) OF THE SECURITIES EXCHANGE ACT OF 1934 |
|
|
OR | |
|
|
x | ANNUAL REPORT PURSUANT TO SECTION 13 OR 15(d) OF THE SECURITIES EXCHANGE ACT OF 1934 |
|
|
OR | |
|
|
o | TRANSITION REPORT PURSUANT TO SECTION 13 OR 15(d) OF THE SECURITIES EXCHANGE ACT OF 1934 |
|
|
OR | |
|
|
o | SHELL COMPANY REPORT PURSUANT TO SECTION 13 OR 15(d) OF THE SECURITIES EXCHANGE ACT OF 1934 |
Commission file number 1-31994
Semiconductor Manufacturing International Corporation |
(Exact name of Registrant as specified in its charter) |
|
Not Applicable |
(Translation of Registrant’s name into English) |
|
Cayman Islands |
(Jurisdiction of incorporation or organization) |
|
18 Zhangjiang Road, Pudong New Area, Shanghai, China 201203 |
(Address of principal executive offices) |
|
Mr. Telephone: (8621) 3861-0000 Facsimile: (8621) 3895-3568 18 Zhangjiang Road, Pudong New Area, Shanghai, China 201203 |
(Name, Telephone, E-mail and/or Facsimile number and Address of Company Contact Person) |
Securities registered or to be registered pursuant to Section 12(b) of the Act.
Title of each class |
| Name of each exchange on which registered |
Ordinary Shares, par value US$0.0004 |
| The Stock Exchange of Hong Kong Limited* |
American Depositary Shares |
| The New York Stock Exchange, Inc. |
Securities registered or to be registered pursuant to Section 12(g) of the Act. None
Securities for which there is a reporting obligation pursuant to Section 15(d) of the Act. None
Indicate the number of outstanding shares of each of the issuer’s classes of capital or ordinary shares as of the close of the period covered by the annual report.
As of December 31, |
Indicate by check mark if the registrant is a well-known seasoned issuer, as defined in Rule 405 of the Securities Act.
x Yes o No
If this report is an annual or transition report, indicate by check mark if the registrant is not required to file reports pursuant to Section 13 or 15 (d)15(d) of the Securities Exchange Act of 1934.
o Yes x No
Indicate by check mark whether the registrant: (1) has filed all reports required to be filed by Section 13 or 15(d) of the Securities Exchange Act of 1934 during the preceding 12 months (or for such shorter period that the registrant was required to file such reports), and (2) has been subject to such filing requirements for the past 90 days.
x Yes o No
Indicate by check mark whether the registrant has submitted electronically and posted on its corporate Web site, if any, every Interactive Data File required to be submitted and posted pursuant to Rule 405 of Regulation S-T (§232.405 of this chapter) during the preceding 12 months (or for such shorter period that the registrant was required to submit and post such files).
x Yes o No
Indicate by check mark whether the registrant is a large accelerated filer, an accelerated filer, or a non-accelerated filer. See definition of “accelerated filer and large accelerated filer” in Rule 12b-2 of the Securities Exchange Act of 1934 (Check one):
Large accelerated filer x |
| Accelerated filer o |
| Non-accelerated filer o |
Indicate by check mark which basis of accounting the registrant has used to prepare the financial statements included in this filing:
U.S. GAAP o |
| International Financial Reporting Standards as issued |
| Other o |
If this is an annual report, indicate by check mark whether the registrant is a shell company (as defined in Rule 12b-2 of the Securities Exchange Act of 1934).
o Yes x No
* Not for trading, but only in connection with the listing of American Depositary Shares on the New York Stock Exchange, Inc.
| |
|
|
Item 1. Identity of Directors, Senior Management and Advisors | 4 |
|
|
4 | |
|
|
4 | |
|
|
| |
|
|
| |
|
|
| |
|
|
| |
|
|
| |
|
|
| |
|
|
| |
|
|
| |
|
|
Item 11. Quantitative and Qualitative Disclosures about Market Risk |
|
|
|
Item 12. Description of Securities Other Than Equity Securities |
|
|
|
| |
|
|
| |
|
|
Item 14. Material Modifications to the Rights of Security Holders and Use of Proceeds |
|
|
|
| |
|
|
| |
|
|
| |
|
|
| |
|
|
Item 16D. Exemptions from the Listing Standards of Audit Committees |
|
|
|
Item 16E. Purchases of Equity Securities by the Issuer and Affiliated Purchasers |
|
|
|
| |
|
|
| |
|
|
| |
|
|
| |
|
|
| |
|
|
| |
|
|
| |
| |
| |
| |
| |
| |
| |
| |
| |
| 126 |
EX-4.9
EX-4.10 EX-4.11 EX-4.12 EX-12.1 EX-12.2 EX-13.1 EX-15.1 |
INTRODUCTION
In this annual report, except where the context otherwise requires and for purposes of this annual report only:
· “ADSs” refers to American Depositary Shares;
· “Average selling price of wafers” refers to simplified average selling price which is calculated as total revenue divided by total shipments;
· “Board” refers to our board of directors;
·“China” or the “PRC” refers to the People’s Republic of China, excluding for the purpose of this annual report, Hong Kong, Macau and Taiwan;
· “Company,” “SMIC,” “Registrant,” “we,” “our” and “us” refers to Semiconductor Manufacturing International Corporation, a Cayman Islands company;
· “Directors” refers to the members of our board of directors;the Board;
· “EUR” refers to Euros;
· “Global Offering” refers to the initial public offering of our ADSs and our odrinaryordinary shares, which was completed on March 18, 2004;
· “Group” refers to SMIC and all of its subsidiaries;
· “HK$” refers to Hong Kong dollars;
· “IFRS” refers to International Financial Reporting Standards as issued by the International Accounting Standards Board;
· “Rmb,” “rmb” or “RMB” refers to Renminbi, the legal currency of China;
· “NYSE” or “New York Stock Exchange” are to the New York Stock Exchange, Inc.;
· “SEC” refers to the U.S. Securities and Exchange Commission;
· “SEHK,” “HKSE” or “Hong Kong Stock Exchange” refers to The Stock Exchange of Hong Kong Limited;
· “U.S. GAAP” refers to generally accepted accounting principles in the United States; and
· “US$” or “USD” refers to U.S. dollars.
· The “Glossary of Technical Terms” contained in Annex A of this annual report sets forth the description of certain technical terms and definitions used in this annual report.
All references in this annual report to silicon wafer quantities are to 8-inch wafer equivalents, unless otherwise specified. Conversion of quantities of 12-inch wafers to 8-inch wafer equivalents is achieved by multiplying the number of 12-inch wafers by 2.25. When we refer to the capacity of wafer fabrication facilities, we are referring to the installed capacity based on specifications established by the manufacturers of the equipment used in those facilities. References to key process technology nodes, such as 0.35 micron, 0.25 micron, 0.18 micron, 0.15 micron, 0.13 micron, 90 nanometer, 65 nanometer and 45 nanometer include the stated resolution of the process technology, as well as intermediate resolutions down to but not including the next key process technology node of finer resolution. For example, when we state “0.25 micron process technology,” that also includes 0.22 micron, 0.21 micron, 0.20 micron and 0.19 micron technologies and “0.18 micron process technology” also includes 0.17 micron and 0.16 micron technologies.
All references to our ordinary shares in this annual report gives effect to the 10-for-1 share split we effected in the form of a share dividend immediately prior to the completion of the Global Offering on March 18, 2004. All references to price per ordinary share and price per preference share reflect the share split referenced above
We prepare our consolidated financial statements in accordance with IFRS. These are our first annualOur consolidated financial statements thatpresented in our annual reports for the years ended prior to December 31, 2012 were prepared in accordance with IFRS and IFRS 1, “First Time Adoption of International Financial Reporting Standards.” Until and including our financial statements at and for the year ended December 31, 2011, we prepared our consolidated financial statements in accordance with generally accepted accounting principles in the United States (“U.S. GAAP”).GAAP.
FORWARD-LOOKING STATEMENTS
This annual report contains, in addition to historical information, “forward-looking statements” within the meaning of the U.S. Private Securities Litigation Reform Act of 1995. These forward-looking statements are based on our current assumptions, expectations and projections about future events. We use words like “believe,” “anticipate,” “intend,” “estimate,” “expect,” “project” and similar expressions to identify forward-looking statements, although not all forward-lookingforward- looking statements contain these words. These forward-looking statements are necessarily estimates reflecting the judgment of our senior management and involve significant risks, both known and unknown, uncertainties and other factors that may cause our actual performance, financial condition or results of operations to be materially different from those suggested by the forward-looking statements including, among others:
· risks associated with cyclicality and market conditions in the semiconductor industry;
· intense competition;
· timely wafer acceptance by our customers;
· timely introduction of new technologies;
· our ability to ramp new products into volume;
· supply and demand for semiconductor foundry services;
· industry overcapacity;
· shortages in equipment, components and raw materials;
· availability of manufacturing capacity;
· our anticipated capital expenditures;
· our anticipated investments in research and development, anticipated changes to our liability for unrecognized tax benefits; and
· financial stability in end markets.
Except as required by law, we undertake no obligation and do not intend to update any forward- looking statement, whether as a result of new information, future events or otherwise.
Item 1.Identity of Directors, Senior Management and Advisors
Not applicable.
Item 2.Offer Statistics and Expected Timetable
Not applicable.
A. Selected Consolidated Financial Data
We started to prepare our annual consolidated financial statements in accordance with IFRS for the first time as of and for the year ended December 31, 2012. As disclosed in Note 1Prior to the consolidated financial statements, these consolidated financial statements represent our initial presentation of the financial results of operations and financial position under IFRS as of and for the year ended December 31, 2012. As a result, these consolidated financial statements have been prepared in accordance with IFRS 1, “First-time Adoption of International Financial Reporting Standards”. Previously,this, we prepared our annual consolidated financial statements in accordance with U.S. GAAP. Further, we haveWe adjusted our consolidated financial informationstatements as of and for the year ended December 31, 2011 in accordance with IFRS and therefore, financial information set forth in this annual report as of and for the year ended December 31, 2011 may differ from information previously published.
IFRS differspublished in certain significant respects from U.S. GAAP. For a discussion ofour annual report for the major differences between IFRS and U.S. GAAP, as they related to us, and a reconciliation of comprehensive income (loss) and shareholders’ equity to U.S. GAAP and information concerning the use of exceptions permitted or required by IFRS 1, see “Note 4 to Consolidated Financial Statements.”year ended December 31, 2011.
The selected consolidated financial data presented below as of and for the years ended December 31, 2011, 2012 and 20122013 have been prepared in accordance with IFRS and are derived from, and should be read in conjunction with our audited consolidated financial statements, including the related notes, included elsewhere in this annual report. The selected consolidated financial data presented below as of and for the years ended December 31, 2008, 2009 and 2010 have been prepared in accordance with U.S. GAAP and are derived from our audited consolidated financial statements not included in this annual report.
|
| For the year ended December 31, |
|
| For the year ended December 31, |
| |||||||||||
|
| 2011 |
| 2012 |
|
| 2011 |
| 2012 |
| 2013 |
| |||||
|
| (in US$ thousands, except for earnings per share) |
|
| (in US$ thousands, except for earnings per share) |
| |||||||||||
Continuing operations |
|
|
|
|
| ||||||||||||
Revenue |
| 1,319,466 |
| 1,701,598 |
|
| 1,319,466 |
| 1,701,598 |
| 2,068,964 |
| |||||
Cost of sales |
| (1,217,525 | ) | (1,352,835 | ) |
| (1,217,525 | ) | (1,352,835 | ) | (1,630,528 | ) | |||||
Gross profit |
| 101,941 |
| 348,763 |
|
| 101,941 |
| 348,763 |
| 438,436 |
| |||||
Research and development |
| (191,473 | ) | (193,569 | ) | ||||||||||||
Research and development expenses |
| (191,473 | ) | (193,569 | ) | (145,314 | ) | ||||||||||
Sales and marketing expenses |
| (32,559 | ) | (31,485 | ) |
| (32,559 | ) | (31,485 | ) | (35,738 | ) | |||||
General and administration expenses |
| (57,435 | ) | (107,313 | ) |
| (57,435 | ) | (107,313 | ) | (138,167 | ) | |||||
Impairment loss on property, plant and equipment |
| (17,691 | ) | — |
| ||||||||||||
Other operating income (expense) |
| (11,190 | ) | 19,117 |
| 67,870 |
| ||||||||||
Profit (loss) from operations |
| (190,716 | ) | 35,513 |
| 187,087 |
| ||||||||||
Interest income |
| 4,724 |
| 5,390 |
| 5,888 |
| ||||||||||
Finance costs |
| (21,903 | ) | (39,460 | ) |
| (21,903 | ) | (39,460 | ) | (34,392 | ) | |||||
Interest income |
| 4,724 |
| 5,390 |
| ||||||||||||
Other income |
| 13,718 |
| 6,190 |
| ||||||||||||
Foreign exchange gains or losses |
| 17,589 |
| 3,895 |
| 13,726 |
| ||||||||||
Other gains or losses |
| 17,081 |
| 23,220 |
|
| 6,709 |
| 6,398 |
| 4,010 |
| |||||
Share of profits of associates |
| 4,479 |
| 1,703 |
|
| 4,479 |
| 1,703 |
| 2,278 |
| |||||
Profit (loss) before tax |
| (179,118 | ) | 13,439 |
|
| (179,118 | ) | 13,439 |
| 178,597 |
| |||||
Income tax benefit (expense) |
| (82,503 | ) | 9,102 |
|
| (82,503 | ) | 9,102 |
| (4,130 | ) | |||||
Profit (loss) for the year from continuing operations |
| (261,621 | ) | 22,541 |
|
| (261,621 | ) | 22,541 |
| 174,467 |
| |||||
Discontinued operations |
|
|
|
|
|
|
|
|
|
|
|
| |||||
Profit for the year from discontinued operations |
| 14,741 |
| — |
|
| 14,741 |
| — |
| — |
| |||||
Profit (loss) for the year |
| (246,880 | ) | 22,541 |
|
| (246,880 | ) | 22,541 |
| 174,467 |
| |||||
Other comprehensive income |
|
|
|
|
|
|
|
|
|
|
|
| |||||
Exchange differences on translating foreign operations |
| 4,938 |
| 70 |
|
| 4,938 |
| 70 |
| 731 |
| |||||
Total comprehensive income (expense) for the year |
| (241,942 | ) | 22,611 |
|
| (241,942 | ) | 22,611 |
| 175,198 |
| |||||
Profit (loss) for the year attributable to: |
|
|
|
|
|
|
|
|
|
|
|
| |||||
Owners of the Company |
| (246,817 | ) | 22,771 |
|
| (246,817 | ) | 22,771 |
| 173,177 |
| |||||
Non-controlling interests |
| (63 | ) | (230 | ) |
| (63 | ) | (230 | ) | 1,290 |
| |||||
|
| (246,880 | ) | 22,541 |
|
| (246,880 | ) | 22,541 |
| 174,467 |
| |||||
Total comprehensive income for the year attributable to: |
|
|
|
|
| ||||||||||||
Total comprehensive income (expense) for the year attributable to: |
|
|
|
|
|
|
| ||||||||||
Owners of the Company |
| (241,879 | ) | 22,841 |
|
| (241,879 | ) | 22,841 |
| 173,908 |
| |||||
Non-controlling interests |
| (63 | ) | (230 | ) |
| (63 | ) | (230 | ) | 1,290 |
| |||||
|
| (241,942 | ) | 22,611 |
|
| (241,942 | ) | 22,611 |
| 175,198 |
| |||||
Earnings per share |
|
|
|
|
| ||||||||||||
Earnings (loss) per share |
|
|
|
|
|
|
| ||||||||||
From continuing and discontinued operations |
|
|
|
|
|
|
|
|
|
|
|
| |||||
Basic |
| $ | (0.01 | ) | $ | 0.00 |
|
| $ | (0.01 | ) | $ | 0.00 |
| $ | 0.01 |
|
Diluted |
| $ | (0.01 | ) | $ | 0.00 |
|
| $ | (0.01 | ) | $ | 0.00 |
| $ | 0.01 |
|
From continuing operations |
|
|
|
|
|
|
|
|
|
|
|
| |||||
Basic |
| $ | (0.01 | ) | $ | 0.00 |
|
| $ | (0.01 | ) | $ | 0.00 |
| $ | 0.01 |
|
Diluted |
| $ | (0.01 | ) | $ | 0.00 |
|
| $ | (0.01 | ) | $ | 0.00 |
| $ | 0.01 |
|
|
| For the year ended December 31, |
| ||||||||||||||
|
| 2008(1) |
| 2009(1) |
| 2010(1) |
|
| For the year ended December 31, |
| |||||||
|
| (in US$ thousands, except for per share and per ADS data) |
|
| 2009(1) |
| 2010(1) |
| |||||||||
|
|
|
|
|
|
|
|
| (in US$ thousands, except for per share |
| |||||||
Sales |
| 1,322,092 |
| 1,037,665 |
| 1,532,449 |
|
| 1,037,665 |
| 1,532,449 |
| |||||
Cost of sales |
| 1,393,788 |
| 1,158,148 |
| 1,229,266 |
|
| 1,158,148 |
| 1,229,266 |
| |||||
Gross profit (loss) |
| (71,696 | ) | (120,483 | ) | 303,183 |
|
| (120,483 | ) | 303,183 |
| |||||
Operating expenses (income): |
| 105,577 |
| 176,420 |
| 191,046 |
|
|
|
|
|
| |||||
Research and development |
|
|
|
|
|
|
|
| 176,420 |
| 191,046 |
| |||||
General and administrative |
| 62,466 |
| 215,845 |
| 41,387 |
|
| 215,845 |
| 41,387 |
| |||||
Selling and marketing |
| 20,434 |
| 26,209 |
| 29,087 |
|
| 26,209 |
| 29,087 |
| |||||
Impairment loss of long-lived assets |
| 106,741 |
| 126,635 |
| 5,138 |
|
| 126,635 |
| 5,138 |
| |||||
Loss (gain) from sale of equipment and other fixed assets |
| (2,890 | ) | 3,891 |
| 97 |
| ||||||||||
Loss from sale of equipment and other fixed assets |
| 3,891 |
| 97 |
| ||||||||||||
Litigation settlement |
| — |
| 269,637 |
| — |
|
| 269,637 |
| — |
| |||||
Other operating income |
| — |
| — |
| (16,493 | ) |
| — |
| (16,493 | ) | |||||
Total operating expenses, net |
| 292,328 |
| 818,637 |
| 250,262 |
|
| 818,637 |
| 250,262 |
| |||||
Income (loss) from operations |
| (364,024 | ) | (939,120 | ) | 52,921 |
|
| (939,120 | ) | 52,921 |
| |||||
Other income (expense): |
|
|
|
|
|
|
|
|
|
|
|
| |||||
Interest income |
| 11,289 |
| 2,547 |
| 4,086 |
|
| 2,547 |
| 4,086 |
| |||||
Interest expense |
| (50,733 | ) | (24,587 | ) | (22,563 | ) |
| (24,587 | ) | (22,563 | ) | |||||
Change in the fair value of commitment to issue shares and warrants |
| — |
| (30,101 | ) | (29,815 | ) |
| (30,101 | ) | (29,815 | ) | |||||
Foreign currency exchange gain |
| 11,261 |
| 7,291 |
| 5,101 |
|
| 7,291 |
| 5,101 |
| |||||
Others, net |
| 6,371 |
| (4,549 | ) | 6,534 |
|
| (4,549 | ) | 6,534 |
| |||||
Total other income (expense), net |
| (21,812 | ) | (49,399 | ) | (36,657 | ) |
| (49,399 | ) | (36,657 | ) | |||||
Income (loss) from continuing operations before income tax and equity investment |
| (385,836 | ) | (988,519 | ) | 16,264 |
|
| (988,519 | ) | 16,264 |
| |||||
Income tax benefit (expense) |
| (26,433 | ) | 46,624 |
| 4,818 |
| ||||||||||
Income tax benefit |
| 46,624 |
| 4,818 |
| ||||||||||||
Gain (loss) from equity investment |
| (444 | ) | (1,782 | ) | 285 |
|
| (1,782 | ) | 285 |
| |||||
Income (loss) from continuing operations |
| (412,713 | ) | (943,677 | ) | 21,367 |
|
| (943,677 | ) | 21,367 |
| |||||
Income (loss) from discontinued operations net of tax effect |
| (19,667 | ) | (18,800 | ) | (7,356 | ) | ||||||||||
Loss from discontinued operations net of tax effect |
| (18,800 | ) | (7,356 | ) | ||||||||||||
Net income (loss) |
| (432,380 | ) | (962,477 | ) | 14,011 |
|
| (962,477 | ) | 14,011 |
| |||||
Accretion of interest to noncontrolling interest |
| (7,851 | ) | (1,060 | ) | (1,050 | ) | ||||||||||
Loss attributable to noncontrolling interest |
| — |
| — |
| 140 |
| ||||||||||
Accretion of interest to non-controlling interest |
| (1,060 | ) | (1,050 | ) | ||||||||||||
Loss attributable to non-controlling interest |
| — |
| 140 |
| ||||||||||||
Net income (loss) attributable to Semiconductor Manufacturing International Corporation |
| (440,231 | ) | (963,537 | ) | 13,100 |
|
| (963,537 | ) | 13,100 |
| |||||
Deemed dividends on convertible preferred shares |
| — |
| — |
| — |
|
| — |
| — |
| |||||
Net income (loss) attributable to holders of ordinary shares |
| (440,231 | ) | (963,537 | ) | 13,100 |
|
| (963,537 | ) | 13,100 |
| |||||
Net income (loss) |
| (432,380 | ) | (962,477 | ) | 14,011 |
|
| (962,477 | ) | 14,011 |
| |||||
Other comprehensive income (loss): |
|
|
|
|
|
|
|
|
|
|
|
| |||||
Foreign currency translation adjustment |
| (437 | ) | 53 |
| (706 | ) |
| 53 |
| (706 | ) | |||||
Comprehensive income (loss) |
| (432,817 | ) | (962,424 | ) | 13,305 |
|
| (962,424 | ) | 13,305 |
| |||||
Comprehensive income (loss) attributable to noncontrolling interest |
| (7,851 | ) | (1,060 | ) | (910 | ) | ||||||||||
Comprehensive income (loss) attributable to non-controlling interest |
| (1,060 | ) | (910 | ) | ||||||||||||
Comprehensive income (loss) attributable to Semiconductor Manufacturing International Corporation |
| (440,668 | ) | (963,484 | ) | 12,395 |
|
| (963,484 | ) | 12,395 |
| |||||
Earnings (loss) per ordinary share, basic |
| $ | (0.02 | ) | $ | (0.04 | ) | $ | 0.00 |
|
| $ | (0.04 | ) | $ | 0.00 |
|
Earnings (loss) per ordinary share, dilute |
| $ | (0.02 | ) | $ | (0.04 | ) | $ | 0.00 |
|
| $ | (0.04 | ) | $ | 0.00 |
|
Weighted average shares used in computing basic earnings (loss) per ordinary share |
| 18,682,544,866 |
| 22,359,237,084 |
| 24,258,437,559 |
|
| 22,359,237,084 |
| 24,258,437,559 |
| |||||
Weighted average shares used in computing diluted earnings (loss) per ordinary share |
| 18,682,544,866 |
| 22,359,237,084 |
| 25,416,597,405 |
|
| 22,359,237,084 |
| 25,416,597,405 |
| |||||
(1) Prepared under U.S. GAAP.
|
| For the year ended December 31, |
| ||||
|
| 2011 |
| 2012 |
| 2013 |
|
|
|
|
| (in US$ thousands) |
|
|
|
Statements of Financial Position Data: |
|
|
|
|
|
|
|
Property, plant and equipment |
| 2,516,578 |
| 2,385,435 |
| 2,528,834 |
|
Prepaid land use rights |
| 77,231 |
| 73,962 |
| 136,725 |
|
Total non-current assets |
| 2,866,416 |
| 2,803,173 |
| 2,960,151 |
|
Inventories |
| 207,308 |
| 295,728 |
| 286,251 |
|
Prepaid operating expense |
| 52,805 |
| 46,986 |
| 43,945 |
|
Trade and other receivables |
| 200,905 |
| 328,211 |
| 379,361 |
|
Other financial assets |
| 1,973 |
| 18,730 |
| 240,311 |
|
Restricted cash |
| 136,907 |
| 217,603 |
| 147,625 |
|
Cash and cash equivalents |
| 261,615 |
| 358,490 |
| 462,483 |
|
Assets classified as held-for-sale |
| — |
| 4,239 |
| 3,265 |
|
Total current assets |
| 861,513 |
| 1,269,987 |
| 1,563,241 |
|
Total assets |
| 3,727,929 |
| 4,073,160 |
| 4,523,392 |
|
Total non-current liabilities |
| 230,607 |
| 688,622 |
| 991,673 |
|
Total current liabilities |
| 1,251,324 |
| 1,108,086 |
| 938,537 |
|
Total liabilities |
| 1,481,931 |
| 1,796,708 |
| 1,930,210 |
|
Non-controlling interest |
| 1,182 |
| 952 |
| 109,410 |
|
Total equity |
| 2,245,998 |
| 2,276,452 |
| 2,593,182 |
|
|
| For the year ended December 31, |
| ||
|
| 2011 |
| 2012 |
|
|
| (in US$ thousands) |
| ||
Statements of Financial Position Data: |
|
|
|
|
|
Cash and cash equivalents |
| 261,615 |
| 358,490 |
|
Restricted cash |
| 136,907 |
| 217,603 |
|
Prepaid operating expense |
| 52,805 |
| 46,986 |
|
Trade and other receivables |
| 200,905 |
| 328,211 |
|
Inventories |
| 207,308 |
| 295,728 |
|
Other financial assets |
| 1,973 |
| 18,730 |
|
Assets classified as held-for-sale |
| — |
| 4,239 |
|
Total current assets |
| 861,513 |
| 1,269,987 |
|
Prepaid land use rights |
| 77,231 |
| 73,692 |
|
Property, plant and equipment |
| 2,516,578 |
| 2,385,435 |
|
Total assets |
| 3,727,929 |
| 4,073,160 |
|
Total current liabilities |
| 1,251,324 |
| 1,108,086 |
|
Total non-current liabilities |
| 230,607 |
| 688,622 |
|
Total liabilities |
| 1,481,931 |
| 1,796,708 |
|
Noncontrolling interest |
| 1,182 |
| 952 |
|
Total equity |
| 2,245,998 |
| 2,276,452 |
|
|
| For the year ended December 31, |
|
| For the year ended December 31, |
| ||||||
|
| 2008(1) |
| 2009(1) |
| 2010(1) |
|
| 2009(1) |
| 2010(1) |
|
|
| (in US$ thousands) |
|
| (in US$ thousands) |
| ||||||
Balance Sheet Data: |
|
|
|
|
|
|
|
|
|
|
|
|
Cash and cash equivalents |
| 450,230 |
| 443,463 |
| 515,808 |
|
| 443,463 |
| 515,808 |
|
Restricted cash |
| 6,255 |
| 20,360 |
| 161,350 |
|
| 20,360 |
| 161,350 |
|
Accounts receivable, net of allowance |
| 199,372 |
| 204,291 |
| 206,623 |
|
| 204,291 |
| 206,623 |
|
Inventories |
| 171,637 |
| 193,705 |
| 213,404 |
|
| 193,705 |
| 213,404 |
|
Total current assets |
| 926,858 |
| 907,058 |
| 1,179,102 |
|
| 907,058 |
| 1,179,102 |
|
Prepaid land use rights |
| 74,293 |
| 78,112 |
| 78,798 |
|
| 78,112 |
| 78,798 |
|
Plant and equipments, net |
| 2,963,386 |
| 2,251,614 |
| 2,351,863 |
|
| 2,251,614 |
| 2,351,863 |
|
Total assets |
| 4,270,622 |
| 3,524,077 |
| 3,902,693 |
|
| 3,524,077 |
| 3,902,693 |
|
Total current liabilities |
| 899,773 |
| 1,031,523 |
| 1,399,345 |
|
| 1,031,523 |
| 1,399,345 |
|
Total long-term liabilities |
| 578,689 |
| 661,472 |
| 294,806 |
|
| 661,472 |
| 294,806 |
|
Total liabilities |
| 1,478,462 |
| 1,692,995 |
| 1,694,152 |
|
| 1,692,995 |
| 1,694,152 |
|
Noncontrolling interest |
| 42,795 |
| 34,842 |
| 39,004 |
| |||||
Non-controlling interest |
| 34,842 |
| 39,004 |
| |||||||
Total equity |
| 2,749,365 |
| 1,796,240 |
| 2,169,537 |
|
| 1,796,240 |
| 2,169,537 |
|
(1) Prepared under U.S. GAAP
B. Capitalization and Indebtedness
Not Applicable
C. Reasons for the Offer and Use of Proceeds
Not Applicable
D. Risk Factors
Risk Factors Related to Our Financial Condition and Business
We may not be able to achieve or maintain a level of profitability, primarily due to the possibility of increasing fixed costs and market competition reflected in price erosion in the average selling prices of our products.
Our profit for the year from continuing operations totaled US$174.5 million in 2013 and US$22.5 million in 2012, while loss for2012. However, with the year from continuing operations totaledoffsetting impact of such profits, we still have net accumulated losses of US$261.61,693.9 million in 2011.as of the end of 2013. We may not be able to achieve or maintain profitability on an annual or quarterly basis, primarily because our business is characterized by high fixed costs relating to advanced technology equipment purchases, which result in correspondingly high levels of depreciation expenses. We will continue to incur capital expenditures and depreciation expenses as we equip and ramp-up additional fabs and expand our capacity at our existing fabs. This may result in an increase of our fixed costs and possibly reduce our chances of achieving or maintaining or achieving a higher level of profitability than we achieved in 2012.profitability. Currently, the planned capital expenditureexpenditures in 20132014 for foundry operations is approximately US$600880 million of which around US$570 million is for our majority owned subsidiary in Beijing, Semiconductor Manufacturing North China (Beijing) Corporation, or SMNC, which is primarily for 12-inch foundry operations55% funded by us and which does not account for additional expenditures that we may incur in connection with a certain joint venture we intend to establish. As announced in May 2012, we are presently negotiating45% funded by the termsother shareholders of a joint venture with Beijing municipal government entities to expand our Beijing production site, or the BJ Joint Venture. While there can be no assurance that we will enter intoentity. We also have budgeted approximately US$110 million as the BJ Joint Venture, we expect that this project would require us to incur significant2014 capital expenditures during its start-up phase, and from time to time thereafter, and that we would need to borrow underfor non-foundry operations mainly for the construction of living quarters for employees as part of our existing credit lines or otherwise obtain additional capital to satisfy our funding obligations under this project.employee retention program.
In addition, we are competing in the same technology environment as a number of other foundries and our competitors who operate these foundries often use price as a means of securing business, resulting in erosion of the average selling price of our product portfolio, which adversely affects our ability to achieve or maintain a level of profitability.
The cyclical nature of the semiconductor industry and periodic overcapacity make our business and operating results particularly vulnerable to economic downturns, such as a global economic crisis.
The semiconductor industry has historically been highly cyclical and, at various times, has experienced significant downturns characterized by fluctuations in end-user demand, reduced demand for integrated circuits, rapid erosion of average selling prices and production overcapacity. Companies in the semiconductor industry have expanded aggressively during periods of increased demand in order to have the capacity needed to meet such increased demand or expected demand in the future. If actual demand is not sustained, does not increase or declines, or if companies in the industry expand too aggressively in light of the actual increase in demand, the industry will generally experience a period in which industry- wide capacity exceeds demand.
During periods when industry-wide capacity exceeds demand, our operations are subject to more intense competition, and our results of operations are likely to suffer because of the resulting pricing pressure and capacity underutilization. Severe pricing pressure could result in the overall foundry industry becoming less profitable, at least for the duration of the downturn, and could prevent us from achieving or maintaining profitability. We expect that industry cyclicality will continue.
In addition, an erosion of global consumer confidence amidst concerns over declining asset values, inflation, energy costs, geopolitical issues, the availability and cost of credit, rising unemployment, and the stability and solvency of financial institutions, financial markets, businesses and sovereign nations could have an adverse effect on our results of operations.
Adverse economic conditions could cause our expenses to vary materially from our expectations. The failure of financial institutions could negatively impact our treasury operations, as the financial condition of such parties may deteriorate rapidly and without notice in times of market volatility and disruption. Other income and expense could vary materially from expectations depending on changes in interest rates, borrowing costs and currency exchange rates. Economic downturns may also lead to restructuring actions and associated expenses.
If we cannot take appropriate or effective actions in a timely manner during any economic downturns, such as reducing our costs to sufficiently offset declines in demand for our services, our business and operating results may be adversely affected. A prolonged period of economic decline could have a material adverse effect on our results of operations. Economic uncertainty also makes it difficult for us to make accurate forecasts of revenue, gross margin and expenses.
Furthermore, a slowdown in the growth in demand for, or the continued reduction in selling prices of, devices that use semiconductors may decrease the demand for our products and reduce our profit margins.
The loan agreements entered into by members of the Group contain certain restrictions that limit our flexibility in operating our business.
The terms of certain of the existing loan agreements entered into by members of the Group contain, and certain future indebtedness of the Group would likely contain, a number of restrictive covenants that impose significant operating and financial restrictions on the Group, including restrictions on the ability of members of the Group to, among other things:
· pay dividends;
· repay outstanding shareholder loans and provide loans to subsidiaries; and
· consolidate, merge, sell or otherwise dispose of any of our assets under certain conditions.
In addition, certain loan agreements of the Group contain, and any future loan agreements may contain, cross-default clauses whereby a default under one of the loan agreements may constitute an event of default under the other loan agreements. We may also be required to satisfy and maintain specified financial ratios and other financial covenants. The Group’s ability to meet such financial ratios and other covenants can be affected by various events, and we cannot assure you that we will meet these ratios and comply with such covenants in the future. A breach of any of these covenants would result in a default under the existing loan agreements of the Group, which may allow the lenders to declare all amounts outstanding thereunder to be due and payable after the lapse of the relevant grace period and terminate all commitments to extend further credit, any of which could result in an event of default under the terms and conditions of the loan agreement.
The impact of deteriorating economic conditions on our customers and suppliers could adversely affect our business.
Customer financial difficulties have resulted, and could result in the future, in increases in bad debt write-offs and additions to reserves in our receivables portfolio. In particular, our exposure to certain financially troubled customers could have an adverse effect on our results of operations. In addition, we depend on suppliers of raw materials, such as silicon wafers, gases and chemicals, and spare equipment parts, in order to maintain our production processes. Our business may be disrupted if, due to the insolvency of key suppliers, we are unable to obtain the raw materials required to sustain our operations.
Demand instability for foundry services may result in a lower rate of return on investments than previously anticipated and our business and operating results may be adversely affected.
The demand for foundry services by IDMs, fabless semiconductor companies and systems companies has been increasing. We have made significant investments in anticipation of the continuation of this trend and, as such, any reversal of this trend will likely result in a lower rate of return on our investments. During an industry slowdown, IDMs may allocate a smaller portion of their fabricating needs to foundry service providers and perform a greater amount of foundry services for system companies and fabless semiconductor companies in order to maintain their equipment’s utilization rates. As a result, our business and operating results could be adversely affected.
Our results of operations may fluctuate from year to year, making it difficult to predict our future performance which may be below our expectations or those of the public market analysts and investors in these periods.
Our sales, expenses, and results of operations may fluctuate significantly from year to year due to a number of factors, many of which are outside our control. Our business and operations are subject to a number of factors, including:
· our customers’ sales outlook, purchasing patterns and inventory adjustments based on general economic conditions or other factors;
· the loss of one or more key customers or the significant reduction or postponement of orders from such customers;
· timing of new technology development and the qualification of this technology by our customers;
· timing of our expansion and development of our facilities;
· our ability to obtain equipment and raw materials; and
· our ability to obtain financing in a timely manner.
Due to the factors noted above and other risks discussed in this section, year-to-year comparisons cannot be relied upon to predict our future performance. Unfavorable changes in any of the above factors may adversely affect our business and operating results. In addition, our operating results may be below the expectations of public market analysts and investors in some future periods.
If we are unable to maintain high capacity utilization, optimize the technology and product mix of our services or improve our yields, our margins may substantially decline, thereby adversely affecting our operating results.
Our ability to achieve and maintain profitability depends, in part, on our ability to:
· maintain high capacity utilization, which is the actual number of wafers we produce in relation to our capacity;
· optimize our technology and product mix, which is the relative number of wafers fabricated utilizing higher margin technologies as compared to commodity and lower margin technologies; and
· continuously maintain and improve our yield, which is the percentage of usable fabricated devices on a wafer.
Our capacity utilization affects our operating results because a large percentage of our costs are fixed. Our technology and product mix has a direct impact upon our average selling prices and overall margins. Our yields directly affect our ability to attract and retain customers, as well as the price of our products. If we are unable to maintain high capacity utilization, optimize the technology and product mix of our wafer production and continuously improve our yields, our margins may substantially decline, thereby adversely affecting our operating results.
Our continuing expansion could present significant challenges to our management and administrative systems and resources, and as a result, we could experience difficulties managing our growth, which could adversely affect our business and operating results.
Over the next several years, we plan to increase our production capacity through expansion of existing production sites. We expect to add capital equipment and increase our headcount with future increases in production capacity. If we fail to develop and maintain management and administrative systems and resources sufficient to keep pace with our planned growth, we may experience difficulties managing our growth and our business and operating results could be adversely affected.
If we lose one or more of our key personnel without obtaining adequate replacements in a timely manner or if we are unable to retain and recruit skilled personnel, our operations could become disrupted and the growth of our business could be delayed or restricted.
Our success depends on the continued service of our key management team members, and in particular, Mr. Zhang Wenyi, Chairman of our board of directorsBoard and Executive Director as well as Dr. Tzu-Yin Chiu, Chief Executive Officer and Executive Director. We do not carry full key person insurance. If we lose the services of any of our key executive officers, it could be very difficult to find, relocate and integrate adequate replacement personnel into our operations. As a result, our operations and the growth of our business could be seriously harmed.
We will require an increased number of experienced executives, engineers and other skilled employees in the future to implement our growth plans. In addition, we expect demand for skilled and experienced personnel in China to increase in the future as new wafer fabrication facilities and other similar high technology businesses are established there. There is intense competition for the services of these personnel in the semiconductor industry. If we are unable to retain our existing personnel or attract, assimilate and retain new experienced personnel in the future, our operations could become disrupted and the growth of our business could be delayed or restricted.
Our customers generally do not place purchase orders far in advance, which makes it difficult for us to predict our future sales, adjust our production costs and efficiently allocate our capacity on a timely basis and could therefore have an adverse effect on our business and operating results.
Our customers generally do not place purchase orders far in advance of the required shipping dates. In addition, due to the cyclical nature of the semiconductor industry, our customers’ purchase orders have varied significantly from period to period. As a result, we do not typically operate with any significant backlog, which makes it difficult for us to forecast our sales in future periods. Also, since our cost of sales and operating expenses have high fixed cost components, including depreciation and employee costs, we may be unable to adjust our cost structure in a timely manner to compensate for shortfalls in sales. Our current and anticipated customers may not place orders with us in accordance with our expectations or at all. As a result, it may be difficult to plan our capacity, which requires significant lead time to ramp-up and cannot be altered easily. If our capacity does not match our customer demand, we will either be burdened with expensive and unutilized overcapacity or unable to support our customers’ requirements, both of which could have an adverse effect on our business and results of operations.
Our sales cycles can be long, which could adversely affect our short-term operating results and cause our long-termlong- term income stream to be unpredictable.
Our sales cycles, which is measured as the time between our first contact with a particular customer and the first shipment of product orders to such customer, vary substantially and can last as long as one year or more, particularly for new technologies. Sales cycles to IDM customers typically take relatively longer since they usually require our engineers to become familiar with the customer’s proprietary technology before production can commence. In addition, even after we make the initial product shipments, it may take the customer several more months to reach full production of that product using our foundry services. As a result of these long sales cycles, we may be required to invest substantial time and incur significant expenses in advance of the receipt of any product order and related revenue. Orders ultimately received may not be in accordance with our expectations and cause our long-term income stream to be unpredictable.
If we do not consistently anticipate trends in technology development, we will not be able to maintain or increase our business and operating margins.
The semiconductor industry is developing rapidly and the related technologies are constantly evolving. We must be able to anticipate the trends in technology development and rapidly develop and implement new and innovative technologies that our customers require to produce sufficiently advanced products at competitive prices and within the time window of market opportunities. To do this, we must make long- term investments, develop or obtain appropriate intellectual property and commit significant resources based on forecasts. If there is large variation between our forecasts and the actual outcome, our long- term investments will not yield satisfactory results and our business and operations will be adversely affected.
Further, as the life cycle for a process technology matures, the average selling price falls. Accordingly, unless we continually upgrade our capability to manufacture new products that our customers design, our customers may use the services of our competitors instead of ours. This can result in the average selling prices of our wafers falling, which could adversely affect our business and operating margins.
Our sales are dependent upon a small number of customers and any decrease in sales to any of them could adversely affect our results of operations.
We have been dependent on a small number of customers for a substantial portion of our business. For the years ended December 31, 20112012 and 2012,2013, our five largest customers accounted for 49.3%56.1% and 56.1%52.3% of our total sales, respectively. We expect that we will continue to be dependent upon a relatively limited number of customers for a significant portion of our sales. Sales generated from these customers, individually or in the aggregate, may not reach our expectations or historical levels in any future period. Our sales could be significantly reduced if any of these customers cancels or reduces its orders, significantly changes its product delivery schedule, or demands lower prices, which could have an adverse effect on our results of operations.
Since our operating cash flows may not be sufficient to cover our planned capital expenditures, we will require additional external financing, which may not be available on acceptable terms, or at all. Any failure to raise adequate funds in a timely manner could adversely affect our business and operating results.
In 2012,2013, our capital expenditures totaled approximately US$499770 million and we currently expect our capital expenditures for foundry operations in 20132014 to total approximately US$600880 million, subject to adjustment based on market conditions. TheseUS$570 million of these capital expenditures will be used primarily to expand SMNC, our operations at our 12-inch fabs in Shanghai andnew Beijing and does not account for additional expenditures that we may incur in connection withmajority owned subsidiary. We also have budgeted approximately US$110 million as the establishment of the BJ Joint Venture. While there can be no assurance that we will enter into the BJ Joint Venture, we expect that this project would require us to incur significant2014 capital expenditures during its start-up phase, and from time to time thereafter, and that we would need to borrow underfor non-foundry operations mainly for the construction of living quarters for employees as part of our existing credit lines or otherwise obtain additional capital to satisfy our funding obligations under this project.employee retention program. In addition, our actual expenditures may exceed our planned expenditures for a variety of reasons, including changes in our business plan, our process technology, market conditions, equipment prices, customer requirements or interest rates. Future acquisitions, mergers, strategic investments, or other developments also may require additional financing. The amount of capital required to meet our growth and development targets is difficult to predict in the highly cyclical and rapidly changing semiconductor industry.
Our operating cash flows may not be sufficient to meet our capital expenditureexpenditures requirements. If our operating cash flows are insufficient, we plan to fund the expected shortfall through bank loans. If necessary, we will also explore other forms of external financing. Our ability to obtain external financing is subject to a variety of uncertainties, including:
· our future financial condition, results of operations and cash flows;
· general market conditions for financing activities of semiconductor companies;
· our future stock price; and
· our future credit rating.
External financing may not be available in a timely manner, on acceptable terms, or at all. Since our capacity expansion is a key component of our overall business strategy, any failure to raise adequate funds could adversely affect our business and operating results.
Expansion of our production sites is subject to certain risks that could result in delays or cost overruns, which could require us to expend additional capital and adversely affect our business and operating results.
We plan to increase our production capacity through expansion of existing production sites and construction or acquisition of new sites in connection with joint ventures we may establish such as the BJ Joint Venture.SMNC, our majority owned subsidiary in Beijing. There are a number of events that could delay these expansion projects or increase the costs of building and equipping these or future projects in accordance with our plans. Such potential events include, but are not limited to:
· shortages and late delivery of building materials and facility equipment;
· delays in the delivery, installation, commissioning and qualification of our manufacturing equipment;
· delays in securing financing for the expansion projects;
· disagreements with partners involved in the expansion projects;
· seasonal factors, such as extended periods of adverse weather that limit construction;
· labor disputes;
· design or construction changes with respect to building spaces or equipment layout;
· delays in securing necessary government approvals or land use rights; and
· changes in technology, capacity, or other changes in our plans for new fabs necessitated by changes in market conditions.
As a result, our projections relating to capacity, process technology capabilities, or technology developments may significantly differ from actual capacity, process technology capabilities, or technology developments.
Delays in the construction and equipping or expansion of any of our fabs could result in the loss or delayed receipt of earnings, an increase in financing costs, or the failure to meet profit and earnings projections, any of which could adversely affect our business and operating results.
If we cannot compete successfully in our industry, particularly in China, our results of operations and financial condition will be adversely affected.
The worldwide semiconductor foundry industry is highly competitive. We compete with other foundries, such as Taiwan Semiconductor Manufacturing Company Ltd., or TSMC, United Microelectronics Corporation, or UMC, and Global Foundries, as well as the foundry services offered by some IDMs, such as Samsung Electronics. We also compete with smaller semiconductor foundries in China, Korea, Malaysia and other countries. Some of our competitors have greater access to capital and substantially higher capacity, longer or more established relationships with their customers, superior research and development capability, and greater marketing and other resources than we do. As a result, these companies may be able to compete more aggressively over a longer period of time than we can.
Some of our competitors have established operations in mainland China in order to compete for the growing domestic market in China. TSMC has its own fab in China, and UMC has established a relationship with a fab in commercial production in China. In these cases, we understand that the ability of these fabs to manufacture wafers using certain more advanced technologies is subject to restrictions by the respective home jurisdiction of TSMC and UMC; however, such restrictions could be reduced or lifted at any time, which may lead to increased competition in China with such competitors and adversely affect our business and operating results.
In addition, various other factors such as import and export controls, foreign exchange controls, exchange rate fluctuations, interest rate fluctuations and political developments affect our ability to compete successfully. If we cannot compete successfully in our industry or are unable to maintain our position as a leading foundry in China, our results of operations and financial condition will be adversely affected.
We may be unable to obtain in a timely manner and at a reasonable cost the equipment necessary for our business and therefore may be unable to achieve our expansion plans or meet ourcustomers’ orders, which could negatively impact our competitiveness, financial condition and results of operations.
The semiconductor industry is capital-intensive and requires investment in advanced equipment that is available from a limited number of manufacturers. The market for equipment used in semiconductor foundries is characterized, from time to time, by significant demand, limited supply and long delivery cycles. Our business plan depends upon our ability to obtain our required equipment in a timely manner and at acceptable prices. Therefore, we invest in advanced equipment based on advance forecasts of demand. During times of significant demand for the types of equipment we use, lead times for delivery can be as long as one year. Shortages of equipment could result in an increase in equipment prices and longer delivery times. If we are unable to obtain equipment in a timely manner and at a reasonable cost, we may be unable to achieve our expansion plans or meet our customers’ orders, which could negatively impact our competitiveness, financial condition, and results of operations.
We expect to have an ongoing need to obtain licenses for the proprietary technology of others, which subjects us to the payment of license fees and potential delays in the development and marketing of our products.
While we continue to develop and pursue patent protection for our own technologies, we expect to continue to rely on third party license arrangements to enable us to manufacture certain advanced wafers. As of December 31, 2012,2013, we had been granted 3,0713,719 patents worldwide, of which, 5860 were in Taiwan, 247318 were in the U.S., and 2,7663,328 were in China.China and 13 were in other jurisdictions. In comparison, we believe our competitors and other industry participants have been issued numerous more patents concerning wafer fabrication in multiple jurisdictions. Our limited patent portfolio may in the future adversely affect our ability to obtain licenses to the proprietary technology of others on favorable license terms due to our inability to offer cross-licensing arrangements. The fees associated with such licenses could adversely affect our financial condition and operating results. They might also render our services less competitive. If for any reason we are unable to license necessary technology on acceptable terms, it may become necessary for us to develop alternative technology internally, which could be costly and delay the marketing and delivery of key products and therefore have an adverse effect on our business and operating results. In addition, we may be unable to independently develop the technology required by our customers on a timely basis or at all, in which case our customers may purchase wafers from our competitors.
We may be subject to claims of intellectual property rights infringement owing to the nature of our industry partly due to our limited patent portfolio and limitations of the indemnification provisions in our technology license agreements. These claims could adversely affect our business and operating results.
There is frequent intellectual property litigation in our industry, involving patents, copyrights, trade secrets, mask works and other intellectual property subject matters. In some cases, a company attempts to avoid or settle litigation on favorable terms if it possesses patents that can be asserted against the plaintiff. The limited size of our current patent portfolio is unlikely to place us in such a favorable bargaining position. Moreover, some of our technology license agreements with our major technology partners do not provide for us to be indemnified in the event that the processes we license pursuant to such agreements infringe third party intellectual property rights. We could be sued for infringing one or more patents as to which we will be unable to obtain a license and unable to design around. As a result, we would be prohibited from manufacturing or selling the products which are dependent upon such technology, which could have a material adverse effect on our business. We may litigate the issues of whether these patents are valid or infringed, but in the event of a loss we could be required to pay substantial monetary damages and be enjoined from further production or sale of such products.
If we are unable to maintain relationships with certain technology partners or are unable to enter into new technology alliances on a timely basis, we may not be able to continue providing our customers with leading edge process technology, which could adversely affect our competitive position and operating results.
Enhancing our process technologies is critical to our ability to provide high quality services for our customers. One way we are using to enhance our process technologies is forming technology alliances with other companies and leveraging our appropriate technology partners to advance our portfolio of process technologies to lower development risk and development cycle. We currently have joint technology development arrangements and technology sharing arrangements with several companies and research institutes. If we are unable to continue our technology alliances with these entities or maintain mutually beneficial terms on our other joint development arrangements, research and development alliances and other similar agreements or enter into new technology alliances with other leading developers of semiconductor technology, we may not be able to continue providing our customers with leading edge process technology on time, which could adversely affect our competitive position and operating results.
Global or regional economic, political and social conditions could adversely affect our business and operating results.
External factors such as potential terrorist attacks, acts of war, financial crises, the global economic crisis, or political, geopolitical and social turmoil in those parts of the world that serve as markets for our products could significantly adversely affect our business and operating results in ways that cannot presently be predicted. These uncertainties could make it difficult for our customers and us to accurately plan future business activities. For example, we purchase raw materials and other services from numerous suppliers, and, even if our facilities were not directly affected by such events, we could be affected by interruptions at such suppliers. Such suppliers may be less likely to be able to quickly recover from such events and may be subject to additional risks such as financial problems that limit their ability to conduct their operations. We cannot assure you that we will have insurance to adequately compensate us for any of these events. More generally, these geopolitical, social and economic conditions could result in increased volatility in worldwide financial markets and economies that could adversely impact our sales. We are not insured for losses and interruptions caused by terrorist acts or acts of war. Therefore, any of these events or circumstances could adversely affect our business and operating results.
The recurrence of an outbreak of the H7N9 and H5N1strain of flu (Avian Flu), the H1N1 strain of flu (Swine Flu), Severe Acute Respiratory Syndrome (SARS), or an outbreak of any other similar epidemic could, directly or indirectly, adversely affect our operating results.
Concerns about the spread of the H7N9 strain of flu (Avian Flu) in China recently and outbreaks of the H1N1 virus (Swine Flu) in North America, Europe and Asia in the past have caused governments to take measures to prevent spread of the virus. The spread of epidemics could negatively affect the economy. For example, past occurrences of epidemics such as SARS have caused different degrees of damage to the national and local economies in China. If any of our employees are identified as a possible source of spreading Swine Flu, Avian Flu or any other similar epidemic, we may be required to quarantine employees that are suspected of being infected, as well as others that have come into contact with those employees. We may also be required to disinfect our affected premises, which could cause a temporary suspension of our manufacturing capacity, thus adversely affecting our operations. A recurrence of an outbreak of Swine Flu, SARS, Avian Flu or other similar epidemic could restrict the level of economic activities generally and/or slow down or disrupt our business activities which could in turn adversely affect our results of operations.
Exchange rate fluctuations could increase our costs, which could adversely affect our operating results and the value of our ADSs.
Our financial statements are prepared in U.S. dollars. The majority of our sales are denominated in U.S. dollars and our manufacturing costs and capital expenditures are generally denominated in U.S. dollars, Japanese Yen, Euros and Renminbi. Although we enter into foreign currency forward exchange contracts to partially hedge our exposure to exchange rate fluctuations, we are still affected by fluctuations in exchange rates between the U.S. dollar and each of the Japanese Yen, the Euros and the Renminbi. Any significant fluctuations among these currencies may lead to an increase in our costs, which could adversely affect our operating results. See “Item 3.D - Risk Factors - Risks Related to Conducting Operations in China — Devaluation or appreciation in the value of the Renminbi or restrictions on convertibility of the Renminbi could adversely affect our business and operating results” for a discussion of risks relating to the Renminbi.
Fluctuations in the exchange rate of the Hong Kong dollar against the U.S. dollar will affect the U.S. dollar value of the ADSs, since our ordinary shares are listed and traded on the Hong Kong Stock Exchange and the price of such shares are denominated in Hong Kong dollars. While the Hong Kong government has continued to pursue a pegged exchange rate policy, with the Hong Kong dollar trading in the range of HK$7.74987.7509 to HK$7.76957.7647 per US$1.00 for 2012,2013, we cannot assure you that this policy will be maintained. Exchange rate fluctuations also will affect the amount of U.S. dollars received upon the payment of any cash dividends or other distributions paid in Hong Kong dollars and the Hong Kong dollar proceeds received from any sales of ordinary shares. Therefore, such fluctuations could also adversely affect the value of our ADSs.
If we fail to maintain an effective system of internal control, we may not be able to achieve the business objectives in operations, financial reporting integrity, and compliance with applicable laws and regulations.
We are required to comply with various PRC, Hong Kong and U.S. laws and regulations. For example, we are subject to reporting obligations under the U.S. securities laws. The SEC, as required by Section 404 of the Sarbanes-Oxley Act of 2002, or the Sarbanes-Oxley Act, adopted rules requiring public companies to include a management report on such company’s internal controls over financial reporting in its annual report, which contains management’s assessment of the effectiveness of our internal controls over financial reporting. Effective internal controls are necessary for us to provide reasonable assurance with respect to our financial reports, compliance with applicable laws and regulations, and to effectively achieve our operation objectives. In addition, because of the inherent limitations of internal control over financial reporting, including the possibility of collusion or improper management override of controls, material misstatements due to error or fraud may not be prevented or detected on a timely basis. As a result, if we fail to maintain effective internal controls, including any failure to implement required new or improved controls, or should we be unable to prevent or detect material misstatements due to error or fraud on a timely basis, our operating results could be harmed, and investors could lose confidence in the reliability of our financial statements. As a result, our business and the trading price of our securities could be negatively impacted.
Security breaches and other disruptions could compromise our information and systems, which would cause our business and reputation to suffer.
We store sensitive data, including intellectual property and proprietary business information belonging to our company, our customers, our suppliers and our business partners. The secure maintenance of this information is critical. Despite our security measures, our information technology and infrastructure may be vulnerable to breaches by hackers, employee error, malfeasance or other disruptions such as natural disasters, power losses or telecommunication failures. Any such breach could compromise our networks and the information stored, possibly resulting in legal and regulatory actions, disruption of operations and customer services, and otherwise harming our business and future operations.
Our tangible and intangible assets may be written down when impaired, any impairment charges may adversely effect on our net income.
Under IFRS, we are required to assess our assets to determine whether an asset may be impaired. An impairment loss exists and is recorded in our books when the carrying value of an asset exceeds its recoverable value. With the exception of goodwill and certain intangible assets for which an annual impairment test is required, we are required to conduct impairment tests where there is an indication of impairment of an asset.
At the end of each reporting period, we are required to assess whether there is any indication that an impairment loss recognized in prior periods for an asset other than goodwill may no longer exist or may have decreased. If any such indication exists, the impairment loss will be reversed up to the newly estimated recoverable amount, not to exceed the original value recorded. Goodwill impairment will not be reversed.
Currently we are not able to estimate the amount of impairment loss or when the loss will occur for future years. Any potential changes of the business assumptions, such as forecasted sales, selling prices and utilization, may have a material adverse effect on our net income.
See “Item 5. Operating and Financial Review and Prospects — Critical Accounting Policies” for a discussion of how we assess if an impairment charge is required and, if so, how the amount is determined.
We have twice settled pending litigation with TSMC at a substantial cost to us, and, if we materially breach our 2009 settlement agreement with TSMC (or certain related documents), we could be required to pay substantial liquidated damages in addition to the money damages or other remedies TSMC may be entitled to in connection with such material breach.
TSMC has brought legal claims against us and our personnel on several occasions since 2002. On January 31, 2005, we entered into a settlement agreement with TSMC and agreed to pay them $175 million in installments over a period of six years (“the 2005 Settlement Agreement”).
On August 25, 2006, TSMC filed a new lawsuit against us and certain of our subsidiaries in the Superior Court of the State of California for alleged breach of the 2005 Settlement Agreement, alleged breach of promissory notes and alleged trade secret misappropriation by us. We filed counterclaims against TSMC in the same court in September 2006 and also filed suit against TSMC in Beijing in November 2006. We settled these 2006 lawsuits with TSMC (“the Settled Actions”) on November 9, 2009 with a settlement agreement (“the 2009 Settlement Agreement”) which replaced the 2005 Settlement Agreement.
Under the terms of the 2009 Settlement Agreement, our obligation to make the remaining payments of approximately US$40 million under the 2005 Settlement Agreement was terminated, but we agreed to pay TSMC an aggregate of US$200 million over a period of four years and committed, subject to certain terms and conditions, to issue TSMC 1,789,493,218 of our shares and one or more warrants exercisable within three years of issuance to subscribe for an aggregate of 695,914,030 of our shares, subject to adjustment, at a purchase price of HK$1.30 per share, subject to adjustment. See “Item 10 — Additional Information — Material Contracts—Other Contracts” for a more detailed description of the share and warrant issuance agreement entered into by us and TSMC in connection with the 2009 Settlement Agreement and the warrant agreement entered into between us and TSMC in connection with the 2009 Settlement Agreement. The 1,789,493,218 common shares and the warrant to purchase 695,914,030 common shares, subject to adjustment, were issued on July 5, 2010. In addition, the 2009 Settlement Agreement terminated that certain patent cross- license agreement that was entered into in connection with the 2005 Settlement Agreement under which we had previously cross-licensed patent portfolios with TSMC (“the 2005 Patent Cross-License”).
Under the 2009 Settlement Agreement, each party released the other party from all claims arising out of or related to claims and counterclaims that were or could have been brought in the Settled Actions, but this release does not apply to claims of breach of the 2009 Settlement Agreement. In addition, each party covenanted not to sue the other for misappropriation or infringement of intellectual property rights, but this covenant not to sue did not extend to claims for breach of the 2009 Settlement Agreement or claims for patent or trademark infringement.
Further, the 2009 Settlement Agreement provides that if we materially breach the 2009 Settlement Agreement (or certain related documents) and fail to cure that breach within 30 days after notice from TSMC, that we will pay TSMC liquidated damages, in addition to any damages arising from such breach, in the amount of US$44 million plus a royalty equal to 5% of our gross revenues derived from foundry services with respect to our 90nm and larger manufacturing processes during the period commencing on the date of the breach and ending on the date that is 20 years from the date of the 2009 Settlement Agreement.
There can be no assurance that TSMC will not sue us again in the future. For example, TSMC is not prohibited under the 2009 Settlement Agreement from bringing infringement claims against us which could not have been brought in the Settled Actions. Further, we are subject to several obligations under the 2009 Settlement Agreement, including obligations to protect the confidentiality of certain information, and TSMC could, in the future, allege a breach by us of the 2009 Settlement Agreement. If TSMC were successful in a claim of material breach by us of our obligations under the 2009 Settlement Agreement (or certain related documents), we have agreed to pay substantial liquidated damages as described above.
TSMC is a competitor of ours and has substantially greater resources than we do to investigate and pursue legal actions. If TSMC successfully brings additional legal actions against us, we could be subject to significant penalties which could include monetary payments and/or injunctive relief such as requirements to discontinue sales of products.
The occurrence of any of these events could have a material adverse effect on our business and operating results and, in any event, the cost of litigation could be substantial.
The audit report included in this annual report is prepared by auditors who are not fully inspected by the Public Company Accounting Oversight Board and, as such, you are deprived of the benefits of such inspection.
Our independent registered public accounting firm that issues the audit reports included in our annual reports filed with the US Securities and Exchange Commission, as auditors of companies that are traded publicly in the United States and a firm registered with the US Public Company Accounting Oversight Board (United States) (“the “PCAOB”), is required by the laws of the United States to undergo regular inspections by the PCAOB to assess its compliance with the laws of the United States and professional standards.
Because we have substantial operations within the People’s Republic of China and the PCAOB is currently unable to conduct inspections of the work of our auditors as it relates to those operations without the approval of the Chinese authorities, our auditors are not currently inspected fully by the PCAOB. Inspections of other firms that the PCAOB has conducted outside China have identified deficiencies in those firms’ audit procedures and quality control procedures, which may be addressed as part of the inspection process to improve future audit quality. This lack of PCAOB inspections in China prevents the PCAOB from regularly evaluating our auditor’s audits and its quality control procedures. As a result, investors may be deprived of the benefits of PCAOB inspections.
The inability of the PCAOB to conduct full inspections of auditors in China makes it more difficult to evaluate the effectiveness of our auditor’s audit procedures or quality control procedures as compared to auditors outside of China that are subject to PCAOB inspections. Investors may lose confidence in our reported financial information and procedures and the quality of our financial statements.
Proceedings instituted by the SEC against five Mainland China -based accounting firms, including the affiliate of our independent registered public accounting firm, could result in financial statements being determined to not be in compliance with the requirements of the Securities Exchange Act of 1934, as amended, or the Exchange Act.
In late 2012, the SEC commenced administrative proceedings under Rule 102(e) of its Rules of Practice and the Sarbanes-Oxley Act of 2002 against the Mainland Chinese affiliates of the ‘‘big four’’ accounting firms (including the Mainland Chinese affiliate of our auditors) and also against Dahua (the former BDO affiliate in China). The Rule 102(e) proceedings initiated by the SEC relate to these firms’ failure to produce documents, including audit work papers, in response to the request of the SEC pursuant to Section 106 of the Sarbanes-Oxley Act of 2002. The auditors located in Mainland China are not in a position to produce documents directly to the SEC pursuant to the SEC’s request because of restrictions under PRC law and specific directives issued by the China Securities Regulatory Commission. The issues raised by the administrative proceedings affect equally all audit firms based in Mainland China and all China-based businesses with securities listed in the United States.
In January 2014, an administrative judge at the SEC reached an Initial Decision that the “big four” accounting firms in Mainland China should be barred from practicing before the SEC for six months. Although, the principal auditor of our financial statements is Deloitte Touche Tohmatsu in Hong Kong which is not subject to the proceedings or the Initial Decision, our auditors use their Mainland China affiliate to assist in the auditing of the Mainland China components of our operations. However, it is currently impossible to determine the ultimate outcome of this matter as the accounting firms have filed a Petition for Review of the Initial Decision and pending that review the effect of the Initial Decision is suspended. The SEC Commissioners will review the Initial Decision, determine whether there has been any violation and, if so, determine the appropriate sanctions, if any, to be placed on these accounting firms. Once such a determination by the SEC Commissioners was made, the accounting firms would have a further right to appeal to the United States federal courts, and the effect of the order might be further stayed pending the outcome of that appeal.
Depending upon the final outcome, listed companies in the United States with major Mainland China operations may find it difficult or impossible to retain auditors in respect of their operations in the PRC, which could result in financial statements being determined to not be in compliance with the requirements of the Securities Exchange Act of 1934, as amended, or the Exchange Act, including possible delisting. Moreover, any negative news about the proceedings against these audit firms may cause investor uncertainty regarding China-based, United States listed companies and the market price of our ADSs may be adversely affected.
U.S. regulations regarding the use of conflict minerals, may affect our, or our supply chain’s, ability to purchase or acquire certain raw materials at competitive prices.
Many industries rely on materials which are subject to regulation concerning certain minerals sourced from the Democratic Republic of Congo or adjoining countries (together “DRC countries”“Covered Countries”). These minerals, as used in electronics manufacturing, are commonly referred to as conflict minerals and include tantalum, tin, tungsten, and gold. The U.S. SEC has adopted regulations that will require companies such as ours to disclose the use of conflict materials and to take certain steps to verify those disclosures with suppliers. Although we expect that we and our suppliers will be able to comply with the requirements of these new regulations, there can be no guarantee that we will be able to gather and verify all the information required. In addition, there may be increasing public sentiment that companies should completely avoid using conflict materialsminerals from DRC countries.Covered Countries, even if such minerals do not support conflict and are thus legally compliant. Although we believe our suppliers do not rely on such conflictconflict-supporting materials, a time may come when we no longer cancannot obtain adequate supplies from supply chains completely outside DRC countries.Covered Countries. A failure to obtain necessary information or to maintain adequate supplies of materials from supply chains outside DRC countriesCovered Countries may delay our production, increasing the risk of losing customers and business. Further, due to the complexity of our supply chain, we may not be able to trace all usagesourcing of conflict minerals and may face reputational harm resulting from making disclosure of the use of such conflict minerals.
Risks Related to Manufacturing
Our manufacturing processes are highly complex, costly and potentially vulnerable to impurities and other disruptions, which could significantly increase our costs and delay product shipments to our customers.
Our manufacturing processes are highly complex, require advanced and costly equipment, demand a high degree of precision and may have to be modified to improve yields and product performance. Dust and other impurities, difficulties in the fabrication process or defects with respect to the equipment or facilities used can lower yields, because quality control problems interrupt production or result in losses of products in process. As system complexity has increased and process technology has become more advanced, manufacturing tolerances have been reduced and requirements for precision have become even more demanding. As a result, we may experience production difficulties, which could significantly increase our costs and delay product shipments to our customers. For products that cannot meet the quality, standards of our customers, we may suffer indemnification losses in addition to the production cost.
We may have difficulty in ramping up production, which could cause delays in product deliveries and loss of customers and otherwise adversely affect our business and operating results.
We may experience difficulty in ramping up production at new or existing facilities, such as our Shanghai and Beijing 12” fab in which we expect to add a significant amount of new equipment. This could be due to a variety of factors, including hiring and training new personnel, implementing new fabrication processes, recalibrating and re-qualifying existing processes and the inability to achieve required yield levels.
In the future, we may face construction delays or interruptions, infrastructure failure, or delays in upgrading or expanding existing facilities or changing our process technologies, which may adversely affect our ability to ramp up production in accordance with our plans. Our failure to ramp up our production on a timely basis could cause delays in product deliveries, which may result in the loss of customers and sales. It could also prevent us from recouping our investments in a timely manner or at all, and otherwise adversely affect our business and operating results.
We have formed joint ventures that, if not successful, could adversely impact our business and operating results.
In July 2004, we announced an agreement with Toppan Printing Co., Ltd., to establish Toppan SMIC Electronics (Shanghai) Co., Ltd., a joint venture in Shanghai, to manufacture color filters and micro-lenses for CMOS image sensors. In May 2012, we announced our intention to enter into the BJ Joint Venture. While there can be no assurance that we will enter into the BJ Joint Venture, we expect that this project would require us to incur significant capital expenditures during its start-up phase, and from time to time thereafter, which may adversely affect our business and operating results.
The results of our joint ventures are reflected in our operating results to the extent of our ownership interest, and gains of the joint ventures could impact our operating results. As integration of assets and operations being contributed by each partner will involve complex activities that must be completed in a short period of time, the joint ventures may face numerous challenges to successful operation, including all operational risks that customarily relate to manufacturing, sales, service, marketing, and corporate functions, which, if unsuccessful, may adversely impact, our business and operating result.
If we are unable to obtain raw materials, spare parts and outsourcing services in a timely manner, our production schedules could be delayed and our costs could increase.
We depend on suppliers of raw materials, such as silicon wafers, gases and chemicals, and spare equipment parts, in order to maintain our production processes. To maintain operations, we must obtain from our suppliers sufficient quantities of quality raw materials and spare equipment parts at acceptable prices and in a timely manner. The most important raw material used in our production is silicon in the form of raw wafers.wafers, almost all of which are sourced from outside China. We currently purchase approximately 78.0%73.41% of our overall raw wafer requirements from our top three raw wafer suppliers. In addition, a portion of our gas and chemical requirements currently must be sourced from outside China. We may not be able to obtain adequate supplies of raw materials and spare parts in a timely manner and at a reasonable cost. In addition, from time to time, we may need to reject raw materials and parts that do not meet our specifications, resulting in potential delays or declines in output. If the supply of raw materials and necessary spare parts is substantially reduced or disrupted; if there are significant increases in their prices; or if the lead times for the supply of raw materials and necessary spare parts are extended, we may incur additional costs to acquire sufficient quantities of these parts and materials to maintain our production schedules and commitments to customers.
We outsource certain wafer manufacturing, assembly and testing services to third parties. Any delay or interruption in the provision of supplies and/or services could result in our inability to meet customer demand or fulfill contract terms, damage our reputation and customer relationships and adversely affect our business.
Our production may be interrupted, limited or delayed if we cannot maintain sufficient sources of fresh water and electricity, which could adversely affect our business and operating results.
The semiconductor fabrication process requires extensive amounts of fresh water and a stable source of electricity. As our production capabilities increase and our business grows, our requirements for these resources will grow substantially. While we have not, to date, experienced any instances of the lack of sufficient supplies of water or material disruptions in the electricity supply to any of our fabs, we may not have access to sufficient supplies of water and electricity to accommodate our planned growth. Droughts, pipeline interruptions, power interruptions, electricity shortages or government intervention, particularly in the form of rationing, are factors that could restrict our access to these utilities in the areas in which our fabs are located. In particular, our fab in Tianjin and our Beijing mega-fab are located in areas that are susceptible to severe water shortages during the summer months. If there is an insufficient supply of fresh water or electricity to satisfy our requirements, we may need to limit or delay our production, which could adversely affect our business and operating results. In addition, a power outage, even of very limited duration, could result in a loss of wafers in production and deterioration in yield.
Our operations may be delayed or interrupted due to natural disasters which could adversely affect our business and operating results.
We depend on suppliers of raw materials, such as silicon wafers, gases and chemicals, and spare equipment parts, in order to maintain our production processes in addition to requiring extensive amounts of fresh water and a stable source of electricity. The occurrence of natural disasters such as the March 2011 earthquake in Japan may disrupt this required access to goods and services provided by our suppliers as well as access to fresh water and electricity. As a result of such risk, our production could be limited or delayed due to the disruption of access to required supplies, in addition to possible damage caused to our manufacturing equipment and related infrastructure, which could adversely affect our business and operating results.
We are subject to the risk of damage due to fires or explosions because the materials we use in our manufacturing processes are highly flammable. Such damage could temporarily reduce our manufacturing capacity, thereby adversely affecting our business and operating results.
We use highly flammable materials such as silane and hydrogen in our manufacturing processes and are therefore subject to the risk of loss arising from explosions and fires. The risk of explosion and fire associated with these materials cannot be completely eliminated. Our comprehensive fire insurance and insurance for the loss of property and the loss of profit resulting from business interruption, may not be sufficient to cover all of our potential losses due to an explosion or fire. If any of our fabs were to be damaged or cease operations as a result of an explosion or fire, it could temporarily reduce our manufacturing capacity, which could adversely affect our business and operating results.
Our operations may be delayed or interrupted and our business could suffer as a result of steps we may be required to take in order to comply with environmental regulations.
We are subject to a variety of Chinese environmental regulations relating to the use, discharge and disposal of toxic or otherwise hazardous materials used in our production processes. Any failure or any claim that we have failed to comply with these regulations could cause delays in our production and capacity expansion and affect our company’s public image, either of which could harm our business. In addition, any failure to comply with these regulations could subject us to substantial fines or other liabilities or require us to suspend or adversely modify our operations.
Any new regulations or customer requirements related to climate change or environmental protection could negatively impact our operating results.
There is global concern that an increase in global average temperatures due to emissions of greenhouse gases (GHG) and other human activities have or will cause significant changes in weather patterns, including natural disasters. Such climate change creates risks, such as the physical risks of increased sea levels or extreme weather events, and the financial risks of causing adverse effects on our operations, financial condition, supply chain, increased manufacturing costs, or reduced demand for products believed to contribute to climate change.
We may become subject to legislation, regulation, or treaty obligations designed to address global climate change, Chinese air quality, and other environmental concerns. Compliance with any new rules could be difficult and costly, causing us to incur additional energy and environmental costs, as well as costs for defending and resolving legal claims.
Furthermore, continued serious air pollution in Chinese cities where we operate could pose long-term health risks to our employees and make recruiting and retaining employees more difficult. For example, in December 2013 Shanghai air pollution index reached “severe” level which is the worst in a six-tier national rating system.
Risks related to Our New Investment Fund
Our performance may be affected by the performance of our new investment fund and we may incur losses as a result of ineffective investment.
On February 27, 2014, our wholly owned subsidiary, Semiconductor Manufacturing International (Shanghai) Corporation, or SMIC Shanghai, established a wholly-owned investment fund in Shanghai which is called China IC Capital Co., Ltd, or the Fund. The Fund has an initial capital of RMB500 million, all funded by SMIC Shanghai. With an operating period of 15 years from the date of the issuance of its business license, the Fund will be operated and managed by an equity investment management company named China Fortune-Tech Capital Co., Ltd, and established by SMIC Shanghai and an independent third party on February 27, 2014.
The Fund will invest primarily in the integrated circuits industry but will also invest in other strategic emerging industries such as energy saving and environmental protection, information technology and new energy as well as some other traditional industries. While we generally expect China’s integrated circuits industry to develop rapidly in the next decade and we believe that the other industries we will invest in also have a promising prospect of development, uncertainties due to the slow recovery of the world economy, the global market demand and consumption behaviors may lead to weak market demand in the industries in which we may choose to invest and our investees may not be able to execute their business strategies as successfully as they expect.
As a result, there is no assurance that our investment will be successful. We may incur losses in our investments through the Fund and our overall financial results may be adversely affected by such failure in the Fund’s investment activities.
Risks Related to Conducting Operations in China
Our business is subject to extensive government regulation and benefits from certain government incentives, and changes in these regulations or incentives could adversely affect our business and operating results.
The Chinese government has broad discretion and authority to regulate the technology industry in China. China’s government has also implemented policies from time to time to regulate economic expansion in China. The economy of China has been transitioning from a planned economy to a market- oriented economy. Although in recent years the Chinese government has implemented measures emphasizing the utilization of market forces for economic reform, the reduction of state ownership of productive assets, and the establishment of sound corporate governance in business enterprises, a substantial portion of productive assets in China is still owned by the Chinese government. In addition, the Chinese government continues to play a significant role in regulating industrial development. It also exercises significant control over China’s economic growth through the allocation of resources, controlling payment of foreign currency- denominated obligations, setting monetary policy, and providing preferential treatment to particular industries or companies. New regulations or the readjustment of previously implemented regulations could require us to change our business plan, increase our costs or limit our ability to sell products and conduct activities in China, which could adversely affect our business and operating results.
In addition, the Chinese government and provincial and local governments have provided, and continue to provide, various incentives to domestic companies in the semiconductor industry, including our company, in order to encourage the development of the industry. Such incentives include tax rebates, reduced tax rates, favorable lending policies, and other measures. Any of these incentives could be reduced or eliminated by governmental authorities at any time, which would adversely affect our business and operating results.
We face uncertainty from PRC’s Circular on Strengthening the Management of Enterprise Income Tax Collection of Income Derived by Non-resident Enterprises from Equity Transfers.
The State Administration of Taxation of PRC issued the Circular on Strengthening the Management of Enterprise Income Tax Collection of Income Derived by Non-resident Enterprises from Equity Transfers, or Circular 698, on December 10, 2009, which addresses the transfer of equity by non-PRC resident enterprises. Under this Circular, the overseas controlling party that effectively controls a PRC resident enterprise through an overseas intermediate holding company, and “indirectly transfers” the equity interests in such PRC resident enterprise by selling shares of the intermediate holding company, is required to report such transfer to the PRC tax authority if the intermediate holding company is located in a foreign jurisdiction that has an effective tax rate of less than 12.5% or does not levy tax on such foreign- sourced capital gains of its residents. If the intermediate holding company mainly serves as tax avoidance vehicle and does not have any reasonable business purpose, the PRC in-charge tax authority may, upon verification of the State Administration of Taxation, disregard the intermediate holding company and re- characterize the equity transfer by referring to its economic essence, and as a result, the overseas controlling party may be subject to a 10% PRC withholding tax for the capital gains realized from the equity transfer.
We do not believe that the transfer of our ordinary shares or ADSs by our non-PRC shareholders should be treated as an indirect transfer of equity interests in our PRC subsidiaries subject to Circular 698, as the share transfer is not carried out for the main purposes of avoiding PRC taxes. However, Circular 698 is relatively new and there is uncertainty as to the interpretation and application of Circular 698 by the PRC tax authorities in practice. If you are required to pay PRC withholding tax on the transfer of our ordinary shares or ADSs, your investment in us may be materially and adversely affected. In addition, we cannot predict how Circular 698 will affect our financial conditions or operations. For example, we may be required to expend valuable resources on complying with Circular 698 or establishing that we should not be taxed under Circular 698, any of which could have an adverse effect on our financial condition and results of operations.
Because our business is highly dependent on growth in the electronics manufacturing supply chain in China, any slowdown in this growth could adversely affect our business and operating results.
Our business is highly dependent upon the economy and the business environment in China. In particular, our growth strategy is based upon the assumption that demand in China for devices that use semiconductors will continue to grow. Therefore, any slowdown in the growth of consumer demand in China for products that use semiconductors, such as computers, mobile phones or other consumer electronics, could have a serious adverse effect on our business. In addition, our business plan assumes that an increasing number of non- Chinese IDMs, fabless semiconductor companies and systems companies will establish operations in China. Any decline in the rate of migration to China of semiconductor design companies or companies that require semiconductors as components for their products could adversely affect our business and operating results.
Limits placed on exports into China could harm our business and operating results.
The growth of our business depends on the ability of our suppliers to export and our ability to import, into China, equipment, materials, spare parts, process know-how and other technologies and hardware (“items”).hardware. Any burdensome new restrictions placed on the import and export (“transfer”) of these items could adversely impact our growth and substantially harm our business. In particular, the international export control regime led by the United States requires our suppliers and us to obtain licenses to transferexport and import, as applicable, certain of the above items. If we or our suppliers are unable to obtain such licenses in a timely manner, our business and operating results could be adversely affected.
Devaluation or appreciation in the value of the Renminbi or restrictions on convertibility of the Renminbi could adversely affect our business and operating results.
The value of the Renminbi is subject to changes in China’s governmental policies and to international economic and political developments. Since 1994, the conversion of Renminbi into foreign currencies, including Hong Kong and U.S. dollars, has been based on rates set by the People’s Bank of China, or the PBOC, which are set daily based on the previous day’s interbank foreign exchange market rates and current exchange rates on the world financial markets. The Renminbi to U.S. dollar exchange rate experienced significant volatility prior to 1994, including periods of sharp devaluation. On July 21, 2005, the PBOC announced an adjustment of the exchange rate of the U.S. dollar to Renminbi from 1:8.27 to 1:8.11 and modified the system by which the exchange rates are determined. The central parity rate of the U.S. Dollar to Renminbi was set at 6.0969 on December 31, 2013 compared with 6.2855 on December 31, 2012 versus 6.3009 on December 31, 2011 by the PBOC. The cumulative appreciation of the Renminbi against the U.S. dollar in 20122013 was approximately 0.24%3.09%. There remains significant international pressure on the PRC government to adopt an even more flexible currency policy, which could result in a further and more significant appreciation of the Renminbi against the U.S. dollar. As a result, the exchange rate may become volatile and the Renminbi may be temporarily devalued again against the U.S. dollar or other currencies, or the Renminbi may be permitted to enter into a full or limited free float, which may result in an appreciation in the value of the Renminbi against the U.S. dollar, any of which could have an adverse effect on our business and operating results.
In the past, financial markets in many Asian countries have experienced severe volatility and, as a result, some Asian currencies have experienced significant devaluation from time to time. The devaluation of some Asian currencies may have the effect of rendering exports from China more expensive and less competitive and therefore place pressure on China’s government to devalue the Renminbi. An appreciation in the value of the Renminbi could have a similar effect. Any devaluation of the Renminbi could result in an increase in volatility of Asian currency and capital markets. Future volatility of Asian financial markets could have an adverse impact on our ability to expand our product sales into Asian markets outside of China.
We receive a portion of our sales in Renminbi, which is currently not a freely convertible currency. For the year ended December 31, 2012,2013, approximately 13.9 %19.3% of our sales were denominated in Renminbi. While we have used these proceeds for the payment of our Renminbi expenses, we may in the future need to convert these sales into foreign currencies to allow us to purchase imported materials and equipment, particularly as we expect the proportion of our sales to China-based companies to increase in the future. Under China’s existing foreign exchange regulations, payments of current account items, including profit distributions, interest payments and expenditures from trade may be made in foreign currencies without government approval, except for certain procedural requirements. The Chinese government may, however, at its discretion, restrict access in the future to foreign currencies for current account transactions and prohibit us from converting our Renminbi sales into foreign currencies. If this were to occur, we may not be able to meet our foreign currency payment obligations.
China’s legal system embodies uncertainties that could adversely affect our business and operating results.
Since 1979, many new laws and regulations covering general economic matters have been promulgated in China. Despite this activity to develop a legal system, China’s system of laws has not been fully implemented. Even where adequate laws exist, enforcement of existing laws or contracts based on such laws may be uncertain and sporadic, and it may be difficult to obtain swift and equitable enforcement or to obtain enforcement of a judgment of another jurisdiction. The relative inexperience of China’s judiciary system in many cases creates additional uncertainty as to the outcome of any litigation. In addition, interpretation of statutes and regulations may be effected by government policies reflecting domestic political changes.
Our activities in China will be subject to administrative review and approval by various national and local Chinese government agencies. Because of the changes occurring in China’s legal and regulatory structure, we may not be able to timely secure the requisite governmental approval for our activities, which would adversely affect our business and operating results.
Our corporate structure may restrict our ability to receive dividends from, and transfer funds to, our Chinese operating subsidiaries, which could restrict our ability to act in response to changing market conditions and reallocate funds from one Chinese subsidiary to another in a timely manner.
We are a Cayman Islands holding company and substantially all of our operations are conducted through our Chinese operating subsidiaries, Semiconductor Manufacturing International (Shanghai) Corporation, or SMIC Shanghai, Semiconductor Manufacturing International (Beijing) Corporation, or SMIC Beijing, and Semiconductor Manufacturing International (Tianjin) Corporation, or SMIC Tianjin. The ability of these subsidiaries to distribute dividends and other payments to us may be restricted by factors that include changes in applicable foreign exchange and other laws and regulations. In particular, under Chinese law, these operating subsidiaries may only pay dividends after 10% of their net profit has been set aside as reserve funds, unless such reserves have reached at least 50% of their respective registered capital. In addition, the profit available for distribution from our Chinese operating subsidiaries is determined in accordance with generally accepted accounting principles in China. This calculation may differ from the one performed in accordance with IFRS. As a result, we may not have sufficient distributions from our Chinese subsidiaries to enable necessary profit distributions to us or any distributions to our shareholders in the future.
Distributions by our Chinese subsidiaries to us may be subject to governmental approval and taxation. Any transfer of funds from us to our Chinese subsidiaries, either as a shareholder loan or as an increase in registered capital, is subject to registration or approval of Chinese governmental authorities, including the relevant administration of foreign exchange and/or the relevant examining and approval authority. In addition, it is not permitted under Chinese law for our Chinese subsidiaries to directly lend money to one another. Therefore, it is difficult to change our capital expenditureexpenditures plans once the relevant funds have been remitted from us to our Chinese subsidiaries. These limitations on the free flow of funds between us and our Chinese subsidiaries could restrict our ability to act in response to changing market conditions and reallocate funds from one Chinese subsidiary to another in a timely manner.
Risks Related to Ownership of Our Shares and ADSs
Future sales of securities by us or our shareholders may decrease the value of your investment.
Future sales by us or our existing shareholders of substantial amounts of our ordinary shares or ADSs in the public markets could adversely affect market prices prevailing from time to time.
We cannot predict the effect, if any, of any such future sales or of the perception that any such future sales will occur, on the market price for our ordinary shares or ADSs.
Holders of our ADSs will not have the same voting rights as the holders of our shares and may not receive voting materials in time to be able to exercise their right to vote.
Holders of our ADSs may not be able to exercise voting rights attaching to the shares evidenced by our ADSs on an individual basis. Holders of our ADSs have appointed the depositary or its nominee as their representative to exercise the voting rights attaching to the shares represented by the ADSs. Holders of our ADSs may not receive voting materials in time to instruct the depositary to vote, and it is possible that holders of our ADSs, or persons who hold their ADSs through brokers, dealers or other third parties, will not have the opportunity to exercise a right to vote.
You may not be able to participate in rights offerings and may experience dilution of your holdings as a result.
We may from time to time distribute rights to our shareholders, including rights to acquire our securities. Under the deposit agreement for the ADSs, the depositary will not offer those rights to ADS holders unless both the rights and the underlying securities to be distributed to ADS holders are either registered under the U.S. Securities Act of 1933, as amended, or the Securities Act, or exempt from registration under the Securities Act with respect to all holders of ADSs. We are under no obligation to file a registration statement with respect to any such rights or underlying securities or to endeavor to cause such a registration statement to be declared effective. In addition, we may not be able to take advantage of any exemptions from registration under the Securities Act. Accordingly, holders of our ADSs may be unable to participate in our rights offerings and may experience dilution in their holdings as a result.
The laws of the Cayman Islands and China may not provide our shareholders with benefits provided to shareholders of corporations incorporated in the United States.
Our corporate affairs are governed by our memorandum and articles of association, and by the Companies Law, as revised from time to time, and the common law of the Cayman Islands. The rights of shareholders to take action against our directors, actions by minority shareholders and the fiduciary responsibilities of our directors to us under Cayman Islands law are to a large extent governed by the common law of the Cayman Islands. The common law in the Cayman Islands is derived in part from comparatively limited judicial precedent in the Cayman Islands and from English common law, the decisions of whose courts are of persuasive authority but are not binding on a court in the Cayman Islands. The rights of our shareholders and the fiduciary responsibilities of our directors under Cayman Islands law are not as clearly established as they would be under statutes or judicial precedents in the United States. In particular, the Cayman Islands have a less developed body of securities laws as compared to the United States. Therefore, our public shareholders may have more difficulty protecting their interests in the face of actions by our management, directors or controlling shareholders than would shareholders of a corporation incorporated in a jurisdiction in the United States. In addition, Cayman Islands companies may not have standing to initiate a shareholder derivative action before the federal courts of the United States.
It may be difficult to enforce any judgment obtained in the United States against our company, which may limit the remedies otherwise available to our shareholders.
Substantially all of our assets are located outside the United States. Almost all of our current operations are conducted in China. Moreover, a number of our directors and officers are nationals or residents of countries other than the United States. All or a substantial portion of the assets of these persons are located outside the United States. As a result, it may be difficult for a person to effect service of process within the United States upon these persons. In addition, there is uncertainty as to whether the courts of the Cayman Islands or China would recognize or enforce judgments of U.S. courts obtained against us or such persons predicated upon the civil liability provisions of the securities law of the United States or any state thereof, or be competent to hear original actions brought in the Cayman Islands or China, respectively, against us or such persons predicated upon the securities laws of the United States or any state thereof. See “Item 4.B — Information on the Company — Business Overview — Enforceability of Civil Liabilities.
Item 4. Information on the Company
A.History and Development of the Company
We were established as an exempted company under the laws of the Cayman Islands on April 3, 2000. Our legal name is Semiconductor Manufacturing International Corporation. Our principal place of business is 18 Zhangjiang Road, Pudong New Area, Shanghai, China, 201203; telephone number: (86) 21-3861-0000. Our registered office is located at PO Box 309, Ugland House, Grand Cayman, KY1-1104, Cayman Islands. Since March 18, 2004, we have been listed on the New York Stock Exchange under the symbol “SMI” and the Stock Exchange of Hong Kong under the stock code “0981.HK”. CT Corporation System is our agent in the United States of America and its address is 818, West 7th street, 2nd Floor, Los Angeles, CA 90017, U.S.A.
We are now the largest and most advanced semiconductor foundry in mainland China. We operate wafer fabrication facilities in China, including facilities at Beijing, Shanghai and Tianjin, with an aggregate capacity of up to 219,250234,000 8-inch wafer equivalents per month. Prior to 2013, we managed and operated a 300mm wafer fab in Wuhan owned by Wuhan Xinxin Semiconductor Manufacturing Corporation (“Wuhan Xinxin arrangement”). The Wuhan Xinxin arrangement ended in the first quarter of 2013, and we no longer manage or operate the wafer fab in Wuhan.
We spent approximately US$765 million, US$499 million and US$499770 million to construct, equip and ramp up our fabs in 2011, 2012 and 20122013 respectively. Currently, the planned capital expenditureexpenditures in 20132014 for foundry operations is approximately $600US$880 million of which around US$570 million is for SMNC, our majority owned subsidiary in Beijing, which is primarily55% funded by us and 45% funded by the other shareholders of the entity. In addition, we have budgeted approximately US$110 million as the 2014 capital expenditures for 12-inch foundrynon-foundry operations in Shanghaimainly for the construction of living quarters for employees as part of our employee retention program. The primary sources of capital resources and Beijing, which we plan to finance withliquidity include funds generated from a combination of cash flows generated from operations, bank borrowings and financing activities, including but not limited to bank borrowing,debt or equity issuances and potential debt and equity issuances. The 2013 planned capital expenditure figure does not account for additional expenditures that we may incur in connection with the establishmentother forms of the BJ Joint Venture. As announced in May 2012, we are presently negotiating the terms of a joint venture with Beijing municipal government entities to expand our Beijing production site, or the BJ Joint Venture. While there can be no assurance that we will enter into the BJ Joint Venture, we expect that this project would require us to incur significant capital expenditures during its start-up phase, and from time to time thereafter, and that we would need to borrow under our existing credit lines or otherwise obtain additional capital to satisfy our funding obligations under this project.financing.
B.Business Overview
We provide integrated circuit (IC) foundry and technology services at 0.35-micron to 40-nanometer line width technologies.40-nanometer. Headquartered in Shanghai, China, we position ourselves as the most advanced and diversified foundry in mainland China to address the mainland China semiconductor needs. Currently, we have a 300mm wafer fabrication facility (fab) and a 200mm mega-fab in Shanghai, a 300mm mega-fab in Beijing, a 200mm fab in Tianjin, and a 200mm fab project under development in Shenzhen. We also have customer service and marketing offices in the U.S., Europe, Japan, and Taiwan, and a representative office in Hong Kong.
The table below sets forth a summary of our current fabs:
|
| Shanghai |
| Beijing |
| Tianjin | |||
Number and Type of fab |
| mega-fab |
| 12-inch fab |
| mega-fab |
| 8-inch fab | |
Wafer size |
| 200mm |
| 300mm |
| 300mm |
| 200mm | |
Current most advanced technology for volume production |
|
|
| 0.040 micron |
| 0.055 micron |
| 0.18 micron | |
Production clean room size |
| 34,610m2 |
| 11,288m2 |
| 23,876m2 |
| 8,463m2 | |
In addition to wafer fabrication, our service offerings include a comprehensive portfolio consisting of IC design libraries, circuit design blocks, design support, mask-making, wafer probing and gold/solder bumping. We also work with our partners to provide assembly and testing services.
We have a global and diversified customer base that includes some of the world’s leading IDMs and fabless semiconductor companies.
Our Products and Services
Manufacturing of Wafers and Our Manufacturing Capacity
We currently manufacture silicon wafers based on proprietary designs provided by our customers or third party designers.
The following table sets forth the historical capacity and utilization rate of our wafer fabrication and facilities (all output and capacity data is provided as 8-inch wafers or 8-inch wafer equivalents per month):
Fab |
| 2010 |
| 2011 |
| 2012 |
|
| 2011 |
| 2012 |
| 2013 |
|
Wafer fabrication capacity as of year-end(1) |
|
|
|
|
|
|
|
|
|
|
|
|
|
|
Shanghai mega-fab |
| 86,000 |
| 90,000 |
| 90,000 |
|
| 90,000 |
| 90,000 |
| 90,000 |
|
Shanghai 12-inch fab |
| — |
| — |
| 13,500 |
|
| — |
| 13,500 |
| 27,000 |
|
Beijing mega-fab |
| 52,425 |
| 65,540 |
| 78,750 |
|
| 65,540 |
| 78,750 |
| 81,000 |
|
Tianjin fab |
| 33,300 |
| 37,750 |
| 37,000 |
|
| 37,750 |
| 37,000 |
| 36,000 |
|
Total monthly wafer fabrication capacity as of year-end(1) |
| 171,725 | (2) | 193,290 | (2) | 219,250 | (2) |
| 193,290 | (2) | 219,250 | (2) | 234,000 | (2) |
Wafer Fabrication capacity utilization |
| 96.1 | % | 68.9 | % | 88.3 | % |
| 68.9 | % | 88.3 | % | 90.7 | % |
(1) Conversion of 12-inch wafers to 8-inch wafer equivalents is achieved by multiplying the number of 12-inch wafers by 2.25.
(2)Mega fab structure includes copper inter connects in the total monthly capacity.
Our factories manufacture the following types of semiconductors:
· Logic, (including basebands, microprocessors, DSPs and application processors);
· Mixed-Signal and RF (for wired and wireless connectivity applications for communications and consumer electronics);
· High Voltage (for display driver integrated circuits, power supplies, power management, telecommunications, automotive electronics and industrial controls);
· Memory, (including standalone SRAM, EEPROM and Flash, and embedded NVM for IC cards to be used in transport, banking, social welfare and national ID);
· CIS (CMOS Image Sensors that are used in a wide range of camera-related systems);
· Others, (Micro Electrical and Mechanical System, or MEMS and Integrated Passive Devices);
The following table sets forth a percentage breakdown of wafer sales by process technology for the years ended December 31, 2010, 2011, 2012 and 20122013 and each of the quarters in the year ended December 31, 2012:2013:
|
|
|
| For the three months ended |
| For the year |
| ||||||||
Process |
| For the year ended |
| March 31, |
| June 30, |
| September |
| December |
| December |
| ||
Technologies |
| 2010(1) |
| 2011 |
| 2012 |
| 2012 |
| 2012 |
| 2012 |
| 2012 |
|
|
| (based on sales in US$) |
| ||||||||||||
0.045 micron |
| — |
| 0.06 | % | 0.28 | % | 0.23 | % | 0.77 | % | 2.61 | % | 1.06 | % |
|
|
|
|
|
|
|
|
|
|
|
|
|
|
|
|
0.065 micron |
| 5.45 | % | 18.50 | % | 22.27 | % | 32.77 | % | 34.80 | % | 35.26 | % | 31.98 | % |
|
|
|
|
|
|
|
|
|
|
|
|
|
|
|
|
0.09 micron |
| 17.48 | % | 9.85 | % | 8.65 | % | 8.73 | % | 9.40 | % | 8.03 | % | 8.69 | % |
|
|
|
|
|
|
|
|
|
|
|
|
|
|
|
|
0.13 micron |
| 32.92 | % | 22.59 | % | 22.75 | % | 15.47 | % | 11.82 | % | 10.17 | % | 14.39 | % |
|
|
|
|
|
|
|
|
|
|
|
|
|
|
|
|
0.15 micron |
| 1.72 | % | 1.81 | % | 0.84 | % | 0.86 | % | 1.10 | % | 0.44 | % | 0.80 | % |
|
|
|
|
|
|
|
|
|
|
|
|
|
|
|
|
0.18 micron |
| 25.87 | % | 33.42 | % | 38.52 | % | 35.62 | % | 36.38 | % | 39.46 | % | 37.49 | % |
|
|
|
|
|
|
|
|
|
|
|
|
|
|
|
|
0.25 micron |
| 0.47 | % | 0.39 | % | 0.38 | % | 0.37 | % | 0.23 | % | 0.21 | % | 0.29 | % |
|
|
|
|
|
|
|
|
|
|
|
|
|
|
|
|
0.35 micron |
| 16.09 | % | 13.38 | % | 6.31 | % | 5.95 | % | 5.50 | % | 3.82 | % | 5.30 | % |
|
|
|
|
|
|
|
|
|
|
|
|
|
|
|
|
Total |
| 100.00 | % | 100.00 | % | 100.00 | % | 100.00 | % | 100.00 | % | 100.00 | % | 100.00 | % |
(1)Prepared under US GAAP.
|
|
|
|
|
|
|
|
|
|
|
|
|
| For the year |
|
|
|
|
|
|
| For the three months ended |
| ended |
| ||||||
|
| For the year ended |
|
|
|
|
| September |
| December |
| December |
| ||
Process |
| December 31, |
| March 31, |
| June 30, |
| 30, |
| 31, |
| 31, |
| ||
Technologies |
| 2011 |
| 2012 |
| 2013 |
| 2013 |
| 2013 |
| 2013 |
| 2013 |
|
|
| (based on sales in US$) |
| ||||||||||||
0.045 micron |
| 0.06 | % | 1.06 | % | 6.45 | % | 10.02 | % | 15.69 | % | 16.22 | % | 12.06 | % |
0.065 micron |
| 18.50 | % | 31.98 | % | 32.05 | % | 30.95 | % | 27.07 | % | 21.11 | % | 27.91 | % |
0.09 micron |
| 9.85 | % | 8.69 | % | 6.74 | % | 4.59 | % | 4.73 | % | 3.51 | % | 4.90 | % |
0.13 micron |
| 22.59 | % | 14.39 | % | 10.70 | % | 10.48 | % | 10.06 | % | 12.22 | % | 10.83 | % |
0.15 micron |
| 1.81 | % | 0.80 | % | 0.55 | % | 0.50 | % | 0.65 | % | 0.58 | % | 0.57 | % |
0.18 micron |
| 33.42 | % | 37.49 | % | 39.35 | % | 39.59 | % | 37.79 | % | 40.91 | % | 39.38 | % |
0.25 micron |
| 0.39 | % | 0.29 | % | 0.23 | % | 0.37 | % | 0.39 | % | 0.30 | % | 0.33 | % |
0.35 micron |
| 13.38 | % | 5.30 | % | 3.93 | % | 3.50 | % | 3.62 | % | 5.15 | % | 4.02 | % |
Total |
| 100.00 | % | 100.00 | % | 100.00 | % | 100.00 | % | 100.00 | % | 100.00 | % | 100.00 | % |
Our Integrated Solutions
In addition to wafer fabrication, we provide our customers with a range of complementary services, from circuit design support and mask-making to wafer level probing and testing. This range of services is supported by our network of partners that assist in providing design, probing, final testing, packaging, assembly and distribution services.
The diagram below sets forth our service model and our key points of interaction with our customers:
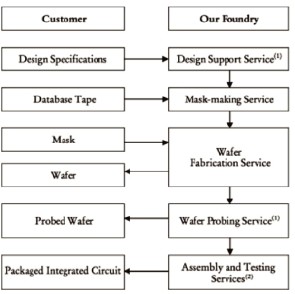

(1) A portion of this work is outsourced to our service partners.
(2) A portion of these services are outsourced to our service partners.
Design Support Services
Our design support services provide our customers with access to the fundamental technology files and libraries that facilitate customers’ own integrated circuit design. We also offer design reference flows and access to our design center alliance, as well as layout services to our customers. In addition, we collaborate with industry leaders in electronic design automation, library and IP (intellectual property) services to create a worldwide network of expertise, resources and services that are available to our customers.
Libraries and Intellectual Property
As part of the fundamental building blocks for our customers’ integrated circuit designs, we have a dedicated team of engineers who work with our research and development department to develop, license or acquire from third parties selected key libraries and intellectual property so that our customers can quickly design sophisticated integrated circuits that utilize our new process technologies. These include standard cell, I/O, memory compilers, embedded memory, high-speedhigh- speed interface, peripheral controllers, and embedded processors, among others, using 0.35 micron down to 4028 nanometer process technologies. They have been developed primarily through our third party alliances, as well as by our internal research and development team, to facilitate easy design and fast integration into the overall design system. Our library partners include ARM, Synopsys, Inc., VeriSilicon, and InnoPower.
Mask-making Services
While most of our mask-making services are for customers who use our wafer fabrication services, we also produce masks for other domestic and overseas fabs as a separate revenue- generating service.
Our mask-making facility, which is located in Shanghai, includes a 3,7504,000 square meters clean room with up to class I specifications. At present, our mask shop offers both five-inch by five-inch, and six-inch by six-inch and seven-inch circular reticles. Our facility is capable of producing binary masks, optical proximity correction masks and phase shift masks. Our mask facility also offers mask repair services.
Wafer Probing, Assembly and Testing Services
We have our own probing facilitiesfacility in Shanghai and Beijing that provideprovides test program development, probe card fabrication, wafer probing, failure analysis, and failure testing. We also outsource these services to our partners.
Our probing facility in Shanghai occupies a clean room space of 3,000 square meters, and our probing facility in Beijing occupies a clean room space of 1,400 square meters. Both facilities arewhich is rated at Class 1000 cleanliness and areis equipped with advanced testers, probers and laser repair machines. We also have testing equipmentsequipment for memory, logic and mixed signal applications.
We have established a network of partners that provide additional probing services, as well as assembly and testing services, to serve our customers. These partners, including Amkor Assembly & Test (Shanghai) Co., Ltd. and ST Assembly Test Services Ltd., have helped to enhance the range of services that we are able to offer our customers.
Customers and Markets
Our customers include IDMs, fabless semiconductor companies and systems companies. The following table sets forth the breakdown of our sales by customer type for 2010, 2011, 2012 and 2012:2013:
|
| For the year ended December 31, |
| ||||||||||
|
| 2010(1) |
| 2011 |
| 2012 |
| ||||||
Customer Type |
| Sales |
| Percentage |
| Sales |
| Percentage |
| Sales |
| Percentage |
|
|
| (in US$ thousands, except percentages) |
| ||||||||||
|
|
|
|
|
|
|
|
|
|
|
|
|
|
Fabless semiconductor companies |
| 1,110,935 |
| 72.49 | % | 1,081,345 |
| 81.95 | % | 1,494,239 |
| 87.81 | % |
|
|
|
|
|
|
|
|
|
|
|
|
|
|
Integrated device manufacturers |
| 248,782 |
| 16.23 | % | 175,922 |
| 13.33 | % | 142,101 |
| 8.35 | % |
|
|
|
|
|
|
|
|
|
|
|
|
|
|
Systems companies and others |
| 172,732 |
| 11.28 | % | 62,199 |
| 4.72 | % | 65,258 |
| 3.84 | % |
|
|
|
|
|
|
|
|
|
|
|
|
|
|
Total |
| 1,532,449 |
| 100.00 | % | 1,319,466 |
| 100.00 | % | 1,701,598 |
| 100.00 | % |
(1)Prepared under US GAAP.
|
| For the year ended December 31, |
| ||||||||||
|
| 2011 |
| 2012 |
| 2013 |
| ||||||
Customer Type |
| Sales |
| Percentage |
| Sales |
| Percentage |
| Sales |
| Percentage |
|
|
| (in US$ thousands, except percentages) |
| ||||||||||
Fabless semiconductor companies |
| 1,081,345 |
| 81.95 | % | 1,494,239 |
| 87.81 | % | 1,814,221 |
| 87.69 | % |
|
|
|
|
|
|
|
|
|
|
|
|
|
|
Integrated device manufacturers |
| 175,922 |
| 13.33 | % | 142,101 |
| 8.35 | % | 127,471 |
| 6.16 | % |
|
|
|
|
|
|
|
|
|
|
|
|
|
|
Systems companies and others |
| 62,199 |
| 4.72 | % | 65,258 |
| 3.84 | % | 127,272 |
| 6.15 | % |
|
|
|
|
|
|
|
|
|
|
|
|
|
|
Total |
| 1,319,466 |
| 100.00 | % | 1,701,598 |
| 100.00 | % | 2,068,964 |
| 100.00 | % |
We categorize our sales geographically based on the headquarters of customer operations and not related to shipment destination. The following table sets forth the geographical distribution of our sales and percentage of sales for 2010, 2011, 2012 and 2012:2013:
|
| For the year ended December 31, |
| ||||||||||
|
| 2010(1) |
| 2011 |
| 2012 |
| ||||||
Region |
| Sales |
| Percentage |
| Sales |
| Percentage |
| Sales |
| Percentage |
|
|
| (in US$ thousands, except percentages) |
| ||||||||||
United States |
| 847,852 |
| 55.33 | % | 726,011 |
| 55.02 | % | 940,370 |
| 55.26 | % |
|
|
|
|
|
|
|
|
|
|
|
|
|
|
Europe |
| 39,168 |
| 2.56 | % | 35,256 |
| 2.67 | % | 38,811 |
| 2.28 | % |
|
|
|
|
|
|
|
|
|
|
|
|
|
|
Asia-Pacific (excluding Japan, Taiwan, and China) |
| 32,011 |
| 2.09 | % | 21,244 |
| 1.61 | % | 28,177 |
| 1.66 | % |
|
|
|
|
|
|
|
|
|
|
|
|
|
|
Taiwan |
| 167,154 |
| 10.90 | % | 105,788 |
| 8.02 | % | 113,227 |
| 6.65 | % |
|
|
|
|
|
|
|
|
|
|
|
|
|
|
Japan |
| 3,188 |
| 0.21 | % | 356 |
| 0.03 | % | 3,423 |
| 0.20 | % |
|
|
|
|
|
|
|
|
|
|
|
|
|
|
China |
| 443,076 |
| 28.91 | % | 430,811 |
| 32.65 | % | 577,590 |
| 33.95 | % |
|
|
|
|
|
|
|
|
|
|
|
|
|
|
Total |
| 1,532,449 |
| 100.00 | % | 1,319,466 |
| 100.00 | % | 1,701,598 |
| 100.00 | % |
|
| For the year ended December 31, |
| ||||||||||
|
| 2011 |
| 2012 |
| 2013 |
| ||||||
Region |
| Sales |
| Percentage |
| Sales |
| Percentage |
| Sales |
| Percentage |
|
|
| (in US$ thousands, except percentages) |
| ||||||||||
United States |
| 726,011 |
| 55.02 | % | 940,370 |
| 55.26 | % | 1,002,699 |
| 48.47 | % |
Mainland China and Hong Kong |
| 430,811 |
| 32.65 | % | 577,590 |
| 33.95 | % | 836,771 |
| 40.44 | % |
Eurasia* |
| 162,644 |
| 12.33 | % | 183,638 |
| 10.79 | % | 229,494 |
| 11.09 | % |
Total |
| 1,319,466 |
| 100.00 | % | 1,701,598 |
| 100.00 | % | 2,068,964 |
| 100.00 | % |
(1)Prepared under US GAAP.* Not including Mainland China and Hong Kong
We have a global and diversified customer base that includes IDMs, fabless semiconductor companies and systems companies. Although we are not dependent on any single customer, aA significant portion of our sales is attributable to a relatively small number of our customers. For the year ended December 31, 2012,2013, our five largest customers accounted for 56.0%52.3% of our total sales.
The following table sets forth a breakdown of our sales by application type for 2010, 2011, 2012 and 2012:2013:
|
| For the year ended December 31, |
|
| For the year ended December 31, |
| ||||||||||||||||||||
|
| 2010(2) |
| 2011 |
| 2012 |
|
| 2011 |
| 2012 |
| 2013 |
| ||||||||||||
Application Type |
| Sales |
| Percentage |
| Sales |
| Percentage |
| Sales |
| Percentage |
|
| Sales |
| Percentage |
| Sales |
| Percentage |
| Sales |
| Percentage |
|
|
| (in US$ thousands, except percentages) |
|
| (in US$ thousands, except percentages) |
| ||||||||||||||||||||
|
|
|
|
|
|
|
|
|
|
|
|
|
| |||||||||||||
Computing(1) |
| 51,651 |
| 3.37 | % | 45,355 |
| 3.44 | % | 33,448 |
| 1.97 | % |
| 45,355 |
| 3.44 | % | 33,448 |
| 1.97 | % | 33,709 |
| 1.63 | % |
|
|
|
|
|
|
|
|
|
|
|
|
|
| |||||||||||||
Communications |
| 755,951 |
| 49.33 | % | 553,493 |
| 41.95 | % | 779,614 |
| 45.82 | % | |||||||||||||
|
|
|
|
|
|
|
|
|
|
|
|
|
| |||||||||||||
Consumer |
| 607,600 |
| 39.65 | % | 595,313 |
| 45.12 | % | 741,456 |
| 43.57 | % | |||||||||||||
|
|
|
|
|
|
|
|
|
|
|
|
|
| |||||||||||||
Communications(2) |
| 553,493 |
| 41.95 | % | 779,614 |
| 45.82 | % | 930,234 |
| 44.96 | % | |||||||||||||
Consumer(3) |
| 595,313 |
| 45.12 | % | 741,456 |
| 43.57 | % | 916,999 |
| 44.32 | % | |||||||||||||
Others |
| 117,247 |
| 7.65 | % | 125,305 |
| 9.49 | % | 147,080 |
| 8.64 | % |
| 125,305 |
| 9.49 | % | 147,080 |
| 8.64 | % | 188,022 |
| 9.09 | % |
|
|
|
|
|
|
|
|
|
|
|
|
|
| |||||||||||||
Total |
| 1,532,449 |
| 100.00 | % | 1,319,466 |
| 100.00 | % | 1,701,598 |
| 100.00 | % |
| 1,319,466 |
| 100.00 | % | 1,701,598 |
| 100.00 | % | 2,068,964 |
| 100.00 | % |
(1) “Computing” consists of integrated circuits such as hard disk drive controllers, DVD-ROM/CD-ROM driver, graphic processors and other components that are commonly used in desktop and notebook computers and peripherals. “Communications”
(2)“Communications” consists of integrated circuits used in both wired and wireless data communications and telecommunications applications.
(3) “Consumer” consists of integrated circuits used for stand-alone DVD players, TV, set top box, game consoles, digital cameras, smart cards and toys.
(2)Prepared under US GAAP.
Intellectual Property, Patents
We have several thousand patents and patent applications, in addition to third party licenses. Research and development is important for us to maintain our competitiveness. We also have various trademark registrations worldwide. However, we are not dependent on any single patent, license, or trademark, or any group of related patents, licenses or trademarks. Please see also “Research and Development, Patents and Licenses, etc.” on page 61.70.
Competition and Marketing Channels
We compete internationally and domestically in mainland China with dedicated foundry service providers, as well as with semiconductor companies that allocate a portion of their fabrication capacity to foundry operations. While different players in the wafer foundry market may compete on factors such as technical competence, production speed and cycle time, time-to-market, research and development quality, available capacity, yields, customer service and price, we seek to compete on the basis of process technology capabilities, performance, quality, service and price. The level of competition differs according to the process technology involved.
Our competitors are other pure-play foundries such as TSMC, UMC and Global Foundries. Another group of potential competitors consists of IDMs that have established their own foundry capabilities includeincluding Fujitsu Limited, Samsung Electronics Co., Ltd. and IBM.
We have customer service and marketing offices located in the US, Europe, Japan, mainland China and Taiwan and a representative office in Hong Kong. Our mainland China offices serve mainland China, Hong Kong and other non-Japan, non-Taiwan Asian markets, our US office serves the North American market, our Taiwan Officeoffice serves the Taiwan market and our Europe and Japan offices serve the European and Japanese markets, respectively. We also sell some products through sales agents in selected markets.
Business Seasonality
In the past, the general, semiconductor foundry business wasis subject to seasonal behavior patterns in which business normally would peak in the third quarter of a calendar year and bottom in the first quarter. Our efforts on cautiously managing our fab capabilities and capacity, together with our limited scale relative to the industry, have significantly reduced the impact of seasonality to our business, especially in 2012.
Raw Materials
Our fabrication processes uses many raw materials, primarily silicon wafers, chemicals, gases, and various types of precious and other metals. Raw material costs constituted 22%, 25% and 25%24% of our manufacturing costs in 2011, 2012 and 2012,2013, respectively.
The three largest components of raw material costs - raw wafers, approximately chemicals and gases - accounted for approximately 36%, 23%, and 10%, respectively, of our raw material costs in 2011, and approximately 36%, 24%, and 10%, respectively, of our raw material costs in 2012.2012, and approximately 36%, 26% and 10%, respectively, of our raw material costs in 2013. Most of our raw materials generally are available from several suppliers, but substantially all of our principal materials requirements must currently be sourced from outside China.
The most important raw material used in our production is silicon in the form of raw wafers. In 2012,2013, we purchased approximately 78.0%73.41% of our overall raw wafer requirements from our three major raw wafer suppliers. The prices of our principal raw material are not considered to be volatile.
For 2013, our largest and five largest raw materials suppliers accounted for approximately 12.2% and 40.7%, respectively, of our overall raw materials purchases. For 2012, our largest and five largest raw materials suppliers accounted for approximately 11.87% and 41.30%, respectively, of our overall raw materials purchases. For 2011, our largest and five largest raw materials suppliers accounted for approximately 11.5% and 36.7%, respectively, of our overall raw materials purchases. Most of our materials are imported free of value-added tax and import duties due to concessions granted to our industry in China.
Electricity and Water
We use substantial amounts of electricity in our manufacturing process. This electricity is sourced from Pudong Electricity Corporation, Beijing Municipal Electricity Department, Tianjin Municipal Electricity Department and Shenzhen PanGuShi Municipal Electricity Department for our facilities located in Shanghai, Beijing, Tianjin and Shenzhen, respectively. We maintain Uninterrupted Power Supply systems and emergency back-up generators to power life safety and critical equipment and systems for emergencies.
The semiconductor manufacturing process also uses extensive amounts of fresh water. We source our fresh water for our Shanghai mega-fab from Pudong VivendiVeolia Water Corporation Limited, for our Beijing mega-fab from Beijing Waterworks Group Co. Ltd., for our Tianjin fab from the Tianjin Municipal Water Department and for our Shenzhen facility from Grand Industrial Zone Water Company of Shenzhen. Because Beijing and Tianjin are subject to potential water shortages in the summer, our fabs in Beijing and Tianjin are equipped with back-up reservoirs. We have taken steps to reduce fresh water consumption in our fabs and capture rainwater for use at our Beijing and Tianjin facilities, and our water recycling systems in each of our fabs allow us to recycle up to 70% of the water used during the manufacturing process. The Beijing site is also equipped to use recycled/treated industrial waste water from the Beijing Economic and Technological Development Area for non-critical operations.
Regulation
The integrated circuit industry in China is subject to substantial regulation by the Chinese government. This section sets forth a summary of the most significant Chinese regulations that affect our business in China.
Scope of Regulation
The Several Policies to Encourage the Development of Software and Integrated Circuit Industry and the Several Policies to Further Encourage the Development of Software and Integrated Circuit Industry, or the Integrated Circuit Policies, promulgated by the State Council of The People’s Republic of China on June 24, 2000 and on January 28, 2011, respectively, together with other ancillary laws and regulations, regulates integrated circuit production enterprises, or ICPEs. The State Council issued the Integrated Circuit Policies in order to encourage the development of the software and integrated circuits industry in China. The Integrated Circuit Policies form the basis for a series of laws and regulations that set out in detail the preferential policies relating to ICPEs. Such laws and regulations include:
·the Notice of the Ministry of Finance, the State Administration of Taxation and the General Administration of Customs on Relevant Taxation Policy Encouraging the Further Development of the Software Industry and the Integrated Circuit Industry, or the Integrated Circuit Notice, jointly issued by the Ministry of Finance, the State Administration of Taxation and the General Administration of Customs on September 22, 2000, as amended by the Notice of the Ministry of Finance and the State Administration of Taxation on Approval Procedure Concerning Foreign Invested Enterprises’ Implementing Enterprise Income Tax Policies of the Software and Integrated Circuit Industry, or the Approval Notice, jointly issued by the Ministry of Finance and the State Administration of Taxation on July 1, 2005;
·the Notice of the Ministry of Finance on Taxation Policies Concerning the Import of Self-used Raw Materials and Consumables by Part of Integrated Circuit Production Enterprises, or the Raw Materials Taxation Notice, issued by the Ministry of Finance on August 24, 2002;
·the Notice on Taxation Policies Concerning the Import of Construction Materials Specially used for Clean Rooms by Part of the Integrated Circuit Production Enterprises, or the Construction Materials Taxation Notice, issued by the Ministry of Finance on September 26, 2002;
·the Notice by the Ministry of Finance and the State Administration of Taxation on Increasing Tax Refund Rate for Export of Certain Information Technology(IT) Products, or the Export Notice, issued by the Ministry of Finance and the State Administration of Taxation on December 10, 2004;
·the Measures for the Accreditation of the Integrated Circuit Enterprise Encouraged by the State (For Trial Implementation),or the Accreditation Measures jointly issued by the National Development and Reform Commission, the Ministry of Information Industry, the State Administration of Taxation and the General Administration of Customs on October 21, 2005; and
·the Interim Measures for the Management of the Special Fund for the Research and Development of the Integrated Circuit Industry, or the Fund Measures, jointly issued by the Ministry of Finance, the Ministry of Information Industry and the National Development and Reform Commission on March 23, 2005.
Preferential Industrial Policies Relating to ICPEs
ICPEs which are duly accredited in accordance with relevant laws and regulations may qualify for preferential industrial policies. Under the Integrated Circuit Policies, accreditation of ICPEs is determined by the competent examination and approval authorities responsible for integrated circuit projects after consultation with relevant taxation authorities. Under the Accreditation Measures, an integrated circuit enterprise refers to an independent legal entity duly established in the PRC (except for Hong Kong, Macao, and Taiwan) engaging in the fabrication, package, or testing of integrated circuit chips and the production of mono-crystalline silicon of six inches or above, excluding the integrated circuit design enterprise. The accreditation of ICPEs is included in the accreditation of the integrated circuit enterprises. Such accreditation is determined by the competent authorities consisting of the National Development and Reform Commission, the Ministry of Information Industry (now Ministry of Industry and Information Technology), the State Administration of Taxation and the General Administration of Customs, which jointly designate the China Semiconductor Industrial Association as the accreditation institution. Any enterprise qualified under the requirements set forth in the Accreditation Measures is entitled to apply to the China Semiconductor Association for the Accreditation of the ICPEs. The accreditation of ICPEs is annually reviewed. If the enterprise fails to apply for the annual review in time, it shall be deemed as giving up such accreditation and if the enterprise fails in the annual review, the accreditation will also be canceled.
SMIC Shanghai, SMIC Beijing, and SMIC Tianjin have been accredited as ICPEs and are entitled to the preferential industrial policies described below.
Encouragement of Domestic Investment in ICPEs
Pursuant to the Interim Provisions on Promoting Industrial Structure Adjustment, or the Interim Provisions, issued by the State Council on December 2, 2005, and the Catalogue for the Guidance of Industrial Structure Adjustment, or the Guidance Catalogue, which is the basis and criteria for implementing the Interim Provisions, issued by the National Development and Reform Commission and all the State Council Institutions on March 27, 2011 and amended on February 16, 2013, the Chinese government encourages (i) the design andof integrated circuits, (ii) the fabrication of large scale integrated circuits with a line width of less than 1.20.8 micron (ii) the fabrication of the equipment of large scale integrated circuit(including 0.8 micron) and (iii) the fabricationadvanced packaging and testing of mixed integrated circuits.BGA, PGA, CSP and MCM. Under the Interim Provisions, imported equipment that is used for a qualifying domestic investment project and that falls within such project’s approved total investment amount is exempt from custom duties except for such equipment listed in the Catalogue of Import Commodities for Domestic Investment Projects Not Entitled to Tax Exemptions, as stipulated by the State Council and amended in 2006.2006, 2008 and 2012, as well as in the General Administration of Customs’ announcement on the relevant matters arising from the implementation of the Industrial Restructuring Guidance Catalogue (2011) by the customs (Announcement No. 36 [2011]of the General Administration of Customs) and the Notice of the State Council on Adjusting the Taxation Policies for Imported Equipment (Guo Fa [1997] No.37).
Encouragement of Foreign Investment in ICPEs
Pursuant to the Integrated Circuit Policies and the Guideline Catalogue of Foreign Investment Industries promulgated jointly by the State Development and Reform Commission and the Ministry of Commerce on December 24, 2011, the following foreign investment categories are encouraged:
· design of integrated circuits;
· fabrication of large scale integrated circuits with a line width of less than 0.18 micron (including 0.18 micron);
· fabrication of analog and analog digital integrated circuits with a line width of less than 0.8 micron (including 0.8 micron);
· advanced packaging and testing of BGA, PGA, CSP, MCM;
· fabrication of mixed integrated circuits;
· MEMS and compound semiconductor integrated circuits.
Foreign investment in such encouraged projects may enjoy preferential treatment as stipulated by the laws and regulations.
Preferential Taxation Policies
SMIC is incorporated in the Cayman Islands and not currently subject to taxation in the Cayman Island.Islands.
The Law of the People’s Republic of China on Enterprise Income Tax (“EIT Law”) was promulgated on March 16, 2007, which became effective January 1, 2008. Under the EIT Law, domestically-owned enterprises and foreign-invested enterprises (“FIEs”) are subject to a uniform tax rate of 25%. The EIT Law provides a five-year transition period starting from its effective date for those companies which were established before the promulgation date of the EIT Law and which were entitled to a preferential lower tax rate under the then effective tax laws or regulations. In accordance with regulations issued by the State Council, the tax rate of such companies may gradually transit to the uniform tax rate within the transition period. For those companies which are enjoying tax holidays, such tax holidays may continue until their expiration in accordance with the regulations issued by the State Council, but where the tax holiday has not yet started because of losses, such tax holiday shall be deemed to commence from the first effective year of the EIT Law. As a result, the applicable tax rates during the five-year transitional period are as follows: 18% in 2008, 20% in 2009, 22% in 2010, 24% in 2011 and 25% in 2012 and thereafter.
Pursuant to Caishui Circular [2012] No.27[2008] No. 1 (“Circular No.27”No. 1”) promulgated on April 20, 2012,February 22, 2008, integrated circuit production enterprises whose total investment exceeds RMB8,000 million (approximately $1,095US$1,095 million) or whose integrated circuits have a line width of less than 0.25 micron are entitled to a preferential tax rate of 15%. For enterprises that have been inEnterprises with an operation forperiod of more than 15 years the time limitsare entitled to a full exemption from income tax for entitlement to preferential tax treatments shall be calculatedfive years starting from the first profitable year the enterprise became profitable until December 31, 2017. These enterprises will be exempt from the enterprise incomeafter utilizing all prior years’ tax in the first five years,losses and will be allowed a 50 percent tax50% reduction of a statutory rate of 25% inthe tax for the following five years, for an effective rate of 12.5%. According to the current policies, an enterprise may qualify for such preferential tax treatments so long as its first year of positive accumulated earnings occurs prior to December 31, 2017. Depreciation periods of manufacturing equipment of integrated circuit manufacturers may be shortened appropriately, the minimum time period should be three years. Pursuant to Caishui Circular [2009] No.69No. 69 (“Circular No. 69”), the 50% reduction should be based on the statutory tax rate of 25% unless the income tax rate of the Company is reduced by the tax incentives granted by Circular No.39. No. 39.
On January 28, 2011, the State Council of China issued Guofa [2011] No.4No. 4 (“Circular No.4”No. 4”), the Notice on Certain Policies to Further Encourage the Development of the Software and Integrated Circuit Industries which reinstates the EIT incentives stipulated by Circular No.1No. 1 for the software and integrated circular enterprises.
On April 20, 2012, State Tax Bureau issued Cai Shui [2012] No. 27 (“Circular No. 27”), stipulating the income tax policies for the development of integrated circuit industry.
On July 25, 2013, State Tax Bureau issued [2013] No. 43 (“Circular No.43”), clarifying that the assertion and preferential tax policy of integrated circuit enterprise established before December 31, 2010, is pursuant to Circular No.1.
Preferential Policies Encouraging Research and Development
The EIT Law and the Implementation Regulations of the EIT Law have provided tax incentives in relation to technologies as a means to encourage advancement and adoption of new technologies. The EIT Law provides an additional 50% deduction of the research and development expenses incurred from the research and development of new technologies, new products, and new techniques on the basis of the actual deductions when relevant enterprise has no intangible asset to be formed and calculated into the current gains and losses. If intangible assets have been formed, they shall be amortized at 150% of the cost of the intangible assets.
Legal Framework Concerning the Protection of Intellectual Property Relating to Integrated Circuits
China has formulated various laws and regulations on intellectual property protection in respect of integrated circuits including:
· the Patent Law of the People’s Republic of China, adopted at the fourth meeting of the Standing Committee of the Sixth National People’s Congress on March 12, 1984, effective April 1, 1985 and amended by the Ninth National People’s Congress on August 25, 2000 and third amended by the Eleventh People’s Congress on December 27, 2008, effective October 1, 2009;
· the Paris Convention for the Protection of Industrial Property of the World Intellectual Property Organization, in which China became a member state as of March 19, 1985;
· the General Principles of the Civil Law of the People’s Republic of China adopted at the fourth session of the Sixth National People’s Congress on April 12, 1986, effective January 1, 1987 and revised at the thirtieth sessiontenth meeting of the TenthStanding Committee of the Eleventh National People’s Congress on October 28, 2007.August 27, 2009. In this legislation, intellectual property rights were defined in China’s basic civil law for the first time as the civil rights of citizens and legal persons;
· the Copyright Law of the People’s Republic of China, adopted by the 15th meeting of the Seventh National People’s Congress Standing Committee on September 7, 1990, effective June 1, 1991, first amended by the Ninth National People’s Congress on October 27,2001andsecond27,2001and amended again by the Eleventh National People’s Congress on February 26, 2010;
· the Regulations for the Protection of the Layout Design of Integrated Circuits, or the Layout Design Regulations, adopted April 2, 2001 at the thirty-sixth session of the executive meeting of the State Council, effective October 1, 2001; and
· the World Intellectual Property Organization’s Washington Treaty on Intellectual Property in Respect of Integrated Circuits, for which China was among the first signatory states in 1990.
Protection of the Layout Design of Integrated Circuits
Under the Layout Design Regulations, layout design of an integrated circuit refers to a three dimensional configuration in an integrated circuit that has two or more components, with at least one of these being an active component, and part or all of the interconnected circuitry or the three-dimensional configuration prepared for the production of integrated circuits.
Chinese natural persons, legal persons or other organizations that create layout designs are entitled to the proprietary rights in the layout designs in accordance with the Layout Design Regulations. Foreign persons or enterprises that create layout designs and have them first put into commercial use in China are entitled to the proprietary rights in the layout designs in accordance with the Layout Design Regulations. Foreign persons or enterprises that create layout designs and that are from a country that has signed agreements with China regarding the protection of layout designs, or is a party to an international treaty concerning the protection of layout designs to which China is also a party, are entitled to the proprietary rights of the layout designs in accordance with the Layout Design Regulations.
Proprietary Rights in Layout Design of Integrated Circuits
Holders of proprietary rights in a layout design are entitled to the following proprietary rights:
· to duplicate the whole protected layout design or any part of the design that is original; and
· to make commercial use of the protected layout design, the integrated circuit containing the layout design, or commodities containing the integrated circuit.
Proprietary rights in layout designs become valid after being registered with the administrative department of the State Council responsible for intellectual property. Unregistered layout designs are not protected by the Layout Design Regulations.
The protection period of the proprietary rights in a layout design is ten years, commencing from the date of the application for registration of the layout design or the date that it is first put into commercial use anywhere in the world, whichever is earlier. However, regardless of whether or not a layout design is registered, or whether or not it is put into commercial use, it is not protected after 15 years from the time of its creation.
Registration of a Layout Design
The administrative departments of the State Council responsible for intellectual property are responsible for the registration of layout designs and accepting applications for the registration of layout designs. If an application for a layout design registration is not made with the administrative department of the State Council responsible for intellectual property within two years after it has been first put into commercial use anywhere in the world, the administrative department of the State Council responsible for intellectual property will not register the application. A holder of proprietary rights in a layout design may transfer the proprietary rights or give permission for other parties to use the layout design.
Compulsory Licenses for Exploitation of Patents in Respect of Semiconductor Technology
Under the Patent Law and the Implementing Regulations of the Patent Law, after three years from the date of granting theafter a patent rights,right is granted and four years after a patent application is filed, any person or enterprise that has made good faith reasonable proposals to the holder of proprietary rights seeking a license to those rights,such right, but has been unable to obtain such license after an extended period of time, may request the administrative department responsible for patents under the State Council to grant a compulsory license for the relevant patent.patent, provided that the patent owner fails to exploit or fails to adequately exploit the patent without justified reasons. However, where a compulsory license involves semiconductor technology, the implementation of a compulsory license is restricted to public and non-commercial uses, or to uses that counteract anti- competitive actions, as determined by judicial or administrative procedures.
PRC Tax for “Resident Enterprises”
Under China’s EIT Law, an enterprise established under the laws of non-PRC jurisdictions, but whose “de facto management body” is located in the PRC is treated as a resident enterprise for PRC tax purpose. If we may beare classified as a “resident enterprise” of China. This classificationin China, we could result inbe subject to unfavorable tax consequences to us and our non-PRC shareholders. The implementing rules of the EIT Law define de facto management bodies as “management bodies that exercises substantial and overall management and control over the production and operations, personnel, accounting, and properties” of the enterprise. Currently no official interpretationIn April 2009, the State Administration of Taxation further specified criteria for the determination of the location of ‘‘de facto management bodies’’ for foreign enterprises, which include: (i) the enterprise’s day-to-day operational management is primarily exercised in the PRC, (ii) decisions relating to the enterprise’s financial and human resource matters are made or applicationsubject to approval by organisations or personnel in the PRC, (iii) the enterprise’s primary assets, accounting books and records, company seals, and board and shareholders’ meeting minutes are located or maintained in the PRC and (iv) 50% or more of this “resident enterprise” classification is available, therefore it is unclear how tax authorities will determine tax residency based onvoting board members or senior executives of the facts of each case.enterprise habitually reside in the PRC.
If the PRC tax authorities determine that our Cayman Islands holding company is a “resident enterprise” for PRC enterprise income tax purposes, a number of unfavorable PRC tax consequences could follow. First, we may be subject to enterprise income tax at a rate of 25% on our worldwide taxable income as well as PRC enterprise income tax reporting obligations. Second, although under the EIT Law and its implementing rules dividends income between qualified resident enterprises is tax exempted income, it is not clear how a qualified resident enterprise which is incorporated overseas would be treated under the EIT Law. Finally, it is possible that future guidance issued with respect to the “resident enterprise” classification could result in a situation in which a 10% withholding tax is imposed on dividends we pay to our non-PRC shareholders and with respect to gains derived by our non-PRC shareholders from transferring our shares or ADSs. Similarly, these unfavorable consequences could apply to our other overseas intermediary holding companies if they are classified as PRC resident enterprises.
Environmental Regulations
Our Chinese subsidiaries are subject to a variety of Chinese environmental laws and regulations promulgated by the central and local governments concerning examination and acceptance of environmental protection measures in construction projects, the use, discharge and disposal of toxic and hazardous materials, the discharge and disposal of waste water, solid waste, and waste gases, control of industrial noise and fire prevention. These laws and regulations set out detailed procedures that must be implemented throughout a project’s construction and operation phases.
A key document that must be submitted for the approval of a project’s construction is an environmental impact assessment report that is reviewed by the relevant environmental protection authorities. Upon completion of construction, and prior to commencement of operations, an additional examination and acceptance by the relevant environmental authority of such projects is also required. Within one month after receiving approval of the environmental impact assessment report, a semiconductor manufacturer is required to apply to and register with the competent environmental authority the types and quantities of liquid, solid and gaseous wastes it plans to discharge, the manner of discharge or disposal, as well as the level of industrial noise and other related factors. If the above wastes and noise are found by the authorities to have been managed within regulatory levels, renewable discharge registrations for the above wastes and noise are then issued for a specified period of time. SMIC Shanghai, SMIC Beijing and SMIC Tianjin have all received approval with respect to their relevant environmental impact assessment reports and discharge registrations.
From time to time during the operation of our Chinese subsidiaries, and also prior to renewal of the necessary discharge registrations, the relevant environmental protection authority will monitor and audit the level of environmental protection compliance of these subsidiaries. Discharge of liquid, solid or gaseous waste over permitted levels may result in imposition of fines, imposition of a time period within which rectification must occur or even suspension of operations.
Enforceability of Civil Liabilities
We are a Cayman Islands holding company. We are incorporated in the Cayman Islands because of the following benefits associated with being a Cayman Islands corporation:
· political and economic stability;
· an effective judicial system;
· a favorable tax system;
· the absence of exchange control or currency restrictions; and
· the availability of professional and support services.
However, the Cayman Islands have a less developed body of securities laws as compared to the United States and provide significantly less protection for investors. In addition, Cayman Islands companies may not have standing to initiate a shareholder derivative action before the federal courts of the United States. Substantially all of our assets are located outside the United States. In addition, most of our directors and officers are nationals and/or residents of countries other than the United States, and all or a substantial portion of our or such persons’ assets are located outside the United States. As a result, it may be difficult for a shareholder to effect service of process within the United States upon us or such persons or to enforce against them or against us, judgments obtained in United States courts, including judgments predicated upon the civil liability provisions of the securities laws of the United States or any state thereof.
Conyers Dill & Pearman (Cayman) Limited, our counsel as to Cayman Islands law, Slaughter and May, our counsel as to Hong Kong law, and Fangda Partners, our counsel as to Chinese law, have advised us that there is uncertainty as to whether the courts of the Cayman Islands, Hong Kong and China, respectively, would:
· recognize or enforce judgments of United States courts obtained against us or our directors or officers predicated upon the civil liability provisions of the securities laws of the United States or any state thereof, or
· be competent to hear original actions brought in each respective jurisdiction, against us or our directors or officers predicated upon the securities laws of the United States or any state thereof.
Conyers Dill & Pearman (Cayman) Limited has further advised us that a final and conclusive judgment in the federal or state courts of the United States under which a sum of money is payable, other than a sum payable in respect of taxes, fines, penalties or similar charges, may be subject to enforcement proceedings as a debt in the Courts of the Cayman Islands under the common law doctrine of obligation.
C. Organizational Structure
We operate primarily through SMIC Shanghai, SMIC Beijing and SMIC Tianjin in China. The chart below sets forth also our other significant operating subsidiaries or affiliates, including their jurisdictions of incorporation and principal activities as of December 31, 2012:2013:
|
|
|
| Direct or Indirect |
|
| |
|
|
|
| equity |
|
| |
|
| Place and date of |
| ownership |
| Principal | |
Name of company |
| incorporation/establishment |
| held |
| Activity | |
|
|
|
|
|
|
| |
Better Way Enterprises Limited (“Better Way”)* |
| Samoa April 5, 2000 |
| 100 | % | Provision of marketing related activities | |
Semiconductor Manufacturing International (Shanghai) Corporation (“ |
| People’s Republic of China (the “PRC”) December 21, 2000 |
| 100 | % | Manufacturing and trading of semiconductor products | |
SMIC, Americas |
| United States of America June 22, 2001 |
| 100 | % | Provision of marketing related activities | |
Semiconductor Manufacturing International (Beijing) Corporation (“ |
| PRC July 25, 2002 |
| 100 | % | Manufacturing and trading of semiconductor products | |
SMIC Japan Corporation |
| Japan October 8, 2002 |
| 100 | % | Provision of marketing related activities | |
SMIC Europe S.R.L. |
| Italy July 3, 2003 |
| 100 | % | Provision of marketing related activities | |
Semiconductor Manufacturing International (Solar Cell) Corporation |
| Cayman Islands June 30, 2005 |
| 100 | % | Investment holding | |
SMIC Commercial (Shanghai) Limited Company (formerly SMIC Consulting Corporation) *# |
| PRC September 30, 2003 |
| 100 | % | Provision of marketing related activities | |
Semiconductor Manufacturing International (Tianjin) Corporation (“ |
| PRC November 3, 2003 |
| 100 | % | Manufacturing and trading of semiconductor products | |
SMIC Development (Chengdu) |
| PRC December 29, 2005 |
| 100 | % | Construction, operation and management of SMICD’s living quarters, schools and supermarket | |
Semiconductor Manufacturing International (BVI) Corporation (“SMIC (BVI)”)* |
| British Virgin Islands April 26, 2007 |
| 100 | % | Provision of marketing related activities | |
Admiral Investment Holdings Limited |
| British Virgin Islands October 10, 2007 |
| 100 | % | Investment holding | |
SMIC Shanghai (Cayman) Corporation |
| Cayman Islands November 8, 2007 |
| 100 | % | Investment holding | |
SMIC Beijing (Cayman) Corporation |
| Cayman Islands November 8, 2007 |
| 100 | % | Investment holding | |
SMIC Tianjin (Cayman) Corporation |
| Cayman Islands November 8, 2007 |
| 100 | % | Investment holding | |
SilTech Semiconductor |
| Cayman Islands February 13, 2008 |
| 100 | % | Investment holding | |
SMIC Shenzhen (Cayman) Corporation |
| Cayman Islands January 21, 2008 |
| 100 | % | Investment holding | |
SMIC Energy Technology (Shanghai) Corporation (“Energy Science)*# |
| PRC September 9, 2005 |
| 100 | % | Manufacturing and trading of solar cells related semiconductor products | |
Magnificent Tower Limited |
| British Virgin Islands January 5, 2006 |
| 100 | % | Investment holding | |
SMIC Shanghai (HK) Company Limited |
| Hong Kong December 3, 2007 |
| 100 | % | Investment holding | |
SMIC Beijing (HK) Company Limited |
| Hong Kong December 3, 2007 |
| 100 | % | Investment holding | |
SMIC Tianjin (HK) Company Limited |
| Hong Kong December 3, 2007 |
| 100 | % | Investment holding | |
SMIC Solar Cell (HK) Company Limited (“SMIC Solar Cell (HK)”)* |
| Hong Kong December 3, 2007 |
| 100 | % | Investment holding | |
|
|
|
|
|
| ||
SMIC Shenzhen (HK) Company Limited |
| Hong Kong January 29, 2008 |
| 100 | % | Investment holding | |
SilTech Semiconductor (Hong Kong) Corporation Limited |
| Hong Kong March 20, 2008 |
| 100 | % | Investment holding | |
Semiconductor Manufacturing International (Shenzhen) Corporation |
| PRC March 20, 2008 |
| 100 | % | Manufacturing and trading of semiconductor products | |
SilTech Semiconductor |
| PRC March 3, 2009 |
| 100 | % | Manufacturing and trading of semiconductor products | |
|
|
|
|
|
| ||
|
|
|
|
| |||
|
| PRC July |
|
| % |
|
*For identification purposes only.
# Companies registered as wholly-owned foreign enterprises in the People’s Republic of China. (PRC), excluding for the purpose of this report, Hong Kong, Macau, and Taiwan.
(Note): The Company consolidates Brite Semiconductor Corporation and its subsidiaries (Brite) through controls gained through contractual agreement. The impact of consolidating of Brite is insignificant to the financial statements of the Company.
D. Property, plant and equipment
Equipment
The quality and level of technology of the equipment used in the semiconductor fabrication process are important because they dictate the limits of the process technology that we use. Advances in process technology cannot be achieved without corresponding advances in equipment technology. The principal pieces of equipment used by us to fabricate semiconductors are scanners, cleaners and track equipment, inspection equipment, etchers, furnaces, wet stations, strippers, implanters, sputterers, CVD equipment, testers and probers. We source substantially all of our equipment from vendors located in the United States, Europe and Japan.
In implementing our capacity expansion and technology advancement plans, we expect to make significant purchases of equipment required for semiconductor fabrication. Some of the equipment is available from a limited number of vendors and/or is manufactured in relatively limited quantities, and in some cases has only recently become commercially available. Our ability to obtain certain kinds of equipment from outside of China may be subject to restrictions. See “Risk Factors — Risks Related to Conducting Operations in China—Limits placed on exports into China could substantially harm our business and operating results.”
We maintain our equipment through a combination of in-house maintenance and outside contracting to our equipment vendors. We decide whether to maintain ourselves, or subcontract the maintenance of, a particular piece of equipment based on a variety of factors, including cost, complexity and regularity of the required periodic maintenance and the availability of maintenance personnel in China. Most of our equipment vendors offer maintenance services through technicians based in China.
Property
The following table sets forth the location, size and primary use of our real properties and whether such real properties are owned or leased.
|
| Size |
|
|
| Owned(1)or | |
Location |
| (Land/Building) |
| Primary Use |
| Leased | |
|
| (Land/Building) |
|
|
|
| |
|
| (in square meters) |
|
|
|
| |
Zhangjiang High-Tech Park, Pudong New Area, Shanghai |
| 367,895/201,772 |
| Wafer fabrication |
| owned/owned | |
|
|
|
|
|
|
| |
Beijing Economic and Technological Development Area |
| 240,140/143,017 |
| Wafer fabrication |
| owned/owned | |
|
|
|
|
|
|
| |
Xiqing Economic Development Area, Tianjin |
| 215,733/70,578 |
| Wafer fabrication |
| owned/owned | |
|
|
|
|
|
|
| |
Shenzhen Export Processing Zone, Shenzhen Pingshan NewArea, Guangdong |
| 200,060/na |
| Wafer fabrication |
| owned/na | |
|
|
|
|
|
|
| |
Japan |
| na/ |
| Marketing activities |
| na/leased | |
|
|
|
|
|
|
| |
USA |
| na/ |
| Marketing activities |
| na/leased | |
|
|
|
|
|
|
| |
Italy |
| na/280 |
| Marketing activities |
| na/leased | |
|
|
|
|
|
|
| |
Taiwan |
|
|
| Marketing activities |
| na/leased | |
|
|
|
|
|
|
| |
Hong |
| na/300 |
| Representative Office |
| na/owned |
(1) With respect to land located in China, “ownership” refers to holding a valid land use rights certificate. All land within municipal zones in China is owned by the Chinese government. Limited liability companies, joint stock companies, foreign-invested enterprises, privately held companies and individual natural persons must pay fees to be granted rights to use land within municipal zones. Legal use of land is evidenced and sanctioned by land use certificates issued by the local municipal administration of land resources. Land use rights granted for industrial purposes are limited to a term of no more than 50 years.
(2) In February 2006, we purchased approximately 300 square meters of property in Hong Kong through our indirect wholly- owned subsidiary, Magnificent Tower Limited, a company incorporated in the British Virgin Islands.
The construction of our 8-inch fab in Shenzhen began in 2008 in an effort to expand our production capacity. Our Shenzhen project has progressed more slowly than expected due to changing market conditions and ongoing negotiations with relevant parties. This project remained as a construction in progress as of December 31, 2012.2013. See “Item 3.D - Risk Factors - Risks Related to Our Financial Condition and Business.”
Our right to continued use of the land is subject to our continued compliance with the land use agreement that each of our Chinese subsidiaries has executed. The Chinese government has reserved the right to revoke our land use rights for special eminent domain purposes, in which case the government will compensate us. In addition, pursuant to our domestic bank loan agreements, SMIC Shanghai and SMIC Beijing have pledged a portion of its land use right to the lenders. See “Item 5 — Operating and Financial Review and Prospects — Liquidity and Capital Resources.”
For further discussion concerning our capacity, capacity utilization rate and capacity expansion plans, please see “Item 5 — Operating and Financial Review and Prospects — Factors that Impact our Results of Operations.”
Environmental Matters
The semiconductor production process generates gaseous chemical wastes, liquid waste, waste water, and other industrial wastes in various stages of the fabrication process. We have installed various types of pollution control equipment for the treatment of gaseous chemical waste and liquid waste and equipment for the recycling of treated water in our fabs. Our operations are subject to regulation and periodic monitoring by the PRC’s State Environmental Protection Bureau, as well as local environmental protection authorities, including those under the Shanghai Pudong Municipal Government, the Beijing Municipal Government and the Tianjin Municipal Government, which may in some cases, establish stricter standards than those imposed by the State Environmental Protection Bureau. The Chinese national and local environmental laws and regulations impose fees for the discharge of waste substances above prescribed levels, require the payment of fines for serious violations, and authorize the Chinese national and local governments to suspend any facility that fails to comply with orders requiring it to cease or remedy operations causing environmental damage. No such penalties have been imposed on us or any of our subsidiaries for violations of environmental pollution.
We believe our pollution control measures are effective and comply with the requirements applicable to the semiconductor industry in China and comparable to other countries. Waste generated from our operations, including acid waste, alkaline waste, flammable waste, toxic waste, oxidizing waste and self- igniting waste, are collected and sorted for proper disposal. Furthermore, we have in many cases implemented waste reduction steps beyond the scope of current regulatory requirements. In addition, we continuously investigate methods to lower our energy consumption, including making existing processes more efficient and reclaiming waste heat.
The ISO 14001 standard is a voluntary standard and part of a comprehensive series of standards for environmental management published by the International Standards Organization. The ISO 14001 standard covers environmental management principles, systems and supporting techniques. SMIC first received ISO 14001 certification in August 2002.
In addition, all fabs currently in operation have been QC 080000 certified to be compliant with the hazardous substances management directives such as RoHS (Restriction of the use of certain Hazardous Substances in electrical and electronic equipment), which bans the use of various chemicals determined to be harmful to humans and the environment. Once the Shenzhen facility is in operation, it too will undergo certification for ISO 14001 and QC 080000 compliance.
We are also proactively protecting the environment by implementing energy saving measures to reduce greenhouse gas emissions. In order to calculate our greenhouse gas output and to reach a reduction goal, all SMIC sites obtained ISO 14064 certification since 2010. ISO 14064 is an international standard against which greenhouse gas (GHG) emissions reports are voluntarily verified.
Item 4A. Unresolved Staff Comments
Not applicable
Item 5.Operating and Financial Review and Prospects
We are dualdually listed inon the New York Stock Exchange and Hong Kong Stock Exchange. In order to improve comparability with peers within semiconductor industry and reduce the cost of financial reporting under different accounting frameworks, we started to prepare our annual consolidated financial statements in accordance with IFRS as of and for the year ended December 31, 2012. As disclosed in Note 1 to the consolidated financial statements, these consolidated financial statements represent our initial presentation of the financial results of operations and financial position under IFRS as of and for the year ended December 31, 2012. As a result, these consolidated financial statements have been prepared in accordance with IFRS 1, “First-time Adoption of International Financial Reporting Standards”. Previously, we prepared our annual consolidated financial statements in accordance with U.S. GAAP. We have adjusted our consolidated financial information as of and for the year ended December 31, 2011 in accordance with IFRS and financial information set forth in this annual report as of and for the year ended December 31, 2011 may differ from information previously published.
IFRS differs in certain significant respects from U.S. GAAP. For a discussion of the major differences between IFRS and U.S. GAAP, as they related to us, and a reconciliation of comprehensive income (loss) and shareholders’ equity to U.S. GAAP and information concerning the use of exceptions permitted or required by IFRS 1, see “Note 4 to Consolidated Financial Statements.”
As discussed in Note 4, the Company has applied the following two exemptions:
·IFRS 2 Share-based Payment has not been applied to equity instruments in share-based payment transactions that were granted on or before November 7, 2002, nor has it been applied to equity instruments granted after November 7, 2002 that vested before January 1, 2011, and
·The Company has designated unquoted equity instruments held at January 1, 2011 as available- for-sale investments.
The Company does not believe these two exemptions had a qualitatively material impact on the consolidated financial statements for the years ended December 31, 2011 and 2012.
The following discussion of our financial condition and results of operations should be read in conjunction with our Consolidated Financial Statementsconsolidated financial statements and the related Notesnotes prepared in accordance with IFRS as described in “Notes to Consolidated Financial Statements” as of, and for the years ended, December 31, 2011, 2012 and 2012.2013. This report contains forward-looking statements. See “Forward-Looking Information.” In evaluating our business, you should carefully consider the information provided under the caption “Item 3.D - Key Information—Risk Factors” in this annual report on Form 20-F. We caution you that our businesses and financial performance are subject to substantial risks and uncertainties.
A.Operating Results
Overview
Our operations are primarily based in China. We celebrated our tenth year of production in 2012.continued to achieve profitability on a full-year basis. In 20122013 we achieved total sales of US$1,701.62,069 million, compared to US$ 1,319.51,701.6 million in 2011.2012. We recorded annual net incomeprofit of US$ 22.8174.5 million and generated US$738.0 million in cash from operating activities in 2013, compared to annual profit of US$22.5 million and US$435.2 million in cash from operating activities in 2012. Compared to annual net loss of US$ 246.9 million and generated US$379.4 million in cash from operating activities in 2011.
AfterIn the firstfourth quarter of 2012, we maintained utilization above 90%. Theour 40/45nm process began mass production, and revenue contribution from our advanced 65nm technology more than doubled in 2012, representing 32.0% of total wafer revenue in 2012 compared to 18.5% in 2011. We also started volume shipment for products using 40nm and 40/45nm technologiesprocess has climbed from 2.6% in the fourth quarter of 2012.2012 to 16.3% in the fourth quarter of 2013. In terms of advanced process research and development, we have completed the 28nm process development in the fourth quarter of 2013 as planned.
The major factors affecting our results of operations and financial condition are discussed below.
Factors that Impact Our Results of Operations
Cyclicality of the Semiconductor Industry
The semiconductor industry is highly cyclical due mainly to the cyclicality of demand in the markets of the products that use semiconductors. As these markets fluctuate, the semiconductor market also fluctuates. This fluctuation in the semiconductor market is exacerbated by the tendency of semiconductor companies, including foundries, to make capital investments in plant and equipment during periods of high demand since it may require several years to plan, construct and commence operations at a fab. Absent sustained growth in demand, this increase in capacity often leads to overcapacity in the semiconductor market, which in the past has led to a significant underutilization of capacity and a sharp drop in semiconductor prices. The semiconductor industry is generally slow to react to declines in demand due to its capital-intensive nature and the need to make commitments for equipment purchases well in advance of the planned expansion. See “Item 3.D - Risk Factors — Risks Related to Our Financial Condition and Business.”
Substantial Capital Expenditures
The semiconductor foundry industry is characterized by substantial capital expenditures. This is particularly true for our company as we have recently constructed and equipped fabs and are continuing to construct and equip new fabs. In connection with the construction and ramp-up of our capacity, we incurred capital expenditures of US$765 million, US$499 million, and US$499770 million, in 2011, 2012 and 2012,2013, respectively. We depreciate our manufacturing machinery and equipment on a straight-line basis over an estimated useful life of five to seven years. We recorded depreciation of US$518.8 million, US$531.8 million, and US$531.8501.9 million in 2011, 2012 and 2012,2013, respectively.
The semiconductor industry is also characterized by rapid changes in technology, frequently resulting in obsolescence of process technologies and products. As a result, our research and development efforts are essential to our overall success. We spent approximately US$191.5 million in 2011, US$193.6 million in 2012 and US$193.6145.3 million in 20122013 on research and development expenses, which represented 14.5%, 11.4% and 11.4%7.0% respectively, of our sales for 2011, 2012 and 2012.2013. Our research and development costs are partially offset by related government subsidiesfundings and include the costs associated with the ramp-up of a new wafer facility.
We currently expect that our capital expenditures in 20132014 for foundry operations will be approximately US$600880 million, subject to adjustment based on market conditions. This amount does not accountWe estimate that US$570 million of these capital expenditures will be used for expendituresSMNC, our majority owned subsidiary in Beijing, which may be incurred withis 55% funded by the establishmentCompany and 45% funded by the other shareholders of the BJ Joint Venture. While there can be no assurance thatentity. In addition, we will enter intohave budgeted approximately US$110 million as the BJ Joint Venture, we expect that this project would require us to incur significant2014 capital expenditures during its start-up phase, and from time to time thereafter, and that we would need to borrow underfor non-foundry operations mainly for the construction of living quarters for employees as part of our existing credit lines or otherwise obtain additional capital to satisfy our funding obligations under this project. Further, ouremployee retention program. Our actual expenditures may differ from our planned expenditures for a variety of reasons, including changes in our business plan, our process technology, market conditions, equipment prices, or customer requirements. We will monitor the global economy, the semiconductor industry, the demands of our customers, and our cash flow from operations and will adjust our capital expenditureexpenditures plans as necessary.
Capacity Expansion
We have expanded, and plan to continue to expand, our capacity through internal growth, joint ventures and acquisitions. An increase in capacity may have a significant effect on our results of operations, both by allowing us to produce and sell more wafers and achieve higher sales, and as a cost component in the form of acquisition costs and depreciation expenses. We anticipate increasing our existing 8-inch capacities from 126,000 wafers per month to 135,000 wafers per month and increasing the capacity of 12 inch wafer by 6000 (13,500 for 8-inch wafer equivalent)our Shanghai 12-inch facility from 12,000 12-inch wafers per month to 14,000 12-inch wafers per month in 20132014 subject to market conditions.
Pricing
We price our foundry services on either a per wafer or a per die basis, taking into account the complexity of the technology, the prevailing market conditions, the order size, the cycle time, the strength and history of our relationship with the customer, and our capacity utilization. Since a majority of our costs and expenses are fixed or semi-fixed, fluctuations in the average selling prices of semiconductor wafers have historically had a substantial impact on our margins. The average selling price of the wafers we shipped decreased by 1.0%increased from US$775 per wafer in 2011 to US$767 per wafer in 2012.2012 to US$804 per wafer in 2013.
Change in Process Mix and Technology Migration
Because the price of wafers processed with different technologies varies significantly, the mix of wafers that we produce is among the primary factors that affect our sales and profitability. The value of a wafer is determined principally by the complexity of the process technology used to fabricate the wafer. In addition, production of devices with higher levels of functionality and greater system-level integration requires more fabrication steps, and these devices generally sell for higher prices.
Prices for wafers of a given level of technology generally decline over the relevant process technology life cycle. As a result, we and our competitors are continuously in the process of developing and acquiring more advanced process technologies and migrating our customers to use such technologies to maintain or improve our profit margins. This technology migration requires continuous investment in research and development and technology-related acquisitions, and we expect to continue tomay spend a substantial amount of capital on upgrading our technologies. See page 29 for a breakdown of wafer sales by process technology.
Capacity Utilization Rates
Operations at or near full capacity utilization have a significant positive effect on our profitability because a substantial percentage of our cost of sales is of a fixed or semi-fixed nature. In 2011 and 2012, approximately 34% and 29.8% respectively, of our cost of sales consisted of depreciation expenses, which are fixed costs. If we increase our utilization rates, the number of wafers we fabricate will increase, and therefore our average fixed costs per wafer will decrease. Therefore, our capacity utilization rates have a significant effect on our margins. Our capacity utilization rates have varied from period to period mainly due to capacity ramp-upsthe mix of wafers produced and fluctuations in customer orders. Our annual capacity utilization rate was 68.9% in 2011, and 88.3% in 2012.2012 and 90.7% in 2013. Factors affecting capacity utilization rates are the overall industry conditions, the level of customer orders, the complexity of the wafers and of the mix of wafers produced, mechanical failures and other operational disruptions such as the expansion of capacity or the relocation of equipment, and our ability to manage the production facilities and product flows efficiently.
Our capacity is determined by us based on the capacity ratings for each piece of equipment, as specified by the manufacturers of such equipment, adjusted for, among other factors, actual output during uninterrupted trial runs, expected down time due to set up for production runs and maintenance, and expected product mix and purchase order coming linearity.mix. Because these factors include subjective elements, our measurement of capacity utilization rates may not be comparable to those of our competitors.
Yield Rates
Yield per wafer is the ratio of the number of functional dies on that wafer to the maximum number of dies that can be produced on that wafer. We continuously upgrade the process technologies that we use. At the beginning of each technology migration, the yield utilizing the new technology is generally lower, sometimes substantially lower, than the yield under the then-current technology. This is because it requires time to stabilize, optimize and test a new process technology. We do not ship wafers to a customer until we have achieved that customer’s minimum yield requirements. Yield is generally improved through the expertise and cooperation of our research and development personnel, process engineers, and equipment suppliers.
Critical Accounting Policies
We prepare our financial statements in conformity with IFRS, which requires us to make judgments, estimates and assumptions. We regularly evaluate these estimates and assumptions based on the most recently available information, our own historical experience and various other assumptions that we believe to be reasonable under the circumstances. Since the use of estimates is an integral component of the financial reporting process, actual results could differ from our expectations as a result of changes in our estimates.
An accounting policy is considered critical if it requires an accounting estimate to be made based on assumptions about matters that are highly uncertain at the time such estimate is made, and if different accounting estimates that reasonably could have been used, or changes in the accounting estimates that are reasonably likely to occur periodically, could materially impact the consolidated financial statements. We believe that the following accounting policies involve a higher degree of judgment and complexity in their applications and require us to make significant accounting estimates. You should read the following descriptions of critical accounting policies, judgments and estimates in conjunction with our consolidated financial statements and other disclosures included in this annual report.
Inventories
Inventories are stated at the lower of cost (weighted average) or net realizable value (NRV), with NRV being the “estimated selling price in the ordinary course of business less the estimated costs of completion and the estimated costs necessary to make the sale.” We estimate the recoverability for such finished goods and work-in-progress based primarily upon the latest invoice prices and current market conditions. If the NRV of an inventory item is determined to be below its carrying value, we record a write- down to cost of sales for the difference between the carrying cost and NRV.
Long-lived assets
We assess the impairment of long-lived assets when events or changes in circumstances indicate that the carrying value of asset or cash-generating unit (“CGU”) may not be recoverable. Factors that we consider in deciding when to perform an impairment review include, but are not limited to significant under-performance of a business or product line in relation to expectations, significant negative industry or economic trends, and significant changes or planned changes in the use of the assets.
An impairment analysis is performed at the lowest level of identifiable independent cash flows for an asset or CGU. An impairment exists when the carrying value of an asset or cash-generating unit exceeds its recoverable amount, which is the higher of its fair value less costs to sell and its value in use. The fair value less costs to sell calculation is based on available data from binding sales transactions, conducted at arm’s length, for similar assets or observable market prices less incremental costs for disposing of the asset. The value in use calculation is based on a discounted cash flow model. Currently we are not able to estimate the amount of impairment loss or when the loss will occur for future years. Any potential changes of the business assumptions, such as forecasted sales, selling prices, utilizations, may have a material adverse effect on our net income.
We make subjective judgments in determining the independent cash flows that can be related to a specific CGU based on its asset usage model and manufacturing capabilities. We measure the recoverability of assets that will continue to be used in our operations by comparing the carrying value of CGU to our estimate of the related total future discounted cash flows. If a CGU’s carrying value is not recoverable through the related discounted cash flows, the impairment loss is measured by comparing the difference between the CGU’s carrying value and its recoverable amount, based on the best information available, including market prices or discounted cash flow analysis. The recoverable amount is most sensitive to the discount rate used for the discounted cash flow model as well as the expected future cash-inflows and the growth rate used for extrapolation purposes.
In order to remain technologically competitive in the semiconductor industry, we have entered into technology transfer and technology license arrangements with third parties in an attempt to advance our process technologies. The payments made for such technology licenses are recorded as an intangible asset or as a deferred cost and amortized on a straight-linestraight- line basis over the estimated useful life of the asset. We routinely review the remaining estimated useful lives of these intangible assets and deferred costs. We also evaluate these intangible assets and deferred costs for impairment whenever events or changes in circumstances indicate that their carrying amounts may not be recoverable. When the carrying amounts of such assets are determined to exceed their recoverable amounts, we will impair such assets and write down their carrying amounts to recoverable amount in the year when such determination was made.
Share-based Compensation Expense
The fair value of options and shares issued pursuant to our option plans at the grant date was estimated using the Black-Scholes option pricing model. This model was developed for use in estimating the fair value of traded options that have no vesting restrictions and are fully transferable. In addition, option-pricing models require the input of highly subjective assumptions, including the expected term of the options, the estimated forfeiture rates and the expected stock price volatility. The expected term of options granted represents the period of time that options granted are expected to be outstanding. We estimated forfeiture rates using historical data to estimate option exercise and employee termination within the pricing formula. We use projected volatility rates based upon the Company’s historical volatility rates. These assumptions are inherently uncertain. Different assumptions and judgments would affect our calculation of the fair value of the underlying ordinary shares for the options granted, and the valuation results and the amount of share-based compensation would also vary accordingly.
For further discussion on our share-based employee compensation plans see “Item 5.E6.E — OperatingDirectors, Senior Management and Financial Review and ProspectsEmployees — Share Ownership.”
Taxes
As a company incorporated in the Cayman Islands, we are not subject to taxation in the Cayman Islands..Islands.
Our other subsidiaries are subject to their respective jurisdictions’ income tax laws, including Japan, the United States and Europe. Our income tax obligations to date have been minimal.
Uncertainties exist with respect to the interpretation of complex tax regulations, changes in tax laws, and the amount and timing of future taxable income. Given the wide range of international business relationships and the long-term nature and complexity of existing contractual agreements, differences arising between the actual results and the assumptions made, or future changes to such assumptions, could necessitate future adjustments to tax income and expense already recorded. We established provisions, based on reasonable estimates, for possible consequences of audits by the tax authorities of the respective counties in which it operates. The amount of such provisions is based on various factors, such as experience of previous tax audits and differing interpretations of tax regulations by the taxable entity and the responsible tax authority. Such differences of interpretation may arise on a wide variety of issues depending on the conditions prevailing in the respective domicile of us.
Deferred tax assets are recognized for unused tax losses to the extent that it is probable that taxable profit will be available against which the losses can be utilized. Significant management judgment is required to determine the amount of deferred tax assets that can be recognized, based upon the likely timing and the level of future taxable profits together with tax planning strategies.
A deferred tax asset of US$1.80.4 million and US$0.4 millionnil has been recognized in our consolidated statement of financial position as of December 31, 20112012 and 2012,2013, respectively, in relation to unused tax losses. The realizability of the deferred tax asset mainly depends on whether sufficient profits or taxable temporary differences will be available in the future. In cases where the actual future profits generated are less than expected, a material reversal of deferred tax assets may arise, which would be recognized in profit or loss for the period in which such a reversal takes place. For further details on taxes see “Note 109 to Consolidated Financial Statements”.
Fair value of financial instrumentsmeasurements and valuation processes
WhenSome of our assets and liabilities are measured at fair value for financial reporting purposes.
In estimating the fair value of financial assets and financial liabilities recorded inan asset or a liability, we use market-observable data to the statement of financial position cannot be derived from active markets, theirextent it is available. Where Level 1 inputs are not available, we engage third party qualified appraisers to perform the valuation.
We use valuation techniques that include inputs that are not based on observable market data to estimate the fair value is determined using valuation techniques including the discounted cash flow model. The inputs to these models are taken from observable markets where possible, but where this is not feasible, a degree of judgment is required in establishing fair values. The judgments include considerations of inputs such as liquidity risk, credit risk and volatility. Changes in assumptions about these factors could affect the reported fair valuecertain types of financial instruments.
Impairment of trade and other receivable
We assess at the end of each reporting period whether there is any objective evidence that trade and other receivable are impaired. To determine whether there is objective evidence of impairment, we consider factors such as the probability of insolvency or significant financial difficulties of the debtor and default or significant delay in payments.
When there is objective evidence of impairment loss, we take into consideration the estimation of future cash flows. The amount of the impairment loss is measured as the difference between the asset’s carrying amount and the present value of estimated future cash flows (excluding future credit losses that have not been incurred) discounted at the financial asset’s original effective interest rate (that is, the effective interest rate computed at initial recognition). Where the actual future cash flows are less than expected, a material impairment loss may arise.
Foreign Currency Fluctuations
Our revenue, expenses, and capital expenditures are primarily transacted in U.S. dollars. We also enter into transactions in other currencies. We are primarily exposed to changes in exchange rates for the Euro, the Japanese Yen, and RMB. Accordingly, we are affected by fluctuations in exchange rates between the U.S. dollar and each of the Japanese Yen, the Euro and the RMB. See “Item 3.D — Key Information - Risk Factors — Risks Related to Conducting Operations in China — Devaluation or appreciation in the value of the Renminbi or restrictions on convertibility of the Renminbi could adversely affect our operating results” and “Risk Factors - Risks Related to Our Financial Condition and Business — Exchange rate fluctuations could increase our costs, which could adversely affect our operating results and the value of our ADSs” for a discussion of the effects on our company of fluctuating exchange rates and “Item 11 — Quantitative and Qualitative Disclosures About Market Risk — Foreign Exchange Rate Fluctuation Risk” for a discussion of our efforts to minimize such risks”.
Recent Accounting Pronouncements
We have not early adopted the following new and revised standards, amendments or interpretations that have been issued but are not yet effective:
IFRS 9 Financial Instruments
IFRS 9, issued in November 2009, introduced new requirements for the classification and measurement of financial assets. IFRS 9 was amended in October 2010 to include requirements for the classification and measurement of financial liabilities and for derecognition.
Key requirements of IFRS 9:
All recognized financial assets that are within the scope of IAS 39 Financial instruments: Recognition and measurement to be subsequently measured at amortized cost or fair value. Specifically, debt investments that are held within a business model whose objective is to collect the contractual cash flows, and that have contractual cash flows that are solely payments of principal and interest on the principal outstanding are generally measured at amortized cost at the end of subsequent accounting periods. All other debt investments and equity investments are measured at their fair value at the end of subsequent accounting periods. In addition, under IFRS 9, entities make an irrevocable election to present subsequent changes in the fair value of an equity investment (that is not held for trading) in other comprehensive income, with only dividend income generally recognized in profit or loss.
With regard to the measurement of financial liabilities designated as at fair value through profit or loss, IFRS 9 requires that the amount of change in the fair value of the financial liabilities that is attributable to changes in the credit risk of that liability, is presented in other comprehensive income, unless the recognition of the effects of changes in the liability’s credit risk in other comprehensive income would create or enlarge an accounting mismatch in profit or loss. Changes in fair value attributable to a financial liability’s credit risk are not subsequently reclassified to profit or loss. Under IAS 39, the entire amount of the change in the fair value of the financial liability designated as fair value through profit or loss was presented in profit or loss.
IFRS 9 is effective for annual periods beginning on or after January 1, 2015, with earlier application permitted. We anticipate that the application of IFRS 9 in the future may have a significant impact on amounts reported in respect of our financial assets (e.g. our equity instruments that are currently classified as available-for-sale investments measured at cost will have to be measured at fair value at the end of subsequent reporting periods). However, it is not practicable to provide a reasonable estimate of the effect of IFRS 9 until a detailed review has been completed.
NewAmendments to IFRS 10, IFRS 12 and revised Standards on consolidation, joint arrangements, associates and disclosuresIAS 27 Investment Entities
In May 2011, a package of five Standards consolidation, joint arrangements, associates and disclosures were issued, includingThe amendments to IFRS 10 IFRS 11, IFRS 12, IAS 27 (as reviseddefine an investment entity and require a reporting entity that meets the definition of an investment entity not to consolidate its subsidiaries but instead to measure its subsidiaries at fair value through profit or loss in 2011)its consolidated and IAS 28 (as revised in 2011).separate financial statements.
Key requirements of these five Standards are described below:
IFRS 10 replaces the parts of IAS 27 Consolidated and Separate Financial Statements that dealt with consolidated financial statements. SIC-12 Consolidation — Special Purpose Entities will be withdrawn upon the effective date of IFRS 10. Under IFRS 10, thereTo qualify as an investment entity, a reporting entity is only one basis for consolidation, that is, control. In addition, IFRS 10 includes a new definition of control that contains three elements: (a) power over an investee, (b) exposure, or rights, to variable returns from its involvement with the investee, and (c) the ability to use its power over the investee to affect the amount of the investor’s return. Extensive guidance has been added in IFRS 10 to deal with complex scenarios.required to:
50·Obtain funds from one or more investors for the purpose of providing them with professional investment management services.
·Commit to its investor(s) that its business purpose is to invest funds solely for returns from capital appreciation, investment income, or both.
·Measure and evaluate performance of substantially all of its investments on a fair value basis.
Consequential amendments have been made to IFRS 12 and IAS 27 to introduce new disclosure requirements for investment entities.
As of December 31, 2013, we do not anticipate that the investment entities amendments will have any effect on the Company’s consolidated financial statements as the Company is not an investment entity.
IFRS 12 is a disclosure standard and is applicable to entities that have interests in subsidiaries, joint arrangements, associates and/or unconsolidated structured entities. In general, the disclosure requirements in IFRS 12 are more extensive than those in the current standards.
In June 2012, the amendments to IFRS 10, IFRS 11 and IFRS 12 were issued to clarify certain transitional guidance on the application of these IFRSs for the first time.
These five standards together with the amendments regarding the transition guidance are effective for annual periods beginning on or after January 1, 2013, with earlier application permitted provided all of these standards are applied at the same time. We anticipate that the application of these five standards will not have a significant impact on amounts reported in the consolidated financial statements.
IFRS 13 Fair Value Measurement
IFRS 13 establishes a single source of guidance for fair value measurements and disclosures about fair value measurements. The standard defines fair value, establishes a framework for measuring fair value, and requires disclosures about fair value measurements. The scope of IFRS 13 is broad; it applies to both financial instrument items and non-financial instrument items for which other IFRS literature requires or permits fair value measurements and disclosures about fair value measurements, except on specified circumstances. In general, the disclosure requirements in IFRS 13 are more extensive than those required in the current standards. For example, quantitative and qualitative disclosures based on the three-level fair value hierarchy currently required for financial instruments only under IFRS 7 Financial Instruments: Disclosures will be extended by IFRS 13 to cover all assets and liabilities within its scope.
IFRS 13 is effective for annual periods beginning on or after January 1, 2013, with earlier application permitted. We anticipate that the application of the new standard may not have significant impact to the amounts reported in the financial statements, but may result in more extensive disclosure.
Amendments to IFRS7 and IAS32IAS 32 Offsetting Financial Assets and Financial Liabilities and the related disclosures
The amendments to IAS 32 clarify existing application issuesthe requirements relating to the offset of financial assets and financial liabilities requirements.liabilities. Specifically, the amendments clarify the meaning of ‘currently has a legally enforceable right of set-off’ and ‘simultaneous realization and settlement’.
The amendments to IFRS 7 require entities to disclose information about rights of offset and related arrangements (such as collateral posting requirements) for financial instruments under an enforceable master netting agreement or similar arrangement.
The amendments to IFRS 7 are effective for annual periods beginning on or after January 1, 2013 and interim periods within those annual periods. The disclosures should be provided retrospectively for all comparative periods. However, the amendments to IAS 32 areWe do not effective until annual periods beginning on or after January 1, 2014, with retrospective application required.
We anticipate that the application of these amendments to IAS32 and IFRS7 may result in more disclosures being made with regard to offsettingIAS 32 will have a significant impact on our consolidated financial statements as we do not have any financial assets and financial liabilities in the future.that qualify for offset.
Amendments to IAS 3236 Recoverable Amount Disclosures for Non-Financial Assets
The amendments to IAS 32 clarify that income tax relating36 remove the requirement to distributionsdisclose the recoverable amount of a cash generating unit (CGU) to holderswhich goodwill or other intangible assets with indefinite useful lives had been allocated when there has been no impairment or reversal of impairment of the related CGU. Furthermore, the amendments introduce additional disclosure requirements regarding the fair value hierarchy, key assumptions and valuation techniques used when the recoverable amount of an equity instrument and to transactionasset or CGU was determined based on its fair value less costs of an equity transaction should be accounted for in accordance with IAS 12 Income Tax. disposal.
We do not anticipate that the application of these amendments to IAS 3236 will have noa significant impact on the Company’s consolidated financial statements.
Amendments to IAS 39 Novation of Derivatives and Continuation of Hedge Accounting
The amendments to IAS 39 provide relief from the requirement to discontinue hedge accounting when a derivative hedging instrument is novated under certain circumstances. The amendments also clarify that any change to the fair value of the derivative hedging instrument arising from the novation should be included in the assessment of hedge effectiveness.
We do not anticipate that the application of these amendments to IAS 39 will have any effect on ourthe Company’s consolidated financial statements as wethe Company does not have already adopted this treatment.any derivatives that are subject to novation.
Incentives from the Chinese government
The chart below sets forth a brief summary of the material incentives received by our Chinese subsidiaries as qualified integrated circuit production enterprises (ICPE) from the Chinese government. Our Shanghai, Beijing, and Tianjin subsidiaries are qualified as ICPEs under the Integrated Circuit Policies. Under these policies, ICPEs whose total investment exceeds RMB8,000 million (approximately $1,095US$1,095 million) or whose integrated circuits have a line width of less than 0.25 micron are entitled to the benefits listed below. For a more detailed discussion of these incentives, see “Item 4.B-Information on the Company—Business Overview —Regulation.”
Incentive | SMIC Shanghai; SMIC Beijing and SMIC Tianjin | |
|
| |
Preferential Enterprise Income Tax Policies |
| Five-year full exemption and five-year 50% reduction upon approval from the local tax bureau |
|
| |
Preferential Customs Duties and Import-related VAT Policies |
| Exemption from customs duties and imported-related VAT with respect to its qualified spare parts, and raw materials pursuant to the Tax-Exemption Categories. |
Our Shanghai, Beijing and Tianjin subsidiaries fall under the encouraged foreign investment industries catalogue for the Guidance58
Operating Results
The following table sets forth a summary of our consolidated results of operations for the periods indicated. We believe that period-to-period comparisons of results of operations should not be relied upon as indicative of future performance.
|
| For the year ended December 31, |
| |||||||
|
| 2011 |
| 2012 |
| 2013 |
| |||
|
| (in US$ thousands, except for earnings per share) |
| |||||||
Revenue |
| 1,319,466 |
| 1,701,598 |
| 2,068,964 |
| |||
Cost of sales |
| (1,217,525 | ) | (1,352,835 | ) | (1,630,528 | ) | |||
Gross profit |
| 101,941 |
| 348,763 |
| 438,436 |
| |||
Research and development expenses |
| (191,473 | ) | (193,569 | ) | (145,314 | ) | |||
Sales and marketing expenses |
| (32,559 | ) | (31,485 | ) | (35,738 | ) | |||
General and administration expenses |
| (57,435 | ) | (107,313 | ) | (138,167 | ) | |||
Other operating income (expense) |
| (11,190 | ) | 19,117 |
| 67,870 |
| |||
Profit (loss) from operations |
| (190,716 | ) | 35,513 |
| 187,087 |
| |||
Interest income |
| 4,724 |
| 5,390 |
| 5,888 |
| |||
Finance costs |
| (21,903 | ) | (39,460 | ) | (34,392 | ) | |||
Foreign exchange gains or losses |
| 17,589 |
| 3,895 |
| 13,726 |
| |||
Other gains or losses |
| 6,709 |
| 6,398 |
| 4,010 |
| |||
Share of profits of associates |
| 4,479 |
| 1,703 |
| 2,278 |
| |||
Profit (loss) before tax |
| (179,118 | ) | 13,439 |
| 178,597 |
| |||
Income tax benefit (expense) |
| (82,503 | ) | 9,102 |
| (4,130 | ) | |||
Profit (loss) for the year from continuing operations |
| (261,621 | ) | 22,541 |
| 174,467 |
| |||
Discontinued operations |
|
|
|
|
|
|
| |||
Profit for the year from discontinued operations |
| 14,741 |
| — |
| — |
| |||
Profit (loss) for the year |
| (246,880 | ) | 22,541 |
| 174,467 |
| |||
Other comprehensive income |
|
|
|
|
|
|
| |||
Exchange differences on translating foreign operations |
| 4,938 |
| 70 |
| 731 |
| |||
Total comprehensive income (expense) for the year |
| (241,942 | ) | 22,611 |
| 175,198 |
| |||
Profit (loss) for the year attributable to: |
|
|
|
|
|
|
| |||
Owners of the Company |
| (246,817 | ) | 22,771 |
| 173,177 |
| |||
Non-controlling interests |
| (63 | ) | (230 | ) | 1,290 |
| |||
|
| (246,880 | ) | 22,541 |
| 174,467 |
| |||
Total comprehensive income (expense) for the year attributable to: |
|
|
|
|
|
|
| |||
Owners of the Company |
| (241,879 | ) | 22,841 |
| 173,908 |
| |||
Non-controlling interests |
| (63 | ) | (230 | ) | 1,290 |
| |||
|
| (241,942 | ) | 22,611 |
| 175,198 |
| |||
Earnings (loss) per share |
|
|
|
|
|
|
| |||
From continuing and discontinued operations |
|
|
|
|
|
|
| |||
Basic |
| $ | (0.01 | ) | $ | 0.00 |
| $ | 0.01 |
|
Diluted |
| $ | (0.01 | ) | $ | 0.00 |
| $ | 0.01 |
|
From continuing operations |
|
|
|
|
|
|
| |||
Basic |
| $ | (0.01 | ) | $ | 0.00 |
| $ | 0.01 |
|
Diluted |
| $ | (0.01 | ) | $ | 0.00 |
| $ | 0.01 |
|
|
| For the year ended December 31, |
| ||||
|
| 2011 |
| 2012 |
| ||
|
| (in US$ thousands, except for earnings per share) |
| ||||
|
|
|
|
|
| ||
Continuing operations |
|
|
|
|
| ||
|
|
|
|
|
| ||
Revenue |
| 1,319,466 |
| 1,701,598 |
| ||
|
|
|
|
|
| ||
Cost of sales |
| (1,217,525 | ) | (1,352,835 | ) | ||
|
|
|
|
|
| ||
Gross Profit |
| 101,941 |
| 348,763 |
| ||
|
|
|
|
|
| ||
Research and development |
| (191,473 | ) | (193,569 | ) | ||
|
|
|
|
|
| ||
Sales and marketing expenses |
| (32,559 | ) | (31,485 | ) | ||
|
|
|
|
|
| ||
General and administration expenses |
| (57,435 | ) | (107,313 | ) | ||
|
|
|
|
|
| ||
Impairment loss on property, plant and equipment |
| (17,691 | ) | — |
| ||
|
|
|
|
|
| ||
Finance costs |
| (21,903 | ) | (39,460 | ) | ||
|
|
|
|
|
| ||
Interest income |
| 4,724 |
| 5,390 |
| ||
|
|
|
|
|
| ||
Other income |
| 13,718 |
| 6,190 |
| ||
|
|
|
|
|
| ||
Other gains or losses |
| 17,081 |
| 23,220 |
| ||
|
|
|
|
|
| ||
Share of profits of associates |
| 4,479 |
| 1,703 |
| ||
|
|
|
|
|
| ||
Profit (loss) before tax |
| (179,118 | ) | 13,439 |
| ||
|
|
|
|
|
| ||
Income tax benefit (expense) |
| (82,503 | ) | 9,102 |
| ||
|
|
|
|
|
| ||
Profit (loss) for the year from continuing operations |
| (261,621 | ) | 22,541 |
| ||
|
|
|
|
|
| ||
Discontinued operations |
|
|
|
|
| ||
|
|
|
|
|
| ||
Profit for the year from discontinued operations |
| 14,741 |
| — |
| ||
|
|
|
|
|
| ||
Profit (loss) for the year |
| (246,880 | ) | 22,541 |
| ||
|
|
|
|
|
| ||
Other comprehensive income |
|
|
|
|
| ||
|
|
|
|
|
| ||
Exchange differences on translating foreign operations |
| 4,938 |
| 70 |
| ||
|
|
|
|
|
| ||
Total comprehensive income (expense) for the year |
| (241,942 | ) | 22,611 |
| ||
|
|
|
|
|
| ||
Profit (loss) for the year attributable to: |
|
|
|
|
| ||
|
|
|
|
|
| ||
Owners of the Company |
| (246,817 | ) | 22,771 |
| ||
|
|
|
|
|
| ||
Non-controlling interests |
| (63 | ) | (230 | ) | ||
|
|
|
|
|
| ||
|
| (246,880 | ) | 22,541 |
| ||
|
|
|
|
|
| ||
Total comprehensive income for the year attributable to: |
|
|
|
|
| ||
|
|
|
|
|
| ||
Owners of the Company |
| (241,879 | ) | 22,841 |
| ||
|
|
|
|
|
| ||
Non-controlling interests |
| (63 | ) | (230 | ) | ||
|
|
|
|
|
| ||
|
| (241,942 | ) | 22,611 |
| ||
|
|
|
|
|
| ||
Earnings per share |
|
|
|
|
| ||
|
|
|
|
|
| ||
From continuing and discontinued operations |
|
|
|
|
| ||
|
|
|
|
|
| ||
Basic |
| $ | (0.01 | ) | $ | 0.00 |
|
|
|
|
|
|
| ||
Diluted |
| $ | (0.01 | ) | $ | 0.00 |
|
|
|
|
|
|
| ||
From continuing operations |
|
|
|
|
| ||
|
|
|
|
|
| ||
Basic |
| $ | (0.01 | ) | $ | 0.00 |
|
|
|
|
|
|
| ||
Diluted |
| $ | (0.01 | ) | $ | 0.00 |
|
SalesRevenue
We generate our sales primarily from fabricating semiconductors. We also derive a relatively small portion of our sales from the mask-making, wafer probing, and other services that we perform for third parties separately from our foundry services.
In 2012,2013, fabless semiconductor companies accounted for 87.81%87.7%, IDMs accounted for 8.35%6.2% and systems and other companies accounted for 3.84%6.1%, respectively, of our sales. Although we are not dependent on any single customer, aA significant portion of our net sales is attributable to a relatively small number of our customers. In 2011, 2012, and 20122013 our five largest customers accounted for approximately 49.3%, 56.0% and 56.0%52.3%, respectively of our sales, respectively. Given our limited scale, relative to the industry, the effect of seasonality is lessened and customer satisfaction plays a larger role in sales.
Cost of sales
Our cost of sales consists principally of:
· depreciation and amortization;
· overhead, including maintenance of production equipment, indirect materials, including chemicals, gases and various types of precious and other metals, utilities and royalties;
· direct materials, which consist of raw wafer costs;
· labor, including share-based compensation expenses for employees directly involved in manufacturing activities; and
· production support, including facilities, utilities, quality control, automated systems and management functions.
Income (expenses) and gaingains (loss) from continuing operations
· Research and development expenses. Research and development expenses consist primarily of salaries and benefits of research and development personnel, materials costs, depreciation and maintenance on the equipment used in our research and development efforts, contracted technology development costs, and the costs associated with the ramp-up of new fabs. Research and development expenses are partially offset by related government subsidies.fundings.
· General and administrative expenses. General and administrative expenses consist primarily of salaries and benefits for our administrative support, finance and human resource personnel, bonuses for employee, commercial insurance, fees for professional services, city maintenance and construction tax expenses, educational surtax expenses and bad debt expenses.
· Selling and marketing expenses. Selling and marketing expenses consist primarily of salaries and benefits of personnel engaged in sales and marketing activities, costs of customer wafer samples, other marketing incentives and related marketing expenses.
54·Other operating income (loss). Other operating income (loss) consist primarily of gains or loss arising from disposal of our living quarters, gains or loss arising from disposal of subsidiaries and impairment loss of long-lived assets.
Finance cost
Our finance costs consist of:
· interest expenses, net of capitalized portions and government interest subsidies,fundings, which have been primarily attributable to our bank loans and the imputed interest rate on an outstanding interest-free promissory note; and
· accretion of interest to preferred shareholders of subsidiaries.
Other gains or losses
Our other gains or losses mainly consist of:
· gains and losses on disposal of property, plantfrom our schools, kindergartens and equipment;living quarters; and
· foreign exchange gains and losses relating to financing and investing activities, including forward contracts.the payment of land idling tax charged by the local government in 2013.
Comparison of the Years Ended December 31, 2011, 2012 and 20122013
Year Ended December 31, 2013 Compared to Year Ended December 31, 2012
SalesRevenue
Revenue increased by 21.6% from US$1,701.6 million for 2012 to US$2,069.0 million for 2013, primarily due to successful ramping up of Shanghai 12-inch fab in 2013 and a significant increase in China sales. For the full year of 2013, the overall wafer shipments were 2,574,119 units of 8-inch equivalent wafers, up 16.1% from the prior year.
The average selling price of the wafers we shipped increased from US$767 per wafer in 2012 to US$804 in 2013. The percentage of wafer revenues from advanced 40/45 technologies increased from 1.1% in 2012 to 12.1% in 2013.
Cost of sales and gross profit
Cost of sales increased from US$1,352.8 million for 2012 to US$1,630.5 million for 2013, primarily due to the increase of advanced node shipment with higher production cost. Out of the total cost of sales, US$474.8 million and US$403.0 million were attributable to depreciation and amortization for the years ended December 31, 2013 and 2012, respectively.
Our gross profit was US$438.4 million for 2013 compared to US$348.8 million in 2012, representing an increase of 25.7%. Gross margin was 21.2% in 2013 compared to 20.5% in 2012. The increase in gross margin was primarily due to higher overall utilization in 2013.
Profit for the year from operations
Profit from operations increased from US$35.5 million for the year ended December 31, 2012 to US$187.1 million for the year ended December 31, 2013 primarily due to 1) shipment increase and high utilization in 2013, 2) Shanghai 12- inch fab successfully ramping up and reducing per wafer cost, 3) increase of fab efficiency and cost saving, 4) gain arising from the disposal of part of the living quarters in Shanghai, and 5) gain arising from the disposal of our total ownership interest in SMIC (Wuhan) Development Corporation (“WHDM”) which was mainly engaged in the construction, operation and management of our living quarters and schools in Wuhan.
Research and development expenses decreased by 24.9% from US$193.6 million for the year ended December 31, 2012 to US$145.3 million for the year ended December 31, 2013. The decrease was mainly due to the Shanghai 12-inch fab commencing volume production in the fourth quarter of 2012 after which the related fab expense was recorded in cost of sales.
General and administrative expenses increased by 28.8% from US$107.3 million for the year ended December 31, 2012 to US$138.2 million for the year ended December 31, 2013. The increase was primarily due to an increase in employee bonus, city maintenance and construction tax expenses and extra charges for education in 2013.
Sales and marketing expenses increased by 13.5% from US$31.5 million for the year ended December 31, 2012 to US$35.7 million for the year ended December 31, 2013. The increase was primarily due to an increase in employee bonus.
Other operating income was US$67.9 million and US$19.1 million for the year ended December 31, 2013 and 2012, respectively, and the increase was due to 1) the gains arising from the disposal of part of our living quarters in Shanghai, 2) the gains arising from the disposal of our total ownership interest in WHDM which was mainly engaged in the construction, operation and management of our living quarters and schools in Wuhan and 3) the gain arising from the deconsolidation of Brite Semiconductor Corporation and its subsidiaries, or Brite due to loss of control.
As a result, our profit from operations was US$187.1 million for the year ended December 31, 2013 compared to US$35.5 million for the year ended December 31, 2012.
Disposal of SMIC (Wuhan) Development Corporation
In 2013, we entered into a sale agreement with a third-party buyer to dispose of our 100% equity interest in WHDM. The disposal was completed on May 23, 2013, on which date we lost control of WHDM. The amount of the consideration was US$60.4 million and we recorded a gain of US$28.3 million. The consideration was fully settled by the buyer on July 26, 2013. WHDM was mainly engaged in the construction, operation and management of our living quarters and schools in Wuhan, which was not our major line of business. Therefore, the disposal of WHDM was not classified as a discontinued operation.
Deconsolidation of Brite Semiconductor Corporation and Its Subsidiaries
On December 30, 2013, all the directors of Brite, a company in which we hold a 48.7% equity interest, adopted and approved by unanimous written consent the amended and restated articles of association, the amended and restated investor rights agreement and the amended and restated voting agreement of Brite. As a result, we lost control of Brite but still have significant influence over it. There was no cash consideration associated with this change. We recorded our ownership interest of Brite as investment in associate and recognized a deconsolidation gain due to loss of control of US$5.4 million. Brite is mainly engaged in design service, which is not our major line of business. Therefore, the deconsolidation of Brite due to loss of control was not classified as a discontinued operation.
Profit for the Year
Due to the factors described above, we recorded a profit of US$174.5 million in 2013 compared to US$22.5 million in 2012.
Year Ended December 31, 2012 Compared to Year Ended December 31, 2011
Revenue
Revenue increased by 29.0% from US$1,319.5 million for 2011 to US$1,701.6 million for 2012, primarily due to an increase in overall wafer shipments. For the full year of 2012, the overall wafer shipments were 2,217,287 units of 8-inch equivalent wafers, up 30.2% year-on-year.from the prior year.
The average selling price of the wafers we shipped decreased from US$775 per wafer in 2011 to US$767 in 2012. The percentage of wafer revenues from advanced technologies, 90nm and below increased from 28.4% to 41.7% between these two years.
Cost of sales and gross profit (loss)
Cost of sales increased by 11.1% from US$1,217.5 million for 2011 to US$1,352.8 million for 2012, primarily due to an increase in overall wafer shipments..shipments. Out of the total cost of sales US$403.0 million and US$415.6 million was attributable to depreciation and amortization for the years ended December 31, 2012 and 2011, respectively.
Our gross profit was US$348.8 million for 2012 compared to US$101.9 million in 2011. Gross margins were 20.5% in 2012 compared to 7.7% in 2011. The increase in gross margins was primarily due to an increase in the production volume which resulted in higher in revenues and utilization improvement.
Profit (loss) for the year from continuing operations
ExpensesProfit (loss) from continuing operations increased by 19.3%improved from US$281.1(190.7) million for the year ended December 31, 2011 to US$335.335.5 million for the year ended December 31, 2012 primarily due to 1) an increase in generalthe production volume which resulted in higher revenues and administrative expensesutilization improvements, 2) the gains arising from the disposal of part of our living quarters in 2012.Shanghai during 2012 and 3) the impairment loss of long-lived assets in 2011.
Research and development expenses increased only by 1% from US$191.5 million for 2011 to US$193.6 million for 2012.
General and administrative expenses increased by 86.8% from US$57.4 million for 2011 to US$107.3 million for 2012. The increase is primarily due to an increase in employee bonus, city maintenance and construction tax expenses and extra charges for education in 2012. In addition, in 2011, the Company settled certain disputes with respective third party debtors by entering into contractually binding agreements which legally released the Company from certain obligations totaling $19.0 million. The forgiveness of debt has been recorded as a reduction of general and administrative expense and other income respectively. In addition, the recovery of bad debt expense of $6.4 million and $2.0 million was recorded as a reduction of general and administrative expense for the year ended December 31, 2011 and 2012, respectively.
Sales and marketing expenses decreased by 3.4% from US$32.6 million for 2011 to US$31.5 million for 2012 due to more effective market promotion activities.
Other gains increased by 35.9% fromoperating income (expense) was US$17.119.1 million and US$(11.2) million for the year ended December 31, 2012 and 2011, to US$23.2 million for 2012 primarilyrespectively, and the improvement was due to a gain of US$19.4 million1) the gains arising from the disposal of part of theour living quarters in Shanghai during 2012 and a US$13.7 million decline in foreign exchange gain in 2012.
Other income decreased by 54.7% from US$13.7 million for 2011 to US$6.2 million for 2012 due to we settled certain dispute with a third party debtor by entering into contractually binding agreement which legally released us from certain obligations2) the impairment loss of long-lived assets in 2011.
As a result, our profit (loss) from continuing operations was US$22.535.5 million and (US$261.6)for the year ended December 31, 2012 compared to US$(190.7) million in 2012 and 2011 respectively.for the year ended December 31, 2011.
Discontinued Operations
On March 1, 2011, we sold our majority ownership interest in Semiconductor Manufacturing International (AT) Corporation (“AT”) and deconsolidated the entity. As a result, all previously issued preferred securities by AT were cancelled. We retained a 10% interest in AT and account for such investment as available-for-sale investments as we no longer have a controlling financial interest nor significant influence over AT. We reported the results of the AT as a discontinued operation in the condensed consolidated statements of comprehensive income. No cash or other consideration was received by the Companyus in conjunction with the disposition.
We recorded a gain of $17.1 million on the deconsolidation of AT equal to the difference between (i) the sum of (a) the fair value of the retained noncontrolling investments in AT, and (b) the carrying amount of the aforementioned noncontrolling interest in AT, and (ii) the carrying amount of AT’s assets and liabilities. Income from discontinued operations of $14.7 million represents both the results of operations of AT for the period from January 1, 2011 to the date it was deconsolidated and the gain on deconsolidation of AT.
Profit (Loss) for the Year
Due to the factors described above, we recorded a profit of US$22.5 million in 2012 compared to a loss of US$246.9 million in 2011.
B. Liquidity and Capital Resources
We anticipate our working capital to be sufficient for our present requirements. We will require access to significant capital to fund our future capital expenditures and capacity expansion requirements, which are difficult to plan in the rapidly changing semiconductor manufacturing industry. We anticipate our working capital is sufficient for our present requirements. In 2012,2013, we entered into a subscription agreement in respect of the issue of US$200 million zero coupon convertible bonds. SMIC Shanghai entered into the new syndicate loan, a three-year loan facility in the principal amount of US$268 million with 9 banks, and a new two-year loan facility in the principal amount of US$70 million with The Export- Import Bank of China. SMIC Beijing entered into the new syndicate loan, a seven-year loan facility in the aggregate principal amount of US$600470 million with 5 banks, andfive banks. SMIC Beijing entered into a two-yearnew USD loan, a twenty-six- month working capital loan facility in the principal amount of US$3060 million with The Export-Import Bank of China. We anticipate that the cash flows from operations in 20132014 and the proceeds from the new loans shouldand the convertible bonds issued will be sufficient to meet our capital expenditureexpenditures requirement. If necessary, we will also explore other forms of external financing. Further, while there can be no assurance that we will enter into the BJ Joint Venture, we expect that this project would require us to incur significant capital expenditures during its start-up phase, and from time to time thereafter, and that we would need to borrow under our existing credit lines or otherwise obtain additional capital to satisfy our funding obligations under this project.
The following table sets forth a condensed summary of our statements of cash flows for the periods indicated:
|
| For the Years Ended December 31, |
| |||||||||
|
| 2011 |
| 2012 |
|
| For the Years Ended December 31, |
| ||||
|
| (in US$ thousands) |
|
| 2011 |
| 2012 |
| 2013 |
| ||
|
|
|
|
|
|
|
|
| (in US$ thousands) |
| ||
Cash Flow Data: |
|
|
|
|
|
|
|
|
|
|
|
|
|
|
|
|
|
| |||||||
Profit (loss) for the year |
| (246,880 | ) | 22,541 |
|
| (246,880 | ) | 22,541 |
| 174,467 |
|
|
|
|
|
|
| |||||||
Non-cash adjustment to reconcile profit (loss) to net operating cash flow: |
|
|
|
|
| |||||||
|
|
|
|
|
| |||||||
Non-cash adjustment to reconcile profit to net operating cash flow: |
|
|
|
|
|
|
| |||||
Depreciation and amortization |
| 551,857 |
| 566,899 |
|
| 551,857 |
| 566,899 |
| 546,910 |
|
|
|
|
|
|
| |||||||
Net cash from operating activities |
| 379,368 |
| 435,166 |
|
| 379,368 |
| 435,166 |
| 738,016 |
|
|
|
|
|
|
| |||||||
Payments for property, plant and equipment |
| (931,574 | ) | (400,291 | ) |
| (931,574 | ) | (400,291 | ) | (650,160 | ) |
|
|
|
|
|
| |||||||
Net cash used in investing activities |
| (903,641 | ) | (522,277 | ) |
| (903,641 | ) | (522,277 | ) | (807,467 | ) |
|
|
|
|
|
| |||||||
Net cash from financing activities |
| 268,855 |
| 184,101 |
|
| 268,855 |
| 184,101 |
| 173,458 |
|
|
|
|
|
|
| |||||||
Net increase (decrease) in cash and cash equivalents |
| (255,418 | ) | 96,990 |
|
| (255,418 | ) | 96,990 |
| 104,007 |
|
Operating Activities
As of December 31, 2013, we had US$462.5 million in cash and cash equivalents. These cash and cash equivalents were held in the form of United States dollars, Japanese Yen, Euros, and Renminbi. Our net cash provided by operating activities in 2013 was US$738.0 million, which was primarily due to the net profit of US$174.5 million, an increase of US$33.4 million in trade and other receivables and the add-back of US$546.9 million in depreciation and amortization.
As of December 31, 2012, we had US$358.5 million in cash and cash equivalents. These cash and cash equivalents were held in the form of United States dollars, Japanese Yen, Euros, and Renminbi. Our net cash provided by operating activities in 2012 was US$435.2 million, which was primarily due to the net profit of US$22.5 million, an increase of US$112.4 million in trade and other receivables, an increase of US$93.3 million in inventories and the add-back of US$566.9 million in depreciation and amortization.
As of December 31, 2011, we had US$261.6 million in cash and cash equivalents. These cash and cash equivalents were held in the form of United States dollars, Japanese Yen, Euros, and Renminbi. Our net cash provided by operating activities in 2011 was US$379.4 million, which was primarily due to the net loss of US$246.9 million, a decrease of US$73.1 million in trade and other receivables, an increase of US$60.2 million in restrictionrestricted cash, an increase of US$41.2 million in prepaid operating expense, and the add-back of US$551.9 million in depreciation and amortization.
Investing Activities
Our net cash used in investing activities was US$807.5 million in 2013, US$522.3 million in 2012 and US$903.6 million in 2011. These amounts were primarily attributable to purchases of plant and equipment for our fabs in Shanghai, Beijing and Tianjin.
Financing Activities
Our net cash from financing activities in 2013 was US$173.5 million. This was primarily derived from US$905.1 million in the proceeds from borrowings, US$1,008.7 million in the repayment of borrowings, US$195.7 million in the proceeds from issuance of convertible bonds, US$108.0 million in the capital contribution from non-controlling interest and US$30.0 million in the repayment of promissory notes.
Our net cash from financing activities in 2012 was US$184.1 million. This was primarily derived from US$1,541.5 million in the proceeds from borrowings, US$1,328.0 million in the repayment of borrowings US$0.7 million in the proceeds from exercise of employee stock options and US$30.0 million in the repayment of promissory notes.
Our net cash from financing activities in 2011 was US$268.9 million. This was primarily derived from US$308.3 million in the proceeds from issuance of convertible preferred shares, US$1,326.4 million in proceeds from borrowings, US$1,339.3 million in the repayment of borrowings US$3.5 million in the proceeds from exercise of employee stock options and US$30.0 million in the repayment of promissory notes.
Capital Expenditures
We incurred capital expenditures of US$765 million, US$499 million and US$499770 million in 2011, 2012 and 2012,2013, respectively. We currently expect our capital expenditures in 20132014 for foundry operations willto be approximately US$600880 million, subject to adjustment based on market conditions, principally to expandof which around US$570 million is for SMNC, our majority owned subsidiary in Beijing, which is 55% funded by the Company and 45% funded by the other shareholders of the entity. In addition, we have budgeted approximately US$110 million as the 2014 capital expenditures for non-foundry operations at 300mm fabs in Shanghai and Beijing.mainly for the construction of living quarters for employees as part of our employee retention program. We plan to finance our substantial capital expenditure requirements through funds generated from a combination of cash from operations, bank borrowing, and debt or equity issuances. Our estimated 2013 capital expenditures do not account for additional expenditures that we may incur in connection with the establishment of the BJ Joint Venture. While there can be no assurance that we will enter into the BJ Joint Venture, we expect that this project would require us to incur significant capital expenditures during its start-up phase, and from time to time thereafter, and that we would need to borrow under our existing credit lines or otherwise obtain additional capital to satisfy our funding obligations under this project.
The construction in progress balance of approximately US$377.4472.7 million as of December 31, 2012,2013, primarily consisted of US$78.7130.5 million and US$146.6208.7 million of the manufacturing equipment acquired to further expand the production capacity at the 300mm12-inch fabs in ShanghaiBeijing and Beijing,Shanghai, respectively, and $91.9$102.1 million related to the ongoing 8”8-inch wafer construction project at Semiconductor Manufacturing International (Shenzhen) Corporation. Our Shenzhen project which commenced in 2008 has progressed more slowly than expected due to changing market conditions and ongoing negotiations with relevant parties. We purchased US$10.6 million facilities and equipment in 2013 in preparation for the Shenzhen project. We will closely monitor the progress of the project and evaluate any additional costs to complete the project. In addition, US$60.231.4 million was related tospent on various ongoing capital expenditureexpenditures projects of other SMIC subsidiaries, which are expected to be completed by the second half of 2013.2014.
Any transfer of funds from our company to our Chinese subsidiaries, either as a shareholder loan or as an increase in registered capital, is subject to registration or approval of Chinese governmental authorities, including the relevant administration of foreign exchange and/or the relevant examining and approval authority. In addition, it is not permitted under Chinese law for our Chinese subsidiaries to directly lend money to each other. Therefore, it is difficult to change our capital expenditure plans once the relevant funds have been remitted from our company to our Chinese subsidiaries. These limitations on the free flow of funds between us and our Chinese subsidiaries could restrict our ability to act in response to changing market conditions and reallocate funds from one Chinese subsidiary to another in a timely manner.
Commitments
As of December 31, 2012,2013, we had commitments of US$25.6114.9 million for facilities construction obligations in connection with the construction of our Shanghai, Beijing and Tianjin facilities. We had commitments of US$481.6178.4 million to purchase machinery and equipment for Shanghai, Beijing, Tianjin and Siltech fabs.SilTech Semiconductor Shanghai Corporation (“SilTech”) fabs and US$10.1 million to purchase intellectual property. For additional information, see “Item 5.A — Operating and Financial Review and Prospects - Operating Results. As of December 31, 2012,2013, our outstanding long-term liabilities primarily consisted of US$713.2721.0 million in secured bank loans, US$50.8 million in unsecured bank loans and US$180.6 million in convertible bonds, which are repayable in installments starting in June 2013,March 2014, with the last payment due in March 2016.2019.
Bank Borrowing
2011 EXIM Bank USD loan (SMIC Shanghai)
In April 2011, Semiconductor Manufacturing International (Shanghai) Corporation (“SMIC ShanghaiShanghai”) entered into the Shanghai EXIM Bank USD loan I, a two-year loan facility in the principal amount of US$69.5 million with The Export-Import Bank of China. This two-year bank facility was used to finance the planned expansion for SMIC Shanghai’s 12-inch fab. SMIC Shanghai repaid the outstanding balance in advance by August 2013. As of December 31, 2012,2013, SMIC Shanghai had drawn down US$69.5 million and repaid US$1 million on this loanno outstanding balance of the facility. The principal amount of $68.5 million will be repayable in June 2013. The interest rate ranged from 4.40%4.0 % to 4.79%5.0% during 2012. The interest expense incurred in 2012 was US$3.4 million, of which US$1.1 million was capitalized as part of the costs of assets under construction in 2012.
The total outstanding balance of the facilities is secured by certain equipment of SMIC Shanghai with an original cost of US$99.6 million as of December 31, 2012.
The Shanghai EXIM Bank USD loan I contains covenants to maintain certain minimum coverage ratio. SMIC Shanghai was in compliance with these covenants as of December 31, 2012.2013.
2012 EXIM Bank USD loan (SMIC Shanghai)
In October 2012, SMIC Shanghai entered into the Shanghai EXIM Bank USD loan II, a new two-year loan facility in the principal amount of US$70 million with The Export-Import Bank of China, which iswas secured by certain equipment of SMIC Shanghai. This two-year bank facility was used to finance the planned expansion for SMIC Shanghai’s 12-inch fab. SMIC Shanghai repaid the outstanding balance in advance by August 2013. As of December 31, 2012,2013, SMIC Shanghai had drawn down US$70 million. The principal amountno outstanding balance of $70 million will be repayable in October 2014.the facility. The interest rate is 4.55%. The interest expense incurred in 2012 was US$0.4 million, of which US$0.1 million was capitalized as part of the costs of assets under construction in 2012.
The Shanghai EXIM Bank USD loan II contains covenantsranged from 4.0% to maintain certain minimum coverage ratio. SMIC Shanghai was in compliance with these covenants as of December 31, 2012.5.0% during 2013.
2012 USD Loan (SMIC Shanghai)
In March 2012, SMIC Shanghai entered into a loan facility in the aggregate principal amount of US$268 million fromwith a consortium of international and Chinese banks. This three-year bank facility iswas used to finance the working capital for SMIC Shanghai’s 8-inch fab. The facility iswas secured by the manufacturing equipment located in the SMIC Shanghai’s 8-inch8- inch fabs, buildings and land use right of SMIC Shanghai. As of December 31, 2012,2013, SMIC Shanghai had drawn down US$245.6268 million and repaid US$67 million on this loan facility. The principal amountoutstanding balance of US$201 million is repayable from September 2013 toby March 2015. The interest rate on this loan facility ranged from 4.03%3.6% to 4.24%4.2% in 2012. The interest expense incurred2013. This syndicate loan contains covenants to maintain certain minimum coverage ratio. SMIC Shanghai was in 2012 was US$7.9 million,compliance with these covenants as of which US$2.4 million was capitalized as part of the cost of assets under construction in 2012.December 31, 2013.
Any of the following in respect of SMIC Shanghai would constitute an event of default during the term of the loan agreement:
1. (Short(Short term loan + Long term Debt Current Portion + Long term Bank Loan) / Total Equity is more than 60%; or
2. (Net(Net profit + Depreciation + Amortization + Income Tax Provision + Financial Expenses) / Financial Expenses is less than 500% before December 31, 2012, and less than 1000% after January 1, 2013; or
3. (Total(Total Equity — Acquired Intangible Assets Net) is less than US$800 million before December 31, 2012, and less than US$1000 million after January 1, 2013; or
4.Debt Service Coverage Ratio is less than 2.0X during the term of the loan repayment. Debt Service Coverage Ratio means trailing four quarters EBITDA (Net Profit + Depreciation + Amortization + Income Tax Provision + Financial Expenses) divided by scheduled repayment of Long Term Loan and related financial expense for all bank borrowings (including hire purchase, leases and other borrowed monies, but not including medium/short term revolving bank loans) for the same period.
SMIC Shanghai was in compliance with these covenants as of December 31, 2012.2013.
20052013 USD Loan (SMIC Beijing)Shanghai)
In May 2005,August 2013, SMIC BeijingShanghai entered into the Beijing USD syndicate loan, a five-year loan facility in the aggregate principal amount of US$600470 million with a syndicate of financial institutions based in the PRC. This seven-year bank facility was used to finance the planned expansion for SMIC Shanghai’s 12-inch fab. The principal amountfacility was secured by the manufacturing equipment located in the SMIC Shanghai 12-inch fabs and buildings of SMIC Shanghai. As of December 31, 2013, SMIC Shanghai had drawn down US$260 million. The outstanding balance of US$260 million is repayable starting from December 2007August 2015 to February 2018. The interest rate on this loan facility ranged from 4.3% to 4.9% in six equal semi-annual installments. On June 26, 2009, SMIC Beijing amended the syndicated loan agreement to defer the commencement2013.
Any of the three remaining semi-annual payments to December 28, 2011. The amendment includes a provision for mandatory early repaymentfollowing in respect of a portionSMIC Shanghai would constitute an event of default during the term of the outstanding balance if SMIC Beijing’s financial performance exceeds certain pre-determined benchmarks. The amendment was accounted for as a modification as the terms of the amended instrument were not substantially different from the original terms. SMIC Beijing made the repayment of remaining outstanding borrowingloan agreement:
1.(Short-term Loans + Long-term Debt Current Portion + Long-term Bank Loans)/Total Equity is more than 70%; or
2.(Net profit + Depreciation + Amortization + Income Tax Provision + Financial Expenses)/Financial Expenses is less than 550% in 2013, and less than 1000% after 2013; or
3.(Total Equity - Acquired Intangible Assets Net) is less than US$180.1800 million in 2012.The interest rate is from 2.94% to 2.99%.The interest expense incurred2013, and less than US$1,000 million after 2013.
SMIC Shanghai was in 2012 was US$4.1 million,compliance with these covenants as of which US$1.0 million was capitalized as part of the cost of assets under construction in 2012.December 31, 2013.
2011 EXIM USD and RMB Loan (SMIC Beijing)
In September 2011, Semiconductor Manufacturing International (Beijing) Corporation (“SMIC BeijingBeijing”) entered into thea USD and RMB Loan,loan, a two-year working capital loan facility in the principal amount of US$25 million and RMB150 million (approximately US$24 million) with The Export-Import Bank of China. This two-year bank facility was used for working capital purposes. SMIC Beijing repaid the outstanding balance in advance by June 2013. As of December 31, 2012,2013, SMIC Beijing had drawn down US$25 million and RMB150 million on this loanno outstanding balance of the facility. The principal amount is repayable in September 2013. The interest rate on this loan facility ranged from 6.15%6.1% to 6.65%6.5% in 2012. The interest expense incurred in 2012 was US$3.2 million, of which US$0.7 million was capitalized as part of the cost of assets under construction in 2012.
The total outstanding balance of the Beijing USD and RMB Loan is secured by SMIC Beijing’s plant and equipment with an original cost of US$132.3 million as of December 31, 2012.2013.
2012 EXIM USD Loan (SMIC Beijing)
In March 2012, SMIC Beijing entered into the newan unsecured USD Loan,loan, a two-year working capital loan facility in the principal amount of US$30 million with The Export-Import Bank of China, which is unsecured.China. This two-year bank facility was used for working capital purpose. SMIC Beijing repaid the outstanding balance of US$20 million in advance by August 2013. As of December 31, 2012,2013, SMIC Beijing had drawn down US$20 million on this loanno outstanding balance of the facility. The principal amount is repayable in March 2014. The interest rate on this loan facility ranged from 6.46%6.2% to 6.54%6.5% in 2012. The interest expense incurred in 2012 was US$1 million, of which US$0.2 million was capitalized as part of the cost of assets under construction in 2012.2013.
2012 USD Loan (SMIC Beijing)
In March 2012, SMIC Beijing entered into the Beijing USD syndicate loan, a seven-year loan facility in the aggregate principal amount of US$600 million, with a syndicate of financial institutions based in the PRC. This seven-year bank facility was used to expand the capacity of SMIC Beijing’s 12 inch12-inch fabs. The facility iswas secured by the manufacturing equipment located in the SMIC Beijing and Semiconductor Manufacturing International (Tianjin) Corporation (“SMIC TianjinTianjin”) fabs, and 100% equity pledge of SMIC Beijing and SMIC Tianjin. On September 26, 2013, SMIC Beijing and the syndicate amended the loan facility amount to US$260 million. As of December 31, 2012,2013, SMIC Beijing had drawn down US$260 million on this loan facility which is repayable from March 2014 to March 2016.2019. The interest rate on this loan facility ranged from 6.16%5.8% to 6.24%6.2% in 2012. The interest expense incurred in 2012 was US$12.2 million, of which US$2.3 million was capitalized as part of the cost of assets under construction in 2012.2013.
Any of the following in respect of SMIC Beijing would constitute an event of default during the term of the loan agreement:
1. Total Liabilities / Total Assets is more than 65% (Total Liabilities exclude Shareholder’s loans); or
2. (Net Profit + Depreciation + Amortization + Interest Expenses + Cash flow from Financing)/ (Principal + Interest Expenses) is less than 100%
SMIC Beijing was in compliance with these covenants as of December 31, 2012.2013.
2005 EUR2013 EXIM USD Loan (SMIC Beijing)
On December 15, 2005, weIn June 2013, SMIC Beijing entered into a EUR denominated long-termnew unsecured USD loan, a twenty-six-month working capital loan facility agreement in the aggregate principal amount of EUR 85US$60 million (equivalent to approximately US$105 million) with ABN AmroThe Export-Import Bank N.V. Shanghai Branch. The drawdown period of the facility ended on the earlier of (i) thirty six months after the execution of the agreement or (ii) the date on which the loans had been fully drawn down. Each draw down made under theChina. This twenty- six-month bank facility was repaidused for working capital purposes. As of December 31, 2013, SMIC Beijing had drawn down US$40 million on this loan facility. The principal amount is repayable in full in ten equal semi-annual installments. In May and Jun 2012, SMIC Shanghai repaid the remaining balance of EUR 6.4 million.August 2015. The interest rate on this loan facility ranged from 2.6%3% to 4.7%4% in 2012. The interest expense incurred in 2012 was US$0.23 million of which US$0.09 million was capitalized as part of the cost of assets under construction in 2012.2013.
2013 CIC RMB Entrust Loan (SMIC Beijing)
In June 2013, SMIC Beijing entered into a new unsecured RMB loan, a two-year working capital entrust loan facility in the principal amount of RMB70 million (approximately US$11.5 million) with China Investment Development Corporation through China CITIC Bank. This two-year entrust loan facility was used for working capital purposes. As of December 31, 2013, SMIC Beijing had drawn down RMB70 million (approximately US$11.5 million) and repaid RMB4.5 million (approximately US$0.7 million) on this loan facility. The outstanding balance of RMB65.5 million (approximately US$10.8 million) is repayable in June 2015. The interest rate on this loan facility was 12% in 2013
Short-term Credit Agreements
As of December 31, 2012,2013, we had 2928 short-term credit agreements that provided total credit facilities of up to US$11.1 billion on a revolving credit basis. As of December 31, 2012,2013, we had drawn down US$383.2219.7 million under these credit agreements and US$629.3927.5 million was available for future trading and borrowing. The outstanding borrowings under the credit agreements are unsecured, except for US$12918.2 million, which is secured by time deposits of US$108.4 million, and an additional balance of US$5.9 million, which is secured by real property with an original cost of US$2.129.1 million. The interest expense incurred in 2012 was US$22.2 million of which US$8.6 million was capitalized as additions to assets under construction. The interest rate ranged from 1.01%0.31% to 7.2%6.69% in 2012.2013.
In May 2012, SMIC Shanghai entered into a four-year strategic framework credit facility in the aggregate amount of RMB5 billion with China Development Bank. The 2013 USD loan (SMIC Shanghai) described above constituted part of this strategic framework credit facility.
Please see “Item 8.A — Financial Information- Consolidated Statements and Other Financial Information—Dividends and Dividend Policy” on our ability to pay dividends on our ordinary shares.
Please see “Item 11 — Quantitative and Qualitative Disclosures About Market Risk” regarding the risk of loss related to adverse changes in market prices, including foreign currency exchange rates and interest rates of financial instruments.
C. Research and Development, Patents and Licenses, etc.
Our research and development activities are principally directed toward the development and implementation of new process technology. We spent US$191.5 million, in 2011 and US$193.6 million and US$145.3 million, respectively in 2011, 2012 and 2013 on research and development expenses, which represented 14.5%, 11.4% and 11.4%7.0% respectively, of our sales in those respective years. Our research and development costs were partially offset by related government subsidiesfundings of US$42.6 million, US$31.0 million and US$31.026.9 in 2011, 2012 and 20122013, respectively, and included the costs associated with the ramp-up of a new wafer facility. We plan to continue to invest significant amounts in research and development in 2013.2014.
The research and development (R&D) efforts in 2010, 2011, 2012 and 20122013 were focused primarily on advanced logic and system-on-chip (SOC) process technologies. We achieved many significant milestones in 2012.2013. In the area of advanced logic process technologies, 40-nanometer (nm) low-leakage (LL)both the High- K-Metal-Gate (HKMG) and the PolySiON R&D programs on the 28nm node have successfully reached process technology wasfreeze in the fourth quarter of 2013 as planned. Both technologies are on schedule to be fully qualified through Multi ProjectMulti-Project Wafers (MPWs) and New Tape Outs (NTOs) and was released forwe are targeting volume manufacturing at the end of the third quarter of 2012. Both the High- K-Metal-Gate (HKMG)production in 2015. Early R&D work on 20nm planar and PolySiON R&D programs on the 28nm node have progressed on schedule and are targeted to reach process freeze at the end of the third quarter of 2013. Path finding on 22/20nm process technology was completed in the first quarter of 2012 and the 22/20nm R&D program was formally established in the second quarter of 2012. In the memory14nm FinFET process technologies 0.13ìm e- EEPROMhave begun and we have established process technology for bankcard/insurance card and 90nm eFlash for high-end smartcard have been successfully completed, with demonstrated yield to support production; 55nm e-Flash program and 38nm NAND program have already been commenced. We also developed more advanced front-side- illumination (FSI) technology for supporting 1.75ìm pixel image sensor products and successfully demonstrated a back-side-illumination (BSI) technology for 5+megapixel image sensor products. In addition, webaselines in collaboration with strategic partners have rolled out the industry’s first 0.13ìm monolithically integrated CMOS MEMS into risk production and successfully demonstrated the analog CMOS with embedded Through Silicon Via (TSV) Input Output (I/O).2013. In the area of power management ICs (PMIC), the technologynon-volatile memory process technologies, four of China’s six bank card IC design houses adopted our eEEPROM platform, migration from 0.18ìm to 0.13ìmwhich has been essentially completed to support broadened customer product applicationscertified by China Union Pay. Two SIM card NTOs on 55nm eFlash were taped out in 2013. During 2012, we achieved over 1,000 patent filings asWe expect that in 2014, a resultnumber of our technology R&D activities.differentiated technologies will begin revenue contribution.
The building and strengthening of ourSMIC’s technology R&D organization continued in 2012. The number2013 through further optimizations on organization structure and resource distribution to improve operational efficiency and to address the ever growing business demands on advanced technologies as well as mature technology enhancements. During 2013, SMIC achieved over 1,500 patent filings as a result of research and development engineers increased from approximately 450 at the end of 2011 to more than 600 at the end of 2012. Most members of theits technology R&D team have experience in the semiconductor industry and have earned advanced degree from leading universities in China and around the world (about 60% with an MS degree and about 15% with a Ph.D. degree in engineering or science). To address planned R&D activities in 2013 and 2014, the Technology Research & Development Division carried out further organization building and restructuring in 2012 for improved operational efficiency and plans to increase manpower by an additional 10% in 2013.activities.
As of December 31, 2012,2013, we had been granted 3,0713,719 patents worldwide, of which, 5860 were in Taiwan, 247318 were in the U.S., and 2,7663,328 were in China.China, and 13 were in other jurisdictions.
D. Trend Information
See “Item 5 — Operating and Financial Review and Prospects-Factors that Impact Our Results of Operations” for a discussion of the most significant recent trends affecting our operations.
E. Off-Balance Sheet Arrangements
We have not entered into any off-balance sheet transactions.
F. Tabular Disclosure of Contractual Obligations
Set forth in the table below are the aggregate amounts, as of December 31, 2012,2013, of our future cash payment obligations under our existing contractual arrangements on a consolidated basis:
|
| Payments due by period |
| |||||||||||||||||||
|
| Payments due by period |
|
| (consolidated, in US$ thousands) |
| ||||||||||||||||
|
| (consolidated, in US$ thousands) |
|
|
|
| Less than 1 |
|
|
|
|
|
|
| ||||||||
Contractual obligations |
| Total |
| Less than 1 |
| 1 - 3 years |
| 3 - 5 years |
| After 5 years |
|
| Total |
| year |
| 1 - 3 years |
| 3 - 5 years |
| After 5 years |
|
|
|
|
|
|
|
|
|
|
|
|
| |||||||||||
Short-Term Borrowings(1) |
| 383,225 |
| 383,225 |
| — |
| — |
| — |
|
| 219,727 |
| 219,727 |
| — |
| — |
| — |
|
|
|
|
|
|
|
|
|
|
|
|
| |||||||||||
Secured Long-Term Loans(1) |
| 713,190 |
| 184,578 |
| 467,112 |
| 61,500 |
| — |
|
| 771,795 |
| 170,820 |
| 348,825 |
| 229,130 |
| 23,020 |
|
|
|
|
|
|
|
|
|
|
|
|
| |||||||||||
Purchase Obligations(2) |
| 507,190 |
| 507,190 |
| — |
| — |
| — |
|
| 303,407 |
| 303,407 |
| — |
| — |
| — |
|
|
|
|
|
|
|
|
|
|
|
|
| |||||||||||
Other Long-Term Obligations(3) |
| 29,374 |
| 29,374 |
| — |
| — |
| — |
| |||||||||||
|
|
|
|
|
|
|
|
|
|
|
| |||||||||||
Total Contractual Obligations |
| 1,632,979 |
| 1,104,367 |
| 467,112 |
| 61,500 |
| — |
|
| 1,294,929 |
| 693,954 |
| 348,825 |
| 229,130 |
| 23,020 |
|
(1) These amounts represent outstanding borrowings. Refer to F-29,F-67, “Borrowings”, for a description of the short-term and long-term borrowings.
(2) Represents commitments for construction or purchase of semiconductor equipment, and other property or services.
Represents the settlement with TSMC for an aggregateTable of $200 million payable in installments over five years.Contents
Item 6. Directors, Senior Management and Employees
A. Directors and Senior Management
Members of our board of directorsBoard are elected by our shareholders. As of April 1, 2013,March 31, 2014, our board of directorsBoard consists of nineten directors, and onetwo alternate director.directors.
Our executive officers are appointed by, and serve at the discretion of, our board of directors.Board. The following table sets forth the names, ages and positions of our directors and executive officers as of April 1, 2013.March 31, 2014.
Name |
| Age |
| Position |
Directors | ||||
Zhang Wenyi |
|
|
| Chairman and Executive Director |
Tzu-Yin Chiu |
|
|
| Chief Executive Officer and Executive Director |
Gao Yonggang* | 49 | Chief Financial Officer, Executive Vice President, Strategic Planning and Executive Director | ||
Chen Shanzhi |
|
|
| Non-Executive Director |
|
|
|
| Non-Executive Director |
Lawrence Juen-Yee Lau |
|
|
| Non-Executive Director |
|
|
|
| |
|
|
| Independent Non-Executive Director | |
Frank Meng |
|
|
| Independent Non-Executive Director |
|
|
| Independent Non-Executive Director | |
Sean Maloney | 57 |
| Independent Non-Executive Director | |
Datong Chen |
|
|
| Alternate Director |
Li Yonghua |
| 39 |
| Alternate Director to Chen Shanzhi |
Senior |
|
|
|
|
Tzu-Yin Chiu |
|
|
| Chief Executive Officer and Executive Director |
|
|
|
| Chief Financial Officer, Executive Vice President, Strategic Planning and |
Haijun Zhao | 50 | Chief Operating Officer and Executive Vice President | ||
Dong Cui | 42 | Executive Vice President, Investment & Strategic Business Development | ||
Shiuh-Wuu Lee | 66 | Executive Vice President, Technology Development | ||
Jyishyang Liu | 61 | Executive Vice President, Engineering & Services | ||
Mike Rekuc |
| 65 |
|
|
|
|
| ||
|
|
| ||
|
|
| ||
|
|
| ||
John Peng |
|
|
| Associate Vice President, General Manager of China Business Unit |
63*Dr. Gao Yonggang has been redesignated as an executive Director since June 17, 2013. He was appointed as our Chief Financial Officer on February 17, 2014.
Datang Telecom Technology & Industry Holdings Co., Ltd., or Datang Telecom, has the right to nominate two members of our board of directors pursuant to the Share Purchase Agreement between us and Datang Telecom dated November 6, 2008, and Country Hill Limited (“Country Hill”), a wholly-owned subsidiary of Bridge Hill Investments Limited which is a subsidiary controlled by China Investment Corporation (“CIC”), has the right to nominate one member of our board of directors pursuant to the Share Subscription Agreement between us and Country Hill Limited dated April 18, 2012. Save as disclosed above, no other shareholder has a contractual right to designate a person to be elected to our board of directors.
There are no family relationships among any of our directors and executive officers.
Board of Directors
Zhang Wenyi
Chairman of the Board & Executive Director
Mr. Zhang Wenyi joined SMIC in 2011 and is currently the Chairman of the Board. He is also a director of several subsidiaries of SMIC. Mr. Zhang is an electronics industry veteran and entrepreneur well known for his achievements in both the semiconductor and CRT industries. Mr. Zhang previously served as the Chairman of the Board of Shanghai Hua Hong (Group) Co., Ltd., China’s first 8-inch foundry, and Chairman of the Board of Hua Hong Group’s subsidiary Shanghai Hua Hong NEC Electronics Co., Ltd., where he successfully transformed its business model into that of a foundry services company. He was also Chairman of Shanghai Hua Hong International, Inc., where he spearheaded the implementation of international and professional management practices. Mr. Zhang was previously General Manager of Shaanxi IRICO Color Picture Tube Plant and President and ChairmanGeneral Manager of IRICO Group Corporation. Under his leadership, IRICO stood out among fierce competition as China’s most profitable CRT manufacturer. Mr. Zhang has also served as Vice Minister of China’s Ministry of Electronics Industry. In this capacity, he oversaw the development of China’s electronic devices and components industry and was responsible for managing the Electronics Industrial Fund, which supports emerging technologies and innovation within the industry. Mr. Zhang is also the honorary chairman of China Semiconductor Industry Association. Mr. Zhang received his B.S. in electrical engineering from Tsinghua University in Beijing and holds the professional title of senior engineer. He was a member of the 11th National Committee of the Chinese People’s Political Consultative ConferenceConference.
Tzu-Yin Chiu
Chief Executive Officer & Executive Director
Dr. Tzu-Yin Chiu joined SMIC as CEO and Executive Directorhas over 30 years’ experience in 2011. He is also a director of most of SMIC’s subsidiaries. Dr. Chiu is athe semiconductor industry veteran with over 30 yearsand a track record of experience spanningmanaging successful semiconductor manufacturing companies at the executive level. Dr. Chiu’s expertise spans technology research, business development, operations and corporate management. PriorHe began his career in the United States as a research scientist at AT&T Bell Laboratories in Murray Hill, New Jersey, rising to joining SMIC,become the department head of its High Speed Electronics Research Department and Silicon Research Operations Department. He then joined Taiwan Semiconductor Manufacturing Corporation (TSMC), where he served as Senior Director of Fab Operations. Subsequently, Dr. Chiu wasbecame Senior Vice President and CEO of Hua Hong NEC.Shanghai Operations for Semiconductor Manufacturing International Corporation (SMIC). He hasthen served in executive positions across the semiconductor industry, including as President and COO of Silterra Malaysia, Senior Vice President and Chief Operating Officer of Hua Hong International Management and President of Hua Hong Semiconductor International Seniorin Shanghai, China. He was then appointed President and COO of Silterra Malaysia, before joining Hua Hong NEC as President and CEO in February 2009. Dr. Chiu also served as the Vice President and Chief Operating Officer of Shanghai Operations atHuali Microelectronics Corporation from 2010 to 2011. From 2005 to 2009, he was an independent director of Actions Semiconductor Co., Ltd. Dr. Chiu returned to SMIC in August 2011 as CEO and Senior DirectorExecutive Director. He is also Vice Council Chairman of Fab Operations at TaiwanChina Semiconductor Industry Association (CSIA), a board member of Global Semiconductor Alliance (GSA), Chairman of the Board of Semiconductor Manufacturing Company Limited (TSMC). He began his career inNorth China (Beijing) Corporation as well as chairman of the United States at AT&T Bell Laboratories, rising to become the department headboard of its High Speed Electronics Research Department and Silicon Research Operations Department. directors of Brite Semiconductor Corporation.
Dr. Chiu holds aearned his bachelor’s degree fromin electrical and systems engineering at Rensselaer Polytechnic Institute a Ph.D.in New York, and his doctorate in electrical engineering and computer science fromat the University of California, Berkeley, andBerkeley. He has also earned an executive MBA degree from Columbia University. A senior member of the IEEE,University in New York. Dr. Chiu holds 40 semiconductor technology patents with 60 additional patents still pending. He is a senior member of the IEEE and has published over thirty30 technical articles.
Gao Yonggang
Chief Financial Officer, Executive Vice President, Strategic Planning & Executive Director
Dr. Gao Yonggang, a non-executive Director since 2009, has been appointed as Executive Vice President, Strategic Planning of the Company and has been re-designated as an executive Director since June 17, 2013. He was appointed as the Chief Financial Officer of the Company on February 17, 2014. Dr. Gao remains as a director of two subsidiaries of the Company, namely Semiconductor Manufacturing International (Beijing) Corporation and Semiconductor Manufacturing International (Shenzhen) Corporation. He is also the executive director of China Fortune-Tech Capital Co., Ltd, the Company’s joint venture with an independent third party. Dr. Gao has more than 20 years of experience in the area of financial management and has worked as chief financial officer or person in charge of finance in various industries, including commercial, industrial, and municipal utilities, and in various types of organizations, including state-owned enterprises, private companies, joint ventures, and government agencies. Dr. Gao was the Chief Financial Officer of the China Academy of Telecommunications Technology (Datang Telecom Technology & Industry Group), the chairman of Datang Capital (Beijing) Co., Ltd. and Datang Telecom Group Finance Co., Ltd., and an executive director of Datang Hi- Tech Venture Capital Investment Co., Ltd. He was also a director and the Senior Vice President of Datang Telecom Technology& Industry Holdings Co., Ltd. Dr. Gao is a standing committee member of Accounting Society of China. Dr. Gao graduated from Nankai University with a Ph.D. in management. He has conducted studies in the field of financial investment, and has been involved in a number of key research projects and publications in this area. Dr. Gao is also a Fellow of the Institute of Chartered Accountants in Australia.
Chen Shanzhi
Non-Executive Director
Dr. Chen Shanzhi has been a Director since 2009. Dr. Chen is currently the SVP, CTO and CIO of the China Academy of Telecommunications Technology (Datang Telecom Technology & Industry Group). He is also the SVP of Datang Telecom Technology & Industry Holdings Co., Ltd., where he is responsible for strategy development, technology and standards development, corporate IT, strategic alliances and cooperation, investment budget management, and external Industrial Investment. Dr. Chen received his bachelor’s degree from Xidian University, his master’s degree from the China Academy of Posts and Telecommunications of the Ministry of Posts and Telecommunications, and his Ph.D. from Beijing University of Posts and Telecommunications. Dr. Chen has 20 years of experience in the field of information and communication technology, during which he has been involved in research and development, technology and strategy management. He has published a book and nearly 100 papers in domestic and foreign academic conferences and publications, most of which were published by SCI and EI. Many of his papers have received awards. At present, he has applied for more than 10 national invention patents.
Gao Yonggang
Non-Executive Director
Dr. Gao Yonggang has been a Director since 2009, and is also a director of several subsidiaries of the Company. Dr. Gao is currently the Chief Financial Officer of the China Academy of Telecommunications Technology (Datang Telecom Technology & Industry Group), the chairman of Datang Capital (Beijing) Co., Ltd. and Datang Telecom Group Finance Co., Ltd., and an executive director of Datang Hi-Tech Venture Capital Investment Co., Ltd. He is also a director and the Senior Vice President of Datang Telecom Technology & Industry Holdings Co., Ltd., a standing committee member of Accounting Society of China. Dr. Gao has more than 20 years of experience in the area of financial management and has worked as Chief Financial Officer or person in charge of finance in various industries such as commercial, industrial, municipal utilities, and many different types of organizations including state-owned enterprises, private companies, joint ventures, and government agencies. In November 2004, he was appointed as the Chief Financial Officer of the China Academy of Telecommunications Technology by the State-owned Assets Supervision and Administration Commission. Dr. Gao graduated from Nankai University with a Ph.D. in management. He has made in-depth studies in the field of financial investment, and has been involved in a number of key research projects and has many publications in this area. Dr. Gao is a Fellow of the Institute of Chartered Accountants in Australia..
Zhou Jie
Non-Executive Director
Mr. Zhou Jie has been a Director since 2009. Mr. Zhou is the president and an executive director of Shanghai Industrial Investment (Holdings) Co. Ltd. (“SIIC”), the vice chairman, the chief executive officer as well as an executive director of Shanghai Industrial Holdings Limited (“SIHL”), and the chairman of Shanghai Pharmaceutical (Group) Co., Ltd. He is also a director of certain subsidiaries of SIIC and SIHL. Mr. Zhou graduated from Shanghai Jiaotong University with a master’s degree in management science and engineering. He was the deputy general manager of the investment banking head office of Shanghai Wanguo Holdings Ltd. (now Shenyin & Wanguo Securities Co., Ltd.) and held the positions of chairman and general manager of Shanghai S.I. Capital Co., Ltd. He has nearly 20 years’ experience in investment banking and capital markets operation.
Lawrence Juen-Yee Lau Non-Executive
Non-Executive Director
Professor Lawrence Juen-Yee Lau has been a Director since 2011. Professor Lau received his B.S. degree (with Great Distinction) in Physics from Stanford University in 1964 and his M.A. and Ph.D. degrees in Economics from the University of California at Berkeley in 1966 and 1969, respectively. He joined the faculty of the Department of Economics at Stanford University in 1966, becoming Professor of Economics in 1976 and the first Kwoh-Ting Li Professor in Economic Development at Stanford University in 1992. From 1992 to 1996, he served as a Co-Director of the Asia-Pacific Research Center at Stanford University, and from 1997 to 1999 as the Director of the Stanford Institute for Economic Policy Research. He became Kwoh-Ting Li Professor in Economic Development, Emeritus, at Stanford University upon his retirement in 2006. From 2004 to 2010, Professor Lau served as Vice-Chancellor (President) of The Chinese University of Hong Kong. In 2010, he was appointed Chairman of CIC International (Hong Kong) Co., Limited, a subsidiary of China Investment Corporation, and serves concurrently as Ralph and Claire Landau Professor of Economics at The Chinese University of Hong Kong. Professor Lau specializes in economic development, economic growth, and the economies of East Asia, including that of China. He has authored, coauthored, or edited six books and published more than 170 articles and notes in professional journals. Professor Lau serves as a member of the 12th National Committee of the Chinese People’s Political Consultative Conference and a Vice-Chairman of its Subcommittee of Population, Resources and Environment, as well asEconomics, Vice-Chairman of the Advisory Committee of the Qianhai Shenzhen-Hong Kong Modern Service Industry Cooperation Zone of Shenzhen.Shenzhen, as well as a director of the Chinese Association of Hong Kong and Macau Studies. Professor Lau also serves as a member of the Exchange Fund Advisory Committee of the Hong Kong Special Administrative Region, and chairman of its Governance Sub-Committees and a member of its Currency Board and Governance Sub-Committees, the Greater Pearl River Delta Business CouncilSub-Committee, and as an adviser to the Hong Kong-Taiwan Economic and Cultural Cooperation and Promotion Council. He was appointed a Justice of the Peace in Hong Kong in July 2007. Professor Lau is also non-executive Vice-Chairman of CITIC Capital Holdings Limited, and an independent non-executive director of CNOOC Limited and an independent director of Far EasTone Telecommunications Company, Limited.
Tsuyoshi KawanishiZhou Jie
Independent Non-Executive Director
Mr. Tsuyoshi KawanishiZhou Jie has been a Director since 20012009. Mr. Zhou is an executive director and the president of Shanghai Industrial Investment (Holdings) Co. Ltd. (“SIIC”) and an executive director, the vice chairman and the chief executive officer of Shanghai Industrial Holdings Limited (“SIHL”). He is a non-executive director of Shanghai Pharmaceuticals Holding Co., Ltd. He is also a director of certain subsidiaries of SIIC and SIHL. Mr. Zhou graduated from Shanghai Jiaotong University with a subsidiarymaster’s degree in management science and engineering. He was the deputy general manager of the Company. Mr. Kawanishiinvestment banking head office of Shanghai Wanguo Holdings Ltd. (now Shenyin & Wanguo Securities Co., Ltd.) and held the positions of chairman and general manager of Shanghai S.I. Capital Co., Ltd. He has more than 50 years ofnearly 20 years’ experience in the electronics industry with Toshiba Corporation, where he served as, among other positions, senior executive vice presidentcorporate management, investment banking and senior advisor. Mr. Kawanishi is an advisor to Accenture Ltd. and a number of private companies. Mr. Kawanishi has been proactively leading the semiconductor industry through his strong leadership as an advisor to Semiconductor Equipment and Materials International (SEMI).capital market operation.
Frank Meng
Independent Non-Executive Director
Mr. Frank Meng has been a Director since 2011. Mr. Meng has been in the telecommunications and semiconductor industries for over 20 years. He received his BS degree in microwave and fiber optics from the Beijing University of Posts and Telecommunications and his MSEE degree from the Polytechnic University of New York. Mr. Meng joined Motorola21Vianet Group, Inc. as President in April 2010July 2013, where he is responsible for the company’s strategic planning, branding and is now themarketing, government affairs and strategic initiatives. Prior to joining 21Vianet, Mr. Meng served as Senior Vice President and President of Greater China offor Motorola Mobility, LLC, a wholly owned subsidiary of Google Inc., where he is responsible for overseeingmanaged all the aspects of the company’s business and sales operations in mainland China, Hong Kong and Taiwan. From September 2002 to April 2010, Mr. Meng served as Senior Vice President and President of Greater China of Qualcomm Inc. Prior to joining Qualcomm, he was the Chief Operating Officer of Tecom Asia Group in Beijing, and he had held various senior posts at Asia.com Inc. and Leyou.com Inc., in Beijing, Infocomm International Corp., in Taipei and Allen Telecom Inc., in Cleveland, Ohio. Mr. Meng is a member of the Expert Committee for Telecommunication Economy (ECTE) of China’s Ministry of Industry and Information Technology.
Lip-Bu Tan
Independent Non-Executive Director
Mr. Lip-Bu Tan has been a Director since 20022001 and is also a director of a subsidiary of the Company. Mr. Tan is the Founder and Chairman of Walden International, a leading venture capital firm managing over US$1.92.0 billion in committed capital. He concurrently serves as President and Chief Executive Officer of Cadence Design Systems, Inc., and has been a member of the Cadence Board of Directors since 2004. He also serves on the boards of Ambarella Corp., SINA, United Overseas Bank, the Global Semiconductor Alliance and several other private companies. Mr. Tan received his B.S. from Nanyang University in Singapore, his MBA from the University of San Francisco, and his M.S. in Nuclear Engineering from the Massachusetts Institute of Technology.
66Sean Maloney
Independent Non-Executive Director
Mr. Sean Maloney has been a Director since 2013. Mr. Maloney spent over 30 years at Intel Corporation. He is known within the high tech industry as a visionary whose hard work and strategic planning contributed to the unprecedented global growth of the company. From August 2011 to January 2013, Mr. Maloney served as Chairman of Intel China where he was responsible for overseeing and developing the company’s strategy. Prior to this appointment, Mr. Maloney was an Executive Vice President at Intel and Co-General Manager of the corporation’s Intel Architecture Group (IAG). He was responsible for architecting, developing, and marketing Intel’s platform solutions for all computing segments including: data centers, desktops, laptops, netbooks/net-tops, handhelds, embedded devices, and consumer electronics. In this capacity, Mr. Maloney focused on business and operations with over one half of the company reporting to him. He also previously ran the company’s Communications Group. Over the years, Mr. Maloney has been recognized for his keen understanding and abilities globally in sales and marketing as well as strategic planning. He served as the Chief of Sales and Marketing Worldwide for the company.
William Tudor Brown
Independent Non-Executive Director
Mr. William Tudor Brown has been a Director since 2013. He is a Chartered Engineer, a Fellow of the Institution of Engineering and Technology and a Fellow of the Royal Academy of Engineering. He holds a master’s degree (Cantab) Degree in Electrical Sciences from Cambridge University. Mr. Brown was one of the founders of ARM Holdings plc, a British multinational semiconductor and software design company listed on London Stock Exchange and NASDAQ. In ARM Holdings plc, he served as President during the period from July 2008 to May 2012. His previous roles include Engineering Director and Chief Technology Officer, EVP Global Development and Chief Operating Officer. He had responsibility for developing high-level relationships with industry partners and governmental agencies and for regional development. Before joining ARM Holdings plc, Mr. Brown was Principal Engineer at Acorn Computers and worked exclusively on the ARM R&D programme since 1984. Mr. Brown served as a director at ARM Holdings plc from October 2001 to May 2012. He was also a director of ARM Ltd. From May 2005 to February 2013, he was a director of ANT Software PLC (a company listed on AIM of London Stock Exchange). Mr. Brown served on the UK Government Asia Task Force until May 2012. He currently sits on the advisory board of Annapurna Labs. Currently, Mr. Brown is a director of Tessera Technologies, Inc. (a company listed on NASDAQ), an independent non-executive director and a member of the Compensation Committee of Lenovo Group Limited (a company listed on Main Board of The Stock Exchange of Hong Kong Limited) and an independent non-executive director of P2i Limited, a world leader in liquid repellent nano-coating technology.
Datong Chen
Alternate Director of Lawrence Juen-Yee Lau
Dr. Datong Chen has been an Alternate Director to Professor Lawrence Juen-Yee Lau, a Non-non- executive Director of the Company, since 2012. Dr. Chen has more than 20 years of investment and operations experience in the communications technology and semiconductor industries. He is the co- founder and managing director of WestSummit Capital Management Limited. Prior to co-founding WestSummit Capital, Dr. Chen was a venture partner at Northern Light Venture Capital, where he led investments in the semiconductor industry. Dr. Chen was also one of the founders of Spreadtrum Communications, Inc. He has been a director of Spreadtrum since 2004, and served as Spreadtrum’s chief technology officer from 2001 to 2008. Prior to that, he co-founded OmniVision Technologies, Inc. and served as vice president of technology from 1995 to 2000. Dr. Chen holds a bachelorBachelor of scienceScience degree, master’s degree and Ph.D. degree in electrical engineering from Tsinghua University, and served as a post-doctoral researcher at both the University of Illinois and Stanford University. He holds over 34 U.S. and European patents.
Li Yonghua
Alternate Director to Dr. Chen Shanzhi
Mr. Li Yonghua has been an alternate Director to Dr. Chen Shanzhi, a non-executive Director of the Company, since October 2013. Mr. Li is currently General Legal Consultant of the China Academy of Telecommunications Technology. Since August 2010, Mr. Li has been a director of Datang Telecom Technology Co., Ltd. (a company listed on the Shanghai Stock Exchange). Mr. Li has also served as General Legal Consultant and Vice President and General Manager of Operation Management of Datang Telecom Technology & Industry Holdings Co., Ltd. since June 2011 and December 2011, respectively. Mr. Li served in Dongming County People’s Procuratorate of Shandong Province as a civil servant from 1996 to 2005. He was legal manager of Jinbangxin Assets Management Company and Chief Law Officer of Hanwang Technology Co., Ltd. He was also Vice Legal General Manager, General Manager and Supervisor of Datang Telecom Technology & Industry Holdings Co., Ltd. from 2008 to 2010. Mr. Li holds a Bachelor of Law degree from Shandong Normal University and a Master of Law degree from Peking University.
Mr. Tsuyoshi Kawanishi, having reached retirement age, did not offer himself for re-election as a Class III Director and retired as an Independent Non-executive Director upon the conclusion of our annual general meeting held on June 13, 2013 in accordance with Article 90 of our Articles of Association.
Senior Management
Tzu-YinTzu-Yin Chiu
Chief Executive Officer and Executive Director
Biographical details are set out in the above Board of Directors section.
Gareth KungGao Yonggang
Chief Financial Officer, and Company SecretaryExecutive Vice President, Strategic planning & Executive Director
Mr. Gareth Kung joined SMIC in July 2012. Prior to joining SMIC as Chief Financial Officer and Company Secretary, Mr. Kung had over twenty-two years of experience working as a chief financial officer of publicly listed companies, private equity investment manager, banker and auditor. From 2003 to 2009, Mr. Kung worked at SMIC as the Group Treasurer and subsequently as the Group Controller. Mr. Kung earned his MBA from The University of Western Ontario and a bachelor’s degree in accountancy from National University of Singapore. Mr. Kung is a Certified Public Accountant in Hong Kong, Australia and Singapore as well as a Fellow of the Association of Chartered Certified Accountants. Mr. Kung is also a Chartered Financial Analyst.
Shiuh-Wuu Lee
Senior Vice President, Technology Development
Dr. Shiuh-Wuu Lee joined SMIC in 2010, and was named Vice President of Technology Development in September 2011. In June 2012 he was promoted to Senior Vice President. Dr. Lee has over 30 years of experienceBiographical details are set out in the semiconductor industry. Prior to arriving at SMIC, he distinguished himself at Intel Corporation and AT&T Bell Laboratories, where he was engaged in logic technology development and developed state-of-the-art tools for microprocessor design. He twice received the Distinguished Technical Achievement award at Bell Labs, served as a technical director at Intel and was elected an Intel Fellow in 2004, the company’s highest technical honor. Dr. Lee received his Ph.D. from the Universityabove Board of Michigan. He is actively involved in semiconductor technology conferences, and he has 54 published technical journal and conference papers. He is the holder of three patents.Directors section.
Haijun Zhao
SeniorChief Operating Officer and Executive Vice President North Operations
Dr. Haijun Zhao joined SMIC in 2010, and was named Vice President of North Operations in September 2011. In June 2012 he was promoted to Senior Vice President.President, and on April 25, 2013, he took on the roles as Executive Vice President and Chief Operating Officer. He has 1921 years of experience in semiconductor operations and technology development, most recently as a vice president of technology development, product engineering and Greater China business at ProMOS Technologies in Taiwan. He also previously held management positions at TECH Semiconductor Singapore. Dr. Zhao received his B.S. and Ph.D. from Tsinghua University, and his MBA from the University of Chicago. He holds two US semiconductor technology patents, with two pending, and has nine published technical papers.
Jyishyang Liu
Senior Vice President, Central Engineering & ServicesCentral Operations (Acting)
Dr Jyishyang Liu joined SMIC in 2001. He became Vice President of Central Engineering & Services in 2010, and has been Acting Vice President of Central Operations since September 2011. In June 2012 he was promoted to Senior Vice President. He has 28 years of experience in the international semiconductor industry, beginning with research & development work at Motorola and Bell Laboratories, as well as operations management at UMC. Dr. Liu received his BS and MS degrees from National Tsing Hua University and completed his Ph.D. in Materials Science and Engineering at the Massachusetts Institute of Technology. He has seven published technical papers and holds two patents.
Dong Cui
SeniorExecutive Vice President, Investment and Strategic Business Development
Mr. Cui Dong joined SMIC in September 2011 as Associate Vice President. In June 2012, he was promoted to Senior Vice President, initially overseeing Administration and Public Affairs. As of March 2013, he oversees Investment and Strategic Business Development.Development and on April 25, 2013, he took on the role as Executive Vice President. Prior to joining SMIC, from 2009 to 2011, Mr. Cui was President of China Electronics Corporation Hua Hong International Inc. and its investment management arm in Silicon Valley, CEC Capital Management LLC (CEC Capital). From 2002 to 2009, he was Vice President of Shanghai Hua Hong International Inc. and its investment management arm, Hua Hong International USA, LLC, which focused on venture capital investment in the semiconductor industry. From 1998 to 2002, Mr. Cui served as the deputy director of the office of the board of Shanghai Hua Hong Group and later as director of its Beijing representative office. From 1996 to 1998, Mr. Cui was the executive secretary of the general office of the Ministry of Electronics Industry. Mr. Cui received a BA in Chinese Language and Literature from Beijing Normal University, an MS in Management Science and Engineering from Tongji University, Shanghai, an MS in Finance from Golden Gate University, and a Certificate of Accounting in Tax from De Anza College. He has a total of 1718 years of experience in the semiconductor industry.
Shiuh-Wuu Lee
Executive Vice President, Technology Development
Dr. Shiuh-Wuu Lee joined SMIC in 2010, and was named Vice President of Technology Development in September 2011. In June 2012 he was promoted to Senior Vice President, and on April 25, 2013, he took on the role as Executive Vice President. Dr. Lee has over 30 years of experience in the semiconductor industry. Prior to arriving at SMIC, he distinguished himself at Intel Corporation and AT&T Bell Laboratories, where he was engaged in logic technology development and developed state-of-the-art tools for microprocessor design. He twice received the Distinguished Technical Achievement award at Bell Labs, served as a technical director at Intel and was elected an Intel Fellow in 2004, the company’s highest technical honor. Dr. Lee received his Ph.D. from the University of Michigan. He is actively involved in semiconductor technology conferences, and he has 54 published technical journal and conference papers. He is the holder of three patents.
Jyishyang Liu
Executive Vice President, Engineering & Services
Dr Jyishyang Liu joined SMIC in 2001. He became Vice President of Central Engineering & Services in 2010, and has been Acting Vice President of Central Operations since September 2011. In June 2012 he was promoted to Senior Vice President, and on April 25, 2013, he took on the role as Executive Vice President. He has 28 years of experience in the international semiconductor industry, beginning with research & development work at Motorola and Bell Laboratories, as well as operations management at UMC. Dr. Liu received his BS and MS degrees from National Tsing Hua University and completed his Ph.D. in Materials Science and Engineering at the Massachusetts Institute of Technology. He has seven published technical papers and holds two patents.
Mike Rekuc
SeniorExecutive Vice President, Worldwide Sales and Marketing
Mike Rekuc joined SMIC in 2011 as President of SMIC Americas. In November 2012, he was promoted to Senior Vice President, initially overseeing Worldwide Sales. As of March 2013, he oversees Worldwide Sales and Marketing.Marketing and on April 25, 2013, he took on the role as Executive Vice President. Mr. Rekuc is a distinguished industry veteran with four decades of semiconductor experience in both the United States and Asia. Before joining SMIC, he was President of Grace Semiconductor USA for Shanghai-based foundry Grace Semiconductor. Before Grace, he was Senior Vice President of Sales and Marketing and President of the Americas Region for Singapore-based Chartered Semiconductor (now part of GlobalFoundries) from 1999 to 2010. Prior to joining Chartered, Mr. Rekuc spent 23 years at Motorola, rising from a district sales engineer in Motorola’s semiconductor sector to become Vice President and Global Sales Director of its World Wide Wireless Subscribers Group. Mr. Rekuc began his career working for the United States Navy as a civilian semiconductor specialist. He holds a Bachelor of Science degree in Electrical Engineering from Lawrence Technological University.
John Peng
Associate Vice President and General Manager of China Business Unit
Mr. John Peng first joined SMIC in 2001 and is currently Associate Vice President and General Manager of the China Business Unit. Prior to joining SMIC, he was Senior Operations Director of Wuxi CSMC-HJ Semiconductor Company Limited, where he was responsible for fab operations and IT, among other responsibilities. He was also a deputy general manager and fab director at Huajing Microelectronics, where he was responsible for China’s National Project 908 AT&T (Lucent) technology transfer, and built China’s most advanced 6-inch fab in 1996. Mr. Peng received his Bachelor’s degree in Physics from Sichuan University, and he received his master’s degree in Microelectronics from Xidian University in 1988. He is a Ph.D. candidate in Microelectronics at Southeast University. He has published more than 10 technical articles.
B. Director and Executive Compensation
Details of the emoluments paid or payable by us to our directors, including Tzu-Yin Chiu, our chief executive officer and executive director and Gao Yonggang, our chief financial officer and executive director, in 20122013 are set out as below:
|
|
|
| Employee settled |
|
|
|
|
|
| Employee settled |
|
|
|
|
| Salaried and |
| share-base |
| Total |
|
| Salaried and |
| share-base |
| Total |
|
|
| wages |
| payment |
| remuneration |
|
| wages |
| payment |
| remuneration |
|
|
| (in US$ thousands) |
|
|
|
| (in US$ thousands) |
|
|
| ||||
Executive directors: |
|
|
|
|
|
|
| |||||||
Executive Directors: |
|
|
|
|
|
|
| |||||||
Zhang Wenyi |
| 188 |
| 353 |
| 541 |
|
| 391 |
| 274 |
| 665 |
|
Tzu-Yin Chiu |
| 962 |
| 642 |
| 1,604 |
|
| 963 |
| 901 |
| 1,864 |
|
|
| 1,150 |
| 995 |
| 2,145 |
| |||||||
Gao Yonggang |
| 142 |
| 101 |
| 243 |
| |||||||
Non-executive directors: |
|
|
|
|
|
|
|
|
|
|
|
|
|
|
Chen Shanzhi |
| 52 |
| 24 |
| 76 |
|
| 54 |
| 10 |
| 64 |
|
Gao Yonggang |
| 47 |
| 24 |
| 71 |
| |||||||
Lawrence Lau |
| — |
| — |
| — |
| |||||||
Lawrence Juen-Yee Lau |
| 22 |
| 62 |
| 84 |
| |||||||
Zhou Jie |
| — |
| — |
| — |
|
| — |
| — |
| — |
|
Chen Datong (alternate director) |
| — |
| — |
| — |
| |||||||
|
| 99 |
| 48 |
| 147 |
| |||||||
Independent non-executive directors |
|
|
|
|
|
|
| |||||||
Li Yonghua (Alternate to Chen Shanzhi) |
| — |
| — |
| — |
| |||||||
Chen Datong (Alternate to Lawrence Juen-Yee Lau) |
| — |
| — |
| — |
| |||||||
Independent non-executive directors: |
|
|
|
|
|
|
| |||||||
Tsuyoshi Kawanishi |
| 45 |
| 15 |
| 60 |
|
| 20 |
| 5 |
| 25 |
|
William Tudor Brown |
| 18 |
| 45 |
| 63 |
| |||||||
Sean Maloney |
| 27 |
| 65 |
| 92 |
| |||||||
Lip-Bu Tan |
| 65 |
| 15 |
| 80 |
|
| 65 |
| 5 |
| 70 |
|
Frank Meng |
| 52 |
| 40 |
| 92 |
|
| 54 |
| 36 |
| 90 |
|
|
| 162 |
| 70 |
| 232 |
| |||||||
Total remuneration |
| 1,411 |
| 1,113 |
| 2,524 |
|
| 1,756 |
| 1,504 |
| 3,260 |
|
The remuneration paid or payable by us to our senior management personnel, including Tzu-Yin Chiu our chief executive officer and executive directorGao Yonggang during the year are as follows:
|
|
|
|
|
| USD’000 |
|
Short-term benefits |
| ||
|
|
| |
3,667 |
| ||
Share-based payments |
| ||
|
|
* Mr. Chris Chi who was one of the senior management personnel as of December 31, 2012 has resigned from his position as Chief Business Officer of the Company effective March 1, 2013.
We do not provide pension, retirement or similar benefits to our executive officers and directors except statutorily required benefits.
In 2012,2013, we have granted options to purchase an aggregate of 8,980,00088,364,005 ordinary shares under our 2004 Stock Option Plan and awarded an aggregate of 4,420,00017,826,161 restricted share units under our 2004 Equity Incentive Plan to certain of our executive officers. Both our 2004 Stock Option Plan and the 2004 Equity Incentive Plan are described below. The exercise price of the options granted to our executive officers in 20122013 to purchase ordinary shares under the 2004 Stock Option Plan range from US$0.0370.080 to US$0.0450.082 per share. The expiration dates of these options range from May 21, 2022June 10, 2023 to September 11, 2022.June 16, 2023.
C. Board Practices
Board of Directors
Our board of directors consists of nine directorsten Directors and onetwo alternate director.Directors. Directors may be elected to hold office until the expiration of their respective terms upon a resolution passed at a duly convened shareholders’ meeting by holders of a majority of our issued shares being entitled to vote in person or by proxy at such meeting. The Board is divided into three classes with one class of Directors eligible for re- election at each annual general meeting of shareholders, or AGM. Each class of Director (including all non-executive Directors) will serve a term of three years.
·The Class I Directors (Zhangare Mr. Zhang Wenyi, Dr. Tzu-Yin Chiu, Dr. Gao Yonggang and Mr. William Tudor Brown. Dr. Gao Yonggang) werewas re-elected for a term of three years at the 2011 AGM (exceptto hold office until the 2014 AGM, while Mr. Zhang and Dr. Chiu, whose appointmentinitial appointments as Directors initially took effect on June 30, 2011 and August 5, 2011 respectively, and who were subsequently re-electedre- elected at the 2012 AGM)AGM to hold office until the 2014 AGM pursuant to Article 126 of the Company’s Articles of Association. Mr. Brown, whose initial appointment as Director took effect on August 8, 2013, will retire from office at the 2014 AGM pursuant to Article 126 of the Company’s Articles of Association while all other Class I Directors will retire from office at the 2014 AGM pursuant to Article 90 of the Company’s Articles of Association. Each of Mr. Zhang, Dr. Chiu, Dr. Gao and Mr. Brown will, being eligible, offer himself for re-election as a Class I Director for a term of three years at the 2014 AGM to hold office until the 2017 AGM.
·The Class II Directors (Chenare Dr. Chen Shanzhi, Mr. Frank Meng and Mr. Lip-Bu Tan)Tan. All Class II Directors were re-electedre- elected for a term of three years at the 2012 AGM to hold office until the 2015 AGM.
·The Class III Directors (Tsuyoshi Kawanishi,are Mr. Zhou Jie, andProfessor Lawrence Juen-Yee Lau) will retire from office on the date of the 2013 AGM pursuant to Article 90 of our Articles of Association. Each of Mr. Kawanishi, Professor Lau and Mr. Sean Maloney. Mr. Zhou will be eligible for re-election at the 2013 AGMand Professor Lau were re-elected for a term of three years at the 2013 AGM to hold office until the 2016 AGM. Mr. Maloney, whose initial appointment as Director took effect on June 15, 2013, will retire from office at the 2014 AGM pursuant to Article 126 of the Company’s Articles of Association. Mr. Maloney will, being eligible, offer himself for re-election as a Class III Director at the 2014 AGM to hold office until the 2016 AGM.
The following table sets forth the names, classes and appointment commencement dates of our current directors:Directors:
Appointment | ||||||
Name of Director |
| Position |
| Class |
|
|
Zhang Wenyi |
| Chairman and Executive Director |
| I |
| 2011/6/30 |
Tzu-Yin Chiu |
| Chief Executive Officer and Executive Director |
| I |
| 2011/8/5 |
Gao Yonggang | Chief Financial Officer, Executive Vice President, Strategic Planning, Executive Director | I | 2009/6/23 | |||
William Tudor Brown | Independent Non-executive Director | I | 2013/8/8 | |||
Chen Shanzhi |
| Non-executive Director |
| II |
| 2009/6/23 |
| Independent Non-executive Director | II | 2001/11/3 | |||
Frank Meng | Independent Non-executive Director | II | 2011/8/23 | |||
Sean Maloney | Independent Non-executive Director | III | 2013/6/15 | |||
Zhou Jie |
| Non-executive Director |
|
|
| 2009/ |
Lawrence Juen-Yee Lau |
| Non-executive Director |
| III |
| 2011/6/30 |
|
|
|
| |||
|
|
|
| |||
|
|
|
| |||
|
|
|
| |||
Datong Chen |
| Alternate Director |
| — |
| 2012/5/10 |
Li Yonghua | Alternate Director to Chen Shanzhi | — | 2013/10/22 |
Please see “Item 7.B—Related Party Transactions — Director Service Contracts” for a description of the service contracts we have entered into with our directors. Except for the indemnification provisions, the Service Contracts (as defined under Item 7) do not provide for benefits upon termination of service or employment.
Committees of Our Board of Directors
Our board of directors has an audit committee, a compensation committee and a nomination committee. The composition and responsibilities of these committees are described below.
Audit Committee.
Currently, the members of the audit committee are Mr. Lip-Bu Tan (chairman of the audit committee), Mr. Gao YonggangFrank Meng and Mr. Frank Meng.Zhou Jie. None of these members of the audit committee has been an executive officer or employee of ours or any of our subsidiaries. In addition to acting as member of our audit committee, Mr. Lip-Bu Tan currently also serves on the audit committee of another publicly traded company, SINA Corporation. In general, and in accordance with section 303A.07 (a) of the Listed Company Manual of the New York Stock Exchange, our board of directors considered and determined that such simultaneous service would not impair the ability of Mr. Tan to effectively serve on our audit committee.
The responsibilities of the audit committee include, among other things:
· making recommendations to the board of directorsBoard concerning the appointment, reappointment, retention, evaluation, oversight and termination of the work of our independent auditor;
· reviewing the experience, qualifications and performance of the senior members of the independent auditor team;
· pre-approving all non-audit services to be provided by our independent auditor;
· approving the remuneration and terms of engagement of our independent auditor;
· reviewing reports from our independent auditor regarding the independent auditor’s internal quality-control procedures; and any material issues raised in the most recent internal or peer review of such procedures, or in any inquiry, review or investigation by governmental, professional or other regulatory authority, respecting independent audits conducted by the independent auditor, and any steps taken to deal with these issues; and (to assess the independent auditor’s independence) all relationships between us and the independent auditor;
· pre-approving the hiring of any employee or former employee of our independent auditor who was a member of the audit team during the preceding three years and the hiring of any employee or former employee of the independent auditor for senior positions regardless of whether that person was a member of our audit team;
· reviewing our annual and interim financial statements, earnings releases, critical accounting policies and practices used to prepare financial statements, alternative treatments of financial information, the effectiveness of our disclosure controls and procedures and important trends and developments in financial reporting practices and requirements;
· reviewing the scope, planning and staffing of internal audits, the organization, responsibilities, plans, results, budget and staffing of our internal audit department, the quality, adequacy and effectiveness of our internal controls (including financial, operational and compliance controls) and any significant deficiencies or material weaknesses in the design or operation of internal controls;
· considering the adequacy of resources, staff qualifications and experience, training programmes and budget of our accounting and financial reporting function;
· reviewing our risk assessment and management policies;
· reviewing any legal matters that may have a material impact and the adequacy and effectiveness of our legal and regulatory compliance procedures;
· establishing procedures for the treatment of complaints received by us regarding financial reporting, internal control or possible improprieties in other matters; and
· obtaining and reviewing reports from management, our internal auditor and our independent auditor regarding compliance with applicable legal and regulatory requirements.
During 2012,2013, the audit committee reviewed:
· our budget for 2012;2013;
· the financial reports for the year ended and as of December 31, 20112012 and the six month period ended and as of June 30, 2012;2013;
· the quarterly earnings releases and any updates thereto;
· the report and management letter submitted by our outside auditors summarizing the findings of and recommendations from their audit of the Company’s financial reports;
· the findings and recommendations of our outside auditors regarding our compliance with the requirements of the Sarbanes-Oxley Act of 2002 (the “Sarbanes-Oxley Act”);
· the effectiveness of our internal control structure in operations, financial reporting integrity and compliance with applicable laws and regulations;
· the findings of our compliance office, which ensures compliance with our Corporate Governance Code and Insider Trading Policy;
· the reports of our ethics hotline;
· the audit fees for our outside auditors; and
· Ourour outside auditors’ engagement letters.
The audit committee reports its work, findings, and recommendations to the board of directorsBoard regularly. In addition, the audit committee meets in person with our external auditor at least twice a year.
The audit committee meets in person at least four times a year on a quarterly basis and on such other occasions as may be required to discuss and vote upon significant issues. The meeting schedule for a year is planned in the preceding year. The Company Secretary assists the chairman of the audit committee in preparing the agenda for meetings and assists the audit committee in complying with relevant rules and regulations. The relevant papers for the audit committee meetings are dispatched to audit committee members in accordance with applicable rules and regulations governing the company. Members of the audit committee may include matters for discussion in the agenda if the need arises. Upon the conclusion of the audit committee meeting, minutes are circulated to the members of the audit committee for their comment and review prior to their approval of the minutes at the following or the subsequent audit committee meeting.
At each quarterly audit committee meeting, the audit committee reviews with the Chief Financial Officer and our outside auditors, the financial statements for the financial period and the financial and accounting principles, policies and controls of the company and its subsidiaries. In particular, the committee discusses (i) the changes in accounting policies and practices, if any; (ii) the going concern assumptions, (iii) compliance with accounting standards and applicable rules and other legal requirements in relation to financial reporting and (iv) our internal controls and the accounting and financial reporting systems. Upon the recommendation of the audit committee, the Board will approve the financial statements.
Compensation Committee
The members of our compensation committee currently consist of Mr. Lip-Bu Tan (chairman of the compensation committee), Mr. Tsuyoshi KawanishiSean Maloney and Mr. Zhou Jie. None of these members of the compensation committee has been an executive officer or employee of ours or any of our subsidiaries.
The responsibilities of the compensation committee include, among other things:
· approving and overseeing the total compensation package for our executive officers and any other officer, evaluating the performance of and determining and approving the compensation to be paid to our chief executive officer and reviewing the results of our chief executive officer’s evaluation of the performance of our other executive officers;
· determining the compensation packages of our executive directors and making recommendations to the board of directorsBoard with respect to non-executive director compensation, including equity- based compensation;
· administering and periodically reviewing and making recommendations to the board of directorsBoard regarding the long- term incentive compensation or equity plans made available to the directors, employees and consultants;
· reviewing and making recommendations to the board of directorsBoard regarding executive compensation philosophy, strategy and principles and reviewing new and existing employment, consulting, retirement and severance agreements proposed for our executive officers; and
· ensuring appropriate oversight of our human resources policies and reviewing strategies established to fulfill our ethical, legal and human resources responsibilities.
The compensation committee makes recommendations to the board to determine the remuneration packages of newly appointed individual executive directors and senior management, and to approve with delegated responsibility any revised remuneration packages of existing individual executive directors and senior management. In addition to reviewing the remuneration of executive directors and the members of our management, the compensation committee reviewed:
· the remuneration policy for employees for the year 2012;2013;
· the profit-sharing and bonus policies;
· the long term compensation strategy, including the granting of stock options and restricted share units pursuant to our option plan and equity incentive plan;
·the termsattrition rate;
·the amendments of our 2004 Stock Option Plan and 2004 Equity Incentive Plan;the compensation committee charter to comply with the US SEC rules; and
· the attrition rate.group insurance program for Directors and executive team.
The compensation committee reports its work, findings and recommendations to our board of directorsthe Board during each quarterly board meeting.
The committee meets in person at least on a quarterly basis and on such other occasions as may be required to discuss and vote upon significant issues affecting our compensation policy. The meeting schedule for a given year is planned in the preceding year. The Company Secretary assists the chairman of the compensation committee in preparing the agenda for meetings and assists the committee in complying with the relevant rules and regulations. The relevant papers for the compensation committee meetings were dispatched to committee members in accordance with relevant rules and regulations applicable to us. Members of the compensation committee may include matters for discussion in the agenda if the need arises. Upon the conclusion of the compensation committee meeting, minutes are circulated to the committee members for their comment and review prior to their approval of the minutes at the following or a subsequent compensation committee meeting.
Nomination Committee
Our nomination committee was established by the board of directors on March 23, 2012. The members of our nomination committee currently consist of Mr. Zhang Wenyi (chairman of the nomination committee), Mr. Frank Meng and Mr. Lip-Bu Tan. The responsibilities of the nomination committee include:
· reviewing the structure, size and composition (including the skills, knowledge and experience) of the board of directorsBoard at least annually and making recommendations on any proposed changes to the board of directorsBoard to complement our corporate strategy;
·monitoring the implementation of the Board Diversity Policy (including any measurable objectives and the progress in achieving those objectives), and ensuring that appropriate disclosures are made regarding board diversity in the Corporate Governance Report set out in the Company’s Hong Kong annual report;
· identifying individuals suitably qualified to become members of the board of directors, consistent with criteria approved by the board of directors,Board and making recommendations to the board of directorsBoard on the selection of individuals nominated for directorships;
· assessing the independence of independent non-executive directors; and
· making recommendations to the board of directorsBoard on the appointment or re-appointment of directors and succession planning for directors, in particular the chairman of our board of directors and our Chief Executive Officer.
The nomination committee meets at least once a year and on such other occasions as may be required to discuss and vote upon significant issues relating to board composition. The Company Secretary assists the chairman of the nomination committee in preparing the agenda for meetings and assists the committee in complying with the relevant rules and regulations. The relevant papers for the nomination committee meetings were dispatched to committee members in accordance with relevant rules and regulations applicable to us. Members of the nomination committee may include matters for discussion in the agenda if the need arises. Upon the conclusion of the nomination committee meeting, minutes are circulated to the committee members for their comment and review prior to their approval of the minutes at the following or a subsequent committee meeting. During 2012,2013, the nomination committee:
· reviewed the structure, size and composition (including the skills, knowledge and experience) of the board ofBoard;
·set criteria, searched and identified suitable independent non-executive directors; and
· evaluated the independence of our independent non-executive directors.
D. Employees
The following table sets forth, as of the dates indicated, the number of our employees serving in the capacities indicated:
|
| As of December 31, |
|
| As of December 31, |
| ||||||||||||
Function |
| 2009 |
| 2010 |
| 2011 |
| 2012 |
|
| 2010 |
| 2011 |
| 2012 |
| 2013 |
|
Managers |
| 1,064 |
| 917 |
| 898 |
| 922 |
|
| 917 |
| 898 |
| 922 |
| 951 |
|
Professionals(1) |
| 4,510 |
| 3,920 |
| 4,297 |
| 4,164 |
|
| 3,920 |
| 4,297 |
| 4,164 |
| 4,440 |
|
Technicians |
| 4,484 |
| 4,970 |
| 3,910 |
| 4,650 |
|
| 4,970 |
| 3,910 |
| 4,650 |
| 4,751 |
|
Clerical staff |
| 249 |
| 269 |
| 347 |
| 238 |
|
| 269 |
| 347 |
| 238 |
| 304 |
|
Total(2) |
| 10,307 |
| 10,076 |
| 9,452 |
| 9,974 |
|
| 10,076 |
| 9,452 |
| 9,974 |
| 10,446 |
|
(1) Professionals include engineers, lawyers, accountants and other personnel with specialized qualifications, excluding managers.
(2) Includes 372, 145, 1, 3 and 3 temporary and part-time employees in 2009, 2010, 2011, 2012, and 20122013 respectively.
The following table sets forth, as of the dates indicated, a breakdown of the number of our employees by geographic location:
|
| As of December 31, |
| ||||||
Location of Facility |
| 2009 |
| 2010 |
| 2011 |
| 2012 |
|
Shanghai |
| 6,460 |
| 5,395 |
| 5,555 |
| 6,037 |
|
Beijing |
| 1,552 |
| 2,102 |
| 2,253 |
| 2,491 |
|
Tianjin |
| 997 |
| 1,439 |
| 1,321 |
| 1,354 |
|
Chengdu |
| 1,104 |
| 792 |
| 12 |
| 11 |
|
Shenzhen |
| 154 |
| 142 |
| 36 |
| 23 |
|
Wuhan |
| — |
| 174 |
| 236 |
| 17 |
|
United States |
| 17 |
| 15 |
| 17 |
| 18 |
|
Europe |
| 9 |
| 8 |
| 6 |
| 8 |
|
Japan |
| 8 |
| 3 |
| — |
| — |
|
Taiwan Office |
| — |
| — |
| 11 |
| 11 |
|
Hong Kong |
| 6 |
| 6 |
| 5 |
| 4 |
|
Total |
| 10,307 |
| 10,076 |
| 9,452 |
| 9,974 |
|
|
| As of December 31, |
| ||||||
Location of Facility |
| 2010 |
| 2011 |
| 2012 |
| 2013 |
|
Shanghai |
| 5,395 |
| 5,555 |
| 6,037 |
| 6,626 |
|
Beijing |
| 2,102 |
| 2,253 |
| 2,491 |
| 2,272 |
|
Tianjin |
| 1,439 |
| 1,321 |
| 1,354 |
| 1,454 |
|
Chengdu |
| 792 |
| 12 |
| 11 |
| 11 |
|
Shenzhen |
| 142 |
| 36 |
| 23 |
| 43 |
|
Wuhan |
| 174 |
| 236 |
| 17 |
| — |
|
United States |
| 15 |
| 17 |
| 18 |
| 20 |
|
Europe |
| 8 |
| 6 |
| 8 |
| 6 |
|
Japan |
| 3 |
| — |
| — |
| 1 |
|
Taiwan Office |
| — |
| 11 |
| 11 |
| 10 |
|
Hong Kong |
| 6 |
| 5 |
| 4 |
| 3 |
|
Total |
| 10,076 |
| 9,452 |
| 9,974 |
| 10,446 |
|
Our employees are not covered by any collective bargaining agreements.
E. Share Ownership
The table below sets forth the ordinary shares beneficially owned by each of our directors and options to purchase ordinary shares as of April 1, 2013:March 31, 2014:
|
|
|
|
|
|
|
| Awards of |
|
|
|
|
|
|
|
|
|
| Percentage |
|
|
| Current |
| Options to Purchase |
| Ordinary Shares |
| Restricted Share |
|
|
|
|
|
|
|
|
|
| of |
|
Name |
| Shareholding |
| Number o f Options |
| Exerci se Price |
| Units |
| |||||||||||
|
|
|
|
|
|
|
|
|
|
|
|
|
|
|
|
|
|
| Aggregate |
|
|
|
|
|
|
|
|
|
|
| Interests to |
| |||||||||
|
|
|
|
|
|
|
|
|
| Total |
| |||||||||
|
|
|
|
|
|
|
|
|
| Issued |
| |||||||||
|
|
|
|
|
|
|
|
|
| Share |
| |||||||||
|
| Derivatives |
| Capital of |
| |||||||||||||||
|
| Number of Ordinary |
|
|
|
|
| Aggregate |
| the |
| |||||||||
Board Member |
| Shares Held |
| Share Options |
| Other |
| Interest |
| Company1 |
| |||||||||
Executive Director |
|
|
|
|
|
|
|
|
|
|
| |||||||||
Zhang Wenyi |
| — |
| 21,746,883 | (1) | US$0.0584 |
| 9,320,093 | (2) |
| — |
| 21,746,883 | 2 | 9,320,093 | 3 | 31,066,976 |
| 0.096 | % |
Tzu-Yin Chiu |
| 13,326,759 |
| 86,987,535 | (3) | US$0.0584 |
| 27,960,279 | (4) |
| 26,119,852 |
| 86,987,535 | 4 | 18,640,186 | 5 | 131,747,573 |
| 0.409 | % |
Gao Yonggang |
| — |
| 16,753,568 | 6 | — |
| 16,753,568 |
| 0.052 | % | |||||||||
Non-executive Director |
|
|
|
|
|
|
|
|
|
|
| |||||||||
Chen Shanzhi |
| — |
| 3,145,319 | (5) | US$0.0821 |
| — |
|
| — |
| 3,145,319 | 7 | — |
| 3,145,319 |
| 0.010 | % |
Gao Yonggang |
| — |
| 3,145,319 | (5) | US$0.0821 |
| — |
| |||||||||||
Lawrence Juen-Yee Lau |
| — |
| — |
| — |
| — |
|
| — |
| 4,492,297 | 8 | — |
| 4,492,297 |
| 0.014 | % |
Zhou Jie |
| — |
| — |
| — |
| — |
|
| — |
| — |
| — |
| — |
| — |
|
Tsuyoshi Kawanishi |
| — |
| 5,634,877 | (6) | US$0.0348-US$0.132 |
| — |
| |||||||||||
Independent Non-executive Director |
|
|
|
|
|
|
|
|
|
|
| |||||||||
William Tudor Brown |
| — |
| 4,492,297 | 9 | — |
| 4,492,297 |
| 0.014 | % | |||||||||
Sean Maloney |
| — |
| 4,490,377 | 10 | — |
| 4,490,377 |
| 0.014 | % | |||||||||
Frank Meng |
| — |
| 4,471,244 | (7) | US$0.0514 |
| — |
|
| — |
| 4,471,244 | 11 | — |
| 4,471,244 |
| 0.014 | % |
Lip-Bu Tan |
| — |
| 4,634,877 | (8) | US$0.0348-US$0.132 |
| — |
|
| — |
| 4,634,877 | 12 | — |
| 4,634,877 |
| 0.014 | % |
Alternate Director |
|
|
|
|
|
|
|
|
|
|
| |||||||||
Datong Chen |
| — |
| — |
| — |
| — |
| — |
| |||||||||
Li Yonghua |
| — |
| — |
| — |
| — |
| — |
| |||||||||
(1)Based on 32,214,208,143 ordinary shares in issue as at March 31, 2014.
(2) On September 8, 2011, Mr. Zhang was granted options to purchase 21,746,883 Ordinary Sharesordinary shares at a price of HK$0.455 per share pursuant to the 2004 Stock Option Plan. These options will expire on the earlier of September 7, 2021 or 120 days after termination of the Director’s service to the Board. As of April 1, 2013,March 31, 2014, none of these options have been exercised.
(2)(3) On September 8, 2011, Mr. Zhang was granted an award of 9,320,093 Restricted Share Unitsrestricted share units (each representing the right to receive one Ordinary Share)ordinary share) pursuant to the 2004 Equity Incentive Plan. These restricted share units, 25% of these Restricted Share Unitswhich will vest on each anniversary of June 30, 2011 and will be fully vested on June 30, 2015. As of March 31, 2014, 50% of Mr. Zhang’s restricted share units were vested, but none of these restricted share units have been settled.
(3)(4) On September 8, 2011, Dr. Chiu was granted options to purchase 86,987,535 Ordinary Sharesordinary shares at a price of HK$0.455 per share pursuant to the 2004 Stock Option Plan. These options will expire on the earlier of September 7, 2021 or 120 days after termination of the Director’s service to the Board. As of April 1, 2013,March 31, 2014, none of these options have been exercised.
(4)(5) On September 8, 2011, Dr. Chiu was granted an award of 37,280,372 Restricted Share Unitsrestricted share units (each representing the right to receive one Ordinaryordinary Share) pursuant to the 2004 Equity Incentive Plan. These restricted share units, 25% of these Restricted Share Unitswhich will vest on each anniversary of the August 5, 2011, and will be fully vested on August 5, 2015. As of April 1, 2013, 25%March 31, 2014, 50% of Dr. Chiu’s Restricted Share Unitsrestricted share units was vested and 9,320,093 Ordinary Sharessettled, and thus 18,640,186 ordinary shares were issued to him.
(5)(6)These options comprise: (a) options granted to Dr. Gao on May 24, 2010 to purchase 3,145,319 ordinary shares at a price of HK$0.64 per share pursuant to the 2004 Stock Option Plan, which options will expire on the earlier of May 23, 2020 or 120 days after termination of his service as a Director to the Board, and (b) options granted to Dr. Gao on June 17, 2013 to purchase 13,608,249 ordinary shares at a price of HK$0.624 per share pursuant to the 2004 Stock Option Plan, which options will expire on the earlier of June 16, 2023 or 120 days after termination of his service as a Director to the Board. As of March 31, 2014, none of these options have been exercised.
(7) On May 24, 2010, each of Dr. Chen and Dr. Gao was granted options to purchase 3,145,319 Ordinary Sharesordinary shares at a price per share of HK$0.64. These options will expire on the earlier of May 23, 2020 or 120 days after termination of the Directors’ service to the Board. As of April 1, 2013,March 31, 2014, none of these options have been exercised.
(6)(8) This comprises of (a)On September 6, 2013, Professor Lau was granted options granted to Mr. Kawanishi on February 23, 2010 to purchase 3,134,877 Ordinary Shares4,492,297 ordinary shares at a price of HK$0.562 per share of HK$0.77 pursuant to the 2004 Stock Option Plan, which will expire on the earlier of February 22, 2020 or 120 days after termination of the Directors’ service to the Board, (b)Plan. These options granted to Mr. Kawanishi on February 17, 2009 to purchase 1,000,000 Ordinary Shares at a price per share of HK$0.27 pursuant to the 2004 Stock Option Plan will expire on the earlier of February 17, 2019 or 120 days after termination of the Directors’ service to the Board, (c) options granted to Mr. Kawanishi on September 29, 2006 to purchase 500,000 Ordinary Shares at a price per share of US$0.132 pursuant to the 2004 Stock Option Plan which were fully vested on May 30, 2008 and will expire on the earlier of September 29, 20165, 2023 or 120 days after termination of the Directors’his service as a Director to the Board, and (d) options to purchase 1,000,000 Ordinary Shares which will expire on January 14, 2014.Board. As of April 1, 2013,March 31, 2014, none of these options have been exercised.
76(9)On September 6, 2013, Mr. Brown was granted options to purchase 4,492,297 ordinary shares at a price of HK$0.562 per share pursuant to the 2004 Stock Option Plan. These options will expire on the earlier of September 5, 2023 or 120 days after termination of his service as a Director to the Board. As of March 31, 2014, none of these options have been exercised.
(7)(10)On June 17, 2013, Mr. Maloney was granted options to purchase 4,490,377 ordinary shares at a price of HK$0.624 per share pursuant to the 2004 Stock Option Plan. These options will expire on the earlier of June 16, 2023 or 120 days after termination of his service as a Director to the Board. As of March 31, 2014, none of these options have been exercised.
(11) On November 17, 2011, Mr. Meng was granted options to purchase 4,471,244 Ordinary Sharesordinary shares at a price of HK$0.4 per share pursuant to the 2004 Stock Option Plan. These options will expire on the earlier of November 16, 2021 or 120 days after termination of the Director’s service to the Board. As of April 1, 2013,March 31, 2014, none of these options have been exercised.
(8)(12) This comprises ofThese options comprise (a) options granted to Mr. Tan on February 23, 2010 to purchase 3,134,877 Ordinary Sharesordinary shares at a price per share of HK$0.77 pursuant to the 2004 Stock Option Plan, which options will expire on the earlier of February 22, 2020 or 120 days after termination of the Directors’ service to the Board, (b) options granted to Mr. Tan on February 17, 2009 to purchase 1,000,000 Ordinary Sharesordinary shares at a price per share of HK$0.27 pursuant to the 2004 Stock Option Plan, which options will expire on the earlier of February 17, 2019 or 120 days after termination of the Directors’ service to the Board, and (c) options granted to Mr. Tan on September 29, 2006 to purchase 500,000 Ordinary Sharesordinary shares at a price per share of US$0.132 pursuant to the 2004 Stock Option Plan which options were fully vested on May 30, 2008 and will expire on the earlier of September 29, 2016 or 120 days after termination of the Directors’ service to the Board. As of April 1, 2013,March 31, 2014, none of these options have been exercised.
The share holdings set forth above excludes shares beneficially owned by entities affiliated with our directors. Each of our directors disclaims beneficial ownership of the shares beneficially owned by such affiliated entity, except to the extent of such director’s pecuniary interest therein as disclosed above.
The exercise price for our options is denominated in Hong Kong dollars. This annual report translates the Hong Kong dollar exercise prices for our options into U.S. dollars based on exchange rates that were in effect as of the applicable option grants dates.
The compensation committee has issued to each of our executive officers options to purchase ordinary shares pursuant to our 2001 Regulation S Stock Option Plan, 2001 Regulation S Preference Shares Stock Plan and the 2004 Stock Option Plan, as applicable, and restricted share units that represent rights to receive ordinary shares pursuant to our 2004 Equity Incentive Plan. The exercise price of the options ranges from US$0.035 to US$0.0345.0.345. The options expire between April 23, 2013March 17, 2014 and September 11, 2022. The restricted share units expire between May 30, 2012 and September 11, 2022.June 16, 2023. The majority of the options and restricted share units are subject to a four-yearfour- year vesting period. Each executive officer owns less than 1% of the total outstanding shares.
2001 Stock Plan and 2001 Regulation S Stock Plan
Type of Awards. Stock options, including incentive stock options, or ISOs, or non-qualified stock options, or NSOs, under the 2001 Stock Plan, and NSOs under the 2001 Regulation S Stock Plan.
Plan Administration. The board of directorsBoard and the compensation committee administer the 2001 Stock Plan and 2001 Regulation S Stock Plan. The compensation committee selected the eligible persons above a certain compensation grade to whom options were granted and determined the grant date, amounts, exercise prices, vesting periods and other relevant terms of the stock options, including whether the options will be ISOs or NSOs. The non-executive option grant committee selected the eligible persons below a certain compensation grade to whom options were granted and determined the grant date, amounts, exercise prices, vesting periods and other relevant terms of stock options within parameters established by the compensation committee and subject to compensation committee ratification. The exercise price of ISOs granted under the 2001 Stock Plan and NSOs granted to residents of California under the 2001 Stock Plan may not be less than 100% and 85%, respectively, of the fair market value of our ordinary shares on the grant date. The exercise price of NSOs granted to people who are not residents of California under either our 2001 Stock Plan or our 2001 Regulation S Stock Plan can be determined by the board of directors,Board, the compensation committee or the non-executive option grant committee in their discretion.
Terms of Awards. Stock options granted under the 2001 Stock Plan and 2001 Regulation S Stock Plan may be exercised at any time after they vest, and, in certain instances, prior to vesting. Shares purchased when an option is exercised prior to vesting are subject to our right of repurchase to the extent unvested in the event of the termination of service of the optionee. In the event of the termination of service of an optionee, the unvested portion of a stock option is forfeited and the vested portion terminates six months after a termination of service due to the death or permanent disability of the optionee or 30 days after termination of service for any other reason or such longer periods as may be provided for in option agreements with our optionees. Stock options are generally not transferable during the life of the optionee.
Acceleration of Vesting. In the event of a change of control (as defined in the plans) or a merger of our company, each outstanding stock option may be assumed or an equivalent stock option or right may be substituted by the successor corporation. In the event that no such substitution or assumption occurs, the outstanding stock options will automatically vest and become exercisable for a period of 15 days, after which the stock options will terminate.
Termination. The 2001 Stock Plan and 2001 Regulation S Stock Plan terminate on December4, 2013 but maybe terminated earlier by our board of directors.the Board.
As of December 31, 2012,2013, there were 88,301,02355,262,975 ordinary shares subject to outstanding stock options under the 2001 Stock Plan and the 2001 Regulation S Stock Plan. We have not issued stock options under the 2001 Stock Plan or the 2001 Regulation S Stock Plan since March 18, 2004 and our board has elected not to grant any further options under these plans.
2001 Preference Shares Stock Plan and 2001 Regulation S Preference Shares Stock Plan
Type of Awards. Stock options for ordinary shares, including ISO and NSOs under the 2001 Preference Shares Stock Plan and NSOs under the 2001 Regulation S Preference Shares Stock Plan.
Plan Administration. The board of directors,Board, the compensation committee and the non-executive option grant committee administer the 2001 Preference Shares Stock Plan and 2001 Regulation S Preference Shares Stock Plan. The compensation committee selected the eligible persons above a certain compensation grade to whom options were granted and determined the grant date, amounts, exercise prices, vesting periods and other relevant terms of the stock options, including whether the options will be ISOs or NSOs. The non-executive option grant committee selected the eligible persons below a certain compensation grade to whom options were granted and determined the grant date, amounts, exercise prices, vesting periods and other relevant terms of stock options within parameters established by the compensation committee and subject to compensation committee ratification. The exercise price of ISOs granted under the 2001 Preference Shares Stock Plan and NSOs granted to residents of California under the 2001 Preference Shares Stock Plan may not be less than 100% and 85%, respectively, of the fair market value of our Series A convertible preference shares on the grant date. The exercise price of NSOs not granted to California residents under either our 2001 Preference Shares Stock Plan or our 2001 Regulation S Preference Shares Stock Plan can be determined by the board of directors,Board, the compensation committee or the non-executive option grant committee in their discretion.
Terms of Awards. Stock options granted under the 2001 Preference Shares Stock Plan and 2001 Regulation S Preference Shares Stock Plan may be exercised at any time after they vest, and, in certain instances, prior to vesting. Shares purchased when an option is exercised prior to vesting are subject to our right of repurchase to the extent unvested in the event of the termination of service of the optionee. In the event of the termination of service of an optionee, the unvested portion of a stock option is forfeited and the vested portion terminates six months after a termination of service due to the death or permanent disability of the optionee or 30 days after termination of service for any other reason or such longer periods as may be provided for in option agreements with our optionees. Stock options are generally not transferable during the life of the optionee.
Acceleration of Vesting. In the event of a change of control (as defined in the plans) or a merger of our company, each outstanding stock option may be assumed or an equivalent stock option or right may be substituted by the successor corporation. In the event that no such substitution or assumption occurs, the outstanding stock options will automatically vest and become exercisable for a period of 15 days, after which the stock options will terminate.
Termination.
As of December 31, 2012,2013, there were 197,000nil ordinary shares subject to outstanding options under the 2001 Preference Shares Stock Plan and the 2001 Regulation S Preference Shares Stock Plan. We have not issued stock options under the 2001 Preference Shares Stock Plan or the 2001 Regulation S Preference Shares Stock Plan since March 18, 2004, and our board has elected not to grant any further options under these plans.
Stock Incentive Schemes
2004 Global EquityStock Incentive Compensation ProgramPlans
2004 Stock Option Plan
Our shareholders adopted on February 16, 2004 a 2004 Stock Option Plan which then became effective on March 18, 2004 and further amended it on June 23, 2009. The number of our Ordinary Shares that may be issued pursuant to our 2004 Stock Option Plan and our 2004 Employee Stock Purchase Plan shall not, in the aggregate, exceed 2,434,668,733 Ordinary Shares.
In no event may the number of Ordinary Shares that may be issued pursuant to any outstanding stock option granted under this 2004 Stock Option Plan or any of our other stock option plans or any outstanding purchase right granted under our 2004 Employee Stock Purchase Plan or any other of our employee stock purchase plans exceed, in the aggregate, thirty percent (30%) of the issued and outstanding Ordinary Shares in issuance from time to time. Stock options issued under the 2004 Stock Option Plan may be issued in the form of Ordinary Shares or American depositary shares. For purposes of determining the number of our Ordinary Shares available under the 2004 Stock Option Plan, the 2004 Equity Incentive Plan,issuance of an American depositary share is deemed to equal fifty underlying Ordinary Shares. In addition, Ordinary Shares or EIP, andAmerican depositary shares subject to stock options under the Employee Stock Purchase Plan (the “ESPP”, together with the Stock Option Plan and the EIP, the “Option Plans”) to attract and retain its employees.
Stock Option Plan
The following is a summary of the principal terms of the Stock Option Plan conditionally adopted by the Company by way of shareholders’ resolution dated February 16,Company’s 2004 and Directors’ resolutions passed on January 16, 2004. Adoption of the Stock Option Plan took effect on March 18, 2004 being the first date of dealings in the ordinary shares.
Summary of the terms of the Stock Option Plan
(a) Purpose of the Stock Option Plan
The purposes of the Stock Option Plan are again available for grant and issuance under our 2004 Stock Option Plan to attract, retainthe extent such stock options have lapsed without Ordinary Shares or American depositary shares being issued.
Our 2004 Stock Option Plan authorizes the award of incentive stock options (ISOs) within the meaning of Section 422 of the United States Internal Revenue Code of 1986, as amended, non-qualified stock options and motivatedirector options.
Director options are non-qualified options granted to non-employee members of the Board, or non-employee Directors. The terms of director options may vary among non-employee Directors and the 2004 Stock Option Plan does not impose any requirement to grant director options subject to uniform terms.
Our 2004 Stock Option Plan is administered by our compensation committee or by our board of directors acting in place of our compensation committee. The compensation committee has the authority to construe and interpret our 2004 Stock Option Plan, grant stock options and make all other determinations necessary or advisable for the administration of the plan.
Our 2004 Stock Option Plan provides for the grant of options to our employees, and Directors of, andofficers or other service providers to the Company, to provide a means, on and after the Global Offering, of compensating them through the grant of stock options for their contribution to our growth and profits, and to allow such employees, Directors and service providers to participate in such growth and profitability.
(b) Who may join
The Compensation Committee may, at its discretion, invite any employee, officer or other service provider of (including, but not limited to, any professional or other adviser of, or consultant or contractor to) the Company whether located in China, the United States or elsewhere, to take up options to subscribe for ordinary shares at a price calculated in accordance with sub-paragraph (e) below. The Compensation Committee may also grant stock optionsor to a Director who is not antrust established in connection with any employee benefit plan of the Company (“Non- Employee Director”).
(c) Stock Options
Stock options granted under(including the 2004 Stock Option Plan (“Stock Options”) shall entitle a participant (“Participant”) of the Stock Option Plan to purchase a specified number of ordinary shares or ADSs (the “Plan Shares”) during a specified period at a price calculated in accordance with sub-paragraph (e) below. Three types of Stock Options may be granted under the Plan, an Incentive Stock Option, a Non-Qualified Stock Option or a Director Option. An Incentive Stock Option is a stock option that falls within the meaning of Section 422 of the U.S. Internal Revenue Code of 1986 and may only be granted to employees of the Company and its subsidiaries from time to time. A Non-Qualified Stock Option is a stock option that is not an Incentive Stock Option. A Director Option is a Non-Qualified Stock Option granted to a Non-Employee Director.
The Company shall issue an Award Document to each Participant of the Stock Option Plan who is granted a Stock Option. The Award Document shall set out the terms and provisions of the grant of a Stock Option to a Participant including applicable vesting dates or the attainment of specified performance goals (as determined by the Compensation Committee or the Administrator (as defined below), as the case may be) by the Participant. The Company may allow a Participant to exercise his or her Stock Options prior to vesting, provided the Participant agrees to enter into a repurchase agreement in respect of the Stock Option with the Company. The Compensation Committee may also (i) accelerate the vesting of a Stock Option (ii) set the date on which any Stock Option may first become exercisable, or (iii) extend the period during which a Stock Option remains exercisable, except that no Stock Options may be exercised after the tenth anniversary of the date of grant.
The Stock Option Plan does not provide for any payment upon application or acceptance of an option.
(d) Administration of the Stock Option Plan
The Compensation Committee shall be responsiblePlan) for the administrationbenefit of the Stock Option Plan. Its responsibilities include granting Stock Options tothose individuals eligible individuals, determining the number of Plan Shares subject to each Stock Option, and determining the terms and conditions of each Stock Option.
The Compensation Committee is not obliged to grant Stock Options to Participants in uniform terms. Accordingly, the terms and conditions which may be imposed may vary between Participants. Any determination by the Compensation Committee in relation to the carrying out and administering of the Stock Option Plan shall be final and binding. No member of the Compensation Committee shall be liable for any action or determination made in good faith, and the members of the Compensation Committee shall be entitled to indemnification and reimbursement in the manner provided in the Articles.
The Compensation Committee may delegate some or all of its authority under the Stock Option Plan to an individual or individuals (each an “Administrator”) who may either be one or more of the members of the Committee or one or more of the officers of the Company. An individual’s status as an Administrator shall not affect his or her eligibility to participate in the 2004 Stock Option Plan. The Compensation Committee shall not delegate its authority to grant Stock Options to executive officers of the Company.
(e) Exercise Price
The exercise price per Plan Share purchasable under a Stock Option shall be fixed by the Committee at the time of grant or by a method specified by the Compensation Committee at the time of grant, but in no event shall be less than the Fair Market Value of a Plan Share on the date such Stock Option is granted.
The Fair Market Value of a Share will be the higher of (i) the closing price of the ordinary shares on the HKSE’s daily quotation sheet on the applicable date of grant (which must be a business day), and (ii) the average closing price of the ordinary shares on the HKSE (as stated in the relevant daily quotation sheets of the HKSE) for the five business days immediately preceding the date of grant.
The Fair Market Value of the ADSs shall be the highest of (i) the closing price of the ADSs on the NYSE on the applicable date of grant, and (ii) the average closing price of the ADSs on the NYSE for the five business days immediately preceding the date of grant.
(f) Limit of the Stock Option Plan
At the annual general meeting of the shareholders held on June 23, 2010, the shareholders of the Company approved an increase to the number of ordinary shares reserved for issuance under the Stock Option Plan and the ESPP (the “Global Limit”) from 1,317,000,000 ordinary shares of the Company to 2,434,668,733 ordinary shares of the Company.
The number of ordinary shares whichPlan; provided that, ISOs may be issued pursuantgranted only to any outstanding Stock Options granted and yet to be exercised under the Stock Option Plan and all outstanding purchase rights granted under the Employee Stock Purchase Plan or other employee stock purchase plan of the Company must not exceed in aggregate 30 percent of the issued and outstanding ordinary shares in issuance from time to time.
(g) Individual Limit
our employees. The total number of ordinary sharesOrdinary Shares underlying stock granted pursuant to the 2004 Stock OptionsOption Plan or any of our other options granted by the Companystock option plans to, and the total number of ordinary sharesOrdinary Shares that may be purchased under one or more purchase rights granted under theour 2004 Employee Stock Purchase Plan or any of our other employee stock purchase plan granted by the Companyplans by, a Participantparticipant (including both exercised and outstanding Stock Options)stock options) in any twelve-month period may not exceed at any time one percent (1%) (or 0.1 percent0.1% in the case of an independent Non-executive Director)“independent non-executive Director” (as that term is used in the Hong Kong Stock Exchange Listing Rules) of the then issued and outstanding ordinary shares unless otherwise allowed under the Rules Governing the Listing of Securities on theOrdinary Shares subject to such changes from time to time to applicable Hong Kong Stock Exchange , or the Listing Rules.
(h) ExerciseThe exercise price of Option
A Stock Option shall vest, andstock options must be exercised, in accordance withat least equal to the termsfair market value of the Stock Option Plan, the relevant Award Document and any rules and procedures established by the Compensation Committee for this purpose. However, the term of each Stock Option shall not exceed ten years fromour Ordinary Shares on the date of grant.
(i) Director Options
Each non-employee Director may be granted Stock Options to purchase ordinary shares (or an equivalent of ADSs) on the terms set out in the relevant Award Document.
The Directors shall exercise all authority and responsibility with respect to Stock Options granted to Directors subject to the requirements of the Listing Rules.
All non-employee Directors’ Stock Options shall only vest provided that the Director has remained in service as a Director through such vesting date. The unvested portion of a Stock Option granted to a Director shall be forfeited in full if the Director’s service with the Board ends for any reason prior to the applicable vesting date.
Following termination of a non-employee Director’s service on the Board, such non-employee Director (or his or her estate, personal representative or beneficiary, as the case may be) shall be entitled to exercise those of his or her Stock Options which have vested as of the date of such termination within 120 days following such termination.
(j) Termination or Lapse of Option
A Stock Option shall terminate or lapse automatically on: (i) the expiry of ten years from the date of grant;
(ii) the termination of a Participant’s employment or service with the Company for a reason set out in sub-paragraph (l) below;
(iii) save as to any contrary directions of the Compensation Committee, in the event of a complete liquidation or dissolution of the Company, all Stock Options outstanding at the time of the liquidation or dissolution shall terminate without further action by any person;
(iv)In general, options granted under the sale2004 Stock Option Plan vest over a four-year period. Options may vest based on time or other divestitureachievement of a subsidiary, divisionperformance conditions. Our compensation committee may provide for options to be exercised only as they vest or operating unitto be immediately exercisable with any Ordinary Shares or American depositary shares issued on exercise being subject to our right of repurchase that lapses as the shares vest. The maximum term of options granted under our 2004 Stock Option Plan is ten years, subject to changes under the Hong Kong Stock Exchange Listing Rules, as determined by our compensation committee. Unless otherwise permitted by our compensation committee, stock options may be exercised during the lifetime of the Company (where the Participant is employed by such subsidiary, division or operating unit); and
(v) termination of the service relationship with a service provider (where the Participant is a service provider of the Company).
(k) Rights are personal to Participant
A Stock Option is personal to the Participant and shall be exercisable by such Participant or his Permitted Transferee (as defined below) only. An option shall not be transferred other than by will,optionee only by the laws of descent and distributionoptionee or pursuant to a domestic relations order. The Compensation Committee may also, at its discretion and subject to such terms and conditions as it shall specify, permit the transfer of a Stock Option for no consideration to a Participant’soptionee’s family members or to a trust or partnership established for the benefit of such family members (collectively “Permitted Transferees”). Anymembers. Options granted under our 2004 Stock Option Plan may not be transferred to a Permitted Transferee shall be further transferable onlyin any manner other than by will or by the laws of descent and distribution, or pursuant to a domestic relations order or as determined by our compensation committee. Options granted under our 2004 Stock Option Plan generally may be exercised for no consideration, to another Permitted Transfereea period of ninety days after the termination of the Participant.
(l) Terminationoptionee’s service to us, except that director options may be exercised for a period of employment or service
If a Participant’s employment or service withone hundred and twenty days after the Company is terminated for the following reasons:
(i) the failure or refusaltermination of the Participantnon-employee Director’s service to substantially perform the duties required of him or her as an employee or officer of, or service provider to, the Company;
(ii) any material violation by the Participant of any law or regulation applicable to any business of the Company, or the Participant’s conviction of, or a plea of nolo contendere to, a felony, or any perpetration by the Participant of a common law fraud against the Company; or
(iii) any other misconduct by the Participant that is materially injurious to the financial condition, business or reputation of the Company,
Then all Stockus. Options granted to the Participant, whether or not then vested shallgenerally terminate immediately lapse.
The Compensation Committee may permit any Incentive Stock Option to convert into a Non-Qualified Stock Option as of a Participant’supon termination of employment for purposes of providing such Participant with the benefit of any extended exercise period applicable to Non-Qualified Stock Options when the contract of employment of the holder of Incentive Stock Option terminates.
(m) Change in control of the Companycause.
The Compensation Committee may specify atnumber and kind of our Ordinary Shares or afterAmerican depositary shares authorized for issuance under the date of grant of avarious limits set forth in the 2004 Stock Option Plan, the effect that a Change in Control (as defined in the Stock Option Plan) will have on such Stock Option. The Compensation Committee may also, in contemplationnumber of a Change in Control, accelerate the vesting, exercisability or payment of Stock Options to a date prior to the Change in Control, if the Compensation Committee determines that such action is necessary or advisable to allow the participants to realize fully the value of their shareoutstanding stock options in connection with such Change in Control.
(n) Change in the capital structure of the Company
In the event of an alteration in the capital structure of the Company (which includes a capitalization issue, reduction of capital, consolidation, sub-division of Plan Shares, or rights issue to purchase Plan Shares at a price substantially below market value), the Compensation Committee may equitably adjustand the number and kind of Plan Shares authorized for issuanceshares subject to any outstanding stock options and the exercise price per share, if any, under any outstanding stock option are equitably adjusted (including by payment of cash to a participant) by our compensation committee in the event of a capitalization issue, rights issue, sub-division or consolidation of shares or reduction of capital in order to preserve, but not increase, the benefits or potential benefits intended to be made available under the Stock Option Plan. In addition, upon the occurrence of any of the foregoing events, the number of outstanding Stock Options and the number and kind of shares subject to any outstanding Stock Option and the purchase price per share under any outstanding Stock Option shall be equitably adjusted so as to preserve the benefits or potential benefits intended to be made available to Participants.
(o) Period of the Stock Option Plan
The Stock Option Plan shall remain in force for a period of ten years commencing on the date of Shareholders’ approval of the Plan.
(p) Amendments and Termination
The Stock Option Plan may be altered, amended in whole or in part, suspended and terminated by the Board at any time provided alterations or amendments of a material nature or any change to the terms of the Stock Options granted must be approved by the shareholders of the Company, unless such alteration or amendment takes effect automatically under the terms of the Stock Option Plan. For the avoidance of doubt, any alteration or amendment pursuant to the exercise of any authority granted under the Stock Option Plan shall be deemed to take effect automatically under the terms of the Share Option Plan. Any alteration or amendment must be in accordance with the requirements of the Listing Rules or permitted by the HKSE.
If the Stock Option Plan is terminated early by the Board, no further Stock Options may be offered but unless otherwise stated in the Plan, Stock Options granted before such termination shall continue to be valid and exercisable in accordance with the2004 Stock Option Plan.
(q) VotingOur 2004 Stock Option Plan provides that in the event of a change in control, including without limitation a person or entity acquiring beneficial ownership of 35% of our then-outstanding shares entitled to vote in the election of the Board, the complete dissolution of the Company, consolidation, merger, or similar transaction involving the Company, the sale of all or substantially all of the assets of us or the consolidated assets of us and dividend rights
No voting rights shall be exercisable and no dividends shall be payableour subsidiaries, a substantial change in relation to Stock Options that have not been exercised.
(r) Cancellationthe composition of Stock Options
Stock Options granted but not exercised may not be cancelled unless an offer to cancel share options has been made pursuant to Rule 13 ofthe Board or any change in control as defined in the Hong Kong Code on Takeovers and Mergers, andour compensation committee determines how to treat each outstanding stock award. The compensation committee of the Hong Kong Securities and Futures commission has consentedCompany may:
·shorten the period during which the stock options are exercisable;
·accelerate the vesting of the stock options or waive, in whole or in part, any performance conditions to such cancellation.vesting;
(s) Ranking·arrange for the assumption or replacement of Ordinary Sharesstock options by a successor corporation;
The ordinary·adjust stock options or their replacements so that such stock options are in respect of the shares of stock, securities or other property (including cash) as may be issuable or payable as a result of such transaction;
·cancel the stock option prior to the transaction in exchange for a cash payment, which may be allotted uponreduced by the exercise of a Stock Option will be subject to the Articles for the time beingprice payable in force and will rank pari passuconnection with the Plan Shares in issue on the date of such allotment.stock option.
Employee Stock Purchase PlanIn the event of a change in control that results in a complete liquidation or dissolution of the Company, all outstanding stock options immediately terminate.
Our 2004 Stock Option Plan was terminated on November 15, 2013. The following is a summary of the principal terms of the ESPP conditionally adopted by the Company by way of shareholders’ resolutions dated February 16, 2004stock options granted before such termination remain outstanding and Directors’ resolutions passed on January 16, 2004.
Summary ofcontinue to vest and become exercisable in accordance with, and subject to, the terms of the ESPP (a) Purposes of the ESPP
The purposes of the ESPP are to attract, retain and motivate employees of the Company, to provide a means of compensating the employees for their contributions to the growth and profitability by permitting such employees to purchase the ADSs of the Company at a discount and receive favorable U.S. income tax treatment on a subsequent qualifying disposition of such ADSs.2004 Stock Option Plan.
(b) Who may join2004 Employee Stock Purchase Plan
SubjectOur shareholders adopted on February 16, 2004 a 2004 Employee Stock Purchase Plan and further amended it on June 23, 2009 in order to enable eligible employees to purchase our Ordinary Shares in the form of American depositary shares at a discount. Purchases are accomplished through participation in discrete offering periods. Our 2004 Employee Stock Purchase Plan is intended to qualify as an employee stock purchase plan under Section 423 of the Internal Revenue Code of 1986, as amended. The number of our Ordinary Shares that may be issued pursuant to the 2004 Employee Stock Purchase Plan and our 2004 Stock Option Plan shall not, in the aggregate, exceed 2,434,668,733 Ordinary Shares. In no event may the number of Ordinary Shares that may be issued pursuant to any contrary directions given byoutstanding purchase right granted under this 2004 Employee Stock Purchase Plan or any of our other employee stock purchase plans or any outstanding stock option granted under our 2004 Stock Option Plan or any of our other stock option plans exceed, in the Compensation Committee, all full-time and regular part-time employees (the “Employees”aggregate, thirty percent (30%) of the Company as atissued and outstanding Ordinary Shares in issuance from time to time, subject to such changes with respect to such thirty percent (30%) limit that may apply from time to time under the first business day (the “Offering Date”)Hong Kong Stock Exchange Listing Rules. All shares purchased under the 2004 Employee Stock Purchase Plan shall be issued in the form of American depositary shares. For purposes of determining the number of the Company’s Ordinary Shares available under the 2004 Employee Stock Purchase Plan, the issuance of an American depositary share is deemed to equal fifty underlying Ordinary Shares.
Our compensation committee administers our 2004 Employee Stock Purchase Plan. Our employees generally are eligible to participate in our 2004 Employee Stock Purchase Plan; our compensation committee may impose additional eligibility conditions upon the employees of one of the Company’s subsidiaries or exclude employees of a given period specified by the Committee (the “Offering Period”) shall be eligible to enrollsubsidiary from participation. Employees who are 5% stockholders, or would become 5% stockholders as a result of their participation in the ESPP. To be eligible to purchase ADSs, all Employees must maintain his or her employment status, without interruption, with the Company through the last day of each Offering Period (the “Purchase Date”)
(c) Offering Period
The ESPP shall be implemented over a series of Offering Periods. An eligibleCompany’s 2004 Employee of the Company may electStock Purchase Plan, are ineligible to participate in the ESPP forCompany’s 2004 Employee Stock Purchase Plan. In addition, to comply with the Hong Kong Stock Exchange Listing Rules, unless otherwise allowed under such rules, no employee can be granted a right to purchase American depositary shares, or a purchase right under the 2004 Employee Stock Purchase Plan if such purchase right would permit the employee to purchase Ordinary Shares or American depositary shares under all employee stock purchase plans or other option plans of the Company granted to the employee in any Offering Periodtwelve-month period to exceed one percent (1%) of the then issued and outstanding Ordinary Shares.
Under our 2004 Employee Stock Purchase Plan, eligible employees are able to acquire our American depositary shares by completingaccumulating funds through payroll deductions. Our compensation committee determines the requisite documents.maximum amount that any employee may contribute to his or her account under the 2004 Employee Stock Purchase Plan during any calendar year. We also have the right to amend or terminate our 2004 Employee Stock Purchase Plan at any time and our 2004 Employee Stock Purchase Plan was terminated on November 15, 2013.
New participants are required to enroll in a timely manner as specified by the Company’s compensation committee.
Once an employee is enrolled, participation is automatic in subsequent offering periods. The Compensation Committeelength of each offering period shall determinebe no shorter than six months and no longer than twenty-seven months. The Company’s compensation committee determines the starting and ending dates of each Offering Period but no Offering Period shall be shorter than 6 months or longer than 27 months.offering period. An employee’s participation automatically ends upon termination of employment for any reason.
(d) Employees’ Contributions under the ESPP93
All amountsNo participant has the right to purchase our American depositary shares in an amount, when aggregated with purchase rights under all our employee stock purchase plans that a Participant contributes (“Contributions”) shall be credited to his or her account under the ESPP. Participants must elect to have payroll deductions made on each payday during the Offering Periodare also in a dollar amount specifiedeffect in the documents submitted by him or by her. The Compensation Committee may permit Participants to make supplemental Contributions into his or her account, on such terms and subject to such limitationssame calendar year(s), that has a fair market value of more than $25,000, determined as the Compensation Committee may decide. Participants may, on one occasion only during an Offering Period, decrease the rate of his or her Contributions to his or her account for the Offering Period, including a decrease to zero. The Participant may restore his or her Contributions to the original level, prior to the earlier of,
(i) six months after the effective date of any such decrease; and
(ii) the end of the relevant Offering Period. (e) Grantfirst day of Purchase Right
Each eligible Employee who elects to participatethe applicable purchase period, for each calendar year in which that right is outstanding. On the ESPP in any given Offering Periodfirst business day of each offering period, a participant shall be granted on the Purchase Date, a purchase right, to purchase the Plan Shares (the “Purchase Right”). The Purchase Right of a Participant shall be calculated in accordance with the following formula:
determined by: (i) dividing (A) the product of US$25,000$25,000 and the number of calendar years during all or part of which the Purchase Rightpurchase right shall be outstanding by (B) the closing pricefair market value of the Plan SharesAmerican depositary shares on the applicable exchange on which Plan Shares are trading (the “Fair Market Value”) on the applicable exchangefirst business day of the Plan Shares on the Offering Date;offering period, and
(ii) subtracting from the quotient thereof (A) the number of Plan Shares thatAmerican depositary shares the Employee hasparticipant purchased during the calendar year in which the Offering Datefirst business day of the applicable offering period occurs under the ESPP2004 Employee Stock Purchase Plan or under any of our other employee stock purchase plan of the Company or any subsidiary of the Companyplans which is intended to qualify under Section 423 of the U.S. InternationalInternal Revenue Code of 1986, as amended, plus (B) the number of Plan SharesAmerican depositary shares subject on the Offering Datefirst business day of the applicable offering period to any outstanding Purchase Rightspurchase rights granted to the Employeeparticipant under any related Plan.
of our other employee stock purchase plans which is intended to qualify under Section 423 of the Internal Revenue Code of 1986, as amended. If application of the abovethis formula would result in the grant of Purchase Rightspurchase rights covering, in the aggregate, more than the number of Plan SharesAmerican depositary shares that the Compensation Committeecompensation committee has made available for the relevant Offering Period,offering period, then the Compensation Committeecompensation committee shall adjust the number of Plan SharesAmerican depositary shares subject to the Purchase Rightpurchase right in order that, following such adjustment, the aggregate number of Plan SharesAmerican depositary shares subject to the purchase Rightright shall remain within the applicable limit.
AllThe purchase price for shares of our American depositary shares purchased under our 2004 Employee Stock Purchase Rights outstanding at the tenth anniversaryPlan shall be 85% of the lesser of the fair market value of our American depositary shares on (i) the first business day of the applicable offering period and (ii) the last day of the applicable offering period.
We have never granted any purchase right under our 2004 Employee Stock Purchase Plan shall remain outstanding throughbefore it was terminated on November 15, 2013.
Amended and Restated 2004 Equity Incentive Plan
Our shareholders adopted an Amended and Restated 2004 Equity Incentive Plan that became effective on June 3, 2010. The aggregate number of the Ordinary Shares that may be exercised uponissued pursuant to the relevant Purchase Date, but no additional Purchase Right shall be grantedAmended and Restated 2004 Equity Incentive Plan may not exceed 1,015,931,725 Ordinary Shares. Awards issued under the ESPP.Amended and Restated 2004 Equity Incentive Plan may be issued in the form of Ordinary Shares or American depositary shares. For purposes of determining the number of the Ordinary Shares available under the Amended and Restated 2004 Equity Incentive Plan, the issuance of an American depositary share is deemed to equal fifty underlying Ordinary Shares. In addition, the following Ordinary Shares or American depositary shares may become available for issuance under the Company’s Amended and Restated 2004 Equity Incentive Plan:
84·Ordinary Shares or American depositary shares forfeited or withheld from issuance to settle an award;
·Ordinary Shares or American depositary shares withheld to satisfy the tax withholding obligations related to any award; and
·Ordinary Shares or American depositary shares subject to awards granted under our Amended and Restated 2004 Equity Incentive Plan that otherwise terminate or lapse without ordinary shares or American depositary shares being issued.
Our Amended and Restated 2004 Equity Incentive Plan authorizes the award of restricted share awards (RSAs), stock appreciation rights (SARs), restricted share units (RSUs), and other equity-based or equity- related awards based on the value of the Ordinary Shares. Cash payments based on criteria determined by the compensation committee may also be awarded under the Amended and Restated 2004 Equity Incentive Plan.
(f) ExerciseOur Amended and Restated 2004 Equity Incentive Plan is administered by our compensation committee or by the Board acting in place of Purchase Rightour compensation committee. The Company’s compensation committee has the authority to construe and interpret our Amended and Restated 2004 Equity Incentive Plan, grant awards and make all other determinations necessary or advisable for the administration of the plan.
Our Amended and Restated 2004 Equity Incentive Plan provides for the grant of awards to our employees, officers or other service providers located in China, the United States or elsewhere, or to a trust established in connection with any employee benefit plan of the Company (including the Amended and Restated 2004 Equity Incentive Plan) for the benefit of those individuals eligible to participate in the Amended and Restated 2004 Equity Incentive Plan.
An RSA is an award of the Ordinary Shares or American depositary shares that are granted for no consideration other than the provision of services (or such minimum payment as may be required under applicable law). The price (if any) of an RSA is determined by the compensation committee. Unless a Participant withdraws fromotherwise determined by the ESPP, his or her Purchase Right shall become exercisable automatically,compensation committee at the time of award, vesting ceases on the Purchase Datedate the participant no longer provides services to us and unvested shares are forfeited to or repurchased by us. Performance-based RSAs that vest based on the attainment of one or more performance goals over a period of time that the compensation committee determines may also be awarded under the Amended and Restated 2004 Equity Incentive Plan.
Stock appreciation rights provide for a payment, or payments, in cash, Ordinary Shares or American depositary shares, to the holder based upon the difference between the fair market value of the relevant Offering Period forOrdinary Shares or American depositary shares on the date of exercise and the stated exercise price up to a maximum amount of cash or number of Ordinary Shares or American depositary shares. SARs may vest based on time or achievement of performance conditions. The compensation committee may determine whether SARs may be granted alone or in tandem with a stock option granted under our 2004 Stock Option Plan or another award.
Restricted share units represent the right to receive the Ordinary Shares obtained by dividingor American depositary shares at a specified date in the accumulated Contributions creditedfuture, subject to forfeiture of that right because of termination of employment or failure to achieve certain performance conditions. If an RSU has not been forfeited, then on the date specified in the RSU agreement, we deliver to the Participant’s account asholder of the Purchase Date byrestricted share unit the applicable Purchase Price, being an amount not less than 85 percentOrdinary Shares (which may be subject to additional restrictions) or American depositary shares, cash or a combination of the Fair Market Value of the PlanOrdinary Shares on the Offering Dateand cash or on the Purchase Date, whichever is lower (the “Purchase Price”).
The Compensation Committee may credit any Contributions that have been credited to a Participant’s account under the ESPP with interest. Any interest credited to a Participant’s account shall not be used to purchase ADSsour American depositary shares and shall instead be paid to the Participant at the end of the relevant Offering Period.
If any portion of a Participant’s accumulated Contributions is not used to purchase ordinary shares on a given Purchase Date, the remaining amount shall be held in the Participant’s account and used for the purchase of Plan Shares under the next Offering Period, unless the Participant withdraws from the next Offering Period.
The exercise of the Purchase Right granted under the ESPP is not subject to any performance target.
(g) Limit of the ESPPcash.
The number and kind of ordinarythe Ordinary Shares or American depositary shares that may be issued under the Stock Optionvarious limits set forth in the Amended and Restated 2004 Equity Incentive Plan, the number of outstanding awards and the ESPP (the “Global Limit”)number and kind of shares subject to any outstanding award and the purchase price per share, if any, under any outstanding award shall be equitably adjusted (including by payment of cash to a participant) by the compensation committee in the event of a capitalization issue, rights issue, sub-division or consolidation of shares or reduction of capital in order to preserve, but not exceed ten percentincrease, the benefits or potential benefits intended to be made available under the Amended and Restated 2004 Equity Incentive Plan.
Awards granted under our Amended and Restated 2004 Equity Incentive Plan may not be transferred in any manner other than by will or by the laws of descent and distribution, or pursuant to a domestic relations order or as determined by our compensation committee.
Our Amended and Restated 2004 Equity Incentive Plan provides that in the event of a change in control, including without limitation a person or entity acquiring beneficial ownership of 35% of our then-outstanding shares entitled to vote in the election of the issued and outstanding ordinary shares immediately followingBoard, the closingcomplete dissolution of the Global Offering (i.e., 1,317,000,000).
The number of ordinary shares that may be issued upon exerciseCompany, consolidation, merger, or similar transaction involving the Company, the sale of all outstanding Purchase Rights granted underor substantially all of the ESPP or other employee stock purchase planassets of the Company or the consolidated assets of us and our subsidiaries, a substantial change in the composition of the Board or any outstanding stock options granted underchange in control as defined in the Stock Option Plan or other stock option planHong Kong Code on Takeovers and Mergers, the compensation committee of the Company must not exceed, indetermines how to treat each outstanding award. The compensation committee may:
·shorten the aggregate, thirty percentperiod during which the awards may be settled;
·accelerate the vesting of the issued and outstanding ordinary sharesaward or waive, in issuance from timewhole or in part, any performance conditions to time.such vesting;
(h) Period·arrange for the assumption or replacement of an award by a successor corporation;
·adjust awards or their replacements so that such awards are in respect of the ESPPshares of stock, securities or other property (including cash) as may be issuable or payable as a result of such transaction; or
The ESPP shall continue·cancel the award prior to the transaction in exchange for a term of ten years from the date of its approvalcash payment, which may be reduced by the Shareholders unless terminatedexercise price payable in accordanceconnection with sub-paragraph (i).the award.
(i) Amendments and Termination ofIn the ESPP
The Compensation Committee may at any time amend the ESPP in any respect or terminate the ESPP, except that, without the approval of our shareholders at a meeting duly called, no amendment shall be made in relation to:
(i) increasing the number of ADSs approved for the ESPP; or
(ii) decreasing the Purchase Price per ADSs.
Any alterations or amendmentsevent of a material naturechange in control that results in a complete liquidation or any change to the terms of the Purchase Rights granted must be approved by the shareholdersdissolution of the Company, unless such alteration or amendment takes effect automatically under the terms of the ESPP. For the avoidance of doubt, any alteration or amendment pursuant to the exercise of any authority granted under the ESPP shall be deemed to take effect automatically under the terms of the ESPP. Any amendment made to the ESPP must be in accordance with the requirements of the Listing Rules or permitted by the SEHK.all outstanding awards immediately terminate.
If the ESPP isOur Amended and Restated 2004 Equity Incentive Plan was terminated by the Board prior to the tenth anniversary of the date of Board approval, unless the Compensation Committee has also terminated any Offering Period then in progress, Purchase Rightson November 15, 2013. The awards granted before such termination shallremain outstanding and continue to be valid and exercisablevest in accordance with, and subject to, the terms and conditions of the Amended and Restated 2004 Equity Incentive Plan.
852014 Stock Incentive Plans
2014 Stock Option Plan
We adopted a 2014 Stock Option Plan that became effective on November 15, 2013 when the 2014 Stock Option Plan was registered with the PRC State Administration of Foreign Exchange. The number of Ordinary Shares that may be issued pursuant to the 2014 Stock Option Plan and the 2014 Employee Stock Purchase Plan (if adopted) shall not, in the aggregate, exceed 3,207,377,124 Ordinary Shares. In no event may the number of Ordinary Shares that may be issued pursuant to any outstanding stock option granted under this 2014 Stock Option Plan or any of our other stock option plans or any outstanding purchase right granted under the 2014 Employee Stock Purchase Plan (if adopted) or any other of our employee stock purchase plans exceed, in the aggregate, thirty percent (30%) of the issued and outstanding Ordinary Shares in issuance from time to time, subject to such changes with respect to such thirty percent (30%) limit that may apply from time to time under the Hong Kong Stock Exchange Listing Rules. Stock options issued under the 2014 Stock Option Plan may be issued in the form of Ordinary Shares or American depositary shares. For purposes of determining the number of our Ordinary Shares available under the 2014 Stock Option Plan, the issuance of an American depositary share is deemed to equal fifty underlying Ordinary Shares. In addition, Ordinary Shares or American depositary shares subject to stock options under the 2014 Stock Option Plan will again be available for grant and issuance under the 2014 Stock Option Plan to the extent such stock options have lapsed without Ordinary Shares or American depositary shares being issued.
Our 2014 Stock Option Plan authorizes the award of incentive stock options (ISOs) within the meaning of Section 422 of the United States Internal Revenue Code of 1986, as amended, non-qualified stock options and director options.
Director options are non-qualified options granted to non-employee members of the Board, or non-employee Directors. The terms of director options may vary among non-employee Directors and the 2014 Stock Option Plan does not impose any requirement to grant director options subject to uniform terms.
Rule 17.03(9)Our 2014 Stock Option Plan will be administered by our compensation committee or by our board of directors acting in place of the compensation committee. The compensation committee will have the authority to construe and interpret the 2014 Stock Option Plan, grant stock options and make all other determinations necessary or advisable for the administration of the plan.
Our 2014 Stock Option Plan will provide for the grant of options to our employees, officers or other service providers located in China, the United States or elsewhere, or to a trust established in connection with any employee benefit plan of the Company (including the 2014 Stock Option Plan) for the benefit of those individuals eligible to participate in the 2014 Stock Option Plan; provided, that, ISOs may be granted only to our employees. The total number of Ordinary Shares underlying stock granted pursuant to the 2014 Stock Option Plan or any of our other stock option plans to, and the total number of Ordinary Shares that may be purchased under one or more purchase rights granted under the 2014 Employee Stock Purchase Plan (if adopted) or any of our other employee stock purchase plans by, a participant (including both exercised and outstanding stock options) in any twelve-month period may not exceed at any time one percent (1%) (or 0.1% in the case of an “independent non-executive Director” (as that term is used in the Hong Kong Stock Exchange Listing Rules) of the then issued and outstanding Ordinary Shares subject to such changes from time to time to applicable Hong Kong Stock Exchange Listing Rules.
The exercise price of stock options must be at least equal to the fair market value of our Ordinary Shares on the date of grant.
In general, options will vest over a four-year period. Options may vest based on time or achievement of performance conditions. Our compensation committee may provide for options to be exercised only as they vest or to be immediately exercisable with any Ordinary Shares or American depositary shares issued on exercise being subject to our right of repurchase that lapses as the shares vest. The maximum term of options granted under the 2014 Stock Option Plan is ten years, subject to changes under the Hong Kong Stock Exchange Listing Rules, provideas determined by the compensation committee. Unless otherwise permitted by our compensation committee, stock options may be exercised during the lifetime of the optionee only by the optionee or the optionee’s guardian or legal representative. Options granted under the 2014 Stock Option Plan may not be transferred in any manner other than by will or by the laws of descent and distribution, or pursuant to a domestic relations order or as determined by our compensation committee. Options granted under the 2014 Stock Option Plan generally may be exercised for a period of ninety days after the termination of the optionee’s service to us, except that director options may be exercised for a period of one hundred and twenty days after the termination of the non- employee Director’s service to us. Options generally terminate immediately upon termination of employment for cause.
The number and kind of our Ordinary Shares or American depositary shares authorized for issuance under the various limits set forth in the 2014 Stock Option Plan, the number of outstanding stock options and the number and kind of shares subject to any outstanding stock options and the exercise price per share, if any, under any outstanding stock option will be equitably adjusted (including by payment of cash to a participant) by the compensation committee in the event of a capitalization issue, rights issue, sub-division or consolidation of shares or reduction of capital in order to preserve, but not increase, the benefits or potential benefits intended to be made available under the 2014 Stock Option Plan.
Our 2014 Stock Option Plan provides that in the event of a change in control, including without limitation a person or entity acquiring beneficial ownership of 35% of the Company’s then-outstanding shares entitled to vote in the election of the Board, the complete dissolution of the Company, consolidation, merger, or similar transaction involving the Company, the sale of all or substantially all of the assets of the Company or the consolidated assets of the Company and its subsidiaries, a substantial change in the composition of the Board or any change in control as defined in the Hong Kong Code on Takeovers and Mergers, the compensation committee of the Company will determine how to treat each outstanding stock award. The compensation committee of the Company may:
·shorten the period during which the stock options are exercisable;
·accelerate the vesting of the stock options or waive, in whole or in part, any performance conditions to such vesting;
·arrange for the assumption or replacement of stock options by a successor corporation;
·adjust stock options or their replacements so that such stock options are in respect of the shares of stock, securities or other property (including cash) as may be issuable or payable as a result of such transaction;
·cancel the stock option prior to the transaction in exchange for a cash payment, which may be reduced by the exercise price payable in connection with the stock option.
In the event of a change in control that results in a complete liquidation or dissolution of the Company, all outstanding stock options will immediately terminate.
Our 2014 Stock Option Plan will terminate ten years from the date of registration of the Plan with the PRC State Administration of Foreign Exchange, unless it is terminated earlier by the Board. The Board may amend or terminate the 2014 Stock Option Plan at any time. If the Board amends the 2014 Stock Option Plan, it does not need to ask for shareholders approval of the amendment unless required by applicable law.
2014 Equity Incentive Plan
We adopted a 2014 Equity Incentive Plan that became effective on November 15, 2013 when the 2014 Equity Incentive Plan was registered with the PRC State Administration of Foreign Exchange. The aggregate number of the Ordinary Shares that may be issued pursuant to the 2014 Equity Incentive Plan may not exceed 801,844,281 Ordinary Shares. Awards issued under the 2014 Equity Incentive Plan may be issued in the form of Ordinary Shares or American depositary shares. For purposes of determining the number of the Company’s Ordinary Shares available under the 2014 Equity Incentive Plan, the issuance of an American depositary share is deemed to equal fifty underlying Ordinary Shares. In addition, the following Ordinary Shares or American depositary shares will again be available for grant and issuance under the 2014 Equity Incentive Plan:
·Ordinary Shares or American depositary shares subject to stock appreciation rights granted under the 2014 Equity Incentive Plan that cease to be subject to the stock appreciation right for any reason other than exercise of the stock appreciation right;
·Ordinary Shares or American depositary shares subject to awards granted under the Company’s 2014 Equity Incentive Plan that are subsequently forfeited at the original issue price; including without limitation Ordinary Shares or American depositary shares withheld from issuance to settle an award and Ordinary Shares or American depositary shares withheld to satisfy the tax withholding obligations related to any award; and
·Ordinary Shares or American depositary shares subject to awards granted under the 2014 Equity Incentive Plan that otherwise terminate or lapse without Ordinary Shares or American depositary shares being issued.
Our 2014 Equity Incentive Plan authorizes the award of restricted share awards (RSAs), stock appreciation rights (SARs), restricted share units (RSUs) and other equity-based or equity-related awards based on the value of our Ordinary Shares. Cash payments based on criteria determined by the compensation committee may also be awarded under the 2014 Equity Incentive Plan.
Our 2014 Equity Incentive Plan will be administered by our compensation committee or by our board of directors acting in place of our compensation committee. The compensation committee will have the authority to construe and interpret the 2014 Equity Incentive Plan, grant awards and make all other determinations necessary or advisable for the administration of the plan.
Our 2014 Equity Incentive Plan will provide for the grant of awards to our employees, officers or other service providers located in China, the United States or elsewhere, or to a trust established in connection with any employee benefit plan of the Company (including the 2014 Equity Incentive Plan) for the benefit of those individuals eligible to participate in the 2014 Equity Incentive Plan.
An RSA is an award of our Ordinary Shares or American depositary shares that are granted for no consideration other than the provision of services (or such minimum payment as may be required under applicable law). The price (if any) of an RSA will be determined by the compensation committee. Unless otherwise determined by the compensation committee at the time of award, vesting will cease on the date the participant no longer provides services to us and unvested shares will be forfeited to or repurchased by us. Performance-based RSAs that vest based on the attainment of one or more performance goals over a period of time that the compensation committee determines may also be awarded under the 2014 Equity Incentive Plan.
Stock appreciation rights provide for a payment, or payments, in cash, Ordinary Shares or American depositary shares, to the holder based upon the difference between the fair market value of our Ordinary Shares or American depositary shares on the date of exercise and the stated exercise price up to a maximum amount of cash or number of Ordinary Shares or American depositary shares. SARs may vest based on time or achievement of performance conditions. The compensation committee may determine whether SARs may be granted alone or in tandem with a stock option scheme operatedgranted under the 2014 Stock Option Plan or another award.
Restricted share units represent the right to receive our Ordinary Shares or American depositary shares at a specified date in the future, subject to forfeiture of that right because of termination of employment or failure to achieve certain performance conditions. If an RSU has not been forfeited, then on the date specified in the RSU agreement, we will deliver to the holder of the restricted share unit the Ordinary Shares (which may be subject to additional restrictions) or American depositary shares, cash or a combination of the Ordinary Shares and cash or the American depositary shares and cash.
The number and kind of our Ordinary Shares or American depositary shares under the various limits set forth in the 2014 Equity Incentive Plan, the number of outstanding awards and the number and kind of shares subject to any outstanding award and the purchase price per share, if any, under any outstanding award will be equitably adjusted (including by listed issuerspayment of cash to a participant) by the compensation committee of our company in the event of a capitalization issue, rights issue, sub-division or consolidation of shares or reduction of capital in order to preserve, but not increase, the benefits or potential benefits intended to be made available under the 2014 Equity Incentive Plan.
Awards granted under the 2014 Equity Incentive Plan may not be lowertransferred in any manner other than effectivelyby will or by the market pricelaws of descent and distribution, or pursuant to a domestic relations order or as determined by the compensation committee.
Our 2014 Equity Incentive Plan provides that in the event of a change in control, including without limitation a person or entity acquiring beneficial ownership of 35% of our then-outstanding shares entitled to vote in the election of our board of directors, the complete dissolution of the ordinary shares. Ascompany, consolidation, merger, or similar transaction involving our company, the sale of all or substantially all of the assets of our company or the consolidated assets of our company and our subsidiaries, a substantial change in the composition of our board of directors or any change in control as defined in the Hong Kong Code on Takeovers and Mergers, the compensation committee will determine how to treat each outstanding award. The compensation committee may:
·shorten the period during which the awards may be settled;
·accelerate the vesting of the award or waive, in whole or in part, any performance conditions to such vesting;
·arrange for the assumption or replacement of an award by a successor corporation;
·adjust awards or their replacements so that such awards are in respect of the shares of stock, securities or other property (including cash) as may be issuable or payable as a result of such transaction; or
·cancel the capital-intensive natureaward prior to the transaction in exchange for a cash payment, which may be reduced by the exercise price payable in connection with the award.
In the event of our business, we have traditionally relied on share options, rather than cash, as an important means of remunerating its employees. This is commona change in the industry and we wish to continue this practice. Accordingly, we have applied to and obtained from the SEHKcontrol that results in a waiver from strict compliance with Rule 17.03(9)complete liquidation or dissolution of the Listing Rules such that the Company, is allowedall outstanding awards will immediately terminate.
Our board of directors may amend or terminate our 2014 Equity Incentive Plan at any time. If our board of directors amends our 2014 Equity Incentive Plan, it does not need to continue to grant options over its ADSs to its employees under the ESPP at an exercise price which is at a discount (up to 15 percent discount) to the lower of market price at the commencementask for stockholder approval of the offering period or the market price on the purchase date.amendment unless required by applicable law.
Up and until December 31, 2012, we have not granted any purchase right under the ESPP.100
Item 7.Major Shareholders and Related Party Transactions
A.Major Shareholders
Ordinary Shares
The following table sets forth information regarding the beneficial ownership as of April 1, 2013March 31, 2014 of our ordinary shares, by each shareholder who is known by us to beneficially own 5% or more of our outstanding ordinary shares as of such date.
Name of Shareholder |
| Number of Shares Held |
| Percentage of aggregate interests to |
|
|
|
|
|
|
|
Datang Telecom Technology & Industry Holdings Co., Ltd. (“Datang”) |
| 6,166,138,341 | (2) | 19.26 | % |
|
|
|
|
|
|
China Investment Corporation |
| 3,605,890,530 | (3) | 11.26 | % |
|
|
|
|
|
|
Shanghai Industrial Investment (Holdings) Company Limited (“SIIC”) |
| 1,978,277,340 | (4) | 6.18 | % |
|
|
|
|
|
|
|
|
|
| Percentage |
|
Name of Shareholder |
| Number of |
| Percentage of |
| Derivatives |
| Total Interest |
| of Total |
|
Datang Telecom Technology & Industry Holdings Co., Ltd. (“Datang Telecom”) |
| 6,116,138,341 | (2) | 18.99% |
| 531,481,129 | (3) | 6,647,619,470 |
| 20.64 | % |
|
|
|
|
|
|
|
|
|
|
|
|
China Investment Corporation (“CIC”) |
| 3,605,890,530 | (4) | 11.19% |
| 313,437,589 | (5) | 3,919,328,119 |
| 12.17 | % |
Notes:
(1)Based on 32,023,168,05032,214,208,143 ordinary shares in issue as of April 1, 2013.March 31, 2014.
(2)All such shares are held by Datang Holdings (Hongkong) Investment Company Limited (“Datang”) which is a wholly-ownedwholly- owned subsidiary of Datang Telecom Technology & Industry Holdings Co., Ltd.Telecom.
(3)On December 18, 2013, we entered into a subscription agreement with Datang (“Datang Subscription Agreement”), pursuant to which we conditionally agreed to issue, and Datang conditionally agreed to subscribe for, the zero coupon convertible bonds due 2018 in an aggregate principal amount of US$54,600,000 (the “Datang Pre-emptive Bonds”) upon the exercise of Datang’s pre-emptive rights as specified in the share purchase agreement dated November 6, 2008 entered into between us and Datang Telecom. The Datang Pre-emptive Bonds are convertible into 531,481,129 ordinary shares (assuming full conversion of the Datang Pre-emptive Bonds at the initial conversion price of HK$0.7965 per ordinary share). The completion of the issue of the Datang Pre-emptive Bonds is subject to the fulfillment of all conditions set out in the Datang Subscription Agreement and is expected to take place on a date no later than May 30, 2014.
(4)All such shares are held by Country Hill Limited.Hill. Country Hill Limited is wholly-owned subsidiary of Bridge Hill Investments Limited, which is a subsidiary controlled by China Investment Corporation.CIC.
(4) This comprises(5)On December 18, 2013, we entered into a subscription agreement with Country Hill (“Country Hill Subscription Agreement”), pursuant to which we conditionally agreed to issue, and Country Hill conditionally agreed to subscribe for, the zero coupon convertible bonds due 2018 in an aggregate principal amount of 145,008,000 held by SIIC Treasury (B.V.I.US$32,200,000 (the “Country Hill Pre-emptive Bonds”) Limited which is a wholly-owned subsidiaryupon the exercise of SIIC,Country Hill’s pre-emptive rights as specified in the share subscription agreement dated April 18, 2011 entered into between us and 1,833,269,340 held by S.I. Technology Production Holdings Limited (“SITPHL”) which is an indirect wholly-owned subsidiary of SIIC. SITPHL is a wholly-owned subsidiary of Shanghai Industrial Financial (Holdings) Company Limited (“SIFHCL”) which in turn is a wholly-owned subsidiary of Shanghai Industrial Financial Holdings Limited (“SIFHL”). By virtueCountry Hill. The Country Hill Pre-emptive Bonds are convertible into 313,437,589 ordinary shares (assuming full conversion of the SFO, SIIC and its subsidiaries, SIFHCL and SIFHL are deemedCountry Hill Pre-emptive Bonds at the initial conversation price of HK$0.7965 per ordinary share). The completion of the issue of the Country Hill Pre-emptive Bonds is subject to be interestedthe fulfillment of all conditions set out in the 1,833,269,340 Ordinary Shares held by SITPHL. AsCountry Hill Subscription Agreement and is expected to take place on a date no later than May 30, 2014.
As of April 1, 2013, Taiwan Semiconductor Manufacturing Company Limited held less than 5% of our outstanding ordinary shares.
As of April 1, 2013, 32,023,168,050March 31, 2014, 32,214,208,143 ordinary shares (including 31,359,63623,218,067 ADSs representing 1,597,981,8001,160,903,350 ordinary shares) of our company were outstanding. J.P. Morgan Chase Bank, the depositary under the deposit agreement, has advised us that, as of April 1, 2013,March 31, 2014, these 31,359,63623,218,067 ADSs, representing 1,597,981,8001,160,903,350 ordinary shares, were held of record by twelve US registered shareholders. We have no further information as to shares held or beneficially owned by U.S. persons. Each ADS represents 50 ordinary shares.
We do not believe that we are directly or indirectly owned or controlled by another corporation, by any foreign government or by any other natural or legal person severally or jointly. We are not aware of any arrangement that may, at a subsequent date, result in a change of control of our company.
B.Related Party Transactions
The following disclosure is for the purpose of fulfilling disclosure requirements pursuant to the rules and regulations promulgated pursuant to the U.S. Securities and Exchange Act of 1934, as amended, or the Exchange Act, only, and may contain disclosure of related party transactions not required to be disclosed in our financial statements under IFRS.
Director Service Contracts
The Company hasWe have entered into service contracts with indemnification provisions with each of our current directors. Except for the indemnification provisions, the service contracts as stated in the preceding sentence do not provide for benefits upon termination of service or employment.
Datang Further Subscription Agreement (2011)
Pursuant to the share purchase agreement dated November 6, November 2008 between us and Datang Telecom, Datang Telecom has a pre-emptive right to subscribe for a pro-rata portion of those convertible preferred shares and warrants issued to Country Hill, Limited, a wholly ownedwholly-owned subsidiary of China Investment Corporation,Bridge Hill Investments Limited, which is a subsidiary controlled by CIC, pursuant to the subscription agreement dated April 18, 2011 between Country Hill Limited and us in connection with its subscription offor (i) 360,589,053 convertible preferred shares and (ii) warrants to subscribe for up to 72,117,810 convertible preferred shares (subject to adjustment).
On May 5, 2011, we entered into a subscription agreement with Datang whereby (i) we conditionally agreed to allot and issue, to Datang Holdings (Hongkong) Investment Company Limited, or Datang Hong Kong, and Datang Hong Kong agreed to subscribe for 84,956,858 convertible preferred shares at the subscription price of HK$5.39 per convertible preferred share. The subscription price reflected an effective conversion price of HK$0.539 per ordinary share (based on the initial conversion rate often ordinary shares per convertible preferred shares, which is subject to adjustment) and (ii) we would issue a warrant to Datang Hong Kong to subscribe for, in aggregate, up to 16,991,371 convertible preferred shares (assuming a full exercise of the warrant). Datang Hong Kong may exercise, in whole or in part, at an exercise price of HK$5.39 per convertible preferred share. The exercise price reflected an effective conversion price of HK$0.539 per ordinary share. Any unexercised warrants will expire on June 4, 2012, being 12 months after the date of the completion of the issuance of convertible preferred shares and warrant to Country Hill Limited.Hill.
On September 16, 2011, 84,956,858 convertible preferred shares and the warrant were issued to Datang HongKong under the special mandate obtained from the shareholders at our extraordinary general meeting held on May 27, 2011.
On June 4, 2012, the convertible preferred shares were converted to ordinary shares and the warrants were expired without being exercised.
Please see the section entitled “Item 10.C— Additional Information— Material Contracts” for further details of the Datang Further Subscription Agreement.
Datang and CIC Subscription Agreement (2013)
On December 18, 2013, we entered into a subscription agreement, or the Datang Subscription Agreement, with Datang, one of our substantial shareholders. Pursuant to the Datang Subscription Agreement, the Company conditionally agreed to issue and Datang conditionally agreed to subscribe for the zero coupon convertible bonds due 2018 in an aggregate principal amount of US$54,600,000, or the Datang Pre-emptive Bonds, upon the exercise of the pre-emptive rights as specified in the share purchase agreement dated November 6, 2008 entered into between the Company and Datang Telecom which holds 100% equity interests of Datang. The Datang Pre-emptive Bonds are convertible into 531,481,129 Ordinary Shares (assuming full conversion of the Datang Pre-emptive Bonds at the initial Conversion Price of HK$0.7965 per share).
On December 18, 2013, we also entered into a subscription agreement, or the Country Hill Subscription Agreement, with Country Hill, another one of our substantial shareholders. Pursuant to the Country Hill Subscription Agreement, we conditionally agreed to issue and Country Hill conditionally agreed to subscribe for the zero coupon convertible bonds due 2018 in an aggregate principal amount of US$32,200,000, or the Country Hill Pre-emptive Bonds, upon the exercise of the pre-emptive rights by Country Hill pursuant to the share subscription agreement dated April 18, 2011 entered into between us and Country Hill. The Country Hill Pre-emptive Bonds are convertible into 313,437,589 Ordinary Shares (assuming full conversion of the Country Hill Pre-emptive Bonds at the initial Conversion Price of HK$0.7965 per share).
As each of Datang and Country Hill is a substantial shareholder of the Company, the execution of the Datang Subscription Agreement and the Country Hill Subscription Agreement as well as the transactions contemplated thereunder (including the issue of the Datang Pre-emptive Bonds and the Country Hill Pre-emptive Bonds and the allotment and issue of any Ordinary Shares on conversion of any Datang Pre-emptive Bonds and Country Hill Pre-emptive Bonds) constituted non-exempt connected transactions under Chapter 14A of the Hong Kong Stock Exchange Listing Rules, and were subsequently approved by the independent shareholders at the extraordinary general meeting of the Company held on February 17, 2014.
The Datang Pre-emptive Bonds and the Country Hill Pre-emptive Bonds are non-interest bearing and will mature on November 7, 2018. We consider that the issue of the Datang Pre-emptive Bonds and the Country Hill Pre-emptive Bonds will strengthen the relationship between Datang, Country Hill and the Company and provide an additional source of funding for our needs beyond the capital raised through the Placed Bonds (See “Item 10 — Additional Information — Material Contracts—Issue of US$200 Million Zero Coupon Convertible Bonds due 2018”). The net proceeds (net of fees and expenses) from the issue of the Datang Pre-emptive Bonds and the issue of the Country Hill Pre-emptive Bonds will be approximately US$54,600,000 and US$32,200,000 respectively. We intend to use such net proceeds for our capital expenditures in capacity expansion associated with 12-inch manufacturing facilities. The completion of the issue of the Datang Pre-emptive Bonds and the Country Hill Pre-emptive Bonds is subject to the fulfillment of all conditions set out respectively in the Datang Subscription Agreement and the Country Hill Subscription Agreement and is expected to take place on a date no later than May 30, 2014.
Framework Agreement with Datang Telecom
On December 14, 2011, we entered into a Framework Agreement with Datang Telecom, Technology & Industry Holdings Co., Ltd., or Datang,the Original Framework Agreement, pursuant to which we (including our subsidiaries) and Datang Telecom (including its associates) willwould engage in business collaboration including but not limited to foundry service. The effective periodterm of the Original Framework Agreement is three years.years commencing from December 14, 2011. The pricing for the transactions contemplated under the agreement willOriginal Framework Agreement should be determined by reference to reasonable market price.
The expected caps, being the maximum revenue on an aggregated basis expected to be generated by us from the transactions contemplated under the Framework Agreement, are
· US$5.2 million for the year endingended December 31, 2011,
· US$40 million for the year endingended December 31, 2012, and
· US$60 million for the year endingended December 31, 2013.
In arriving at the above caps, we have considered the potential level of transactions itwe may potentially engage in light of current market conditions of the semiconductor industry and our technological capability, having regard to the historical transaction volume of Datang Telecom and its associates with us, and our historical revenues.revenues so generated.
The aggregate revenues generated by us from the transactions entered into pursuant to the Original Framework Agreement were approximately US$16.7 million for the year ended December 31, 2013, approximately US$9.7 million for the year ended December 31, 2012, and approximately US$4.64.8 million for the year ended December 31, 2011.
On February 18, 2014, we entered into a new Framework Agreement with Datang Telecom, or the Renewed Framework Agreement, pursuant to which we (including our subsidiaries) and Datang Telecom (including its associates) would engage in business collaboration including but not limited to foundry service. The term of the Renewed Framework Agreement is two years commencing from February 18, 2014. The pricing for the transactions contemplated under the Renewed Framework Agreement will be determined by reference to reasonable market price available from or to independent third parties in the ordinary and usual course of business based on normal commercial terms and on arm’s length negotiation, or the price based on the actual production cost incurred plus a reasonable profit margin with reference to the general range of profit margins in the industry, and will be determined on terms not less favorable than those sold by independent third parties to us or our subsidiaries or sold by us or our subsidiaries to independent third parties (if any).
The caps, being the maximum revenue on an aggregated basis expected to be generated by us from the transactions contemplated under the Renewed Framework Agreement, are
·US$60 million for the year ending December 31, 2014, and
·US$75 million for the year ending December 31, 2015.
Entrusted Loan Agreement with China Academy of Telecommunication Technology and Datang Telecom Group Finance Co.,Ltd
OnIn November, 2012, our subsidiary SMIC Beijing entered into an entrusted loan arrangement with China Academy of Telecommunication Technology, (“Lender”)or Lender, and Datang Telecom Group Finance Co.,Ltd (“Arranger”) Ltd., as Arranger, under which SMIC Beijing was provided a 180 day revolving unsecured loan in the principal amount of RMB 500 million (approximately $80US$80 million), which is unsecured.. This entrusted loan was used to finance the planned expansion for SMIC Beijing’s 12-inch fab. As of December 31, 2012, SMIC Beijing had drawn down RMB 500 million on this loan. The principal amount is repayablerepaid the loan in May 2013. The interest rate on the loan was 5.04% in 2013.
In December, 2013, our subsidiary SMIC Beijing entered into another entrusted loan arrangement with Lender and Arranger, under which SMIC Beijing was provided a two-month unsecured loan in the principal amount of RMB 400 million (approximately US$66 million). This entrusted loan was used to finance the planned expansion for SMIC Beijing’s 12-inch fab. SMIC Beijing repaid the loan in February 2014. The interest rate on the loan was 3%.
Entrusted Loan Agreement with China Investment Development Corporation
In June 2013, our subsidiary SMIC Beijing entered into an entrusted loan arrangement with China Investment Development Corporation through China CITIC Bank , under which SMIC Beijing was provided a two-year unsecured entrusted loan in the principal amount of RMB 70 million (approximately US$11.5 million). This entrusted loan was used for working capital purposes. As of December 31, 2013, SMIC Beijing has drawn down RMB70 million and repaid RMB4.5 million on this loan facility. The outstanding balance of RMB65.5 million is 5.04%repayable in June 2015. The interest rate on the loan is 12%.
Other Related Party Transactions
Please see Note 36 of Notes to the Consolidated Financial Statements for further information regarding the transactions between us and our related parties.
C. Interests of Experts and Counsel.
Not applicable.
A. Consolidated Statements and Other Financial Information
Please see “Item 18. Financial Statements” for our audited consolidated financial statements filed as a part of this annual report on Form 20-F.
See “Item4.B—Information on the Company—Business Overview—Customers and Markets” regarding the percentage of our sales which are exported from China.
Litigation
TSMC Litigation
Beginning in December 2003, we became subject to several lawsuits brought by Taiwan Semiconductor Manufacturing Company Limited, or TSMC, alleging infringement of certain patents and misappropriation of alleged trade secrets relating to methods for conducting semiconductor fab operations and manufacturing integrated circuits.
On January 30, 2005, we entered into the 2005 settlement agreement (the “2005 Settlement Agreement”), without admission of liability, which provided for the dismissal of all pending legal actions without prejudice between the two companies and agreed to pay TSMC $175 million in installments over a period of six years.
On August 25, 2006, TSMC filed a lawsuit against us and certain of our subsidiaries (SMIC Shanghai, SMIC Beijing and SMIC Americas) in the Superior Court of the State of California, County of Alameda for alleged breach of the 2005 Settlement Agreement, alleged breach of promissory notes related to the 2005 Settlement Agreement and alleged trade secret misappropriation by us. We filed counterclaims against TSMC in the same court in September 2006 and also filed suit against TSMC in Beijing in November 2006.
We settled all pending litigation with TSMC on November 9, 2009, including the legal action filed in California for which a verdict was returned by the jury against SMIC on November 4, 2009, with the 2009 Settlement Agreement which replaced the 2005 Settlement Agreement. The 2009 Settlement Agreement resolved all pending lawsuits between the parties and the parties have since dismissed all pending litigation between them. The terms of the 2009 Settlement Agreement include the following:
1) Entry of judgment and mutual release of all claims that were or could have been brought in the pending lawsuits;
2) Termination of SMIC’s obligation to make remaining payments under the 2005 Settlement Agreement between the parties (approximately US$40 million);
3) Payment to TSMC of an aggregate of US$200 million (with US$15 million paid upon execution, funded from SMIC’s existing cash balances, and the remainder to be paid in installments over a period of four years);
4) Commitment to grant to TSMC of 1,789,493,218 shares of SMIC (representing approximately 8% of SMIC’s issued share capital as of October 31,2009) and a warrant exercisable within three years of issuance to subscribe for 695,914,030 shares of SMIC, subject to adjustment at a purchase price of HK$1.30 per share, subject to adjustment. Both the shares and the warrant would allow TSMC to obtain total ownership of approximately 10% of SMIC’s issued share capital after giving effect to the share issuances and are subject to receipt of required government and regulatory approvals; and
5) Certain remedies in the event of breach of this settlement.
Semiconductor Manufacturer Dispute Arbitration
In 2007, we entered into equipment purchase and cooperative manufacturing arrangements (the “Arrangements”) with an unrelated semiconductor manufacturer (the “Counterparty”). The equipment was relocated by 2008 as scheduled. In 2009, we received notifications from the Counterparty that we were responsible for additional equipment relocation expenses and a portion of the losses incurred during the term of the Arrangements. The Company contested the claims and requested further information supporting the Counterparty’s claims. The Company recorded its best estimate of the probable amount of its liability on the claims regarding the Arrangements and equipment relocation and charged to cost of sales and general and administrative expense, respectively, in the consolidated financial statement as of and during the year ended December 31, 2009.
The Counterparty filed a demand for dispute arbitration in late 2009 for the equipment relocation expenses. In 2010, we settled the dispute related to the equipment relocation claims by paying $8.0 million to the Counterparty and continued its investigations and negotiations with the Counterparty under the Arrangements.
In the end of 2010, the Counterparty filed further claims under the Arrangements. In December 2011, we settled the arbitration regarding Arrangements by paying $21.0 million to the Counterparty. All claims and counterclaims were dismissed then.
Dividends and Dividend Policy
At the end of 2012,2013, our accumulated deficit decreased to US$1,867.01,693.9 million from an accumulated deficit of US$1,889.81,867.0 million at the end of 2011.2012. We have not declared or paid any cash dividends on the ordinary shares. We intend to retain any earnings for use in our business and do not currently intend to pay cash dividends on the ordinary shares. Dividends, if any, on the outstanding shares will be declared by and subject to the discretion of the Board and must be approved at the annual general meeting of shareholders. The timing, amount and form of future dividends, if any, will also depend, among other things, on:
· our results of operations and cash flow;
· our future prospects;
· our capital requirements and surplus;
· our financial condition;
· general business conditions;
· contractual restrictions on the payment of dividends by the Company to its shareholders or by our subsidiaries to the Company; and
· other factors deemed relevant by the Board.
Our ability to pay cash dividends will also depend upon the amount of distributions, if any, received by us from our wholly-owned Chinese operating subsidiaries. Under the applicable requirements of Chinese Company Law, our subsidiaries in China may only distribute dividends after they have made allowances for:
· recovery of losses, if any;
· allocation to the statutory common reserve funds;
· allocation to staff and workers’ bonus and welfare funds; and
· allocation to a discretionary common reserve fund if approved by our shareholders.
More specifically, these operating subsidiaries may only pay dividends after 10% of their net profit has been set aside as statutory common reserves and a discretionary percentage of their net profit has been set aside for the staff and workers’ bonus and welfare funds. These operating subsidiaries are not required to set aside any of their net profit as statutory common reserves if the accumulation of such reserves has reached at least 50% of their respective registered capital. Furthermore, if they record no net income for a year, they generally may not distribute dividends for that year.
B. Significant Changes
Except as disclosed elsewhere in this annual report, we have not experienced any significant changes since the date of our audited consolidated financial statements included in this annual report.
Our ordinary shares are principally traded on the HKSE under the stock code “981.” Our ordinary shares began trading on the HKSE on March 18, 2004. Our ADSs, which began trading on the NYSE on March 17, 2004, are traded under the symbol “SMI.”
The table below sets forth the high and low closing prices on the HKSE and the NYSE for the ordinary shares and ADSs representing such ordinary shares, respectively, since March 2004 and for the most recent six months.
|
| Stock Exchange of Hong Kong |
| New York Stock Exchange(1) |
|
| Stock Exchange of Hong Kong |
| New York Stock Exchange(1) |
| ||||||||||||||||
|
| Closing price per ordinary share |
| Closing Price per ADS |
|
| Closing price per ordinary share |
| Closing Price per ADS |
| ||||||||||||||||
|
| High Price |
| Low Price |
| High Price |
| Low Price |
|
| High Price |
| Low Price |
| High Price |
| Low Price |
| ||||||||
Annual |
|
|
|
|
|
|
|
|
|
|
|
|
|
|
|
|
|
| ||||||||
|
|
|
|
|
|
|
|
|
| |||||||||||||||||
Fiscal year 2008 |
| HK$ | 0.820 |
| HK$ | 0.110 |
| US$ | 4.980 |
| US$ | 0.890 |
| |||||||||||||
|
|
|
|
|
|
|
|
|
|
|
|
|
|
|
|
|
|
| ||||||||
Fiscal year 2009 |
| HK$ | 0.660 |
| HK$ | 0.230 |
| US$ | 3.880 |
| US$ | 1.530 |
|
| HK$ | 0.660 |
| HK$ | 0.230 |
| US$ | 3.880 |
| US$ | 1.530 |
|
|
|
|
|
|
|
|
|
|
|
|
|
|
|
|
|
|
|
|
|
|
|
| ||||
Fiscal year 2010 |
| HK$ | 1.060 |
| HK$ | 0.480 |
| US$ | 6.670 |
| US$ | 3.080 |
|
| HK$ | 1.060 |
| HK$ | 0.480 |
| US$ | 6.670 |
| US$ | 3.080 |
|
|
|
|
|
|
|
|
|
|
|
|
|
|
|
|
|
|
|
|
|
|
|
| ||||
Fiscal year 2011 |
| HK$ | 0.940 |
| HK$ | 0.335 |
| US$ | 5.780 |
| US$ | 2.120 |
|
| HK$ | 0.940 |
| HK$ | 0.335 |
| US$ | 5.780 |
| US$ | 2.120 |
|
|
|
|
|
|
|
|
|
|
|
|
|
|
|
|
|
|
|
|
|
|
|
| ||||
Fiscal year 2012 |
| HK$ | 0.445 |
| HK$ | 0.239 |
| US$ | 2.860 |
| US$ | 1.490 |
|
| HK$ | 0.445 |
| HK$ | 0.239 |
| US$ | 2.860 |
| US$ | 1.490 |
|
|
|
|
|
|
|
|
|
|
|
|
|
|
|
|
|
|
|
|
|
|
|
| ||||
Fiscal year 2013 |
| HK$ | 0.720 |
| HK$ | 0.400 |
| US$ | 4.560 |
| US$ | 2.560 |
| |||||||||||||
|
|
|
|
|
|
|
|
|
|
|
|
|
| |||||||||||||
Quarterly |
|
|
|
|
|
|
|
|
|
|
|
|
|
|
|
|
|
|
|
|
|
| ||||
|
|
|
|
|
|
|
|
|
| |||||||||||||||||
First Quarter 2011 |
| HK$ | 0.750 |
| HK$ | 0.560 |
| US$ | 4.720 |
| US$ | 3.590 |
| |||||||||||||
|
|
|
|
|
|
|
|
|
| |||||||||||||||||
Second Quarter 2011 |
| HK$ | 0.910 |
| HK$ | 0.590 |
| US$ | 5.700 |
| US$ | 3.720 |
| |||||||||||||
|
|
|
|
|
|
|
|
|
| |||||||||||||||||
Third Quarter 2011 |
| HK$ | 0.570 |
| HK$ | 0.355 |
| US$ | 3.920 |
| US$ | 2.120 |
| |||||||||||||
|
|
|
|
|
|
|
|
|
| |||||||||||||||||
Fourth Quarter 2011 |
| HK$ | 0.445 |
| HK$ | 0.360 |
| US$ | 2.940 |
| US$ | 2.230 |
| |||||||||||||
|
|
|
|
|
|
|
|
|
|
|
|
|
|
|
|
|
|
|
|
|
|
| ||||
First Quarter 2012 |
| HK$ | 0.445 |
| HK$ | 0.370 |
| US$ | 2.860 |
| US$ | 2.330 |
|
| HK$ | 0.445 |
| HK$ | 0.370 |
| US$ | 2.860 |
| US$ | 2.330 |
|
|
|
|
|
|
|
|
|
|
|
|
|
|
|
|
|
|
|
|
|
|
|
| ||||
Second Quarter 2012 |
| HK$ | 0.415 |
| HK$ | 0.246 |
| US$ | 2.650 |
| US$ | 1.490 |
|
| HK$ | 0.415 |
| HK$ | 0.246 |
| US$ | 2.650 |
| US$ | 1.490 |
|
|
|
|
|
|
|
|
|
|
|
|
|
|
|
|
|
|
|
|
|
|
|
| ||||
Third Quarter 2012 |
| HK$ | 0.315 |
| HK$ | 0.239 |
| US$ | 1.960 |
| US$ | 1.490 |
|
| HK$ | 0.315 |
| HK$ | 0.239 |
| US$ | 1.960 |
| US$ | 1.490 |
|
|
|
|
|
|
|
|
|
|
|
|
|
|
|
|
|
|
|
|
|
|
|
| ||||
Fourth Quarter 2012 |
| HK$ | 0.390 |
| HK$ | 0.290 |
| US$ | 2.550 |
| US$ | 1.760 |
|
| HK$ | 0.390 |
| HK$ | 0.290 |
| US$ | 2.550 |
| US$ | 1.760 |
|
|
|
|
|
|
|
|
|
|
|
|
|
|
|
|
|
|
|
|
|
|
|
| ||||
First Quarter 2013 |
| HK$ | 0.520 |
| HK$ | 0.40 |
| US$ | 3.370 |
| US$ | 2.560 |
|
| HK$ | 0.520 |
| HK$ | 0.400 |
| US$ | 3.370 |
| US$ | 2.560 |
|
|
|
|
|
|
|
|
|
|
|
|
|
|
|
|
|
|
|
|
|
|
|
| ||||
Second Quarter 2013 |
| HK$ | 0.720 |
| HK$ | 0.455 |
| US$ | 4.560 |
| US$ | 2.880 |
| |||||||||||||
|
|
|
|
|
|
|
|
|
|
|
|
|
| |||||||||||||
Third Quarter 2013 |
| HK$ | 0.660 |
| HK$ | 0.520 |
| US$ | 4.160 |
| US$ | 3.470 |
| |||||||||||||
|
|
|
|
|
|
|
|
|
|
|
|
|
| |||||||||||||
Fourth Quarter 2013 |
| HK$ | 0.650 |
| HK$ | 0.540 |
| US$ | 4.110 |
| US$ | 3.490 |
| |||||||||||||
|
|
|
|
|
|
|
|
|
|
|
|
|
| |||||||||||||
First Quarter 2014 |
| HK$ | 0.840 |
| HK$ | 0.580 |
| US$ | 5.310 |
| US$ | 3.770 |
| |||||||||||||
|
|
|
|
|
|
|
|
|
|
|
|
|
| |||||||||||||
Monthly |
|
|
|
|
|
|
|
|
|
|
|
|
|
|
|
|
|
|
|
|
|
| ||||
|
|
|
|
|
|
|
|
|
|
|
|
|
|
|
|
|
|
|
|
|
|
| ||||
October 2012 |
| HK$ | 0.320 |
| HK$ | 0.290 |
| US$ | 2.030 |
| US$ | 1.760 |
| |||||||||||||
October 2013 |
| HK$ | 0.630 |
| HK$ | 0.550 |
| US$ | 4.110 |
| US$ | 3.520 |
| |||||||||||||
|
|
|
|
|
|
|
|
|
|
|
|
|
|
|
|
|
|
|
|
|
|
| ||||
November 2012 |
| HK$ | 0.380 |
| HK$ | 0.310 |
| US$ | 2.410 |
| US$ | 1.940 |
| |||||||||||||
November 2013 |
| HK$ | 0.640 |
| HK$ | 0.540 |
| US$ | 4.050 |
| US$ | 3.490 |
| |||||||||||||
|
|
|
|
|
|
|
|
|
|
|
|
|
|
|
|
|
|
|
|
|
|
| ||||
December 2012 |
| HK$ | 0.390 |
| HK$ | 0.365 |
| US$ | 2.550 |
| US$ | 2.250 |
| |||||||||||||
December 2013 |
| HK$ | 0.650 |
| HK$ | 0.590 |
| US$ | 4.080 |
| US$ | 3.660 |
| |||||||||||||
|
|
|
|
|
|
|
|
|
|
|
|
|
|
|
|
|
|
|
|
|
|
| ||||
January 2013 |
| HK$ | 0.500 |
| HK$ | 0.400 |
| US$ | 3.230 |
| US$ | 2.610 |
| |||||||||||||
January 2014 |
| HK$ | 0.800 |
| HK$ | 0.610 |
| US$ | 5.060 |
| US$ | 3.820 |
| |||||||||||||
|
|
|
|
|
|
|
|
|
|
|
|
|
|
|
|
|
|
|
|
|
|
| ||||
February 2013 |
| HK$ | 0.520 |
| HK$ | 0.410 |
| US$ | 3.190 |
| US$ | 2.630 |
| |||||||||||||
February 2014 |
| HK$ | 0.840 |
| HK$ | 0.620 |
| US$ | 5.310 |
| US$ | 3.980 |
| |||||||||||||
|
|
|
|
|
|
|
|
|
|
|
|
|
|
|
|
|
|
|
|
|
|
| ||||
March 2013 |
| HK$ | 0.490 |
| HK$ | 0.435 |
| US$ | 3.080 |
| US$ | 2.710 |
| |||||||||||||
March 2014 |
| HK$ | 0.680 |
| HK$ | 0.580 |
| US$ | 4.370 |
| US$ | 3.770 |
| |||||||||||||
|
|
|
|
|
|
|
|
|
|
|
|
|
|
|
|
|
|
|
|
|
|
| ||||
April 2013 (through April 8) |
| HK$ | 0.480 |
| HK$ | 0.455 |
| US$ | 3.030 |
| US$ | 2.880 |
| |||||||||||||
April 2014 (through April 11, 2014) |
| HK$ | 0.620 |
| HK$ | 0.580 |
| US$ | 4.020 |
| US$ | 3.760 |
| |||||||||||||
On April 18, 2011, trading in our ADSs on the NYSE was suspended from 9:30 a.m., New York time, pending the release of our announcement regarding our entering into an investment agreement with Country Hill Limited.Hill. Trading in our shares resumed at 1:57 p.m., New York time on the same day. There was no trading suspension on the HKSE because it was closed during the NYSE suspension period.
At our request, trading in our shares on the HKSE was suspended with effect from 9:00 a.m. on June 30, 2011, Hong Kong time, pending the release of our announcement regarding our appointment of chairman of our board of directors, redesignation of directors and independent non-executive director, resignation of chief executive officer, appointment of acting chief executive officer and authorized representative, and clarification regarding staff departures. Pursuant to our application to the HKSE, trading in our ordinary shares resumed on the HKSE with effect from 9:00 a.m., July 18, 2011, Hong Kong time. Also at our request, trading in our ADSs on the NYSE was suspended for a like period.
The closing prices on the HKSE and the NYSE for our ordinary shares and ADSs, respectively, on the first trading day in the 6 months immediately preceding our pre-emptive issue to Datang Hong Kong on September 16, 2011 are set forth below:
2011 |
| Stock Exchange of Hong Kong |
| New York Stock Exchange(1) |
| ||
March 1 |
| HK$ | 0.620 |
| US$ | 3.860 |
|
|
|
|
|
|
|
|
|
April 1 |
| HK$ | 0.610 |
| US$ | 3.890 |
|
|
|
|
|
|
|
|
|
May 3 |
| HK$ | 0.770 |
| US$ | 4.790 |
|
|
|
|
|
|
|
|
|
June 1 |
| HK$ | 0.650 |
| US$ | 4.050 |
|
|
|
|
|
|
|
|
|
July 4 |
|
| Suspended |
|
| Suspended |
|
|
|
|
|
|
|
|
|
August 1 |
| HK$ | 0.475 |
| US$ | 2.970 |
|
(1) Each ADS represents 50 ordinary shares
The closing prices on the HKSE and the NYSE for our ordinary shares and ADSs, respectively, on the last trading day before our announcement on May 5, 2011 of the pre-emptive issue to Datang Hong Kong are set forth below:
|
| Stock Exchange of Hong Kong |
| New York Stock Exchange(1) Closing price per ADS |
| ||
May 4, 2011 |
| HK$ | 0.740 |
| US$ | 4.610 |
|
|
| Stock Exchange of Hong Kong |
| New York Stock Exchange(1) |
| ||
May 4, 2011 |
| HK$ | 0.740 |
| US$ | 4.610 |
|
The closing prices on the HKSE and the NYSE for our ordinary shares and ADSs, respectively, on April 8, 2013 are set forth below:
|
| Stock Exchange of Hong Kong |
| New York Stock Exchange(1) |
| ||
April 8,2013 |
| HK$ | 0.455 |
| US$ | 2.91 |
|
|
| Stock Exchange of Hong Kong |
| New York Stock Exchange(1) |
| ||
April 8, 2013 |
| HK$ | 0.455 |
| US$ | 2.91 |
|
(1) Each ADS represents 50 ordinary shares.
On October 24, 2013, trading in our ADSs on the NYSE was suspended from 9:30 a.m., New York time, pending the release of our announcement regarding the launching of our US$200 million zero coupon convertible bonds offering. Trading in our shares resumed at 9:30 a.m., New York time on October 25, 2013. There was no trading suspension on the HKSE because it was closed during the NYSE suspension period.
The closing prices on the HKSE and the NYSE for our ordinary shares and ADSs, respectively, on the first trading day in the 6 months immediately preceding our pre-emptive issues to Datang and CIC which are expected to be completed on a date no later than May 30, 2014 are set forth below:
|
| Stock Exchange of Hong Kong |
| New York Stock Exchange(1) |
| ||
November 1, 2013 |
| HK$ | 0.560 |
| US$ | 3.580 |
|
|
|
|
|
|
|
|
|
December 2, 2013 |
| HK$ | 0.630 |
| US$ | 4.030 |
|
|
|
|
|
|
|
|
|
January 2, 2014 |
| HK$ | 0.630 |
| US$ | 3.950 |
|
|
|
|
|
|
|
|
|
February 3, 2014 |
|
| Market closed |
| US$ | 4.820 |
|
|
|
|
|
|
|
|
|
March 3, 2014 |
| HK$ | 0.680 |
| US$ | 4.370 |
|
|
|
|
|
|
|
|
|
April 1, 2014 |
| HK$ | 0.600 |
| US$ | 3.930 |
|
(1) Each ADS represents 50 ordinary shares
The closing prices on the HKSE and the NYSE for our ordinary shares and ADSs, respectively, on the last trading day before our announcement on December 18, 2013 of the pre-emptive issue to Datang and CIC are set forth below:
|
| Stock Exchange of Hong Kong |
| New York Stock Exchange(1) |
| ||
December 17, 2013 |
| HK$ | 0.600 |
| US$ | 3.760 |
|
The closing prices on the HKSE and the NYSE for our ordinary shares and ADSs, respectively, on April 11, 2014 are set forth below:
|
| Stock Exchange of Hong Kong |
| New York Stock Exchange(1) |
| ||
April 11,2014 |
| HK$ | 0.600 |
| US$ | 3.820 |
|
(1) Each ADS represents 50 ordinary shares.
Item 10. Additional Information
A. Share Capital
Not applicable.
B. Memorandum and Articles of Association
The section entitled “Description of Share Capital” in our IPO registration statement is incorporated by reference into this annual report.
The sections entitled “Item 10-Additional Information-Memorandum and Articles of Association” in our annual report on Form 20-F for the fiscal year ended December 31, 2004, filed with the SEC on June 26, 2005 and in our annual report on Form 20-F for the fiscal year ended December 31, 2005, filed with the SEC on June 26, 2006 are incorporated by reference into this annual report. In addition, at the annual general meeting of our shareholders held on June 2, 2008, our shareholders approved an amendment to our Articles of Association to provide that a member of our board of directors may be removed by Ordinary Resolution.
C. Material Contracts
Subscription Agreement with Country Hill Limited
The subscription agreement, or the CIC Subscription Agreement, dated as of April 18, 2011 and entered into by us and Country Hill Limited, a wholly-owned subsidiary of China Investment Corporation, or CIC, in respect of the subscription of 360,589,053 convertible preferred shares, or the CIC Initial Preferred Shares and a warrant to subscribe for 72,117,810 convertible preferred shares, or the CIC Warrants” includes, among others, the following terms:
·Consideration of the CIC Securities. The subscription price of HK$5.39 per CIC Initial Preferred Share is reflective of an effective conversion price of HK$0.539 per ordinary share (based on the initial conversion rate of ten ordinary shares per convertible preferred share) and the total cash consideration payable by CIC is US$250 million.
·Terms of the convertible preferred shares. Below are the principal terms of the convertible preferred
Shares:
·Dividend entitlements: The convertible preferred shares will rank pari passu in respect of entitlement to dividends and other income distribution as ordinary shares as if the convertible preferred shares had been converted into ordinary shares for the relevant accounting period.
·Capital: Upon our liquidation, dissolution, winding up (whether voluntary or involuntary) or return or reduction of capital (but not on conversion of the Convertible preferred shares or any repurchases by us of any convertible preferred shares or ordinary shares) , or our assets available for distribution among the shareholders will be applied first in paying to the holders of the convertible preferred shares and holders of our other preferred shares an amount in repayment of capital equal to the amount paid up or credited as paid up on such shares in priority to:
(A)any payment to the holders of ordinary shares; and
(B)any other obligations ranking pari passu with the claims of the holders of ordinary shares.
·Ranking: The CIC Initial Preferred Shares will, upon issue, rank (a) pari passu with the claims of holders of (i) any class of our preferred share capital and (ii) other obligations of ours which rank pari passu with the convertible preferred shares or such preferred shares, and (b) in priority (including with respect to distribution of proceeds upon any liquidation event up to the amount paid up) to any payment to the holders of our ordinary shares and other obligations ours, incurred directly or indirectly by it, which rank, or are expressed to rank, pari passu the claims of the ordinary shares.
·Conversion right: The holders of the convertible preferred shares will have the right at any time to convert (in whole or in part) their convertible preferred shares into fully paid ordinary shares at the conversion rate of ten ordinary shares per convertible preferred share (which shall be for a minimum amount of 70,000,000 convertible preferred shares or, if less than 70,000,000 convertible preferred shares are then held by CIC, all of such Convertible preferred shares). The holders of the convertible preferred shares are not required to pay any amount for conversion of their convertible preferred shares into ordinary shares. The ordinary shares issued upon conversion will be credited as fully paid, and will rank pari passu in all respects with the other ordinary shares in issue as at the date of the conversion, and will be allotted and issued free from all liens, charges and encumbrances and together with all rights attaching there to upon allotment and issue and at any time thereafter, including all rights to any dividend or other distribution declared, made or payable by reference to a record date falling on or after the date of the conversion notice.
·Mandatory Conversion Date: The convertible preferred shares will be mandatorily converted into ordinary shares at the then applicable conversion rate on June 4, 2012 as if the holder of the convertible preferred shares has elected to convert its convertible preferred shares into ordinary shares on the mandatory conversion date. As a result of this provision, the convertible preferred shares held by Country Hill Limited were converted into 3,605,890,530 of our ordinary shares on June 4, 2012.
·Adjustment to Conversion Rate: The initial conversion rate of ten ordinary shares per convertible preferred share was subject to adjustment upon the occurrence of certain prescribed events, among other things, capitalization of profits or reserves, consolidations, sub-divisions and re- classifications of shares, capital distributions, issue of shares or other securities, and the issue of a new class of shares carrying voting rights. In the event of any issue of any ordinary share or any securities which by their terms are convertible into or exchangeable for, or carry right(s)of subscription for, any ordinary share, the conversion rate in force immediately before such issue was adjusted to compensate the holders of convertible preferred share by reference to the lowest of:
(a)the reference price per ordinary share which initially is HK$0.5390 (subject to adjustment as described in this section);
(b)the amount which represents:
(1)in respect of any rights issue of ordinary shares by the Company, 90% of the relevant theoretical ex-rights price for an ordinary share under that rights issue;
(2)in respect of any issue of securities which by their terms are convertible into or exchangeable for, or carry right(s) of subscription for, ordinary share(s):
(i)in the case of options, warrants or similar instruments, the aggregate of the subscription price or premium for such instrument and the initial exercise price at which the holder of such instrument may subscribe for ordinary shares;
(ii)in the case of convertible bonds or convertible shares or similar instruments, the initial conversion price at which such instrument may be converted into ordinary shares; or
(iii)in any other case, the aggregate price paid and initially payable by the subscriber of such securities in order to receive ordinary shares; and
(3)in respect of any other issue of our ordinary shares, the relevant issue price for an ordinary share under that issue;
(c)the amount which represents a discount of 10% to the arithmetic average of the daily volume weighted average price for an ordinary share as shown on the VAP page of Bloomberg for the:
(1)ten consecutive trading days immediately after the date on which the relevant issue is announced;
(2)in the case of a rights issue, ten consecutive trading days immediately after the ex- rights date; or
(3)if the reference price to determine the issue price is based on share prices for a period after the relevant issue is announced, all the trading days during that period.
The adjustment will become effective immediately following the date of the issuance of the new securities.
No adjustment to the conversion rate will be made which has the effect or result of: (i) reducing the initial conversion rate upon the issue of the convertible preferred shares, except upon any consolidation of ordinary shares or any corporate exercise with the effect of increasing the nominal value of the ordinary shares; or (ii) any ordinary share, upon conversion, falling to be issued at a price below the nominal value of the ordinary share.
·Voting: The convertible preferred shares will entitle the holders thereof to receive notice of, attend and vote at any meeting of our members. Each convertible preferred shares will confer on its holder such number of voting rights as if the convertible preferred shares had been converted into ordinary shares.
·Consent: Except with the consent or sanction of at least 75 per cent of the vote of the holders of the convertible preferred shares given at a separate class meeting, no resolution may be made by us to amend the terms of the convertible preferred shares.
·Transferability: The convertible preferred shares will be freely transferrable save as provided for under the terms of the CIC Subscription Agreement.
·Redemption: The convertible preferred shares are non-redeemable.
·Protection: We have undertaken to each holder of convertible preferred shares (including but not limited to) (i) that all the ordinary shares issued upon conversion will be duly and validly allotted and issued as fully paid or credited as fully paid and free from all liens, charges and encumbrances; (ii) that we will not in any way vary the rights attached to any class or series of shares, or attach any restriction to any class or series of shares, to the extent that such variation would have the effect of varying the rights attaching to the convertible preferred shares, without prior written approval of 75 per cent. of the holders of convertible preferred shares; (iii) that there will not be shares of different nominal values in issue at any time; (iv) it will not, without prior written approval of 75 per cent. of the holders of convertible preferred shares, take any steps to or so as to liquidate, dissolve or windup our Company or any of our subsidiaries unless such liquidation, dissolution or winding-up will not have a material adverse effect; (v) we will not make any reduction or redemption of capital, share premium account or capital redemption reserve involving repayment of money to our shareholders or reduce any uncalled liability in respect of any issued share except in certain situations; and (vi) we will not enter into any agreement, instrument or other document whatsoever binding on us which may result in any breach of our memorandum and articles of association.
·Pre-emptive rights. Country Hill Limited will have the following right to subscribe for (subject to any authorization, consent, approval, license or notification required for the purposes of or as a consequence of the CIC Subscription either from governmental, regulatory or other public bodies):
(i) whilst any convertible preferred shares issued to and beneficially owned by Country Hill Limited (and/or its permitted transferee) remain unconverted and to the extent that the original percentage of our issued share capital held by Country Hill Limited (and/or its permitted transferee) on a fully-diluted basis through such convertible preferred shares immediately prior to the issue is reduced as a result of the issue of any new ordinary shares or preferred shares, any securities convertible into or exchangeable into ordinary shares or preferred shares or any warrants or other rights to subscribe for ordinary shares or preferred shares (which preferred shares carry voting rights in our general meetings),or Relevant Securities (after having taken into account any adjustment to the conversion rate), such number of additional convertible preferred shares (bearing the same conversion rate as the existing issued convertible preferred shares having reflected the adjustment) so as to enable Country Hill Limited to hold, after the issue of the Relevant Securities, a pro rata portion of our issued share capital (on a fully diluted basis) equal to the original percentage; and
(ii) to the extent that any of the Country Hill Limited convertible preferred shares held by Country Hill Limited have been converted and Country Hill Limited is holding our ordinary shares issued as a result of the conversion, such number of additional Relevant Securities so as to enable Country Hill Limited to hold, after the issue of the Relevant Securities, a pro rata portion of the Relevant Securities equal to the percentage of our issued share capital represented by the converted ordinary shares then beneficially owned by Country Hill Limited immediately prior to the issuance of the Relevant Securities.
·Right to Nominate one member of the Board. Country Hill Limited will have the right to nominate one member of our board of directors, or CIC Nominee, provided that: (i) the nomination and appointment of the CIC Nominee is considered by the board of directors (excluding CIC Nominee) to be in the best interest of us and our shareholders as a whole; and(ii) the CIC Nominee has passed our conflict and background check in accordance with common and usual standards and policies generally applicable to the appointment and nomination of a director of ours. We will use all reasonable efforts to give effect to the appointment of the CIC Nominee to our board of directors as soon as practicable after the completion of the subscription by Country Hill Limited which took place on June 3, 2011, and no later than 31 August 2011.
·Lock-up Undertaking. Country Hill Limited will be restricted from selling, or transferring the CIC Initial Preferred Shares, any convertible preferred shares issued upon the exercise of the CIC Warrants and any additional convertible preferred shares or warrants subscribed for a period of 2 years from convertible preferred shares, except that Country Hill Limited may transfer any convertible preferred shares or ordinary shares to any wholly- owned subsidiaries of CIC. The lock-up undertaking will cease to apply where any of the following members of our senior management, being Mr. David N.K. Wang, Mr. Gary Tseng, Mr. Simon Yang, Mr. Chris Keh-Fei Chi and Mr. Barry Quan, cease their employment with us within a period of (2) years commencing from June 3, 2011, except where they ceased their employment as a result of misconduct, or as a result of health conditions.
·Restriction on transfers to a Competitor. Country Hill Limited has agreed to refrain from transferring to any entity that provides or that has the capability to provide, directly or indirectly through any subsidiary or affiliate, semiconductor wafer fabrication or foundry services to third parties ,or a Competitor, directly or indirectly, the convertible preferred shares, the CIC Warrants, or any ordinary shares issued upon conversion of the convertible preferred shares except where there is a genuine open market sale, with the written consent of our board of directors, or for accepting a general offer which has become unconditional or where the offer or has become entitled to exercise compulsory acquisition rights.
·Warrant Agreement. On June 3, 2011, or the completion date, we and Country Hill Limited entered into a warrant agreement, or the CIC Warrant Agreement pursuant to the CIC Subscription Agreement whereby the Company issued the CIC Warrant to Country Hill Limited. Major terms of the warrant agreement are as below:
·Consideration. The CIC Warrants are issued as part of CIC’s subscription.
·Exercise of the CIC Warrants. Country Hill Limited may exercise, in whole or in part, the CIC Warrants on any business day on or prior to 11: 59 p.m., Hong Kong time, on the date that is 12 months from the date of the CIC Warrant Agreement. Upon exercise, the CIC Warrants will be converted into convertible preferred shares. Each partial exercise shall be for a minimum subscription of 15,000,000 convertible preferred shares, or, if less than 15,000,000 Warrant Preferred Shares are issuable under the CIC Warrant then held by Country Hill Limited, for all of such number of convertible preferred shares issuable under the CIC Warrants then held by Country Hill Limited. Any unexercised portion of the CIC Warrants will lapse after the date that is 12 months from the date of the CIC Warrant Agreement.
·Exercise Price. The exercise price of the CIC Warrant is HK$5.39 per convertible preferred share, which is equivalent to the subscription price for the CIC Initial Preferred Shares and is reflective of an effective conversion price of HK$0.539 per ordinary share (based on the initial conversion rate of ten ordinary shares per convertible preferred share).
·Adjustment of Exercise Price. No adjustment will be made to the exercise price of the CIC Warrant nor the number of convertible preferred shares issuable upon exercise of the CIC Warrant.
·Warrant Preferred Shares. The convertible preferred shares issuable upon exercise of the CIC Warrant will not be adjusted but will bear a conversion rate for conversion into ordinary shares that may be adjusted as described in the paragraph ‘‘Terms of the convertible preferred shares — Adjustment to Conversion Rate’’ above. The convertible preferred shares issuable upon exercise of the CIC Warrant will entitle the holders thereof to receive notice of, attend and vote at any meeting of our members. Each such convertible preferred share will confer on its holder such number of voting rights as if such share had been converted into ordinary shares.
·Transferability. Save as to transfers to any wholly-owned subsidiary of CIC, the CIC Warrant is not transferable without our prior written approval.
·No Listing of the CIC Warrant. No application will be made for a listing of the CIC Warrant on The Stock Exchange of Hong Kong Limited or any other stock exchange.
Datang Further Subscription Agreement (2011)
On May 5, 2011, we entered into a subscription agreement, or the Datang Further Subscription Agreement with Datang Hong Kong, whereby we have conditionally agreed to allot and issue to Datang Hong Kong, and Datang Hong Kong has conditionally agreed to subscribe for (i) 84,956,858 convertible preferred shares at a subscription price of HK$5.39 per share and(ii) a warrant to subscribe for up to16,991,371 convertible preferred shares (subject to adjustment) at an exercise price of HK$5.39 share pursuant to Datang’s exercise of its pre-emptive right under the Datang Share Purchase Agreement in connection with the subscription of convertible preferred shares and warrant by Country Hill Limited, or the CIC Subscription, on the same terms and conditions as reasonably practicable as the CIC Subscription, taking into account the fact that Datang is already an existing shareholder of ours. The issue of the above referenced convertible preferred shares and warrant is conditional on, among other things, obtaining the approval of our independent shareholders and necessary governmental approvals. We have obtained independent shareholders’ approval at our extraordinary general meeting held on May 27, 2011.
Principal terms of the Datang Further Subscription Agreement are as below:
·Consideration of the Datang Pre-emptive Securities. The subscription price of HK$5.39 per convertible preferred share is reflective of an effective conversion price of HK$0.539 per ordinary share (based on the initial conversion rate of ten ordinary shares per convertible Preferred Share) and the total cash consideration payable by Datang is US$58.9 million.
·Terms of the convertible preferred shares. Below are their principal terms:
·Dividend entitlements. The convertible preferred shares will rank pari passu in respect of entitlement to dividends and other income distribution as ordinary shares as if the convertible preferred shares had been converted into ordinary shares for the relevant accounting period.
·Capital. Upon our liquidation, dissolution, winding up (whether voluntary or involuntary) or return or reduction of capital (but not on conversion of the convertible preferred shares or any repurchases by us of any convertible preferred shares or ordinary shares) our assets available for distribution among the shareholders will be applied first in paying to the holders of the convertible preferred shares and holders of our other preferred shares an amount equal to the amount paid up or credited as paid up on such shares in priority to:
(A)any payment to the holders of ordinary shares; and
(B)any other obligations ranking pari passu with the claims of the holders of ordinary shares.
·Ranking. The convertible preferred shares issued pursuant to the Datang Further Subscription Agreement will, upon issue, rank (a) pari passu with the claims of holders of (i) any class of our preferred share capital and (ii) our other obligations which rank pari passu with the convertible preferred shares or such preferred shares, and (b) in priority (including with respect to distribution of proceeds upon any liquidation event up to the amount paid up) to any payment to the holders of our ordinary shares and other obligations, incurred directly or indirectly by it, which rank, or are expressed to rank, pari passu the claims of the ordinary shares.
·Conversion right. The holders of the convertible preferred shares will have the right at any time to convert (in whole or in part) their convertible preferred shares into fully paid ordinary shares at the conversion rate which is initially ten ordinary shares per convertible preferred share and subject to adjustment(s) (which shall be for a minimum amount of 70,000,000 convertible preferred shares or, if less than 70,000,000 convertible preferred shares are then held by Datang, all of such convertible preferred shares). The holders of the convertible preferred shares are not required to pay any amount for conversion of their convertible preferred shares into ordinary shares. The ordinary shares issued upon conversion will be credited as fully paid, and will rank pari passu in all respects with the other ordinary shares in issue as at the date of the conversion, and will be allotted and issued free from all liens, charges and encumbrances and together with all rights attaching thereto upon allotment and issue and at any time thereafter, including all rights to any dividend or other distribution declared, made or payable by reference to a record date falling on or after the date of the conversion notice.
·Mandatory Conversion Date. The convertible preferred shares will be mandatorily converted into ordinary shares at the then applicable conversion rate on the day immediately following the expiry of twelve months commencing from the completion date of the subscription the convertible preferred shares issued pursuant to the Datang Further Subscription Agreement as if the holder of the convertible preferred shares has elected to convert its convertible preferred shares into ordinary shares on the mandatory conversion date. As a result of this provision, the convertible preferred shares of Datang Hong Kong were converted into 849,568,580 of our ordinary shares on June 4, 2012.
·Adjustment to Conversion Rate. The initial conversion rate of ten ordinary shares per convertible preferred share is subject to adjustment upon the occurrence of certain prescribed events, among other things, capitalization of profits or reserves, consolidations, sub-divisions and re-classifications of shares, capital distributions, issue of shares or other securities, and the issue of a new class of shares carrying voting rights.
In the event of any issue of any ordinary share or any securities which by their terms are convertible into or exchangeable for, or carry right(s) of subscription for, any ordinary share, the conversion rate in force immediately before such issue will be adjusted to compensate the holders of convertible preference shares by reference to the lowest of:
(i)the reference price per ordinary share which initially is HK$0.5390 (subject to adjustment as described in this section);
(ii)the amount which represents:
(a) in respect of any rights issue of ordinary shares by the Company, 90% of the relevant theoretical ex-rights price for an ordinary share under that rights issue;
(b) in respect of any issue of securities which by their terms are convertible into or exchangeable for, or carry right(s) of subscription for, ordinary share(s):
(1)in the case of options, warrants or similar instruments, the aggregate of the subscription price or premium for such instrument and the initial exercise price at which the holder of such instrument may subscribe for ordinary shares;
(2)in the case of convertible bonds or convertible shares or similar instruments, the initial conversion price at which such instrument may be converted into ordinary shares; or
(3)in any other case, the aggregate price paid and initially payable by the subscriber of such securities in order to receive ordinary shares; and
(c) in respect of any other issue of our ordinary shares, the relevant issue price for an ordinary share under that issue;
(iii) the amount which represents a discount of 10% to the arithmetic average of the daily volume weighted average price for an ordinary share as shown on the VAP page of Bloomberg for the:
(a) ten consecutive trading days immediately after the date on which the relevant issue is announced; or
(b)in the case of a rights issue, ten consecutive trading days immediately after the ex-rights date; or
(c)if the reference price to determine the issue price is based on share prices for a period after the relevant issue is announced, all the trading days during that period.
The adjustment will become effective immediately following the date of the issuance of the new securities. No adjustment to the conversion rate will be made which has the effect or result of: (i) reducing the initial conversion rate upon the issue of the convertible preferred shares, except upon any consolidation of ordinary shares or any corporate exercise with the effect of increasing the nominal value of the ordinary shares; or (ii) any ordinary Share, upon conversion, falling to be issued at a price below the nominal value of the ordinary share
·Voting. The convertible preferred shares will entitle the holders thereof to receive notice of, attend and vote at any meeting of our members. Each convertible preferred shares will confer on its holder such number of voting rights as if the convertible preferred shares had been converted into ordinary shares.
·Consent. Except with the consent or sanction of at least 75 per cent. of the vote of the holders of the convertible preferred shares given at a separate class meeting, no resolution may be made by the Company to amend the terms of the convertible preferred shares.
·Transferability. The convertible preferred shares will be freely transferrable save as provided for under the terms of the Datang Further Subscription Agreement.
·Redemption. The convertible preferred shares are non-redeemable.
·Protection. We have undertaken to each holder of convertible preferred shares (including but not limited to) (i) that all the ordinary shares upon conversion will be duly and validly allotted and issued as fully paid or credited as fully paid and free from all liens, charges and encumbrances; (ii) that we will not in any way vary the rights attached to any class or series of shares, or attach any restriction to any class or series of shares, to the extent that such variation would have the effect of varying the rights attaching to the convertible preferred shares, without prior written approval of 75 per cent. of the holders of convertible preferred shares; (iii) that there will not be shares of different nominal values in issue at any time; (iv) we will not without prior written approval of 75 per cent. of the holders of convertible preferred shares, take any steps to or so as to liquidate, dissolve or windup our Company or any of our subsidiaries unless such liquidation, dissolution or winding-up will not have a material adverse effect; (v) we will not make any reduction or redemption of capital, share premium account or capital redemption reserve involving repayment of money to its shareholders or reduce any uncalled liability in respect of any issued share except in certain situations; and (vi) we will not enter into any agreement, instrument or other document whatsoever binding on us which may result in any breach of our memorandum and articles of association.
·Pre-emptive Rights. Datang will have the following right to subscribe for (subject to any authorization, consent, approval, license or notification required for the purposes of or as a consequence of the Datang Further Subscription either from governmental, regulatory or other public bodies):
(i)whilst any convertible preferred shares issued to and beneficially held by Datang (and/or its permitted transferee) remain unconverted, and to the extent that the original percentage of our issued share capital held by Datang on a fully-diluted basis through such convertible preferred shares immediately prior to the issue is reduced as a result of the issue of any new ordinary shares or preferred shares, any securities convertible into or exchangeable into ordinary shares or preferred shares or any warrants or other rights to subscribe for ordinary shares or preferred shares (which preferred shares carry voting rights in general meetings of the Company) , or the Relevant Securities (after having taken into account any adjustment to the conversion rate), such number of additional convertible preferred shares (bearing the same conversion rate as the existing issued convertible preferred shares having reflected the adjustment) so as to enable Datang to hold, after the issue of the Relevant Securities, a pro rata portion of our issued share capital (on a fully-diluted basis) equal to the original percentage; and to the extent that any of the convertible preferred shares held by Datang have been converted and Datang is holding ordinary shares issued as a result of the said conversion, such number of additional Relevant Securities so as to enable Datang to hold, after the issue of the Relevant Securities, a pro rata portion of the Relevant Securities equal to the percentage of our issued share capital represented by the converted ordinary shares then beneficially owned by Datang immediately prior to the issuance of the Relevant Securities, provided that Datang’s shareholding in our issued share capital represented by the convertible preferred shares or converted ordinary shares shall be excluded and ignored for the purpose of determining the number of securities that Datang is able to acquire pursuant to its pre-emptive rights under the Datang Share Purchase Agreement.
·Lock-up Undertaking. Datang will be restricted from selling, or transferring the convertible preferred shares issued pursuant to the Datang Further Subscription Agreement, any convertible preferred shares issued upon the exercise of the warrant issued pursuant to the Datang Further Subscription Agreement and any additional convertible preferred shares or Warrant subscribed for a period of 2 years from the completion date for the subscription of the above referenced securities, or Datang Closing, except that Datang may transfer any convertible preference shares or ordinary shares to a permitted transferee. The lock-up undertaking will cease to apply where any of the following members of our senior management, being Mr. David N.K. Wang, Mr. Gary Tseng, Mr. Simon Yang, Mr. Chris Keh-Fei Chi and Mr. Barry Quan, cease their employment with us within a period of two (2) years commencing from the Datang Closing date, except where they ceased their employment as a result of misconduct, or as a result of health conditions..
·Restriction on transfers to a Competitor. Datang has agreed to refrain from transferring to any entity that provides or that has the capability to provide, directly or indirectly through any subsidiary or affiliate, semiconductor wafer fabrication or foundry services to third parties, directly or indirectly, the above referenced convertible preferred shares, or any ordinary shares issued upon conversion of the convertible preferred shares except where there is a genuine open market sale, with the written consent of our board of directors, or for accepting a general offer which has become unconditional or where the offer or has become entitled to exercise compulsory acquisition rights.
·Completion of the Datang Further Subscription. The completion took place on September 16, 2011.
·Datang Warrant Agreement. The warrant agreement was entered into between us as the issuer and Datang as the subscriber of the warrant to subscribe for 16,991,371 convertible preferred shares on September 16, 2011, pursuant to the Datang Further Subscription Agreement. Major terms of this warrant agreement are as below:
·Consideration. The warrant is issued as part of the securities issued pursuant to the Datang Further Subscription Agreement.
·Exercise of the Datang Pre-emptive Warrants. Datang may exercise, in whole or in part, the warrant on any business day on or prior to 11: 59 p.m., Hong Kong time, on June 3, 2012. Upon exercise, the warrants will be converted into convertible preferred shares. Each partial exercise will be for a minimum subscription of 15,000,000 convertible preferred shares, or, if less than 15,000,000 convertible preferred shares are issuable under the warrants then held by Datang, for all of such number of convertible preferred shares issuable under the warrants then held by Datang. Any unexercised portion of the warrant will lapse after portion of the warrant.
·Exercise Price. The exercise price is HK$ 5.39 per convertible preferred share, which is equivalent to the subscription price for the convertible preferred shares issued pursuant to the Datang Further Subscription Agreement and is reflective of an effective conversion price of HK$0.539 per ordinary share (based on the initial conversion rate of ten ordinary shares per convertible preferred share).
·Adjustment of Exercise Price. No adjustment will be made to the exercise price of the warrant nor the number of convertible preferred shares issuable upon exercise of such warrant.
·Datang Warrant Preferred Shares. The convertible preferred shares issuable upon exercise of the warrant will not be adjusted but will bear a conversion rate for conversion into ordinary shares that may be adjusted as described in the paragraph ‘‘Terms of the convertible preferred shares—Adjustment to Conversion Rate’’ above. The convertible preferred shares issuable upon exercise of the warrant will entitle the holders thereof to receive notice of, attend and vote at any meeting of our members. Each such convertible preferred share will confer on its holder such number of voting rights as if such convertible preferred share had been converted into ordinary shares.
·Transferability. Save as to transfers to any wholly-owned subsidiary of Datang, the warrant is not transferable without our prior written approval.
·No Listing of the Datang Warrant. No application will be made for a listing of the warrant on The Stock Exchange of Hong Kong Limited or any other stock exchange
Joint Venture Agreement and JV Memorandum with Hubei Science & Technology Investment Group Co., Ltd.
On May 12, 2011, we entered into a joint venture agreement and a memorandum with Hubei Science & Technology Investment Group Co., Ltd., or Hubei Science & Technology, a company incorporated in the PRC and wholly-owned by the Wuhan East Lake Hi-Tech Development Zone Administrative Committee, to invest in and manage Wuhan Xinxin Semiconductor Manufacturing Corporation’s (“Wuhan Xinxin”) 12-inch wafer production line, or the Wuhan JV Agreement,.Agreement.
Pursuant to the Wuhan JV Agreement, the parties shall establish Semiconductor Manufacturing International (Wuhan) Corp., a joint venture company to be established in Wuhan, Hubei Province, the PRC, or the Wuhan JV Company, for the purpose of further developing 12-inch wafer production facilities and implementing advanced technologies for the manufacturing of integrated circuits. Under the Wuhan JV Agreement, we and Hubei Science & Technology shall contribute 66.66% and 33.34%, respectively, of the registered capital of the Wuhan JV Company.
In April 2012, we had announced that we anticipated that the formation of the Wuhan JV Company would be delayed until the first half of 2013. We currently expectIn March 2013, we further announced that the formation of any business collaboration with Hubei Science & Technology willwould be further delayed due to changing market conditions in China and the current status of the global economy. Both we and Hubei Science & Technology require additional time to analyze strategies and collaboration direction, aiming to optimize the potential interests of both parties. Furthermore, after having undergone a transition period in transferring responsibility to Wuhan Xinxin, we no longerceased to manage and operate Wuhan Xinxin’s 12-inch fab.
Other ContractsJoint Venture Agreement with ZDG and BIDIMC
On June 3, 2013, we entered into a Joint Venture Agreement with SMIC Beijing, Beijing industrial Developing Investment Management Co., Ltd (“BIDIMC”) and Zhongguancun Development Group (“ZDG”) in relation to the establishment of a joint venture which will principally engage in, among other things, the testing, development, design, manufacturing, packaging and sale of integrated circuits.
Pursuant to the JV Agreement, the parties would establish SMNC, a new company to be established in Beijing, for the purpose of establishing and building up significant manufacturing capacity with a focus on 45-nanometer and finer technologies and an aim to reach a manufacturing capacity of 35,000 wafers per month. Under the JV Agreement, we and SMIC Beijing shall contribute 55% of the registered capital, ZDG and BIDIMC shall contribute 45% of the registered capital. The registered capital of SMNC is US$1.2 billion.
TSMC Share and Warrant Issuance AgreementIssue of US$200 Million Zero Coupon Convertible Bonds due 2018
The share and warrant issuance agreementSubscription Agreement related to US$200 Million Zero Coupon Convertible Bonds due 2018 convertible into our ordinary shares, dated as of November 9, 200924 October 24 2013 and entered into by us and TSMC in connection with the 2009 Settlement Agreement (the “TSMC ShareJ.P. Morgan Securities PLC and Warrant Issuance Agreement”Deutsche Bank AG, Hong Kong Branch (jointly referred to as “the Joint Managers”), includes among others, the following terms:
1) Commitment to grant to TSMC 1,789,493,218 sharesAgreement by each of SMIC and one or more warrants exercisable within three years of issuancethe Joint Managers to subscribe and pay for, or to procure subscribers to subscribe and pay for the placed bonds to be issued by the Company in an aggregate principal amount of 695,914,030 shares of SMIC, subject to adjustment, at a purchase price of HK$1.30 per share, subject to adjustment (referred to collectively as US$200 million (“the “TSMC Warrant”Placed Bonds”). Issuance of the shares and the TSMC Warrant are subject to receipt of required government and regulatory approvals;;
2) TSMC’s agreement that, subject to certain exceptions, it will not, except withBased on the prior written consentinitial Conversion Price of our BoardHK$0.7965 and assuming full conversion of Directors, acquire any of our ordinary shares or other voting securities or securitiesthe Bonds at the initial conversion price, the Bonds were convertible into or exchangeable for any such securities or take certain specified actions such as making a tender offer or commencing a proxy solicitation with respect to our1,946,817,325 shares, for so long as TSMC holds any of the securities to be issued to it under the 2009 Settlement Agreement and we have not become the subject of certain specified transactions related to a change of control of SMIC;
3)Pre-emptive rights in favor of TSMC which permit TSMC to purchase its pro rata portion (based on the percentagerepresenting (i) approximately 6.07% of the issued share capital of SMIC beneficially ownedthe Company on the last trading day before Bond issuance and (ii) approximately 5.72% of the issued share capital of the Company as enlarged by TSMC)the issue of new equity issuances by SMIC,the conversion shares. The conversion shares were allotted and issued pursuant to the general mandate of the Company granted to the Directors at the annual general meeting held on 13 June 2013 and rank pari passu in all respects with the shares then in issue on the relevant conversion date. The issue of the Bonds was not subject to certain specified exceptions and conditions, including compliance with the rulesapproval of the shareholders;
3)Application was made to the Hong Kong Stock Exchange for the listing of, Hong Kong;and permission to deal in, the conversion shares. An application was made to the Singapore Exchange for the listing of the Bonds;
4) Agreement by TSMC to vote all ofThe maturity date for the ordinary shares of SMIC held by it as recommended by our Board of Directors other than with respect to certain change of control transactions involving SMIC;Bonds is 7 November 2018. Unless previously redeemed, converted or repurchased and cancelled, the Company will redeem each Bond at its principal amount on the maturity date. The Bonds will not bear interest;
5) An obligation of SMIC, if the conditions to the issuance of our shares and the TSMC Warrant to be issued under the 2009 Settlement Agreement have not been satisfied prior to June 30, 2010, and if requested by TSMC, to sell the shares which would otherwise have been issued to TSMC (including the shares issuable under the TSMC Warrant if the trading price for SMIC’s shares exceeds the applicable exercise price for specified periods) in underwritten public offerings or share placements and to deliver theThe net proceeds of any such offerings or placements (net of underwriters’ discounts orfees, commissions and expenses) from the issue of the Bonds will be approximately US$194.6 million;
6)The Company intends to use the placement agent, as applicable) to TSMC.net proceeds (net of fees, commissions and expenses) from the issue of the Bonds, for the Company’s capital expenditure used for capacity expansion associated with 8-inch and 12-inch manufacturing facilities and general corporate purposes.
TSMC Warrant AgreementDatang and CIC Subscription Agreements (2013)
The WarrantPlease see “Item 7.B— Related Party Transactions — Datang and CIC Subscription Agreement entered into (subject to receipt of required government and regulatory approvals) by SMIC and TSMC on July 5, 2010 in connection with the 2009 Settlement Agreement (the “TSMC Warrant Agreement”) provides for adjustments to the number of shares issuable under the TSMC Warrant, the per share exercise price of the TSMC Warrant and/or the nature of the property issuable upon exercise of the TSMC Warrant including the following:
1)In the event of stock dividends, stock splits and similar transactions, the number of shares issuable under the TSMC Warrant and the per share exercise price of the TSMC Warrant will be adjusted so as to make such dividend, split or similar transaction not affect the economic value of the TSMC Warrant;
2)In the event of certain specified change of control transactions involving SMIC, the TSMC Warrant will become exercisable for the same consideration as would have been payable with respect to the shares of stock issuable under the TSMC Warrant in connection with that change of control transaction if such shares of stock had been issued prior to the change of control transaction; and
3)In the event of the issuance by SMIC following November 9, 2009, of any new shares or securities exercisable for, convertible into or exchangeable for common shares of SMIC or similar rights, for a consideration per share (as determined in accordance with certain guidelines in the Warrant Agreement) less than the then-applicable per share exercise price for the TSMC Warrant then the number of shares issuable under the TSMC Warrant will be increased by multiplying such number by a fraction (A) the numerator of which is the then applicable per share exercise price under the TSMC Warrant and (B) the denominator of which is determined by dividing (i) the sum of (x) the then-applicable per share exercise price under the TSMC Warrant multiplied by the number of shares of SMIC outstanding prior to the new issuance plus (y) the total consideration received by SMIC in the new issuance (as determined in accordance with certain guidelines in the Warrant Agreement) by (ii) the number of shares of SMIC outstanding following the new issuance.
SMIC Residential Area Development Project Cooperative Framework Agreement
On November, 18, 2011, SMIC Shanghai signed an agreement with CIC Development Company or CIC Development, pursuant to which we agreed with CIC Development to set up a joint venture called SMIC Development Investment Company, which was later renamed ZhongxinXiecheng Investment (Bejing) Company or ZhongxinXiecheng. The business scope of ZhongxinXiecheng is to develop several pieces of land owned by SMIC into residential areas for our employees. Under the agreement, the joint venture will be run and managed by CIC Development which intends to sell the residential units with priority to our employees and then to the outside market.
CIC Development is an indirect, 60%-owned subsidiary of China Investment Corporation whose wholly owned subsidiary, Country Hill Limited, in turn owns 11% of our shares. We do not consider CIC Development a related party.(2013).”
Yizhuang Residential Project Investment and Development Agreement
On June 15, 2012, SMIC Beijing, SMIC Shanghai, ZhongxinXiecheng Investment (Beijing) Co., Ltd., and CICChina Investment Development Corporation entered into a cooperation agreement to jointly develop the SMIC Beijing Yizhuang residential area. The agreement covers development, construction management and other matters pertaining to Phase 2 of SMIC Beijing residential area and SMIC Private School Beijing Phase 2.
Under the agreement, ZhongxinXiecheng Investment (Beijing) Co., Ltd., the joint-venture formed by and between SMIC Shanghai and CICChina Investment Development Corporation, is fully responsible for the investment planning, development, and construction of both the residential area and the school projects. ZhongxinXiecheng is also responsible for the day-to-day operations under the project management framework agreement. Pursuant to the agreement, profits derived from the residential area development project will be distributed between the parties.
SMIC Beijing Phase 2 Project Cooperative Framework Agreement
On May 15, 2012, SMIC Beijing, Beijing Economic-Technological Development Area Management Committee (BDAC), and Beijing Municipal Commission of Economy and Information Technology (BJEIT) entered into a non-legally binding Cooperation Framework Agreement. Pursuant to the Cooperation Framework Agreement, BJEIT, BDAC and SMIC Beijing proposes the establishment of the BJ Joint Venturea joint venture company in the PRCBeijing with respect to the production of 45-20 nanometer integrated circuits with a goal of achieving eventual production capacity of about 70,000 12-inch wafers per month or the BJ Phase 2 Project.month.
BJEIT, BDAC and SMIC Beijing have agreed to negotiate in good faith with a view towards entering into a definitive agreement in respect of the proposed establishment of the BJ Joint Venture.a joint venture company in Beijing.
Land Lease Agreement
On September 12, 2012, SMIC Beijing signed an agreement with Beijing Bodaxin Development and Construction Co., Ltd. (BDC) to lease land on which the fab for the BJ Phase 2 Project would be developed.
According to the agreement, BDC willwould make a one-time payment to SMIC Beijing of RMB 394,000 (approximately US$63,246) for the lease. The term of the lease expiresexpired on June 30, 2013.
SMIC Beijing Phase 2 Project Fab Construction Framework Agreement
On October 15, 2012, SMIC Beijing signed an agreement with BDC, pursuant to which BDC will be responsible for the development of the fab for the BJ Phase 2 Project. BDC will contribute US$ 340 million for the development and all costs in the development of the fab will be borne by BDC.
Joint Venture Agreement with Jiangsu Changjiang Electronics Technology Co., Ltd.
On February 20, 2014, we entered into a joint venture agreement with Jiangsu Changjiang Electronics Technology Co., Ltd, the largest packaging service provider in China, to jointly set up a company for 12-inch bumping and related testing.
Under such joint venture agreement, we and Jiangsu Changjiang Electronics Technology Co., Ltd shall contribute 51% and 49%, respectively, of the registered capital. The registered capital of the joint company is US$50 million.
D. Exchange Controls
We receive government subsidiesfundings and a portion of our sales in Renminbi, which is currently not a freely convertible currency. Approximately 12.3% of our sales for the year ended December, 31, 2011, and approximately 13.9% of our sales for the year ended December, 31, 2012 and approximately 19.3% of our sales for the year ended December, 31, 2013 were denominated in Renminbi. While we have used these proceeds for the payment of our Renminbi expenses, we may in the future need to convert these sales into foreign currencies to allow us to purchase imported materials and equipment, particularly as we expect the proportion of our sales to China-based companies to increase in the future. Under China’s existing foreign exchange regulations, payments of current account items, including profit distributions, interest payments and expenditures from trade may be made in foreign currencies without government approval, except for certain procedural requirements. The Chinese government may, however, at its discretion, restrict access in the future to foreign currencies for current account transactions and prohibit us from converting our Renminbi sales into foreign currencies.
E. Taxation
The following discussion of the material U.S. federal income and Cayman Islands tax consequences of an investment in our ADSs or ordinary shares is based upon laws and relevant interpretations thereof in effect as of the date of this prospectus, all of which are subject to change, possibly with retroactive effect. This discussion does not deal with all possible tax consequences relating to an investment in our ADSs or ordinary shares, such as the tax consequences under U.S. state, local and non-U.S. tax laws.
United States Federal Income Taxation
Except where noted, this summary deals only with the ownership and disposition of the ADSs and ordinary shares that are held as capital assets by U.S. Holders. This summary does not represent a detailed description of the U.S. federal income tax consequences applicable to U.S. Holders that are subject to special treatment under the U.S. federal income tax laws, including:
· banks;
· dealers in securities or currencies;
· financial institutions;
· real estate investment trusts;
· insurance companies;
· tax-exempt organizations;
· persons holding ADSs or ordinary shares as part of a hedging, integrated or conversion transaction, constructive sale or straddle;
· traders in securities that have elected the mark-to-market method of accounting;
· persons liable for the alternative minimum tax;
· persons who have ceased to be U.S. citizens or to be taxed as resident aliens;
· persons who own or are deemed to own more than 10% of our voting shares; or
· U.S. persons whose “functional currency” is not the U.S. dollar.
This summary is based in part on representations by the depositary and assumes that each obligation under the deposit agreement and any related agreement will be performed in accordance with its terms. Furthermore, the discussion below is based upon the provisions of the Internal Revenue Code of 1986, as amended, or the Code, and U.S. Treasury regulations,Regulations, Internal Revenue Service rulings and judicial decisions there under as of the date hereof, and suchhereof. Such authorities may be replaced, revoked or modified, possibly on a retroactive basis, so as to result in U.S. federal income tax consequences different from those discussed below.
A U.S. Holder that holds ADSs or ordinary shares is urged to consult its own tax advisor concerning the U.S. federal income tax consequences as well as any consequences arising under the laws of any other taxing jurisdiction (including any U.S. state or locality) or any aspect of U.S. federal gift or estate law in light of the particular circumstances of the U.S. Holder.
A U.S. Holder is a beneficial owner of ADSs or ordinary shares that is a U.S. person. A U.S. person is:
· a citizen or resident of the United States;
· a corporation or other entity taxable as a corporation created or organized in or under the laws of the United States, any state thereof, or the District of Columbia;
· an estate the income of which is subject to U.S. federal income taxation, regardless of its source; or
· a trust if (i) it is subject to the primary supervision of a court within the United States and one or more U.S. persons have the authority to control all substantial decisions of the trust, or have(ii) it has a valid election in effect under applicable U.S. Treasury regulations to be treated as a U.S. person.
If a partnership holds ADSs or ordinary shares, the tax treatment of a partner will generally depend on the status of the partner and the activities of the partnership. A U.S. Holder that is a partner of a partnership holding ADSs or ordinary shares is urged to consult its own tax advisors.
ADSs or Ordinary Shares. In general, for U.S. federal income tax purposes, a U.S. Holder of ADSs will be treated as the owner of the underlying ordinary shares that are represented by such ADSs. Deposits and withdrawals of ordinary shares in exchange for ADSs will not be subject to U.S. federal income taxation.
Distributions on ADSs or Ordinary Shares. Subject to the discussion under “-Passive Foreign Investment Company Rules” below, the gross amount of the cash distributions on the ADSs or ordinary shares will be taxable to a U.S. Holder as dividends to the extent of our current and accumulated earnings and profits, as determined under U.S. federal income tax principles. Subject to certain limitations, dividends paid to noncorporate U.S. Holders, including individuals may be eligible for a reduced rate of taxation if we are deemed to be a “qualified foreign corporation” for U.S. federal income tax purposes. A qualified foreign corporation includes:
· a foreign corporation that is eligible for the benefits of a comprehensive income tax treaty with the United States that includes an exchange of information program; andor
· a foreign corporation if its stock with respect to which a dividend is paid or its ADSs backed by such stock are readily tradable on an established securities market within the United States but does not include an otherwise qualified corporation that is a passive foreign investment company. We believe that we will be a qualified foreign corporation for so long as we are not a passive foreign investment company and the ordinary shares or ADSs are considered to be readily tradable on an established securities market within the United States. A U.S. Holder that exchanges its ADSs for ordinary shares may not be eligible for the reduced rate of taxation on dividends if the ordinary shares are not readily tradable on an established securities market within the United States. Our status as a qualified foreign corporation, however, may change.
Dividends will be includable in a U.S. Holder’s gross income on the date actually or constructively received by such U.S. Holder, in the case of ordinary shares, or by the depositary, in the case of ADSs. These dividends will not be eligible for the dividends-received deduction generally allowed to U.S. corporations in respect of dividends received from other U.S. corporations.
To the extent that the amount of any cash distribution exceeds our current and accumulated earnings and profits, the distribution will first be treated as a tax-free return of capital, causing a reduction in the adjusted basis of the ADSs or ordinary shares (thereby increasing the amount of gain, or decreasing the amount of loss, a U.S. Holder would recognize on a subsequent disposition of the ADSs or ordinary shares), and the balance in excess of adjusted basis will be subject to tax as capital gain.
To the extent we pay dividends on the ADSs or the ordinary shares in Hong Kong dollars, the U.S. dollar value of such dividends should be calculated by reference to the exchange rate prevailing on the date of actual or constructive receipt of the dividend, regardless of whether the Hong Kong dollars are converted into U.S. dollars at that time. If Hong Kong dollars are converted into U.S. dollars on the date of actual or constructive receipt of such dividends, the tax basis of the U.S. holder in such Hong Kong dollars will be equal to their U.S. dollar value on that date and, as a result, the U.S. Holder generally should not be required to recognize any foreign currency exchange gain or loss. Any gain or loss recognized on a subsequent conversion or other disposition of the Hong Kong dollars generally will be treated as U.S. source ordinary income or loss.
Dividends paid on the ADSs or ordinary shares will be income from sources outside of the United States and will constitute “passive category income” or, in the case of certain U.S. Holders, “general category income” for U.S. foreign tax credit limitation purposes.
Sale, Exchange or Other Disposition of ADSs or Ordinary Shares. Subject to the discussion under “- Passive Foreign Investment Company Rules” below, upon the sale, exchange or other disposition of ADSs or ordinary shares, a U.S. Holder generally will recognize capital gain or loss equal to the difference between the amount realized upon the sale, exchange or other disposition and the adjusted tax basis of the U.S. Holder in the ADSs or ordinary shares. A U.S. Holder’s tax basis in an ADS or an ordinary share will be, in general, the price it paid for that ADS or ordinary share. The capital gain or loss generally will be long-term capital gain or loss if, at the time of sale, exchange or other disposition, the U.S. Holder has held the ADS or ordinary share for more than one year. Net long-term capital gains of noncorporate U.S. Holders, including individuals, are eligible for reduced rates of taxation. The deductibility of capital loss is subject to limitations. Any gain or loss that a U.S. Holder recognizes generally will be treated as gain or loss from sources within the United States for U.S. foreign tax credit limitation purposes.
Medicare Tax. US Holders who are individuals, estates or trusts may be required to pay up to an additional 3.8% tax on, among other things, dividends and capital gains. You are urged to consult your tax advisor regarding the potential tax consequences to you from the Medicare Tax, also called the Net Investment Income Tax.
Passive Foreign Investment Company Rules. We believe that we were not a passive foreign investment company for 2012.2013. Based on the projected composition of our income, the timing of our anticipated capital expenditures and valuation of our assets, we do not expect to be a passive foreign investment company for 20132014 and do not expect to become one in the future, although this may change.
In general, we will be deemed to be a passive foreign investment company for any taxable year in which either (i) at least 75% of our gross income is passive income or (ii) at least 50% of the value (determined on the basis of a quarterly average) of our assets is attributable to assets that produce or are held for the production of passive income. For this purpose, passive income generally includes dividends, interest, royalties, rents (other than rents and royalties derived in the active conduct of a trade or business and not derived from a related person), annuities and gains from assets that produce passive income.
If we are a PFIC in any taxable year, unless a mark-to-market election described below is made, U.S. Holders will generally be subject to additional taxes and interest charges on certain “excess” distribution we make and on any gain realized on the disposition or deemed disposition of ADSs or ordinary shares regardless of whether we continue to be a PFIC in the year of the “excess” distribution or disposition. Distributions in respect of a U.S. Holder’s ADSs or ordinary shares during the taxable year will generally constitute “excess” distributions if, in the aggregate, they exceed 125% of the average amount of distributions in respect of the U.S. Holder’s ADSs or ordinary shares over the three preceding taxable years or, if shorter, the portion of the U.S. Holder’s holding period before such taxable year.
To compute the tax on “excess” distributions or any gain, (i) the “excess” distribution or the gain will be allocated ratably to each day in the holding period; (ii) the amount allocated to the current year and any tax year before we became a PFIC will be taxed as ordinary income in the current year; (iii) the amount allocated to other taxable years will be taxable at the highest applicable marginal rate in effect for that year; and (iv) an interest charge at the rate for underpayment of taxes will be imposed with respect to any portion of the “excess” distribution or gain described under (iii) above that is allocated to such other taxable years. In addition, if we are PFIC, no distribution will qualify for taxation at the preferential rate for non-corporate holders discussed in “-Distributions on ADSs or Ordinary Shares” above.
If we are a PFIC in any year in which our ADSs or ordinary shares are “marketable”, a U.S. Holder will be able to avoid the “excess” distribution rules described above if such U.S. Holder makes a timely “mark-to-market” election with respect to its ADSs or ordinary shares. The ADSs or ordinary shares will be “marketable” as long as they remain regularly traded on a national securities exchange, such as the New York Stock Exchange or the Hong Kong Stock Exchange. If this election is made in a timely fashion, the U.S. Holder will generally recognize as ordinary income or ordinary loss the difference between the fair market value of the ADSs or ordinary shares on the last day of any taxable year and the U.S. Holder’s adjusted tax basis in the ADSs or ordinary shares. Any ordinary income resulting from this election will generally be taxed at ordinary income rates. Any ordinary losses will be deductible only to the extent of the net amount of previously included income as a result of the mark-to-market election, if any. The U.S. Holder’s adjusted tax basis in the ADSs or ordinary shares will be adjusted to reflect any such income or loss.
Alternatively, the “excess“excess” distribution” rules described above may generally be avoided by electing to treat us as a “Qualified Electing Fund,” or QEF, under Section 1295 of the Internal Revenue Code of 1986, as amended. A QEF election is available only if the U.S. Holder receives an annual information statement from the PFIC setting forth its ordinary earnings and net capital gains, as calculated for U.S. federal income tax purposes. We will not provide our U.S. Holders with the information statement necessary to make a QEF election. Accordingly, U.S. Holders will not be able to make or maintain such an election.
A U.S. Holder is urged to consult its own tax advisors concerning the availability of making a mark-to- marketmark-to-market election or a qualified electing fund election and the U.S. federal income tax consequences of holding the ADSs or ordinary shares if we are deemed to be a passive foreign investment company in any taxable year.
Information Reporting and Backup Withholding. In general, unless a U.S. Holder belongs to a category of certain exempt recipients (such as corporations), information reporting requirements will apply to distributions on ADSs or ordinary shares made within the United States and to the proceeds of sales of ADSs or ordinary shares that are effected through the U.S. office of a broker or the non-U.S. office of a broker that has certain connections with the United States.
Backup withholding currently imposed at a rate of 28% may apply to these payments if a U.S. Holder fails to provide a correct taxpayer identification number or certification of exempt status, fails to report in full dividend and interest income or, in certain circumstances, fails to comply with applicable certification requirements.
Any amounts withheld under the backup withholding rules may generally be allowed as a refund or a credit against a U.S. Holder’s U.S. federal income tax, provided the U.S. Holder furnishes the required information to the Internal Revenue Service in a timely manner.
Cayman Islands Taxation
The following summary constitutes the opinion of Conyers Dill & Pearman (Cayman) Limited to the material Cayman Islands tax consequences of acquiring, owning, and transferring our ADSs and ordinary shares.
The Cayman Islands currently levy no taxes on individuals or corporations based upon profits, income, gains or appreciation and there is no taxation in the nature of inheritance tax or estate duty. You will not be subject to Cayman Islands taxation on payments of dividends or upon the repurchase by us of your ADSs or ordinary shares. In addition, you will not be subject to withholding tax on payments of dividends or distributions, including upon a return of capital, nor will gains derived from the disposal of ADSs or ordinary shares be subject to Cayman Islands income or corporation tax.
No Cayman Islands stamp duty will be payable by you in respect of the issue or transfer of ADSs or ordinary shares. However, an instrument transferring title to an ADS, if brought to or executed in the Cayman Islands, would be subject to Cayman Islands stamp duty. The Cayman Islands are not party to any double taxation treaties. There are no exchange control regulations or currency restrictions in the Cayman Islands.
We were incorporated under the laws of the Cayman Islands as an exempted company and, as such, obtained an undertaking in April 2000 from the Governor in Council of the Cayman Islands substantially that, for a period of twenty years from the date of such undertaking, no law which is enacted in the Cayman Islands imposing any tax to be levied on profit or income or gains or appreciation shall apply to us and no such tax and no tax in the nature of estate duty or inheritance tax will be payable, either directly or by way of withholding, on our ADSs or ordinary shares.
F. Dividends and Paying Agents
Not applicable.
G. Statements by Experts
Not applicable.
H. Documents on Display
Documents on Display
We are subject to the information requirements of the Exchange Act. In accordance with these requirements, we file reports and other information with the SEC. These materials, including this annual report and the exhibits thereto, may be inspected and copied at the SEC’s Public Reference Room at 100 F Street, N.E., Washington, D.C. 20549. The public may obtain information on the operation of the SEC’s Public Reference Room by calling the SEC in the United States at 1-800-SEC-0330. The SEC also maintains a website at http://www.sec.gov that contains reports, proxy statements and other information regarding registrants that file electronically with the SEC.
Item 11. Quantitative and Qualitative Disclosures about Market Risk
Market risk is the risk of loss related to adverse changes in market prices, including foreign currency exchange rates and interest rates of financial instruments. We are exposed to these risks in the ordinary course of our business. Our exposure to these risks derives primarily from changes in interest rates and foreign currency exchange rates. To mitigate some of these risks, we utilize spot, forward, and derivative financial instruments.
Foreign Exchange Rate Fluctuation Risk
Our revenue, expense, and capital purchasing activities are primarily transacted in U.S. dollars. However, since we have operations consisting of manufacturing, sales activities and capital purchasing outside of the U.S., we enter into transactions in other currencies. We are primarily exposed to changes in exchange rate for the Euro, Japanese Yen, and Renminbi.
To minimize these risks, we purchase foreign-currency forward exchange contracts with contract terms normally lasting less than twelve months to protect against the adverse effect that exchange rate fluctuations may have on foreign- currency denominated activities. These forward exchange contracts are principally denominated in Renminbi, Japanese Yen or Euros, and do not qualify for hedge accounting. As of December 31, 2012,2013, we had no outstanding foreign currency forward exchange contracts with notional amounts of US$82.8 million. As of December 31, 2012, the fair value of foreign currency forward exchange contracts was approximately a gain of US$0.05 million, which is recorded in other income and other current assets.contracts.
We do not enter into foreign currency exchange contracts for speculative purposes. See “Item 3.D— Key Information— Risk Factors—Risks Related to Our Financial Condition and Business-Exchange rate fluctuations could increase our costs, which could adversely affect our operating results and the value of our ADSs” and “Item 3.D—Key Information— Risk Factors—Risks Related to Conducting Operations in China-Devaluation or appreciation in the value of the Renminbi or restrictions on convertibility of the Renminbi could adversely affect our business and operating results.”
|
| As of December 31, 2012 |
| ||
|
| Notional Amount 2012 |
| Fair Value |
|
|
|
|
|
|
|
Forward Exchange Agreement |
|
|
|
|
|
|
|
|
|
|
|
(Receive RMB/Pay US$) |
|
|
|
|
|
|
|
|
|
|
|
Contract Amount |
| 82,810 |
| 52 |
|
|
|
|
|
|
|
(Receive EUR/Pay US$) |
|
|
|
|
|
|
|
|
|
|
|
Contract Amount |
| — |
| — |
|
|
|
|
|
|
|
Total Contract Amount |
| 82,810 |
| 52 |
|
Cross Currency Swap Fluctuation Risk
On December 15, 2005, we entered into a long-term loan facility agreement in the aggregate principal amount of EUR 85 million. We were primarily exposed to changes in the exchange rate for the Euro.
To minimize the risk, we entered into cross currency swap contracts with a contract term fully matching the repayment schedule of the long-term loan to protect against the adverse effect of exchange rate fluctuations arising from foreign- currency denominated loans. The cross currency swap contract did not qualify for hedge accounting in accordance with IFRS.
For the portion of the Euro long-term loan that is not covered by cross currency swap contracts, we had separately entered into foreign exchange forward contracts to minimize the currency risk. These foreign exchange forward contracts do not qualify for hedge accounting in accordance with IFRS.
As of December 31, 2012, we had no outstanding cross currency swap contracts. Notional amounts of US$3.7 million outstanding as of December 31, 2011 were settled in May 2012. A realized foreign exchange loss of US$0.5 million was recorded for 2012.
Interest Rate Risk
Our exposure to interest rate risks relates primarily to our long-term debt obligations, which we generally assume to fund capital expenditures and working capital requirements. The table below presents annual principal amounts due and related weighted average implied forward interest rates by year of maturity for the our debt obligations outstanding as of December 31, 2012.2013. Our long-term debt obligations are all subject to variable interest rates. The interest rates on our U.S. dollar-denominated loans are linked to the LIBOR. The interest rates on our RMB denominated loan is linked to People’s Bank of China (PBOC) RMB Interest Rate. As a result, the interest rates on our loans are subject to fluctuations in the underlying interest rates to which they are linked.
|
| 2013 |
| 2014 |
|
| 2014 |
| 2015 |
|
|
| (Forecast) |
|
|
|
| (Forecast) |
| ||
|
| (in US$ thousands, except percentages) |
|
| (in US$ thousands, except percentages) |
| ||||
|
|
|
|
|
|
|
|
|
|
|
US$ denominated |
|
|
|
|
|
|
|
|
|
|
|
|
|
|
|
| |||||
Average balance |
| 618,595 |
| 397,976 |
|
| 853,889 |
| 672,221 |
|
|
|
|
|
|
| |||||
Average interest rate |
| 5.17 | % | 5.35 | % |
| 4.59 | % | 4.66 | % |
|
|
|
|
|
| |||||
RMB denominated |
|
|
|
|
|
|
|
|
|
|
|
|
|
|
|
| |||||
Average balance |
| 18,669 |
| — |
|
| 10,795 |
| 5,264 |
|
|
|
|
|
|
| |||||
Average interest rate |
| 6.65 | % | — |
|
| 12 | % | 12 | % |
|
|
|
|
|
| |||||
Weighted average forward interest rate |
| 5.21 | % | 5.35 | % |
| 4.68 | % | 4.72 | % |
Item 12. Description of Securities Other Than Equity Securities
A. Debt Securities
Not applicable.
B. Warrants and Rights
Not applicable.
D. American DepositoryDepositary Shares
Fees and Charges That An ADR Holder May Have To Pay
Category
(as defined by SEC) |
| Depositary Actions |
| Associated Fee |
(a) Depositing or substituting the underlying shares |
| Each person to whom ADSs are issued against deposits of Shares, including deposits in respect of Share Distributions, Rights and Other Distributions (as such terms are defined in paragraph (10) of the Deposit Agreement as filed with the SEC on March 10, 2004 which we are referred to herein as the “Depositary Agreement”) |
| $5.00 for each 100 ADSs (or portion thereof) evidenced by the new ADRs delivered |
|
|
|
|
|
(b) Receiving or distributing dividends |
| Distribution of dividends |
| $0.02 or less per ADS (or portion thereof) |
|
|
|
|
|
(c) Selling or exercising rights |
| Distribution or sale of securities |
| Such fee being in an amount equal to the fee |
|
|
|
|
|
(d) Withdrawing an underlying security |
| Each person surrendering ADSs |
| $5.00 for each 100 ADSs (or portion thereof) surrendered. |
|
|
|
|
|
(e) Transferring, splitting or grouping receipts |
| Transfers, combining or grouping of depositary receipts |
| $1.50 per ADR |
|
|
|
|
|
(f) General depositary services, particularly those charged on an annual basis |
| Not applicable |
| Not applicable |
|
|
|
|
|
(g) Expenses of the depositary |
| Fees and expenses incurred by the Depositary (including without limitation expenses incurred on behalf of Holders in connection with compliance with foreign exchange control regulations or any law or regulation relating to foreign investment) in delivery of Deposited Securities or otherwise in connection with the Depositary’s or its Custodian’s compliance with applicable law, rule or regulation. |
| The Company will pay all other charges and expenses of the Depositary and any agent of the Depositary (except the Custodian) pursuant to agreements from time to time between the Company and the Depositary, except (i) stock transfer or other taxes and other governmental charges (which are payable by Holders or persons depositing Shares), (ii) cable, telex and facsimile transmission and delivery charges incurred at the request of persons depositing, or Holders delivering Shares, ADRs or Deposited Securities (which are payable by such persons or Holders), (iii) transfer or registration fees for the registration of transfer of |
|
|
|
|
|
|
|
|
| Deposited Securities on any applicable register in connection with the deposit or withdrawal of |
|
|
|
|
|
|
|
|
| Deposited Securities (which are payable by persons depositing Shares or Holders withdrawing Deposited Securities; there are no such fees in respect of the Shares as of the date of the Deposit Agreement), and (iv) expenses of the Depositary in connection with the conversion of foreign currency into U.S. dollars (which are paid out of such foreign currency). These charges may be changed in the manner indicated in paragraph (16) of the Depositary Agreement |
Fees and Payments Made By The Depositary To The Company
DIRECT PAYMENTS
J.P. Morgan, as depositary, has agreed to reimburse certain reasonable expenses related to our ADR Program and incurred by us in connection with the program. In the year ended 2012, the total reimbursed amount was US$388,015.04 among which US$208,176.47 was for investor relations, US$76,467.45 was for legal service fees, US$38,098.00 was for NYSE annual listing fees, US$58,232.78 was for equity incentive plan share registration fees, and US$7,040.35 was for broker reimbursement. The amountsWe did not receive any direct payment from the depositary reimbursed are not perforce related to the fees collected by the depositary from ADR holders.in 2013.
INDIRECT PAYMENTS
As part of its service to us, J.P. Morgan has agreed to waive US$120,000 annually for on-going ADR program maintenance. The table below sets forth the fees that J.P. Morgan has agreed to waive and/or expenses that J.P. Morgan has agreed to pay in the year ended December 31, 2012.2013.
|
| Amount Waived or Paid for Fiscal |
| |||||
|
| Year Ended December 31, 2012 |
|
| Amount Waived or Paid for Fiscal |
| ||
|
|
|
|
| Year Ended December 31, 2013 |
| ||
Category of Expenses |
|
|
|
|
|
| ||
|
|
|
| |||||
Third-party expenses paid directly |
| $ | — |
|
| $ | — |
|
|
|
|
| |||||
Fees waived |
| $ | 120,000 |
|
| $ | 120,000 |
|
Item 13. Defaults, Dividend Arrearages, and Delinquencies
None.
Item 14. Material Modifications to the Rights of Security Holders and Use of Proceeds
Not applicable.
Item 15. Controls and Procedures
Disclosure Controls and Procedures
Our Chief Executive Officer and our Chief Financial Officer have evaluated the effectiveness of our disclosure controls and procedures (as defined in Rules 13a-15(e) and 15d-15(e) of the Exchange Act) as of December 31, 2012.2013. Based on that evaluation, our Chief Executive Officer and our Chief Financial Officer concluded that our disclosure controls and procedures were effective and designed to ensure that the information required to be disclosed by us in reports filed under the Exchange Act is recorded, processed, summarized and reported within the time periods specified by the SEC’s rules, regulations and forms and to ensure that information required to be disclosed by us in the reports we file or submit is accumulated and communicated to our management, including our principal executive officer and principal financial officer, as appropriate to allow timely decisions regarding required disclosure.
Report Byby Management On Internal Control Over Financial Reporting
Our management is responsible for establishing and maintaining adequate internal control over financial reporting, as such term is defined in Rules 13a-15(f) and 15d-15(f) under the Exchange Act for our company. Internal control over financial reporting is a process designed to provide reasonable assurance regarding the reliability of financial reporting and the preparation of consolidated financial statements in accordance with IFRS and includes those policies and procedures that (a) pertain to the maintenance of records that, in reasonable detail, accurately and fairly reflect the transactions and dispositions of a company’s assets, (b) provide reasonable assurance that transactions are recorded as necessary to permit preparation of consolidated financial statements in accordance with IFRS and that a company’s receipts and expenditures are being made only in accordance with authorizations of a company’s management and directors and (c) provide reasonable assurance regarding prevention or timely detection of unauthorized acquisition, use or disposition of a company’s assets that could have a material effect on the consolidated financial statements.
Because of its inherent limitations, a system of internal control over financial reporting can provide only reasonable assurance with respect to consolidated financial statement preparation and presentation and may not prevent or detect misstatements. Also, projections of any evaluation of effectiveness to future periods are subject to the risk that controls may become inadequate because of changes in conditions, or that the degree of compliance with the policies and procedures may deteriorate.
As required by Section 404 of the Sarbanes-Oxley Act and related rules as promulgated by the SEC, our management assessed the effectiveness of the internal control over financial reporting as of December 31, 20122013 using criteria established in Internal Control — Integrated Framework (1992) issued by the Committee of Sponsoring Organizations of the Treadway Commission.
Based on this evaluation, our management has concluded that the internal control over financial reporting was effective as of December 31, 2012,2013, based on the criteria established in Internal Control— Integrated Framework (1992) issued by the Committee of Sponsoring Organizations of the Treadway Commission.
Attestation Report of the Registered Public Accounting Firm
The effectiveness of internal control over financial reporting as of December 31, 20122013 has been audited by our independent registered public accounting firm, Deloitte Touche Tohmatsu as stated in its report (See F-3).
Changes Inin Internal Control Over Financial Reporting
There were no changes in the design in our internal controls over financial reporting that occurred during the period covered by this annual report that have materially affected, or are reasonably likely to materially affect, our internal controls over financial reporting.
Item 16A. Audit Committee Financial Expert
Our board has determined that Mr. Lip-Bu Tan is an audit committee financial expert as defined under the applicable rules of the SEC issued pursuant to Section 407 of the Sarbanes-Oxley Act of 2002. Mr. Tan is independent as such term is defined under Section 303A.02 of the New York Stock Exchange Listed Company Manual.
We have adopted a Code of Business Conduct and Ethics which is applicable to all of our employees, including our Chief Executive Officer, Chief Financial Officer, and any other persons performing similar functions.
Our Code of Business Conduct and Ethics is available, free of charge, to any person who sends a request for a paper copy to us at Semiconductor Manufacturing International Corporation, 18 Zhangjiang Road, Pudong New Area, Shanghai, China 201203, Attention: Investor Relations.
Item 16C. Principal Accountant Fees and Services
The following table sets forth the aggregate audit fees, audit-related fees, tax fees and all other fees we paid or incurred for audit services, audit-related services, tax services and other services rendered by our principal accountants during the fiscal years ended December 31, 20112012 and December 31, 2012.2013.
|
| 2011 |
| 2012 |
| ||
|
|
|
|
|
|
|
|
Audit Fees |
| US $ | 1,250,000 |
| US $ | 1,442,290 |
|
|
|
|
|
|
|
|
|
Total |
| US $ | 1,250,000 |
| US $ | 1,442,290 |
|
|
| 2012 |
| 2013 |
| ||
|
| (in US$ thousands) |
| ||||
|
|
|
|
|
| ||
Audit Fees |
| US $ | 1,442 |
| US $ | 1,187 |
|
Audit fees consist of the standard work associated with the statutory audit as well as audit of our annual financial statements including the review of our quarterly financial results and filings with the Securities and Exchange Commission, Hong Kong Stock Exchange and other regulators.
Audit fees also include services relating to our compliance with the requirements of the Sarbanes- Oxley Act and services relating to our resolution of SEC related comments.
The audit committee has approved all audit-related services performed by Deloitte Touche Tohmatsu, which is located at 35/F, One Pacific Place, 88, Queensway, Hong Kong. The audit committee has also approved and will continue to consider, on a case-by-case basis, all non-audit services. According to the charter of our audit committee, before our principal accountants are engaged by us to render audit or non-audit services, the engagement, including the nature and scope of the work to be performed and the associated fees, must be approved by our audit committee. Our audit committee has not established any pre-approval policies and procedures.
Item 16D. Exemptions from the Listing Standards of Audit Committees
Not applicable.
Item 16E. Purchases of Equity Securities by the Issuer and Affiliated Purchasers
Pursuant to the terms of our 2001 Stock Plan, 2001 Preference Shares Stock Plan, 2001 Regulation S Stock Plan and 2001 Regulation S Preference Shares Stock Plan recipients of stock options to purchase our ordinary shares are entitled to early exercise their options, subject to our right of repurchase. When employees, directors, or service providers who have early exercised their options terminate their employment with us, we may repurchase the unvested shares subject to the option, at a price which is the lower of the exercise price of the option and the fair market value of our ordinary shares as of the date of repurchase. We have not repurchased any of our outstanding capital stockshares during 2012.2013.
Item 16F. Changes in Registrant’s Certifying Accountant
None.
Item 16G. Corporate Governance
We are incorporated under the laws of the Cayman Islands. The principal trading market for our shares is the Hong Kong Stock Exchange. We have adopted a set of corporate governance guidelines in accordance with the applicable laws, rule and regulations, including our Corporate Governance Policy and our Code of Business Conduct and Ethics, each of which are posted on our website.
Because our American Depositary Shares are registered with the SEC and are listed on the New York Stock Exchange, or the NYSE, we are also subject to certain U.S. corporate governance requirements, including many of the provisions of the Sarbanes-Oxley Act of 2002. However, because we are a “foreign private issuer”, many of the corporate governance rules in the NYSE Listed Company Manual, or the NYSE Standards, do not apply to us. We are permitted to follow corporate governance practices in accordance with Cayman Islands law and the Hong Kong Stock Exchange Listing Rules in lieu of most of the corporate governance standards contained in the NYSE Standards.
Set forth below is a brief summary of the significant differences between our corporate governance practices and the corporate governance standards applicable to U.S. domestic companies listed on the NYSE, or U.S. domestic issuers:
· The NYSE Standards require U.S. domestic issuers to have a nominating/corporate governance committee composed entirely of independent directors. We are not subject to this requirement, and we have not established a nominating/corporate governance committee. Instead, our Board has established a nomination committee to review the structure, size and composition (including the skills, knowledge and experience) of the Board at least annually, make recommendations on any proposed changes to the Board to complement our corporate strategy, identify individuals suitably qualified to become Board members consistent with criteria approved by the Board, assess the independence of independent non-executive Directors, make recommendations to the Board on the selection of individuals nominated for directorships, and make recommendations to the Board on the appointment or re-appointment of Directors and succession planning for Directors, in particular the chairman of the Board and the Chief Executive Officer. However, such nomination committee is not responsible for developing and recommending to the Board a set of corporate governance guidelines applicable to the Company and overseeing the evaluation of the Board and management.
· The NYSE Standards provide detailed tests that U.S. domestic issuers must use for determining independence of directors. While we may not specifically apply the NYSE tests, our Board assesses independence in accordance with Hong Kong Stock Exchange Listing Rules, and in the case of audit committee members in accordance with Rule 10A-3 under the Exchange Act, and considers whether there are any relationships or circumstances which are likely to affect such director’s independence from management.
· We believe that the composition of our Board and its committees and their respective duties and responsibilities are otherwise generally responsive to the relevant NYSE Standards applicable to U.S. domestic issuers. However, the charters for our audit and compensation committees may not address all aspects of the NYSE Standards. For example, NYSE Standards require compensation committees of U.S. domestic issuers to produce a compensation committee report annually and include such report in their annual proxy statements or annual reports on Form 10-K. We are not subject to this requirement, and we have not addressed this in our compensation committee charter. We disclose the amounts of compensation of our directors on a named basis, remuneration payable to members of the senior management by band, and the five highest individuals on an aggregate basis in our annual report in accordance with the requirements of the Hong Kong Stock Exchange Listing Rules.
· The NYSE Standards require that shareholders must be given the opportunity to vote on all equity compensation plans and material revisions to those plans. We comply with the requirements of Cayman Islands law and the Hong Kong Stock Exchange Listing Rules in determining whether shareholder approval is required, and we do not take into consideration the NYSE’s detailed definition of what are considered “material revisions”.
The above summary is not a detailed, item-by-item analysis of the differences between our corporate governance practices and the corporate governance standards applicable to U.S. domestic issuers, but rather is intended to provide our U.S. shareholders with a brief, general summary of the significant ways that our corporate governance practices differ from those of a U.S. domestic issuer.
Item 16H. Mine Safety Disclosure
Not applicable.
We have elected to provide the financial statements and related information specified in Item 18 in lieu of Item 17.
See pages F-1 to F-92F-96.
Exhibit 1.1 Eleventh Amended and Restated Articles of Association, as adopted at the Registrant’s annual general meeting of shareholders on June 2, 2008 (1)
Exhibit 4.1 Settlement Agreement dated January 31, 2005 by and between Semiconductor Manufacturing International Corporation and Taiwan Semiconductor Manufacturing Corporation, Ltd., including Patent License Agreement (2)
Exhibit 4.2English language summary of Chinese language Syndicate Loan Agreement dated May 26, 2005, between Semiconductor Manufacturing International (Beijing) Corporation, Semiconductor Manufacturing International Corporation, as guarantor, and China Development Bank, China Construction Bank, Bank of China, Agricultural Bank of China, China Merchants Bank, HuaXia Bank, China Mingsheng Bank, Bank of Communications, Bank of Beijing, Industrial and Commercial Bank of China (Asia) and CITIC Ka Wah Bank (2)
Exhibit 4.3Form of Indemnification Agreement, as adopted at the Registrant’s annual general meeting of shareholders on May 6, 2005(2)
Exhibit 4.44.2 Form of Service Contract between the Company and each of its executive directors(3)
Exhibit 4.54.3 Form of Service Contract between the Company and each of its non-executive directors and independent non-executive directors
Exhibit 4.6English language summary of Chinese language Syndicate Loan Agreement dated June 8, 2006, between Semiconductor Manufacturing International (Shanghai) Corporation, Semiconductor Manufacturing International Corporation, as guarantor, and ABN AMRO Bank N.V., Bank of China (Hong Kong) Limited, Bank of Communications, The Bank of Tokyo-Mitsubishi UFJ, Ltd., China Construction Bank, DBS Bank Ltd., Fubon Bank (Hong Kong) Limited, Industrial and Commercial Bank of China and Shanghai Pudong Development Bank (3)
Exhibit 4.7Share Purchase Agreement, dated November 6, 2008, by and between the Company and Datang Telecom Technology & Industry Holdings Limited Co., Ltd.(4)
Exhibit 4.84.4 English language translation of Strategic Cooperation Agreement, dated December 24, 2008 by and between the Company and Datang Telecom Technology & Industry Holdings Co., Ltd. (5)(4)
Exhibit 4.9Settlement Agreement dated November 9, 2009 by and between the Company and Taiwan Semiconductor Manufacturing Corporation, Ltd., including Share and Warrant Agreements(6)
Exhibit 4.104.5 Placing Agreement dated July 8, 2010 by and between the Company as the Issuer and J.P. Morgan (Asia Pacific) Limited and The Royal Bank of Scotland N.V., Hong Kong Branch as placing agents (7)(5)
Exhibit 4.11Subscription Agreement with Datang Telecom Technology & Industry Holdings Co., Ltd. dated August 16, 2010 (7)
Exhibit 4.12Subscription Agreement with Country Hill Limited, a wholly-owned subsidiary of China Investment Corporation dated April 18, 2011 (7)
Exhibit 4.13Share Subscription Agreement with Datang Holdings (Hongkong) Investment Company Limited, a wholly-owned subsidiary of Datang Telecom Technology & Industry Holdings Co., Ltd., dated May 5, 2011 (7)
Exhibit 4.144.6 English language translation of Chinese language Joint Venture Agreement and Joint Venture Memorandum dated May 12, 2011, between Semiconductor Manufacturing International Corporation and Hubei Science & Technology Investment Group Co., Ltd.(7)(5)
Exhibit 4.154.7 English language summary of Chinese language Syndicate Loan Agreement dated March 21, 2012, between Semiconductor Manufacturing International (Shanghai) Corporation, Semiconductor Manufacturing International Corporation, as guarantor, and Bank of China, The Export-Import Bank of China, China Construction Bank, Shanghai Pudong Development Bank, Cathay United Bank, Bank Sinopac, Taishin International Bank, EnTie Commercial Bank, Ta Chong Bank(3)
Exhibit 4.164.8 English language summary of Chinese language Syndicate Loan Agreement dated March 23, 2012, between Semiconductor Manufacturing International (Beijing) Corporation, Semiconductor Manufacturing International Corporation, as guarantor, and China Development Bank,, The Export-Import Bank Of China, China Construction Bank, Bank of Shanghai, Bank of Beijing(3)
Exhibit 4.9Summary of Longterm Loan Agreement dated June 26, 2013, between Semiconductor Manufacturing International (Beijing) Corporation, Semiconductor Manufacturing International (Tianjin) Corporation, as guarantor, and The Export-Import Bank of China
Exhibit 4.10Summary of Syndicate Loan Agreement dated August 7, 2013, between Semiconductor Manufacturing International (Shanghai) Corporation, Semiconductor Manufacturing International Corporation, as guarantor, and Bank of China, The Export-Import Bank of China, China Development Bank, China Construction Bank and Bank of Shanghai
Exhibit 4.11 Subscription Agreement related to US$200 Million Zero Coupon Convertible Bonds due 2018, dated October 24, 2013 by and between the Company as the Issuer and Deutsche Bank AG, Hong Kong Branch and J.P.Morgan Securities PLC as the Manager
Exhibit 4.12 English language summary of Chinese language Joint Venture Agreement dated June 3, 2013, among SMIC Beijing, SMIC, ZDG and BIDIMC
Exhibit 8.1 List of Subsidiaries(3)
Exhibit 12.1 Certification of CEO under Section 302 of the U.S. Sarbanes-Oxley Act of 2002
Exhibit 12.2 Certification of CFO under Section 302 of the U.S. Sarbanes-Oxley Act of 2002
Exhibit 13.1 Certification of CEO and CFO under Section 906 of the U.S. Sarbanes-Oxley Act of 2002
Exhibit 15.1 Consent of Deloitte Touche Tohmatsu
(1) Previously filed as an exhibit to the Registrant’s Annual Report on Form 20F for the fiscal year ended December 31, 2007, filed June 27, 2008 and amended November 28, 2008.
(2) Previously filed as an exhibit to the Registrant’s Annual Report on Form 20F for the fiscal year ended December 31, 2004, filed June 28, 2005. With respect to Exhibit 4.1, please refer to Item 8 “Litigation” in the Registrant’s Annual Report on Form 20F for the fiscal year ended December 31, 2008.
(3) Previously filed as an exhibit to the Registrant’s Annual Report on Form 20F for the fiscal year ended December 31, 2005,2012, filed June 28, 2006.April 15, 2013.
(4)Previously filed as an exhibit to the Registrant’s Form 6-K dated November 17, 2008. Portions of this exhibit were omitted and filed separately with the Commission pursuant to Rule 24b-2 of the Securities Exchange Act of 1934, as amended, concerning confidential treatment.
(5) Previously filed as an exhibit to the Registrant’s Form 6-K dated January 5, 2009. Portions of this exhibit were omitted and filed separately with the Commission pursuant to Rule 24b-2 of the Securities Exchange Act of 1934, as amended, concerning confidential treatment.
(6)Previously filed as an exhibit to the Registrant’s Annual Report on Form 20F for the fiscal year ended December 31, 2009, filed June 29, 2010.
(7)(5) Previously filed as an exhibit to the Registrant’s Annual Report on Form 20F for the fiscal year ended December 31, 2010, filed June 28, 2011.
SIGNATURES
The registrant hereby certifies that it meets all of the requirements for filing on Form 20-F and that it has duly caused and authorized the undersigned to sign this annual report on its behalf.
| SEMICONDUCTOR MANUFACTURING INTERNATIONAL CORPORATION | |
|
| |
|
|
|
Date: April | By: | /s/ Dr. Tzu-Yin Chiu |
|
|
|
|
| Name: Dr. Tzu-Yin Chiu |
|
| Title: Chief Executive Officer and Executive Director |
INDEX TO FINANCIAL STATEMENTS
Contents |
| Page(s) |
|
|
|
| F-2 | |
|
|
|
| F-5 | |
|
|
|
Consolidated statements of financial position as of |
| F-6 |
|
|
|
| F-8 | |
|
|
|
| F-9 | |
|
|
|
| F-11 | |
|
|
|
|
|
REPORT OF INDEPENDENT REGISTERED PUBLIC ACCOUNTING FIRM
To the Board of Directors and Stockholders of
Semiconductor Manufacturing International Corporation
We have audited the accompanying consolidated statements of financial position of Semiconductor Manufacturing International Corporation and subsidiaries (the “Company”) as of December 31, 2013, 2012 and 2011, and the related consolidated statements of profit or loss and other comprehensive income, changes in equity, and cash flows for each of the twothree years in the period ended December 31, 2012.2013. These financial statements and financial statement schedule are the responsibility of the Company’s management. Our responsibility is to express an opinion on these financial statements and financial statement schedule based on our audits.
We conducted our audits in accordance with the standards of the Public Company Accounting Oversight Board (United States). Those standards require that we plan and perform the audit to obtain reasonable assurance about whether the financial statements are free of material misstatement. An audit includes examining, on a test basis, evidence supporting the amounts and disclosures in the financial statements. An audit also includes assessing the accounting principles used and significant estimates made by management, as well as evaluating the overall financial statement presentation. We believe that our audits provide a reasonable basis for our opinion.
In our opinion, such consolidated financial statements present fairly, in all material respects, the financial position of Semiconductor Manufacturing International Corporation and subsidiaries as of December 31, 2013, 2012 and 2011, and the results of their operations and their cash flows for each of the twothree years in the period ended December 31, 2012,2013, in conformity with International Financial Reporting Standards as issued by the International Accounting Standard Board. Also, in our opinion, such financial statement schedule, when considered in relation to the basic financial statements taken as a whole, present fairly, in all material respects, the information set forth therein.
We have also audited, in accordance with the standards of the Public Company Accounting Oversight Board (United States), the Company’s internal control over financial reporting as of December 31, 2012,2013, based on the criteria established in Internal Control—Control — Integrated Framework (1992) issued by the Committee of Sponsoring Organizations of the Treadway Commission and our report dated March 25, 201312, 2014 expressed an unqualified opinion on the Company’s internal control over financial reporting.
/s/ Deloitte Touche Tohmatsu |
|
Certified Public Accountants |
|
Hong Kong | |
March 12, 2014 |
Hong Kong
March 25, 2013
REPORT OF INDEPENDENT REGISTERED PUBLIC ACCOUNTING FIRM
To the Board of Directors and Stockholders of
Semiconductor Manufacturing International Corporation
We have audited the internal control over financial reporting of Semiconductor Manufacturing International Corporation and subsidiaries (the “Company”) as of December 31, 2012,2013, based on the criteria established in Internal Control — Integrated Framework (1992) issued by the Committee of Sponsoring Organizations of the Treadway Commission.Commission. The Company’s management is responsible for maintaining effective internal control over financial reporting and for its assessment of the effectiveness of internal control over financial reporting, included in the accompanying Report by Management on Internal Control over Financial Reporting. Our responsibility is to express an opinion on the Company’s internal control over financial reporting based on our audit.
We conducted our audit in accordance with the standards of the Public Company Accounting Oversight Board (United States). Those standards require that we plan and perform the audit to obtain reasonable assurance about whether effective internal control over financial reporting was maintained in all material respects. Our audit included obtaining an understanding of internal control over financial reporting, assessing the risk that a material weakness exists, testing and evaluating the design and operating effectiveness of internal control based on the assessed risk, and performing such other procedures as we considered necessary in the circumstances. We believe that our audit provides a reasonable basis for our opinion.
A company’s internal control over financial reporting is a process designed by, or under the supervision of, the company’s principal executive and principal financial officers, or persons performing similar functions, and effected by the company’s board of directors, management, and other personnel to provide reasonable assurance regarding the reliability of financial reporting and the preparation of financial statements for external purposes in accordance with generally accepted accounting principles. A company’s internal control over financial reporting includes those policies and procedures that (1) pertain to the maintenance of records that, in reasonable detail, accurately and fairly reflect the transactions and dispositions of the assets of the company; (2) provide reasonable assurance that transactions are recorded as necessary to permit preparation of financial statements in accordance with generally accepted accounting principles, and that receipts and expenditures of the company are being made only in accordance with authorizations of management and directors of the company; and (3) provide reasonable assurance regarding prevention or timely detection of unauthorized acquisition, use, or disposition of the company’s assets that could have a material effect on the financial statements.
Because of the inherent limitations of internal control over financial reporting, including the possibility of collusion or improper management override of controls, material misstatements due to error or fraud may not be prevented or detected on a timely basis. Also, projections of any evaluation of the effectiveness of the internal control over financial reporting to future periods are subject to the risk that the controls may become inadequate because of changes in conditions, or that the degree of compliance with the policies or procedures may deteriorate.
In our opinion, the Company maintained, in all material respects, effective internal control over financial reporting as of December 31, 2012,2013, based on the criteria established in Internal Control — Integrated Framework (1992) issued by the Committee of Sponsoring Organizations of the Treadway Commission.Commission.
We have also audited, in accordance with the standards of the Public Company Accounting Oversight Board (United States), the consolidated financial statements as of and for the year ended December 31, 2012,2013, of the Company and our report dated March 25, 201312, 2014 expressed an unqualified opinion on those financial statements.
/s/ Deloitte Touche Tohmatsu
| |
Certified Public Accountants |
Hong Kong
March 25, 201312, 2014
CONSOLIDATED STATEMENTSSTATEMENT OF PROFIT OR LOSS AND OTHER COMPREHENSIVE INCOME
(In USD’000, except share and per share data)
|
|
|
| For the year ended December 31, |
| |||||||
|
| Notes |
| 2013 |
| 2012 |
| 2011 |
| |||
|
|
|
| USD’000 |
| USD’000 |
| USD’000 |
| |||
Revenue |
| 5 |
| 2,068,964 |
| 1,701,598 |
| 1,319,466 |
| |||
Cost of sales |
|
|
| (1,630,528 | ) | (1,352,835 | ) | (1,217,525 | ) | |||
Gross profit |
|
|
| 438,436 |
| 348,763 |
| 101,941 |
| |||
Research and development expenses |
|
|
| (145,314 | ) | (193,569 | ) | (191,473 | ) | |||
Sales and marketing expenses |
|
|
| (35,738 | ) | (31,485 | ) | (32,559 | ) | |||
General and administration expenses |
|
|
| (138,167 | ) | (107,313 | ) | (57,435 | ) | |||
Other operating income (expense) |
| 7 |
| 67,870 |
| 19,117 |
| (11,190 | ) | |||
Profit (loss) from operations |
|
|
| 187,087 |
| 35,513 |
| (190,716 | ) | |||
Interest income |
|
|
| 5,888 |
| 5,390 |
| 4,724 |
| |||
Finance costs |
| 8 |
| (34,392 | ) | (39,460 | ) | (21,903 | ) | |||
Foreign exchange gains or losses |
|
|
| 13,726 |
| 3,895 |
| 17,589 |
| |||
Other gains or losses |
|
|
| 4,010 |
| 6,398 |
| 6,709 |
| |||
Share of profits of associates |
|
|
| 2,278 |
| 1,703 |
| 4,479 |
| |||
Profit (loss) before tax |
|
|
| 178,597 |
| 13,439 |
| (179,118 | ) | |||
Income tax (expense) benefit |
| 9 |
| (4,130 | ) | 9,102 |
| (82,503 | ) | |||
Profit (loss) for the year from continuing operations |
|
|
| 174,467 |
| 22,541 |
| (261,621 | ) | |||
Discontinued operations |
|
|
|
|
|
|
|
|
| |||
Profit for the year from discontinued operations |
|
|
| — |
| — |
| 14,741 |
| |||
Profit (loss) for the year |
| 10 |
| 174,467 |
| 22,541 |
| (246,880 | ) | |||
Other comprehensive income |
|
|
|
|
|
|
|
|
| |||
Items that may be reclassified subsequently to profit or loss |
|
|
|
|
|
|
|
|
| |||
Exchange differences on translating foreign operations |
|
|
| 731 |
| 70 |
| 4,938 |
| |||
Total comprehensive income (expense) for the year |
|
|
| 175,198 |
| 22,611 |
| (241,942 | ) | |||
Profit (loss) for the year attributable to: |
|
|
|
|
|
|
|
|
| |||
Owners of the Company |
|
|
| 173,177 |
| 22,771 |
| (246,817 | ) | |||
Non-controlling interests |
|
|
| 1,290 |
| (230 | ) | (63 | ) | |||
|
|
|
| 174,467 |
| 22,541 |
| (246,880 | ) | |||
Total comprehensive income (expense) for the year attributable to: |
|
|
|
|
|
|
|
|
| |||
Owners of the Company |
|
|
| 173,908 |
| 22,841 |
| (241,879 | ) | |||
Non-controlling interests |
|
|
| 1,290 |
| (230 | ) | (63 | ) | |||
|
|
|
| 175,198 |
| 22,611 |
| (241,942 | ) | |||
Earnings (loss) per share |
|
|
|
|
|
|
|
|
| |||
From continuing and discontinued operations |
|
|
|
|
|
|
|
|
|
|
|
|
Basic |
| 13 |
| $ | 0.01 |
| $ | 0.00 |
| $ | (0.01 | ) |
Diluted |
| 13 |
| $ | 0.01 |
| $ | 0.00 |
| $ | (0.01 | ) |
From continuing operations |
|
|
|
|
|
|
|
|
| |||
Basic |
| 13 |
| $ | 0.01 |
| $ | 0.00 |
| $ | (0.01 | ) |
Diluted |
| 13 |
| $ | 0.01 |
| $ | 0.00 |
| $ | (0.01 | ) |
CONSOLIDATED STATEMENT OF FINANCIAL POSITION
(In USD’000, except share and per share data)
|
|
|
| For the year ended December 31 |
| ||||
|
| Notes |
| 2012 |
| 2011 |
| ||
Continuing operations |
|
|
|
|
|
|
| ||
Revenue |
| 6 |
| 1,701,598 |
| 1,319,466 |
| ||
Cost of sales |
|
|
| (1,352,835 | ) | (1,217,525 | ) | ||
Gross profit |
|
|
| 348,763 |
| 101,941 |
| ||
Research and development |
|
|
| (193,569 | ) | (191,473 | ) | ||
Sales and marketing expenses |
|
|
| (31,485 | ) | (32,559 | ) | ||
General and administration expenses |
|
|
| (107,313 | ) | (57,435 | ) | ||
Impairment loss on property, plant and equipment |
|
|
| — |
| (17,691 | ) | ||
Finance costs |
| 9 |
| (39,460 | ) | (21,903 | ) | ||
Interest income |
|
|
| 5,390 |
| 4,724 |
| ||
Other income |
|
|
| 6,190 |
| 13,718 |
| ||
Other gains or losses |
| 8 |
| 23,220 |
| 17,081 |
| ||
Share of profits of associates |
|
|
| 1,703 |
| 4,479 |
| ||
Profit (loss) before tax |
|
|
| 13,439 |
| (179,118 | ) | ||
Income tax benefit (expense) |
| 10 |
| 9,102 |
| (82,503 | ) | ||
Profit (loss) for the year from continuing operations |
| 11 |
| 22,541 |
| (261,621 | ) | ||
Discontinued operations |
|
|
|
|
|
|
| ||
Profit for the year from discontinued operations |
| 12 |
| — |
| 14,741 |
| ||
Profit (loss) for the year |
|
|
| 22,541 |
| (246,880 | ) | ||
Other comprehensive income |
|
|
|
|
|
|
| ||
Item that may be reclassified subsequently to profit or loss |
|
|
|
|
|
|
| ||
Exchange differences on translating foreign operations |
|
|
| 70 |
| 4,938 |
| ||
Total comprehensive income (expense) for the year |
|
|
| 22,611 |
| (241,942 | ) | ||
Profit (loss) for the year attributable to: |
|
|
|
|
|
|
| ||
Owners of the Company |
|
|
| 22,771 |
| (246,817 | ) | ||
Non-controlling interest |
|
|
| (230 | ) | (63 | ) | ||
|
|
|
| 22,541 |
| (246,880 | ) | ||
Total comprehensive income (expense) for the year attributable to: |
|
|
|
|
|
|
| ||
Owners of the Company |
|
|
| 22,841 |
| (241,879 | ) | ||
Non-controlling interests |
|
|
| (230 | ) | (63 | ) | ||
|
|
|
| 22,611 |
| (241,942 | ) | ||
Earnings (loss) per share |
|
|
|
|
|
|
| ||
From continuing and discontinued operations |
|
|
|
|
|
|
| ||
Basic |
| 15 |
| $ | 0.00 |
| $ | (0.01 | ) |
Diluted |
| 15 |
| $ | 0.00 |
| $ | (0.01 | ) |
From continuing operations |
|
|
|
|
|
|
| ||
Basic |
| 15 |
| $ | 0.00 |
| $ | (0.01 | ) |
Diluted |
| 15 |
| $ | 0.00 |
| $ | (0.01 | ) |
|
| Notes |
| 12/31/13 |
| 12/31/12 |
| 12/31/11 |
|
|
|
|
| USD’000 |
| USD’000 |
| USD’000 |
|
Assets |
|
|
|
|
|
|
|
|
|
Non-current assets |
|
|
|
|
|
|
|
|
|
Property, plant and equipment |
| 16 |
| 2,528,834 |
| 2,385,435 |
| 2,516,578 |
|
Prepaid land use right |
|
|
| 136,725 |
| 73,962 |
| 77,231 |
|
Intangible assets |
| 17 |
| 215,265 |
| 235,378 |
| 179,279 |
|
Investments in associates |
| 19 |
| 29,200 |
| 21,636 |
| 15,856 |
|
Deferred tax assets |
| 9 |
| 43,890 |
| 43,380 |
| 31,787 |
|
Other assets |
| 21 |
| 6,237 |
| 43,382 |
| 45,685 |
|
Total non-current assets |
|
|
| 2,960,151 |
| 2,803,173 |
| 2,866,416 |
|
Current assets |
|
|
|
|
|
|
|
|
|
Inventories |
| 22 |
| 286,251 |
| 295,728 |
| 207,308 |
|
Prepaid operating expenses |
|
|
| 43,945 |
| 46,986 |
| 52,805 |
|
Trade and other receivables |
| 23 |
| 379,361 |
| 328,211 |
| 200,905 |
|
Other financial assets |
| 20 |
| 240,311 |
| 18,730 |
| 1,973 |
|
Restricted cash |
| 24 |
| 147,625 |
| 217,603 |
| 136,907 |
|
Cash and bank balances |
|
|
| 462,483 |
| 358,490 |
| 261,615 |
|
|
|
|
| 1,559,976 |
| 1,265,748 |
| 861,513 |
|
Assets classified as held-for-sale |
| 15 |
| 3,265 |
| 4,239 |
| — |
|
Total current assets |
|
|
| 1,563,241 |
| 1,269,987 |
| 861,513 |
|
Total assets |
|
|
| 4,523,392 |
| 4,073,160 |
| 3,727,929 |
|
Equity and liabilities |
|
|
|
|
|
|
|
|
|
Capital and reserves |
|
|
|
|
|
|
|
|
|
Ordinary shares $0.0004 par value, 50,000,000,000 shares authorized, 32,112,307,101, 32,000,139,623 and 27,487,676,065 shares issued and outstanding at December 31, 2013, 2012 and 2011, respectively |
| 25 |
| 12,845 |
| 12,800 |
| 10,995 |
|
Convertible preferred shares, $0.0004 par value, 5,000,000,000 shares authorized, nil, nil and 445,545,911 shares issued and outstanding at December 31, 2013, 2012 and 2011, respectively |
|
|
| — |
| — |
| 178 |
|
Share premium |
| 25 |
| 4,089,846 |
| 4,083,588 |
| 4,082,135 |
|
Reserves |
| 26 |
| 74,940 |
| 46,148 |
| 41,315 |
|
Accumulated deficit |
| 27 |
| (1,693,859 | ) | (1,867,036 | ) | (1,889,807 | ) |
Equity attributable to owners of the Company |
|
|
| 2,483,772 |
| 2,275,500 |
| 2,244,816 |
|
Non-controlling interests |
|
|
| 109,410 |
| 952 |
| 1,182 |
|
Total equity |
|
|
| 2,593,182 |
| 2,276,452 |
| 2,245,998 |
|
CONSOLIDATED STATEMENTS OF FINANCIAL POSITION
(In USD’000, except share and per share data)
|
| Notes |
| 12/31/12 |
| 12/31/11 |
| 1/1/11 |
|
Assets |
|
|
|
|
|
|
|
|
|
Non-current assets |
|
|
|
|
|
|
|
|
|
Property, plant and equipment |
| 17 |
| 2,385,435 |
| 2,516,578 |
| 2,351,863 |
|
Prepaid Land use right |
|
|
| 73,962 |
| 77,231 |
| 78,798 |
|
Intangible assets |
| 18 |
| 235,378 |
| 179,279 |
| 173,821 |
|
Investments in associates |
| 20 |
| 21,636 |
| 15,856 |
| 7,665 |
|
Deferred tax assets |
| 10 |
| 43,380 |
| 31,787 |
| 112,688 |
|
Other assets |
| 22 |
| 43,382 |
| 45,685 |
| 2,393 |
|
Total non-current assets |
|
|
| 2,803,173 |
| 2,866,416 |
| 2,727,228 |
|
Current assets |
|
|
|
|
|
|
|
|
|
Inventories |
| 23 |
| 295,728 |
| 207,308 |
| 213,404 |
|
Prepaid operating expenses |
|
|
| 46,986 |
| 52,805 |
| 17,705 |
|
Trade and other receivables |
| 24 |
| 328,211 |
| 200,905 |
| 264,048 |
|
Other financial assets |
| 21 |
| 18,730 |
| 1,973 |
| 3,149 |
|
Restricted cash |
| 25 |
| 217,603 |
| 136,907 |
| 161,350 |
|
Cash and bank balances |
|
|
| 358,490 |
| 261,615 |
| 515,808 |
|
|
|
|
| 1,265,748 |
| 861,513 |
| 1,175,464 |
|
Assets classified as held-for-sale |
| 16 |
| 4,239 |
| — |
| — |
|
Total current assets |
|
|
| 1,269,987 |
| 861,513 |
| 1,175,464 |
|
Total assets |
|
|
| 4,073,160 |
| 3,727,929 |
| 3,902,692 |
|
Equity and liabilities |
|
|
|
|
|
|
|
|
|
Capital and reserves |
|
|
|
|
|
|
|
|
|
Ordinary shares $0.0004 par value, 50,000,000,000 shares authorized, 32,000,139,623, 27,487,676,065, and 27,334,063,747 shares issued and outstanding at December 31, 2012, 2011 and 2010, respectively |
| 26 |
| 12,800 |
| 10,995 |
| 10,934 |
|
Convertible preferred shares, $0.0004 par value, 5,000,000,000 shares authorized, nil, 445,545,911 shares and nil issued and outstanding at December 31, 2012, 2011 and 2010, respectively |
| 26 |
| — |
| 178 |
| — |
|
Share premium |
| 26 |
| 4,083,588 |
| 4,082,135 |
| 3,762,146 |
|
Reserves |
| 27 |
| 46,148 |
| 41,315 |
| 39,447 |
|
Accumulated deficit |
| 28 |
| (1,867,036 | ) | (1,889,807 | ) | (1,642,990 | ) |
Equity attributable to owners of the Company |
|
|
| 2,275,500 |
| 2,244,816 |
| 2,169,537 |
|
Non-controlling interests |
|
|
| 952 |
| 1,182 |
| 1,245 |
|
Total equity |
|
|
| 2,276,452 |
| 2,245,998 |
| 2,170,782 |
|
|
| Notes |
| 12/31/13 |
| 12/31/12 |
| 12/31/11 |
|
|
|
|
| USD’000 |
| USD’000 |
| USD’000 |
|
Non-current liabilities |
|
|
|
|
|
|
|
|
|
Borrowings |
| 28 |
| 600,975 |
| 528,612 |
| 72,361 |
|
Convertible bonds |
| 29 |
| 180,563 |
| — |
| — |
|
Deferred tax liabilities |
| 9 |
| 167 |
| 440 |
| 1,333 |
|
Deferred government funding |
|
|
| 209,968 |
| 150,347 |
| 125,335 |
|
Promissory notes |
| 32 |
| — |
| — |
| 28,560 |
|
Long-term financial liabilities |
|
|
| — |
| 4,223 |
| 3,018 |
|
Other liabilities |
|
|
| — |
| 5,000 |
| — |
|
Total non-current liabilities |
|
|
| 991,673 |
| 688,622 |
| 230,607 |
|
Current liabilities |
|
|
|
|
|
|
|
|
|
Trade and other payables |
| 30 |
| 393,890 |
| 423,952 |
| 375,748 |
|
Borrowings |
| 28 |
| 390,547 |
| 567,803 |
| 798,782 |
|
Accrued liabilities |
| 31 |
| 153,942 |
| 84,611 |
| 45,674 |
|
Promissory notes |
| 32 |
| — |
| 29,374 |
| 29,374 |
|
Other financial liabilities |
| 33 |
| — |
| 25 |
| 1,683 |
|
Current tax liabilities |
| 9 |
| 158 |
| 2,321 |
| 63 |
|
Total current liabilities |
|
|
| 938,537 |
| 1,108,086 |
| 1,251,324 |
|
Total liabilities |
|
|
| 1,930,210 |
| 1,796,708 |
| 1,481,931 |
|
Total equity and liabilities |
|
|
| 4,523,392 |
| 4,073,160 |
| 3,727,929 |
|
CONSOLIDATED STATEMENT OF CHANGES IN EQUITY
CONSOLIDATED STATEMENTS OF FINANCIAL POSITION(In USD’000)
|
| Notes |
| 12/31/12 |
| 12/31/11 |
| 1/1/11 |
|
Non-current liabilities |
|
|
|
|
|
|
|
|
|
Borrowings |
| 29 |
| 528,612 |
| 72,361 |
| 178,596 |
|
Deferred tax liabilities |
| 10 |
| 440 |
| 1,333 |
| 1,094 |
|
Deferred government grant |
|
|
| 150,347 |
| 125,335 |
| 49,143 |
|
Promissory notes | �� | 31 |
| — |
| 28,560 |
| 56,327 |
|
Long-term financial liabilities |
|
|
| 4,223 |
| 3,018 |
| 37,759 |
|
Other liabilities |
|
|
| 5,000 |
| — |
| 9,646 |
|
Total non-current liabilities |
|
|
| 688,622 |
| 230,607 |
| 332,565 |
|
Current liabilities |
|
|
|
|
|
|
|
|
|
Trade and other payables |
| 30 |
| 423,952 |
| 375,748 |
| 614,055 |
|
Borrowings |
| 29 |
| 567,803 |
| 798,782 |
| 705,514 |
|
Accrued liabilities |
|
|
| 84,611 |
| 45,674 |
| 45,357 |
|
Promissory notes |
| 31 |
| 29,374 |
| 29,374 |
| 29,374 |
|
Other financial liabilities |
| 32 |
| 25 |
| 1,683 |
| 3,152 |
|
Current tax liabilities |
| 10 |
| 2,321 |
| 63 |
| 1,893 |
|
Total current liabilities |
|
|
| 1,108,086 |
| 1,251,324 |
| 1,399,345 |
|
Total liabilities |
|
|
| 1,796,708 |
| 1,481,931 |
| 1,731,910 |
|
Total equity and liabilities |
|
|
| 4,073,160 |
| 3,727,929 |
| 3,902,692 |
|
|
| Ordinary |
| Convertible |
| Share |
| Equity- |
| Foreign |
| Convertible |
| Accumulated |
| Attributable |
| Non- |
| Total |
|
|
| (Note25) |
| (Note25) |
| (Note25) |
| (Note26) |
| (Note26) |
| (Note26) |
| (Note27) |
|
|
|
|
|
|
|
Balance at January 1, 2011 |
| 10,934 |
| — |
| 3,762,146 |
| 40,539 |
| (1,092 | ) | — |
| (1,642,990 | ) | 2,169,537 |
| 1,245 |
| 2,170,782 |
|
Loss for the year |
| — |
| — |
| — |
| — |
| — |
| — |
| (246,817 | ) | (246,817 | ) | (63 | ) | (246,880 | ) |
Other comprehensive income for the year |
| — |
| — |
| — |
| — |
| 4,938 |
| — |
| — |
| 4,938 |
| — |
| 4,938 |
|
Total comprehensive income for the year |
| — |
| — |
| — |
| — |
| 4,938 |
| — |
| (246,817 | ) | (241,879 | ) | (63 | ) | (241,942 | ) |
Exercise of stock options |
| 61 |
| — |
| 11,870 |
| (8,406 | ) | — |
| — |
| — |
| 3,525 |
| — |
| 3,525 |
|
Issuance of convertible preferred shares and warrants |
| — |
| 178 |
| 308,119 |
| — |
| — |
| — |
| — |
| 308,297 |
| — |
| 308,297 |
|
Share-based compensation |
| — |
| — |
| — |
| 5,336 |
| — |
| — |
| — |
| 5,336 |
| — |
| 5,336 |
|
Balance at December 31, 2011 |
| 10,995 |
| 178 |
| 4,082,135 |
| 37,469 |
| 3,846 |
| — |
| (1,889,807 | ) | 2,244,816 |
| 1,182 |
| 2,245,998 |
|
Profit for the year |
| — |
| — |
| — |
| — |
| — |
| — |
| 22,771 |
| 22,771 |
| (230 | ) | 22,541 |
|
Other comprehensive income for the year |
| — |
| — |
| — |
| — |
| 70 |
| — |
| — |
| 70 |
| — |
| 70 |
|
Total comprehensive income for the year |
| — |
| — |
| — |
| — |
| 70 |
| — |
| 22,771 |
| 22,841 |
| (230 | ) | 22,611 |
|
Exercise of stock options |
| 23 |
| — |
| 3,057 |
| (2,411 | ) | — |
| — |
| — |
| 669 |
| — |
| 669 |
|
Exercise convertible preference shares and warrants |
| 1,782 |
| (178 | ) | (1,604 | ) | — |
| — |
| — |
| — |
| — |
| — |
| — |
|
Share-based compensation |
| — |
| — |
| — |
| 7,174 |
| — |
| — |
| — |
| 7,174 |
| — |
| 7,174 |
|
Balance at December 31, 2012 |
| 12,800 |
| — |
| 4,083,588 |
| 42,232 |
| 3,916 |
| — |
| (1,867,036 | ) | 2,275,500 |
| 952 |
| 2,276,452 |
|
Profit for the year |
| — |
| — |
| — |
| — |
| — |
| — |
| 173,177 |
| 173,177 |
| 1,290 |
| 174,467 |
|
Other comprehensive income for the year |
| — |
| — |
| — |
| — |
| 731 |
| — |
| — |
| 731 |
| — |
| 731 |
|
Total comprehensive income for the year |
| — |
| — |
| — |
| — |
| 731 |
| — |
| 173,177 |
| 173,908 |
| 1,290 |
| 175,198 |
|
Exercise of stock options |
| 45 |
| — |
| 6,641 |
| (3,457 | ) | — |
| — |
| — |
| 3,229 |
| — |
| 3,229 |
|
Share-based compensation |
| — |
| — |
| — |
| 16,402 |
| — |
| — |
| — |
| 16,402 |
| — |
| 16,402 |
|
Capital contribution from non-controlling interest |
| — |
| — |
| — |
| — |
| — |
| — |
| — |
| — |
| 108,000 |
| 108,000 |
|
Purchased additional shares of subsidiaries |
| — |
| — |
| (383 | ) | — |
| — |
| — |
| — |
| (383 | ) | (178 | ) | (561 | ) |
Deconsolidation of subsidiaries due to loss of control |
| — |
| — |
| — |
| — |
| (94 | ) | — |
| — |
| (94 | ) | (654 | ) | (748 | ) |
Recognition of equity component of convertible bonds |
| — |
| — |
| — |
| — |
| — |
| 15,210 |
| — |
| 15,210 |
| — |
| 15,210 |
|
Balance at December 31, 2013 |
| 12,845 |
| — |
| 4,089,846 |
| 55,177 |
| 4,553 |
| 15,210 |
| (1,693,859 | ) | 2,483,772 |
| 109,410 |
| 2,593,182 |
|
CONSOLIDATED STATEMENTSSTATEMENT OF CHANGES IN EQUITYCASH FLOWS
(In USD’000)
|
| Ordinary |
| Convertible |
| Share |
| Equity-settled |
| Foreign |
| Accumulated |
| Attributable |
| Non- |
| Total |
|
|
|
|
| (Note 26) |
| (Note 26) |
| (Note 27) |
| (Note 27) |
| (Note 28) |
|
|
|
|
|
|
|
Balance at January 1, 2011 |
| 10,934 |
| — |
| 3,762,146 |
| 40,539 |
| (1,092 | ) | (1,642,990 | ) | 2,169,537 |
| 1,245 |
| 2,170,782 |
|
Loss for the year |
| — |
| — |
| — |
| — |
| — |
| (246,817 | ) | (246,817 | ) | (63 | ) | (246,880 | ) |
Other comprehensive income for the year |
| — |
| — |
| — |
| — |
| 4,938 |
| — |
| 4,938 |
| — |
| 4,938 |
|
Total comprehensive income for the year |
| — |
| — |
| — |
| — |
| 4,938 |
| (246,817 | ) | (241,879 | ) | (63 | ) | (241,942 | ) |
Exercise of stock options |
| 61 |
| — |
| 11,870 |
| (8,406 | ) | — |
| — |
| 3,525 |
| — |
| 3,525 |
|
Issuance of convertible preferred shares and warrants |
| — |
| 178 |
| 308,119 |
| — |
| — |
| — |
| 308,297 |
| — |
| 308,297 |
|
Share-based compensation |
| — |
| — |
| — |
| 5,336 |
| — |
| — |
| 5,336 |
| — |
| 5,336 |
|
Balance at December 31, 2011 |
| 10,995 |
| 178 |
| 4,082,135 |
| 37,469 |
| 3,846 |
| (1,889,807 | ) | 2,244,816 |
| 1,182 |
| 2,245,998 |
|
Profit for the year |
| — |
| — |
| — |
| — |
| — |
| 22,771 |
| 22,771 |
| (230 | ) | 22,541 |
|
Other comprehensive income for the year |
| — |
| — |
| — |
| — |
| 70 |
| — |
| 70 |
| — |
| 70 |
|
Total comprehensive income for the year |
| — |
| — |
| — |
| — |
| 70 |
| 22,771 |
| 22,841 |
| (230 | ) | 22,611 |
|
Exercise of stock options |
| 23 |
| — |
| 3,057 |
| (2,411 | ) | — |
| — |
| 669 |
| — |
| 669 |
|
Exercise convertible preferred shares |
| 1,782 |
| (178 | ) | (1,604 | ) | — |
| — |
| — |
| — |
| — |
| — |
|
Share-based compensation |
| — |
| — |
| — |
| 7,174 |
| — |
| — |
| 7,174 |
| — |
| 7,174 |
|
Balance at December 31, 2012 |
| 12,800 |
| — |
| 4,083,588 |
| 42,232 |
| 3,916 |
| (1,867,036 | ) | 2,275,500 |
| 952 |
| 2,276,452 |
|
|
| For the year ended December 31, |
| ||||
|
| 2013 |
| 2012 |
| 2011 |
|
|
| USD’000 |
| USD’000 |
| USD’000 |
|
Profit (loss) for the year |
| 174,467 |
| 22,541 |
| (246,880 | ) |
Adjustments for: |
|
|
|
|
|
|
|
Income tax expense (benefit) |
| 4,130 |
| (9,102 | ) | 82,503 |
|
Forgiveness of payables |
| — |
| — |
| (19,011 | ) |
Gain on disposition of discontinued operation, net of taxes |
| — |
| — |
| (17,103 | ) |
Amortization of intangible assets and land use right |
| 44,987 |
| 35,076 |
| 33,017 |
|
Depreciation of property, plant and equipment |
| 501,923 |
| 531,823 |
| 518,840 |
|
Impairment loss of property, plant and equipment |
| — |
| — |
| 17,691 |
|
Impairment loss of available-for-sale investment |
| 279 |
| — |
| — |
|
Expense recognized in respect of equity-settled share-based payments |
| 16,402 |
| 7,174 |
| 5,336 |
|
Finance costs |
| 34,392 |
| 39,460 |
| 21,903 |
|
(Gain) loss on disposal of property, plant and equipment |
| (33,996 | ) | (19,325 | ) | 508 |
|
Gain on disposal of subsidiaries |
| (28,304 | ) | — |
| — |
|
Gain on deconsolidation of subsidiaries |
| (5,419 | ) | — |
| — |
|
Interest income recognized in profit or loss |
| (5,888 | ) | (5,390 | ) | (4,724 | ) |
Bad debt allowance on trade receivables |
| 617 |
| 4,615 |
| 551 |
|
Impairment loss (reversed) recognized on inventory |
| (141 | ) | 4,851 |
| 6,473 |
|
Net loss (gain) arising on financial assets at fair value through profit or loss |
| 76 |
| 861 |
| (244 | ) |
Net gain arising on financial liabilities at fair value through profit or loss |
| (25 | ) | (1,659 | ) | (1,469 | ) |
Reversal of bad debt allowance on trade receivables |
| (1,213 | ) | (2,095 | ) | (6,400 | ) |
Share of profit of associates |
| (2,278 | ) | (1,703 | ) | (4,479 | ) |
Other non-cash expense |
| (413 | ) | 635 |
| 556 |
|
Operating cash flows before movements in working capital: |
| 699,596 |
| 607,762 |
| 387,068 |
|
(Increase) decrease in trade and other receivables |
| (33,375 | ) | (112,410 | ) | 73,069 |
|
Decrease (increase) in inventories |
| 8,595 |
| (93,270 | ) | (5,587 | ) |
Increase in restricted cash relating to operating activities |
| (5,944 | ) | (15,406 | ) | (60,221 | ) |
Decrease (increase) in prepaid operating expenses |
| 2,129 |
| 7,791 |
| (41,190 | ) |
Decrease (increase) in other assets |
| 619 |
| (937 | ) | (9,897 | ) |
(Increase) decrease in trade and other payables |
| (24,311 | ) | 22,942 |
| 902 |
|
Increase in deferred government funding |
| 85,972 |
| 25,010 |
| 76,193 |
|
Increase in accrued liabilities |
| 42,264 |
| 36,951 |
| 5,911 |
|
Decrease in other liabilities |
| — |
| — |
| (9,646 | ) |
Cash generated from operations |
| 775,545 |
| 478,433 |
| 416,602 |
|
Interest paid |
| (43,239 | ) | (47,532 | ) | (38,765 | ) |
Interest received |
| 6,770 |
| 5,390 |
| 4,724 |
|
Income taxes paid |
| (1,060 | ) | (1,125 | ) | (3,193 | ) |
Net cash from operating activities |
| 738,016 |
| 435,166 |
| 379,368 |
|
CONSOLIDATED STATEMENTSSTATEMENT OF CASH FLOWS
(In USD’000)
|
| For the year ended December 31 |
| ||
|
| 2012 |
| 2011 |
|
Operating activities: |
|
|
|
|
|
Profit (loss) for the year |
| 22,541 |
| (246,880 | ) |
Adjustments for: |
|
|
|
|
|
Income tax (benefit) expenses |
| (9,102 | ) | 82,503 |
|
Forgiveness of payables |
| — |
| (19,011 | ) |
Gain on disposition of discontinued operation, net of taxes |
| — |
| (17,103 | ) |
Amortization of intangible assets and land use right |
| 35,076 |
| 33,017 |
|
Depreciation of property, plant and equipment |
| 531,823 |
| 518,840 |
|
Impairment loss of property, plant and equipment |
| — |
| 17,691 |
|
Expense recognized in respect of equity-settled share-based payments |
| 7,174 |
| 5,336 |
|
Finance cost |
| 39,460 |
| 21,903 |
|
(Gain) loss on disposal of property, plant and equipment |
| (19,325 | ) | 508 |
|
Interest income recognized in profit or loss |
| (5,390 | ) | (4,724 | ) |
Bad debt allowance on trade receivables |
| 4,615 |
| 551 |
|
Impairment loss recognized on Inventory |
| 4,851 |
| 6,473 |
|
Net loss (gain) arising on financial assets at fair value through profit or loss |
| 861 |
| (244 | ) |
Net gain arising on financial liabilities at fair value through profit or loss |
| (1,659 | ) | (1,469 | ) |
Reversal of bad debt allowance on trade receivables |
| (2,095 | ) | (6,400 | ) |
Share of profit of associates |
| (1,703 | ) | (4,479 | ) |
Other non-cash expense |
| 635 |
| 556 |
|
Operating cash flows before movements in working capital: |
| 607,762 |
| 387,068 |
|
(Increase) decrease in trade and other receivables |
| (112,410 | ) | 73,069 |
|
Increase in inventories |
| (93,270 | ) | (5,587 | ) |
Increase in restricted cash relating to operating activities |
| (15,406 | ) | (60,221 | ) |
Decrease (increase) in prepaid operating expenses |
| 7,791 |
| (41,190 | ) |
Increase in other assets |
| (937 | ) | (9,897 | ) |
Increase in trade and other payables |
| 22,942 |
| 902 |
|
Increase in deferred government grant |
| 25,010 |
| 76,193 |
|
Increase in accrued liabilities |
| 36,951 |
| 5,911 |
|
Decrease in other liabilities |
| — |
| (9,646 | ) |
Cash generated from operations |
| 478,433 |
| 416,602 |
|
Interest paid |
| (47,532 | ) | (38,765 | ) |
Interest received |
| 5,390 |
| 4,724 |
|
Income taxes paid |
| (1,125 | ) | (3,193 | ) |
Net cash from operating activities |
| 435,166 |
| 379,368 |
|
|
| For the year ended December 31, |
| ||||
|
| 2013 |
| 2012 |
| 2011 |
|
|
| USD’000 |
| USD’000 |
| USD’000 |
|
Investing activities |
|
|
|
|
|
|
|
Payments to acquire financial assets |
| (258,102 | ) | (43,638 | ) | (40,350 | ) |
Proceeds on sale of financial assets |
| 39,245 |
| 26,019 |
| 45,093 |
|
Payments for property, plant and equipment |
| (650,160 | ) | (400,291 | ) | (931,574 | ) |
Proceeds from government funding to purchase plant and equipment |
| — |
| — |
| 1,967 |
|
Proceeds from disposal of property, plant and equipment |
| 61,099 |
| 37,288 |
| 4,421 |
|
Payments for intangible assets |
| (45,425 | ) | (76,366 | ) | (31,185 | ) |
Payments for land use rights |
| (76,032 | ) | — |
| — |
|
Payments to acquire long-term investment |
| (562 | ) | — |
| (1,000 | ) |
Amounts advanced to proposed joint ventures |
| — |
| — |
| (31,816 | ) |
Change in restricted cash relating to investing activities |
| 71,933 |
| (65,289 | ) | 84,316 |
|
Net cash inflow from disposal of subsidiaries |
| 57,743 |
| — |
| — |
|
Net cash outflow from deconsolidation of subsidiaries |
| (6,799 | ) | — |
| — |
|
Net cash outflow from disposition of discontinued operation |
| — |
| — |
| (3,513 | ) |
Others |
| (407 | ) | — |
| — |
|
Net cash used in investing activities |
| (807,467 | ) | (522,277 | ) | (903,641 | ) |
Financing activities |
|
|
|
|
|
|
|
Proceeds from issuance of convertible preferred shares |
| — |
| — |
| 308,297 |
|
Proceeds from borrowings |
| 905,127 |
| 1,541,480 |
| 1,326,351 |
|
Repayment of borrowings |
| (1,008,698 | ) | (1,328,048 | ) | (1,339,318 | ) |
Proceeds from issuance of convertible bonds |
| 195,800 |
| — |
| — |
|
Proceeds from exercise of employee stock options |
| 3,229 |
| 669 |
| 3,525 |
|
Repayment of promissory notes |
| (30,000 | ) | (30,000 | ) | (30,000 | ) |
Proceeds from non-controlling interest — capital contribution |
| 108,000 |
| — |
| — |
|
Net cash from financing activities |
| 173,458 |
| 184,101 |
| 268,855 |
|
Net increase (decrease) in cash and bank balances |
| 104,007 |
| 96,990 |
| (255,418 | ) |
Cash and bank balances at the beginning of the year |
| 358,490 |
| 261,615 |
| 515,808 |
|
Effects of exchange rate changes on the balance of cash held in foreign currencies |
| (14 | ) | (115 | ) | 1,225 |
|
Cash and bank balances at the end of the year |
| 462,483 |
| 358,490 |
| 261,615 |
|
CONSOLIDATED STATEMENTS OF CASH FLOWS
(In USD’000)
|
| For the year ended December 31 |
| ||
|
| 2012 |
| 2011 |
|
Investing activities |
|
|
|
|
|
Payments to acquire financial assets |
| (43,638 | ) | (40,350 | ) |
Proceeds on sale of financial assets |
| 26,019 |
| 45,093 |
|
Payments for property, plant and equipment |
| (400,291 | ) | (931,574 | ) |
Proceeds from government subsidy to purchase plant and equipment |
| — |
| 1,967 |
|
Proceeds from disposal of property, plant and equipment and intangible assets |
| 37,288 |
| 4,421 |
|
Payments for intangible assets |
| (76,366 | ) | (31,185 | ) |
Payments to acquire long-term investment |
| — |
| (1,000 | ) |
Amounts advanced to proposed joint ventures |
| — |
| (31,816 | ) |
Change in restricted cash relating to investing activities |
| (65,289 | ) | 84,316 |
|
Net cash outflow from disposition of discontinued operation |
| — |
| (3,513 | ) |
Net cash used in investing activities |
| (522,277 | ) | (903,641 | ) |
Financing activities |
|
|
|
|
|
Proceeds from issuance of convertible preferred shares |
| — |
| 308,297 |
|
Proceeds from borrowings |
| 1,541,480 |
| 1,326,351 |
|
Repayment of borrowings |
| (1,328,048 | ) | (1,339,318 | ) |
Proceeds from exercise of employee stock options |
| 669 |
| 3,525 |
|
Repayment of promissory notes |
| (30,000 | ) | (30,000 | ) |
Net cash from financing activities |
| 184,101 |
| 268,855 |
|
Net increase (decrease) in cash and cash equivalents |
| 96,990 |
| (255,418 | ) |
Cash and cash equivalents at the beginning of the year |
| 261,615 |
| 515,808 |
|
Effects of exchange rate changes on the balance of cash held in foreign currencies |
| (115 | ) | 1,225 |
|
Cash and bank balance at the end of the year |
| 358,490 |
| 261,615 |
|
NOTES TO THE CONSOLIDATED FINANCIAL STATEMENTS
1. General information
Semiconductor Manufacturing International Corporation was established as an exempt company incorporated under the laws of the Cayman Islands on April 3, 2000. The address of the principal place of business is 18 Zhangjiang Road, Pudong New Area, Shanghai, China, 201203; The registered address is at PO Box 309, Ugland House, Grand Cayman, KY1-1104 Cayman Islands. Semiconductor Manufacturing International Corporation is an investment holding company.
Semiconductor Manufacturing International Corporation and its subsidiaries (hereinafter collectively referred to as the “Company” or “SMIC”) are mainly engaged in the computer-aided design, manufacturing, testing, packaging, and trading of integrated circuits and other semiconductor services, as well as designing and manufacturing semiconductor masks. The principal subsidiaries and their activities are set out in Note 19.18.
2. Basis of preparation and applicationApplication of new and revised International Financial Reporting Standards (IFRSs)
Basis of preparationNew and revised IFRSs affecting amounts reported and/or disclosures in the financial statements
The consolidated financial statements ofIn the current year, the Company have been prepared in accordance with International Financial Reporting Standards (“IFRS”) ashas applied a number of new and revised IFRSs issued by the International Accounting Standards Board (“IASB”).(IASB) that are mandatorily effective for an accounting period that begins on or after January 1, 2013.
These are the Company’s first annual financial statements issued under IFRS. PriorAmendments to 2012, the Company prepared its consolidated financial statements in accordance with Generally Accepted Accounting Principles in the United States of America (“US GAAP”). IFRS 7 Disclosures — Offsetting Financial Assets and Financial Liabilities
The Company has applied the amendments to IFRS 1, “First-time Adoption7 Disclosures — Offsetting Financial Assets and Financial Liabilities for the first time in the current year. The amendments to IFRS 7 require entities to disclose information about rights of Internationaloffset and related arrangements (such as collateral posting requirements) for financial instruments under an enforceable master netting agreement or similar arrangement. Disclosures of offsetting financial assets and financial liabilities are set out in note 38.
New and revised Standards on consolidation, joint arrangements, associates and disclosures
In May 2011, a package of five standards on consolidation, joint arrangements, associates and disclosures was issued comprising IFRS 10 Consolidated Financial Reporting Standards”Statements, IFRS 11 Joint Arrangements, IFRS 12 Disclosure of Interests in Other Entities, IAS 27 (as revised in 2011) Separate Financial Statements and IAS 28 (as revised in 2011) Investments in Associates and Joint Ventures. Subsequent to transition from US GAAPthe issue of these standards, amendments to IFRS.IFRS 10, IFRS 11 and IFRS 12 were issued to clarify certain transitional guidance on the first-time application of the standards.
In the current year, the Company has applied for the first time IFRS 10, IFRS 11, IFRS 12 and IAS 28 (as revised in 2011) together with the amendments to IFRS 10, IFRS 11 and IFRS 12 regarding the transitional guidance. IAS 27 (as revised in 2011) is not applicable to the Group as it deals only with separate financial statements.
The preparation of the consolidated financial statements resulted in different accounting policies adopted as compared to those disclosed in the Company’s audited consolidated financial statements for the year ended December 31, 2011, prepared under US GAAP. A summary of the significant changes to the Company’s accounting policies, along with reconciliations presenting the impact of the transition to IFRS as at January 1, 2011 and as at December 31, 2011 and for the year ended December 31, 2011, are disclosed in Note 4. A summaryapplication of the Company’s significant accounting policies under IFRSthese standards is presented in Note 3. These policies have been retrospectively and consistently applied.set out below.
NOTES TO THE CONSOLIDATED FINANCIAL STATEMENTS
2. Basis of preparation and application of new and revised International Financial Reporting Standards (IFRSs) (continued)
Basis of preparation (continued)
In addition, the Company has applied the amendments to IAS 1 Presentation of Items of Other Comprehensive Income in advance of the effective date (annual periods beginning on or after July 1, 2012). The amendments introduce new terminology for the statement of comprehensive income and income statement. Under the amendments to IAS 1, the ‘statement of comprehensive income’ is renamed the ‘statement of profit or loss and other comprehensive income’ and the ‘income statement’ is renamed the ‘statement of profit or loss’. The amendments to IAS 1 retain the option to present profit or loss and other comprehensive income in either a single statement or in two separate but consecutive statements. However, the amendments to IAS 1 require items of other comprehensive income to be grouped into two categories in the other comprehensive income section: (a) items that will not be reclassified subsequently to profit or loss and (b) items that may be reclassified subsequently to profit or loss when specific conditions are met. Income tax on items of other comprehensive income is required to be allocated on the same basis — the amendments do not change the option to present items of other comprehensive income either before tax or net of tax. The amendments have been applied retrospectively.
NOTES TO THE CONSOLIDATED FINANCIAL STATEMENTS
2.Basis of preparation and applicationApplication of new and revised International Financial Reporting Standards (IFRSs) (continued)
New and revised IFRSs affecting amounts reported and/or disclosures in the financial statements (continued)
Impact of the application of IFRS 10
IFRS 10 replaces the parts of IAS 27 Consolidated and Separate Financial Statements that deal with consolidated financial statements and SIC-12 Consolidation — Special Purpose Entities. IFRS 10 changes the definition of control such that an investor has control over an investee when a) it has power over the investee, b) it is exposed, or has rights, to variable returns from its involvement with the investee and c) has the ability to use its power to affect its returns. All three of these criteria must be met for an investor to have control over an investee. Previously, control was defined as the power to govern the financial and operating policies of an entity so as to obtain benefits from its activities. Additional guidance has been included in IFRS 10 to explain when an investor has control over an investee. Some guidance included in IFRS 10 that deals with whether or not an investor that owns less than 50% of the voting rights in an investee has control over the investee is relevant to the Company.
Impact of the application of IFRS 11
IFRS 11 replaces IAS 31 Interests in Joint Ventures, and the guidance contained in a related interpretation, SIC-13 Jointly Controlled Entities — Non-Monetary Contributions by Venturers, has been incorporated in IAS 28 (as revised in 2011). IFRS 11 deals with how a joint arrangement of which two or more parties have joint control should be classified and accounted for. Under IFRS 11, there are only two types of joint arrangements — joint operations and joint ventures. The classification of joint arrangements under IFRS 11 is determined based on the rights and obligations of parties to the joint arrangements by considering the structure, the legal form of the arrangements, the contractual terms agreed by the parties to the arrangement, and, when relevant, other facts and circumstances. A joint operation is a joint arrangement whereby the parties that have joint control of the arrangement (i.e. joint operators) have rights to the assets, and obligations for the liabilities, relating to the arrangement. A joint venture is a joint arrangement whereby the parties that have joint control of the arrangement (i.e. joint venturers) have rights to the net assets of the arrangement. Previously, IAS 31 contemplated three types of joint arrangements — jointly controlled entities, jointly controlled operations and jointly controlled assets. The classification of joint arrangements under IAS 31 was primarily determined based on the legal form of the arrangement (e.g. a joint arrangement that was established through a separate entity was accounted for as a jointly controlled entity).
The initial and subsequent accounting of joint ventures and joint operations is different. Investments in joint ventures are accounted for using the equity method (proportionate consolidation is no longer allowed). Investments in joint operations are accounted for such that each joint operator recognizes its assets (including its share of any assets jointly held), its liabilities (including its share of any liabilities incurred jointly), its revenue (including its share of revenue from the sale of the output by the joint operation) and its expenses (including its share of any expenses incurred jointly). Each joint operator accounts for the assets and liabilities, as well as revenues and expenses, relating to its interest in the joint operation in accordance with the applicable Standards.
2.Application of new and revised International Financial Reporting Standards (IFRSs) (continued)
New and revised IFRSs affecting amounts reported and/or disclosures in the financial statements (continued)
Impact of the application of IFRS 12
IFRS 12 is a new disclosure standard and is applicable to entities that have interests in subsidiaries, joint arrangements, associates and/or unconsolidated structured entities. In general, the application of IFRS 12 has resulted in more extensive disclosures in the consolidated financial statements (please see notes 18 and 19 for details).
IFRS 13 Fair Value Measurement
The Company has applied IFRS 13 for the first time in the current year. IFRS 13 establishes a single source of guidance for fair value measurements and disclosures about fair value measurements. The scope of IFRS 13 is broad; the fair value measurement requirements of IFRS 13 apply to both financial instrument items and non-financial instrument items for which other IFRSs require or permit fair value measurements and disclosures about fair value measurements, except for share-based payment transactions that are within the scope of IFRS 2 Share-based Payment, leasing transactions that are within the scope of IAS 17 Leases, and measurements that have some similarities to fair value but are not fair value (e.g. net realizable value for the purposes of measuring inventories or value in use for impairment assessment purposes).
IFRS 13 defines fair value as the price that would be received to sell an asset or paid to transfer a liability in an orderly transaction in the principal (or most advantageous) market at the measurement date under current market conditions. Fair value under IFRS 13 is an exit price regardless of whether that price is directly observable or estimated using another valuation technique. Also, IFRS 13 includes extensive disclosure requirements.
IFRS 13 requires prospective application from January 1, 2013. In addition, specific transitional provisions were given to entities such that they need not apply the disclosure requirements set out in the Standard in comparative information provided for periods before the initial application of the Standard.
Except as described above, the application of the new and revised IFRSs in the current year has had no material impact on the Company’s financial performance and positions for the current and prior years and/or on the disclosures set out in these consolidated financial statements.
NOTES TO THE CONSOLIDATED FINANCIAL STATEMENTS
2.Application of new and revised International Financial Reporting Standards (IFRSs) (continued)
New or revised IFRSs in issue but not yet effective
The Company has not applied the following new and revised IFRSs that have been issued but are not yet effective:
Amendments to | IFRS 10, IFRS 12 and IAS 27 |
|
Amendments to | IAS 19 |
|
|
| |
Amendments to IFRS 9 and IFRS 7 | Mandatory Effective Date of IFRS 9 and Transition Disclosures | |
|
| |
|
| |
IFRS 9 | Financial Instruments | |
|
| |
|
| |
|
| |
|
| |
|
| |
|
| |
|
| |
Amendments to IAS 32 | Offsetting Financial Assets and Financial Liabilities | |
Amendments to IAS 36 | Recoverable Amount Disclosures for Non-Financial Assets1 | |
Amendments to IAS 39 | Novation of Derivatives and Continuation of Hedge Accounting1 | |
Amendments to IFRSs | Annual Improvements to IFRSs 2010-2012 Cycle4 | |
Amendments to IFRSs | Annual Improvements to IFRSs 2011-2013 Cycle2 | |
IFRIC | 21 |
|
1 1.Effective for annual periods beginning on or after January 1, 2013
2 Effective for annual periods beginning on or after January 1, 2015
3 Effective for annual periods beginning on or after January 1, 2014
2.Effective for annual periods beginning on or after July 1, 2014
F-133.Available for application — the mandatory effective date will be determined when the outstanding phases of IFRS 9 are finalized
4.Effective for annual periods beginning on or after July 1, 2014, with limited exceptions
NOTES TO THE CONSOLIDATED FINANCIAL STATEMENTS
2. Basis of preparation and applicationApplication of new and revised International Financial Reporting Standards (IFRSs) (continued)
New andor revised IFRSs in issue but not yet effective (continued)
IFRS 9 Financial Instruments
IFRS 9, issued in November 2009, introduced new requirements for the classification and measurement of financial assets. IFRS 9 was amended in October 2010 to include requirements for the classification and measurement of financial liabilities and for derecognition.
Key requirements of IFRS 9:
· All recognized financial assets that are within the scope of IAS 39 Financial Instruments: Recognition and measurement to be subsequently measured at amortized cost or fair value. Specifically, debt investments that are held within a business model whose objective is to collect the contractual cash flows, and that have contractual cash flows that are solely payments of principal and interest on the principal outstanding are generally measured at amortized cost at the end of subsequent accounting periods. All other debt investments and equity investments are measured at their fair value at the end of subsequent accounting periods. In addition, under IFRS 9, entities make an irrevocable election to present subsequent changes in the fair value of an equity investment (that is not held for trading) in other comprehensive income, with only dividend income generally recognized in profit or loss.
· With regard to the measurement of financial liabilities designated as at fair value through profit or loss, IFRS 9 requires that the amount of change in the fair value of the financial liabilities that is attributable to changes in the credit risk of that liability, is presented in other comprehensive income, unless the recognition of the effects of changes in the liability’s credit risk in other comprehensive income would create or enlarge an accounting mismatch in profit or loss. Changes in fair value attributable to a financial liability’s credit risk are not subsequently reclassified to profit or loss. Under IAS 39, the entire amount of the change in the fair value of the financial liability designated as fair value through profit or loss was presented in profit or loss.
IFRS 9 is effective for annual periods beginning on or after January 1, 2015, with earlier application permitted.
The Company anticipates that the application of IFRS 9 in the future may have a significant impact on amounts reported in respect of the Company’s financial assets (e.g. the Company’s equity instruments that are currently classified as available-for-sale investments measured at cost will have to be measured at fair value at the end of subsequent reporting periods). However, it is not practicable to provide a reasonable estimate of the effect of IFRS 9 until a detailed review has been completed.
NOTES TO THE CONSOLIDATED FINANCIAL STATEMENTS
2. Basis of preparation and applicationApplication of new and revised International Financial Reporting Standards (IFRSs) (continued)
New andor revised IFRSs in issue but not yet effective (continued)
New and revised Standards on consolidation, joint arrangements, associates and disclosures
In May 2011, a package of five Standards consolidation, joint arrangements, associates and disclosures issued, including IFRS 10, IFRS 11, IFRS 12, IAS 27 (as revised in 2011) and IAS 28 (as revised in 2011).
Key requirements of these five Standards are described below
IFRS 10 replaces the parts of IAS 27 Consolidated and Separate Financial Statements that deal with consolidated financial statements. SIC-12 Consolidation — Special Purpose Entities will be withdrawn upon the effective date of IFRS 10. Under IFRS 10, there is only one basis for consolidation, that is, control. In addition, IFRS 10 includes a new definition of control that contains three elements: (a) power over an investee, (b) exposure, or rights, to variable returns from its involvement with the investee, and (c) the ability to use its power over the investee to affect the amount of the investor’s return. Extensive guidance has been added in IFRS 10 to deal with complex scenarios.
IFRS 12 is a disclosure standard and is applicable to entities that have interests in subsidiaries, joint arrangements, associates and/or unconsolidated structured entities. In general, the disclosure requirements in IFRS 12 are more extensive than those in the current standards.
In June 2012, the amendmentsAmendments to IFRS 10, IFRS 1112 and IFRS 12 were issued to clarify certain transitional guidance on the application of these IFRSs for the first time.IAS 27 Investment Entities
These five standards together withThe amendments to IFRS10 define an investment entity and require a reporting entity that meets the amendments regarding the transition guidance are effective for annual periods beginning ondefinition of an investment entity not to consolidate its subsidiaries but instead to measure its subsidiaries at fair value through profit or after January 1, 2013, with earlier application permitted provided all of these standards are applied at the same time. The Company anticipates that the application of these five standards will not have a significant impact on amounts reportedloss in theits consolidated and separate financial statements.
NOTES TO THE CONSOLIDATED FINANCIAL STATEMENTSTo qualify as an investment entity, a reporting entity is required to:
2.· BasisObtain funds from one or more investors for the purpose of preparation and application of new and revised International Financial Reporting Standards (IFRSs) (continued)providing them with professional investment management services.
New and revised IFRSs in issue but not yet effective (continued)
IFRS 13 Fair Value Measurement·Commit to its investor(s) that its business purpose is to invest funds solely for returns from capital appreciation, investment income, or both.
IFRS 13 establishes·Measure and evaluate performance of substantially all of its investments on a single source of guidance for fair value measurementsbasis.
Consequential amendments have been made to IFRS 12 and disclosures about fair value measurements. The standard defines fair value, establishes a framework for measuring fair value, and requires disclosures about fair value measurements. The scope of IFRS 13 is broad; it appliesIAS 27 to both financial instrument items and non-financial instrument items for which other IFRS literature require or permit fair value measurements and disclosures about fair value measurements, except on specified circumstances. In general, theintroduce new disclosure requirements in IFRS 13 are more extensive than those required infor investment entities.
As of December 31, 2013, the current standards. For example, quantitative and qualitative disclosures basedCompany does not anticipate that the investment entities amendments will have any effect on the three-level fair value hierarchy currently required for financial instruments only under IFRS 7 Financial Instruments: Disclosures will be extended by IFRS 13 to cover all assets and liabilities within its scope.
IFRS 13 is effective for annual periods beginning on or after January 1, 2013, with earlier application permitted.
The Company anticipates that the application of the new standard may not have significant impact to the amounts reported in theCompany’s consolidated financial statements but may result in more extensive disclosure.as the Company is not an investment entity.
Amendments to IFRS7 and IAS32IAS 32 Offsetting Financial Assets and Financial Liabilities and the related disclosures
The amendments to IAS 32 clarify existing application issuesthe requirements relating to the offset of financial assets and financial liabilities requirements.liabilities. Specifically, the amendments clarify the meaning of ‘currently has a legally enforceable right of set-off’ and ‘simultaneous realization and settlement’.
The amendments to IFRS 7 require entities to disclose information about rights of offset and related arrangements (such as collateral posting requirements) for financial instruments under an enforceable master netting agreement or similar arrangement.
The amendments to IFRS 7 are effective for annual periods beginning on or after January 1, 2013 and interim periods within those annual periods. The disclosures should be provided retrospectively for all comparative periods. However, the amendments to IAS 32 areCompany does not effective until annual periods beginning on or after January 1, 2014, with retrospective application required.
The Company anticipatesanticipate that the application of these amendments to IAS32 and IFRS7 may result in more disclosures being made with regard to offsettingIAS 32 will have a significant impact on the Company’s consolidated financial statements as the Company does not have any financial assets and financial liabilities in the future.that qualify for offset.
Amendments to IAS 3236 Recoverable Amount Disclosures for Non-Financial Assets
The amendments to IAS 3236 remove the requirement to disclose the recoverable amount of a cash generating unit (CGU) to which goodwill or other intangible assets with indefinite useful lives had been allocated when there has been no impairment or reversal of impairment of the related CGU. Furthermore, the amendments introduce additional disclosure requirements regarding the fair value hierarchy, key assumptions and valuation techniques used when the recoverable amount of an asset or CGU was determined based on its fair value less costs of disposal.
The directors of the Company do not anticipate that the application of these amendments to IAS 36 will have a significant impact on the Company’s consolidated financial statements.
2.Application of new and revised International Financial Reporting Standards (IFRSs) (continued)
New or revised IFRSs in issue but not yet effective (continued)
Amendments to IAS 39 Novation of Derivatives and Continuation of Hedge Accounting
The amendments to IAS 39 provide relief from the requirement to discontinue hedge accounting when a derivative hedging instrument is novated under certain circumstances. The amendments also clarify that income tax relatingany change to distributionsthe fair value of the derivative hedging instrument arising from the novation should be included in the assessment of hedge effectiveness
The directors of the Company do not anticipate that the application of these amendments to holdersIAS 39 will have any effect on the Company’s consolidated financial statements as the Company does not have any derivatives that are subject to novation.
IFRIC — Interpretation (“Int”) 21 Levies
IFRIC — Int 21 Levies addresses the issue of an equity instrumentwhen to recognize a liability to pay a levy. The Interpretation defines a levy, and specifies that the obligating event that gives rise to transaction coststhe liability is the activity that triggers the payment of an equity transactionthe levy, as identified by legislation. The Interpretation provides guidance on how different levy arrangements should be accounted for, in accordance with IAS 12 Income Tax. particular, it clarifies that neither economic compulsion nor the going concern basis of financial statements preparation implies that an entity has a present obligation to pay a levy that will be triggered by operating in a future period.
The directors of the Company anticipatesanticipate that the amendments to IAS 32application of IFRIC — Int 21 will have no effect on the Company’s consolidated financial statements as the Company has already adapted this treatment.does not have any levy arrangements.
Annual Improvements to IFRSs 2010-2012 Cycle
The Annual Improvements to IFRSs 2010-2012 Cycle include a number of amendments to various IFRSs, which are summarized below:
The amendments to IFRS 2 (i) change the definitions of ‘vesting condition’ and ‘market condition’; and (ii) add definitions for ‘performance condition’ and ‘service condition’ which were previously included within the definition of ‘vesting condition’. The amendments to IFRS 2 are effective for share-based payment transactions for which the grant date is on or after July 1, 2014.
The amendments to IFRS 3 clarify that contingent consideration that is classified as an asset or a liability should be measured at fair value at each reporting date, irrespective of whether the contingent consideration is a financial instrument within the scope of IFRS 9 or IAS 39 or a non-financial asset or liability. Changes in fair value (other than measurement period adjustments) should be recognized in profit and loss. The amendments to IFRS 3 are effective for business combinations for which the acquisition date is on or after July 1, 2014.
NOTES TO THE CONSOLIDATED FINANCIAL STATEMENTS
2.Application of new and revised International Financial Reporting Standards (IFRSs) (continued)
Annual Improvements to IFRSs 2010-2012 Cycle (continued)
The amendments to IFRS 8 (i) require an entity to disclose the judgements made by management in applying the aggregation criteria to operating segments, including a description of the operating segments aggregated and the economic indicators assessed in determining whether the operating segments have ‘similar economic characteristics’; and (ii) clarify that a reconciliation of the total of the reportable segments’ assets to the entity’s assets should only be provided if the segment assets are regularly provided to the chief operating decision-maker.
The amendments to the basis for conclusions of IFRS 13 clarify that the issue of IFRS 13 and consequential amendments to IAS 39 and IFRS 9 did not remove the ability to measure short- term receivables and payables with no stated interest rate at their invoice amounts without discounting, if the effect of discounting is immaterial.
The amendments to IAS 16 and IAS 38 remove perceived inconsistencies in the accounting for accumulated depreciation/amortization when an item of property, plant and equipment or an intangible asset is revalued. The amended standards clarify that the gross carrying amount is adjusted in a manner consistent with the revaluation of the carrying amount of the asset and that accumulated depreciation/ amortization is the difference between the gross carrying amount and the carrying amount after taking into account accumulated impairment losses.
The amendments to IAS 24 clarify that a management entity providing key management personnel services to a reporting entity is a related party of the reporting entity. Consequently, the reporting entity should disclose as related party transactions the amounts incurred for the service paid or payable to the management entity for the provision of key management personnel services. However, disclosure of the components of such compensation is not required.
The directors do not anticipate that the application of the amendments included in the Annual Improvements to IFRSs 2010-2012 Cycle will have a material effect on the Company’s consolidated financial statements.
2.Application of new and revised International Financial Reporting Standards (IFRSs) (continued)
Annual Improvements to IFRSs 2011-2013 Cycle
The Annual Improvements to IFRSs 2011-2013 Cycle include a number of amendments to various IFRSs, which are summarized below:
The amendments to IFRS 3 clarify that the standard does not apply to the accounting for the formation of all types of joint arrangement in the financial statements of the joint arrangement itself.
The amendments to IFRS 13 clarify that the scope of the portfolio exception for measuring the fair value of a group of financial assets and financial liabilities on a net basis includes all contracts that are within the scope of, and accounted for in accordance with, IAS 39 or IFRS 9, even if those contracts do not meet the definitions of financial assets or financial liabilities within IAS 32.
The amendments to IAS 40 clarify that IAS 40 and IFRS 3 are not mutually exclusive and application of both standards may be required. Consequently, an entity acquiring investment property must determine whether:
(a)the property meets the definition of investment property in terms of IAS 40; and
(b)the transaction meets the definition of a business combination under IFRS 3.
The directors do not anticipate that the application of the amendments included in the Annual Improvements to IFRSs 2011-2013 Cycle will have a material effect on the Company’s consolidated financial statements.
3. Significant accounting policies
Statement of compliance
The consolidated financial statements have been prepared in accordance with International Financial Reporting Standards (“IFRS”) issued by the International Accounting Standards Board (“IASB”). In addition, the consolidated financial statements include applicable disclosures required by the Rules Governing the Listing of Securities on The Stock Exchange of Hong Kong Limited and by the Hong Kong Companies Ordinance.
Basis of preparation
The consolidated financial statements have been prepared on a historical cost basis, except for certain financial instruments that are measured at fair value as explained in the accounting policies set out below. The consolidated financial statements are presented in US dollars and all values are rounded to the nearest thousand, (US’000), except when otherwise indicated. The Company presented a sub-total for ‘profit (loss) from operations’ in current year. As a result, certain amount in prior year has been reclassified to conform to current year’s presentation.
Historical cost is generally based on the fair value of the consideration given in exchange for goods and services.
NOTES TO THE CONSOLIDATED FINANCIAL STATEMENTS
3.Significant accounting policies (continued)
Basis of preparation (continued)
Fair value is the price that would be received to sell an asset or paid to transfer a liability in an orderly transaction between market participants at the measurement date, regardless of whether that price is directly observable or estimated using another valuation technique. In estimating the fair value of an asset or a liability, the Company takes into account the characteristics of the asset or liability if market participants would take those characteristics into account when pricing the asset or liability at the measurement date. Fair value for measurement and/or disclosure purposes in these consolidated financial statements is determined on such a basis, except for share-based payment transactions that are within the scope of IFRS 2, and measurements that have some similarities to fair value but are not fair value, such as net realizable value in IAS 2 or value in use in IAS 36.
In addition, for financial reporting purposes, fair value measurements are categorized into Level 1, 2 or 3 based on the degree to which the inputs to the fair value measurements are observable and the significance of the inputs to the fair value measurement in its entirety, which are described as follows:
·Level 1 inputs are quoted prices (unadjusted) in active markets for identical assets or liabilities that the entity can access at the measurement date;
·Level 2 inputs are inputs, other than quoted prices included within Level 1, that are observable for the asset or liability, either directly or indirectly; and
· Level 3 inputs are unobservable inputs for the asset or liability
The principal accounting policies are set out below.
Basis of consolidation
The consolidated financial statements incorporate the financial statements of the Company and entities (including structured entities) controlled by the Company (its subsidiaries).and its subsidiaries. Control is achieved wherewhen the Company:
·has power over the investee;
·is exposed, or has rights, to variable returns from its involvement with the investee; and
·has the ability to use its power to affect its returns.
The Company reassesses whether or not it controls an investee if facts and circumstances indicate that there are changes to one or more of the three elements of control listed above.
When the Company has less than a majority of the power to govern the financial and operating policiesvoting rights of an entity so asinvestee, it has power over the investee when the voting rights are sufficient to obtain benefits from its activities.give it the practical ability to direct the relevant activities of the investee unilaterally. The Company considers all relevant facts and circumstances in assessing whether or not the Company’s voting rights in an investee are sufficient to give it power, including:
Income·the size of the Company’s holding of voting rights relative to the size and dispersion of holdings of the other vote holders;
·potential voting rights held by the Company, other vote holders or other parties;
3.Significant accounting policies (continued)
Basis of consolidation (continued)
·rights arising from other contractual arrangements; and
·any additional facts and circumstances that indicate that the Company has, or does not have, the current ability to direct the relevant activities at the time that decisions need to be made, including voting patterns at previous shareholders’ meetings.
Consolidation of a subsidiary begins when the Company obtains control over the subsidiary and ceases when the Company loses control of the subsidiary. Specifically, income and expenses of subsidiariesa subsidiary acquired or disposed of during the year are included in the consolidated statementsstatement of profit or loss and other comprehensive income from the effective date the Company gains control until the date when the Company ceases to control the subsidiary.
Profit or loss and each component of acquisition and upother comprehensive income are attributed to the effective dateowners of disposal, as appropriate.the Company and to the non-controlling interests. Total comprehensive income of subsidiaries is attributed to the owners of the Company and to the non-controlling interests even if this results in the non-controllingnon- controlling interests having a deficit balance.
When necessary, adjustments are made to the financial statements of the subsidiaries to bring their accounting policies ininto line with those used by otherthe Group’s accounting policies.
All intragroup assets and liabilities, equity, income, expenses and cash flows relating to transactions between members of the Company.
All intra-group transactions, balances, income and expensesCompany are eliminated in full on consolidation.
Non-controllingChanges in the Company’s ownership interests in existing subsidiaries
Changes in the Company’s ownership interests in subsidiaries that do not result in the Company losing control over the subsidiaries are presented separately fromaccounted for as equity transactions. The carrying amounts of the Company’s interests and the non-controlling interests are adjusted to reflect the changes in their relative interests in the subsidiaries. Any difference between the amount by which the non-controlling interests are adjusted and the fair value of the consideration paid or received is recognized directly in equity therein.and attributed to owners of the Company.
When the Company loses control of a subsidiary, a gain or loss is recognized in profit or loss and is calculated as the difference between (i) the aggregate of the fair value of the consideration received and the fair value of any retained interest and (ii) the previous carrying amount of the assets (including goodwill), and liabilities of the subsidiary and any non-controlling interests. All amounts previously recognized in other comprehensive income in relation to that subsidiary are accounted for as if the Company had directly disposed of the related assets or liabilities of the subsidiary (i.e. reclassified to profit or loss or transferred to another category of equity as specified/permitted by applicable IFRSs). The fair value of any investment retained in the former subsidiary at the date when control is lost is regarded as the fair value on initial recognition for subsequent accounting under IAS 39, when applicable, the cost on initial recognition of an investment in an associate or a joint venture.
NOTES TO THE CONSOLIDATED FINANCIAL STATEMENTS
3.Significant accounting policies (continued)
Investments in associates
An associate is an entity over which the Company has significant influence and that is neither a subsidiary nor an interest in a joint venture. Significant influence is the power to participate in the financial and operating policy decisions of the investee but is not control or joint control over those policies.
The results and assets and liabilities of associates are incorporated in these consolidated financial statements using the equity method of accounting. The financial statements of associates used for equity accounting purposes are prepared using uniform accounting policies as those of the Company for like transactions and events in similar circumstances. Under the equity method, an investmentinvestments in an associate isassociates are initially recognized in the consolidated statement of financial position at cost and adjusted thereafter to recognize the Company’s share of the profit or loss and other comprehensive income of the associate.associates. When the Company’s share of losses of an associate exceeds the Company’s interest in that associate (which includes any long-term interests that, in substance, form part of the Company’s net investment in the associate), the Company discontinues recognizing its share of further losses. Additional losses are recognized only to the extent that the Company has incurred legal or constructive obligations or made payments on behalf of thethat associate.
NOTES TO THE CONSOLIDATED FINANCIAL STATEMENTSthe investment in an associate, any excess of the cost of the investment over the Company’s share of the net fair value of the identifiable assets and liabilities of the investee is recognized as goodwill, which is included within the carrying amount of the investment. Any excess of the Company’s share of the net fair value of the identifiable assets and liabilities over the cost of the investment, after reassessment, is recognized immediately in profit or loss in the period in which the investment is acquired.
3.Significant accounting policies (continued)
Investments in associates (continued)
The requirements of IAS 39 are applied to determine whether it is necessary to recognize any impairment loss with respect to the Company’s investment in an associate. When necessary, the entire carrying amount of the investment (including goodwill) is tested for impairment in accordance with IAS 36 Impairment of Assets as a single asset by comparing its recoverable amount (higher of value in use and fair value less costs to sell) with its carrying amount. Any impairment loss recognized forms part of the carrying amount of the investment. Any reversal of that impairment loss is recognized in accordance with IAS 36 to the extent that the recoverable amount of the investment subsequently increases.
Upon disposalThe Company discontinues the use of the equity method from the date when the investment ceases to be an associate, that resultsor when the investment is classified as held for sale. When the Company retains an interest in the former associate and the retained interest is a financial asset, the Company losing significant influence over that associate, anymeasures the retained investment is measuredinterest at fair value at that date and the fair value is regarded as its fair value anon initial recognition as a financial asset in accordance with IAS 39. The difference between the previous carrying amount of the associate attributable toat the date the equity method was discontinued, and the fair value of any retained interest and its fair valueany proceeds from disposing of a part interest in the associate is included in the determination of the gain or loss on disposal of the associate. In addition, the Company accounts for all amounts previously recognized in other comprehensive income in relation to that associate on the same basis as would be required if that associate had directly disposed of the related assets or liabilities. Therefore, if a gain or loss previously recognized in other comprehensive income by that associate would be reclassified to profit or loss on the disposal of the related assets or liabilities, the Company reclassifies the gain or loss from equity to profit or loss (as a reclassification adjustment) when it loses significant influence overthe equity method is discontinued.
3.Significant accounting policies (continued)
Investments in associates (continued)
When the Company reduces its ownership interest in an associate but the Company continues to use the equity method, the Company reclassifies to profit or loss the proportion of the gain or loss that associate.had previously been recognized in other comprehensive income relating to that reduction in ownership interest if that gain or loss would be reclassified to profit or loss on the disposal of the related assets or liabilities.
When a group entity transacts with itsan associate of the Company, profits and losses resulting from the transactions with the associate are recognized in the Company’Company’s consolidated financial statements only to the extent of interests in the associate that are not related to the Company.
NOTES TO THE CONSOLIDATED FINANCIAL STATEMENTS
3.Significant accounting policies (continued)
Non-current assets held-for-sale
Non-current assets and disposal groups are classified as held for sale if their carrying amount will be recovered principally through a sale transaction rather than through continuing use. This condition is regarded as met only when the sale is highly probable and the non-current asset (or disposal group) is available for immediate sale in its present condition. Management must be committed to the sale, which should be expected to qualify for recognition as a completed sale within one year from the date of classification.
Non-current assets (and disposal groups) classified as held-for-sale are measured at the lower of their previous carrying amount and fair value less costs to sell.of disposal.
Revenue recognition
Revenue is measured at the fair value of the consideration received or receivable. Revenue is reduced for estimated customer returns, rebates and other similar allowances.
Sale of goods
The Company manufactures semiconductor wafers for its customers based on the customers’ designs and specifications pursuant to manufacturing agreements and/or purchase orders. The Company also sells certain semiconductor standard products to customers.
Revenue from the sale of goods is recognized when the goods are delivered and titles have passed, at which time all the following conditions are satisfied:
· the Company has transferred to the buyer the significant risks and rewards of ownership of the goods;
· the Company retains neither continuing managerial involvement to the degree usually associated with ownership nor effective control over the goods sold;
· the amount of revenue can be measured reliably;
· it is probable that the economic benefits associated with the transaction will flow to the Company; and
· the costs incurred or to be incurred in respect of the transaction can be measured reliably.
NOTES TO THE CONSOLIDATED FINANCIAL STATEMENTS
3. Significant accounting policies (continued)
Revenue recognition (continued)
Sale of goods (continued)
Customers have the right of return within one year pursuant to warranty and sales return provisions. The Company typically performs tests of its products prior to shipment to identify yield rate per wafer. Occasionally, product tests performed after shipment identify yields below the level agreed with the customer. In those circumstances, the customer arrangement may provide for a reduction to the price paid by the customer or for the costs to return products and to ship replacement products to the customer. The Company estimates the amount of sales returns and the cost of replacement products based on the historical trend of returns and warranty replacements relative to sales as well as a consideration of any current information regarding specific known product defects at customers that may exceed historical trends.
Gain on sale of real estate property
Gain from sales of real estate property is recognized when all the following conditions are satisfied: 1) sales contract executed;executed, 2) full payment collected, or down payment collected and non-cancellable mortgage contract is executed with borrowing institution, 3) and the respective properties have been delivered to the buyers.
Interest income
Interest income from a financial asset is recognized when it is probable that the economic benefits will flow to the Company and the amount of income can be measured reliably. Interest income is accrued on a time basis, by reference to the principal outstanding and at the effective interest rate applicable, which is the rate that exactly discounts estimated future cash receipts through the expected life of the financial asset to that asset’s net carrying amount on initial recognition.applicable.
Foreign currencies
The United States dollar (“US dollar”), the currency in which a substantialsignificant portion of the Company’s transactions are denominated, is used as the functional and reporting currency of the Company.
In preparing the financial statements of each individual group entity transactions in currencies other than the entity’s functional currency (foreign currencies) are recognized at the rates of exchange prevailing at the dates of the transactions. At the end of each reporting period, monetary items denominated in foreign currencies are retranslated at the rates prevailing at that date. Non-monetary items that are measured in terms of historical cost in a foreign currency are not retranslated.
Exchange differences on monetary items are recognized in profit or loss in the period in which they arise.
NOTES TO THE CONSOLIDATED FINANCIAL STATEMENTS
3.Significant accounting policies (continued)
Foreign currencies (continued)
For the purposes of presenting consolidated financial statements, the assets and liabilities of the Company’s foreign operations are translated into United States dollars using exchange rates prevailing at the end of each reporting period. Income and expense items are translated at the average exchange rates for the period, unless exchange rates fluctuate significantly during that period, in which case the exchange rates at the dates of the transactions are used. Exchange differences arising, if any, are recognized in other comprehensive income and accumulated in equity (attributed to non-controlling interests as appropriate).
3.Significant accounting policies (continued)
Foreign currencies (continued)
On the disposal of a foreign operation (i.e. a disposal of the Company’s entire interest in a foreign operation, or a disposal involving loss of control over a subsidiary that includes a foreign operation, or a disposal involving loss of significant influence over an associate that includes a foreign operation), all of the exchange differences accumulated in equity in respect of that operation attributable to the owners of the Company are reclassified to profit or loss.
In addition, in relation to a partial disposal of a subsidiary that does not result in the Company losing control over the subsidiary, the proportionate share of accumulated exchange differences are re- attributed to non-controlling interests and are not recognized in profit or loss.
Borrowing costs
Borrowing costs directly attributable to the acquisition, construction or production of qualifying assets, which are assets that necessarily take a substantial period of time to get ready for their intended use or sale, are added to the cost of those assets, until such time as the assets are substantially ready for their intended use or sale.
Investment income earned on the temporary investment of specific borrowings pending their expenditure on qualifying assets is deducted from the borrowing costs eligible for capitalization.
All other borrowing costs are recognized in profit or loss in the period in which they are incurred.
NOTES TO THE CONSOLIDATED FINANCIAL STATEMENTS
3.Significant accounting policies (continued)
Government grantsfunding
Government grants arefunding is not recognized in profit or loss until there is reasonable assurance that the Company will comply with the conditions attaching to them and that the grantsfunding will be received.
Government grants arefunding is recognized in profit or loss on a systematic basis over the periods in which the Company recognizes as expenses the related costs for which the grants arefunding is intended to compensate. Specifically, government grantsfunding whose primary condition is that the Company should purchase, construct or otherwise acquire non-current assets are recognized as deferred revenue in the consolidated statements of financial position and transferred to profit or loss on a systematic and rational basis over the useful lives of the related assets.
Government grantsfunding that areis receivable as compensation for expenses or losses already incurred or for the purpose of giving immediate financial support to the Company with no future related cost are recognized in profit or loss in the period in which they become receivable.
Retirement benefits
The Company’s local Chinese employees are entitled to a retirement benefit based on their basic salary upon retirement and their length of service in accordance with a state-managed pension plan. The PRC government is responsible for the pension liability to these retired staff. The Company is required to make contributions to the state-managed retirement plan based onat a range ofmain rate equal to 20% to 22% of the monthly basic salary of current employees. The costs are recognized in profit or loss when incurred. Employees are required to make contributions equivalent to 6%at a rate equal to 8% of their monthly basic salary.
NOTES TO THE CONSOLIDATED FINANCIAL STATEMENTS
3.Significant accounting policies (continued)
Share-based payment arrangements
Equity-settled share-based payments to employees and others providing similar services are measured at the fair value of the equity instruments at the grant date. Details regarding the determination of the fair value of equity-settled share-based transactions are set out in Note 33.34.
The fair value determined at the grant date of the equity-settled share-based payments is expensed on a straight-line basis over the vesting period, based on the Company’s estimate of equity instruments that will eventually vest, with a corresponding increase in equity. At the end of each reporting period, the Company revises its estimate of the number of equity instruments expected to vest. The impact of the revision of the original estimates, if any, is recognized in profit or loss such that the cumulative expense reflects the revised estimate, with a corresponding adjustment to the equity-settled employee benefits reserve. When share options are exercised, the amount previously recognized in the reserve will be transferred to share premium.
Equity-settled share-based payment transactions with parties other than employees are measured at the fair value of the goods or services received, except where that fair value cannot be estimated reliably, in which case they are measured at the fair value of the equity instruments granted, measured at the date the entity obtains the goods or the counterparty renders the service.
NOTES TO THE CONSOLIDATED FINANCIAL STATEMENTS
3.Significant accounting policies (continued)
Taxation
Income tax expense represents the sum of the tax currently payable and deferred tax.
Current tax
The tax currently payable is based on taxable profit for the year. Taxable profit differs from profit before tax as reported in the consolidated statements of profit or loss and other comprehensive income because of items of income or expense that are taxable or deductible in other years and items that are never taxable or deductible. The Company’s liability for current tax is calculated using tax rates that have been enacted or substantively enacted by the end of the reporting period.
Deferred tax
Deferred tax is recognized on temporary differences between the carrying amounts of assets and liabilities in the consolidated financial statements and the corresponding tax bases used in the computation of taxable profit. Deferred tax liabilities are generally recognized for all taxable temporary differences. Deferred tax assets are generally recognized for all deductible temporary differences to the extent that it is probable that taxable profits will be available against which those deductible temporary differences can be utilized. Such deferred tax assets and liabilities are not recognized if the temporary difference arises from goodwill or from the initial recognition other than in a business combination of other assets and liabilities in a transaction that affects neither the taxable profit nor the accounting profit.
3.Significant accounting policies (continued)
Taxation (continued)
Deferred tax (continued)
Deferred tax liabilities are recognized for taxable temporary differences associated with investments in subsidiaries and associates, except where the Company is able to control the reversal of the temporary difference and it is probable that the temporary difference will not reverse in the foreseeable future. Deferred tax assets arising from deductible temporary differences associated with such investments are only recognized to the extent that it is probable that there will be sufficient taxable profits against which to utilize the benefits of the temporary differences and they are expected to reverse in the foreseeable future.
The carrying amount of deferred tax assets is reviewed at the end of each reporting period and reduced to the extent that it is no longer probable that sufficient taxable profits will be available to allow all or part of the asset to be recovered.
Deferred tax liabilities and assets are measured at the tax rates that are expected to apply in the period in which the liability is settled or the asset is realized, based on tax rates (and tax laws) that have been enacted or substantively enacted by the end of the reporting period.
The measurement of deferred tax liabilities and assets reflects the tax consequences that would follow from the manner in which the Company expects, at the end of the reporting period, to recover or settle the carrying amount of its assets and liabilities.
NOTES TO THE CONSOLIDATED FINANCIAL STATEMENTS
3.Significant accounting policies (continued)
Taxation (continued)
Current and deferred tax are recognized in profit or loss.
Property, plant and equipment
Property, plant and equipment held for use in the production or supply of goods or services, or for administrative purposes, are stated in the consolidated statement of financial position at their costs, less any subsequent accumulated depreciation and subsequent accumulated impairment losses. Such cost includes the cost of replacing part of the property, plant and equipment and borrowing costs for long- term construction projects if the recognition criteria are met.
The Company constructs certain of its plant and equipment. In addition to costs under the construction contracts, external costs that are directly related to the construction and acquisition of such facilities, including dutiesplant and tariffs, equipment installation and shipping costs, are capitalized. Interest incurred during the active construction period is capitalized. Depreciation is recorded at the time assets are ready for their intended use. Such properties are classified to the appropriate categories of property, plant and equipment when completed and ready for intended use. Depreciation of these assets, on the same basis as other property assets, commences when the assets are ready for their intended use.
An item at property, plant and equipment is derecognized upon disposal or when no future economic benefits are expected to arise from the continued use of the asset. Any gain or loss arising on the disposal or retirement of an item of property, plant and equipment is determined as the difference between the sales proceeds and the carrying amount of the asset and is recognized in profit or loss.
NOTES TO THE CONSOLIDATED FINANCIAL STATEMENTS
3. Significant accounting policies (continued)
Property, plant and equipment (continued)
Depreciation is recognized so as to write off the cost of items of property, plant and equipment other than properties under construction over their estimated useful lives, using the straight-line method. The estimated useful lives and depreciation method are reviewed at the end of each reporting period, with the effect of any changes in estimate accounted for on a prospective basis.
The following useful lives are used in the calculation of depreciation.
Buildings |
| 25 years | |
Plant and equipment |
| 5–10 years | |
Office equipment |
| 3–5 years |
Prepaid land use right
Prepaid land use rights, which are all located in the PRC, are recorded at cost and are charged to profit or loss ratably over the term of the land use agreements which range from 50 to 70 years.
Intangible assets
Acquired intangible assets which consists primarily of technology, licenses and patents, are carried at cost less accumulated amortization and any accumulated impairment loss. Amortization is computed using the straight-line method over the expected useful lives of the assets of three to ten years. The estimated useful life and amortization method are reviewed at the end of each reporting period, with effect of any changes in estimate being accounted for on a prospective basis.
NOTES TO THE CONSOLIDATED FINANCIAL STATEMENTS
3.Significant accounting policies (continued)
Impairment of tangible and intangible assets other than goodwill
At the end of each reporting period, the Company reviews the carrying amounts of its tangible and intangible assets to determine whether there is any indication that those assets have suffered an impairment loss. If any such indication exists, the recoverable amount of the asset is estimated in order to determine the extent of the impairment loss (if any). When it is not possible to estimate the recoverable amount of an individual asset, the Company estimates the recoverable amount of the cash- generating unit to which the asset belongs. When a reasonable and consistent basis of allocation can be identified, corporate assets are also allocated to individual cash-generating units, or otherwise they are allocated to the smallest group of cash-generating units for which a reasonable and consistent allocation basis can be identified.
Recoverable amount is the higher of fair value less costs to sell and value in use. In assessing value in use, the estimated future cash flows are discounted to their present value using a pre-tax discount rate that reflects current market assessments of the time value of money and the risks specific to the asset for which the estimates of future cash flows have not been adjusted.
If the recoverable amount of an asset (or cash-generating unit) is estimated to be less than its carrying amount, the carrying amount of the asset (or cash-generating unit) is reduced to its recoverable amount. An impairment loss is recognized immediately in profit or loss.
3.Significant accounting policies (continued)
Impairment of tangible and intangible assets other than goodwill (continued)
When an impairment loss subsequently reverses, the carrying amount of the asset (or a cash-generating unit) is increased to the revised estimate of its recoverable amount, but so that the increased carrying amount does not exceed the carrying amount that would have been determined had no impairment loss been recognized for the asset (or cash-generating unit) in prior years. A reversal of an impairment loss is recognized as income.
NOTES TO THE CONSOLIDATED FINANCIAL STATEMENTS
3.Significant accounting policies (continued)
Cash and cash equivalents
Cash equivalents are short-term, highly liquid investments that are readily convertible to known amounts of cash and are subjected to an insignificant risk of changes in value, with original maturities of three months or less.
Restricted cash
Restricted cash consists of bank deposits pledged against letters of credit and short-term credit facilities and unused government subsidiesfunding for certain research and development projects. Changes of restricted cash pledged against letter of credit and short-term credit facilities are presented as investing activity in consolidated statements of cash flows.
Inventories
Inventories are stated at the lower of cost and net realizable value. Costs of inventories are determined on a weighted average basis. Net realizable value represents the estimated selling price for inventories less all estimated costs of completion and costs necessary to make the sale.
Provisions
Provisions are recognized when the Company has a present obligation (legal or constructive) as a result of a past event, it is probable that the Company will be required to settle the obligation, and a reliable estimate can be made of the amount of the obligation.
The amount recognized as a provision is the best estimate of the consideration required to settle the present obligation at the end of the reporting period, taking into account the risks and uncertainties surrounding the obligation. When a provision is measured using the cash flows estimated to settle the present obligation, its carrying amount is the present value of those cash flows (when the effect of the time value of money is material).
When some or all of the economic benefits required to settle a provision are expected to be recovered from a third party, a receivable is recognized as an asset if it is virtually certain that reimbursement will be received and the amount of the receivable can be measured reliably.
NOTES TO THE CONSOLIDATED FINANCIAL STATEMENTS
3.Significant accounting policies (continued)
Financial instruments
Financial assets and financial liabilities are recognized when a group entity becomes a party to the contractual provisions of the instruments.
Financial assets and financial liabilities are initially measured at fair value. Transaction costs that are directly attributable to the acquisition or issue of financial assets and financial liabilities other than financial assets and financial liabilities at fair value through profit or loss are added to or deducted from the fair value of the financial assets or financial liabilities, as appropriate, on initial recognition. Transaction costs directly attributable to the acquisition of financial assets or financial liabilities at fair value through profit or loss are recognized immediately in profit or loss.
NOTES TO THE CONSOLIDATED FINANCIAL STATEMENTS
3.Significant accounting policies (continued)
Financial assets
Financial assets are classified into the following specified categories: financial assets ‘at fair value through profit or loss’ (FVTPL)(“FVTPL”) and ‘available-for-sale’ (AFS)(“AFS”) financial assets and ‘loans and receivables’. The classification depends on the nature and purpose of the financial assets and is determined at the time of initial recognition. All regular way purchases or sales of financial assets are recognized and derecognized on a trade date basis. Regular way purchases or sales are purchases or sales of financial assets that require delivery of assets within the time frame established by regulation or convention in the marketplace.
Effective interest method
The effective interest method is a method of calculating the amortized cost of a debt instrument and of allocating interest income over the relevant period. The effective interest rate is the rate that exactly discounts estimated future cash receipts (including all fees and points paid or received that form an integral part of the effective interest rate, transaction costs and other premiums or discounts) through the expected life of the debt instrument, or, where appropriate, a shorter period, to the net carrying amount on initial recognition.
Income is recognized on an effective interest basis for debt instruments other than those financial assets classified as at FVTPL.
Financial assets at FVTPL
Financial assets are classified as at FVTPL when the financial asset is held for trading.
A financial asset is classified as held for trading if:
· it has been acquired principally for the purpose of selling in the near term; or
· it is a part of a portfolio of identified financial instruments that the Company manages together and has a recent actual pattern of short-term profit-taking; or
· it is a derivative that is not designated and effective as a hedging instrument.
Financial assets at FVTPL are stated at fair value, with any gains or losses arising on remeasurement recognized in profit or loss. The net gain or loss recognized in profit or loss incorporates any dividend or interest earned on the financial asset and is included in the ‘other gains and losses’ line item.
NOTES TO THE CONSOLIDATED FINANCIAL STATEMENTS
3. Significant accounting policies (continued)
Financial assets (continued)
Available-for-sale financial assets (AFS financial assets)
��
AFS financial assets are non-derivatives that are either designated as AFS or are not classified as (a) loans and receivables, (b) held-to-maturity investments or (c) financial assets at fair value through profit or loss.
Dividends on AFS equity instruments are recognized in profit or loss when the Company’s right to receive the dividends is established.
The Company has AFS equity investments totaled at $3.8US$1.3 million and US$3.8 million as of December 31, 20122013 and 2011,2012, respectively, that do not have a quoted market price in an active market and whose fair value cannot be reliably measured and therefore has been measured at cost less any identified impairment losses at the end of each reporting period. The AFS equity investment is recorded in other assets.
Loans and receivables
Loans and receivables are non-derivative financial assets with fixed or determinable payments that are not quoted in an active market. Loans and receivables including trade and other receivables, and cash and bank balances and restricted cash are measured at amortized cost using the effective interest method, less any impairment loss.
Interest income is recognized by applying the effective interest rate, except for short-term receivables when the effect of discounting is immaterial.
Impairment of financial assets
Financial assets, other than those at FVTPL, are assessed for indicators of impairment at the end of each reporting period. Financial assets are considered to be impaired when there is objective evidence that, as a result of one or more events that occurred after the initial recognition of the financial asset, the estimated future cash flows of the investment have been affected.
For all other financial assets, objective evidence of impairment could include:
· significant financial difficulty of the issuer or counterparty; or
· breach of contract, such as a default or delinquency in interest or principal payments; or
· it becoming probable that the borrower will enter bankruptcy or financial re-organization.
For certain categories of financial assets, such as trade receivables, assets are assessed for impairment on a collective basis even if they were assessed not to be impaired individually. Objective evidence of impairment for a portfolio of receivables could include the Company’s past experience of collecting payments, an increase in the number of delayed payments in the portfolio past the average credit period, as well as observable changes in national or local economic conditions that correlate with default on receivables.
NOTES TO THE CONSOLIDATED FINANCIAL STATEMENTS
3. Significant accounting policies (continued)
Financial assets (continued)
Impairment of financial assets (continued)
For financial assets carried at amortized cost, the amount of the impairment loss recognized is the difference between the asset’s carrying amount and the present value of estimated future cash flows, discounted at the financial asset’s original effective interest rate.
For financial assets that are carried at cost, the amount of the impairment loss is measured as the difference between the asset’s carrying amount and the present value of the estimated future cash flows discounted at the current market rate of return for a similar financial asset. Such impairment loss will not be reversed in subsequent periods.
The carrying amount of the financial asset is reduced by the impairment loss directly for all financial assets with the exception of trade receivables, where the carrying amount is reduced through the use of an allowance account. When a trade receivable is considered uncollectible, it is written off against the allowance account. Subsequent recoveries of amounts previously written off are credited to profit or loss.
For financial assets measured at amortized cost, if, in a subsequent period, the amount of the impairment loss decreases and the decrease can be related objectively to an event occurring after the impairment was recognized, the previously recognized impairment loss is reversed through profit or loss to the extent that the carrying amount of the investment at the date the impairment is reversed does not exceed what the amortized cost would have been had the impairment not been recognized.
Derecognition of financial assets
The Company derecognizes a financial asset only when the contractual rights to the cash flows from the asset expire, or when it transfers the financial asset and substantially all the risks and rewards of ownership of the asset to another party. If the Company neither transfers nor retains substantially all the risks and rewards of ownership and continues to control the transferred asset, the Company recognizes its retained interest in the asset and an associated liability for amounts it may have to pay. If the Company retains substantially all the risks and rewards of ownership of a transferred financial asset, the Company continues to recognize the financial asset and also recognizes a collateralized borrowing for the proceeds received.
On derecognition of a financial asset in its entirety the difference between the asset’s carrying amount and the sum of the consideration received and receivable and the cumulative gain or loss that had been recognized in other comprehensive income and accumulated in equity is recognized in profit or loss.
Financial liabilities and equity instruments
Classification as debt or equity
Debt and equity instruments issued by a group entity are classified as either financial liabilities or as equity in accordance with the substance of the contractual arrangements and the definitions of a financial liability and an equity instrument.
NOTES TO THE CONSOLIDATED FINANCIAL STATEMENTS
3. Significant accounting policies (continued)
Financial liabilities and equity instruments (continued)
Equity instruments
An equity instrument is any contract that evidences a residual interest in the assets of the group after deducting all of its liabilities. Equity instruments issued by the Company are recognisedrecognized at the proceeds received, net of direct issue costs.
Convertible Bonds
The component parts of the convertible bonds issued by the Company are classified separately as financial liabilities and equity in accordance with the substance of the contractual arrangements and the definitions of a financial liability and an equity instrument. Conversion option that will be settled by the exchange of a fixed amount of cash or another financial asset for a fixed number of the Company’s own equity instruments is an equity instrument.
At the date of issue, the fair value of the liability component is estimated using the prevailing market interest rate for similar non-convertible instruments. This amount is recorded as a liability on an amortized cost basis using the effective interest method until extinguished upon conversion or at the instrument’s maturity date.
The conversion option classified as equity is determined by deducting the amount of the liability component from the fair value of the compound instrument as a whole. This is recognized and included in equity, net of income tax effects, and is not subsequently remeasured. In addition, the conversion option classified as equity will remain in equity until the conversion option is exercised, in which case, the balance recognized in equity will be transferred to share premium. Where the conversion option remains unexercised at the maturity date of the convertible note, the balance recognized in equity will be transferred to retained earnings. No gain or loss is recognized in profit or loss upon conversion or expiration of the conversion option.
Transaction costs that relate to the issue of the convertible bonds are allocated to the liability and equity components in proportion to the allocation of the gross proceeds. Transaction costs relating to the equity component are charged directly to equity. Transaction costs relating to the liability component are included in the carrying amount of the liability portion and amortized over the period of the convertible bonds using the effective interest method.
Financial liabilities
Financial liabilities are classified as either financial liabilities ‘at FVTPL’ or ‘other financial liabilities’.
Financial liabilities at FVTPL
Financial liabilities are classified as at FVTPL when the financial liability is held for trading.
Financial liabilities at FVTPL are stated at fair value, with any gains or losses arising on remeasurement recognized in profit or loss. The net gain or loss recognized in profit or loss incorporates any interest paid on the financial liability and is included in the ‘other gains and losses’ line item. Fair value is determined in the manner described in Note 35.
NOTES TO THE CONSOLIDATED FINANCIAL STATEMENTS
3.Significant accounting policies (continued)
Financial liabilities and equity instruments (continued)
Financial liabilities (continued)
Other financial liabilities
Other financial liabilities (including borrowings, trade and other payables and promissory notes) are subsequently measured at amortized cost using the effective interest method.
The effective interest method is a method of calculating the amortized cost of a financial liability and of aIIocating interest expense over the relevant period. The effective interest rate is the rate that exactly discounts estimated future cash payments (including all fees and points paid or received that form an integral part of the effective interest rate, transaction costs and other premiums or discounts) through the expected life of the financial liability or (where appropriate) shorter period, to the net carrying amount on initial recognition.
Derecognition of financial liabilities
The Company derecognizes financial liabilities when, and only when, the Company’s obligations are discharged, cancelled or they expire. The difference between the carrying amount of the financial liability derecognized and the consideration paid and payable is recognized in profit or loss.
Derivative financial instruments
The Company enters into a variety of derivative financial instruments to manage its exposure to interest rate and foreign exchange rate risks, including foreign exchange forward contracts, interest rate swaps and cross currency swaps. Further details of derivative financial instruments are disclosed in Note 35.
Derivatives are initially recognized at fair value at the date the derivative contracts are entered into and are subsequently remeasured to their fair value at the end of each reporting period. The resulting gain or loss is recognized in profit or loss immediately unless the derivative is designated and effective as a hedging instrument, in which event the timing of the recognition in profit or loss depends on the nature of the hedge relationship.
NOTES TO THE CONSOLIDATED FINANCIAL STATEMENTS
4.Transition to IFRS
The Company is dual listed in New York Stock Exchange and Hong Kong Stock Exchange. In order to improve comparability with peers within semiconductor industry and reduce the cost of financial reporting under different accounting framework, the Company started to prepare financials statements in accordance with IFRS for the year ended December 31, 2012. As disclosed in Note 1, these consolidated financial statements represent the Company’s initial presentation of the financial results of operations and financial position under IFRS for the year ended December 31, 2012. As a result, these consolidated financial statements have been prepared in accordance with IFRS 1, “First-time Adoption of International Financial Reporting Standards”. Previously, the Company prepared its annual consolidated financial statements in accordance with US GAAP.
IFRS 1 requires the presentation of comparative information as at January 1, 2011 the transition date and subsequent comparative period as well as the consistent and retrospective application of IFRS accounting policies. To assist with the transition, the provisions of IFRS 1 allow for certain mandatory and optional exemptions for first-time adopters to alleviate the retrospective application of all IFRSs. The significant exemption applied under IFRS 1 in preparing these consolidated financial statements and the significant differences between the Company’s accounting policy under US GAAP and those applied by the Company under IFRS are discussed below.
IFRS 1 First-Time Adoption of International Financial Reporting Standards allows first-time adopters certain exemptions from the retrospective application of certain IFRS.
The Company has applied the following exemptions:
·IFRS 2 Share-based Payment has not been applied to equity instruments in share-based payment transactions that were granted on or before November 7, 2002, nor has it been applied to equity instruments granted after November 7, 2002 that vested before January 1, 2011.
·The Company has designated unquoted equity instruments held at January 1, 2011 as available- for-sale investments.
Estimates
The estimates at January 1, 2011 and at December 31, 2011 are consistent with those made for the same dates in accordance with U.S. GAAP .
The estimates used by the Company to present these amounts in accordance with IFRS reflect conditions at January 1, 2011, the date of transition to IFRS and as of December 31, 2011.
NOTES TO THE CONSOLIDATED FINANCIAL STATEMENTS
4.Transition to IFRS (continued)
Reconciliation of statement of financial position under IFRS from the amounts previously reported under U.S. GAAP as at January 1, 2011 (date of transition to IFRS)
|
|
|
|
|
| Effect of |
| IFRS as at |
|
|
|
|
|
|
| Transition to |
| January 1, |
|
|
| Notes |
| U.S. GAAP |
| IFRSs |
| 2011 |
|
|
|
|
| USD’000 |
| USD’000 |
| USD’000 |
|
Assets |
|
|
|
|
|
|
|
|
|
Non-current assets |
|
|
|
|
|
|
|
|
|
Property, plant and equipment |
|
|
| 2,351,863 |
| — |
| 2,351,863 |
|
Prepaid Land use right |
|
|
| 78,798 |
| — |
| 78,798 |
|
Intangible assets |
|
|
| 173,821 |
| — |
| 173,821 |
|
Investments in associates* |
|
|
| 7,665 |
| — |
| 7,665 |
|
Deferred tax assets |
| E |
| 112,688 |
| — |
| 112,688 |
|
Other assets* |
|
|
| 2,393 |
| — |
| 2,393 |
|
Total non-current assets |
|
|
| 2,727,228 |
| — |
| 2,727,228 |
|
Current assets |
|
|
|
|
|
|
|
|
|
Inventories |
|
|
| 213,404 |
| — |
| 213,404 |
|
Prepaid operating expenses* |
|
|
| 17,705 |
| — |
| 17,705 |
|
Trade and other receivables* |
|
|
| 264,048 |
| — |
| 264,048 |
|
Other financial assets* |
|
|
| 3,149 |
| — |
| 3,149 |
|
Restricted cash |
|
|
| 161,350 |
| — |
| 161,350 |
|
Cash and bank balances |
|
|
| 515,808 |
| — |
| 515,808 |
|
Total current assets |
|
|
| 1,175,464 |
| — |
| 1,175,464 |
|
Total assets |
|
|
| 3,902,692 |
| — |
| 3,902,692 |
|
*US GAAP figures have been reclassified to conform to IFRS presentation. Please refer to Note A below for details.
NOTES TO THE CONSOLIDATED FINANCIAL STATEMENTS
4.Transition to IFRS (continued)
Reconciliation of statement of financial position under IFRS from the amounts previously reported under U.S. GAAP as at January 1, 2011 (date of transition to IFRS)
|
| Notes |
| U.S. GAAP |
| Effect of |
| IFRS as at |
|
|
|
|
| USD’000 |
| USD’000 |
| USD’000 |
|
Equity and liabilities |
|
|
|
|
|
|
|
|
|
Capital and reserves |
|
|
|
|
|
|
|
|
|
Ordinary shares |
|
|
| 10,934 |
| — |
| 10,934 |
|
Share premium |
| B, D |
| 3,858,642 |
| (96,496 | ) | 3,762,146 |
|
Reserves |
| D |
| (1,092 | ) | 40,539 |
| 39,447 |
|
Accumulated deficit |
| B |
| (1,698,947 | ) | 55,957 |
| (1,642,990 | ) |
Equity attributable to owners of the Company |
|
|
| 2,169,537 |
| — |
| 2,169,537 |
|
Non-controlling interests |
| C |
| 39,004 |
| (37,759 | ) | 1,245 |
|
Total equity |
|
|
| 2,208,541 |
| (37,759 | ) | 2,170,782 |
|
Non-current liabilities |
|
|
|
|
|
|
|
|
|
Borrowings |
|
|
| 178,596 |
| — |
| 178,596 |
|
Deferred tax liabilities |
|
|
| 1,094 |
| — |
| 1,094 |
|
Deferred government grant |
|
|
| 49,143 |
| — |
| 49,143 |
|
Promissory notes |
|
|
| 56,327 |
| — |
| 56,327 |
|
Long-term financial liabilities |
| C |
| — |
| 37,759 |
| 37,759 |
|
Other liabilities |
|
|
| 9,646 |
| — |
| 9,646 |
|
Total non-current liabilities |
|
|
| 294,806 |
| 37,759 |
| 332,565 |
|
Current liabilities |
|
|
|
|
|
|
|
|
|
Trade and other payables* |
|
|
| 614,055 |
| — |
| 614,055 |
|
Borrowings* |
|
|
| 705,514 |
| — |
| 705,514 |
|
Accrued liabilities* |
|
|
| 45,357 |
| — |
| 45,357 |
|
Promissory notes |
|
|
| 29,374 |
| — |
| 29,374 |
|
Other financial liabilities* |
|
|
| 3,152 |
| — |
| 3,152 |
|
Current tax liabilities |
|
|
| 1,893 |
| — |
| 1,893 |
|
Total current liabilities |
|
|
| 1,399,345 |
| — |
| 1,399,345 |
|
Total liabilities |
|
|
| 1,694,151 |
| 37,759 |
| 1,731,910 |
|
Total equity and liabilities |
|
|
| 3,902,692 |
| — |
| 3,902,692 |
|
*US GAAP figures have been reclassified to conform to IFRS presentation. Please refer to Note A below for details.
NOTES TO THE CONSOLIDATED FINANCIAL STATEMENTS
4.Transition to IFRS (continued)
Reconciliation of statement of financial position under IFRS from the amounts previously reported under U.S. GAAP as at December 31, 2011
|
| Notes |
| U.S. GAAP |
| Effect of |
| IFRS as at |
|
|
|
|
| USD’000 |
| USD’000 |
| USD’000 |
|
Assets |
|
|
|
|
|
|
|
|
|
Non-current assets |
|
|
|
|
|
|
|
|
|
Property, plant and equipment |
|
|
| 2,516,578 |
| — |
| 2,516,578 |
|
Prepaid Land use right |
|
|
| 77,231 |
| — |
| 77,231 |
|
Intangible assets |
|
|
| 179,279 |
| — |
| 179,279 |
|
Investments in associates* |
|
|
| 15,856 |
| — |
| 15,856 |
|
Deferred tax assets |
| E |
| 31,787 |
| — |
| 31,787 |
|
Other assets* |
|
|
| 45,685 |
| — |
| 45,685 |
|
Total non-current assets |
|
|
| 2,866,416 |
| — |
| 2,866,416 |
|
Current assets |
|
|
|
|
|
|
|
|
|
Inventories |
|
|
| 207,308 |
| — |
| 207,308 |
|
Prepaid operating expenses* |
|
|
| 52,805 |
| — |
| 52,805 |
|
Trade and other receivables* |
|
|
| 200,905 |
| — |
| 200,905 |
|
Other financial assets* |
|
|
| 1,973 |
| — |
| 1,973 |
|
Restricted cash |
|
|
| 136,907 |
| — |
| 136,907 |
|
Cash and bank balances |
|
|
| 261,615 |
| — |
| 261,615 |
|
Total current assets |
|
|
| 861,513 |
| — |
| 861,513 |
|
Total assets |
|
|
| 3,727,929 |
| — |
| 3,727,929 |
|
*US GAAP figures have been reclassified to conform to IFRS presentation. Please refer to Note A below for details.
NOTES TO THE CONSOLIDATED FINANCIAL STATEMENTS
4.Transition to IFRS (continued)
Reconciliation of statement of financial position under IFRS from the amounts previously reported under U.S. GAAP as at December 31, 2011 (continued)
|
| Notes |
| U.S. GAAP |
| Effect of |
| IFRS as at |
|
|
|
|
| USD’000 |
| USD’000 |
| USD’000 |
|
Equity and liabilities |
|
|
|
|
|
|
|
|
|
Capital and reserves |
|
|
|
|
|
|
|
|
|
Ordinary shares |
|
|
| 10,995 |
| — |
| 10,995 |
|
Convertible Preferance shares |
|
|
| 178 |
| — |
| 178 |
|
Share premium |
| B, D |
| 4,240,530 |
| (158,395 | ) | 4,082,135 |
|
Reserves |
| D |
| 3,846 |
| 37,469 |
| 41,315 |
|
Accumulated deficit |
| B |
| (2,010,733 | ) | 120,926 |
| (1,889,807 | ) |
Equity attributable to owners of the Company |
|
|
| 2,244,816 |
| — |
| 2,244,816 |
|
Non-controlling interests |
| C |
| 4,200 |
| (3,018 | ) | 1,182 |
|
Total equity |
|
|
| 2,249,016 |
| (3,018 | ) | 2,245,998 |
|
Non-current liabilities |
|
|
|
|
|
|
|
|
|
Borrowings |
|
|
| 72,361 |
| — |
| 72,361 |
|
Deferred tax liabilities |
|
|
| 1,333 |
| — |
| 1,333 |
|
Deferred government grant |
|
|
| 125,335 |
| — |
| 125,335 |
|
Long-term financial liabilities |
| C |
| — |
| 3,018 |
| 3,018 |
|
Promissory notes |
|
|
| 28,560 |
| — |
| 28,560 |
|
Total non-current liabilities |
|
|
| 227,589 |
| 3,018 |
| 230,607 |
|
Current liabilities |
|
|
|
|
|
|
|
|
|
Trade and other payables* |
|
|
| 375,748 |
| — |
| 375,748 |
|
Borrowings* |
|
|
| 798,782 |
| — |
| 798,782 |
|
Accrued liabilities* |
|
|
| 45,674 |
| — |
| 45,674 |
|
Promissory notes |
|
|
| 29,374 |
| — |
| 29,374 |
|
Other financial liabilities* |
|
|
| 1,683 |
| — |
| 1,683 |
|
Current tax liabilities |
|
|
| 63 |
| — |
| 63 |
|
Total current liabilities |
|
|
| 1,251,324 |
| — |
| 1,251,324 |
|
Total liabilities |
|
|
| 1,478,913 |
| 3,018 |
| 1,481,931 |
|
Total equity and liabilities |
|
|
| 3,727,929 |
| — |
| 3,727,929 |
|
*US GAAP figures have been reclassified to conform to IFRS presentation. Please refer to Note A below for details.
NOTES TO THE CONSOLIDATED FINANCIAL STATEMENTS
4.Transition to IFRS (continued)
Reconciliation of total comprehensive income under IFRS from the amounts previously reported under U.S. GAAP for the year ended December 31, 2011
|
|
|
|
|
|
|
|
|
|
|
|
|
|
|
| Effect of |
| IFRS for the |
|
|
| Notes |
| U.S. GAAP |
| IFRSs |
| 2011 |
|
|
|
|
| USD’000 |
| USD’000 |
| USD’000 |
|
Continuing operations |
|
|
|
|
|
|
|
|
|
Revenue |
|
|
| 1,319,466 |
| — |
| 1,319,466 |
|
Cost of sales |
|
|
| (1,217,525 | ) | — |
| (1,217,525 | ) |
Gross profit |
|
|
| 101,941 |
| — |
| 101,941 |
|
Research and development |
|
|
| (191,473 | ) | — |
| (191,473 | ) |
Sales and Marketing expenses |
|
|
| (32,559 | ) | — |
| (32,559 | ) |
General and Administration expenses |
|
|
| (57,435 | ) | — |
| (57,435 | ) |
Impairment loss on property, plant and equipment |
|
|
| (17,691 | ) | — |
| (17,691 | ) |
Finance costs |
| C |
| (20,583 | ) | (1,320 | ) | (21,903 | ) |
Interest income |
|
|
| 4,724 |
| — |
| 4,724 |
|
Other income* |
|
|
| 13,718 |
| — |
| 13,718 |
|
Other gains or losses* |
|
|
| 17,081 |
| — |
| 17,081 |
|
Share of profits of associates |
|
|
| 4,479 |
| — |
| 4,479 |
|
Loss before tax |
|
|
| (177,798 | ) | (1,320 | ) | (179,118 | ) |
Income tax expense |
|
|
| (82,503 | ) | — |
| (82,503 | ) |
Loss for the year from continuing operations |
|
|
| (260,301 | ) | (1,320 | ) | (261,621 | ) |
Discontinued operations |
|
|
|
|
|
|
|
|
|
Profit for the year from discontinued operations |
|
|
| 14,741 |
| — |
| 14,741 |
|
Loss for the year |
|
|
| (245,560 | ) | (1,320 | ) | (246,880 | ) |
Other comprehensive income |
|
|
|
|
|
|
|
|
|
Item that may be reclassified subsequently to profit or loss |
|
|
|
|
|
|
|
|
|
Exchange differences on translating foreign operations |
|
|
| 4,938 |
| — |
| 4,938 |
|
Total comprehensive loss for the year |
|
|
| (240,622 | ) | — |
| (241,942 | ) |
*US GAAP figures have been reclassified to conform to IFRS presentation. Please refer to Note A below for details.
NOTES TO THE CONSOLIDATED FINANCIAL STATEMENTS
4.Transition to IFRS (continued)
Notes to the reconciliation of financial position as at January 1, 2011 and December 31, 2011 and total comprehensive income for the year ended December 31, 2011
AReclassification made to the statement of financial position and statement of comprehensive income
U.S. GAAP figures have been reclassified to conform to IFRS presentation. Reclassification mainly comprise of:
·Available-for-sale investment in unlisted shares is presented as separate line item in IFRS financial statements which was recorded in Equity investment in previous U.S. GAAP financial statements
·Other receivables, previously recorded in Prepaid expense and other current assets in previous U.S. GAAP financial statements, are reclassified to Trade and other receivables in IFRS financial statements
·Other financial assets is presented as separate line item in IFRS financial statements while is recorded in Prepaid expense and other current assets in previous U.S. GAAP financial statements
·Short-term borrowing and current portion of long-term debt presented separately in U.S. GAAP financial statements are aggregated and presented as Borrowings in IFRS financial statements
·Certain other current liability which was recorded in accrued expenses and other current liabilities in previous U.S. GAAP financial statements are reclassified to Trade and other payables in IFRS financial statements
·Current financial liabilities is presented as separate line item in IFRS financial statements which was recorded in Accrued expenses and other current liabilities in previous U.S. GAAP financial statements
·Other operating income and Others, net are aggregated and presented as Other income in IFRS financial statements
·Loss from sale of equipment and other fixed assets and Foreign currency exchange gain are aggregated and presented as Other gains or losses in IFRS financial statements
NOTES TO THE CONSOLIDATED FINANCIAL STATEMENTS
4.Transition to IFRS (continued)
Notes to the reconciliation of financial position as at January 1, 2011 and December 31, 2011 and total comprehensive income for the year ended December 31, 2011 (continued)
BConvertible preferred shares — beneficial conversion feature
Under US GAAP, a beneficial conversion feature refers to the preferential price of certain convertible equity instruments an investor receives when the effective conversion price of the equity instruments in lower than the fair market value of the common stock to which the convertible equity instrument is convertible into at the date of issuance. US GAAP requires the recognition of the difference between the effective conversion price of the convertible equity instrument and the fair market value of the common stock as a deemed dividend.
Under IFRS, the deemed dividend of US$56.0 million relates to year before 2011 and US$65.0 million in 2011 are not required to be recorded.
CPreferred shares
Under US GAAP, the Company presented the redeemable accumulated dividend preferred shares in Brite Semiconductor Corporation (“Brite”) and redeemable convertible preferred shares in Semiconductor Manufacturing International (AT) Corporation (“AT”) that were not owned by the Company as non-controlling interest. The accretion of interest on non-controlling interest (or “NCI”) was separately disclosed on the face of the statements of comprehensive income.
IFRS requires an entity that issues a financial instrument with characteristics of both liabilities and equity to separately classify the liability and equity components. The liability component is measured at fair value at inception, and any residual proceeds are allocated to the equity component. On initial recognition, the fair value of the liability component is determined using the prevailing market interest of similar non-convertible debt. The accretion of interest to record the redeemable convertible preferred shares at redemption value is recognized as interest expense. The value assigned to the conversion option of the redeemable convertible preferred shares is insignificant at initial recognition. As a result, the accretion of interest on NCI totaled at US$1.3 million was adjusted to finance cost for the year ended December 31, 2011 and non-controlling interest relates to Brite totaled at US$3.0 million was adjusted from NCI to long-term financial liability as of December 31, 2011.
NCI relates to Brite and AT totaled at US$37.8 million was adjusted from NCI to long-term financial liabilities as of January 1, 2011.
DEquity settled employee benefits
In order to conform to the current financial year’s presentation as a result of adoption IFRS, equity settled employee benefits reserve has been presented as a component of Reserve.
E.Deferred tax assets
Deferred tax assets have been reclassified as non-current assets under IFRS. Under US GAAP, deferred tax assets are classified as current or non-current based on the classification of the related asset for financial reporting.
NOTES TO THE CONSOLIDATED FINANCIAL STATEMENTS
5. Critical accounting judgments and key sources of estimation uncertainty
In the application of the Company’s accounting policies, which are described in Note 3, the Company is required to make judgments, estimates and assumptions about the carrying amounts of assets and liabilities that are not readily apparent from other sources. The estimates and associated assumptions are based on historical experience and other factors that are considered to be relevant. Actual results may differ from these estimates.
The estimates and underlying assumptions are reviewed on an ongoing basis. Revisions to accounting estimates are recognized in the period in which the estimate is revised if the revision affects only that period, or in the period of the revision and future periods if the revision affects both current and future periods.
Key sources of estimation uncertainty
The following are the key assumptions concerning the future, and other key sources of estimation uncertainty at the end of the reporting period, that have a significant risk of causing a material adjustment to the carrying amounts of assets and liabilities within the next financial year.
4.Critical accounting judgments and key sources of estimation uncertainty (continued)
Key sources of estimation uncertainty (continued)
Inventories
Inventories are stated at the lower of cost (weighted average) or net realizable value (NRV), with NRV being the “estimated selling price in the ordinary course of business less the estimated costs of completion and the estimated costs necessary to make the sale”. The Company estimates the recoverability for such finished goods and work-in-progress based primarily upon the latest invoice prices and current market conditions. If the NRV of a an inventory item is determined to be below its carrying value, the Company records a write-down to cost of sales for the difference between the carrying cost and NRV.
NOTES TO THE CONSOLIDATED FINANCIAL STATEMENTS
5.Critical accounting judgments and key sources of estimation uncertainty (continued)
Key sources of estimation uncertainty (continued)
Long-lived assets
The Company assesses the impairment of long-lived assets when events or changes in circumstances indicate that the carrying value of asset or cash-generating unit (“CGU”) may not be recoverable. Factors that the Company considers in deciding when to perform an impairment review include, but are not limited to significant under-performance of a business or product line in relation to expectations, significant negative industry or economic trends, and significant changes or planned changes in the use of the assets.
An impairment analysis is performed at the lowest level of identifiable independent cash flows for an asset or CGU. An impairment exists when the carrying value of an asset or cash-generating unit exceeds its recoverable amount, which is the higher of its fair value less costs to sell and its value in use. The fair value less costs to sell calculation is based on available data from binding sales transactions, conducted at arm’s length, for similar assets or observable market prices less incremental costs for disposing of the asset. The value in use calculation is based on a discounted cash flow model. Currently the Company is not able to estimate the amount of impairment loss or when the loss will occur for future years. Any potential changes of the business assumptions, such as forecasted sales, selling prices, utilizations, may have a material adverse effect on our net income.
The Company makes subjective judgments in determining the independent cash flows that can be related to a specific CGU based on its asset usage model and manufacturing capabilities. The Company measures the recoverability of assets that will continue to be used in the Company’s operations by comparing the carrying value of CGU to the Company’s estimate of the related total future discounted cash flows. If a CGU’s carrying value is not recoverable through the related discounted cash flows, the impairment loss is measured by comparing the difference between the CGU’s carrying value and its recoverable amount, based on the best information available, including market prices or discounted cash flow analysis. The recoverable amount is most sensitive to the discount rate used for the discounted cash flow model as well as the expected future cash-inflows and the growth rate used for extrapolation purposes.
NOTES TO THE CONSOLIDATED FINANCIAL STATEMENTS
5.4. Critical accounting judgments and key sources of estimation uncertainty (continued)
Key sources of estimation uncertainty (continued)
Long-lived assets (continued)
In order to remain technologically competitive in the semiconductor industry, the Company has entered into technology transfer and technology license arrangements with third parties in an attempt to advance the Company’s process technologies. The payments made for such technology licenses are recorded as an intangible asset or as a deferred cost and amortized on a straight-line basis over the estimated useful life of the asset. The Company routinely reviews the remaining estimated useful lives of these intangible assets and deferred costs. The Company also evaluates these intangible assets and deferred costs for impairment whenever events or changes in circumstances indicate that their carrying amounts may not be recoverable. When the carrying amounts of such assets are determined to exceed their recoverable amounts, the Company will impair such assets and write down their carrying amounts to recoverable amount in the year when such determination was made.
Share-based Compensation Expense
The fair value of options and shares issued pursuant to the Company’s option plans at the grant date was estimated using the Black-Scholes option pricing model. This model was developed for use in estimating the fair value of traded options that have no vesting restrictions and are fully transferable. In addition, option-pricing models require the input of highly subjective assumptions, including the expected term of the options, the estimated forfeiture rates and the expected stock price volatility. The expected term of options granted represents the period of time that options granted are expected to be outstanding. The Company estimated forfeiture rates using historical data to estimate option exercise and employee termination within the pricing formula. The Company uses projected volatility rates based upon the Company’s historical volatility rates. These assumptions are inherently uncertain. Different assumptions and judgments would affect the Company’s calculation of the fair value of the underlying ordinary shares for the options granted, and the valuation results and the amount of share-based compensation would also vary accordingly.
Taxes
Uncertainties exist with respect to the interpretation of complex tax regulations, changes in tax laws, and the amount and timing of future taxable income. Given the wide range of international business relationships and the long-term nature and complexity of existing contractual agreements, differences arising between the actual results and the assumptions made, or future changes to such assumptions, could necessitate future adjustments to tax income and expense already recorded. The Company establishes provisions, based on reasonable estimates, for possible consequences of audits by the tax authorities of the respective counties in which it operates. The amount of such provisions is based on various factors, such as experience of previous tax audits and differing interpretations of tax regulations by the taxable entity and the responsible tax authority. Such differences of interpretation may arise on a wide variety of issues depending on the conditions prevailing in the respective domicile of the Company companies.
NOTES TO THE CONSOLIDATED FINANCIAL STATEMENTS
5.Critical accounting judgements and key sources of estimation uncertainty (continued)
Key sources of estimation uncertainty (continued)
Taxes (continued)
Deferred tax assets are recognized for unused tax losses to the extent that it is probable that taxable profit will be available against which the losses can be utilized. Significant management judgment is required to determine the amount of deferred tax assets that can be recognized, based upon the likely timing and the level of future taxable profits together with tax planning strategies.
4.Critical accounting judgments and key sources of estimation uncertainty (continued)
Key sources of estimation uncertainty (continued)
Taxes (continued)
As at December 31, 2012, a2013, there is no deferred tax asset of US$0.4 million (December 31, 2011: USD1.82012: USD$0.4 million) in relation to unused tax losses has been recognized in the Company’s consolidated statement of financial position. The realizability of the deferred tax asset mainly depends on whether sufficient profits or taxable temporary differences will be available in the future. In cases where the actual future profits generated are less than expected, a material reversal of deferred tax assets may arise, which would be recognized in profit or loss for the period in which such a reversal takes place. Further details on taxes are disclosed in Note 10.9.
Fair value of financial instrumentsmeasurements and valuation processes
WhenSome of the Company’s assets and liabilities are measured at fair value for financial reporting purposes.
In estimating the fair value of financial assets and financial liabilities recorded inan asset or a liability, the statement of financial position cannot be derived from active markets, their fair valueCompany uses market-observable data to the extent it is determined usingavailable. Where Level 1 inputs are not available, the Company engages third party qualified valuers to perform the valuation.
The Company uses valuation techniques includingthat include inputs that are not based on observable market data to estimate the discounted cash flow model. The inputs to these models are taken from observable markets where possible, but where this is not feasible, a degree of judgment is required in establishing fair values. The judgments include considerations of inputs such as liquidity risk, credit risk and volatility. Changes in assumptions about these factors could affect the reported fair value of certain types of financial instruments. See NoteNotes 35 for further discussion.provide detailed information about the valuation techniques, inputs and key assumptions used in the determination of the fair value of various assets and liabilities.
Impairment of trade and other receivable
The Company assesses at the end of each reporting period whether there is any objective evidence that trade and other receivable is impaired. To determine whether there is objective evidence of impairment, the Company considers factors such as the probability of insolvency or significant financial difficulties of the debtor and default or significant delay in payments.
When there is objective evidence of impairment loss, the Company takes into consideration the estimation of future cash flows. The amount of the impairment loss is measured as the difference between the asset’s carrying amount and the present value of estimated future cash flows (excluding future credit losses that have not been incurred) discounted at the financial asset’s original effective interest rate (that is, the effective interest rate computed at initial recognition). Where the actual future cash flows are less than expected, a material impairment loss may arise. The carrying amount of the Company’s trade and other receivable at the end of the reporting period is disclosed in Note 24.23.
NOTES TO THE CONSOLIDATED FINANCIAL STATEMENTS
6.5. Segment information
The Company operates in three principal geographical areas — Unitedareas-United States, Europe, and Asia Pacific.
The Company is engaged principally in the computer-aided design, manufacturing and trading of integrated circuits. The Company’s chief operating decision maker has been identified as the Chief Executive Officer, who reviews consolidated results from operations when making decisions about allocating resources and assessing performance of the Company. The Company operates in one segment. The Company’s revenue from continuing operations from external customers by location is detailed below.
|
| Revenue from external |
| ||
|
| Year ended |
| Year ended |
|
|
| USD’000 |
| USD’000 |
|
United States |
| 940,369 |
| 726,011 |
|
Europe |
| 38,811 |
| 35,256 |
|
Asia Pacific* |
| 28,177 |
| 21,244 |
|
Taiwan |
| 113,227 |
| 105,788 |
|
Japan |
| 3,423 |
| 356 |
|
Mainland China and Hong Kong |
| 577,591 |
| 430,811 |
|
|
| 1,701,598 |
| 1,319,466 |
|
|
| Revenue from |
| ||||
|
| year ended |
| year ended |
| year ended |
|
|
| USD’000 |
| USD’000 |
| USD’000 |
|
United States |
| 1,002,699 |
| 940,369 |
| 726,011 |
|
Mainland China and Hong Kong |
| 836,771 |
| 577,591 |
| 430,811 |
|
Eurasia* |
| 229,494 |
| 183,638 |
| 162,644 |
|
|
| 2,068,964 |
| 1,701,598 |
| 1,319,466 |
|
* Not including Taiwan, Japan, Mainland China and Hong Kong
The following table summarizes property, plant and equipment of the Company by location.
|
| Property, plant and equipment |
|
| Property, plant and equipment |
| ||||||
|
| 12/31/12 |
| 12/31/11 |
|
| 12/31/13 |
| 12/31/12 |
| 12/31/11 |
|
|
| USD’000 |
| USD’000 |
|
| USD’000 |
| USD’000 |
| USD’000 |
|
United States |
| 55 |
| 75 |
|
| 33 |
| 55 |
| 75 |
|
Europe |
| — |
| 5 |
|
| 4 |
| — |
| 5 |
|
Taiwan |
| 19 |
| 23 |
|
| 14 |
| 19 |
| 23 |
|
Hong Kong |
| 3,640 |
| 3,832 |
|
| 3,440 |
| 3,640 |
| 3,832 |
|
Mainland China |
| 2,381,721 |
| 2,512,643 |
|
| 2,525,343 |
| 2,381,721 |
| 2,512,643 |
|
|
| 2,385,435 |
| 2,516,578 |
|
| 2,528,834 |
| 2,385,435 |
| 2,516,578 |
|
Substantially all other non-current assets excluding deferred tax and financial instruments of the Company are located in Mainland China.
NOTES TO THE CONSOLIDATED FINANCIAL STATEMENTS
7.6. Significant Customerscustomers
The following table summarizes net revenue andor accounts receivable for customers which accounted for 10% or more of gross accounts receivable and net sales:
|
| Net Revenue |
| Accounts receivable |
|
| Net revenue |
| Accounts receivable |
| ||||||||||||
|
| Year ended December 31, |
| December 31, |
|
| Year ended December 31, |
| December 31, |
| ||||||||||||
|
| 2012 |
| 2011 |
| 2012 |
| 2011 |
|
| 2013 |
| 2012 |
| 2011 |
| 2013 |
| 2012 |
| 2011 |
|
A |
| 383,626 |
| 275,502 |
| 43,246 |
| 43,468 |
|
| 473,699 |
| 282,946 |
| 165,180 |
| 109,778 |
| 57,865 |
| 27,921 |
|
B |
| 282,946 |
| 165,180 |
| 57,865 |
| 27,921 |
|
| 270,230 |
| 383,626 |
| 275,502 |
| 19,619 |
| 43,246 |
| 43,468 |
|
|
|
|
|
|
|
|
|
|
| |||||||||||||
A |
| 23 | % | 21 | % | 13 | % | 21 | % |
| 23 | % | 17 | % | 13 | % | 31 | % | 18 | % | 13 | % |
B |
| 17 | % | 13 | % | 18 | % | 13 | % |
| 13 | % | 23 | % | 21 | % | 6 | % | 13 | % | 21 | % |
8.7. Other gains or lossesoperating income (expense)
|
| Year ended |
| Year ended |
|
|
| 12/31/12 |
| 12/31/11 |
|
|
| USD’000 |
| USD’000 |
|
Gain (loss) on disposal of property, plant and equipment |
| 19,325 |
| (508 | ) |
Foreign exchange gain |
| 3,895 |
| 17,589 |
|
|
| 23,220 |
| 17,081 |
|
|
| year ended |
| year ended |
| year ended |
|
|
| 12/31/13 |
| 12/31/12 |
| 12/31/11 |
|
|
| USD’000 |
| USD’000 |
| USD’000 |
|
Gain (loss) on disposal of property, plant and equipment and assets classified as held-for-sale |
| 33,996 |
| 19,325 |
| (508 | ) |
Gain on disposal of subsidiaries |
| 28,304 |
| — |
| — |
|
Gain on deconsolidation of subsidiaries |
| 5,419 |
| — |
| — |
|
Impairment loss of property, plant and equipment |
| — |
| — |
| (17,691 | ) |
Others |
| 151 |
| (208 | ) | 7,009 |
|
|
| 67,870 |
| 19,117 |
| (11,190 | ) |
The gain on disposal of property, plant and equipment inand assets classified as held-for-sale for the year ended December 31, 2013 and 2012 arose primarily from the sales of the staff living quarters in Shanghai to employees.
7.1Disposal of subsidiaries
The gain on disposal of subsidiaries for the year ended December 31, 2013 arose from disposal of the Company’s total ownership interest in SMIC (Wuhan) Development Corporation (“WHDM”). During the year, the Company entered into a sale agreement to dispose of its 100% equity interest in WHDM. The disposal was completed on May 23, 2013, on that date the Company lost control of WHDM. The amount of the consideration was US$60.4 million and the Company recorded a gain of US$28.3 million. The consideration was fully settled by the buyer on July 26, 2013. WHDM was mainly engaged in the construction, operation and management of the Company’s living quarters and schools in Shanghai.Wuhan, which was not the major line of business of the Company and therefore, the disposal of WHDM was not classified as a discontinued operation.
NOTES TO THE CONSOLIDATED FINANCIAL STATEMENTS
7.Other operating income (expense) (continued)
7.1Disposal of subsidiaries (continued)
Year ended | |||
12/31/13 | |||
USD’000 | |||
Analysis of asset and liabilities over which control was lost | |||
Total assets | 39,039 | ||
Total liabilities | (38,853 | ) | |
Net assets disposed of | 186 | ||
Gain on disposal of subsidiaries | |||
Amount of the total consideration | 60,408 | ||
Due from WHDM | (31,196 | ) | |
Business tax incurred in relation to the disposal | (722 | ) | |
Net assets disposed of | (186 | ) | |
Gain on disposal | 28,304 | ||
Proceeds from disposal of subsidiaries | |||
Amount of the total consideration | 60,408 | ||
Bank balances and cash disposal of | (1,565 | ) | |
Payment of business tax in relation to the disposal | (722 | ) | |
Effect of the exchange rate changes on the consideration | (378 | ) | |
Net cash flow arising on disposal | 57,743 | ||
Cash flows from WHDM | |||
Net cash outflows from operating activities | (268 | ) | |
Net cash flows from investing activities | 25,580 | ||
Net cash outflows from financing activities | (26,162 | ) | |
Net cash outflows | (850 | ) |
7.2Deconsolidation of subsidiaries due to loss of control
On December 30, 2013, the Company lost control of Brite Semiconductor Corporation and its subsidiaries (“Brite”). The gain at the date of deconsolidation of Brite was US$5.4 million. The deconsolidation has no material impact on the consolidated financial statements.
8. Finance costs
|
| Year ended |
| Year ended |
|
| Year ended |
| Year ended |
| Year ended |
|
|
| 12/31/12 |
| 12/31/11 |
|
| 12/31/13 |
| 12/31/12 |
| 12/31/11 |
|
|
| USD’000 |
| USD’000 |
|
| USD’000 |
| USD’000 |
| USD’000 |
|
Interest expense |
| 54,712 |
| 39,567 |
| |||||||
Interest on: |
|
|
|
|
|
|
| |||||
Bank and other borrowings |
|
|
|
|
|
|
| |||||
— wholly repayable within five years |
| 45,924 |
| 54,712 |
| 39,567 |
| |||||
— not wholly repayable within five years |
| 1,440 |
| — |
| — |
| |||||
Interest on convertible bonds |
| 1,173 |
| — |
| — |
| |||||
Accretion of interest to preferred shareholders of a subsidiary |
| 1,206 |
| 1,320 |
|
| 1,683 |
| 1,206 |
| 1,320 |
|
Total interest expense for financial liabilities not classified as at FVTPL |
| 55,918 |
| 40,887 |
|
| 50,220 |
| 55,918 |
| 40,887 |
|
Less: amounts capitalized |
| 16,458 |
| 18,984 |
|
| 15,828 |
| 16,458 |
| 18,984 |
|
|
| 39,460 |
| 21,903 |
|
| 34,392 |
| 39,460 |
| 21,903 |
|
The weighted average interest rate on funds borrowed generally is 4.42% per annum (2012: 4.97% per annum (2011:and 2011: 3.62% per annum).
NOTES TO THE CONSOLIDATED FINANCIAL STATEMENTS
10.9. Income taxes relating to continuing operations
Income tax recognized in profit or loss
|
| Year ended |
| Year ended |
| |||||||
|
| 12/31/12 |
| 12/31/11 |
|
| Year ended |
| Year ended |
| Year ended |
|
|
| USD’000 |
| USD’000 |
|
| USD’000 |
| USD’000 |
| USD’000 |
|
Current tax — Enterprise Income Tax |
| 1,071 |
| 1,363 |
|
| 957 |
| 1,071 |
| 1,363 |
|
Deferred tax |
| (12,486 | ) | 81,140 |
|
| (783 | ) | (12,486 | ) | 81,140 |
|
Current tax — Land Appreciation Tax |
| 2,313 |
| — |
|
| 3,956 |
| 2,313 |
| — |
|
Total income tax (benefit) expense raised in the current year relating to continuing operations |
| (9,102 | ) | 82,503 |
| |||||||
Total income tax expense (benefit) raised in the current year |
| 4,130 |
| (9,102 | ) | 82,503 |
| |||||
The income tax expense for the year can be reconciled to the accounting profit as follows:
|
| Year ended |
| Year ended |
|
|
| 12/31/12 |
| 12/31/11 |
|
|
| USD’000 |
| USD’000 |
|
Profit (loss) before tax from continuing operations |
| 13,439 |
| (179,118 | ) |
Income tax expense (benefit) calculated at 15% (2011: 15%) |
| 2,016 |
| (26,868 | ) |
Effect of tax holiday and tax concession |
| (3,045 | ) | (2,329 | ) |
Expenses to be recognized in future periods |
| (3,742 | ) | (20,420 | ) |
Effect of unused tax losses not recognized as deferred tax assets |
| (6,574 | ) | 130,040 |
|
Effect of different tax rates of subsidiaries operating in other jurisdictions |
| (1,087 | ) | 2,508 |
|
Others |
| 1,364 |
| (428 | ) |
Land Appreciation Tax (after tax) — gain on sale of living quarters |
| 1,966 |
| — |
|
Income tax (benefit) expense (relating to continuing operations) |
| (9,102 | ) | 82,503 |
|
|
| Year ended |
| Year ended |
| Year ended |
|
|
| USD’000 |
| USD’000 |
| USD’000 |
|
Profit (loss) before tax |
| 178,597 |
| 13,439 |
| (179,118 | ) |
Income tax expense (benefit) calculated at 15% (2012: 15% and 2011:15%) |
| 26,790 |
| 2,016 |
| (26,868 | ) |
Effect of expenses not deductible for tax purpose |
| 1,247 |
| — |
| — |
|
Effect of tax holiday and tax concession |
| (3,045 | ) | (3,045 | ) | (2,329 | ) |
Expense (benefit) to be recognized in future periods |
| 13,303 |
| (3,742 | ) | (20,420 | ) |
Effect of tax losses not recognized as deferred tax assets |
| (36,345 | ) | (6,574 | ) | 130,040 |
|
Effect of different tax rates of subsidiaries operating in other jurisdictions |
| (641 | ) | (1,087 | ) | 2,508 |
|
Others |
| (578 | ) | 1,364 |
| (428 | ) |
Land Appreciation Tax (after tax)-gain on sale of living quarters |
| 3,399 |
| 1,966 |
| — |
|
Income tax expense (benefit) |
| 4,130 |
| (9,102 | ) | 82,503 |
|
NOTES TO THE CONSOLIDATED FINANCIAL STATEMENTS
9.Income taxes (continued)
Income tax recognized in profit or loss (continued)
The tax rate used for the 2013, 2012 and 2011 reconciliation above is the corporate tax rate of 15% payable by most of the Company’s entities in Mainland China under tax law in that jurisdiction.
NOTES TO THE CONSOLIDATED FINANCIAL STATEMENTS
10.Income taxes relating to continuing operations (continued)
Current tax liabilities
|
| 12/31/12 |
| 12/31/11 |
| 01/01/11 |
|
| 12/31/13 |
| 12/31/12 |
| 12/31/11 |
|
|
| USD’000 |
| USD’000 |
| USD’000 |
|
| USD’000 |
| USD’000 |
| USD’000 |
|
Current tax liabilities |
|
|
|
|
|
|
|
|
|
|
|
|
|
|
Income tax payable — Land Appreciation Tax |
| 2,313 |
| — |
| — |
|
| 73 |
| 2,313 |
| — |
|
Income tax payable — Others |
| 8 |
| 63 |
| 1,893 |
|
| 85 |
| 8 |
| 63 |
|
|
| 2,321 |
| 63 |
| 1,893 |
|
| 158 |
| 2,321 |
| 63 |
|
Deferred tax balances
The following is the analysis of deferred tax assets (liabilities) presented in the consolidated statement of financial position:
|
| 12/31/12 |
| 12/31/11 |
| 01/01/11 |
|
| 12/31/13 |
| 12/31/12 |
| 12/31/11 |
|
|
| USD’000 |
| USD’000 |
| USD’000 |
|
| USD’000 |
| USD’000 |
| USD’000 |
|
Deferred tax assets |
| 43,380 |
| 31,787 |
| 112,688 |
|
| 43,890 |
| 43,380 |
| 31,787 |
|
Deferred tax liabilities |
| (440 | ) | (1,333 | ) | (1,094 | ) |
| (167 | ) | (440 | ) | (1,333 | ) |
|
| 42,940 |
| 30,454 |
| 111,594 |
|
| 43,723 |
| 42,940 |
| 30,454 |
|
|
| 12/31/12 |
| 12/31/11 |
| 01/01/11 |
|
| 12/31/13 |
| 12/31/12 |
| 12/31/11 |
|
|
| USD’000 |
| USD’000 |
| USD’000 |
|
| USD’000 |
| USD’000 |
| USD’000 |
|
Deferred tax assets |
|
|
|
|
|
|
|
|
|
|
|
|
|
|
Allowances and reserves |
| 3,829 |
| 1,664 |
| 1,321 |
|
| — |
| 3,829 |
| 1,664 |
|
Net operating loss carry forwards |
| 372 |
| 1,767 |
| 6,020 |
|
| — |
| 372 |
| 1,767 |
|
Property plant and equipment |
| 38,955 |
| 25,966 |
| 103,030 |
|
| 43,890 |
| 38,955 |
| 25,966 |
|
Accrued expenses |
| 224 |
| 2,390 |
| 2,317 |
|
| — |
| 224 |
| 2,390 |
|
Net deferred tax assets |
| 43,380 |
| 31,787 |
| 112,688 |
| |||||||
Deferred tax assets |
| 43,890 |
| 43,380 |
| 31,787 |
| |||||||
Deferred tax liabilities |
|
|
|
|
|
|
|
|
|
|
|
|
|
|
Capitalized interest |
| (373 | ) | (1,266 | ) | (1,049 | ) |
| (167 | ) | (373 | ) | (1,266 | ) |
Unrealized exchange gain |
| (64 | ) | (67 | ) | (45 | ) |
| — |
| (64 | ) | (67 | ) |
Depreciation for asset held for sale |
| (3 | ) | — |
| — |
|
| — |
| (3 | ) | — |
|
|
| (440 | ) | (1,333 | ) | (1,094 | ) | |||||||
Deferred tax liabilities |
| (167 | ) | (440 | ) | (1,333 | ) | |||||||
NOTES TO THE CONSOLIDATED FINANCIAL STATEMENTS
10.9. Income taxes relating to continuing operations (continued)
Deferred tax balances (continued)
2013.12.31
|
|
|
| Recognized |
|
|
|
|
| Opening |
| in profit |
| Closing |
|
|
| balance |
| or loss |
| balance |
|
|
| USD’000 |
| USD’000 |
| USD’000 |
|
Deferred tax (liabilities)/assets in relation to: |
|
|
|
|
|
|
|
Property plant and equipment |
| 38,955 |
| 4,935 |
| 43,890 |
|
Allowances and reserves |
| 3,829 |
| (3,829 | ) | — |
|
Accrued expenses |
| 224 |
| (224 | ) | — |
|
Capitalized interest |
| (373 | ) | 206 |
| (167 | ) |
Unrealized exchange gain |
| (64 | ) | 64 |
| — |
|
Depreciation for asset held for sale |
| (3 | ) | 3 |
| — |
|
Others |
| 372 |
| (372 | ) | — |
|
|
| 42,940 |
| 783 |
| 43,723 |
|
2012.12.31
|
|
|
| Recognized |
|
|
| |||||||
|
| Opening |
| Recognized in |
| Closing |
|
| Opening |
| in profit |
| Closing |
|
|
| Balance |
| profit or loss |
| balance |
|
| balance |
| or loss |
| balance |
|
|
| USD’000 |
| USD’000 |
| USD’000 |
|
| USD’000 |
| USD’000 |
| USD’000 |
|
Deferred tax (liabilities) assets in relation to: |
|
|
|
|
|
|
|
|
|
|
|
|
|
|
Property plant and equipment |
| 25,966 |
| 12,989 |
| 38,955 |
|
| 25,966 |
| 12,989 |
| 38,955 |
|
Allowances and reserves |
| 1,664 |
| 2,165 |
| 3,829 |
|
| 1,664 |
| 2,165 |
| 3,829 |
|
Accrued expenses |
| 2,390 |
| (2,166 | ) | 224 |
|
| 2,390 |
| (2,166 | ) | 224 |
|
Capitalized interest |
| (1,266 | ) | 893 |
| (373 | ) |
| (1,266 | ) | 893 |
| (373 | ) |
Unrealized exchange gain |
| (67 | ) | 3 |
| (64 | ) |
| (67 | ) | 3 |
| (64 | ) |
Depreciation for asset held for sale |
| — |
| (3 | ) | (3 | ) |
| — |
| (3 | ) | (3 | ) |
Others |
| 1,767 |
| (1,395 | ) | 372 |
|
| 1,767 |
| (1,395 | ) | 372 |
|
|
| 30,454 |
| 12,486 |
| 42,940 |
|
| 30,454 |
| 12,486 |
| 42,940 |
|
2011.12.31
|
|
|
| Recognized |
|
|
| |||||||
|
| Opening |
| Recognized in |
| Closing |
|
| Opening |
| in profit |
| Closing |
|
|
| balance |
| profit or loss |
| balance |
|
| balance |
| or loss |
| balance |
|
|
| USD’000 |
| USD’000 |
| USD’000 |
|
| USD’000 |
| USD’000 |
| USD’000 |
|
Deferred tax (liabilities) assets in relation to: |
|
|
|
|
|
|
|
|
|
|
|
|
|
|
Property plant and equipment |
| 103,030 |
| (77,064 | ) | 25,966 |
|
| 103,030 |
| (77,064 | ) | 25,966 |
|
Allowances and reserves |
| 1,321 |
| 343 |
| 1,664 |
|
| 1,321 |
| 343 |
| 1,664 |
|
Accrued expenses |
| 2,317 |
| 73 |
| 2,390 |
|
| 2,317 |
| 73 |
| 2,390 |
|
Capitalized interest |
| (1,049 | ) | (217 | ) | (1,266 | ) |
| (1,049 | ) | (217 | ) | (1,266 | ) |
Unrealized exchange gain |
| (45 | ) | (22 | ) | (67 | ) |
| (45 | ) | (22 | ) | (67 | ) |
Others |
| 6,020 |
| (4,253 | ) | 1,767 |
|
| 6,020 |
| (4,253 | ) | 1,767 |
|
|
| 111,594 |
| (81,140 | ) | 30,454 |
|
| 111,594 |
| (81,140 | ) | 30,454 |
|
NOTES TO THE CONSOLIDATED FINANCIAL STATEMENTS
9.Income taxes (continued)
Under the NewLaw of the People’s Republic of China on Enterprise Income Tax, or the EIT Law, the profits of a foreign invested enterprise arising in 2008 and beyond that will be distributed to its immediate holding company outside mainland Chinawho is a non-PRC tax resident will be subject to a withholding tax rate of 10%. A lower withholding tax rate may be applied if there is a favorable tax treaty between mainland China and the jurisdiction of the foreign holding company. For example, holding companies in Hong Kong that are also tax residents in Hong Kong are eligible for a 5% withholding tax on dividends under the Tax Memorandum between China and the Hong Kong Special Administrative Region. Since the Company intends to reinvest its earnings to expand its businesses in mainland China, its mainland China subsidiaries do not intend to distribute profits to their immediate foreign holding companies for the foreseeable future.
NOTES TO THE CONSOLIDATED FINANCIAL STATEMENTS
10.Income taxes relating to continuing operations (continued)
Deferred tax balances (continued)
Semiconductor Manufacturing International Corporation is incorporated in the Cayman Islands, whichwhere it is tax exempted.not currently subject to taxation.
Prior to January 1, 2008, the subsidiaries incorporated in the PRC were governed by the Income Tax Law of the PRC Concerning Foreign Investment and Foreign Enterprises and various local income tax laws (the “FEIT Laws”).
The Law of the People’s Republic of China on Income Tax (“New EIT Law”)Law was promulgated on March 16, 2007, which became effective on January 1, 2008. Under the New EIT Law, domestically-owned enterprises and foreign invested enterprises (“FIEs”) are subject to a uniform tax rate of 25%. Enterprises which were entitled to a preferential tax rate of 25%15% prior to January 1, 2008 could gradually transit to 25% throughout a five-year period. Pursuant to Guofa [2007] No. 39 (“Circular No. 39”), the application tax rates during the five-year transitional period are as follows: 18% in 2008, 20% in 2009, 22% in 2010, 24% in 2011 and 25% in 2012 and thereafter. The tax holiday, which has already kicked off before the effective date of the EIT law, may continue to be enjoyed till the end of the holiday.
Pursuant to Caishui Circular [2008] No. 1 (“Circular No. 1”) promulgated on February 22, 2008, integrated circuit production enterprises whose total investment exceeds RMB8,000 million (approximately US$1,095 million) or whose integrated circuits have a line width of less than 0.25 micron are entitled to a preferential tax rate of 15%. Enterprises with an operation period of more than 15 years are entitled to a full exemption from income tax for five years starting from the first profitable year after utilizing all prior years’ tax losses and 50% reduction of the tax for the following five years. Pursuant to Caishui Circular [2009] No. 69 (“Circular No. 69”), the 50% reduction should be based on the statutory tax rate of 25% unless the income tax rate is reduced by the tax incentives granted by Circular No. 39.
On February 9,January 28, 2011, the State Council of China issued Guofa [2011] No. 4 (“Circular No. 4”), the Notice on Certain Policies to Further Encourage the Development of the Software and Integrated Circuit Industries which reinstates the EIT incentives stipulated by Circular No. 1 for the software and integrated circular enterprises.
On April 20, 2012, State Tax Bureau issued Cai Shui [2012] No. 27 (“Circular No. 27”), stipulating the income tax policies for encouraging the development of integrated circuit industry is the implementation rule of Circular No. 4.industry.
NOTES TO THE CONSOLIDATED FINANCIAL STATEMENTS
10.9. Income taxes relating to continuing operations (continued)
DeferredOn July 25, 2013, State Tax Bureau issued [2013] No. 43 (“Circular No.43”), clarifying that the assertion and preferential tax balances (continued)policy of integrated circuit enterprise established before December 31, 2010, is pursuant to Circular No.1.
The detailed tax status of SMIC’s principal PRC entities with tax holidays is elaborated as follows:
1) Semiconductor Manufacturing International (Shanghai) Corporation (SMIS) and Semiconductor Manufacturing International (Tianjin) Corporation (SMIT)
Pursuant to relevant tax regulation, SMIS began a 10-year tax holiday (five year full exemption followed by five year half reduction) from 2004 after utilizing all prior years’ tax losses. As SMIS is a manufacturing company located in Shanghai’s Pudong New Area, it can continue its tax holiday based on the transitional income tax rate granted by Circular No. 39No.39 instead of the statutory income tax rate. The income tax rate for SMIS was 12% in 2011, 12.5% in 2012 and will be 12.5% in 2013. After that, the income tax rate will be 15%.
Pursuant to relevant tax regulation, SMIT began a 10-year tax holiday (five year full exemption followed by five year half reduction) from 2013 after utilizing all prior years’ tax losses. The income tax rate for SMIT was 0% from 2013 to 2017 and 12.5% from 2018 to 2022. After that, the income tax rate will be 15%.
2) Semiconductor Manufacturing International (Beijing) Corporation (SMIB) and Semiconductor Manufacturing International (Tianjin) Corporation (SMIT)
In accordance with Circular No. 4 and Circular No. 27,43, SMIB and SMIT areis entitled to the preferential tax rate of 15% and 10-year10- year tax holiday (five year full exemption followed by five year half reduction) subsequent to theirits first profit-making yearsyear after utilizing all prior tax losses but no later than December 31, 2017. Both entities werelosses. SMIB was in accumulative loss positions as of December 31, 20122013 and the tax holiday has not begun to take effect.
All the other PRC entities of SMIC were subject to income tax rate of 25%.
Unrecognized deductible temporary differences, unused tax losses
At the end of the reporting period, no deferred tax asset was recognized in respect of tax losses of US$851.7 million (December 31, 2012: US$1,199.2 million (Decemberand December 31, 2011: US$951.9 million) due to the unpredictability of future profit streams, of which $305.1US$410.9 million, $448.5US$85.9 million, $83.4US$193.5 million, $193.5US$153.9 million and $168.7US$7.5 million will expire in 2013, 2014, 2015, 2016, 2017 and 2017,2018, respectively. At the end of the reporting period, the Company had deductible temporary differences of US$618.4 million (December 31, 2012: US$580.4 million (Decemberand December 31, 2011: US$634.9 million) in relation to which no deferred tax asset was recognized as it is not probable that taxable profit will be available against which the deductible temporary differences can be utilized.
NOTES TO THE CONSOLIDATED FINANCIAL STATEMENTS
11.10. Profit (loss) for the year
Profit (loss) for the year from continuing operations has been arrived at after charging (crediting)
11.110.1 Impairment losses (reversal of impairment losses) on financial assets
|
| Year ended |
| Year ended |
|
| Year ended |
| Year ended |
| Year ended |
|
|
| USD’000 |
| USD’000 |
|
| USD’000 |
| USD’000 |
| USD’000 |
|
Allowance on trade receivables (see Note 24) |
| 4,615 |
| 551 |
| |||||||
Allowance on trade receivables (see Note 23) |
| 617 |
| 4,615 |
| 551 |
| |||||
Reversal of allowance on doubtful trade receivables |
| (2,095 | ) | (6,400 | ) |
| (1,213 | ) | (2,095 | ) | (6,400 | ) |
|
| 2,520 |
| (5,849 | ) |
| (596 | ) | 2,520 |
| (5,849 | ) |
In 2011, the Company settled certain disputes with respective third party debtors by entering into contractually binding agreements which legally released the Company from certain obligations totaling $19.0 million. The forgiveness of debt has been recorded as a reduction of general and administrative expense and other income respectively. In addition, the recovery of bad debt expense of $6.4US$1.2 million, US$2.0 million and $2.0US$6.4 million was recorded as a reduction of general and administrative expense for the year ended December 31, 20112013, 2012 and 2012,2011, respectively.
11.210.2 Impairment losses on property, plant and equipment
|
| Year ended |
| Year ended |
| Year ended | |
| 12/31/13 |
| 12/31/12 |
| 12/31/11 |
| |
|
| USD’000 |
| USD’000 |
| USD’000 | |
Impairment losses on property, plant and equipment | — | — |
| 17,691 |
|
11.310.3 Depreciation and amortization expense
|
| Year ended |
| Year ended |
|
| Year ended |
| Year ended |
| Year ended |
|
|
| 12/31/12 |
| 12/31/11 |
|
| 12/31/13 |
| 12/31/12 |
| 12/31/11 |
|
|
| USD’000 |
| USD’000 |
|
| USD’000 |
| USD’000 |
| USD’000 |
|
Depreciation of property, plant and equipment |
| 531,823 |
| 518,840 |
|
| 501,923 |
| 531,823 |
| 518,840 |
|
Amortization of intangible assets and land use right |
| 35,076 |
| 33,071 |
|
| 44,987 |
| 35,076 |
| 33,017 |
|
Total depreciation and amortization expense |
| 566,899 |
| 551,911 |
|
| 546,910 |
| 566,899 |
| 551,857 |
|
11.410.4 Employee benefits expense
|
| Year ended |
| Year ended |
|
| Year ended |
| Year ended |
| Year ended |
|
|
| USD’000 |
| USD’000 |
|
| USD’000 |
| USD’000 |
| USD’000 |
|
Wages, salaries and social security contributions |
| 206,807 |
| 190,901 |
|
| 233,025 |
| 206,807 |
| 190,901 |
|
Bonus |
| 28,048 |
| 10,431 |
|
| 68,618 |
| 28,048 |
| 10,431 |
|
Paid annual leave |
| 738 |
| 310 |
|
| 541 |
| 738 |
| 310 |
|
Non-monetary benefits |
| 12,880 |
| 12,494 |
|
| 17,937 |
| 12,880 |
| 12,494 |
|
Termination benefits |
| 7 |
| 5,018 |
|
| — |
| 7 |
| 5,018 |
|
Equity-settled share-based payments (Note 33) |
| 7,174 |
| 5,336 |
| |||||||
Equity-settled share-based payments (Note 34) |
| 16,402 |
| 7,174 |
| 5,336 |
| |||||
Total employee benefits expense |
| 255,654 |
| 224,490 |
|
| 336,523 |
| 255,654 |
| 224,490 |
|
NOTES TO THE CONSOLIDATED FINANCIAL STATEMENTS
11.10. Profit (loss) for the year (continued)
Profit (loss) for the year from continuing operations has been arrived at after charging (crediting) (continued)
11.510.5 Royalties expense
|
| Year ended |
| Year ended |
|
|
| 12/31/12 |
| 12/31/11 |
|
|
| USD’000 |
| USD’000 |
|
Royalties expense |
| 28,993 |
| 22,795 |
|
|
| Year ended |
| Year ended |
| Year ended |
|
|
| USD’000 |
| USD’000 |
| USD’000 |
|
Royalties expense |
| 32,546 |
| 28,993 |
| 22,795 |
|
11.610.6 Government grantfunding
Government subsidiesfunding under specific R&D projects
The Company received government awardsfunding of US$145.8 million, US$54.1 million and US$126.1 million and recognized US$26.9 million US$31.0 million and US$42.6 million in the form of reimbursementas reductions of certain R&D expenses in 2013, 2012 and 2011 for several specific R&D projects respectively. The awards are deferredgovernment funding is recorded as a liability upon receipt and recognized as reduction of R&D expenses until the milestones specified in the terms of the subsidyfunding have been reached, at which time they are recorded as a reduction in R&D expense.reached.
Government subsidiesfunding for specific intended use
The Company received government subsidies in cashfunding of US$7.1 million, US$1.4 million and US$0.8 million in 2012 and 2011 respectively, which was determined based on the estimated interest expense to be incurred, on the Company’s budgeted outstanding borrowings. The government subsidy is recorded as a liability upon receipt and until the requirements (if any) specified in the terms of the subsidy have been reached, at which time they are recorded as a reduction in interest expense. The Company recordedrecognized US$7.1 million, US$1.2 million and US$0.8 million as reduction of interest expense in 2013, 2012 and 2011.2011 respectively. The government funding is recorded as a liability upon receipt and recognized as reduction of interest expense until the requirements (if any) specified in the terms of the funding have been reached.
12Discontinued operations
Disposal of Semiconductor Manufacturing International (AT) Corporation
On March 1, 2011, the Company sold its majority ownership interest in Semiconductor Manufacturing International (AT) Corporation (“AT”) and deconsolidated the entity. As a result, all previously issued preferred securities by AT were cancelled. The Company retained a 10% interest in AT and accounts for such investment as available-for-sale investment as it no longer has a controlling financial interest nor significant influence over AT. The Company reported the results of the AT as a discontinued operation in the condensed consolidated statements of comprehensive income. No cash or other consideration was received by the Company in conjunction with the disposition.
The Company recorded a gain of US$17.1 million on the deconsolidation of AT equal to the difference between (i) the sum of (a) the fair value of the retained non-controlling interest in AT, and (b) the carrying amount of the aforementioned non-controlling interest in AT, and (ii) the carrying amount of AT’s assets and liabilities. Income from discontinued operations of US$14.7 million represents both the results of operations of AT for the period from January 1, 2011 to the date it was deconsolidated and the gain on deconsolidation of AT.
NOTES TO THE CONSOLIDATED FINANCIAL STATEMENTS
12Discontinued operations (continued)
Analysis of profit for the year from discontinued operations
| |||
| |||
| |||
| |||
|
| ||
|
|
| |
|
|
| |
|
|
| |
|
|
| |
|
| ||
|
| ||
| |||
| |||
|
|
| |
|
|
| |
|
|
| |
|
|
|
13.11. Directors’ remuneration
|
| Year ended |
| Year ended |
| |||||||
|
| 12/31/12 |
| 12/31/11 |
|
| Year ended |
| Year ended |
| Year ended |
|
|
| USD’000 |
| USD’000 |
|
| USD’000 |
| USD’000 |
| USD’000 |
|
Salaries |
| 1,411 |
| 1,160 |
|
| 1,756 |
| 1,411 |
| 1,160 |
|
Equity-settled share-based payments |
| 1,113 |
| 1,145 |
|
| 1,504 |
| 1,113 |
| 1,145 |
|
|
| 2,524 |
| 2,305 |
|
| 3,260 |
| 2,524 |
| 2,305 |
|
The Company granted 27,083,220, nil and 113,205,662 options to purchase ordinary shares of the Company to the directors in 2013, 2012 and 2011.2011, respectively. During the year ended December 31, 2013, 1,000,000 stock options were exercised and 4,634,877 stock options were expired. During the year ended December 31, 2012, no stock optionsoption was exercised and 500,000 stock options were expired. And during the year ended December 31, 2011, 1,000,000 stock options were exercised and 78,371,941 stock options were lapsed in connection with certain directors ceasing to continue serving as directors.
The Company granted nil, nil and 46,600,465 restricted share units to purchase ordinary shares of the Company to the directors in 2013, 2012 and 2011.2011, respectively. During the year ended December 31, 2013, 11,650,116 restricted share units automatically vested and no restricted share units were forfeited. During the year ended December 31, 2012, 11,650,116 restricted share units automatically vested and noneno restricted share units were lapsed.forfeited. And during the year ended December 31, 2011, 15,114,588 restricted share units automatically vested and 18,473,385 restricted share units were lapsedforfeited in connection with certain directors ceasing to continue serving as directors.
NOTES TO THE CONSOLIDATED FINANCIAL STATEMENTS
11.Directors’ remuneration (continued)
In 2013, 2012 and 2011, no emoluments were paid by the Company to any of the directors as an inducement to join or upon joining the Company or as compensation for loss of office. In 2013, 2012 and 2011, no directors waived any emoluments.
NOTES TO THE CONSOLIDATED FINANCIAL STATEMENTS
13.Directors’ remuneration (continued)
(a) Independent non-executive directors
The fees paid or payable to independent non-executive directors of the Company during the year were as follows:
|
|
|
| Employee |
|
|
|
| Salaries |
| Employee |
| Total |
|
|
|
|
| settled share- |
| Total |
|
| USD’000 |
| USD’000 |
| USD’000 |
|
|
| Salaries |
| base payment |
| remuneration |
| |||||||
|
| USD’000 |
| USD’000 |
| USD’000 |
| |||||||
2012 |
|
|
|
|
|
|
| |||||||
2013 |
|
|
|
|
|
|
| |||||||
Tsuyoshi Kawanishi |
| 45 |
| 15 |
| 60 |
|
| 20 |
| 5 |
| 25 |
|
William Tudor Brown |
| 18 |
| 45 |
| 63 |
| |||||||
Sean Maloney |
| 27 |
| 65 |
| 92 |
| |||||||
Lip-Bu Tan |
| 65 |
| 15 |
| 80 |
|
| 65 |
| 5 |
| 70 |
|
Frank Meng |
| 52 |
| 40 |
| 92 |
|
| 54 |
| 36 |
| 90 |
|
|
| 162 |
| 70 |
| 232 |
|
| 184 |
| 156 |
| 340 |
|
|
|
|
| Employee |
|
|
|
|
|
| Employee |
|
|
|
|
|
|
| settled share- |
| Total |
|
|
|
| settle share- |
| Total |
|
|
| Salaries |
| base payment |
| remuneration |
|
| Salaries |
| base payment |
| remuneration |
|
|
| USD’000 |
| USD’000 |
| USD’000 |
|
| USD’000 |
| USD’000 |
| USD’000 |
|
2011 |
|
|
|
|
|
|
| |||||||
2012 |
|
|
|
|
|
|
| |||||||
Tsuyoshi Kawanishi |
| 45 |
| 13 |
| 58 |
|
| 45 |
| 15 |
| 60 |
|
Lip-Bu Tan |
| 60 |
| 13 |
| 73 |
|
| 65 |
| 15 |
| 80 |
|
Frank Meng |
| 4 |
| 14 |
| 18 |
|
| 52 |
| 40 |
| 92 |
|
Jiang Shangzhou* |
| 97 |
| 141 |
| 238 |
| |||||||
|
| 206 |
| 181 |
| 387 |
|
| 162 |
| 70 |
| 232 |
|
|
|
|
| Employee |
|
|
|
|
|
|
| settle share- |
| Total |
|
|
| Salaries |
| base payment |
| remuneration |
|
|
| USD’000 |
| USD’000 |
| USD’000 |
|
2011 |
|
|
|
|
|
|
|
Tsuyoshi Kawanishi |
| 45 |
| 13 |
| 58 |
|
Lip-Bu Tan |
| 60 |
| 13 |
| 73 |
|
Frank Meng |
| 4 |
| 14 |
| 18 |
|
Jiang Shangzhou* |
| 97 |
| 141 |
| 238 |
|
|
| 206 |
| 181 |
| 387 |
|
* Jiang Shangzhou passed away on June 27, 2011.
There were no other emoluments payable to the independent non-executive directors during the year (2011:(2012: Nil and 2011: Nil).
11.Directors’ remuneration (continued)
(b) Executive directors and non-executive directors
|
| Salaries |
| Employee |
| Total |
|
| Salaries |
| Employee |
| Total |
|
|
| USD’000 |
| USD’000 |
| USD’000 |
|
| and wages |
| base payment |
| remuneration |
|
2012 |
|
|
|
|
|
|
| |||||||
|
| USD’000 |
| USD’000 |
| USD’000 |
| |||||||
2013 |
|
|
|
|
|
|
| |||||||
Executive directors: |
|
|
|
|
|
|
|
|
|
|
|
|
|
|
Zhang Wenyi |
| 188 |
| 353 |
| 541 |
|
| 391 |
| 274 |
| 665 |
|
Tzu-Yin Chiu* |
| 962 |
| 642 |
| 1,604 |
|
| 963 |
| 901 |
| 1,864 |
|
Gao Yonggang# |
| 142 |
| 101 |
| 243 |
| |||||||
|
| 1,150 |
| 995 |
| 2,145 |
|
| 1,496 |
| 1,276 |
| 2,772 |
|
Non-executive directors: |
|
|
|
|
|
|
|
|
|
|
|
|
|
|
Chen Shangzhi |
| 52 |
| 24 |
| 76 |
| |||||||
Gao Yonggang |
| 47 |
| 24 |
| 71 |
| |||||||
Lawrence Lau |
| — |
| — |
| — |
| |||||||
Chen Shanzhi |
| 54 |
| 10 |
| 64 |
| |||||||
Lawrence Juen-Yee Lau |
| 22 |
| 62 |
| 84 |
| |||||||
Zhou Jie |
| — |
| — |
| — |
|
| — |
| — |
| — |
|
Chen Datong |
| — |
| — |
| — |
| |||||||
Li Yonghua (Alternate to Chen Shanzhi) |
| — |
| — |
| — |
| |||||||
Chen Datong |
| — |
| — |
| — |
| |||||||
|
| 99 |
| 48 |
| 147 |
|
| 76 |
| 72 |
| 148 |
|
|
| Salaries |
| Employee |
| Total |
|
|
| USD’000 |
| USD’000 |
| USD’000 |
|
2012 |
|
|
|
|
|
|
|
Executive directors: |
|
|
|
|
|
|
|
Zhang Wenyi |
| 188 |
| 353 |
| 541 |
|
Tzu-Yin Chiu* |
| 962 |
| 642 |
| 1,604 |
|
|
| 1,150 |
| 995 |
| 2,145 |
|
Non-executive directors: |
|
|
|
|
|
|
|
Chen Shanzhi |
| 52 |
| 24 |
| 76 |
|
Gao Yonggang |
| 47 |
| 24 |
| 71 |
|
Lawrence Juen-Yee Lau |
| — |
| — |
| — |
|
Zhou Jie |
| — |
| — |
| — |
|
Chen Datong |
| — |
| — |
| — |
|
|
| 99 |
| 48 |
| 147 |
|
NOTES TO THE CONSOLIDATED FINANCIAL STATEMENTS
11.Directors’ remuneration (continued)
(b)Executive directors and a non-executive director (continued)
|
| Salaries |
| Employee |
| Total |
|
|
| USD’000 |
| USD’000 |
| USD’000 |
|
2011 |
|
|
|
|
|
|
|
Executive directors: |
|
|
|
|
|
|
|
Zhang Wenyi |
| 100 |
| 178 |
| 278 |
|
Tzu-Yin Chiu* |
| 154 |
| 261 |
| 415 |
|
David N.K. Wang** |
| 601 |
| 478 |
| 1,079 |
|
|
| 855 |
| 917 |
| 1,772 |
|
Non-executive directors: |
|
|
|
|
|
|
|
Chen Shanzhi |
| 49 |
| 24 |
| 73 |
|
Gao Yonggang |
| 49 |
| 24 |
| 73 |
|
Lawrence Juen-Yee Lau |
| — |
| — |
| — |
|
Zhou Jie |
| — |
| — |
| — |
|
Chen Datong |
| — |
| — |
| — |
|
|
| 98 |
| 48 |
| 146 |
|
* Tzu-Yin Chiu is also the Chief Executive Officer of the Company.
NOTES TO THE CONSOLIDATED FINANCIAL STATEMENTS
13.Directors’ remuneration (continued)
(b)Executive directors and non-executive directors (continued)
|
| Salaries |
| Employee |
| Total |
|
|
| USD’000 |
| USD’000 |
| USD’000 |
|
2011 |
|
|
|
|
|
|
|
Executive directors: |
|
|
|
|
|
|
|
Zhang Wenyi |
| 100 |
| 178 |
| 278 |
|
Tzu-Yin Chiu |
| 154 |
| 261 |
| 415 |
|
David N.K. Wang* |
| 601 |
| 478 |
| 1,079 |
|
|
| 855 |
| 917 |
| 1,772 |
|
Non-executive directors: |
|
|
|
|
|
|
|
Chen Shanzhi |
| 49 |
| 24 |
| 73 |
|
Gao Yonggang |
| 49 |
| 24 |
| 73 |
|
Lawrence Lau |
| — |
| — |
| — |
|
Zhou Jie |
| — |
| — |
| — |
|
Chen Datong |
| — |
| — |
| — |
|
|
| — 98 |
| 48 |
| 146 |
|
** David N.K. Wang ceased to be a director on June 29, 2011.
#Gao Yongang has been re-designated as an executive director of the Company with effect from June 17, 2013.
There was no arrangement under which a director waived or agreed to waive any remuneration during the year.
14.12. Five highest paid employeesindividuals
The five highest paid employeesindividuals during the year included two (2012: one (2011:and 2011: one) director,directors, details of whose remuneration are set out in Note 1311 above. Details of the remuneration of the remaining three (2012: four (2011:and 2011: four) non-directors, highest paid employeesindividuals for the year are as follows:
|
| Year ended |
| Year ended |
|
| Year ended |
| Year ended |
| Year ended |
|
|
| USD’000 |
| USD’000 |
|
| USD’000 |
| USD’000 |
| USD’000 |
|
Salaries and other benefits |
| 1,334 |
| 1,209 |
|
| 955 |
| 1,334 |
| 1,209 |
|
Bonus |
| 16 |
| 690 |
|
| 386 |
| 16 |
| 690 |
|
Stock option benefits |
| 521 |
| 543 |
|
| 566 |
| 521 |
| 543 |
|
|
| 1,871 |
| 2,442 |
|
| 1,907 |
| 1,871 |
| 2,442 |
|
The bonus is determined on the basis of the basic salary and the performance of the Company and the individual.
In 2013, 2012 and 2011, no emoluments were paid by the Company to any of the five highest paid employeesindividuals as an inducement to join or upon joining the Company or as compensation for loss of office.
NOTES TO THE CONSOLIDATED FINANCIAL STATEMENTS
14.12. Five highest paid employeesindividuals (continued)
The number of non-director, highest paid employeesindividuals whose remuneration fell within the following bands is as follows:
|
| Number of employees |
| ||
|
| 2012 |
| 2011 |
|
HK$2,000,001 ($257,441) to HK$2,500,000 ($321,800) |
| 1 |
| — |
|
HK$2,500,001 ($321,801) to HK$3,000,000 ($386,160) |
| — |
| — |
|
HK$3,000,001 ($386,161) to HK$3,500,000 ($450,520) |
| 1 |
| — |
|
HK$3,500,001 ($450,521) to HK$4,000,000 ($514,880) |
| 1 |
| 1 |
|
HK$4,500,001 ($579,241) to HK$5,000,000 ($643,600) |
| 1 |
| 2 |
|
HK$5,000,001 ($643,601) to HK$5,500,000 ($707,960) |
| — |
| 1 |
|
|
| 4 |
| 4 |
|
|
| Number of employees |
| ||||
|
| 2013 |
| 2012 |
| 2011 |
|
HK$2,000,001 (US$257,902) to HK$2,500,000 (US$322,376) |
| — |
| 1 |
| — |
|
HK$2,500,001 (US$322,377) to HK$3,000,000 (US$386,851) |
| — |
| — |
| — |
|
HK$3,000,001 (US$386,852) to HK$3,500,000 (US$451,327) |
| — |
| 1 |
| — |
|
HK$3,500,001 (US$451,328) to HK$4,000,000 (US$515,802) |
| 1 |
| 1 |
| 1 |
|
HK$4,500,001 (US$580,278) to HK$5,000,000 (US$644,753) |
| — |
| 1 |
| 2 |
|
HK$5,000,001 (US$644,754) to HK$5,500,000 (US$709,228) |
| 1 |
| — |
| 1 |
|
HK$5,500,001 (US$709,229) to HK$6,000,000 (US$773,704) |
| 1 |
| — |
| — |
|
|
| 3 |
| 4 |
| 4 |
|
15.13. Earnings (loss) per share
|
| Year ended |
| Year ended |
|
| Year ended |
| Year ended |
| Year ended |
|
|
| 12/31/12 |
| 12/31/11 |
|
| 12/31/13 |
| 12/31/12 |
| 12/31/11 |
|
|
| USD |
| USD |
|
| USD |
| USD |
| USD |
|
Basic earnings (loss) per share |
|
|
|
|
|
|
|
|
|
|
|
|
From continuing operations |
| 0.00 |
| (0.01 | ) |
| 0.01 |
| 0.00 |
| (0.01 | ) |
From discontinued operations |
| — |
| 0.00 |
|
| — |
| — |
| 0.00 |
|
Total basic earnings (loss) per share |
| 0.00 |
| (0.01 | ) |
| 0.01 |
| 0.00 |
| (0.01 | ) |
Diluted earnings (loss) per share |
|
|
|
|
|
|
|
|
|
|
|
|
From continuing operations |
| 0.00 |
| (0.01 | ) |
| 0.01 |
| 0.00 |
| (0.01 | ) |
From discontinued operations |
| — |
| (0.00 | ) |
| — |
| — |
| 0.00 |
|
Total diluted earnings (loss) per share |
| 0.00 |
| (0.01 | ) |
| 0.01 |
| 0.00 |
| (0.01 | ) |
Basic earnings (loss) per share
The earnings (loss) and weighted average number of ordinary shares used in the calculation of basic earnings (loss) per share are as follows:
|
| Year ended |
| Year ended |
| Year ended |
| |||||
|
| Year ended |
| Year ended |
|
| 12/31/13 |
| 12/31/12 |
| 12/31/11 |
|
|
| USD’000 |
| USD’000 |
|
| USD’000 |
| USD’000 |
| USD’000 |
|
Profit (loss) for the year attributable to owners of the Company |
| 22,771 |
| (246,817 | ) |
| 173,177 |
| 22,771 |
| (246,817 | ) |
Earnings (loss) used in the calculation of basic earnings (loss) per share |
| 22,771 |
| (246,817 | ) |
| 173,177 |
| 22,771 |
| (246,817 | ) |
Profit for the year from discontinued operations used in the calculation of basic earnings per share from discontinued operations |
| — |
| 14,741 |
|
| — |
| — |
| 14,741 |
|
Earnings (loss) used in the calculation of basic earnings (loss) per share from continuing operations |
| 22,771 |
| (261,558 | ) |
| 173,177 |
| 22,771 |
| (261,558 | ) |
Weighted average number of ordinary shares for the purposes of basic earnings (loss) per share |
| 30,078,893,961 |
| 27,435,853,922 |
|
| 32,063,137,846 |
| 30,078,893,961 |
| 27,435,853,922 |
|
NOTES TO THE CONSOLIDATED FINANCIAL STATEMENTS
15.13. Earnings (loss) per share (continued)
Diluted earnings (loss) per share
The earnings (loss) used in the calculation of diluted earnings (loss) per share are as follows:
|
| Year ended |
| Year ended |
|
| Year ended |
| Year ended |
| Year ended |
|
|
| 12/31/12 |
| 12/31/11 |
|
| 12/31/13 |
| 12/31/12 |
| 12/31/11 |
|
|
| USD’000 |
| USD’000 |
|
| USD’000 |
| USD’000 |
| USD’000 |
|
Earnings (loss) used in the calculation of basic earnings (loss) per share |
| 22,771 |
| (246,817 | ) |
| 173,177 |
| 22,771 |
| (246,817 | ) |
Profit for the year from discontinued operations used in the calculation of diluted earnings (loss) per share from discontinued operations |
| — |
| 14,741 |
| |||||||
Profit for the year from discontinued operations used in the calculation of basic earnings per share from discontinued operations |
| — |
| — |
| 14,741 |
| |||||
Interest expense from convertible bonds |
| 1,173 |
| — |
| — |
| |||||
Earnings (loss) used in the calculation of diluted earnings (loss) per share from continuing operations |
| 22,771 |
| (261,558 | ) |
| 174,350 |
| 22,771 |
| (261,558 | ) |
The weighted average number of ordinary shares for the purpose of diluted earnings (loss) per share reconciles to the weighted average number of ordinary shares used in the calculation of basic earnings (loss) per share as follows:
|
| Year ended |
| Year ended |
|
| Year ended |
| Year ended |
| Year ended |
|
|
| 12/31/12 |
| 12/31/11 |
|
| 12/31/13 |
| 12/31/12 |
| 12/31/11 |
|
Weighted average number of ordinary shares used in the calculation of basic earnings (loss) per share |
| 30,078,893,961 |
| 27,435,853,922 |
| |||||||
|
| USD’000 |
| USD’000 |
| USD’000 |
| |||||
Weighted average number of ordinary shares used in the calculation of basic earnings per share |
| 32,063,137,846 |
| 30,078,893,961 |
| 27,435,853,922 |
| |||||
Employee option and restricted share units |
| 64,712,749 |
| — |
|
| 237,913,672 |
| 64,712,749 |
| — |
|
Convertible preferred shares |
| 1,899,048,145 |
| — |
|
| — |
| 1,899,048,145 |
| — |
|
Weighted average number of ordinary shares used in the calculation of diluted earnings (loss) per share |
| 32,042,654,855 |
| 27,435,853,922 |
| |||||||
Convertible bonds |
| 288,027,267 |
| — |
| — |
| |||||
Weighted average number of ordinary shares used in the calculation of diluted earnings per share |
| 32,589,078,785 |
| 32,042,654,855 |
| 27,435,853,922 |
| |||||
As ofDuring the year ended December 31, 2012,2013, the Company had 2,032,765,688785,159,938 weighted average outstanding employee stock options and warrants which were excluded from the computation of diluted earnings per share because the exercise price was greater than the average market price of the common shares.
AsDuring the year ended December 31, 2012, the Company had 2,021,406,706 weighted average outstanding employee stock options and warrants which were excluded from the computation of diluted earnings per share because the exercise price was greater than the average market price of the common shares.
During the year ended December 31, 2011, the Company had 3,057,405,0862,896,467,247 weighted average outstanding employee stock options, restricted share units, warrants and convertible preferred shares outstanding which were excluded from the computation of diluted lossearnings per share, as their effect would have been anti-dilutive due to the net loss reported in the year ended December 31, 2011.
14.Dividend
The Board did not recommend the payment of any dividend for the year ended December 31, 2013 (December 31, 2012: Nil and December 31, 2011: Nil).
15. Assets classified as held for sale
|
|
| |||||
|
|
| |||||
|
|
|
|
|
| 12/31/13 |
| 12/31/12 |
| 12/31/11 |
|
|
| USD’000 |
| USD’000 |
| USD’000 |
|
Assets related to employee’s living quarters (i) |
| 3,265 |
| 4,239 |
| — |
|
(i) The Company is seeking to sell its self-constructed living quarters to its employees.
NOTES TO THE CONSOLIDATED FINANCIAL STATEMENTS
17.16. Property, plant and equipment
|
| Buildings |
| Plant and |
| Office |
| Construction |
| Total |
|
|
| USD’000 |
| USD’000 |
| USD’000 |
| USD’000 |
| USD’000 |
|
Cost |
|
|
|
|
|
|
|
|
|
|
|
Balance at January 1, 2011 |
| 311,717 |
| 6,273,719 |
| 78,076 |
| 814,331 |
| 7,477,843 |
|
Transter from (out) CIP |
| 9,351 |
| 805,588 |
| 12,613 |
| (827,552 | ) | — |
|
Addition |
| — |
| — |
| — |
| 727,576 |
| 727,576 |
|
Disposals |
| (1,177 | ) | (75,593 | ) | (4,152 | ) | (2,352 | ) | (83,274 | ) |
Write-off |
| — |
| — |
| — |
| (87,355 | ) | (87,355 | ) |
Balance at December 31, 2011 |
| 319,891 |
| 7,003,714 |
| 86,537 |
| 624,648 |
| 8,034,790 |
|
Transter from (out) CIP |
| 24,581 |
| 581,579 |
| 18,029 |
| (624,189 | ) | — |
|
Addition |
| — |
| — |
| — |
| 409,750 |
| 409,750 |
|
Disposals |
| (4,088 | ) | (7,918 | ) | (580 | ) | (142 | ) | (12,728 | ) |
Reclassified as held for sale |
| (4,842 | ) | — |
| (32 | ) | — |
| (4,874 | ) |
Balance at December 31, 2012 |
| 335,542 |
| 7,577,375 |
| 103,954 |
| 410,067 |
| 8,426,938 |
|
|
| Buildings |
| Plant and |
| Office |
| Construction |
| Total |
|
|
| USD’000 |
| USD’000 |
| USD’000 |
| USD’000 |
| USD’000 |
|
Accumulated depreciation and impairment |
|
|
|
|
|
|
|
|
|
|
|
Balance at January 1, 2011 |
| 77,949 |
| 4,873,172 |
| 72,507 |
| 102,352 |
| 5,125,980 |
|
Disposal |
| (406 | ) | (52,448 | ) | (4,090 | ) | — |
| (56,944 | ) |
Write-off |
| — |
| — |
| — |
| (87,355 | ) | (87,355 | ) |
Impairment losses recognized in profit or loss |
| — |
| — |
| — |
| 17,691 |
| 17,691 |
|
Depreciation expense |
| 11,833 |
| 501,683 |
| 5,324 |
| — |
| 518,840 |
|
Balance at December 31, 2011 |
| 89,376 |
| 5,322,407 |
| 73,741 |
| 32,688 |
| 5,518,212 |
|
Disposal |
| (1,403 | ) | (4,850 | ) | (579 | ) | — |
| (6,832 | ) |
Depreciation expense |
| 12,903 |
| 509,962 |
| 8,958 |
| — |
| 531,823 |
|
Reclassified as held for sale |
| (1,671 | ) | — |
| (29 | ) | — |
| (1,700 | ) |
Balance at December 31, 2012 |
| 99,205 |
| 5,827,519 |
| 82,091 |
| 32,688 |
| 6,041,503 |
|
|
| Buildings |
| Plant and |
| Office |
| Construction |
| Total |
|
|
| USD’000 |
| USD’000 |
| USD’000 |
| USD’000 |
| USD’000 |
|
Carrying value at January 1, 2011 |
| 233,768 |
| 1,400,547 |
| 5,569 |
| 711,979 |
| 2,351,863 |
|
Carrying value at December 31, 2011 |
| 230,515 |
| 1,681,307 |
| 12,796 |
| 591,960 |
| 2,516,578 |
|
Carrying value at December 31, 2012 |
| 236,337 |
| 1,749,856 |
| 21,863 |
| 377,379 |
| 2,385,435 |
|
|
| Buildings |
| Plant and |
| Office |
| Construction |
| Total |
|
|
| USD’000 |
| USD’000 |
| USD’000 |
| USD’000 |
| USD’000 |
|
Cost |
|
|
|
|
|
|
|
|
|
|
|
Balance at January 1, 2011 |
| 311,717 |
| 6,273,719 |
| 78,076 |
| 814,331 |
| 7,477,843 |
|
Transfer from (out) CIP |
| 9,351 |
| 805,588 |
| 12,613 |
| (827,552 | ) | — |
|
Addition |
| — |
| — |
| — |
| 727,576 |
| 727,576 |
|
Disposals |
| (1,177 | ) | (75,593 | ) | (4,152 | ) | (2,352 | ) | (83,274 | ) |
Reclassified as held for sale |
| — |
| — |
| — |
| (87,355 | ) | (87,355 | ) |
Balance at December 31, 2011 |
| 319,891 |
| 7,003,714 |
| 86,537 |
| 624,648 |
| 8,034,790 |
|
Transfer from (out) CIP |
| 24,581 |
| 581,579 |
| 18,029 |
| (624,189 | ) | — |
|
Addition |
| — |
| — |
| — |
| 409,750 |
| 409,750 |
|
Disposals |
| (4,088 | ) | (7,918 | ) | (580 | ) | (142 | ) | (12,728 | ) |
Reclassified as held for sale |
| (4,842 | ) | — |
| (32 | ) | — |
| (4,874 | ) |
Balance at December 31, 2012 |
| 335,542 |
| 7,577,375 |
| 103,954 |
| 410,067 |
| 8,426,938 |
|
Transfer from (out) CIP |
| 7,238 |
| 553,162 |
| 9,610 |
| (570,010 | ) | — |
|
Addition |
| — |
| — |
| — |
| 670,853 |
| 670,853 |
|
Disposals |
| (20,698 | ) | (1,163 | ) | (5,531 | ) | (10,000 | ) | (37,392 | ) |
Reclassified as held for sale |
| (2,999 | ) | — |
| (2 | ) | — |
| (3,001 | ) |
Balance at December 31, 2013 |
| 319,083 |
| 8,129,374 |
| 108,031 |
| 500,910 |
| 9,057,398 |
|
NOTES TO THE CONSOLIDATED FINANCIAL STATEMENTS
17.16. Property, plant and equipment (continued)
|
|
|
| Plant and |
| Office |
| Construction |
|
|
|
|
| Buildings |
| equipment |
| equipment |
| (CIP) |
| Total |
|
|
| USD’000 |
| USD’000 |
| USD’000 |
| USD’000 |
| USD’000 |
|
Accumulated depreciation and impairment |
|
|
|
|
|
|
|
|
|
|
|
Balance at January 1, 2011 |
| 77,949 |
| 4,873,172 |
| 72,507 |
| 102,352 |
| 5,125,980 |
|
Disposal |
| (406 | ) | (52,448 | ) | (4,090 | ) | — |
| (56,944 | ) |
Write-off |
| — |
| — |
| — |
| (87,355 | ) | (87,355 | ) |
Impairment losses recognized in profit or loss |
| — |
| — |
| — |
| 17,691 |
| 17,691 |
|
Depreciation expense |
| 11,833 |
| 501,683 |
| 5,324 |
| — |
| 518,840 |
|
Balance at December 31, 2011 |
| 89,376 |
| 5,322,407 |
| 73,741 |
| 32,688 |
| 5,518,212 |
|
Disposal |
| (1,403 | ) | (4,850 | ) | (579 | ) | — |
| (6,832 | ) |
Depreciation expense |
| 12,903 |
| 509,962 |
| 8,958 |
| — |
| 531,823 |
|
Reclassified as held for sale |
| (1,671 | ) | — |
| (29 | ) | — |
| (1,700 | ) |
Balance at December 31, 2012 |
| 99,205 |
| 5,827,519 |
| 82,091 |
| 32,688 |
| 6,041,503 |
|
Disposal |
| (3,030 | ) | (1,405 | ) | (5,073 | ) | (4,490 | ) | (13,998 | ) |
Depreciation expense |
| 13,160 |
| 477,600 |
| 11,163 |
| — |
| 501,923 |
|
Reclassified as held for sale |
| (862 | ) | — |
| (2 | ) | — |
| (864 | ) |
Balance at December 31, 2013 |
| 108,473 |
| 6,303,714 |
| 88,179 |
| 28,198 |
| 6,528,564 |
|
|
|
|
| Plant and |
| Office |
| Construction |
|
|
|
|
| Buildings |
| equipment |
| equipment |
| (CIP) |
| Total |
|
|
| USD’000 |
| USD’000 |
| USD’000 |
| USD’000 |
| USD’000 |
|
Carrying value at December 31, 2011 |
| 230,515 |
| 1,681,307 |
| 12,796 |
| 591,960 |
| 2,516,578 |
|
Carrying value at December 31, 2012 |
| 236,337 |
| 1,749,856 |
| 21,863 |
| 377,379 |
| 2,385,435 |
|
Carrying value at December 31, 2013 |
| 210,610 |
| 1,825,660 |
| 19,852 |
| 472,712 |
| 2,528,834 |
|
Construction in progress
The construction in progress balance of approximately US$377.4472.7 million as of December 31, 2012,2013, primarily consisted of US$78.7130.5 million and US$146.6208.7 million of the manufacturing equipment acquired to further expand the production capacity at the 12” fab in Beijing and Shanghai, respectively, and US$91.9102.1 million related to the ongoing 8” wafer construction project at Semiconductor Manufacturing International (Shenzhen) Corporation. The Company’s Shenzhen project which commenced in 2008 has progressed more slowly than expected due to changing market conditions and ongoing negotiations with relevant parties. The Company purchased US$10.6 million facilities and equipment in current year in preparation of Shenzhen project. The Company will closely monitor the progress of the project and evaluate any additional costs to complete the project. In addition, $60.2US$31.4 million was related to various ongoing capital expenditureexpenditures projects of other SMIC subsidiaries, which are expected to be completed by the second half of 2013.2014.
16.Property, plant and equipment (continued)
Impairment losses recognized in the year
The Company recorded an impairment loss of US$nil (2012: Nil (2011:and 2011: US$17.7 million) associated with the disposal of property, plant and equipment with outdated technologies.
Assets pledged as security
Property, plant and equipment with carrying amount of approximately US$9931,000 million (2011:(2012: approximately US$1,064 million and 2011: approximately US$482 million) have been pledged to secure borrowings of the Company (see Note 29)28). The plant and equipment have been pledged as security for bank loans under a mortgage. The Company is not allowed to pledge these assets as security for other borrowings or to sell them to another entity.
18.17. Intangible assets
|
| Acquired |
|
|
| USD’000 |
|
Cost |
|
|
|
Balance at January 1, 2011 |
| 236,691 |
|
Additions |
| 37,490 |
|
Expired and |
| (21,908 | ) |
Balance at December 31, 2011 |
| 252,273 |
|
Additions |
| 89,636 |
|
Balance at December 31, 2012 |
| 341,909 | |
Additions | 23,139 | ||
Expired and disposal | (16,627 | ) | |
Balance at December 31, 2013 | 348,421 |
| |
Accumulated amortization and impairment |
|
|
|
Balance at January 1, 2011 |
| 62,870 |
|
Amortization expense for the year |
| 31,450 |
|
Expired and |
| (21,326 | ) |
Balance at December 31, 2011 |
| 72,994 |
|
Amortization expense for the year |
| 33,537 |
|
Balance at December 31, 2012 |
| 106,531 |
|
|
|
| |
Expired and disposal | (14,171 | ) | |
Balance at December 31, 2013 | 133,156 |
| |
Carrying value at December 31, 2011 |
| 179,279 |
|
Carrying value at December 31, 2012 |
| 235,378 |
|
Carrying value at December 31, 2013 | 215,265 |
NOTES TO THE CONSOLIDATED FINANCIAL STATEMENTS
19.18. Subsidiaries
Details of the Company’s subsidiaries at the end of the reporting period are as follows:
Name of company |
| Place of establishment |
| Class of |
| Paid up |
| Proportion of |
| Proportion of |
| Principal activities |
| ||
Better Way Enterprises Limited (“Better Way”) |
| Samoa |
| Ordinary |
| US$ | 1,000,000 |
| Directly | 100 | % | 100 | % | Provision of marketing related activities |
|
Semiconductor Manufacturing International (Shanghai) Corporation (“SMIS”)# |
| People’s Republic of China (the “PRC”) |
| Ordinary |
| US$ | 1,740,000,000 |
| Directly | 100 | % | 100 | % | Manufacturing and trading of semiconductor products |
|
SMIC, Americas |
| United States of America |
| Ordinary |
| US$ | 500,000 |
| Directly | 100 | % | 100 | % | Provision of marketing related activities |
|
Semiconductor Manufacturing International (Beijing) Corporation (“SMIB”)# |
| PRC |
| Ordinary |
| US$ | 1,000,000,000 |
| Directly | 100 | % | 100 | % | Manufacturing and trading of semiconductor products |
|
SMIC Japan |
| Japan |
| Ordinary |
| JPY | 10,000,000 |
| Directly | 100 | % | 100 | % | Provision of marketing related activities |
|
SMIC Europe S.R.L |
| Italy |
| Ordinary |
| Euros | 100,000 |
| Directly | 100 | % | 100 | % | Provision of marketing related activities |
|
Semiconductor Manufacturing International (Solar Cell) Corporation |
| Cayman Islands |
| Ordinary |
| US$ | 11,000 |
| Directly | 100 | % | 100 | % | Investment holding |
|
SMIC Commercial (Shanghai) Limited Company (formerly SMIC Consulting Corporation) |
| PRC |
| Ordinary |
| US$ | 800,000 |
| Directly | 100 | % | 100 | % | Provision of marketing related activities |
|
Semiconductor Manufacturing International (Tianjin) Corporation (“SMIT”)# |
| PRC |
| Ordinary |
| US$ | 690,000,000 |
| Directly | 100 | % | 100 | % | Manufacturing and trading of semiconductor products |
|
SMIC Development (Chengdu) Corporation |
| PRC |
| Ordinary |
| US$ | 5,000,000 |
| Directly | 100 | % | 100 | % | Construction, operation, and management of SMICD’s living quarters, schools, and supermarket |
|
Semiconductor Manufacturing International (BVI) Corporation (“SMIC (BVI)”) |
| British Virgin Islands |
| Ordinary |
| US$ | 10 |
| Directly | 100 | % | 100 | % | Provision of marketing related activities |
|
Admiral Investment Holdings Limited |
| British Virgin Islands |
| Ordinary |
| US$ | 10 |
| Directly | 100 | % | 100 | % | Investment holding |
|
SMIC Shanghai (Cayman) Corporation |
| Cayman Islands |
| Ordinary |
| US$ | 50,000 |
| Directly | 100 | % | 100 | % | Investment holding |
|
SMIC Beijing (Cayman) Corporation |
| Cayman Islands |
| Ordinary |
| US$ | 50,000 |
| Directly | 100 | % | 100 | % | Investment holding |
|
SMIC Tianjin (Cayman) Corporation |
| Cayman Islands |
| Ordinary |
| US$ | 50,000 |
| Directly | 100 | % | 100 | % | Investment holding |
|
SilTech Semiconductor Corporation |
| Cayman Islands |
| Ordinary |
| US$ | 10,000 |
| Directly | 100 | % | 100 | % | Investment holding |
|
SMIC Shenzhen (Cayman) Corporation |
| Cayman Islands |
| Ordinary |
| US$ | 50,000 |
| Directly | 100 | % | 100 | % | Investment holding |
|
SMIC Energy Technology (Shanghai) Corporation (“Energy Science”)# |
| PRC |
| Ordinary |
| US$ | 10,400,000 |
| Indirectly | 100 | % | 100 | % | Manufacturing and trading of solar cell related semiconductor products |
|
Magnificent Tower Limited |
| British Virgin Islands |
| Ordinary |
| US$ | 50,000 |
| Indirectly | 100 | % | 100 | % | Investment holding |
|
SMIC Shanghai (HK) Company Limited |
| Hong Kong |
| Ordinary |
| HK$ | 1,000 |
| Indirectly | 100 | % | 100 | % | Investment holding |
|
SMIC Beijing (HK) Company Limited |
| Hong Kong |
| Ordinary |
| HK$ | 1,000 |
| Indirectly | 100 | % | 100 | % | Investment holding |
|
SMIC Tianjin (HK) Company Limited |
| Hong Kong |
| Ordinary |
| HK$ | 1,000 |
| Indirectly | 100 | % | 100 | % | Investment holding |
|
SMIC Solar Cell (HK) Company Limited |
| Hong Kong |
| Ordinary |
| HK$ | 10,000 |
| Indirectly | 100 | % | 100 | % | Investment holding |
|
SMIC ShenZhen (HK) Company Limited |
| Hong Kong |
| Ordinary |
| HK$ | 1,000 |
| Indirectly | 100 | % | 100 | % | Investment holding |
|
SilTech Semiconductor (Hong Kong) Corporation Limited |
| Hong Kong |
| Ordinary |
| HK$ | 1,000 |
| Indirectly | 100 | % | 100 | % | Investment holding |
|
Semiconductor Manufacturing International (Shenzhen) Corporation |
| PRC |
| Ordinary |
| US$ | 127,000,000 |
| Indirectly | 100 | % | 100 | % | Manufacturing and trading of semiconductor products |
|
SilTech Semiconductor Shanghai Corporation Limited |
| PRC |
| Ordinary |
| US$ | 12,000,000 |
| Indirectly | 100 | % | 100 | % | Manufacturing and trading of semiconductor products |
|
Semiconductor Manufacturing North China (Beijing) Corporation |
| PRC |
| Ordinary |
| US$ | 240,000,000 |
| Directly and indirectly | 55 | % | 55 | % | Manufacturing and trading of semiconductor products |
|
# Abbreviation for identification purposes.
As of December 30, 2013, the Company lost control of Brite, but still has significant influence over it. The Company recorded its ownership interest of Brite as investment in associate.
18.Subsidiaries (continued)
Details of non-wholly owned subsidiaries that have material non-controlling interests
The table below shows details of non-wholly owned subsidiaries of the Company that have material non-controlling interests:
|
|
|
| Proportion of |
| Profit allocated |
|
|
|
|
| Place of |
| held by non- |
| to non- |
| Accumulated |
|
Name of company |
| establishment |
| 12/31/13 |
| Year ended |
| 12/31/13 |
|
|
|
|
|
|
| USD’000 |
| USD’000 |
|
Semiconductor Manufacturing North China (Beijing)Corporation (“SMNC”) |
| Beijing |
| 45.0 | % | 1,410 |
| 109,410 |
|
Total |
|
|
|
|
| 1,410 |
| 109,410 |
|
Summarized financial information in respect of each of the Company’s subsidiaries that has material non-controlling interests is set out below. The summarized financial information below represents amounts before intragroup eliminations.
SMNC
|
|
|
| ||||||
|
|
|
|
| |||||
Current assets |
|
|
|
| |||||
|
|
|
|
|
| ||||
|
|
|
|
|
|
| |||
|
|
|
|
|
|
| |||
|
|
|
|
|
|
| |||
|
|
|
|
|
|
| |||
|
|
|
|
|
|
| |||
|
|
|
|
|
|
| |||
|
|
|
|
|
| ||||
|
|
|
|
|
| ||||
|
|
|
|
|
| ||||
NOTES TO THE CONSOLIDATED FINANCIAL STATEMENTS
19.18. Subsidiaries (continued)
SMNC (continued)
|
|
|
| ||||||
USD’000 | |||||||||
Non operating income |
|
|
|
| |||||
Expense |
|
| ) | ||||||
Profit or loss from continuing operations |
|
|
| ||||||
|
|
|
|
|
| ||||
|
|
|
|
|
|
| |||
|
|
|
|
|
| ||||
|
|
|
|
|
| ||||
|
|
|
|
|
| ||||
|
|
|
|
|
| ||||
|
|
|
|
|
| ||||
|
|
|
|
|
| ||||
|
|
|
|
|
| ||||
|
|
|
|
|
| ||||
|
|
|
|
|
| ||||
|
|
|
|
|
| ||||
|
|
|
|
|
| ||||
NOTES TO THE CONSOLIDATED FINANCIAL STATEMENTS
19.Subsidiaries (continued)
|
|
| |||||||
Profit attributable to owners of the Company |
|
|
|
| |||||
|
|
|
|
|
| ||||
|
|
|
|
|
| ||||
|
|
|
|
|
|
| |||
|
|
|
|
|
|
| |||
|
|
|
|
|
|
| |||
|
|
|
|
|
|
| |||
|
|
|
|
|
|
| |||
|
|
|
|
|
|
| |||
|
|
|
|
|
|
| |||
|
|
|
|
|
|
| |||
|
|
|
|
| |||||
Net cash outflow from investing activities |
|
| ) | ||||||
Net cash inflow from financing activities | 240,000 | ||||||||
Net cash inflow | 77,149 | ||||||||
#Abbreviation for identification purposes
*The Company consolidates Brite Semiconductor Corporation and its subsidiaries (Brite) through controls gained through contractual agreement. The impact of consolidating of Brite is insignificant to the financial statements of the Company.
NOTES TO THE CONSOLIDATED FINANCIAL STATEMENTS
20.19. Investments in associates
Details of the Company’s significant associates, which are all unlisted companies, at the end of the reporting period are as follows:
|
|
|
|
|
| Proportion of |
| ||
|
|
|
| Place of |
| ownership interest and |
| ||
|
|
|
| establishment |
| voting power held by |
| ||
Name of company |
| Principal activity |
| and operation |
| the Company |
| ||
|
|
|
|
|
| 12/31/12 |
| 12/31/11 |
|
Toppan SMIC Electronic (Shanghai) Co., Ltd |
| Design, production and processing micro lens imaging sensors and related products |
| Shanghai |
| 30 | % | 30 | % |
Zhongxin Xiecheng Investment (Beijing) Co., Ltd |
| Equity investment, Project investment, consulting |
| Beijing |
| 49 | % | — |
|
|
| Place of establishment |
| Class |
| Proportion of ownership interest |
| Proportion |
| ||||
Name of company |
| and operation |
| held |
| 12/31/13 |
| 12/31/12 |
| 12/31/11 |
| power held |
|
Toppan SMIC Electronic (Shanghai) Co., Ltd (“Toppan”) |
| Shanghai |
| Ordinary |
| 30.0 | % | 30.0 | % | 30.0 | % | 30.0 | % |
SummarizedAbove associate is accounted for using the equity method in these consolidated financial information in respect of the Company’s associates is set out below.statements.
|
| Year ended |
| Year ended |
|
|
| USD’000 |
| USD’000 |
|
Total revenue |
| 20,103 |
| 24,210 |
|
Total profit for the year |
| 5,724 |
| 14,928 |
|
Company’s share of profits of associates |
| 1,703 |
| 4,479 |
|
|
| 12/31/12 |
| 12/31/11 |
|
Total assets |
| 69,374 |
| 54,470 |
|
Total liabilities |
| (2,237 | ) | (1,616 | ) |
Net assets |
| 67,137 |
| 52,854 |
|
Company’s share of net assets of associates |
| 21,636 |
| 15,856 |
|
19.Investments in associates (continued)
Toppan
|
| 12/31/13 |
| 12/31/12 |
| 12/31/11 |
|
|
| USD’000 |
| USD’000 |
| USD’000 |
|
Current assets |
| 47,554 |
| 44,987 |
| 36,778 |
|
Non-current assets |
| 22,660 |
| 15,677 |
| 17,692 |
|
Current liabilities |
| (2,117 | ) | (1,608 | ) | (1,616 | ) |
Non-current liabilities |
| — |
| — |
| — |
|
Net assets |
| 68,097 |
| 59,056 |
| 52,854 |
|
|
|
|
|
|
|
|
|
|
| Year ended |
| Year ended |
| Year ended |
|
|
| USD’000 |
| USD’000 |
| USD’000 |
|
Total revenue |
| 23,796 |
| 19,008 |
| 24,721 |
|
Profit from continuing operations |
| 7,364 |
| 5,585 |
| 14,928 |
|
Post-tax profit from discontinued operations |
| — |
| — |
| — |
|
Profit for the year |
| 7,364 |
| 5,585 |
| 14,928 |
|
Other comprehensive income for the year |
| — |
| — |
| — |
|
Total comprehensive income for the year |
| 7,364 |
| 5,585 |
| 14,928 |
|
Dividends received from the associate during the year |
| — |
| — |
| — |
|
Reconciliation of the above summarized financial information to the carrying amount of the interest in the associate recognized in the consolidated financial statements:
|
| 12/31/13 |
| 12/31/12 |
| 12/31/11 |
|
|
| USD’000 |
| USD’000 |
| USD’000 |
|
Net assets of the associate |
| 68,097 |
| 59,056 |
| 52,854 |
|
Proportion of the Company’s ownership interest in Toppan |
| 30 | % | 30 | % | 30 | % |
Carrying amount of the Company’s interest in Toppan |
| 20,429 |
| 17,717 |
| 15,856 |
|
NOTES TO THE CONSOLIDATED FINANCIAL STATEMENTS
21.20. Other financial assets
|
| 31/12/12 |
| 31/12/11 |
| 01/01/11 |
|
| 12/31/13 |
| 12/31/12 |
| 12/31/11 |
|
|
| USD’000 |
| USD’000 |
| USD’000 |
|
| USD’000 |
| USD’000 |
| USD’000 |
|
Derivatives |
|
|
|
|
|
|
|
|
|
|
|
|
|
|
Foreign currency forward contracts |
| 77 |
| 939 |
| 695 |
|
| — |
| 77 |
| 939 |
|
Short-term investments carried at fair value through profit or loss |
| 18,653 |
| 1,034 |
| 2,454 |
|
| 240,311 |
| 18,653 |
| 1,034 |
|
|
| 18,730 |
| 1,973 |
| 3,149 |
|
| 240,311 |
| 18,730 |
| 1,973 |
|
22.21. Other assets
|
| 12/31/12 |
| 12/31/11 |
| 01/01/11 |
|
| 12/31/13 |
| 12/31/12 |
| 12/31/11 |
|
|
| USD’000 |
| USD’000 |
| USD’000 |
|
| USD’000 |
| USD’000 |
| USD’000 |
|
Advance payments |
| 28,252 |
| 31,816 |
| — |
|
| — |
| 28,252 |
| 31,816 |
|
Others |
| 15,130 |
| 13,869 |
| 2,393 |
|
| 6,237 |
| 15,130 |
| 13,869 |
|
Non-current |
| 43,382 |
| 45,685 |
| 2,393 |
|
| 6,237 |
| 43,382 |
| 45,685 |
|
In 2011, an advance of US$28 million was made in conjunction with a proposed joint venture between the Companyholding company and Wuhan Xinxin Semiconductor Manufacturing Corporation (“Xinxin”). This advance payment is refundable should the joint venture cannot be formed successfully.
In addition, an advance of US$3.9 million was made in 2011reclassified to Zhongxin Xiecheng Investment (Beijing) Corporation Limited in conjunction with a joint venture between China Investment Corporation and the Company. The advance converted to capital of the new company aftercurrent assets as at December 31, 2013 as it was formed in 2012.became receivable within one year.
Available-for-sale investment of US$1.3 million as of December 31, 2013 and US$3.8 million as of December 31, 2012 and 2011, respectively, has been included as others.
23.22. Inventories
|
| 12/31/12 |
| 12/31/11 |
| 01/01/11 |
|
| 12/31/13 |
| 12/31/12 |
| 12/31/11 |
|
|
| USD’000 |
| USD’000 |
| USD’000 |
|
| USD’000 |
| USD’000 |
| USD’000 |
|
Raw materials |
| 52,228 |
| 54,853 |
| 79,037 |
|
| 56,242 |
| 52,228 |
| 54,853 |
|
Work in progress |
| 156,392 |
| 93,472 |
| 86,235 |
|
| 180,710 |
| 156,392 |
| 93,472 |
|
Finished goods |
| 87,108 |
| 58,983 |
| 48,132 |
|
| 49,299 |
| 87,108 |
| 58,983 |
|
|
| 295,728 |
| 207,308 |
| 213,404 |
|
| 286,251 |
| 295,728 |
| 207,308 |
|
The cost of inventories recognized as an expense (income) during the year in respect of inventory provision was US$30.9(0.1) million (2011:(2012: US$26.14.9 million and 2011: US$6.5 million).
23. Trade and other receivables
|
| 12/31/12 |
| 12/31/11 |
| 01/01/11 |
|
|
| USD’000 |
| USD’000 |
| USD’000 |
|
Trade receivables |
| 323,451 |
| 208,054 |
| 255,996 |
|
Allowance for doubtful debts |
| (45,340 | ) | (42,820 | ) | (49,373 | ) |
|
| 278,111 |
| 165,234 |
| 206,623 |
|
Other receivables and refundable deposits |
| 50,100 |
| 35,671 |
| 57,425 |
|
|
| 328,211 |
| 200,905 |
| 264,048 |
|
NOTES TO THE CONSOLIDATED FINANCIAL STATEMENTS
24.Trade and other receivables (continued)
|
| 12/31/13 |
| 12/31/12 |
| 12/31/11 |
|
|
| USD’000 |
| USD’000 |
| USD’000 |
|
Trade receivables |
| 352,872 |
| 323,451 |
| 208,054 |
|
Allowance for doubtful debts |
| (44,643 | ) | (45,340 | ) | (42,820 | ) |
|
| 308,229 |
| 278,111 |
| 165,234 |
|
Other receivables and refundable deposits |
| 71,132 |
| 50,100 |
| 35,671 |
|
|
| 379,361 |
| 328,211 |
| 200,905 |
|
The Company determines credit terms mostly ranging from 30 to 60 days for each customer on a case-by-casecase- by-case basis, based on its assessment of such customer’s financial standing and business potential with the Company.
The Company determines its allowance for doubtful debts based on the Company’s historical experience and the relative aging of receivables as well as individual assessment of certain debtors. The Company’s allowance for doubtful debts excludes receivables from a limited number of customers due to their high credit worthiness. The Company provides allowance for doubtful debts based on recoverable amount by making reference to the age category of the remaining receivables and subsequent settlement. The Company recognized U$US$0.6 million, US$4.6 million and US$0.6 million of allowance for doubtful debts respectively during the year ended December 31, December2013, 2012 and 2011 respectively. The Company reviews, analyzes and adjusts allowance for doubtful debts on a monthly basis.
In evaluating the customers’ credit quality, the Company used an internal system based on each customer’s operation size, listing status, payment history and other qualitative criteria. These criteria are reviewed and updated annually. Based on such evaluation, the Company believes the recoverability of those receivables that are not impaired is reasonably assured.
Trade receivables
Of the trade receivables balance at the end of the year of 2013, 2012 and 2011, US$129.4 million, US$101.1 million and US$71.4 million respectively are due from the Company’s two largest customers.
The following is an aged analysis of trade receivables presented based on the invoice date at the end of the reporting period.
Age of receivables
|
| 12/31/13 |
| 12/31/12 |
| 12/31/11 |
|
|
| USD’000 |
| USD’000 |
| USD’000 |
|
Within 30 days |
| 166,117 |
| 113,955 |
| 66,244 |
|
31—60 days |
| 110,470 |
| 123,618 |
| 77,527 |
|
Over 60 days |
| 76,285 |
| 85,878 |
| 64,283 |
|
Total |
| 352,872 |
| 323,451 |
| 208,054 |
|
NOTES TO THE CONSOLIDATED FINANCIAL STATEMENTS
23.Trade and other receivables (continued)
Trade receivables (continued)
Age of receivables (continued)
Trade receivables disclosed above include amounts (see below for aged analysis) that are past due at the end of the reporting period for which the Company has not recognized an allowance for doubtful debts because there has not been a significant change in credit quality and the amounts are still considered recoverable.
Age of receivables
|
| 12/31/12 |
| 12/31/11 |
| 01/01/11 |
|
| 12/31/13 |
| 12/31/12 |
| 12/31/11 |
|
|
| USD’000 |
| USD’000 |
| USD’000 |
|
| USD’000 |
| USD’000 |
| USD’000 |
|
Current |
| 222,765 |
| 134,958 |
| 174,380 |
|
| 269,740 |
| 222,765 |
| 134,958 |
|
Past due but not impaired |
|
|
|
|
|
|
|
|
|
|
|
|
|
|
Within 30 days |
| 31,219 |
| 26,468 |
| 25,395 |
|
| 24,480 |
| 31,219 |
| 26,468 |
|
31–60 days |
| 16,559 |
| 1,083 |
| 3,033 |
| |||||||
31—60 days |
| 10,068 |
| 16,559 |
| 1,083 |
| |||||||
Over 60 days |
| 7,568 |
| 2,725 |
| 3,815 |
|
| 3,941 |
| 7,568 |
| 2,725 |
|
Total |
| 278,111 |
| 165,234 |
| 206,623 |
|
| 308,229 |
| 278,111 |
| 165,234 |
|
Average overdue days |
| 47 |
| 31 |
| 37 |
|
| 40 |
| 47 |
| 31 |
|
Movement in the allowance for doubtful debts
|
| 12/31/12 |
| 12/31/11 |
|
|
| USD’000 |
| USD’000 |
|
Balance at beginning of the year |
| 42,820 |
| 49,373 |
|
Addition in allowance for doubtful debts |
| 4,615 |
| 551 |
|
Amounts written off during the year as uncollectible |
| — |
| (704 | ) |
Reversal of allowance for doubtful debts |
| (2,095 | ) | (6,400 | ) |
Balance at end of the year |
| 45,340 |
| 42,820 |
|
NOTES TO THE CONSOLIDATED FINANCIAL STATEMENTS
24.Trade and other receivables (continued)
Trade receivables (continued)
Movement in the allowance for doubtful debts (continued)
|
| 12/31/13 |
| 12/31/12 |
| 12/31/11 |
|
|
| USD’000 |
| USD’000 |
| USD’000 |
|
Balance at beginning of the year |
| 45,340 |
| 42,820 |
| 49,373 |
|
Addition in allowance for doubtful debts |
| 617 |
| 4,615 |
| 551 |
|
Amounts written off during the year as uncollectible |
| (101 | ) | — |
| (704 | ) |
Reversal of allowance for doubtful debts |
| (1,213 | ) | (2,095 | ) | (6,400 | ) |
Balance at end of the year |
| 44,643 |
| 45,340 |
| 42,820 |
|
In determining the recoverability of a trade receivable, the Company considers any change in the credit quality of the trade receivable from the date credit was initially granted up to the end of the reporting period.
Included in the allowance for doubtful debts are individually impaired trade receivables amounting to nil (December 31, 2012: nil and December 31, 2011: US$4.6 million) which have been placed under liquidation. The impairment recognized represents the difference between the carrying amount of these trade receivables and the present value of the expected liquidation proceeds. The Company does not hold any collateral over these balances.
Age of impaired trade receivables
|
| 12/31/12 |
| 12/31/11 |
|
| 12/31/13 |
| 12/31/12 |
| 12/31/11 |
|
|
| USD’000 |
| USD’000 |
|
| USD’000 |
| USD’000 |
| USD’000 |
|
Within 30 days |
| 278 |
| 204 |
|
| 192 |
| 278 |
| 204 |
|
31–60 days |
| 855 |
| 53 |
| |||||||
31—60 days |
| 89 |
| 855 |
| 53 |
| |||||
Over 60 days |
| 44,207 |
| 42,563 |
|
| 44,362 |
| 44,207 |
| 42,563 |
|
Total |
| 45,340 |
| 42,820 |
|
| 44,643 |
| 45,340 |
| 42,820 |
|
24. Restricted cash
As of December 31, 2013, 2012 and 2011, restricted cash consisted of US$35.7 million, US$111.6 million and US$46.3 million, respectively of bank time deposits pledged against letters of credit and short-term borrowings, and US$111.9 million, US$106.0 million and US$90.6 million, respectively of government subsidiesfunding received mainly for the reimbursement of research and development expenses to be incurred.
26.25. Shares and issued capital
Fully paid ordinary shares
|
| Number of |
| Share |
| Share |
|
| Number of |
| Share |
| Share |
|
|
| shares |
| capital |
| premium |
|
| shares |
| capital |
| premium |
|
|
|
|
| USD’000 |
| USD’000 |
|
|
|
| USD’000 |
| USD’000 |
|
Balance at January 1, 2011 |
| 27,334,063,747 |
| 10,934 |
| 3,762,146 |
|
| 27,334,063,747 |
| 10,934 |
| 3,762,146 |
|
Issue of shares under the Company’s employee share option plan (see Note 33) |
| 153,612,318 |
| 61 |
| 11,870 |
| |||||||
Issuance of shares under the Company’s employee stock incentive plans (see note 34) |
| 153,612,318 |
| 61 |
| 11,870 |
| |||||||
Balance at December 31, 2011 |
| 27,487,676,065 |
| 10,995 |
| 3,774,016 |
|
| 27,487,676,065 |
| 10,995 |
| 3,774,016 |
|
Issuance of shares under the Company’s employee share option plan (see Note 33) |
| 57,004,448 |
| 23 |
| 3,057 |
| |||||||
Conversion of convertible preferred shares |
| 4,455,459,110 |
| 1,782 |
| 306,515 |
| |||||||
Issuance of shares under the Company’s employee stock incentive plans (see note 34) |
| 57,004,448 |
| 23 |
| 3,057 |
| |||||||
Conversion of convertible preference shares |
| 4,455,459,110 |
| 1,782 |
| 306,515 |
| |||||||
Balance at December 31, 2012 |
| 32,000,139,623 |
| 12,800 |
| 4,083,588 |
|
| 32,000,139,623 |
| 12,800 |
| 4,083,588 |
|
Issuance of shares under the Company’s employee stock incentive plans (see note 34) |
| 112,167,478 |
| 45 |
| 6,641 |
| |||||||
The Company purchased shares of subsidiaries |
| — |
| — |
| (383 | ) | |||||||
Balance at December 31, 2013 |
| 32,112,307,101 |
| 12,845 |
| 4,089,846 |
| |||||||
Fully paid ordinary shares, which have a par value of US$0.0004, carry one vote per share and carry a right to dividends.
NOTES TO THE CONSOLIDATED FINANCIAL STATEMENTS
26.25. Shares and issued capital (continued)
Convertible preferredpreference shares
|
| Number of |
| Share |
| Share |
|
|
| shares |
| capital |
| premium |
|
|
|
|
| USD’000 |
| USD’000 |
|
Balance at January 1, 2011 |
| — |
| — |
| — |
|
Issue of shares |
| 445,545,911 |
| 178 |
| 308,119 |
|
Balance at December 31, 2011 |
| 445,545,911 |
| 178 |
| 308,119 |
|
Converted into ordinary shares |
| (445,545,911 | ) | (178 | ) | (308,119 | ) |
Balance at December 31, 2012 |
| — |
| — |
| — |
|
In June 2011, the Company issued 360,589,053 non-redeemable convertible preferred shares (the “Preferred Shares”) and a warrant (the “CIC Warrant”) to subscribe for up to 72,117,810 preferred shares, to Country Hill Limited, a wholly-owned subsidiary of China Investment Corporation (“CIC”), for an aggregate proceeds of approximately $249US$249 million, net of issuance cost of $0.6US$0.6 million which was deducted from the carrying value of the Preferred Shares.
In September 2011, the Company issued 84,956,858 preferred shares and a Warrant (the “Datang Warrant” and, together with the CIC Warrant, the “Warrant”) to subscribe for up to 16,991,371 preferred shares, to Datang Holdings (Hongkong) Investment Company Limited (“Datang (Hongkong)”Datang”), for aggregate proceeds of approximately $58.9US$58.9 million.
The holders of the preferred shares had the right at any time to convert their preferred shares into fully paid ordinary shares and the preferred shares have been mandatorily converted into ordinary shares at the conversion rate of 10 ordinary shares per convertible preferred share. As of result of the conversion, the Company issued 3,605,890,530 and 849,568,580 ordinary shares to CIC and Datang, (Hongkong), respectively, on June 4, 2012.
The Warrant to subscribe for convertible preferred shares havehas expired without exercise.
Share options schemesStock incentive plans
The Company has adopted the two share option schemesstock incentive plans under which options to subscribe for the Company’s shares have been granted to certain employees, officers and other service providers (Note 33)34).
26. Reserves
Equity-settled employee benefits reserve
|
| 12/31/12 |
| 12/31/11 |
|
|
| USD’000 |
| USD’000 |
|
Balance at beginning of year |
| 37,469 |
| 40,539 |
|
Arising on share-based payments |
| 7,174 |
| 5,336 |
|
Transfer to share premium |
| (2,411 | ) | (8,406 | ) |
Balance at end of year |
| 42,232 |
| 37,469 |
|
NOTES TO THE CONSOLIDATED FINANCIAL STATEMENTS
27.Reserves (continued)
Equity-settled employee benefits reserve (continued)
|
| 12/31/13 |
| 12/31/12 |
| 12/31/11 |
|
|
| USD’000 |
| USD’000 |
| USD’000 |
|
Balance at beginning of year |
| 42,232 |
| 37,469 |
| 40,539 |
|
Arising on share-based payments |
| 16,402 |
| 7,174 |
| 5,336 |
|
Transfer to share premium |
| (3,457 | ) | (2,411 | ) | (8,406 | ) |
Balance at end of year |
| 55,177 |
| 42,232 |
| 37,469 |
|
The above equity-settled employee benefits reserve related to share options and restricted share units (“RSUs”) granted by the Company to its employees and service providers under its employee share option plan.stock incentive plans. Items included in equity- settled employee benefits reserve will not be reclassified subsequently to profit or loss. Further information about share-based payments to employees and service providers is set out in Note 33.34.
Foreign currency translation reserve
Items that may be reclassified subsequently to profit or loss
|
| 12/31/12 |
| 12/31/11 |
|
| 12/31/13 |
| 12/31/12 |
| 12/31/11 |
|
|
| USD’000 |
| USD’000 |
|
| USD’000 |
| USD’000 |
| USD’000 |
|
Balance at beginning of year |
| 3,846 |
| (1,092 | ) |
| 3,916 |
| 3,846 |
| (1,092 | ) |
Exchange differences arising on translating the foreign operations |
| 70 |
| 4,938 |
|
| 731 |
| 70 |
| 4,938 |
|
Deconsolidation of subsidiaries |
| (94 | ) | — |
| — |
| |||||
Balance at end of year |
| 3,916 |
| 3,846 |
|
| 4,553 |
| 3,916 |
| 3,846 |
|
Exchange differences relating to the translation of the results and net assets of the Company’s foreign operations from their functional currencies to the Company’s presentation currency (i.e. United States dollars) are recognized directly in other comprehensive income and accumulated in the foreign currency translation reserve. Exchange differences previously accumulated in the foreign currency translation reserve (in respect of translating both the net assets of foreign operations and hedges of foreign operations) are reclassified to profit or loss on the disposaldisposal/deconsolidation of the foreign operation.
28.Convertible bonds equity reserve
12/31/13 | |||
USD’000 | |||
Balance at beginning of year | — | ||
Recognition of the equity component of convertible bonds | 15,210 | ||
Balance at end of year | 15,210 |
NOTES TO THE CONSOLIDATED FINANCIAL STATEMENTS
27. Accumulated deficit
As stipulated by the relevant laws and regulations applicable to China’s foreign investment enterprise, the Company’s PRC subsidiaries are required or allowed to make appropriations to non-distributable reserves. The general reserve fund requires annual appropriation of 10% of after tax profit (as determined under accounting principles generally accepted in the PRC at each year-end), after offsetting accumulated losses from prior years, until the accumulative amount of such reserve fund reaches 50% of registered capital of the relevant subsidiaries. The general reserve fund can only be used to increase the registered capital and eliminate future losses of the relevant subsidiaries under PRC regulations. The staff welfare and bonus reserve is determined by the board of directors of the respective PRC subsidiaries and used for the collective welfare of the employee of the subsidiaries. The enterprise expansion reserve is for the expansion of the subsidiaries’ operations and can be converted to capital subject to approval by the relevant authorities. These reserves represent appropriations of the retained earnings determined in accordance with Chinese law. In 20122013 the Company did not make any appropriation to non-distributable reserves. As of December 31, 2013, 2012 and 2011, the accumulated non-distributable reserve was US$30 million, US$30 million and US$30 million respectively.
In addition, due to restrictions on the distribution of paid-in capital from the Company’s PRC subsidiaries, the PRC subsidiaries’ paid-in capital of US$3,4123,744 million at December 31, 20122013 is considered restricted.
NOTES TO THE CONSOLIDATED FINANCIAL STATEMENTS
28.Accumulated deficit (continued)
As a result of these PRC laws and regulations, as of December 31, 2012,2013, reserve and capital of approximately US$3,4423,774 million was not available for distribution to the Company by its PRC subsidiaries in the form of dividends, loans or advances.
In 2013, 2012 and 2011 the Company did not declare or pay any cash dividends on the ordinary shares.
BorrowingsTable of Contents
|
| 12/31/12 |
| 12/31/11 |
| 01/01/11 |
|
|
| USD’000 |
| USD’000 |
| USD’000 |
|
At amortized cost |
|
|
|
|
|
|
|
Short-term commercial bank loans (i) |
| 383,225 |
| 607,427 |
| 372,055 |
|
|
| 383,225 |
| 607,427 |
| 372,055 |
|
Long-term debt by contracts |
|
|
|
|
|
|
|
Shanghai USD & RMB loan |
| — |
| — |
| 110,271 |
|
Beijing USD syndicate loan (ii) |
| — |
| 180,084 |
| 290,062 |
|
EUR loan (iii) |
| — |
| 8,271 |
| 25,422 |
|
Tianjin USD syndicate loan |
| — |
| — |
| 86,300 |
|
Beijing USD & RMB loan (iv) |
| 49,079 |
| 48,838 |
| — |
|
Shanghai USD loan (v) |
| 68,500 |
| 26,523 |
| — |
|
Shanghai EXIM70M loan (vi) |
| 70,000 |
| — |
| — |
|
Shanghai 268M syndicate loan (vii) |
| 245,611 |
| — |
| — |
|
Beijing EXIM20M loan (viii) |
| 20,000 |
| — |
| — |
|
Beijing 600M syndicate loan (ix) |
| 260,000 |
| — |
| — |
|
|
| 713,190 |
| 263,716 |
| 512,055 |
|
Less: current maturities of long-term debt |
| 184,578 |
| 191,355 |
| 333,459 |
|
Non-current maturties of long-term debt |
| 528,612 |
| 72,361 |
| 178,596 |
|
Borrowing by repayment schedule: |
|
|
|
|
|
|
|
Within 1 year |
| 567,803 |
| 798,782 |
| 705,514 |
|
Within 1–2 years |
| 309,000 |
| 72,361 |
| 178,596 |
|
Within 2–5 years |
| 219,612 |
| — |
| — |
|
|
| 1,096,415 |
| 871,143 |
| 884,110 |
|
28. Borrowings
|
| 12/31/13 |
| 12/31/12 |
| 12/31/11 |
|
|
| USD’000 |
| USD’000 |
| USD’000 |
|
At amortized cost |
|
|
|
|
|
|
|
Short-term commercial bank loans (i) |
| 219,727 |
| 383,225 |
| 607,427 |
|
|
| 219,727 |
| 383,225 |
| 607,427 |
|
Long-term debt by contracts |
|
|
|
|
|
|
|
Beijing USD syndicate loan |
| — |
| — |
| 180,084 |
|
EUR loan |
| — |
| — |
| 8,271 |
|
Shanghai EXIM69M USD loan (ii) |
| — |
| 68,500 |
| 26,523 |
|
Shanghai EXIM70M loan (iii) |
| — |
| 70,000 |
| — |
|
Shanghai 268M syndicate loan (iv) |
| 201,000 |
| 245,611 |
| — |
|
Shanghai 470M syndicate loan (v) |
| 260,000 |
| — |
| — |
|
Beijing USD & RMB loan (vi) |
| — |
| 49,079 |
| 48,838 |
|
Beijing EXIM20M loan (vii) |
| — |
| 20,000 |
|
|
|
Beijing USD syndicate loan (viii) |
| 260,000 |
| 260,000 |
| — |
|
Beijing EXIM40/60M loan (ix) |
| 40,000 |
| — |
| — |
|
Beijing CIC Entrust loan (x) |
| 10,795 |
| — |
| — |
|
|
| 771,795 |
| 713,190 |
| 263,716 |
|
Less: current maturities of long-term debt |
| 170,820 |
| 184,578 |
| 191,355 |
|
Non-current maturities of long-term debt |
| 600,975 |
| 528,612 |
| 72,361 |
|
Borrowing by repayment schedule: |
|
|
|
|
|
|
|
Within 1 year |
| 390,547 |
| 567,803 |
| 798,782 |
|
Within 1–2 years |
| 209,965 |
| 309,000 |
| 72,361 |
|
Within 2–5 years |
| 367,990 |
| 219,612 |
| — |
|
Over 5 years |
| 23,020 |
| — |
| — |
|
|
| 991,522 |
| 1,096,415 |
| 871,143 |
|
Summary of borrowing arrangements
(i) As of December 31, 2012,2013, the Company had 2928 short-term credit agreements that provided total credit facilities of up to US$11.1 billion on a revolving credit basis. As of December 31, 2012,2013, the Company had drawn down US$383.2219.7 million under these credit agreements and US$629.3927.5 million was available for future trading and borrowings. The outstanding borrowings under the credit agreements are unsecured, except for $129US$18.2 million, which is secured by time deposits of US$108.4 million, and an additional balance of US$5.9 million, which is secured by real property with an original cost of US$2.129.1 million. The interest expense incurred in 2012 was US$22.2 million of which US$8.6 million was capitalized as additions to assets under construction. The interest rate ranged from 1.01%0.31% to 7.2%6.69% in 2012.2013.
F-68(ii)In April 2011, Semiconductor Manufacturing International (Shanghai) Corporation (“SMIS”) entered into the Shanghai EXIM Bank USD loan I, a new two-year loan facility in the principal amount of US$69.5 million with The Export-Import Bank of China. This two-year bank facility was used to finance the planned expansion for SMIS’s 12-inch fab. SMIS repaid the outstanding balance in advance by August 2013. As of December 31, 2013, SMIS had no outstanding balance of the facility. The interest rate ranged from 4.0 % to 5.0% during 2013.
NOTES TO THE CONSOLIDATED FINANCIAL STATEMENTS
29.28. Borrowings (continued)
Summary of borrowing arrangements (continued)
(ii)(iii) In May 2005, Semiconductor Manufacturing International (Beijing) Corporation (“SMIB”)October 2012, SMIS entered into the BeijingShanghai EXIM Bank USD syndicate loan II, a five-yeartwo-year loan facility in the principal amount of US$70 million with The Export-Import Bank of China, which was secured by certain equipment of SMIS. This two-year bank facility was used to finance the planned expansion for SMIS’s 12-inch fab. SMIS repaid the outstanding balance in advance by August 2013. As of December 31, 2013, SMIS had no outstanding balance of the facility. The interest rate ranged from 4.0 % to 5.0% during 2013.
(iv)In March 2012, SMIS entered into a loan facility in the aggregate principal amount of US$600268 million from a consortium of international and Chinese banks. This three-year bank facility was used to finance the working capital for SMIS’s 8-inch fab. The facility was secured by the manufacturing equipment located in the SMIS 8-inch fabs, buildings and land use right of SMIS. As of December 31, 2013, SMIS had drawn down US$268 million and repaid US$67 million on this loan facility. The outstanding balance of US$201 million is repayable by March 2015. The interest rate on this loan facility ranged from 3.6% to 4.2% in 2013. The Shanghai USD syndicate loan contains covenants to maintain certain minimum coverage ratio. SMIS was in compliance with these covenants as of December 31, 2013.
(v)In August 2013, SMIS entered into a loan facility in the aggregate principal amount of US$470 million, with a syndicate of financial institutions based in the PRC. This seven-year bank facility was used to finance the planned expansion for SMIS’s 12-inch fab. The principal amountfacility was repayable starting fromsecured by the manufacturing equipment located in the SMIS 12-inch fabs and buildings of SMIS. As of December 2007 in six equal semi-annual installments. On June 26, 2009, SMIB amended the syndicated loan agreement to defer the commencement of the three remaining semi-annual payments to December 28, 2011.31, 2013, SMIS had drawn down US$260 million. The amendment includes a provision for mandatory early repayment of a portion of the outstanding balance if SMIB’s financial performance exceeds certain pre-determined benchmarks. The amendment was accounted for as a modification as the terms of the amended instrument were not substantially differentUS$260 million is repayable from the original terms. SMIB made the repayment of remaining outstanding borrowing US$180.1 million in 2012.August 2015 to February 2018. The interest rate on this loan facility ranged from 2.94%4.3% to 2.99%. The interest expense incurred4.9% in 2012 was US$4.1 million, of which US$1.0 million was capitalized as part of the costs of assets under construction in 2012.2013.
In May 2012, SMIS entered into a four-year strategic framework credit facility in the aggregate amount of RMB5 billion with China Development Bank. The Beijing USD syndicateabove loan contained covenants to maintain minimum cash flows as a percentageconstituted part of non-cash expenses and to limit total liabilities, excluding shareholder loans, as a percentage of total assets. SMIB was in compliance with these covenants as of December 31, 2011. The loan has been fully repaid during 2012.this strategic framework credit facility.
(iii)On December 15, 2005, the Company entered into a EUR denominated long-term loan facility agreement in the aggregate principal amount of EUR85 million (equivalent to approximately US$105 million) with ABN Amro Bank N.V., Shanghai Branch. The drawdown period of the facility ended on the earlier of (i) thirty six months after the execution of the agreement or (ii) the date which the loans have been fully drawn down. Each draw-down made under the facility was repaid in full by the Company in ten equal semi-annual installments. In May and June 2012, SMIS repaid the remaining balance of EUR6.4 million. The interest rate ranged from 2.6% to 4.7% in 2012. The interest expense incurred in 2012 was US$0.23 million of which US$0.09 million was capitalized as part of the costs of assets under construction in 2012.
The loan has been fully repaid during 2012.
(iv)(vi) In September 2011, SMIBSemiconductor Manufacturing International (Beijing) Corporation (“SMIB”) entered into the USD and RMB Loan, a two-year loan facility in the principal amount of US$25 million and RMB150 million (approximately US$24 million) with The Export-Import Bank of China. This two-year bank facility was used for working capital purposes. SMIB repaid the outstanding balance in advance by June 2013. As of December 31, 2012,2013, SMIB had drawn down US$25 million & RMB150 million on this loanno outstanding balance of the facility. The principal amount is repayable in September 2013. The interest rate on this loan facility ranged from 6.15%6.1% to 6.65%6.5% in 2012. The interest expense incurred in 2012 was US$3.2 million, of which US$0.7 million was capitalized as part of the costs of assets under construction in 2012.2013.
The total outstanding balance of this USD & RMB Loan is secured by SMIB’s plant and equipment with an original cost of US$132.3 million as of December 31, 2012 (US$132.3 million as of December 31, 2011).
NOTES TO THE CONSOLIDATED FINANCIAL STATEMENTS
29.28. Borrowings (continued)
Summary of borrowing arrangements (continued)
(v)In April 2011, SMIS entered into the Shanghai EXIM Bank USD loan I, a new two-year loan facility in the principal amount of $69.5 million with The Export-Import Bank of China. This two-year bank facility was used to finance the planned expansion for SMIS’s 12-inch fab. As of December 31, 2012, SMIS had drawn down US$69.5 million and repaid US$1 million. The principal amount of $68.5 million will be repayable in June, 2013. The interest rate ranged from 4.40% to 4.79% during 2012. The interest expense incurred in 2012 was US$3.4 million, of which US$1.1 million was capitalized as part of the costs of assets under construction in 2012.
The total outstanding balance of the facilities is secured by certain equipment of SMIS with an original cost of US$ 99.6 million as of December 31, 2012 (US$38.6 million as of December 31, 2011). The Shanghai EXIM Bank USD loan contains covenants to maintain certain minimum coverage ratio. SMIS was in compliance with these covenants as of December 31, 2012 and 2011 respectively.
(vi)In October 2012, SMIS entered into the Shanghai EXIM Bank USD loan II, a new two-year loan facility in the principal amount of US$70 million with The Export-Import Bank of China, which is secured by certain equipment of SMIS. This two-year bank facility was used to finance the planned expansion for SMIS’s 12-inch fab. As of December 31, 2012, SMIS had drawn down US$70 million. The principal amount of $70 million will be repayable in October 2014. The interest rate is 4.55%. The interest expense incurred in 2012 was US$0.4 million, of which US$0.1 million was capitalized as part of the costs of assets under construction in 2012.
The Shanghai EXIM Bank USD loan II contains covenants to maintain certain minimum coverage ratio. SMIS was in compliance with these covenants as of December 31, 2012.
(vii)In March 2012, SMIS entered into a loan facility in the aggregate principal amount of US$268 million from a consortium of international and Chinese banks. This three-year bank facility is used to finance the working capital for SMIS’s 8-inch fab. The facility is secured by the manufacturing equipment located in the SMIS 8-inch fabs, buildings and land use right of SMIS. As of December 31, 2012, SMIS had drawn down US$245.6 million, on this loan facility. The principal amount is repayable from September 2013 to March 2015. The interest rate on this loan facility ranged from 4.03% to 4.24% in 2012. The interest expense incurred in 2012 was US$7.9 million, of which US$2.4 million was capitalized as part of the costs of assets under construction in 2012. The Shanghai USD syndicate loan contains covenants to maintain certain minimum coverage ratio. SMIS was in compliance with these covenants as of December 31, 2012.
(viii) In March 2012, SMIB entered into the new USD Loan, a two-year working capital loan facility in the principal amount of US$30 million with the Export-Import Bank of China, which iswas unsecured. This two-year bank facility was used for working capital purpose. SMIB repaid the outstanding balance of US$20 million in advance by August 2013. As of December 31, 2012,2013, SMIB had drawn down US$20 million on this loanno outstanding balance of the facility. The principal amount is repayable in March 2014. The interest rate on this loan facility ranged from 6.46%6.2% to 6.54%6.5% in 2012. The interest expense incurred in 2012 was US$1 million, of which US$0.2 million was capitalized as part of the costs of assets under construction in 2012.2013.
NOTES TO THE CONSOLIDATED FINANCIAL STATEMENTS
29.Borrowings (continued)
Summary of borrowing arrangements (continued)
(ix)(viii) In March 2012, SMIB entered into the Beijing USD syndicate loan, a seven-year loan facility in the aggregate principal amount of $600US$600 million, with a syndicate of financial institutions based in the PRC. This seven-year bank facility was used to expand the capacity of SMIB’s 12 inch fabs. The facility iswas secured by the manufacturing equipment located in the SMIB and SMIT fabs, and 100% equity pledge of SMIB and SMIT. On September 26, 2013, SMIB and the syndicate amended the loan facility amount to US$260 million. As of December 31, 2012,2013, SMIB had drawn down US$260 million on this loan facility which is repayable from March 2014 to March 2016.2019. The interest rate on this loan facility ranged from 6.16%5.8% to 6.24%6.2% in 2012.2013. The interest expense incurred in 2012 was US$12.2 million, of which US$2.3 million was capitalizedBeijing USD syndicate loan contains as part of the costs of assets under construction in 2012. The Beijing USD syndicate loan contains covenants to maintain certain minimum coverage ratio. SMIB was in compliance with these covenants as of December 31, 2012.2013.
(ix)In June 2013, SMIB entered into the new USD Loan, a twenty-six-months working capital loan facility in the principal amount of US$60 million with The Export-Import Bank of China, which was unsecured. This twenty-six-months bank facility was used for working capital purposes. As of December 31, 2013, SMIB had drawn down US$40 million on this loan facility. The principal amount is repayable in August 2015. The interest rate on this loan facility ranged from 3% to 4% in 2013.
(x)In June 2013, SMIB entered into the new RMB Loan, a two-year working capital entrust loan facility in the principal amount of RMB70 million (approximately US$11.5 million) with China Investment Development Corporation through China CITIC Bank, which was unsecured. This two- year entrust loan facility was used for working capital purposes. As of December 31, 2013, SMIB had drawn down RMB70 million (approximately US$11.5 million) and repaid RMB4.5 million (approximately US$0.7 million) on this loan facility. The outstanding balance of RMB65.5 million (approximately US$10.8 million) is repayable in June 2015. The interest rate on this loan facility was 12% in 2013.
As of December 31, 2013, property, plant and equipment and land use right with carrying amount of approximately US$1,007 million (2012: US$1,070 million and 2011: US$482 million) have been pledged to secure borrowings of the Company.
NOTES TO THE CONSOLIDATED FINANCIAL STATEMENTS
29.Convertible bonds
The Company issued convertible bonds at a par value of US$200,000 each with an aggregate principal amount of US$200,000,000 on November 7, 2013.
The principal terms of the bonds are as follows:
(1)Denomination of the bonds — The convertible bonds are denominated in USD.
(2)Maturity date — Five years from the date of issuance, which is November 7, 2018 (“Maturity Date”)
(3)Interest — The bonds do not bear any cash interest.
(4)Conversion —
a)Conversion price — The price is HK$0.7965 per each new share to be issued upon conversion of the bonds (“Conversion Share”), subject to anti-dilutive adjustment in accordance with the terms of the bonds, including subdivision, reclassification or consolidation of shares of the Company, capitalisation of profits or reserves, capital distribution, issuance of options or rights, and certain other events.
b)Conversion period — The Bondholder has the right to convert the bonds into shares at any time on or after December 18, 2013 up to the close of business on the date falling seven days prior to the Maturity Date or if such bonds shall have been called or put for redemption at any time before the Maturity Date, then up to the close of business on a date no later than seven days prior to the date fixed for redemption, which is discussed below.
c)Number of Conversion Shares issuable — 1,946,817,325 Conversion Shares will be issued upon full conversion of the bonds based on the initial conversion price of HK$0.7965 (translated at the fixed exchange rate of HK$7.7532 = US$1.0 as pre-determined).
(5)Redemption —
a)At the option of the Company:
(I)Redemption at maturity — The Company will redeem the bonds outstanding at principal amount on the Maturity Date.
(II)Redemption for tax reasons — The Company will redeem all and not only some of the Bonds at their principal amount, at its option, at any time, on giving not less than 30 nor more than 60 days’ notice to the Bondholders on the date specified in the Tax Redemption Notice.
29.Convertible bonds (continued)
(5)(continued)
a)(continued)
(III)Redemption at the Option — The Company may redeem all and not only some of the Bonds on the date specified in the Option Redemption Notice at their principal amount at any time after November 7, 2015, provided that the Closing Price of a Share at least 120 percent of the Conversion Price then in effect immediately prior to the date upon which notice of such redemption is given. If at any time the aggregate principal amount of the Bonds outstanding is less than 10% of the aggregate principal amount originally issued, the Issuer may redeem all and not only some of such outstanding Bonds at their principal amount.
b)At the option of the Bondholder:
(I)Redemption on change of control — Upon the occurrence of a Change of Control, the Bondholder will have the right, at such holder’s option, to require the Company to redeem all or some only of such holder’s bonds on the Change of Control put date at their principal amount of the bonds.
(II)Redemption at the option — The holders of each Bond will have the right at such holder’s option, to require the Issuer to redeem all or some only of the Bonds of such holder on the Optional Put Date (on November 7, 2016) at their principal amount.
(6)Purchase — The Issuer or any of their respective Subsidiaries may, subject to applicable laws and regulations, at any time and from time to time purchase Bonds at any price in the open market or otherwise.
(7)Cancellation — All Bonds which are redeemed, converted or purchased by the Issuer or any of its Subsidiaries, will forthwith be cancelled. Certificates in respect of all Bonds cancelled will be forwarded to or to the order of the Registrar and such Bonds may not be reissued or resold.
The convertible bonds issued at November 7, 2013 is a compound instrument that included a liability component, an equity component and an embedded derivative in respect of the early redemption feature of the convertible bonds. The embedded derivative in respect of the early redemption feature of the convertible bonds is deemed to be clearly and closely related to the host contract and therefore, does not need to be separately recorded. The fair value of the liability component of the convertible bonds was approximately US$179.4 million and the equity component was approximately US$15.2 million, determined by deducting the amount of the liability component from the fair value of the compound instrument as a whole.
USD’000 | |||
Principal amount | 200,000 | ||
Transaction cost | (5,400 | ) | |
Liability component at the date of issue | 179,390 | ||
Equity component | 15,210 |
NOTES TO THE CONSOLIDATED FINANCIAL STATEMENTS
29.Convertible bonds (continued)
Subsequent to the initial recognition, the liability component of the convertible bonds was carried at amortized cost using the effective interest method. The effective interest rate of the liability component of the convertible bonds was 3.69% per annum. The movement of the liability component of the convertible bonds for the year ended December 31, 2013 is set out below:
USD’000 | |||
Liability component at the date of issue | 179,390 | ||
Interest charged | 1,173 | ||
Liability component at December 31, 2013 | 180,563 |
The equity component will remain in convertible bond equity reserve until the embedded conversion option is exercised or the bonds mature.
On December 18, 2013, the Company entered into a subscription agreement (“Datang Subscription Agreement”) with Datang Holdings (Hongkong) Investment Company Limited (“Datang”), a substantial shareholder of the Company. Pursuant to the Datang Subscription Agreement, the Company conditionally agreed to issue and Datang conditionally agreed to subscribe for the zero coupon convertible bonds due 2018 in an aggregate principal amount of US$54,600,000 (“Datang Pre-emptive Bonds”) upon the exercise of the pre-emptive rights as specified in the share purchase agreement dated November 6, 2008 entered into between the Company and Datang Telecom Technology & Industry Holdings Co., Ltd. (“Datang Telecom”) which holds 100% equity interests of Datang.
On December 18, 2013, the Company also entered into a subscription agreement (“Country Hill Subscription Agreement”) with Country Hill Limited (“Country Hill”), a substantial shareholder of the Company. Pursuant to the Country Hill Subscription Agreement, the Company conditionally agreed to issue and Country Hill conditionally agreed to subscribe for the zero coupon convertible bonds due 2018 in an aggregate principal amount of US$32,200,000 (“Country Hill Pre-emptive Bonds”) upon the exercise of the pre-emptive rights by Country Hill under the share subscription agreement dated April 18, 2011 entered into between the Company and Country Hill.
As each of Datang and Country Hill is a substantial shareholder of the Company, the execution of the Datang Subscription Agreement and the Country Hill Subscription Agreement as well as the transactions contemplated thereunder (including the issue of the Datang Pre-emptive Bonds and the Country Hill Pre-emptive Bonds and the allotment and issue of any Ordinary Shares on conversion of any Datang Pre-emptive Bonds and Country Hill Pre-emptive Bonds) constituted non-exempt connected transactions of the Company under Chapter 14A of the Hong Kong Stock Exchange Listing Rules, and were subsequently approved by the independent shareholders at the extraordinary general meeting of the Company held on February 17, 2014.
The net proceeds (net of fees and expenses) from the issue of the Datang Pre-emptive Bonds and the issue of the Country Hill Pre-emptive Bonds will be approximately US$54,600,000 and US$32,200,000, respectively. The completion of the issue of the Datang Pre-emptive Bonds and the Country Hill Pre- emptive Bonds is expected to take place on a date no later than May 30, 2014.
30. Trade and other payables
|
| 12/31/12 |
| 12/31/11 |
| 01/01/11 |
|
| 12/31/13 |
| 12/31/12 |
| 12/31/11 |
|
|
| USD’000 |
| USD’000 |
| USD’000 |
|
| USD’000 |
| USD’000 |
| USD’000 |
|
Trade payables |
| 331,394 |
| 280,691 |
| 515,577 |
|
| 285,967 |
| 331,394 |
| 280,691 |
|
Advance receipts from customers |
| 67,108 |
| 68,660 |
| 22,795 |
|
| 41,164 |
| 67,108 |
| 68,660 |
|
Deposit received from customer |
| 10,591 |
| 5,631 |
| 64,445 |
| |||||||
Deposit received from customers |
| 48,976 |
| 10,591 |
| 5,631 |
| |||||||
Other payable |
| 14,859 |
| 20,766 |
| 11,238 |
|
| 17,783 |
| 14,859 |
| 20,766 |
|
|
| 423,952 |
| 375,748 |
| 614,055 |
|
| 393,890 |
| 423,952 |
| 375,748 |
|
Trade payables are non-interest bearing and are normally settled on 30-day to 60-day terms.
The following is an aged analysis of accounts payable presented based on the invoice date at the end of the reporting period.
|
| 12/31/13 |
| 12/31/12 |
| 12/31/11 |
|
|
| USD’000 |
| USD’000 |
| USD’000 |
|
Within 30 days |
| 214,219 |
| 252,097 |
| 169,315 |
|
Between 31 to 60 days |
| 20,295 |
| 49,735 |
| 30,909 |
|
Over 60 days |
| 51,453 |
| 29,562 |
| 80,467 |
|
|
| 285,967 |
| 331,394 |
| 280,691 |
|
An agingaged analysis of the accounts payable is as follows:
|
| 12/31/12 |
| 12/31/11 |
| 01/01/11 |
|
| 12/31/13 |
| 12/31/12 |
| 12/31/11 |
|
|
| USD’000 |
| USD’000 |
| USD’000 |
|
| USD’000 |
| USD’000 |
| USD’000 |
|
Current |
| 275,398 |
| 194,434 |
| 429,831 |
|
| 237,337 |
| 275,398 |
| 194,434 |
|
Overdue: |
|
|
|
|
|
|
|
|
|
|
|
|
|
|
Within 30 days |
| 26,783 |
| 42,278 |
| 42,087 |
|
| 9,493 |
| 26,783 |
| 42,278 |
|
Between 31 to 60 days |
| 10,652 |
| 16,327 |
| 8,541 |
|
| 12,299 |
| 10,652 |
| 16,327 |
|
Over 60 days |
| 18,561 |
| 27,652 |
| 35,118 |
|
| 26,838 |
| 18,561 |
| 27,652 |
|
|
| 331,394 |
| 280,691 |
| 515,577 |
|
| 285,967 |
| 331,394 |
| 280,691 |
|
NOTES TO THE CONSOLIDATED FINANCIAL STATEMENTS
31.Accrued liabilities
The amounts of accrued liabilities as of December 31, 2013, 2012 and 2011 were US$153.9 million, US$84.6 million and US$45.7 million, within which the amounts of accrued payroll expenses were US$55.5 million, US$21.4 million and US$9.4 million, respectively.
32. Promissory notes
In 2009, the Company reached a new settlement with Taiwan Semiconductor Manufacturing Corporation (“TSMC”). Under this agreement, the remaining promissory note of US$40.0 million under the prior 2005 Settlement Agreement was cancelled. The Company issued twelve non-interest bearing promissory notes with an aggregate amount of US$200.0 million as the settlement consideration. The Company has recorded a discount of US$8.1 million for the imputed interest on the notes using an effective interest rate of 2.85% (which represents the Company’s average rate of borrowing for 2009), which was recorded as a reduction of the face amount of the promissory notes. In total, the Company paid TSMC US$30.0 million and US$30.0 million in 2013 and 2012, respectively. There are no remaining promissory notes to be paid as of December 31, 2013 and the outstanding promissory notes as of December 31, 2012 and 2011 respectively. The outstanding promissory notes are as follows:
|
|
|
| 12/31/12 |
|
| 31/12/12 |
| ||
|
|
|
| Discounted |
|
|
|
| Discounted |
|
|
| Face value |
| Value |
|
| Face value |
| Value |
|
|
| USD’000 |
| USD’000 |
|
| USD’000 |
| USD’000 |
|
Maturity |
|
|
|
|
|
|
|
|
|
|
2013–Current |
| 30,000 |
| 29,374 |
| |||||
2013-Current |
| 30,000 |
| 29,374 |
| |||||
|
| 30,000 |
| 29,374 |
|
| 30,000 |
| 29,374 |
|
|
| 31/12/11 |
| ||
|
|
|
| Discounted |
|
|
| Face value |
| Value |
|
|
| USD’000 |
| USD’000 |
|
Maturity |
|
|
|
|
|
2012-Current |
| 30,000 |
| 29,374 |
|
Non-current |
| 30,000 |
| 28,560 |
|
|
| 60,000 |
| 57,934 |
|
F-7233.Other financial liabilities
|
| 12/31/13 |
| 12/31/12 |
| 12/31/11 |
|
|
| USD’000 |
| USD’000 |
| USD’000 |
|
Derivatives carried at fair value through profit or loss (FVTPL) |
|
|
|
|
|
|
|
Foreign currency forward contracts |
| — |
| 25 |
| 816 |
|
Interest rate swaps |
| — |
| — |
| 405 |
|
Cross-currency interest rate swaps |
| — |
| — |
| 462 |
|
|
| — |
| 25 |
| 1,683 |
|
NOTES TO THE CONSOLIDATED FINANCIAL STATEMENTS
32.Other financial liabilities
|
| 12/31/12 |
| 12/31/11 |
| 01/01/11 |
|
|
| USD’000 |
| USD’000 |
| USD’000 |
|
Derivatives carried at fair value through profit or loss (FVTPL) |
|
|
|
|
|
|
|
Foreign currency forward contracts |
| 25 |
| 816 |
| 480 |
|
Interest rate swaps |
| — |
| 405 |
| 1,380 |
|
Cross-currency interest rate swaps |
| — |
| 462 |
| 1,292 |
|
|
| 25 |
| 1,683 |
| 3,152 |
|
33.34. Share-based payments
Employee Stock Option Plansincentive plans
The Company’s employee stock optionincentive plans (the “Plans”) allow the Company to offer a variety of incentive awards to employees, consultants or external service advisors of the Company.
Stock option plan
The options are granted at the fair market value of the Company’s ordinary shares and expire 10 years from the date of grant and vest over a requisite service period of four years.
The fair value of each option granted is estimated on the date of grant using the Black-Scholes option pricing model, taking into account the terms and conditions upon which the share options were granted.
Restricted share units (“RSUs”)
The Company adopted the Equity Incentive Plan (“EIP”) whereby the Company provided additional incentives to the Company’s employees, directors and external consultants through the issuance of restricted shares, restricted share units and stock appreciation rights to the participants at the discretion of the Board of Directors. The RSUs vest over a requisite service period of 4 years and expire 10 years from the date of grant.
The fair value of each option granted is estimated on the date of grant using the Black-Scholes option pricing model, taking into account the terms and conditions upon which the instruments were granted.
The expense recognized for employee services received during the year is shown in the following table:
|
| Year ended |
| Year ended |
|
|
| 12/31/12 |
| 12/31/11 |
|
|
| USD’000 |
| USD’000 |
|
Expense arising from equity-settled share-based payment transactions |
| 7,174 |
| 5,336 |
|
NOTES TO THE CONSOLIDATED FINANCIAL STATEMENTS
33.Share-based payments (continued)
|
| Year ended |
| Year ended |
| Year ended |
|
|
| 12/31/13 |
| 12/31/12 |
| 12/31/11 |
|
|
| USD’000 |
| USD’000 |
| USD’000 |
|
Expense arising from equity-settled share-based payment transactions |
| 16,402 |
| 7,174 |
| 5,336 |
|
Movements during the year
(i) �� The following table illustrates the number and weighted average exercise prices (WAEP) of, and movements in, share options during the year (excluding RSUs):
|
| 2012 |
| 2012 |
| 2011 |
| 2011 |
|
| 2013 |
| 2013 |
| 2012 |
| 2012 |
| 2011 |
| 2011 |
| |||||
|
| Number |
| WAEP |
| Number |
| WAEP |
|
| Number |
| WAEP |
| Number |
| WAEP |
| Number |
| WAEP |
| |||||
Outstanding at January 1 |
| 1,230,938,429 |
| US$ | 0.10 |
| 1,317,679,526 |
| US$ | 0.11 |
|
| 1,285,367,372 |
| US$ | 0.09 |
| 1,230,938,429 |
| US$ | 0.10 |
| 1,317,679,526 |
| US$ | 0.11 |
|
Granted during the year |
| 292,084,956 |
| US$ | 0.04 |
| 321,290,693 |
| US$ | 0.07 |
|
| 270,695,247 |
| US$ | 0.08 |
| 292,084,956 |
| US$ | 0.04 |
| 321,290,693 |
| US$ | 0.07 |
|
Cancelled during the year |
| (209,218,313 | ) | US$ | 0.09 |
| (332,650,148 | ) | US$ | 0.11 |
| ||||||||||||||||
Forfeited and expired during the year |
| (158,907,830 | ) | US$ | 0.11 |
| (209,218,313 | ) | US$ | 0.09 |
| (332,650,148 | ) | US$ | 0.11 |
| |||||||||||
Exercised during the year |
| (28,437,700 | ) | US$ | 0.02 |
| (75,381,642 | ) | US$ | 0.05 |
|
| (76,770,936 | ) | US$ | 0.04 |
| (28,437,700 | ) | US$ | 0.02 |
| (75,381,642 | ) | US$ | 0.05 |
|
Outstanding at December 31 |
| 1,285,367,372 |
| US$ | 0.09 |
| 1,230,938,429 |
| US$ | 0.10 |
|
| 1,320,383,853 |
| US$ | 0.09 |
| 1,285,367,372 |
| US$ | 0.09 |
| 1,230,938,429 |
| US$ | 0.10 |
|
Exercisable at December 31 |
| 457,250,416 |
| US$ | 0.12 |
| 465,796,149 |
| US$ | 0.12 |
|
| 483,679,899 |
| US$ | 0.11 |
| 457,250,416 |
| US$ | 0.12 |
| 465,796,149 |
| US$ | 0.12 |
|
The weighted average remaining contractual life for the share options outstanding as at December 31, 20122013 was 6.58 years (2012: 6.61 years (2011:and 2011: 6.67 years).
The range of exercise prices for options outstanding at the end of the year was US$0.02 to US$0.35 (2011:(2012: US$0.02 to US$0.35 and 2011: US$0.01 to US$0.35).
NOTES TO THE CONSOLIDATED FINANCIAL STATEMENTS
34.Share-based payments (continued)
Movements during the year (continued)
(i)(continued)
The weighted average closing price of the Company’s shares immediately before the dates on which the share options were exercised was US$0.07 (2012: US$0.04 and 2011: US$0.09).
During the year ended December 31, 2013, share options were granted on May 7, 2013, June 11, 2013, June 17, 2013, September 6, 2013 and November 4, 2013. The fair values of the options determined at the dates of grant using the Black-Scholes Option Pricing model were US$0.04, US$0.04, US$0.04, US$0.04 and US$0.03, respectively.
During the year ended December 31, 2012, share options were granted on May 22, 2012, September 12, 2012 and November 15, 2012. The fair values of the options determined at the dates of grant using the Black-Scholes Option Pricing model were US$0.02, US$0.02 and US$0.03, respectively.
During the year ended December 31, 2011, share options were granted on May 31, 2011, September 8, 2011 and November 17, 2011. The fair values of the options determined at the dates of grant using the Black-Scholes Option Pricing model were US$0.05, US$0.03 and US$0.03, respectively.
The following table list the inputs to the Black Scholes Pricing models used for the option granted during the years ended 31 December 2013, 2012 and 2011 respectively:
|
| 2012 |
| 2011 |
|
| 2013 |
| 2012 |
| 2011 |
|
Dividend yield (%) |
| — |
| — |
|
| — |
| — |
| — |
|
Expected volatility |
| 65.93 | % | 69.15 | % |
| 62.18% |
| 65.93% |
| 69.15% |
|
Risk-free interest rate |
| 0.77 | % | 1.04 | % |
| 1.23% |
| 0.77% |
| 1.04% |
|
Expected life of share options |
| 1–5 years |
| 1–5 years |
|
| 1–5 years |
| 1–5 years |
| 1–5 years |
|
The risk-free rate for periods within the contractual life of the option is based on the yield of the US Treasury Bond. The expected term of options granted represents the period of time that options granted are expected to be outstanding. Expected volatilities are based on the average volatility of the Company’s stock prices with the time period commensurate with the expected term of the options. The dividend yield is based on the Company’s intended future dividend plan.
The valuation of the options are based on the best estimates from Company by taking into account a number of assumptions and is subject to limitation of the valuation model. Changes in variables and assumptions may affect the fair value of these options.
NOTES TO THE CONSOLIDATED FINANCIAL STATEMENTS
33.34. Share-based payments (continued)
Movements during the year (continued)
(ii) The following table illustrates the number and weighted average fair value (WAFV) of, and movements in, RSUs during the year (excluding share options):
|
| 2012 |
| 2012 |
| 2011 |
| 2011 |
|
| 2013 |
| 2013 |
| 2012 |
| 2012 |
| 2011 |
| 2011 |
| |||||
|
| Number |
| WAFV |
| Number |
| WAFV |
|
| Number |
| WAFV |
| Number |
| WAFV |
| Number |
| WAFV |
| |||||
Outstanding at January 1 |
| 101,564,432 |
| US$ | 0.07 |
| 144,457,562 |
| US$ | 0.10 |
|
| 125,358,288 |
| US$ | 0.06 |
| 101,564,432 |
| US$ | 0.07 |
| 144,457,562 |
| US$ | 0.10 |
|
Granted during the year |
| 65,170,000 |
| US$ | 0.04 |
| 67,949,495 |
| US$ | 0.07 |
|
| 151,336,161 |
| US$ | 0.08 |
| 65,170,000 |
| US$ | 0.04 |
| 67,949,495 |
| US$ | 0.07 |
|
Cancelled during the year |
| (12,809,396 | ) | US$ | 0.08 |
| (32,611,949 | ) | US$ | 0.10 |
| ||||||||||||||||
Forfeited during the year |
| (8,139,176 | ) | US$ | 0.07 |
| (12,809,396 | ) | US$ | 0.08 |
| (32,611,949 | ) | US$ | 0.10 |
| |||||||||||
Exercised during the year |
| (28,566,748 | ) | US$ | 0.08 |
| (78,230,676 | ) | US$ | 0.10 |
|
| (35,396,542 | ) | US$ | 0.06 |
| (28,566,748 | ) | US$ | 0.08 |
| (78,230,676 | ) | US$ | 0.10 |
|
Outstanding at December 31 |
| 125,358,288 |
| US$ | 0.06 |
| 101,564,432 |
| US$ | 0.07 |
|
| 233,158,731 |
| US$ | 0.07 |
| 125,358,288 |
| US$ | 0.06 |
| 101,564,432 |
| US$ | 0.07 |
|
The weighted average remaining contractual life for the RSUs outstanding as at December 31, 20122013 was 8.88 years (2012: 8.84 years (2011:and 2011: 9.01 years).
34.DisposalThe weighted average closing price of a subsidiarythe Company’s shares immediately before the dates on which the RSUs were exercised was US$0.08 (2012: US$0.04 and 2011: US$0.07).
On March 1, 2011,During the Company disposedyear ended December 31, 2013, RSUs were granted on June 11, 2013. The fair values of majority ownership interest in Semiconductor Manufacturing International (AT) Corporation. No cash consideration received in connection with this disposal.the RUSs determined at the dates of grant using the Black-Scholes Option Pricing model were US$0.08.
During the year ended December 31, 2012, RSUs were granted on May 22, 2012 and September 12, 2012. The fair values of the RSUs determined at the dates of grant using the Black-Scholes Option Pricing model were US$0.04 and US$0.04. During the year ended December 31, 2011, RSUs were granted on May 31, 2011 and September 8, 2011. The fair values of the RSUs determined at the dates of grant using the Black-Scholes Option Pricing model were US$0.08 and US$0.06. |
| ||
| |||
| |||
| |||
|
| ||
|
| ||
|
| ||
|
| ||
|
| ||
|
|
| |
|
|
| |
|
|
| |
|
| ||
| |||
|
| ||
|
| ||
|
|
| |
|
|
The gain on disposal is included infollowing table list the profitinputs to the models used for the yearplans for the years ended December 31, 2013, 2012 and 2011, respectively:
|
| 2013 |
| 2012 |
| 2011 |
|
Dividend yield (%) |
| — |
| — |
| — |
|
Expected volatility |
| 47.03% |
| 49.90% |
| 69.23% |
|
Risk-free interest rate |
| 0.34% |
| 0.30% |
| 0.27% |
|
Expected life of RSUs |
| 1–2 years |
| 1–2 years |
| 1–2 years |
|
The risk-free rate for periods within the contractual life of the RSUs is based on the yield of the US Treasury Bond. The expected term of RSUs granted represents the period of time that RSUs granted are expected to be outstanding. Expected volatilities are based on the average volatility of the Company’s stock prices with the time period commensurate with the expected term of the RSUs. The dividend yield is based on the Company’s intended future dividend plan.
The valuation of the RSUs is based on the best estimates from discontinued operations (see Note 12).Company by taking into account a number of assumptions and is subject to limitation of the valuation model. Changes in variables and assumptions may affect the fair value of these RSUs.
NOTES TO THE CONSOLIDATED FINANCIAL STATEMENTS
35. Financial instruments
Capital management
The Company manages its capital to ensure that entities in the Company will be able to continue as going concerns while maximizing the return to stakeholders through the optimization of the capital structure. The Company’s overall strategy remains unchanged from 2011.2012.
The capital structure of the Company consists of net debt (borrowings as detailed in Note 2928 offset by cash and bank balance) and equity of the Company.
Where the entity manages its capital through issuing/repurchasing shares and raising/repayment of debts. The Company reviews the capital structure on a semi-annual basis. As part of this review, the Company considers the cost of capital and the risks associates with each class of capital. The Company will balance its overall capital structure through the payment of dividends, new share issues and share buy-backs as well as the issue of new debt or the redemption of existing debt.
Gearing ratio
The gearing ratio at end of the reporting period was as follows.
|
| 12/31/12 |
| 12/31/11 |
|
| 12/31/13 |
| 12/31/12 |
| 12/31/11 |
|
|
| USD’000 |
| USD’000 |
|
| USD’000 |
| USD’000 |
| USD’000 |
|
Debt (i) |
| 1,096,415 |
| 871,143 |
|
| 1,172,085 |
| 1,096,415 |
| 871,143 |
|
Cash and bank balances |
| (358,490 | ) | (261,615 | ) |
| (462,483 | ) | (358,490 | ) | (261,615 | ) |
Net debt |
| 737,925 |
| 609,528 |
|
| 709,602 |
| 737,925 |
| 609,528 |
|
Equity |
| 2,276,452 |
| 2,245,998 |
|
| 2,593,182 |
| 2,276,452 |
| 2,245,998 |
|
Net debt to equity ratio |
| 32.42 | % | 27.14 | % |
| 27.36 | % | 32.42 | % | 27.14 | % |
(i) Debt is defined as long- and short-term borrowings (excluding derivatives), and convertible bonds, as described in Note 28 and Note 29.
NOTES TO THE CONSOLIDATED FINANCIAL STATEMENTS
35. Financial instruments (continued)
Categories of financial instruments
|
| 12/31/12 |
| 12/31/11 |
|
| 12/31/13 |
| 12/31/12 |
| 12/31/11 |
|
|
| USD’000 |
| USD’000 |
|
| USD’000 |
| USD’000 |
| USD’000 |
|
Financial assets |
|
|
|
|
|
|
|
|
|
|
|
|
Cash and bank balance |
| 358,490 |
| 261,615 |
| |||||||
Cash and bank balances |
| 462,483 |
| 358,490 |
| 261,615 |
| |||||
Restricted Cash (Deposit pledged against letters of credit & short-term credit facilities) |
| 111,560 |
| 46,273 |
|
| 35,639 |
| 111,560 |
| 46,273 |
|
Fair value through profit or loss (FVTPL) Foreign currency forward contracts |
| 77 |
| 939 |
| |||||||
Short-term investment carried at fair value through profit or loss |
| 18,653 |
| 1,034 |
| |||||||
Fair value through profit or loss (FVTPL) |
|
|
|
|
|
|
| |||||
Foreign currency forward contracts |
| — |
| 77 |
| 939 |
| |||||
|
|
|
|
|
|
|
| |||||
Short term investment carried at fair value through profit or loss |
| 240,311 |
| 18,653 |
| 1,034 |
| |||||
Trade and other receivables |
| 328,211 |
| 200,905 |
|
| 379,361 |
| 328,211 |
| 200,905 |
|
Available-for-sale financial assets carried at cost |
| 3,757 |
| 3,757 |
|
| 1,278 |
| 3,757 |
| 3,757 |
|
Financial liabilities |
|
|
|
|
|
|
|
|
|
|
|
|
Fair value through profit or loss (FVTPL) |
|
|
|
|
|
|
|
|
|
|
|
|
Foreign currency forward contracts |
| 25 |
| 816 |
|
| — |
| 25 |
| 816 |
|
Interest rate swaps |
| — |
| 405 |
|
| — |
| — |
| 405 |
|
Cross-currency interest rate swaps |
| — |
| 462 |
|
| — |
| — |
| 462 |
|
Trade and other payables |
| 423,952 |
| 375,748 |
|
| 393,890 |
| 423,952 |
| 375,748 |
|
Borrowings |
| 1,096,415 |
| 871,143 |
|
| 991,522 |
| 1,096,415 |
| 871,143 |
|
Convertible bonds |
| 180,563 |
| — |
| — |
| |||||
Promissory notes |
| 29,374 |
| 57,934 |
|
| — |
| 29,374 |
| 57,934 |
|
Long-term liabilities |
| 4,223 |
| 3,018 |
|
| — |
| 4,223 |
| 3,018 |
|
Financial risk management objectives
The Company’s corporate treasury function co-ordinates access to domestic and international financial markets, monitors and manages the financial risks relating to the operations of the Company through internal risk reports which analyze exposures by degree and magnitude of risks. These risks include market risk including currency risk, interest rate risk and other price risk, credit risk and liquidity risk.
The Company seeks to minimiseminimize the effects of these risks by using derivative financial instruments to hedge risk exposures. The use of financial derivatives is governed by the Company’s policies approved by the board of directors, which provide written principles on foreign exchange risk, interest rate risk, credit risk, the use of financial derivatives and non-derivative financial instruments, and the investment of excess liquidity. Compliance with policies and exposure limits is reviewed on continuous basis. The Company does not enter into or trade financial instruments, including derivative financial instruments, for speculative purposes.
NOTES TO THE CONSOLIDATED FINANCIAL STATEMENTS
35. Financial instruments (continued)
Market risk
The Company’s activities expose it primarily to the financial risks of changes in foreign currency exchange rates and interest rates. The Company enters into a variety of derivative financial instruments to manage its exposure to foreign currency risk and interest rate risk, including:
· forward foreign exchange contracts to hedge the exchange rate risk arising on the import from suppliers;
· interest rate swaps to mitigate the risk of rising interest rates; and
· cross-currency interest rate swap agreements to protect against volatility of future cash flows caused by the changes in both interest rates and exchange rates associated with outstanding long-term debt denominated in a currency other than the US dollar.
Market risk exposures are measured using the sensitivity analysis and the analysis in the following sections relate to the position as at December 31, 2013, 2012 and 2011.
There has been no change to the Company’s exposure to market risks or the manner in which these risks are managed and measured.
Foreign currency risk management
The Company undertakes transactions denominated in foreign currencies, consequently, exposures to exchange rate fluctuations arise. Exchange rate exposures are managed within approved policy parameters utilising forward foreign exchange contracts.
The carrying amounts of the Company’s foreign currency denominated monetary assets and monetary liabilities at the end of the reporting period are as followsfollows:
|
| Liabilities |
| Assets |
|
| Liabilities |
| Assets |
| ||||||||||||
|
| 12/31/12 |
| 12/31/11 |
| 12/31/12 |
| 12/31/11 |
|
| 12/31/13 |
| 12/31/12 |
| 12/31/11 |
| 12/31/13 |
| 12/31/12 |
| 12/31/11 |
|
|
| USD’000 |
| USD’000 |
| USD’000 |
| USD’000 |
|
| USD’000 |
| USD’000 |
| USD’000 |
| USD’000 |
| USD’000 |
| USD’000 |
|
EUR |
| 1,345 |
| 12,569 |
| 3,249 |
| 3,017 |
|
| 3,037 |
| 1,345 |
| 12,569 |
| 2,595 |
| 3,249 |
| 3,017 |
|
JPY |
| 13,693 |
| 19,137 |
| 3,023 |
| 2,629 |
|
| 7,925 |
| 13,693 |
| 19,137 |
| 1,499 |
| 3,023 |
| 2,629 |
|
RMB |
| 254,750 |
| 178,491 |
| 456,271 |
| 431,121 |
|
| 133,177 |
| 254,750 |
| 178,491 |
| 766,960 |
| 456,271 |
| 431,121 |
|
Others |
| 6,934 |
| 7,797 |
| 2,122 |
| 1,630 |
|
| 8,226 |
| 6,934 |
| 7,797 |
| 7,323 |
| 2,122 |
| 1,630 |
|
NOTES TO THE CONSOLIDATED FINANCIAL STATEMENTS
35.Financial instruments (continued)
Foreign currency risk management (continued)
Foreign currency sensitivity analysis
The Company is mainly exposed to the currency of RMB, Japanese Yen (“JPY”) and Euros (“EUR”).
The following table details the Company’s sensitivity to a 5% increase in the foreign currencies against USD. 5% represents management’s assessment of the reasonably possible change in foreign exchange rates. The sensitivity analysis includes only outstanding foreign currency denominated monetary items and adjusts their translation at the period end for a 5% change in foreign currency rates. For a 5% decrease of the foreign currency against USD, there would be an equal and opposite impact on the profit or equity below predicted.
|
| EUR |
| JPY |
| RMB |
| Others |
| ||||||||
|
| 2012 |
| 2011 |
| 2012 |
| 2011 |
| 2012 |
| 2011 |
| 2012 |
| 2011 |
|
|
| USD’000 |
| USD’000 |
| USD’000 |
| USD’000 |
| USD’000 |
| USD’000 |
| USD’000 |
| USD’000 |
|
Profit or loss |
| 95 |
| (478 | ) | (562 | ) | (869 | ) | 10,606 |
| 13,296 |
| (3 | ) | (11 | ) |
Equity |
| 95 |
| (478 | ) | (562 | ) | (869 | ) | 10,606 |
| 13,296 |
| (3 | ) | (11 | ) |
35.Financial instruments (continued)
Foreign currency risk management (continued)
Foreign currency sensitivity analysis (continued)
|
| EUR |
| JPY |
| RMB |
| Others |
| ||||||||||||||||
|
| 2013 |
| 2012 |
| 2011 |
| 2013 |
| 2012 |
| 2011 |
| 2013 |
| 2012 |
| 2011 |
| 2013 |
| 2012 |
| 2011 |
|
|
| USD’000 |
| USD’000 |
| USD’000 |
| USD’000 |
| USD’000 |
| USD’000 |
| USD’000 |
| USD’000 |
| USD’000 |
| USD’000 |
| USD’000 |
| USD’000 |
|
Profit or loss |
| (22 | ) | 95 |
| (478 | ) | (338 | ) | (562 | ) | (869 | ) | 33,357 |
| 10,606 |
| 13,296 |
| (1 | ) | (3 | ) | (11 | ) |
Equity |
| (22 | ) | 95 |
| (478 | ) | (338 | ) | (562 | ) | (869 | ) | 33,357 |
| 10,606 |
| 13,296 |
| (1 | ) | (3 | ) | (11 | ) |
Forward foreign exchange contracts
It is the policy of the Company to enter into forward foreign exchange contracts to cover specific foreign currency payments and receipts within the exposure generated. The Company also enters into forward foreign exchange contracts to manage the foreign currency exposure from purchases/sales and financing activities.
NOTES TO THE CONSOLIDATED FINANCIAL STATEMENTS
35.Financial instruments (continued)
Foreign currency risk management (continued)
Forward foreign exchange contracts (continued)
The following table details the forward foreign currency (FC) contracts outstanding at the end of the reporting period:
Outstanding contracts
|
| Average exchange |
|
|
|
|
| Fair value assets/ |
| |||||||||||||||||||||||||||||||||
|
| rate |
| Foreign currency |
| Notional value |
| (liabilities) |
|
| Average exchange rate |
| Foreign currency |
| Notional value |
| Fair value assets/(liabilities) |
| ||||||||||||||||||||||||
|
| 12/31/12 |
| 12/31/11 |
| 12/31/12 |
| 12/31/11 |
| 12/31/12 |
| 12/31/11 |
| 12/31/12 |
| 12/31/11 |
|
| 12/31/13 |
| 12/31/12 |
| 12/31/11 |
| 12/31/13 |
| 12/31/12 |
| 12/31/11 |
| 12/31/13 |
| 12/31/12 |
| 12/31/11 |
| 12/31/13 |
| 12/31/12 |
| 12/31/11 |
|
|
|
|
|
|
| FC’000 |
| FC’000 |
| USD’000 |
| USD’000 |
| USD’000 |
| USD’000 |
|
|
|
|
|
|
|
| FC’000 |
| FC’000 |
| FC’000 |
| USD’000 |
| USD’000 |
| USD’000 |
| USD’000 |
| USD’000 |
| USD’000 |
|
Buy RMB |
|
|
|
|
|
|
|
|
|
|
|
|
|
|
|
|
|
|
|
|
|
|
|
|
|
|
|
|
|
|
|
|
|
|
|
|
|
|
|
|
|
|
Less than 3 months |
| 6.3763 |
| 6.5085 |
| 221,173 |
| 586,456 |
| 35,504 |
| 93,199 |
| 67 |
| 736 |
|
| — |
| 6.3763 |
| 6.5085 |
| — |
| 221,173 |
| 586,456 |
| — |
| 35,504 |
| 93,199 |
| — |
| 67 |
| 736 |
|
3 months to 1 year |
| 6.4100 |
| 6.4450 |
| 294,696 |
| 426,592 |
| 47,306 |
| 67,794 |
| (15 | ) | (525 | ) |
| — |
| 6.4100 |
| 6.4450 |
| — |
| 294,696 |
| 426,592 |
| — |
| 47,306 |
| 67,794 |
| — |
| (15 | ) | (525 | ) |
|
|
|
|
|
| 515,869 |
| 1,013,048 |
| 82,810 |
| 160,993 |
| 52 |
| 211 |
|
|
|
|
|
|
|
|
|
| 515,869 |
| 1,013,048 |
|
|
| 82,810 |
| 160,993 |
|
|
| 52 |
| 211 |
|
Buy EUR |
|
|
|
|
|
|
|
|
|
|
|
|
|
|
|
|
|
|
|
|
|
|
|
|
|
|
|
|
|
|
|
|
|
|
|
|
|
|
|
|
|
|
3 months to 1 year |
|
|
| 1.3214 |
|
|
| 3,600 |
|
|
| 4,653 |
| — |
| (88 | ) |
| — |
| — |
| 1.3214 |
| — |
| — |
| 3,600 |
| — |
| — |
| 4,653 |
| — |
| — |
| (88 | ) |
|
|
|
|
|
|
|
| 3,600 |
|
|
| 4,653 |
| — |
| (88 | ) |
|
|
|
|
|
|
|
|
| — |
| 3,600 |
|
|
| — |
| 4,653 |
| — |
| — |
| (88 | ) |
The Company does not enter into foreign currency exchange contracts for speculative purposes.
Interest rate risk management
The Company is exposed to interest rate risk relates primarily to the Company’s long-term debt obligations, which the Company generally assumes to fund capital expenditures and working capital requirements. The risk is managed by the Company by maintaining an appropriate mix between fixed and floating rate borrowings, and by the use of interest rate swap contracts and cross currency swap contracts.
The Company’s exposures to interest rates on financial assets and financial liabilities are detailed in the liquidity risk management section of this note.
NOTES TO THE CONSOLIDATED FINANCIAL STATEMENTS
35.Financial instruments (continued)
Interest rate risk management (continued)
Interest rate sensitivity analysis
The sensitivity analyses below have been determined based on the exposure to interest rates for both derivatives and non-derivative instruments at the end of the reporting period. For floating rate liabilities, the analysis is prepared assuming the amount of the liability outstanding at the end of the reporting period was outstanding for the whole year. A 10 basis point increase or decrease represents management’s assessment of the reasonably possible change in interest rates.
If interest rates had been 10 basis points higher and all other variables were held constant, the Company’s profit for the year ended December 31, 20122013 would decrease by US$0.6 million (2011:(2012: profit decrease by US$0.6 million and 2011: loss increase by US$0.7 million). This is mainly attributable to the Company’s exposure to interest rates on its variable rate borrowings.
NOTES TO THE CONSOLIDATED FINANCIAL STATEMENTS
35.Financial instruments (continued)
Interest rate risk management (continued)
Interest rate swap contracts
Under interest rate swap contracts, the Company agrees to exchange the difference between fixed and floating rate interest amounts calculated on agreed notional principal amounts. Such contracts enable the Company to mitigate the risk of changing interest rates on the fair value of issued fixed rate debt and the cash flow exposures on the issued variable rate debt. The fair value of interest rate swaps at the end of the reporting period is determined by discounting the future cash flows using the curves at the end of the reporting period and the credit risk inherent in the contracts, and is disclosed below. The average interest rate is based on the outstanding balances at the end of the reporting period.
The following tables detail the notional principal amounts and remaining terms of interest rate swap contracts outstanding at the end of the reporting period.
Outstanding receive |
| Average contracted |
| Notional principal |
| Fair value assets |
| ||||||
contracts |
| 12/31/12 |
| 12/31/11 |
| 12/31/12 |
| 12/31/11 |
| 12/31/12 |
| 12/31/11 |
|
|
| % |
| % |
| USD’000 |
| USD’000 |
| USD’000 |
| USD’000 |
|
Less than 1 year |
| — |
| 2.07 |
| — |
| 48,000 |
| — |
| (405 | ) |
Outstanding receive |
| Average contracted fixed |
| Notional principal value |
| Fair value assets (liabilities) |
| ||||||||||||
floating pay fixed contracts |
| 12/31/13 |
| 12/31/12 |
| 12/31/11 |
| 12/31/13 |
| 12/31/12 |
| 12/31/11 |
| 12/31/13 |
| 12/31/12 |
| 12/31/11 |
|
|
| % |
| % |
| % |
| USD’000 |
| USD’000 |
| USD’000 |
| USD’000 |
| USD’000 |
| USD’000 |
|
Less than 1 year |
| — |
| — |
| 2.07 |
| — |
| — |
| 48,000 |
| — |
| — |
| (405 | ) |
The interest rate swaps settle on a semi-yearly basis. The floating rate on the interest rate swaps is linking to 6 month Libor. The Company will settle the difference between the fixed and floating interest rate on a net basis.
Credit risk management
Credit risk refers to the risk that counterparty will default on its contractual obligations resulting in financial loss to the Company. The Company is mainly exposed to credit risk from trade and other receivables and deposits with banks and financial institutions.
35.Financial instruments (continued)
Credit risk management (continued)
Customer credit risk is managed by each business unit subject to the Company’s established policy, procedures and control relating to customer credit risk management. It is the Company’s policy that all customers who wish to trade on credit terms are subject to credit verification procedures and is offered credit terms only with the approval from Finance and Sales Division. Credit quality of a customer is assessed using publicly available financial information and its own trading records to rate its major customers. The Company’s exposure and credit ratings of its counterparties are continuously monitored. In addition, receivable balances are monitored on an ongoing basis with the result that the Company’s exposure to bad debts is not significant.
Trade receivables consist of a large number of customers, spread across diverse industries and geographical areas.
NOTES TO THE CONSOLIDATED FINANCIAL STATEMENTS
35.Financial instruments (continued)
Credit risk management (continued)
Apart from A and B, two largest customers of the Company, the Company does not have significant credit risk exposure to any single counterparty or any group of counterparties having similar characteristics. The Company defines counterparties as having similar characteristics if they are related entities. Concentration of credit risk related to A and B did not exceed 10% and 12%7% of gross monetary assets at the end of current year. Concentration of credit risk to any other counterparty did not exceed 5% of gross monetary assets at the end of current year.
Net revenue and accounts receivable for customers which accounted for 10% or more of the Company’s accounts receivable and net sales is disclosed in Note 7.6.
The credit risk on liquid funds and derivative financial instruments is limited because the counterparties are banks with high credit-ratings.
Liquidity risk management
The Company manages liquidity risk by maintaining adequate cash reserves, banking facilities and reserve borrowing facilities, by continuously monitoring forecast and actual cash flows, and by matching the maturity profiles of financial assets and liabilities.
NOTES TO THE CONSOLIDATED FINANCIAL STATEMENTS
35.Financial instruments (continued)
Liquidity risk management (continued)
Liquidity and interest risk tables
The following tables detail the Company’s remaining contractual maturity for its non-derivative financial liabilities with agreed repayment periods. The tables have been drawn up based on the undiscounted cash flows of financial liabilities based on the earliest date on which the Company can be required to pay. The tables include both interest and principal cash flows. To the extent that interest flows are floating rate, the undiscounted amount is derived from interest rate curves at the end of the reporting period. The contractual maturity is based on the earliest date on which the Company may be required to pay.
|
|
|
| Weighted |
| Less than |
| 3 months |
| 1–5 years |
| 5+ years |
| Total |
|
|
|
|
| % |
| USD’000 |
| USD’000 |
| USD’000 |
| USD’000 |
| USD’000 |
|
31 December 2012 |
|
|
|
|
|
|
|
|
|
|
|
|
|
|
|
Promissory notes |
|
|
|
|
| — |
| 30,000 |
| — |
| — |
| 30,000 |
|
Interest-bearing bank and other borrowings |
| Fixed |
| 4.73 | % | — |
| 392,282 |
| — |
| — |
| 392,282 |
|
|
| Floating |
| 5.64 | % | — |
| 189,786 |
| 588,270 |
| — |
| 778,056 |
|
Long-term financial liabilities |
|
|
|
|
| — |
| — |
| 6,750 |
| — |
| 6,750 |
|
Trade and other payables |
|
|
|
|
| 353,009 |
| 62,120 |
| 8,823 |
| — |
| 423,952 |
|
|
|
|
|
|
| 353,009 |
| 674,188 |
| 603,843 |
| — |
| 1,631,040 |
|
|
|
|
| Weighted |
| Less than |
| 3 months |
| 1—5 years |
| 5+ years |
| Total |
|
|
|
|
| % |
| USD’000 |
| USD’000 |
| USD’000 |
| USD’000 |
| USD’000 |
|
December 31, 2013 |
|
|
|
|
|
|
|
|
|
|
|
|
|
|
|
Interest-bearing bank and other borrowings |
| Fixed |
| 3.72 | % | 102,800 |
| 119,588 |
| — |
| — |
| 222,388 |
|
|
| Floating |
| 5.66 | % | 82,741 |
| 91,169 |
| 643,369 |
| 26,928 |
| 844,207 |
|
Convertible bonds |
|
|
| 3.69 | % | — |
| — |
| 200,000 |
| — |
| 200,000 |
|
Trade and other payables |
|
|
|
|
| 334,622 |
| 56,383 |
| 2,885 |
| — |
| 393,890 |
|
|
|
|
|
|
| 520,163 |
| 267,140 |
| 846,254 |
| 26,928 |
| 1,660,485 |
|
|
|
|
| Weighted |
| Less than |
| 3 months |
| 1-5 years |
| 5+ years |
| Total |
|
|
|
|
| % |
| USD’000 |
| USD’000 |
| USD’000 |
| USD’000 |
| USD’000 |
|
December 31, 2012 |
|
|
|
|
|
|
|
|
|
|
|
|
|
|
|
Promissory notes |
|
|
|
|
| — |
| 30,000 |
| — |
| — |
| 30,000 |
|
Interest-bearing bank and other borrowings |
| Fixed |
| 4.73 | % | — |
| 392,282 |
| — |
| — |
| 392,282 |
|
|
| Floating |
| 5.64 | % | — |
| 189,786 |
| 588,270 |
| — |
| 778,056 |
|
Long-term financial Liabilities |
|
|
|
|
| — |
| — |
| 6,750 |
| — |
| 6,750 |
|
Trade and other payables |
|
|
|
|
| 353,009 |
| 62,120 |
| 8,823 |
| — |
| 423,952 |
|
|
|
|
|
|
| 353,009 |
| 674,188 |
| 603,843 |
| — |
| 1,631,040 |
|
NOTES TO THE CONSOLIDATED FINANCIAL STATEMENTS
35. Financial instruments (continued)
Liquidity risk management (continued)
Liquidity and interest risk tables (continued)
|
|
|
| Weighted |
| Less than |
| 3 months |
| 1–5 years |
| 5+ years |
| Total |
|
|
|
| Weighted |
| Less than 3 |
| 3 months to |
| 1–5 years |
| 5+ years |
| Total |
|
|
|
|
| % |
| USD’000 |
| USD’000 |
| USD’000 |
| USD’000 |
| USD’000 |
|
|
|
| % |
| USD’000 |
| USD’000 |
| USD’000 |
| USD’000 |
| USD’000 |
|
31 December 2011 |
|
|
|
|
|
|
|
|
|
|
|
|
|
|
| |||||||||||||||
December 31, 2011 |
|
|
|
|
|
|
|
|
|
|
|
|
|
|
| |||||||||||||||
Promissory notes |
|
|
|
|
| — |
| 30,000 |
| 30,000 |
| — |
| 60,000 |
|
|
|
|
|
| — |
| 30,000 |
| 30,000 |
| — |
| 60,000 |
|
Interest-bearing bank and other borrowings |
| Fixed |
| 3.60 | % | — |
| 618,364 |
| — |
| — |
| 618,364 |
|
| Fixed |
| 3.60 | % | — |
| 618,364 |
| — |
| — |
| 618,364 |
|
|
| Floating |
| 3.46 | % | — |
| 194,665 |
| 77,368 |
| — |
| 272,033 |
|
| Floating |
| 3.46 | % | — |
| 194,665 |
| 77,368 |
| — |
| 272,033 |
|
Long-term financial liabilities |
|
|
|
|
| — |
| — |
| 6,750 |
| — |
| 6,750 |
| |||||||||||||||
Long-term financial Liabilities |
|
|
|
|
| — |
| — |
| 6,750 |
| — |
| 6,750 |
| |||||||||||||||
Trade and other payables |
|
|
|
|
| 322,528 |
| 47,407 |
| 5,813 |
| — |
| 375,748 |
|
|
|
|
|
| 322,528 |
| 47,407 |
| 5,813 |
| — |
| 375,748 |
|
|
|
|
|
|
| 322,528 |
| 890,436 |
| 119,931 |
| — |
| 1,332,895 |
|
|
|
|
|
| 322,528 |
| 890,436 |
| 119,931 |
| — |
| 1,332,895 |
|
The following table details the Company’s expected maturity for its non-derivative financial assets. The table has been drawn up based on the undiscounted contractual maturities of the financial assets including interest that will be earned on those assets. The inclusion of information on non-derivative financial assets is necessary in order to understand the Company’s liquidity risk management as the liquidity is managed on a net asset and liability basis.
|
| Weighted |
| Less than |
| 3 months |
| 1–5 years |
| 5+ years |
| Total |
|
| Weighted |
| Less than 3 |
| 3 months |
| 1-5 years |
| 5+ years |
| Total |
|
|
| % |
| USD’000 |
| USD’000 |
| USD’000 |
| USD’000 |
| USD’000 |
|
| % |
| USD’000 |
| USD’000 |
| USD’000 |
| USD’000 |
| USD’000 |
|
31 December 2012 |
|
|
|
|
|
|
|
|
|
|
|
|
| |||||||||||||
December 31, 2013 |
|
|
|
|
|
|
|
|
|
|
|
|
| |||||||||||||
Trade and other receivables |
|
|
| 322,380 |
| 5,831 |
| — |
| — |
| 328,211 |
|
|
|
| 379,361 |
| — |
| — |
| — |
| 379,361 |
|
Cash balances, restricted cash & short-term investments |
| 1.35 | % | 414,798 |
| 75,108 |
| — |
| — |
| 489,906 |
|
| 1.34 | % | 680,525 |
| 59,437 |
| — |
| — |
| 739,962 |
|
Available for sale financial assets |
|
|
| — |
| — |
| — |
| 3,757 |
| 3,757 |
|
|
|
| — |
| — |
| — |
| 1,278 |
| 1,278 |
|
|
|
|
| 737,178 |
| 80,939 |
| — |
| 3,757 |
| 821,874 |
|
|
|
| 1,059,886 |
| 59,437 |
| — |
| 1,278 |
| 1,120,601 |
|
|
| Weighted |
| Less than |
| 3 months |
| 1–5 years |
| 5+ years |
| Total |
|
|
| % |
| USD’000 |
| USD’000 |
| USD’000 |
| USD’000 |
| USD’000 |
|
31 December 2011 |
|
|
|
|
|
|
|
|
|
|
|
|
|
Trade and other receivables |
|
|
| 195,953 |
| 4,952 |
| — |
| — |
| 200,905 |
|
Cash balances, Restricted Cash & short-term investments |
| 0.91 | % | 265,773 |
| 43,647 |
| — |
| — |
| 309,420 |
|
Available for sale financial asset |
|
|
| — |
| — |
| — |
| 3,757 |
| 3,757 |
|
|
|
|
| 461,726 |
| 48,599 |
| — |
| 3,757 |
| 514,082 |
|
|
| Weighted |
| Less than 3 |
| 3 months to |
| 1-5 years |
| 5+ years |
| Total |
|
|
| % |
| USD’000 |
| USD’000 |
| USD’000 |
| USD’000 |
| USD’000 |
|
December 31, 2012 |
|
|
|
|
|
|
|
|
|
|
|
|
|
Trade and other receivables |
|
|
| 322,380 |
| 5,831 |
| — |
| — |
| 328,211 |
|
Cash balances, restricted cash & short-term investments |
| 1.35 | % | 414,798 |
| 75,108 |
| — |
| — |
| 489,906 |
|
Available for sale financial assets |
|
|
| — |
| — |
| — |
| 3,757 |
| 3,757 |
|
|
|
|
| 737,178 |
| 80,939 |
| — |
| 3,757 |
| 821,874 |
|
NOTES TO THE CONSOLIDATED FINANCIAL STATEMENTS
35. Financial instruments (continued)
Liquidity risk management (continued)
Liquidity and interest risk tables (continued)
|
| Weighted |
| Less than 3 |
| 3 months to |
| 1-5 years |
| 5+ years |
| Total |
|
|
| % |
| USD’000 |
| USD’000 |
| USD’000 |
| USD’000 |
| USD’000 |
|
December 31, 2011 |
|
|
|
|
|
|
|
|
|
|
|
|
|
Trade and other receivables |
|
|
| 195,953 |
| 4,952 |
| — |
| — |
| 200,905 |
|
Cash balances, restricted cash & short-term investments |
| 0.91 | % | 265,773 |
| 43,647 |
| — |
| — |
| 309,420 |
|
Available for sale financial assets |
|
|
| — |
| — |
| — |
| 3,757 |
| 3,757 |
|
|
|
|
| 461,726 |
| 48,599 |
| — |
| 3,757 |
| 514,082 |
|
The amounts included above for variable interest rate instruments for both non-derivative financial assets and liabilities is subject to change if changes in variable interest rates differ to those estimates of interest rates determined at the end of the reporting period.
The Company has access to short-term financing facilities as described in below section, of which USD629.3US$927.5 million were unused at the end of the reporting period (2011: USD311.6(2012: US$629.3 million and 2011: US$311.6 million). The Company expects to meet its other obligations from operating cash flows and proceeds of maturing financial assets.
The following table details the Company’s liquidity analysis for its derivative financial instruments. The table has been drawn up based on the undiscounted contractual net cash inflows and outflows on derivative instruments that settle on a net basis, and the undiscounted gross inflows and outflows on those derivatives that require gross settlement. When the amount payable or receivable is not fixed, the amount disclosed has been determined by reference to the projected interest rates as illustrated by the yield curves at the end of the reporting period.
|
| 1 month |
| Less than |
| 1–3 |
| 3 months |
| 1–5 years |
| 5+ years |
|
|
|
| Less than |
| 1-3 |
| 3 months |
|
|
|
|
|
|
| USD’000 |
| USD’000 |
| USD’000 |
| USD’000 |
| USD’000 |
| USD’000 |
|
| 1 month |
| 1 month |
| months |
| to 1 year |
| 1-5 years |
| 5+ years |
|
31 December 2012 |
|
|
|
|
|
|
|
|
|
|
|
|
| |||||||||||||
|
| USD’000 |
| USD’000 |
| USD’000 |
| USD’000 |
| USD’000 |
| USD’000 |
| |||||||||||||
December 31, 2012 |
|
|
|
|
|
|
|
|
|
|
|
|
| |||||||||||||
Net settled: |
|
|
|
|
|
|
|
|
|
|
|
|
|
|
|
|
|
|
|
|
|
|
|
|
|
|
— foreign exchange forward Contracts |
| — |
| 20 |
| 47 |
| (15 | ) | — |
| — |
| |||||||||||||
— foreign exchange forward contracts |
| — |
| 20 |
| 47 |
| (15 | ) | — |
| — |
| |||||||||||||
|
| — |
| 20 |
| 47 |
| (15 | ) | — |
| — |
|
| — |
| 20 |
| 47 |
| (15 | ) | — |
| — |
|
31 December 2011 |
|
|
|
|
|
|
|
|
|
|
|
|
| |||||||||||||
December 31, 2011 |
|
|
|
|
|
|
|
|
|
|
|
|
| |||||||||||||
Net settled: |
|
|
|
|
|
|
|
|
|
|
|
|
|
|
|
|
|
|
|
|
|
|
|
|
|
|
— Interest rate swaps |
| — |
| — |
| — |
| (405 | ) | — |
| — |
|
| — |
| — |
| — |
| (405 | ) | — |
| — |
|
— foreign exchange forward contracts |
| — |
| 712 |
| 24 |
| (613 | ) | — |
| — |
|
| — |
| 712 |
| 24 |
| (613 | ) | — |
| — |
|
— cross-currency interest rate swap contracts |
| — |
| — |
| — |
| (462 | ) | — |
| — |
|
| — |
| — |
| — |
| (462 | ) | — |
| — |
|
|
| — |
| 712 |
| 24 |
| (1,480 | ) | — |
| — |
|
| — |
| 712 |
| 24 |
| (1,480 | ) | — |
| — |
|
35.Financial instruments (continued)
Fair value of financial instruments
Fair value of financial instruments carried at amortized cost
The Company considers that the carrying amounts of financial assets and financial liabilities recognized in the consolidated financial statements approximate their fair values.
The carrying values of long-term promissory notes approximate their fair values as the interest rates used to discount the promissory notes did not fluctuate significantly between the date the notes were recorded and December 31, 2012.
NOTES TO THE CONSOLIDATED FINANCIAL STATEMENTS
35.Financial instruments (continued)
Fair value of financial instruments (continued)
Valuation techniques and assumptions applied for the purposes of measuring fair value
The fair values of financial assets and financial liabilities are determined as follows:
· the fair value of financial instruments based on quoted market prices in active markets, valuation techniques that use observable market-based inputs or unobservable inputs that are corroborated by market data. Pricing information the Company obtains from third parties is internally validated for reasonableness prior to use in the consolidated financial statements. When observable market prices are not readily available, the Company generally estimates the fair value using valuation techniques that rely on alternate market data or inputs that are generally less readily observable from objective sources and are estimated based on pertinent information available at the time of the applicable reporting periods. In certain cases, fair values are not subject to precise quantification or verification and may fluctuate as economic and market factors vary and the Company’s evaluation of those factors changes.
Fair value measurements recognized in the consolidated statement of financial position
The following table providestables provide an analysis of financial instruments that are measured at fair value on a recurring basis subsequent to initial recognition, at fair value, grouped into Levels 1 to 3 based on the degree to which the fair value is observable:observable. There is no transfer within different levels of the fair value hierarchy in the year ended December 31, 2013, 2012 and 2011:
· Level 1 fair value measurements are those derived from quoted prices (unadjusted) in active marketsmarket for identical assets or liabilities;
· Level 2 fair value measurements are those derived from inputs other than quoted priesprices included within Level 1 that are observable for the asset or liability, either directly (i.e. as prices) or indirectly (i.e. derived from prices); and.
· Level 3 fair value measurements are those derived from valuation techniques that include inputs for the asset or liability that are not based on observable market data (unobservable inputs).
|
| 31/12/12 |
| ||||||
|
| Level 1 |
| Level 2 |
| Level 3 |
| Total |
|
|
| USD’000 |
| USD’000 |
| USD’000 |
| USD’000 |
|
Financial assets at FVTPL |
|
|
|
|
|
|
|
|
|
Derivative financial assets |
| — |
| 77 |
| — |
| 77 |
|
Short-term investment carried at fair value through profit or loss |
| — |
| 18,653 |
| — |
| 18,653 |
|
Total |
| — |
| 18,730 |
|
|
| 18,730 |
|
Financial liabilities at FVTPL |
|
|
|
|
|
|
|
|
|
Other derivative financial liabilities |
| — |
| (25 | ) | — |
| (25 | ) |
Total |
| — |
| (25 | ) | — |
| (25 | ) |
NOTES TO THE CONSOLIDATED FINANCIAL STATEMENTS
35. Financial instruments (continued)
Fair value of financial instruments (continued)
Fair value measurements recognized in the consolidated statement of financial position
(continued)
|
|
|
| 12/31/13 |
| ||||||
|
| Valuation technique(s) and key input |
| Level 1 |
| Level 2 |
| Level 3 |
| Total |
|
|
|
|
| USD’000 |
| USD’000 |
| USD’000 |
| USD’000 |
|
Financial assets at FVTPL |
|
|
|
|
|
|
|
|
|
|
|
Short-term investment carried at fair value through profit or loss |
| Discounted cash flow. Future cash flows are estimated based on contracted interest rates, discounted at a rate that reflects the credit risk of various counterparties. |
| — |
| 240,311 |
| — |
| 240,311 |
|
Total |
|
|
| — |
| 240,311 |
| — |
| 240,311 |
|
|
|
|
| 12/31/12 |
| ||||||
|
| Valuation technique(s) and key input |
| Level 1 |
| Level 2 |
| Level 3 |
| Total |
|
|
|
|
| USD’000 |
| USD’000 |
| USD’000 |
| USD’000 |
|
Financial assets at FVTPL |
|
|
|
|
|
|
|
|
|
|
|
Foreign currency forward contracts classified as other financial assets in the statement of financial position |
| Discounted cash flow. Future cash flows are estimated based on forward exchange rates (from observable forward exchange rates at the end of the reporting period) and contracted forward rates, discounted at a rate that reflects the credit risk of various counterparties. |
| — |
| 77 |
| — |
| 77 |
|
Short-term investment carried at fair value through profit or loss |
| Discounted cash flow. Future cash flows are estimated based on contracted interest rates, discounted at a rate that reflects the credit risk of various counterparties. |
| — |
| 18,653 |
| — |
| 18,653 |
|
Total |
|
|
| — |
| 18,730 |
| — |
| 18,730 |
|
Financial liabilities at FVTPL |
|
|
|
|
|
|
|
|
|
|
|
Foreign currency forward contracts classified as other financial liabilities in the statement of financial position |
| Discounted cash flow. Future cash flows are estimated based on forward exchange rates (from observable forward exchange rates at the end of the reporting period) and contracted forward rates, discounted at a rate that reflects the credit risk of various counterparties. |
| — |
| (25 | ) | — |
| (25 | ) |
Total |
|
|
| — |
| (25 | ) | — |
| (25 | ) |
35.Financial instruments (continued)
Fair value of financial instruments (continued)
Fair value measurements recognized in the consolidated statement of financial position
(continued)
|
| 31/12/11 |
| ||||||
|
| Level 1 |
| Level 2 |
| Level 3 |
| Total |
|
|
| USD’000 |
| USD’000 |
| USD’000 |
| USD’000 |
|
Financial assets at FVTPL |
|
|
|
|
|
|
|
|
|
Derivative financial assets |
| — |
| 939 |
| — |
| 939 |
|
Short-term investment carried at fair value through profit or loss |
| — |
| 1,034 |
| — |
| 1,034 |
|
Total |
| — |
| 1,973 |
|
|
| 1,973 |
|
Financial liabilities at FVTPL |
|
|
|
|
|
|
|
|
|
Other derivative financial liabilities |
| — |
| (1,683 | ) | — |
| (1,683 | ) |
Total |
| — |
| (1,683 | ) | — |
| (1,683 | ) |
There were no transfers between Level 1 and 2 during year ended December 31, 2012 and 2011.
|
|
|
| 12/31/11 |
| ||||||
|
| Valuation technique(s) and key input |
| Level 1 |
| Level 2 |
| Level 3 |
| Total |
|
|
|
|
| USD’000 |
| USD’000 |
| USD’000 |
| USD’000 |
|
Financial assets at FVTPL |
|
|
|
|
|
|
|
|
|
|
|
Foreign currency forward contracts classified as other financial assets in the statement of financial position |
| Discounted cash flow. Future cash flows are estimated based on forward exchange rates (from observable forward exchange rates at the end of the reporting period) and contracted forward rates, discounted at a rate that reflects the credit risk of various counterparties. |
| — |
| 939 |
| — |
| 939 |
|
Short-term investment carried at fair value through profit or loss |
| Discounted cash flow. Future cash flows are estimated based on contracted interest rates, discounted at a rate that reflects the credit risk of various counterparties. |
| — |
| 1,034 |
| — |
| 1,034 |
|
Total |
|
|
| — |
| 1,973 |
| — |
| 1,973 |
|
Financial liabilities at FVTPL |
|
|
|
|
|
|
|
|
|
|
|
Foreign currency forward contracts classified as other financial liabilities in the statement of financial position |
| Discounted cash flow. Future cash flows are estimated based on forward exchange rates (from observable forward exchange rates at the end of the reporting period) and contracted forward rates, discounted at a rate that reflects the credit risk of various counterparties. |
| — |
| (1,683 | ) | — |
| (1,683 | ) |
Total |
|
|
| — |
| (1,683 | ) | — |
| (1,683 | ) |
36. Related party transactions
Balances and transactions between the Company and its subsidiaries, which are related parties of the Company, have been eliminated on consolidation and are not disclosed in this note. Details of transactions between the Company and other related parties are disclosed below.
Trading transactions
During the year, group entities entered into the following trading transactions with related parties that are not members of the Company:
|
| Sales of goods |
|
| Sale of goods |
| ||||||
|
| Year ended |
| Year ended |
|
| 12/31/13 |
| 12/31/12 |
| 12/31/11 |
|
|
| USD’000 |
| USD’000 |
|
| USD’000 |
| USD’000 |
| USD’000 |
|
Datang Microelectronics Technology Co., Ltd** |
| 9,654 |
| 4,558 |
|
| 14,821 |
| 9,654 |
| 4,558 |
|
Leadcore Technology Co., Ltd** |
| 1,905 |
| 44 |
| 266 |
| |||||
Toppan SMIC Electronics (Shanghai) Co., Ltd |
| 4,192 |
| 4,099 |
|
| 4,317 |
| 4,192 |
| 4,099 |
|
NOTES TO THE CONSOLIDATED FINANCIAL STATEMENTS
36. Related party transactions (continued)
Trading transactions (continued)
|
| Purchase of goods |
| Purchase of services |
| |||||||||||||||||
|
| Purchase of goods |
| Purchase of services |
|
| Year ended |
| Year ended |
| ||||||||||||
|
| Year |
| Year |
| Year |
| Year |
|
| 12/31/13 |
| 12/31/12 |
| 12/31/11 |
| 12/31/13 |
| 12/31/12 |
| 12/31/11 |
|
|
| USD’000 |
| USD’000 |
| USD’000 |
| USD’000 |
|
| USD’000 |
| USD’000 |
| USD’000 |
| USD’000 |
| USD’000 |
| USD’000 |
|
Toppan SMIC Electronics (Shanghai) Co., Ltd |
| 169 |
| 6,828 |
| 12,755 |
| 13,594 |
|
| 7 |
| 169 |
| 6,828 |
| 22,854 |
| 12,755 |
| 13,594 |
|
Zhongxin Xiecheng Investment (Beijing) Co., Ltd |
| — |
| — |
| 1,094 |
| — |
|
| — |
| — |
| — |
| 1,930 |
| 1,094 |
| — |
|
The following balances were outstanding at the end of the reporting period:
|
| Amounts due from |
| Amounts due to |
| |||||||||||||||||
|
| Amounts owing by |
| Amounts owing to |
|
| related parties |
| related parties |
| ||||||||||||
|
| 12/31/12 |
| 12/31/11 |
| 12/31/12 |
| 12/31/11 |
|
| 12/31/13 |
| 12/31/12 |
| 12/31/11 |
| 12/31/13 |
| 12/31/12 |
| 12/31/11 |
|
|
| USD’000 |
| USD’000 |
| USD’000 |
| USD’000 |
|
| USD’000 |
| USD’000 |
| USD’000 |
| USD’000 |
| USD’000 |
| USD’000 |
|
Datang Microelectronics Technology Co., Ltd** |
| 4,138 |
| 1,261 |
| — |
| — |
|
| 6,124 |
| 4,138 |
| 1,261 |
| — |
| — |
| — |
|
Datang Telecom Company Finance Co., Ltd** |
| — |
| — |
| 80,262 | * | — |
|
| — |
| — |
| — |
| 65,884 | * | 80,262 |
| — |
|
Toppan SMIC Electronics (Shanghai) Co., Ltd |
| 372 |
| 350 |
| 1,487 |
| 1,629 |
| |||||||||||||
Leadcore Technology Co., Ltd.** |
| 405 |
| 11 |
| 11 |
| 140 |
| 19 |
| — |
| |||||||||
Toppan SMIC Electronics (Shanghai) Co., Ltd. |
| 370 |
| 372 |
| 350 |
| 2,397 |
| 1,487 |
| 1,629 |
| |||||||||
Zhongxin Xiecheng Investment (Beijing) Co., Ltd. |
| 6 |
| — |
| — |
| — |
| — |
| — |
| |||||||||
Brite Semiconductor (Shanghai) Corporation*** |
| 683 |
| — |
| — |
| 645 |
| — |
| — |
| |||||||||
* Short-term borrowing, the principal amount is repayablewas repaid in May 2013.February 2014. The interest rate is 5.04%3%.
** Members of Datang GroupGroup. (as defined below)
***As of December 30, 2013, the Company lost control of Brite and Brite became an associate of the Company.
On December 14, 2011, the Company entered into a Framework Agreement with Datang Telecom Technology & Industry Holdings Co., Ltd. (“Datang”Datang Telecom”), a substantial shareholder of the Company. Datang Telecom is a member of Datang Telecom Technology & Industry Group (“Datang Group”). Pursuant to the agreement, the Company (including its subsidiaries) and Datang Telecom (including its associates) will engage in business collaboration including but not limited to foundry service. The effective period of the Framework Agreement is three years. The pricing for the transactions contemplated under the agreement will be determined by reference to reasonable market price.
On December 18, 2013, the Company entered into a subscription agreement (“Datang Subscription Agreement”) with Datang, a substantial shareholder of the Company. Please refer to Note 29 for details.
NOTES TO THE CONSOLIDATED FINANCIAL STATEMENTS
36. Related party transactions (continued)
Compensation of key management personnel
Key management personnel are those persons having authority and responsibility for planning, directing and controlling the activities of the Company, directly or indirectly, including directors of the Company.
The remuneration of key management personnel during the year are as follows:
|
| year ended |
| year ended |
|
| year ended |
| year ended |
| year ended |
|
|
| 12/31/12 |
| 12/31/11 |
|
| USD’000 |
| USD’000 |
| USD’000 |
|
|
| USD’000 |
| USD’000 |
| |||||||
Short-term benefits |
| 3,191 |
| 3,222 |
| |||||||
Short-term benefit |
| 4,318 |
| 3,191 |
| 3,222 |
| |||||
Share-based payments |
| 1,343 |
| 1,619 |
|
| 3,028 |
| 1,343 |
| 1,619 |
|
|
| 4,534 |
| 4,841 |
|
| 7,346 |
| 4,534 |
| 4,841 |
|
The remuneration of key management personnel is determined by the Compensation Committee having regard to the performance of individuals and market trends.
TheSale of self-developed living quarter unit
Amount of sales of self-developed living quarter unit to one of directors of the Company and one of the key management, which were previously approved by the Board, approved to sellwere US$1.1 million and US$0.8 million in 2013.
Amount of sales of self-developed apartmentliving quarter unit to two of the key management, in 2012. Amount of sales of self-developed apartmentswhich were approved by the Board, was US$0.9 million.million in 2012.
37. Commitments for expenditure
Purchase commitments
As of December 31, 2013, 2012 and 2011, the Company had the following commitments to purchase machinery, equipment and construction obligations. The machinery and equipment is scheduled to be delivered to the Company’s facility by December 31, 2013.2014.
|
| 12/31/12 |
| 12/31/11 |
|
| 12/31/13 |
| 12/31/12 |
| 12/31/11 |
|
|
| USD’000 |
| USD’000 |
|
| USD’000 |
| USD’000 |
| USD’000 |
|
Commitments for the facility construction |
| 25,551 |
| 40,322 |
|
| 114,878 |
| 25,551 |
| 40,322 |
|
Commitments for the acquisition of property, plant and equipment |
| 481,639 |
| 420,461 |
|
| 178,382 |
| 481,639 |
| 420,461 |
|
Commitments for the acquisition of intangible assets |
| 10,147 |
| — |
|
|
| |||||
|
| 507,190 |
| 460,783 |
|
| 303,407 |
| 507,190 |
| 460,783 |
|
NOTES TO THE CONSOLIDATED FINANCIAL STATEMENTS
38.Offsetting a financial asset and a financial liability
On December 26, 2013, six financing agreements (“Financing Agreements”) were entered into under which the Company totally borrowed US$4.0 million from Bank of China to settle the accounts payable of suppliers, and the Company will then repay such borrowing to Bank of China according to repayment schedule and interest rate in the agreements.
A pledged deposit agreement (“Pledged Deposit Agreement”) was entered into simultaneously, under which the Company pledged with Bank of China US$4.0 million to guarantee the repayment under the Financing Agreements to Bank of China. The interest income from the pledged deposit is also pledged and used as guarantee. If the Company fails to repay the borrowings under the Financing Agreements as scheduled, Bank of China will have the right to use the pledged deposit to repay the related borrowings.
An offsetting agreement was entered into in connection with the Financing Agreements and Pledged Deposit Agreement, under which the Company shall have the legal right to use the pledged deposit under Pledged Deposit Agreement to offset the borrowings under the Financing Agreements at any time during the financing period specified in the Financing Agreements, and the amount of the pledged deposit should cover both principal and interests.
As of December 31, 2013, the Company presented the remaining amount as restricted cash after offsetting.
39.Subsequent event
On February 27, 2014, SMIS established a wholly-owned investment fund company in Shanghai — China IC Capital Co., Ltd (the “Fund”). The initial investment of the Fund is RMB500 million, all funded by SMIS. The Fund is intended to invest primarily in integrated circuits related fund products and investment projects. The operating period of the Fund will be 15 years from the date of the issuance of the business license. The Fund will be operated and managed by an equity investment management company China Fortune-Tech Capital Co., Ltd established by SMIS and an independent third party on February 27, 2014.
40. Approval of financial statements
The financial statements were approved and authorized for issue by the board of directors of the Company on March 25, 2013.12, 2014.
ADDITIONAL INFORMATION — SCHEDULE I
FINANCIAL INFORMATION OF PARENT COMPANY
STATEMENTS OF PROFIT OR LOSS
|
| Year ended |
| Year ended |
|
| Year ended |
| Year ended |
| Year ended |
|
|
| USD’000 |
| USD’000 |
|
| USD’000 |
| USD’000 |
| USD’000 |
|
Continuing operations |
|
|
|
|
|
|
|
|
|
|
|
|
Revenue |
| — |
| 304 |
|
| — |
| — |
| 304 |
|
General and administration expenses |
| (38,853 | ) | (37,149 | ) |
| (59,771 | ) | (38,853 | ) | (32,269 | ) |
Loss from operations |
| (59,771 | ) | (38,853 | ) | (31,965 | ) | |||||
Interest income |
| 1,050 |
| 1,021 |
| 449 |
| |||||
Finance costs |
| (3,331 | ) | (4,628 | ) |
| (2,972 | ) | (3,331 | ) | (4,628 | ) |
Interest income |
| 1,021 |
| 449 |
| |||||||
Other (loss) income |
| (66 | ) | 5,494 |
| |||||||
Foreign exchange gains or losses |
| 558 |
| (237 | ) | 2,079 |
| |||||
Other gains or losses |
| (237 | ) | 1,667 |
|
| (916 | ) | (66 | ) | 202 |
|
Profit (loss) before tax |
| (41,466 | ) | (33,863 | ) | |||||||
Loss before tax |
| (62,051 | ) | (41,466 | ) | (33,863 | ) | |||||
Income tax expense |
| — |
| (214 | ) |
| — |
| — |
| (214 | ) |
Profit (loss) for the year from continuing operations |
| (41,466 | ) | (34,077 | ) | |||||||
Loss for the year from continuing operations |
| (62,051 | ) | (41,466 | ) | (34,077 | ) | |||||
Discontinued operations |
|
|
|
|
|
|
|
|
|
|
|
|
Profit for the year from discontinued operations |
| — |
| 17,103 |
|
| — |
| — |
| 17,103 |
|
Profit (loss) for the year |
| (41,466 | ) | (16,974 | ) | |||||||
Loss for the year |
| (62,051 | ) | (41,466 | ) | (16,974 | ) | |||||
ADDITIONAL INFORMATION — SCHEDULE I
FINANCIAL INFORMATION OF PARENT COMPANY
STATEMENTSSTATEMENT OF FINANCIAL POSITION
|
| 12/31/12 |
| 12/31/11 |
| 1/1/11 |
|
| 12/31/13 |
| 12/31/12 |
| 12/31/11 |
|
|
| USD’000 |
| USD’000 |
| USD’000 |
|
| USD’000 |
| USD’000 |
| USD’000 |
|
Assets |
|
|
|
|
|
|
|
|
|
|
|
|
|
|
Non-current assets |
|
|
|
|
|
|
|
|
|
|
|
|
|
|
Property, plant and equipment |
| 5,728 |
| 3,642 |
| 6,638 |
|
| 7,301 |
| 5,728 |
| 3,642 |
|
Intangible assets |
| 171,629 |
| 125,562 |
| 139,511 |
|
| 154,682 |
| 171,629 |
| 125,562 |
|
Investments in subsidiaries |
| 2,565,148 |
| 2,565,148 |
| 2,099,437 |
| |||||||
Investment in subsidiaries |
| 2,689,158 |
| 2,565,148 |
| 2,565,148 |
| |||||||
Investments in associates |
| 7,665 |
| 7,665 |
| 7,665 |
|
| 12,301 |
| 7,665 |
| 7,665 |
|
Other assets |
| 3,479 |
| 3,479 |
| — |
|
| 1,000 |
| 3,479 |
| 3,479 |
|
Total non-current assets |
| 2,753,649 |
| 2,705,496 |
| 2,253,251 |
|
| 2,864,442 |
| 2,753,649 |
| 2,705,496 |
|
Current assets |
|
|
|
|
|
|
|
|
|
|
|
|
|
|
Inventories |
| 168 |
| 99 |
| 170 |
|
| — |
| 168 |
| 99 |
|
Prepaid operating expenses |
| 1,173 |
| 1,510 |
| 788 |
|
| 626 |
| 1,173 |
| 1,510 |
|
Trade and other receivables |
| 211,942 |
| 184,582 |
| 234,036 |
|
| 201,352 |
| 211,942 |
| 184,582 |
|
Other financial assets |
| 14,878 |
| 255 |
| 2,526 |
|
| — |
| 14,878 |
| 255 |
|
Restricted cash |
| 47,506 |
| 7,500 |
| 7,500 |
|
| 29,130 |
| 47,506 |
| 7,500 |
|
Cash and bank balances |
| 77,869 |
| 60,910 |
| 110,181 |
|
| 162,360 |
| 77,869 |
| 60,910 |
|
Total current assets |
| 353,536 |
| 254,856 |
| 355,201 |
|
| 393,468 |
| 353,536 |
| 254,856 |
|
Total assets |
| 3,107,185 |
| 2,960,352 |
| 2,608,452 |
|
| 3,257,910 |
| 3,107,185 |
| 2,960,352 |
|
Equity and liabilities |
|
|
|
|
|
|
|
|
|
|
|
|
|
|
Capital and reserves |
|
|
|
|
|
|
|
|
|
|
|
|
|
|
Ordinary shares $0.0004 par value, 50,000,000,000 shares authorized, 32,000,139,623, 27,487,676,065, and 27,334,063,747 shares issued and outstanding at December 31, 2012, 2011 and 2010, Respectively |
| 12,800 |
| 10,995 |
| 10,934 |
| |||||||
Convertible preferred shares, $0.0004 par value, 5,000,000,000 shares authorized, nil, 445,545,911 shares and nil issued and outstanding at December 31, 2012, 2011 and 2010, respectively |
| — |
| 178 |
| — |
| |||||||
Ordinary shares $0.0004 par value, 50,000,000,000 shares authorized, 32,112,307,101, 32,000,139,623 and 27,487,676,065 shares issued and outstanding at December 31, 2013, 2012 and 2011, respectively |
| 12,845 |
| 12,800 |
| 10,995 |
| |||||||
Convertible preferred shares, $0.0004 par value, 5,000,000,000 shares authorized, nil, nil and 445,545,911 shares issued and outstanding at December 31, 2013, 2012 and 2011, respectively |
| — |
| — |
| 178 |
| |||||||
Share premium |
| 4,083,588 |
| 4,082,135 |
| 3,762,146 |
|
| 4,090,229 |
| 4,083,588 |
| 4,082,135 |
|
Reserves |
| 41,140 |
| 36,377 |
| 39,447 |
|
| 69,295 |
| 41,140 |
| 36,377 |
|
Accumulated deficit |
| (1,701,430 | ) | (1,659,964 | ) | (1,642,990 | ) |
| (1,763,481 | ) | (1,701,430 | ) | (1,659,964 | ) |
Total equity |
| 2,436,098 |
| 2,469,721 |
| 2,169,537 |
|
| 2,408,888 |
| 2,436,098 |
| 2,469,721 |
|
Non-current liabilities |
|
|
|
|
|
|
|
|
|
|
|
|
|
|
Convertible bonds |
| 180,563 |
| — |
| — |
| |||||||
Promissory notes |
| — |
| 28,560 |
| 56,327 |
|
| — |
| — |
| 28,560 |
|
Other liabilities |
| 5,000 |
| — |
| 9,646 |
|
| — |
| 5,000 |
| — |
|
Total non-current liabilities |
| 5,000 |
| 28,560 |
| 65,973 |
|
| 180,563 |
| 5,000 |
| 28,560 |
|
Current liabilities |
|
|
|
|
|
|
|
|
|
|
|
|
|
|
Trade and other payables |
| 450,784 |
| 215,697 |
| 221,214 |
|
| 527,035 |
| 450,784 |
| 215,697 |
|
Borrowings |
| 180,034 |
| 209,026 |
| 109,470 |
|
| 133,803 |
| 180,034 |
| 209,026 |
|
Accrued liabilities |
| 5,870 |
| 6,404 |
| 8,109 |
|
| 7,615 |
| 5,870 |
| 6,404 |
|
Promissory notes |
| 29,374 |
| 29,374 |
| 29,374 |
|
| — |
| 29,374 |
| 29,374 |
|
Other financial liabilities |
| 25 |
| 1,532 |
| 2,907 |
|
| — |
| 25 |
| 1,532 |
|
Current tax liabilities |
| — |
| 38 |
| 1,868 |
|
| 6 |
| — |
| 38 |
|
Total current liabilities |
| 666,087 |
| 462,071 |
| 372,942 |
|
| 668,459 |
| 666,087 |
| 462,071 |
|
Total liabilities |
| 671,087 |
| 490,631 |
| 438,915 |
|
| 849,022 |
| 671,087 |
| 490,631 |
|
Total equity and liabilities |
| 3,107,185 |
| 2,960,352 |
| 2,608,452 |
|
| 3,257,910 |
| 3,107,185 |
| 2,960,352 |
|
ADDITIONAL INFORMATION — SCHEDULE I
FINANCIAL INFORMATION OF PARENT COMPANY
STATEMENTS OF CASH FLOWS
|
| Year ended |
| Year ended |
|
|
| USD’000 |
| USD’000 |
|
Operating activities: |
|
|
|
|
|
Profit (loss) for the year |
| (41,466 | ) | (16,974 | ) |
Adjustments for: |
|
|
|
|
|
Forgiveness of payables |
| — |
| (17,565 | ) |
Gain on disposition of discontinued operation, net of taxes |
| — |
| (17,103 | ) |
Amortization of intangible assets and land use right |
| 26,433 |
| 23,656 |
|
Depreciation of property, plant and equipment |
| 1,331 |
| 1,299 |
|
Expense recognized in respect of equity-settled share-based payments |
| 7,174 |
| 5,334 |
|
Finance cost |
| 3,331 |
| 4,628 |
|
Loss on disposal of property, plant and equipment |
| — |
| 412 |
|
Interest income recognized in profit or loss |
| (1,021 | ) | (449 | ) |
Impairment loss recognized on trade receivables |
| — |
| (3 | ) |
Net loss (gain) arising on financial assets at fair value through profit or loss |
| 190 |
| (183 | ) |
Net gain arising on financial liabilities at fair value through profit or loss |
| (1,509 | ) | (1,375 | ) |
Reversal of impairment loss on trade receivables |
| (2,095 | ) | (6,400 | ) |
|
| (7,632 | ) | (24,723 | ) |
Movements in working capital: |
|
|
|
|
|
Decrease in trade and other receivables |
| 1,204 |
| 6,905 |
|
(Increase) decrease in inventories |
| (69 | ) | 70 |
|
Decrease (increase) in prepaid operating expenses |
| 347 |
| (722 | ) |
Decrease in trade and other payables |
| (5,412 | ) | (3,583 | ) |
Decrease in accrued liabilities |
| (319 | ) | (1,842 | ) |
Decrease in other liabilities |
| (38 | ) | (11,477 | ) |
Cash used in operations |
| (11,919 | ) | (35,372 | ) |
Interest paid |
| (3,465 | ) | (3,883 | ) |
Interest received |
| 1,021 |
| 449 |
|
Net cash used in operating activities |
| (14,363 | ) | (38,806 | ) |
Cash flows from investing activities |
|
|
|
|
|
Payments to acquire financial assets |
| (38,760 | ) | (19,008 | ) |
Proceeds on sale of financial assets |
| 23,944 |
| 21,462 |
|
Payments for property, plant and equipment |
| — |
| (295 | ) |
Investment in subsidiaries |
| — |
| (451,086 | ) |
Payments for intangible assets |
| (58,167 | ) | (5,406 | ) |
Amounts advanced to a proposed joint venture |
| — |
| (1,000 | ) |
Changes in restricted cash relating to investing activities |
| (40,005 | ) | — |
|
Cash (paid for) received from subsidiaries |
| (26,469 | ) | 51,875 |
|
Net cash used in investing activities |
| (139,457 | ) | (403,458 | ) |
Cash flows from financing activities |
|
|
|
|
|
Proceeds from issuance of convertible preferred shares |
| — |
| 308,298 |
|
Proceeds from borrowings |
| 193,239 |
| 227,210 |
|
Repayment of borrowings |
| (222,232 | ) | (127,653 | ) |
Proceeds from exercise of employee stock options |
| 669 |
| 3,525 |
|
Repayment of promissory notes |
| (30,000 | ) | (30,000 | ) |
Prepayment for bank financing management fee |
| (2,065 | ) | — |
|
Cash received from subsidiaries |
| 231,168 |
| 11,656 |
|
Net cash generated from financing activities |
| 170,779 |
| 393,036 |
|
Net increase (decrease) in cash and cash equivalents |
| 16,959 |
| (49,228 | ) |
Cash and cash equivalents at the beginning of the year |
| 60,910 |
| 110,181 |
|
Effects of exchange rate changes on the balance of cash held in foreign currencies |
| — |
| (43 | ) |
Cash and bank balance at the end of the year |
| 77,869 |
| 60,910 |
|
|
| Year ended |
| Year ended |
| Year ended |
|
|
| USD’000 |
| USD’000 |
| USD’000 |
|
Operating activities |
|
|
|
|
|
|
|
Loss for the year |
| (62,051 | ) | (41,466 | ) | (16,974 | ) |
Adjustments for: |
|
|
|
|
|
|
|
Forgiveness of payables |
| — |
| — |
| (17,565 | ) |
Gain on disposition of discontinued operation, net of taxes |
| — |
| — |
| (17,103 | ) |
Amortization of intangible assets and land use right |
| 28,946 |
| 26,433 |
| 23,656 |
|
Depreciation of property, plant and equipment |
| 1,806 |
| 1,331 |
| 1,299 |
|
Loss from investment in associates |
| 750 |
| — |
| — |
|
Impairment loss of available-for-sale investment |
| 279 |
| — |
| — |
|
Expense recognized in respect of equity-settled share-based payments |
| 16,402 |
| 7,174 |
| 5,334 |
|
Finance costs |
| 2,972 |
| 3,331 |
| 4,628 |
|
Loss on disposal of property, plant and equipment |
| — |
| — |
| 412 |
|
Interest income recognized in profit or loss |
| (1,050 | ) | (1,021 | ) | (449 | ) |
Impairment loss (reversed) recognized on inventory |
| — |
| — |
| (3 | ) |
Net loss (gain) arising on financial assets at fair value through profit or loss |
| 64 |
| 190 |
| (183 | ) |
Net gain arising on financial liabilities at fair value through profit or loss |
| (25 | ) | (1,509 | ) | (1,375 | ) |
Reversal of bad debt allowance on trade receivables |
| — |
| (2,095 | ) | (6,400 | ) |
|
| (11,907 | ) | (7,632 | ) | (24,723 | ) |
Operating cash flows before movements in working capital: |
|
|
|
|
|
|
|
Decrease in trade and other receivables |
| 476 |
| 1,204 |
| 6,905 |
|
Decrease (increase) in inventories |
| 168 |
| (69 | ) | 70 |
|
Decrease (increase) in prepaid operating expenses |
| (91 | ) | 347 |
| (722 | ) |
Decrease (increase) in other payables |
| (53,194 | ) | (5,412 | ) | (3,583 | ) |
Increase in accrued liabilities |
| 74 |
| (319 | ) | (1,842 | ) |
Decrease in other liabilities |
| — |
| (38 | ) | (11,477 | ) |
Cash generated from operations |
| (64,474 | ) | (11,919 | ) | (35,372 | ) |
Interest paid |
| 307 |
| (3,465 | ) | (3,883 | ) |
Interest received |
| 1,050 |
| 1,021 |
| 449 |
|
Net cash used in operating activities |
| (63,117 | ) | (14,363 | ) | (38,806 | ) |
|
|
|
|
|
|
|
|
Investing activities |
|
|
|
|
|
|
|
Payments to acquire financial assets |
| (4,000 | ) | (38,760 | ) | (19,008 | ) |
Proceeds on sale of financial assets |
| 21,020 |
| 23,944 |
| 21,462 |
|
Payments for property, plant and equipment |
| (3,379 | ) | — |
| (295 | ) |
Investment in subsidiaries |
| (129,010 | ) | — |
| (451,086 | ) |
Payments for intangible assets |
| (24,858 | ) | (58,167 | ) | (5,406 | ) |
Payment to a proposed to associates |
| (387 | ) | — |
| — |
|
Amounts advanced to proposed joint ventures |
| — |
| — |
| (1,000 | ) |
Change in Restricted cash relating to investing activities |
| 18,376 |
| (40,005 | ) | — |
|
Cash (paid for) received from subsidiaries |
| 10,112 |
| (26,469 | ) | 51,875 |
|
Net cash used in investing activities |
| (112,126 | ) | (139,457 | ) | (403,458 | ) |
ADDITIONAL INFORMATION — SCHEDULE I
FINANCIAL INFORMATION OF PARENT COMPANY
STATEMENTS OF CASH FLOWS
|
| Year ended |
| Year ended |
| Year ended |
|
|
| USD’000 |
| USD’000 |
| USD’000 |
|
Financing activities |
|
|
|
|
|
|
|
Proceeds from issuance of convertible preferred shares |
| — |
| — |
| 308,298 |
|
Proceeds from borrowings |
| 241,775 |
| 193,239 |
| 227,210 |
|
Repayment of borrowings |
| (288,007 | ) | (222,232 | ) | (127,653 | ) |
Proceeds from issuance of convertible bonds. |
| 195,800 |
| — |
| — |
|
Proceeds from exercise of employee stock options |
| 3,229 |
| 669 |
| 3,525 |
|
Repayment of promissory notes |
| (30,000 | ) | (30,000 | ) | (30,000 | ) |
Prepayment for bank financing management fee |
| (370 | ) | (2,065 | ) | — |
|
Cash received from subsidiaries |
| 137,307 |
| 231,168 |
| 11,656 |
|
Net cash from financing activities |
| 259,734 |
| 170,779 |
| 393,036 |
|
Net increase (decrease) in cash and bank balances |
| 84,491 |
| 16,959 |
| (49,228 | ) |
Cash and bank balances at the beginning of the year |
| 77,869 |
| 60,910 |
| 110,181 |
|
Effects of exchange rate changes on the balance of cash held in foreign currencies |
| — |
| — |
| (43 | ) |
Cash and bank balances at the end of the year |
| 162,360 |
| 77,869 |
| 60,910 |
|
NOTES TO FINANCIAL STATEMENT SCHEDULE I
Schedule 1 has been provided pursuant to the requirements of Rules 12-04(a) and 4-08(e)(3) of SEC Regulation S-X, which require condensed financial information as to financial position, changes in financial position and results of operations of a parent company as of the same dates and for the same periods for which audited consolidated financial statements have been presented when the restricted net assets of consolidated and unconsolidated subsidiaries together exceed 25 percent of consolidated net assets as of the end of the most recently completed fiscal year.
Basic of Presentation
For the purpose of the presentation of the parent company only financial information, the Company records its investment in subsidiaries under the cost method of accounting. Such investment is presented on the statements of financial position as “Investment in subsidiaries” at cost less any identified impairment loss.
Annex A
GLOSSARY OF TECHNICAL TERMS
|
| |
Cell |
| A primary unit that normally repeats many times in an integrated circuit. Cells represent individual functional design units or circuits that may be reused as blocks in designs. For example, a memory cell represents a storage unit in a memory array. |
CIS |
| CMOS Image Sensor. CIS can be used in applications such as still and video cameras and embedded cameras in mobile telephones. It is a fast growing imaging sensor technology. The fabrication of CIS is fully compatible with the mainstream CMOS process, which enables system-on-chip capability, low power consumption and low cost of fabrication. |
Clean room |
| Area within a fab in which the wafer fabrication takes place. The classification of a clean room relates to the maximum number of particles of contaminants per cubic foot within that room. For example, a class 100 clean room contains less than 100 particles of contaminants per cubic foot. |
CMOS |
| Complementary Metal Oxide Silicon. A fabrication process that incorporates n-channel and p-channel CMOS transistors within the same silicon substrate. Currently, this is the most commonly used integrated circuit fabrication process technology and is one of the latest fabrication techniques to use metal oxide semiconductor transistors. |
CVD |
| Chemical Vapor Deposition. A process in which gaseous chemicals react on a heated wafer surface to form solid film. |
Die |
| One individual chip cut from a wafer before being packaged. |
|
| |
|
| |
DRAM |
| Dynamic Random Access Memory. A device that temporarily stores digital information but requires regular refreshing to ensure data is not lost. |
DSP |
| Digital Signal Processor. A type of integrated circuit that processes and manipulates digital information after it has been converted from an analog source. |
eEEPROM |
| Embedded Electrically Erasable Programmable Read-Only Memory is a type of embedded Non-Volatile Memory that has similar function as an EEPROM, but in generally is embedded in a system or in a controller IC or SoC |
EEPROM |
| Electrically Erasable Programmable Read-Only Memory. An integrated circuit that can be electrically erased and electrically programmed with user-defined information. |
EPROM |
| Erasable Programmable Read-Only Memory. A form of PROM that is programmable electrically yet erasable using ultraviolet light. |
FinFet |
| |
|
| |
| the device. The | |
device. FinFET greatly reduces the leakage currents and enables the use of lower threhold voltages and results better performance and power savings. | ||
Flash memory |
| A type of non-volatile memory where data is erased in blocks. The name “flash” is derived from the rapid block erase operation. Flash memory requires only one transistor per memory cell versus two transistors per memory cell for EEPROMs, making flash memory less expensive to produce. Flash memory is the most popular form of non-volatile semiconductor memory currently available. |
Gold Bumping |
| The fabrication process of forming gold bump termination electrodes on a finished wafer. |
High-K Metal |
| High-k Metal Gate (HKMG) is referring to High-k dielectrics, used in semiconductor manufacturing process with metallic gate, generally replaces a silicon dioxide gate dielectric or another dielectric layers of a device. HKMG allows the increase of gate capacitance without the associated leakage effects. |
| ||
High voltage semiconductor |
| High voltage semiconductors are semiconductor devices that can drive relatively high voltage potential to systems that require higher voltage of between five volts to several hundred volts. |
IDM |
| Integrated Device Manufacturer. |
Integrated circuit |
|
|
Interconnect |
| Conductive materials such as aluminum doped polysilicon or copper that form the wiring circuitry to carry electrical signals to different parts of the chip. |
I/O |
| Inputs/Outputs. |
|
| |
Logic device |
| A device that contains digital integrated circuits that perform a function rather than store information. |
|
| |
Mask |
| A glass plate with a pattern of transparent and opaque areas used to create patterns on wafers. “Mask” is commonly used to refer to a plate that has a pattern large enough to pattern a whole wafer at one time, as compared to a reticle, where a glass plate can contain the pattern for one or more dies but is not large enough to transfer a wafer-sized pattern all at once. |
|
| |
Memory |
| A device that can store information for later retrieval. |
MEMS |
| Micro-Electro-Mechanical Systems. |
Micro-display |
| A small display that is of such high resolution that it is only practically viewed or projected with lenses or mirrors. A micro-display is typically magnified by optics to enlarge the image viewed by the user. For example, a miniature display smaller than one inch in size may be magnified to provide a 12-inch to |
Micron |
| A term for micrometer, which is a unit of linear measure that equals one one-millionth (1/1,000,000) of a meter. There are 25.4 microns in one one-thousandth of an inch. |
Mixed-signal |
| The combination of analog and digital circuitry in a single semiconductor. |
MPW |
| |
|
| |
|
| |
|
| |
to produce in low quantities. | ||
Nanometer |
| A term for micrometer, which is a unit of linear measure that equals one thousandth (1/1,000) of a micron. |
Non-volatile memory |
| Memory products that maintain their content when the power supply is switched off. |
PolySiON |
| |
|
| |
silicon oxygen nitride gate dielectrics. | ||
PROM |
| Programmable Read-Only Memory. Memory that can be reprogrammed once after manufacturing. |
RAM |
| Random Access Memory. Memory devices where any memory cell in a large memory array may be accessed in any order at random. |
Reticle |
| See “Mask” above. |
RF |
| Radio Frequency. Radio frequency semiconductors are primarily used in communications devices such as cell phones. |
ROM |
| Read-Only Memory. See “Mask ROM” above. |
Scanner |
| An aligner that scans light through a slit across a mask to produce an image on a wafer. |
Semiconductor An element with an electrical resistivity within the range of an insulator and a conductor. A semiconductor can conduct or block the flow of electric current depending on the direction and magnitude of applied electrical biases.
Solder bumping The fabrication processes of forming solder bump termination electrodes, which are elevated metal structures, or lead free bump termination electrodes.
An element with an electrical resistivity within the range of an insulator and a conductor. A semiconductor can conduct or block the flow of electric current depending on the direction and magnitude of applied electrical biases. | ||
Solder bumping | The fabrication processes of forming solder bump termination electrodes, which are elevated metal structures, or lead free bump termination electrodes. | |
SRAM |
| Static Random Access Memory. A type of volatile memory product that is used in electronic systems to store data and program instructions. Unlike the more common DRAM, it does not need to be refreshed. |
|
| A |
System-on-chip A chip that incorporates functions usually performed by several different devices and therefore generally offers better performance and lower cost.
Systems companies |
| Companies that design and manufacture complete end market products or systems for sale to the market. |
Transistor |
| An individual circuit that can amplify or switch electric current. This is the building block of all integrated circuits. |
Volatile memory |
| |
|
|
Volatile memory Memory products that lose their content when the power supply is switched off. Wafer A thin, round, flat piece of silicon that is the base of most integrated circuits.