As filed with the Securities and Exchange Commission on April 28, 20162021
UNITED STATES
SECURITIES AND EXCHANGE COMMISSION
WASHINGTON, D.C. 20549
FORM 20-F
| ANNUAL REPORT PURSUANT TO SECTION 13 OR 15(d) OF THE SECURITIES EXCHANGE ACT OF 1934 |
Commission file number 001-13142
Embotelladora Andina S.A. |
(Exact name of Registrant as specified in its charter) |
| Andina Bottling Company |
(Translation of Registrant’s name |
Republic of Chile |
(Jurisdiction of incorporation or organization) |
Miraflores 9153, 7th Floor Renca - Santiago, Chile |
(Address of principal executive offices) |
Paula Vicuña, Tel. (56-2) 2338-0520 E-mail: paula.vicuna@koandina.com Miraflores 9153, 7th Floor - Renca - Santiago, Chile |
(Name, Telephone, E-mail and/or Facsimile number and Address of Company Contact Person) |
Securities registered or to be registered pursuant to Section 12(b) of the Act.
Title of each class | Trading Symbol | Name of each exchange on which registered | |
Series A Shares, Series B Shares of Registrant represented by American Depositary Shares | AKO.A AKO.B | New York Stock Exchange |
Securities registered or to be registered pursuant to Section 12(g) of the Act: None
Securities for which there is a reporting obligation pursuant to Section 15(d) of the Act: None
Indicate the number of outstanding shares of each of the issuer’s classes of capital or common stock as of the close of the period covered by the annual report.
Series A Shares | 473,289,301 | |
Series B Shares | 473,281,303 |
Indicate by check mark if the registrant is a well-known seasoned issuer, as defined in Rule 405 of the Securities Act.
x Yes ¨oNo
If this report is an annual or transition report, indicate by check mark if the registrant is not required to file reports pursuant to Section 13 or 15(d) of the Securities Exchange Act of 1934.
o¨ Yes x No
Indicate by check mark whether the registrant (1) has filed all reports required to be filed by Section 13 or 15(d) of the Securities Exchange Act of 1934 during the preceding 12 months (or for such shorter period that the registrant was required to file such reports), and (2) has been subject to such filing requirements for the past 90 days.
x Yes ¨o No
Indicate by check mark whether the registrant has submitted electronically and posted on its corporate Web site, if any, every Interactive Data File required to be submitted and posted pursuant to Rule 405 of Regulation S-T (§232.405 of this chapter) during the preceding 12 months (or for such shorter period that the registrant was required to submit and post such files).
ox Yes ¨x No
Indicate by check mark whether the registrant is a large accelerated filer, an accelerated filer, or a non-accelerated filer.filer, or an emerging growth company. See definitionthe definitions of “large accelerated filer,” “accelerated filer,” and large accelerated filer”“emerging growth company” in Rule 12b-2 of the Exchange Act. (Check one):
Large accelerated filer x | Accelerated filer | Non-accelerated filer | Emerging growth company ¨ |
If an emerging growth company that prepares its financial statements in accordance with U.S. GAAP, indicate by check mark if the registrant has elected not to use the extended transition period for complying with any new or revised financial accounting standards† provided pursuant to Section 13(a) of the Exchange Act. ¨
+†The term ‘‘new or revised financial accounting standard’’ refers to any update issued by the Financial Accounting Standards Board to its Accounting Standards Codification after April 5, 2012.
Indicate by check mark whether the registrant has filed a report on and attestation to its management’s assessment of the effectiveness of its internal control over financial reporting under Section 404(b) of the Sarbanes-Oxley Act (15 U.S.C. 7262(b)) by the registered public accounting firm that prepared or issued its audit report.
x Yes ¨ No
Indicate by check mark which basis of accounting the registrant has used to prepare the financial statements included in this filing:
U.S. GAAP | International Financial Reporting Standards as issued | Other |
If “Other” has been checked in response to the previous question, indicate by check mark which financial statement item the registrant has elected to follow.
o¨ Item 17 ¨o Item 18
If this is an annual report, indicate by check mark whether the registrant is a shell company (as defined in Rule 12b-2 of the Exchange Act).
o¨ Yes x No
ReferencesCertain Definitions
Unless the context otherwise requires, as used in this annual report the following terms have the meanings set forth below:
| · | the “Company,” “we,” “our,” “Andina” and “Coca-Cola Andina” means Embotelladora Andina S.A. and its consolidated subsidiaries; |
· the “Company”, “we”, “Andina” and “Coca-Cola Andina” means Embotelladora Andina S.A. and its consolidated subsidiaries;
| · | “Andina Argentina” means our subsidiary, Embotelladora del Atlántico S.A., or EDASA; |
· “Andina Brazil” means our subsidiary, Rio de Janeiro Refrescos Ltda. and its subsidiaries;
| · | “Andina Brazil” means our subsidiary, Rio de Janeiro Refrescos Ltda. and its subsidiaries; |
· “AESA” means our subsidiary, Andina Empaques Argentina S.A.;
| · | “AEASA” means our subsidiary, Andina Empaques Argentina S.A.; |
· “EDASA” means our subsidiary, Embotelladora del Atlántico S.A.;
| · | “EDASA” means our subsidiary, Embotelladora del Atlántico S.A.; |
· “PARESA” means our subsidiary, Paraguay Refrescos S.A.;
| · | “PARESA” means our subsidiary, Paraguay Refrescos S.A.; |
· “CMF” means our affiliate, Envases CMF S.A.;
| · | “Envases CMF” means our affiliate, Envases CMF S.A.; |
· “ECSA” means our affiliate, Envases Central S.A.;
| · | “ECSA” means our subsidiary, Envases Central S.A.; |
· “Vital Jugos” means our affiliate, Vital Jugos S.A., previously known as Vital S.A.;
| · | “Vital Jugos” means our subsidiary, VJ S.A., previously known as Vital S.A. and subsequently Vital Jugos S.A.; |
· “VASA” means our affiliate, Vital Aguas S.A.;
| · | “VASA” means our subsidiary, Vital Aguas S.A.; |
· “TAR” means our subsidiary, Transportes Andina Refrescos Ltda.;
| · | “TAR” means our subsidiary, Transportes Andina Refrescos Ltda.; |
· “TP” means our subsidiary, Transportes Polar S.A.;
| · | “The Coca-Cola Company” means The Coca-Cola Company and its subsidiaries, including without limitation Coca-Cola de Chile S.A. (“CC Chile”), which operates in Chile, Recofarma Industrias do Amazonas Ltda. (“CC Brazil”), which operates in Brazil, and Servicios y Productos para Bebidas Refrescantes S.R.L. (“CC Argentina”), which operates in Argentina; |
· “The Coca-Cola Company” means The Coca-Cola Company or any of its subsidiaries, including without limitation Coca-Cola de Chile S.A. (“CC Chile”), which operates in Chile, Recofarma Industrias do Amazonas Ltda. (“CC Brazil”), which operates in Brazil and Servicios y Productos para Bebidas Refrescantes S.R.L. (“CC Argentina”), which operates in Argentina;
| · | the “Chilean territory” means the regions of Antofagasta, Atacama, Coquimbo, Metropolitan Region of Santiago, Aysén and Magallanes and the Chilean Antartic and the provinces of Cachapoal and San Antonio; |
· the “Chilean territory” means the Metropolitan Region of Santiago, the Coquimbo region, and the provinces of Cachapoal, San Antonio, Antofagasta, Atacama, Aisén and Magallanes;
| · | the “Brazilian territory” means the greater part of the State of Rio de Janeiro, the totality of the State of Espírito Santo and parts of the state of São Paulo and the state of Minas Gerais; |
· the “Brazilian territory” means the majority of the State of Rio de Janeiro, and the totality of the State of Espírito Santo, part of the state of São Paulo and part of the state of Minas Gerais;
| · | the “Argentine territory” means the provinces of Córdoba, Mendoza, San Juan, San Luis, Santa Fe, Entre Ríos, La Pampa, Neuquén, Río Negro, Chubut, Santa Cruz, Tierra del Fuego as well as the western part of the province of Buenos Aires; and, |
· the “Argentine territory” means the provinces of Córdoba, Mendoza, San Juan, San Luis, Entre Rios, Buenos Aires (only San Nicolás and Ramallo), La Pampa, Neuquén, Río Negro, Chubut, Santa Cruz, Tierra del Fuego and most of Santa Fe as well as part of the province of Buenos Aires; and
·
| · | the “Paraguayan territory” means the country of Paraguay. |
Presentation of Financial and Certain Other Information
PRESENTATION OF FINANCIAL AND CERTAIN OTHER INFORMATION
Unless otherwise specified, references herein to “dollars,”“dollars”, “U.S. dollars” or “US$” are to United States dollars; references to “pesos,”“pesos”, “Chilean pesos”, “Ch$” or “ThCh$” are to Chilean pesos; references to “Argentine pesos” or “AR$” are to Argentine pesos,pesos; references to “real” or, “reais” or “R$” are to Brazilian reaisreais; and references to “guaranies” or “guarani”“guaraníes”, “guaraní” or “G$” are to Paraguayan Guaranies.guaraníes. References to “UF” are to Unidades de Fomento. The UF is an inflation-indexed Chilean monetary unit with a value in Chilean pesos that is adjusted daily to reflect changes in the official consumer price index of the Instituto Nacional de Estadísticas (the “Chilean National Institute of Statistics”). The UF is adjusted in monthly cycles. Each day in the period beginning on the tenth day of the current month through the ninth day of the succeeding month, the nominal peso value of the UF is indexed up (or down in the event of deflation) in order to reflect a proportionate amount of the change in the Chilean consumer price index during the prior calendar month. Certain percentages and amounts contained in this annual report have been rounded for ease of presentation.
In this annual report certain (local currency) amounts have been converted into United States dollars at the rate of Ch$654.66 to the dollar when it is average exchange rate and Ch$710.16 to the dollar when it is year end exchange rate. Such conversions should not be construed as representations that the (local currency) amounts represent, or have been or could be converted into, United States dollars at that or any other rate.
The Company’s Consolidated Financial Statementsconsolidated financial statements for the years ended December 31, 2014, 2013, 2012, 20112018, 2019 and 20102020 were prepared in accordance with International Financial Reporting Standards (hereinafter “IFRS”) issued by the International Accounting Standards Board (hereinafter “IASB”).
Special Note Regarding Non-IFRS Financial Measures
This annual report makes reference to certain non-IFRS measures, namely EBIT, EBITDA and Adjusted EBITDA. These non-IFRS measures are not recognized measures under IFRS, do not have a standardized meaning prescribed by IFRS and are therefore unlikely to be comparable to similar measures presented by other companies. Rather, these measures are provided as additional information to complement IFRS measures by providing further understanding of the Company’s results of operations from management’s perspective. Accordingly, they should not be considered in isolation nor as a substitute for analysis of our financial information reported under IFRS.
EBIT represents profit attributable to controlling shareholders before net interest expense and income taxes. EBITDA represents EBIT plus depreciation and amortization expense. Adjusted EBITDA represents EBITDA plus other expenses (income), net. We have included EBIT, EBITDA and Adjusted EBITDA to provide investors with a supplemental measure of our operating performance.
We believe EBIT, EBITDA and Adjusted EBITDA are an important supplemental measure of operating performance because they eliminate items that have less bearing on our operating performance and thus highlight trends in our core business that may not otherwise be apparent when relying solely on IFRS financial measures. We also believe that securities analysts, investors and other interested parties frequently use EBITDA in the evaluation of issuers, many of which present EBITDA when reporting their results.
Our management also uses EBITDAconsolidated financial statements are presented in Chilean pesos. Our consolidated financial statements reflect the results of our subsidiaries located in Brazil, Argentina and Adjusted EBITDAParaguay, converted to Chilean pesos (our functional and presentation currency). IFRS requires assets and liabilities to be converted from the functional currency of our subsidiaries outside Chile to our reporting currency (Chilean peso) at the end of period exchange rates and income and expense accounts to be converted at the average monthly exchange rate for the month in order to facilitate operating performance comparisons from period to period, prepare annual operating budgets, assess our ability to meet our future debt service, capital expenditure and working capital requirements and assess our ability to pay dividends on our capital stock.which income or expense is recognized for subsidiaries that do not operate in hyperinflationary economies.
EBIT, EBITDAIn the case of our Argentine subsidiaries, which have been operating in an environment that during 2018, 2019 and Adjusted EBITDA have important limitations2020 was classified as analytical tools. For example, neither EBIT, EBITDA nor Adjusted EBITDA reflect (a) our cash expenditures or future requirements for capital expenditures or contractual commitments; (b) changes in, or cash requirements for, our working capital needs; (c) significant interest expense orhyperinflationary, the cash requirements necessary to service interest or principal payments on our debt; and (d) tax payments or distributionsconversion criteria from the functional currency of those subsidiaries to our parent to make payments with respect to taxes attributable to us that represent a reductionpresentation currency is the following:
| · | First adoption of a hyperinflationary economy was in 2018: Losses and gains by correction of current non-monetary items the previous year were recorded in accumulated results as of January 1, 2018. |
| · | Statement of financial position (balance sheet): Non-monetary items are expressed in the current currency at the balance sheet date and translated to the presentation currency of the closing exchange rate. Losses and gains are included in net earnings (fiscal year income). |
| · | Income statement: Income statement items are expressed in the current currency unit at the end of the reporting period, using the variation of the general price index from the date on which the expenses and revenues were accrued, and translated to the presentation currency at closing exchange rate. |
| · | Cash flow statement: Cash flow statement items are expressed in the current currency unit at the end of the reporting period and translated to the presentation currency at closing exchange rate. |
For more information on the effects of the hyperinflationary environment in cash available to us. Although we consider the items excluded in the calculationArgentina see note 2.5 of non-IFRS measures to be less relevant to evaluate our performance, some of these items may continue to take place and accordingly may reduce the cash available to us.consolidated financial statements included herein.
We believe that the presentation of the non-IFRS measures described aboveUnless otherwise specified, our financial data is appropriate. However, these non-IFRS measures have important limitations as analytical tools, and you should not consider thempresented herein in isolation, or as substitutes for analysis of our results as reported under IFRS. Because of these limitations, we primarily rely on our results as reported in accordance with IFRS and use EBIT, EBITDA and Adjusted EBITDA only complementarily. In addition, because other companies may calculate EBITDA and Adjusted EBITDA differently than we do, EBITDA may not be, and Adjusted EBITDA as presented in this report is not, comparable to similarly titled measures reported by other companies.Chilean pesos.
Forward-Looking Statements
This annual report includes forward looking statements, principally under the captions “Item 4. Information on the Company—Part B. Business Overview,” “Item 3. Key Information—Part D. Risk Factors,” and “Item 5. Operating and Financial Review and Prospects.” We have based these forward-looking statements largely on our current beliefs, expectations and projections about future events and financial trends affecting our business. Examples of such forward-looking statements include:
| · | statements of our plans, objectives or goals, including those related to anticipated trends, competition or regulation; |
· statements of our plans, objectives or goals, including those related to anticipated trends, competition or regulation;
| · | statements about our future economic performance and that of Chile or other countries in which we operate; |
· statements about our future economic performance and that of Chile or other countries in which we operate;
| · | statements about our exposure to market risks, including interest rate risks, foreign exchange risk and equity price risk; and |
· statements about our exposure to market risks, including interest rate risks, foreign exchange risk and equity price risk; and
| · | statements of assumptions underlying such statements. |
· statements of assumptions underlying such statements.
Words such as “believes,” “expects,” “anticipates,” “projects,” “intends,” “should,” “could,” “may,” “seeks,” “aim,” “combined,” “estimates,” “probability,” “risk,” “target,” “goal,” “objective,” “future” or similar expressions are intended to identify forward-looking statements but are not the exclusive means of identifying such statements. These statements may relate to (i) our asset growth and financing plans, (ii) trends affecting our financial condition or results of operations and (iii) the impact of competition and regulations, but are not limited to such topics. Forward-looking statements are not guarantees of future performance and involve risks and uncertainties, and actual results may differ materially and adversely from those described in such forward-looking statements included in this annual report as a result of various factors (including, without limitation, the actions of competitors, future global economic conditions, market conditions, foreign exchange rates and operating and financial risks), many of which are beyond our control. The occurrence of any such factors not currently expected by us would significantly alter the results set forth in these statements.
You should understand that the following important factors, in addition to those discussed elsewhere in this annual report, could affect our future results and could cause those results or other outcomes to differ materially and adversely from those expressed in our forward-looking statements:
| · | changes in general economic, business, political or other conditions in the regions where we operate; |
· changes in general economic, business, political or other conditions in the regions where we operate;
| · | the impact of the ongoing COVID-19 pandemic and government measures aimed at limiting the spread of the virus; |
· changes in the legal and regulatory framework of the beverage sector in the regions where we operate;
| · | changes in the legal and regulatory framework of the beverage sector in the regions where we operate; |
· the monetary and interest rate policies of the central banks of the countries in which we operate;
| · | the monetary and interest rate policies of the central banks of the countries in which we operate; |
· unanticipated movements or volatility in interest rates, foreign exchange rates, equity prices or other rates or prices;
| · | unanticipated movements or volatility in interest rates, foreign exchange rates, inflation, equity prices or other rates or prices; |
· changes in, or our failure to comply with, laws and regulations in the countries where we operate and applicable foreign laws;
| · | changes in taxes; |
· changes in taxes;
| · | our inability to hedge certain risks economically; |
· changes in competition and pricing environments;
| · | potential effects of weather conditions, earthquakes, tsunamis or other natural disasters; |
· our inability to hedge certain risks economically;
| · | the outcome of litigation against us; |
· potential effects of weather conditions, earthquakes, tsunamis or other natural disasters;
| · | the nature and extent of competition in the beverage industry in Latin America and the effect of competition on the prices we are able to charge for our products; |
· the outcome of litigation against us;
| · | volatility and fluctuations in demand for our products and the effect of such changes on the volume that we are able to sell and the price that we are able to charge for our products; |
· the nature and extent of competition in the beverage industry in Latin America and the effect of competition on the prices we are able to charge for our products;
| · | capital and credit market conditions, including the availability of credit changes in interest rates; |
· volatility and fluctuations in demand for our products and the effect of such changes on the prices that we are able to charge for our products;
| · | delays in the development of our projects, changes to our investment plans, due to changes in demand, authorizations, etc.; and |
· capital and credit market conditions, including the availability of credit and changes in interest rates;
· delays in the development of our projects, changes to our investment plans due to changes in demand, authorizations, expropriations, etc.;
· actions of our shareholders;
· unanticipated increases in financing and other costs or the inability to obtain additional debt or equity financing on attractive terms if at all; and
· the factors described under “Risk Factors” beginning on page 8.
| · | the factors described under “Risk Factors”. |
The forward-looking statements contained in this document speak only as of the date of this annual report, and we do not undertake any obligation to update any forward-looking statement to reflect events or circumstances after the date hereof or to reflect the occurrence of unanticipated events,. unless required by law.
Market Data
We have computed the information contained in this annual report regarding annual volume and per capita growth rates and levels, and market share, product segment, and population data in our bottling territories, based upon accumulated statistics developed by us. Market share information presented with respect to soft drinks, juices, waters and beer is based on data supplied by A.C. Nielsen Company.
ITEM 1.IDENTITY OF DIRECTORS, SENIOR MANAGEMENT AND ADVISERS
| ITEM 1. | IDENTITY OF DIRECTORS, SENIOR MANAGEMENT AND ADVISERS |
Not applicable.
ITEM 2.OFFER STATISTICS AND EXPECTED TIMETABLE
| ITEM 2. | OFFER STATISTICS AND EXPECTED TIMETABLE |
Not applicable.
| ITEM 3. | KEY INFORMATION |
A.Selected Financial Data
| A. | Reserved. |
The following tables present certain summary consolidatedselected financial data previously required by Item 3.A of Form 20-F has been omitted in reliance on SEC Release No. 33-10890, Management’s Discussion and other financialAnalysis, Selected Financial Data and operating information of Andina at the dates and for the periods indicated. This information should be read in conjunction with, and is qualified in its entirety by reference to our consolidated financial statements, including the notes thereto, included elsewhere in this annual report and our consolidated financial statements, including the notes thereto, included herein.Supplementary Financial Information.
The summary consolidated financial information as of December 31, 2014 and 2015 and for the years ended December 31, 2013, 2014 and 2015 has been derived from our audited consolidated financial statements as of December 31, 2015 and 2014. The summary consolidated financial information as of December 31, 2011, 2012 and 2013 and for the year ended December 31, 2011 and 2012 has been derived from our audited consolidated financial statements as of and for the years then ended not included herein.
On October 1, 2012, we consummated the acquisition of Polar, which significantly enhanced the size and scope of our company. We began consolidating the results of operations of Polar into our consolidated financial statements as of October 1, 2012. As a result, our consolidated results of operations for the year ended December 31, 2012 are not fully comparable to our consolidated results of operations for previous periods.
On October 11, 2013, Andina Brazil consummated its acquisition of Ipiranga in an all-cash transaction. We began consolidating the results of operations of Ipiranga into our consolidated financial statements as of October 1, 2013. As a result, our consolidated results of operations for the year ended December 31, 2013 are not fully comparable to our consolidated results of operations for previous periods.
Our consolidated financial statements reflect the results of our subsidiaries located in Brazil, Argentina and Paraguay, converted to Chilean pesos (our functional and reporting currency) and are presented in accordance with IFRS. IFRS requires assets and liabilities to be converted from the functional currency of our subsidiaries outside Chile to our reporting currency (Chilean peso) at the end of period exchange rates and income and expense accounts to be converted at the average monthly exchange rate for the month in which income or expense is recognized. Unless otherwise specified, our financial data is presented herein in Chilean pesos and U.S. dollars.
Our income and cash flow accounts have been converted according to the average exchange rate during the relevant periods, using the average of monthly averages, and therefore may differ from a daily average of the observed exchange rate. Balance sheet accounts have been converted using the exchange rate at the end of the relevant period.
|
| Year ended December 31, |
| ||||||||||
|
| 2011 |
| 2012(2) |
| 2013(3) |
| 2014 |
| 2015 |
| 2015 |
|
|
| (in millions of Ch$ and millions of US$) |
| ||||||||||
|
| Ch$ |
| Ch$ |
| Ch$ |
| Ch$ |
| Ch$ |
| US$ |
|
INCOME STATEMENT DATA |
|
|
|
|
|
|
|
|
|
|
|
|
|
Net sales |
| 982,864 |
| 1,172,293 |
| 1,521,681 |
| 1,797,200 |
| 1,877,394 |
| 2,868 |
|
Cost of sales |
| (578,581 | ) | (698,955 | ) | (914,818 | ) | (1,081,243 | ) | (1,106,706 | ) | (1,691 | ) |
Gross profit |
| 404,283 |
| 473,338 |
| 606,863 |
| 715,957 |
| 770,688 |
| 1,177 |
|
Other income |
| 2,125 |
| 2,518 |
| 4,386 |
| 3,971 |
| 472 |
| 1 |
|
Distribution expenses |
| (98,808 | ) | (122,819 | ) | (163,023 | ) | (187,043 | ) | (202,491 | ) | (309 | ) |
Administrative expenses |
| (163,051 | ) | (196,355 | ) | (272,556 | ) | (342,141 | ) | (352,601 | ) | (539 | ) |
Other expenses |
| (11,915 | ) | (15,420 | ) | (30,462 | ) | (18,591 | ) | (21,983 | ) | (34 | ) |
Other (expense) income, net(4) |
| 1,495 |
| (2,336 | ) | 740 |
| (4,392 | ) | (6,301 | ) | (10 | ) |
Financial income |
| 3,182 |
| 2,728 |
| 4,973 |
| 8,656 |
| 10,118 |
| 15 |
|
Financial expenses |
| (7,235 | ) | (11,173 | ) | (28,944 | ) | (65,081 | ) | (55,669 | ) | (85 | ) |
Share of (loss) profit of investments accounted for using the equity method |
| 2,026 |
| 1,770 |
| 783 |
| 1,191 |
| (2,328 | ) | (4 | ) |
Foreign exchange differences |
| 3 |
| (4,471 | ) | (7,695 | ) | (2,676 | ) | (2,856 | ) | (4 | ) |
Loss from differences in indexed financial assets and liabilities |
| (393 | ) | (1,006 | ) | (1,832 | ) | (12,463 | ) | (7,308 | ) | (10 | ) |
Net income before income taxes |
| 131,712 |
| 126,774 |
| 113,233 |
| 97,388 |
| 129,741 |
| 198 |
|
Income tax expense |
| (34,685 | ) | (38,505 | ) | (22,966 | ) | (45,354 | ) | (41,643 | ) | (63 | ) |
Net income |
| 97,027 |
| 88,269 |
| 90,267 |
| 52,034 |
| 88,098 |
| 135 |
|
|
|
|
|
|
|
|
|
|
|
|
|
|
|
BALANCE SHEET DATA |
|
|
|
|
|
|
|
|
|
|
|
|
|
Assets |
|
|
|
|
|
|
|
|
|
|
|
|
|
Current assets: |
|
|
|
|
|
|
|
|
|
|
|
|
|
Cash and cash equivalents |
| 31,298 |
| 55,522 |
| 79,976 |
| 79,514 |
| 129,160 |
| 182 |
|
Other financial assets |
| 15,661 |
| 129 |
| 36,472 |
| 106,577 |
| 87,492 |
| 123 |
|
Other non-financial assets |
| 14,761 |
| 18.203 |
| 9,696 |
| 7,787 |
| 8,686 |
| 12 |
|
Trade and other accounts receivable, net |
| 107,443 |
| 152,817 |
| 195,434 |
| 198,110 |
| 176,386 |
| 248 |
|
Accounts receivable from related parties |
| 6,419 |
| 5,324 |
| 8,029 |
| 5,994 |
| 4,611 |
| 6 |
|
Inventories |
| 57,487 |
| 89,320 |
| 125,854 |
| 149,728 |
| 133,333 |
| 188 |
|
Current tax assets |
| 2,463 |
| 2,879 |
| 3,990 |
| 6,026 |
| 7,742 |
| 12 |
|
Non-current assets classified as available for sale |
| — |
| 2,978 |
| 1,133 |
| — |
| — |
| — |
|
Total current assets |
| 235,532 |
| 327,172 |
| 460,584 |
| 553,736 |
| 547,410 |
| 771 |
|
|
|
|
|
|
|
|
|
|
|
|
|
|
|
Non current assets: |
|
|
|
|
|
|
|
|
|
|
|
|
|
Other financial assets |
| — |
| — |
| 7,922 |
| 51,027 |
| 181,491 |
| 256 |
|
Other non-financial assets |
| 30,194 |
| 26,927 |
| 28,796 |
| 33,057 |
| 18,290 |
| 26 |
|
Trade and other receivables |
| 7,176 |
| 6,724 |
| 7,631 |
| 7,098 |
| 5,932 |
| 8 |
|
Accounts receivable from related parties |
| 11 |
| 7 |
| 19 |
| 25 |
| 15 |
| — |
|
Investments accounted for under the equity method |
| 60,291 |
| 73,080 |
| 68,673 |
| 66,050 |
| 54,191 |
| 76 |
|
Intangible assets other than goodwill |
| 1,139 |
| 464,582 |
| 700,606 |
| 728,181 |
| 665,666 |
| 937 |
|
Goodwill |
| 57,552 |
| 64,793 |
| 115,779 |
| 116,924 |
| 95,836 |
| 135 |
|
Property, plant and equipment |
| 350,064 |
| 576,551 |
| 692,950 |
| 713,075 |
| 640,530 |
| 902 |
|
Total non-current assets |
| 506,427 |
| 1,212,664 |
| 1,622,377 |
| 1,715,437 |
| 1,661,951 |
| 2,340 |
|
Total assets |
| 741,959 |
| 1,539,836 |
| 2,082,961 |
| 2,269,173 |
| 2,209,361 |
| 3,111 |
|
|
|
|
|
|
|
|
|
|
|
|
|
|
|
Liabilities |
|
|
|
|
|
|
|
|
|
|
|
|
|
Current liabilities |
|
|
|
|
|
|
|
|
|
|
|
|
|
Other financial liabilities |
| 23,093 |
| 106,248 |
| 106,877 |
| 83,402 |
| 62,218 |
| 88 |
|
Trade and other accounts payable |
| 127,941 |
| 184,318 |
| 210,446 |
| 228,179 |
| 212,526 |
| 299 |
|
Accounts payable to related parties |
| 11,359 |
| 32,727 |
| 43,425 |
| 55,967 |
| 48,653 |
| 69 |
|
Provisions |
| 88 |
| 593 |
| 270 |
| 366 |
| 326 |
| — |
|
Income taxes payable |
| 3,821 |
| 1,115 |
| 3,679 |
| 2,931 |
| 7,495 |
| 11 |
|
Employee benefits current provisions |
| 14,079 |
| 19,633 |
| 21,440 |
| 27,747 |
| 31,791 |
| 45 |
|
Other non-financial liabilities |
| 16,263 |
| 737 |
| 16,007 |
| 11,620 |
| 17,565 |
| 24 |
|
Total current liabilities |
| 196,644 |
| 345,371 |
| 402,144 |
| 410,212 |
| 380,574 |
| 536 |
|
|
|
|
|
|
|
|
|
|
|
|
|
|
|
Non-current liabilities |
|
|
|
|
|
|
|
|
|
|
|
|
|
Other long-term current financial liabilities |
| 74,641 |
| 173,880 |
| 605,362 |
| 726,616 |
| 765,299 |
| 1,078 |
|
Trade and other payables |
| 164 |
| 1,930 |
| 1,262 |
| 1,216 |
| 9,303 |
| 13 |
|
Provisions |
| 7,883 |
| 6,422 |
| 77,542 |
| 77,447 |
| 63,976 |
| 90 |
|
Deferred income tax liabilities |
| 35,245 |
| 111,415 |
| 105,537 |
| 126,126 |
| 130,202 |
| 183 |
|
Post-employment benefit liabilities |
| 5,130 |
| 7,037 |
| 8,759 |
| 8,125 |
| 8,230 |
| 12 |
|
Other non-financial liabilities |
| 273 |
| 176 |
| 922 |
| 433 |
| 243 |
| — |
|
Total Non-Current Liabilities |
| 123,336 |
| 300,860 |
| 799,384 |
| 939,963 |
| 977,253 |
| 1,376 |
|
|
|
|
|
|
|
|
|
|
|
|
|
|
|
Issued capital |
| 230,892 |
| 270,737 |
| 270,737 |
| 270,737 |
| 270,737 |
| 381 |
|
Retained earnings |
| 208,102 |
| 239,845 |
| 243,193 |
| 247,818 |
| 274,755 |
| 387 |
|
Other reserves |
| (17,024 | ) | 363,582 |
| 346,739 |
| 378,739 |
| 284,982 |
| 401 |
|
Equity attributable to equity holders of the parent |
| 421,970 |
| 874,164 |
| 860,669 |
| 897,294 |
| 830,474 |
| 1,169 |
|
Non-controlling interests |
| 9 |
| 19,441 |
| 20,764 |
| 21,703 |
| 21,060 |
| 30 |
|
Total equity |
| 421,979 |
| 893,605 |
| 881,433 |
| 918,998 |
| 851,534 |
| 1,199 |
|
Total liabilities and equity |
| 741,959 |
| 1,539,836 |
| 2,082,961 |
| 2,269,173 |
| 2,209,361 |
| 3,111 |
|
|
| Year ended December 31, |
| ||||||||||
|
| 2011 |
| 2012(2) |
| 2013(3) |
| 2014 |
| 2015 |
| 2015 |
|
|
| (in millions of Ch$ and millions of US$) |
| ||||||||||
|
| Ch$ |
| Ch$ |
| Ch$ |
| Ch$ |
| Ch$ |
| US$ |
|
CASH FLOW DATA |
|
|
|
|
|
|
|
|
|
|
|
|
|
Net cash flows generated from Operating Activities |
| 138,950 |
| 188,857 |
| 172,085 |
| 215,514 |
| 264,909 |
| 405 |
|
Net cash flows used in investing activities |
| (89,621 | ) | (156,170 | ) | (447,550 | ) | (166,776 | ) | (103,131 | ) | (158 | ) |
Net cash flows provided by (used in) financing activities |
| (67,159 | ) | (3,551 | ) | 303,106 |
| (46,920 | ) | (98,560 | ) | (151 | ) |
Net increase in cash and cash equivalents before exchange differences |
| (17,830 | ) | 29,136 |
| 27,641 |
| 1,818 |
| 63,218 |
| 96 |
|
Effects of exchange differences on cash and cash equivalents |
| 865 |
| (4,912 | ) | (3,187 | ) | (2,280 | ) | (13,571 | ) | (21 | ) |
Net increase (decrease) in cash and cash equivalents |
| (16,965 | ) | 24,224 |
| 24,454 |
| (462 | ) | 49,647 |
| 75 |
|
Cash and cash equivalents - beginning of year |
| 48,263 |
| 31,298 |
| 55,522 |
| 79,976 |
| 79,514 |
| 112 |
|
Cash and cash equivalents - end of year |
| 31,298 |
| 55,522 |
| 79,976 |
| 79,514 |
| 129,161 |
| 182 |
|
|
|
|
|
|
|
|
|
|
|
|
|
|
|
OTHER FINANCIAL DATA |
|
|
|
|
|
|
|
|
|
|
|
|
|
Adjusted EBITDA(5) |
| 181,922 |
| 207,988 |
| 254,621 |
| 289,740 |
| 316,229 |
| 483 |
|
Adjusted EBITDA margin(6) |
| 18,5 | % | 17,7 | % | 16,7 | % | 16,1 | % | 16,8 | % | 16,8 | % |
Adjusted EBITDA/net financial expense(7) |
| 44,9 |
| 24,6 |
| 10,6 |
| 5,1 |
| 6,9 |
| 6,9 |
|
Net debt(8) |
| 50,776 |
| 224,477 |
| 587,869 |
| 572,901 |
| 429,373 |
| 656 |
|
Net debt/Adjusted EBITDA(9) |
| 0,3 |
| 1,1 |
| 2,3 |
| 2,0 |
| 1,4 |
| 1,4 |
|
Depreciation and amortization |
| 39,498 |
| 53,824 |
| 83,337 |
| 102,967 |
| 100,632 |
| 154 |
|
Capital expenditures |
| 126,931 |
| 143,764 |
| 183,697 |
| 114,217 |
| 112,400 |
| 172 |
|
Dividends paid |
| 70,906 |
| 69,766 |
| 73,041 |
| 52,269 |
| 53,671 |
| 82 |
|
Basic and diluted earnings per share: |
|
|
|
|
|
|
|
|
|
|
|
|
|
Series A(13) |
| 121,54 |
| 104,12 |
| 89,53 |
| 52,19 |
| 88,40 |
| 0,14 |
|
Series B(13) |
| 133,69 |
| 114,53 |
| 98,48 |
| 57,41 |
| 97,24 |
| 0,15 |
|
Basic and diluted earnings per ADR:(14) |
|
|
|
|
|
|
|
|
|
|
|
|
|
Series A(13) |
| 729,24 |
| 624,72 |
| 537,18 |
| 313,16 |
| 530,40 |
| 0,81 |
|
Series B(13) |
| 802,14 |
| 687,18 |
| 590,88 |
| 344,48 |
| 583,44 |
| 0,89 |
|
Capital Stock: |
|
|
|
|
|
|
|
|
|
|
|
|
|
Series A |
| 380,137,271 |
| 473,289,368 |
| 473,289,301 |
| 473,289,301 |
| 473,289,301 |
| 473,289,301 |
|
Series B |
| 380,137,271 |
| 473,289,368 |
| 473,281,303 |
| 473,281,303 |
| 473,281,303 |
| 473,281,303 |
|
Issued Capital |
| 230,892 |
| 270,759 |
| 270,738 |
| 270,738 |
| 270,738 |
| 414 |
|
Total dividends declared: |
|
|
|
|
|
|
|
|
|
|
|
|
|
Total Series A Shares |
| 33.809 |
| 34.018 |
| 33.888 |
| 24.800 |
| 29.344 |
| 45 |
|
Total Series B Shares |
| 37.190 |
| 37.420 |
| 37.276 |
| 27.283 |
| 32.278 |
| 49 |
|
|
|
|
|
|
|
|
|
|
|
|
|
|
|
OTHER OPERATING DATA (unaudited) |
|
|
|
|
|
|
|
|
|
|
|
|
|
Sales volume |
|
|
|
|
|
|
|
|
|
|
|
|
|
Coca-Cola trade brand soft drinks (millions of UCs)(10) |
| 448.2 |
| 517.6 |
| 633.5 |
| 671.6 |
| 653.8 |
| 653.8 |
|
Other beverages (millions of UCs) (2)(3)(10)(11) |
| 53.3 |
| 78.6 |
| 129.5 |
| 159.0 |
| 166.1 |
| 166.1 |
|
(1) Conversion to U.S. dollars are solely for the convenience of the reader.
(2) Due to Polar’s merger with and into us on October 1, 2012, data for the year ended December 31, 2012 includes the operations of Polar (as well as the operations of Vital Aguas, Vital Jugos and Envases Central (together, the “Joint Ventures”)) for the period from October 1, 2012 to December 31, 2012. Prior to our merger with Polar the Joint Ventures were held, in part, by each of Andina, Polar and Embonor S.A., respectively, and the Joint Ventures’ operations were not consolidated in the financial and other data of Andina or Polar. Upon consummation of our merger with Polar, and our increased ownership interest in the Joint Ventures that resulted from such merger, the Joint Ventures became our subsidiaries for accounting purposes and are therefore consolidated into our financial and other data for periods subsequent to such merger.
(3) Due to the acquisition of Ipiranga consummated on October 11, 2013, data for the year ended December 31, 2013 includes the operations of Ipiranga for the period from October 1, 2013 to December 31, 2013.
(4) Includes other expenses, other income (expense), share in profit of investees accounted under the equity method, foreign exchange gains (losses) and gains (losses) from indexed financial assets and liabilities.
(5) Adjusted EBITDA is a non-IFRS financial measure, does not represent cash flows from operations for the periods indicated and should not be considered an alternative to net income as an indicator of our results of operations or as an alternative to cash flows from operations as an indicator of liquidity. Adjusted EBITDA does not have a standardized meaning and, accordingly, our definition of Adjusted EBITDA may not be comparable to Adjusted EBITDA as used by other companies. See “Presentation of Financial and Other Information —Non-IFRS Financial Information”. We define Adjusted EBITDA as net income plus income taxes, other expenses (income), depreciation and amortization (which includes only the amortization of information technology software). A reconciliation of our net income to our Adjusted EBITDA is set forth below:
|
| Year Ended December 31, |
| ||||||||||
|
| 2011 |
| 2012 |
| 2013 |
| 2014 |
| 2015 |
| 2015 |
|
|
| (in millions of Ch$ and US$) |
| ||||||||||
|
| Ch$ |
| Ch$ |
| Ch$ |
| Ch$ |
| Ch$ |
| US$ |
|
Net income |
| 97,027 |
| 88,269 |
| 90,267 |
| 52,034 |
| 88,098 |
| 135 |
|
Add: |
|
|
|
|
|
|
|
|
|
|
|
|
|
Income taxes |
| 34,685 |
| 38,505 |
| 22,966 |
| 45,354 |
| 41,643 |
| 64 |
|
Finance costs |
| 7,235 |
| 11,173 |
| 28,944 |
| 65,082 |
| 55,669 |
| 85 |
|
Finance income |
| (3,182 | ) | (2,728 | ) | (4,973 | ) | (8,656 | ) | (10,118 | ) | (15 | ) |
Depreciation and amortization(5) |
| 39,498 |
| 53,824 |
| 83,337 |
| 102,967 |
| 100,632 |
| 154 |
|
Share of profit of investments using equity method of accounting |
| (2,026 | ) | (1,770 | ) | (783 | ) | (1,191 | ) | 2,328 |
| 4 |
|
Foreign exchange difference |
| (3 | ) | 4,471 |
| 7,695 |
| 2,675 |
| 2,856 |
| 4 |
|
Gain (loss) from indexed financial assets and liabilities |
| 1,178 |
| 1,754 |
| 1,833 |
| 12,462 |
| 7,308 |
| 11 |
|
Other income |
| (2,909 | ) | (3,266 | ) | (4,386 | ) | (3,971 | ) | (472 | ) | (1 | ) |
Other expenses |
| 11,915 |
| 15,420 |
| 30,462 |
| 18,591 |
| 21,983 |
| 34 |
|
Other income (expenses) |
| (1,496 | ) | 2,336 |
| (741 | ) | 4,392 |
| 6,301 |
| 10 |
|
Adjusted EBITDA(14) |
| 181,922 |
| 207,988 |
| 254,621 |
| 289,740 |
| 316,229 |
| 483 |
|
(6) Adjusted EBITDA margin is defined as Adjusted EBITDA divided by net sales, expressed as a percentage.
(7) Adjusted EBITDA / net financial expense is defined as Adjusted EBITDA divided by total financial expense (which includes expenses for hedging purposes) minus total financial income.
(8) Net debt is defined as the sum of (i) other current financial liabilities and (ii) other noncurrent financial liabilities, minus the sum of (i) cash and cash equivalents, (ii) other current financial assets and (iii) other non-current financial assets.
(9) Net debt / Adjusted EBITDA ratio is the ratio of our net debt (defined as the sum of (i) other current financial liabilities and (ii) other noncurrent financial liabilities, minus the sum of (i) cash and cash equivalents and (ii) other financial assets) as of the end of the applicable period divided by our Adjusted EBITDA for the last 12 months ended as of the end of the applicable period.
(10) Calculation of profits per share considers the average amount of outstanding shares existing at each date.
(11) Each ADR represents six shares of common stock of the corresponding series of Shares.
(12) Unit cases refer to 192 ounces of finished beverage product (24 eight-ounce servings) or 5.69 liters.
(13) Includes waters, juices, beer and other spirits.
(14) Totals may not sum due to rounding.
Exchange Rates
Chile
Chile has two currency markets, the Mercado Cambiario Formal (the “Formal Exchange Market”) and the Mercado Cambiario Informal (the “Informal Exchange Market”). The Formal Exchange Market is comprised of banks and other entities authorized by the Chilean Central Bank. The Informal Exchange Market is comprised of entities that are not expressly authorized to operate in the Formal Exchange Market, such as certain foreign exchange houses and travel agencies, among others. The Chilean Central Bank is empowered to require that certain purchases and sales of foreign currencies be carried out on the Formal Exchange Market. See also “Item 10. Additional Information—D. Exchange Controls—Foreign Exchange Controls—Chile.”
Both the Formal and Informal Exchange Markets are driven by free market forces. Current regulations require that the Chilean Central Bank be informed of certain transactions and that they be effected through the Formal Exchange Market.
The U.S. dollar observed exchange rate (dólar observado), which is reported by the Chilean Central Bank and published daily in the Official Gazette (Diario Oficial), is the weighted average exchange rate of the previous business day’s transactions in the Formal Exchange Market. The Chilean Central Bank has the power to intervene by buying or selling foreign currency on the Formal Exchange Market to attempt to maintain the observed exchange rate within a desired range. During the past few years the Chilean Central Bank has attempted to keep the observed exchange rate within a certain range only under special circumstances. Although the Chilean Central Bank is not required to purchase or sell dollars at any specific exchange rate, it generally uses spot rates for its transactions. Other banks generally carry out authorized transactions at spot rates as well.
The Informal Exchange Market reflects transactions carried out at the informal exchange rate. There are no limits imposed on the extent to which the rate of exchange in the Informal Exchange Market can fluctuate above or below the observed exchange rate. In recent years, the variation between the observed exchange rate and the informal exchange rate has not been significant.
The following table sets forth the annual low, high, average and period end observed exchange rate for U.S. dollars for the periods presented, as reported by the Chilean Central Bank. The Federal Reserve Bank of New York does not report a noon buying rate for Chilean pesos.
|
| Daily observed exchange rate Ch$ per U.S.$ |
| ||||||
|
| High(1) |
| Low(1) |
| Average(2) |
| Period end (3) |
|
Year ended December 31, |
|
|
|
|
|
|
|
|
|
2011 |
| 533.74 |
| 455.91 |
| 483.57 |
| 519.20 |
|
2012 |
| 519.69 |
| 469.65 |
| 486.59 |
| 479.96 |
|
2013 |
| 533.95 |
| 466.50 |
| 495.18 |
| 524.61 |
|
2014 |
| 621.41 |
| 527.53 |
| 570.33 |
| 606.75 |
|
2015 |
| 715.66 |
| 597.10 |
| 654.66 |
| 710.16 |
|
Month end |
|
|
|
|
|
|
|
|
|
October 31, 2015 |
| 695.53 |
| 673.91 |
| 684.91 |
| 690.32 |
|
November 30, 2015 |
| 715.66 |
| 688.94 |
| 705.00 |
| 711.20 |
|
December 31, 2015 |
| 711.52 |
| 693.72 |
| 704.19 |
| 710.16 |
|
January 31, 2016 |
| 730.31 |
| 710.37 |
| 721.96 |
| 710.37 |
|
February 29, 2016 |
| 715.41 |
| 689.18 |
| 703.31 |
| 694.17 |
|
March 31, 2016 |
| 694.82 |
| 669.80 |
| 680.96 |
| 669.80 |
|
April 2016 (through April 22, 2016) |
| 682.45 |
| 657.90 |
| 670.60 |
| 666.80 |
|
Source: Chilean Central Bank.
(1) Exchange rates are the actual low and high, on a daily basis for each period.
(2) The yearly average rate is calculated as the average of the exchange rates on the last day of each month during the period.
(3) Each year period ends on December 31, and the respective period-end exchange rate is published by the Chilean Central Bank on the first business day of the following year. Each month period ends on the last calendar day of such month, and the respective period end exchange rate is published by the Chilean Central Bank on the first business day of the following month.
Argentina
From April 1, 1991 until the end of 2001, the Convertibility Law No. 23,928 and Regulatory Decree No. 529/91 (together, the “Convertibility Law”) established a fixed exchange rate under which the Central Bank of Argentina was obliged to sell U.S. dollars at a fixed rate of one Argentine peso per U.S. dollar. On January 6, 2002, the Argentine Congress enacted the Public Emergency Law, which suspended certain provisions of the Convertibility Law, including the fixed exchange rate of Ar$1.00 to U.S.$1.00, and granted the executive branch of the Argentine government the power to set the exchange rate between the Argentine peso and foreign currencies and to issue regulations related to the foreign exchange market. Following a brief period during which the Argentine government established a temporary dual exchange rate system, pursuant to the Public Emergency Law, the Argentine peso has been allowed to float freely against other currencies since February 2002. For the last few years the Argentine government has maintained a policy of intervention in foreign exchange markets, conducting periodic transactions for the sale and purchase of U.S. dollars. There is no way to foresee if this could continue in the future. See also “Item 10. Additional Information—D. Exchange Controls—Foreign Exchange Controls—Argentina.”
The following table sets forth the annual high, low, average and period-end exchange rates for the periods indicated, expressed in Argentine pesos per U.S. dollar and not adjusted for inflation as reported by the Central Bank of Argentina. The Federal Reserve Bank of New York does not report a noon buying rate for Argentine pesos.
|
| High |
| Low |
| Average(1) |
| Period end |
|
|
|
|
|
|
|
|
|
|
|
Year ended December 31, |
|
|
|
|
|
|
|
|
|
2011 |
| 4.304 |
| 3.972 |
| 4.131 |
| 4.304 |
|
2012 |
| 4.917 |
| 4.304 |
| 4.552 |
| 4.917 |
|
2013 |
| 6.518 |
| 4.923 |
| 5.479 |
| 6.518 |
|
2014 |
| 8.556 |
| 6.543 |
| 8.119 |
| 8.552 |
|
2015 |
| 13.005 |
| 8.554 |
| 9.269 |
| 13.005 |
|
Month end |
|
|
|
|
|
|
|
|
|
October 31, 2015 |
| 9.546 |
| 9.427 |
| 9.490 |
| 9.546 |
|
November 30, 2015 |
| 9.688 |
| 9.554 |
| 9.627 |
| 9.688 |
|
December 31, 2015 |
| 13.005 |
| 9.698 |
| 11.428 |
| 13.005 |
|
January 31, 2016 |
| 13.960 |
| 13.200 |
| 13.654 |
| 13.960 |
|
February 29, 2016 |
| 15.800 |
| 14.130 |
| 14.852 |
| 15.800 |
|
March 31, 2016 |
| 15.800 |
| 14.390 |
| 14.954 |
| 14.700 |
|
April 2016 (through April 22, 2016) |
| 14.790 |
| 14.050 |
| 14.416 |
| 14.330 |
|
Source: Central Bank of Argentina. (“A” 3500 Report — Wholesale)
(1) Represents the daily average exchange rate during each of the relevant periods.
Brazil
The Central Bank of Brazil allows the real/U.S. dollar exchange rate to float freely and has intervened occasionally to control unstable fluctuations in foreign exchange rates. We cannot predict whether the Central Bank of Brazil or the Brazilian government will continue to let the real float freely or will intervene in the exchange rate market through a currency band system or otherwise. The Brazilian real may depreciate or appreciate substantially against the U.S. dollar in the future. Exchange rate fluctuations may adversely affect our financial condition. See also “Item 10. Additional Information—D. Exchange Controls—Foreign Exchange Controls—Brazil.”
Prior to March 14, 2005, under Brazilian regulations, foreign exchange transactions were carried out on either the commercial rate exchange market or the floating rate exchange market. Rates in the two markets were generally the same. On March 14, 2005, the National Monetary Council of Brazil (Conselho Monetário Nacional) unified the two markets.
The following table sets forth the exchange selling rates expressed in Brazilian reais per U.S. dollar for the periods indicated, as reported by the Central Bank of Brazil through the Central Bank System (Sistema do Banco Central) using PTAX 800, option 5.
|
| Daily observed exchange rate R$ per U.S.$ |
| ||||||
|
| High |
| Low |
| Average |
| Period end |
|
Year ended December 31, |
|
|
|
|
|
|
|
|
|
2011 |
| 1.8811 |
| 1.6554 |
| 1.7593 |
| 1.6662 |
|
2012 |
| 1.9016 |
| 1.5345 |
| 1.6746 |
| 1.8758 |
|
2013 |
| 2.1121 |
| 1.7024 |
| 1.9550 |
| 2.0435 |
|
2014 |
| 2.7403 |
| 2.1974 |
| 2.3547 |
| 2.6562 |
|
2015 |
| 4.1949 |
| 2.5754 |
| 3.3314 |
| 3.9048 |
|
Month end |
|
|
|
|
|
|
|
|
|
October 31, 2015 |
| 4.0010 |
| 3.7386 |
| 3.8801 |
| 3.8589 |
|
November 30, 2015 |
| 3.8506 |
| 3.7010 |
| 3.7765 |
| 3.8506 |
|
December 31, 2015 |
| 3.9831 |
| 3.7476 |
| 3.8711 |
| 3.9048 |
|
January 31, 2016 |
| 4.1558 |
| 3.9863 |
| 4.0524 |
| 4.0428 |
|
February 29, 2016 |
| 4.0492 |
| 3.8653 |
| 3.9737 |
| 3.9796 |
|
March 31, 2016 |
| 3.9913 |
| 3.5589 |
| 3.7039 |
| 3.5589 |
|
April 2016 (through April 22, 2016) |
| 3.6921 |
| 3.5126 |
| 3.5817 |
| 3.5472 |
|
Source: Central Bank of Brazil.
(1) Represents the daily average exchange rate during each of the relevant periods.
B.CAPITALIZATION AND INDEBTEDNESS
| B. | CAPITALIZATION AND INDEBTEDNESS |
Not applicable.
C.REASONS FOR THE OFFER AND USE OF PROCEEDS
| C. | REASONS FOR THE OFFER AND USE OF PROCEEDS |
Not applicable.
| D. | RISK FACTORS |
D.RISK FACTORS
Summary of Risk Factors
The following summarizes some, but not all, of the principal risks provided below. Please carefully consider all of the information discussed in this Item 3.D “Risk Factors” in this annual report on Form 20-F for a detailed description of these and other risks.
| · | We rely heavily on our relationship with The Coca-Cola Company, which has substantial influence over our business and operations; and changes in this relationship may adversely affect our business. |
| · | The beverage business environment is changing rapidly, including as a result of epidemic diseases such as the recent outbreak of the COVID-19 pandemic, and increased health and environmental concerns, and if we do not address evolving consumer product and shopping preferences, our business could suffer. |
| · | Increased concern about the health effects of sugar and other sweeteners in beverages could result in changes to the beverage business. |
| · | Our business is highly competitive, including with respect to price competition, which may adversely affect our net profits and margins. |
| · | If our raw material costs increase, including as a result of U.S. dollar/local currency exchange risk and price volatility, our profitability may be affected. |
| · | Instability in the supply of utility services and oil prices may adversely impact our results of operations. |
| · | Water scarcity and poor water quality could adversely impact our production costs and capacity. |
| · | Significant additional labeling or warning requirements may inhibit sales of our products. |
| · | Our business may be adversely affected if we are unable to maintain brand image and product quality. |
| · | Trademark infringement could adversely impact our beverage business. |
| · | Weather conditions or natural disasters may adversely affect our business. |
| · | Our business is subject to risks arising from the ongoing COVID-19 pandemic. |
| · | If we are unable to protect our information systems against data corruption, cyber-based attacks or network security breaches, our operations could be disrupted. |
| · | Perception of risk in emerging economies may impede our access to international capital markets, hinder our ability to finance our operations and adversely affect our financial performance. |
| · | Our business may be adversely affected if we fail to renew collective bargaining labor agreements on satisfactory terms or experience strikes or other labor unrest. |
| · | Our business is subject to extensive regulation, which is complex and subject to change. |
| · | Our business is subject to increasing environmental regulation, which may result in increases in our operating costs or adverse changes in consumer demand. |
| · | The countries in which we operate may adopt new tax laws or modify existing laws to increase taxes applicable to our business or reduce existing tax incentives. |
��
| · | A devaluation of the currencies of the countries where we have our operations, with regard to the Chilean peso, can negatively affect the results reported by the Company in Chilean pesos. |
| · | The imposition of exchange controls could restrict the entry and exit of funds to and from the countries in which we operate, which could significantly limit our financial capacity. |
You should carefully consider the following factors in addition to various economic, political, social and competitive conditions.the other information set forth in this annual report on Form 20-F. Any of the following risks, if they materialize, could materially and adversely affect our business, results of operations, prospects and financial condition.
Risks Relating to Ourour Company
We rely heavily on our relationship with The Coca-Cola Company, which has substantial influence over our business and operations.operations; and changes in this relationship may adversely affect our business.
The Coca-Cola Company has substantial influence on the conduct of our business. The interests of The Coca-Cola Company may be different from the interests of our remaining shareholders, which may result in us taking actions contrary to the interests of our remainingother shareholders.
76%68% and 65% of our net sales for the year ended December 31, 20152019 and 2020, respectively, were derived from the distribution of soft drinks under The Coca-Cola Company trademarks, while 22% and an additional 19% was18% of our net sales for 2019 and 2020, respectively, were derived from the distribution of other beverages also bearing trademarks owned by The Coca-Cola Company. In addition, The Coca-Cola Company currently owns, directly or through its subsidiaries, 14.65% of our Series A shares (representing 7.33% of our total shares) and benefits from certain rights under a shareholders’ agreement. We produce, market and distribute Coca-Cola products through standard bottler agreements between our bottler subsidiaries and, in each case, The Coca-Cola Company’s local subsidiary or The Coca-Cola Company, or, in the case of juices and nectars, The Minute Maid Company, a subsidiary of The Coca-Cola Company. The Coca-Cola Company has the ability to exerciseexert a substantial influence over ouron the business of the Company through its rights under thesethe bottler agreements. Under theseAccording to the bottler agreements, The Coca-Cola Company unilaterally sets the prices for Coca-Cola soft drink concentrate soldthat they sell to us. The Coca-Cola Company may in the future increase the price we pay for the concentrate, increasing our costs. The Coca-Cola Company also monitors our prices and has the right to review and approve our marketing, operationaloperating and advertising plans. In addition, The Coca-Cola Company may unilaterally set the price for its concentrate, and it may in the future increase the price we pay for concentrate, increasing our costs. These factors may impact our profit margins, which could adversely affect our net income and results of operations.
Our marketing campaigns for Coca-Cola products are designed and controlled by The Coca-Cola Company. The Coca-Cola Company also makes significant contributions to our marketing expenses, although it is not required to contribute a particular amount. Accordingly, The Coca-Cola Company may discontinue or reduce such contribution at any time. Pursuant to the bottler agreements, we are required to submit a business plan to The Coca-Cola Company for prior approval on a yearly basis. In accordance with our bottler agreements, The Coca-Cola Company may, among other things, require that we demonstrate the financial ability to meet our business plan, and if we are not able to demonstrate our financial capacity, The Coca-Cola Company may terminate our rights to produce, market and distribute Coca-Cola soft drinks or other Coca-Cola beverages in territories where we have such approval. Under these bottler agreements, we are prohibited from producing, bottling, distributing or selling any products that could be substituted for,
be confused with or be considered an imitation of Coca-Cola soft drinks or other Coca-Cola beverages and products.products under the trademarks of The Coca-Cola Company.
We depend on The Coca-Cola Company to renew our bottler agreements, which are subject to termination by The Coca-Cola Company in the event we default or upon expiration of their respective terms. We currently are party to fivefour bottler agreements: two agreementsone agreement for Chile, which expireexpires in 2018 and 2019,2023, one agreement for Brazil, which expires in 2017,2022, one agreement for Argentina, which expires in 2017,2022, and one agreement for Paraguay, which expires in 2020.March 2022. We cannot provide any assurance that our bottler agreements will be maintained or extendedrenewed upon their termination. Even if they are renewed, we cannot provide any assurance that renewal will be granted on the same terms as those currently in effect. Termination, non-extension or non-renewal of any of our bottler agreements would prevent us from selling Coca-Cola trademark beverages in the affected territory, which would have a material adverse effect on our business, financial condition and results of operation.
In addition, any acquisition we make of bottlers of Coca-Cola products in other territories may require, among other things, the consent of The Coca-Cola Company under bottler agreements to which such other bottlers are subject. We cannot assure you that The Coca-Cola Company will consent to any future geographic expansion of our Coca-Cola beverage business. In addition, we
We cannot assure you that our relationship with The Coca-Cola Company will not deteriorate or otherwise undergo significant changes in the future. If such changes do occur, our operations and financial results and condition could be materially affected.
The nonalcoholic beverage business environment is changing rapidly, including as a result of epidemic diseases such as the recent outbreak of the COVID-19 pandemic, and increased obesityhealth and other healthenvironmental concerns, whichand if we do not address evolving consumer product and shopping preferences, our business could have a material adverse effect on demand for our products, and consequently on our financial performance.suffer.
Consumers, public health officials and government officials in the majority of our markets, are increasingly concerned with public health consequences associated with obesity, particularly among young people. Some researchers, health advocates and dietary guidelines are encouraging consumers to reduce consumption of sugar-sweetened beverages and beverages sweetened with High Fructose Corn Syrup, nutritive or alternative sweeteners. Increasing public concern about these issues, the possibility of taxes on sugar-sweetened beverages, additional governmental regulations concerning the marketing, labeling, packaging or sale of our beverages and any negative publicity resulting from actual or threatened legal actions against nonalcoholic beverage companies relating to the marketing, labeling or sale of beverages may reduce demand for our products, which could adversely affect our profitability.
In addition, concerns over the environmental impact of plastic may reduce the consumption of our products sold in plastic bottles or result in additional taxes that would adversely affect consumer demand.
The nonalcoholic beverage business environment in our territories is dynamic and constantly evolving rapidly as a result of, among other things, changes in consumer preferences, including changes based on health and nutrition considerations and obesity concerns;concerns, shifting consumer tastespreferences and needs; changes in consumer lifestyles;lifestyles, especially as affected by the COVID-19 pandemic; concerns regarding location of origin or source of ingredients and raw materials, and the environmental and sustainability impact of the product manufacturing process; consumer shopping patterns that are changing with the digital revolution; consumer emphasis on transparency related to our products and packaging; and competitive product and pricing pressures. IfWhile we have reduced the amounts of sugar in multiple beverages across our portfolio and increased availability of low or no-calorie soft drinks, if we are unable to successfully adapt successfully toin this environment, our participation in the changing environmentsales of beverages and retail landscape, our share of nonalcoholic beverage sales, volume growth and overall financial results willin general would be adverselynegatively affected.
Increased concern about the health effects of sugar and other sweeteners in beverages could result in changes to the beverage business.
Consumers, public health officials and government agencies in the majority of our markets, are increasingly concerned with public health consequences associated with obesity, particularly among young people. Additionally, some researchers, health advocates and dietary guidelines are encouraging consumers to reduce consumption of sugar-sweetened beverages and beverages sweetened with nutritive or alternative sweeteners. Increasing public concern about these issues, the possibility of taxes on sugar-sweetened beverages or other sweeteners, additional governmental regulations concerning the marketing, labeling, packaging or sale of our beverages and any negative publicity resulting from actual or threatened legal actions against beverage companies relating to the marketing, labeling or sale of beverages may reduce demand for our products or increase the cost, which could adversely affect our profitability.
Our business is highly competitive, including with respect to price competition, which may adversely affect our net profits and margins.
The soft drink and nonalcoholic beverage businesses arebusiness is highly competitive in each of the territories in which we operate. We compete with bottlers of local and regional brands, including low cost beverages and Pepsi products. In Argentina and Brazil, we compete with Companhia de Bebidas das Americas, commonly referred to as AmBev, the largest brewer in Latin America and a subsidiary of InBev S.A., which sells Pepsico trademark products, in addition to a portfolio that includes local brands with flavors such as Guaraná. In Chile, our main competitor is Compañía de Cervecerías Unidas, which sells Pepsico trademark products as well as a portfolio that includes juices and waters. In Paraguay, our main competitor is Embotelladora Central with Niki and De la Costa trademarks (which are low cost “B-brands”), followed by AV S.A. a bottler of the Pepsico trademark. This competition in each of the regions where we operate is likely to continue, and we cannot assure you that it will not intensify in the future, which could materially and adversely affect our financial condition and results of operations. If we do not continuously strengthen our capabilities in marketing and innovation to maintain our brand loyalty and market share, our business and results of operations could be negatively affected.
RawIf our raw material prices may be subject tocosts increase, including as a result of U.S. dollar/local currency exchange risk and price volatility, which could increase our costs of operations.profitability may be affected.
In addition to water, our most significant raw materials are (1) concentrate, which we acquire from affiliates of The Coca-Cola Company, (2) sweeteners and (3) packaging materials. Our most significant packaging raw material costs arise from the purchase of resin and plastic preforms to make plastic bottles and from the purchase of finished plastic bottles, the prices of which are related to
crude oil prices and global resin supply. Prices for concentrate are determined by The Coca-Cola Company and theThe Coca-Cola Company has unilaterally increased concentrate prices in the past and may do so again in the future. We cannot assure you that The Coca-Cola Company will not increase the price of the concentrate for Coca-Cola trademark beverages or change the manner in which such pricethese prices will be calculated in the future. We may not be successful in negotiating or implementing measures to mitigate the negative effect this may have in the pricing of our products or our results. The prices for our remaining raw materials are driven by market prices and local availability, the imposition of import duties and restrictions and fluctuations in exchange rates. We may not be successful in negotiating or implementing measures to mitigate the negative effect that increased raw material costs may have in the pricing of our products or our results.
We purchase our raw materials from both domestic and international suppliers, some of which must be approved by The Coca-Cola Company, which may limit the number of suppliers available to us. Because the prices of theour main raw materials –except for concentrate– are denominated in U.S. dollars, we are subject to local currency risk with respect to each of our operations. If any of the Chilean peso, Brazilian real, Argentine peso, or Paraguayan guaraní were to depreciate significantly against the U.S. dollar, the cost of certain raw materials in our respective territories could rise significantly, which could have an adverse effect on our financial condition and results of operations. We cannot assure you that these currencies will not lose value against the U.S. dollar in the future. Additionally, some raw material prices are subject to high volatility, which could also have a material adverse effect on our profitability. The supply or cost of specific raw materials could be adversely affected by domestic or global price changes, strikes, weather conditions, taxes, governmental controls or other factors. Any sustained interruption in the supply of these raw materials or any significant increase in their price could have a material adverse effect on our financial performance.
Instability in the supply of utility services and oil prices may adversely impact our results of operations.
Our operations depend on a stable supply of utilities and fuel in the countries where we operate. Electrical power outages could lead to increased energy prices and possible service interruptions. Interruptions in the supply of water could also generate an increase of our production costs and possible service interruptions. We cannot assure you that in the future we will not experience energy or water supply interruptions that could materially and adversely affect our business. In addition, a significant increase in energy prices would raise our costs, which could materially impact our results of operations. Fluctuations in oil prices have adversely affected our cost of energy and transportation in the regions where we operate, and we expect that they will continue to do so in the future. We cannot assure you that fuel prices will not increase in the future, and a significantthat such an increase in fuel price maywould not have a significant effect on our financial performance.
Water scarcity and poor water quality could adversely impact our production costs and capacity.
Water is the main ingredient in substantially all of our products. It is also a limited resource in many parts of the world, facing unprecedented challenges from overexploitation, increasing pollution and poor management. As demand for water continues to increase around the world, and as the quality of available water deteriorates, we may incur increasing production costs or face capacity constraints that could adversely affect our profitability or net operating revenues.profitability. We obtain water from various sources in our territories, including springs, wells, rivers and municipal and state water companies pursuant to either concessions granted by governments in our various territories or pursuant to contracts.territories. We are also subject to uncertainty regarding the interpretation of the laws of the countries in which we operate, and any ambiguity or uncertainty regarding the interpretation or application of regulations can result in increased production costs or penalties for non-compliance, which are impossible or difficult to predict. We also anticipate future discussions on new regulations on ownership and water usage in Chile and Paraguay. Additionally,other countries where we operate relating to future ownership of water supply in the São Paulo region has been recently affected by low rainfall, which has affected the mainresources, including possible nationalization, and stricter controls on water reservoir that serves the greater São Paulo area.usage. Water shortagesscarcity or changes in governmental regulations aimed at rationing water in the regionregions where we operate could affect our water supply.supply and therefore our business.
We cannot assure you that water will be available in sufficient quantities to meet our future production needs or will prove sufficient to meet our current water supply needs.
Significant additional labeling or warning requirements may inhibit sales of our products.
The countries in which we operate may adopt significant advertising restrictions as well as additional product labeling or warning requirements relating to the chemical content or perceived adverse health consequences of certain of our Coca-Cola products or other products. In addition, theThe Chilean congress recentlyCongress passed a new law which will become effective on June 27, 2016,Law No. 20,606 with respect to labeling of certain consumer products, including soft drinks and bottled juices and waters such as ours. In October 2015 we instituted a plan to adjust our labels toThe law became effective in June 2016 and its implementation has been carried out in stages, with labeling requirements becoming progressively stricter in June 2018 and June 2019. Given the new requirements of this law in order to be able to comply with its requirements once it becomes effective. Due touncertainty surrounding the difficulty of determining the future scope and interpretation of the requirements of this law, we may occasionally be subject to ambiguity or uncertainty with respect to its interpretation and application which could result in non-compliance and associated costs and penalties associated with non-compliance, which are impossible or difficult to predict. These requirements may adversely affect sales of our products.products and our results of operations.
Our business may be adversely affected if we are unable to maintain brand image and product quality.
Our beverage business is highly dependent on maintaining the reputation of our products in the countries where we operate. If we fail to maintain high standards for product quality, our reputation and ability to remain a distributor of The Coca-Cola Company beverages in the countries where we operate could be jeopardized. Negative publicity or incidents related to our products may reduce their demand and could have a material adverse effect on our financial performance. If any of our products is defective or found to contain contaminants, or causes injury or illness, we may be subject to legal claims filed by consumers, product recalls, business interruptions and/or other liabilities.
We take significant precautions in order to ensure thatminimize any risk of defects or contamination in our beverage products are free from contaminants and that our packaging materials (such as bottles, crowns, cans and other containers) are free of defects. Suchproducts. These precautions include quality-control programs for primaryraw materials, the production process and our final products.
We also have established procedures to correct as soon as practicable any problems that are detected.
In However, the event that contamination or a defect does occur in the future, it may lead to business interruptions, product recalls or liability, each of which could have an adverse effect on our business, reputation, prospects, financial conditionprecautions and results of operations.
Althoughprocedures we maintain insurance policies against certain product liability risks, we may not be able to enforce our rights in respect of these policies, and, in the event that a defect occurs, any amounts that we recoverimplement may not be sufficient to offset any damage we may suffer, which could adversely impact our business, results of operations and financial condition.protect us from potential incidents.
Trademark infringement could adversely impact our beverage business.
A significant portion of our sales derives from sales of soft drinksbeverages branded with trademarks of The Coca-Cola trademarks,Company, as well as other trademarks. If other parties attempt to misappropriate trademarks we use, we may be unable to protect these trademarks. The maintenance of the reputation of these brands is essential for the future success of our beverage business. Misappropriation of trademarks we use, or challenges thereto, could have a material adverse effect on our financial performance.
We may not be able to successfully implement our expansion strategies or achieve the expected operational efficiencies or synergies from potential acquisitions.
We have, and we may continue to, acquire businesses and pursue other strategic transactions as part of our expansion strategies. We cannot assure you that we will be successful in identifying opportunities and consummating acquisitions and other strategic transactions on favorable terms or at all. These types of transactions may involve additional risks to our Company, including operating in geographic regions or with beverage categories in which we have less or no operating history. Depending on the size and timing of an acquisition or transaction, we may be required to raise future financing to consummate the acquisition or transaction. Moreover, even if we are able to consummate a transaction, acquisitions and other strategic opportunities may involve significant risks and uncertainties.
Key elements to achieving the benefits and expected synergies of our acquisitions are the integration of acquired businesses’ operations into our own in a timely and effective manner and the retention of qualified and experienced key personnel. We may incur in unforeseen liabilities in connection with acquiring, taking control of, or managing beverage operations and other businesses and may encounter difficulties and unforeseen or additional costs in restructuring and integrating them into our operating structure. These difficulties include distraction of management from current operations, difficulties in integration with our existing business and technology, greater than expected liabilities and expenses, inadequate return on capital, and unidentified issues not discovered in our pre-acquisition investigations and evaluations of those strategies and acquisitions. We cannot assure you that these efforts will be successful or completed as expected by us, and our business, financial condition, results of operations could be adversely affected if we are unable to do so.
Weather conditions or natural disasters may adversely affect our business.
Lower temperatures and higher rainfall may negatively impact consumer patterns, which may result in lower per capita consumption of our beverage offerings.beverages. Additionally, adverse weather conditions or natural disasters may affect road infrastructure in the countries in which we operate and limit our ability to sell and distribute our products. For example, in February of 2010 our business experienced a temporary interruption in our production as a result of the 8.8 magnitude earthquake in central Chile; and in March 2015, flash floods in the north of Chile interrupted our production and distribution in such territory.
Our business is subject to risks arising from the ongoing COVID-19 pandemic.
The outbreak of the Novel Coronavirus 2019 (COVID-19), which was declared by the World Health Organization to be a “public health emergency of international concern”, has spread across most of the world. Countries around the world have adopted extraordinary measures to contain the spread of COVID-19, including imposing travel restrictions and bans, closing borders, establishing restrictions on public gatherings, instructing residents to practice social distancing, requiring closures of non-essential businesses, issuing stay-at-home advisories and orders, implementing quarantines and similar actions. The impact to date of the COVID-19 pandemic on global economic conditions has significantly increased economic uncertainty and is likely to have caused a global recession. We cannot predict how long the COVID-19 pandemic will continue or how long current or future governments’ restrictions will remain in place. Furthermore, even if the outbreaks of COVID-19 subside, we cannot predict whether subsequent outbreaks, including from new variants of the virus, will reoccur, or whether governments will implement longer-term measures that continue to affect industries.
Given uncertainties regarding the impact of the COVID-19 pandemic, we cannot predict accurately the extent to which the COVID-19 outbreak could affect our business and results of operations. COVID-19 poses the risk that we or our employees, contractors, suppliers and other partners may be limited or prevented from conducting business activities for an indefinite period of time, including due to shutdowns that may be requested or mandated by governmental authorities. While our operations have not been
materially disrupted to date, the COVID-19 pandemic and government measures taken to contain the spread of the virus could disrupt our supply chain and the manufacture or shipment of our products, and adversely impact our business or results of operations.
Additionally, the COVID-19 pandemic and government measures have disrupted certain of our sales channels, in particular as a result of the temporary mandatory closing of restaurants and bars and prohibition on social gathering events, which adversely affects our sales volumes to these channels. We cannot predict how much of an impact the COVID-19 pandemic and government measures will ultimately have on these sales channels, including whether many channels will be able to resume their operations after the virus is contained. Nor can we predict how much or for how long consumer spending patterns may change as a result of these developments.
The COVID-19 pandemic and government measures could in the future adversely affect our business and results of operations, potentially materially. In addition, an outbreak of other epidemics in the future, such as the bird flu, influenza, SARS, the Ebola virus and the Zika virus, could also result in a similar impact.
Our insurance coverage may not adequately cover losses resulting from the risks for which we are insured.
We maintain insurance for our principal facilities and other assets. Our insurance coverage protects us in the event we suffer certain losses resulting from theft, fraud, expropriation, business interruption,fire, terrorism and natural disasters, or other similar eventssuch as earthquake and floods, or from business interruptions caused by such events. In addition, we maintain other insurance policies for our directorsgeneral liability and officers.product contamination. We cannot assure you that our insurance coverage will be sufficient or will provide adequate compensation for losses that we may incur.
If we are unable to protect our information systems against data corruption, cyber-based attacks or network security breaches, our operations could be disrupted.
We are increasingly dependent on information technology networks and systems, including over the Internet, to process, transmit and store electronic information. In particular, we depend on our information technology infrastructure for digital marketing activities and electronic communications among us and our clients, suppliers and also among our subsidiaries.subsidiaries and facilities. Security breaches of thisor infrastructure flaws can create system disruptions, shutdowns or unauthorized disclosure of confidential information. If we are unable to prevent such breaches or flaws, our operations could be disrupted, or we may suffer financial damage or loss because of lost or misappropriated information.
Cyber threats are rapidly evolving and the means for obtaining access to information in digital and other storage media are becoming increasingly sophisticated. Cyber threats and cyber-attackers can be sponsored by countries or sophisticated criminal organizations or be the work of single “hackers” or small groups of “hackers”.
We are in the process of analyzing the adequacy of our information technology systems and installing new and upgrading existing information technology systems in order to achieve industry standard levels of protection for the Company’s data and business processes against risk of data security breach and cyber-attack. We are working to strengthen the integrity of our data network and expect this process to continue over the coming years. Insider or employee cyber and security threats are increasingly a concern for all companies, including ours. Nevertheless, as cyber threats evolve, change and become more difficult to detect and successfully defend against, one or more cyber-attacks might defeat our or a third-party service provider’s security measures in the future and obtain the personal information of customers or employees. Employee error or other irregularities may also defeat of security measures and result in a breach of information systems. Moreover, hardware, software or applications we use may have inherent defects of design, manufacture or operations or could be inadvertently or intentionally implemented or used in a manner that could compromise information security. A security breach and loss of information may not be discovered for a significant period of time after it occurs. While we have no knowledge of a material security breach to date, any compromise of data security could result in a violation of applicable privacy and other laws or standards, the loss of valuable business data, or a disruption of our business. A security breach involving the misappropriation, loss or other unauthorized disclosure of sensitive or confidential information could give rise to unwanted media attention, materially damage our customer relationships and reputation, and result in fines or liabilities, which may not be covered by our insurance policies.
Perception of risk in emerging economies may impede our access to international capital markets, hinder our ability to finance our operations and adversely affect our financial performance.
International investors, as a general rule, consider the countries in which we operate to be emerging market economies. Consequently, economic conditions and the market for securities of emerging market countries influence investors’ perceptions of Chile, Brazil, Argentina and Paraguay and their evaluation of securities of companies located in these countries.
During periods of heightened investor concern regarding emerging market economies, in particular in recent years Argentina, the countries where we operate may experience significant outflows of U.S. dollars.
In addition, during these periods companies based in the countries where we operate have faced higher costs for raising funds, both domestically and abroad, as well as limited access to international capital markets, which have negatively affected the prices of the aforementioned countries’ securities. Although economic conditions are different in each of the emerging-market countries, investors’ reactions to developments in one of these countries may affect the securities of issuers in the others. For example, adverse developments in emerging market countries may lead to decreased investor interest in investing in the securities of Chilean companies.companies.
Our business may be adversely affected if we fail to renew collective bargaining labor agreements on satisfactory terms or experience strikes or other labor unrest.
A substantial portion of our employees is covered by collective bargaining labor agreements. These agreements generally expire every year. Our inability to renegotiate these agreements on satisfactory terms could cause work stoppages and interruptions, which may adversely impact our operations. AmendmentsChanges to the terms and conditions of existing agreements could also increase our costs or otherwise have an adverse effect on our operational efficiency. We experience periodic strikes and other forms of labor unrest through the ordinary course of business. For example, in 2008 we experienced a strike in our production facilities in Chile, which lasted for a period of approximately two weeks, and which had a significant effect on our production capacity. We cannot assure you labor interruptions or other labor unrest will not occur in the future. If we experience strikes, work stoppages or other forms of labor unrest at any of our production facilities, our ability to supply finished beverages to customers could be impaired, which would reduce our net operating revenues and could expose us to customer claims.
Our business is subject to extensive regulation, which is complex and subject to change.
We are subject to local regulations in each of the territories in which we operate. The principalmain areas in which we are subject toof regulation are water, environment, labor, taxation, health, consumer protection, advertising and antitrust. Regulation could also affect our ability to set prices for our products. The adoption of new laws or regulations or a stricter interpretation or enforcement thereof in the countries in which we operate may increase our operating costs or impose restrictions on our operations which, in turn, may adversely affect our financial condition, business and results. Further changes in current regulations may result in increased compliance costs, which may have an adverse effect on our results or financial condition.
In the past, voluntary price restraints or statutory price controls have been imposed in several of the countries in which we operate. Currently there are no restraints or price controls applicable to our products in any of the territories in which we operate, other than in Argentina, where there are voluntary price restraints. There are currently no price controls for our products in anyexcept with respect to a limited number of the territories in which we operate, except in Argentina, where there are voluntary price restraints. There are currently no published laws or regulations imposing price controls on our products in Argentina. Nonetheless,However, we have complied with the request by Argentine government authorities to maintain prices of certain products sold through supermarkets.
The imposition of these restrictions or voluntary price restraints in Argentina or other territories may have an adverse effect on our results and financial condition. We cannot assure you that government authorities in Argentina or in any country in which we operate will not impose statutory price controls, or that we will not be requested to impose voluntary price restraints in the future.
We may be required to incur considerable expenses The potential imposition of restraints or price controls in order to comply with various environmental laws and regulations. Such expensesthe future may have a materialan adverse effect on our results of operations and financial position.condition.
Our business is subject to increasing environmental regulation, which may result in increases in our operating costs or adverse changes in consumer demand.
We are subject to various environmental laws and regulations thatin the countries where we operate, which apply to our products, containers products and activities. If these environmental laws and regulations are strengthened or newly established in jurisdictions in which we conduct our businesses, we may be forcedrequired to incur considerable expenses in order to comply with such
laws and regulations. We are also subject to uncertainty regarding the interpretation of the environmental laws and regulations of the countries in which we operate, and any ambiguity or uncertainty regarding the interpretation or application of regulations can result in increased production costs or penalties for non-compliance, which are difficult to predict. Such increased expenses may have a material adverse effect on our results of operations and financial position. To the extent we determine that it is not financially sound for us to continue to comply with such laws and regulations, we may have to curtail or discontinue our activities in the affected business areas.
In addition, concerns over the environmental impact of plastic may reduce the consumption of our products sold in plastic bottles or result in additional taxes that could adversely affect consumer demand. In 2019, different bills seeking to restrict the generation of single-use plastic products and regulate plastics in Chile were consolidated in one bill and introduced for consideration by the Chilean Congress. The bill would consider specific regulations for single-use plastic bottles and refillables. During 2020, the bill was approved by the Senate, and currently is under discussion at the House of Representatives. However, we cannot predict whether this bill will pass. If enacted, this bill may have an adverse effect on our results of operations.
If we were to become subject to adverse judgments or determinations in legal proceedings to which we are, or may become, a party, our future profitability could suffer through significant liabilities, a reduction of sales, increased costs or damage to our reputation due to our failure to adequately communicate the impact of any such proceeding or its outcome to the investor and business communities.reputation.
In the ordinary course of our business, we become involved in various other claims, lawsuits, investigations and governmental and administrative proceedings, some of which are or may be significant. In addition, Coca-Cola Andina Brazil isWe are currently a party to a series of ongoing administrative tax proceedings in which the Brazilian federal tax authorities have claimed that Coca-Cola Andina Brazil has unpaid liabilities for value-added taxes on industrialized products (imposto sobre produtos industrializados, or IPI) involving aggregate claims of a significant amount.certain legal proceedings. Adverse
judgments or determinations in one or more of these proceedings could require us to change the way we do business or use substantial resources in adhering to the settlements andsettlements. These could have a material adverse effect on our business, including, among other consequences, by significantly increasing the costs required to operate our business. Ineffective communications during or after these proceedings could amplify the negative effects, if any, of these proceedings on our reputation and may result in a negative market impact on the price of our securities. Additionally, adverse preliminary decisions in one We evaluate these litigation claims and legal proceedings to assess the likelihood of unfavorable outcomes and to estimate, if possible, the amount of potential losses. Based on these assessments and estimates, we establish reserves and/or moredisclose the relevant litigation claims or legal proceedings, as appropriate. These assessments and estimates are based on the information available to management at the time and involve a significant amount of management judgment. Actual outcomes or losses may differ materially from our current assessments and estimates.
In addition, during recent years, the Company has been subject to judicial proceedings and administrative investigations associated with alleged monopolistic practices. Although these proceedings and investigations have not resulted in any convictions or penalties for the Company, we cannot assure that this will not occur in the future. Antitrust complaints may require the usebe submitted in Chile without any prior admissibility test and, as a result, we cannot predict whether unsubstantiated claims against us will be filed. Possible sanctions in matters of substantial financial resources during its review by a higher court.competition could have an adverse effect on our business.
The countries in which we operate may adopt new tax laws or modify existing laws to increase taxes applicable to our business.business or reduce existing tax incentives.
We cannot assure you that any governmental authority in any country where we operate will not impose new taxes or increase the taxes on our products in the future. The imposition of new taxes, orthe increases in taxes on our productsor the reduction of tax incentives may have a material adverse effect on our business, financial condition prospects and results.
For example, in Chile on September 29, 2014 Law 20.780No. 20,780 was enacted which was subsequently amended by Law 20.899,No. 20,899, on February 8, 2016 (the “Tax Reform”). The Tax Reform providesintroduced a “Transitional Regime”new tax regime for calendar years 2014, 2015corporations, the Semi-Integrated Regime established in article 14(B) of the Chilean Income Law, increasing the tax burden, among other changes. For companies such as Andina, the latest reform introduced in Chile (by Law 21.210 of February 2020) maintains corporate tax and 2016 and a “Permanent Regime” for calendar years 2017 and thereafter.withholding tax rates on dividends.
In Argentina in December 2017, a tax reform was passed, which came into force in 2018. The most important consequence for the Transitional Regime, for calendar years 2014, 2015 and 2016,Company is the Tax Reform progressively increasesreduction in the Corporate Income Tax rate to 21%, 22.5% and 24%, respectively. There are no changes to the taxation that applies to dividends paid to shareholders that are not resident in Chile. The additionalprevious income tax rate remains atfrom 35% and credit is available for 100 percent of corporate income tax that may be charged to dividends remitted abroad. For natural persons domiciled or resident in Chile the current regime also remains. Such shareholders are taxed with the Supplementary Global Tax which has progressive rates ranging between 0% and 40% in the year they receive the payment of the dividend, entitled to credit30% for the entirety of corporate income tax paid by the issuer of the shares. For the calendar year 2017,fiscal years 2018 and 2019 and from 2020 onwards the rate willdecreases to 25%. However, this reduction is only available when profits are reinvested. In addition, a tax of 7% must be 25% for companies that choosepaid at the Attributed Regime scheme and 25.5% for those taxed by the Semi-Integrated scheme, each described below.
In the Permanent Regime,time of distribution of dividends for the first two years 2017 and thereafter, taxpayers may choose either the Attributed Regime or the Semi-Integrated income taxation schemes. Under the Attributed Regime scheme, annual accrued profits are immediately charged with13% from 2020 onwards. The Argentine government had suspended the corporate income tax rate of 25%decrease previously contemplated for fiscal years 2020 and an additional tax of 35%, maintaining the right to credit against the latter 100% of corporate income tax. In this option, non-Chilean shareholders are taxed with the additional tax of 35% regardless of whether the Chilean company pays2021. As a dividend or not due to the fact that the additional tax should be declared and paid in the year in which profits are accrued in the Chilean company that has issued the shares.
The same applies to local shareholders, defined as natural persons domiciled in Chile, but with a maximum rate of 35% for the Supplementary Global Tax. Under the Semi-Integrated tax scheme, earned annual profits are taxed atresult, the corporate income tax rate has remained at 30% and the income tax rate on dividends has remained at 7%. In addition, a bill was introduced in the Argentinian Congress to amend and increase the corporate income tax rate from 30% to 35% on companies with income in excess of 27% (25.5%AR$20,000,000, while taxes on dividends would continue to be taxed at 7%. If the bill is approved, the increased tax rate may apply for fiscal year 2017). Dividends remitted abroad and those paid2021. In relation to local shareholders are taxed with additionalgross income tax, or Supplementary Global Tax (within 2019 there was a maximum rate of 35%) only0.5% average reduction in the yeargross income tax rate for industry activity in provinces of Argentina where Andina has no productive plants, while the 0.5% reduction planned for 2020 was suspended and continues suspended for 2021. Municipal rates in 2019 and so far as of the paymentdate of the dividend. The additional tax rate remains at 35%this annual report, remain unchanged, with corporate income tax credit paid by the issuing company.
Notwithstanding the above, local shareholders and shareholders domiciled in countries that do not have an existing treaty to avoid double taxation with Chile, can only credit 65% of corporate income tax, which results in a total tax burden on profits distributed to those shareholders of 44.45%. The credit limitation is made by establishing a debit (tax) to the shareholder equal to 35% of corporate income tax.few insignificant exceptions.
It should be noted that an open stock corporation in which one or moreAndina Argentina enjoys the benefit of its shareholders is in turn a company domiciled in Chile does not have the option and will automatically be subject to the Semi-Integrated scheme.
The same reform increased the additional tax on non-alcoholic beverages with sugar from 13% to 18%, and reduced the additional tax on non-alcoholic beverages without sugar from 13% to 10%.
In November 2012, the government of the Province of Buenos Aires, Argentina, adopted Law No. 14,394, which increased the tax rate applied to revenue from products sold within the Province of Buenos Aires. For products manufactured in the territory of the Province of Buenos Aires, Law No. 14,394 increased the tax rate from 1% to 1.75%, and for products manufactured in any other Argentine province, from 3% to 4%. In January 2013, the government of the Province of Chubut, Argentina, adopted Law No. XXIV-62, which increased the tax rate applied to revenue from products sold within the Province of Chubut and manufactured in any other Argentine province from 3% to 4%. In December 2012, the government of the Province of La Pampa, Argentina, adopted Law No. 2,700, which increased the tax rate applied to revenue from products sold within the Province of La Pampa and manufactured in any other Argentine province, from 1.5% to 2.5%. In January 2013, the government of the Province of Mendoza, Argentina, adopted Law No. 8,523, which increased the tax rate applied to revenue from the sale of mineral water bottled in any other Argentine province and sold within the Province of Mendoza from 4% to 6%.
In January 2016, the government of the Province of Río Negro, Argentina, adopted Law No. 5,009, which increased the tax rate applied to revenue from products sold within the Province of Río Negro and manufactured in any other Argentine province from 3.8% to 4%. In January 2016, the government of the Province of Neuquén, Argentina adopted Law No. 2.982, which increased the tax rate applied to revenue from products sold within the Province of Neuquén and manufactured in any other Argentine province in 0.5%. In December 2015, the government of the Province of Córdoba, Argentina adopted Law No 10.323, establishing an additional tax from January 1, 2016 through and including December 31, 2019, for the Infrastructure Works Financing Fund increasing the taxzero-tax rate on gross income by 15.25%.in the province of Córdoba until 2030 under a new industrial promotion granted on August 31, 2020. For further information, see also “Risks Relating to Brazil – Changes in tax laws may increase our tax burden and reduce tax incentives and, as a result, negatively affect our profitability.”
GivenBrazilian tax proceedings may result in a significant tax liability.
Our subsidiary Rio de Janeiro Refrescos Ltda. is party in several tax proceedings in which the highBrazilian federal tax burdenauthorities argue the alleged existence of liabilities associated with value added tax on industrialized products for an approximate total amount of R$ 2,471 billion (equivalent to approximately US$475.49 million). These proceedings are at different administrative as well as judicial procedural stages. We disagree with the Brazilian tax authorities’ position and believe that Rio de Janeiro Refrescos Ltda. is entitled to claim Imposto sobre Produtos Industrializados (IPI) tax credits in connection with its purchases of certain exempt raw materials from suppliers located in the Manaus Free Trade Zone. We believe that the Brazilian tax authorities’ claims are without merit. Our external Brazilian counsel has advised us that it believes that Rio de Janeiro Refrescos Ltda.’s likelihood of loss in most of these proceedings is classified as possible to remote (i.e., approximately 30%). Despite the foregoing, the outcome of these claims is subject to uncertainty, and it is difficult to predict their final resolution or any other negative repercussions from this dispute with the Brazilian tax authorities to The Coca-Cola Company or its bottling companies in Brazil, including our Brazilian subsidiaries.
The modifications to the government provides tax incentivesbeer distribution agreement with Heineken in Brazil may not be approved by the Brazilian antitrust authorities, which could adversely affect our results of operations.
In July 2017 Heineken Brazil notified us of the termination of the agreement by virtue of which Rio de Janeiro Refrescos Ltda. distributes Heineken and Amstel branded beers, among others, within its franchise territories, effective as of March 2022. The termination of this agreement will adversely affect our results. During 2020, however, the Coca-Cola system in Brazil and Heineken reached an agreement to attract investment to certain territories, particularly for manufacturers and other companies operating and investingredesign their distribution partnership in Brazil. AndinaAs per the agreement, expected to become effective mid-2021, the Coca-Cola system in Brazil has been providedwill continue to offer the Kaiser, Bavaria and Sol brands, and will complement this portfolio with somethe Eisenbahn brand and certain other brands. Additionally, as part of said incentives. However, these incentive programs may bethe redesign of the distribution partnership, the agreement allows the Coca-Cola system bottlers in Brazil to distribute and produce other national or international brands, in certain percentages and under certain conditions. We estimate that initially the brands portfolio under the modified or terminated, thereby increasingagreement will represent approximately 26% of the volume under the previous agreement with Heineken, based on sales volume during 2020. The modified agreement is subject to antitrust approval. Consequently, our cost of operations in Brazil. Termination, non-extension or non-renewal of said tax incentives would have a material adverse effect on our business financial condition and results of operation.
Weoperations may not be able to successfully integrate our recent acquisitions and achieve the operational efficiencies and/or expected synergies.
We have and we may continue to acquire bottling operations and other businesses. A key element to achieve the benefits and expected synergies of our recent and future acquisitions and/or mergers is to integrate the operation of acquired or merged businesses into our operations in a timely and effective manner. We may incur unforeseen liabilities in connection with acquiring, taking control of, or managing bottling operations and other businesses and may encounter difficulties and unforeseen or additional costs in restructuring and integrating them into our operating structure. We cannot assure you that these efforts will be successful or completed as expected by us, and our business, results and financial condition could be adversely affected if we are unable to do so.obtain the necessary authorizations to implement the modified agreement with Heineken.
If we do not successfully comply with laws and regulations designed to combat governmental corruption in countries in which we sell our products, we could become subject to fines, penalties or other regulatory sanctions, and our sales and profitability could suffer.
Although we are committed to conducting business in a legal and ethical manner in compliance with local and international statutory requirements and standards applicable to our business, there is a risk that our employees or representatives may take actions that violate applicable laws and regulations that generally prohibit the making of improper payments to foreign government officials for the purpose of obtaining or keeping business, including laws relating to the 1997 OECD Convention on Combating Bribery of Foreign Public Officials in International Business Transactions such asor the U.S. Foreign Corrupt Practices Act.
We may not be able to recruit or retain key personnel.
In order to support and market our products, we must hire and retain skilled employees with particular expertise. The implementation of our strategic business plans could be undermined by a failure to recruit or retain key personnel or the unexpected loss of senior employees, including in acquired companies. We face various challenges inherent in the management of a large number of employees over diverse geographical regions. Key employees may choose to leave their employment for a variety of reasons, including reasons beyond our control. The impact of the departure of key employees cannot be determined and may depend on, among other things, our ability to recruit other individuals of similar experience and skill. It is not certain that we will be able to attract or retain key employees and successfully manage them, which could disrupt our business and have an unfavorable material effect on our financial position, income from operations and competitive position.
A devaluation of the currencies of the countries where we have our operations, with regard to the Chilean peso, can negatively affect the results reported by the Company in Chilean pesos.
The Company reports its results in Chilean pesos, while a large part of its revenues and Adjusted EBITDA comes from countries that use other currencies. During 2019 and 2020, 35% and 34% of the Company’s net sales were generated in Brazil, 22% and 19% in Argentina, and 9% and 9% in Paraguay, while 34% and 33% of Adjusted EBITDA was generated in Brazil, 16% and 14% in Argentina, and 12% and 14% in Paraguay, respectively. If the currencies of these countries depreciate against the Chilean peso, this would have a negative effect on the results and financial condition of the Company, which are reported in Chilean pesos.
The imposition of exchange controls could restrict the entry and exit of funds to and from the countries in which we operate, which could significantly limit our financial capacity.
The imposition of exchange controls in the countries in which we operate could affect our ability to repatriate profits, which could significantly limit our ability to pay dividends to our shareholders. Additionally, it may limit the ability of our foreign subsidiaries to finance payments of U.S. dollar denominated liabilities required by foreign creditors.
Negative information on social media and similar platforms could adversely affect our reputation.
Negative or inaccurate information concerning us or The Coca-Cola trademarks may be posted on social media and similar platforms of Internet-based communications at any time. This information may affect our reputation, and adversely impact our business and results of operations.
Risks Relating to Chile
Our growth and profitability depend significantly on economic conditions in Chile.
39.3%Our operations in Chile represented 37.7% and 47.8% of our assets as of December 31, 20152019 and 27.3%December 31, 2020, respectively, and 34.2% and 38.0% of our net sales for the year ended December 31, 2015 corresponded to2019 and 2020, respectively. Accordingly, our operations in Chile. Thus, ourbusiness, financial condition, and results of operations depend, significantly onto a considerable extent, upon economic conditions prevailing in Chile.
International and local economic crisisconditions may adversely affect the Chilean economy, and unfavorable general economic conditions could negatively affect the affordability of and demand for some of our products.products in the country. In difficult economic conditions, consumers may seek to reduce discretionary spending by forgoing purchases of our products or buying low cost “B brands”brands offered by competitors. Any of these events could have an adverse effect on our business, financial condition and results of operations.
According to data published by the Central Bank, the Chilean economy grew at a rate of 5.6%1.3% in 2012, 4.2%2016, 1.5% in 20132017, 4.0% in 2018 and 1.9%1.1% in 2014 and at2019and in 2020 it contracted 5.8%, as a rateresult of 2.5%, 1.9% and 2.2% respectively during the first three quartersimpact of 2015.the COVID-19 pandemic. Our financial condition and results of operations could also be adversely affected by changes over which we have no control, including, without limitation:
| · | political or economic developments in or affecting Chile; |
· the economic or other policies of the Chilean government, which has a substantial influence over many aspects of the private sector;
| · | the economic or other policies of the Chilean government, which has a substantial influence over many aspects of the private sector; |
· other political or economic developments in or affecting Chile;
| · | tax rates and policies; |
· regulatory changes or administrative practices of Chilean authorities;
| · | regulatory changes or administrative practices of Chilean authorities; |
· inflation and governmental policies to combat inflation;
| · | the Chilean constitutional process, and the impact of a new Chilean Constitution, if approved; |
· currency exchange movements; and
| · | government restrictions in response to the COVID-19 pandemic and authorities, capacity to keep the pandemic under control; |
· global and regional economic conditions.
| · | inflation and governmental policies to combat inflation; |
| · | currency exchange movements; and |
| · | global and regional economic conditions. |
We cannot assure you that the future development of the Chilean economy will not impair our ability to successfully carry out our business plan or materially adversely affect our business, financial condition or results of operations.
Civil unrest in Chile, the approval by the general public to draft a new Constitution and the health conditions resulting from COVID-19 have had and could have in the future a significant adverse effect on the general economic conditions in Chile and our business, results of operations and financial condition.
Beginning in October 2019, widespread protests have taken place in Chile. This began with the government's announcement of an increase in subway fares in Santiago and quickly grew into broader unrest over economic inequality in the country. Demonstrations spread across the country and resulted in violent and, sometimes, fatal acts, as well as significant damage to public and private property. The Congress of Chile, as a measure to address the protests, agreed to submit to the general public the approval of a potential reform to the Constitution. On October, 2020, Chile held a referendum whereby nearly 80% of voters opted to replace the Constitution and to have a new constitution drafted by a special constitutional convention comprised of 155 citizens to be elected in April 2021 solely for that task. Upon its drafting and approval by two-thirds of the constitutional convention’s members, the final draft of the new constitution will be submitted to a further public referendum expected to be held during 2022 for its approval or rejection by absolute majority vote.
During 2020 the country was affected by the COVID-19 pandemic, resulting in countless fatalities and an economic crisis caused, in part, by government restrictions aimed at continuing the spread of the virus. Significant measures have been taken to support households and businesses, both tax incentives and social assistance contributions were made, and a 10% two-time withdrawal of pension plan savings was approved. However, developments in the economy during the last quarter of 2020 were less favorable than projected due to new health restrictions and a slow recovery in the sectors most affected, which has negatively impacted the dynamism of the economic recovery and is expected to have a significant effect on consumption and trade-related activities in 2021. At the same time, government fiscal stimulus is expected to continue, in line with the approved budget, and Chile's economy is expected to receive a significant external boost, with copper price averaging increasing significantly.
We cannot predict the extent to which Chile's economy will be affected by civil unrest, the uncertainty of a new Constitution, or the effects of the pandemic and government restrictions to contain the spread of the virus, nor can we predict whether government policies enacted in response to these situations will have a negative impact on Chilean economy. Despite looting at our distribution center in Puente Alto, our operations have not been affected by the protests and vandalism in any material respect to date. Additionally, despite the imposition of the changes and our operations to mitigate the potential spread of the virus, and changes in consumption patterns, our financial results have not been significally impacted. We cannot assure these or similar future developments will not affect our production and logistics infrastructure in the future.
The Chilean peso is subject to depreciation and volatility, which could adversely affect our business.
The Chilean peso has been subject to large nominal devaluations in the past and may be subject to significant fluctuations in the future. The main drivers of exchange rate volatility in past years were the significant fluctuations of commodity prices, as well as general uncertainty and trade imbalances in the global markets. The Chilean peso appreciated by 6% and 8% during 2016 and 2017, respectively, depreciated by 13% and 8% during 2018 and 2019 and appreciated by 5% in 2020, compared to the previous year's closing exchange rate of the US dollar in nominal terms.
A significant part of the raw materials used by the Company are in U.S. dollars, therefore a devaluation of the Chilean peso against the U.S. dollar can affect our costs and margins in a significant way.
In addition, as we report our results of operations in Chilean pesos, fluctuations in the value of the Chilean peso versus the Brazilian real, the Argentine peso and the Paraguayan guaraní could also impact our reported performance in Chilean pesos.
Inflation in Chile and government measures to curb inflation may disrupt our business and have an adverse effect on our financial condition and results of operations.
Although Chilean inflation has decreased in recent years, Chile has experienced highsignificant levels of inflation in the past. The annual rates of inflation in Chile, which in 2012, 2013, 20142016, 2017, 2018, 2019 and 20152020 were 1.5%2.7%, 2.3%, 2.6%, 3.0% 4.6%
and 4.4%3.0%, respectively, as measured by changes in the consumer price index and as reported by the INE (Instituto Nacional de Estadísticas, or the Chilean National Institute of Statistics),Statistics, could adversely affect the Chilean economy and have a material adverse effect on our financial condition and results of operations if we are unable to increase our prices in line with inflation. We cannot assure you that Chilean inflation will not revert to prior levelsincrease in the future.
The measures taken by the Central Bank in the past to control inflation have often included maintaining a conservative monetary policy with high interest rates, thereby restricting the availability of credit and economic growth. Inflation, measures to combat inflation, and public speculation about possible additional actions by the government have also contributed materiallyin the past to economic uncertainty in Chile and to heightened volatility in its securities markets. Periods of higher inflation may also slow the growth rate of the Chilean economy, which could lead to reduced demand for our products and decreased sales. Inflation is also likely to increase some of our costs and expenses, given that the majority of our supply contracts in Chile are UF-denominated or are indexed to the Chilean consumer price index. Due to competition, weWe cannot assure you that, under competitive pressure, we will be able to realizecarry out price increases, which could adversely impact our operating margins and operating income. Additionally, an important part of our financial debt in Chile is UF-denominated, and therefore the value of the debt reflects any increase of the inflation in Chile.
The Chilean peso is subject to depreciation and volatility, which could adversely affect our business.
The Chilean government’s economic policies and any future changes in the value of the Chilean peso against the U.S. dollar could adversely affect our operations and financial results. The Chilean peso has been subject to large nominal devaluations in the past and may be subject to significant fluctuations in the future. The main drivers of exchange rate volatility in past years were the significant fluctuations of commodity prices, as well as general uncertainty and trade imbalances in the global markets. In 2011, the Chilean peso appreciated mainly resulting from worsening financial conditions in certain Eurozone countries and higher volatility in global financial markets. The more recent exchange rate volatility has also been driven by uncertainty about the Eurozone’s financial situation and its effects on global growth. The value of the Chilean peso against the U.S. dollar may continue to fluctuate significantly in the future.
Based on the Observed Exchange Rates for U.S. dollars as of December 31, 2013, 2014 and 2015, the Chilean peso depreciated 9.3%, 15.7% and 14.7% relative to the U.S. dollar in nominal terms, respectively.
A severe earthquake or tsunami in Chile could adversely affect the Chilean economy and our network infrastructure.
Chile lies on the Nazca tectonic plate, one of the world’s most seismically active regions. Chile has been adversely affected by powerful earthquakes in the past, including an 8.0 magnitude earthquake that struck Santiago in 1985 and a 9.5 magnitude earthquake in 1960 which wasis the largest earthquake ever recorded.
OnIn February 27, 2010, an 8.8 magnitude earthquake struck the central and south centralsouth-central regions of Chile. The quake epicenter was located 200 miles southwest of Santiago and 70 miles north of Concepción, Chile’s second largest city. The regions of Bío Bío and Maule were the most severely affected regions, especially the coastal area, which, shortly after the earthquake, was hit by a tsunami that significantly damaged cities and port facilities. The regions of Valparaíso and Metropolitan regionregions were also severely affected. At least 1,500,0001.5 million homes were damaged, and more than 500 people were killed. According to an initial assessment by the government of Chile, the repair of the resulting damage, excluding damage to port facilities, is likely to take between three and four years and the preliminary assessments of reconstruction costs indicate that they could total approximately US$30 billion. As a result of these developments, economic activity in Chile was adversely affected in March 2010. Legislation was passed to raise the corporate income tax rate in order to pay for reconstruction following the earthquake and tsunami, which had an adverse effect on our results. The legislation increased the corporate tax rate from its previous rate of 17.0% to 20.0%.
A severe earthquake and/or tsunami in Chile in the future could have an adverse impact on the Chilean economy and on our business, financial condition and results of operation, including our production and logistics network, including our business, results of operations and financial condition.network.
Risks Relating to Brazil
Our business operations in Brazil are dependent on economic conditions in Brazil.
36.6%Our operations in Brazil represented 40.1% and 32.4% of our assets as of December 31, 20152019 and 32.3%December 31, 2020, respectively, and 34.8% and 34.2% of our consolidated net sales for the year ended December 31, 2015 corresponded to our operations in Brazil.
2019 and 2020, respectively. Because demand for soft drinks and beverage products is usually correlated to economic conditions prevailing in the relevant local market, whichdevelopments in turn is dependenteconomic conditions in Brazil, and measures taken by the Brazilian government, have had and are expected to continue to have an impact on the macroeconomic condition of the country in which the market is located, our financial condition andbusiness, results of operations and financial condition.
The Brazilian economy has historically been characterized by unstable economic cycles and interventions by the Brazilian government. Brazilian GDP contracted by 3.3% in 2016, grew by 1.3%, 1.8% and 1.4% in 2017, 2018 and 2019, respectively, according to a considerable extent are dependent upon politicalthe Brazilian Institute of Geography and economic conditions prevailingStatistics (Instituto Brasileiro de Geografia e Estatistica). According to the Brazilian Institute of Geography and Statistics, the Brazilian GDP contracted by 4.1% in Brazil. 2020. The Brazilian government has often changed monetary, taxation and other policies to influence the course of Brazil’s economy. Our business, results of operations and financial condition may be adversely affected by, among others, the following factors:
| · | expansion or contraction of the Brazilian economy; |
| · | exchange rate fluctuations; |
| · | high inflation rates; |
| · | changes in fiscal or tax policies; |
| · | changes in monetary policy, including an increase in interest rates; |
| · | exchange control policies and restrictions on remittances abroad; |
| · | investment levels; |
| · | liquidity of domestic capital and credit markets; |
| · | employment levels and labor and social security regulations; |
| · | energy or water shortages or rationalization; |
| · | changes in environmental regulation; |
| · | government restrictions in response to the COVID-19 pandemic and the capacity of authorities to keep the pandemic under control; |
| · | social and political instability; and |
| · | other developments in or affecting Brazil. |
The Brazilian economy is also affected by international economic and market conditions in general, especially economic and market conditions in the United States. Similarly to other emerging market countries, the Brazilian currency depreciated significantly during 2015, attributed in part to an outflow of capital related to the expectation that the United States, Federal Reserve will reduce or end its “quantitative easing” economic stimulus measures. The Brazilian economy is therefore subject to uncertainties and risks related to changes in economic conditions and policy measures in countries such as the United States and China, as well as the European Union and elsewhere.China.
The Brazilian economy has been experiencing a slowdown — GDP growth rates were 3.9%, 1.8%, 2.7%, and 0.1% in 2011, 2012, 2013 and 2014, respectively, but GDP decreased 3.8% in 2015. In addition, inflation, unemployment and interest rates increased in 2015, and the Brazilian real weakened significantly in comparison to the U.S. dollar. The market expectation for 2016 is that the Brazilian economy will continue to slow down.
The Brazilian government exercises significant influence over the Brazilian economy, which together with historicallyHistorically volatile Brazilian political, social and economic conditions in Brazil could adversely affect our business and results of operations.
Brazil’s political environment has historically influenced, and continues to influence, the performance of the country’s economy. Political crisis have affected and continue to affect the confidence of investors and the general public, which have historically resulted in economic deceleration.
Economic instability in Brazil has contributed to a decline in market confidence in the Brazilian economy as well as to a deteriorating political environment. In addition, various ongoing investigations into allegations of money laundering and corruption being conducted by the Office of the Brazilian Federal Prosecutor, including the largest such investigation, known as “Operação Lava Jato,” have negatively impacted the Brazilian economy and political environment. The potential outcome of these investigations is uncertain, but they have already had an adverse impact on the image and reputation of the implicated companies, and on the general market perception of the Brazilian economy. We cannot predict whether the ongoing investigations will result in further political and economic instability, or if new allegations against government officials and/or executives of private companies will arise in the future.
Jair Bolsonaro was elected as the President of Brazil in October 2018. His election led to a market recovery and the recovery of the value of the local stock market. However, we cannot assure that this confidence in the market will remain, nor that the policies promoted by this government will be beneficial to the economy or our business. A failure by the Brazilian government to implement necessary reforms may result in diminished confidence in the Brazilian government’s fiscal condition and budget, which could result in downgrades of Brazil’s sovereign foreign credit rating by credit rating agencies, negatively impact Brazil’s economy, lead to further depreciation of the real and an increase in inflation and interest rates, adversely affecting our business, financial condition and results of operations.
The Brazilian economy has historically been characterized by interventions by the Brazilian government and unstable economic cycles. The Brazilian government has often changed monetary, price controls, taxation, credit, tariff and other policies to influence the course of Brazil’s economy. Our business, results of operations, financial condition and prospects may be adversely affected by, among others, the following factors:
· exchange rate fluctuations;
· expansion or contraction of the Brazilian economy, as measured by rates of growth in gross domestic product (GDP);
· high inflation rates;
· changes in fiscal or monetary policies;
· increase in interest rates;
· exchange control policies;
· volatility and liquidity of domestic capital and credit markets;
· changes in climate and weather patterns;
· energy or water shortages or rationalization, particularly in light of water shortages in parts of Brazil;
· changes in environmental regulation;
· social and political instability, particularly in light of recent protests against the government; and
· other economic, political, diplomatic and social developments in or affecting Brazil, including with respect to alleged unethical or illegal conduct of certain figures in the Brazilian government and legislators, which are currently under investigation.
Our results of operations and financial condition may be adversely affected by the economic conditions in Brazil. In addition, protests, strikes and corruption scandals, including the “Lava Jato” investigation, have led to a fall in confidence and a political crisis. There is strong popular pressure and several legal and administrative proceedings for the impeachment of Dilma Rousseff, the Brazilian President, and/or revocation of the mandates or resignation of the Brazilian President and/or the Head of the House of Representatives, which have led to uncertainties. The political crisis could worsen the economic conditions in Brazil, which may worsen purchasing power, consumption and supply chain costs and adversely affect our results of operations and financial condition.
Inflation and the Brazilian government’s measures to curb inflation, including by increasing interest rates, may contribute to economic uncertainty in Brazil, adversely affecting the operations of Andina Brazil, which could adversely impact our financial condition and results of operations.Brazil.
Brazil has historically experienced extremely high rates of inflation. Inflation, and severalinflation, including periods of hyperinflation before 1995. Several measures takenhave been implemented by the Federal GovernmentBrazilian government in orderan effort to control it, combined with speculation about possible government measures, have in the past had significant negative effects on the Brazilian economy. Historically, the annualcurb rising inflation, rates recorded in Brazil before 1995 were extremely high, and included periods of hyperinflation.but we cannot predict whether these policies will be effective. According to the National Amplified Consumer Price Index (Índice Nacional de Preços ao Consumidor Amplo, or “IPCA”), published by the Brazilian Institute of Geography and Statistics (Instituto(Instituto Brasileiro de Geografia e Estatística,, or the “IBGE”), Brazilian annual rates of inflation for consumer price inflation ratesprices were 6.5%6.3% in 2011, 5.8%2016, 3.0% in 2012, 5.9%2017, 3.8% in 2013, 6.4%2018, 4.3% in 20142019, and 10.7%4.5% in 2015. Considering this history and the uncertainty around the Brazilian government’s policies, we cannot provide any assurance that inflation rates in Brazil will not increase more.2020.
BrazilInflationary pressures may continue experiencing high levels of inflationresult in 2016, abovegovernmental interventions in the Central Bank’s target. Periods of higher inflation sloweconomy, including policies that could adversely affect the growth rategeneral performance of the Brazilian economy, which, in turn, could adversely affect our business operations in Brazil. Inflation may lead to lower growth in consumption of products. Inflation also is likely to continue to put pressure on industryincrease our costs of production and expenses, which will force companiesand we may be unable to search for innovative solutions in ordertransfer such costs to remain competitive. We may not be able to pass this cost onto our customers, and, as a result, it may reducereducing our profit margins and net profit.income. In addition, inflation could also affect us indirectly, as our customers may also be affected and its effect on domestic interesthave their financial capacity reduced. Any decrease in our net sales or net income, as well as any reduction in our financial performance, may also result in a reduction in our net operating margin. Our customers and suppliers may be affected by high inflation rates can lead to reduced liquidity in the domestic capital and lending markets, which could affect our ability to refinance our indebtedness in those markets and may have an adverse effectsuch effects on our business, results of operationscustomers and financial condition.suppliers may adversely affect us.
Exchange rate instabilityThe Brazilian real is subject to depreciation and volatility, which could adversely affect our business, financial condition and results of operations.
The Brazilian currency has fluctuatedbeen subject to significant fluctuations over the past three decades. Throughout this period, the Brazilian government has implemented various economic plans and exchange rate policies, including sudden devaluations, periodic mini-devaluationsmini devaluations (during which the frequency of adjustments has ranged from daily to monthly), exchange controls, dual exchange market and floating exchange rate systems. Although long-term devaluation of the real is generally related to the rate of inflation in Brazil, the devaluation of the real over shorter periods has resulted in significant fluctuations in the exchange rate between the Brazilian currency, the U.S. dollar and other currencies. The Brazilian real appreciated 17% during 2016 and depreciated 2%, 17%, 4%, and 29% during 2017, 2018, 2019 and 2020, respectively, compared to the closing exchange rate as of the end of the prior period for the U.S. dollar in nominal terms.
In 2013,A significant part of the raw materials we use in Brazil are priced in U.S. dollars, so a depreciation of the Brazilian real depreciated against the U.S. dollar closing at R$2.3426 to US$1.00. In 2014,has a significant adverse effect in our costs and margins.
Any depreciation of the real depreciated against the U.S. dollar closing at R$2.6562could create additional inflationary pressure, which might result in the Brazilian government adopting restrictive policies to US$1.00 on December 31, 2014. In 2015,combat inflation. This could lead to increases in interest rates, which might negatively affect the real depreciated againstBrazilian economy as a whole, as well as our results of operations, in addition to restricting our access to international financial markets. It also reduces the U.S. dollar closing at R$3.904 to US$1.00 on December 31, 2015. We cannot guarantee thatvalue of our revenues. On the real will not again depreciate or appreciate against the U.S. dollar in the future. In addition, we cannot guarantee that any deprecation orother hand, future appreciation of the real against the U.S. dollar or other currenciesmight result in the deterioration of Brazil’s current and capital accounts, as well as a weakening of Brazilian GDP growth derived from exports. We cannot assure you that the real will not again fluctuate significantly against the U.S. dollar in the future and, as a result, have an adverse effect on our business.
Depreciation of the real against major foreign currencies, including the U.S. dollar, could create additional inflationary pressures in Brazil and cause the Central Bank to increase interest rates in effort to steady the economy. In turn, these measures could negatively affect the growth of the Brazilian economy as a whole and may harm our financial condition and ourbusiness, results of operations curtail access to foreignand financial markets and prompt government intervention, including efforts to avoid recession. Depreciation of the real can also, as in the context of an economic slowdown, lead to a decrease in consumer spending, deflationary pressures and reduced growth in the Brazilian economy as a whole.
In contrast, appreciation of the real relative to the major foreign currencies, including the U.S. dollar, could lead to a deterioration of Brazilian current accounts, as well as foreign exchange current accounts, and also affect export-driven growth. Depending on the circumstances, either depreciation or appreciation of the real could materially and adversely affect the growth of the Brazilian economy and us.condition.
Changes in tax laws may increase our tax burden and reduce tax incentives and, as a result, negatively affect our profitability.
The Brazilian government regularly implements changes to tax regimes that may increase our and our customers’ tax burdens. These changes include modifications in the tax rates and, on occasion, enactment of temporary taxes, the proceeds of which are earmarked for designated governmental purposes. In the past, the Brazilian government has presented certain tax reform proposals, which have been mainly designed to simplify the Brazilian tax system, to avoid internal disputes within and between the Brazilian states and municipalities, and to redistribute tax revenues. The tax reform proposals provide for changes in the rules governing the federal Social Integration Program (Programa de Integração Social, or “PIS”) and Social Security Contribution (Contribuição para o Financiamento da Seguridade Social, or “COFINS”) taxes, the state Tax on the Circulation of MerchandiseGoods and Services (Imposto Sobre a Circulação de Mercadorias e Serviços, or “ICMS”) and some other taxes, such as increases in payroll taxes. These proposals may not be approved and passed into law. The effects of these proposed tax reform measures and any other changes that result from enactment of additional tax reforms have not been, and cannot be, quantified. However, some of these measures, if enacted, may result in increases in our overall tax burden, which could negatively affect our overall financial performance.In addition, the Brazilian beverage industry experiences unfair competition arising from tax evasion, which is primarily due to the high level of taxes on beverage products in Brazil. An increase in taxes may lead to an increase in tax evasion, which could result in unfair pricing practices in the industry.
Recently, regardingSince 2018, the “ICMS”, thereBrazilian government has gradually altered the value-added tax on industrialized products (Imposto sobre Produtos Industrializados or “IPI”) applicable to soft drinks concentrate. This measure has negatively affected our operations, since it significantly reduced the tax credit derived from the purchases of concentrate from the Manaus Free Trade Zone that currently benefits Rio de Janeiro Refrescos, and the soft drinks industry as a whole. Such alterations have been some discussions aboutimplemented gradually, as follows:
(1) 20% IPI rate until August 2018;
(2) 4% IPI rate from September to December 2018;
(3) 12% IPI rate in the difference between a full exemptionfirst half of 2019;
(4) 8% IPI rate from July to September 2019;
(5) 10% IPI rate from October to December 2019;
(6) 4% IPI rate from January to May 2020;
(7) 8% IPI rate from June to November 2020;
(8) 4% IPI rate from December 2020 to January 2021; and a base reduction. If a base reduction is considered a partial exemption, there is a risk
(9) 8% IPI rate from February 2021 onwards.
Any further reductions of reduction of our tax credits, whichthe IPI may adversely affect our financial condition and results of operations.
Tax proceedings may resultGiven the high tax burden in a significant tax liability to Ipiranga
Ipiranga is party toBrazil, federal and state authorities of that country offer a series of ongoing administrativesignificant tax proceedingsincentives to certain territories and/or localities in whichorder to attract investment, particularly for manufacturers and other companies operating and investing in Brazil. Coca-Cola Andina Brazil has received some of these tax incentives and its results have been positively affected by these incentives. Although these incentives have generally been renewed in the Brazilian federalpast, we cannot assure that they will continue to be renewed in the future. Current tax authorities have claimed that Ipiranga has unpaid liabilities for value-added taxes on industrialized products (imposto sobre produtos industrializados, or IPI) in an aggregate amount, asincentives from the State of December 31, 2015, of approximately R$1,206,853,388. These proceedings are at different administrative as well as judicial procedural stages. We disagree with the Brazilian tax authority’s position and believe that Ipiranga was entitled to claim IPI tax creditsRio de Janeiro in connection with its purchasesthe development and construction of certain exempt inputs from suppliers locatedthe Duque de Caxias production plant expired in the Manaus Free Trade Zone. We believe that the BrazilianOctober 2020 and were not renewed, resulting in a negative impact of R$41.9 million in 2020 when compared to 2019. Termination, non-extension or non-renewal of tax authority’s claims are without merit. Our external Brazilian counsel has advised us that it believes Ipiranga’s likelihoodincentives could have a material adverse effect on our business, financial condition and results of loss in most of these proceedings is classified as possible to remote (i.e., approximately 30% likelihood). Despite the foregoing, the outcome of these claims is subject to uncertainty, and it is impossible to predict its final resolution. Finally, pursuant to the agreement under which we agreed to acquire Ipiranga’s shares, the sellers agreed to indemnify us for such tax obligations and established a five-year duration escrow account (which five-year term expires [·]) to support this indemnity liability in an amount equivalent to R$270,018,165.operation.
Risks Relating to Argentina
Our business operations in Argentina are dependent on economic conditions in Argentina.
10.0%Our operations in Argentina represented 10.1% and 8.8% of our assets as of December 31, 20152019 and 33.4%December 31, 2020, respectively, and 22.2% and 18.8% of our net sales for 2019 and 2020, respectively. Developments in economic, political, regulatory and social conditions in Argentina, and measures taken by the year ended December 31, 2015 correspondedArgentine government, have had and are expected to continue to have an impact on our operations in Argentina. Because demand for soft drinks and beverage products is usually correlated to economic conditions prevailing in the local market, which in turn is dependent on the macroeconomic condition of the country, the financial condition andbusiness, results of operations of our business operations in Argentina are, to a considerable extent, dependent upon political and economic conditions prevailing in Argentina.financial condition.
Historically, the Argentine economy has experienced periods of high levels of instability and volatility, low or negative economic growth and high and variable inflation and devaluation levels. During 2001 and 2002, Argentina went through a period of major political, economic and social instability, which led to a partial default by Argentina in the payment of its sovereign debt, and the devaluation of the peso in January 2002, after over ten years of parity with the U.S. dollar. Although general economic conditions in Argentina have recovered significantly during the past years, there is uncertainty as to whether this recovery is sustainable. This is mainly because recent economic growth was initially dependent on a significant devaluation of the Argentine peso, a high excess production capacity resulting from a long period of deep recession and high commodity prices. According to the INDECNational Statistics and Census Institute (Instituto Nacional de Estadísticas y Censos, or the National Statistics and Census Institute)“INDEC”), Argentine GDP growthcontracted in real terms by 2.1% in Argentina was 9.5%2016, grew by 2.8% in 2010, 8.4%2017 and contracted by 2.6% and 2.1% in 2011, 0.8%2018 and 2019, respectively. During 2020, Argentine GDP decreased by 9.9% compared to the previous year according to the INDEC.
Argentine economic conditions are dependent on a variety of factors, including the following:
| · | domestic production, international demand and prices for Argentina’s principal commodity exports; |
| · | the competitiveness and efficiency of domestic industries and services; |
| · | the stability and competitiveness of the Argentine peso against foreign currencies; |
| · | the rate of inflation; |
| · | the government’s fiscal deficits; |
| · | the government’s public debt levels; |
| · | government restrictions in response to the COVID-19 pandemic and the capacity of authorities to keep the pandemic under control; |
| · | foreign and domestic investment and financing; and |
| · | governmental policies and the legal and regulatory environment. |
Government policies and regulation—which at times have been implemented through informal measures and have been subject to radical shifts—that have had a significant impact on the Argentine economy in 2012, 2.9%the past have included, among others: monetary policy, including exchange controls, capital controls, high interest rates and a variety of measures to curb inflation, restrictions on exports and imports, price controls, mandatory wage increases, taxation and government intervention in 2013 and 0.5% in 2014. The most recent GDP figures INDEC has released are for the first and second quarters of 2015, when Argentina registered GDP growth in real terms of 2.1% and 2.3%, respectively. private sector.
We cannot assure you that Argentine GDP will increase or remain stable in the future. The economic crisis in Europe, the international demand for Argentine products, the instability and competitiveness of the Argentine peso against foreign currencies, confidence among consumers and foreign and domestic investors, the significant and increasing inflation rate and future political, financial and economic uncertainties, among other factors, may affect the development of the Argentine economy.economy will not impair our ability to successfully carry out our business plan or materially adversely affect our business, financial condition or results of operations.
Political and economic instability in Argentina may recur, which could have a material adverse effect on our Argentine operations and on our financial condition and results of operations.
Argentina has a history of political and economic instability that often results in abrupt changes in government policies. Argentine governments have pursued different, and often contradictory, policies to those of preceding administrations. In recent decades, succeeding administrations have implemented interventionist policies, which included nationalization, debt renegotiation, price controls, and exchange restrictions, as well as market-friendly policies, such as export tax reductions, elimination of currency controls, deregulation of utility prices, negotiation of free trade agreements and implementation of pro-investor initiatives.
In October 2019, Argentine presidential, legislative and certain provincial and municipal governments elections were held and Alberto Fernández was elected president. The new administration took office in December 2019. Certain members of the period from 1998 through 2003, Argentina experienced acute economic difficulties that culminatedcurrent government coalition, including president Alberto Fernández and vice president Cristina Fernández de Kirchner, were part of administrations which in the restructuringpast were characterized by high levels of substantially all of Argentina’s sovereign indebtedness. There weregovernment intervention and policies at times disadvantageous to investors and the private sector. As a succession of presidents during this crisis periodresult, there is uncertainty regarding the policies and various states ofchanges in regulation that the current Argentine government will implement. In December 2019, the government passed a law granting emergency were declared that suspended civil liberties and instituted restrictions on transfers of funds abroad and foreign exchange controls,powers to the executive branch, among other measures. Argentina’s GDP contracted 10.9% in 2002. Beginning in 2003, Argentine GDP began to recover and from 2004 to 2008 recorded an average rate of growth of 8.4%.We cannot predict what policies this government will implement under these emergency powers.
The global economic crisis of 2008 led to a sudden economic decline, accompanied by political and social unrest, inflationary and Argentine peso depreciation pressures, and lack of consumer and investor confidence, which have forcedWe cannot provide assurance that the Argentine government towill not adopt different measures, including the tightening of foreign exchange controls, the elimination of subsidies to the private sector and the proposal for new taxes.
On the other hand, until December 2015,policies, over which we have no control, that adversely affect the Argentine government increased its intervention level in some of the areas of the economy. For example, in May of 2012, the Argentine government nationalized YPF S.A., Argentina’s largest and previously Spanish-owned oil company, which was originally an Argentinian state owned entity. Expropriations and other interventions by the Argentine government such as the one relating to YPF can have an adverse impact on the level of foreign investment in Argentina, the access of Argentine companies to the international capital markets and Argentina’s commercial and diplomatic relations with other countries. Despite the change in government that occurred in December 2015, the level of governmental intervention in the economy in the future may continue, which may have adverse effects on Argentina’s economy and in turn,impair our Argentine operations and our business, results of operations and financial condition.
The Argentine government could impose certain restrictions on currency conversions and remittances abroad, which could affect the timing and amount of any dividends or other payment we receive from our Argentine subsidiary.
In 2001 and 2002, the Argentine government implemented a number of monetary and currency exchange control measures, which included restrictions on the withdrawal of funds deposited with banks and stringent restrictions on the outflow of foreign currency from Argentina, including for purposes of paying principal and interest on debt and distributing dividends. From December 2011 to November 2015, as a result of the increased demand in Argentina for U.S. dollars and capital flows from Argentina during 2011, the Argentine Government imposed additional restrictions on the purchase of foreign currency and certain transfers of funds out of Argentina and reduced the time required to comply with certain transfers of funds into Argentina.
During December 2015 these restrictions began to be reviewed by the new administration in order to normalize the existing exchange-rate policy.
Under current Argentine law, we may declare and distribute dividends with respect to our Argentine subsidiary and Argentine banks may lawfully process payments of those dividends to us and other non-resident shareholders. Our declaration and distribution of dividends is subject to certain statutory requirements and must be consistent with our audited financial statements. The processing of payment of dividends by Argentine banks is subject to Argentine Central Bank regulations, including verification of our Argentine subsidiary’s compliance with foreign debt and direct investment disclosure obligations. In addition to statutory and administrative rules affecting our Argentine subsidiary’s payment of dividends, during 2012 the Argentine government imposed discretionary restrictions on Argentine companies as part of a policy to limit outbound transfers of U.S. dollars. From 2010 until the beginning of 2016 these restrictions halted dividend payments to non-resident shareholders. At the start of 2016 the new administration began decreasing these restrictions which enabled us to withdraw earnings for the year 2010 from our Argentine subsidiary in February 2016.
Nonetheless, we cannot assure you that we will be able to cause our Argentine subsidiary to distribute dividends to its non-resident shareholders, despite otherwise meeting all statutory and regulatory requirements for payment.
Argentina’s government may impose certain restrictions on imports, which could have an impact in our operations.
Since February 2012, pursuant to a resolution of the Argentine Federal Tax Authority (“Administración Federal de Ingresos Públicos—AFIP”) Argentine importers were required to file a “Prior Import Statement” (“Declaración Jurada Anticipada de Importación—DJAI”) with the AFIP providing information on future imports prior to the execution of any purchase order or similar document. Compliance with this requirement, was verified by the Argentine customs upon arrival of the goods into Argentina and was a condition for the authorization of the payment of the purchase price by the Argentine fiscal entities. Although this was intended merely as an information gathering regime, it may in the future be used for purposes of restricting imports into Argentina. A similar regime was also imposed in respect of the import and export of services (known by its initials as “DJAS”), and resulted in additional restrictions being imposed on the payments made by Argentine residents on services provided by foreign residents. While the change in the Argentine government that occurred in December 2015 considerably relaxed restrictions on imports of goods and services and replaced the Prior Import Statement system described above with a Comprehensive System of Monitoring Imports (Sistema Integral de Monitoreo de Importaciones - SIMI) (together with the implementation of automatic and non-automatic licenses) while maintaining the DJAS, we cannot assure that these restrictions will be completely removed or that the previous regime will not be reinstated. Restrictions on Argentine imports of goods and services of our subsidiaries may adversely affect our financial conditions or results of operations.
Inflation in Argentina may adversely affect our operations, which could adversely impact our financial condition and results of operations.
Argentina has experienced high levels of inflation in recent decades, resulting in large devaluations of its currency.decades. Argentina’s historically high rates of inflation resulted mainly from its lack of control over fiscal policy and itsthe money supply. AccordingArgentina continues to theface high inflationary pressures. The INDEC the official annual rates of inflation for the years 2011, 2012, 2013, 2014 and 2015 (date until October 2015 since the INDEC suspended its report thereafter) were 9.5%, 10.8%, 10.9%, 23.9% and 11.8%, respectively. Moreover, after changes in personnel and in the methodology used to calculate2017 reported that the consumer price index at(índice de precios al consumidor or “CPI”) increased 24.8%, while the INDEC in 2007, the accuracy of its past measurements has been put into doubt by economists and investors. The actual consumer price index and wholesale price index may therefore be substantially higher than those indicated by(índice de precios internos al por mayor or “WPI”) increased 18.8%. In 2018, the INDEC registered a variation in the CPI of 47.6% and an increase in WPI of 73.5%. In 2019, the INDEC registered an increase in CPI of 53.7%, while the WPI increased 58.5%. In 2020, the INDEC registered an increase in CPI of 42.0%, while the WPI increased 35.4%.
During 2018, 2019 and 2020, Argentina met the criteria to be considered a hyperinflationary economy as provided by IAS 29 guidelines, which include, among other characteristics, a cumulative inflation rate over three years that approaches or exceeds 100%. Accordingly, IAS 29 must be applied for financial statements for fiscal years priorending on or after July 1, 2018. IAS 29 requires non-monetary assets and liabilities, shareholders’ equity and comprehensive income to December 2015. Withbe restated in terms of a measuring unit current at the changeperiod end. IAS 29 also requires the use of a general price index to reflect changes in purchasing power. As a result, since July 2018, we began to apply IAS 29 in the preparation of our financial statements and report the results of our operations in Argentina as if this economy was hyperinflationary from January 1, 2018. In addition, by application of IAS 29, we had to translate figures in Argentine Government in December 2015, INDEC has suspendedpesos to Chilean pesos using the issuanceperiod closing exchange rate (and not the average exchange rate), thus reducing our results of reports on the consumeroperations and wholesale price indices until June 2016, date on which, according to INDEC, it will begin to report new indexes.net earnings. We cannot assure INDEC will disseminate new indexes or that when they do theypredict for how long Argentina will be accurate or appropriate. A lackconsidered a hyperinflationary economy and we will have to apply IAS 29 to the preparation of consumer price indexes and other proper and accurate
INDEC indexes could cause a significant decrease in confidence in the Argentine economy, which could, in turn, have a material adverse effect on our operations and financial conditionstatements.
In the past, inflation has materially undermined the Argentine economy and the government’s ability to generate conditions that foster economic growth. In addition, highHigh inflation or a high level of price instability may materially and adversely affect the business volume of the financial system. This result, in turn, could adversely affect the level of economic activity and employment in the country.
High inflation would also undermine Argentina’s foreign competitiveness and adversely affect economic activity, employment, real salaries, consumption and interest rates. In addition, a dilution of the positive effects of the Argentine peso devaluation on the export-oriented sectors of the Argentine economy, even with the elimination of the exchange restriction, would decrease the level of economic activity in the country. In turn, a portion of the Argentine debt is adjusted by the Coeficiente de Estabilización de Referencia, the Stabilization Coefficient Index, a currency index that is strongly tied to inflation. Therefore, any significant increase in inflation would cause an increase in Argentina’s debt and, consequently, the country’s financial obligations. A high level of uncertainty with respect to these economic indicators, and a general lack of stability with respect to inflation, could cause a shortening of contract terms and affect the ability of businesses to plan and make decisions,rates, thereby potentially materially and adversely affecting economic activity and lowering consumers’ and individuals’ income and their purchasing power, all of which could have a material adverse effect on our financial condition and operating results.
DueBetween 2007 and 2015, the INDEC, which is the only institution in Argentina with the statutory authority to a default by Argentina on its debt obligationsproduce official national statistics, experienced significant institutional and methodological changes that gave rise to controversy regarding the reliability of the information that it produces, including inflation, GDP and unemployment data, resulting in 2001 and related litigation,allegations that the ability ofinflation rate in Argentina and private sector companiesthe other rates calculated by INDEC could be substantially different than as indicated in Argentina to obtain financingofficial reports. While the previous administration undertook reforms and to attract direct foreign investment isthe credibility of the national statistics systems has since been restored, we cannot assure you that the new or future administrations will not implement policies that may affect the national statistics system undermining consumer and will continue to be limited,investor confidence, which may have material adverse effects on the economyultimately could affect our business, results of operations and our financial performance.condition.
Argentina has very limited access to foreign financing. In December 2001, Argentina defaulted on over $81.8 billion in external debt to bondholders. In addition, since 2002, Argentina suspended payments on over $15.7 billion in debt to multilateral financial institutions (and continues to owe a substantial portion of this amount to the Paris Club and to other financial institutions). As of December 31, 2013, Argentina’s total public debt amounted to approximately $28.4 billion (excluding the debt in default to bondholders).
In addition, the foreign shareholders of several Argentine companies, including public utilities, and bondholders filed claims that exceeded US$20 billion with the International Centre for Settlement of Investment Disputes. During 2013, approximately US$ 680 million of these claims were settled. As of the date hereof, approximately US$ 15 billion in claims remains pending.
In addition, pursuant to an order dated February 23, 2012, as amended by an order dated November 21, 2012, the United States District Court for the Southern District of New York granted an injunction requiring Argentina to pay the holders of the defaulted debt as a precondition to making a single interest payment under the restructured debt. The injunction further required Argentina to pay into an escrow account over $1.3 billion prior to making the payment of the restructured debt on the December 15, 2012 scheduled payment. Upon appeal by Argentina, on August 23, 2013 the U.S. Court of Appeals for the Second Circuit upheld the lower court order requiring Argentina to pay holdout bondholders as a condition to payments to holders of restructured debt. On September 11, 2013, Argentina’s Congress approved an open-ended bond swap offer that would allow holders of the remaining 7% of bonds still outstanding after the country’s 2002 default (as well as participating bondholders) to exchange their instruments for new bonds governed by Argentine law. On October 3, 2013, the U.S. District Court for the Southern District of New York ordered Argentina to desist from the exchange offer. On November 18, 2013 the Second Circuit upheld the previous order and Argentina appealed to the Supreme Court of the United States. A ruling is expected within the next 6 months, however if the Supreme Court does not rule within that period the previous ruling will be affirmed. In December 2015, the new Argentinian administration announced its intention to negotiate with holdout bondholders, a process that is currently under negotiation.
This substantial uncertainty on the outstanding defaulted debt limits the access of Argentina to foreign financing in the international markets. Without access to international private financing, Argentina may not be able to finance its obligations, which could also inhibit the ability of the Argentine Central Bank to adopt measures to curb inflation and could adversely affect Argentina’s economic growth and public finances, which could, in turn, adversely affect our operations in Argentina, our financial condition and the results of our operations.
The Argentine peso is subject to depreciation and volatility, which could adversely affect our financial condition and results of operations.
After several years of price stabilityFluctuations in Argentina, the devaluationvalue of the peso continue to affect the Argentine peso ineconomy. Since January 2002, imposed pressures on the domestic price system that generatedpeso has fluctuated significantly in value, often following periods of high inflation throughout 2002. The devaluationand currency controls that artificially appreciated the value of the currency. Frequent devaluations have had an adverse effect on the ability of the Argentine government and Argentine companies to make timely payments on their foreign currency denominated obligations, generating high inflation throughout 2002,have significantly reducingreduced wages in real salariesterms, and have adversely affecting companies that were focusedimpacted the stability of businesses whose success depends on the domestic market such as public service companies and financial companies. It also adversely affecteddemand.
In an effort to reduce downward pressure on the abilityvalue of the government to honor its foreign debt obligations. Since December 2001 until November 2015 CPI increased 1290% while the nominal exchange rate varied 979% rendering an exchange rate depreciation that was attempted to be partially corrected through a 43% devaluation of theArgentine peso, towards the end of December 2015.
During 2015, the official exchange rate in Argentina depreciated by 52.5% against the U.S. dollar with respect to the official exchange rate as of the end of 2014.
In late 2011 the Argentine government has at times implemented a series of measurespolicies aimed at maintaining the level of reserves of the Banco Central de la República Argentina (“BCRA”). As part of that effort, during the last quarter of 2011 until December 2015 new measures were implemented to limit the purchase of foreign currency by private companies and individuals. AccessCurrently, access to the foreign exchange market requires authorizationis subject to several restrictions and governmental authorizations.
In 2016, 2017, 2018, 2019 and 2020, the Argentine peso depreciated 22%, 17%, 102%, 59% and 41%, respectively, compared to the closing exchange rate as of the tax authorities, among other restrictions. As a result, the implied exchange rate in the quotation of Argentine securities that traded in foreign markets and in the local market increased significantly. During the year 2015 these restrictions continued increasing, making operations to withdraw payments to overseas suppliers highly complex. In January 2015 the purchase of dollars per day was limited to US$300,000. By the middleend of the year, this limit had been decreased to US$75,000 andprior period for the U.S. dollar. A significant part of the raw materials used by year end was US$50,000, which forced companies to split foreign import payments and caused some companies to reduce their importation of certain inputs.
On December 17, 2015, after the company in Argentina are in U.S. dollars, so a devaluation of the Argentine Peso,peso against the split exchange rate market was reunified with the returnU.S. dollar can affect our costs and margins in a significant way.
The depreciation of the “Single Free Exchange Market” (Mercado Unico Libre de Cambio)Argentine peso may have a negative impact on the ability of certain Argentine businesses to service their foreign currency denominated debt, significantly reduce real wages and many restrictionsjeopardize the stability of businesses which success depends on acquisitiondomestic market demand. It may also, adversely affect the Argentine government’s ability to honor its foreign debt obligations. A significant appreciation of foreign exchangethe Argentine peso against the U.S. dollar also presents risks for the Argentine economy, including the possibility of a reduction in exports as a consequence of the loss of external competitiveness. Any such appreciation could also have a negative effect on economic growth and payments to overseas suppliers were eliminated.employment, and reduce tax revenues.
Given the economic and political conditions in Argentina, we cannot predict whether, and to what extent, the value of the Argentine peso may depreciate or appreciate against the U.S. dollar, the euro or other foreign currencies. With the change of the Argentine Government in December 2015, the exchange market was partially deregulated, and the gap between the exchange rate published by the BCRA and the black market exchange rate was considerably reduced. We cannot predict how these conditions will affect the consumption of our products. Moreover, we cannot predict whether the newcurrent Argentine government will continue its monetary, fiscal, and exchange rate policy amendments and, if so, what impact any of these changes could have on the value of the Argentine peso and, accordingly, on our financial condition, results of operations and cash flows, and on our ability to transfer funds abroad in order to comply with commercial or financial obligations. According
The Argentine government could impose certain restrictions on currency conversions and remittances abroad, which could affect the timing and amount of any dividends or other payment we receive from our Argentine subsidiary.
Beginning in December 2015, the Argentine government gradually eased restrictions which significantly curtailed access to IFRS,the foreign exchange market by individuals and private sector entities and affected our ability to declare and distribute dividends with respect to our Argentine subsidiary. These measures included informal restrictions, which isconsisted of de facto measures restricting local residents and companies from purchasing foreign currency through the method under whichforeign exchange market to make payments abroad, such as dividends and payment for the Company presents its results,importation of goods and services.
On September 1, 2019, in a response to the weakening of the Argentine peso following the results generatedof the primary elections, the Argentine government temporarily reinstated certain exchange restrictions. The new controls apply with respect to access to the foreign exchange market by residents (both companies and natural persons) for savings and investment purposes abroad, the payment of external financial debts abroad, the payment of dividends in foreign currency abroad, the payment of imports of goods and services, and the obligation to repatriate and settle for Argentine pesos the proceeds from exports of goods and services, among others. Under current Argentine law, we are restricted from accessing the official foreign exchange market to make dividend payments to us from our operationsArgentine subsidiaries without prior approval from the Argentine Central Bank.
The Argentine government could maintain or impose new exchange control regulations, restrictions and adopt other measures to prevent capital flight or significant depreciation of the peso, which could limit access to international capital markets, adversely affecting Argentina's economy, and further impair our ability to declare and distribute dividends from our Argentine subsidiaries.
The Argentine government’s ability to obtain financing from international capital markets may be limited or costly, which may impair its ability to implement reforms and foster economic growth.
At the end of 2001, the Argentine government defaulted in part of its sovereign debt. In 2005 and 2010, Argentina conducted exchange offers to restructure part of its sovereign debt that had been in default since the end of 2001. Through these exchange offers, Argentina restructured over 92% of its eligible defaulted debt. In April 2016, after a series of judicial actions by Argentina’s bondholders, the Argentine government settled substantially all of the remaining defaulted debt. Additionally, as a result partially of emergency measures undertaken by the government in response to the crisis of 2001 and 2002, foreign shareholders of several Argentine companies filed claims with the International Centre for Settlement of Investment Disputes (“ICSID”), alleging that those measures diverged from the just and equal treatment standards set forth in bilateral investment treaties to which Argentina is a party. The ICSID ruled against the Argentine government in a number of these proceedings, and the Argentine government has settled some but not all of these claims.
Between December 2019 and September 2020, the Argentine government agreed restrictions to its sovereign debt with international and local bondholders. In August and September 2020, the Argentine government restructured its sovereign bonds debt under foreign law in the amount of US$67 billion and under local law in the amount of US$45 billion, in both cases with an acceptance level of over 99%. The Ministry of Economy is currently renegotiating the agreement with the International Monetary Fund after extending part of a US$57 billion bailout program agreed with the previous Administration. As a result, Fitch rating agency changed its rating to Argentina from "restricted default" to "substantial credit risk" and Standard & Poor's changed its rating from "selective default" to "substantial risk.
While Argentina had regained access to the international capital markets, actions by the Argentine government, or investor perceptions of the country’s creditworthiness, could curtail access in the future or could significantly increase borrowing costs, limiting the government’s ability to foster economic growth. Limited or costly access to international financing for the private sector could also affect our business, financial condition and results of operations.
The government may order salary increases to be paid to employees in the private sector, which could increase our operating costs and affect our results of operations.
In the past, the Argentine government has passed laws, regulations and decrees requiring companies in the private sector to increase wages and provide specified benefits to employees. On December 23, 2019, the Argentine government passed a law granting emergency powers to the executive branch which, among others, include the ability to mandate increases to private sector wages. Due to persistent high levels of inflation, labor organizations regularly demand significant wage increases. In 2016, 2017, 2018, 2019 and 2020 the increase in the federally-mandated minimum wage was 35%, 17%, 28%, 48% and 22%, respectively, and for these same years the market average salary increase for workers was 33%, 26%, 32%, 48% and 38%, respectively. In addition, the Argentine government has arranged various measures to mitigate the impact of inflation and exchange rate fluctuation in wages. Due to high levels of inflation, both public and private sector employers continue to experience significant pressure to further increase salaries.
Labor relations in Argentina are convertedgoverned by specific legislation, such as Labor Law No. 20,744 and Law No. 14,250 on Collective Bargaining Agreements, which, among other things, dictate how salary and other labor negotiations are to be conducted. In the reporting currency usingfuture, the official exchange rate.government could take new measures requiring salary increases or additional benefits for workers, and the labor force and labor unions may apply pressure in support of such measures. Any such increase in wages or worker benefit could result in added costs and reduced results of operations for Argentine companies, including us.
Government measures to preempt or respond to social unrest may adversely affect the Argentine economy and our business.
During the Argentine economic crisis in 2001 and 2002,In recent decades, Argentina has experienced significant social and political turmoil, including civil unrest, riots, looting, nationwide protests, strikes and street demonstrations. Despite Argentina’s economic recovery and relative stabilization, socialSocial and political tension and high levels of poverty and unemployment continue. In 2008, Argentina facedUnions frequently stage nationwide strikes and protests. In November of 2012 there was a general strike led by opposition trade unions. The social unrest increased during the last months of 2012,protests, and in December 2012 additional riots occurred, in addition toand lootings of shops and supermarkets in cities around the country.country have taken place at times of social turmoil.
Future government policies to preempt, or in response to, social unrest may include expropriation, nationalization, forced renegotiation or modification of existing contracts, suspension of the enforcement of creditors’ rights, new taxation policies and changes in laws and policies affecting foreign trade and investment. Such policies could destabilize the country and adversely and materially affect the Argentine economy, and thereby our business, results of operations and financial condition.
The governmentPrice control policies in Argentina may order salary increases to be paid to employees in the private sector,accentuated, which could increase our operating costs and affect our results of operations.
In the past, the Argentine government has passed laws, regulations and decrees requiring companies in the private sector to increase wages and provide specified benefits to employees, and may do so again in the future. Due to the high levels of inflation, labor organizations are demanding significant wage increases. In August 2012, the Argentine government established a 25% increase in the minimum salary accumulating a total of 32% for that period, and 16% for 2012. In 2013, 2014 and 2015 the increase of the vital and mobile minimum salary was 23.60%, 33.33% and 27% respectively, and for these same years the market average increase for workers was 25%, 30% and 32%, respectively.
It is possible that the Argentine government could adopt measures mandating salary increases and/or the provision of additional employee benefits in the future, which could have a material and adverse effect on our expenses and business,the results of our Argentine operations.
The Argentine government has from time to time established price controls on consumer products. To the extent that the price of our products in Argentina are restricted by government imposed price controls the results of our Argentine operations may be materially affected. As of 2020, with the change of administration, the Argentine government restablished its Precios Cuidados price-watch program with new products including 93 new items from different categories of the mass consumption basket with price revisions on a quarterly basis or every four months. In March 2020, with the implementation of the COVID-19 pandemic health measures, through a resolution issued by the Secretariat of Commerce presidential decree and financial condition.in parallel to the current Precios Cuidados price-watch program, the Maximum Reference Prices program was created, freezing prices of 2,300 products from 50 basic consumer categories (in force for hypermarkets, supermarkets, mom & pops, self-service, mini markets and wholesale supermarkets and their respective products suppliers throughout the country). Price increases for the products involved in the new program were subsequently authorized in July and October. The extension and validity of this program will depend on the Argentine government's politics based on developments in the health crisis and inflation. As of the date of this annual report, the program is scheduled to end on May 15, 2021, as the Secretariat of Commerce decided to extend, once more, the validity of this program to protect consumers. Aligned with the price control policies, in March 2021 the Secretariat of Commerce created a new information regime known as
“System for the Implementation of Economic Reactivation Policies” (“SIPRE”) to avoid arbitrary price increases and shortage of products. The SIPRE requires large commercial and industrial companies, including beverages manufacturers, to inform on a monthly basis the price, production and sales, and inventory stocks of their products. Also, the Secretariat of Commerce announced, during April 2021, the formation of the Observatory of Prices and Availability of Inputs, Goods and Services, that will monitor, survey and systematize the prices and availability of all inputs, goods and services that are produced, traded and rendered in Argentina.
Towards the end of 2020 and beginning of 2021, the Argentine government began to reduce the number of categories in the Maximum Reference Prices program, with the aim and commitment to expand the offer of items in the current Precios Cuidados price-watch program. Starting in 2021, the Precios Cuidados price-watch program reaches 800 referential products, covering the main categories of mass consumption and other relevant industries.
Consistent with these price control policies, the Secretariat of Commerce created in March 2021 a new information regime known as “System for the Implementation of Economic Reactivation Policies” (SIPRE for its acronym in Spanish) to prevent unjustified price increases and shortage of products. The SIPRE requires large commercial and industrial companies, including beverages manufacturers, to inform on a monthly basis the price, production, sales, and stocks of their products.
The participation of Coca-Cola products in the Precios Cuidados price-watch program as referential products involved one product from the soft drinks’ category, which was temporarily extended to three in sugar-free variants until the end of 2020, where new categories were incorporated, reaching four products as estimated.
We cannot assure that price controls in Argentina will not continue or be expected to include additional consumer products. Nor can we assure you the affect to which government imposed price control will affect the profitability of our Argentina operations.
Risks Relating to Paraguay
Legislative and public policy changes.
In 2015 a new Civil and Commercial Code of the Republic of Argentina came into force that regulates all legal relations of our Argentine subsidiary with its customers, suppliers and consumers. In addition, the new Argentine government which took office in December 2015 has announced that it is considering various bills that could amend Argentinian legislation on issues such as tax, customs, social security, labor, and commerce, among other areas. Also, the new government has announced changes in various public policies, including an increase in controls under the competition act. We cannot guarantee that these legislative amendments, if approved, may not adversely affect our financial condition or results of operations of our Argentine subsidiaries.
Risks Relating to Paraguay
Our business operations in Paraguay are dependent on economic conditions in Paraguay.
14.1%Our operations in Paraguay represented 12.1% and 11.1% of our assets as of December 31, 20152019 and 7.0%December 31, 2020, respectively, and 8.9% and 9.3% of our net sales for the year ended December 31, 2015 corresponded to our operations in Paraguay.2019 and 2020, respectively. Because demand for soft drinks and beverage products is generally related to the economic conditions prevailing in the local market which, in turn, depend on the macroeconomic and political conditions of the country, our financial situation and our results of operations could be adversely affected by changes in these factors over which we have no control.
GDPParaguay has a history of economic and political instability, exchange controls, frequent changes in Paraguay for the year 2015regulatory policies, corruption and weak judicial security. Paraguayan GDP grew by 3.0%4%, 5%, 3% and in 2016, 2017 and 2018, respectively; did not grow in 2019 and contracted 1% in 2020, according to preliminary figures from the Paraguayan Central Bank of Paraguay published in the month of December of 2015, compared to growth of 4.7% in 2014 and 14.2% in 2013, after a decrease of 1.2% in 2012 due to adverse weather conditions.Bank. Paraguayan GDP is closely tied to the performance of Paraguay’s agricultural sector, which can be volatile. If
The situation of the Paraguayan agricultural performanceeconomy is removed from calculationalso strongly influenced by the economic situation in Argentina and Brazil. A deterioration in the economic situation of GDP, Paraguay’s GDP has grown for 13 consecutive years at an average rate that lies between 3%these countries could adversely affect the Paraguayan economy and, 4%.in turn, our financial condition and operating results.
Inflation in Paraguay may adversely affect our financial condition and results of operations.
Paraguay’s consumer price index presented was 3.1%Although inflation in 2015 versus 4.2%Paraguay has remained stable at around 4% over the last five years, we cannot assure that inflation in 2014, showing inflation. Part of the basic food basket used in its calculation consists of imported products and despite the value of the dollar appreciating by over 25%, the exchange rate pass-through wasParaguay will not observed in inflation levels due to the reduced activity of the Paraguayan economy during 2015, principally in trade sector.
increase significantly. An increase in inflation in Paraguay could decrease the purchasing power of our consumers in the country, which could adversely affect our volumes and impact our sales income. We cannot assure you that inflation in Paraguay will not increase significantly.
The Paraguayan guaraní is subject to depreciation and volatility, which could adversely affect our financial condition and results of operations.
The exchange rate of Paraguay is free and floating and the Banco Central de Paraguay, or Paraguay Central Bank, (“BCP”), actively participateparticipates in the exchange market in order to reduce volatility. Since a portion of our total costs (28%) in Paraguay for raw material and supplies are denominated in U.S. dollars, a significant depreciation of the local currency could adversely affect our financial situation and results.
In 2015 theThe Paraguayan guaraní appreciated by 1% and 3% in 2016 and 2017, respectively, and depreciated by 25.2% against7%, 8% and 7% in 2018, 2019 and 2020, respectively, in each case compared to the closing exchange rate as of the end of the prior period of the U.S. dollar, while in 2014 it depreciated by 0.7%. While this depreciation is lower than that of other countries in the region, thedollar.
The local currency follows regional and global trends. Therefore, to the extent that the United States economy improves, the U.S. dollar will begin to gain value. When the U.S. dollar’s value increases, and raw materials lose value in Paraguay, this directly impacts Paraguay’s generation of foreign exchange which occurs mainly through the export of raw materials.
A deterioration in the economic growth of Paraguay as result of a significant depreciation of the local currencyParaguayan guaraní could adversely affecthave an effect on our business, financial situationcondition and financial results as approximately 25% of our total costs of raw materials and supplies are in U.S. dollars, as well as impact other expenses such as professional fees and maintenance costs.operations.
Risk Factors Relating to the ADRs and Common Stock
Preemptive rights may be unavailable to ADR holdersholders.
According to the Ley de Sociedades Anónimas No. 18.04618,046 and the Reglamento de Sociedades Anónimas (collectively, the “Chilean Companies Law”), whenever we issue new shares for cash, we are required to grant preemptive rights to holders of our shares (including shares represented by ADRs), giving them the right to purchase a sufficient number of shares to maintain their existing ownership percentage. However, we may not be able to offer shares to United States holders of ADRs pursuant to preemptive rights granted to our shareholders in connection with any future issuance of shares unless a registration statement under the U.S. Securities Act of 1933, as amended, is effective with respect to such rights and shares, or an exemption from the registration requirements of the U.S. Securities Act of 1933, as amended, is available.
Under the procedure established by the Central Bank of Chile, the foreign investment agreement of a Chilean company with an existing ADR program will become subject to an amendment (which will also be deemed to incorporate all laws and regulations applicable to international offerings in effect as of the date of the amendment) that will extend the benefits of such contract to new shares issued pursuant to a preemptive rights offering to existing ADR owners and to other persons residing and domiciled outside of Chile that exercise preemptive rights, upon request to the Central Bank of Chile. We intend to evaluate at the time of any rights offering the costs and potential liabilities associated with any such registration statement as well as the indirect benefits to us of enabling United States ADR holders to exercise preemptive rights and any other factors that we consider appropriate at the time, and then make a decision as to whether to file such registration statement.
We cannot assure you that any registration statement would be filed. To the extent ADR holders are unable to exercise such rights because a registration statement has not been filed, the depositary will attempt to sell such holders’ preemptive rights and distribute the net proceeds thereof if a secondary market for such rights exists and a premium can be recognized over the cost of any such sale. If such rights cannot be sold, they will expire, and ADR holders will not realize any value from the grant of such preemptive rights. In any such case, such holder’s equity interest in the Company would be diluted proportionately.
Shareholders’ rights are less well definedwell-defined in Chile than in other jurisdictions, including the United StatesStates.
Under the United States federal securities laws, as a foreign private issuer, we are exempt from certain rules that apply to domestic United States issuers with equity securities registered under the United States Securities Exchange Act of 1934, as amended, including the proxy solicitation rules, the rules requiring disclosure of share ownership by directors, officers and certain shareholders. We are also exempt from certain of the corporate governance requirements of the Sarbanes-Oxley Act of 2002 and the New York Stock Exchange, Inc., including the requirements concerning independent directors.
Our corporate affairs are governed by the laws of Chile and our estatutos or bylaws, which function not only as our bylaws but also as our articles of incorporation.bylaws. Under such laws, our shareholders may have fewer or less well-defined rights than they might have as shareholders of a corporation incorporated in a U.S. jurisdiction.
Pursuant to Law No. 19,705, enacted in December 2000, the controlling shareholders of an open stock corporation can only sell their controlling shares viathrough a tender offer issued to all shareholders in which the bidder would have to buy all of the offered shares up to the percentage determined by it, where the price paid is substantially higher than the market price (that is,(i.e., when the price paid was higher than the average market price for a period starting 90 days before the proposed transaction and ending 30 days before such proposed transaction, plus 10%).
The market for our shares may be volatile and illiquid.
The Chilean securities markets are substantially smaller, less liquid and more volatile than major securities markets in the United States. The Bolsa de Comercio de Santiago (the “Santiago Stock Exchange”), which is Chile’s principal securities exchange, had a market capitalization of approximately US$191,510174,570 million atas of December 31, 20152020 and an average monthly trading volume of approximately US$1,8613,307 million for 2015.the year. The lack of liquidity is owed, in part, to the relatively small size of the Chilean securities markets and may have a material adverse effect on the trading prices of our shares. Because the market for our ADRs depends, in part, on investors’ perception of the value of our underlying shares, this lack of liquidity for our shares in Chile may have a significant effect on the trading prices of our ADRs.
| ITEM 4. | INFORMATION ON THE COMPANY |
| A. | HISTORY AND DEVELOPMENT OF THE COMPANY |
Overview
ITEM 4.INFORMATION ON THE COMPANY
A.HISTORY AND DEVELOPMENT OF THE COMPANY
Overview
Our legal name is Embotelladora Andina S.A., and our commercial name is Coca-Cola Andina. We were incorporated and organized under Chilean law as a sociedad anónima on February 7, 1946 under Chilean regulations, most importantly Chilean Companies’ Law N° 18,046 .1946. An abstract of our bylaws is registered within the Registro de Comercio del Conservador de Bienes Raíces de Santiago (Public Registry of Commerce of the Real Estate Commission Administrator of the City of Santiago) under No. 581 of the year 1946. Pursuant to our bylaws, our term of duration is indefinite.
Our shares of common stockshares are listed and traded on the Santiago Stock Exchange and on the Bolsa Electrónica de Chile (the Chilean Electronic Stock Exchange) and, until October 2018, were listed on the Bolsa de Corredores de Valparaiso (the Valparaiso StockbrokersBrokers Stock Exchange). , which closed operations in October 2018. Our Series A and Series B ADRs representing our Series A and Series B shares, respectively, are listed on the New York Stock Exchange.
Our principal executive offices are located at Avenida Miraflores 9153, PisoFloor 7, Renca, Santiago, Chile. Our telephone number is +56-2-2338-0520+562-2338-0520 and our website is www.koandina.com.www.koandina.com.
Our depositary agent for the ADRs in the United States is The Bank of New York Mellon Corporation, located at One Wall240 Greenwich Street, New York, New York 10286. Our depositary agent’s telephone number is (212) 815-2296. Our authorized representative in the United States is Puglisi & Associates, located at 850 Library Avenue, Suite 204, Newark, Delaware 19711,19711-7144, United States, and its phone number is (302) 738-6680.
History
Chile
In 1941, The Coca-Cola Company licensed a private Chilean company to produce Coca-Cola soft drinks in Chile and production began in 1943. In 1946, the original licensee withdrew from the license arrangement and a group of U.S. and Chilean investors formed Andina, which became The Coca-Cola Company’s sole licensee in Chile.
Between 1946 and the early 1980s, Andina developed the Chilean market for Coca-Cola soft drinks with a system of production and distribution facilities covering the central and southern regions of Chile. In the early 1980s, Andina sold its Coca-Cola licenses for most areas outside the Santiago metropolitan region and concentrated on the development of its soft drink business in the Santiago metropolitan area. Although we are no longer the sole Coca-Cola bottler in Chile, we have been the principal manufacturer of Coca-Cola products in Chile for an uninterrupted period of 66 years.since 1946.
In 1998, we purchased a 49% stake in Vital S.A. from The Coca-Cola Company. Concurrently, The Coca-Cola Company purchased Vital’sVital S.A. mineral water springs located in Chanqueahue, 80 miles south of Santiago. As part of the transaction, the Vital bottler agreement was replaced with a Minute Maid International Inc., juice bottler agreement and a new mineral water bottling agreement with The Coca-Cola Company.
The production and packaging business of water, juices and non-carbonated beverages licensed by The Coca-Cola Company in Chile was restructured in 2005. Vital Aguas S.A:S.A. (“VASA”) was created in 2005 in order to develop the processing, production and packaging of mineral water and other waters by Agua Mineral de Chanqueahue Vital. Vital S.A. is focused on developing juices and non-carbonated beverages. Andina and Embonor S.A. are also involved incontinued the development of juices and non-carbonated beverages through their ownership stakes in Vital S.A., holding 66.5% and 33.5%, respectively. In January 2011, the juice production business was restructured to allow the incorporation of theincorporate other Coca-Cola bottlers in Chile to the ownershipas shareholders of Vital S.A., which changed its name initially to Vital Jugos S.A. and then to VJ S.A. in 2019. Andina and Embonor hold 65% and 35% stakes in Embonor S.A,VJ S.A., respectively.
In 2001, we entered into a joint venture with Cristalerías de Chile to produce PET bottles. On January 27, 2012, Coca-Cola Embonor through its subsidiary, Embonor Empaques S.A., acquired Cristalerías de Chile’s stake equivalent to a 50% ownership interest in Envases CMF.
On October 16,In 2012, in order to reinforce our leadership position among Coca-Cola bottlers in South America, the Company completed its merger with Embotelladoras Coca-Cola Polar S.A. (“Polar”). Polar iswas a Coca-Cola bottler with operations in Chile, where it servicesserviced territories in the II, III, IV, XI and XII regions, as well as parts of Argentina, as described below, and all of Paraguay. The merger grantsgranted former shareholders of Polar a 19.68% ownership interest in the merged entity, however the Company controls its day to day
operations. As a result of the transaction, we also acquired additional indirect ownership interests in Vital Jugos, S.A., Vital Aguas S.A. and Envases Central S.A.Central.
OnIn January 28, 2016, the Company incorporated a closed joint-stock company called Coca-Cola Del Valle New Ventures S.A. (“Coca-Cola Del Valle”). Embotelladora Andina S.A. contributed 35% of the capital of Coca-Cola Del Valle, with Embonor S.A. and Coca-Cola de Chile S.AS.A. contributing the remaining 15% and 50%, respectively. The main corporate purpose of Coca-Cola Del Valle is the development and production of juices, waters and non-carbonated beverages under brands owned by The Coca-Cola Company that Andina and Coca-Cola Embonor S.A. are authorized to commercialize and distribute in their respective franchise territories.
In August 2016, the Company signed an agreement with Monster Energy Company for the distribution of Monster Energy products in the Chilean territory covered by Andina, which we began distributing in September 2016.
In March 2017, The Coca-Cola Company, together with its bottlers in Latin America, announced the closing of the acquisition from Unilever of the AdeS vegetable protein-based beverage business. Andina began distributing AdeS products in Chile in July 2017.
In January 2018, the Company, Embonor S.A., Coca-Cola del Valle New Ventures S.A., and Coca-Cola de Chile S.A., as buyers, and Inversiones Siemel S.A. as seller, entered into a stock purchase agreement under which the parties agreed to transfer 100% ownership of the shares of Comercializadora Novaverde S.A. (“Novaverde”), a Chilean company dedicated to the production and distribution of juices, ice cream, and other food, mainly under the brand “Guallarauco”. The transaction did not include the acquisition of the avocado sales business line and the General Mills brand representation. In October 2018, the purchase of 100% of the shares of Novaverde was completed.
In May 2018, Diageo Chile Ltda., Embonor S.A. and Embotelladora Andina S.A. signed an agreement for the distribution in Chile of the brands belonging to Diageo, including Johnnie Walker, Baileys, Smirnoff, Guinness, Pampero, among others.
In October 2019, Cooperativa Agrícola Pisquera Elqui Ltda. (“Capel”), Embonor S.A. and Andina, signed an agreement for the distribution in Chile of products bearing the brands belonging to Capel, including Capel (brand), Alto del Carmen, Monte Fraile, Brujas de Salamanca, Artesanos del Cochiguaz, among others.
In August 2020, Cervecería Chile S.A. and Andina signed an agreement for the distribution in Chile of the brands belonging to AB InBev, including Corona, Becker, Báltica, Budweiser, Stella Artois, Cusqueña, among others.
Brazil
Andina Brazil, our Brazilian subsidiary, began production and distribution of Coca-Cola soft drinks in Rio de Janeiro in 1942. In June 1994,In1994, we acquired 100% of the capital stock of Andina Brazil for approximately US$120 million and contributed an additional US$31 million to Andina Brazil’s capital immediately after the acquisition to repay certain indebtedness of Andina Brazil. In 2000, we purchased a Coca-Cola franchise licensee NVG through Andina Brazil for a territory in Brazil comprising the State of Espírito Santo and part of the States of Rio de Janeiro and Minas Gerais, for US$74.5 million.
NVG was merged into Andina Brazil in 2000, and its operations were integrated with Andina Brazil in 2001.Gerais.
In 2004, Andina Brazil entered into a franchise swap agreement with the Brazilian subsidiary of The Coca-Cola Company, Recofarma Indústria do Amazonas Ltda., for an exchange of franchising rights, goods and other assets of Andina Brazil in the territory of Governador Valadares in the State of Minas Gerais, and other franchise rights of The Coca-Cola Company in the territories of Nova Iguaçu in the state of Rio de Janeiro, which were previously owned by Companhia Mineira de Refrescos S.A.
In 2007, The Coca-Cola Company along with the Coca-Cola bottlers in Brazil created a joint venture, Mais Indústria de Alimentos, in order to enhance the non-carbonated business for the entire Systemsystem in that country, and in 2008 The Coca-Cola Systemsystem acquired a second company that produces non-carbonated beverages called Sucos del Valle do Brasil Ltda. These two companies merged in 2011 and SABB (Sistema de Alimentos y Bebidas do Brasil) was created.
In 2010, The Coca-Cola Company along with its bottlers, acquired in a joint venture the company Leão Junior S.A. (currently Leão Alimentos e Bebidas Ltda.). with a consolidated presence and market share in Andina Brazil’s region in the category of iced tea. Leão Junior S.A.Alimentos e Bebidas Ltda. commercializes the Matte Leão brand, among others. Andina Brazil controls 18.20% of Leão Junior S.A. Andina Brazil holds a 10.74% average10.26% ownership interest in Leão Junior S.A and SABB.Alimentos e Bebidas Ltda.
In November, 2012, Andina Brazil acquired a 40% stake in Sorocaba Refrescos S.A., a Coca-Cola bottler located in the state of Sao Paulo, for R$146,946,004.São Paulo.
On October 11th,In 2013, Rio de Janeiro Refrescos Ltda. (“RJR”), a subsidiary of Embotelladora Andina S.A. (“Coca-Cola Andina”) in Brazil, closed the acquisition ofacquired 100% of the capital stock of Companhia de Bebidas Ipiranga (“Ipiranga”) in an all-cash transaction. Ipiranga is also a Coca-Cola bottler with operations in part of the States of São Paulo and part of the State of Minas Gerais. This acquisition was previously arranged between the parties through an agreement signed on July 10th,10, 2013. The final price paid was R$1,155,445,998. Ipiranga is a leading bottler of The Coca-Cola System in Brazil that operates in certain territories of the states of São Paulo and Minas Gerais. During 2012, its sales volume amounted to 89.3 million unit cases, with revenues amounting to R$695 million, and an EBITDA of R$112 million.
During 2013, there was a restructuring of the juice and mate herb (“yerba mate”) business, pursuant to which the companies in which Rio de Janeiro Refrescos Ltda.Andina Brazil held an interest were merged. As a result of the restructuring, Rio de Janeiro Refrescos Ltda.Andina Brazil ended up with a 9.57% ownership interest in LeonLeão Alimentos y Bebidas Ltda., the legal successor of these companies. This percentage increased to 10.87% as a result of our acquisition of, and subsequent merger with, Compañía de Bebidas Ipiranga that held an ownership interest in LeonLeão Alimentos y Bebidas Ltda. During 2014, Rio de Janeiro Refrescos Ltda.Andina Brazil sold 2.05% of its ownership interest in Leão Alimentos e Bebidas Ltda., remaining with a finalresulting in its current ownership interest of 8.82%10.26%.
During 2016, Andina Brazil, along with Coca-Cola Brazil and the other bottlers in Brazil, acquired Laticinios Verde Campo Ltda. The purchase was made through Trop Frutas do Brasil Ltda. a subsidiary of Leão Alimentos e Bebidas Ltda. Andina Brazil acquired 7.5% of Laticinios Verde Campo Ltda..
In 2016, Andina Brazil signed an agreement with Monster Energy Company for the distribution of Monster Energy products in Andina Brazil’s territory. These products began being distributed in November, 2016.
In 2016, Andina Brazil closed its production facility in Cariacica, state of Espírito Santo, leaving only two production facilities, in the States of Rio de Janeiro and São Paulo.
In 2017, Andina Brazil bought, together with Coca-Cola Brazil and the other Coca-Cola bottlers in Brazil, the company UBI 3 Participações Ltda. The operation was carried out to make the distribution and marketing of AdeS products in Brazil viable. Andina Brazil bought 8.50% of UBI 3 Participações Ltda.. Andina Brazil began distributing AdeS products in June 2017.
In August 2017, Andina Brazil increased its ownership interest in Leão Alimentos e Bebidas Ltda. from 8.8% to 10.3%.
In March 2018, Andina Brazil started the production of soft drinks at the new Duque de Caxias plant in the state of Rio de Janeiro, and in January 2019, the production of mineral waters started in the same plant.
Argentina
Production of Coca-Cola soft drinks in Argentina began in 1943 with operations in the province of Córdoba, Argentina, through Inti S.A.I.C., (“INTI”). In July 1995, we, through an investment company incorporated in Argentina called Inversiones del Atlántico S.A., (“IASA”), acquired a 59% interest in Embotelladoras del Atlántico S.A. (“Edasa”EDASA”, the parent company of Rosario Refrescos S.A. and Mendoza Refrescos S.A.). These entities were subsequently merged to create Rosario Mendoza Refrescos S.A., (“Romesa”ROMESA”). In 1996, we acquired an additional 35.9% interest in Edasa,EDASA, an additional 78.7% interest in Inti,INTI, a 100% interest in CipetCIPET (a PET plastic bottle and packaging business located in Buenos Aires) and a 15.2% interest in Cican S.A. During 1997, the operations of RomesaROMESA were merged with INTI. In 1999, EdasaEDASA was merged into IASA. In 2000, IASA was merged into INTI, forming Embotelladora del Atlántico S.A. (“EDASA”). In 2002, CipetCIPET merged into EDASA. During 2007, EDASA’s ownership interest in Cican S.A. was sold to FEMSA.
DuringIn 2011, EDASAEDASA's shareholders resolved the division of part of its equity to form a new company, Andina Empaques Argentina S.A., transferringthrough a spin-off of all activities and assets necessary for the development of EDASA’s Packaging Division.
AccountingDivision, including all tangible and tax effects began on January 1, 2012.intangible assets related thereto. Subsequently, EDASA absorbed Coca-Cola Polar Argentina S.A. by merger. The corresponding Definitive Merger Agreement was registered in the Public Register of Trade of the Province of Córdoba under the Contracts and Dissolves Protocol Registration N ° 007-A25 on September 24, 2014. The merger’s tax and accounting effects began on November 1, 2012. Currently EDASA is the Coca-Cola bottler in the provinces of Córdoba, Mendoza, San Juan, San Luis, Entre Ríos, part of the province of Buenos Aires and in almost all of Santa Fe, as well as in La Pampa, Neuquén, Río Negro, Chubut, Santa Cruz, Tierra del Fuego, Antarctica and South Atlantic Islands.
Additionally, as a result of the Company’s merger with Polar which was completed in October 16, 2012, and is more fully described above, the Company gained territory serviced by Polar in Argentina, consisting of territories in Santa Cruz, Neuquén, El Chubut, Tierra del Fuego, Río Negro, La Pampa and the western zonepart of the province of Buenos Aires.
Finally, afterIn March 2017, EDASA acquired 13.0% of the issuanceshares of favorable opinions, on December 2, 2015 the National Commission forcompany Alimentos de Soja S.A.U., dedicated to the defenseproduction of Competitionvegetable protein-based beverages marketed under the brand “AdeS”. The sale of Alimentos de Soja S.A.U. shares was carried out within the framework of a global transaction under the terms of which The Coca-Cola Company and certain Coca-Cola bottlers acquired the “AdeS” liquid soy-based food business from the Unilever Group in Brazil, Mexico, Argentina, Colombia, Paraguay, Uruguay, Bolivia and Chile. EDASA began distributing AdeS products in July 2017. In 2018, EDASA acquired shares of Alimentos de Soja S.A.U. (currently Alimentos de Soja S.A.), increasing its ownership interest to 14.3%. The amount of shares transferred was sufficient to provide EDASA a percentage of shares approximately proportional to its market share in the Republicterritory.
In December 2017, EDASA, together with Monster Energy Company, entered into an agreement in which Monster Energy Company named Embotelladora del Atlántico S.A. as distributor in the franchise territory of Andina Argentina a non-concentrated organism under the administration of the Undersecretaryproducts bearing the "Monster" brand for an initial period of Trade of10 years. In February 2018, we began commercializing and distributing Monster products entering the Secretary of Trade of Ministry of Economy and Public Finances, notified EDASA of Resolution No. 640 dictated on November 24, 2015 by the Secretary of Trade of the Ministry of Economy and Public Finances under which it moved to authorize and approve the economic concentration caused by the (i) merger by incorporation between the Chilean company Embotelladora Andina S.A., as surviving entity, and Embotelladoras Coca-Cola Polar S.A, and (ii) the merger by incorporation between EDASA as surviving entity, and Coca-Cola Polar Argentina S.A, respectively, under article 13, inc. a) of Law 25.156.category for energy drinks.
Paraguay
PARESA is the first authorized Coca-Cola Bottler Company in Paraguay, which started its operations in May 13, 1965. In 1967, Plant 1 was opened with a capacity of 400,000 annual unit cases. In 1980, the Barcequillo Plant - located on Km 3.5 Barcequillo of the Ñemby route, in the City of San Lorenzo- was opened, reaffirming and applying the concept of the highest end technology of bottling. Beginning in 2004, PARESA became property of the Grupo Polar from Chile, continuing its operations in the Paraguayan market. On October 1,In 2012, PARESA became part of Grupo Coca-Cola Andina due to the merger of Embotelladoras Coca-Cola Polar S.A. into Embotelladora Andina S.A.
Capital ExpendituresIn March 2017, The Coca-Cola Company, together with its bottlers in Latin America, announced the closing of the acquisition from Unilever of the AdeS vegetable protein-based beverage business.
During 2015, we used external financing to refinance certain current financial liabilities, to cover temporary cash shortagesPARESA began distributing AdeS and other corporate purposes.Monster products in July 2017 and May 2019, respectively.
Capital Expenditures
The following table sets forth our capital expenditures by territory and line of businesscountry for the periods indicated:2018-2020 period:
| Year ended December 31, | |||||||||||||||||||
|
| Year ended December 31, |
| 2018 | 2019 | 2020 | |||||||||||||
|
| 2013 |
| 2014 |
| 2015 |
| ||||||||||||
|
| MCh$ |
| MCh$ |
| MCh$ |
| (in millions of Ch$) | |||||||||||
Chile |
| 57,545 |
| 45,110 |
| 50,043 |
| 37,601 | 56,141 | 26,488 | |||||||||
Brazil |
| 56,720 |
| 30,280 |
| 24,831 |
| 47,444 | 22,737 | 19,138 | |||||||||
Argentina |
| 52,272 |
| 25,724 |
| 30,056 |
| 29,571 | 22,011 | 16,508 | |||||||||
Paraguay |
| 17,160 |
| 13.103 |
| 7,470 |
| 14,292 | 15,283 | 20,519 | |||||||||
Total |
| 183,697 |
| 114,217 |
| 112,400 |
| 128,908 | 116,171 | 82,653 | |||||||||
During 2015, we made investments totaling Ch$2,403 million (unaudited figures) for improvements in industrial processes, equipment to measure industrial waste flows, laboratory analyses, consulting on environmental impacts and other studies. For further details please refer to Note 29 of our consolidated financial statements filed herewith.
Our total capital expenditures were Ch$183,697128,908 million in 2013,2018, Ch$114,217 million116,171 in 20142019 and Ch$112,400 million82,653 in 2015.
We have budgeted approximately US$200-230 million for our capital expenditures2020. The decrease in 2016. Our capital expenditures in 2016 are primarily intended for:
· investments in production capacity (primarily for a plant in Brazil among other investments);
· market investments (primarily for2020 was maily due to the placementuncertainty regarding the potential impacts of coolers);
· returnable bottles and cases; and
· investments in vehicles (primarily in Brazil);
We believe that internally generated funds will be sufficient to meet our budgeted capital expenditure for 2016. Our capital expenditure plan for 2016 may change based on market and other conditions, our results and financial resources.the COVID-19 pandemic.
In 2015,2020, capital expenditures were principally related to the following:
Argentina
| · | Returnable containers (glass and PET bottles) and cases for bottles, |
· Bottles (glass and PET) and bottle cases;
| · | Coolers - Cold Equipment, |
· Coolers and post mix equipment;
| · | RefPET Returnable Labeling (Monte Cristo plant and Bahía Blanca plant), |
· New Box Line for packaging (Andina Empaques Plant-fine tuning)
| · | Returnable Glass Labeling (Monte Cristo plant), |
· Process adaptation and new towers at Raw Sugar Plant;
| · | Sugar reduction in carbonated products, |
· Adaptation Cold and Hot Fill Production Lines (all plants);
| · | Adaptation of Effluents’ process (Monte Cristo plant), |
· Molds and tooling of new SKUs (CDS and NCBS); and
| · | "Front Office Project" (stage 2 of implementation, to be completed during 2021), |
· Expansion of finished product deposit and patio (Bahía Blanca plant)
| · | Purchase of forklifts and transpallets, and |
| · | Hardware technology upgrade and software development for productivity and management improvement. |
Brazil
| · | Production lines and equipment for the Andina’s plants, |
· First stage construction of the Duque de Caxias plant;
| · | Implementation of returnable labelling project, |
· Construction of the Caju Distribution Center;
| · | Returnable containers (Ref PET and glass bottles) and plastic bottle cases, |
· REF PET and glass returnable bottles and bottle cases;
| · | Cold equipment, post-mix and other equipment for the point of sale, |
· Coolers and post-mix equipment for the point of sale;
| · | Improvements in the management systems, |
· Machinery to increase efficiency and production capacity; and
| · | Machinery to increase efficiency and productive capacity, and |
· Acquisition of distribution trucks and motorcycles for the sales force.
| · | Renewal of part of the trucks and forklifts for industrial and logistics areas. |
Chile
| · | Logistics Densification (refurbishment of racks and centers to receive new beer category), |
· Returnable bottles (glass and PET) and bottle cases;
| · | Implementation of production lines at Antofagasta plant (transfer from Coquimbo), |
· Cold equipment, post-mix and other equipment for points of sale;
| · | New Renca and Inamar wells, |
· Purchase of distribution trucks;
| · | Engineering for decreasing water ratio, and |
· Infrastructure investments at Renca plant, in logistics and sourcing;
· Machinery to improve efficiency and production capacity; and
· Land purchases.
Vital Jugos
· Acquisition of an Electronic Inspector for RGB Line 1;
· Implementation of inventory and dispatch control with RFID system;
· Acquisition of automatic caser for bottles RGB Line 1;
· Construction of fruit pulp warehouse in racks; and
· Acquisition and installation of a water treatment plant.
Vital Aguas:
· Acquisition and installation of a bottle cap manufacturing machine for aluminum caps for glass bottles;
· Refurbishing of PET OW Lines 3 and 4 and Container Line 2; and
· Installation of CCTV IP system.
| · | Engineering of wastewater treatment plant. |
Paraguay
| · | New line for stills products, |
· Sugar treatment system by ion exchange;
| · | Fructose production facilities, |
· Completion of implementation of electronic inspection by Asebi in all returnable glass lines;
| · | Extension of deposits, |
· Implementation of fire network in industrial plant and distribution centers of Coronel Oviedo and Encarnación;
| · | “Front Office” project, |
· Returnable bottles and plastic cases; and
| · | Returnable bottles and plastic cases, and |
· Cooling equipment.
B.BUSINESS OVERVIEW
| · | Coolers - Cold equipment. |
We have budgeted US$160-180 million for our capital expenditures in 2021 which is expected to be mainly destined to:
| · | Improve our information technologies with a main focus on big data and artificial intelligence, |
| · | Improve our productive capacity (for product reformulation, in addition to continuing the returnables labeling project in Argentina, and a production line in Paraguay), |
| · | Improve infrastructure for greater flexibility (mainly in Paraguay), |
| · | Returnable bottles and containers (optimizing the use of multipurpose bottles), |
| · | Cold equipment (with energy efficiency savings and better customer service), |
| · | Renew trucks (Brazil and Chile) to comply with regulations, and |
| · | Improve water use efficiency (Chile). |
For 2021, we estimate that internally generated funds will finance a large part of our budgeted capital expenditure. Our capital expenditure plan for 2021 may change based on market conditions and how the economy evolves in the countries where we operate. We believe wethe uncertainty regarding the COVID-19 pandemic has diminished, but our capital expenditures plans are dynamic and subject to change if the conditions requires it.
| B. | BUSINESS OVERVIEW |
We are the third largest bottler of Coca-Cola trademark beverages in Latin America in terms of sales volume. We believe we are the largest bottler of Coca-Cola trademark beverages in Chile the second largest inand Argentina and the third largest in Brazil, in each case in terms of sales volume. We are also the only bottler of Coca-Cola trademark beverages in Paraguay.
In 2015,2020, we had consolidated net sales of Ch$1,877,3941,698,281 million and total sales volume of 819.9734.6 million unit cases of Coca-Cola soft drinks.beverages.
In addition to our soft drinks business, which accounted for 76%65% of our consolidated net sales during 2015,2020, we also:
| · | produce, sell and distribute fruit juices, other fruit-flavored beverages, sport drinks, flavored waters, mineral and purified water in Chile, Argentina, Brazil and Paraguay under trademarks owned by The Coca-Cola Company; |
· produce and distribute fruit juices, other fruit-flavored beverages and mineral and purified water in Chile, Argentina and Paraguay under trademarks owned by The Coca-Cola Company;
| · | manufacture polyethylene terephthalate (“PET”) bottles and preforms, returnable PET bottles, cases and plastic caps, primarily for our own use in the packaging of our beverages in Chile and Argentina; |
· produce flavored waters and other carbonated beverages under trademarks owned by The Coca-Cola Company;
| · | produce, sell and distribute ice tea, mate beverages, and sell and distribute lactose free dairy products in Brazil; |
· manufacture polyethylene terephthalate (“PET”) bottles primarily for our own use in the packaging of Coca-Cola soft drinks in Chile and Argentina, where we also produce returnable PET bottles, cases and plastic caps;
| · | produce, sell and distribute seed-based beverages in Argentina under trademarks owned by The Coca-Cola Company, and sell and distribute these products in Brazil, Chile and Paraguay; |
· produce Tea and Juices in Brazil for Leão Alimentos e Industria Ltda.;
| · | sell and distribute energy drinks in Argentina, Brazil, Chile and Paraguay under trademarks owned by Monster Energy Company; |
· distribute non-carbonated beverages such as tea, fruit juices, energy drinks, sport drinks and waters in Brazil under trademarks owned by The Coca-Cola Company;
| · | sell and distribute beer in Brazil under the brands Amstel, Bavaria, Heineken, Kaiser and Sol; |
· distribute beer in Brazil under the brands Amstel, Bavaria, Birra Moretti, Dos Equis (XX), Edelweiss, Heineken, Kaiser, Murphy’s, Sol and Xingú;
| · | distribute beer, wine and cider in southern Argentina; |
· distribute beer in the south of Argentina; and
| · | sell and distribute beer, spirits and wine in Chile; and |
· distribute spirits in the south of Chile.
| · | distribute ice cream and other frozen products under the Guallarauco brand in Chile. |
Our Territories
The following map shows our territories, estimates of the population to which we offer products, the number of retailers of our beverages and the per capita consumption of our beverages as of December 31, 2014.2020.

Per capita consumption data for a territory is determined by dividing total beverage sales volume, excluding the sales to other Coca-Cola bottlers within the territory by the estimated population within such territory, and is expressed on the basis of the number of eight-ounce servings of our products consumed annually per capita.products. One of the factors we use to evaluate the development of local volume sales in our territories and to determine product potential is the per capitalcapita consumption of our beverages.
Our Product Overview
We produce, market and distribute the following Coca-Cola trademark beverages and brands licensed from third parties throughout our franchise territories. In addition, we distribute Heineken brand beer in Brazil, beer, wine and cider in southern Argentina, and beer, spirits and wine in Chile. The following table sets forth ourthe brands of the products that we distribute by country as of December 31, 2015:2020:
Chile | Brazil | Argentina | Paraguay | |||||
| ||||||||
Coca-Cola | ü |
| ü |
| ü |
| ü | |
Coca-Cola | ü |
| ü |
| ü |
| ü | |
Coca-Cola | ü |
|
| ü |
|
| ||
Coca-Cola | ü |
| ü |
| ||||
| Coca-Cola Energy | ü | |||||||
| ||||||||
|
|
| ||||||
| ü |
|
|
|
| |||
|
| ü | ü | |||||
| ü |
| ü | ü | ü | |||
Fanta Zero/Sin azúcar | ü | ü | ü | ü | ||||
| Inca Kola | ü | |||||||
| Inca Kola Zero | ü |
| ||||||
Kuat Zero | ü |
| ||||||
| ü |
| ||||||
Nordic Mist Agua Tónica | ü |
| ||||||
Nordic Mist Zero | ü |
| ||||||
Quatro Light/Liviana/Zero/Sin azúcar | ü |
|
|
|
|
|
| ||||
| ü |
| ||||||
Schweppes | ü |
| ü |
| ü | |||
Schweppes |
| ü | ||||||
|
| ü | ü | ü | ||||
| Schweppes Tónica Light | ü | |||||||
| ü | ü | ü | ü | ||||
| ü | ü | ü |
| ü | |||
| ü |
|
| ü | ||||
|
| |||||||
|
|
| ||||||
| ü | |||||||
| Andina Del Valle Light | ü | |||||||
| ü | |||||||
|
|
| ü |
|
| |||
|
| ü | ||||||
| ü |
| ||||||
|
| ü | ||||||
| ü | |||||||
| ü |
| ||||||
| ü |
| ||||||
| ||||||||
| ü |
| ü | ü | ||||
|
|
| ü |
| ||||
| ü |
| ||||||
| ü |
|
|
| ||||
|
| ü | ||||||
|
|
| ü | |||||
| ü |
|
| Chile | Brazil | Argentina | Paraguay | |||||
Dasani | ü | |||||||
| Glaceau Smart Water | ü | ü | ü | |||||
| Glaceau Vitamin Water | ü | |||||||
| Guallarauco Agua de Fruta | ü | |||||||
| Kin Con Gas | ü | |||||||
| Kin Sin Gas | ü | |||||||
| Vital | ü | |||||||
| Other Non-alcoholic Beverages | ||||||||
| AdeS | ü | ü | ü | ü | ||||
| Blak | ü | |||||||
| Burn | ü | |||||||
| Fuze Ice Tea | ü | |||||||
| Fuze Ice Tea Zero | ü | |||||||
| I9 | ü | |||||||
| Leão Ice Tea Light/Zero/sin azúcar | ü |
| ||||||
Matte Leão | ü |
| ||||||
|
| ü |
|
|
| |||
|
| ü | ||||||
| ü | ü |
| ü | ü | |||
| Monster Zero/Light/Sin azúcar | ü | ü | ü | |||||
| Powerade | ü | ü | ü | ü | ||||
| Powerade Zero/Light/Sin azúcar | ü | ü | ||||||
| Reign | ü | |||||||
| Shake Whey | ü | |||||||
| Tropical | ü | |||||||
| Beer | ||||||||
| Amstel | ü | ü | ||||||
| Báltica | ü | |||||||
| Bavaria | ü | |||||||
| Becker | ü | |||||||
| Becks | ü | |||||||
| Blue Moon | ü | |||||||
| Brahma | ü | |||||||
| Bud light | ü | |||||||
| Budweiser | ü | |||||||
| Busch | ü | |||||||
| Corona | ü | |||||||
| Corona Light | ü | |||||||
| Coronita | ü | |||||||
| Cusqueña | ü | |||||||
| Grolsch | ü | |||||||
| Heineken | ü | ü | ||||||
| Imperial | ü | |||||||
| Isenbeck | ü | |||||||
| Kaiser | ü | |||||||
| Kilómetro 24.7 | ü | |||||||
| Kunstmann | ü | |||||||
| Malta del Sur | ü | |||||||
| Michelob Ultra | ü | |||||||
| Miller | ü | |||||||
| Modelo | ü | |||||||
| Negra Modelo | ü |
| Chile | Brazil | Argentina | Paraguay | ||||
| Palermo | ü | ||||||
| Pilsen del Sur | ü | ||||||
| Quilmes | ü | ||||||
| Schneider | ü | ||||||
| Sol | ü | ü | |||||
| Stella Artois | ü | ||||||
| Stella Artois Gluten Free | ü | ||||||
| Warsteiner | ü | ||||||
| Spirits and Wine | |||||||
| Alto del Carmen Ice | ü | ||||||
| Artesanos del Cochiguaz Sour | ü | ||||||
| Baileys | ü | ||||||
| Bourbon Bulleit | ü | ||||||
| Capel Ice | ü | ||||||
| Capel Mix | ü | ||||||
| Capel Pisco Sour | ü | ||||||
| Capel Pisco Sour Light | ü | ||||||
| Cremisse | ü | ||||||
| Espumante Francisco de Aguirre | ü | ||||||
| Espumante Myla | ü | ||||||
| Espumante Nola Zero | ü | ||||||
| Espumante Sensus | ü | ||||||
| Fernet Branca | ü | ||||||
| Gin Tanqueray | ü | ||||||
| Maddero Ice | ü | ||||||
| Pisco Alto del Carmen | ü | ||||||
| Pisco Artesanos del Cochiguaz | ü | ||||||
| Pisco Brujas de Salamanca | ü | ||||||
| Pisco Capel | ü | ||||||
| Pisco Hacienda La Torre | ü | ||||||
| Pisco Monte Fraile | ü | ||||||
| Ron Cacique | ü | ||||||
| Ron Maddero | ü | ||||||
| Ron Pampero | ü | ||||||
| Ron Zacapa | ü | ||||||
| Sheridan's | ü | ||||||
| Sidra 1888 | ü | ||||||
| Sidra Pehuenia | ü | ||||||
| Sidra Real | ü | ||||||
| Sour Inca de Oro | ü | ||||||
| Tequila Don Julio | ü | ||||||
| Vino Carbonatado Pkador | ü | ||||||
| Vino Colón | ü | ||||||
| Vino Eugenio Bustos | ü | ||||||
| Vino Graffigna | ü | ||||||
| Vino Grosso | ü | ||||||
| Vino La Celia | ü | ||||||
| Vino Prólogo Late Harvest | ü | ||||||
| Vodka Ciroc | ü | ||||||
| Vodka Smirnoff | ü | ||||||
| Whisky Bell's | ü | ||||||
| Whisky Buchanan's | ü | ||||||
| Whisky J&B | ü |
| Chile | Brazil | Argentina | Paraguay | ||||
| Whisky Johnnie Walker | ü | ||||||
| Whisky Old Parr | ü | ||||||
| Whisky Sandy Mac | ü | ||||||
| Whisky Singleton | ü | ||||||
| Whisky Vat-69 | ü | ||||||
| Whisky White Horse | ü | ||||||
| Ice Creams and Frozen Products | |||||||
| Guallarauco | ü |
In addition, in Chile, we import and distribute some other Coca-Cola branded beverages, such as Coca-Cola Caffeine Free, Coca-Cola Zero Cherry, Coca-Cola Zero Vainilla, Aloe Gloe (organic aloe vera), Coca-Cola Plus Espresso, Zico coconut water, among others.
We produce, market and distribute Coca-Cola soft drinksproducts in our franchise territories through standard bottler agreements between our bottler subsidiaries and the local subsidiary in each jurisdiction of The Coca-Cola Company (collectively, the “Bottler Agreements”).Company. We consider the enhancement of our relationship with The Coca-Cola Company to be an integral part of our business strategy.
We seek to enhance our business throughout the franchise territories by developing existing markets, penetrating other soft drink, waters and juices markets, and also alcoholic beverages markets, forming strategic alliances with retailers to increase consumer demand for our products, increasing productivity, and by further internationalizing our operations.
Reporting Segments
The following discussion analyzes our product sales and customers by reporting segments.
Chile
In Chile, we produce, market and distribute our beverages under The Coca-Cola Company trademarks in the metropolitan region of Santiago and the neighboring provinces of Cachapoal and San Antonio, as well as the regions of Antofagasta, Atacama, Coquimbo, AiséAysén and Magallanes.
During 2020, Chile accounted for 28.5%32.2% and 27.3%38.0% of our volume and consolidated net sales, respectively, during 2015.respectively.
Soft Drinks. Drinks: Our Chilean soft drink operations accounted for net sales in 20152020 of Ch$375,993407,191 million. We measure sales volume in terms of unit cases which we refer to as UCs. Unit cases contain 192 ounces of finished beverage product (24 eight-ounce servings) or 5.69 liters.
(UCs). The following table highlights historical sales and volume of Coca-Cola soft drinks sold in Chile for the periods indicated:
| Year ended December 31, | |||||||||||||||||||||||||||||||||||||
|
| Year ended December 31, |
| 2018 | 2019 | 2020 | |||||||||||||||||||||||||||||||
|
| 2013 |
| 2014 |
| 2015 |
| ||||||||||||||||||||||||||||||
|
| Ch$ |
| UCs |
| Ch$ |
| UCs |
| Ch$ |
| UCs |
| (in millions) | |||||||||||||||||||||||
|
| (in millions) |
| Ch$ | UCs | Ch$ | UCs | Ch$ | UCs | ||||||||||||||||||||||||||||
Colas |
| 243,176 |
| 118.7 |
| 262,901 |
| 122.8 |
| 262,173 |
| 115.4 |
| 284,155 | 112.5 | 305,205 | 119.3 | 319,811 | 120.5 | ||||||||||||||||||
Flavored soft drinks |
| 113,999 |
| 55.7 |
| 100,222 |
| 45.7 |
| 113,820 |
| 50.1 |
| 106,627 | 42.2 | 103,263 | 38.9 | 87,380 | 33.2 | ||||||||||||||||||
Total |
| 357,175 |
| 174.4 |
| 363,123 |
| 168.5 |
| 375,993 |
| 165.5 |
| 390,782 | 154.7 | 408,468 | 158.2 | 407,191 | 153.8 | ||||||||||||||||||
As of December 31, 2015,2020, we sold our products to approximately 65,00064,000 customers in Chile. Although the mix varies significantly among the franchise territories, our distribution network generally relies on a combination of Company-owned trucks and independent distributors in each territory. The following table highlights the type of customer in Chile for our products:
|
| Year ended December 31, |
| ||||
|
| 2013 |
| 2014 |
| 2015 |
|
|
| (%) |
| ||||
Mom & Pops(1) |
| 58 |
| 53 |
| 50 |
|
Supermarkets |
| 25 |
| 25 |
| 26 |
|
On premise |
| 10 |
| 15 |
| 13 |
|
Wholesale distributors |
| 7 |
| 7 |
| 11 |
|
Total |
| 100 |
| 100 |
| 100 |
|
(1) Mom & Pops: are neighborhood stores (grocery stores, minimarkets, kiosks, liquor stores, bakeries, etc.) characterized by providing daily shopping needs, and differentiated because they are nearby, the provide informal credit and products are available in smaller formats.
| Year ended December 31 (1) , | ||||||||||||
| 2018 | 2019 | 2020 | ||||||||||
| (%) | ||||||||||||
| Mom & Pops (2) | 46 | 47 | 52 | |||||||||
| Supermarkets | 27 | 27 | 24 | |||||||||
| On premise | 14 | 13 | 11 | |||||||||
| Wholesale distributors | 13 | 13 | 13 | |||||||||
| Total | 100 | 100 | 100 | |||||||||
| (1) | In 2020, we made more uniform our channel definitions accross our four segments, consequently percentages from previous years were reclassified for comparison purposes. |
| (2) | Mom & Pops are neighborhood stores (grocery stores, minimarkets, kiosks, liquor stores, bakeries, etc.) characterized by providing daily shopping needs, and differentiated because they are nearby, and products are available in smaller formats. |
Other Beverages. Beverages: In addition to Coca-Cola soft drinks,Andina, through Vital JugosVJ S.A., we produceproduces and sellsells juices, other fruit flavored beverages ready-to-drink tea and sports drinks, and through Vital Aguas S.A. we produce and sell mineral water and purified water.drinks. Juices are producedmanufactured and soldcommercialized under the brands Andina del Valle (juices and fruit nectars), Kapo (juice drink), Fuze Tea (ready-to-drink tea), Glaceau Vitamin Water (water with added vitamins and minerals), Aquarius (juice drink), Powerade (isotonic) and Powerade (isotonic).
Waters are producedGuallarauco (fruit waters and soldnectars). Vital Aguas S.A. is in charge of bottling mineral and mineralized water under the brands Vital (mineral water) as sparkling,and SmartWater (sparkling and still versions). Also, Andina (in Chile) produces purified water under the brand Benedictino.
In September 2016 and lightly carbonatedJuly 2017, the Company began the distribution in Chile of products under the trademarks of Monster and Benedictino (purified water) as sparklingAdeS, respectively. In 2018, the Company began selling and still.distributing certain Guallarauco products and also spirits from the company Diageo, and in 2019 the Company began with the sale and distribution of liquors and wine of the company Capel.
In 2015,2020, the Company began selling and distributing AB InBev beer in Chile, under the following brands: Corona, Becker, Báltica, Budweiser, Stella Artois, Cusqueña, among others.
In 2020, net sales of waters, juices, seed-based beverages, sports drinks and juices in Chile represented 7.4% of our consolidated net sales. On a consolidated basis, sales of waters and juicesenergy drinks in Chile were Ch$138,547173,459 million, and net sales of beer and spirits were Ch$64,111 million.
Brazil
In Brazil, we produce, market and distribute our beverages under The Coca-Cola Company trademarks in the majority of the State of Rio de Janeiro and the entirety of the State of Espírito Santo and as ofsince October 1, 2013 in part of the state of São Paulo and part of the state of Minas Gerais, as a consequence of the consummation of the Ipiranga acquisition on October 1, 2013. During 2020, Brazil accounted for 35.4%36.1% and 32.3%34.2% of our volume and consolidated net sales, respectively, during 2015.respectively.
Soft Drinks. Drinks: The Brazilian soft drink operations accounted for net sales of Ch$417,509317,713 million. The following table highlights historical sales and volume of Coca-Cola soft drinks sold in Brazil for the periods indicated:
|
| Year ended December 31, |
| ||||||||||
|
| 2013 |
| 2014 |
| 2015 |
| ||||||
|
| (in millions) |
| ||||||||||
|
| Ch$ |
| UCs |
| Ch$ |
| UCs |
| Ch$ |
| UCs |
|
Colas |
| 271,159 |
| 154.8 |
| 365,744 |
| 186.6 |
| 320,220 |
| 180.7 |
|
Flavored soft drinks |
| 88,342 |
| 50.4 |
| 125,188 |
| 63.6 |
| 97,289 |
| 54.9 |
|
Total |
| 359,501 |
| 205.2 |
| 490,931 |
| 250.2 |
| 417,509 |
| 235.6 |
|
| Year ended December 31, | ||||||||||||||||||||||||
| 2018 | 2019 | 2020 | ||||||||||||||||||||||
| (in millions) | ||||||||||||||||||||||||
| Ch$ | UCs | Ch$ | UCs | Ch$ | UCs | |||||||||||||||||||
| Colas | 245,955 | 152.0 | 264,929 | 145.6 | 262,741 | 163.7 | ||||||||||||||||||
| Flavored soft drinks | 80,601 | 49.4 | 95,862 | 61.2 | 54,972 | 41.8 | ||||||||||||||||||
| Total | 326,016 | 201.4 | 360,792 | 206.8 | 317,713 | 205.5 | ||||||||||||||||||
As of December 31, 2015,2020, we sold our products to approximately 97,00087,000 customers in Brazil. The following table highlights the type of customer in Brazil for our products:
|
| Year ended December 31, |
| Year ended December 31 (1) , | |||||||||||||||
|
| 2013 |
| 2014 |
| 2015 |
| 2018 | 2019 | 2020 | |||||||||
|
| (%) |
| ||||||||||||||||
Mom & Pops |
| 25 |
| 26 |
| 25 |
| ||||||||||||
| (%) | |||||||||||||||||||
| Mom & Pops (2) | 32 | 33 | 34 | ||||||||||||||||
Supermarkets |
| 32 |
| 31 |
| 31 |
| 34 | 32 | 33 | |||||||||
On premise |
| 22 |
| 21 |
| 21 |
| 16 | 16 | 12 | |||||||||
Wholesale distributors |
| 21 |
| 22 |
| 23 |
| 19 | 20 | 22 | |||||||||
Total |
| 100 |
| 100 |
| 100 |
| 100 | 100 | 100 | |||||||||
| (1) | In 2020, we made more uniform our channel definitions accross our four segments, consequently percentages from previous years were reclassified for comparison purposes. |
| (2) | Mom & Pops are neighborhood stores (grocery stores, minimarkets, kiosks, liquor stores, bakeries, etc.) characterized by providing daily shopping needs, and differentiated because they are nearby, and products are available in smaller formats. |
Other Beverages. Beverages: We sell and distribute beer under the Amstel, Bavaria, Birra Moretti, Desesperados, Dos Equis (XX), Edelweiss, Heineken, Kaiser Murphys, Sagres,and Sol and Xingu labels. We alsosell and distribute water under the labels Crystal and Aquarius Fresh and sell and distributeSmartWater, ready-to-drink juices under the labels Del Valle Frut e Fresh, Del Valle Mais, Del Valle 100%, Del Valle Nutri, Del Valle Hortifruti and Kapo, energy drinks under the brand names Burn and Monster, isotonic drinks under i9 and Powerade brand names and Fuze CháIce Tea, Leão Fuze Ice Tea, Fuze Matte Leão and Guaraná Leão ready-to-drink teas. We also sell and distribute seed-based beverages, AdeS Juice and AdeS Milk, under the brand name AdeS and Shake Whey and Minilac lactose-free beverages under the brand name Verde Campo. As of November 2016 and June 2017, the Company began the distribution in its Brazilian franchise territories of products under the trademarks of Monster and AdeS, respectively.
In 2015,2020, net sales of beer, waters, juices, ready-to-drink teas, isotonicseed-based beverages, sports drinks and energy drinks in Brazil were Ch$189,53999,184 million, representing 10.1%and net sales of our consolidated net sales.beer were Ch$163,167 million.
Argentina
In Argentina, we produce, market and distribute our beverages under The Coca-Cola Company trademarks in the entirety of the provinces of Córdoba, Mendoza, San Juan, San Luis, Entre Rios,Ríos, western part of the Provinceprovince of Buenos Aires and most of Santa Fé,Fe, as well as La Pampa, Neuquén, Río Negro, Chubut, Santa Cruz, and Tierra del FuegoAntarctica and South Atlantic Islands.. During 2020, Argentina accounted for 28.6%22.7% and 33.4%18.8% of our sales volume and consolidated net sales, respectively, during 2015.respectively.
Soft Drinks. Drinks: The Argentine soft drink operations accounted for net sales of Ch$523,461260,118 million in 2015.2020. The following table highlights historical sales and volume of Coca-Cola soft drinks sold in Argentina for the periods indicated:
| Year ended December 31, | |||||||||||||||||||||||||||||||||||||
|
| Year ended December 31, |
| 2018 | 2019 | 2020 | |||||||||||||||||||||||||||||||
|
| 2013 |
| 2014 |
| 2015 |
| ||||||||||||||||||||||||||||||
|
| (in millions) |
| (in millions) | |||||||||||||||||||||||||||||||||
|
| Ch$ |
| UCs |
| Ch$ |
| UCs |
| Ch$ |
| UCs |
| Ch$ | UCs | Ch$ | UCs | Ch$ | UCs | ||||||||||||||||||
Colas |
| 291,231 |
| 149.8 |
| 294,241 |
| 149.5 |
| 384,429 |
| 147.1 |
| 235,678 | 119.0 | 222,140 | 108.9 | 194,621 | 111.6 | ||||||||||||||||||
Flavored soft drinks |
| 98,537 |
| 50.6 |
| 97,558 |
| 49.6 |
| 139,032 |
| 53.2 |
| 95,125 | 48.0 | 91,726 | 40.8 | 65,497 | 33.6 | ||||||||||||||||||
Total |
| 389,768 |
| 200.4 |
| 391,799 |
| 199.1 |
| 523,461 |
| 200.3 |
| 330,803 | 167.0 | 313,866 | 149.7 | 260,118 | 145.2 | ||||||||||||||||||
As of December 31, 2015,2020, we sold our products to approximately 66,00065,000 clients in Argentina. The following table highlights the type of client in Argentina for our products:
|
| Year ended December 31, |
| ||||
|
| 2013 |
| 2014 |
| 2015 |
|
|
| (%) |
| ||||
Mom & Pops |
| 45 |
| 44 |
| 35 |
|
Supermarkets |
| 22 |
| 22 |
| 28 |
|
On premise |
| 3 |
| 3 |
| 3 |
|
Wholesale distributors |
| 30 |
| 31 |
| 34 |
|
Total |
| 100 |
| 100 |
| 100 |
|
| Year ended December 31 (1) , | ||||||||||||
| 2018 | 2019 | 2020 | ||||||||||
| (%) | ||||||||||||
| Mom & Pops (2) | 37 | 37 | 36 | |||||||||
| Supermarkets | 23 | 23 | 23 | |||||||||
| On premise | 7 | 8 | 4 | |||||||||
| Wholesale distributors | 33 | 32 | 36 | |||||||||
| Total | 100 | 100 | 100 | |||||||||
| (1) | In 2020, we made more uniform our channel definitions accross our four segments, consequently percentages from previous years were reclassified for comparison purposes. |
| (2) | Mom & Pops are neighborhood stores (grocery stores, minimarkets, kiosks, liquor stores, bakeries, etc.) characterized by providing daily shopping needs, and differentiated because they are nearby, and products are available in smaller formats. |
Other Beverages. BeveragesIn: in Argentina we produce, sell and distribute ready-to-drinkflavored waters under the brand name Aquarius, and mineral and drinking water under the brands Bonaqua and Kin, and sell and distribute Glaceau Smartwater (which was incorporated into the portfolio in 2020). In addition, we produce, sell and distribute ready to drink juices under the Cepita brand name.name, and fruit and vegetable seed based drinks under the brand name AdeS (which in 2017 was incorporated into the portfolio through a joint venture between The Coca-Cola Company and other Coca-Cola bottlers, including Andina). We also produce, sell and distribute sport drinks under the Powerade brand name, and sell waterand distribute energy drinks under the brands Kin, Bonaqua (sparklingMonster brand name (which was incorporated into the portfolio in 2018). We also sell and still mineral water), Aquariusdistribute beer, wine and Quatro Liviana (flavored waters), as well as Poweradecider in the isotonic segment. Withsouthern region of the incorporation of Coca-Cola Polar Argentina S.A., starting 2012, we distribute beers includingfranchise under the following brands: Amstel, Blue Moon, Grolsch, Heineken, Imperial, Isenbeck, Kunstmann, Miller, Palermo, Schneider, Heineken, Budweiser, Amstel, Bieckert, Sol Imperial and KunstmannWarsteiner (beer); Colón, Eugenio Bustos, Graffigna and La Celia (wine); and 1888, Pehuenia and Real (cider).
In 2015,2020, net sales of juices, waters, tea basedseed-based beverages, isotonicsports and energy drinks in Argentina were Ch$93,410 million, representing 5.0%49,818 million. These values also consider the commission for distribution of our consolidated net sales.beer, wine and cider.
Paraguay
In Paraguay, we produce, market and distribute our beverages under The Coca-Cola Company trademarks in the entire country. During 2020, Paraguay accounted for 7.5%9.0% and 7.0%9.3% of our volume and consolidated net sales, respectively, during 2015.respectively.
Soft Drinks. Drinks: The Paraguayan soft drinks operations accounted for net sales of Ch$105,710126,058 million. The following table highlights historical sales and volume of Coca-Cola soft drinks sold in Paraguay for the periods indicated:
| Year ended December 31, | |||||||||||||||||||||||||||||||||||||
|
| Year ended December 31, |
| 2018 | 2019 | 2020 | |||||||||||||||||||||||||||||||
|
| 2013 |
| 2014 |
| 2015 |
| ||||||||||||||||||||||||||||||
|
| (in millions) |
| (in millions) | |||||||||||||||||||||||||||||||||
|
| Ch$ |
| UCs |
| Ch$ |
| UCs |
| Ch$ |
| UCs |
| Ch$ | UCs | Ch$ | UCs | Ch$ | UCs | ||||||||||||||||||
Colas |
| 60,230 |
| 34.2 |
| 65,866 |
| 33.2 |
| 62,337 |
| 30.9 |
| 67,538 | 32.1 | 72,303 | 30.6 | 58,597 | 30.1 | ||||||||||||||||||
Flavored soft drinks |
| 34,084 |
| 19.3 |
| 40,713 |
| 20.6 |
| 43,373 |
| 21.5 |
| 50,557 | 24.0 | 52,553 | 25.6 | 67,460 | 25.0 | ||||||||||||||||||
Total |
| 94,314 |
| 53.5 |
| 106,579 |
| 53.8 |
| 105,710 |
| 52.4 |
| 118,095 | 56.1 | 124,856 | 56.2 | 126,058 | 55.1 | ||||||||||||||||||
As of December 31, 2015,2020, we sold our products to approximately 53,00058,000 customers in Paraguay. The following table highlights the type of customer in Paraguay for our products:
|
| Year ended December 31, |
| Year ended December 31 (1) , | |||||||||||||||
|
| 2013 |
| 2014 |
| 2015 |
| 2018 | 2019 | 2020 | |||||||||
|
| (%) |
| ||||||||||||||||
Mom & Pops |
| 45 |
| 44 |
| 45 |
| ||||||||||||
| (%) | |||||||||||||||||||
| Mom & Pops (2) | 37 | 39 | 42 | ||||||||||||||||
Supermarkets |
| 11 |
| 11 |
| 11 |
| 12 | 13 | 12 | |||||||||
On premise |
| 22 |
| 22 |
| 23 |
| 14 | 13 | 9 | |||||||||
Wholesale distributors |
| 22 |
| 23 |
| 21 |
| 37 | 35 | 36 | |||||||||
Total |
| 100 |
| 100 |
| 100 |
| 100 | 100 | 100 | |||||||||
| (1) | In 2020, we made more uniform our channel definitions accross our four segments, consequently percentages from previous years were reclassified for comparison purposes. |
| (2) | Mom & Pops are neighborhood stores (grocery stores, minimarkets, kiosks, liquor stores, bakeries, etc.) characterized by providing daily shopping needs, and differentiated because they are nearby, and products are available in smaller formats. |
Other Beverages. Beverages: In Paraguay, we produce and distribute juices ready to be consumeddrink under the trademark Frugos.Frugos and we import and distribute seed-based drinks under the AdeS trademark. We also manufacture and sell water under the trademarks Dasani (purified water) and, Aquarius (flavored water), Kin (mineral water) and isotonic drinks like Powerade.Powerade (sports drinks). We also manufacture and sell energy drinks under the trademark Burn in disposable glass bottles and we import and distribute cans under the trademark Burn.Monster (since May 2019).
In 2015,2020, net sales of juices, waters, isotonicseed-based beverages, sports and energy drinks in Paraguay were Ch$24,330 million, representing 1.3% of our consolidated net sales.31,095 million.
Distribution
Chile
Soft Drinks, Juices, Waters and other Beverages.: In Chile, we generally distribute Coca-Cola soft drinksour products through a distribution system that includes: (i) third-party owned trucks operated by independent distributors pursuant to(569 trucks) that provide an exclusive distribution arrangements with us (622 trucks)service and (ii) our own trucks (75(244 trucks). In 2015, 85%2020, 81% of our distribution was distributedperformed by exclusive distributorsthird-party transport companies and 15%19% by our own trucks. Distributioncompanies in the Andina group. The distribution of all of Andina Chile’sAndina’s beverages takes placein Chile is carried out from distribution centers and production facilities. The 76 distributors collectively service all of our Chilean customers. In most cases, the distributorcarrier collects cash payment from theor customer in cash or check. Where applicable,checks. In some cases, the driver also either collects empty returnable glass containers or PET bottles of the same type and quantity as the bottles beingthose that were delivered or collects cash deposits for the net returnable bottles delivered. This task is particularly significant in the Chilean territory where returnable containers accounted for approximately 52.3%47.0% of total soft drinks volume in 2015.2020. Certain important customers (such as supermarkets), maintain accounts receivables with us, which are settled on average every 4346 days after invoices are issued. On average, accounts receivable from all credit sales clients are liquidated on a 41 day term.
Other Beverages. JuicesBeer and waters throughoutspirits: Andina in Chile are distributed by means ofuses its distribution system to distribute beer and spirits in its franchise territory. Since 2018, Andina in Chile has developed a portfolio expansion strategy to become a more complete beverage company. To this end, the Company has entered into agreements between The Coca-Cola Company and the Coca-Cola bottlers in Chile. In 2015, Andina distributed approximately 71%with different strategic partners transforming its value proposition towards customers of the different channels it serves in each product category. Since 2018, it has distributed Diageo's total portfolio of distilled spirits, brands such as Johnnie Walker, Vat 69 and Sandy Mac (whiskey), Cacique and Zacapa (rum), Smirnoff and Ciroc (vodka), Tanqueray and Gordon's (gin), and Baileys, among others, in the traditional channel, on-premise channel, convenience stores and B2C digital channel. During the third quarter of 2019, the product portfolio of the Cooperativa Capel (Alto del Carmen and Capel piscos, among other brands, and wines of the Viña Francisco de Aguirre) began to be distributed in all the channels of the territory. In 2020 we entered into a commercialization and distribution agreement, incorporating most of AB InBev brands in Chile, thereby commercializing products of Vital Jugosthe multinational company in the different channels of most of our territory. Andina in Chile purchases the different alcoholic products from the commercial partners (Diageo, Cooperativa Capel and Vital Aguas. Under Vital Jugos’AB InBev) at a price determined by these partners and Vital Aguas’ distribution agreements,sell them to its customers with a margin previously agreed by category and channel. The discount scheme is different in each bottler hascategory but, as a common rule, discounts approved by the exclusive right to distribute waters and juicescommercial partners are paid by these partners without affecting the margin of Andina in its territory.
Our management believes that our distribution arrangements for waters and juices provide an effective means of distributing those products throughout Chile using the extensive distribution system of the Coca-Cola bottlers. We have a good working relationship with the other Coca-Cola bottler that distribute waters and juices. If the other Coca-Cola bottler was to cease distribution, our management believes it could arrange alternative distribution arrangements, but the transition to the new arrangements could involve significant delays in distributing products and would involve additional costs and an initial reduction in sales.Chile.
Brazil
Soft Drinks, Juices and Waters.: In Brazil, we generally distribute Coca-Cola soft drinksproducts through a distribution system that includes: (i) own trucks (ii) trucks operated by independent distributors pursuant to exclusivenon-exclusive distribution arrangements, with us; (ii)and
(iii) trucks operated by independent transport companies on a non-exclusivean exclusive basis and (iii) our own trucks.with us. In 2015, 8%2020, 11.7% was distributed by exclusive distributors, 31%7.2% by independent transport companies and 61%81.1% by our own trucks. Distribution of all of Andina Brazil’s beverages takes place from distribution centers and production facilities. In 2015, approximately 7.6% of Andina Brazil’ soft drink sales were paid for in cash at the time of delivery, 0.3% were paid by check and 92.1% were paid were paid with other bank securities with an average payment term of 17 days.
Other Beverages.: Andina Brazil uses its distribution system to distribute beer in the Brazilian territory. Andina Brazil started distributing beer in the 1980s as a result of the acquisition of Cervejarias Kaiser S.A. (“Kaiser”) by a consortium of Coca-Cola bottlers (including Andina Brazil) in Brazil. In March 2002, the Canadian brewing company Molson Inc. acquired Kaiser. In 2006, FemsaFEMSA acquired from Molson a controlling ownership interest in Kaiser and in 2010, Heineken acquired a controlling interest in Femsa’sFEMSA’s beer operation. Andina Brazil buys beer from Heineken at a price determined by Heineken and sells it to its customers with a fixed margin. In the case of certain discount sales that have been approved by Heineken, Heineken shares between 50% and 100% of the cost of such discounts. In 2015,2020, Andina Brazil’s net sales of beer were Ch$82,790 million, of which Bavaria brand beer accounted for 37.4%, Heineken for 17.6%, Kaiser for 42.8%, Sol for 1.0%, and all the other brands accounted for 1.2% of net sales.163,167 million.
TheIn 2002, the Coca-Cola Company and the Brazilian Association of Coca-Cola Manufacturers entered into an agreement regarding the distribution through the Coca-Cola Systemsystem of beer produced and imported by Heineken. The agreements were signed May 30, 2003, and are renewable for a periodIn July 2017 Heineken Brazil notified us of 20 years.the termination of the agreement by virtue of which Andina Brazil iscommercialized and distributed Heineken-branded beers in Brazil, which will be effective in March 2022. During 2020, the Coca-Cola system in Brazil and Heineken reached a new agreement to redesign their distribution partnership in Brazil. As per the agreement, expected to become effective mid-2021 and have a initial five year term of duration, the Coca-Cola system in Brazil will continue to offer the Kaiser, Bavaria and Sol brands, and will complement this portfolio with the Eisenbahn brand and other brands. Additionally, as part of the redesign of the distribution partnership, the agreement allows the Coca-Cola system bottlers in Brazil to distribute and produce other national or international brands, in certain percentages and under certain conditions. See “Item 3. Key Information — Risk Factors — Risks Related to our Company— The modifications to the beer distribution agreement with Heineken in Brazil may not allowed to produce, bottle, sell or obtain any interest in any bottled or tap beer under any other label or in any bottle or packaging thatbe approved by the Brazilian antitrust authorities, which could be confused with brand beers, except as may be mutually agreed in writing betweenadversely affect our results of operations”.
In 2016, Andina Brazil and Heineken.signed an agreement with Monster Energy Company for the distribution of Monster Energy products in Andina Brazil’s territory. These products began being distributed in November 2016.
Argentina
Soft Drinks, Juices and Waters.: In 2015, 70%2020, 63% of Edasa’sEDASA’s Coca-Cola soft drinks were distributed by direct distribution and 30%37% by other distributors and wholesale distribution (indirect distribution). AllThe direct distribution is done by a group of independent transport companies. In 2015, approximately 68% of EDASA’s soft drink sales were paid for in cash and 32% were credit sales.companies, on an exclusive basis.
Other Beverages: Andina Argentina uses its distribution system to distribute beer in the territory composed by the provinces of La Pampa, Neuquén, Río Negro, Chubut, Santa Cruz, Tierra del Fuego and the following parts of the Province of Buenos Aires: Bahía Blanca, Tornquist, Coronel M.L.Rosales, Coronel Dorrego, Villarino, Daireaux, Guamini, Adolfo Alsina, Coronel Suarez, Coronel Pringles, Saavedra, Puán, Saliqueló, Municipio Urbano de Monte Hermoso, Benito Juárez, Gonzalez Chávez, Tres Arroyos, Carmen de Patagones, Olavarría, Azul, Tapalqué, Laprida, Lamadrid, Arrecifes, Chacabuco, Colón, Pergamino, Rojas, Salto, Bartolomé Mitre, Capitán Sarmiento, 9 de Julio, 25 de Mayo, General Alvear, Chivilcoy, Alberti, Bragado, Junín, Viamonte, Arenales, L.N.Alem, Lincoln, General Pinto, Ameghino, Tres Lomas, Pehuajó, Carlos Casares, Hipólito Yrigoyen, Bolívar, Carlos Pellegrini, Trenque Lauquen, Rivadavia, Carlos Tejedor, General Villegas. Andina Argentina began distributing beer in 2012 due to the merger with Coca-Cola Polar. Since mid-2019, wine and cider have been added to the business. Andina Argentina distributes on behalf of and according to an order by CICSA (Compañía Industrial Cervecera S.A.) at a set price which is segmented for each of the regions where the contract operates, and for which Andina Argentina receives a commission.
The Coca-Cola Company and two bottlers (ex-Coca-Cola Polar Argentina S.A., today Andina Argentina, and ex Juan Bautista Guerrero S.A., today Salta Refrescos S.A. of the Arca group) executed a master agreement regarding the distribution of beer manufactured or imported by CICSA, through the Coca-Cola distribution system. The distribution master agreement was executed in 2003 for an initial period of five years, with successive extensions every three years, and the last one agreed in November 2017 for a new five-year term expiring on June 12, 2022. In 2019, an addendum to this agreement was signed to amend the commissions and include wine and cider within the scope of the distribution agreement.
In addition, in December 2017, EDASA executed an agreement with Monster Energy Company for the distribution and commercialization of energy drinks of the “Monster” trademark for an initial period of 10 years in the territory within the franchise of Andina Argentina, with the consent of The Coca-Cola Company.
Paraguay
Soft Drinks, Juices and Waters.: PARESA distributed 76.5% Coca-Cola soft drinks89.6% of its products through direct distribution (independent transport companies), and 23.5%10.4% through wholesale distributors. All direct distribution is done by a group of small truck businessmen. In 2015 approximately 65.3% of sales of Paresa soft drinks were paid in cash and 34.7% were credit sales.
Competition
We face intense competition throughout the franchise territories principally from bottlers of competing soft drink brands. See “Item 3. Key Information — Risk Factors — Risks Related to our Company —Company—Our Business is highly competitive including with respect to price competition which may adversely affect our net profits and margins”. Our business is highly competitive including with respect to price competition which may adversely affect our net profits and margins.” As a result of restrictions related to COVID-19, A.C. Nielsen, the surveying company, changed the methodology and sample in Argentina, Chile and Paraguay, therefore figures may not be fully comparable to those of previous periods in these countries. The following table presents the market share of our main competitorsCoca-Cola and other soft drinks in Chile, Brazil, Argentina and Paraguay for the periods indicated:
Market Share
| 2018 | 2019 | 2020 | ||||||||||||||||||||||||||||||||||||||||||||||
| Chile | Brazil | Argentina | Paraguay | Chile | Brazil | Argentina | Paraguay | Chile | Brazil | Argentina | Paraguay | |||||||||||||||||||||||||||||||||||||
| (%) | ||||||||||||||||||||||||||||||||||||||||||||||||
| Coca-Cola soft drinks | 67 | 62 | 63 | 72 | 67 | 62 | 63 | 73 | 65 | 62 | 61 | 76 | ||||||||||||||||||||||||||||||||||||
| Pepsi Bottler soft drinks | 29 | 17 | 16 | 8 | 30 | 17 | 14 | 7 | 31 | 18 | 14 | 7 | ||||||||||||||||||||||||||||||||||||
| Other soft drinks | 4 | 21 | 21 | 20 | 4 | 21 | 23 | 20 | 4 | 20 | 25 | 17 | ||||||||||||||||||||||||||||||||||||
| Total | 100 | 100 | 100 | 100 | 100 | 100 | 100 | 100 | 100 | 100 | 100 | 100 | ||||||||||||||||||||||||||||||||||||
|
| 2013 |
| 2014 |
| 2015 |
| ||||||||||||||||||
|
| Chile |
| Brazil |
| Argentina |
| Paraguay |
| Chile |
| Brazil |
| Argentina |
| Paraguay |
| Chile |
| Brazil |
| Argentina |
| Paraguay |
|
|
| (%) |
| ||||||||||||||||||||||
Coca-Cola soft drinks |
| 67 |
| 61 |
| 60 |
| 61 |
| 69 |
| 61 |
| 61 |
| 62 |
| 69 |
| 62 |
| 62 |
| 66 |
|
Pepsi Bottler soft drinks |
| 26 |
| 19 |
| 20 |
| 11 |
| 26 |
| 19 |
| 20 |
| 12 |
| 27 |
| 19 |
| 19 |
| 9 |
|
Other soft drinks |
| 7 |
| 20 |
| 20 |
| 28 |
| 5 |
| 20 |
| 19 |
| 26 |
| 4 |
| 19 |
| 19 |
| 25 |
|
Total |
| 100 |
| 100 |
| 100 |
| 100 |
| 100 |
| 100 |
| 100 |
| 100 |
| 100 |
| 100 |
| 100 |
| 100 |
|
Source: A.C. Nielsen, with the exception of Paraguay, where the data was collected by IPSOS in 2013 and 2014.Nielsen.
Chile
Soft Drinks. Drinks: The soft drink segment of the Chilean beverage industry is highly competitive. The most important areas of competition are product image, pricing, advertising, ability to deliver product in popular bottle sizes, distribution capacity, and the amountnumber of returnable bottles held by retailers or by consumers. Returnable bottles can be exchanged at the time of new purchases in lieu of paying a bottle deposit, thereby decreasing the purchase price. Our main competitor in the Chilean franchise territory is Embotelladora Chilenas Unidas or ECUSA, a subsidiary of Compañía Cervecerías Unidas S.A. or CCU, the largest brewer in Chile. ECUSA produces and distributes Pepsi-Cola products and its own brands (soft drinks and bottled water). Based on reports by A.C. Nielsen, we estimate that in 2015,2020, our average soft drink market share within our franchise territories was 69.3%65.2%.
Other Beverages.Beverages: Vital Aguas’ Our principal competitor in the water segment is CCU, but there is also competition from low priced brands (“B-brands”) in the water segment in Chile. Vital Jugos S.A.’s. Our principal competitors in the juice segment are, Watt’s-CCU joint venture, Corpora Tres Montes and three of the leading dairy producers in Chile: Soprole S.A., Nestlé Chile S.A. and Loncoleche S.A.. During 2006, CCU acquired a 50% ownership interest of the juice brands in Chile and created a joint venture for the management of this business area.Loncoleche. The Chilean market for fruit-flavored beverages and waters also includes low-cost, lower-quality fruit juice concentrates and artificially flavored powdered beverage mixes. We do not consider these products competition for our waters and juices business because we believe that these products are of lower quality and value. Based on reports by A.C. Nielsen, we estimate that in 2015,2020, our average market share within our Chilean franchise territories wasreached approximately 34.8%39.7% for juices and others segment and approximately 42.5%46.8% for waters.
In the different categories for alcoholic beverages, CCU is the main competitor of Andina in Chile. CCU distributes beer (main brands are Escudo, Cristal, Kunstmann and Heineken), spirits (Pernod Ricard portfolio brands) and piscos (Control and Mistral brands, among others).
Brazil
Soft Drinks. Drinks: The soft drink segment of the Brazilian beverage industry is highly competitive. The most important areas of competition are product image, pricing, advertising and distribution capacity (including the number and location of sales outlets).
According to A.C. Nielsen, our main soft drink competitor in the Brazilian territory is American Beverage Company or AmBev, the largest beer producer and distributor in Brazil and also produces soft drinks, including Pepsi-Cola products. Based on reports by A.C. Nielsen, we estimate that in 2015,2020, our average soft drink market share within our Brazilian franchise territories was approximately 62.3%62.1%.
Other Beverages.: In the beer sector, Andina Brazil’s main competitor is AmBev which during 20142020 had a very dominant position in the Brazilian market. InBased on reports by A.C. Nielsen, we estimate that in 2020, our Rio de Janeiro and Espiritu Santo franchise ouraverage market share for waters was 5.8%reached 20.3%, where we distribute under the Crystal brand mineral water.water and SmartWater. In the segment of juices and others, based on reports by A.C. Nielsen, we estimate that in 2020, our average market share was 40.8%51.4%.
Argentina
Soft Drinks. Drinks: The soft drink segment of the Argentine beverage industry is highly competitive. The most important areas of competition are product image, pricing, advertising, ability to produce bottles in popular sizes and distribution capacity. Our greatest competitor in Argentina is Pepsi, commercialized by InBev. The most significant B-brandB-brands competitors are: Talca,Refres Now (Manaos), Pritty and Interlagos.Produnoa (Secco). Based on reports by A.C. Nielsen, we estimate that in 2015,2020, our average soft drink market share within our Argentine franchise territories wasreached approximately 61.6%61.5%.
Other Beverages. WeBeverages: we service the water market throughof flavored and plain waters with the brands Aquarius, Bonaqua, brand, through whichKin and Glaceau Smartwater. Based on reports by A.C. Nielsen, we have 8% of the market.estimate that in 2020, our average market share was 16.6%. In addition, the Juices and Others market ofis serviced by the Cepita, AdeS and Powerade brands. Based on reports by A.C. Nielsen, we estimate that in 2020, our average market share was 44.9%. Our biggest competitor in the water category is Danone, RPB (Baggio) in juices and others is serviced through the Cepita juice brand, AquariusInBev in flavored water and Powerade in isotonic, where we have a market share of 26.4%.sports drinks.
Paraguay
Soft Drinks.Drinks: The soft drink segment of the Paraguayan beverage industry is highly competitive. The most important areas of competition are product image, pricing, advertising, ability to produce bottles in popular sizes and the amountnumber of returnable bottles held by retailers or by consumers.
Our greatest competitor, local brand “Niko/De La Costa,” is produced and bottled by Embotelladora Central S.A., which hashad a 13.1%8.7% market share.share in 2020. B-brands in Paraguay represent 25.0%represented 22.2% of the soft drink industry. In 2020, Pepsi had a market share of 8.8% in December 2015,7.0%, and is produced and marketed by Vierci Group, Vierci, a local franchisee. Based on reports by A.C. Nielsen, we estimate that in 2015,2020, our average soft drinks market share within our Paraguayan franchise territories was approximately 66.3%76.5%.
Other Beverages.: We are leaders in all non-carbonated categories, except energy drinks.categories. In waters, based on reports by A.C. Nielsen, we have aestimate that in 2020, our average market share of 49.4%was 51.7% with theour Dasani, Aquarius, Tropical and DasaniKin brands. Additionally, theThe market for juices and others is serviced among others bythrough the trademark Frugos in juices and AdeS brands, Powerade in isotonic wheresport drinks, and Monster in energy drinks. Based on reports by A.C. Nielsen, we have aestimate that in 2020, our average market share of 38.2%was 44.9%.
Seasonality
Each of our lines of business are seasonal. Most of our beverage products have their highest sales volumes during the South American spring and summer (October through March), with the exception of nectar products, which have a slightly higher sales volume during the South American winter and autumn (April through September).
Packaging
Overview and Background
WeThrough Envases CMF S.A. in Chile (50% owned by Andina and 50% owned by Embonor), and Andina Empaques Argentina S.A. (“AEASA”) in Argentina we produce PET bottles in both returnable and non-returnable formats, preforms and plastic caps. As a returnable packaging material, PET has advantages compared to glass because it is lightweight, difficult to break, transparent and easily recyclable. On average, returnable PET bottles can be used up to 12 times. Non-returnable PET bottles also are produced in various sizes and are used by a variety of soft drink producers and, in Chile, by producers of edible oil products, wine and personal hygiene products.
EDASA produces and distributes Coca-Cola soft drinks in glass bottles and returnable and non-returnable PET bottles of various sizes and also in aluminum cans. They are also distributed as post-mix syrup, which is mixed with carbonated water in a dispenser at the point of sale, in stainless steel and bag-in-box containers. EDASA produces and distributes Coca-Cola soft drinks in returnable and non-returnable glass and PET bottles of various sizes, in aluminum cans and as post-mix syrup.
Juices are distributed in non-returnable PET bottles and Tetra Pak containers EDASA also produces and distributes mineral and mineralized water in returnable glass bottles and non-returnable PET bottles. Lastly, it produces and distributes flavored water in non-returnable PET bottles and aluminum cans and isotonic drinks in non-returnable PET bottles.
Sales
In 2015, AEASA had net2020, total sales of AEASA reached Ch$22,16215,149 million, withof which Ch$6,257 million corresponded to sales to EDASA, andCh$2,452 million corresponded to sales to other related companies amountingof the group and Ch$6,440 million corresponded to Ch$11,775 million. AEASA also sold PET bottlessales to third parties accounting for approximately Ch$10,387 million.parties.
Competition
We are suppliersAEASA is the supplier of returnable and non-returnable PET bottles, preforms, plastic caps and cases for Coca-Cola Bottlers in Argentina, also supplying some formats to Coca-Cola bottlers in ArgentinaChile, Bolivia and Chile. According to the pre-existing agreements between The Coca-Cola Company and the other Coca-Cola bottlers within South America, we must obtain the consent and assistance of The Coca-Cola Company to expand our sales of returnable PET bottles to said bottlers.
In Chile, we do not have any principal competitors in the non—returnable PET bottles market for oils, wines and personal hygiene. There are a few producers of non-returnable PET bottles in Chile who are significantly smaller than CMF. Plasco S.A., the second Chilean manufacturer of non-returnable PET bottles, does not compete with us because it is the exclusive supplier of PET bottles for ECUSA. (The Chilean Pepsi bottler).
Paraguay. In Argentina, we compete principally with Alpla S.A. and Amcor. AEASA supplies returnable PET bottles to all Coca-Cola bottlers in Argentina.
CMF is the exclusive supplier of PET Agreementsresin raw materials, returnable and preform packaging, as well as a main supplier in caps, cases and other plastic resin inputs. This market in Chile is very concentrated, there is only a second supplier of similar manufacturing dimensions and capacities, Plasco S.A., which manufactures mainly for ECUSA, the Pepsi bottler in Chile.
On June 29, 2001, we and Cristalerías de Chile S.A. signed a series of contracts forming a joint venture for the development of a PET production facility in Chile through the formation of Envases CMF S.A. We contributed the assets necessary to further the development of the joint venture. Our subsidiary Andina Inversiones Societarias S.A. holds a 50% stake in the joint venture while Cristalerías de Chile S.A. retains the other 50% interest. On January 27, 2012, Coca-Cola Embonor through its subsidiary, Embonor Empaques S.A. acquired Cristalerías de Chile’s stake equivalent to a 50% ownership interest in Envases CMF.
Raw Materials and Supplies
The principalmain raw materials used in the production of Coca-Cola soft drinks are concentrate, sweetener, water and carbon dioxide gas. Production also requires glass and plastic bottles, bottle topscaps and labels. Water used in soft drink production is treated for impurities and adjusted for taste reasons. All raw materials, especially water, are subjected to continuous quality control.
Chile
Soft Drinks.Drinks We purchase concentrate at prices established by The Coca-Cola Company. We mainly purchase sugar from Industria Azucarera Nacional S.A., IANSA, Sucden Américas and to Sucden Chile S.A., although we may purchase sugar in: Main suppliers of raw materials for the international market when prices are favorable, and have done so on occasion. Chilean sugar prices are subject to a price band established by the Chilean government on an annual basis. We obtain carbon dioxide gas from Linde Gas Chile S.A., Praxair Chile S.A. and Praxair Argentina S.A.- Our electric energy supplier is Chilectra S.A.. Andina’s affiliate Envases CMF, produces returnable PET bottles and non-returnable PET pre-forms which are blown at our Renca plant.production of soft drinks:
We also purchase bottles from Cristalerías de Chile S.A., Cristalpet S.A. Uruguay and Cristalerías Toro S.A.I.C. Bottle caps are purchased from Envases CMF S.A., Alucaps Mexicana S.A. de C.V. and Sinea S.A. Water is supplied by Aguas Andina S.A.
| · | Concentrate: Coca-Cola de Chile S.A. |
| · | Sweetener: Iansa Ingredientes S.A., Sucden Chile S.A. and Comercializadora de Productos Panor Ltda. |
| · | Carbon dioxide gas: Linde Gas Chile S.A. |
| · | Plastic bottles and packaging: Envases CMF S.A. |
| · | Glass bottles: Cristalerías de Chile S.A. and Cristalerías Toro S.P.A. |
| · | Plastic caps: Sinea S.A. |
| · | Labels: Impregraph Ltda. |
| · | Thermo-contractible: Plásticos Arpoli S.P.A. |
During 2015, 84%2020, 81% of the variable cost of sales for soft drinks produced by Andina Chile corresponded to main raw materials.materials and acquired finished products by Andina in Chile. The cost of each raw material within the total of main raw materialscost mix is the following:divided as follows: concentrate represents 66%73%; sugar and artificial sweeteners 21%13%; non-returnable bottles 9%; bottle caps 3%, carbon dioxide 1% and other raw material 2%. Water does not constitute an important cost as raw material.material cost. Additionally, the cost of finished products purchased from third parties (suchour subsidiaries, such as our affiliate ECSA)ECSA, is included within the cost of sales of soft drinks. These costs represent 14%11% of the total costs of sales of soft drinks and correspond mainly to cans, PET bottles and some PET bottles.sweeteners.
Other Beverages.: The principal raw materials used by Vital Jugos S.A. in the production of juices and as a percentage of total raw material costs, are sweeteners 10%2.3%, fruit pulp and juices 13%6.7%, concentrate 30%31.7%, containers 21% and18.7%, wrapping material 4%3.0%, caps 3%3.9%, and other raw material 3%2.5% all of which during 20152020 accounted for 84%68.8% of total costs for sales of juice, including packaging. Additionally, AdeS finished product represented 1.6% of total costs for sales of juices.
The principal raw materials used by Vital Aguas S.A. in the production of still and sparkling mineral water with and without gas and as a percentage of total raw material costs are: packaging 43%25%, concentrate 22%26%, caps 7%4%, wrapping material 5%4%, carbonation 1%, and other raw materials 2%, all of which during 20152020 accounted for 79%61% of total costs for sales of water, including packaging.
Brazil
Soft Drinks.Drinks Andina Brazil purchases concentrate in: Main suppliers of raw materials for the cityproduction of Manaus at prices established by The Coca-Cola Company. Manaus has been designated as a duty-free development zone by the Brazilian government. Andina Brazil purchases sugar from Brazilian suppliers, in particular from Usina Alta Mogiana S.A., Acúcar e Alcool, Guarani S.A. and Central EM Acucar e Alcool Ltda (Moreno) Copersucar Ltda., Alta Mogiana and Usina Moreno. It purchases carbon dioxide gas mainly from Companhia White Martins Gases S.A., Light Esco Ltda. and Linde Gases S.A., packaging from Brasalpla Brasil Industria de Embalagens Ltda. Amcor Pet Packaging do Brasil Ltd., and Owens Illinois S.A. Cans and aluminum caps are purchased from Rexam Beverage Can South and Latapack Ball Embalagens Ltda; metal bottle caps from Aro S.A., Bericap do Brasil Ltda and Closure Systems International (Brazil) Sistemas de Vedacao Ltda. Andina Brazil purchases water from the municipality of Rio de Janeiro and to Companhia Espírito Santense de Sanenamento.soft drinks:
| · | Concentrate: Recofarma Industrias do Amazonas Ltda. |
During 2015, 76%
| · | Sweetener: Usina Alta Mogiana S.A. Açúcar e Alcool. |
| · | Water: Companhia Estadual de Água e Esgotos. |
| · | Preforms: Lorenpet Industria e Comercio de Plásticos Ltda. |
| · | Containers (RefPET): RioPet Embalagens S.A. |
| · | Aluminum cans and aluminum caps: Ball Embalagens Ltda. |
| · | Plastic caps: Bericap do Brasil Ltda. |
| · | Electricity/Gas: Ecogen Rio Soluções Energéticas S.A. |
| · | Thermo-contractible: Valfilm MG Industria de Embalagens Ltda. |
In 2020, 72.1% of the variable cost of sales for soft drinks produced by Andina Brazil corresponded to main raw materials. The cost of each raw material within the total of main raw materials is the following: concentrate (including juice used for some flavors) represents 40%46.7%; sugar and artificial sweeteners 21%20.2%; non-returnable bottles 16%14.4%; cans 15%9.6%; bottle caps 3%3.0%; carbon dioxide 1%1.8% and other raw material 4%4.3%. Additionally, the cost of soft drinks finished products purchased from third parties is included within the cost of sales of soft drinks. These costs represent 0.3% of the total costs of sales of soft drinks and correspond to some formats of cans, PET and non-returnable glass bottles.
Argentina
Soft Drinks.Drinks EDASA purchases concentrate at prices established by The Coca-Cola Company. EDASA purchases sugar mainly from Atanor S.C.A. and Ingenio y Refinería San Martín de Tabacal S.R.L. and Carbon dioxide gas from Praxair Argentina S.R.L. and Air Liquide S.A. EDASA buys non-returnable and returnable PET bottles and cases from AEASA and glass bottles from Cattorini Hermanos S.A. EDASA also buys bottles from Amcor Pet Packaging de Argentina S.A. The plastic caps are purchased from Alusud Argentina S.R.L., AEASA, Sinea Plásticos S.A. and Bericap S.A. and the metal caps are purchased from Metalgráfica Cearense S.A. and Aro S.A. in Brazil. Regarding water supply: Main suppliers of raw materials for the production of soft drinks, EDASA owns water wells and pays a fee to the Dirección Provincial de Aguas Sanitarias. EDASA also buys plastic labels from Luis and Miguel Zanniello S.A. and Envases John S.A and plastic packaging from Petropack S.A., Plastiandino S.A. and Rio Chico S.A.
EDASA obtains electric energy from Compañía Administradora del Mercado Mayorista Eléctrico S.A..drinks:
| · | Concentrate: Servicios y Productos para Bebidas Refrescantes S.R.L. |
During 2015, 71%
| · | Sweetener: Complejo Azucarero Concepción. |
| · | Bottles and Preforms: Andina Empaques Argentina S.A. and Vinisa Fueguina S.R.L. |
| · | Carbon dioxide gas, Carbonic gas and Nitrogen: Praxair Argentina S.R.L. |
| · | Resin bottles: Dak Americas Argentina S.A. |
| · | Glass bottles: Cattorini Hermanos S.A.C.I.F.E.I. |
| · | Plastic caps: Andina Empaques Argentina S.A. and Closure Systems International Sistemas de Vedação Ltda. |
| · | Cans: Ball Beverage Can South America. |
| · | Chemical inputs (Caustic Soda, Hydrochloric Acid, etc.): Frini Ariel Ramon. |
| · | Thermo-contractible: Rio Chico S.A. |
In 2020, 64.8% of the variable cost of sales for soft drinks produced by Andina Argentina corresponded to main raw materials. The cost of each raw material as a percentage of the total cost of raw materials is as follows: concentrate 59%65.0%, sugar and artificial sweeteners 20%15.4%, non-returnable bottles 14%11.4%, bottle caps 3%3.3%, carbon dioxide 1%0.6%, cans and caps 2.7%, and other raw materials 3%1.7%. Additionally, the cost of finished products purchased from third parties is included within the cost of sales of soft drinks. These costs represent 4%1.1% of the total costs of sales of soft drinks and correspond to can formats and other formats of soft drinks which are not produced by Andina Argentina.Argentina during 2020.
PET Packaging.Packaging: The principal raw material required for production of PET bottles is PET resin. During 2014,2020, this raw material was mainly purchased from DAK AméricasAmericas de Argentina S.A. and EcopekS.A.Ecopek S.A. In the case of plastic caps and cases, the main raw material required for their production is HDPE resin (high density polyethylene), which during the year 20152020 was bought mainly from PBB Polisur S.A.
In 2014,2020, AEASA’s costs for PET resin accounted for 42%41% of the total variable cost of its sales of PET bottles and preforms.
Paraguay
Soft Drinks. PARESA acquires concentrates at prices established by The Coca-Cola Company. PARESA acquires sugar from Industria Paraguaya de Alcoholes S.A. Non-returnable pre-forms are mainly supplied by Industrias Pet S.A. Glass bottles are bought from Cattorini Hermanos S.A. and Lux S.A.. Plastic caps for non-returnable bottles are bought from Andina Empaques in Argentina and plastic caps for returnable glass bottles and RefPet are bought from Sinea, and metal caps from Aro S.A. de Brazil. Electric energy is supplied by ANDE-Administración Nacional de Electricidad. PARESA has its own water wells: Main suppliers of raw materials for the supplyproduction of water.soft drinks:
| · | Concentrate: Recofarma Industrias do Amazonas Ltda. and Servicios y Productos para Bebidas. |
| · | Sugar: Inpasa del Paraguay S.A., Alcotec Sociedad Anónima, and Azucarera Paraguaya S.A. |
| · | Carbon dioxide gas: Liquid Carbonic del Paraguay S.A. |
| · | Caps: Andina Empaques Argentina S.A. |
| · | Preforms: Industrias PET S.A.E.C.A. |
| · | Fructose: Ingredion Argentina S.R.L. and Arcor S.A.I.C. |
During 2015, 77%2020, 75% of the variable cost of sales for soft drinksbeverages produced by ParesaPARESA corresponded to our main raw materials. The costcomposition of eachthis raw material within the total of main raw materialscost is as follows: concentrate represents 49%50%, sugar and artificial sweeteners 20%19%, non-returnable bottles 12%, bottle caps 4%3%, carbon dioxide 1% and other raw material 14%materials 7.5%. Water does not constitute an important cost as raw material. Additionally, the cost ofAdeS finished products purchased from third parties is included withinfor the costsale of salesjuices represented 7.5% of soft drinks. These costs represent 1% of the total costs of sales of soft drinks and correspond to cans and some PET bottles.variable costs.
Marketing
We and The Coca-Cola Company jointly promote and market Coca-Cola soft drinksproducts in our franchise territories, in accordance with the terms of our respective Bottler Agreements.bottler agreements. We advertise in all major communications media. We focus our advertising efforts on increasing brand recognition by consumers and improving our customer relations. National advertising campaigns are designed and proposed by The Coca-Cola Company’s local affiliates, with our input at the local or regional level.
During 2015,Generally we paidpay approximately 50% of the advertising and promotional expenses incurred by The Coca-Cola Company in our franchise territories. Nearly all media advertising and promotional materials for Coca-Cola soft drinks are produced and distributed by The Coca-Cola Company. See “Item 4. Information on the Company —Bottler Agreements.” Marketing and promotional programs, including television, radio and print advertising, point-of-sale advertising, sales promotions and entertainment are developed by The Coca-Cola Company for all Vital Jugos’ and Vital Aguas’ products.
UnderPursuant to the terms of our agreementexisting distribution agreements with Heineken Heineken undertakes all responsibilityand Monster, these companies are responsible for planning and managing advertising, marketing and promotional activities related to beer.beer and energy drinks, respectively. Andina Brazil, however, is free to undertake marketing or promotional activities with Heineken´sHeineken’s and Monster’s prior approval. The parties have agreed to
assume joint responsibility forjointly the costs of certain promotional activities (radio or television) and for certain outdoor events which take place in the Rio de Janeiro, and Espírito Santo and Ribeirão Preto regions.
In Argentina, in accordance with the existing distribution agreement with CICSA, CICSA is responsible for planning and managing advertising, marketing and promotional activities related to beer, wine and cider. Andina Argentina, however, is free to undertake marketing or promotional activities with CICSA’s prior approval. The parties have agreed that CICSA will assume the costs of promotional activities (radio, television, outdoor advertising and media) in the region.
In September 2016, November 2016, February 2018 and May 2019, Andina (Chile), Andina Brazil, Andina Argentina and Paraguay Refrescos, respectively, began to commercialize the energy drink, called Monster Energy. This brand is part of the collaboration agreement entered into during 2015 by The Coca-Cola Company and Monster Energy, which included the distribution of its products in the territories of the Coca-Cola System, such as Chile, Brazil, Argentina and Paraguay.
Channel Marketing
In order to provide more dynamic and specialized marketing of our products, our strategy is to divide our market into distribution channels. Our principalmain channels are “mom and pops” which are small retailers, “on premise” consumption such as restaurants and bars, supermarkets“supermarkets” and third party distributors.“wholesale distributors”. Presence in these channels entails a comprehensive and detailed analysis of the purchasing patterns and preferences of various groups of soft drinkdrinks and other beverages consumers in each type of location or distribution channel. In response to this analysis, we seek to tailor our product, price, packaging and distribution strategies to meet the particular needs of and exploit the potential of each channel.
We believe that the implementation of our channel marketing strategy also enables us to respond to competitive initiatives with channel-specific responses as opposed to market-wide responses. This focused response capability isolates the effects of competitive pressure in a specific channel, thereby avoiding costlier market-wide responses. Our channel marketing activities are facilitated by our management information systems. We have invested significantly in creating such systems, including providing hand-held computer and data gathering equipment to support the gathering of product, consumer and delivery information, as well as applications that may be used on smartphones enabled to use these applications. All of which is required to implement our channel marketing strategies effectively for most of our sales routes in Chile, Brazil, Argentina and Paraguay. We will continue investing to increase pre-sale coverage in our territories.
Our consolidated total advertising expenditures were Ch$45,729million, Ch$48,110 million and Ch$43,667 million in 2013, 2014 and 2015 respectively.Bottler Agreements
Bottler AgreementsGeneral
Our status as a The Coca-Cola Company franchisee is based on the Bottler Agreementsbottler agreements that the Company has entered into with The Coca-Cola Company by which it has the license to produce and distribute Coca-Cola brand products within its operating franchise territories in Chile, Brazil, Argentina and Paraguay. The Company’s operations are highly dependent on maintaining and renewing the Bottler Agreementsbottler agreements which provide for the production and distribution of Coca-Cola brand products under certain terms and provisionsprovisions.
The Bottler Agreementsbottler agreements are international standard contractscontracts. The Coca-Cola Company enters into with bottlers outside the United States for the sale of concentrates and beverage basis for certain Coca-Cola soft drinks and non-soft drink beverages. These are renewable upon request by the bottler and at the sole discretion of The Coca-Cola Company. We cannot assure you that the Bottler Agreementsbottler agreements will be renewed upon their expiration or that they will be renewed upon the same or better terms.
Concentrates and beverage basis
The Bottler Agreementsbottler agreements provide that we will purchase our entire requirement of concentrates and beverage basis for Coca-Cola soft drinks and other Coca-Cola beverages from The Coca-Cola Company and other authorized suppliers. Although under the Bottler Agreementsbottler agreements, The Coca-Cola Company, in its sole discretion, may set the price of concentrates and beverage basis, among other terms, we set the price of products sold to retailers at our discretion, subject only to certain price restraints.restrictions.
WeAs of the date of this annual report, we are the sole producer of Coca-Cola soft drinks and other Coca-Cola beverages in our franchise territories. Although this right is not exclusive, The Coca-Cola Company even though empoweredit has the ability to do so, has never authorized any other entity to produce or distribute Coca-Cola soft drinks or other Coca-Cola beverages in such territories, although we cannot assure you that in the future it will not do so. In the case of post-mix soft drinks, the Bottler Agreementsbottler agreements explicitly establish such non-exclusive rights.
The Bottler Agreementsbottler agreements include an acknowledgment by us that The Coca-Cola Company is the sole owner of the trademarks that identify the Coca-Cola soft drinks and other Coca-Cola beverages and of any secret formula used in concentrates.
Production and Distribution
All distribution must be in authorized containers. The Coca-Cola Company has the right to approve, at its sole discretion, any and all kinds of packages and containers for beverages, including their size, shape and any of their attributes. The Coca-Cola Company has the authority at its sole discretion to redesign or discontinue any package of any of the Coca-Cola products, subject to certain limitations, so long as Coca-Cola soft drinks and other Coca-Cola beverages are not all discontinued at the same time.
We are prohibited from producing or handling any other beverage products, other than those of The Coca-Cola Company or other products or packages that would imitate, infringe or cause confusion with the products, trade dress, containers or trademarks of The Coca-Cola Company, or from acquiring or holding an interest in a party that engages in such activities. The Bottler Agreementsbottler agreements also impose restrictions concerning the use of certain trademarks, authorized containers, packaging and labeling of The Coca-Cola Company and prohibit bottlers from distributing Coca-Cola soft drinks or other Coca-Cola beverages outside their designated territories.
The Bottler Agreementsbottler agreements require us to maintain adequate production and distribution facilities; inventories of bottles, caps, boxes, cartons and other exterior packaging or materials; to undertake adequate quality control measures prescribed by The Coca-Cola Company; to develop, stimulate, and fully satisfy the demand for Coca-Cola soft drinks and other Coca-Cola beverages and tothat we use all approved means, and spend such funds on advertising and other forms of marketing, as may be reasonably required to meet that objective; and to maintain such sound financial capacity as may be reasonably necessary to assure performance by us and our affiliates of our obligations before to The Coca-Cola Company. All Bottler Agreementsbottler agreements require us annually to submit, on an annually basis, our business plans for such franchise territories to The Coca-Cola Company, including without limitation, marketing, management and promotional and advertising plans for the following year.
Advertising and marketing
The Coca-Cola Company has no obligation to contribute to our expenditures derived fromfor advertising and marketing, but it may, at its discretion, contribute to such expenditures and undertakeperform independent advertising and marketing activities, as well as cooperative advertising and sales promotion that would require our cooperation and support. In each of the franchise territories, The Coca-Cola Company has been contributing approximately 50% of our advertising and marketing expenses, but no assurances can be given that equivalent contributions or any contributions at all will be made in the future.
Assignments and other provisions
Each bottler is prohibited from, directly or indirectly, assigning, transferring or pledging its Bottler Agreement,bottler agreement, or any interest therein, whether voluntarily, involuntarily or by operation of law, without the prior consent of The Coca-Cola Company, and each Bottler Agreementbottler agreement is subject to termination by The Coca-Cola Company in the event of default by us. Moreover, no bottler may undergo a material change of ownership or control in the bottler may occur without the prior consent of The Coca-Cola Company.
Termination
The Coca-Cola Company may terminate a Bottler Agreementbottler agreement immediately by written notice to the bottler in the event that, among other events, (i) the bottler suspends payments to creditors, declares bankruptcy, is declared bankrupt, is expropriated or nationalized, is liquidated, dissolved, changes its legal structure, or pledges or mortgages its assets; (ii) the bottler does not comply with instructions and standards established by The Coca-Cola Company relating to the production of its authorized soft drink products; (iii) the bottler ceases to be controlled by its controlling shareholders;shareholders (without the prior consent of The Coca-Cola Company); or (iv) the terms of the Bottler Agreement comebottler agreement become contrary to violatethe applicable law.
Either party to any Bottler Agreementbottler agreement may, withwithin 60 days’ notice thereof to the other party, terminate the Bottler Agreementbottler agreement in the eventcase of non-compliance bydefault of the other party, with the terms thereof so long as the party in non-compliance hasprovided that such default is not remedied during such non-compliance during this period.
In addition, if a bottler does not wish to pay the required price for concentrate for any Coca-Cola products, it must notify The Coca-Cola Company within 30 days of receipt of The Coca-Cola Company’s new prices. In the case of any Coca-Cola soft drink or other Coca-Cola beverages other than Coca-Cola concentrate, the franchise regarding such product shall be deemed automatically canceled three months after The Coca-Cola Company’s receipt of the bottler’s notice of refusal. In the case of Coca-Cola concentrate, the Bottler Agreementsbottler agreements shall be deemed terminated three months after The Coca-Cola Company’s receipt of the bottler’s notice of refusal.
The Coca-Cola Company may also terminate the Bottler Agreementsbottler agreements if the bottler or any individual or legal entity that controls owns a majority share in or directly or indirectly influences the management of the bottler,it, engages in the production of any non-Coca-Cola beverage, whether through direct ownership of such operations or through control or administration thereof, provided that, upon request, the bottler shall be given six months to remedy such situation.
Chile
Our licenses for the territories in Chile expire in 2018 and 2019.January 2023.
In 2005 VitalVJ S.A. and The Coca-Cola Company entered into a Juice Bottler Agreement by which The Coca-Cola Company authorized VitalVJ S.A. to produce, prepare and bottle in packaging previously approved by The Coca-Cola Company the previously mentioned trademarkstrademarks.
Andina and Embonor S.A. have the right to purchase products from Vital JugosVJ S.A. Said agreement is currently in the process of renewal.This contract was renewed on January 1, 2019 and expires on December 31, 2021. Additionally, Andina, Vital JugosVJ S.A. and Embonor S.A. have agreed with The Coca-Cola Company the respective agreements and authorizations to produce, bottle and commercialize these products at their respective plants.
Water Production and Packaging Agreement: In 2005, Vital Aguas S.A. and The Coca-Cola Company entered into a Water Manufacturing and Packaging Agreement for the preparation and packaging of beverages regardingin connection with the brands Vital, Chanqueahue, Vital de Chanqueahue, and Dasani brands incorporating at the beginning of 2008 the Benedictino brand Benedictino to the product portfolio manufactured by Vital Aguas S.A. under the agreement. This agreement is currently in the process of renewalcontract was renewed on January 1, 2019 and expires on December 31, 2021.
Brazil
Our licenses for the territories in Brazil will expire in 2017.October 2022.
Argentina
Our licenses for the territories in Argentina expire in 2017.September 2022.
Paraguay
Our licenses for the territories in Paraguay expire in September 2020.March 2022.
Regulation
General
We are subject to thea full range of government regulations generally applicable to companies engaged in business in our franchise territories, including but not limited to labor, social security, public health, consumer protection, environmental, sanitation, employee safety, securities and anti-trust laws. Currently, no material legal or administrative proceedings are pending against us with respect to any regulatory matter in any of our franchise territories except those listed as such in “Item 3. Key Information—Risk Factors” and “Item 8. Financial Information—Contingencies.”Contingencies”.
We believe that, to the best of our knowledge that we are in compliance in all material respects with applicable statutory and administrative regulations relating to our business in each of our franchise territories.
Chile.: There are no special licenses or permits specifically required to manufacture and distribute soft drinks and juices in the Chilean territory. Food and beverage producers in Chile, however, must obtain authorization from, and are supervised by the Chilean Environmental Protection ServicesHealth Ministry’s respective regional offices (Servicio Sanitario Metropolitano del AmbienteSecretaría Regional Ministerial de Salud), which inspects production facilities and takes liquid samples for analysis on a regular basis. Our main plant in Renca obtained its permit fromto operate on October 6, 2011 which has been granted for an indefinite period. Likewise, the Chilean Environmental Protection Authority was obtained on January 8, 1992 and ispermits we have to operate our other plants in effect indefinitely.Chile, have also been granted for an indefinite period. In addition, production and distribution of mineral water is subject to special regulations such that mineral water may be drawn only from sources designated for such purpose by presidentialsupreme decree. Certification of compliance with such decree is provided by the National Health Service, the Undersecretary’s Office of the Ministry of Health (Servicio de Salud Metropolitano del Ambiente). Our mineral water production facilities have received the required certification.
With regard to the storage and distribution of alcoholic beverages, these activities are governed by the rules of Laws No. 18,455 and No. 19,925, which regulate the production, processing, commercialization, sale and consumption of alcoholic beverages.
Brazil.: Labor laws, in addition to mandating employee benefits, include regulations to ensure sanitary and safe working conditions in our production facilities located in Brazil. Food and beverage producers in Brazil must register their products with and receive a ten-year permit from the Ministry of Agriculture and Provisioning and the Ministry of Health, which oversees diet products.
Health. Our permits from said
Ministries are valid and in force for a term of ten years for each product we produce. Although we cannot assure you that they will be renewed, we have not experienced any material difficulties in renewing our permits in the past nor do we expect to experience any difficulties in the future. The Ministries do not regularly inspect facilities, but they do send inspectors to investigate any complaints it receives.
Argentina.: While most laws applicable to EDASA are enforced at the federal level, some, such as sanitary and environmental regulations, are primarily enforced by provincial and municipal governments. Licenses or permits are required for the manufacture or distribution of soft drinksbeverages in the Argentine territory, which are evidenced through national records of food establishment and food products. Additionally, our production facilities are subject to registration with federal and provincial authorities and to supervision by municipal health agencies, which certify compliance with applicable laws.
Paraguay.: ParesaPARESA is registered with the Ministry of Industry and Trade in Paraguay, which issues and renews the industrial registry. Its latest renewal expires in 2017. Food and beverage producers in Paraguay must register with the Ministry of Health, which performs inspections of plants and monitors products in the market. Industries must also have an environmental license issued by the Ministry of Environment and Sustainable Development, which is the main body responsible for monitoring compliance with environmental laws. In addition to establishing the mandatory employee benefits, include safe working and sanitary conditions at industrial installations within Paraguay. ParesaPARESA maintains all of its licenses, permits and registrations issued by these institutions and ensures compliance with the regulations and ordinances of the municipalities where its plant is located.
Environmental Matters
It is our policy to conduct environmentally sound operations on a basis consistent with applicable laws and within criteria established by The Coca-Cola Company. Although regulation of matters relating to the protection of the environment is not as well-developed in the franchise territories as in the United States and other industrialized countries, we expect that additional laws and regulations may be enacted in the future with respect to environmental matters that may impose additional restrictions on us which could materially or adversely affect our results of operations in the future. There are no material legal or administrative proceedings pending against us in any of the franchise territories with respect to environmental matters, and we believe that, to the best of our knowledge, we are in compliance in all material respects with all environmental regulations applicable to us.
Chile
The Chilean government has several regulations governing environmental matters relating to our operations.
Law N° 19,300, addressing general environmental concerns, passed in March 1994, addressesregulates general environmental concerns that may beissues and fundamental aspects applicable to our activities and which, if applicable, wouldthat could require us to hirethe hiring of independent experts to conduct studies or environmental impact studies or declarationsstatements of any future projectsproject or activitiesactivity that couldmay be impactedaffected by the regulationsprovisions of Law N° 19,300. This Law creates the National Commission on the Environment, which is supported by regional commissions to supervise environmental impact studies and declarations for all new projects, to enforce the regulations of Law 19,300 and to grant discretionary power to regulators. In January 2010, the aforementioned law was amended with the enactment ofby Law N° 20,417, which created a new environmental institutionagency, the Environment Ministry, the Environmental Assessment Service and the Environment Superintendence. In January 2012, Law N° 20,600 was published which created the MinistryEnvironmental Tribunals (3), which came into operation on December 2012.
Law N° 20,920 passed in June 2016, sets the framework for waste management, the extended liability of Environment, Environmental Assessment Services, the Superintendence of Environmental Protectionproducer and the Environmental Courts,promotion of recycling, which became effective on December 2012. The Environmental Courtsaims to reduce waste generation and encourage reuse, recycling and other types of valorization, in order to protect people’s health and the Metropolitan Region and in Antofagasta began functioning during 2013.environment.
Brazil
Our Brazilian operations are subject to several environmental laws, none of which currently impose substantial restrictions on us. The Brazilian Constitution establishes the broad guidelines for the new treatment of environmental concerns, dedicating an entire chapter (Chapter VI, Article 225) to the protection of the environment, along with several other articles related to the environmental law and urban law.concerns. Environmental issues are regulated at the federal, state and municipal levels.
The Brazilian Constitution empowers the public authorities to develop regulations designed to preserve and restore the environment and to control industrial processes that affect human life. Violations of these regulations are subject to criminal, civil and administrative penalties.
In addition, Law No.N° 6,938 of 1981, known as the Brazilian Environmental Policy, introduced an environmental regime under which no environmental damage is exempt from coverage. TheThis legislation is based on the idea that even a polluting waste tolerated under the established standards could cause environmental damage, and therefore subjects the party causing such damage to the payment of an indemnity. Moreover, as mentioned above, activities damaging to the environment lead to criminal and administrative penalties, provided for in Law N° 9,605 of 1998 or the Environmental Crimes Act.
Numerous governmental bodies have jurisdiction over environmental matters. At the federal level, the Ministério do Meio Ambiente (Brazilian Ministry of Environment) and the Conselho Nacional do Meio-Ambiente or CONAMA dictate environmental policy, including, without limitation, initiating environmental improvement projects, establishing a system of fines and administrative penalties and reaching agreements on environmental matters with offending industries. The Instituto Brasileiro do Meio Ambiente e dos Recursos Naturais Renováveis or IBAMA, enforces environmental regulations set by CONAMA.CONAMA, including by developing several activities for the preservation and conservation of natural heritage and controlling and supervising the use of natural resources. In addition, various federal authorities have jurisdiction over specific industrial sectors, but none of these currently affect us.
Finally, various state and local authorities regulate environmental matters in the Brazilian territory including the FundaçãoInstituto Estadual de Engenharia do Meio-AmbienteAmbiente or FEEMA,INEA, the principalmain environmental authority in Rio de Janeiro, the Instituto Estadual de Medio Ambiente e Recursos Hídricos or IEMA,(“IEMA”), the principalmain authority on environmental authorityissues in Espírito Santo, and the principal environmental authority in São Paulo is CETESB - Companhia de Tecnologia de Saneamento Ambiental. FEEMA, - CETESB, the main environmental authority in São Paulo and the Secretaria de Estado de Meio Ambiente e Desenvolvimento Susutentável (SEMAD), the main environmental authority in Minas Gerais. INEA, IEMA, CETESB and CETESBSEMAD periodically inspect industrial sites and test liquid waste for contamination.sites. We believe to the best of our knowledge that we are in compliance in all material respects with the standards established by all the governmental authorities applicable to our operations in Brazil. We cannot assure you, however, that additional regulations will not be enacted in the future, and that such restrictions would not have a material adverse effect on our results or operations. The operation in Brazil as that of Chile counts with all certifications mentioned in terms of Quality, Environment and Occupational Health and Safety and those associated with Food Safety and Best Practices in Food Processing.
Argentina
The Argentine Constitution, as amended in 1994, allows any individual who believes a third party may be damaging the environment to initiate an action against it. No such action of this nature has ever been institutedinitiated against EDASA, but we cannot assure youensure that an actionit will not be broughtinitiated in the future. Though provincial governments have primary regulatory authority over environmental matters, municipal and federal authorities also have authority competent to enact decrees and laws on environmental issues. Thus, municipalities can set policy on local environmental matters, such as waste management, while the federal government regulates inter-province environmental issues, such as transport of hazardous waste or environmental matters covered by international treaties.
In 2002, the National Congress approved federal Law No.N° 25,612, Comprehensive Management of Industrial Residues and Service Activities (Gestión Integral de Residuos Industriales y de Actividades de Servicios(Comprehensive Management of Industrial Residues and Service Activities)) and Law No.N° 25,675, General Environmental Law (Ley General del Ambiente (General Environmental Law)) establishing minimum guidelines for the protection of the sustainable environmental management and the protection of biodiversity, applicable throughout Argentina. The law establishes the purposes, principles and instruments of the national environmental policy, the concept of “minimum guidelines,” the judicial purview and the rules governing environmental education and information, citizens’ participation and self-management, among other provisions.
Provincial governments within the Argentine territory have enacted laws establishing a framework for the preservation of the environment. Provincial laws that are applicable to industrial facilities at EDASA, among others are Law No.N° 7,343 of the Province of Córdoba and its supplemental N°. 10208 10,208 since 2014, Law No.N° 11,459 of the Province of Buenos Aires and Environmental Code N° 54395,439 of the Chubut province. These laws contain principles on environmental policy and management, as well as rules on environmental impact assessment.
They also give certain agencies jurisdiction over environmental issues.
Almost all provinces as well as many municipalities have established rules regarding the use of water, the sewage system and the disposal of liquids into underground flows of water or rivers. There are currently no claims pending against EDASA related to these rules, whose violation normally results in a fine.
Paraguay
The environmental framework comprises several national and local environmental regulations. The Paraguayan Constitution of 1992 states that everyone has the right to live in a healthy and ecologically balanced environment and has the obligation to preserve it. All damage caused to the environment will carry the obligation to repair and compensate.
Considered the “mother of environmental law” in the country, Law 1561/00 chartered the three primary environmental agencies in Paraguay. These are: The Ministry of the Environment and Sustainable Development of Paraguay (SecretaríaMinisterio del Ambiente y Desarrollo Sostenible (SEAM or the“MADES”), National Environmental Department), Council (Consejo Nacional del Ambiente (CONAM or the“CONAM”), and National Environmental Counsel), and System (el Sistema Nacional del Ambiente (SISNAM or National Environmental System)“SISNAM”). The Law establishes the authority and responsibility of these agencies to develop and oversee the national environmental policy.
Of
The Ministry of the three, the SEAMEnvironment and Sustainable Development is the main environmental institutionbody responsible for the development and implementation of national environmental laws and it is also the authority responsible for implementing most of the national
environmental regulations and for monitoring their compliance. The SEAM can apply sanctions, including: warnings, temporary or permanent suspension of authorizations or concessions, confiscations and/or fines. These penalties are applicable regardless of other civil or criminal sanctions or of the revocation of the environmental authorizations granted by SEAM. The CONAM is responsible for investigating and establishing the main goals in the environmental policies, which the SEAMMADES must then implement. The SISNAM is integrated by several bodies, including governmental and municipal agencies and private sector stakeholders, all interested in solving environmental issues. The SISNAM provides a discussion forum for the public and private sectors to work together collectively, developing ideas and plans to promote a sustainable development.
Environmental Impact: Law 294/93 states the rights and obligations that will be triggered by any damage caused to the environment and provides the obligation to restore the environment to its previous state or, if that is technically impossible, to make a payment or provide compensation.
Water Resources Act of Paraguay: Law 3239/07 on water resources establishes the sustainable management of all waters (superficial, ground, atmospheric) and the territories that generate such waters, regardless of their location, physical condition or natural occurrence within the Paraguayan territory, in order to make it socially, economically and environmentally sustainable for the people living in the territory of Paraguay. The supervising agency is the SEAM.Ministry of Environment and Sustainable Development. Superficial and ground waters are property of the State’s public domain. The law establishes the following order of priority for the use of water: i) fulfillment of the needs of aquatic ecosystems; ii) social use within the home environment; iii) use and enjoyment for agricultural activities, including aquaculture; iv) use and utilization for power generation; v) use and enjoyment for other industrial activities and vi) use and enjoyment for other activities. The use of water for productive purposes is subject to the authorization granted by the State through a permit (for the use of small amounts of water) or through concessions (prior public bidding process), in both cases after the payment of applicable fees. Authorizations may be revoked based on the occurrence of situations contemplated under the law. Concessions may be expropriated for public benefit or be terminated in certain situations established by the law. In addition, a National Registry of Water Resources has been created to keep record of all individuals or legal entities that utilize water resources or engage in activities related to them.
C.ORGANIZATIONALSTRUCTURE
| C. | ORGANIZATIONAL STRUCTURE |
The following chart presents ina summary formof our direct and indirect ownership interests in our subsidiaries and affiliates:associated companies:
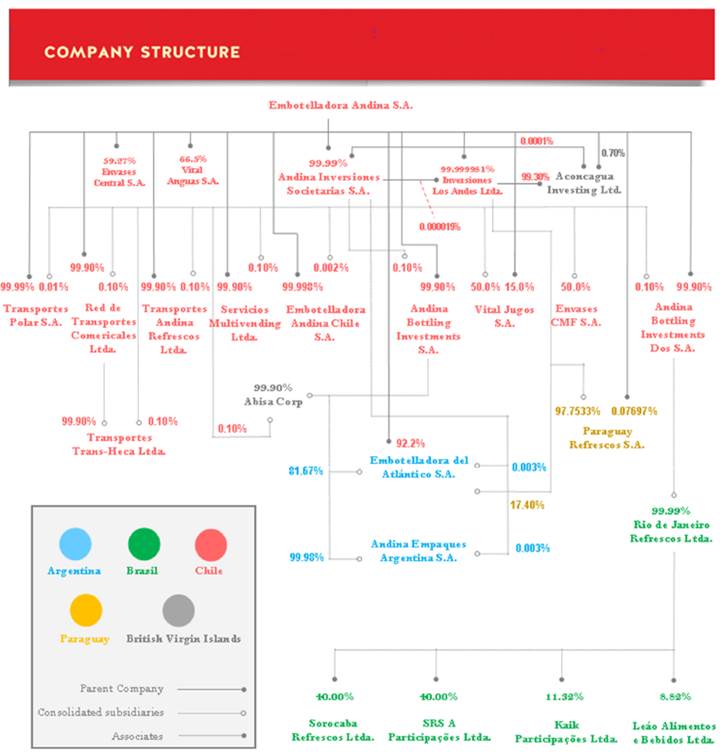
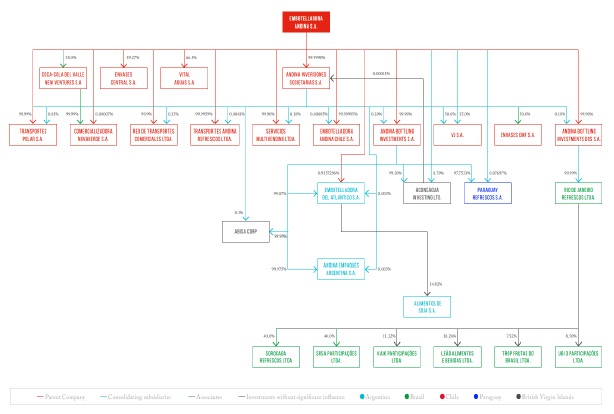
The following tablestable presents information relating to the main activities of our subsidiaries and affiliates,associated companies, as well as our direct and indirect ownership interests in them as of the date of the preparation of this document:
Subsidiary | Activity | Country of | Percentage | |||
Embotelladora Andina Chile S.A.(1) | Manufacture, bottle, distribute, and commercialize non-alcoholic beverages. | Chile | 99.99 | |||
| Manufacture, distribute, and commercialize all kinds of food products, juices, and beverages. | Chile | 65.00 | |||
Vital Aguas S.A. | Manufacture, distribute, and commercialize all kinds of waters and beverages in general. | Chile | 66.50 | |||
Servicios Multivending Ltda. | Commercialize products through equipment and vending machines. | Chile | 99.99 | |||
Transportes Andina Refrescos Ltda. | Provide administrative services and management of domestic and foreign ground transportation. | Chile | 99.99 | |||
Transporte Polar S.A. | Provide administrative services and management of domestic and foreign ground transportation. | Chile | 99.99 | |||
Envases Central S.A. | Manufacture and packaging of all kinds of beverages and commercialize all kinds of packaging. | Chile | 59.27 | |||
Andina Bottling Investments S.A. | Manufacture, bottle and commercialize beverages and food in general. Invest in other companies. | Chile | 99.99 | |||
Andina Bottling Investments Dos S.A. | Carry out exclusively foreign permanent investments and lease all kinds of real estate. | Chile | 99.99 | |||
|
|
|
| |||
Andina Inversiones Societarias S.A. | Invest in all types of companies and commercialize food products in general. | Chile | 99.99 | |||
Comercializadora Novaverde S.A | Process and commercialize fruits, ice cream, vegetables and food in general, under the Guallarauco trademark. | Chile | 35.00 | |||
| Rio de Janeiro Refrescos Ltda. | Manufacture and commercialize beverages in general, powdered juices and other related semi-processed products. | Brazil | 99.99 | |||
Embotelladora del Atlántico S.A. | Manufacture, bottle, distribute, and commercialize non-alcoholic beverages. | Argentina | 99.99 | |||
| Andina Empaques Argentina S.A. (5) | Design, produce, and commercialize plastic products mainly packaging. | Argentina | 99.98 | |||
|
| Argentina |
| |||
Paraguay Refrescos S.A. | Manufacture, bottle, distribute, and commercialize non-alcoholic beverages. | Paraguay | 97.83 | |||
Abisa Corp. | Invest in financial | British Virgin Islands | 99.99 | |||
Aconcagua Investing Ltda. | Invest in financial | British Virgin Islands | 99.99 | |||
Red de Transportes Comerciales Ltda. | Provide administrative services and management of domestic and foreign ground transportation. | Chile | 99.99 | |||
|
|
|
|
|
|
|
| |||
Envases CMF S.A. | Manufacture, acquire and commercialize all types of containers and packaging; and provide bottling services. | Chile | 50.00 | |||
| Manufacture, distribute and commercialize all kinds of juices, waters and beverages in general. | Chile | 35.00 | |||
| Leão Alimentos e Bebidas Ltda. | Manufacture, bottle and commercialize beverages and food in general. Invest in other companies. | Brazil |
| |||
Trop Frutas do Brasil Ltda.(10) | Manufacture, commercialize and export natural fruit pulp and coconut water. | Brazil | 7.52 | |||
| Sorocaba Refrescos S.A. | Manufacture, bottle and commercialize beverages and food in general. Invest in other companies. | Brazil | 40.00 | |||
SRSA |
| Brazil | 40.00 | |||
Kaik Participações Ltda. | Invest in other companies with own resources. | Brazil | 11.32 | |||
| UBI 3 Participações Ltda | Invest in other companies with own resources. Purchase and sale of real estate investments and property management. | Brazil | 8.5 |
| (1) | At the extraordinary shareholders’ meeting held in 2011, the shareholders of Embotelladora Andina Chile S.A. agreed to increase its capital of the latter from Ch$10,000,000 (divided into 10,000 shares) to Ch$4,778,206,076 (divided into 4,778,206 shares). It was agreed |
| that the capital increase was to be subscribed and paid by the shareholder Embotelladora Andina S.A. through the contribution of movable goods and real estate property, which are identified in the minutes of the Shareholders’ Meeting. |
| (2) | Vital Aguas, Vital Jugos, and Envases Central, modified their percentage interests, due to the merger with Embotelladoras Coca-Cola Polar in 2012. |
| (3) | Companies incorporated during 2012, due to the merger with Embotelladoras Coca-Cola Polar S.A. |
| (4) | During the fourth quarter of 2013 Rio de Janeiro Refrescos Ltda. acquired Companhia de Bebidas Ipiranga, which was legally merged into this entity. |
| (5) | At the extraordinary general shareholders’ meeting held on November 1st, 2011, Embotelladora del Atlántico S.A. decided to divide part of its equity to form a new company, Andina Empaques Argentina S.A., for the purpose of developing the design, manufacture and sale of all kinds of plastic products or products derived from the industry for plastics, primarily in the packaging division. Accounting and tax effects began on January 1, 2012. |
| (6) | At the end of the fiscal year 2017, Embotelladora Andina S.A., indirectly through Embotelladora del Atlántico S.A. (EDASA) held an ownership interest of 12.96% (76,507,211 shares) in the stock capital of Alimentos de Soja S.A. On August 23, 2018, the capitalization of contributions made by the shareholders in 2017 was approved. As a result of such capitalization, EDASA maintained its ownership percentage (84,692,875 shares). In August 2018, EDASA acquired 8,849,363 shares from the shareholder Salta Refrescos S.A., according to the volume quotas, and as a result the ownership interest of EDASA increased to 14.30% (93,542,238 shares). Additionally, in August and December 2018, two capital increases were approved for which EDASA's holding increased to 113,431,590 and then 130,449,895 shares, respectively, maintaining its ownership interest of 14.30%. |
| (7) | Companies created to facilitate the restructuring of the distribution process in Chile. |
| (8) | Coca-Cola del Valle New Ventures S.A. was incorporated during 2016. |
| (9) | During the first quarter of 2013, there was a reorganization of the companies that manufacture juice products and mate in Brazil, with the merger of Holdfab2 Participações Ltda. and Sistema de Alimentos de Bebidas Do Brasil Ltda. into a single company that is the legal continuing entity, namely Leão Alimentos e Bebidas Ltda. According to the current business scheme in Brazil for this company, during 2014 a 2.05% ownership interest held by Rio de Janeiro Refrescos Ltda. in Leão Alimentos e Bebidas Ltda. was sold to the rest of the bottlers’ system in Brazil. |
| (10) | As a result of company restructuring in 2016, Trop Frutas do Brasil Ltda, began to depend on the group of bottlers from The Coca-Cola System in Brazil, Rio de Janeiro Refrescos Ltda, holds a 7.52% direct ownership interest in that company. |
| (11) | In 2012, 40% of the Brazilian company Sociedad Brasilera Sorocaba Refrescos S.A. was acquired for a total price of R$146.9 million. |
(1) At the Extraordinary Shareholders’ Meeting held November 22, 2011, the shareholders of Embotelladora Andina Chile S.A. agreed to increase its capital of the latter from Ch$10,000,000 (divided into 10,000 shares) to Ch$4,778,206,076 (divided into 4,778,206 shares). It was agreed that the capital increase was to be subscribed and paid by the shareholder Embotelladora Andina S.A. through the contribution of movable goods and real estate property, which are identified in the minutes of the Shareholders’ Meeting. The Shareholders’ Meeting was reduced to public document on November 28, 2011, granted by the notary public of Santiago, Cosme Gomila.
(2) At the Extraordinary General Shareholders’ Meeting held November 1st 2011, Embotelladora del Atlántico S.A. decided to divide part of its equity to form a new company, Andina Empaques Argentina S.A., for the purpose of developing the design, manufacture and sale of all kinds of plastic products or products derived from the industry for plastics, primarily in the packaging division. Accounting and tax effects will begin on January 1st 2012.
(3) In October 2012, 40% of the Brazilian company Sociedad Brasilera Sorocaba Refrescos S.A. was acquired for a total price of 146.9 million Brazilian reais.
(4) Vital Aguas S.A., Vital Jugos S.A. and Envases Central S.A., modified their percentage interests, due to the merger with Embotelladoras Coca Cola Polar in 2012.
(5) During 2012 a capital increase was made for M$6,960,000, of which, Embotelladora Andina S.A. paid the M$2,380,320 according to its percentage of interests.
(6) Companies incorporated during 2012, due to the merger with Embotelladoras Coca Cola Polar S.A
(7) During the first quarter of 2013, there was a reorganization of the companies that manufacture juice products and mate in Brazil, with the merger of Holdfab2 Participações Ltda. and Sistema de Alimentos de Bebidas Do Brasil Ltda. into a single company that is the legal continuing entity, namely Leao Alimentos e Bebidas Ltda. According to the current business scheme in Brazil for this company, during 2014 a 2.05% ownership interest held by Rio de Janeiro Refrescos Ltda. in Leao Alimentos e Bebidas Ltda. was sold to the rest of the bottlers’ system in Brazil.
(8) Companies created to facilitate the restructuring of the distribution process in Chile.
(9) During the fourth quarter of 2013 Rio de Janeiro Refrescos Ltda. acquired Companhia de Bebidas Ipiranga, which was legally merged into this entity.
D.PROPERTY, PLANTS AND EQUIPMENT
| D. | PROPERTY, PLANTS AND EQUIPMENT |
We maintainown production plants in each of the principal population centers that comprise the franchise territories. In addition, we maintainown distribution centers and administrative offices in each of the franchise territories. We also use (i) facilities owned by third parties through lease agreements and (ii) facilities owned by third parties through contracts other than lease agreements, such as distribution contracts. The following table sets forth in square meters, our principal properties,real property (in square meters) and other facilities that we use in each of the franchise territories:
|
meters | Property | ||||||
ARGENTINA | ||||||||
Embotelladora del Atlántico S.A. | ||||||||
Azul | Distribution Center / Warehouses | 600 | Third Parties | |||||
| Bahía | Offices / Production of Soft Drinks / Distribution Center / Warehouses |
| 102,708 | Own | ||||
Bahía Blanca |
|
| 6,000 | Leased | ||||
| Commercial Office | 903 | Leased | |||||
| Bahía Blanca* | Real Estate (parking lot) | 73,150 | Own | |||||
| Bahía Blanca | Warehouses (M&F Palletizer -EDF deposit) | 1,400 | Leased | |||||
| Bariloche | Offices / Distribution |
| 1,870 | Leased | ||||
|
|
| 880 |
| Own | |||
| Commercial |
| 38 | Leased | ||||
Carlos Paz | Commercial Office | 270 | Leased | |||||
| Carmen de Patagones | Commercial |
| 1,600 | Leased | ||||
| Offices / Distribution |
| 25,798 | Own | ||||
Chivilcoy | Distribution Center / Warehouses | 1,350 | Third Parties | |||||
| Chivilcoy | Commercial Office | 72 | Leased | |||||
| Comodoro Rivadavia | Offices / Distribution |
| 7,500 | Leased | ||||
Concepcion del Uruguay | Commercial |
| 118 | Leased | ||||
Concordia |
|
| 1,214 | Leased | ||||
Có | Offices |
| 959,585 | Own | ||||
Córdoba (H.Primo) | Commercial |
| 1,173 | Leased | ||||
Córdoba (San Isidro)* | Deposit and Offices | 8,808 | Own | |||||
| Córdoba | Deposit (Rigar) | 8,800 | Leased | |||||
| Córdoba | Deposit (Ricardo Balbín) | 2,500 | Leased | |||||
| Coronel Suarez | Offices / Third party Distribution Center / Warehouses / Deposit | 1,000 | Leased | |||||
| General Pico* | Offices / Distribution |
| 15,525 |
| Own | |||
General | Distribution Center / Warehouses | 2,800 | Third Parties | |||||
| Gualeguaychu | Commercial Office / Warehouses | 2,392 | Leased | |||||
| Junín (Buenos Aires) | Cross Docking | 995 | Third Parties | |||||
| Junín (Buenos Aires) | Commercial Office | 108 | Leased | |||||
| Mendoza* | Offices / Distribution |
| 36,452 | Own | ||||
| Real Estate** | 300 | Own | |||||
| Neuquén* | Offices / Distribution |
| 10,157 |
| Own | |||
|
|
|
| |||||
| Offices / Distribution |
| 3,065 |
| Leased | |||
| MAIN USE | Square meters | Property | ||||||
|
|
| 318 |
| Leased | |||
| Offices / Distribution |
| 1,060 |
| Leased | |||
|
|
|
| |||||
|
|
|
| |||||
|
|
|
| |||||
| Offices / Cross Docking |
| 15,700 | Own | ||||
Puerto Madryn |
|
| 115 | Leased | ||||
| Distribution |
| 2,491 | Leased | ||||
| Offices / Distribution |
| 2,460 | Leased | ||||
Río IV* | Housing | 1,914 | Own | |||||
| Río IV* | Private Passageway | 5,170 | Own | |||||
| Río IV* | Cross Docking | 7,482 | Own | |||||
| Río IV |
|
| 93 |
| Leased | |||
|
|
| 800 |
| Own | |||
| Offices / Distribution Center / Warehouses / |
| 27,814 | Own | ||||
San Francisco | Commercial |
| 63 | Leased | ||||
San | Offices / Distribution |
| 48,036 | Own | ||||
San | Commercial Offices / Distribution |
| 5,205 | Own | ||||
San |
| 50 | Leased | |||||
| San Rafael | Commercial Office | 58 | Leased | |||||
| Santa Fe (Casilda) | Commercial Office | 40 | Leased | |||||
| Santa Fe | Commercial Office | 238 | Leased | |||||
| Santa Rosa | Distribution Center / Warehouses | 1,200 | Third Parties | |||||
| Santo Tomé* | Administrative Office / Distribution |
| 88,309 |
| Own | |||
|
|
|
| |||||
|
|
|
| |||||
|
|
|
| |||||
|
|
|
| |||||
| Offices / Production of Soft Drinks / Distribution Center / Warehouses |
| 51,000 | Own | ||||
Trelew | Warehouses | 1,500 | Leased | |||||
| Tres Arroyos |
|
| 1,548 | Leased | ||||
Ushuaia | Offices / Distribution |
| 1,360 | Leased | ||||
Ushuaia | Commercial |
| 94 | Leased | ||||
Venado Tuerto |
|
| 2,449 |
| Third Parties | |||
Villa Maria | Commercial |
| 125 | Leased | ||||
Villa Mercedes | Commercial |
| 70 | Leased | ||||
Andina Empaques Argentina S.A. | ||||||||
Buenos | Production of bottles, PET |
| 27,520 | Own | ||||
| Buenos Aires | Deposit adjoining the production plant | 1,041 | Leased | |||||
| Deposit adjoining the production plant | 940 | Leased | |||||
BRAZIL | ||||||||
| Rio de Janeiro Refrescos Ltda. | ||||||||
Jacarepaguá | Offices / Production of Soft Drinks / Distribution Center / Warehouses |
| 249,470 | Own | ||||
Duque de |
|
|
| |||||
|
|
|
| |||||
|
|
|
| |||||
|
|
|
| |||||
|
|
|
| |||||
|
|
| ||||||
|
|
|
| |||||
|
|
|
| |||||
|
|
|
| |||||
|
|
|
| |||||
|
|
|
| |||||
| Offices / Production of Soft Drinks / Distribution Center / Warehouses |
| 2,243,953 | Own | ||||
| Nova Iguaçu* | Distribution Center / Warehouses | 82,618 | Own |
| MAIN USE | Square meters | Property | ||||||
| Bangu* | Distribution Center | 44,389 | Own | |||||
| Campos* | Distribution Center | 36,083 | Own | |||||
| Cabo Frio* | Distribution Center** | 1,985 | Own | |||||
| São Pedro da Aldeia* | Distribution Center | 10,139 | Concession | |||||
| Itaperuna* | Cross Docking | 2,500 | Leased | |||||
| Caju* | Distribution Center | 4,866 | Own | |||||
| Caju* | Distribution Center | 8,058 | Own | |||||
| Caju* | Parking Lot | 7,400 | Leased | |||||
| Vitória (Cariacica)* | Distribution Center | 93,320 | Own | |||||
| Cachoeiro do Itapemirim * | Cross Docking |
| 8,000 | Leased | ||||
| Cross Docking |
| 1,500 | Leased | ||||
|
|
|
| |||||
Ribeirão Preto | Offices / Production of Soft Drinks / Distribution Center / Warehouses |
| 238,096 | Own | ||||
Ribeirão | Real Estate |
| 279,557 | Own | ||||
| Distribution |
| 32,500 | Own | ||||
| Distribution |
| 33,669 | Leased | ||||
| Distribution |
| 11,658 |
| Own | |||
|
|
| 69 |
| Own | |||
|
|
| 20,773 | Own | ||||
| Parking Lot | 6,400 | Concession | |||||
Itaipu* | Commercial Office | 750 | Leased | |||||
| Nova Friburgo* | Commercial Office / Cross Docking | 350 | Leased | |||||
| Guarapari* | Commercial Office | 218 | Leased | |||||
| Colatina* | Commercial Office / Cross Docking | 3,840 | Leased | |||||
| São Mateus* | Commercial Office / Cross Docking | 2,007 | Leased | |||||
| Rio das Ostras* | Commercial Office | 527 | Leased | |||||
| CHILE | ||||||||
| Embotelladora Andina S.A. | ||||||||
| Offices / Production of Soft Drinks / Distribution Center / Warehouses |
| 380,833 | Own | ||||
Renca* | Warehouses | 55,562 | Own | |||||
| Renca* | Warehouses | 11,211 | Own | |||||
| Renca* | Warehouses | 46,965 | Own | |||||
| Carlos | Distribution |
| 106,820 | Own | ||||
Puente Alto * | Distribution |
| 68,682 | Own | ||||
| Distribution |
| 45,833 | Own | ||||
| Warehouses | n/a | Leased | |||||
| Trailerlogistic (Metropolitan Region) | Warehouses | n/a | Leased | |||||
| Monster (Metropolitan Region) | Warehouses | n/a | Leased | |||||
| Rancagua* | Distribution |
| 25,920 | Own | ||||
San | Distribution |
| 19,809 | Own | ||||
| MAIN USE | Square meters | Property | ||||||
Antofagasta * | Offices / Production of Soft Drinks / Distribution Center / Warehouses |
| 34,729 | Own | ||||
|
|
|
| |||||
|
|
|
| |||||
|
|
|
| |||||
| Offices / Production of Soft Drinks / Distribution Center / Warehouses |
| 8,028 | Own | ||||
| Distribution |
| 10,700 | Own | ||||
| Distribution |
| 562 | Own | ||||
| Offices / Distribution |
| 31,383 | Own | ||||
| Distribution |
| 26,800 |
| Own | |||
| Distribution Center / Warehouses | 6,223 | Own | |||||
| Vallenar* | Distribution Center / Warehouses | 5,000 | Own | |||||
| Illapel | Distribution Center / Warehouses | n/a | Leased | |||||
| Punta Arenas* | Offices / Production of Soft Drinks / Distribution Center / Warehouses |
| 109,517 | Own | ||||
| Distribution |
| 5,093 | Own | ||||
Puerto Natales | Distribution |
| 850 | Leased | ||||
| ||||||||
| Offices / Production of Juices |
| 40,000 | Own | ||||
Vital Aguas S.A. | ||||||||
| Offices / Production of Waters |
| 573,620 | Own | ||||
Envases Central S.A. | ||||||||
| Offices / Production of Soft Drinks |
| 51,907 | Own | ||||
PARAGUAY | ||||||||
Paraguay Refrescos S.A. | ||||||||
San | Offices / Production of Soft Drinks / Warehouses |
| 275,292 | Own | ||||
Coronel | Offices / Warehouses |
| 32,911 | Own | ||||
Encarnació | Offices / Warehouses |
| 12,744 | Own | ||||
Ciudad del | Offices / Warehouses |
| 14,620 | Own | ||||
* Encumbrance free propertiesFree of encumbrance properties.
**Inactive: facilities that are not being use currently by the Company.
Leased: facilities owned by third parties, used by the Company through a lease agreement.
Third Parties: facilities owned by third parties, used by the Company through contracts other than lease agreements, such as distribution contracts.
Own: facilities owned by the Company.
Capacity by Line of Business
Set forth below is certain information concerning the installed capacity and approximate average utilization of our production facilities, by line of business.
|
| Year Ended December 31, |
| ||||||||||
|
| 2014 |
| 2015 |
| ||||||||
|
| Annual |
| Average |
| Capacity |
| Annual |
| Average |
| Capacity |
|
Soft drinks (millions of UCs): |
|
|
|
|
|
|
|
|
|
|
|
|
|
Chile |
| 320 |
| 52 |
| 68 |
| 319 |
| 52 |
| 65 |
|
Brazil |
| 405 |
| 72 |
| 74 |
| 386 |
| 67 |
| 70 |
|
Argentina |
| 341 |
| 60 |
| 72 |
| 347 |
| 62 |
| 72 |
|
Paraguay |
| 80 |
| 82 |
| 86 |
| 80 |
| 82 |
| 86 |
|
Other beverages (millions of UCs) |
|
|
|
|
|
|
|
|
|
|
|
|
|
Chile |
| 62 |
| 61 |
| 83 |
| 62 |
| 61 |
| 83 |
|
Brazil |
| 16 |
| 81 |
| 86 |
| 18 |
| 65 |
| 85 |
|
Argentina |
| 52 |
| 31 |
| 49 |
| 52 |
| 40 |
| 58 |
|
Paraguay |
| 23 |
| 75 |
| 88 |
| 23 |
| 75 |
| 88 |
|
PET packaging (millions of bottles) |
| 67 |
| 56 |
| 100 |
| 67 |
| 74 |
| 100 |
|
Preforms (millions of preforms) |
| 988 |
| 88 |
| 100 |
| 1,000 |
| 91 |
| 100 |
|
Plastic caps (millions of caps ) |
| 511 |
| 85 |
| 100 |
| 511 |
| 90 |
| 100 |
|
| Year Ended December 31, | ||||||||||||||||||||||||
| 2019 | 2020 | |||||||||||||||||||||||
| Annual Total Installed Capacity(1) | Average Capacity Utilization (%) | Capacity Utilization During Peak Month (%) | Annual Total Installed Capacity(1) | Average Capacity Utilization (%) | Capacity Utilization During Peak Month (%) | |||||||||||||||||||
| Soft drinks (millions of UCs): | ||||||||||||||||||||||||
| Andina Chile | 337 | 45 | 63 | 317 | 50 | 64 | ||||||||||||||||||
| Andina Brazil | 430 | 58 | 62 | 421 | 53 | 63 | ||||||||||||||||||
| Andina Argentina | 344 | 44 | 55 | 378 | 39 | 58 | ||||||||||||||||||
| Paraguay Refrescos | 118 | 45 | 59 | 128 | 39 | 57 | ||||||||||||||||||
| Other beverages (millions of UCs) | ||||||||||||||||||||||||
| Andina Chile | 22 | 50 | 72 | 22 | 54 | 61 | ||||||||||||||||||
| Andina Brazil | 45 | 47 | 42 | 56 | 43 | 54 | ||||||||||||||||||
| Andina Argentina | 105 | 25 | 36 | 117 | 15 | 24 | ||||||||||||||||||
| Paraguay Refrescos | 29 | 40 | 54 | 33 | 29 | 36 | ||||||||||||||||||
| ECSA/VJSA/VASA | 115 | 49 | 54 | 122 | 53 | 59 | ||||||||||||||||||
| PET packaging (millions of bottles) (2) | 46 | 42 | 60 | 46 | 38 | 66 | ||||||||||||||||||
| Preforms (millions of preforms) (2) | 968 | 67 | 93 | 860 | 64 | 85 | ||||||||||||||||||
| Plastic caps (millions of caps) (2) | 1,000 | 54 | 88 | 1,000 | 41 | 97 | ||||||||||||||||||
| Cases(2) | 0.7 | 68 | 100 | 0.7 | 59 | 100 | ||||||||||||||||||
(1) Total installed annual production capacity assumes production of the mix of products and containers produced in 2015.
| (1) | Annual Total Installed Capacity assumes production of the mix of products and containers produced in 2019 and 2020. Capacity calculation was standardized for all operations. Thus, calculation considers Overall Equipment Effectiveness budgeted for the years 2019 and 2020. |
| (2) | Andina Empaques Argentina only. |
In 2015,2020, we continued to modernize and renovate our manufacturing facilities in order to maximize efficiency and productivity. For instance, in Paraguay, in 2020 we finalized the investment of an in-line blowing machine, which made it possible to stop producing bottles in the old blowing plant (intermediate process) and to maximize the productive capacity of the PET OW line, since in the same line is performed blowing and filling. We also made significant improvements to our auxiliary services and complementary processes such as the investment of a new well in Renca, in order to ensure water treatment plants and effluent treatment stations. At present, we estimatesupply for the next 10 years, increasing extraction capacity by 25%. We believe we have the capacity in each of the franchise territories to meet consumer demand for each product format. Because bottling is a seasonal business with significantly higher demand during the South American summer and spring and because soft drinks are perishable, it is necessary for bottlers to carry significant over-capacity in order to meet the substantially greater seasonal demand. We assure the quality of our products through worldwide class practices and procedures maintaining quality control laboratories and structures in each production facility where raw materials are tested and where we analyze samples of our products.
As of December 31, 2015,2020, we had total installed annual production capacity, including soft drinks, fruit juices, and water, of 1,2991,594 million unit cases. Our primary facilities include:
| · | through Coca-Cola Andina, in the Chilean territory, three soft drink and other beverages production facilities with 23 production lines, with total installed annual capacity of 339 million unit cases (21.3% of our total installed annual capacity); |
· through Coca-Cola Andina, in the Chilean territory, four soft drink production facilities with ten production lines in Renca, four production lines in Antofagasta, three production lines in Coquimbo and two production lines in Punta Arenas with total installed annual capacity of 320 million unit cases (24.8% of our total installed annual capacity);
| · | through Vital Jugos in the Chilean territory, one fruit juice production facility, with 15 production lines, with total installed annual capacity of 32 million unit cases (2.0% of our total installed annual capacity); |
| · | through Envases Central in the Chilean territory, one fruit juice production facility, with 2 production lines, with total installed annual capacity of 46 million unit cases (2.9% of our total installed annual capacity); |
| · | through Vital Aguas in the Chilean territory, one mineral water production facility, with 2 production lines, with total installed annual capacity of 44 million unit cases (2.8% of our total installed annual capacity); |
| · | through Rio de Janeiro Refrescos in the Brazilian territory, three soft drink and other beverages production facilities with 19 production lines for soft drinks with total installed annual capacity of 421 million unit cases (26.4% of our total installed annual capacity); and 11 production lines for juices, tea and water which satisfy the franchise’s needs and re-sales to other Bottlers in Brazil, with total installed annual capacity of 56 million unit cases (3.5% of our total installed annual capacity); |
| · | through Embotelladora del Atlántico in the Argentine territory, three soft drink and other beverages production facilities with 17 production lines for soft drinks with a total installed annual capacity of 378 million unit cases (23.7% of our total installed annual capacity); four production lines for juices that covers the needs of our franchise, and one production line for waters and sensitive products with a total installed annual capacity of 117 million unit cases (7.3% of our total installed annual capacity); |
| · | through Andina Empaques Argentina S.A. in the Argentine territory, one production facility for bottles, preforms and plastic caps that covers the needs of the Coca-Cola system in that country. It has 13 preform injectors, two bottle blowers, two injectors for plastic caps and one production line for cases, with a total installed annual capacity of 1,097 million units considering PET bottles, preforms, plastic caps and cases; |
· through Vital Jugos in the Chilean territory, one fruit juice production facility, with sixteen production lines, with total installed annual capacity of 41 million unit cases (3.2% of our total installed annual capacity);
| · | through PARESA in the Paraguayan territory, one production facility located in San Lorenzo, with seven soft drink and other beverages production lines with a total installed annual capacity of 143 million unit cases (9.0% of our total installed annual capacity); and three tetra pack lines with a total installed annual capacity of 18 million unit cases (1.1% of our total installed annual capacity). |
· through Vital Aguas in the Chilean territory, one mineral water production facility, with four production lines, with total installed annual capacity of 21 million unit cases (1.6% of our total installed annual capacity);
· through Rio de Janeiro Refrescos in the Brazilian territory, three soft drink production facilities with twenty-five production lines with total installed annual capacity of 386 million unit cases (30.0% of our total installed annual capacity); and five production lines for juices and tea which satisfy the franchise’s needs and re-sales to other Bottlers in Brazil, with total installed annual capacity of 18 million unit cases (1.4% of our total installed annual capacity);
· through Embotelladora del Atlántico in the Argentine territory, three soft drink production facilities with sixteen production lines with a total installed annual capacity of 347 million unit cases (27.0% of our total installed annual capacity); and two facilities for the production of juices with four production lines that covers the needs of our franchise with a total installed annual capacity of 17 million unit cases (1.3% of our total installed annual capacity), and one production line for waters and sensitive products with a total installed annual capacity of 35.3 million unit cases (2.7% of our total installed annual capacity);
· through Andina Empaques Argentina S.A. in the Argentine territory one production facility for bottles, preforms and plastic caps that covers the needs of the Coca-Cola system in that country. It has 13 preform injectors, three bottle blowers, 1 injector for plastic caps and one production line for cases, with a total installed annual capacity of 1,579 million units considering PET bottles, preforms, plastic caps and cases.
· through Paresa in the Paraguayan territory, one production facility located in San Lorenzo, with eight production lines with a total installed annual capacity of 95 million unit cases (7.4% of our total installed annual capacity); and three tetra pack lines with a total installed annual capacity of 8 million unit cases (0.6% of our total installed annual capacity).
ITEM 4A.UNRESOLVED SECURITIES AND EXCHANGE COMMISSION STAFF COMMENTS
| ITEM 4A. | UNRESOLVED SECURITIES AND EXCHANGE COMMISSION STAFF COMMENTS |
Not applicable.
| ITEM 5. | OPERATING AND FINANCIAL REVIEW AND PROSPECTS |
ITEM 5.OPERATING AND FINANCIAL REVIEW AND PROSPECTS
| A. | OPERATING RESULTS 2020 |
A.OPERATING RESULTS
Results of Operations 2015
Overviewoperation
Set forth below is a discussion and analysis of our results of operationsoperation for the yearyears ended December 31, 2015 compared to the year ended December 31, 20142020, 2019 and 2013. 2018.
Our consolidated financial results for the years ended December 31, 20152020, 2019 and 20142018 include the results of our subsidiaries located in Chile, Brazil, (including full year operations of Ipiranga), Argentina and Paraguay. Our consolidated financial results for the year ended December 31, 2013 include the results of Ipiranga beginning October 11, 2013. Our consolidated financial statements reflect the results of the subsidiaries outside of Chile, converted into Chilean pesos (our functional and reporting currency) and are presented in accordance with IFRS. .
IFRS requires that assets and liabilities toof our subsidiaries outside of Chile be converted from the functional currency of each entity to the reportingpresentation currency (Chilean peso) at end of periodyear-end exchange rates, and that income and expense accounts to beare converted at themonthly average monthly exchange raterates for the month in which income or expense is recognized.they are recognized for those subsidiaries that do not operate in hyperinflationary economies.
Factors Affecting ComparabilityIn the case of our Argentine subsidiaries, which have been operating in an environment that during 2018, 2019 and 2020 was classified as hyperinflationary, the conversion criteria from the functional currency of those subsidiaries to our presentation currency is the following:
| · | First adoption of a hyperinflationary economy was in 2018: Losses and gains by correction of current non-monetary items the previous year are recorded in accumulated results as of January 1, 2018. |
On October 11, 2013, Andina Brazil consummated its acquisition of Ipiranga and we began consolidating
| · | The statement of financial position (balance sheet): Non-cash items are expressed in the current currency at the balance sheet date and translated to the presentation currency at the closing exchange rate. Losses and gains are included in net earnings (fiscal year income). |
| · | The income statement: Income statement items are expressed in the current currency unit at the end of the reporting period, using the variation of the general price index from the date on which the expenses and revenues were accrued, and translated to the presentation currency at closing exchange rate. |
| · | Cash flow statement: Cash flow statement items are expressed in the current currency unit at the end of the reporting period and translated to the presentation currency at closing exchange rate. |
For more information on the resultseffects of the operationshyper-inflationary environment in Argentina, see note 2.5 of Ipiranga into our consolidated financial statements asincluded herein.
The Impact of October 1, 2013. the Ongoing COVID-19 Pandemic
As a result of the impact that the ongoing COVID-19 pandemic is having across the world, including in the countries where we operate, we have taken measures necessary to protect the health and safety of our consolidated resultsemployees and to ensure the continuity of our operations. Among the measures we have taken are the following:
| · | the launch of a campaign to educate our employees on actions to be taken to avoid the spread of the virus; |
| · | sending home any employee that has been exposed to the virus; |
| · | implementation of additional cleaning protocols for our facilities; |
| · | modifying certain work practices and activities, without affecting our operational standards; for instance, home office has been implemented for those employees whose work can be performed remotely, and domestic and international traveling has been canceled; and |
| · | providing personal protection and cleaning products (including face masks and sanitizers) to those employees who need to keep working at our plants and distribution centers or in the transportation of our products. |
Beginning mid-March 2020, governments around the world, including in the countries where we operate, have adopted extraordinary measures to contain the spread of COVID-19 and reduce infection rates, including, in some cases, the closing of schools, universities, shopping centers, restaurants and bars, prohibiting social gathering events, issuing stay-at-home orders and establishing quarantine requirements, imposing additional sanitary requirements on exports and imports, and limiting international travel and closing borders. Governments in the countries where we operate have also announced economic stimulus programs for families and businesses, including in Argentina a temporary restriction on workforce reductions. These government measures are affecting our Company and our customers. As these measures become more restrictive or are extended in time, our Company’s priority will continue to be to protect the health and safety of our employees and to continue operating to serve our customers and communities in the best way we can. To date, our operations for the year ended December 31, 2015have not been required to close and 2014we are not aware of the virus affecting any significant part of our workforce.
As a result of the COVID-19 pandemic and government measures, we have experienced high volatility in our sales across channels. During the fourth quarter of 2020, in consolidated terms, we continue to experience a decrease (albeit to a lesser extent than in previous quarters) in our sales volumes in the on-premise channel, consisting mainly of restaurants and bars, which are currently able to operate but with capacity restrictions. We have also observed volume growth again in supermarkets, although marginal, with the traditional (mom & pops) and wholesale channels continuing to drive volume growth. Because the pandemic and the actions taken by governments change rapidly, we believe it is too early to make conclusions about changes in long-term consumption patterns, and how changes may affect our operational and financial results in the future.
Due to uncertainty regarding the evolution of the COVID-19 pandemic and government measures, including how long they will persist, we cannot predict the effect these trends will have on our financial performance. We believe that the Company will have no liquidity problems. To date, we also do not anticipate significant provisions or write-offs. Additionally, our investment plan for 2021 returns to pre-crisis investments levels (i.e., around US$160 – US$180 million). We continuously monitor our investment plans and we cannot assure you that we will fully comparable toabide by our consolidated resultscurrent plans, especially in the event of operationsa stronger flare-up of the virus in the countries in which we operate, or for December 31, 2013.some other unforeseen circumstance.
Summary of Results of Operations for the YearYears ended December 31, 20142019 and the Year ended December 31, 20152020
The following tables set forth our sales volume, net sales and gross profit for the yearyears ended December 31, 2013, compared to the year ended December 31, 20142018, 2019 and December 31, 2015:2020:
| Year ended December 31, | |||||||||||||||
|
| Year ended December 31, |
| 2019 | 2020 | ||||||||||
|
| 2013 |
| 2014 |
| 2015 |
| ||||||||
|
| (millions of unit cases(1)) |
| (millions of unit cases (1)) | |||||||||||
Sales volume: |
|
|
|
|
|
|
| ||||||||
Chile |
|
|
|
|
|
|
| ||||||||
Soft drinks |
| 174.4 |
| 168.5 |
| 165.5 |
| 158.2 | 153.8 | ||||||
Mineral water |
| 30.0 |
| 32.8 |
| 35.4 |
| 44.6 | 41.1 | ||||||
Juices |
| 30.3 |
| 30.3 |
| 32.8 |
| ||||||||
Beer |
| 0.1 |
| 0.1 |
| 0.0 |
| ||||||||
| Juices and other non-alcoholic | 36.1 | 33.9 | |||||||||||||
| Beer and Spirits | 0.6 | 7.5 | |||||||||||||
Total |
| 234.7 |
| 231.8 |
| 233.7 |
| 239.6 | 236.3 | ||||||
|
|
|
|
|
|
|
| ||||||||
Brazil |
|
|
|
|
|
|
| ||||||||
Soft drinks |
| 205.2 |
| 250.2 |
| 235.6 |
| 206.8 | 205.5 | ||||||
Mineral water |
| 6.2 |
| 5.4 |
| 6.4 |
| 11.5 | 17.9 | ||||||
Juices |
| 22.9 |
| 34.1 |
| 30.8 |
| ||||||||
| Juices and other non-alcoholic | 22.3 | 18.8 | |||||||||||||
Beer |
| 8.4 |
| 17.2 |
| 17.8 |
| 18.7 | 23.0 | ||||||
Total |
| 242.6 |
| 306.9 |
| 290.6 |
| 259.3 | 265.1 | ||||||
|
|
|
|
|
|
|
| ||||||||
Argentina |
|
|
|
|
|
|
| ||||||||
| Argentina(2) | |||||||||||||||
Soft drinks |
| 200.4 |
| 199.1 |
| 200.3 |
| 149.5 | 145.2 | ||||||
Mineral water |
| 18.0 |
| 21.7 |
| 24.4 |
| 18.9 | 12.0 | ||||||
Juices |
| 6.0 |
| 8.5 |
| 9.6 |
| ||||||||
| Juices and other non-alcoholic | 9.9 | 9.5 | |||||||||||||
Total |
| 224.4 |
| 229.4 |
| 234.2 |
| 178.2 | 166.7 | ||||||
|
|
|
|
|
|
|
| ||||||||
Paraguay |
|
|
|
|
|
|
| ||||||||
Soft drinks |
| 53.5 |
| 53.8 |
| 52.4 |
| 56.2 | 55.1 | ||||||
Mineral water |
| 4.4 |
| 5.5 |
| 5.6 |
| 7.9 | 6.5 | ||||||
Juices |
| 3.4 |
| 3.3 |
| 3.4 |
| ||||||||
| Juices and other non-alcoholic | 5.2 | 4.8 | |||||||||||||
Total |
| 61.2 |
| 62.5 |
| 61.4 |
| 69.3 | 66.4 | ||||||
(1)
| (1) | Unit cases refer to 192 ounces of finished beverage product (24 eight-ounce servings) or 5.68 liters. |
| (2) | Volumes by category in Argentina were reclassified in previous years to reflect comparable figures with 2020; however total volumes did not change. |
Note: Totals may not sum due to 192 ounces of finished beverage product (24 eight-ounce servings) or 5.69 litersrounding.
|
| Year ended December 31, |
| ||||||||||
|
| 2013 |
| 2014 |
| 2015 |
| ||||||
|
| Ch$ millions |
| % of Total |
| Ch$ millions |
| % of Total |
| Ch$ millions |
| % of Total |
|
Net sales: |
|
|
|
|
|
|
|
|
|
|
|
|
|
Chile |
| 477,918 |
| 31.4 |
| 492,072 |
| 27.4 |
| 514,733 |
| 27.4 |
|
Brazil |
| 491,861 |
| 32.3 |
| 715,728 |
| 39.8 |
| 607,048 |
| 32.3 |
|
Argentina |
| 441,229 |
| 29.0 |
| 461,003 |
| 25.7 |
| 627,258 |
| 33.4 |
|
Paraguay |
| 112,254 |
| 7.4 |
| 129,496 |
| 7.2 |
| 130,039 |
| 7.0 |
|
Inter-country eliminations(1) |
| (1,581 | ) | (0.1 | ) | (1,099 | ) | (0.1 | ) | (1,684 | ) | (0.1 | ) |
Total net sales |
| 1,521,681 |
| 100.0 | % | 1,797,200 |
| 100.0 | % | 1,877,394 |
| 100.0 | % |
| Year ended December 31, | ||||||||||||||||
| 2019 | 2020 | |||||||||||||||
| Ch$ millions | % of Total | Ch$ millions | % of Total | |||||||||||||
| Net sales: | ||||||||||||||||
| Chile | 608,952 | 34.2 | 644,762 | 38.0 | ||||||||||||
| Brazil | 619,321 | 34.8 | 580,063 | 34.2 | ||||||||||||
| Argentina | 394,636 | 22.2 | 318,828 | 18.8 | ||||||||||||
| Paraguay | 158,892 | 8.9 | 157,153 | 9.3 | ||||||||||||
| Inter-country eliminations (1) | (2,776 | ) | (0.2 | ) | (2,524 | ) | (0.1 | ) | ||||||||
| Total net sales | 1,779,025 | 100.0 | 1,698,281 | 100.0 | ||||||||||||
(1)
| (1) | Eliminations represent intercompany sales. |
Note: Totals may not sum due to rounding.
The following tables set forth our results of operations for the yearyears ended December 31, 2014 compared to the year ended December 31, 2015.2019 and 2020.
|
| Year ended December 31, |
| ||||||||||
|
| 2014 |
| 2015 |
| 2015 |
| ||||||
|
| Ch$ |
| % of net |
| Ch$ |
| % of |
| US$ |
| % of |
|
Net sales |
| 1.797.200 |
| 100.0 |
| 1,877,394 |
| 100.0 |
| 2,868 |
| 100.0 |
|
Cost of sales |
| (1.081.243 | ) | (60.2 | ) | (1,106,706 | ) | (58.9 | ) | (1,691 | ) | (58.9 | ) |
Gross profit |
| 715.957 |
| 39.8 |
| 770,688 |
| 41.1 |
| 1,177 |
| 41.1 |
|
Distribution, administrative and sales expenses |
| (529.184 | ) | (29.4 | ) | (555,092 | ) | (29.6 | ) | (848 | ) | (29.6 | ) |
Other (expense) income, net(2) |
| (89.385 | ) | (5.0 | ) | (85,856 | ) | (4.6 | ) | (131 | ) | (4.6 | ) |
Income taxes |
| (45.354 | ) | (2.5 | ) | (41,643 | ) | (2.2 | ) | (64 | ) | (2.2 | ) |
Net income |
| 52.034 |
| 2.9 |
| 88,098 |
| 4.7 |
| 135 |
| 4.7 |
|
(1) Conversion of U.S. dollar amounts, solely for the convenience of the reader.
(2) Includes other expenses, other income (expense), financial income, financial costs, share in profit of investees accounted under the equity method, foreign exchange gains (losses) and gains (losses) from indexed financial assets and liabilities.
| Year ended December 31, | ||||||||||||||||
| 2019 | 2020 | |||||||||||||||
| Ch$ millions | % of net sales | Ch$ millions | % of net sales | |||||||||||||
| Net sales | 1,779,025 | 100.0 | 1,698,281 | 100.0 | ||||||||||||
| Cost of sales | (1,048,344 | ) | (58.9 | ) | (1,022,499 | ) | (60.2 | ) | ||||||||
| Gross profit | 730,681 | 41.1 | 675,783 | 39.8 | ||||||||||||
| Distribution, administrative and sales expenses | (492,900 | ) | (27.7 | ) | (436,171 | ) | (25.7 | ) | ||||||||
| Other (expense) income, net (1) | (1,368 | ) | (0.1 | ) | (61,589 | ) | (3.6 | ) | ||||||||
| Income taxes | (61,167 | ) | (3.4 | ) | (54,905 | ) | (3.2 | ) | ||||||||
| Net income | 175,246 | 9.9 | 123,117 | 7.2 | ||||||||||||
|
| Chile |
| Brazil |
| Argentina |
| Paraguay |
| Eliminations |
| Total (1) |
| ||||||||||||
|
| 2014 |
| 2015 |
| 2014 |
| 2015 |
| 2014 |
| 2015 |
| 2014 |
| 2015 |
| 2014 |
| 2015 |
| 2014 |
| 2015 |
|
M Ch$ |
|
|
|
|
|
|
|
|
|
|
|
|
|
|
|
|
|
|
|
|
|
|
|
|
|
Net Sales |
| 492,072 |
| 514,733 |
| 715,728 |
| 607,048 |
| 461,003 |
| 627,258 |
| 129,496 |
| 130,039 |
| (1,099 | ) | (1,684 | ) | 1,797,200 |
| 1,877,394 |
|
Cost of sales |
| (296,894 | ) | (309,387 | ) | (440,655 | ) | (369,212 | ) | (265,288 | ) | (351,140 | ) | (79,505 | ) | (78,651 | ) | 1,099 |
| 1,684 |
| (1,081,243 | ) | (1,106,706 | ) |
Gross profit |
| 195,178 | �� | 205,345 |
| 275,073 |
| 237,836 |
| 195,715 |
| 276,118 |
| 49,990 |
| 51,389 |
| — |
| — |
| 715,956 |
| 770,688 |
|
Distribution, administrative and selling expenses |
| (138,718 | ) | (142,287 | ) | (190,272 | ) | (161,899 | ) | (165,267 | ) | (217,644 | ) | (29,832 | ) | (29,221 | ) |
|
|
|
| (524,089 | ) | (551,051 | ) |
Corporate expenses |
|
|
|
|
|
|
|
|
|
|
|
|
|
|
|
|
| — |
| — |
| (5,095 | ) | (4,040 | ) |
| (1) | Includes other expenses, other income (expense), financial income, financial costs, share in profit of investees accounted under the equity method, foreign exchange gains (losses) and gains (losses) from indexed financial assets and liabilities. |
| Chile | Brazil | Argentina | Paraguay | Eliminations | Total (1) | |||||||||||||||||||||||||||||||||||||||||||
| Millons Ch$ | 2019 | 2020 | 2019 | 2020 | 2019 | 2020 | 2019 | 2020 | 2019 | 2020 | �� | 2019 | 2020 | |||||||||||||||||||||||||||||||||||
| Net Sales | 608,952 | 644,762 | 619,321 | 580,063 | 394,636 | 318,828 | 158,892 | 157,153 | (2,776 | ) | (2,524 | ) | 1,779,025 | 1,698,281 | ||||||||||||||||||||||||||||||||||
| Cost of sales | (359,466 | ) | (392,720 | ) | (384,839 | ) | (373,445 | ) | (214,447 | ) | (172,066 | ) | (92,368 | ) | (86,792 | ) | 2,776 | 2,524 | (1,048,344 | ) | (1,022,499 | ) | ||||||||||||||||||||||||||
| Gross profit | 249,486 | 252,041 | 234,482 | 206,618 | 180,189 | 146,762 | 66,524 | 70,361 | - | - | 730,681 | 675,783 | ||||||||||||||||||||||||||||||||||||
| Distribution, administrative and sales expenses | (161,508 | ) | (160,876 | ) | (144,297 | ) | (117,623 | ) | (148,150 | ) | (120,729 | ) | (34,073 | ) | (31,516 | ) | - | - | (488,028 | ) | (430,744 | ) | ||||||||||||||||||||||||||
| Corporate expenses | - | - | - | - | - | - | - | - | - | - | (4,872 | ) | (5,427 | ) | ||||||||||||||||||||||||||||||||||
| (1) | Totals may not sum due to rounding. |
Net Sales
Our sales volume was 819.9734.6 million unit cases during the year ended December 31, 2015,2020, a 1.3%1.6% decrease compared to 830.6746.4 million unit cases during in 2014.2019, mainly explained by the volume decrease in the Argentine, Chilean and Paraguayan operations, and partly offset by the volume increase in the Brazilian operation. Volume for soft drinks decreased 2.3%1.9%, volume for waters decreased 6.6% and volume for juices and other non-alcoholic beverages decreased 2.9%,8.7% while beer and watersspirits increased 3.0% and 9.7%, respectively, in each case during the year ended December 31, 2015, compared to 2014.
Our net sales were Ch$1,877,394 million during the year ended December 31, 2015, a Ch$80,194 million, or 4.5% increase compared to Ch$1,797,200 million during 2014, principally as a result of (i) increased volume in Argentina and Chile and (ii) increased sales prices in Chile, Brazil, Argentina and Paraguay. This was partially offset by (i) a decrease in soft drink volume in Brazil and Paraguay, and (ii) currency conversions into Chilean pesos, resulting from a depreciation of the Brazilian real against the Chilean peso.
Soft drinks represented 76% of net sales during the year ended December 31, 2015, compared to 75% during 2014.
Chile
Our sales volume in Chile was 233.7 million unit cases during the year ended December 31, 2015, a 0.8% increase compared to 231.8 million unit cases during 2014. Volumes for soft drinks and juices in Chile decreased 0.2% and 0.7% respectively while volume for waters in Chile increased by 7.9%57.2%, in each case during the year ended December 31, 2015,2020 compared to 2014.2019. The increase of sales volume of beer is mainly due to (i) the new distribution agreement signed with AB InBev in Chile, beginning November 2020, and (ii) higher volume in Brazil. Excluding beer volume in Chile, resulting from the new agreement with AB InBev, sales volume would have decreased by 2.4% during the year.
Our net sales were Ch$1,698,281 million during the year ended December 31, 2020, a 4.5% decrease compared to Ch$1,779,025 million during 2019. Our net sales decreased mainly as a result of a decrease in sales in Argentina and Paraguay, and a negative effect upon translation of figures from our corporations in Brazil and Argentina. This was partially offset by higher sales in Chile, mainly as a result of higher sales volume, and higher average revenue per unit case sold.
Soft drinks represented 65.4% of net sales during the year ended December 31, 2020, compared to 67.9% during 2019.
Chile
Our sales volume in Chile was 236.3 million unit cases during the year ended December 31, 2020, a 1.3% decrease compared to 239.6 million unit cases during 2019. Volume for soft drinks, waters and juices and other non-alcoholic beverages in Chile decreased 2.8%, 7.9% and 6.1%, respectively, while volume for beer and spirits increased 1,063.6% in each case during the year ended December 31, 2020, compared to 2019. Excluding beer volume in Chile resulting from the new agreement with AB InBev, sales volume would have decreased by 3.7% during the year.
Our average market share for soft drinks in Chile during the year ended December 31, 2015,2020, according to A.C. Nielsen Company, was 69.3%65.2% (in terms of volume), compared to 68.5%66.7% for 2014,2019, and 71.3%68.3% (in terms of average sales), compared to 71.0%68.9% for 2014.2019. As a result of restrictions related to COVID-19, the surveying company changed the methodology and sample, therefore 2020 figures may not be fully completely comparable to prior periods.
Our net sales in Chile were Ch$514,733644,762 million during the year ended December 31, 2015,2020, a Ch$22,661 million, or 4.6%5.9% increase compared to Ch$492,072608,952 million during 2014,2019, which is explained mainly resulting fromby higher revenues per unit case, and partially offset by the aforementioned increase in volume sold.decrease.
Our net sales of soft drinks in Chile were Ch$375,993407,191 million during the year ended December 31, 2015,2020, a Ch$12,870 million, or 3.5% increase0.3% decrease when compared to Ch$363,123408,468 million in 2014, primarily2019, mainly as a result of the lower volume sold, and partially offset by higher revenues per unit case. Our net sales of water, juices and watersother non-alcoholic beverages in Chile were Ch$138,547173,459 million during the year ended December 31, 2015,2020, a Ch$9,599 million, or 7.4% increase5.6% decrease compared to Ch$128,948183,738 million during 2014,2019, primarily as a result of the lower volume sold, and partially offset by higher revenues per unit casecase. Our net sales of beer and higher volumes.spirits in Chile were Ch$64,111 million during the year ended December 31, 2020, a 282.8% increase compared to Ch$16,746 million during 2019, mainly as a result of the new distributing agreement with AB InBev, effective since November 2020.
Brazil
Our sales volume in Brazil was 290.6265.1 million unit cases during the year ended December 31, 2015,2020, a 5.3% decrease2.3% increase compared to 306.9259.3 million unit cases during 2014.2019. Volume for soft drinks and juices and other non-alcoholic beverages, in Brazil decreased 5.8%
0.6% and 15.7%, andrespectively, while volume for waters increased 19.1%, volume for juices decreased 9.6% and volume for beer increased 3.3%55.6% and 22.5%, respectively, in each case during the year ended December 31, 2015,2020 compared to 2014.2019. The increase of sales volume of water is mainly explained because the state of Rio de Janeiro was affected by the quality of the drinking water, particularly in the first quarter of 2020, translating into a sharp growth of our water sales volume.
Our average market share for soft drinks in Brazil, during the year ended December 31, 2015,2020, according to A.C. Nielsen Company, was 62.3%62.1% (in terms of volume), compared to 61.4%61.6% for 2014,2019, and 68.7%68.3% (in terms of average sales), compared to 68.0% for 2014.2019.
Our net sales in Brazil were Ch$607,048580,063 million during the year ended December 31, 2015,2020, a Ch$108,681 million, or 15.2%6.3% decrease compared to Ch$715,728619,321 million during 2014.2019.
Our net sales of soft drinks in Brazil were Ch$417,509317,713 million during the year ended December 31, 2015, a Ch$73,423 million, or 15.0%2020, an 11.9% decrease compared to Ch$490,931360,792 million during 2014, primarily as a result of conversion of figures, given the strong devaluation of the Brazilian real against the Chilean peso.2019. In local currency, theynet sales of soft drinks increased 3.6%2.2%, mainly because of higher revenue per unit case and partially offset by the lower volume sold. Our net sales of water and juices and other non-alcoholic beverages in Brazil were Ch$99,184 million during the year ended December 31, 2020, a 19.9% decrease compared to Ch$123,829 million during 2019. In local currency, net sales of water and juices and other non-alcoholic beverages decreased 8.5%, mainly because of a lower average revenue per unit case sold, and partially offset by the increase in volume sold. Our net sales of beer in Brazil were Ch$163,167 million during the year ended December 31, 2020, a 21.1% increase compared to Ch$134,701 million during 2019. In local currency, net sales of beer increased 40.7%, mainly as a result of higher revenuesvolume sold and a higher average revenue per unit case which was partially offset by a decrease in volume. Our net sales of juices, waters and beer in Brazil were Ch$189,539 million during the year ended December 31, 2015, a Ch$35,258 million, or 15.7% decrease compared to Ch$224,797 million during 2014, primarily as a result of conversion of figures, given the strong devaluation of the Brazilian real against the Chilean peso. In local currency, they increased 2.9%, mainly as a result of higher revenues per unit case which was partially offset by a decrease in volume.sold.
Argentina
Our sales volume in Argentina was 234.2166.7 million unit cases during the year ended December 31, 2015,2020, a 2.1% increase6.5% decrease compared to 229.4178.2 million unit cases during 2014.2019. Volume for soft drinks, waters and juices and other non-alcoholic beverages in Argentina increased 0.6%decreased 2.8%, volume for juices increased by 13.1%36.7% and volume for waters increased 12.1%3.5%, in each caserespectively, during the year ended December 31, 2015,2020 compared to 2014.2019. The decrease of sales volumes is explained by the negative macroeconomic environment faced by the country during 2020.
Our average market share for soft drinks in Argentina during the year ended December 31, 2015,2020, according to A.C. Nielsen Company, was 61.6%61.5% (in terms of volume), compared to 61.4%62.9% for 2014,2019, and 67.6%71.2% (in terms of average sales), compared to 66.9%71.6% for 2014.20191. As a result of restrictions related to COVID-19, the surveying company changed the methodology and sample, therefore 2020 figures may not be fully comparable to prior periods.
Our net sales in Argentina were Ch$627,258318,828 million during the year ended December 31, 2015,2020, a Ch$166,255 million, or 36.1% increase19.2% decrease compared to Ch$461,003394,636 million during 2014,2019. This was mainly resulting from an increaseexplained by (i) the decrease in sales volume, (ii) lower average revenue per unit case sold, because of price controls, and prices.(iii) the negative effect of the conversion of results to Chilean pesos.
Our net sales of soft drinks in Argentina were Ch$523,461260,118 million during the year ended December 31, 2015,2020, a Ch$131,662 million, or 33.6% increase17.1% decrease compared to Ch$391,799313,866 million during 2014 primarily2019. In local currency, net sales of soft drinks decreased 9.9% in real terms, mainly as a result of higher revenuesa lower average price per unit case sold and higher volume which was partially offset by the devaluation of the Argentinean peso against the Chilean peso.decrease in volume. Our net sales of juices and other non-alcoholic beverages, waters and beer and spirits in Argentina were Ch$93,41049,818 million during the year ended December 31, 2014,2020, a Ch$31,876 million, or 51.8% increase29.8% decrease compared to Ch$61,53370,990 million during 2014, primarily as a result2019. In local currency, net sales of higher revenues per unit casejuices and higher volume which was partially offset byother non-alcoholic beverages, water and beer and spirits decreased 25.3% in real terms, mainly due to the devaluation of the Argentinean peso against the Chilean peso.previously mentioned decline in volumes.
Paraguay
Our sales volume in Paraguay was 61.466.4 million unit cases during the year ended December 31, 2015,2020, a 1.8%4.2% decrease compared to 62.569.3 million unit cases during 2014.2019. Volume for soft drinks, water and juices and other non-alcoholic beverages in Paraguay decreased 2.5%2.0%, while volume for juices increased 3.2%17.6% and volume for waters increased 1.9%7.6%, respectively, in each case during the year ended December 31, 2015,2020, compared to 2014.2019.
Our average market share for soft drinks in Paraguay during the year ended December 31, 2015,2020, according to A.C. Nielsen Company, was 66.3%76.5% (in terms of volume), compared to 61.7%73.4% for 2014,2019, and 72.8% (in81.3% in terms of average sales),sales, compared to 66.9%78.3% for 2014.2019 according to the same source. As a result of restrictions related to COVID-19, the surveying company changed the methodology and sample, consequently 2020 figures may not be fully comparable to prior periods.
Our net sales in Paraguay were Ch$130,039157,153 million during the year ended December 31, 2015,2020, a Ch$543 million, or 0.4% increase1.1% decrease compared to Ch$129.496158,892 million during 2014,2019, mainly resulting from increased prices,lower volume sold, and partially offset by the volume decrease.(i) higher revenues per unit case in local currency, and (ii) a positive effect upon translation of figures into Chilean pesos.
Our net sales of soft drinks in Paraguay were Ch$105,710126,058 million during the year ended December 31, 2015,2020, a Ch$870 million, or 0.8% decrease1.0% increase compared to Ch$106,579124,856 million during 2014,2019. In local currency, our net sales of soft drinks decreased 1.8%, primarily as a result of result of the devaluation of the Paraguayan guaraní against the Chilean peso. In local currency, they increased 1.0%, mainly as a result of higher revenues per unit case which wasdecrease in volume sold, partially offset by a decrease in volume.higher average revenue per unit case. Our net sales of water and juices and watersother non-alcoholic beverages in Paraguay were Ch$24,33031,095 million during the year ended December 31, 2015, a Ch$1,413 million, or 6.2% increase2020, an 8.6% decrease compared to Ch$22,91634,036 million during 2014,2019. In local currency, net sales of water and juices and other non-alcoholic beverages decreased by 11.3%, primarily as a result of higher revenues per unit case and higher volume, which was partially offset by conversion of the Paraguayan guaraní to Chilean pesos.lower volume.
Cost of Sales
Our cost of sales werewas Ch$1,106,7061,022,499 million during the year ended December 31, 2015,2020, a Ch$25,463 million, or 2.4% increase,2.5% decrease, compared to Ch$1,081,2431,048,344 million during 2014.2019. The cost of sales per unit case increased 3.7%decreased 0.9% in the same period. This increasedecrease was mainly due to (i) higher cost of concentrate, for which we are charged a percentage of ourthe sales by The Coca Cola Company,volume decrease in Argentina, Brazil and Chile; (ii) an increase in the percentage of distributed products (juices and waters) in our product mix in Brazil, which have a greater cost per unit case; (iii) an increase in labor costs, mainly in Argentina, (iv) the depreciation of the local currencies of Brazil, Chile and Paraguay, relative to(ii) the U.S. dollar, which increases our effectivelower cost of raw materials denominatedPET resin, and (iii) a shift in U.S. dollars; and (iv) increased depreciation of capital goods in Argentina .the soft drinks’ mix towards future consumption packaging which carry a lower unit cost. These effects were partially offset by (i) increased sales in the lowerbeer and spirits category in Chile, which carry a higher cost of sugar in Paraguayper unit case, and (ii) the decrease innegative effect of the costdepreciation of juicesthe Argentine peso, the Brazilian real, the Paraguayan guaraní and waters in Chile.the Chilean peso on our dollarized costs. Our cost of sales represented 58.9%60.2% of net sales for the year ended December 31, 2015,2020, compared to 60.2%58.9% for 2014.2019.
Chile
Our cost of sales in Chile was Ch$309,387392,720 million during the year ended December 31, 2015,2020, a Ch$12,493 million, or 4.2%9.3% increase compared to Ch$296.894359,466 million during 2014.2019. The cost of sales per unit case increased 3.4%10.7% in the same period. This increase was mainly due to (i) increased sales of the beer and spirits category, which carry a higher concentrate costs given price increases carried out andcost per unit case, (ii) the negative effect of the depreciation of the Chilean peso which has a negative impact on dollar denominated costs.our dollarized costs, and (iii) greater depreciation expenses. This was partially compensated forpartly offset by the decreasea shift in the cost of juices and waters.soft drinks’ mix from immediate to future consumption, which carries a lower average cost. Our cost of sales in Chile represented 60.1%60.9% of net sales in Chile for the year ended December 31, 2015,2020, compared to 60.3%59.0% for 2014.2019.
Brazil
Our cost of sales in Brazil was Ch$369,212373,445 million during the year ended December 31, 2015,2020, a Ch$71,443 million, or 16.2%3.0% decrease compared to Ch$440,655384,839 million during 2014.2019. The cost of sales per unit case decreased 11.5%5.1% in the same period. In local currency, total cost of sales increased 2.4%12.2%, mainly due to (i) increasedthe negative effect of the depreciation of the Brazilian real on our dollarized costs, of(ii) greater concentrate resulting from price increases carried out, (ii) an increase in our product mix of distributed products (mainly waters and beer), which have a greater cost per unit case;costs due to lower tax benefits, and (iii) the devaluation effectincrease of beer in the Brazilian Real over our costs expressed in US Dollars.sales mix, which carries a higher cost. Our cost of sales in Brazil represented 60.8%64.4% of net sales in Brazil for the year ended December 31, 2015,2020, compared to 61.6%62.1% for 2014.2019.
Argentina
Our cost of sales in Argentina was Ch$351,140172,066 million during the year ended December 31, 2015,2020, a Ch$85,852 million, or 32.4% increase19.8% decrease compared to Ch$265,288214,447 million during 2014.2019. The cost of sales per unit case increased 29.6%decreased 14.2% in the same period. In local currency total(in real terms, based on currency rates as of December 2020) cost of sales increased 35.7%. The increase in our cost of sales per unit case in local currency was decreased 12.7% mainly due to:to (i) higherlower sales volume, (ii) lower sugar costs, of concentrate explained by price increases; (ii) higher labor costs, mainly causedand (iii) lower PET resin costs. This was partly offset by the increase in real wages, and (iii) highereffect of the depreciation due to recent investments.
of the Argentine peso on our dollarized costs. Our cost of sales in Argentina represented 57.5%54.0% of net sales in Argentina for the year ended December 31, 2015,2020, compared to 57.5%54.3% for 2014.2019.
Paraguay
Our cost of sales in Paraguay was Ch$78,65186,792 million during the year ended December 31, 2015,2020, a Ch$855 million, or 1.1%6.0% decrease compared to Ch$79,50692,368 million during 2014.2019. Cost of sales per unit case increased 0.7%decreased 1.9% during the same period. This increase is explained by the effect of conversion of figures. In local currency, it experiencedcost of sales decreased 8.7%. This is mainly explained by (i) lower volume sold, (ii) a marginal increase,reduction in the price of PET resin, and (iii) lower repair and maintenance expenses, among other items, due to the effect of the devaluation of the Paraguay guaraní over our costs expressed in U.S. dollars, partially offset by the lower cost of sugar.savings plan implemented. Our cost of sales in Paraguay represented 60.5%55.2% of net sales in Paraguay for the year ended December 31, 2015,2020, compared to 61.4%58.1% for 2014.2019.
Gross Profit
Due to the factors described above, our gross profit was Ch$770,688675,783 million during the year ended December 31, 2015,2020, a Ch$54,732 million, or 7.6% increase7.5% decrease compared to Ch$715,956730,681 million during 2014.2019. Our gross profit represented 41.1%39.8% of our net sales during the year ended December 31, 2015,2020, compared to 39.8%41.1% of our net sales in 2014.2019.
Distribution, administrative and sales expenses
We had distribution, administrative and sales expenses of Ch$555,092436,171 million during the year ended December 31, 2015, a Ch$25,908 million, or 4.9% increase2020, an 11.5% decrease compared to Ch$529,184492,900 million during 2014.2019. This increasedecrease in distribution, administrative and sales expenses, was mainly due to (i) increasedlower labor costs in Argentina, Chile and Brazil andacross our four segments, (ii) increased distribution costs in Argentina and Brazil. This was partially offset by lower marketing expenses in Brazilacross our four segments, and Chile.(iii) lower distribution costs due to lower sales volume. Our distribution, administrative and sales expenses represented 29.4%25.7% of our net sales during the year ended December 31, 2015,2020, compared to 29.2%27.7% for 2014.2019.
Chile
In Chile, our distribution, administrative and sales expenses were Ch$142,287160,876 million during the year ended December 31, 2015,2020, a Ch$3,569 million, or 2.6% increase0.4% decrease compared to Ch$138,718161,508 million during 2014. The increase in distribution, administrative and sales expenses in Chile2019. This was mainly due to increased(i) lower labor costs, which were 7% higher when compared to the previous year and (ii) lower advertising expenses. This effect was partially offset by (i) lower marketingother operating income classified under this item, and (ii) higher expenses which were 19% lower compared to the previous year.on uncollectible accounts and higher insurance expenses. Our distribution, administrative and sales expenses in Chile represented 27.6%25.0% of our net sales in Chile during the year ended December 31, 2015,2020, compared to 28.2%26.5% for 2014.2019.
Brazil
In Brazil, our distribution, administrative and sales expenses were Ch$161,899117,623 million during the year ended December 31, 2015, a Ch$28,372 million, or 14.9%2020, an 18.5% decrease compared to Ch$190,272144,297 million during 2014,2019. In local currency, they decreased 6.8%, mainly due to the effect of currency conversion. In local currency our distribution, administrative and sales(i) lower advertising expenses, increased 4.1% mainly due to increased(ii) lower labor costs, which were 6% higher when compared to the previous year, and higher(iii) lower distribution freight costs, which were 10% higher when compared to the previous year, which were partially offset by lower marketing expenses. Our distribution, administrative and sales expenses in Brazil represented 26.7%20.3% of our net sales in Brazil during the year ended December 31, 2015,2020, compared to 26.6%23.3% for 2014.2019.
Argentina
In Argentina, our distribution, administrative and sales expenses were Ch$217,644120,729 million during the year ended December 31, 2015, a Ch$52,377 million, or 31.7% increase2020, an 18.5% decrease compared to Ch$165,267148,150 million during 2014.2019. In local currency (in real terms, based on currency rates as of December 2020), the distribution, administrative and sales expenses increased 31.9%decreased 11.3%, mainly due to (i) lower labor costs and expenses for services provided by third parties, which grew below local inflation, (ii) lower advertising expenses, (iii) higher other operating income classified under this item, and (iv) the effect of local inflation over labor costs and costs for freight and third-party services.lower volumes on distribution expenses. Our distribution, administrative and sales expenses in Argentina represented 34.7%37.9% of our net sales in Argentina during the year ended December 31, 2015,2020, compared to 35.8%37.5% for 2014.2019.
Paraguay
In Paraguay, our distribution, administrative and sales expenses were Ch$29,22131,516 million during the year ended December 31, 2015,2020, a Ch$611 million, or 2.0%7.5% decrease, compared to Ch$29,83234,073 million during 2014.2019. The distribution, administrative and sales expenses in local currency in Paraguay deceased 0.3% since increaseddecreased 11.0%, which is mainly due to (i) lower advertising expenses, (ii) lower labor costs, which was 8% higher when compared to the previous year was offset by (i)(iii) greater other operating income classified under this item, and (iv) lower freight distribution which was 10%expenses due to lower compared to the previous year and (ii) lower marketing expenses which were 11% lower when compared to the previous year.volume sold. Our distribution, administrative and sales expenses in Paraguay represented 22.5%20.1% of our net sales in Paraguay during the year ended December 31, 2015,2020, compared to 23.0%21.4% for 2014.2019.
Other Income (Expense), Net
The following table sets forth our other income (expense), net for the year ended December 31, 20142019 and 2015:2020:
|
| Year Ended December |
| Year Ended December 31, | |||||||||
|
| 2014 |
| 2015 |
| 2019 | 2020 | ||||||
|
| (in millions of Ch$) |
| ||||||||||
|
|
|
|
|
| (in millions of Ch$) | |||||||
Other income (expense) |
| (19,014 | ) | (27,813 | ) | 14,767 | (9,074 | ) | |||||
Financial income |
| 8,656 |
| 10,118 |
| 45,156 | 14,946 | ||||||
Financial costs |
| (65,081 | ) | (55,669 | ) | (46,209 | ) | (54,773 | ) | ||||
Share of income (losses) from affiliated companies and joint business that are accounted for using the equity method |
| 1,191 |
| (2,328 | ) | (3,415 | ) | 2,229 | |||||
Exchange rate differences |
| (2,675 | ) | (2,856 | ) | (4,131 | ) | (3,088 | ) | ||||
Loss from differences in indexed financial assets and liabilities |
| (12,462 | ) | (7,308 | ) | ||||||||
| Gain (loss) from differences in indexed financial assets and liabilities | (7,536 | ) | (11,829 | ) | |||||||||
Other income (expense), net |
| (89,385 | ) | (85,856 | ) | (1,368 | ) | (61,589 | ) | ||||
We had other expenses, net, of Ch$85,85661,589 million during the year ended December 31, 2015,2020, a Ch$3,529 million, or 3.9% decrease4,401.7% increase compared to Ch$89,3851,368 million during 2014. This decrease was mainly influenced by decreased financial costs and decreased levels of financial indebtedness in Argentina and Brazil and the effect of conversion of figures given the depreciation of the Brazilian real against the Chilean peso, lower losses by adjustment units resulting from lower inflation levels in Chile during 2015 against 2014, which has a favorable impact on the debt indexed to Chilean inflation (Unidad de Fomento); these effects were partially offset by (i) the2019. The increase in other expenses, generatednet, is mainly from increased contingency provisionexplained by a decrease in financial income of Ch$30,210 million and a decrease in other income (expense) of Ch$23,841 million (both accounts were impacted in 2019 by the recognition of a tax credit in Brazil and (ii)its monetary restatement, which resulted in Ch$40,282 million in other income and by Ch$35,543 million in financial income (net of financial costs), respectively). In addition, there is an increase in financial costs of Ch$8,564 million mainly due to a new bond issuance in January 2020 (senior notes due 2050) and the item income from related companies, from recognizing losses from investment in Brazilian equity investees.costs of derivative instruments utilized for hedging purposes (bonds series B, C, D and E and new Bond due 2050).
Income Taxes
We had income taxes of Ch$41,64354,905 million during the year ended December 31, 2015,2020, a Ch$3,711 million, or 8.2%10.2% decrease compared to Ch$45,35461,167 million during 2014.2019. This decrease wasis mainly explained by the recognition of income tax resulting from differed tax estimatescredits from previous years recognized by the operation in Brazil in 2019, which involved an increase in income tax by Ch$25,780 million in that year. This decrease in income tax expenses was partially offset by the appreciation of the Chilean peso against the dollar (5.0%) which led to higher taxes derived from income due to the exchange rate variation. This effect was partially offset during 2015 by increased taxable income in the operations in Argentina and Brazil and increased deferred taxes due to exchange rate variations.differences.
Net Income
Due to the factors described above, we had a net income of Ch$88,098123,117 million during the year ended December 31, 2015,2020, a Ch$36,064 million, or 69.3% increase29.7% decrease compared to Ch$52,034175,246 million during 2014.2019. Our net income represented 4.7%7.2% of our net sales during the year ended December 31, 2015,2020, compared to 2.9%9.9% for 2014.2019.
Summary of Results of Operations for the YearYears ended December 31, 20132018 and the Year ended December 31, 20142019
The following tables set forth our sales volume, net sales and gross profit forFor information regarding the year ended December 31, 2012, compared to the year ended December 31, 2013 and December 31, 2014:
|
| Year ended December 31, |
| ||||
|
| 2012 |
| 2013 |
| 2014 |
|
|
| (millions of unit cases(1)) |
| ||||
Sales volume: |
|
|
|
|
|
|
|
Chile |
|
|
|
|
|
|
|
Soft drinks |
| 149.9 |
| 174.4 |
| 168.5 |
|
Mineral water |
| 16.8 |
| 30.0 |
| 32.8 |
|
Juices |
| 18.6 |
| 30.3 |
| 30.3 |
|
Beer |
| — |
| 0.1 |
| 0.1 |
|
Total |
| 185.4 |
| 234.7 |
| 231.8 |
|
|
|
|
|
|
|
|
|
Brazil |
|
|
|
|
|
|
|
Soft drinks |
| 197.8 |
| 205.2 |
| 250.2 |
|
Mineral water |
| 5.8 |
| 6.2 |
| 5.4 |
|
Juices |
| 16.2 |
| 22.9 |
| 34.1 |
|
Beer |
| 5.2 |
| 8.4 |
| 17.2 |
|
Total |
| 225.0 |
| 242.6 |
| 306.9 |
|
|
|
|
|
|
|
|
|
Argentina |
|
|
|
|
|
|
|
Soft drinks |
| 153.4 |
| 200.4 |
| 199.1 |
|
Mineral water |
| 9.8 |
| 18.0 |
| 21.7 |
|
Juices |
| 3.8 |
| 6.0 |
| 8.5 |
|
Total |
| 167.0 |
| 224.4 |
| 229.4 |
|
|
|
|
|
|
|
|
|
Paraguay |
|
|
|
|
|
|
|
Soft drinks |
| 16.5 |
| 53.5 |
| 53.8 |
|
Mineral water |
| 1.5 |
| 4.4 |
| 5.5 |
|
Juices |
| 0.8 |
| 3.4 |
| 3.3 |
|
Total |
| 18.8 |
| 61.2 |
| 62.5 |
|
(1) Unit cases refer to 192 ounces of finished beverage product (24 eight-ounce servings) or 5.69 liters
|
| Year ended December 31, |
| ||||||||||
|
| 2012 |
| 2013 |
| 2014 |
| ||||||
|
| Ch$ |
| % of |
| Ch$ |
| % of |
| Ch$ |
| % of |
|
Net sales: |
|
|
|
|
|
|
|
|
|
|
|
|
|
Chile |
| 374,873 |
| 32.0 |
| 477,918 |
| 31.4 |
| 492,072 |
| 27.4 |
|
Brazil |
| 451,597 |
| 38.5 |
| 491,861 |
| 32.3 |
| 715,728 |
| 39.8 |
|
Argentina |
| 315,336 |
| 26.9 |
| 441,229 |
| 29.0 |
| 461,003 |
| 25.7 |
|
Paraguay |
| 32,028 |
| 2.7 |
| 112,254 |
| 7.4 |
| 129,496 |
| 7.2 |
|
Inter-country eliminations(1) |
| (1,541 | ) | (0.1 | ) | (1,581 | ) | (0.1 | ) | (1,099 | ) | (0.1 | ) |
Total net sales |
| 1,172,293 |
| 100.0 | % | 1,521,681 |
| 100.0 | % | 1,797,200 |
| 100.0 | % |
(1) Eliminations represent intercompany sales.
The following tables set forth our results of operations for the years ended December 31, 2018 and December 31, 2019, See “Item 5. Operating and Financial Review and Prospects –A. Operating Results 2019 –Summary of Results of Operations for the years ended December 31, 2017, 2018 and 2019” in our Company’s annual report on Form 20-F for the fiscal year ended December 31, 2013 compared to the year ended December 31, 2014.
|
| Year ended December 31, |
| ||||||||||
|
| 2013 |
| 2014 |
| 2014 |
| ||||||
|
| Ch$ |
| % of net |
| Ch$ |
| % of |
| US$ |
| % of |
|
Net sales |
| 1,521,681 |
| 100.0 |
| 1.797.200 |
| 100.0 |
| 3,151 |
| 100.0 |
|
Cost of sales |
| (914,818 | ) | (60.1 | ) | (1.081.243 | ) | (60.2 | ) | (1,896 | ) | (60.2 | ) |
Gross profit |
| 606,864 |
| 39.9 |
| 715.957 |
| 39.8 |
| 1,255 |
| 39.8 |
|
Distribution, administrative and sales expenses |
| (435,579 | ) | (28.6 | ) | (529.184 | ) | (29.4 | ) | (928 | ) | (29.4 | ) |
Other (expense) income, net(2) |
| (58,051 | ) | (3.8 | ) | (89.385 | ) | (5.0 | ) | (157 | ) | (5.0 | ) |
Income taxes |
| (22,966 | ) | (1.5 | ) | (45.354 | ) | (2.5 | ) | (79 | ) | (2.5 | ) |
Net income |
| 90,267 |
| 5.9 |
| 52.034 |
| 2.9 |
| 91 |
| 2.9 |
|
(1) Conversion of U.S. dollar amounts, solely for the convenience of the reader.
(2) Includes other expenses, other income (expense), financial income, financial costs, share in profit of investees accounted under the equity method, foreign exchange gains (losses) and gains (losses) from indexed financial assets and liabilities.
|
| Chile |
| Brazil |
| Argentina |
| Paraguay |
| Eliminations |
| Total |
| ||||||||||||
|
| 2013 |
| 2014 |
| 2013 |
| 2014 |
| 2013 |
| 2014 |
| 2013 |
| 2014 |
| 2013 |
| 2014 |
| 2013 |
| 2014 |
|
M Ch$ |
|
|
|
|
|
|
|
|
|
|
|
|
|
|
|
|
|
|
|
|
|
|
|
|
|
Net sales |
| 477,918 |
| 492,072 |
| 491,861 |
| 715,728 |
| 441,229 |
| 461,003 |
| 112,254 |
| 129,496 |
| (1,581 | ) | (1,099 | ) | 1,521,681 |
| 1,797,200 |
|
Cost of sales |
| (283,988 | ) | (296,894 | ) | (308,359 | ) | (440,655 | ) | (250,551 | ) | (265,288 | ) | (73,500 | ) | (79,505 | ) | 1,581 |
| 1,099 |
| (914,818 | ) | (1,081,243 | ) |
Gross profit |
| 193,930 |
| 195,178 |
| 183,502 |
| 275,073 |
| 190,678 |
| 195,715 |
| 38,753 |
| 49,990 |
|
|
|
|
| 606,864 |
| 715,956 |
|
Distribution, administrative and selling expenses |
| (127,311 | ) | (138,718 | ) | (124,383 | ) | (190,272 | ) | (155,211 | ) | (165,267 | ) | (23,700 | ) | (29,832 | ) |
|
|
|
| (430,605 | ) | (524,089 | ) |
Corporate expenses |
|
|
|
|
|
|
|
|
|
|
|
|
|
|
|
|
|
|
|
|
| (4,975 | ) | (5,095 | ) |
Overview2019.
The Ipiranga acquisition was consummated on October 11, 2013 and their results are included in our consolidated results as of October 1, 2013. For this analysis we define “Organically” as without taking into account the M&A activity associated with the Ipiranga acquisition.
Net Sales
Our sales volume was 830.6 million unit cases during the year ended December 31, 2014, an 8.9% increase compared to 763.0 million unit cases during in 2013. Volume for soft drinks increased 6.0%, and volume for juices, beer and waters increased 21.8%, 104.3% and 11.9%, respectively, in each case during the year ended December 31, 2014, compared to 2013. Organically, our sales volume increased 0.7%, which was comprised of a 0.7% decrease in soft drinks volume, and increases in waters, juices and beer volumes of 10.5%, 6.4% and 4.0% respectively. The Ipiranga acquisition contributed 25.7 million unit cases in 2013 and 87.9 million unit cases in 2014.
Our net sales were Ch$1,797,200 million during the year ended December 31, 2014, a Ch$275,519 million, or 18.1% increase compared to Ch$1,521,681 million during 2013. Organically, our net sales increased 8.8%, principally as a result of (i) increased volume, mainly soft drinks in Argentina and waters in Chile and Argentina and (ii) increased prices in Brazil and Argentina, and partially offset by (i) a decrease in soft drink volume in Chile and Brazil and (ii) currency conversions into Chilean pesos, resulting from an appreciation of the Chilean peso against the Argentine peso.
Soft drinks represented 75% of net sales during the year ended December 31, 2014, compared to 79% during 2013.
Chile
Our sales volume in Chile was 231.8 million unit cases during the year ended December 31, 2014, a 1.3% decrease compared to 234.7 million unit cases during 2013. Volume for soft drinks in Chile decreased 3.3%, and volume for juices and waters in Chile increased by 0.2% and 11.9%, respectively, in each case during the year ended December 31, 2014, compared to 2013.
Our market share for soft drinks in Chile during the year ended December 31, 20134, according to A.C. Nielsen Company, was 68.5% (in terms of volume), compared to 67.6% for 2013, and 70.9% (in terms of average sales), compared to 70.0% for 2013.
Our net sales in Chile were Ch$492,072 million during the year ended December 31, 2014, a Ch$14,154 million, or 3.0% increase compared to Ch$477,918 million during 2013, mainly resulting from higher revenues per unit case and partially offset by the aforementioned decrease in volume sold.
Our net sales of soft drinks in Chile were Ch$363,123 million during the year ended December 31, 2014, a Ch$5,948 million, or 1.7% increase compared to Ch$357,175 million during 2013. Our net sales of juices and waters in Chile were Ch$128,948 million during the year ended December 31, 2014, a Ch$8,477 million, or 7.0% increase compared to Ch$120,472 million during 2013.
Brazil
Our sales volume in Brazil was 306.9 million unit cases during the year ended December 31, 2014, a 26.5% increase compared to 242.6 million unit cases during 2013. Volume for soft drinks in Brazil increased 21.9%, and volume for waters decreased 13.1%, volume for juices increased 49.2% and volume for beer increased 105.6% in each case during the year ended December 31, 2014, compared to 2013. Excluding the effect of our merger with Ipiranga, sales volumes increased 1.0% principally resulting from the 1.3% increase in soft drinks volume and the 7.3% increase in juices and 4.3% increase in beer, partially offset by the 30.5% decrease in the volume for waters. The low growth in soft drinks volume is principally due to (i) the unfavorable macroeconomic condition in Brazil; and (ii) food inflation above general inflation which reduced consumers’ purchasing power. The Ipiranga acquisition contributed 25.7 million unit cases in 2013 (when we incorporated only 4Q13 in our results) and 87.9 million unit cases in 2014 (when we incorporated results for the full year 2014).
Our market share for soft drinks in Brazil, excluding Ipiranga, during the year ended December 31, 2014, according to A.C. Nielsen Company, was 59.1% (in terms of volume), compared to 58.4% for 2013, and 66.6% (in terms of average sales), compared to 66.4% for 2013.
Our net sales in Brazil were Ch$715,728 million during the year ended December 31, 2014, a Ch$223,867 million, or 45.5% increase compared to Ch$491,861 million during 2013. Excluding the effect of the Ipiranga acquisition, which represented Ch$194,810 million, net sales in Brazil increased 17.7%, principally as a result of (i) higher revenues per unit case and (ii) the aforementioned volume increase. These effects where greatened by the effect of conversion of local currency to Chilean pesos resulting from a 5.6% appreciation of the Brazilian real against the Chilean Peso, based on the average exchange rate for the year ended December 31, 2014 compared with 2013.
Our net sales of soft drinks in Brazil were Ch$490,931 million during the year ended December 31, 2014, a Ch$131,431 million, or 36.6% increase compared to Ch$359,501 million during 2013. Our net sales of juices, waters and beer in Brazil were Ch$224,797 million during the year ended December 31, 2013, a Ch$92,436 million, or 69.8% increase compared to Ch$132,361 million during 2013.
Argentina
Our sales volume in Argentina was 229.4 million unit cases during the year ended December 31, 2014, a 2.2% increase compared to 224.4 million unit cases during 2013. Volume for soft drinks in Argentina decreased 0.7%, and volume for juices increased by 41.0% and volume for waters increased 21.0%, in each case during the year ended December 31, 2014, compared to 2013.
Our market share for soft drinks in Argentina during the year ended December 31, 2014, according to A.C. Nielsen Company, was 61.4% (in terms of volume), compared to 60.4% for 2013, and 66.6% (in terms of average sales), compared to 66.0% for 2013.
Our net sales in Argentina were Ch$461,003 million during the year ended December 31, 2014, a Ch$19,774 million, or 4.5% increase compared to Ch$441,229 million during 2013, mainly resulting from (i) increased volume; and (ii) increased prices, partially offset by currency conversion to Chilean Pesos, resulting from the 22.3% depreciation of the Argentine Peso against the Chilean Peso based on the average exchange rate for the year ended December 31, 2014, compared to 2013.
Our net sales of soft drinks in Argentina were Ch$391,799 million during the year ended December 31, 2014, a Ch$2.031 million, or 0.5% increase compared to Ch$389,768 million during 2013. Our net sales of juices and waters in Argentina were Ch$61,533 million during the year ended December 31, 2013, an Ch$16,187 million, or 35.7% increase compared to Ch$45,346 million during 2013.
Paraguay
Our sales volume in Paraguay was 62.5 million unit cases during the year ended December 31, 2014, a 2.1% increase compared to 61.2 million unit cases during 2013. Volume for soft drinks in Paraguay increased 0.5%, and volume for juices decreased by 4.4% and volume for waters increased 26.9%, in each case during the year ended December 31, 2014, compared to 2013.
Our market share for soft drinks in Paraguay during the year ended December 31, 20134, according to IPSOS ASI, was 62.1% in terms of volume, compared to 60.6% for 2013, and 70.1% in terms of average sales, compared to 69.0% for 2013.
Our net sales in Paraguay were Ch$129.496 million during the year ended December 31, 2014, a Ch$17,242 million, or 15.4% increase compared to Ch$112,254 million during 2013, mainly resulting from (i) increased volume; and (ii) increased prices, and (iii) local currency conversion to Chilean Pesos, resulting from the 10.6% appreciation of the Paraguayan Guarani against the Chilean Peso based on the average exchange rate for the year ended December 31, 2014, compared to 2013.
Our net sales of soft drinks in Paraguay were Ch$106,579 million during the year ended December 31, 2014, a Ch$12,266 million, or 13.0% increase compared to Ch$94,314 million during 2013. Our net sales of juices and waters in Paraguay were Ch$22,916 million during the year ended December 31, 2014, a Ch$4,977 million, or 27.7% increase compared to Ch$17,940 million during 2013.
Cost of Sales
Our cost of sales were Ch$1,081,243 million during the year ended December 31, 2014, a Ch$166,426 million, or 18.2% increase, compared to Ch$914,818 million during 2013. The cost of sales per unit case increased 8.6% in the same period. Excluding the effect of the Ipiranga acquisition, which represented Ch$130,012 million of our cost of sales in 2014 and Ch$35,044 million in 2013, our cost of sales increased 8.1% compared to 2013. This increase was mainly due to (i) an increase in the percentage of distributed products (juices and waters) in our product mix in Brazil and Chile which have a greater cost per unit case; (ii) an increase in labor costs, mainly in Argentina, Chile and Paraguay, (iii) the depreciation of the local currencies of Argentina, Chile and Brazil relative to the U.S. dollar, which increases our effective cost of raw materials denominated in U.S. dollars; (iv) increased depreciation of capital goods, corresponding to plant and equipment in Brazil and Paraguay and (v) higher cost of concentrate, for which we are charged a percentage of our sales by The Coca Cola Company, in Argentina, Chile and Brazil, due to price increases of our products. These effects were partially offset by the depreciation of the Argentinean peso with respect to the Chilean Peso, which reduces our costs upon conversion to Chilean Pesos and by the lower cost of sugar in Paraguay. Our cost of sales represented 60.2% of net sales for the year ended December 31, 2014, compared to 60.1% for 2013.
Chile
Our cost of sales in Chile was Ch$296.894 million during the year ended December 31, 2014, a Ch$12.906 million, or 4.5% increase compared to Ch$283,988 million during 2013. The cost of sales per unit case increased 5.9% in the same period. This increase was mainly due to (i) the depreciation of the Chilean peso which has a negative impact over dollarized costs, (ii) an increase in the mix of distributed products (juices and waters), which have a higher cost per unit case, (iii) higher concentrate costs given price increases carried out which explains 57% of the increase of cost of sales per unit case and (iv) higher labor costs in Chile, which explains 8% of the increase of cost of sales per unit cases. Our cost of sales in Chile represented 60.3% of net sales in Chile for the year ended December 31, 2014, compared to 59.4% for 2013.
Brazil
Our cost of sales in Brazil was Ch$440,655 million during the year ended December 31, 2014, a Ch$132,295 million, or 42.9% increase compared to Ch$308.360 million during 2013. The cost of sales per unit case increased 13.0% in the same period. Excluding the effect of the Ipiranga acquisition, which contributed Ch$130,012 million to our cost of sales during the year ended December 31, 2014, our cost of sales increased 8.1% (an increase of 12.5% per unit case) compared to 2013. In local currency and excluding the effect of the Ipiranga acquisition, cost of sales increased 8.0%, mainly due to (i) an increase in our product mix of distributed products (juices and waters), which have a greater cost per unit case, which explains 76% of the increase of the cost of sales per unit case; (ii) increased costs of concentrate resulting from price increases carried out which explains 17% of the increase of the cost of sales per unit case; and (iii) greater depreciation charges, which explains 11% of the increase of the cost of sales per unit case. These effects were partially offset by the lower cost of PET and labels, resulting from the shift in the product mix towards returnable formats and the conversion of local currency to Chilean Pesos, resulting from the 5.6% appreciation of the Brazilian Real against the Chilean Peso, based on the average exchange rate for the period ended December 31, 2014 compared to 2013. Our cost of sales in Brazil represented 61.6% of net sales in Brazil for the year ended December 31, 2014, compared to 62.7% for 2013.
Argentina
Our cost of sales in Argentina was Ch$265,288 million during the year ended December 31, 2014, a Ch$14,737 million, or 5.9% increase compared to Ch$250,551 million during 2013. The cost of sales per unit case increased 3.6% in the same period. In local currency total cost of sales increased 35.7%. The increase in our cost of sales per unit case in local currency was mainly due to: (i) higher costs of concentrate explained by price increases and higher volumes sold, which explains 29% of the increase of the cost of sales per unit case; (ii) increase in the product mix of juices and waters, which explains 16% of the increase of the cost of sales per unit case; (iii) higher labor costs, mainly caused by the increase in real wages, which explains 15% of the increase of the cost of sales per unit case; and (iv) higher depreciation due to recent investments, which explains 8% of the increase of the cost of sales per unit case. Our cost of sales in Argentina represented 57.5% of net sales in Argentina for the year ended December 31, 2014, compared to 56.8% for 2013.
Paraguay
Our cost of sales in Paraguay was Ch$79,506 million during the year ended December 31, 2014, a Ch$6,005 million, or 8.2% increase compared to Ch$73,500 million during 2013. Cost of sales per unit case increased 5.9% during the same period. This increase is explained by the effect of conversion of figures given the appreciation of the Paraguayan Guarani against the Chilean Peso. In local currency cost of sales decreased 2%, which is mainly explained by the lower cost of sugar which was 25% lower per unit case when compared to the previous year. This was partially offset by (i) greater depreciation charges and (ii) increased labor costs. Our cost of sales in Paraguay represented 61.4% of net sales in Paraguay for the year ended December 31, 2014, compared to 65.5% for 2013.
Gross Profit
Due to the factors described above, our gross profit was Ch$715,956 million during the year ended December 31, 2014, a Ch$109,093 million, or 18.0% increase compared to Ch$606,864 million during 2013. Our gross profit represented 39.8% of our net sales during the year ended December 31, 2014, while in 2013 it represented 39.9% of our net sales. Organically, our gross profit during the year ended December 31, 2014 was $651,158 million, representing 40.6% of our net sales, and a Ch$58,587 million, or 9.9% increase compared to 2013.
Distribution, administrative and sales expenses
We had distribution, administrative and sales expenses of Ch$529,184 million during the year ended December 31, 2014, a Ch$93,605 million, or 21.5% increase compared to Ch$435,579 million during 2013. Excluding the effect of the acquisition of Ipiranga, which represented Ch$50,225 million of our distribution, administrative and sales expenses in 2014, and Ch$14,293 million in 2013, our distribution, administrative and sales expenses increased 12.3% compared to 2013.
This increase in distribution, administrative and sales expenses, excluding the effect of the M&A activity, was mainly due to (i) increased distribution costs in the four countries where we operate; (ii) increased labor costs in the four countries; (iii) increased marketing expenses in the four countries and (iv) the effect of other operating income which is classified under this item and which was substantially higher in 2013 in Paraguay. Our distribution, administrative and sales expenses represented 29.4% of our net sales during the year ended December 31, 2014, compared to 28.6% for 2013.
Chile
In Chile, our distribution, administrative and sales expenses were Ch$138,718 million during the year ended December 31, 2014, a Ch$11,407 million, or 9.0% increase compared to Ch$127,311 million during 2013. The increase in distribution, administrative and sales expenses in Chile was mainly due to the effect of other operating income which is classified under the item and which were greater in 2013. Isolating this effect, distribution, administrative and sales expenses increased 7%, which is mainly explained by (i) higher distribution expenses, which were 14% higher when compared to the previous year and (ii) increased labor costs which were 7% higher when compared to the previous year. Our distribution, administrative and sales expenses in Chile represented 28.2% of our net sales in Chile during the year ended December 31, 2014, compared to 26.6% for 2013.
Brazil
In Brazil, our distribution, administrative and sales expenses were Ch$190,272 million during the year ended December 31, 2014, a Ch$65,889 million, or 53.0% increase compared to Ch$124,383 million during 2013. Excluding the effect of the Ipiranga acquisition, which represented Ch$50,225 million of our distribution, administrative and sales expenses in Brazil in 2014, our distribution, administrative and sales expenses in Brazil increased 21.4% compared to 2013. In local currency and excluding the effect of the Ipiranga acquisition, our distribution, administrative and sales expenses increased 13.8%, mainly due to (i) increased marketing expenses, which were 57% higher compared to the previous year; (ii) increased labor costs resulting from an increase in salaries, which were 11% higher when compared to the previous year; (iii) higher distribution costs, which were 10% higher when compared to the previous year. Our distribution, administrative and sales expenses in Brazil represented 26.6% of our net sales in Brazil during the year ended December 31, 2014, compared to 25.3% for 2013.
Argentina
In Argentina, our distribution, administrative and sales expenses were Ch$165,267 million during the year ended December 31, 2014, a Ch$10.056 million, or 6.5% increase compared to Ch$155,211 million during 2013. In local currency the distribution, administrative and sales expenses increased 36.1%, mainly due to (i) the effect of local inflation on labor costs, freight costs and services provided by third parties, (ii) higher distribution costs, which were 36% higher when compared to the previous year; and (iii) higher marketing expenses, which were 54% higher when compared to the previous year. Our distribution, administrative and sales expenses in Argentina represented 35.8% of our net sales in Argentina during the year ended December 31, 2014, compared to 35.2% for 2013.
Paraguay
In Paraguay, our distribution, administrative and sales expenses were Ch$29,832 million during the year ended December 31, 2014, a Ch$6,133 million, or 25.9% increase compared to Ch$23,700 million during 2013. The increase in distribution, administrative and sales expenses in local currency in Paraguay was mainly due to the effect of other operating income which is classified under the item and which was substantially greater in 2013. Isolating this effect, distribution, administrative and sales expenses increased 8% in local currency, which is mainly explained by (i) increased labor costs, which were 15% higher when compared to the previous year and (ii) increased freight distribution charges due to higher tariffs which were 11% higher compared to the previous year. Our distribution, administrative and sales expenses in Paraguay represented 23.0% of our net sales in Paraguay during the year ended December 31, 2014, compared to 21.1% for 2013.
Other Income (Expense), Net
The following table sets forth our other income (expense), net for the year ended December 31, 2013 and 2014:
|
| Year Ended December 31, |
| ||
|
| 2013 |
| 2014 |
|
|
| (in millions of Ch$) |
| ||
|
|
|
|
|
|
Other income (expense) |
| (25,335 | ) | (19,014 | ) |
Financial income |
| 4,973 |
| 8,656 |
|
Financial costs |
| (28,944 | ) | (65,081 | ) |
Share of income (losses) from affiliated companies and joint business that are accounted for using the equity method |
| 783 |
| 1,191 |
|
Exchange rate differences |
| (7,695 | ) | (2,675 | ) |
Loss from differences in indexed financial assets and liabilities |
| (1,833 | ) | (12,462 | ) |
Other income (expense), net |
| (58,051 | ) | (89,385 | ) |
We had other expenses, net, of Ch$89,385 million during the year ended December 31, 2014, a Ch$31,334 million, or 54.0% increase compared to Ch$58,051 million during 2013. This increase was mainly influenced by increased financial costs and loss generated on UF conversion, which resulted primarily from increased levels of financial indebtedness (basically due the financing of the acquisition of Ipiranga and other debt restructuring). The financing of the acquisition of Ipiranga consisted of an issuance of US$575 million in Yankee Bonds, which began to accrue interest from October 1, 2013. Additionally in April 2014 a UF 3 million local bond was issued, which add to the issuance of UF 5 million in local bonds issued in August of 2013.
Income Taxes
We had income taxes of Ch$45,354 million during the year ended December 31, 2014, a Ch$22,388 million, or 97.5% increase compared to Ch$22,966 million during 2013. This increase was mainly due to the effects of the tax reform in Chile, which increased the tax income line in Ch$ 23,335 million. On September 29, 2014, Chile enacted the Tax Reform Act. The Tax Reform Act introduced changes to the corporate tax rate, mandating a gradual increase of the rate from 20% to 25% or 27% in certain cases, the rules regarding minimum capitalization, and the taxation of Chilean investments abroad (the controlled-foreign-corporation rules), among others. The new rules are set to come into effect gradually, with the implementation process having commenced on October 1, 2014 and set to be completed by January 1, 2018.
On the other hand the effect of tax reductions in 2013 for Ch$14,055 million of deferred taxes with credit to 2013 income in our subsidiary, Rio de Janeiro Refrescos Ltda. This decrease was mainly due to the reversal of Ch$14,055 million of deferred tax liabilities in the subsidiary, Rio de Janeiro Refrescos Ltda. due to a new repatriation structure of earnings from Brazil, from a scheme based on dividends to a combination of interest returns on inter-company loans and dividends, in which the Company will not have to pay certain local taxes on earnings remitted to Chile, is offset by lower income taxes during 2014, resulting from the Company’s greater financial burden beginning 2014 tax year.
Net Income
Due to the factors described above, we had net income of Ch$52,034 million during the year ended December 31, 2014, a Ch$38,233 million, or 42.4% decrease compared to Ch$90,267 million during 2013. Our net income represented 4.2% of our net sales during the year ended December 31, 2014, compared to 5.9% for 2013.
Basis of Presentation
The aforementioned discussion should be read in conjunction with and is qualified in its entirety by reference to the Consolidated Financial Statements,consolidated financial statements, including the notes thereto.
These Financial Statementsconsolidated financial statements have been prepared in accordance with IFRS issued by the IASB.
These Financial Statementsfinancial statements reflect the consolidated financial position of Embotelladora Andina S.A. and its subsidiaries as of December 31, 20152020 and 20142019 as well as the operating results, changes in shareholders’ equity and cash flows for the years ended December 31, 2015, 20142020, 2019 and 2013,2018, all of which were approved by the board of directors on April 26, 2016.15, 2021.
Our consolidated financial results include the results of our subsidiaries located in Chile, Brazil, Argentina and Paraguay. Our subsidiaries outside Chile prepare their financial statements in accordance with IFRS and to comply with local regulations in accordance with generally accepted accounting principles of the country in which they operate. The Consolidated Financial Statementsconsolidated financial statements reflect the results of the subsidiaries outside of Chile, converted to Chilean pesos (functional and reporting currency of the parent company) and are presented in accordance with IFRS. The International Financial Reporting Standards requiresIFRS require that balances of subsidiaries be converted from their functional currency to the presentation currency (Chilean peso). The conversion for subsidiaries operating in non-hyperinflationary environments (Brazil and Paraguay) is performed by converting the assets and liabilities to be converted from the functional currency of each entity to the reporting currency (Chilean peso)subsidiaries at end of periodyear-end exchange rates, and income and expense accounts tomust be converted at themonthly average monthly exchange rate forrates of the month in which they are recognized. In the case of subsidiaries operating in hyperinflationary environments (Argentina), non-monetary assets and liabilities and income or expense is recognizedstatements are restated by the inflation rate of the hyperinflationary economy, bringing its effects to the income statement. These restated balances are converted from the functional currency to the presentation currency at the closing exchange rate of each year.
Critical Accounting Estimates
Discussion of critical accounting estimates
In the ordinary course of business, we have made a number of estimates and assumptions relating to the reporting of our results of operations and financial position in the preparation of financial statements in conformity with IFRS. We cannot assure you that actual results will not differ from those estimates. We believe that the following discussion addresses our most critical accounting policies, which are those that are most important to the portrayal of our financial condition and results of operations and require management’s most difficult, subjective and complex judgments, often as a result of the need to make estimates and assumptions about the effect of matters that are inherently uncertain. For a more detailed discussion of accounting policies significant to our operations, please see Note 2note 2.23 to our Consolidated Financial Statements.
Impairment of goodwill and intangible assets of indefinite useful life
The GroupCompany tests if goodwill and intangible assets of indefinite useful life have suffered impairment loss on an annual basis or whenever there are indicators of impairment. The recoverable amounts of cash generating units (“CGU”) are determined based on calculations of the value in use. The key variables that management calculates include the volume of sales, prices, marketing expenses and other economic factors. The estimation of these variables requires a material administrative judgment as those variables imply inherent uncertainties. However, the assumptions are consistent with our internal planning. Therefore, management evaluates, and updates estimates according to the conditions affecting the variables. If these assets are deemed to have become impaired, they will be written off at their estimated fair value or future recovery value according to discounted cash flows. Discounted free cash flows in the cash generating unit of the Parent Company in Chile as well as the subsidiaries in Brazil, Argentina and Paraguay generated greater values than their respective assets, including goodwill for the Brazilian, Argentine and Paraguayan subsidiaries.
The management of the Company understands that these discounted cash flows of the Company and subsidiaries are sensitive to many factors. The following further discusses the sensitivity of the most significant estimates in the value in use calculation: Discount Rate, Residual Cash Flows Growth Rate and EBITDA Margin
Discount Rate: The Comany used a weighted average cost of capital (WACC) in which each category of capital was proportionately weighted to obtain the discount rate. For each CGU we used a different discount rate, reflecting the specific risks related to its country’s and operation’s risk. To provide a more broader understanding of the effect of this variable on the valuation, changes in the discount rate of +/- 100 bps were applied. The result of this sensitivity analysis was that the value in use were greater than their respective recorded assets of each of the CGUs.
Residual Cash Flows Growth Rate: In the model it was assigned an specific growth rate to future residual cash flows (beyond 5 years projections) for each CGU. To have a better understanding of the effect of this perpetual growth rate on the valuations, changes in the growth rate on +/- 75 bps were applied for each of the CGU. As a result of this sensitivity analysis, the value in use were greater than their respective recorded assets of each of the CGUs.
EBITDA Margin: Given that cash flows from each CGU may vary from the original projections for different reasons, such as variations on volume of sales, on prices, on expenses and also on other economic factors, management decided to apply a sensitivity analysis based on the variation of EBITDA margin of each CGU. The variation range of margins was of +/-100 bps from the original EBITDA margin of each year projected (2021-2025) and perpetuity. The result of the sensitivity analysis was that the generated value in use were greater than their respective assets on each CGU.
Fair value of assets and liabilities
IFRS requires, in certain cases, that assets and liabilities be recorded at their fair value. Fair value is the amount at which an asset can be purchased or sold or the amount at which a liability can be incurred or liquidated in an actual transaction among parties duly informed under conditions of mutual independence, different from a forced liquidation.
The basis for measuring assets and liabilities at fair value are the current prices in the active market. Lacking such an active market, we estimate said values based on the best information available, including the use of models or other valuation techniques.
We estimated the fair value of the intangible assets acquired as a result of mergers and acquisitions based on the multiple period excess earning method, which implies the estimation of future cash flows generated by intangible assets, adjusted by cash flows that do not come from intangible assets, but from other assets.
For this, we estimated the time during which the intangible asset will generate cash flows, the cash flows themselves, cash flows from other assets and a discount rate.
Other assets acquired and implicit liabilities in the business combination are carried at fair value using valuation methods that are considered appropriate under the circumstances including the cost of depreciated recovery and recent transaction values for
comparable assets, among others. These methodologies require certain inputs to be estimated, including the estimation of future cash flows.
ProvisionAllowances for doubtful accountsexpected credit losses
We evaluate the possibility of collecting trade accounts receivablereceivables using several factors. WhenWe apply a simplified approach in calculating expected credit losses. Accordingly, we become aware ofdo not track changes in credit risk, but instead recognize a specific inability ofloss allowance based on lifetime expected credit losses at each reporting date. We have established a customer to fulfill its financial commitments, aprovision matrix that is based on our historical credit loss experience, adjusted for forward-looking factors specific provision for doubtful accounts is estimated and recorded, which reduces the recognized receivable to the amount that we estimate will ultimately be collected. In addition to specifically identifying potential uncollectible customer accounts, debits for doubtful accounts are accounted for based ondebtors and the recent history of prior losses and a general assessment of trade accounts receivable, both outstanding and past due, among other factors.economic environment.
Useful life, residual value and impairment of property, plant, and equipment
Property, plant, and equipment are recorded at cost and depreciated using the straight-line method over the estimated useful life of those assets. Changes in circumstances, such as technological advances, changes to our business model, or changes in our capital strategy might modify the effective useful lives compared to our estimates. Whenever we determine that the useful life of property, plant and equipment might be shortened, it depreciates the excess between the net book value and the estimated recoverable amount according to the revised remaining useful life. Factors such as changes in the planned use of manufacturing equipment, dispensers, and transportation equipment or computer software could make the useful lives of assets shorter. We review the impairment of long-lived assets each time events or changes in circumstances indicate that the book value of any of those assets might not be recovered. The estimate of future cash flows is based, among other things, on certain assumptions about the expected operating profits in the future. Our estimates of non-discounteddiscounted cash flows may differ from real cash flows because of, among other reasons, technological changes, economic conditions, changes in the business model, or changes in the operating profit. If the sum of non-discounteddiscounted cash flows that have been projected (excluding interest) is less than the carrying value of the asset, the asset will be written down to its estimated recoverable value.
Liabilities for bottle and case collateral
We have a liability for deposits received for bottles and cases provided to our customers and distributors. The liability represents the deposit value that we may be required to remit upon receipt from the customer or distributor of the bottles and cases, in good condition, along with the original invoice. The liability is not subject to price level restatements as per current agreements with customers and distributors. We estimate the liability for deposits based on a periodic inventory of bottles loaned to customers and distributors, estimates of bottles in circulation and a weighted average historical deposit value per bottle or case. Significant management judgment is involved in estimating the number of bottles in circulation, the deposit value that could be subject to redemption and the timing of disbursements related to this liability.
Impact of Foreign Currency Fluctuations
In accordance withPursuant to the methodology of conversion of IFRS, conversion methods,the assets and liabilities from Argentina,of the subsidiaries of Brazil and Paraguay and Brazil are converted from their functional currency (Argentine peso,(Brazilian real and Paraguayan guaraní and Brazilian real, respectively) to the reportingpresentation currency of the parentParent company (Chilean peso), at the end of periodclosing exchange rate, and income accounts at the exchange rate as of the date of theeach transaction or monthlyat the average exchange rate of each month in which these are performed. In the month when it took place.case of subsidiaries operating in hyperinflationary environments (Argentina, beginning in 2018), non-monetary assets and liabilities and income statements items are restated by the inflation rate of the hyperinflationary economy, bringing its effects to the income statement. These restated balances are converted from the functional currency to the presentation currency at the closing exchange rate of each year. The effects of conversionthese conversions are presented as other comprehensive income and do not affectaffecting the results forof the fiscal years ended as of December 31, 2015, 20142018, 2019 and 2013.2020. The conversion effects due to the currency conversion undertaken foreffect resulting from bringing assets and liabilities in accordance with(including the method previously explainedeffects of intercompany accounts designated as an integral part of the investment) from the functional currency to the presentation currency, according to the methodology described above, resulted in a decrease of other comprehensive income of Ch$106,153178,420 million during 2014 (net increasein 2020 (a net decrease of Ch$28,15032,402 million during 2014in 2019 and a net decrease of Ch$17,297 million during 2013). We also present under other comprehensive income the net effect as result of the restatement of Chilean pesos to U.S. dollars and other currencies to U.S. dollars resulting from the update of intercompany accounts that have designated as part of the Company’s investment, this effect resulted in a decrease of Ch$8,009 million during 2015 (increase of Ch$9269,597 million in 2014 and a decrease of Ch$675 million during 2013)2018).
In order to protect us from the effects on income resulting from the volatility of the Brazilian real and the Chilean peso against the U.S. dollar, we maintain derivative contracts (cross currency swaps) derivative to cover almost 100% of U.S. dollar-denominated financial liabilities.
By designating suchAdditionally, according to our currency hedge policy, we enter into forward contracts as hedging derivatives,on a monthly basis to protect against the effectsrisk of variation of the U.S. dollar against our local currencies, which has an impact on income for variations insome of our principal raw materials. Our balance sheets reflect these dollar forward contracts against the Argentine peso, the Brazilian real, the Chilean peso and the Brazilian real against the U.S. dollar, are mitigated annulling its exposure to exchange rate.Paraguayan guaraní.
In Chile, we use hedge agreements, to protect against foreign currency risk, which has an impact on our dollar denominated raw materials needs. The mark to market of these contracts wasare recorded in 2014 and 2013 according to the hedge accounting methodology outlined in IFRS standards, i.e., the valuation at fair value is carried to equity accounts, and when the effect on results of the hedged item occurs, the effects of derivatives contracts, are recycled from equity to operating results. For further information about the instruments we use to protect against foreign currency risk, see “Item 11. Quantitative and Qualitative Disclosures about Market Risk—Foreign Currency Risk.”Risk”.
Impact of Governmental Policies
| B. | LIQUIDITY AND CAPITAL RESOURCES |
Our business is dependent upon the economic conditions prevailing in our countries of operation. Various governmental economic, fiscal, monetary and political policies, such as those related to inflation or foreign exchange, may affect these economic conditions, and in turn may impact our business. These government policies may also affect investments by our shareholders.
For a discussion of political factors and governmental, economic, fiscal and monetary policies that could materially affect investments by U.S. shareholders as well as our operations, please refer to “Item 3. Key Information—Risk Factors” and “Item 10. Additional Information”
B.LIQUIDITY AND CAPITAL RESOURCES
Capital Resources, Treasury and Funding Policies
The products we sell are usually paid for in cash and short termor short-term credit, and therefore our main source of financing comes from the cash flow of our operations. This cash flow has been generally sufficient to cover the investments necessary for the normal course of our business, as well as the distribution of dividends approved at our General Shareholders’ Meeting. Nevertheless, in 2013 it was necessary to issue international bonds to finance the acquisition of the 100% stake of Ipiranga in Brazil for R$1,155 million (equivalent to Ch$261,245 million). Our net cash position diminished after the merger with Polar and the Ipiranga acquisition in part because Polar and Ipiranga previously had more debt when compared to Andina’s balance sheet.general shareholders’ meeting. Should additional funding be required for potential future investments in geographic expansion or other needs, theour main sources of financing are expected to consider are:be: (i) debt offerings in the Chilean and foreigninternational capital markets (ii) borrowings from commercial banks, both internationally and in the local markets where we have operations; and; (iii) public equity offerings.
Certain restrictions could exist to transfer funds amongfrom our operating subsidiaries. In 2013, 2014 and 2015, all cash flow generated by the subsidiary in Argentina was reinvested in the operation, and we did not receive dividends fromsubsidiaries to our subsidiary in Argentina. During 2013, 2014 and 2015,parent company, however during 2020, we received dividends from our subsidiaries in Argentina, Brazil and Paraguay. No assurance can be madeOn September 1, 2019, the Argentine government reinstated certain exchange restrictions. We cannot assure you that we will not face restrictions in the future regarding the distribution of dividends from our foreign subsidiaries.
Our management believes that we have access to financial resources to maintain our current operations and provide for our current capital expenditure and working capital requirements, scheduled debt payments, interest and income tax payments and dividendsdividend payments to shareholders.
The amount and frequency of future dividends to our shareholders will be determined at the General Shareholders’ Meetinggeneral shareholders’ meeting upon the proposal of our board of directors in light of our earnings and financial condition at such time, and we cannot assure you that dividends will be declared in the future. However, it should be noted that Chilean Corporate Law requires us to distribute at least 30% of any profits generated each year.
Our board of directors has been empowered by our shareholders to define our financing and investment policies. Our bylaws do not define a strict financing structure, nor do they limit the types of investments we may make. Traditionally, we have preferred to use our own resources to finance our investments.
Our general financing policy iscontemplates that each subsidiary should financefinances its own operations. From this perspective, each subsidiary’s management must focusfocuses on cash generation and should establish clear targets for operating income, capital expenditures and levels of working capital. These targets are reviewed on a monthly basis to ensure that their objectives are met. Should additional financing needs arise, either as a result of a cash deficit or to take advantage of market opportunities, our general policy is to prefer local financing to allow for natural hedging. If local financing conditions wereare not acceptable, because of costs or other constraints, Andina will provide financing, or our subsidiary could finance itself in a currency different than the local one.one, and will use derivative instruments to hedge against the operation’s functional currency.
Our cash surplusmanagement policy iscontemplates that Andina invests any cash surplussurpluses be invested in a portfolio of investment gradelow risk securities that are mainly short-term and easily liquidated assets until such time as our board of directors makes a final decision as to the disposition of the surplus.that this surplus should be needed.
Derivative instruments are utilized only for business purposes, and nevernot for speculative purposes. ForwardPursuant to our currency hedge policy, forward currency contracts are used in some operations to cover the risk of local currency devaluation relative to the U.S. dollar in an amount not greater than the budgeted purchases of U.S. dollar-denominated raw materials. Depending on market conditions, instead of forward currency contracts, from time to time we prefer to utilize our cash surplus to purchase raw materials in advance to obtain better prices and a fixed exchange rate.
Cash Flows from Operating Activities 2015 vs2020 vs. Cash Flows from Operating Activities 20142019 and 2018
Cash flows from operating activities during 20152020 amounted to Ch$264,909278,769 million compared to Ch$215,514255,148 million in 2014.2019. The increase in cash flow generation was mainly due to higher client collections, resulting from a better performance mainly fromlower payments to suppliers, lower tax payments and other cash outflows, partially offset by lower collections.
See “Item 5.Operating and Financial Review and Prospects –B. Liquidity and Capital Resources –Capital Resources, Treasury and Funding Policies”, in our Company’s annual report on Form 20-F for the Argentine operation.fiscal year ended December 31, 2019.
Cash Flows from Operating Activities 2014 vs Cash Flows from Operating Activities 2013
Cash flows from operating activities during 2014 amounted to Ch$215,514 million compared to Ch$172,085 million in 2013. The increase in cash flow generation was mainly due to higher client collections, resulting from the integration of Ipiranga for the whole year, partially offset by higher interest payments due to greater indebtedness entered into by the Company. Cash flows from operating activities without considering the merger with Ipiranga amounted to Ch$183,805 million.
Cash Flows from Investing Activities 2015 vs2020 vs. Cash Flows from Investing Activities 20142019 and 2018
Cash flows for investinginvestment activities (includes purchase and sale of property, plant and equipment, investmentequipment; investments in associated companiescompanies; and financial investments) amounted to Ch$103,131223,879 million in 20152020 compared to Ch$166,776110,048 million during 2014. During 2014 we made lower net investments2019. The increase in short and long term financial instruments.
The main item ofcash flow used in investing activities is the purchase of property, plant and equipment which decreased from Ch$114,217 million in 2014 to Ch$112,400 in 2015.
Cash Flows from Investing Activities 2014 vs Cash Flows from Investing Activities 2013
Cash flows for investing activities (includes purchase and sale of property, plant and equipment, investment in associated companies and financial investments) amounted to Ch$166,776 million in 2014 compared to Ch$447,550 million during 2013. In 2013 the Ipiranga acquisition represented a disbursement in the amount of Ch$261,245 million. The investment activities of Andina during 2013, without considering the effect of the acquisition of Ipiranga and the disbursements associated with its purchase, amounted to Ch$191.852 million.
The main item of investing activities is the purchase of property, plant and equipment which decreased from Ch$183,697 million in 2013 to Ch$114,217 million in 2014. In 2014, and without considering the effect of the merger with Ipiranga, Andina invested Ch$109,513 million. This figure is highly influencedmainly explained by greater purchases of short-term financial instruments partially offset by lower investment in property, plant and equipmentequipment.
See “Item 5.Operating and Financial Review and Prospects –B. Liquidity and Capital Resources –Capital Resources, Treasury and Funding Policies”, in Brazil and Paraguay, and by purchases of financial instruments which are not defined as cash and cash equivalents.our Company’s annual report on Form 20-F for the fiscal year ended December 31, 2019.
Cash Flows from Financing Activities 2015 vs2020 vs. Cash Flows from Financing Activities 20142019 and 2018
Our financingFinancing activities are directly related to dividend distributions to our shareholders, that recordgenerated a utilizationpositive cash flow of cash resources amounting to Ch$54,320113,041 million in 2020, increasing Ch$240,153 million compared to Ch$52,269 million during 2014, and borrowings from banks and payment of these loans,2019, which is mainly explained by a new bond issuance in order to finance these dividend payments and investments. As a result of our business’ seasonality, we generate greater cash flows during the summer months (December through March); therefore, during the winter season we may require short term financing in order to fulfill our dividend and investment commitments.January 2020 (Senior Notes due 2050).
As of December 31, 2015, we had available2020, 23 short-term credit lines inare available for an amount equivalent to Ch$198,144 million. The aggregate150,107 million, of which all of them are unused portion of such lines of credit at that date wasremain available. In Argentina, we had the equivalent toof Ch$126,398 million. Our unused sources of liquidity include four36,898 million in credit available from nine lines of credit.credit, which have not been used. In Brazil, we had the equivalent of Ch$88,513 million in credit available from 11 lines of credit, which remanined unused as of December 31, 2020. In Chile, we had the equivalent of Ch$15,0007,000 million in credit available from two separate lines. The unused portion of such linesone line of credit, at that date was equivalent to Ch$15,000 million. In Brazil, we had the equivalent of Ch$108,506 million in credit available from four lines. The unused portion of such lines of credit at that date was equivalent to Ch$39,530 million. In Argentina, we had the equivalent of Ch$67,536 million in credit available with ten lines. The unused portion of such lines of credit at that date was equivalent to Ch$64,766 million.which has not been used. In Paraguay, we had the equivalent of Ch$7,10217,696 million in credit available from one line. The unused portion of said linetwo lines of credit, at that date was equivalent to Ch$7,102 million.which have not been used.
Cash Flows from Financing Activities 2014 vs Cash Flows from Financing Activities 2013See “Item 5. Operating and Financial Review and Prospects –B. Liquidity and Capital Resources –Capital Resources, Treasury and Funding Policies”, in our Company’s annual report on Form 20-F for the fiscal year ended December 31, 2019.
Our financing activities are directly related to dividend distributions to our shareholders, that record a utilization of cash resources amounting to Ch$52,269 million in 2014 compared to Ch$73,041 million during 2013, and borrowings from banks and payment of these loans, in order to finance these dividend payments and investments. As a result of our business’ seasonality, we generate greater cash flows during the summer months (December through March); therefore, during the winter season we may require short term financing in order to fulfill our dividend and investment commitments.Liabilities
As of December 31, 2014, we had available short-term credit lines in an amount equivalent to Ch$320,113 million. The aggregate unused portion of such lines of credit at that date was equivalent to Ch$204,594 million. Our unused sources of liquidity include eight lines of credit. In Chile, we had the equivalent of Ch$16,738 million in credit available from five separate lines. The unused portion of such lines of credit at that date was equivalent to Ch$16,532 million. In Brazil, we had the equivalent of Ch$197,376 million in credit available with twenty one lines. The unused portion of such lines of credit at that date was equivalent to Ch$101,145 million. In Argentina, we had the equivalent of Ch$87,979 million in credit available with ten lines. The unused portion of such lines of credit at that date was equivalent to Ch$68,896 million. In Paraguay, we had the equivalent of Ch$18,020 million in credit available with two lines. The unused portion of such lines of credit at that date was equivalent to Ch$18,020 million.
Liabilities
For the year ended December 31, 2015,2020, our total liabilities, excluding non-controlling interest, were Ch$1,357,827 million;1,616,504 million, representing a 0.6%13.7% increase compared to December 31, 2014. The increase in total2019.
Current liabilities resulted principally from the restatement of public liabilities given currency indexation (Unidad de Fomento), partially offsetdecreased by decreased bank liabilities in Argentina. As of December 31, 2015, our noncurrent liabilities included (i) other noncurrent financial liabilities of Ch$765,29933,602 million, (ii) noncurrent accounts payable of Ch$9,303 million (iii) other noncurrent provisions of Ch$63,976 million, (iv) deferred tax liabilities for Ch$130,202 million; (v) noncurrent employee benefit provisions for Ch$8,230 million; and (vi) other noncurrent non-financial liabilities for Ch$242 million, totaling noncurrent liabilities for Ch$977,252 million during the year ended December 31, 20158.2% compared to Ch$939,963 million duringDecember 2019, mainly explained by the year ended December 31, 2014.
As of December 31, 2015, our current liabilities included (i) other current financial liabilities of Ch$62,218 million; (ii) trade accounts and other accounts payable for Ch$212,526 million; (iii)decrease in current accounts payable to related entities for Ch$48,653 million; (iv)(-Ch$14,096 million), mainly by lower accounts payable to The Coca-Cola Company and other related companies, coupled with the decrease in trade accounts payable and other current provisions foraccounts payable (-Ch$13,255 million), mainly explained by the negative effect of translating figures on accounts payable in Brazil and Argentina.
Non-current liabilities increased by Ch$326 million; (v) current tax liabilities for Ch$7,495228,062 million, and (vi) current employee benefit provisions for Ch$31,791 million and (vi) other non-financial current liabilities for Ch$17,566 million. Total current liabilities during the year ended December 31, 2015 amounted to Ch$380,574 million22.6% compared to Ch$410,212 million duringDecember 2019, mainly due to the year ended December 31, 2013.
Asincrease in other non-current financial liabilities (Ch$246,503 million), mainly explained by the recognition of December 31, 2015,the liability for the bond placement in the U.S. market in January 2020 and beforeby the mark-to-market liability of cross currency swaps contracts the company entered in,of this same bond.
As of December 31, 2020, our bond liabilitiesobligation had a weighted average interest rate of 4.70%3.7% in UF and 4.5% in US$ while our bank liabilitiesobligation had a weighted average interest rate of 4.93%.26.6% for debts in Argentine pesos and 2.0% for debts in Chilean pesos.
***
Summary of Significant Debt Instruments
Summary of Significant Debt Instruments
As of December 31, 2015,2020, the Company is in compliance with all its debt covenants which are summarized below:
Series B Local Bonds (BANDI-B1; BANDI-B2)
InDuring 2001, we issued in Chile Series B bonds. This issuance was structured into two series, one of which matured in 2008. As of December 31, 2020, Series B is the Chilean capital marketsoutstanding series with sub-series B1 and B2. During 2001, UF 3.7 million Series Bin bonds duewere issued with final maturity in 2026, bearing interest at a variablean annual interest rate of 6.50% over inflation.6.5%. The Series B Local Bonds are subject to the following restrictive covenants:
· Maintain an indebtedness level where Consolidated Financial Liabilities shall not exceed Consolidated Equity by 1.20 times. For these purposes Consolidated Financial Liabilities shall be regarded as Current Liabilities bearing interest, namely: (i) other current financial liabilities, plus (ii) other non-current financial liabilities, less (iii) active balances of derivative financial instruments, taken to cover exchange rate risks or interest rate risks on financial liabilities accounted for under “Other Current Financial Assets” and “Other Non-current Financial Assets” of the issuer’s Consolidated Statement of Financial Position. Consolidated Equity shall be regarded as total equity including non-controlling interests.
| · | In October 2020, the covenant of Consolidated Financial Liabilities / Consolidated Equity was amended as the following: Maintain an indebtedness level where Net Consolidated Financial Liabilities shall not exceed Consolidated Equity by 1.20 times. For these purposes Net Consolidated Financial Liabilities will be the result of: (i) Other Current Financial Liabilities, plus (ii) Other Non-Current Financial Liabilities, less (iii) the sum of Cash and Cash Equivalents; plus Other Current Financial Assets; plus Other Non-Current Financial Assets (to the extent that they correspond to the active balances of derivative financial instruments, taken to cover exchange rate risks or interest rate risks on financial liabilities). |
· Maintain and in no way lose, sell, assign, or transfer to a third party the geographical area today called “Metropolitan Region”, as franchised territory in Chile by The Coca-Cola Company, for the development, production, sale and distribution of products and brands of the licensor, in accordance with the respective bottling agreement or license, renewable from time to time.
| · | Maintain and not lose, sell, assign, or transfer to a third party the geographical area today called the “Metropolitan Region”, as franchised territory in Chile by The Coca-Cola Company, for the development, production, sale and distribution of products and brands of such licensor, in accordance with the respective bottling agreement or license, renewable from time to time. |
· Not lose, sell, assign, or transfer to a third party any other territory of Argentina or Brazil, which to date is franchised to the Company by TCCC for the manufacture, production, sale and distribution of products and brands of such licensor; as long as these territories account for more than 40% of the Issuer’s Adjusted Consolidated Operating Flow.
| · | Not lose, sell, assign, or transfer to a third party any other territory of Argentina or Brazil, which to date is franchised to the Company by The Coca-Cola Company for the manufacture, production, sale and distribution of products and brands of such licensor; as long as these territories account for more than 40% of the Company’s Adjusted Consolidated Operating Flow. |
· Maintain consolidated assets free of any pledge, mortgage or other lien by an amount, less than or equal to 1.3 times of the Issuer’s unsecured consolidated current liabilities.
| · | Maintain consolidated assets free of any pledge, mortgage or other lien by an amount, less than or equal to 1.3 times the Company’s unsecured consolidated current liabilities. |
Unsecured consolidated current liabilities are the Company’s total liabilities, obligations and debts that are not secured with real guarantees on goods and assets of the latter, made voluntarily and conventionallyor by agreement by the Company less the active balances of derivative financial instruments, taken to cover exchange rate risks or interest rate risks on financial liabilities accounted for under “OtherOther Current Financial Assets”Assets and “OtherOther Non-current Financial Assets”Assets of the Issuer’sCompany’s Consolidated Statement of Financial Position.
Consolidated assetsAssets are assets free of any pledge, mortgage or other lien, as well as those assets that have real liens, mortgage or encumbrances that operate only by law less the active balances of derivative financial instruments, taken to cover exchange rate risks or interest rate risks on financial liabilities accounted for under “OtherOther Current Financial Assets”Assets and “OtherOther Non-current Financial Assets”Assets of the Issuer’sCompany’s Consolidated Statement of Financial Position.
In July 2020, derivatives have been contracted (Cross Currency Swaps) that cover 100% of UF denominated financial obligations, redenominating them to Chilean pesos.
Series A and C Local Bonds (BKOP-C)
As a consequence of our merger with Polar, we became an obligor under the following twooutstanding bonds issued by Polar in the Chilean capital marketsChile in 2010:2010.
· UF 1.0 million of Series A bonds due 2017, bearing interest at a variable annual rate equal to 3.00%; and
| · | Series C bonds due 2031, bearing interest at a fixed annual rate equal to 4.00%. |
· UF 1.5 million of Series C bonds due 2031, bearing interest at a variable annual rate equal to 4.00%
The Series A and C local bonds areThis series is subject to the following restrictions:
· Maintain a “Net Financial Indebtedness” level of no more than 1.5 times in the quarterly financial statements, measured by figures included in the Polar’s Consolidated Statement of Financial Position. For these purposes, net financial indebtedness level is defined as the ratio of net financial debt to total assets of the issuer (equity attributable to the owners of the controllers plus non-controlling interests). Net financial debt means the difference between the Issuer’s financial debt and cash.
| · | Maintain a level of Net Financial Indebtedness within its quarterly financial statements that may not exceed 1.5 times, measured by figures included in the Company Consolidated Statement of Financial Position. For these purposes, net financial indebtedness level is defined as the ratio of net financial debt to total equity of the Company (equity attributable to the owners of the controllers plus non-controlling interests). Net financial debt means the difference between the Company financial debt and cash. |
· Maintain consolidated assets free of any pledge, mortgage or other lien by an amount, less than or equal to 1.3 times of the Issuer’s unsecured consolidated current liabilities.
| · | Maintain consolidated assets free of any pledge, mortgage or other encumbrances for an amount at least equal to 1.3 times of the Company unsecured consolidated liabilities. |
Unencumbered assetsAssets are (a) assets that meet the following conditions. Theyconditions: (i) they are the property of Polar,the Company, (ii) they are classified under Total Assets ofin the Polar’sCompany’s Financial Statement and, (iii) they are free of any pledge, mortgage or other levies constituted in favor of third parties, less “Other current financial assets”(b) Other Current Financial Assets and “Other non-current financial assets” on Polar’sOther Non-Current Financial Statement (toAssets included in the extent they correspond to the active balances of derivative financial instruments, taken to cover exchange rate risks or interest rate risks on financial liabilities.)
Unsecured total liabilities means liabilities under the account Total Current liabilities and Total non-current Liabilities on Polar’s Financial Statements which do not benefit from preferences or privileges, less “Other current financial assets” and “Other non-current financial assets” of Polar’sCompany’s Financial Statements (to the extent they correspond to the active balances of derivative financial instruments, taken to cover exchange rate risks or interest rate risks on financial liabilities.)liabilities).
· Not invest in instruments issued by related partiesUnsecured Total Liabilities are (a) liabilities included under Total Current Liabilities and Total Non-Current Liabilities on the Company Financial Statements which do not benefit from preferences or carry out operations with related parties other than those related to the general purposeprivileges, less (b) Other Current Financial Assets and Other Non-Current Financial Assets of the entities, in conditions that are unfavorableCompany’s Financial Statements (to the extent they correspond to Polar in relation to those prevailing in the market.
· Maintain a Net Financial Coverage level of greater than 3.0. Net financial coverage is the ratio between Polar’s EBITDA for the past 12 months and Polar’s net financial expenses (financial income less financial expenses) for the past 12 months. However, this restriction shall be regarded as breached when the mentioned net financial coverage level is lower than the level previously indicated during two consecutive quarters.
Series C, D and E Local Bonds
On September 4, 2013, we issued in the Chilean capital markets UF 4,000,000 aggregate principal amount (equivalent to Ch$92,199.40 million, as of September 5, 2013) of UF 3.80% bonds due 2034 and UF 1,000,000 aggregate principal amount (equivalent to Ch$23,049.85 million, as of September 5, 2013) of UF 3.50% bonds due 2020. The bonds are non-convertible and are not guaranteed. The proceeds from these local bonds were used to pay down existing indebtedness and for other general corporate purposes.
On April 3, 2014, we issued additional capital in the amount of UF 3,000,000 in the Chilean capital markets (equivalent to Ch$70,855 million, on April 3, 2014) in UF bonds at 3.75% maturing in 2035. The funds from these local bond funds were used to pay off existing debts and for other general corporate purposes.
The Series C, D and E local bonds are subject to the following restrictions:
· Maintain an indebtedness level where Consolidated Financial Liabilities shall not exceed Consolidated Equity by 1.20 times. For these purposes Consolidated Financial Liabilities is Current Liabilities bearing interest, namely: (i) other current financial liabilities, plus (ii) other non-current financial liabilities, less (iii) active balances of derivative financial instruments, taken to cover exchange rate risks or interest rate risks on financial liabilities accounted for under “Otherliabilities).
| · | Not invest in instruments issued by related parties or carry out operations with related parties other than those related to the general purpose of the entities, in conditions that are less favorable to those of the Company in relation to those prevailing in the market. |
| · | Maintain a Net Financial Coverage ratio greater than 3.0 times. Net financial coverage is the ratio between the Company’s EBITDA for the past 12 months and the Company’s Net Financial Expenses. Net financial Expenses is defined as the difference between the absolute value of the interest expenses associated with the issuer's financial debt recorded in the “Financial Costs” account; and interest income associated with the issuer's cash, recorded in the Financial Income account, |
| for the past 12 months. However, this restriction will be considered breached when the mentioned net financial coverage ratio is lower than the ratio previously indicated during two consecutive quarters. |
In July 2020, derivatives have been contracted (Cross Currency Swaps) that cover 100% of UF denominated financial obligations, redenominating them to Chilean pesos.
Series D and E Local Bonds (BANDI-D; BANDI-E)
During 2013 and 2014, Andina placed local bonds in the Chilean market. The issuance was structured into three series, one of which matured in 2020.
| · | UF 4.0 million of Series D Bonds due 2034 were issued in August 2013, bearing an annual interest rate of 3.8%; |
| · | UF 3.0 million of Series E Bonds due 2035 were issued in March 2014, bearing an annual interest rate of 3.75%. |
The Series D and E local bonds are subject to the following restrictions:
| · | Maintain an indebtedness level where Net Consolidated Financial Liabilities shall not exceed Consolidated Equity by 1.20 times. |
For these purposes Net Consolidated Financial Liabilities will be the result of: (i) Other Current Financial Assets”Liabilities, plus (ii) Other Non-Current Financial Liabilities, less (iii) the sum of Cash and “Other Non-currentCash Equivalents; plus Other Current Financial Assets”Assets; plus Other Non-Current Financial Assets (to the extent that they correspond to the active balances of the issuer’s Consolidated Statement of Financial Position. derivative financial instruments, taken to cover exchange rate risks or interest rate risks on financial liabilities).
Consolidated Equity is total equity including non-controlling interests.
· Maintain consolidated assets free of any pledge, mortgage or other lien by an amount, less than or equal to 1.3 times of the Issuer’s unsecured consolidated current liabilities.
| · | Maintain Consolidated Assets free of any pledge, mortgage or other lien by an amount, at least equal to 1.3 times of the Issuer’s unsecured consolidated current liabilities. |
“Unsecured Consolidated Current Liabilities”Liabilities are the Company’s total liabilities, obligations and debts that are not secured with real guarantees on goods and assets of the latter, made voluntarily and conventionallyor by agreement by the Company, less the active balances of derivative financial instruments, taken to cover exchange rate risks or interest rate risks on financial liabilities accounted for under “OtherOther Current Financial Assets”Assets and “OtherOther Non-current Financial Assets”Assets of the Company’s Consolidated Statement of Financial Position.
For purposes of determining Consolidated Assets these will consider assets free of any pledge, mortgage or other lien, as well as those assets that have real liens, mortgage or encumbrances that operate only by law. Therefore, Consolidated Assets free of any lien, mortgage or other encumbrance are regarded as those assets for which no real lien, mortgage or other encumbrance has been made voluntarily or by agreement by the Company, less the active balances of derivative financial instruments, taken to cover exchange rate risks or interest rate risks on financial liabilities accounted for under Other Current Financial Assets and Other Non-current Financial Assets of the Company’s Consolidated Statement of Financial Position.
| · | Maintain and not lose, sell, assign, or transfer to a third party the Metropolitan Region, as franchised territory in Chile by The Coca-Cola Company for the production, sale and distribution of products and brands of the licensor. Losing said territory means the non-renewal, cancellation, early termination or annulment of the license agreement granted by The Coca-Cola Company for the Metropolitan Region. |
| · | Not lose, sell, assign, or transfer to a third party any other territory of Argentina or Brazil, which as of the issuance date of the Series C, D and E local bonds were franchised to the Company by The Coca-Cola Company for the manufacture, production, sale and distribution of products and brands of The Coca-Cola Company; as long as these territories account for more than 40% of the Company’s Adjusted Consolidated Operating Flow of the audited fiscal year immediately prior to the moment when such loss, sale, assignment or transfer occurs. For these purposes Adjusted Consolidated Operating Flow is the addition of the following accounting items of the Issuer’s Consolidated Statement of Financial Position: (i) Gross Income, including revenue and cost of sales, less (ii) Distribution Costs, less (iii) Administrative Expenses, plus (iv) Participation in Earnings (Losses) of Associates and Joint Ventures accounted for using the Equity Method, plus (v) Depreciation, plus (vi) Amortization of Intangibles. |
In July 2020, derivatives have been contracted (Cross Currency Swaps) that cover 100% of UF denominated financial obligations, redenominating them to Chilean pesos.
Series F Local Bonds (BANDI-F)
During 2018, Andina undertook the partial repurchase (US$210 million) of the Senior Notes due 2023, which was refinanced with the placement of the Series F Local Bonds in the Chilean local market. These bonds were issued in October 2018, in the amount of UF5.7 million, accruing an annual interest rate of 2.8% and with a maturity of 2039.
The Series F local bonds are subject to the following restrictions:
| · | Maintain an indebtedness level where Net Consolidated Financial Liabilities shall not exceed Consolidated Equity by 1.20 times. |
For these purposes Net Consolidated Financial Liabilities will be the result of: (i) Other Current Financial Liabilities, plus (ii) Other Non-Current Financial Liabilities, less (iii) the sum of Cash and Cash Equivalents; plus Other Current Financial Assets; plus Other Non-Current Financial Assets (to the extent that they correspond to the active balances of derivative financial instruments, taken to cover exchange rate risks or interest rate risks on financial liabilities).
Consolidated Equity is total equity including non-controlling interests.
| · | Maintain Consolidated Assets free of any pledge, mortgage or other lien by an amount, at least equal to 1.3 times of the Issuer’s unsecured consolidated current liabilities. |
Unsecured Consolidated Current Liabilities are the Company’s total liabilities, obligations and debts that are not secured with real guarantees on goods and assets of the latter, made voluntarily or by agreement by the Company, less the active balances of derivative financial instruments, taken to cover exchange rate risks or interest rate risks on financial liabilities accounted for under Other Current Financial Assets and Other Non-current Financial Assets of the Company’s Consolidated Statement of Financial Position.
For purposes of determining Consolidated Assets these will consider assets free of any pledge, mortgage or other lien, as well as those assets that have real liens, mortgage or encumbrances that operate only by law. Therefore, Consolidated Assets free of any lien, mortgage or other encumbrance shall be regarded as those assets for which no real lien, mortgage or other encumbrance has been made voluntarily and conventionallyor by agreement by the Company, less the active balances of derivative financial instruments, taken to cover exchange rate risks or interest rate risks on financial liabilities accounted for under “OtherOther Current Financial Assets”Assets and “OtherOther Non-current Financial Assets”Assets of the Company’s Consolidated Statement of Financial Position.
| · | Maintain and not lose, sell, assign, or transfer to a third party the Metropolitan Region, as franchised territory in Chile by The Coca-Cola Company for the production, sale and distribution of products and brands of the licensor. Losing said territory means the non-renewal, cancellation, early termination or annulment of the license agreement granted by The Coca-Cola Company for the Metropolitan Region. |
· Maintain and in no way lose, sell, assign, or transfer to a third party the Metropolitan Region, as franchised territory in Chile by The Coca-Cola Company for the production, sale and distribution of products and brands of the licensor. Losing said territory means the non-renewal, cancellation, early termination or annulment of this license agreement by The Coca-Cola Company, for the Metropolitan Region.
| · | Not lose, sell, assign, or transfer to a third party any other territory of Argentina or Brazil, which as of the issuance date of the Series F local bonds, is franchised to the Company by The Coca-Cola Company for the manufacture, production, sale and distribution of products and brands of The Coca-Cola Company; as long as these territories account for more than 40% of the Company’s Adjusted Consolidated Operating Flow of the audited fiscal year immediately prior to the moment when said loss, sale, assignment or transfer occurs. For these purposes Adjusted Consolidated Operating Flow is the addition of the following accounting items of the Issuer’s Consolidated Statement of Financial Position: (i) Gross Income, including revenue and cost of sales, less (ii) Distribution Costs, less (iii) Administrative Expenses, plus (iv) Participation in Earnings (Losses) of Associates and Joint Ventures accounted for using the Equity Method, plus (v) Depreciation, plus (vi) Amortization of Intangibles. |
· Not lose, sell, assign, or transfer to a third party any other territory of Argentina or Brazil, which as of the issuance date of the Series C, D and E local bonds, is franchised to the Company by The Coca-Cola Company for the manufacture, production, sale and distribution of products and brands of The Coca-Cola Company; as long as these territories account for more than 40% of the Company’s Adjusted Consolidated Operating Flow of the audited fiscal year immediately prior to the moment when said loss, sale, assignment or transfer occurs. For these purposes “Adjusted Consolidated Operating Flow” is the addition of the following accounting items of the Issuer’s Consolidated Statement of Financial Position: (i) “Gross Income”, including revenue and cost of sales, less (ii) “Distribution Costs”, less (iii) Administrative Expenses, plus (iv) Participation in Earnings (Losses) of Associates and Joint Ventures accounted for using the Equity Method”, plus (v) “Depreciation”, plus (vi) “Amortization of Intangibles”.
Senior Notes due 2023 in Connection with Acquisition of Ipiranga
In October 2013, we issued US$575 million of 5.000% Senior Notes due 2023. The notes will mature on October 1, 2023. Thein the U.S. market under 144A/Reg S regulations. These notes are unsecured obligations that are effectively subordinated to our secured debt.with the whole principal amount due in 2023. The proceeds from these notes were used to finance a portion of the purchase price for our acquisition of Ipiranga and for general corporate purposes.
In October 2018, as part of the Company’s debt reprofiling, Andina undertook a partial repurchase of the Senior Notes in the amount of US$210 million (which was refinanced with the placement of Series F Local Bonds in the Chilean local market), with a total remaining outstanding amount of Senior Notes of US$365 million.
RepurchasedSenior Notes due 20272050
On January 21, 2020, the Company issued a 30-year corporate bond in the international markets for US$300 million due 2050, with an annual coupon rate of 3.950%. The use of funds from this operation are general corporate purposes which could include an eventual payment of existing liabilities, financing of potential acquisitions and 2097improvement of the company's liquidity position.
In October 1997, we issued US$100 million of 7.625% Notes due 2027 and US$100 million of 7.875% Notes due 2097. Through a series of repurchases between 2000 and 2009, weparallel, derivatives have repurchased and currently hold, all of these notes through our wholly-owned subsidiary Abisa Corp. On December 15, 2014, Embotelladora Andina S.A. repurchased US$200 million in outstanding bonds from its subsidiary Abisa Corp S.A., thereby eliminatingbeen contracted (Cross Currency Swaps) to fully redenominate the related bond liability.US dollar-denominated financial obligations to UF’s.
C.RESEARCH AND DEVELOPMENT, PATENTS AND LICENSES
| C. | RESEARCH AND DEVELOPMENT, PATENTS AND LICENSES |
Given the nature of the business and the support provided by The Coca-Cola Company as franchisor to its bottlers, the Company’s research and development expenses are not meaningful. For more information on patents and licenses, see “Item 4. Information on the Company – Bottler Agreements”.
D.TREND INFORMATION
| D. | TREND INFORMATION |
Our results will likely continue to be influenced by changes in the level of consumer demand in the countries in which we operate, resulting from governmental economic measures that are or may be implemented in the future. Additionally, principal raw materials used in the production of soft drinks, such as sugar and resin, may experience price increases in the future. Such price increases may affect our results if we are unable to pass the cost increases on to the sales price of our products due to depressed consumer demand and/or heightened competition.
Increased competition from low-price brands is another factor that could limit our ability to grow, and thus negatively affect our results.
Finally,Additionally, exchange rate fluctuations, in particular the potential devaluations relative to the U.S. dollar of local currencies in the countries in which we operate, may adversely affect our results because of the impact on the cost of U.S. dollar-denominated raw materials and the conversion of monetary assets.
E.OFF-BALANCE SHEET ARRANGEMENTSThe outbreak of the COVID-19 pandemic and the extraordinary measures adopted by the government to contain the spread of the virus, could adversely affect our business and results of operations. For more information see “Item 3. Key Information – D. Risk Factors – Our business is subject to risks arising from the ongoing COVID-19 pandemic”.
| E. | OFF-BALANCE SHEET ARRANGEMENTS |
At
As of December 31, 2015,2020, we did not have any material off-balance sheet arrangements.
F.CONTRACTUAL OBLIGATIONS
| F. | CONTRACTUAL OBLIGATIONS |
The following table sets forth our principal contractual and commercial obligations as of December 31, 2015:2020:
|
| Payments Due by Period |
| ||||||||
|
| Less than 1 |
| 1-3 Years |
| 3-5 Years |
| More than |
| Total |
|
|
| (in millions of Ch$ ) |
| ||||||||
|
|
|
|
|
|
|
|
|
|
|
|
Debt with financial institutions(1) |
| 24,592 |
| 24,699 |
| 6,615 |
| — |
| 55,905 |
|
Bonds(1)(2) |
| 45,518 |
| 96,584 |
| 89,145 |
| 835,728 |
| 1,066,975 |
|
Lease obligations(1) |
| 10,338 |
| 6,366 |
| 16,827 |
| — |
| 33,531 |
|
Purchase obligations(1)(3) |
| 158,942 |
| 75,270 |
| 16,089 |
| 52,183 |
| 302,484 |
|
Total(1) |
| 239,390 |
| 202,919 |
| 128,675 |
| 887,911 |
| 1,458,896 |
|
| Payments Due by Period | ||||||||||||||||||||
| Less than 1 year | 1-3 Years | 3-5 Years | More than 5 years | Total | ||||||||||||||||
| (in millions of Ch$) | ||||||||||||||||||||
| Debt with financial institutions (1) | 776 | 850 | 162 | 4,081 | 5,869 | |||||||||||||||
| Bonds (1) (2) | 72,133 | 11,977 | 285,048 | 628,944 | 998,102 | |||||||||||||||
| Lease obligations (1) | 5,718 | 5,129 | 10,012 | 198 | 21,057 | |||||||||||||||
| Purchase obligations (1) (3) | 8,426 | 83,368 | 23,287 | 9,714 | 124,795 | |||||||||||||||
| Total | 87,053 | 101,324 | 318,509 | 642,937 | 1,149,823 | |||||||||||||||
| (1) | Includes interest. |
| (2) | See note 17 to our consolidated financial statements for additional information. |
| (3) | This includes: (i) IT services contract, and (ii) some services and raw material contracts, mainly for sugar. |
(1) Includes interest
(2) See Note 16 to our consolidated financial statements as of December 31, 2015 and for the year ended December 31, 2014 and 2015 for additional information.
(3) This includes: (i) our Brazilian cogeneration contract, (ii) our services contract with Hewlett Packard and (iii) some services and raw material contacts, mainly for sugar.
The following table presents future expirations for additional long-term liabilities. These expirations have been estimated based on accounting estimates because the liabilities do not have specific dates of future payment, as allowance for severance indemnities, contingencies, and liabilities are included.
| Maturity Years | |||||||||||||||||||||||||
|
| Maturity Years |
| Total | 1-3 Years | 3-5 Years | More than 5 Years | ||||||||||||||||||
|
| Total |
| 1-3 Years |
| 3-5 Years |
| More than 5 Years |
| ||||||||||||||||
|
| (in millions of Ch$ 2014) |
| (Millions Ch$ 2020) | |||||||||||||||||||||
Provisions |
| 63,975 |
| 365 |
| 730 |
| 62,880 |
| 50,070 | 1,335 | 789 | 47,946 | ||||||||||||
Other long-term liabilities |
| 8,473 |
| 1,003 |
| 2,006 |
| 5,464 |
| 13,636 | 648 | 427 | 12,561 | ||||||||||||
Total long-term liabilities |
| 72,448 |
| 1,368 |
| 2,736 |
| 68,344 |
| 63,706 | 1,983 | 1,216 | 60,507 | ||||||||||||
G.SAFE HARBOR
| G. | SAFE HARBOR |
See “Presentation“Introduction - Presentation of Financial and Certain Other Information—Forward-Looking Statements.”Statements”.
ITEM 6.DIRECTORS, SENIOR MANAGEMENT AND EMPLOYEES
| ITEM 6. | DIRECTORS, SENIOR MANAGEMENT AND EMPLOYEES |
A.DIRECTORS AND SENIOR MANAGEMENT
| A. | DIRECTORS AND SENIOR MANAGEMENT |
Pursuant to Chilean law, we are managed by a group of executive officers under the supervision of our board of directors. The Company’s operations in Chile, Brazil, Argentina and Paraguay report to the Corporate Office.
Principal Officers
The following table includes information regarding our senior executives:
|
|
| ||
|
|
| ||
|
|
| ||
|
|
| ||
|
|
| ||
|
|
| ||
|
|
| ||
|
|
| ||
|
|
| ||
|
|
| ||
|
|
|
Mr. Peirano joined uscorporate headquarters in 2011, as Chief Executive Officer. Prior to his appointment in Andina, he was President at FEMSA Cerveza Brazil from 2009 through 2011. While at Coca-Cola FEMSA he held several positions: Vice-President from 2006-2008; Director of Operations in Argentina from 2003 through 2005; Commercial Director during 2002; Manufacturing Director in 2000 and Strategic Planning Director in 1999. He also worked as Assistant Manager at McKinsey & Company in 1999.
Mr. Wainer joined us in 1996 as a research analyst in the corporate office. In 2000, he was appointed Development Manager in EDASA and in 2001, he returned to the corporate office as Research and Development Officer. In 2006, he was appointed finance and administration manager at the Chilean operation and in November 2010, he returns to the corporate office as Chief Financial Officer.
Mr. Vedoya joined us in 2015 as Chief Strategic Planning Officer. Prior to joining Andina, he was an independent consultant from 2011 until 2014. He also held the position of Senior Consultant at Virtus Partners, from 2009 until 2011. He also worked for other companies in the hotel industry.
Mr. Cohen joined us in 2008, as Chief Legal Officer. Prior to joining Andina, he held a similar position at Socovesa S.A. from 2004. He formed part of the legal division of Citibank from 2000 to 2004. He also was an attorney at the law offices of Cruzat, Ortuzar & Mackenna and Baker & McKenzie from 1996 until 1999. He began his professional career in 1993 as lawyer at Banco de A. Edwards.
Mr. Garib has held the position of as Chief Information Officer since 1998. Prior to Andina, he was the marketing manager of IBM Chile.
Mr. Muñoz joined the Company in 2015 as Chief Human Resources officer. Prior to Andina he worked at British American Tobacco as Human Resources Director in Mexico and Human Resources Southern Cone Director. He also held several other positions at British American Tobacco such as Finance Directors and General Manager in several Latin-American countries.
Mr. Castelli joined us in 1994, holding the position of Traditional Sales Manager in Mendoza. He is currently General Manager (since April 2014) of Andina Argentina. Previously, he was Andina Argentina Commercial Manager (2010). Marketing Manager from 2000-2010, Commercial Planning Manager from 1997 to 2000, Marketing Services Manager between 1996 and 1997, Sales Manager Traditional Mendoza in 1994-1995.
Mr. Barbosa joined us on January 1, 2012 as general manager of our operation in Brazil. He has worked in the Coca-Cola System for 23 years, primarily as general manager of Brasal, a Coca-Cola bottling company servicing the western central part of Brazil. He also has worked for other large companies such as McDonald’s and Banco do Brasil.
Mr. Solorzano joined us in 2003, where he served in various managerial positions in the commercial area, passing through the management of key accounts sales, traditional channel sales management, and management of marketing and commercial areas. In March of 2010, he has served as General Manager of Andina’s Argentine operations. On April 1, 2014 assumed as General Manager of Andina Chile. Prior to his arrival at Andina, he worked as marketing manager, plant manager and business manager of Coca-Cola Polar, for five years. Before his introduction to the Coca-Cola bottler system, he worked at Malloa.
Mr. Sansfurgo joined us after the merger with Embotelladoras Coca-Cola Polar assuming the position of General Manager of Paraguay Refrescos S.A. In 1990, he joined Embotelladoras Coca-Cola Polar S.A. as General Manager of Embotelladora Austral (Punta Arenas — Chile). Since 2005 has been General Manager of Paraguay Refrescos S.A.
Notes:
1. Germán Garib left his position on January 31, 2016 and has been replaced as Chief Processes and IT Officer by Mr. Carlos Gálvez, beginning February 1, 2016.
2. Cristián Mandiola resigned to his position as Chief Operations South Officer of Coca-Cola Andina effective April 2, 2015.
3. Beginning April 1, 2015 Rodrigo Ormaechea assumes the position of Commercial Director of Coca-Cola Andina in Brazil reporting to the General Manager Renato Barbosa. His replacement as Chief Strategic Planning Officer of Coca-Cola Andina is assumed by Mr. Tomás Vedoya, beginning February 23, 2015.
4. Alan Dunford left his position on December 31, 2014 and has been replaced as Chief Human Resources Officer by Mr. Gonzalo Muñoz, Rut beginning January 1, 2015.
Board of Directors
In accordance with our current bylaws, the board of directors must consistis comprised of fourteen (14) directors. The directors may or may not be shareholders and are elected at general shareholders’ meetings for a three-year term, of three years subject to indefinite re-election. All members of the board of directors are completely renewed every three years by and during the General Shareholders’ Meeting.with re-election permitted. Cumulative voting is permitted for the election of directors.
In the event of a vacancy, the board of directors may appoint a replacement to fill the vacancy, and the entire board of directors must be elected or re-elected at the next regularly scheduled General Shareholders’ Meeting.general shareholders’ meeting.
The majority shareholders’shareholders agreement forregulates the election of directors is contained inof the Agreement and further explained on Item 7 “MajorCompany by the controlling shareholders (See “Item 7. Major Shareholders and Transactions with Related Companies”). In addition, pursuant to the terms and conditions of the deposit agreement among theentered between The Company and the Bank of New York dated as of December 14, 2000, (the “Deposit Agreement”), if no instructions are received by The Bank of New York, Mellon, as depositary (the “Depositary”), it shall give a discretionary proxy to a person designated by the chairman of our board of directors with respect to the shares or other deposited securities that represent the ADRs.
As of December 31, 2015, our board ofThe following table sets forth information with respect to the current directors consisted of the following directors:Company, which have been elected at our general shareholders’ meeting dated April 15, 2021:
Name |
| Date of | Position | |||||
Juan Claro |
| 70 |
| April 15, 2024 | Chairman | |||
Eduardo Chadwick |
| 61 |
|
| Director | |||
Salvador Said(1) | 56 | April 15, 2024 | Vice Chairman | |||||
| José Antonio Garcés |
| 54 |
| April 15, 2024 | Director | |||
|
| 56 |
| April 15, 2024 | Director | |||
|
| 52 |
| April 15, 2024 | Director | |||
|
| 68 |
| April 15, 2024 | Director | |||
|
| 58 |
| April 15, 2024 | Director | |||
|
| 64 |
| April 15, 2024 | Director | |||
|
| 58 |
| April 15, 2024 | Director | |||
|
| 61 |
| April 15, 2024 | Director | |||
|
| 54 |
| April 15, 2024 | Director | |||
|
| 54 |
| April 15, 2024 | Director | |||
|
| 53 |
|
| ||||
|
|
| Director | |||||
(1)Salvador Said is first cousin of Gonzalo Said.
| (1) | Salvador Said is first cousin of Gonzalo Said. |
(2)
| (2) | Independent from controlling shareholder pursuant to Article 50 bis, paragraph 6 of the Chilean Public Company Law N° 18,046. |
| (3) | Age at December 31, 2020. |
The following are brief biographies of each of the Chilean Public Company Law N° 18,046.Company’s directors:
Juan Claro Gonzalez
Mr. ClaroAppointment: He has been a member of ourthe board of directors, and also the Chairman since April 2004. His principal occupation is as an entrepreneur.
Experience: He holds a civil engineering degree from the Pontificia Universidad Católica de Chile. He was the president of the Sociedad de Fomento Fabril (Sofofa) between 2001 and 2005, the Confederación de la Producción y del Comercio (CPC), between 2002 and 2005 and also serves as a directorof the Chile-China Bilateral Business Council between 2005 and 2007. He has more than 17 years of experience in the following organizations: Chairmanbeverage and mass consumption industry. Currently, he is member of Embotelladora Andina, Energía Covancothe risk committee of Agrosuper S.A. and Energía Llaima; directormember of Entel,the sustainability and stakeholders' committee of Antofagasta Minerals, Antofagasta Plc, Pesquera Friosur, Melon S.A and Agrosuper.PLC.
Mr. ChadwickHe has been a member of ourthe board of directors since June 2012. His principal occupation is as an entrepreneur. He also serves as a director inof the following organizations: Viña Errazuriz, Empresas Penta, MaltexcoS.A.companies: Gasco S.A (1991-2000), Ebema, Vinos de ChileCMPC S.A. (2005-2011), Entel S.A. (2005-2011) and Banco Penta.chairman of the board of directors of Metrogas (1994-2000) and Emel S.A (2001-2007).
Other positions: Currently, he is member of the board of directors of Antofagasta PLC, Cementos Melon, Agrosuper and Energía Llaima. He is also an honorary member of Centro de Estudios Públicos (CEP).
José Antonio Garcés Silva
Mr. MajlisAppointment: He has been a member of ourthe board of directors since April 1997. His principal occupation is as a principal partner of the law offices of Grasty, Quintana, Majlis y Compañía. He also serves as a director in the following organizations: Asesorías e Inversiones Til Til S.A.; Asesorías e Inversiones MJS Ltda., Banchile Seguros de Vida, Seguros Orion, Mathiesen Group, Laboratorio Maver, Fundación Convivir, Fundación Puerto de Ideas and Orion Seguros Generales.Company since 1992.
Experience: He holds a business administration degree from the Universidad Gabriela Mistral with a specialization in Finance, and has postgraduate studies with an executive MBA and PADE from ESE school from the Universidad de Los Andes. Previously, he was chairman of the board of directors of Banvida S.A., CEO of Inversiones San Andrés (family holding company), past president of USEC, member of the board of Fundación Paternitas and advisor of Sofofa. He has 25 years of experience in the beverage and mass consumption industry, and extensive experience in risk and cybersecurity in the financial sector. Currently he is a member of the risk committee of Banco Consorcio.
Mr. GarcésOther positions: Currently, he is member of the board of directors of Banco Consorcio, CN Life Compañía de Seguros, Consorcio Nacional de Seguros, Banvida S.A., Energía Llaima SpA, Andes Iron SpA and Viña Montes.
Marco Antonio Araujo
Appointment: He has been a member of ourthe board of directors of the Company since April 1992. His principal occupation is as general manager of Inversiones San Andrés Ltda.2020.
Experience: He holds a systems and industrial engineer degrees, both from Pontificia Universidad Católica de Rio de Janeiro, Brazil; He also serves as directorholds a masters in finance degree from the Pontificia Universidad Católica de Rio de Janeiro, Brazil and postgraduate studies in accounting from the FGV in Rio de Janeiro, Brazil. He is CFO of the Latin America Operating Unit at The Coca-Cola Company. He has 28 years of experience in the following organizations: Banco Consorcio, Banvida S.A.; Inmobiliaria FFV S.A., Fundación Paternitas, Viña Montes, Viña Garcés Silva Ltda.,beverage industry and Chairman of USEC.mass consumption, experience in mergers and acquisitions, risk management and sustainability.
Other positions: At The Coca-Cola Company he has served as Finance VP & CFO Japan Business Unit; Finance VP & CFO Brazil Business Unit; Finance VP & CFO Mexico Business Unit; M&A Manager for Latin America, Atlanta-USA; Finance Director, Madrid, Spain; Finance Manager SE Region, Brazil Division; and Financial Planning Analyst/Manager, Brazil Division.
Georges De Bourguignon Arndt
Mr. Gonzalo SaidAppointment: He has been a member of ourthe board of directors of the Company since April 2016.
Experience: He holds an economist degree from the Pontificia Universidad Católica de Chile with a specialization in finance and has an MBA from Harvard University. In the academic field he was professor of economics at the Universidad Católica and Director of Harvard Business School Alumni Board in Boston. He is co-founder and CEO of Asset Chile. Previously he was director of Latam Airlines Group (2011-2019) and Empresas La Polar S.A. (2011-2015). He has more than five years of experience in the mass consumption industry. He was a member of the Latam Airlines Group and currently serves in the risk committees of Sociedad Química y Minera de Chile S.A. and Asset AGF S.A. He also is a member of the sustainability committee of Sociedad Química y Minera de Chile S.A.
Other positions: Currently, he is member of the board of directors of Asset Chile S.A., Asset AGF S.A., Sociedad Química y Minera de Chile S.A. and Tánica S.A.
Eduardo Chadwick Claro
Appointment: He has been member of the board of directors of the Company since June 2012.
Experience: He holds a civil industrial engineering degree from the Pontificia Universidad Catolica de Chile. He has 30 years experience in the beverage and mass consumption industry.
Other positions: Currently, he is the chairman of the board of Vina Errazuriz and member of the board of directors of Empresas Penta S.A., Maltexco S.A. and Ebema S.A.
Domingo Cruzat Amunátegui
Appointment: He has been member of the board of directors of the Company since 2021.
Experience: He holds a civil industrial engineering degree from the Universidad de Chile and an MBA from The Wharton School of the University of Pennsylvania. Previously, he served as comercial manager at Pesquera Coloso – San José; CEO at Watt’s Alimentos; CEO at Loncoleche, CEO at Bellsouth Chile and chief operations officer at Compañía Sudamericana de Vapores. He has 12 years of experience in the beverage and mass consumption industry. He is a university professor in the areas of marketing and sales at the ESE from the Universidad Los Andes. He has also been member of the board of directors of Conpax, Construmart, Copefrut, Essal, Principal Financial Group, Compañía Sudamericana de Vapores and Viña San Pedro Tarapacá. Additionally, he was chairman of the board of Correos de Chile and president of the SEP (“Sistema de Empresas Públicas”).
Other positions: Currently, he is member of the board of directors of Enel Américas, IP Chile, SEP and Stars (Family Office). Additionally, he is founding partner of Fundación La Esperanza, a foundation dedicated to rehabilitating young drug addicts.
Roberto Mercade
Appointment: He has been member of the board of directors of the Company since April 2019.
Experience: He holds a civil industrial engineering degree from the Georgia Institute of Technology, Atlanta (United States). Previously, he was member of the board of directors of ARCA-Lindley in Peru, Escuela Campo Alegre in Venezuela and American
International School of Johannesburg in South Africa. Has 29 years of experience in the beverage and mass consumption industry. He was responsible for the risk management operation at The Coca-Cola Company’s Latin Center. In the sustainability area, he was responsible for co-creating and managing the World Without Waste strategy for the same unit. He has developed his experience in the regions of Latin America, Africa and Asia.
Other positions: Currently serves as president of Coca-Cola Mexico in The Coca-Cola Company.
Gonzalo Parot Palma
Appointment: He has been member of the board of directors of the Company since 2009.
Experience: He holds a civil industrial engineering and economist degree from the Universidad de Chile, a master in industrial engineering degree from Universidad de Chile and a master in economics from the University of Chicago. Previously, he served as head of research at CCU S.A., corporate manager of research and development in Empresas CMPC S.A., executive chairman of Filiales Envases y Productos de Papel CMPC S.A.; general manager and director of Pacific Pulp; corporate general manager of CMPC Tissue S.A.; and director and corporate general manager of Copesa S.A. In his career he has been director, executive vice president and advisor of the Municipal Corporation and Municipal Theater of Santiago, director of the Asociación Nacional de la Prensa and the the Cámara Chileno-Argentina de Negocios, professor and director of the School of Business and Economics of the Universidad de Chile, professor and dean of economics and Administration of the Universidad Gabriela Mistral. He has 16 years of experience in the beverage and mass consumption industry.
Other positions: Currently serves as Director of AES Gener S.A.
Mariano Rossi
Appointment: He has been member of the board of directors of the Company since June 2012.
Experience: He holds a business administration degree from the School of Economics, Universidad de Buenos Aires with a specialization in finance. At The Coca-Cola Company, he was CFO in Spain, Latin America and General Manager in Argentina. He has also been director in different bottlers of the Coca-Cola System in Chile (Embonor and Polar), Peru (JRL Lindley) and Uruguay (Monresa) between 1999 and 2008. He has participated in executive programs at the University of Michigan and IESE (Switzerland), as well as in the executive development programs of The Coca-Cola Company of Emory & Wharton Universities (USA). He has 30 years of experience in the beverage and mass consumption industry.
Salvador Said Somavia
Appointment: He has been member of the board of directors of the Company since 1992.
Experience: He holds a business administration degree from Universidad Gabriela Mistral, with specialization in business management. He was a member of the board of Envases del Pacífico S.A. and Envases CMF S.A. He also participates in non-profit organizations, such as Endeavor Chile, where he was the chairman for six years and currently he continues as a member of the board. He is a member of the board of directors of the Centro de Estudios Públicos (CEP). He has 22 years of experience in the beverage and mass consumption industry. He has knowledge and experience in risk management due to his position as member of the board of Scotiabank Chile since 2011 and as a member of the risk committe of the bank.
Other positions: Currently, he is the chairman of Scotiabank Chile S.A. and member of the board of Parque Arauco S.A., Energía Llaima SpA, SmSalud S.A., Idelpa Energía S.A., Inversiones Sevillana S.A., Inmobiliaria Atlantis S.A., Inversiones del Pacífico S.A., and Administradora Costanera S.A.
Gonzalo Said Handal
Appointment: He has been member of the board of directors of the Company since April 1993. His principal occupation
Experience: He holds a business administration degree from Universidad Gabriela Mistral, with specialization in finance, best practices and corporate governance. he is as an entrepreneur. He also serves as director in the following organizations: Banco BBVA, Director Newport Ltda. (Grupo Said Handal), Membera member of the “Circleboard of Finance”directors of ICARE,Sofofa and participates inchairman of the Boardboard of Universidad Finnis Terrae and is the Chairmandirectors of Fundación Generación Empresarial
Mr. Salvador SaidEmpresarial. He has been30 years of experience in the beverage and mass consumption industry. He has knowledge and experience in risk management as a business administrator and member of the risk committee of Scotiabank Chile, as well as knowledge and experience in sustainability as a member of our boardthe ethics and sustainability committee of directors since April 1992. His principal occupation is as Director of Said Holding Group. He also serves as director in the following organizations: Chairman of Endeavor ChileEmbotelladora Andina S.A. and of Bupa Chile S.A. Board member of Parque Arauco S.A., Edelpa S.A., BBVA Chile and Envases CMF S.A. Counselor in CEP (Centro de Estudios Públicos) and inthrough Fundación Generación Empresarial.
Other positions: Currently, he serves as director of Scotiabank Chile S.A., Energia Llaima SpA and of Holding de Empresas Said Handal.
Felipe Joannon Vergara
Mr. CrespoAppointment: He has been member of ourthe board of directors of the Company since April 2013. His principal occupation is as President of Coca Cola Mexico.2018.
Experience: He holds a business administration degree wiht major in economics from Pontificia Universidad Católica de Chile and an MBA from The Wharton School. Previously, he was member of the board of directors of the companies of Grupo Luksic, development manager of Quiñenco S.A., general manager of Viña Santa Rita and assistant general manager of Cristalerías de Chile S.A. In the academic field, he is a professor at the School of Administration and Economics of the Pontificia Universidad Católica de Chile and at the ESE of the Universidad de los Andes.
Mr. ParotOther positions: has been Currently, he is a member of ourthe board of directors since April 2009. His principal occupation is as an engineerForestal O'Higgins (parent company of the Matte Group), Quimetal Industrial S.A., Icom Gestión Inmobiliaria SpA, Altis S.A. AGF and economist. He is Principal Partner and CEO at Elex Consulting Group. He also serves as Director in Inmobiliaria Elex.Maquinarias y Construcciones Río Loa S.A.
Rodrigo Vergara Montes
Mr. RodriguezAppointment: He has been member of ourthe board of directors of the Company since April 2013. His principal occupation is as attorney at law. He also serves as director in the following organizations: Lan Perú, Inmuebles Comerciales del Perú S.A., Inmuebles Panamericana S.A., La Positiva Sanitas EPS S.A., Soriperu S.A., Inversiones en Salud S.A., Automotores Gildemeister del Perú S.A., Maquinaria Nacional Perú S.A. Motormundi S.A., Prospectiva 2020 Perú,2018.
Mr. De GregorioExperience: He holds a business administration degree from from the Pontificia Universidad Católica de Chile and a PhD in Economics from Harvard University. Former President of the Banco Central de Chile (2011-2016) and director of the same monetary entity (2009-2011). He was a director of Moneda S.A., Moneda AGF, Entel S.A. and Banco Internacional. He has knowledge and experience in Risk Management due to the functions he developed in Banco Central. He exhibits knowledge and experience in sustainability from his work in the monetary entity and in the companies in which he has been director. In the area of cybersecurity, he has knowledge and experience given that this is an issue of the utmost relevance for Banco Central, as well as for the banks in which he has been director. In the academic field, he is a professor at Instituto de Economía of the Universidad Católica de Chile.
Other positions: Currently, he is member of ourthe board of Banco Santander Chile and Besalco S.A. He also is a Senior Economist at the Centro de Estudios Públicos and an Associate Researcher at the Mossavar-Rahmani Center for Business and Government of Harvard University.
Carmen Román Arancibia
Appointment: She has been member of the board of directors of the Company since June 2012. His principal occupation are Professor2021.
Experience: She holds a law degree from from Universidad Gabriela Mistral. Former chief legal officer and head of Economicscorporate affairs of Walmart Chile. She has developed a strong experience in the retail industry, working for 11 years in Walmart, four years in Santa Isabel, and for seven years in Cencosud. She has knowledge and experience in risk management due to her role as chief compliance and ethics officer in Walmart. She exhibits knowledge and experience in sustainability from her work as president of the sustainability and corporate governance committee at SOFOFA. In the area of diversity and inclusion she has knowledge and experience as mentor and trainer of female leadership programs.
Other positions: Currently, she is member of the board of directors of the legal sustainability council in the Universidad Católica and Valle Escondido Golf Club. Also, she is counselor in Comunidad Mujer and Laboratoria ONG and part of the Círculo Legal of Icare.
Executive Officers
The following table includes information regarding our senior executives:
| Name | Age(1) | Position | ||||
| Miguel Ángel Peirano | 61 | Chief Executive Officer | ||||
| Andrés Wainer | 50 | Chief Financial Officer | ||||
| Fernando Jaña | 43 | Chief Strategic Planning Officer | ||||
| Jaime Cohen | 53 | Chief Legal Officer | ||||
| Martín Idígoras | 45 | Chief IT Officer | ||||
| Gonzalo Muñoz | 59 | Chief Human Resources Officer | ||||
| Fabián Castelli | 55 | General Manager of Embotelladora del Atlántico S.A. | ||||
| Renato Barbosa | 60 | General Manager of Rio de Janeiro Refrescos Ltda. | ||||
| José Luis Solorzano | 50 | General Manager of Embotelladora Andina S.A. | ||||
| Francisco Sanfurgo | 66 | General Manager of Paraguay Refrescos S.A. | ||||
| (1) | Age at December 31, 2020. |
Miguel Angel Peirano
Chief Executive Officer
He holds an electronic engineer degree from the Instituto Tecnológico de Buenos Aires and has postgraduate studies at Harvard Business School and Stanford University. He joined the Company and became Executive Vice President in 2011. Previously, he was senior engagement manager at McKinsey & Company and was president of Coca-Cola Femsa Mercosur.
Andres Wainer
Chief Financial Officer
He holds a business administration degree with a major in economics from the Pontificia Universidad Católica de Chile and a master's degree in finance from the London Business School. He joined the Company in 1996 and since 2010 he has been Chief Financial Officer. Previously, he was development manager at Coca-Cola Andina Argentina, administration and finance manager at Coca-Cola Andina Chile and research and development corporate manager at the Corporate Office.
Jaime Cohen
Chief Legal Officer
He holds a law degree from the Universidad de Chile and non-resident Senior Fellowa master law degree from the University of Virginia, United States. He joined the Company in 2008. Previously, he was manager of legal affairs at Socovesa S.A. (2004-2008); corporate banking lawyer at Citibank N.A., Santiago de Chile (2000-2004); international associate at Milbank, Tweed, Hadley & McCloy, New York (2001-2002); associate lawyer at Cruzat, Ortúzar & Mackenna, Baker & McKenzie (1996-1999) and lawyer in the Petersen Institutearea of financial and real estate advisory at Banco Edwards (1993-1996).
Gonzalo Muñoz
Chief Human Resources Officer
He He holds an auditor accountant degree from Universidad de Chile. He joined the Company in 2015. Previously, he was director of finance, general manager and director of human resources in various latin american countries in the British American Tobacco company. He has also served as a professor of marketing at Universidad de Chile.
Martin Idigoras
Chief Information Technology Officer
He holds a bachelor's degree in systems from Universidad John F. Kennedy in Argentina, with a specialization in information technology. He joined the Company in 2018. Previously he worked for International Economics.17 years at Cencosud. During that time he served as CIO for the home improvement division (2015-2018), regional manager of the SAP center of expertise (2014-2015) and CTO for the home improvement division (2015-2018) and regional CTO (2010-June 2014). He also servesworked in different technology positions in different companies such as directorCorreo Argentino and Arcor.
Fernando Jaña
Chief Strategic Planning Officer
He holds a industrial civil engineering degree from Universidad Adolfo Ibáñez and a master's degree in logistics and supply chain management from The University of Sydney, Australia. He joined the Company in 2014 and has held his current position since 2019. He was general manager of Coca-Cola del Valle, manager of innovation and projects in Coca-Cola Andina Chile, ecommerce manager at Cencosud Supermercados and logistics and distribution manager at CCU. He has also worked as a teacher and researcher at Universidad Adolfo Ibáñez.
Jose Luis Solorzano
General Manager Coca-Cola Andina Chile
He holds a business administration degree from Universidad Adolfo Ibáñez, with specialization in the following corporations: Compañía Sudamericana de Vapores; Intervial S.A., Euroamerica S.A.areas of marketing and Ruta del Maipo S.A.finance. He joined the Company in 2003 and since 2014 he has been general manager of Coca-Cola Andina Chile. He previously held the positions of general manager of Coca-Cola Andina Argentina and commercial manager of Coca-Cola Andina Chile. Prior to that, he was commercial manager of Coca-Cola Polar.
Mr. FontaineFabian Castelli
General Manager Coca-Cola Andina Argentina
He holds a industrial engineering degree from Universidad Nacional de Cuyo, with specialization in a management development program at IAE, Argentina and Donald R. Keough System Leadership Academy. He joined the Company in 1994 and since 2014 he has been a membergeneral manager of our boardCoca-Cola Andina Argentina. Previously he held the positions of directors since June 2012. His principal occupation ishead of the mendoza sales department, business development and planning manager, marketing manager and commercial manager. He was also director of AdeS in Argentina, vice president of Asociación de Fabricantes Argentinos de Coca-Cola (AFAC) and Director of Cámara Argentina de Industria de Bebidas sin Alcohol (Argentine Chamber of Non-Alcoholic Beverages Industry).
Renato Barbosa
General Manager Coca-Cola Andina Brazil
He holds an economist degree from Universidade do Distrito Federal Brazil, with specialization in business and post graduation studies in business from FGV Sao Paulo, Brazil and an MBA in marketing from the FGV Rio de Janeiro, Brazil. He joined the Company in 2012 as a consultant. He also serves as directorgeneral manager of Coca-Cola Andina Brazil. Previously held the position of general manager of Brasal Refrigerantes (Coca-Cola bottler in the following organizations: Bolsa de Comercio de Santiago (Santiago Stock Exchange), Administradora de Inversiones La Construcción S.A., Sigdo Koppers. Advisorcentral-eastern region of Libertad y Desarrollo.Brazil).
Mr. AlscherFrancisco Sanfrugo
General Manager Coca-Cola Paresa
He holds a mechanical engineering degree from Universidad de Concepción and a specialization in project management from Universidad Adolfo Ibáñez. He joined the Company in 1988, and has been general manager of Coca-Cola Paresa since 2005. Previously, he was manager of commercial dimetral in Punta Arenas, branch manager of Citicorp Punta Arenas and general manager of Cervecería memberAustral in Punta Arenas.
| B. | COMPENSATION |
Compensation of our board of directors since June 2012. His principal occupation is as Vice President of Finance for Latin America, The Coca-Cola Company. He does not serve as director in any other organizations.Executive Officers
Mr. Vontobel has been a member ofFor our board of directors since June 2012. His principal occupation is as General Manager of Vonpar S.A. He also serves as director in Vonpar S.A.
Mr. Rossi has been a member of our board of directors since June 2012. His principal occupation is as a consultant. He does not serve as director in any other organizations.
B.COMPENSATION
Compensation of Principal Officers
The Company does not provide general incentives other than its compensation plans, except inexecutive officers, the case of its principal officers, whose compensation plans are composed of a fixed remunerationcompensation and a performance bonus, which try to adaptare defined according adapted to the realitycompetitive and competitiveoffer conditions inof each market, and whose amounts vary according to the position and/or exercised responsibility. Suchresponsibility exercised. The performance bonuses are payable only to the extent that personal goals of each principal officer and company goals are met, which are previously definedthe objectives determined by the Company for each case in particular.officer are met.
For the period ended December 31, 2015Company's Chief Executive Officer, the amountmain performance indicators are consolidated EBITDA, net income, consolidated cash flow and capex. for general managers of operations, the main performance indicators are EBITDA generated by their operation in local currency, consolidated EBITDA in Chilean pesos, participation in the NARTD (non-alcohol ready-to-drink) market share, safety and certain individualized goals in the event that the Company's Chief Executive Officer so determines.
For corporate officers, the main performance indicators are consolidated EBITDA in Chilean pesos and certain individualized goals in the event that the Company's Chief Executive Officer so determines. Particularly, for those executive officers who, by the nature of their position, are directly related to the Company's investors, there is a payment scheme for their performance bonus that is partly deferred over four years indexed to the Company's share price. Additionally, within the compensation structure for certain executive officers, there are permanence bonuses, which are paid out upon completion of the agreed terms of service.
For 2020, the fixed compensationsremuneration paid to Coca-Cola Andina’s principalAndina's executive officers amounted to ThCh$4,308 (ThCh$3,859Ch$5,259 million (Ch$4,167 million in 2014)2019). Likewise,Similarly, the amount of compensationremuneration paid infor performance bonuses amounted to ThCh$2,362 (ThCh$2,468Ch$2,502 million (Ch$2,407 million in 2014)2019). During 2020, there were no severance indemnities payed to the Company's executive officers. During 2019, the amount paid for severance indemnities to the Company's managers and executive officers amounted to Ch$55 million.
During the period ended December 31, 2015 severance payments to managers and principal officers of Embotelladora Andina S.A. were Ch$193 million. During the period ended December 31, 2014 severance payments to managers and principal officers of Embotelladora Andina S.A. were Ch$327 million.
We do not make available to the public information as to the compensation of our executive officers on an individual basis, as disclosure of such information is not required under Chilean law.
Compensation of Directors
Directors receive an annual fee for attendance to meetingstheir services and participation as members of the board of directors and committees. The amounts paid to each director for attendance at board meetings varies in accordance with the position held and the period of time during which such position is held. Total compensation paid to each director or alternate director during 2015,2020, which was approved by our shareholders, was as follows:
|
| Directors’ |
| Executive |
| Directors’ and Audit |
|
|
|
|
| Compensation |
| Committee |
| Committee |
| Total |
|
2015 |
| ThCh$ |
| ThCh$ |
| ThCh$ |
| ThCh$ |
|
|
|
|
|
|
|
|
|
|
|
Juan Claro Gonzalez |
| 144,000 |
|
|
|
|
| 144,000 |
|
Arturo Majlis Albala |
| 72,000 |
| 72,000 |
| 24,000 |
| 168,000 |
|
Gonzalo Said Handal |
| 72,000 |
| 72,000 |
|
|
| 144,000 |
|
Jose Antonio Garces Silva |
| 72,000 |
| 72,000 |
|
|
| 144,000 |
|
Salvador Said Somavia |
| 72,000 |
| 72,000 |
| 24,000 |
| 168,000 |
|
Eduardo Chadwick Claro |
| 72,000 |
| 72,000 |
|
|
| 144,000 |
|
Gonzalo Parot Palma (Ind) |
| 72,000 |
|
|
| 24,000 |
| 96,000 |
|
Francisco Crespo |
| 72,000 |
|
|
|
|
| 72,000 |
|
Cesar Emilio Rodriguez Larrain Salinas |
| 72,000 |
|
|
|
|
| 72,000 |
|
José Fernando De Gregorio Rebeco |
| 72,000 |
|
|
|
|
| 72,000 |
|
Juan Andrés Fontaine Talavera |
| 72,000 |
|
|
|
|
| 72,000 |
|
Franz Alscher |
| 72,000 |
|
|
|
|
| 72,000 |
|
Ricardo Vontobel |
| 72,000 |
|
|
|
|
| 72,000 |
|
Mariano Rossi |
| 72,000 |
|
|
|
|
| 72,000 |
|
Total |
| 1,080,000 |
| 360,000 |
| 72,000 |
| 1,512,000 |
|
| 2020 | Directors’ Compensation ThCh$ | Executive Committee ThCh$ | Directors’ and Audit Committee ThCh$ | Total ThCh$ | ||||||||||||
| Juan Claro González(1) | 144,000 | 144,000 | ||||||||||||||
| Arturo Majlis Albala(2) | 54,000 | 54,000 | 108,000 | |||||||||||||
| Gonzalo Said Handal | 72,000 | 72,000 | 144,000 | |||||||||||||
| Jose Antonio Garcés Silva | 72,000 | 72,000 | 144,000 | |||||||||||||
| Salvador Said Somavía | 72,000 | 72,000 | 24,000 | 168,000 | ||||||||||||
| Eduardo Chadwick Claro | 72,000 | 72,000 | 144,000 | |||||||||||||
| Gonzalo Parot Palma(3) | 72,000 | 24,000 | 96,000 | |||||||||||||
| Marco Antonio Fernandez De Araujo(4) | 51,000 | 51,000 | ||||||||||||||
| Rodrigo Vergara Montes | 72,000 | 72,000 | ||||||||||||||
| Mariano Rossi | 72,000 | 72,000 | ||||||||||||||
| Roberto Mercadé Rovira | 72,000 | 72,000 | ||||||||||||||
| Georges de Bourguignon Arndt | 72,000 | 72,000 | ||||||||||||||
| Enrique Rapetti(5) | 24,000 | 24,000 | ||||||||||||||
| María del Pilar Lamana Gaete(3) | 72,000 | 24,000 | 96,000 | |||||||||||||
| Felipe Joannon Vergara | 72,000 | 72,000 | ||||||||||||||
| Total Gross | 1,065,000 | 342,000 | 72,000 | 1,479,000 | ||||||||||||
| (1) | Includes Ch$72 million additional as Chairman of the Board. |
| (2) | Left the Board in September 2020. |
| (3) | Independent from controlling shareholder pursuant to Article 50 bis, paragraph 6 of the Chilean Public Company Law N° 18,046. |
| (4) | Joined the Board in April 2020. |
| (5) | Left the Board in April 2020. |
For the year that ended on December 31, 2015,2020, the aggregate amount of compensation we paid to all directors and executive officers as a group was Ch$8,1829,355 million of which Ch$6,6707,876 million was paid to our executive officers. We do not disclose to our shareholders or otherwise make available to the public information as to the compensation of our executive officers on an individual basis.basis, as disclosure of such information is not required under Chilean law. We do notonly maintain any pension ora retirement programsplan for our directors orchief executive officers. See “—Employees.”officer.
C.BOARD PRACTICES
| C. | BOARD PRACTICES |
Our board of directors has regularly scheduled meetings at least once a month, and extraordinary meetings are convened when called by the chairman or when requested by one or more directors. The quorum for a meeting of the board of directors is established by the presence of an absolute majority of its directors. Directors serve terms of 3three years from the date they are elected. Resolutions are passedadopted by the affirmative vote of an absolutea majority of those directors present at the meeting, with the chairman determining the outcome of any tie vote.
Benefits upon Termination of Employment
There are no contracts providing for benefits to Directorsdirectors upon termination of employment.
Executive Committee
Our board of directors is counseled by an Executive Committee that proposes Company policies and is currently comprised by the following Directors: Mr. Eduardo Chadwick Claro, Mr. Arturo Majlis Albala, Mr. José Antonio Garcés Silva (junior), Mr. Gonzalo Said Handal, and Mr. Salvador Said Somavía, who were elected during the ordinary Board Session N°1,086Meeting held on April 30, 2013.27, 2021. The Executive Committee is also comprised by the Chairman of the Board, Mr. Juan Claro González and by our chief executive officer who participate by their own rights.
officer. This committee meets permanently throughout the year and normally holds one or two monthly sessions.
Directors’ Committee
Pursuant to Article 50 bis of Chilean Company Law N°18,046 and in accordance towith the dispositions of Circular N°1956 and Circular N°5601,956 of the Chilean Superintendence of Securities and Insurance,Financial Market Commission (Comisión para el Mercado Financiero – “CMF”) a new Directors’ Committee was elected during the Board Session N°1086 datedMeeting held on April 30, 2013,27, 2021, applying the same election criteria set forth by Circular N°1956.1,956. The directors Mr. Domingo Cruzat Amunátegui and Mr. Gonzalo Parot Palma (as Committee Chairman and(both as Independent Director)Directors), Mr. Arturo Majlis Albala and Mr. Salvador Said Somavía comprisecomprised the Committee. Mr. Gonzalo Parot Palma is the Chairman of the Company’s Directors’ Committee.
The duties performed by this Committee during 2015,2020, following the same categorization of faculties and responsibilities established by Article 50 bis of Company Law N°18,046, of the Chilean Superintendence of Securities and Insurance, were the following:
| · | Subject to the duties of the Audit Committee, examine the reports of external auditors, the balance sheets and other financial statements, presented by the administrators of the Company, and take a position on such reports before they were presented to shareholders for their approval. |
· Examined the reports of external auditors, of the balance sheets and other financial statements, presented by the administrators of the Company to the shareholders, and to take a position on such reports before they are presented to shareholders for their approval.
| · | Subject to the duties of the Audit Committee, analyze and prepare proposal of external auditors and private rating agencies to the Board of Directors, which were suggested to the respective shareholders’ meeting. |
· Proposed External Auditors and Private Rating Agencies, accordingly to the Board of Directors were proposed to the Shareholders’ Meeting.
| · | Examine background information regarding the operations referred to by Title XVI of Law N°18,046 (related parties transactions) and issue a report on those operations. |
· Examined information regarding the operations referred to by Title XVI of Law N°18,046 and report on these operations. For detailed information regarding these operations, please refer to the Notes of the Consolidated Financial Statements included in this annual report.
| · | Examine the salary systems and compensation plans of the Company’s managers, executive officers and employees. |
· Examine the salary systems and compensation plans of managers, principal officers and employees.
| · | Review anonymous reports. |
· Reported to the Board of Directors whether it is convenient or not to hire an external auditing Company to render services that do not form part of the external audit, when they are not forbidden in accordance to article 242 of Chilean Law N°18,045 on Securities Market.
| · | Subject to the duties of the Audit Committee, review and approve the 20F and compliance with Section 404 of the Sarbanes-Oxley Act. |
· Reviewed and approved the Company’s 20F and verified management compliance with Rule 404 of the Sarbanes Oxley Act (Rule 404 states that management must evaluate Company internal controls on a yearly basis).
| · | Prepare the budget proposal for the Committee’s operation. |
· Reviewed anonymous complaints.
| · | Review internal audit reports. |
· Reviewed internal audit reports.
| · | Subject to the duties of the Audit Committee, periodically interview the Company’s external auditors’ representatives. |
· Reviewed and approved Corporate Policy on Purchases and Investments.
| · | Interview with Chief Human Resources Officer. |
· Reviewed and monitored the Internal Control system in accordance to the new COSO 2013 standard.
| · | Review operating budget between related companies (production joint ventures). |
· Reviewed and followed up on the implementation of the Coke One System.
| · | Review corporate insurances. |
· Reviewed and reported to the Board about the Corporate Policy on Conflict of Interest.
| · | Review and approve press releases that refer to the Company’s communications. |
· Followed up on the fulfillment of the Conciliation Agreement concluded with Chile’s National Economic Prosecutor (Fiscalía Nacional Económica)
| · | Review the Company’s four operations’ internal control standards, including critical risks in accounting processes, compliance of corporate policies, tax contingencies and status of internal and external audit observations. |
· Requested counseling to comply with General Rule N ° 385 of Chile’s Superintendence of Securities and Insurance, and to follow up on the reports referred to the progress in this area.
| · | Analyze risk aanagement model. |
· Acknowledged and analyzed the origin of a new business model for Stills.
| · | Review Crime Prevention Model Law No. 20,393. |
· Reviewed the terms of the Corporate Policy on Insurance.
| · | Review advances in Cybersecurity and IT. |
| · | Review judicial procedures and contingency analysis. |
| · | Review tax status. |
| · | Analyze possible improvements to corporate governance. |
| · | Prepare the Annual Management Report. |
During 2015, the Directors’ Committee incurred in expenses for Ch$42,354,736. Said expenses were related to counselling by Ernst & Young on internal control issues, market research and corporate transparency analysis and maintenance of the Company’s whistleblowing hotline.
Sarbanes-Oxley Audit Committee
In accordance with NYSE and SEC requirements, regarding compliance with the Sarbanes-Oxley Act, the boardBoard of directorsDirectors established the firstan Audit Committee on July 26, 2005. The members of thecurrent Audit Committee are designatedwas elected during the Board Meeting held on April 27, 2021. The Committee is comprised by the Board, and serve until such member’s successor is duly designated or until such member’s earlier resignation or removal.
Any member of the Audit Committee may be removed, with or without cause, by a majority vote of the Board. During Board Session N°1086 dated April 30, 2013,directors Mr. Domingo Cruzat Amunátegui, Mr. Gonzalo Parot Palma, Mr. Arturo Majlis Albala, and Mr. Salvador Said Somavía, were elected as memberswith the Board of our Audit Committee. It was determinedDirectors determining that Mr. Domingo Cruzat Amunátegui and Mr. Gonzalo Parot Palma complied withfulfill the independence standards set forth in Rule 10A-3 of the Sarbanes-OxleyU.S. Exchange Act SEC and applicable NYSE regulations.rules. Mr. Salvador Said Somavía has non-voting observer status, as described in Item 16D. Also, Mr. Parot has been appointedPalma was determined by the Board of Directors to qualify as the audit committee financial expert in accordance with the definitions of the listing standards of the NYSE and the Sarbanes-Oxley Act.SEC.
The resolutions, agreements and organization of the Audit Committee are governed by the rules relating to Board Meetings and to the Company’s Directors’ Committee. Since its creation, the sessions of the Audit Committee have been held with the Directors’ Committee, since some of the functions are very similar and the members of both of these Committees are the same.
The Audit Committee Charter, thatwhich is available on our website: www.koandina.com, defines the duties and responsibilities of this Committee. The Audit Committee is responsible for analyzing the Company’s financial statements; supporting the financial supervision and rendering of accounts; ensuring management’s development of reliable internal controls; ensuring compliance by the audit department and external auditors of their respective roles; and reviewing auditing practices.
For the period ended December 31, 2015, the AuditCulture, Ethics & Sustainability Committee did not incur any expenses.
Ethics Committee
The Culture, Ethics and Sustainability Committee was established during the Board of Directors sessionMeeting held on January 28, 2014. This Committee is composedcomprised by three directors, who are appointed by the Board of Directors and will occupy their posts until their successors are elected, or until resignation or dismissal. The current members of the Culture, Ethics and Sustainability Committee are the directors Mr. José Antonio Garcés Silva, Mr. JuanEduardo Chadwick Claro, GonzálezMrs. Carmen Román Arancibia and Mr. José De Gregorio Rebeco.Gonzalo Said Handal, in addition to the Chairman of the Board.
| D. | EMPLOYEES |
Overview
D. EMPLOYEES
Overview
OnAs of December 31, 2015,2020, we had 15,42817,354 employees, including 4,345 in Chile (3,240 own and 1,105 outsourced), 7,817 in Brazil (7,715 own and 102 outsourced), 3,102 in Chile, 7,560Argentina (3,012 own and 90 outsourced) and 1,488 in Brazil,Paraguay (1,069 own and 3,288 in Argentina and 1,478 in Paraguay. Of419 outsourced). From these employees, 289915 were temporary employees in Chile, 501387 were temporary employees in Argentina, 0 were temporary in Brazil and 15273 were temporary employees in Paraguay. During the South American Summer, it is customary for us to increase the number of employees in order to meet peak demand. Additionally, in Vital Jugos, Vital Aguas and Envases Central we had 311, 67 and 183 employees, respectively, for a total aggregate amount of 561 employees for those three companies. Additionally, the corporate office had 41 employees.
OnAs of December 31, 2015, 1,137; 605; 2,3292020, 2,181, 638, 2,078 and 316410 of our employees in Chile, Brazil, Argentina and Paraguay, respectively, were members of unions.
Management believes that the Company has good relations with its employees.
The following table represents a breakdown of our employees for the years ended December 31, 2014,2019 and 2015:2020:
|
| 2014 |
| ||||||||||||||||||||||
|
| Chile |
| Brazil |
| Argentina |
| Paraguay |
| ||||||||||||||||
|
| Total |
| Union |
| Non- |
| Total |
| Union |
| Non- |
| Total |
| Union |
| Non- |
| Total |
| Union |
| Non- |
|
Executives |
| 69 |
| — |
| 69 |
| 60 |
| — |
| 60 |
| 107 |
| — |
| 107 |
| 29 |
| — |
| 29 |
|
Technicians and professionals |
| 1,008 |
| 388 |
| 620 |
| 5,278 |
| 599 |
| 4,679 |
| 687 |
| 10 |
| 677 |
| 246 |
| 24 |
| 222 |
|
Workers |
| 1,608 |
| 1,112 |
| 496 |
| 2,202 |
| 13 |
| 2,189 |
| 2,021 |
| 1,801 |
| 220 |
| 1,103 |
| 308 |
| 795 |
|
Temporary Workers |
| 417 |
| — |
| 417 |
| 20 |
| — |
| 20 |
| 473 |
| 459 |
| 14 |
| 100 |
| — |
| 100 |
|
Total |
| 3,102 |
| 1,500 |
| 1,602 |
| 7,560 |
| 612 |
| 6,948 |
| 3,288 |
| 2,270 |
| 1,018 |
| 1,478 |
| 332 |
| 1,146 |
|
|
| 2015 |
| 2019 | ||||||||||||||||||||||||||||||||||||||||||||||||||||||||||||||||||||
|
| Chile |
| Brazil |
| Argentina |
| Paraguay |
| Chile(1) | Brazil | Argentina(2) | Paraguay | |||||||||||||||||||||||||||||||||||||||||||||||||||||||||||
|
| Total |
| Union |
| Non- |
| Total |
| Union |
| Non- |
| Total |
| Union |
| Non- |
| Total |
| Union |
| Non- |
| Total | Union | Non-Union | Total | Union | Non-Union | Total | Union | Non-Union | Total | Union | Non-Union | |||||||||||||||||||||||||||||||||||
Executives |
| 69 |
| — |
| 56 |
| 63 |
| 0 |
| 63 |
| 106 |
| — |
| 106 |
| 33 |
| — |
| 33 |
| 70 | 0 | 70 | 53 | 1 | 52 | 97 | 0 | 97 | 38 | 0 | 38 | |||||||||||||||||||||||||||||||||||
Technicians and professionals |
| 1,008 |
| 411 |
| 611 |
| 5,705 |
| 535 |
| 5,170 |
| 712 |
| 10 |
| 702 |
| 250 |
| 29 |
| 221 |
| 481 | 2 | 479 | 981 | 38 | 943 | 738 | 10 | 728 | 335 | 53 | 282 | |||||||||||||||||||||||||||||||||||
Workers |
| 1,608 |
| 726 |
| 559 |
| 2,271 |
| 70 |
| 2,201 |
| 2,050 |
| 1,884 |
| 166 |
| 1,084 |
| 287 |
| 797 |
| 3,029 | 1,858 | 1,172 | 6,998 | 696 | 6,302 | 1,883 | 1,757 | 126 | 1,168 | 357 | 811 | |||||||||||||||||||||||||||||||||||
Temporary Workers |
| 417 |
| 0 |
| 289 |
| 0 |
| — |
| 0 |
| 501 |
| 435 |
| 66 |
| 152 |
| — |
| 152 |
| |||||||||||||||||||||||||||||||||||||||||||||||
| Temporary workers | 691 | 1 | 690 | 0 | 0 | 0 | 341 | 271 | 70 | 105 | 0 | 105 | ||||||||||||||||||||||||||||||||||||||||||||||||||||||||||||
Total |
| 3,102 |
| 1,137 |
| 1,515 |
| 8,039 |
| 605 |
| 7,434 |
| 3,369 |
| 2,329 |
| 1,040 |
| 1,519 |
| 316 |
| 1,203 |
| 4,271 | 1,860 | 2,411 | 8,032 | 735 | 7,297 | 3,059 | 2,038 | 1,021 | 1,646 | 410 | 1,236 | |||||||||||||||||||||||||||||||||||
| 2020 | |||||||||||||||||||||||||||||||||||||||||||||||
| Chile(1) | Brazil | Argentina(2) | Paraguay | ||||||||||||||||||||||||||||||||||||||||||||
| Total | Union | Non-Union | Total | Union | Non-Union | Total | Union | Non-Union | Total | Union | Non-Union | ||||||||||||||||||||||||||||||||||||
| Executives | 47 | 0 | 47 | 46 | 1 | 45 | 95 | 0 | 95 | 38 | 0 | 38 | |||||||||||||||||||||||||||||||||||
| Technicians and professionals | 567 | 29 | 538 | 928 | 29 | 899 | 739 | 10 | 729 | 332 | 52 | 280 | |||||||||||||||||||||||||||||||||||
| Workers | 2,816 | 2,152 | 664 | 6,843 | 608 | 6,235 | 1,881 | 1,759 | 122 | 1,045 | 358 | 687 | |||||||||||||||||||||||||||||||||||
| Temporary workers | 915 | 0 | 915 | 0 | 0 | 0 | 386 | 308 | 77 | 73 | 0 | 73 | |||||||||||||||||||||||||||||||||||
| Total | 4,345 | 2,181 | 2,164 | 7,817 | 638 | 7,179 | 3,102 | 2,078 | 1,024 | 1,488 | 410 | 1,078 | |||||||||||||||||||||||||||||||||||
| 2019 | ||||||||||||
| Vital Aguas/Vital Jugos/Envases Central | ||||||||||||
| Total | Union | Non-Union | ||||||||||
| Executives | 10 | 0 | 10 | |||||||||
| Technicians and professionals | 135 | 44 | 91 | |||||||||
| Workers | 375 | 270 | 105 | |||||||||
| Temporary workers | 17 | 1 | 16 | |||||||||
| Total | 537 | 315 | 222 | |||||||||
| 2020 | ||||||||||||
| Vital Aguas/Vital Jugos/Envases Central | ||||||||||||
| Total | Union | Non-Union | ||||||||||
| Executives | 10 | 0 | 10 | |||||||||
| Technicians and professionals | 175 | 101 | 74 | |||||||||
| Workers | 264 | 210 | 54 | |||||||||
| Temporary workers | 102 | 0 | 102 | |||||||||
| Total | 561 | 309 | 252 | |||||||||
Management believes
| (1) | Information for Chile includes only Andina Chile. |
| (2) | Argentina includes AEASA. |
Note: The number of employees is calculated as equivalent to full time hours, which means that is has good relations with itsextraordinary hours are considered as additional employees.
Chile
In Chile, we continue to make provisions for severance indemnities in accordance with our collective bargaining agreements and current labor legislations, in the amount of one month’smonth’s salary for every year of employment subject to certain restrictions. In addition, we complementbenefit our employees’employees with a contribution to oura health insurance system thus decreasingthat complements what the employee pays, which contributes to decrease health costs for the employees’ families. Employees are required to contribute funds for financing pension funds, which are mainly managed by private entities.
In Chile 56.5%64.53% of employees with indefinite work contracts are membersaffiliated with a labor union organization, with a total of 13 labor unions. The followingunion organizations and a total of 17 collective bargaining agreements are in effect as of December 31, 2015 in the city of Santiago: (i) with Labor Union N° 1, that mainly represents workers from the bottling area, from December 1, 2015 to November 30, 2018; (ii) with Labor Union N°2, that mainly represents personnel from the areas of management, logistics and operations specialists from June 1, 2015 to June 1, 2018; (iii) with Labor Union N°3 that mainly represents sales force employees from May 1, 2014 to April 30, 2018; (iv) Collective contract with Workers Union N°3 of new salesforce from June 1, 2013 to May 31, 2016; (v) Agreement with sales force negotiating group in force since June 1, 2013 through May 31, 2016; (vi) Collective Contract with Labor Union TAR, that represents workers from the distribution area from July 1, 2012 to June 30, 2016; and collective agreement with the picking area workers from the Venecia, Renca and Carlos Valdovinos branches, from March 1st 2011, to February 28, 2015 and (vii) collective contract with a group of workers in the area of operations of the new plant Renca, effective as from July 1, 2015, until June 30, 2018.agreements.
The agreements in force as of December 31, 2015 in Coquimbo are: (i) Workers Union N°1 Agreement, formed mainly by workers from the production area, in force since March 1, 2013 through February 28, 2016; (ii) National Workers Union N°1 Agreement, which represents a part of the Administrative Employees and salesman, in force since January 1, 2014 through November 30, 2016; (iii) Collective Agreement formed mainly by Administrative Employees which is in force since September 1, 2013 through August 31, 2016; (iv) Transportation Collective Agreement, in force since May 1, 2014 through October 31, 2016. The collective agreements in force as of December 31, 2015 in Antofagasta (v) Collective agreement with Workers Union N°1 formed mainly by workers form the production area, in force since May 1 2014 through April 30, 2017; (vi) Collective agreement with Workers Union N°2, form by personnel from different areas, in force since November 27, 2013 through November 30, 2016; (vii) collective agreement with the salesmen negotiating group, in force since December 1, 2013 through November 30, 2016; (viii) Collective agreement with transportation workers from the base zone, in force since May 4, 2014 through May 4, 2017, and (ix) Collective agreement with transportation workers from Calama, in force since October 1, 2013 through September 30, 2016. Finally, the collective agreements in force as of December 31, 2015 in Punta Arenas are: (i) Collective agreement with the workers union in Punta Arenas, which mainly represents workers from the Production Area, in force since August 1, 2013, through July 31, 2016; (ii) Collective Agreement with InterAreas personnel, in force since February 1, 2014 through December 31, 2016, and (iii) Collective agreement with Transportation workers, in force since December 1, 2013 through November 30, 2016.
Brazil
In Brazil, 7.5%8.27% of our employees are members of labor unions. Collective bargaining agreements are negotiated on an industry-wide basis, although companies can negotiate special terms for their affiliates that apply to all employees in each jurisdiction where companies have a plant. Collective bargaining agreements are generally binding for one year.
With respect to Andina Brazil, there are twenty31 collective bargaining agreements currently in force.force as of December 31, 2020.
Twelve agreements for employees in the State of Rio de Janeiro:
(i) the Soft Drink Industry Employees’ Union agreement from July 1, 2015 to June 30, 2016;
(ii) the Sales Force Union agreement from May 1, 2015 to April 30, 2016;
(iii)The Sales Force II Union agreement from August 1, 2015 to July 31, 2016;
(iv) the “Forklift “ Operator Union agreement from May 1, 2015 to April 30, 2016;
(v) the “Forklift “ II Operator Union agreement from August 1, 2015 to July 31, 2016;
(vi) the Driver and Helper of the Lagos Region Union agreement from May 1, 2015 through April 30, 2016;
(vii) the Driver and Helper of the Lagos Region II Union agreement from May 1, 2015 through April 30, 2016;
(viii) Collective bargaining agreement executed with the Drivers and Nova Iguaçu Helpers effective from May 1, 2015 until April 30, 2016;
(ix) Agreement with the Drivers and Helpers Workers’ Union of Sao Goncalo in force since May 1, 2015 through April 30, 2016;
(x) Agreement with the Drivers and Helpers Workers’ Union of Rio de Janeiro in force since May 1, 2015 through April 30, 2016;
(xi) Agreement with the Drivers and Helpers Workers’ Union of Campos in force since May 1, 2015 through April 30, 2016; and
(xii) Agreement with the Drivers and Helpers Workers’ Union of Itaperuna in force since May 1, 2015 through April 30, 2016.
Four agreements for employees in the State of Espírito Santo:
(i) the Nourishment Union agreement from July 1, 2015 to June 30, 2016;
(ii) the Sales Force Union agreement from May 1, 2015 to April 30, 2016;
(iii) the Sales Force Union II agreement from May 1, 2015 to April 30, 2016; and
(iv) Agreement with the Drivers and Helpers Workers’ Union of the State of Espírito Santo in force since May 1, 2015 through April 30, 2016.
Seven agreements with employees from the State of São Paulo:
(i) Workers Union for the Beverage Industry of Ribeirão Preto since October 1, 2015 through September 1, 2016;
(ii) Agreement with the Trade Workers Union for the region of Araraquara since October 1, 2015 through September 1, 2016;
(iii) Agreement with the Trade Workers Union for the region of Franca since October 1, 2015 through September 1, 2016;
(i) Agreement with the Transportation Workers Union for the regions of Ribeirão Preto since May 1, 2015 through April 30, 2016;
(ii) Agreement with the Transportation Workers Union for the regions of Ribeirão Preto since May 1, 2015 through April 30, 2016;
(iii) Agreement with the Transportation Workers Union for the regions of Franca since May 1, 2015 through April 30, 2016;
(iv) Agreement with the Transportation Workers Union for the regions of Araquara since May 1, 2015 through April 30, 2016;
(v) Agreement with the Transportation Workers Union for the regions of Mococa since May 1, 2015 through April 30, 2016;
(vi) Agreement with the Salesmen Union of the State of São Paulo since July 1, 2015 through June 30, 2016; and
(vii) Agreement with the Security Technicians Union for the region of Ribeirão Preto, Franca, Araraquara and Mococa since May 1, 2015 through April 30, 2016.
These agreements do not require us to increase wages on a collective basis. Selected increases were granted, however, mainly in the manufacturing area.according to inflation. We provide benefits to our employees according to the relevant legislation and to the collective bargaining agreements. Andina Brazil experienced its most recent work stoppages in December 2014, for three days organized by the drivers of internal buses.buses in the Espirito Santo operation. However, as this operation no longer uses internal buses, such work stoppages are not expected to occur in the future.
Argentina
In Argentina, 69%66.6% of EDASA’s employees are parties to collective bargaining agreements and are represented by local workers’ unions associated with a national federation of unions. The Argentine Chamber of Non-Alcoholic Beverages of the Argentine Republic (Cámara Argentina de Industria de Bebidas sin Alcohol de la República ArgentinaArgentina) (the “Chamber”) and the Argentine Workers Federation of Carbonated Water (Federación Argentina de Trabajadores de Aguas Gaseosas) (the “Federation”) are parties to a collective bargaining agreement that began July 29, 2008. On November 24, 2015,27, 2020, the Chamber and the Federation entered into a new collective bargaining agreement establishing new salaries, new nonnon- salary benefits and a new complementary regulation on company contributions.
Argentine law requires severance payments upon dismissal without cause in an amount at least equal to an average of one-month’s wages for each year of employment or a fraction thereof if employed longer than three months. Severance payments are subject to maximum and minimum amounts fixed by legislations and jurisprudence of the Justice Supreme Court of Argentina.
On December 13, 2019, a public emergency in occupational matters was declared, which was in force throughout 2020. Consequently, during this period in the event of a employees’s dismissal without just cause, the employees shall be entitled to receive double the compensation referred to in the preceding paragraph. Along with this, on March 31, 2020, by means of a Decree of Need and Urgency, the national government banned dismissals without just cause and on the grounds of lack or decrease in labor and force majeure. This measure was originally valid for 90 days, but then had successive extensions, such that the measure was in force throughout 2020.
All employee contributions are made to the state social security system. Most of the health system in the Argentine territory is run by the unions through contributions from employees within the Collective Work Agreements (CCT — Convenios Colectivos de Trabajo).
Paraguay
In Paraguay, 20.8%27.6% of PARESA’s employees are members of labor unions. Collective bargaining agreements are negotiated with the company (Coca-Cola Paresa Paraguay). Unions can negotiate special terms for their members, which are applicable to all employees. Collective bargaining agreements generally have a two year term of duration.
The collective bargaining agreements that are currently in force are: (1) Collective bargaining agreement executed with the Authentic Workers’ Union of Paraguay Refrescos effective from June 16, 2015 to June 15, 2017; and (2) Workers’ Union of Paraguay Refrescos effective from April 10, 2015 to September 10, 2016.
E.SHARE OWNERSHIP
| E. | SHARE OWNERSHIP |
The following table sets forth the amount and percentage of our shares beneficially owned by our directors members of the Directors’ Committee and senior executivesexecutive officers as of December 31, 2015.2020.
|
| Series A |
| Series B |
| Series A | Series B | |||||||||||||||||||||||||||||||||||||||||||||||||||||||||||||||||
|
| Beneficial |
| % |
| Direct |
| % |
| Indirect |
| % |
| Beneficial |
| % |
| Direct |
| % |
| Indirect |
| % |
| Beneficial Owner | % Class | Direct Owner | % Class | Indirect Owner | % Class | Beneficial Owner | % Class | Direct Owner | % Class | Indirect Owner | % Class | |||||||||||||||||||||||||||||||||||
Shareholder |
|
|
|
|
|
|
|
|
|
|
|
|
|
|
|
|
|
|
|
|
|
|
|
|
| |||||||||||||||||||||||||||||||||||||||||||||||
José Antonio Garcés Silva |
| — |
| — |
| — |
| — |
| 52,987,375 |
| 11.19 |
| — |
| — |
| — |
| — |
| 25,728,183 |
| 5.43 |
| — | — | — | — | 65,487,786 | 13.84 | — | — | — | — | 13,028,183 | 2.75 | |||||||||||||||||||||||||||||||||||
Arturo Majlis Albala |
| — |
| — |
| — |
| — |
| 2,150 |
| 0.0006 |
| — |
| — |
| 5,220 |
| 0.0014 |
| — |
| — |
| |||||||||||||||||||||||||||||||||||||||||||||||
Salvador Said Somavía |
| — |
| — |
| — |
| — |
| 52,987,375 |
| 11.19 |
| — |
| — |
| — |
| — |
| 49,700,463 |
| 10.50 |
| — | — | — | — | 65,487,786 | 13.84 | — | — | — | — | 37,000,463 | 7.82 | |||||||||||||||||||||||||||||||||||
Gonzalo Said Handal |
| — |
| — |
| — |
| — |
| 52,987,375 |
| 11.19 |
| 11,761,462 |
| 3.094 |
| — |
| — |
| 37,914,463 |
| 8.018 |
| — | — | — | — | 65,489,786 | 13.84 | --- | --- | — | — | 25,214,463 | 5.33 | |||||||||||||||||||||||||||||||||||
Eduardo Chadwick Claro |
|
|
|
|
|
|
|
|
| 52,987,375 |
| 11.19 |
|
|
|
|
|
|
|
|
| 52,989,382 |
| 11.19 |
| — | — | 63,327 | 0.01 | 65,683,396 | 13.88 | — | — | 63,327 | 0.01 | 22,918,824 | 4.84 | |||||||||||||||||||||||||||||||||||
ITEM 7.MAJOR SHAREHOLDERS AND RELATED PARTY TRANSACTIONS
| ITEM 7. | MAJOR SHAREHOLDERS AND RELATED PARTY TRANSACTIONS |
A.MAJOR SHAREHOLDERS
| A. | MAJOR SHAREHOLDERS |
The following table sets forth certain information concerning beneficial ownership of our capital stock with respect to the principal shareholders known to us who maintain at least a 5% beneficial ownership in our shares and with respect to all of our directors and executive officers as a group as of December 31, 2015:2020:
|
| Series A |
| Series B |
| Series A | Series B | ||||||||||||||||||
Shareholder |
| Shares |
| % Class |
| Shares |
| % Class |
| Shares | % Class | Shares | % Class | ||||||||||||
Controlling shareholders(1) |
| 263,718,485 |
| 55.7 |
| 207,253,769 |
| 43.8 |
| 262,148,781 | 55.39 | 98,161,933 | 20.74 | ||||||||||||
The Bank of New York Mellon(2) |
| 11,023,308 |
| 2.33 |
| 50,815,002 |
| 10.7 |
| 2,458,494 | 0.52 | 13,167,618 | 2.78 | ||||||||||||
The Coca-Cola Company, directly or through subsidiaries |
| 69,348,241 |
| 14.7 |
| 69,348,241 |
| 14.7 |
| 69,348,241 | 14.65 | — | — | ||||||||||||
AFPs as a group (Chilean pension funds) |
| 21,772,987 |
| 4.6 |
| 7,205,884 |
| 1.5 |
| 32,248,480 | 6.81 | 53,912,262 | 11.39 | ||||||||||||
Principal foreign funds as a group |
| 11,023,308 |
| 2.33 |
| 50,815,002 |
| 10.7 |
| ||||||||||||||||
| International Shareholders | 37,920,965 | 8.01 | 135,083,304 | 28.54 | |||||||||||||||||||||
Executive officers as a group |
| 0 |
| 0 |
| 0 |
| 0 |
| — | — | — | — | ||||||||||||
Directors as a group(3) |
| 215,327,365 |
| 45.49 |
| 165,686,166 |
| 35.0 |
| 262,148,781 | 55.39 | 98,161,933 | 20.74 | ||||||||||||
|
| For further information of our controlling shareholders, |
| (2) | Acting as Depositary for ADRs. |
| (3) | Represents shares held directly and indirectly by Mr. Gonzalo Said Handal, Mr. José Antonio Garcés Silva (junior), Mr. Salvador Said Somavía and Mr. Eduardo Chadwick Claro. |
As of December 31, 2020, approximately 91.47% of our Series A shares and 68.68% of our Series B shares are held in Chile. It is not practicable for us to determine the number of record holders in Chile.
Our controlling shareholders are: Inversiones SH Seis Limitada (controlled by family Said Handal), Inversiones Cabildo SpA (controlled by the Said Somavia family), Inversiones Nueva Delta S.A. (controlled by the Garcés Silva family), Inversiones Nueva Sofia Limitada (controlled by the Garcés Silva family), Inversiones Playa Amarilla SpA (controlled by Andres Herrera Ramirez), Inversiones Playa Negra SpA (controlled by Patricia Claro Marchant), Inversiones Don Alfonso Limitada (controlled by María de la Luz Chadwick Hurtado), Inversiones El Campanario Limitada (controlled by María Soledad Chadwick Claro), Inversiones Los Robles Limitada (controlled by María Carolina Chadwick Claro), Inversiones Las Niñas Dos SpA (controlled by Eduardo Chadwick Claro), and the estates of Jaime Said Demaría, José Said Saffie and José Antonio Garcés Silva.
Below is a summary of the members of our controlling shareholders or their related persons and the numbers of shares and percentage they hold in Andina (including series A and series B shares):
| Controlling Shareholder Entity | Series A | Series B | ||||||
| Inversiones SH Seis Limitada(1) | 65,489,786 | 25,164,863 | ||||||
| Estate of Mr. Jaime Said Demaría (1) | - | 49,600 | ||||||
| Total of shares percentage of Andina: | 13.8371 | % | 5.3275 | % | ||||
| Inversiones Cabildo SpA(2) | 65,487,786 | 36,950,863 | ||||||
| Estate of Mr. José Said Saffie(2) | - | 49,600 | ||||||
| Total of shares percentage of Andina: | 13.8367 | % | 7.8178 | % | ||||
| Inversiones Nueva Delta S.A.(3) | 58,927,056 | - | ||||||
| Inversiones Nueva Delta Dos S.A.(3) | 3,574,999 | - | ||||||
| Inversiones Nueva Sofía Limitada(3) | 2,985,731 | 12,978,583 | ||||||
| José Antonio Garcés Silva(3) | - | 49,600 | ||||||
| Total of shares percentage of Andina: | 13.8367 | % | 2.7527 | % | ||||
| Inversiones Playa Amarilla SpA(4) | 16,689,895 | 8,513,594 | ||||||
| Inversiones Playa Negra SpA(4) | 637,205 | 315,939 | ||||||
| Inversiones El Campanario Limitada(4) | 12,089,074 | - | ||||||
| Inversiones Los Robles Limitada(4) | 12,089,074 | 6,638,363 | ||||||
| Inversiones Las Niñas Dos SpA(4) | 12,089,074 | - | ||||||
| Inversiones Don Alfonso Limitada(4) | 12,089,074 | 7,450,928 | ||||||
| Eduardo Chadwick Claro(4) | 63,327 | 63,327 | ||||||
| Total of shares percentage of Andina: | 13.8914 | % | 4.8559 | % | ||||
| (1) | Inversiones SH Seis Limitada is controlled by the Said Handal family. The family members are: Jaime, Gonzalo, Javier, Bárbara, Marisol and Cristina Said Handal. |
| (2) | Inversiones Cabildo SpA is controlled by the Said Somavia family. The family members are: Isabel Margarita Somavía Dittborn and Salvador, Isabel, Constanza and Loreto Said Somavía. |
| (3) | Inversiones Nueva Delta S.A., Inversiones Nueva Delta Dos S.A. and Inversiones Nueva Sofía Limitada are controlled by the Garcés Silva family. The family members are: José Antonio Garcés Silva (father), María Teresa Silva Silva and María Teresa, María Paz, José Antonio (Jr.), Matías Alberto and Andrés Sergio Garcés Silva. |
| (4) | Inversiones Playa Amarilla SpA is controlled by Andrés Herrera Ramírez; Inversiones Playa Negra SpA is controlled by Patricia Claro Marchant; Inversiones Don Alfonso Limitada is controlled María de la Luz Chadwick Hurtado; Inversiones El Campanario Limitada is controlled by María Soledad Chadwick Hurtado; Inversiones Los Robles Limitada is controlled by María Carolina Chadwick Claro; and |
Our controlling shareholders act pursuant to a shareholders’ agreement that establishes that this group will exercise joint control in order to ensure a majority vote at shareholders’ meetings and board sessions.meetings. Our controlling shareholders pass resolutions with the simply majority approval of at least four of the five parties, except with respect to the following matters, which require aan unanimous decision:
| · | carrying out of new business activities different from our current line of business (unless related to “ready to drink products” or Coca-Cola products); |
· the carrying out of new business activities different from our current line of business (unless related to “ready to drink products” or Coca Cola products);
| · | amendment of the number of our directors; |
| · | issuances of new shares; |
| · | spin-offs or mergers; |
| · | capital increases (subject to certain indebtedness thresholds); and |
| · | the joint acquisition of our Series A shares. |
· the amendment of the number of our directors;
· issuances of new shares;
· spin-offs or mergers;
· capital increases (subject to certain indebtedness thresholds); and
· the joint acquisition of our Series A shares.
In connection with The Coca-Cola Company’s investment in us, The Coca-Cola Company and our controlling shareholders entered into a Shareholders’ Agreement dated September 5, 1996, as amended (the “Amended and Restated Shareholders Agreement or Shareholders’ Agreement”-incorporated,included as Exhibitexhibit to the Form 20-F)this annual report), providing for certain restrictions on the transfer of shares of our capital stock by the Coca-Cola Shareholders and our controlling shareholders. Specifically, our controlling shareholders are restricted from transferring its Series A shares without the prior authorization of The Coca-Cola Company. The Shareholders’ Agreement also provides for certain corporate governance matters, including the right of the Coca-Cola shareholders to elect two members of our board of directors soas long as The Coca-Cola Company and its subsidiaries collectively own, in aggregate, a certain percentage of the Series A shares. In addition, in related agreements, our controlling shareholders granted The Coca-Cola Company an option, exercisable upon the occurrence of certain changes in the beneficial ownership of the Controlling Group,controlling shareholders, to acquire 100% of the Series A shares held by our controlling shareholders at a price and in accordance with procedures established in such agreements.
B.RELATED PARTY TRANSACTIONS
| B. | RELATED PARTY TRANSACTIONS |
In the ordinary course of our business, we engage in a variety of transactions with certain of our affiliates and related parties. Financial information concerning these transactions is set forth in Notenote 12.3 to our Consolidated Financial Statementsconsolidated financial statements and were carried out under the following conditions: (i) they were previously approved by the Company’s Board of Directors, with the abstention of the director involved in the corresponding case; (ii) the purpose of these transactions was to contribute to the Company’s interest; and (iii) they were consistent with prevailing market price, terms and conditions at the time of their approval. Our Directors’ Committee is charged withresponsible for evaluating transactions with related parties and to report onfor reporting these transactions to the full board of directors. See “Item 6. Directors, Senior Management and Employees—Directors’ Committee.”Committee”.
Our management believes, to the best of its knowledge, that it has complied in all material respects with the Chilean Public Company law regarding to the transactions with related parties in effect atas of December 31, 2015.2020. There can be no assurance, however, that these regulations will not be modified in the future.
C.INTERESTS OF EXPERTS AND COUNSEL
| C. | INTERESTS OF EXPERTS AND COUNSEL |
Not applicable.
| ITEM 8. | FINANCIAL INFORMATION |
A.CONSOLIDATED STATEMENTS AND OTHER FINANCIAL INFORMATION
| A. | CONSOLIDATED STATEMENTS AND OTHER FINANCIAL INFORMATION |
See “Item 18. —Financial18 - Financial Statements” for our Consolidated Financial Statementsconsolidated financial statements filed as part of this annual report.
Contingencies
We are party to certain legal proceedings that have arisen during the normal course of business, and we believe none of them are likely to have a material adverse effect on our financial condition. In accordance with accounting principles, the provisions regarding legal proceedings must be recorded if said procedures are reasonably probable to be resolved against the Company.
The following table represents accounting provisions made as of December 31, 20142019 and 2015,2020, for potential loss contingencies stemming from labor, tax, commercial and other litigation faced by our Company:
|
| For the year ended December 31, |
| For the year ended December 31, | |||||||||
|
| 2014 |
| 2015 |
| 2019 | 2020 | ||||||
|
| Million Ch$ |
| Million Ch$ | |||||||||
Chile |
| 366 |
| 263 |
| 2,065 | 1,301 | ||||||
Brazil |
| 76,016 |
| 62,571 |
| 66,070 | 47,946 | ||||||
Argentina |
| 1,430 |
| 1,468 |
| 968 | 789 | ||||||
| Paraguay | 3 | 34 | |||||||||||
Total |
| 77,812 |
| 64,302 |
| 69,108 | 50,070 | ||||||
For more details, see note 23 of our consolidated financial statements included herein.
Dividend Policy
The declaration and payment of dividends are determined, subject to the limitations set forth below, by the affirmative vote of a majority of our shareholders at a general shareholders’ meeting, based upon the recommendation of our board of directors.
At our annual ordinary shareholders’ meeting, our board of directors submits our annual financial statements for the preceding fiscal year together with reports prepared by our Audit Committee for approval by our shareholders. Once our shareholders have approved our annual financial statements, they determine the allocation of our net income, after provision for income taxes and legal reserves for the preceding year and taking into accountconsidering the accumulation of losses from prior periods. All shares of our capital stock outstanding at the time a dividend or other distribution is declared are entitled to share equally in that dividend or other distribution, except that holders of our Series B shares are entitled to a dividend 10% greater than any dividend on Series A shares.
Pursuant to Chilean law, we must distribute cash dividends equal to at least 30% of our annual net income, calculated in accordance with IFRS. If we do not record any net income in a given year, we are not legally required to distribute dividends from accumulated earnings. At the annualgeneral shareholders’ meeting of shareholders held inon April of 2014,15, 2021, our shareholders authorized our board of directors to distribute at its discretion, interimfinal dividends during 2014on account of 2020 fiscal year and 2015.an Additional dividend on account of retained earnings.
During 2013, 20142018, 2019 and 2015,2020, our respective general shareholders’ meetings approved additional dividend payments to be paid from retained earnings, given our significant cash generation. These additional dividend payments for 2013, 20142018, 2019 and 20152020 are not indicative of whether or not additional dividend payments will be made in any future period.
The following table sets forth the amount in Chilean pesos of dividends declared and paid per share each year and the U.S. dollar amounts paid to shareholders (each ADR represents six shares), on each of the respective payment dates:
|
|
|
|
|
| Aggregate |
| Series A |
| Series B |
| ||||
Dividend |
| Dividend |
| Fiscal year with respect |
| Declared and |
| Ch$ |
| US$ |
| Ch$ |
| US$ |
|
12-22-15 |
| 01-28-16 |
| 2015 |
| 16,896 |
| 17.00 |
| 0.02374 |
| 18.70 |
| 0.02611 |
|
09-29-15 |
| 10-29-15 |
| 2015 |
| 14,908 |
| 15.00 |
| 0.02182 |
| 16.50 |
| 0.02400 |
|
04-22-15 |
| 08-28-15 |
| Accumulated earnings |
| 14,908 |
| 15.00 |
| 0.02144 |
| 16.50 |
| 0.02358 |
|
04-22-15 |
| 05-29-15 |
| 2014 |
| 14,908 |
| 15.00 |
| 0.02429 |
| 16.50 |
| 0.02673 |
|
12-18-14 |
| 01-29-15 |
| 2014 |
| 8,945 |
| 9.00 |
| 0.01446 |
| 9.90 |
| 0.01590 |
|
09-30-14 |
| 10-29-14 |
| 2014 |
| 13,020 |
| 13.10 |
| 0.02252 |
| 14.41 |
| 0.02478 |
|
04-21-14 |
| 08-20-14 |
| Accumulated earnings |
| 12,295 |
| 12.37 |
| 0.02138 |
| 13.607 |
| 0.02352 |
|
04-21-14 |
| 05-16-14 |
| Accumulated earnings |
| 12,295 |
| 12.37 |
| 0.02234 |
| 13.607 |
| 0.02458 |
|
04-21-14 |
| 05-16-14 |
| 2013 |
| 1,451 |
| 1.46 |
| 0.00264 |
| 1.606 |
| 0.00290 |
|
12-18-14 |
| 01-29-15 |
| 2014 |
| 8,945 |
| 9.0 |
| 0.01446 |
| 9.9 |
| 0.01591 |
|
12-17-13 |
| 01-23-14 |
| 2013 |
| 13,020 |
| 13.1 |
| 0.02407 |
| 14.41 |
| 0.02648 |
|
04-24-13 |
| 11-15-13 |
| Accumulated earnings |
| 46,713 |
| 47.0 |
| 0.09023 |
| 51.7 |
| 0.09925 |
|
05-28-13 |
| 06-26-13 |
| 2013 |
| 12,225 |
| 12.3 |
| 0.02419 |
| 13.53 |
| 0.02660 |
|
04-25-13 |
| 05-20-13 |
| Accumulated earnings |
| 12,225 |
| 12.3 |
| 0.02581 |
| 13.53 |
| 0.02814 |
|
11-20-12 |
| 12-27-12 |
| 2012 |
| 24,331 |
| 24.48 |
| 0.05110 |
| 26.930 |
| 0.05621 |
|
10-02-12 |
| 10-30-12 |
| 2012 |
| 12,165 |
| 12.24 |
| 0.02550 |
| 13.460 |
| 0.02805 |
|
02-27-12 |
| 05-31-12 |
| Accumulated earnings |
| 19,398 |
| 24.3 |
| 0.04692 |
| 26.730 |
| 0.05161 |
|
04-27-12 |
| 05-11-12 |
| 2011 |
| 8,757 |
| 10.97 |
| 0.02256 |
| 12.067 |
| 0.02481 |
|
04-27-11 |
| 07-26-11 |
| Accumulated earnings |
| 39,914 |
| 50.0 |
| 0.10811 |
| 55.000 |
| 0.11892 |
|
| Dividend Approval | Dividend | Fiscal year with respect to which | Aggregate Amount of Dividends Declared and Paid | Series A | Series B | |||||||||||||||||||||
Date | payment Date | dividend was declared | (Ch$ millions) | Ch$ per share | US$ per share | Ch$ per share | US$ per share | |||||||||||||||||||
| 12-22-2020 | 01-29-2021 | 2020 | 25,841 | 26.00 | 0.03507 | 28.60 | 0.03858 | |||||||||||||||||||
| 10-27-2020 | 11-24-2020 | 2020 | 25,841 | 26.00 | 0.03394 | 28.60 | 0.03734 | |||||||||||||||||||
| 02-25-2020 | 08-28-2020 | Accumulated earnings | 25,841 | 26.00 | 0.03315 | 28.60 | 0.03647 | |||||||||||||||||||
| 02-25-2020 | 05-29-2020 | 2019 | 25,841 | 26.00 | 0.03199 | 28.60 | 0.03519 | |||||||||||||||||||
| 12-20-2019 | 01-23-2020 | 2019 | 22,462 | 22.60 | 0.02927 | 24.86 | 0.03220 | |||||||||||||||||||
| 09-24-2019 | 10-24-2019 | 2019 | 21,369 | 21.50 | 0.02961 | 23.65 | 0.03257 | |||||||||||||||||||
| 04-17-2019 | 08-29-2019 | Accumulated earnings | 21,369 | 21.50 | 0.02969 | 23.65 | 0.03266 | |||||||||||||||||||
| 04-17-2019 | 05-30-2019 | 2018 | 21,369 | 21.50 | 0.03036 | 23.65 | 0.03339 | |||||||||||||||||||
| 12-20-2018 | 01-24-2019 | 2018 | 21,369 | 21.50 | 0.03199 | 23.65 | 0.03519 | |||||||||||||||||||
| 09-25-2018 | 10-25-2018 | 2018 | 21,369 | 21.50 | 0.03127 | 23.65 | 0.03440 | |||||||||||||||||||
| 04-19-2018 | 08-30-2018 | Accumulated earnings | 21,369 | 21.50 | 0.03160 | 23.65 | 0.03475 | |||||||||||||||||||
| 04-19-2018 | 05-31-2018 | 2017 | 21,369 | 21.50 | 0.03406 | 23.65 | 0.03746 | |||||||||||||||||||
| 12-22-2017 | 01-25-2018 | 2017 | 21,369 | 21.50 | 0.03587 | 23.65 | 0.03946 | |||||||||||||||||||
| 09-27-2017 | 10-26-2017 | 2017 | 18,884 | 19.00 | 0.03018 | 20.90 | 0.03319 | |||||||||||||||||||
| 04-26-2017 | 08-31-2017 | Accumulated earnings | 18,884 | 19.00 | 0.03021 | 20.90 | 0.03323 | |||||||||||||||||||
| 04-26-2017 | 05-30-2017 | 2016 | 18,884 | 19.00 | 0.02814 | 20.90 | 0.03095 | |||||||||||||||||||
| 12-22-2016 | 01-26-2017 | 2016 | 18,884 | 19.00 | 0.02931 | 20.90 | 0.03224 | |||||||||||||||||||
| 09-27-2016 | 10-27-2016 | 2016 | 16,896 | 17.00 | 0.02601 | 18.70 | 0.02861 | |||||||||||||||||||
| 04-21-2016 | 08-27-2016 | Accumulated earnings | 16,896 | 17.00 | 0.02564 | 18.70 | 0.02821 | |||||||||||||||||||
| 04-21-2016 | 05-27-2016 | 2015 | 16,896 | 17.00 | 0.02473 | 18.70 | 0.02721 | |||||||||||||||||||
| 12-22-2015 | 01-28-2016 | 2015 | 16,896 | 17.00 | 0.02374 | 18.70 | 0.02611 | |||||||||||||||||||
| 09-29-2015 | 10-29-2015 | 2015 | 14,908 | 15.00 | 0.02182 | 16.50 | 0.02400 | |||||||||||||||||||
| 04-22-2015 | 08-28-2015 | Accumulated earnings | 14,908 | 15.00 | 0.02144 | 16.50 | 0.02358 | |||||||||||||||||||
| 04-22-2015 | 05-29-2015 | 2014 | 14,908 | 15.00 | 0.02429 | 16.50 | 0.02673 | |||||||||||||||||||
| 12-18-2014 | 01-29-2015 | 2014 | 8,946 | 9.00 | 0.01446 | 9.90 | 0.01590 | |||||||||||||||||||
B.SIGNIFICANT CHANGESAt our general shareholders’ meeting held on April 15, 2021, the distribution of dividends corresponding to the year 2020 were approved. The general shareholders’ meeting approved to distribute definitive dividends for the amount of Ch$25,841,367,092, and additional dividends for the amount of Ch$25,841,367,092, which are expected to be paid in May and August, 2021, respectively.
| B. | SIGNIFICANT CHANGES |
We are not aware of any changes bearing upon our financial condition since the date of the financial statements included in this annual report.
| THE OFFER AND LISTING |
| A. | OFFER AND LISTING DETAILS |
Our common shares are listed and traded on the Santiago Stock Exchange and on the Bolsa Electrónica de Chile (the Chilean Electronic Stock Exchange) and, until October 2018, were listed on the Bolsa de Corredores de Valparaiso (the Valparaiso Brokers Stock Exchange), which closed operations in October 2018.
A.OFFER AND LISTING DETAILS
Shares ofAlso, our common stock trade in Chile on the Bolsa de Comercio de Santiago, the Bolsa de Valores Electrónica and the Bolsa de Valores de Valparaíso. Also, shares of our common stock have been traded in the United States on the New York Stock Exchange (“NYSE”) since July 14, 1994 in the form of ADRs, which represent six common shares of common stock.each. The Depositary for the ADRs is The Bank of New York Mellon.York.
The table below shows the high and low daily closing prices of the common stock in Chilean pesos and the trading volume of the common stock on the Santiago Stock Exchange for the periods indicated. It also shows the high and low daily closing prices of the ADRs and the volume traded in the NYSE.
|
| Share Volume |
| Ch$ per Share |
| ||||||||
|
| Series A |
| Series B |
| Series A |
| Series B |
| ||||
|
|
|
|
|
| High |
| Low |
| High |
| Low |
|
2009 |
| 63,647 |
| 125,476 |
| 1,440 |
| 1,088 |
| 1,740 |
| 1,262 |
|
2010 |
| 15,196 |
| 110,049 |
| 2,072 |
| 1,282 |
| 2,501 |
| 1,621 |
|
2011 |
| 38,416 |
| 79,599 |
| 2,120 |
| 1,600 |
| 2,521 |
| 1,780 |
|
2012 |
| 45,877 |
| 123,437 |
| 2,550 |
| 1,847 |
| 3,155 |
| 2,220 |
|
2013 |
| 41,873 |
| 79,618 |
| 2,622 |
| 1,847 |
| 3,350 |
| 2,310 |
|
2014 |
|
|
|
|
|
|
|
|
|
|
|
|
|
1st Quarter |
| 12,606 |
| 36,919 |
| 1,890 |
| 1,590 |
| 2,525 |
| 1,900 |
|
2nd Quarter |
| 14,817 |
| 22,665 |
| 1,840 |
| 1,600 |
| 2,380 |
| 1,982 |
|
3rd Quarter |
| 10,363 |
| 27,004 |
| 1,730 |
| 1,590 |
| 2,123 |
| 1,865 |
|
4th Quarter |
| 16,478 |
| 27,034 |
| 1,640 |
| 1,400 |
| 1,975 |
| 1,705 |
|
2015 |
|
|
|
|
|
|
|
|
|
|
|
|
|
1st Quarter |
| 10,104 |
| 22,584 |
| 1,500 |
| 1,350 |
| 1,829 |
| 1,550 |
|
2nd Quarter |
| 11,388 |
| 47,093 |
| 1,680 |
| 1,300 |
| 2,180 |
| 1,585 |
|
3rd Quarter |
| 10,044 |
| 33,332 |
| 2,200 |
| 1,510 |
| 2,800 |
| 1,800 |
|
4th Quarter |
| 11,837 |
| 23,200 |
| 2,200 |
| 1,830 |
| 2,710 |
| 1,970 |
|
Last six months |
|
|
|
|
|
|
|
|
|
|
|
|
|
Oct-15 |
| 1,585 |
| 9,929 |
| 2,200 |
| 1,999 |
| 2,710 |
| 2,300 |
|
Nov-15 |
| 6,573 |
| 7,119 |
| 2,050 |
| 1,925 |
| 2,563 |
| 2,144 |
|
Dec-15 |
| 3,678 |
| 6,151 |
| 2,000 |
| 1,830 |
| 2,300 |
| 1,970 |
|
Jan-16 |
| 4,736 |
| 8,259 |
| 1,970 |
| 1,674 |
| 2,100 |
| 1,750 |
|
Feb-16 |
| 3,195 |
| 7,686 |
| 1,800 |
| 1,600 |
| 2,125 |
| 1,903 |
|
Mar-16 |
| 2,139 |
| 8,924 |
| 1,900 |
| 1,750 |
| 2,240 |
| 2,030 |
|
|
| ADR Volume |
| US$ per Share |
| ||||||||
|
| Series A |
| Series B |
| Series A |
| Series B |
| ||||
|
|
|
|
|
| High |
| Low |
| High |
| Low |
|
2009 |
| 1,307 |
| 6,366 |
| 17.19 |
| 10.26 |
| 18.50 |
| 12.36 |
|
2010 |
| 2,076 |
| 7,140 |
| 28.83 |
| 15.04 |
| 31.40 |
| 18.68 |
|
2011 |
| 911 |
| 5,089 |
| 26.25 |
| 15.04 |
| 31.41 |
| 21.00 |
|
2012 |
| 1,276 |
| 6,030 |
| 33 |
| 21 |
| 40 |
| 26 |
|
2013 |
| 1,351 |
| 4,930 |
| 34.07 |
| 15.04 |
| 42.23 |
| 26.51 |
|
2014 |
|
|
|
|
|
|
|
|
|
|
|
|
|
1st Quarter |
| 457 |
| 2,567 |
| 21.50 |
| 16.59 |
| 28.25 |
| 19.75 |
|
2nd Quarter |
| 393 |
| 2,257 |
| 21.45 |
| 17.06 |
| 25.75 |
| 21.19 |
|
3rd Quarter |
| 167 |
| 2,346 |
| 19.08 |
| 16.04 |
| 22.96 |
| 18.19 |
|
4th Quarter |
| 498 |
| 2,843 |
| 16.15 |
| 14.00 |
| 19.93 |
| 16.82 |
|
2015 |
|
|
|
|
|
|
|
|
|
|
|
|
|
1st Quarter |
| 237 |
| 1,861 |
| 15.00 |
| 12.14 |
| 17.77 |
| 14.87 |
|
2nd Quarter |
| 150 |
| 4,716 |
| 16.48 |
| 12.56 |
| 21.46 |
| 15.32 |
|
3rd Quarter |
| 221 |
| 2,718 |
| 18.68 |
| 13.18 |
| 23.74 |
| 16.35 |
|
4th Quarter |
| 199 |
| 2,606 |
| 19.20 |
| 15.14 |
| 24.01 |
| 16.56 |
|
Last six months |
|
|
|
|
|
|
|
|
|
|
|
|
|
Oct-15 |
| 63 |
| 1,311 |
| 19.20 |
| 16.67 |
| 24.01 |
| 20.00 |
|
Nov-15 |
| 88 |
| 505 |
| 17.48 |
| 15.31 |
| 22.33 |
| 18.28 |
|
Dec-15 |
| 49 |
| 790 |
| 16.85 |
| 15.14 |
| 18.90 |
| 16.56 |
|
Jan-16 |
| 53 |
| 1,118 |
| 16.01 |
| 14.20 |
| 17.80 |
| 14.21 |
|
Feb-16 |
| 263 |
| 744 |
| 15.48 |
| 14.17 |
| 18.30 |
| 14.78 |
|
Mar-16 |
| 49 |
| 607 |
| 17.49 |
| 15.34 |
| 19.82 |
| 17.56 |
|
Source: Bloomberg
The total number of registered ADR holders we had at December 20152020 was 28 (31623 (18 in the Series A ADRs and 75 in the Series B ADRs). As of thisthat date the ADRs represented 6.34%1.65% of the total number of our issued and outstanding shares. On December 31, 2015,2020 the closing price for the Series A shares on the Santiago Stock Exchange was Ch$1,955.001,580.00 per share (US$16.28 13.32 per Series A ADR), and Ch$2,130.001,829.00 for the Series B shares (US$17.41 14.94 per Series B ADR). At December 31, 2015,2020, there were 2,070,218409,749 Series A ADRs (equivalent to 9,269,3642,458,494 Series A shares) and 8,926,7012,194,603 Series B ADRs (equivalent to 50,710,23613,167,618 Series B shares).
Trading activity on the Santiago Stock Exchange is on average substantially less than that on the principal national securities exchanges in the United States. We estimate that for the year ended December 31, 2015, Andina’s shares were traded on the Santiago Stock Exchange on an average of approximately 81% and 100% of such trading days, for Series A and Series B shares respectively.
Other than as previously discussed in “Item 7-Major7 - Major Shareholders”, we are not aware of any other existing contracts or documents that impose material limitations or qualifications on the rights of shareholders of our listed securities.
Debt Securities
The Central Bank is responsible, inter alia, for Chile’s monetary policies and exchange controls. The Central Bank has authorized Chilean issuers to offer bonds in Chile and abroad under the terms of Chapter XIV of the Compendium of Foreign Exchange Regulations (Compendio de Normas de Cambios Internacionales or CFER). The following paragraphs summarize some of the Central Bank rules on international bond issuances.This summary does not intend to be complete and those interested in a full description should refer to Chapter XIV of the CFER.
Effective April 19, 2001 the CFER greatly simplified the procedure to register capital contributions, investments and foreign loans, including bonds issuances. Payments or remittances of funds, to or from Chile, in connection with credits granted abroad should be made through the Formal Exchange Market, which is composed by the main commercial banks that operate in Chile. When foreign currency resulting from loans or bonds is made available to the beneficiary in the country, the intervening bank should issue the pertinent “Form” and request certain information from the debtor and creditor, as applicable, pursuant to Chapter XIV.
Payments or remittances of foreign currency as capital, interest, adjustments, profits and other benefits originating in the transactions regulated under Chapter XIV must be reported to the Central Bank as follows: (i) if the foreign currency represents a remittance made from Chile, the intervening Formal Exchange Market bank should issue the above form; (ii) the issuer or borrower should inform the Central Bank, within the first 10 days of the month following the date of the transaction, if the foreign currency used to make the pertinent payments originates from credit transactions for which the foreign currency has been used directly abroad or if the corresponding payment obligation is fulfilled abroad using funds other than those indicated in Chapter XIV.
Any change in the terms of the transaction must be reported to the Central Bank within 10 days after formalization. This requirement applies, among others, to the substitution of the debtor or creditor, total or partial assignments of credits or rights and the modification of the financial terms of the respective credit regarding investments or capital contributions.
Exchange rule amendments dated April 2001 established that transactions recorded prior to April 19, 2001 will continue to be governed by the rules in force at the time they were recorded, but that the parties may choose to apply the new regulations.
These procedures also apply to foreign loans obtained through the placement of convertible bonds, in which case the issuer shall report to the Central Bank any increase or decrease in their registered amount as a result of the conversion of convertible bonds denominated and payable in Chilean pesos, for other convertible bonds denominated and payable in foreign currency or shares, as applicable, acquired by foreign investors with proceeds that had entered Chile under the terms of Chapter XIV.
According to Chapter XIV, the Central Bank established that credits relating to acts, agreements or contracts which create a direct obligation of payment or remittance of foreign currency abroad by persons domiciled or residing in Chile, that exceed on an individual basis the sum of US$100,000 or the equivalent in other foreign currencies, absent any special rule in the CFER, shall be reported to the Chilean Central Bank by the obligor either directly or through a Formal Exchange Market entity using the forms contained in the CFER, within 10 days from formalization.
In February 1999, after obtaining the requisite authorization from the Central Bank, we issued bonds in the international markets, subject to the exchange regulations in effect at that time. The main difference between the exchange regime applicable to our bond issuances and those currently in effect, is that in the case of our bond issuances the Central Banks warrants the access to currency markets. However, the regime applicable to our bond issuance has less flexibility as far as the procedures to carry out payments or remittances to bond holders.
We cannot give any assurance that the Central Bank will not impose future restrictions applicable to the holders of debt securities, nor can we make any evaluation of the duration or impact of such restrictions, if imposed.
B.PLAN OF DISTRIBUTION
| B. | PLAN OF DISTRIBUTION |
Not applicable.
C.MARKETS
| C. | MARKETS |
See “Item 9. The Offer and Listing—A. Offer and Listing Details.”Details”.
D.SELLING SHAREHOLDERS
| D. | SELLING SHAREHOLDERS |
Not applicable.
E.DILUTION
| E. | DILUTION |
Not applicable.
ITEM 10.ADDITIONAL INFORMATION
| ITEM 10. | ADDITIONAL INFORMATION |
A.SHARE CAPITAL
| A. | SHARE CAPITAL |
Not applicable.
B.MEMORANDUM AND ARTICLES OF ASSOCIATION
| B. | MEMORANDUM AND ARTICLES OF ASSOCIATION |
Our bylaws (“Estatutos”) are incorporatedincluded as an Exhibitexhibit to this Form 20F,annual report, and are also available on our website www.koandina.com, under Corporate Governance/Board of Directors/Deeds of Incorporation. The following is a summary of the material provisions of our bylaws. The last amendment of our bylaws was approved on July 12, 2012.
Organization
We are a publicly held company and were incorporated inon February 7, 1946. Our legal domicile is the city of Santiago, Chile, notwithstanding the special domiciles of offices, agencies or branches that are established in the country as well as abroad. Our duration is indefinite.
Purposes
Our corporate purposes are to execute and develop the following:
| · | Develop one or more industrial establishments dedicated to the business, operations and activities to manufacture, produce, transform, bottle, can, distribute, transport, import, export, purchase, sell and market in general, in any form and in any way, any type of food product and in particular any type of mineral water, juice, beverage and drink in general or other similar products, and raw materials or semi-finished materials used in such activities and/or products complementary or related to the preceding businesses and activities; |
· Develop one or more industrial establishments dedicated to the business, operations and activities to manufacture, produce, transform, bottle, can, distribute, transport, import, export, purchase, sell and market in general, in any form and in any way, any type of food product and in particular any type of mineral water, juice, beverage and drink in general or other similar products, and raw materials or semi- finished materials used in such activities and/or products complementary or related to the preceding businesses and activities;
| · | Develop one or more agricultural or agro industrial establishments and farmland dedicated to the business, operations and development of agricultural activities and agro industry in general; |
| · | Produce, transform, distribute, transport, import, export, purchase, sell and market in general, in any form and in any way, any type of agricultural products and/or agro industrial products and raw materials, or semi-finished materials used in such activities, and/or products complementary or related to the preceding activities; |
| · | Manufacture, distribute, transport, import, export, purchase, sell and market in general, in any form and in any way, any type of container; and execute and develop any type of material recycling process and activity; |
| · | Accept from and/or grant the representation of trademarks, products and/or licenses related to such businesses, activities, operations and products to national or foreign companies; |
| · | Provide any type of service and/or technical assistance in any way related to the goods, products, businesses and activities referred to in the preceding letters; |
| · | Invest cash surplus, even in the capital market; and |
· Develop one or more agricultural or agro industrial establishments and farm land dedicated to the business, operations and development of agricultural activities and agro industry in general;
· Produce, transform, distribute, transport, import, export, purchase, sell and market in general, in any form and in any way, any type of agricultural products and/or agro industrial products and raw materials, or semi-finished materials used in such activities, and/or products complementary or related to the preceding activities;
· Manufacture, distribute, transport, import, export, purchase, sell and market in general, in any form and in any way, any type of container; and execute and develop any type of material recycling process and activity;
· Accept from and/or grant the representation of trademarks, products and/or licenses related to such businesses, activities, operations and products to national or foreign companies;
· Provide any type of service and/or technical assistance in any way related to the goods, products, businesses and activities referred to in the preceding letters;
· Invest cash surplus, even in the capital market; and
· In general, undertake all other businesses and activities supplementary or linked to the above mentioned operations.
| · | In general, undertake all other businesses and activities supplementary or linked to the above mentioned operations. |
We may execute our objectives directly or by participating as a partner or shareholder in other companies or by acquiring rights or interests in any other type of association related to the aforementioned activities.
Voting Rights
Our capital equity is divided into Series A shares and Series B shares, both preferred and with no par value, whose features, rights and privileges are the following:
| · | The preference of Series A shares consists solely of the right to elect twelve out of the fourteen board members of the Company. Series A shares are entitled to full voting rights without limitations. |
· The preference of Series A shares consists solely of the right to elect twelve out of the fourteen board members of the Company. Series A shares are entitled to full voting rights without limitations.
| · | The preference of Series B shares consists solely of the right to receive all and any of the per share dividends we may distribute, whether temporary, definitive, minimum mandatory, additional, or eventual, increased by 10%. Series B shares are entitled to a limited voting right, voting only with respect to the election of two board members for the Company. |
| · | The preferences of Series A and B shares will remain in effect through December 31, 2130. Once this period has expired, Series A and B will be eliminated and the shares which comprise them shall automatically become common shares without any preferences whatsoever, therefore eliminating the division of shares into series. |
· The preference of Series B shares consists solely of the right to receive all and any of the per share dividends we may distribute, whether temporary, definitive, minimum mandatory, additional, or eventual, increased by 10%. Series B shares are entitled to a limited voting right, voting only with respect to the election of two board members for the Company.
· The preferences of Series A and B shares will remain in effect through December 31, 2130. Once this period has expired, Series A and B will be eliminated and the shares which comprise them shall automatically become common shares without any preferences whatsoever, therefore eliminating the division of shares into series.
Board of Directors and Shareholder Meetings
Our management is exercised by aThe members of the board of directors, whose membersDirectors are proposed and elected every three years during the general annual shareholders’ meeting. Board members are elected by separateSeparate voting of the Series A and Series B shareholder.shareholder elect board members. As mentioned, Series A shares elect twelve directors, and Series B shares elect two Directors.
The Directors may or may not be shareholders,Board members are elected by separate voting at Series A and Series B shareholders’ meeting and will hold their offices for three years with the possibility to be re-elected for an indefinite number of periods. Even though we have not established a formal process that allows our shareholders to communicate with the directors, shareholders desiring to do so may share their opinions, considerations or recommendations before or during the corresponding shareholders’ meeting which will be heard and attended by the Chairman of the Board, or by the Chief Executive Officer, as the case may be, and any such recommendations will be submitted for resolution by the shareholders in attendance during the meeting.
Regular general shareholdersshareholders’ meetings are held once a year within the first four months following the date of the annual balance sheet. We prepare a balance sheet annually on our operations as of December 31, which is presented together with the profit and loss statement, the report by the auditors and annual report to the respective shareholdersshareholders’ meeting. The board sends a copy of the balance sheet, annual report, report by the auditors and respective notes to each of the shareholders registered in the registry no later than by the date the first summons is published.
Special shareholdersshareholders’ meetings may be held at any time according to corporate needs and to discuss and decide upon any matter within the competence thereof, provided it is indicated in the summons. Being a shareholder of the Company is the only condition for entry to a shareholder’s meeting.
C.MATERIAL CONTRACTS
| C. | MATERIAL CONTRACTS |
On January 28, 2016,See “Item 4. Information on the Company incorporated a closed joint-stock company called Coca-Cola Del Valle New Ventures S.A. (“Coca-Cola Del Valle”) in Chile. Embotelladora Andina S.A. contributed 35%- Bottler Agreements and Item 5. Operating and Financial Review and Prospects - Summary of the capital of Coca-Cola Del Valle, with Embonor S.A. and Coca-Cola de Chile S.A contributing the remaining 15% and 50%, respectively. The main corporate purpose of Coca-Cola Del Valle is the development and production of juices, waters and non-carbonated beverages under brands owned by The Coca-Cola Company that Andina and Coca-Cola Embonor S.A. are authorized to commercialize and distribute in their respective franchise territories.
In 2013, we acquired the 100% of the shares of Companhia de Bebidas Ipiranga in Brazil. Additionally, we issued UF 5,000,000 in bonds in tranches of 7 and 21 years in the Chilean market and US$575 million in 10 years term bonds in the US market.
On August 30, 2012, Andina Brazil entered into a Share Purchase and Sale Agreement for the acquisition of 40% of the capital shares of Sorocaba Refreshments S.A., a manufacturer authorized by The Coca-Cola Company, based in the city of Sorocaba, State of São Paulo, owned by Compañía Maranhense de Refrigerantes (successor of Renosa Ind. Brasileira de Bebidas S/A) and in November 2012 RJR paid the purchase price of R$146,946,044.00.
Our special shareholders’ meeting held on June 25, 2012, approved the merger (by absorption) of Embotelladora Coca Cola Polar S.A. and Embotelladora Andina S.A. On September 28, 2012, Embotelladora Andina S.A. and Embotelladora Coca Cola Polar S.A. signed the public deed of the merger of their operations, in which they declared that merger had been finalized and perfected on October 1, 2012. This operation began on February 2, 2012, and allows Embotelladora Andina S.A. to consolidate its leading position in the business of bottling products licensed by The Coca-Cola Company in the southern cone and generate opportunities for growth and generation of value for its shareholders and employees. In practice, Embotelladora Andina S.A. is the second largest Coca-Cola bottler in South America and the seventh in the world, with operations in Argentina, Brazil, Chile and Paraguay. The transaction took the form of a merger (by absorption) and the exchange of newly issued shares of Andina, at a ratio of 0.33268606071 shares of Andina Series A shares and 0.33268606071 Andina Series B shares for each share of Embotelladoras Coca-Cola Polar S.A. The final process of exchange of shares took place on October 16, 2012.
During 2012, Andina Argentina held, among others, the following contracts with economic or strategic content: natural gas supply agreements, and electricity supply agreements; IP telephony services agreement (with supplier SIEMENS); purchase of new forklift agreement (with supplier Toyota) which are necessary due to the enlargement of the Cordoba Plant Deposit; and agreement for the extension of the Deposit of Final Products and Patio of the Cordoba Plant (13,600 m2) and at the Bahia Blanca Plant (2,800 m2)Significant Debt Instruments".
During 2012, PARESA executed a contract with TECNOEDIL S.A. building company for the construction of Warehouse 9, extension of Warehouse 8 for forklifts and the construction of the Distribution building, which represents additional storage capacity, the total contract value Gs.8,262,784,550. Additionally, on June 1, 2012 an agreement was signed with Azucarera Paraguaya S.A. for the provision of 38,500 of sugar tons until May 31, 2013. The total value of the contract is Gs.192,500,000,000.
| D. | EXCHANGE CONTROLS |
In October 2011, Andina Brazil entered into an agreement with Light Esco — Prestação de Serviços S/A, for the construction and operation of an electrical cogeneration station at the Jacarepaguá bottling facility. The term of this agreement is 15 years beginning upon the date on which the station begins operating, which would enter into operation towards the year 2013 and will ensure the supply of energy for the plant. The estimated value of the agreement is of $738 million reals. At the end of the contractual term, ownership of the cogeneration station will be transferred to Andina Brazil and equipment maintenance and upgrades will be carried out by Light Esco.
On June 30, 2011, Andina Brazil together with the other bottlers of the Coca-Cola System in Brazil, and Recofarma (a constituent of the Coca-Cola Group Brazil), signed an amendment to the agreement with SABB - SISTEMA DE ALIMENTOS E BEBIDAS DO BRASIL, the new corporate name of Sucos del Valle, approving the merger of Mais Indústria de Alimentos Ltda into SABB, which gave the Brazilian bottlers 50% of the share capital of SABB. As a result of this agreement, Andina Brazil obtained a total ownership of 5.74% of the share capital of SABB.
During January of 2011, the juice business in Chile was restructured to allow the incorporation of the other Coca-Cola bottlers in Chile into the property of Vital S.A. which changed its name to Vital Jugos S.A. Andina, Embonor S.A. and Embotelladora Coca-Cola Polar S.A. own 57%, 28% and 15%, respectively, of the outstanding capital of Vital Jugos S.A.
During 2011, EDASA, among others, entered into the following materially significant agreements: construction of the new plant for raw sugar; purchase of machinery and equipment for the REF PET line N°8 and N°7 (600 bottles per minute); construction and equipment for a new filling line for water and sensitive products; supply of natural gas; supply of electric power and long distance and inter-deposit service agreements.
D.EXCHANGE CONTROLS
Foreign Investment and Exchange Controls in Chile
The Central Bank is responsible, among other matters, for setting monetary policies and exchange controls in Chile. As of April 19, 2001, the Chilean Central Bank (“CCB”) eliminated prior foreign exchange controls, imposed certain reporting requirements and determined that certain operations be conducted through the Formal Exchange Market (“FEM”). The main purpose of these amendments, as declared by the Central Bank, is to facilitate the flow of capital into Chile and outside the country and to foster foreign investment.
Equity investments in Chile (including investments in stock) by non-resident persons or entities must comply with some existing exchange control restrictions. Foreign investments may be registered
Any foreign individual or legal entity, as well as Chileans with residence abroad, can invest in Chile through the New Direct Foreign Investment Committee (Comité de Inversiones Extranjeras) in accordance with Law N° 600 of 1974 and amendmentsStatute or with the Central Bank in accordance withby Chapter XIV of the Compendium of Foreign Exchange Regulations (Compendio de Normas de Cambios Internacionales or CFER) of the Central Bank. In
Under the caseNew Direct Foreign Investment Statute, any legal entity or individual that qualifies as foreign investor under the terms of Decree Law N° 600,the aforementioned Statute, may request a certificate to be issued by the Foreign Investment Promotion Agency, confirming its status as foreign investors execute a foreign investment agreement with Chile, thus guaranteeinginvestor, and enabling access to the FEM. However, investors under Decree Law N° 600 will only be able to repatriate capital one year after the investment. Earnings can be remitted abroad at any time. In the case of CFER, capital as well as earnings can be repatriated at any time, without an agreement with the Central Bank.new foreign investment regime.
During 2001, the CCB eliminated certain exchange controls. For instance, it revoked Chapter XXVI of the CFER, which regulated the issuance and placement of ADRs by Chilean corporations. Pursuant to the new rules, the Central Bank’s approval is no longer a pre-condition for ADR issuances or foreign investment contracts with the CCB. ADR issuances are now regarded as an ordinary foreign investment, and the only requirements are that the CCB be informed of the transaction, by fulfilling the rules of Chapter XIV of the CFER, that mainly establishes that the monies come in or leave the country exclusively through the Formal Exchange Market, if the recipient of the investment decides to enter the foreign currency to the country or if it carries out payments or remittances from Chile.
Notwithstanding these changes, exchange transactions authorized prior to April 19, 2001 remained subject to the rules in force as of the date of such transactions. The new exchange regime did not affect Chapter XXVI of the CFER and the Foreign Investment Contract (“FIC”) between Andina, the Central Bank and The Bank of New York Mellon (as Depositary of the shares represented by ADRs). Notwithstanding the previous, the parties to the FIC may choose to adopt the norms imposed by the CCB, resigning to those of the FIC, and which has been the option we have taken until this date. The FIC is the agreement by which access to the FEM is given to the Depositary and ADR holders. The FIC adopted the dispositions of Chapter XXVI and was celebrated pursuant to Article 47 of the Constitutional Organic Act of the CCB.
Under Chapter XXVI of the CFER, if the funds to purchase the common shares underlying the ADRs are brought into Chile, the Depositary must deliver, on behalf of foreign investors, an annex providing information on the transaction to the Formal Exchange Market entity involved, together with a letter instructing such entity to deliver the foreign currency or the equivalent amount in pesos, on or before the date the foreign currency is brought or is to be brought into Chile.
Repatriation of amounts received with respect to deposited common shares or common shares withdrawn from deposits on surrender of ADRs (including amounts received as cash dividends and proceeds from the sale in Chile of the underlying common shares and any rights arising there from) need be made through the FEM. The FEM entity intervening in the repatriation must provide certain information to the CCB on the following banking business day.
Under Chapter XXVI and the FIC, the CCB agreed to grant to the Depositary, on behalf of ADR holders, and to any investor not residing nor domiciled in Chile who acquire shares or replace ADRs for common stock, which we refer to as “Withdrawn Shares”, FEM access to convert Chilean pesos into U.S. dollars and to remit those dollars outside Chile including amounts received as: (i) cash dividends; (ii) proceeds from the sale in Chile of Withdrawn Shares; (iii) proceeds from the sale in Chile of preemptive rights to subscribe for additional shares; (iv) proceeds from the liquidation, merger or consolidation of Andina; (v) proceeds resulting from capital decreases or earnings or liquidations; and (vi) other distributions, including those in respect of any re-capitalization resulting from holding shares, ADRs or by Withdrawn Shares.
The guarantee of FEM access under the FIC will extend to the participants of the ADR offering if the following requirements are met: (i) that the funds to purchase the shares underlying the ADRs are brought into Chile and converted into Chilean pesos through the FEM; (ii) that the purchase of the underlying shares is made on a Chilean stock exchange; and (iii) that within five business days from the conversion of the funds into Chilean pesos, the CCB is informed that the funds converted were used to purchase the underlying shares, if those funds are not invested in shares within that period, it can access the FEM to reacquire foreign currency, provided that the request is submitted to the CCB within seven banking business days of the initial conversion into pesos.
Chapter XXVI provides that FEM access in connection with dividend payments is conditioned to our certifying to the CCB that a dividend payment has been made and that any applicable tax has been withheld. Chapter XXVI also provides that FEM access in connection with the sale of Withdrawn Shares, or distribution thereon, is conditioned upon receipt by the CCB (i) a certificate by the Depositary or custodian, as the case may be, that the shares have been withdrawn in exchange for delivery of the appropriate ADRs,ADRs; and (ii) a waiver of the benefits of the FIC with respect to ADRs (except in connection with the proposed sale of the shares) until the Withdrawn Shares are re-deposited.
FEM access under any of the circumstances described above is not automatic. Pursuant to Chapter XXVI, such access needs the BCC’sCCB’s approval on a request submitted to that end through a banking institution established in Chile. The FIC provides that if the BCCCCB has not acted upon the request within seven banking days, the request is deemed to have been granted.
Under current Chilean law, the BCCCCB cannot unilaterally change the FIC. The Chilean Courts (although not binding on future judicial decisions) also have established that the FIC cannot be annulled by future legislative changes. No assurance can be given, however, that additional Chilean restrictions applicable to the holders of ADRs, to the disposition of underlying shares, or to the repatriation of proceeds from their disposition, will not be imposed in the future; nor can there be any assessment of the duration or impact of any restrictions that might be imposed. If for whatever reason, including changes in the FIC or Chilean law, the Depositary is prevented from converting Chilean pesos into U.S. dollars, the investors shall receive dividends or other payments in Chilean pesos, which shall subject the investors to exchange rate risks. It cannot be guaranteed that the CFER, as amended, or any other exchange regulation will not be amended in the future, or that if new regulations are enacted that they shall have no material bearing on Andina or the ADR holders.
No assurance can be given that Andina will be able to purchase U.S. dollars in the local exchange market at any time in the future, nor that any such purchase will be for the amounts necessary to pay any sum due under any of its capital or debt instruments.
Likewise, it is not possible to guarantee that changes to the regulations of the CCB or other legislative changes relating to exchange controls will not restrict or impair Andina’s ability to purchase U.S. dollars in order to make payment on its debt instruments.
E.TAXATION
| E. | TAXATION |
Tax Considerations Relating to Equity Securities
Chilean Tax ConsiderationsConsiderations.
The following discussion summarizes the material Chilean income tax consequences of an investment in Andina’s stock or ADRs by an individual who is not domiciled or resident in Chile or a legal entity that is not organized under the laws of Chile and does not have a permanent establishment in Chile (a “foreign(“foreign holder”). This discussion is based upon Chilean income tax laws presently in force and administrative jurisprudence, including Ruling No. 324 of January 29, 1990 of the Servicio de Impuestos Internos (the Chilean Internal Revenue Service or “SII”) and other applicable regulations and rulings that are subject to change without notice. The discussion is not intended as tax advice to any particular investor, which can be rendered only in light of that investor’s particular tax situation. Each investor or potential investor is encouraged to seek independent tax advice with respect to consequences of investing in Andina’s stock or ADRs.
Dividends
Dividend distributions to investors who are juridical or natural persons residing or domiciled abroad, are affected by an additional tax ("withholding at the source") at a rate of 35%, with the right to credit for corporate income tax (First Category Tax) paid by Andina (today a rate of 27%). However, distributions made to investors residing or domiciled in countries that do not have a treaty to avoid double taxation with Chile, are taxed by an additional withholding equivalent to 35% of the corporate income tax credit, thus limiting the credit for this tax at 65%. This additional withholding does not apply to distributions made to residents of countries that have a treaty in force with Chile, which may allocate 100% of the credit. Until December 31, 2016, this additional withholding also did not apply to distributions made to shareholders who were residents of countries that had a treaty to avoid double taxation that was not in force to the extent it was subscribed prior to January 1, 2020.
Distributions made to investors residing or domiciled in Chile are taxed by personal taxes ("Supplementary Global Tax") which have progressive rates ranging from 0% to 40%. The tax credit limitation also applies to these investors, thus they are taxed with an additional tax ("debit") equivalent to 35% of the corporate tax credit.
Capital Gains
Gains recognized from the sale or exchange of ADRs by a foreign holder outside of Chile willare not be subject to Chilean taxation. Gains recognized on aCapital gains generated from the sale or exchange of shares of common stock will beare subject to bothgeneral taxation, unless they are shares that are sold on the Corporate Income Taxstock exchange and that have been acquired on the Withholding Tax (the former being credited against the latter) if either: (i) the foreign holder has held thestock exchange, or are shares of common stock for less than one year, (ii) the foreign holder acquired and disposed of the shares of common stock in the ordinary course of its business or as an habitual trader of shares, or (iii) the foreign holder transfers shares of common stock to a related person, as defined by Chilean tax law. In all other cases, gain on the disposition of shares of common stock will be subject only to the Corporate Income Tax, with rates of 22.5% and 24% for business years 2015 and 2016, respectively, except for shares resulting from an exchange of ADRs for shares (flow back),first issue, in which case the Chilean Internal Revenue Service pursuant to Notice 1,705, dated May 15, 2006, has been interpreted to say that shares may benefit from Article 18 if the ADRs were acquired through a stock broker orgains are not affected by any other circumstance stipulated by that norm.income taxation in Chile.
Beginning in fiscal year 2017, the profit generated by sales of shares will be subject to a Withholding Tax rate of 35%.
The tax basis of sharescost of common stockshares received in exchange for ADRs will be("conversion") is determined in accordance with the valuation procedure set forthout in the Deposit Agreement, which values shares of common stockshares at the highest reported salesselling price at which they tradeaccording to transactions on the Santiago Stock Exchange on the date of the withdrawal of the shares of common stock from the Depositary.shares. Consequently, the conversion of ADRs into shares of common stock, and the immediate sale of the shares for the value established under the Deposit Agreement, will not generate a capital gain subject to taxation in Chile. However, in the case where the sale of the shares is made on a day that is different than the date in which the exchangeconversion is recorded, capital gain subject to taxation in Chile may be generated. In connection thereto, on October 1, 1999 the Chilean Internal Revenue Service
SII issued Ruling No. 37083,708 whereby it allowed Chilean issuers of ADRs to amend the deposit agreements to which they are parties in order to include a clause that states that, in the case that the exchanged shares are sold by the ADRs’ holders on a Chilean stock exchange either on the same day in which the exchange is recorded or within the two business days prior to such date, the acquisition price of such exchanged shares shall be the price registered in the invoice issued by the stock broker that participated in the sale transaction. As this amendment has been included in the Deposit Agreement, the capital gain that may be generated if the exchange date of conversion is different than the date in which the shares received in exchange for ADRs were sold, willof sale, would not be subject to taxation. We reiteratetaxation, to the extent that if athe SII's criterion is maintained and the contributor in good faith adopts Notice No.1.705, thenthis criterion, which the excess value will not be subjectcontributor must certify to taxationthe satisfaction of the authority in Chile.case of observation.
The distribution and exercise of preemptive rights relating to the shares of common stock willare not be subject to Chilean taxation.taxation in Chile. Any capital gain onfrom the sale or assignment of preemptive rights relating to the shares of common stock will be subject to both the Corporate Income Tax and the Withholding Tax (the former being credited against the latter).general taxation.
Other Chilean Taxes
No Chilean inheritance, gift or succession taxes apply to theThe transfer or disposition of the ADRs by a foreign holder but suchis not subject to inheritance tax or donation tax. These taxes generally willmay only apply to thein case of donation or hereditary transfer at death or by gift of shares of common stock by a foreign holder. No Chilean stamp, issue,shares.
The issuance, registration or similar taxes or duties apply to foreign holderstransfer of ADRs or common shares of common stock.is not taxed with Stamp and Seal Tax or any other similar tax.
Withholding Tax Certificates
Upon request, we will provide to foreign holders appropriate documentation evidencing the payment of Chilean withholding taxes.taxes applied in Chile on earnings distributed to foreign holders.
United StatesU.S. Federal Income Tax Considerations Relating to ADRs or Shares of Common StockStock.
The following discussion summarizes certain U.S. federal income tax consequences of an investment in Andina’s ADRs or shares of common stock. This discussion is based upon U.S. federal income tax laws presently in force. The discussion is not a full description of all tax considerations that may be relevant to a decision to purchase ADRs or shares of common stock. In particular, the discussion is directed only to U.S. holders (as defined below) that hold ADRs or shares of common stock as capital assets, and it does not address the tax treatment of holders that are subject to special tax rules under the Internal Revenue Code of 1986 as amended (the “Code”), such as financial institutions, regulated investment companies, real estate investment trusts, partnerships or other pass-through entities, dealers in securities or currencies, traders in securities that elect to use a mark-to-market method of accounting for their securities holdings, insurance companies, tax-exempt entities, persons holding ADRs or shares of common stock as part of a hedging, integrated, conversion or constructive sale transaction or a straddle, holders that own or are deemed to own 10% or more of our voting shares (by vote or value), persons required to accelerate the recognition of any item of gross income with respect to ADRs or shares of common stock as a result of such income being recognized on an applicable financial statement, persons liable for alternative minimum tax or persons whose “functional currency” is not the U.S. dollar. Furthermore, the discussion below is based upon the provisions of the Code and regulations, rulings and judicial decisions there underthereunder as of the date hereof, and such authorities may be repealed, revoked or modified so as to result in U.S. federal income tax consequences different from those discussed below. In addition, the discussion below assumes that the Deposit Agreement, and all other related agreements, will be performed in accordance with their terms. If a partnership holds our ADRs or shares of common stock, the tax treatment of a partner will generally depend upon the status of the partner and the activities of the partnership. Partners in a partnership holding ADRs or shares of common stock should consult their tax advisors. This summary does not contain a detailed description of all the United StatesU.S. federal income tax consequences to a holder in light of its particular circumstances and does not address the Medicare tax on net investment income, U.S. federal estate and gift taxes or the effects of any state, local or non-United States tax laws.
Prospective purchasers should consult their tax advisors about the federal, state, local and foreign tax consequences to them of the purchase, ownership and disposition of ADRs or shares of common stock.
As used herein, the term “U.S. holder” means a beneficial owner of ADRs or shares of common stock that is (i) an individual U.S. citizen or resident, (ii) a corporation (or any other entity treated as a corporation for U.S. federal income tax purposes) created or organized in or under the laws of the United States, any state thereof or the District of Columbia, (iii) an estate the income of which is subject to U.S. federal income taxation regardless of its source or (iv) a trust that: (a) is subject to the primary supervision of a court within the United States and with respect to which one or more U.S. persons have the authority to control all substantial decisions of the trust or (b) has a valid election in effect under applicable U.S. Treasury regulations to be treated as a U.S. person.
If the obligations contemplated by the Deposit Agreement are performed in accordance with its terms, ADR holders generally will be treated for U.S. federal income tax purposes as the owners of the shares of common stock represented by those ADRs.
Deposits or withdrawals of shares of common stock by U.S. holders in exchange for ADRs will not result in the realization of gain or loss for U.S. federal income tax purposes.
Cash Dividends and Other Distributions
Cash distributions (including the amount of any Chilean taxes withheld) paid to U.S. holders with respect to the ADRs or shares of common stock generally will be treated as dividend income to such U.S. holders, to the extent paid out of our current or accumulated earnings and profits, as determined under U.S. federal income tax principles. Such income will be includable in the gross income of a U.S. holder as ordinary income on the day received by the Depositary, in the case of ADRs, or by the U.S. holder, in the case of shares of common stock. The dividends will not be eligible for the dividends received deduction allowed to corporations under the Code. With respect to non-corporate U.S. holders, certain dividends received from a qualified foreign corporation may be subject to reduced rates of taxation. A foreign corporation is treated as a qualified foreign corporation with respect to dividends received from that corporation on shares (or ADRs backed by such shares) that are readily tradable on an established securities market in the United States. U.S. Treasury Department guidance indicates that our ADRs (which are listed on the New York Stock Exchange), but not our shares of common stock, are readily tradable on an established securities market in the United States. Thus, we do not believe that dividends that we pay on our shares of our common stock that are not backedrepresented by ADRs currently meet the conditions required for these reduced tax rates. There also can be no assurance that our ADRs will be considered readily tradable on an established securities market in the United States in later years. Non-corporate holders that do not meet a minimum holding period requirement during which they are not protected from the risk of loss or that elect to treat the dividend income as “investment income” pursuant to section 163(d)(4) of the Code will not be eligible for the reduced rates of taxation regardless of our status as a qualified foreign corporation. In addition, the rate reduction will not apply to dividends if the recipient of a dividend is obligated to make related payments with respect to positions in substantially similar or related property. This disallowance applies even if the minimum holding period has been met. Non-corporate U.S. holders should consult their own tax advisors regarding the application of these rules given their particular circumstances.
Dividends paid in Chilean pesos will be includable in income in a U.S. dollar amount based on the exchange rate in effect on the day of receipt by the Depositary, in the case of ADRs, or by the U.S. holder, in the case of shares of common stock, regardless of whether the Chilean pesos are converted into U.S. dollars. If the Chilean pesos received as dividends are not converted into U.S. dollars on the date of receipt, a U.S. holder will have a basis in the Chilean pesos equal to their U.S. dollar value on the date of receipt. Any gain or loss realized on a subsequent conversion or other disposition of the Chilean pesos will be treated as U.S. source ordinary income or loss, regardless of whether the pesos are converted into U.S. dollars.
TheAny Chilean Withholding Taxwithholding tax (net of any credit for the Corporate Income Tax)corporate income tax) paid by or for the account of any U.S. holder may be eligible, subject to generally applicable limitations and conditions, for credit against the U.S. holder’s U.S. federal income tax liability. For purposes of calculating the foreign tax credit, dividends paid with respect to the ADRs or shares of common stock generally will be foreign source income and will generally constitute passive category income. Furthermore, in certain circumstances, a U.S. holder thatthat: (i) has held ADRs or shares of common stock for less than a specified minimum period during which it is not protected from risk of loss or (ii) is obligated to make payments related to the dividends, will not be allowed a foreign tax credit for foreign taxes imposed on dividends paid on ADRs or shares of common stock. The rules governing the foreign tax credit are complex. Investors are urged to consult their tax advisors regarding the availability of the foreign tax credit under their particular circumstances.
Distributions to U.S. holders of additional shares of common stock or preemptive rights with respect to shares of common stock that are made as part of a pro rata distribution to all shareholders of the Company generally should not be subject to U.S. federal income tax.
To the extent that the amount of any distribution exceeds our current and accumulated earnings and profits for a taxable year, as determined under U.S. federal income tax principles, the distribution will first be treated as a tax-free return of capital, causing a reduction in the adjusted basis of the ADRs or shares of common stock (thereby(thereby increasing the amount of gain, or decreasing the amount of loss, to be recognized by the investor on a subsequent disposition of the ADRs or shares of common stock), and the balance in excess of adjusted basis will be taxed as capital gain recognized on a sale or exchange. Consequently, such distributions in excess of our current and accumulated earnings and profits generally would not give rise to foreign source income and a U.S. holder generally would not be able to use the foreign tax credit arising from any Chilean withholding tax imposed on such distributions unless such credit can be applied (subject to applicable limitations) against U.S. taxes due on other foreign source income in the appropriate category for foreign tax credit purposes.
However, we do not expect to keep earnings and profits in accordance with U.S. federal income tax principles. Therefore, a U.S. holder should expect that a distribution will generally be treated as a dividend (as discussed above).
Passive Foreign Investment Company
We do not believe that we are, for U.S. federal income tax purposes, a passive foreign investment company (a “PFIC”), and expect to continue our operations in such a manner that we will not be a PFIC. If, however, we are or become a PFIC, U.S. holders could be subject to additional U.S. federal income taxes on gain recognized with respect to the ADRs or shares of common stock and on certain distributions, plus an interest charge on certain taxes treated as having been deferred by the U.S. holder under the PFIC rules of the U.S. federal income tax laws.
Non-corporate U.S. holders will not be eligible for reduced rates of taxation on any dividends received from us, if we are a PFIC in the taxable year in which such dividends are paid or in the preceding taxable year.
Capital Gains
U.S. holders that hold ADRs or shares of common stock as capital assets will recognize capital gain or loss for U.S. federal income tax purposes on the sale or other disposition of such ADRs or shares (or preemptive rights with respect to such shares) held by the U.S. holder or the Depositary. Capital gains of non-corporate U.S. holders (including individuals) derived with respect to capital assets held for more than one year are eligible for reduced rates of taxation. The deductibility of capital losses is subject to limitations. Any gain or loss recognized by a U.S. holder generally will be treated as U.S. source gain or loss. Consequently, in the case of a disposition of shares of common stock (which, unlike a disposition of ADRs, may be taxable in Chile), the U.S. holder may not be able to use the foreign tax credit for any Chilean tax imposed on the gain unless it can apply (subject to applicable limitations) the credit against tax due on other income from foreign sources.
Estate and Gift Taxation
As discussed above under “Chilean Tax Considerations — Other Chilean Taxes,” there are no Chilean inheritance, gift or succession taxes applicable to the transfer or disposition of ADRs by a foreign holder, but such taxes generally will apply to the transfer at death or by gift of shares of common stock by a foreign holder. The amount of any inheritance tax paid to Chile may be eligible for credit against the amount of U.S. federal estate tax imposed on the estate of a U.S. holder. U.S. holders should consult their personal tax advisors to determine whether and to what extent they may be entitled to such credit. The Chilean gift tax generally will not be treated as a creditable foreign tax for U.S. tax purposes.
Information Reporting and Backup Withholding
In general, information reporting requirements will apply to dividends in respect of ADRs or shares of common stock or the proceeds received on the sale, exchange, or redemptionother disposition of ADRs or shares of common stock paid within the United States (and in certain cases, outside of the United States) to U.S. holders other than certain exempt recipients. ALikewise, a backup withholding tax may apply to such payments if the U.S. holder fails to provide an accurate taxpayer identification number or certification of other exempt status or fails to report interest and dividends required to be shown on its federal income tax returns. The amount of any backup withholding from a payment to a U.S. holder will be allowed as a refund or a credit against the U.S. holder’s U.S. federal income tax liability, provided the required information is furnished to the U.S. Internal Revenue Service.
F.DIVIDENDS AND PAYING AGENTS
| F. | DIVIDENDS AND PAYING AGENTS |
Not applicable.
G.STATEMENT BY EXPERTS
| G. | STATEMENT BY EXPERTS |
Not applicable.
H.DOCUMENTS ON DISPLAY
| H. | DOCUMENTS ON DISPLAY |
We are subject to the informational reporting requirements of the U.S. Securities Exchange Act of 1934, as amended, which requires that we file periodic reports and other information with the SEC. As a foreign private issuer, we file annual reports on Form 20-F as opposed to Form 10-K. We do not file quarterly reports on Form 10-Q but furnish quarterly reports and reports in relation to material events on Form 6-K. As a foreign private issuer, we are exempt from the rules under the U.S. Securities Exchange Act of 1934, as amended, prescribing the furnishing and content of proxy statements and short-swing profit disclosure and liability.
You may read and copy all or any portion of the annual report or other information in our files in the SEC’s public reference room at 100 F Street, N.E., Washington, D.C. 20549. You can also access to these documents through the SEC’s website at www.sec.gov, or fromand access –and request– a hard copy of them through our corporate website www.koandina.com or request a hard copy through our website also.www.koandina.com. You can also request copies of these documents upon payment of a duplicating fee, by writing to the SEC. Please call the SEC at 1-800-SEC-0330 for further information on the operation of the public reference rooms. In addition, reports and other information concerning us may be inspected at the offices of the New York Stock Exchange, Inc., 20 Broad Street, New York, New York 10005, on which our ADRs are listed.
We also file reports with the Chilean Superintendencia de Valores y SegurosComisión para el Mercado Financiero (“CMF”). You may read and copy any materials filed with the SVSCMF directly from its website www.svs.cl.www.cmfchile.cl or from our corporate website www.koandina.com or request a hard copy through our website also. The documents referred to in this annual report can be inspected at Miraflores 9153, Piso 7, Renca, Santiago, Chile.
I.SUBSIDIARY INFORMATION
| I. | SUBSIDIARY INFORMATION |
Not applicable.
ITEM 11.QUANTITATIVE AND QUALITATIVE DISCLOSURES ABOUT MARKET RISK
| ITEM 11. | QUANTITATIVE AND QUALITATIVE DISCLOSURES ABOUT MARKET RISK |
Market risk generally representsThe main sources of systematic risks that the risk that losses may occur in the values of financial instruments as a result of movementsCompany is exposed to are: changes in interest rates foreignand changes in currency exchange rates.
Particularly, interest rates increase, and currency exchange rates and commodity prices. We are exposeddepreciation may affect the Company financial strategy given the various currency denominated debt the Company currently holds. To protect the Company against market volatility, hedging policies have been set with the objective to changes in financial market conditions inregulate the normal course of our business due to our use of certain financial derivatives by management. The use of these instruments as well as transactinghad been strictly designed for hedging purposes, leaving out any speculation and trading use.
Interest Rate Risk
The Company’s debt is mainly denominated in UF (local inflation indexed Chilean currency) and U.S. dollar fixed rate bonds. Bank debt represents a smaller proportion of the total debt and it’s denominated in various foreignlocal currencies and conversionin either fixed or variable rates. Given that the main portion of our foreign subsidiaries’ financial statements into the Chilean peso.debt is in fixed rate, the main risk is the interest rate increase at the moment of refinancing mature debt.
Interest Rate Risk
Our primary interest rate exposures relate to U.S. dollar denominated and UF long-term fixed rate bond liabilities andOn the other long-term variable and fixed rate bank liabilities. We also investside, our cash is invested in certain medium-term bondshort-term securities that bear amainly in fixed interest rate. We monitor our exposure to interest rate fluctuations regularly depending on market conditions.
The following table provides information about our long-termthe Company’s debt (bonds & bank debt) and bondshort-term investments that are sensitivehave exposure to changes in market interest rates as of December 31, 2015.2020.
|
| Expected Maturity Date |
| Estimated |
| ||||||||||||
|
| 2016 |
| 2017 |
| 2018 |
| 2019 |
| 2020 |
| Thereafter |
| Total |
| Total |
|
|
| MCh$ |
| MCh$ |
| MCh$ |
| MCh$ |
| MCh$ |
| MCh$ |
| MCh$ |
| MCh$ |
|
|
|
|
|
|
|
|
|
|
|
|
|
|
|
|
|
|
|
Interest Earning Assets |
|
|
|
|
|
|
|
|
|
|
|
|
|
|
|
|
|
Time deposits and credit links |
| 99,113 |
| 17 |
| — |
| — |
| — |
| — |
| 99,130 |
| 99,130 |
|
Weighted average interest rate |
| 1.1 | % | 8.82 | % | — |
| — |
| — |
| — |
| 1.1 | % | — |
|
|
|
|
|
|
|
|
|
|
|
|
|
|
|
|
|
|
|
Interest Bearing Liabilities |
|
|
|
|
|
|
|
|
|
|
|
|
|
|
|
|
|
Long-term debt (Bonds) |
| 19,237 |
| 17,971 |
| 11,898 |
| 12,256 |
| 12,636 |
| 663,243 |
| 737,241 |
| 785,844 |
|
Fixed Rate |
| 4.54 | % | 4.18 | % | 4.88 | % | 4.86 | % | 4.93 | % | 4.71 | % | 4.70 | % |
|
|
Bank liabilities |
| 23,991 |
| 20,441 |
| 3,951 |
| 2,980 |
| 2,865 |
| — |
| 54,228 |
| 48,607 |
|
Weighted average interest rate |
| 5.49 | % | 4.05 | % | 5.63 | % | 5.27 | % | 5.21 | % | — |
| 4,93 | % |
|
|
| Expected Maturity Date | Fair Value | |||||||||||||||||||||||||||||||
| 2021 | 2022 | 2023 | 2024 | 2025 | 2026 Onwards | Total | Total | |||||||||||||||||||||||||
| (in millions Ch$) | ||||||||||||||||||||||||||||||||
| Interest Earning Assets | ||||||||||||||||||||||||||||||||
| Short term investments - Chile | 312,811 | - | - | - | - | - | 312,811 | |||||||||||||||||||||||||
| Interest rate (weighted average) | 2.31 | % | - | - | - | - | - | 2.31 | % | |||||||||||||||||||||||
| Short term investments - Brazil | 46,250 | - | - | - | - | - | 46,250 | |||||||||||||||||||||||||
| Interest rate (weighted average) | 2.62 | % | - | - | - | - | - | 2.62 | % | |||||||||||||||||||||||
| Short term investments - Argentina | 6,583 | - | - | - | - | - | 6,583 | |||||||||||||||||||||||||
| Interest rate (weighted average) | 28.20 | % | - | - | - | - | - | 28.20 | % | |||||||||||||||||||||||
| Interest Bearing Liabilities | ||||||||||||||||||||||||||||||||
| International bonds (144A/RegS) (1) | 6,486 | - | 258,256 | - | - | 208,448 | 473,190 | 537,618 | ||||||||||||||||||||||||
| Fixed Rate 144A Bonds | 4.41 | % | - | 5.00 | % | - | - | 3.95 | % | 4.53 | % | |||||||||||||||||||||
| Local Chilean Bonds (1) | 12,219 | 11,913 | 12,455 | 13,039 | 13,664 | 401,146 | 464,436 | 581,161 | ||||||||||||||||||||||||
| Fixed Rate - Local Chilean Bonds (weighted average) | 5.38 | % | 5.64 | % | 5.68 | % | 5.72 | % | 5.76 | % | 3.43 | % | 3.73 | % | ||||||||||||||||||
| �� | ||||||||||||||||||||||||||||||||
| Total public debt (Bonds) | 18,705 | 11,913 | 270,711 | 13,039 | 13,664 | 609,594 | 937,626 | 1,118,779 | ||||||||||||||||||||||||
| Bank debt – Chile | 794 | - | - | 4,000 | - | - | 4,794 | |||||||||||||||||||||||||
| Weighted average interest rate Ch$ | 2.12 | % | - | - | 2.00 | % | - | - | 2.02 | % | ||||||||||||||||||||||
| Bank debt – Argentina | 5 | - | - | - | - | - | 5 | |||||||||||||||||||||||||
| Weighted average interest rate AR$ | 26.60 | % | - | - | - | - | - | 26.60 | % | |||||||||||||||||||||||
| Total bank debt | 799 | - | - | 4,000 | - | - | 4,799 | |||||||||||||||||||||||||
| (1) | Includes issuance deferred costs: |
International Bonds Issuance Costs: Current: Ch$489 million, Non-Current: Ch$6,078 million.
Local Chilean Bonds: Current: Ch$153 million, Non-Current: Ch$970 million.
Foreign Currency Risk
As of December 31, 2015, we have debt held by banks and debt held2020, the only foreign currency used by the public denominated in U.S. dollars, which are hedged by derivative instruments, which lowerCompany to finance its operation is the risk of exposure toU.S dollar, all the accrual of fluctuationsrest of the value of the US dollar. Net assets balanceCompany’s debt is denominated in dollars as of December 31, 2015, which amounts to $591.0 million as detailed below. local operation currencies (UF, Chilean peso, Argentinean peso, Brazilian real and Paraguayan guaraníes).
The following table summarizes the financial instruments held to December 31, 2015,2020, denominated in U.S. dollars:
Assets |
| 2016 |
| 2017 |
| 2018 |
| 2019 |
| 2020 |
| 2021 Onwards |
| Total |
| Fair estimated |
| ||||||||||||||||||||||||||||||||
(U.S. Dollars) |
| MM$ |
| MM$ |
| MM$ |
| MM$ |
| MM$ |
| MM$ |
| MM$ |
| MM$ |
| ||||||||||||||||||||||||||||||||
| (Denominated in | 2021 | 2022 | 2023 | 2024 | 2025 | 2026 Onwards | Total | Fair Value | |||||||||||||||||||||||||||||||||||||||||
| U.S. dollars instruments) | (in millions Ch$) | ||||||||||||||||||||||||||||||||||||||||||||||||
Assets |
|
|
|
|
|
|
|
|
|
|
|
|
|
|
|
|
| ||||||||||||||||||||||||||||||||
Cash and cash equivalents |
| 13,598 |
| — |
| — |
| — |
| — |
| — |
| 13,598 |
| 13,598 |
| 21,332 | - | - | - | - | - | 21,332 | 21,332 | ||||||||||||||||||||||||
Liabilities |
|
|
|
|
|
|
|
|
|
|
|
|
|
|
|
|
| ||||||||||||||||||||||||||||||||
Bonds obligations |
| (4,377 | ) | — |
| — |
| — |
| — |
| (403,430 | ) | (407,807 | ) | (423,100 | ) | ||||||||||||||||||||||||||||||||
Bank debt |
| (12,818 | ) | (12,681 | ) | — |
| — |
| — |
|
|
| (25,499 | ) | (24,992 | ) | ||||||||||||||||||||||||||||||||
Net assets (liabilities) |
| (3,597 | ) | (12,681 | ) | — |
| — |
| — |
| (403,430 | ) | (419,708 | ) | (395,626 | ) | ||||||||||||||||||||||||||||||||
| Bonds debt (1) | 6,486 | - | 258,256 | - | - | 208,448 | 473,190 | 537,618 | |||||||||||||||||||||||||||||||||||||||||
| (Denominated in | 2021 | 2022 | 2023 | 2024 | 2025 | 2026 Onwards | Total | Fair Value | ||||||||||||||||||||||||
| U.S. dollars instruments) | (in millions Ch$) | |||||||||||||||||||||||||||||||
| Leasing debt | 291 | - | 367 | - | 250 | 73 | 981 | 981 | ||||||||||||||||||||||||
| Net debt | 28,109 | - | 258,623 | - | 250 | 208,521 | 495,503 | 559,931 | ||||||||||||||||||||||||
ITEM 12.DESCRIPTION OF SECURITIES OTHER THAN EQUITY SECURITIES
| (1) | Includes issuance deferred costs: |
International Bonds Issuance Costs: Current: Ch$489 million, Non-Current: Ch$6,078 million.
Local Chilean Bonds: Current: Ch$153 million, Non-Current: Ch$970 million.
A.DEBT SECURITIESIn order to protect the Company from the effects on results due to the volatility of the Brazilian real against the U.S. dollar (bond due 2023), we have entered into currency swaps that cover 99% of our dollar-denominated financial obligations, thereby mitigating our exchange rate exposure. Additionally, to protect the Company from the effects on results due to the volatility of the Chilean peso against the U.S. dollar (bond due 2023 and bond due 2050), derivatives have been contracted (cross currency swaps) to fully redenominate the US dollar-denominated financial obligations to UF’s.
As of December 31, 2020, the Company’s net exposure to existing assets and liabilities in foreign currencies, discounting our derivatives contracts, was Ch$16,388,923.
| ITEM 12. | DESCRIPTION OF SECURITIES OTHER THAN EQUITY SECURITIES |
| A. | DEBT SECURITIES |
Not applicable.
B.WARRANTS AND RIGHTS
| B. | WARRANTS AND RIGHTS |
Not applicable.
C.OTHER SECURITIES
| C. | OTHER SECURITIES |
Not applicable.
D.AMERICAN DEPOSITARY RECEIPTS
| D. | AMERICAN DEPOSITARY RECEIPTS |
Fees and Charges
The Bank of New York Mellon serves as the depositary for our ADRs. ADR holders are required to pay various fees to the depositary, and the depositary may refuse to provide any service for which a fee is assessed until the applicable fee has been paid.
ADR holders are required to pay the depositary amounts in respect of expenses incurred by the depositary or its agents on behalf of ADR holders, including expenses arising from compliance with applicable law, taxes or other governmental charges, or conversion of foreign currency into U.S. dollars. The depositary may decide in its sole discretion to seek payment by either billing holders or by deducting the fee from one or more cash dividends or other cash distributions.
ADR holders are also required to pay additional fees for certain services provided by the depositary, as set forth in the table below.
Depositary service | Fee payable by ADR holders | |
Issuance and delivery of ADRs, including in connection with share distributions | Up to US$5.00 per 100 ADSs (or portion thereof) | |
Withdrawal of shares underlying ADRs | Up to US$5.00 per 100 ADSs (or portion thereof) | |
Registration for the transfer of shares | Registration or transfer fees that may from time to time be in effect | |
Cash distribution fees | US$0.02 or less per ADS |
In addition, holders may be required to pay a fee for the distribution or sale of securities. Such fee (which may be deducted from such proceeds) would be for an amount equal to the lesser of (1) the fee for the issuance of ADRs that would be charged as if the securities were treated as deposited shares and (2) the amount of such proceeds.
Fees Incurred in Past Annual Period
From January 1, 20152020 to December 31, 2015,2020, we received from the depositary US$118,430.65 89,277.50 for continuing annual stock exchange listing fees, standard out-of-pocket maintenance costs for the ADRs (consisting of the expenses of postage and envelopes for mailing annual and interim financial reports, printing and distributing dividend checks, electronic filing of U.S. Federal tax information, mailing required tax forms, stationery, postage, facsimile, and telephone calls), any applicable performance indicators relating to the ADR facility, underwriting fees and legal fees.
Fees to be Paid in the Future
The Bank of New York Mellon, as depositary, has agreed to reimburse us for expenses they incur that are related to establishment and maintenance expenses of the ADR program. The depositary has agreed to reimburse us for its continuing annual stock exchange listing fees. The depositary has also agreed to pay the standard out-of-pocket maintenance costs for the ADRs, which consist of the expenses of postage and envelopes for mailing annual and interim financial reports, printing and distributing dividend checks, electronic filing of U.S. Federal tax information, mailing required tax forms, stationery, postage, facsimile, and telephone calls. It has also agreed to reimburse us annually for certain investor relationship programs or special investor relations promotional activities. In certain instances, the depositary has agreed to provide additional payments to us based on any applicable performance indicators relating to the ADR facility. There are limits on the amount of expenses for which the depositary will reimburse us, but the amount of reimbursement available to us is not necessarily tied to the amount of fees the depositary collects from investors.
The depositary collects its fees for delivery and surrender of ADRs directly from investors depositing shares or surrendering ADRs for the purpose of withdrawal or from intermediaries acting for them. The depositary collects fees for making distributions to investors by deducting those fees from the amounts distributed or by selling a portion of distributable property to pay the fees. The depositary may collect its annual fee for depositary services by deduction from cash distributions or by directly billing investors or by charging the book-entry system accounts of participants acting for them. The depositary may generally refuse to provide fee-attracting services until its fees for those services are paid.
ITEM 13.DEFAULTS, DIVIDEND ARREARAGES AND DELINQUENCIESPART II
| ITEM 13. | DEFAULTS, DIVIDEND ARREARAGES AND DELINQUENCIES |
Not applicable.
ITEM 14.MATERIAL MODIFICATIONS TO THE RIGHTS OF SECURITY HOLDERS AND USE OF PROCEEDS
| ITEM 14. | MATERIAL MODIFICATIONS TO THE RIGHTS OF SECURITY HOLDERS AND USE OF PROCEEDS |
In 1996, our shareholders approved the Reclassification of Capital Stock, which we refer to as the “Reclassification,”reclassification of our common stock into two new series of shares. Pursuant to the Reclassification,reclassification, each outstanding share of our common stock was replaced by one newly issued Series A share and one newly issued Series B share.
The Series A and Series B shares are principally differentiated by their voting and economic rights. The modification of our bylaws as of June 25, 2012, increased the number of directors from 7 to 14. The holders of the Series A shares have full voting power and are entitled to elect 12 of 14 members of the board of directors, and the holders of the Series B shares have no voting rights but for the right to elect 2 members of the board of directors. In addition, holders of Series B shares are entitled to a dividend 10% greater than any dividend on Series A shares.
After the Reclassification,reclassification, the Superintendence of Pension Fund Managers (Superintendencia de Administradores de Fondos de Pensiones) decreed that Chilean pension funds would not be permitted to acquire Series B Shares due to their limited voting rights. In 2004, however, the Superintendence reversed, and approved Series B shares as investment instruments for Chilean Pension funds. Series A shares have always been eligible as investment instruments.instruments for Chilean pensions funds.
ITEM 15.CONTROLS AND DISCLOSURE PROCEDURES
| ITEM 15. | CONTROLS AND DISCLOSURE PROCEDURES |
Disclosure Controls and Procedures
We have evaluated, with the participation of our chief executive officer and chief financial officer, the effectiveness of our disclosure controls and procedures as of December 31, 2015.2020. There are inherent limitations to the effectiveness of any system of disclosure controls and procedures, including the possibility of human error and the circumvention or overriding of the controls and procedures. Accordingly, even effective disclosure controls and procedures can only provide reasonable assurance of achieving their control objectives. Based upon our evaluation, our chief executive officer and chief financial officer concluded that, as of December 31, 2020, our disclosure controls and procedures were effective to provide reasonable assurance that the information required to be disclosed by us in the reports that we file or submit under the Exchange Act is recorded, processed, summarized and reported, within the time periods specified in the applicable rules and forms, and that it is accumulated and communicated to our management, including our chief executive officer and chief financial officer, as appropriate to allow timely decisions regarding required disclosure.
Management’s Annual Report on Internal Control Overover Financial Reporting
Our management is responsible for establishing and maintaining adequate internal control over financial reporting, as such term is defined in Rules 13a—15(f) and 15d—15(f) under the Securities Exchange Act of 1934, as amended. Under the supervision and with the participation of our management, including our chief executive officer and chief financial officer, we conducted an evaluation of effectiveness of our internal control over financial reporting based on the framework in Internal Control—Integrated Framework (2013) issued by the Committee of Sponsoring Organizations of the Treadway Commission.
Our internal control over financial reporting is a process designed to provide reasonable assurance regarding the reliability of financial reporting and the preparation of financial statements for external purposes in accordance with IFRS as issued by the IASB. Our internal control over financial reporting includes those policies and procedures that (i) pertain to maintenance of records that, in reasonable detail, accurately and fairly reflect the transactions and dispositions or our assets; (ii) provide reasonable assurance that transactions are recorded as necessary to permit preparation of financial statements in accordance with IFRS as issued by the IASB, and that our receipts and expenditures are being made only in accordance with authorizations of our management and directors; and (iii) provide reasonable assurance regarding prevention or timely detection of unauthorized acquisition, use, or disposition of our assets that could have a material effect on our financial statements.
Because of its inherent limitations, internal control over financial reporting may not prevent or detect misstatements. Also, projections of any evaluation of effectiveness to future periods are subject to the risk that controls may become inadequate because of changes in conditions, or that the degree of compliance with the policies or procedures may deteriorate. Based on our evaluation under the framework in Internal Controls—Integrated framework (2013) issued by the Committee of Sponsoring Organizations of the Tread way Commission, our management concluded that our internal control over financial reporting was effective as of December 31, 2015.2020.
The effectiveness of our internal control over financial reporting as of December 31, 20152020 has been audited by our registered independent accounting firm, which opinion is stated in their report, included on pages F-2 and F-3 herein.
Changes in Internal Control Overover Financial Reporting
There have been no changes in our internal control over financial reporting identified in connection with the evaluation required under Rules 13a-15 or 15d-15 that occurred during the period covered by this annual report that has materially affected, or is reasonably likely to materially affect, our internal control over financial reporting.
ITEM 16A.AUDIT COMMITTEE FINANCIAL EXPERT
| ITEM 16A. | AUDIT COMMITTEE FINANCIAL EXPERT |
Our board of directors has designated Mr. Gonzalo Parot Palma as our Audit Committee Financial Expert, as defined in the instructions to Item 16A of Form 20-F. Our board of directors has also determined that Mr. Domingo Cruzat Amunátegui and Mr. Gonzalo Parot Palma is an Independent Director as definedfulfills the independence standards set forth in Section 303A.02Rule 10A-3 of the NYSE’s Listed Company Manual.U.S. Exchange Act and applicable NYSE rules.
| ITEM 16B. | CODE OF ETHICS |
We have adopted a Code of Ethics that constitutes a code of ethics for our directors and employees. This Code applies to our Board of Directors, chief executive officer and all senior financial officers of our Company, including the chief financial officer, or any other persons performing similar functions, as well as to all other officers and employees of the Company. Our Code of Ethics is available on our website www.koandina.com.www.koandina.com. If we make any substantive amendment to the Code or grant any waivers, including any implicit waiver, from a provision of the Code, we will disclose the nature of such amendment or waiver on the above mentioned website throughand. On December 22, 2020, we amended our Code of Ethics to incorporate provisions related to criminal liability of legal entities, in accordance with Chilean Law N° 20.393, Argentine Law N° 27.401, and other compliance and anti-bribery provisions, including the Sarbanes-Oxley Act and the U.S. Foreign Corrupt Practices Act (FCPA). Additionally, we incorporated other provisions, making explicit reference to the importance of equal treatment and respect for each individual, diversity and non-discrimination, a 6-K form.
ITEM 16C.PRINCIPAL ACCOUNTANT FEES AND SERVICEShealthy working environment, protection of our natural resources, sustainability, among others.
| ITEM 16C. | PRINCIPAL ACCOUNTANT FEES AND SERVICES |
Fees Paid Toto Independent Public Accountants
The following table sets forth, for each of the years indicated, the kinds of fees paid to our external auditors and the percentage of each of the fees out of the total amount paid to them.
|
| Year ended December 31, |
| ||||||
|
| 2014 |
| 2015 |
| ||||
Services rendered |
| Fees |
| % of |
| Fees |
| % of |
|
Audit fees(1) |
| 889 |
| 94 | % | 961 |
| 99 | % |
Audit-related fees(2) |
| 28 |
| 3 | % | — |
| 0 | % |
Tax fees(3) |
| 18 |
| 2 | % | 9 |
| 1 | % |
Other fees |
| 10 |
| 1 | % | 1 |
| 0 | % |
Total |
| 945 |
| 100 | % | 972 |
| 100 | % |
(1) Audit fees consist of services that would normally be provided in connection with statutory and regulatory filings or engagements, including services that generally only the independent accountant can reasonably provide.
(2) Audit-related fees relate to assurance and associated services that traditionally are performed by the independent accountant, including: attestation services that are not required by statute or regulation; accounting consultation and audits in connection with mergers, acquisitions and divestitures; employee benefit plan audits; and consultation concerning financial accounting and reporting standards.
(3) Tax fees relate to services performed by the tax division for tax compliance, planning, and advice.
| Year ended December 31, | ||||||||||||||||
| 2019 | 2020 | |||||||||||||||
| Services rendered | Fees millions Ch$ | % of Total Fees | Fees millions Ch$ | % of Total Fees | ||||||||||||
| Audit fees (1) | 842 | 100 | % | 827 | 100 | % | ||||||||||
| Audit-related fees (2) | — | — | — | — | ||||||||||||
| Tax fees (3) | — | — | — | — | ||||||||||||
| Other fees | — | — | — | — | ||||||||||||
| Total | 842 | 100 | % | 827 | 100 | % | ||||||||||
| (1) | Audit fees correspond to services that are normally provided in connection with regulatory filings, including those services that only external auditors can provide. |
| (2) | Audit-related fees apply to advisory services generally performed by independent auditors, including reports that are not required by regulations; accounting and audit consultancies in connection with mergers, acquisitions or sales; employee benefit plan audit; and inquiries regarding disclosure and financial accounting standards. |
| (3) | Tax fees correspond to services and counseling by the tax division to meet tax requirements. |
Directors’ Committee and Audit Committee Pre-Approval Policies and Procedures
We have adopted pre-approval policies and procedures under which all non-audit services provided by our external auditors must be pre-approved by our Directors’ Committee. Once the proposed service is approved, our subsidiaries or we formalize the engagement of services. In addition, the members of our board of directors are briefed on matters discussed by the Directors’ Committee.
ITEM 16D.EXEMPTIONS FROM THE LISTING STANDARDS FOR AUDIT COMMITTEES
| ITEM 16D. | EXEMPTIONS FROM THE LISTING STANDARDS FOR AUDIT COMMITTEES |
Our Audit Committee is comprised of Gonzalo Parot Palma, Salvador Said Somavía and Arturo Majlis Albala.Domingo Cruzat Amunátegui.
We disclose that, with respect to the current membership of Mr. Salvador Said Somavía and Mr. Arturo Majlis Albala on our Audit Committee, the Company has relied on the exemption from the independence requirements provided by Rule 10A-3(b)(1)(iv)(D) of the Securities and Exchange Act of 1934, as amended. Pursuant to said rule, a member of the Committee who is an affiliate of the foreign private issuer or a representative of such an affiliate that has only observer status on, and is not a voting member or the chair of, the audit committee, and neither the member nor the affiliate is not an executive officer of the foreign private issuer, may be exempted from the independence requirement.
Mr. Arturo Majlis Albala and Mr. Salvador Said Somavía meet,meets, for the duration of theirhis membership, the requirements of Rule 10A-3(b)(1)(iv)(D) because theyhe (i) areis a representative of our controlling shareholder group; (ii) havehas an observer-only status on our Audit Committee;(iii) areis not officersan officer of usthe Company or any of our subsidiaries; and (iv) dodoes not receive, directly or indirectly, compensation from us or any of our subsidiaries other than in their capacitieshis capacity as membersmember of our Audit Committee.
Our reliance on the exemption provided by Rule 10A-3of10A-3 of the Exchange Act, with respect to Mr. Arturo Majlis Albala and Mr. Salvador Said Somavía, would not materially adversely affect the ability of our Audit Committee to act independently.
ITEM 16E.PURCHASERS OF EQUITY SECURITIES BY THE ISSUER AND AFFILIATED PURCHASERS
| ITEM 16E. | PURCHASERS OF EQUITY SECURITIES BY THE ISSUER AND AFFILIATED PURCHASERS |
During 2015,2020, no issuer or affiliated parties made purchases pursuant to publicly announced plans or programs or not pursuant to such plans.
ITEM 16F. CHANGE IN REGISTRANT’S CERTIFYING ACCOUNTANT
| ITEM 16F. | CHANGE IN REGISTRANT’S CERTIFYING ACCOUNTANT |
Not applicable.
ITEM 16G. CORPORATE GOVERNANCE
| ITEM 16G. | CORPORATE GOVERNANCE |
NYSE and Chilean Corporate Governance Requirements
In accordance with Section 303A.11 of the NYSE’s Listed Company Manual, theThe following table sets forth significant differences between Chilean corporate governance practices and those corporate governance practices followed by domestic corporations under NYSE listing standards. Significant ways in which our corporate governance practices differ from those followed by U.S. companies under NYSE listing standards are also publicly available on our website at www.koandina.com.www.koandina.com.
| NYSE REQUIREMENTS FOR US LISTED | CHILEAN LAW REQUIREMENTS AND | ||
|
|
| ||
|
|
| ||
|
| No similar legal obligation exists under Chilean law. Under Chilean law, the position of director of a corporation is incompatible with the position of manager, auditor, accountant or president of the company. The Non-Management Director does not exist under Chilean law. Directors, however, are required to convene in legally established meetings to resolve matters required by Chilean Corporation Law. Since Non-Management Director does not exist under Chilean law, it is not possible to comply with the Section 303A.03. | ||
| Listed companies must have a Nominating/Corporate Governance Committee composed entirely of independent | There is no similar legal obligation under Chilean law. Andina has a Directors’ Committee whose functions are set by Chilean Corporation Law. |
| REQUIREMENT | NYSE REQUIREMENTS FOR US LISTED COMPANIES | CHILEAN LAW REQUIREMENTS AND COMPANY PRACTICE | ||
“controlled company”, we would be exempt from NYSE’s requirement to The functions of the Directors’ Committee are described under Item 6C.”Directors, Senior Management and Employees-Board Practices”. | ||||
| Listed companies must have a Compensation Committee composed entirely of independent | There is no similar legal obligation under Chilean law. In accordance with Chilean law, the above-mentioned Directors’ Committee is in charge of reviewing management compensation. | ||
|
The functions of the Directors’ Committee are described under Item 6C. “Directors, Senior Management and Employees-Board Practices”. | |||
| Audit Committee | Must have an audit committee with the specific responsibilities and authority necessary to comply with SEC rules. Members must | No similar legal obligation exists under Chilean law. However, in accordance with the Chilean Public Companies Law 18,046, public companies that have a net worth of more than 1.5 million UFs and/or at least a Andina designated an Audit Committee in accordance with SEC Rule |
|
|
| ||
| Listed companies must maintain an Internal Audit Function to provide management and the Audit Committee with ongoing assessments of the company’s risk management processes and systems of internal control. A listed company may choose to outsource this function to a third party service provider other than its independent auditor. | There is no similar obligation under Chilean law. Chilean law requires that companies must have both account inspectors and external auditors. However, Andina has an Internal Auditor who reports to the Audit Committee. | ||
| Shareholders must | There is no similar obligation under Chilean law, with the exception of Directors’ compensation which annually approved during the | ||
| Listed companies must adopt and disclose Corporate Governance | Chilean Law does not require the adoption of Corporate Governance Practices because | ||
| A company must adopt a Code of Business Conduct for its directors, officers and employees. Such | There is no legal obligation to adopt a Code of Business Conduct. Chilean law requires that a company have a set |
| REQUIREMENT | NYSE REQUIREMENTS FOR US LISTED COMPANIES | CHILEAN LAW REQUIREMENTS AND COMPANY PRACTICE | ||
| company must disclose any waiver of its code of conduct that is granted to an officer or director. | of internal regulations which regulate the company and its relations with personnel. Such regulations must contain, among other things, regulations related to ethics and good behavior. Notwithstanding the above, a company may create internal codes of conduct, provided they do not require or prohibit behavior that contravenes Chilean law. In 1996, Andina created a Code of Ethics and Business Conduct that applies to the entire Company. Andina has posted this information on its website | |||
ITEM 16H.MINE SAFETY DISCLOSURE
Not applicable.
| FINANCIAL STATEMENTS |
Reference is made to Item 18 for a list of all financial statements filed as part of this annual report.
See “Item 18 – Financial Statements”.
| ITEM 18. | FINANCIAL STATEMENTS |
The following financial statements, together with the report of independent registered accounting firm, are filed as part of this Annual Report:annual report:
Index to Consolidated | Page | |
|
| |
Consolidated Statements of Financial Position at December 31, |
| |
| 2018 |
| |
| 2018 |
| |
Statements of Changes in Equity for the years ended December 31, |
| |
| 2018 |
| |
Notes to the Consolidated Financial Statements at December 31, |
|
ITEM 18.FINANCIAL STATEMENTS
The exhibits filed with or incorporated by reference in this annual report are listed in the exhibit index below.
EXHIBIT INDEX
|
| |
| 4.5 | ||
|
| |
|
| |
|
| |
|
| |
|
| |
|
| |
|
| |
|
| |
|
| |
|
| |
|
|
| |
|
| |
|
| |
|
| |
|
| |
|
| |
|
| |
| ||
| 4.6 | Amendment | |
| ||
| 4.7 | Bottler Agreement dated as of | |
|
| |
|
| |
| ||
| 4.8 | Amendment dated as of | |
|
|
Omitted from the exhibits filed with this annual report are certain instruments and agreements with respect to long-term debt ofEmbotelladora Andina S.A., none of which authorizes securities in a total amount that exceeds 10.0% of the total assets of Embotelladora Andina S.A. We hereby agree to furnish to the SEC copies of any such omitted instruments or agreements upon request by the SEC.
| 101.INS | XBRL Instance Document | |
| 101.SCH | XBRL Taxonomy Extension Schema Document | |
| 101.CAL | XBRL Taxonomy Extension Calculation Linkbase Document | |
| 101.LAB | XBRL Taxonomy Extension Label Linkbase Document | |
| 101.PRE | XBRL Taxonomy Extension Presentation Linkbase Document |
SIGNATURES
The registrant hereby certifies that it meets all of the requirements for filing on Form 20-F and that it has duly caused and authorized the undersigned to sign this annual report on its behalf.
Embotelladora Andina S.A. | |
(Registrant) | |
/s/ Miguel Ángel Peirano | |
(Signature) | |
| /s/ Andrés Wainer | |
(Signature) |
Date: April 28, 2016

Consolidated Financial Statements
EMBOTELLADORA ANDINA S.A. AND SUBSIDIARIES
Consolidated Financial StatementsSantiago, Chile
as of December 31, 20152020 and 20142019
EMBOTELLADORA ANDINA S.A. AND SUBSIDIARIESReport of Independent Registered Public Accounting Firm
Consolidated Financial Statements
INDEX

REPORT OF INDEPENDENT REGISTERED PUBLIC ACCOUNTING FIRM
To the Board of Directors and Shareholders of Embotelladora Andina S.A.
In our opinion,Opinion on the Consolidated Financial Statements
We have audited the accompanying consolidated statements of financial position of Embotelladora Andina S.A. and subsidiaries (the Company) as of December 31, 2020 and 2019, the related consolidated statements of income, other comprehensive income, changes in equity and cash flows present fairly, in all material respects, the financial position of Embotelladora Andina S.A. and its subsidiaries at December 31, 2015 and 2014 and the results of their operations and their cash flows for each of the three years in the period ended December 31, 20152020, and the related notes (collectively referred to as the “consolidated financial statements”). In our opinion, the consolidated financial statements present fairly, in all material respects, the consolidated financial position of the Company as of December 31, 2020 and 2019, and the consolidated results of its operations and its cash flows for each of the three years in the period ended December 31, 2020, in conformity with International Financial Reporting Standards (IFRS), as issued by the International Accounting Standards Board. Also
We also have audited, in accordance with the standards of the Public Company Accounting Oversight Board (United States) (PCAOB), the Company's internal control over financial reporting as of December 31, 2020, based on criteria established in Internal Control-Integrated Framework issued by the Committee of Sponsoring Organizations of the Treadway Commission (2013 framework) and our report dated April 27, 2021 expressed an unqualified opinion thereon.
Basis for Opinion
These consolidated financial statements are the responsibility of the Company's management. Our responsibility is to express an opinion on the Company's financial statements based on our audits. We are a public accounting firm registered with the PCAOB and are required to be independent with respect to the Company in accordance with the U.S. federal securities laws and the applicable rules and regulations of the Securities and Exchange Commission and the PCAOB.
We conducted our audits in accordance with the standards of the PCAOB. Those standards require that we plan and perform the audit to obtain reasonable assurance about whether the consolidated financial statements are free of material misstatement, whether due to error or fraud. Our audits included performing procedures to assess the risks of material misstatement of the consolidated financial statements, whether due to error or fraud, and performing procedures that respond to those risks. Such procedures included examining, on a test basis, evidence regarding the amounts and disclosures in the consolidated financial statements. Our audits also included evaluating the accounting principles used and significant estimates made by management, as well as evaluating the overall presentation of the consolidated financial statements. We believe that our audits provide a reasonable basis for our opinion.
Critical Audit Matters
The critical audit matters communicated below are matters arising from the current period audit of the financial statements that were communicated or required to be communicated to the audit committee and that: (1) relate to accounts or disclosures that are material to the financial statements and (2) involved our especially challenging, subjective or complex judgments. The communication of critical audit matters does not alter in any way our opinion on the consolidated financial statements, taken as a whole, and we are not, by communicating the critical audit matters below, providing separate opinions on the critical audit matters or on the accounts or disclosures to which they relate.
| | | Impairment of indefinite lived assets - distribution rights and goodwill |
| Description of the Matter | | As disclosed in Notes 15 and 16 to the consolidated financial statements, Distribution Rights and Goodwill were Ch$ 604,514 million and Ch$ 98,326 million respectively as of December 31, 2020. The Company carries out an impairment test annually, or more frequently if indicators of impairment require the performance of an interim impairment assessment. Auditing management’s impairment tests was complex and specially challenging due to the significant measurement uncertainty in determining the fair values of the reporting units. In particular the fair value estimates are sensitive to changes in significant assumptions such as discount rate, revenue growth rate, operating margins, consumer trends and other market and economic conditions. |
| How We Addressed the Matter in our Audit | | We obtained an understanding, evaluated the design and tested the operating effectiveness of controls over the distribution rights and goodwill impairment test. For example, we tested controls over the significant assumptions, such as discount rate, projected cash flow, terminal growth rate and revenue growth rates used in the fair value computation process. To test the fair values of the reporting units, our audit procedures included, among others, assessing the methodologies used by the Company with the assistance of our valuation specialists; testing the underlying data; evaluating significant assumptions, such as volume growth and product mix with the assistance of our valuation specialists; comparing significant assumptions to current market and economic trends and historical results of the Company's business and performing a sensitivity analysis of significant assumptions to evaluate the changes in the fair value of the reporting units resulting from changes in those assumptions. We also evaluated the financial statements disclosures included in Notes 2.8, 15 and 16. |
| | | Tax Contingencies in Brazil |
| Description of the Matter | | As described in Note 23 to the consolidated financial statements, the Company is party to a number of administrative and legal proceedings arising from various tax claims for which a provision was recorded as of December 31, 2020, as the probability of loss was assessed as more than likely based on current available information. The Company uses significant judgment in determining whether its technical merits are more-likely-than-not to be sustained in court, considering the complexity of the Brazilian tax environment and lack of jurisprudence for certain tax matters. To carry out this assessment, management monitors the evolution of court ruling trends and is assisted by the Company’s external legal counsel. Auditing management’s assessment of the probability of a loss on tax claims is complex, highly judgmental and based on interpretations of tax laws and legal rulings, as there is significant estimation uncertainty related to the ultimate outcome of court decisions, the evolution of jurisprudence and the position of the Brazilian tax authorities. |
| How We Addressed the Matter in our Audit | | We obtained an understanding, evaluated the design and tested the operating effectiveness of controls over the identification and evaluation of tax claims, including management’s process to determine whether the technical merits are more-likely-than-not to be sustained in the court. To test the Company’s assessment of the probability of a loss on tax claims, our audit procedures included, among others, involving of our tax professionals to assess the Company’s technical merits and in evaluating legal opinions and other tax advice obtained by the Company; independently corresponding with certain key external tax and legal advisers of the Company; comparing the evolution of the loss probability assessment by the Company for significant matters and evaluating the Company’s current assessment using our knowledge of, and experience with, the application of tax laws by the relevant tax authorities. We also evaluated the financial statements disclosures included in notes in Notes 19 and 23. |
| /s/ EY Audit SpA | ||
| We have served as the Company's auditor since 2017. | ||
| Santiago, Chile | ||
| April 27, 2021 |
Report of Independent Registered Public Accounting Firm
To the Shareholders and the Board of Directors of Embotelladora Andina S.A.
Opinion on Internal Control over Financial Reporting
We have audited Embotelladora Andina S.A.’s internal control over financial reporting as of December 31, 2020, based on criteria established in Internal Control-Integrated Framework issued by the Committee of Sponsoring Organizations of the Treadway Commission (2013 framework) (the COSO criteria). In our opinion, Embotelladora Andina S.A. (the Company) maintained, in all material respects, effective internal control over financial reporting as of December 31, 2015,2020, based on criteria establishedthe COSO criteria.
We also have audited, in Internal Control - Integrated Framework (2013) issued byaccordance with the Committee of Sponsoring Organizationsstandards of the Treadway Commission (COSO). Public Company Accounting Oversight Board (United States) (PCAOB), the accompanying consolidated statements of financial position of Embotelladora Andina S.A. as of December 31, 2020 and 2019, the related consolidated statements of income, other comprehensive income, changes in equity and cash flows for each of the three years then ended December 31, 2020, and the related notes and our report dated April 27, 2021 expressed an unqualified opinion thereon.
Basis for Opinion
The Company’sCompany's management is responsible for these financial statements, for maintaining effective internal control over financial reporting and for its assessment of the effectiveness of internal control over financial reporting included in Management’s Annualthe accompanying Report on Internal Control over Financial Reporting appearing under Item 15 of this Annual Report on Form 20-F.Reporting. Our responsibility is to express opinions on these financial statements andan opinion on the Company’sCompany's internal control over financial reporting based on our integrated audits. audit. We are a public accounting firm registered with the PCAOB and are required to be independent with respect to the Company in accordance with the U.S. federal securities laws and the applicable rules and regulations of the Securities and Exchange Commission and the PCAOB.
We conducted our auditsaudit in accordance with the standards of the Public Company Accounting Oversight Board (United States).PCAOB. Those standards require that we plan and perform the auditsaudit to obtain reasonable assurance about whether the financial statements are free of material misstatement and whether effective internal control over financial reporting was maintained in all material respects. Our audits of the financial statements included examining, on a test basis, evidence supporting the amounts and disclosures in the financial statements, assessing the accounting principles used and significant estimates made by management, and evaluating the overall financial statement presentation.
Our audit of internal control over financial reporting included obtaining an understanding of internal control over financial reporting, assessing the risk that a material weakness exists, and testing and evaluating the design and operating effectiveness of internal control based on the assessed risk. Our audits also includedrisk, and performing such other procedures as we considered necessary in the circumstances. We believe that our audits provideaudit provides a reasonable basis for our opinions.opinion.
F-4
Definition and Limitations of Internal Control over Financial Reporting
A company’scompany's internal control over financial reporting is a process designed to provide reasonable assurance regarding the reliability of financial reporting and the preparation of financial statements for external purposes in accordance with generally accepted accounting principles. A company’scompany's internal control over financial reporting includes those policies and procedures that (i)(1) pertain to the maintenance of records that, in reasonable detail, accurately and fairly reflect the transactions and dispositions of the assets of the company; (ii)(2) provide reasonable assurance that transactions are recorded as necessary to permit preparation of financial statements in accordance with generally accepted accounting principles, and that receipts and expenditures of the company are being made only in accordance with authorizations of management and directors of the company; and (iii)(3) provide reasonable assurance regarding prevention or timely detection of unauthorized acquisition, use, or disposition of the company’scompany's assets that could have a material effect on the financial statements.

Because of its inherent limitations, internal control over financial reporting may not prevent or detect misstatements. Also, projections of any evaluation of effectiveness to future periods are subject to the risk that controls may become inadequate because of changes in conditions, or that the degree of compliance with the policies or procedures may deteriorate.
| /s/ EY Audit SpA | ||
| Santiago, Chile | ||
| April 27, 2021 | ||
/s/ PricewaterhouseCoopers
Santiago - Chile
April 26, 2016
EMBOTELLADORA ANDINA S.A. AND SUBSIDIARIES
Consolidated Financial Statements
Consolidated Financial Statements
EMBOTELLADORA ANDINA S.A. AND SUBSIDIARIES
As of December 31, 2020 and 2019
F-7

EMBOTELLADORA ANDINA S.A. AND SUBSIDIARIES
Consolidated Statements of Financial Position
As of December 31, 2015 and 2014
(Translation of consolidated financial statements originally issued in Spanish — See Note 2.2)
|
| NOTE |
| 12.31.2015 |
| 12.31.2014 |
| |||||||||||
|
|
|
| ThCh$ |
| ThCh$ |
| 12.31.2020 | 12.31.2019 | |||||||||
ASSETS |
|
|
|
|
|
|
| NOTE | ThCh$ | ThCh$ | ||||||||
Current assets: |
|
|
|
|
|
|
| |||||||||||
Cash and cash equivalents |
| 5 |
| 129,160,939 |
| 79,514,434 |
| 4 | 309,530,699 | 157,567,986 | ||||||||
Other financial assets |
| 6 |
| 87,491,931 |
| 106,577,042 |
| 5 | 140,304,853 | 347,278 | ||||||||
Other non-financial assets |
| 7.1 |
| 8,686,156 |
| 7,787,181 |
| 6 | 13,374,381 | 16,188,965 | ||||||||
Trade and other accounts receivable, net |
| 8 |
| 176,385,836 |
| 198,110,424 |
| 7 | 194,021,253 | 191,077,588 | ||||||||
Accounts receivable from related parties |
| 12.1 |
| 4,610,500 |
| 5,994,453 |
| |||||||||||
Inventories |
| 9 |
| 133,333,253 |
| 149,727,618 |
| |||||||||||
| Accounts receivable from related companies | 12,1 | 11,875,408 | 10,835,768 | |||||||||||||||
| Inventory | 8 | 127,972,650 | 147,641,224 | |||||||||||||||
Current tax assets |
| 10.2 |
| 7,741,241 |
| 6,025,049 |
| 9 | 218,472 | 9,815,294 | ||||||||
Total Current Assets |
|
|
| 547,409,856 |
| 553,736,201 |
| 797,297,716 | 533,474,103 | |||||||||
|
|
|
|
|
|
|
| |||||||||||
Non-Current Assets: |
|
|
|
|
|
|
| |||||||||||
| Non-Current Assets: | ||||||||||||||||||
Other financial assets |
| 6 |
| 181,491,527 |
| 51,026,773 |
| 5 | 162,013,278 | 110,784,311 | ||||||||
Other non-financial assets |
| 7.2 |
| 18,289,901 |
| 33,056,780 |
| 6 | 90,242,672 | 125,636,150 | ||||||||
Trade and other receivables |
| 8 |
| 5,931,999 |
| 7,097,809 |
| 7 | 73,862 | 523,769 | ||||||||
Accounts receivable from related parties |
| 12.1 |
| 14,732 |
| 24,752 |
| 12,1 | 138,346 | 283,118 | ||||||||
Investments accounted for under the equity method |
| 14.1 |
| 54,190,546 |
| 66,050,213 |
| 14 | 87,956,354 | 99,866,733 | ||||||||
Intangible assets other than goodwill |
| 15.1 |
| 665,666,655 |
| 728,181,279 |
| 15 | 604,514,165 | 675,075,375 | ||||||||
Goodwill |
| 15.2 |
| 95,835,936 |
| 116,924,199 |
| 16 | 98,325,593 | 121,221,661 | ||||||||
Property, plant and equipment |
| 11.1 |
| 640,529,872 |
| 713,075,285 |
| 11 | 605,576,545 | 722,718,863 | ||||||||
| Deferred tax assets | 10,2 | 1,925,869 | 1,364,340 | |||||||||||||||
Total Non-Current Assets |
|
|
| 1,661,951,168 |
| 1,715,437,090 |
| 1,650,766,684 | 1,857,474,320 | |||||||||
Total Assets |
|
|
| 2,209,361,024 |
| 2,269,173,291 |
| 2,448,064,400 | 2,390,948,423 | |||||||||
The accompanying notes 1 to 3031 form an integral part of these financial statementsConsolidated Financial Statements
F-8
EMBOTELLADORA ANDINA S.A. AND SUBSIDIARIES
Consolidated Statements of Financial Position
As of December 31, 2015 and 2014
(Translation of consolidated financial statements originally issued in Spanish — See Note 2.2)
|
| NOTE |
| 12.31.2015 |
| 12.31.2014 |
| |||||||||||
|
|
|
| ThCh$ |
| ThCh$ |
| 12.31.2020 | 12.31.2019 | |||||||||
LIABILITIES AND EQUITY |
|
|
|
|
|
|
| NOTE | ThCh$ | ThCh$ | ||||||||
LIABILITIES |
|
|
|
|
|
|
| |||||||||||
Current Liabilities: |
|
|
|
|
|
|
| |||||||||||
Other financial liabilities |
| 16 |
| 62,217,688 |
| 83,402,440 |
| 17 | 38,566,724 | 40,593,878 | ||||||||
Trade and other accounts payable |
| 17 |
| 212,526,368 |
| 228,179,112 |
| 18 | 230,445,809 | 243,700,553 | ||||||||
Accounts payable to related parties |
| 12.2 |
| 48,652,827 |
| 55,966,789 |
| 12,2 | 39,541,968 | 53,637,601 | ||||||||
Provisions |
| 18 |
| 326,093 |
| 365,832 |
| 19 | 1,335,337 | 2,068,984 | ||||||||
Income taxes payable |
| 10.3 |
| 7,494,832 |
| 2,931,206 |
| 9 | 8,828,599 | 6,762,267 | ||||||||
Employee benefits current provisions |
| 13 |
| 31,790,759 |
| 27,746,745 |
| 13 | 31,071,019 | 38,392,854 | ||||||||
Other non-financial liabilities |
| 19 |
| 17,565,643 |
| 11,620,303 |
| 20 | 28,266,730 | 26,502,215 | ||||||||
Total Current Liabilities |
|
|
| 380,574,210 |
| 410,212,427 |
| 378,056,186 | 411,658,352 | |||||||||
|
|
|
|
|
|
|
| |||||||||||
| Other financial liabilities, non-current | 17 | 989,829,569 | 743,327,057 | |||||||||||||||
| Accounts payable, non-current | 18 | 295,279 | 619,587 | |||||||||||||||
| Accounts payable to related companies, non-current | 12,2 | 10,790,089 | 19,777,812 | |||||||||||||||
| Other provisions, non-current | 19 | 48,734,936 | 67,038,566 | |||||||||||||||
| Deferred tax liabilities | 10,2 | 153,669,547 | 169,449,747 | |||||||||||||||
| Employee benefits non-current provisions | 13 | 13,635,558 | 10,173,354 | |||||||||||||||
| Other non-financial liabilities, non-current | 20 | 21,472,048 | - | |||||||||||||||
| Income taxes payable, non-current | 9 | 20,597 | - | |||||||||||||||
Non-Current Liabilities: |
|
|
|
|
|
|
| 1,238,447,623 | 1,010,386,123 | |||||||||
Other financial liabilities |
| 16 |
| 765,299,344 |
| 726,616,440 |
| |||||||||||
Trade and other payables |
| 17 |
| 9,303,224 |
| 1,216,434 |
| |||||||||||
Provisions |
| 18 |
| 63,975,724 |
| 77,446,513 |
| |||||||||||
Deferred income tax liabilities |
| 10.5 |
| 130,201,701 |
| 126,126,147 |
| |||||||||||
Post-employment benefit liabilities |
| 13 |
| 8,230,030 |
| 8,125,107 |
| |||||||||||
Other non-financial liabilities |
| 19 |
| 242,491 |
| 432,490 |
| |||||||||||
Total Non-Current Liabilities |
|
|
| 977,252,514 |
| 939,963,131 |
| |||||||||||
|
|
|
|
|
|
|
| |||||||||||
Equity: |
| 20 |
|
|
|
|
| 21 | ||||||||||
Issued capital |
|
|
| 270,737,574 |
| 270,737,574 |
| 270,737,574 | 270,737,574 | |||||||||
Retained earnings |
|
|
| 274,755,431 |
| 247,817,939 |
| 654,171,126 | 600,918,265 | |||||||||
Other reserves |
|
|
| 284,980,830 |
| 378,738,982 |
| (113,727,586 | ) | 76,993,851 | ||||||||
Equity attributable to equity holders of the parent |
|
|
| 830,473,835 |
| 897,294,495 |
| 811,181,114 | 948,649,690 | |||||||||
Non-controlling interests |
|
|
| 21,060,465 |
| 21,703,238 |
| 20,379,477 | 20,254,258 | |||||||||
Total Equity |
|
|
| 851,534,300 |
| 918,997,733 |
| 831,560,591 | 968,903,948 | |||||||||
Total Liabilities and Equity |
|
|
| 2,209,361,024 |
| 2,269,173,291 |
| 2,448,064,400 | 2,390,948,423 | |||||||||
The accompanying notes 1 to 3031 form an integral part of these financial statementsConsolidated Financial Statements
EMBOTELLADORA ANDINA S.A. AND SUBSIDIARIES
Consolidated Statements of Income by Function
atperiods between January 1 and December 31, 2015, 20142020, 2019 and 2013
(Translation of consolidated financial statements originally issued in Spanish — See Note 2.2)2018
|
|
|
| 01.01.2015 |
| 01.01.2014 |
| 01.01.2013 |
| 01.01.2020 | 01.01.2019 | 01.01.2018 | |||||||||||||
|
| NOTE |
| 12.31.2015 |
| 12.31.2014 |
| 12.31.2013 |
| 12.31.2020 | 12.31.2019 | 12.31.2018 | |||||||||||||
|
|
|
| ThCh$ |
| ThCh$ |
| ThCh$ |
| NOTE | ThCh$ | ThCh$ | ThCh$ | ||||||||||||
Net sales |
|
|
| 1,877,394,256 |
| 1,797,199,877 |
| 1,521,681,335 |
| 1,698,281,237 | 1,779,025,115 | 1,672,915,799 | |||||||||||||
Cost of sales |
| 24 |
| (1,106,706,146 | ) | (1,081,243,408 | ) | (914,817,748 | ) | 8 | (1,022,498,659 | ) | (1,048,343,767 | ) | (968,027,774 | ) | |||||||||
Gross Profit |
|
|
| 770,688,110 |
| 715,956,469 |
| 606,863,587 |
| 675,782,578 | 730,681,348 | 704,888,025 | |||||||||||||
Other income |
| 25 |
| 471,569 |
| 3,970,623 |
| 4,385,617 |
| 26 | 8,356,298 | 40,947,158 | 2,609,168 | ||||||||||||
Distribution expenses |
| 24 |
| (202,490,792 | ) | (187,042,843 | ) | (163,022,685 | ) | 25 | (152,532,018 | ) | (166,996,289 | ) | (165,775,484 | ) | |||||||||
Administrative expenses |
| 24 |
| (352,600,846 | ) | (342,140,932 | ) | (272,556,438 | ) | 25 | (283,638,935 | ) | (325,903,809 | ) | (313,742,853 | ) | |||||||||
Other expenses |
| 26 |
| (21,983,048 | ) | (18,591,271 | ) | (30,462,097 | ) | 27 | (17,430,256 | ) | (26,182,847 | ) | (16,057,763 | ) | |||||||||
Other (loss) gains |
| 28 |
| (6,301,121 | ) | (4,392,105 | ) | 740,373 |
| 29 | 287 | 2,876 | (2,707,859 | ) | |||||||||||
Financial income |
| 27 |
| 10,118,375 |
| 8,655,623 |
| 4,973,312 |
| 28 | 14,945,879 | 45,155,791 | 3,940,244 | ||||||||||||
Financial expenses |
| 27 |
| (55,669,217 | ) | (65,081,431 | ) | (28,944,023 | ) | 28 | (54,772,837 | ) | (46,209,020 | ) | (55,014,660 | ) | |||||||||
Share of (loss) profit of investments accounted for using the equity method |
| 14.3 |
| (2,327,829 | ) | 1,190,969 |
| 783,418 |
| ||||||||||||||||
| Share of profit (loss) of investments in associates and joint ventures accounted for using the equity method | 14,3 | 2,228,763 | (3,415,083 | ) | 1,411,179 | ||||||||||||||||||||
Foreign exchange differences |
|
|
| (2,856,370 | ) | (2,675,027 | ) | (7,694,834 | ) | (3,088,278 | ) | (4,130,543 | ) | (1,449,256 | ) | ||||||||||
Loss from differences in indexed financial assets and liabilities |
|
|
| (7,308,343 | ) | (12,461,548 | ) | (1,832,742 | ) | ||||||||||||||||
| Income by indexation units | (11,828,762 | ) | (7,536,466 | ) | (5,085,140 | ) | |||||||||||||||||||
Net income before income taxes |
|
|
| 129,740,488 |
| 97,388,527 |
| 113,233,488 |
| 178,022,719 | 236,413,116 | 153,015,601 | |||||||||||||
Income tax expense |
| 10.4 |
| (41,642,562 | ) | (45,354,435 | ) | (22,966,264 | ) | 10,1 | (54,905,399 | ) | (61,166,891 | ) | (55,564,855 | ) | |||||||||
Net income |
|
|
| 88,097,926 |
| 52,034,092 |
| 90,267,224 |
| 123,117,320 | 175,246,225 | 97,450,746 | |||||||||||||
|
|
|
|
|
|
|
|
|
| ||||||||||||||||
Net income attributable to: |
|
|
|
|
|
|
|
|
| ||||||||||||||||
Equity holders of the parent |
|
|
| 87,863,484 |
| 51,875,084 |
| 88,982,678 |
| ||||||||||||||||
| Net income attributable to | |||||||||||||||||||||||||
| Owners of the controller | 121,999,805 | 173,721,928 | 96,603,371 | ||||||||||||||||||||||
Non-controlling interests |
|
|
| 234,442 |
| 159,008 |
| 1,284,546 |
| 1,117,515 | 1,524,297 | 847,375 | |||||||||||||
Net income |
|
|
| 88,097,926 |
| 52,034,092 |
| 90,267,224 |
| 123,117,320 | 175,246,225 | 97,450,746 | |||||||||||||
|
|
|
|
|
|
|
|
|
| ||||||||||||||||
|
|
|
| Ch$ |
| Ch$ |
| Ch$ |
| ||||||||||||||||
Earnings per Share, basic and diluted |
|
|
|
|
|
|
|
|
| Ch$ | Ch$ | Ch$ | |||||||||||||
Earnings per Series A Share |
| 20.5 |
| 88,40 |
| 52,19 |
| 89.53 |
| 21,5 | 122.75 | 174.79 | 97.20 | ||||||||||||
Earnings per Series B Share |
| 20.5 |
| 97,24 |
| 57,41 |
| 98.48 |
| 21,5 | 135.02 | 192.27 | 106.92 | ||||||||||||
The accompanying notes 1 to 3031 form an integral part of these financial statementsConsolidated Financial Statements
EMBOTELLADORA ANDINA S.A. AND SUBSIDIARIES
Consolidated Statements of Comprehensive Income
for the years ended atperiods between January 1 and December 31, 2015, 20142020, 2019 and 2013
(Translation of consolidated financial statements originally issued in Spanish — See Note 2.2)2018
|
| 01.01.2015 |
| 01.01.2014 |
| 01.01.2013 |
| 01.01.2020 | 01.01.2019 | 01.01.2018 | |||||||||
|
| 12.31.2015 |
| 12.31.2014 |
| 12.31.2013 |
| 12.31.2020 | 12.31.2019 | 12.31.2018 | |||||||||
|
| ThCh$ |
| ThCh$ |
| ThCh$ |
| ThCh$ | ThCh$ | ThCh$ | |||||||||
Net income |
| 88,097,926 |
| 52,034,092 |
| 90,267,224 |
| 123,117,320 | 175,246,225 | 97,450,746 | |||||||||
Other Comprehensive Income: |
|
|
|
|
|
|
| ||||||||||||
Components of other comprehensive income that are not re-measured to net income for the period, before taxes |
|
|
|
|
|
|
| ||||||||||||
| Components of other comprehensive income that will not be reclassified to net income for the period, before taxes | |||||||||||||||||||
Actuarial losses from defined benefit plans |
| (744,445 | ) | (140,749 | ) | (1,411,030 | ) | (3,146,362 | ) | (379,007 | ) | (63,463 | ) | ||||||
Components of other comprehensive income that will be re-measured to net income for the period, before taxes |
|
|
|
|
|
|
| ||||||||||||
Gains (losses) from exchange rate translation differences |
| (119,212,803 | ) | 28,309,535 |
| (18,877,527 | ) | ||||||||||||
Gains from cash flow hedges |
| 31,134,391 |
| 5,909,129 |
| 2,961,146 |
| ||||||||||||
Income tax related to components of other comprehensive income that are not re-measured to net income for the period |
|
|
|
|
|
|
| ||||||||||||
| Components of other comprehensive income that will be reclassified to net income for the period, before taxes | |||||||||||||||||||
| Gain (losses) from exchange rate translation differences | (264,119,093 | ) | (41,844,584 | ) | (72,455,525 | ) | |||||||||||||
| Gain (losses) from cash flow hedges | (12,203,755 | ) | (1,865,233 | ) | (13,151,841 | ) | |||||||||||||
| Income tax related to components of other comprehensive income that will not be reclassified to net income for the period | |||||||||||||||||||
Income tax benefit related to defined benefit plans |
| 148,877 |
| 31,580 |
| 282,206 |
| 849,518 | 102,332 | 16,184 | |||||||||
|
|
|
|
|
|
|
| ||||||||||||
Income tax related to components of other comprehensive income that will be re-measured to net income for the period |
|
|
|
|
|
|
| ||||||||||||
Income tax, related to exchange rate translation differences |
| 4,604,711 |
| 663,705 |
| 1,096,509 |
| ||||||||||||
| Income tax related to components of other comprehensive income that will be reclassified to net income for the period | |||||||||||||||||||
| Income tax related to exchange rate translation differences | 84,571,922 | 9,295,546 | 2,476,204 | ||||||||||||||||
Income tax related to cash flow hedges |
| (10,172,792 | ) | (2,041,658 | ) | (703,002 | ) | 2,334,037 | 683,482 | 2,554,551 | |||||||||
| Other comprehensive income, total | (191,713,733 | ) | (34,007,464 | ) | (80,623,890 | ) | |||||||||||||
Total comprehensive income |
| (6,144,135 | ) | 84,765,634 |
| 73,615,526 |
| (68,596,413 | ) | 141,238,761 | 16,826,856 | ||||||||
Total comprehensive income attributable to: |
|
|
|
|
|
|
| ||||||||||||
Equity holders of the parent |
| (5,894,668 | ) | 83,875,399 |
| 72,139,832 |
| ||||||||||||
| Equity holders of the controller | (68,721,632 | ) | 139,861,690 | 16,370,635 | |||||||||||||||
Non-controlling interests |
| (249,467 | ) | 890,235 |
| 1,475,694 |
| 125,219 | 1,377,071 | 456,221 | |||||||||
Total comprehensive income |
| (6,144,135 | ) | 84,765,634 |
| 73,615,526 |
| (68,596,413 | ) | 141,238,761 | 16,826,856 | ||||||||
The accompanying notes 1 to 3031 form an integral part of these financial statementsConsolidated Financial Statements
F-11

EMBOTELLADORA ANDINA S.A. AND SUBSIDIARIES
Consolidated StatementStatements of Changes in EquiEquityty
for the years endedperiods
between January 1 and December 31, 2015, 20142020, 2019 and 2013
(Translation of consolidated financial statements originally issued in Spanish — See Note 2.2)2018
|
|
|
| Other reserves |
|
|
|
|
|
|
|
|
| Other reserves | |||||||||||||||||||||||||||||||||||||||||||||||
|
| Issued capital |
| Translation reserves |
| Cash flow hedge |
| Actuarial gains |
| Other |
| Total |
| Retained |
| Controlling |
| Non- |
| Total Equity |
| Issued capital | Reserves for exchange rate differences | Cash flow hedge reserve | Actuarial gains or losses in employee benefits | Other reserves | Total other reserve, net of taxs | Retained earnings | Controlling Equity | Non- | Total Equity | ||||||||||||||||||||||||||||||
|
| ThCh$ |
| ThCh$ |
| ThCh$ |
| ThCh$ |
| ThCh$ |
| ThCh$ |
| ThCh$ |
| ThCh$ |
| ThCh$ |
| ThCh$ |
| ThCh$ | ThCh$ | ThCh$ | ThCh$ | ThCh$ | ThCh$ | ThCh$ | ThCh$ | ThCh$ | ThCh$ | ||||||||||||||||||||||||||||||
Opening balance at 01/01/2015 |
| 270,737,574 |
| (53,285,698 | ) | 6,125,615 |
| (1,237,993 | ) | 427,137,058 |
| 378,738,982 |
| 247,817,939 |
| 897,294,495 |
| 21,703,238 |
| 918,997,733 |
| ||||||||||||||||||||||||||||||||||||||||
| Opening balance as of 01,01,2020 | 270,737,574 | (339,076,340 | ) | (14,850,683 | ) | (2,230,752 | ) | 433,151,626 | 76,993,851 | 600,918,265 | 948,649,690 | 20,254,258 | 968,903,948 | ||||||||||||||||||||||||||||||||||||||||||||||||
Changes in Equity |
|
|
|
|
|
|
|
|
|
|
|
|
|
|
|
|
|
|
|
|
| ||||||||||||||||||||||||||||||||||||||||
Comprehensive Income |
|
|
|
|
|
|
|
|
|
|
|
|
|
|
|
|
|
|
|
|
| ||||||||||||||||||||||||||||||||||||||||
Net income |
| — |
| — |
| — |
| — |
| — |
| — |
| 87,863,484 |
| 87,863,484 |
| 234,442 |
| 88.097.926 |
| ||||||||||||||||||||||||||||||||||||||||
| Earnings | - | - | - | - | - | 121,999,805 | 121,999,805 | 1,117,515 | 123,117,320 | ||||||||||||||||||||||||||||||||||||||||||||||||||||
Other comprehensive income |
| — |
| (114,161,459 | ) | 20,961,599 |
| (558,292 | ) | — |
| (93,758,152 | ) | — |
| (93,758,152 | ) | (483,909 | ) | (94.242.061 | ) | - | (178,420,146 | ) | (9,868,850 | ) | (2,432,441 | ) | - | (190,721,437 | ) | - | (190,721,437 | ) | (992,296 | ) | (191,713,733 | ) | |||||||||||||||||||||||
Comprehensive income |
| — |
| (114,161,459 | ) | 20,961,599 |
| (558,292 | ) | — |
| (93,758,152 | ) | 87,863,484 |
| (5,894,668 | ) | (249,467 | ) | (6.144.135 | ) | - | (178,420,146 | ) | (9,868,850 | ) | (2,432,441 | ) | - | (190,721,437 | ) | 121,999,805 | (68,721,632 | ) | 125,219 | (68,596,413 | ) | ||||||||||||||||||||||||
Dividends |
| — |
| — |
| — |
| — |
| — |
| — |
| (60,925,992 | ) | (60,925,992 | ) | (393,306 | ) | (61,319,298 | ) | - | - | - | - | - | - | (103,365,468 | ) | (103,365,468 | ) | - | (103,365,468 | ) | |||||||||||||||||||||||||||
| Increase (decrease) from other changes | - | - | - | - | - | - | 34,618,524 | 34,618,524 | - | 34,618,524 | |||||||||||||||||||||||||||||||||||||||||||||||||||
Total changes in equity |
| — |
| (114,161,459 | ) | 20,961,599 |
| (558,292 | ) | — |
| (93,758,152 | ) | 26,937,492 |
| (66,820,660 | ) | (642,773 | ) | (67,463,433 | ) | - | (178,420,146 | ) | (9,868,850 | ) | (2,432,441 | ) | - | (190,721,437 | ) | 53,252,861 | (137,468,576 | ) | 125,219 | (137,343,357 | ) | ||||||||||||||||||||||||
Ending balance at 12.31.2015 |
| 270,737,574 |
| (167,447,157 | ) | 27,087,214 |
| (1,796,285 | ) | 427,137,058 |
| 284,980,830 |
| 274,755,431 |
| 830,473,835 |
| 21,060,465 |
| 851,534,300 |
| ||||||||||||||||||||||||||||||||||||||||
| Ending balance as of 12,31,2020 | 270,737,574 | (517,496,486 | ) | (24,719,533 | ) | (4,663,193 | ) | 433,151,626 | (113,727,586 | ) | 654,171,126 | 811,181,114 | 20,379,477 | 831,560,591 | |||||||||||||||||||||||||||||||||||||||||||||||
|
|
|
| Other reserves |
|
|
|
|
|
|
|
|
| Other reserves | |||||||||||||||||||||||||||||||||||||||||||||||
|
| Issued capital |
| Translation reserves |
| Cash flow hedge |
| Actuarial |
| Other |
| Total |
| Retained |
| Controlling |
| Non- |
| Total Equity |
| Issued capital | Reserves for exchange rate differences | Cash flow hedge reserve | Actuarial gains or losses in employee benefits | Other reserves | Total other reserve, net of taxs | Retained earnings | Controlling Equity | Non-Controlling interests | Total Equity | ||||||||||||||||||||||||||||||
|
| ThCh$ |
| ThCh$ |
| ThCh$ |
| ThCh$ |
| ThCh$ |
| ThCh$ |
| ThCh$ |
| ThCh$ |
| ThCh$ |
| ThCh$ |
| ThCh$ | ThCh$ | ThCh$ | ThCh$ | ThCh$ | ThCh$ | ThCh$ | ThCh$ | ThCh$ | ThCh$ | ||||||||||||||||||||||||||||||
Opening balance at 01/01/2014 |
| 270,737,574 |
| (81,527,711 | ) | 2,258,144 |
| (1,128,824 | ) | 427,137,058 |
| 346,738,667 |
| 243,192,801 |
| 860,669,042 |
| 20,763,546 |
| 881,432,588 |
| ||||||||||||||||||||||||||||||||||||||||
| Opening balance as of 01,01,2019 | 270,737,574 | (306,674,528 | ) | (13,668,932 | ) | (1,954,077 | ) | 433,151,626 | 110,854,089 | 462,221,463 | 843,813,126 | 19,901,617 | 863,714,743 | ||||||||||||||||||||||||||||||||||||||||||||||||
Changes in Equity |
|
|
|
|
|
|
|
|
|
|
|
|
|
|
|
|
|
|
|
|
| ||||||||||||||||||||||||||||||||||||||||
Comprehensive Income |
|
|
|
|
|
|
|
|
|
|
|
|
|
|
|
|
|
|
|
|
| ||||||||||||||||||||||||||||||||||||||||
Net income |
| — |
| — |
| — |
| — |
| — |
| — |
| 51,875,084 |
| 51,875,084 |
| 159,008 |
| 52.034.092 |
| ||||||||||||||||||||||||||||||||||||||||
| Earnings | - | - | - | - | - | 173,721,928 | 173,721,928 | 1,524,297 | 175,246,225 | ||||||||||||||||||||||||||||||||||||||||||||||||||||
Other comprehensive income |
| — |
| 28,242,013 |
| 3,867,471 |
| (109,169 | ) | — |
| 32,000,315 |
| — |
| 32,000,315 |
| 731,227 |
| 32.731.542 |
| - | (32,401,812 | ) | (1,181,751 | ) | (276,675 | ) | - | (33,860,238 | ) | - | (33,860,238 | ) | (147,226 | ) | (34,007,464 | ) | |||||||||||||||||||||||
Comprehensive income |
| — |
| 28,242,013 |
| 3,867,471 |
| (109,169 | ) | — |
| 32,000,315 |
| 51,875,084 |
| 83,875,399 |
| 890,235 |
| 84.765.634 |
| - | (32,401,812 | ) | (1,181,751 | ) | (276,675 | ) | - | (33,860,238 | ) | 173,721,928 | 139,861,690 | 1,377,071 | 141,238,761 | ||||||||||||||||||||||||||
Dividends |
| — |
| — |
| — |
| — |
| — |
| — |
| (47,249,946 | ) | (47,249,946 | ) | 49,457 |
| (47,200,489 | ) | - | - | - | - | - | - | (86,568,579 | ) | (86,568,579 | ) | (1,024,430 | ) | (87,593,009 | ) | ||||||||||||||||||||||||||
| Increase (decrease) from other changes | - | - | - | - | - | - | 51,543,453 | 51,543,453 | - | 51,543,453 | |||||||||||||||||||||||||||||||||||||||||||||||||||
Total changes in equity |
| — |
| 28,242,013 |
| 3,867,471 |
| (109,169 | ) | — |
| 32,000,315 |
| 4,625,138 |
| 36,625,453 |
| 939,692 |
| 37,565,145 |
| - | (32,401,812 | ) | (1,181,751 | ) | (276,675 | ) | - | (33,860,238 | ) | 138,696,802 | 104,836,564 | 352,641 | 105,189,205 | ||||||||||||||||||||||||||
Ending balance at 12.31.2014 |
| 270,737,574 |
| (53,285,698 | ) | 6,125,615 |
| (1,237,993 | ) | 427,137,058 |
| 378,738,982 |
| 247,817,939 |
| 897,294,495 |
| 21,703,238 |
| 918,997,733 |
| ||||||||||||||||||||||||||||||||||||||||
| Ending balance as of 12,31,2019 | 270,737,574 | (339,076,340 | ) | (14,850,683 | ) | (2,230,752 | ) | 433,151,626 | 76,993,851 | 600,918,265 | 948,649,690 | 20,254,258 | 968,903,948 | ||||||||||||||||||||||||||||||||||||||||||||||||
The accompanying notes 1 to 3031 form an integral part of these financial statementsConsolidated Financial Statements
|
|
|
|
|
| Other reserves |
|
|
|
|
|
|
|
|
| Other reserves | |||||||||||||||||||||||||||||||||||||||||||||||
|
| Issued capital |
| Treasury |
| Translation |
| Cash flow |
| Actuarial |
| Other |
| Total |
| Retained |
| Controlling Equity |
| Non-Controlling |
| Total Equity |
| Issued capital | Reserves for exchange rate differences | Cash flow hedge reserve | Actuarial gains or losses in employee benefits | Other reserves | Total other reserves, net of tax | Retained earnings | Controlling Equity | Non- Controlling interests | Total Equity | ||||||||||||||||||||||||||||||
|
| ThCh$ |
| ThCh$ |
| ThCh$ |
| ThCh$ |
| ThCh$ |
| ThCh$ |
| ThCh$ |
| ThCh$ |
| ThCh$ |
| ThCh$ |
| ThCh$ |
| ThCh$ | ThCh$ | ThCh$ | ThCh$ | ThCh$ | ThCh$ | ThCh$ | ThCh$ | ThCh$ | ThCh$ | ||||||||||||||||||||||||||||||
Opening balance at 01.01.2013 |
| 270,759,299 |
| (21,725 | ) | (63,555,545 | ) | — |
| — |
| 427,137,058 |
| 363,581,513 |
| 239,844,662 |
| 874,163,749 |
| 19,441,172 |
| 893,604,921 |
| ||||||||||||||||||||||||||||||||||||||||
| Opening balance as of 01,01,2018 | 270,737,574 | (237,077,572 | ) | (3,094,671 | ) | (1,915,587 | ) | 427,137,058 | 185,049,228 | 335,523,254 | 791,310,056 | 21,923,293 | 813,233,349 | ||||||||||||||||||||||||||||||||||||||||||||||||||
| Changes in accounting policies | - | - | - | - | - | - | 79,499,736 | 79,499,736 | - | 79,499,736 | |||||||||||||||||||||||||||||||||||||||||||||||||||||
| Restated opening balance | 270,737,574 | (237,077,572 | ) | (3,094,671 | ) | (1,915,587 | ) | 427,137,058 | 185,049,228 | 415,022,990 | 870,809,792 | 21,923,293 | 892,733,085 | ||||||||||||||||||||||||||||||||||||||||||||||||||
Changes in Equity |
|
|
|
|
|
|
|
|
|
|
|
|
|
|
|
|
|
|
|
|
|
|
| ||||||||||||||||||||||||||||||||||||||||
Comprehensive Income |
|
|
|
|
|
|
|
|
|
|
|
|
|
|
|
|
|
|
|
|
|
|
| ||||||||||||||||||||||||||||||||||||||||
Net income |
| — |
| — |
| — |
| — |
| — |
| — |
| — |
| 88,982,678 |
| 88,982,678 |
| 1,284,546 |
| 90,267,224 |
| ||||||||||||||||||||||||||||||||||||||||
| Earnings | - | - | - | - | - | - | 96,603,371 | 96,603,371 | 847,375 | 97,450,746 | |||||||||||||||||||||||||||||||||||||||||||||||||||||
Other comprehensive income |
| — |
| — |
| (17,972,166 | ) | 2,258,144 |
| (1,128,824 | ) | — |
| (16,842,846 | ) | — |
| (16,842,846 | ) | 191,148 |
| (16,651,698 | ) | - | (69,596,956 | ) | (10,597,290 | ) | (38,490 | ) | - | (80,232,736 | ) | - | (80,232,736 | ) | (391,154 | ) | (80,623,890 | ) | |||||||||||||||||||||||
Comprehensive income |
| — |
| — |
| (17,972,166 | ) | 2,258,144 |
| (1,128,824 | ) | — |
| (16,842,846 | ) | 88,982,678 |
| 72,139,832 |
| 1,475,694 |
| 73,615,526 |
| ||||||||||||||||||||||||||||||||||||||||
| Comprehensive income, total | - | (69,596,956 | ) | (10,597,290 | ) | (38,490 | ) | - | (80,232,736 | ) | 96,603,371 | 16,370,635 | 456,221 | 16,826,856 | |||||||||||||||||||||||||||||||||||||||||||||||||
Dividends |
| — |
| — |
| — |
| — |
| — |
| — |
| — |
| (85,634,539 | ) | (85,634,539 | ) | (153,320 | ) | (85,787,859 | ) | - | - | - | - | - | - | (85,475,291 | ) | (85,475,291 | ) | (2,477,897 | ) | (87,953,188 | ) | ||||||||||||||||||||||||||
Decrease of Capital |
| (21,725 | ) | 21,725 |
| — |
| — |
| — |
| — |
| — |
| — |
| — |
| — |
| — |
| ||||||||||||||||||||||||||||||||||||||||
| Increase (decrease) from other changes | - | - | 23,029 | - | 6,014,568 | 6,037,597 | 36,070,393 | 42,107,990 | - | 42,107,990 | |||||||||||||||||||||||||||||||||||||||||||||||||||||
Total changes in equity |
| (21,725 | ) | 21,725 |
| (17,972,166 | ) | 2,258,144 |
| (1,128,824 | ) | — |
| (16,842,846 | ) | 3,348,139 |
| (13,494,707 | ) | 1,322,374 |
| (12,172,333 | ) | - | (69,596,956 | ) | (10,574,261 | ) | (38,490 | ) | 6,014,568 | (74,195,139 | ) | 47,198,473 | (26,996,666 | ) | (2,021,676 | ) | (29,018,342 | ) | |||||||||||||||||||||||
Ending balance at 12.31.2013 |
| 270,737,574 |
| — |
| (81,527,711 | ) | 2,258,144 |
| (1,128,824 | ) | 427,137,058 |
| 346,738,667 |
| 243,192,801 |
| 860,669,042 |
| 20,763,546 |
| 881,432,588 |
| ||||||||||||||||||||||||||||||||||||||||
| Ending balance as of 12,31,2018 | 270,737,574 | (306,674,528 | ) | (13,668,932 | ) | (1,954,077 | ) | 433,151,626 | 110,854,089 | 462,221,463 | 843,813,126 | 19,901,617 | 863,714,743 | ||||||||||||||||||||||||||||||||||||||||||||||||||
The accompanying notes 1 to 3031 form an integral part of these financial statementsConsolidated Financial Statements
F-13

EMBOTELLADORA ANDINA S.A. AND SUBSIDIARIES
Consolidated StatementStatements of Direct Cash Flows
Forfor the years endedperiods between January 1 and December 31, 2015, 20142020, 2019 and 2013
(Translation of consolidated financial statements originally issued in Spanish — See Note 2.2)2018
|
|
|
| 01.01.2015 |
| 01.01.2014 |
| 01.01.2013 |
|
|
| NOTE |
| 12.31.2015 |
| 12.31.2014 |
| 12.31.2013 |
|
|
|
|
| ThCh$ |
| ThCh$ |
| ThCh$ |
|
Cash flows provided by Operating Activities |
|
|
|
|
|
|
|
|
|
Cash flows provided by Operating Activities |
|
|
|
|
|
|
|
|
|
Receipts from customers (including taxes) |
|
|
| 2,406,656,125 |
| 2,367,485,129 |
| 1,954,744,395 |
|
Receipts from premiums, claims, annuities and other policy benefits |
|
|
|
|
|
|
| 77,300 |
|
Payments for Operating Activities |
|
|
|
|
|
|
|
|
|
Payments to suppliers for goods and services (including taxes) |
|
|
| (1,569,343,254 | ) | (1,579,575,529 | ) | (1,349,009,473 | ) |
Payments to employees |
|
|
| (213,532,202 | ) | (191,529,823 | ) | (153,571,748 | ) |
Other payments for operating activities (value-added taxes on purchases, sales and others) |
|
|
| (275,697,786 | ) | (295,650,855 | ) | (222,218,717 | ) |
Dividends received |
|
|
| 1,250,000 |
| 1,590,675 |
| 2,085,031 |
|
Interest payments |
|
|
| (57,963,479 | ) | (62,079,744 | ) | (23,319,351 | ) |
Interest received |
|
|
| 7,463,013 |
| 5,332,755 |
| 3,295,309 |
|
Income tax payments |
|
|
| (26,322,106 | ) | (23,778,366 | ) | (33,410,166 | ) |
Other cash movements (tax on bank debits Argentina and others) |
|
|
| (7,601,081 | ) | (6,279,811 | ) | (6,587,855 | ) |
Net cash flows generated from Operating Activities |
|
|
| 264,909,230 |
| 215,514,431 |
| 172,084,725 |
|
|
|
|
|
|
|
|
|
|
|
Cash flows used in Investing Activities |
|
|
|
|
|
|
|
|
|
|
|
|
|
|
|
|
|
|
|
Cash flows from the sale of equity investees (sale of investment in Leao Alimentos e Bebidas Ltda.) |
|
|
| — |
| 4,616,752 |
| 3,704,831 |
|
Cash flows used to obtain control of subsidiaries or other businesses (Purchase Compañía de Bebidas Ipiranga) |
|
|
| — |
| — |
| (261,244,818 | ) |
Cash flow used to acquire non-controlling interests (Capital contribution in Leão Alimentos e Bebidas Ltda.) |
| 14.2 |
| (915,069 | ) | — |
| — |
|
Proceeds from sale of property, plant and equipment |
|
|
| 1,969,878 |
| 2,273,241 |
| 6,861,329 |
|
Purchase of property, plant and equipment |
|
|
| (112,399,528 | ) | (114,216,855 | ) | (183,697,386 | ) |
Proceeds from other long term assets (term deposits over 90 days) |
|
|
| 106,609,849 |
| 122,292,893 |
| 19,423,100 |
|
Purchase of other long term assets (term deposits over 90 days) |
|
|
| (95,008,674 | ) | (186,014,285 | ) | (52,076,837 | ) |
Payments on forward, term, option and financial exchange agreements |
|
|
| (3,387,526 | ) | (702,959 | ) | (873,453 | ) |
Receipts from forward, term, option and financial exchange agreements |
|
|
| — |
| 4,975,477 |
| 11,216,678 |
|
Other cash movements (cash opening balance Companhia de Bebidas Ipiranga in 2013 and Embotelladoras Coca Cola Polar in 2012 and others) |
|
|
| — |
| — |
| 9,137,035 |
|
Net cash flows used in Investing Activities |
|
|
| (103,131,070 | ) | (166,775,736 | ) | (447,549,521 | ) |
|
|
|
|
|
|
|
|
|
|
Cash Flows generated from (used in) Financing Activities |
|
|
|
|
|
|
|
|
|
|
|
|
|
|
|
|
|
|
|
Proceeds from long-term loans obtained |
|
|
| — |
| 73,087,596 |
| 403,245,077 |
|
Proceeds from short-term loans obtained |
|
|
| 89,423,068 |
| 106,645,178 |
| 246,038,498 |
|
Loan payments |
|
|
| (130,503,764 | ) | (167,480,619 | ) | (271,177,359 | ) |
Payments of finance lease liabilities |
|
|
| (3,160,000 | ) | (6,903,487 | ) | (1,959,307 | ) |
Dividend payments by the reporting entity |
|
|
| (54,319,681 | ) | (52,268,909 | ) | (73,041,053 | ) |
Net cash flows generated by (used in) Financing Activities |
|
|
| (98,560,377 | ) | (46,920,241 | ) | 303,105,856 |
|
|
|
|
|
|
|
|
|
|
|
Net increase in cash and cash equivalents before exchange differences |
|
|
| 63,217,783 |
| 1,818,454 |
| 27,641,060 |
|
Effects of exchange differences on cash and cash equivalents |
|
|
| (13,571,278 | ) | (2,280,146 | ) | (3,187,189 | ) |
Net increase (decrease) in cash and cash equivalents |
|
|
| 49,646,505 |
| (461,692 | ) | 24,453,871 |
|
Cash and cash equivalents — beginning of year |
| 5 |
| 79,514,434 |
| 79,976,126 |
| 55,522,255 |
|
Cash and cash equivalents - end of year |
| 5 |
| 129,160,939 |
| 79,514,434 |
| 79,976,126 |
|
| 01,01,2020 | 01,01,2019 | 01,01,2018 | ||||||||||||||
| Cash flows provided by (used in) Operating Activities | NOTE | 12,31,2020 | 12,31,2019 | 12,31,2018 | ||||||||||||
| Cash flows provided by Operating Activities | ThCh$ | ThCh$ | ThCh$ | |||||||||||||
| Receipts from the sale of goods and the rendering of services (including taxes) | 2,321,999,131 | 2,626,374,510 | 2,296,830,656 | |||||||||||||
| Payments for Operating Activities | ||||||||||||||||
| Payments to suppliers for goods and services (including taxes) | (1,517,256,079 | ) | (1,802,751,639 | ) | (1,526,444,730 | ) | ||||||||||
| Payments to and on behalf of employees | (189,758,823 | ) | (203,681,853 | ) | (199,460,816 | ) | ||||||||||
| Other payments for operating activities (value-added taxes on purchases, sales and others) | (266,228,165 | ) | (292,958,045 | ) | (267,827,342 | ) | ||||||||||
| Dividends received | 1,176,079 | 411,041 | 601,022 | |||||||||||||
| Interest payments | (44,299,001 | ) | (36,141,477 | ) | (41,353,013 | ) | ||||||||||
| Interest received | 7,538,364 | 1,539,120 | 3,545,313 | |||||||||||||
| Income tax payments | (29,474,900 | ) | (34,198,767 | ) | (29,904,176 | ) | ||||||||||
| Other cash movements (tax on bank debits Argentina and others) | (4,927,608 | ) | (3,444,416 | ) | (707,552 | ) | ||||||||||
| Cash flows provided by (used in) Operating Activities | 278,768,998 | 255,148,474 | 235,279,362 | |||||||||||||
| Cash flows provided by (used in) Investing Activities | ||||||||||||||||
| Contributions made in associates | - | (15,615,466 | ) | |||||||||||||
| Proceeds from sale of Property, plant and equipment | 3,570 | 18,904 | 260,116 | |||||||||||||
| Purchase of Property, plant and equipment | (85,874,958 | ) | (110,683,258 | ) | (121,063,273 | ) | ||||||||||
| Purchase of intangible assets | (207,889 | ) | (448,307 | ) | - | |||||||||||
| Proceeds from other long-term assets (redemption of term deposits over 90 days) | - | - | 13,883,132 | |||||||||||||
| Purchase of other long-term assets (term deposits over 90 days) | (472,551 | ) | (70,373 | ) | - | |||||||||||
| Payments on forward, term, option and financial exchange agreements | 2,122,954 | 1,135,034 | 6,403,152 | |||||||||||||
| Other payments on the purchase of financial instruments | (139,449,884 | ) | - | (1,953,309 | ) | |||||||||||
| Net cash flows used in Investing Activities | (223,878,758 | ) | (110,048,000 | ) | (118,085,648 | ) | ||||||||||
| Cash Flows generated from (used in) Financing Activities | ||||||||||||||||
| Proceeds from short-term loans obtained | 27,633,156 | 50,297,337 | 29,850,728 | |||||||||||||
| Loan payments | (25,197,737 | ) | (74,332,889 | ) | (44,234,859 | ) | ||||||||||
| Lease liability payments | (3,974,086 | ) | (2,989,457 | ) | (2,395,966 | ) | ||||||||||
| Dividend payments by the reporting entity | (99,985,500 | ) | (86,265,896 | ) | (87,535,698 | ) | ||||||||||
| Other inflows (outflows) of cash (Placement and payment of public obligations) | 214,565,128 | (13,821,732 | ) | (10,319,483 | ) | |||||||||||
| Net cash flows (used in) generated by Financing Activities | 113,040,961 | (127,112,637 | ) | (114,635,278 | ) | |||||||||||
| Net increase in cash and cash equivalents before exchange differences | 167,931,201 | 17,987,837 | 2,558,436 | |||||||||||||
| Effects of exchange differences on cash and cash equivalents | (13,574,854 | ) | 4,048,168 | 3,574,340 | ||||||||||||
| Effects of exchange differences on cash and cash equivalents | (2,393,634 | ) | (2,006,632 | ) | (4,836,279 | ) | ||||||||||
| Net decrease in cash and cash equivalents | 151,962,713 | 20,029,373 | 1,296,497 | |||||||||||||
| Cash and cash equivalents – beginning of period | 4 | 157,567,986 | 137,538,613 | 136,242,116 | ||||||||||||
| Cash and cash equivalents - end of period | 4 | 309,530,699 | 157,567,986 | 137,538,613 |
The accompanying notes 1 to 3031 form an integral part of these financial statementsConsolidated Financial Statements
EMBOTELLADORA ANDINA S.A. AND SUBSIDIARIES
Notes to the Consolidated Financial Statements
(Translation of consolidated financial statements originally issued in Spanish — See Note 2.2)
NOTE 1 - CORPORATE INFORMATION
Embotelladora Andina S.A. RUT (Chilean Tax Id. N°) 91.144.000-8 (hereinafter “Andina,” and together with its subsidiaries, the “Company”) is an open stock corporation, whose corporate address and principal offices are located at Miraflores 9153, borough of Renca, Santiago, Chile. The Company is registered under No. 00124 of the Securities Registry and is regulated by Chile’s Financial Market Commission (hereinafter “CMF”) and pursuant to Chile’s Law 18,046 is subject to the Chilean Superintendencesupervision of this entity. It is also registered with the U.S. Securities and Insurance (SVS) pursuant to Law 18.046.Exchange Commission (hereinafter “SEC”) and its stock is traded on the New York Stock Exchange since 1994.
The principal activitiesactivity of Embotelladora Andina S.A. (hereafter “Andina,” and together with its subsidiaries, the “Company”) areis to produce, bottle, commercialize and selldistribute the products under registered trademarks of The Coca-Cola Company (TCCC). The Company maintains operations and is licensed to produce, commercialize and distribute such products and other Coca-Cola beverages. After the merger and recent acquisitions, the Company has operationsin certain territories in Chile, Brazil, Argentina and Paraguay. Paraguay
In Chile, the geographic areasterritories in which it has such a license are the Company has distribution franchises are regionsMetropolitan Region; the province of San Antonio, the V Region; the province of Cachapoal including the commune of San Vicente de Tagua-Tagua, the VI Region; the II Region of Antofagasta; the III Region of Atacama, the IV Region of Coquimbo XI Region de Aysén del General Carlos Ibáñez del Campo; XII Metropolitan Region Rancaguaof Magallanes and San Antonio.Chilean Antarctic. In Brazil, the Company has distribution franchises inaforementioned license covers much of the statesstate of Rio de Janeiro, Espíritothe entire state of Espirito Santo, Niteroi, Vitoria, Nova Iguaçu,and part of the states of Sao Paulo and part of Minas Gerais. In Argentina the Company has distribution franchises init includes the provinces of Córdoba, Mendoza, Córdoba,San Juan, San Luis, Entre Ríos, as well as part of the provinces of Santa Fe Rosario,and Buenos Aires, Chubut, Santa Cruz, Neuquén, El Chubut, Tierra del Fuego, Río Negro, La Pampa, Tierra del Fuego, Antarctica and the western zone of the Province of Buenos Aires. InSouth Atlantic Islands. Finally, in Paraguay the franchised territory coverescomprises the whole country.country. The Company has distribution licenses from The Coca-Cola Company in all of its territories: Chile, Brazil, Argentina and Paraguay. Licensesbottling agreement for the territories in Chile expireexpires in 2018 and 2019;October 2023; in Argentina it expires in 2017;2022; in Brazil it expires in 20172022, and in Paraguay they expireit expires in 2020.2021. Said agreements are renewable upon the request of the licensee and at the sole discretion of The Coca-Cola Company chooses to grant all of these licenses, and they are expected to be renewed under similar conditions on the date of expiration.Company.
As of December 31, 2015, the Freiredate of these consolidated financial statements, regarding Andina’s principal shareholders, the Controlling Group and its related companies hold 55.68%holds 55.38% of the outstanding shares with voting rights, corresponding to the Series A shares. The Controlling Group is composed of the Chadwick Claro, Garcés Silva, Said Handal and Said Somavía families, who control the Company in equal parts.
The head office of Embotelladora Andina S.A. is located on Miraflores 9153, municipality of Renca, Santiago, Chile. Its taxpayer identification number is 91.144.000-8.
NOTE 2 - BASIS OF PREPARATION OF CONSOLIDATED FINANCIAL STATEMENTS AND SUMMARYAPPLICATION OF SIGNIFICANT ACCOUNTING POLICIESCRITERIA
2.1Periods covered Accounting principles and basis of preparation
These consolidated financial statements encompass the following periods:
Consolidated statements of financial position: For the years ended at December 31, 2015 and 2014.
Consolidated statements of income by function and comprehensive income: For the periods from January 1 to December 31, 2015, 2014 and 2013.
Consolidated statements of cash flows: For the periods from January 1 to December 31, 2015, 2014 and 2013, using the “direct method”.
Consolidated statements of changes in equity: For the periods between January 1 and December 31, 2015, 2014 and 2013 .
2.2Basis of preparation
The Company’s Consolidated Financial Statements for the yearsperiods ended December 31, 20152020 and 2014 were2019, have been prepared in accordance with the International Financial Reporting Standards (hereinafter “IFRS”"IFRS") issued by the International Accounting Standards Board (hereinafter “IASB”"IASB").
As explained in note 10.1, on September 29, 2014 Law No. 20,780 was issued, which introduces modificationsThese Consolidated Financial Statements have been prepared following the going concern principle by applying the historical cost method, with the exception, according to the income tax system in Chile and other tax matters. On October 17, 2014 the Chilean SuperintendenceIFRS, of Securities and Insurance (the “SVS”) issued Circular No. 856, which established that the effects of the change in the income tax rates on deferred taxthose assets and liabilities must be recognized directly within “Retained earnings” instead of the income statement as required by IAS 12.that are recorded at fair value.
In order to comply with IAS 12,These Consolidated Statements reflect the consolidated financial statementsposition of Embotelladora Andina S,A, and its Subsidiaries as of December 31,2014 are different to those presented to31, 2020 and 2019 and the SVS asrelated consolidated statements of income, comprehensive income, changes in equity and cash flows for each of the aforementioned effect has been recognized withinthree years in the income statement. A reconciliation of such differences is presented as follows:period ended December 31, 2020, 2019 and 2018 and the related notes.
As of December 31, 2014
|
| Consolidated |
| Consolidated |
| Difference |
|
|
| ThCh$ |
| ThCh$ |
| ThCh$ |
|
Total Equity |
|
|
|
|
|
|
|
Equity holders of the parent |
|
|
|
|
|
|
|
Retained earnings |
|
|
|
|
|
|
|
Net income (loss) for the period |
| 51,875,084 |
| 75,490,235 |
| (23,615,151 | ) |
Retained earnings for the last period |
| 195,942,855 |
| 172,327,704 |
| 23,615,151 |
|
Total retained earnings |
| 247,817,939 |
| 247,817,939 |
| — |
|
|
|
|
|
|
|
|
|
Non-controlling interest |
|
|
|
|
|
|
|
Retained earnings |
|
|
|
|
|
|
|
Net income (loss) for the period |
| 159,008 |
| 317,203 |
| (158,195 | ) |
Retained earnings for the last period |
| 21,544,230 |
| 21,386,035 |
| 158,195 |
|
Total retained earnings |
| 21,703,238 |
| 21,703,238 |
| — |
|
The consolidated financial statements are presented under the historical cost criteria, although modified by the revaluation of certain financial instruments and derivative instruments.
The Company’s 20152020 local statutory consolidated financial statements in spanishSpanish were approved by the Company’s Board of Directors on February 29, 2016,23, 2021, with subsequent events first being considered through that date. Those local statutory consolidated financial statements consisted of consolidated statement of financial position as of December 31, 20152020 and 20142019 along with consolidated income statement, consolidated statement of comprehensive income, consolidated statement of changes in equity, and consolidated statement of cash flows (and related disclosures), each for the two years then ended. Those consolidated financial statements were then subsequently approved by the Company’s shareholders during its April 26, 2016 meeting.15, 2021 meeting.
Included in this 20152020 consolidated financial statements are consolidated statement of financial position as of December 31, 20152020 and 2014,2019, along with consolidated income statement, consolidated statement of comprehensive income, consolidated statement of changes in equity and consolidated statement of cash flows (and the related disclosures) for each of the three years ended December 31, 2015, 20142020, 2019 and 2013.2018. This three yearthree-year presentation of operations, changes in equity and of cash flows is required by the rules of the United States Securities and Exchange Commission. Other than such three year presentation and disclosure and the effect of the change in the income tax rates on deferred tax assets and liabilities were directly recognized within “Retained Earnings” in the Company’s 2015 local statutory consolidated financial statements instead of the income statement for the period ended December 31, 2015 , theThe accompanying English language IFRS consolidated financial statements are consistent with the previously issued local statutory consolidated financial statements. This three yearthree-year English language IFRS consolidated financial statements were approved for issuances by the Board of Directors during a session held on April 26, 2016,27, 2021, with subsequent events considered through this later date.
2.3Basis of consolidation
2.3.1Subsidiaries
These consolidated financial statement incorporateConsolidated Financial Statements have been prepared based on the financial statementsaccounting records maintained by the Parent Company and by the other entities that are part of the Company and are presented in thousands of Chilean pesos (unless expressly stated) as this is the functional and presentation currency of the Company. Foreign operations are included in accordance with the accounting policies established in Notes 2.5.
2.2 Subsidiaries and consolidation
Subsidiary entities are those companies directly or indirectly controlled by the Company (its subsidiaries).Embotelladora Andina. Control is obtained when the Company has power over the investee, when it has exposure or is entitled to variable returns from its involvement in the investee and when it has the ability to use its power to influence the amount of investor returns. They include assets and liabilities, as of December 31, 2015 and 2014 and results of operations, and cash flows for the years ended December 31, 2015, 2014 and 2013.periods reported. Income or losses from subsidiaries acquired or sold are included in the consolidated financial statementsConsolidated Financial Statements from the effective date of acquisition through to the effective date of disposal, as applicable.
The acquisition method is used to account for the acquisition of subsidiaries. The consideration transferred for the acquisition of the subsidiary is the fair value of assets transferred, equity securities issued, liabilities incurred to the former owners of the acquire or assumed on the date that control is obtained. Identifiable assets acquired, and identifiable liabilities and contingencies assumed in a business combination are accounted for initially at their fair values at the acquisition date. Goodwill is initially measured as the excess of the aggregate of the consideration transferred and the fair value of non-controlling interest over the net identifiable assets acquired and liabilities assumed. If the consideration is less than the fair value of the net assets of the subsidiary acquired, the difference is recognized directly in the income statement. All acquisition related costs are expensed in the period incurred.statement.
Intercompany transactions, balances income, expenses and unrealized gains and losses on transactions between Group companiesentities are eliminated. AccountingUnrealized losses are also eliminated. When necessary, the accounting policies of the subsidiaries are changedmodified to ensure consistencyuniformity with the policies adopted by the Company, where necessary.Group.
The interest of non-controlling shareholders is presented in “Non-Controlling Interest” in the consolidated income statement and Earnings attributable to non-controlling interests”, in the consolidated statement of changes in equity. and the consolidated statement of income by function under "Non-Controlling Interest" and “Earnings attributable to non-controlling interests", respectively.
The consolidated financial statements include all assets, liabilities, income, expenses, and cash flows of the Company and its subsidiaries after eliminating intercompany balances and transactions.
The list of subsidiariestransaction among the Group’s entities, the subsidiary companies included in the consolidation is detailed as follows:are the following:
|
|
|
| Holding control (percentage) |
| Ownership interest | |||||||||||||||||||||||||||||||||||
|
|
|
| 12-31-2015 |
| 12-31-2014 |
| 12.31.2020 | 12.31.2019 | ||||||||||||||||||||||||||||||||
Taxpayer ID |
| Name of the Company |
| Direct |
| Indirect |
| Total |
| Direct |
| Indirect |
| Total |
| Company Name | Direct | Indirect | Total | Direct | Indirect | Total | |||||||||||||||||||
59.144.140-K |
| Abisa Corp S.A. |
| — |
| 99.99 |
| 99.99 |
| — |
| 99.99 |
| 99.99 |
| Abisa Corp S.A. | - | 99.99 | 99.99 | - | 99.99 | 99.99 | |||||||||||||||||||
Foreign |
| Aconcagua Investing Ltda. |
| 0.71 |
| 99.28 |
| 99.99 |
| 0.71 |
| 99.28 |
| 99.99 |
| Aconcagua Investing Ltda. | 0.70 | 99.28 | 99.98 | 0.70 | 99.28 | 99.98 | |||||||||||||||||||
96.842.970-1 |
| Andina Bottling Investments S.A. |
| 99.90 |
| 0.09 |
| 99.99 |
| 99.90 |
| 0.09 |
| 99.99 |
| Andina Bottling Investments S.A. | 99.9 | 0.09 | 99.99 | 99.9 | 0.09 | 99.99 | |||||||||||||||||||
96.972.760-9 |
| Andina Bottling Investments Dos S.A. |
| 99.90 |
| 0.09 |
| 99.99 |
| 99.90 |
| 0.09 |
| 99.99 |
| Andina Bottling Investments Dos S.A. | 99.9 | 0.09 | 99.99 | 99.9 | 0.09 | 99.99 | |||||||||||||||||||
Foreign |
| Andina Empaques Argentina S.A. |
| — |
| 99.98 |
| 99.98 |
| — |
| 99.98 |
| 99.98 |
| Andina Empaques Argentina S.A. | - | 99.98 | 99.98 | - | 99.98 | 99.98 | |||||||||||||||||||
96.836.750-1 |
| Andina Inversiones Societarias S.A. |
| 99.98 |
| 0.01 |
| 99.99 |
| 99.98 |
| 0.01 |
| 99.99 |
| Andina Inversiones Societarias S.A. | 99.98 | 0.01 | 99.99 | 99.98 | 0.01 | 99.99 | |||||||||||||||||||
76.070.406-7 |
| Embotelladora Andina Chile S.A. |
| 99.99 |
| — |
| 99.99 |
| 99.99 |
| — |
| 99.99 |
| Embotelladora Andina Chile S.A. | 99.99 | - | 99.99 | 99.99 | - | 99.99 | |||||||||||||||||||
Foreign |
| Embotelladora del Atlántico S.A. |
| 0.92 |
| 99.07 |
| 99.99 |
| 0.92 |
| 99.07 |
| 99.99 |
| Embotelladora del Atlántico S.A. | 0.92 | 99.07 | 99.99 | 0.92 | 99.07 | 99.99 | |||||||||||||||||||
96.705.990-0 |
| Envases Central S.A. |
| 59.27 |
| — |
| 59.27 |
| 59.27 |
| — |
| 59.27 |
| Envases Central S.A. | 59.27 | - | 59.27 | 59.27 | - | 59.27 | |||||||||||||||||||
96.971.280-6 |
| Inversiones Los Andes Ltda. |
| 99.99 |
| — |
| 99.99 |
| 99.99 |
| — |
| 99.99 |
| ||||||||||||||||||||||||||
Foreign |
| Paraguay Refrescos S.A. |
| 0.08 |
| 97.75 |
| 97.83 |
| 0.08 |
| 97.75 |
| 97.83 |
| Paraguay Refrescos S.A. | 0.08 | 97.75 | 97.83 | 0.08 | 97.75 | 97.83 | |||||||||||||||||||
76.276.604-3 |
| Red de Transportes Comerciales Ltda. |
| 99.90 |
| 0.09 |
| 99.99 |
| 99.90 |
| 0.09 |
| 99.99 |
| Red de Transportes Comerciales Ltda. | 99.9 | 0.09 | 99.99 | 99.9 | 0.09 | 99.99 | |||||||||||||||||||
Foreign |
| Rio de Janeiro Refrescos Ltda. |
| — |
| 99.99 |
| 99.99 |
| — |
| 99.99 |
| 99.99 |
| Rio de Janeiro Refrescos Ltda. | - | 99.99 | 99.99 | - | 99.99 | 99.99 | |||||||||||||||||||
78.536.950-5 |
| Servicios Multivending Ltda. |
| 99.90 |
| 0.09 |
| 99.99 |
| 99.90 |
| 0.09 |
| 99.99 |
| Servicios Multivending Ltda. | 99.9 | 0.09 | 99.99 | 99.9 | 0.09 | 99.99 | |||||||||||||||||||
78.775.460-0 |
| Sociedad de Transportes Trans-Heca Limitada |
| — |
| 99.99 |
| 99.99 |
| — |
| 99.99 |
| 99.99 |
| ||||||||||||||||||||||||||
78.861.790-9 |
| Transportes Andina Refrescos Ltda. |
| 99.90 |
| 0.09 |
| 99.99 |
| 99.90 |
| 0.09 |
| 99.99 |
| Transportes Andina Refrescos Ltda. | 99.9 | 0.09 | 99.99 | 99.9 | 0.09 | 99.99 | |||||||||||||||||||
96.928.520-7 |
| Transportes Polar S.A. |
| 99.99 |
| — |
| 99.99 |
| 99.99 |
| — |
| 99.99 |
| Transportes Polar S.A. | 99.99 | - | 99.99 | 99.99 | - | 99.99 | |||||||||||||||||||
76.389.720-6 |
| Vital Aguas S.A. |
| 66.50 |
| — |
| 66.50 |
| 66.50 |
| — |
| 66.50 |
| Vital Aguas S.A. | 66.50 | - | 66.50 | 66.50 | - | 66.50 | |||||||||||||||||||
93.899.000-k |
| Vital Jugos S.A. |
| 15.00 |
| 50.00 |
| 65.00 |
| 15.00 |
| 50.00 |
| 65.00 |
| Vital Jugos S.A. | 15.00 | 50.00 | 65.00 | 15.00 | 50.00 | 65.00 | |||||||||||||||||||
2.3.22.3 Investments accounted for underin associates
Ownership interest held by the Group in associates are recorded following the equity method. According to the equity method, the investment in an associate is initially recorded at cost. As of the date of acquisition, the investment in the statement of financial position is recorded by the proportion of its total assets, which represents the Group's participation in its capital, once adjusted, where appropriate, the effect of the transactions made with the Group, plus capital gains that have been generated in the acquisition of the company.
Dividends received from these companies are recorded by reducing the value of the investment and the results obtained by them, which correspond to the Group according to its ownership, are recorded under the item “Participation in profit (loss) of associates accounted for by the equity method.”
Associates are all entities over which the CompanyGroup exercises significant influence but does not have control. InvestmentsSignificant influence is the power to intervene in the financial and operating policy decisions of the associate, without having control or joint control over it. The results of these associates are accounted for using the equity method of accounting.
The Company’s share in profit or loss in associates subsequent to the acquisition date is recognized in the income statement, and its share of post acquisition movements in other comprehensive income is recognized in OCI with corresponding adjustment to the carrying amount of the investment.
Unrealized gains in transactions between the Company and its associates are eliminated to the extent of the Company´s interests in those associates. Unrealized losses are also eliminated unless the transaction provides evidence of an impairment on the asset transferred.method. Accounting policies of the associates are changed, where necessary, to ensure conformity with the policies adopted by the Company.Company and unrealized gains are eliminated.
2.4Financial reporting by operating segment
“IFRS 8 Operating Segments” requires that entities disclose information on the results of operating segments.segments, In general, this is information that Management and the Board of Directors use internally to assess performance of segments and allocate resources to them.them, Therefore, the following operating segments have been determined based on geographic location:
| · | Operation in Chile |
| · | Operation in Brazil |
| · | Operation in Argentina |
| · | Operation in Paraguay |
· Chilean operations
· Brazilian operations
· Argentine operationsF-18
· Paraguayan operations
2.5Foreign currency translation
2.5.12.5 Functional currency and presentation currency
2.5.1 Functional currency
Items included in the financial statements of each of the entities in the Company are measured using the currency of the primary economic environment in which the entity operates (“functional currency”). The functional currency of each of the Operations is the following:
| Company | Functional currency |
| Embotelladora del Atlántico | Argentine Peso (ARS) |
| Embotelladora Andina | Chilean Peso (CLP) |
| Paraguay Refrescos | Paraguayan Guaraní (PYG) |
| Rio de Janeiro Refrescos | Brazil Real (BRL) |
Foreign currency-denominated monetary assets and liabilities are converted to the functional currency at the spot exchange rate in effect on the closing date.
All differences arising from the liquidation or conversion of monetary items are recorded in the income statement, with the exception of the monetary items designated as part of the hedging of the Group's net investment in a business abroad. These differences are recorded under other comprehensive income until the disposal of the net investment, at which point they are reclassified to the income statement. Tax adjustments attributable to exchange differences in these monetary items are also recognized under other comprehensive income.
Non-monetary items that are valued at historical cost in a foreign currency are converted using the exchange rate in effect at the date of the initial transaction. Non-monetary items measured at fair value in a foreign currency are converted using the exchange rate in effect at the date on which fair value is determined. Losses or gains arising from the conversion of non-monetary items measured at fair value are recorded in accordance with the recognition of losses or gains arising from the change in the fair value of the respective item (e.g., exchange differences arising from items whose fair value gains or losses are recognized in another overall result or in results are also recognized under comprehensive income ).
Functional currency in hyperinflationary economies
Beginning July 2018, Argentina's economy is considered as hyperinflationary, according to the criteria established in the International Accounting Standard No. 29 “Financial information in hyperinflationary economies” (IAS 29). This determination was carried out based on a series of qualitative and quantitative criteria, including an accumulated inflation rate of more than 100% for three years. In accordance with IAS 29, the financial statements of companies in which Embotelladora Andina S.A. participates in Argentina have been retrospectively restated by applying a general price index to the historical cost, in order to reflect the changes in the purchasing power of the Argentine peso, as of the closing date of these financial statements.
Non-monetary assets and liabilities were restated since February 2003, the last date an inflation adjustment was applied for accounting purposes in Argentina. In this context, it should be mentioned that the Group made its transition to IFRS on January 1, 2004, applying the attributed cost exemption for Property, plant and equipment.
For consolidation purposes in Embotelladora Andina S.A. and as a result of the adoption of IAS 29, the results and financial situation of our Argentine subsidiaries were converted to the closing exchange rate (ARS/CLP) as December 31, 2020, in accordance with IAS 21 "Effects of foreign currency exchange rate variations", when dealing with a hyperinflationary economy.

The comparative amounts in the consolidated financial statements are those that were presented as current year amounts in Chilean pesos, which is the parent company’s functional currencyrelevant financial statements of the previous year (i.e., not adjusted for subsequent changes in price level or exchange rates). This results in differences between the closing net equity of the previous year and the Company´s presentation currency.
2.5.2Balances and transactions
Foreign currency transactions are translated into the functional currency using the foreign exchange rates prevailing on the datesopening net equity of the transactions. Lossescurrent year and, gains in foreign currency resulting fromas an accounting policy option, these changes are presented as follows: (a) the liquidationre-measurement of these transactionsinitial balances under IAS 29 as an adjustment to equity and the translation at the closing exchange(b) subsequent effects, including re-expression under IAS 21 , as "Exchange rate of monetary assets and liabilities denominated in foreign currency are recognizeddifferences in the income statementsconversion of foreign operations" under foreign exchange rate differences, except when they correspond to cash flow hedges; in which case they are presented in the statement ofother comprehensive income.
The exchange rates at the close of each ofInflation for the periods presented were as follows:from January to December 20202 and 2019 amounted to 36.01% and 54.85%, respectively.
|
| Exchange rate to the Chilean peso |
| ||||||||||
Date |
| US$ |
| R$ Brazilian |
| A$ Argentine |
| UF Unidad de |
| Paraguayan |
| € |
|
12.31.2015 |
| 710.16 |
| 181.87 |
| 54.46 |
| 25,629.09 |
| 0.1217 |
| 774.61 |
|
12.31.2014 |
| 606.75 |
| 228.43 |
| 70.96 |
| 24,627.10 |
| 0.1311 |
| 738.05 |
|
12.31.2013 |
| 524.61 |
| 223.94 |
| 80.45 |
| 23,309.56 |
| 0.1144 |
| 724.30 |
|
2.5.3Translation of foreign subsidiaries2.5.2 Presentation currency
The financial position and results of all entities inpresentation currency is the Company (none ofChilean peso, which hasis the functional currency of a hyperinflationary economy) that have athe parent company, for such purposes, the financial statements of subsidiaries are translated from the functional currency different fromto the presentation currency as indicated below:
| a. | Translation of financial statements whose functional currency does not correspond to hyperinflationary economies (Brazil and Paraguay) |
Financial statements measured as indicated are translated intoto the presentation currency as follows:
| · | The statement of financial position is translated to the closing exchange rate at the financial statement date and the income statement is translated at the average monthly exchange rates, the differences that result are recognized in equity under other comprehensive income. |
| · | Cash flow income statement are also translated at average exchange rates for each transaction. |
| · | In the case of the disposal of an investment abroad, the component of other comprehensive income (OCI) relating to that investment is reclassified to the income statement. |
| b. | Translation of financial statements whose functional currency corresponds to hyperinflationary economies (Argentina) |
Financial statements of economies with a hyperinflationary economic environment, are recognized according to IAS 29 Financial Information in Hyperinflationary Economies, and subsequently converted to Chilean pesos as follows:
| · | The statement of financial position sheet is translated at the closing exchange rate at the financial statements date. |
| · | The income statement is translated at the closing exchange rate at the financial statements date |
| · | The statement of cash flows is converted to the closing exchange rate at the date of the financial statements. |
| · | For the disposal of an investment abroad, the component of other comprehensive income (OCI) relating to that investment is reclassified to the income statement. |
(i) Assets and liabilities for2.5.3 Exchange rates
Exchange rates regarding the statement of financial position are translatedChilean peso in effect at the closing exchange rateend of each period are as of the reporting date;follows:
(ii) Income
| Date | USD | BRL | ARS | PGY | ||||||||||||||
| 12.31.2020 | 710.95 | 136.80 | 8.44 | 0.103 | ||||||||||||||
| 12.31.2019 | 748.74 | 185.76 | 12.50 | 0.116 | ||||||||||||||
| 12.31.2018 | 694.77 | 179.30 | 18.43 | 0.117 | ||||||||||||||
2.6 Property, plant, and expenses of the income statement are translated at average exchange rates for the period; and
(iii) All resulting translation differences are recognized in other comprehensive income.equipment
The companies that have a functional currency different from the presentation currencyelements of the parent company are:
|
| |
|
| |
|
| |
|
| |
|
|
In consolidation, translation differences arising from the translation of net investments in foreign entities are recognized in other comprehensive income. Exchange differences from accounts receivable which are considered to be part of an equity investment are recognized as comprehensive income net of deferred taxes, if applicable. On disposal of the investment, such translation differences are recognized in the income statement as part of the gain or loss on the disposal of the investment.
2.6Property, plant, and equipment
Assets included in property, plant and equipment, are recognized atvalued for their historicalacquisition cost, or fair value on the IFRS transition date, lessnet of their corresponding accumulated depreciation, and cumulativeof the impairment losses.losses they have experienced.
HistoricalThe cost of property,the items of Property, plant and equipment includes expendituresinclude in addition to the price paid for the acquisition: i) the financial expenses accrued during the construction period that are directly attributable to the acquisition, construction or production of qualified assets, which are those that require a substantial period of time before being ready for use, such as production facilities. The Group defines a substantial period as one that exceeds twelve months. The interest rate used is that corresponding to specific financing or, if it does not exist, the weighted average financing rate of the items less government subsidies resultingCompany making the investment; and ii) personnel expenses directly related to the construction in progress.
Construction in progress is transferred to operating assets after the end of the trial period when they are available for use, from the difference between market interest rates and the government´s preferential credit rates. Historical cost also includes revaluations and price-level restatements of opening balances (attributable cost) at January 1, 2009, in accordance with the exemptions in IFRS 1.which moment depreciation begins.
Subsequent costs are included in the asset´sasset’s carrying amount or recognized as a separate asset only when it is probable that future economic benefits associated with the items of property,Property, plant and equipment will flow to the Company and the cost of the item can be measured reliably. The carrying amount of the replaced part is derecognized. Repairs and maintenance are charged to the income statement in the reporting period in which they are incurred.
Land is not depreciated.depreciated since it has an indefinite useful life. Depreciation on other assets is calculated using the straight-line method to allocate their cost or revalued amounts to their residual values over their estimated useful lives.
The estimated useful lives by asset category are:
Assets | Range in years | |
Buildings |
| |
Plant and equipment |
| |
Warehouse installations and accessories |
| |
| 4-5 | |
Motor vehicles |
| |
Other |
| |
Bottles and containers |
|
The residual value and useful lives of assetsProperty, plant and equipment are reviewed and adjusted at the end of each financial statement reporting period,fiscal year, if appropriate.
When the value of
The Company assesses on each reporting date if there is evidence that an asset is greater than its estimatedmay be impaired. The Group estimates the recoverable amount of the valueasset, if there is written down immediately to its recoverable amount.evidence, or when an annual impairment test is required for an asset.
Gains and losses on disposals of property, plant, and equipment are calculated by comparing the proceeds to the carrying amount and are charged to other expenses by function or other gains, as appropriate in the statement of comprehensive income statement.
If there are items available for sale, and comply with the conditions of IFRS 5 “Non-current assets held for sale and discontinued operations” are separated from property, plant and equipment and are presented within current assets at the lower value between the book value and its fair value less selling costs.
2.7Intangible assets and Goodwill
2.7.1Goodwill
| 2.7.1 | Goodwill |
Goodwill represents the excess of the consideration transferred over the Company’s interest in the net fair value of the net identifiable assets of the subsidiary and the fair value of the non-controlling interest in the subsidiary on the acquisition date. GoodwillSince goodwill is an intangible asset with indefinite useful life, it is recognized separately and tested annually for impairment or more frequently if events or changes in circumstances indicate a potential impairment. Goodwill is carried at cost less accumulated impairment losses.
Gains and losses on the sale of an entity include the carrying amount of goodwill related to that entity.
Goodwill is assigned to each cash generating unit (CGU) or group of cash-generating units;units, from where it is expected to benefit from the synergies arising from the business combination. Such CGUs or groups of CGUs represent the lowest level in the organization at which goodwill is monitored for internal management purposes.
2.7.2Distribution rights
Distribution rights are contractual rights to produce andand/or distribute products under the Coca-Cola brand and other brands in certain territories in Argentina, Brazil, Chile and Paraguay whichthat were acquired during Business Combination. Distribution rights are born from the process of valuation at fair value of the assets and liabilities of companies acquired in business combinations. Distribution rights have an indefinite useful life and are not amortized, as the Company believes that the agreements will be(as they are permanently renewed indefinitely by theThe Coca-Cola Company with similar termsCompany) and conditions. Theytherefore are subject to impairment tests on an annual basis.
2.7.3Software
| 2.7.3 | Software |
Carrying amounts correspond to internal and external software development costs, which are capitalized once the recognition criteria in IAS 38, Intangible Assets,, have been met. SoftwareTheir accounting recognition is initially realized for their acquisition or production cost and, subsequently, they are valued at their net cost of their corresponding accumulated amortization and of the impairment losses that, if applicable, they have experienced. The aforementioned software is amortized in administrative expenses in the consolidated income statement over a period ofwithin four years.
F-22

2.8Impairments Impairment of non-financial assets
Assets that have an indefinite useful life, such as intangibles related to distribution rights and goodwill, are not amortized and are tested annually for impairment or more frequently if events or changes in circumstances indicate a potential impairment. Assets that are subject to amortization are tested for impairment whenever there is an event or change in circumstances indicating that the carrying amount may not be recoverable. An impairment loss is recognized for the amount by which the carrying value of the asset exceeds its recoverable amount. The recoverable amount is the greater of an asset’s fair value less costs to sell or its value in use.
For the purposes of assessing impairment, assets are grouped at the lowest levels for which there are separately identifiable cash flows (cash generating units)units - CGU).
2.9FinancialRegardless of what was stated in the previous paragraph, in the case of CGUs to which capital gains or intangible assets have been assigned with an indefinite useful life, the analysis of their recoverability is carried out systematically at the end of each fiscal year. These indications may include new legal provisions, change in the economic environment that affects business performance indicators, competition movements, or the disposal of an important part of a CGU.
Management reviews business performance based on geographic segments. Goodwill is monitored at the operating segment level that includes the different cash generating units in operations in Chile, Brazil, Argentina and Paraguay. The impairment of distribution rights is monitored geographically in the CGU or group of cash generating units, which correspond to specific territories for which Coca-Cola distribution rights have been acquired. These cash generating units or groups of cash generating units are composed of the following segments:
| - | Operation in Chile; |
| - | Operation in Argentina; |
| - | Operation in Brazil (State of Rio de Janeiro and Espirito Santo, Ipiranga territories, investment in the Sorocaba associate and investment in the Leão Alimentos S.A. associate); |
| - | Operation in Paraguay |
To check if goodwill has suffered a loss due to impairment of value, the Company compares the book value thereof with its recoverable value, and recognizes an impairment loss, for the excess of the asset's carrying amount over its recoverable amount. To determine the recoverable values of the CGU, management considers the discounted cash flow method as the most appropriate.
The main assumptions used in the annual test are:
| a) | Discount rate |
The discount rate applied in the annual test carried out in December 2020 was estimated using the CAPM (Capital Asset Pricing Model) methodology, which allows estimating a discount rate according to the level of risk of the CGU in the country where it operates. A nominal discount rate in local currency before tax is used according to the following table:
| Discount rates 2020 | Discount rates 2019 | ||||||||
| Argentina | 28.1 | % | 35.3 | % | |||||
| Chile | 7.2 | % | 8.5 | % | |||||
| Brazil | 9.9 | % | 11.4 | % | |||||
| Paraguay | 9.3 | % | 11.5 | % | |||||

| b) | Other assumptions |
The financial projections to determine the net present value of the future cash flows of the CGUs are modeled based on the main historical variables and the respective budgets approved by the CGU. In this regard, a conservative growth rate is used, which reaches 5% for the carbonated beverage category and up to 7% for less developed categories such as juices and waters. Beyond the fifth year of projection, growth perpetuity rates are established per operation ranging from 1% to 2.5% depending on the degree of maturity of the consumption of the products in each operation. In this sense, the variables with greatest sensitivity in these projections are the discount rates applied in the determination of the net present value of projected cash flows, growth perpetuities and EBITDA margins considered in each CGU.
In order to sensitize the impairment test, variations were made to the main variables used in the model. Ranges used for each of the modified variables are:
| - | Discount Rate: Increase / Decrease of up to 100 bps as a value in the rate at which future cash flows are discounted to bring them to present value |
| - | Perpetuity: Increase / Decrease of up to 75 bps in the rate to calculate the perpetual growth of future cash flows |
| - | EBITDA margin: Increase / Decrease of 100 bps of EBITDA margin of operations, which is applied per year for the projected periods, that is, for the years 2021-2025 |
In each sensitization scenario of the of the 3 variables mentioned above, no signs of impairment were observed for the Company's CGUs.
The Company classifiesperforms the impairment analysis on an annual basis. As a result of the tests conducted as of December 31, 2020 and 2019, no evidence of impairment was identified in any of the CGUs listed above, assuming conservative EBITDA margin projections and in line with market history.
Despite the deterioration in macroeconomic conditions experienced by the economies of the countries in which operations are carried out and as a result of the pandemic, the impairment test yielded recovery values higher than the book values of assets, including those for the sensitivity calculations in the stress test conducted on the model.
It should be noted that although no impairment evidence was identified for the CGUs described above, the annual review of other investments identified that for the AdeS brand in Chile's operation the recoverable value would be CLP 1,451 million below the book value recorded in the financial statements, which were reduced from its book value as of December 2020. The main reasons are due to the lower expected flows for the seed-based non-carbonated beverage segment for the local market.
2.9 Financial instruments
A financial assets intoinstrument is any contract that results in the following categories:recognition of a financial asset in one entity and a financial liability or equity instrument in another entity.
2.9.1 Financial assets
Pursuant to IFRS 9 “Financial Instruments”, except for certain trade accounts receivable, the Group initially measures a financial asset at its fair value plus transaction costs, in the case of a financial asset that is not at fair value, through profit or loss, loans and receivables, financial assets held to maturity, and available for sale. The classification depends on the purpose for which the financial assets were acquired. Management determines the classification of its financial assets at initial recognition.reflecting changes in P&L.

At each reporting dateThe classification is based on two criteria: (a) the Company assesses if there is evidence of impairment for any asset or group of financial assets.
2.9.1Financial assets at fair value through profit or loss
Fair value financial assets with changes in results are financial assets available for sale in the short term. A financial asset is classified under this category if it is acquired mainlyGroup's business model for the purpose of selling it inmanaging financial assets to obtain contractual cash flows; and (b) if the short term. Assets in this categorycontractual cash flows of financial instruments represent "solely payments of principal and interest” on the outstanding principal amount (the “SPPI criterion”). According to IFRS 9, financial assets are classified as current assets.
Derivatives are also categorized as held for trading unless they are designated as hedges.
Gains or losses fromsubsequently measured at (i) fair value with changes in fair value of financial assets atP&L (FVPL), (ii) amortized cost or (iii) fair value through profit and loss are recognized in theother comprehensive income statement under financial income or expense during the year in which they incur.(FVOCI).
TableThe subsequent classification and measurement of Contentsthe Group's financial assets are as follows:
2.9.2Loans and receivables
| - | Financial asset at amortized cost for financial instruments that are maintained within a business model with the objective of maintaining the financial assets to collect contractual cash flows that meet the SPPI criterion. This category includes the Group’s trade and other accounts receivable. |
Loans and accounts receivable are financial assets with fixed and determinable payments that are not quoted in an active market period. Loans and receivables are not quoted in an active market. They are included in current assets, unless they are due more than 12 months from the reporting date, in which case they are classified as non-current assets. Loans and receivables are included in trade and other receivables in the consolidated statement of financial position and they are recorded at their amortized cost less a provision for impairment.
An impairment is recorded on trade accounts receivable when there is objective evidence that the Company may not be able to collect the full amount according to the original terms of the receivable, based either on individual or on global aging analyses. The loss is recognized in administrative expenses in the consolidated income statement.
2.9.3Financial assets held to maturity
| - | Financial assets measured at fair value with changes in other comprehensive income (FVOCI), with gains or losses recognized in P&L at the time of liquidation. Financial assets in this category correspond to the Group's instruments that meet the SPPI criterion and are kept within a business model both to collect cash flows and to sell. |
Other financial assets corresponds to bank depositsare classified and subsequently measures as follows:
| - | Equity instruments at fair value with changes in other comprehensive income (FVOCI) without recognizing earnings or losses in P&L at the time of liquidation. This category only includes equity instruments that the Group intends to keep in the foreseeable future and that the Group has irrevocably chosen to classify in this category in the initial recognition or transition. |
| - | Financial assets at fair value with changes in P&L (FVPL) include derivative instruments and equity instruments quoted that the Group had not irrevocably chosen to classify at FVOCI in the initial recognition or transition. This category also includes debt instruments whose cash flow characteristics do not comply with the SPPI criterion or are not kept within a business model whose objective is to recognize contractual cash flows or sale. |
A financial asset (or, where applicable, a portion of a financial asset or a portion of a group of similar financial assets) is initially disposed (for example, canceled in the Company’s managementGroup's consolidated financial statements) when:
| - | The rights to receive cash flows from the asset have expired, |
| - | The Group has transferred the rights to receive the cash flows of the asset or has assumed the obligation to pay all cash flows received without delay to a third party under a transfer agreement; and the Group (a) has substantially transferred all risks and benefits of the asset, or (b) has not substantially transferred or retained all risks and benefits of the asset but has transferred control of the asset. |
2.9.2 Financial Liabilities
Financial liabilities are classified as a fair value financial liability at the positive intentiondate of their initial recognition, as appropriate, with changes in results, loans and ability to hold until their maturity. Theycredits, accounts payable or derivatives designated as hedging instruments in an effective coverage.
All financial liabilities are recordedinitially recognized at fair value and transaction costs directly attributable are netted from loans and credits and accounts payable.

The Group's financial liabilities include trade and other accounts payable, loans and credits, including those discovered in current assets because they mature in less than 12 months from the reporting dateaccounts, and are carried at cost, which approximates their fair value considering their short-term nature.derivative financial instruments.
AccruedThe classification and subsequent measurement of the Group's financial liabilities are as follows:
| - | Fair value financial liabilities with changes in results include financial liabilities held for trading and financial liabilities designated in their initial recognition at fair value with changes in results. The losses or gains of liabilities held for trading are recognized in the income statement. |
| - | Loans and credits are valued at cost or amortized using the effective interest rate method. Gains and losses are recognized in the income statement when liabilities are disposed, as well as interest accrued in accordance with the effective interest rate method. |
A financial liability is disposed of when the obligation is extinguished, cancelled or expires. Where an existing financial liability is replaced by another of the same lender under substantially different conditions, or where the conditions of an existing liability are substantially modified, such exchange or modification is treated as a disposal of the original liability and the recognition of the new obligation. The difference in the values in the respective books is recognized in the consolidated income statement under financial income during the year in which it occurs.of income.
2.9.3 Offsetting financial instruments
Financial assets and financial liabilities are offset with the corresponding net amount presenting the corresponding net amount in the statement of financial position, if:
| - | There is currently a legally enforceable right to offset the amounts recognized, and |
| - | It is intended to liquidate them for the net amount or to realize the assets and liquidate the liabilities simultaneously. |
2.10Derivatives financial instruments and hedging activities
The Company usesand its subsidiaries use derivative financial instruments to mitigate risks relating to changes in foreign currency and exchange rates associated with raw materials, property, plant and equipment, and loan obligations.
Derivatives are initially recognized at fair value on the date a derivative contract is entered into and are subsequently re-measured at their fair value.value at each closing date. Derivatives are accounted as financial assets when the fair value is positive and as financial liabilities when the fair value is negative. The method of recognizing the resulting gain or loss depends on whether the derivative is designated as a hedging instrument, and if so, the nature of the item being hedged.
2.10.1Derivative financial instruments designated as cash flow hedges
The group documents atAt the inception of the transaction, the group documents the relationship between hedging instruments and hedged items, as well as its risk management objectives and strategy for undertaking various hedging transactions. The group also documents its assessment, both at hedge inception and on an ongoing basis, of whether the derivatives that are used in hedging transactions are highly effective in offsetting changes in cash flows of hedged items.
The effective portion of changes in the fair value of derivatives that are designated and qualify as cash flow hedges is recognized in other comprehensive income. The gain or loss relating to the ineffective portion is recognized immediately in the consolidated income statement within “other"other gains (losses)”.

Amounts accumulated in equity are reclassified to profit or loss in the periods when the hedged item affects profit or loss (for example, when foreign currency denominated financial liabilities are translated into their functional currencies). The gain or loss relating to the effective portion of cross currency swaps hedging the effects of changes in foreign exchange rates are recognized in the consolidated income statement within “foreign"foreign exchange differences”.differences.” When a hedging instrument expires or is sold, or when a hedge no longer meets the criteria for hedge accounting, any cumulative gain or loss existing in equity at that time remains in equity and is recognized when the forecast transaction is ultimately recognized in the consolidated income statement.
2.10.2Derivative financial instruments not designated for hedging
The fair value of derivative financial instruments that do not qualify for hedge accounting pursuant to IFRS are immediately recognized in the consolidated income statement under “Other"Other income and losses”losses". The fair value of these derivatives areis recorded under “other"other current financial assets”assets" or “other"other current financial liabilities”liabilities" in the statement of financial position.”
The Company does not use hedge accounting for its foreign investments.
The Company also evaluates the existence of derivatives implicitly in contracts and financial instrument contracts to determine whether their characteristics and risks are closely related to the master agreement,instruments as stipulated by IAS 39.IFRS 9 and classifies them pursuant to their contractual terms and the business model of the group. As of December 31, 2020, the Company had no implicit derivatives
Table of Contents2.10.3 Fair value hierarchy
Fair value hierarchyis the price that would be received to sell an asset or paid to transfer a liability in an orderly transaction between market participants on the date of the transaction. Fair value is based on the presumption that the transaction to sell the asset or to transfer the liability takes place;
| - | In the asset or liability main market, or |
| - | In the absence of a main market, in the most advantageous market for the transaction of those assets or liabilities. |
The Company recordsmaintains assets and liabilities as of December 31, 2015 and 2014 based on itsrelated to foreign currency derivative foreign exchange contracts which arewere classified within other financial assets (current assets and non-current) and otheras Other current financial liabilities (current and non-current financial liabilities), respectively. These contractsassets and Other current and non-current financial liabilities, respectively, and are carriedaccounted at fair value inwithin the statement of financial position. The Company uses the following hierarchy for determiningto determine and disclosingdisclose the fair value of financial instruments at fair value by valuation method:with assessment techniques:
Level 1: Quoted Quote values (unadjusted) prices in active markets for identical assets or liabilities.liabilities
Level 2: Inputs other than quoted prices included in Level 1 that are observableValuation techniques for which the lowest level variable used, which is significant for the assets and liabilities, eithercalculation, is directly (that is, as prices) or indirectly (thatobservable
Level 3: Valuation techniques for which the lowest level variable used, which is derived from prices).
Level 3: Inputssignificant for the assets or liabilities that arecalculation, is not based on observable market data information.observable.
During the year ended December 31, 2015,reporting periods there were no transfers of items between fair value measurement categories. All of which were valued during the periodperiods using Level 2.
2.11Inventories
| 2.11 | Inventories |
Inventories are stated at the lower of cost and net realizable value. Cost is determined using the weighted average cost method. The cost of finished goods and work in progress includes raw materials, direct labor, other direct costs and manufacturing overhead (based on operating capacity) to bring the goods to marketable condition, but it excludes interest expense. Net realizable value is the estimated selling price in the ordinary course of business, less applicable variable selling expenses. Spare parts and production materials are stated at the lower of cost or net realizable value.

The initial cost of inventories includes the transfer of losses and gains from cash flow hedges, related to the purchase of raw materials.
Estimates are also made for obsolescence of raw materials and finished products based on turnover and age of the related goods.
2.12Trade receivables
| 2.12 | Trade receivables |
Trade accounts receivablesreceivable and other accounts receivable are measured and recognized initially at fair value and subsequently measuredthe transaction price at amortized costthe time they are generated less the provision for impairment, given their short term nature. Aexpected credit losses, pursuant to the requirements of IFRS 15, since they do not have a significant financial component, less the provision of expected credit losses. The provision for expected credit losses is made applying a value impairment model based on expected credit losses for the following 12 months. The Group applies a simplified focus for trade receivables, thereby impairment is made when there is objective evidence thatalways recorded referring to expected losses during the Company may not be able to collect the full amount according to the original termswhole life of the receivable, based either on individual or on global aging analyses.asset. The carrying amount of the asset is reduced by the provision amountof expected credit losses, and the loss is recognized in administrative expenses in the consolidated income statement.statement by function.
2.13Cash and cash equivalents
| 2.13 | Cash and cash equivalents |
Cash and cash equivalents include cash on hand, bank balances, time deposits with banks and other short-term highly liquid and low risk of change in value investments and mutual funds with original short-term maturities ofequal to or less than three months or less.from the date of acquisition.
2.14Other financial liabilities
| 2.14 | Other financial liabilities |
Resources obtained from financial institutions as well as the issuance of debt securities are initially recognized at fair value, net of costs incurred during the transaction. Then, liabilities are valued by accruing interests in order to equal the current value with the future value of liabilities payable, using the effective interest rate method.
General and specific borrowing costs directly attributable to the acquisition, construction or production of qualified assets, considered as those that require a substantial period of time in order to get ready for their forecasted use or sale, are added to the cost of those assets until the period in which the assets are substantially ready to be used or sold no borrowing costs have been capitalized. For the years ended December 31, 2015, 2014 and 2013.
2.15Government subsidies
Government subsidies are recognized at fair value when it is certain that the subsidy will be received and that the Company will meet all the established conditions.
Subsidies for operating costs are deferred and recognized on the income statement in the period that the operating costs are incurred.
Subsidies for purchases of property, plant and equipment are deducted from the costs of the related asset in property, plant and equipment and depreciation is recognized on the income statement, on a straight-line basis during the estimated useful life of the related asset.
2.16Income tax
| 2.15 | Income tax |
The Company and its subsidiaries in Chile account for income tax according to the net taxable income calculated based on the rules in the Income Tax Law. Subsidiaries in other countries account for income taxes according to the tax regulations of the country in which they operate.
Deferred income taxes are calculated using the liability method on temporary differences arising between the tax bases of assets and liabilities and their carrying amounts in the consolidated financial statements,Consolidated Financial Statements, using the tax rates that have been enacted or substantively enacted on the balance sheet date and are expected to apply when the deferred income tax asset is realized, or the deferred income tax liability is settled.
Deferred income tax assets are recognized only to the extent that it is probable that future taxable profits will be available against which the temporary differences can be utilized.
The Company does not recognize deferred income taxes for temporary differences from investments in subsidiaries in which the Company can control the timing of the reversal of the temporary differences and it is probable that they will not be reversed in the foreseeable future, the amount ofnear future.

The Group offsets deferred tax notassets and liabilities if and only if it has legally recognized a right to offset against the tax authority the amounts recognized in this connection amountedthose items; and intends to ThCh$77,921,832 at December 31, 2015 (ThCh$62,662,666 at December 31, 2014).settle the resulting net debts, or to realize the assets and simultaneously settle the debts that have been offset by them.
2.17Employee benefits
| 2.16 | Employee benefits |
The Company hasrecords a provision to coverliability regarding indemnities for years of service whichthat will be paid to employees in accordance with individual and collective agreements subscribed with employees, which is recorded at actuarial value in accordance with IAS 19.19 “Employee Benefits”.
Results from updated of actuarial variables are recorded within other comprehensive income.income in accordance with IAS 19.
Additionally, the Company has retention plans for some officers, which have a provision pursuant to the guidelines of each plan. These plans grant the right to certain officers to receive a cash payment on a certain date once they have fulfilled with the required years of service.
The Company and its subsidiaries have recorded a provision to account for the cost of vacations and other employee benefits on an accrual basis. These liabilities are recorded under employee benefits current provisions.non-financial liabilities.
2.18Provisions
| 2.17 | Provisions |
Provisions for litigation and other contingencies are recognized when the Company has a present legal or constructive obligation as a result of past event, it is probable that an outflow of resources will be required to settle the obligation, and the amount can be reliably estimated.
Provisions are measured at the present value of the expenditures expected to be required to settle the obligation using a pre-tax rate that reflects current market assessments of the time value of money and the risks specific to the obligation.
2.19Leases
| 2.18 | Leases |
a)Operating leases
Operating lease payments are recognized as an expense on a straight-line basis overIn accordance with IFRS 16 “Leases” Embotelladora Andina analyzes, at the termbeginning of the lease.
b)Finance leases
Leasescontract, the economic background of property, plant and equipment where the Companyagreement, to determine if the contract is, or contains, a lease, evaluating whether the agreement transfers the right to control the use of an identified asset for a period of time in exchange for a consideration. Control is considered to exist if the client has i) the right to obtain substantially all the riskseconomic benefits from the use of an identified asset; and rewardsii) the right to direct the use of ownership are classified as finance leases. Finance leases are capitalizedthe asset.
When the Company is lessee, on the date the underlying asset is available for use, we records an asset for the right-of-use in the statement of financial position (under Property, plant and equipment) and a lease liability (under Other financial liabilities).
This asset is initially recognized at cost, which includes: i) the inceptionvalue of the initial measurement of the lease liability; ii) lease payments made up to the start date less lease incentives received; iii) the initial direct costs incurred; and iv) the estimation of costs for dismantling or restoration. Subsequently, the right-of-use asset is measured at cost, adjusted by any new measurement of the lease liability, less accumulated depreciation and accumulated losses due to impairment of value. The right-of-use asset is depreciated in the same terms as the rest of similar depreciable assets, if there is reasonable certainty that the lessee will acquire ownership of the asset at the lowerend of the fair valuelease. If such certainty does not exist, the asset depreciates at the shortest period between the useful life of the leased assets andasset or the lease term.

On the other hand, the lease liability is initially measured at the present value of the minimum lease payments. Eachpayments, discounted at the incremental loan rate of the Company, if the interest rate implicit in the lease payment is allocated betweencould not be easily determined. Lease payments included in the measurement of the liability include: i) fixed payments, less any lease incentive receivable; ii) variable lease payments; iii) residual value guarantees; iv) exercise price of a purchase option; and finance charges.v) penalties for lease termination.
The lease liability is increased to reflect the accumulation of interest elementand is chargedreduced by the lease payments made. In addition, the carrying amount of the liability is measured again if there is a modification in the terms of the lease (changes in the term, in the amount of payments or in the evaluation of an option to buy or change in the income statement overamounts to be paid). Interest expense is recognized as an expense and is distributed among the periods that constitute the lease period, so as to producethat a constant periodicinterest rate of interestis obtained in each year on the remainingoutstanding balance of the liability for each period.lease liability.
TableShort-term leases, equal to or less than one year, or lease of Contentslow-value assets are excepted from the application of the recognition criteria described above, recording the payments associated with the lease as an expense in a linear manner throughout the lease term. The Company does not act as lessor.
2.20Deposits for returnable containers
| 2.19 | Deposits for returnable containers |
This liability comprises of cash collateral, or deposit, received from customers for bottles and other returnable containers made available to them.
This liability pertains to the deposit amount that iswould be reimbursed when the customer or distributor returns the bottles and containers in good condition, together with the original invoice. The
This liability is estimated based on the number of bottles given to clients and distributors, the estimated amount of bottles in circulation, and a historical average weighted value per bottle or containers.
Deposits for returnable containers are presented as aunder Other current liability in other financial liabilities becausesince the Company does not have legal rights to defer settlement for a period in excess of one year. However, the Company does not anticipate any material cash settlements for such amounts during the upcoming year.
2.21Revenue recognition
Revenues from regular activities include fair value of the consideration received or to be received for goods sold during the regular course of the Company’s activities. This revenue is presented net of VAT, reimbursements, deductions and discounts.
| 2.20 | Revenue recognition |
The Company recognizes revenue when control over a good or service is transferred to the amountclient. Control refers to the ability of revenue can be reliablythe client to direct the use and obtain substantially all the benefits of the goods and services exchanged. Revenue is measured andbased on the consideration to which it is probable that the future economic benefits will flowexpected to the Company.be entitled for such transfer of control, excluding amounts collected on behalf of third parties.
RevenuesManagement has defined the following indicators for revenue recognition, applying the five-step model established by IFRS 15 “Revenue from contracts with customers”: 1) Identification of the contract with the customer; 2) Identification of performance obligations; 3) Determination of the transaction price; 4) Assignment of the transaction price; and 5) Recognition of revenue.

All the above conditions are recognized oncemet at the time the products are physically delivered to customers.the customer. Net sales reflect the units delivered at list price, net of promotions, discounts and taxes.
2.22ContributionsThe revenue recognition criteria of The Coca-Cola Companythe good provided by Embotelladora Andina corresponds to a single performance obligation that transfers the product to be received to the customer.
| 2.21 | Contributions of The Coca-Cola Company |
The Company receives certain discretionary contributions from The Coca-Cola Company (TCCC) mainly related to the financing of advertising and promotional programs for its products in the territories where itthe Company has distribution licenses. The contributionscontribution received from TCCC are recognized in net income after the conditions agreed with TCCC in order to become a creditor to such incentive have been fulfilled, they are recorded as a reduction in the marketing expenses included in the consolidated income statement.Administration Expenses account. Given its discretionary nature, the portion of contributions received in one period does not imply it will be repeated in the following period.
In certain limited situations, there is a legally binding agreement with The Coca-Cola Company through which the Company receives contributions for the building and acquisition of specific items of property, plant and equipment. In such situations, payments received pursuant to these agreements are recorded as a reduction of the cost of the related assets.
2.23Dividend payments
| 2.22 | Dividend payments |
Dividend distribution to Company shareholders is recorded as a liability in the Company’s consolidated financial statements,Consolidated Financial Statements, considering the 30% minimum dividend of the period’s earnings established by Chilean Corporate Law.Law, unless otherwise agreed in the respective meeting, by the unanimity of the issued shares.
2.24Critical accounting estimatesInterim and judgmentsfinal dividends are recorded at the time of their approval by the competent body, which in the first case is normally the Board of Directors of the Company, while in the second case it is the responsibility of General Shareholders’ Meeting.
| 2.23 | Critical accounting estimates and judgments |
The Company makes estimates and judgments concerning the future. Actual results may differ from previously estimated amounts. The
In preparing the consolidated financial statements, the Company has used certain judgments and estimates made to quantify some of the assets, liabilities, income, expenses and commitments.
Following is a summary of the estimates and judgments that might have a material impact on future financial statements are explained below:statements.
2.24.12.23.1 Impairment of goodwill and intangible assets with indefinite useful lives
The Company testtests annually whether goodwill and intangible assets with indefinite useful life (such as distribution rights) have suffered any impairment. The recoverable amounts of cash generating units are generating units are determined based on value in use calculations. The key variables used in the calculations include sales volumes and prices, discount rates, marketing expenses and other economic factors including inflation. The estimation of these variables requires ana use of estimates and judgments as they are subject to inherent uncertainties; however, the assumptions are consistent with the Company´sCompany’s internal planning end past results. Therefore, management evaluates, and updates estimates according to the conditions affecting the variables. If these assets are considered to have been impaired, they will be written off at their estimated fair value or future recovery value according to the discounted cash flows analysis. DiscountedAs of December 31, 2019, discounted cash flows in the Company’sCompany's cash generating units in Chile, Brazil, Argentina and Paraguay generated a higher value than the carrying values of the respective net assets, including goodwill.goodwill of the Brazilian, Argentinian and Paraguayan subsidiaries.

2.24.22.23.2 Fair Value of Assets and Liabilities
IFRS requires in certain cases that assets and liabilities be recorded at their fair value. Fair value is the amount at whichprice that would be received for selling an asset can be purchased or sold orpaid to transfer a liability can be incurred or liquidated in an actuala transaction among parties under mutually independently agreed conditions which are different from a forced liquidation.ordered between market participants at the date of measurement.
The basis for measuring assets and liabilities at fair value are their current prices in an active market. For those that are not traded in an active market, the Company determines fair value based on the best information available by using valuation techniques.
In the case of the valuation of intangibles recognized as a result of acquisitions from business combinations, the Company estimates the fair value based on the “multi-period"multi-period excess earning method”method", which involves the estimation of future cash flows generated by the intangible assets, adjusted by cash flows whichthat do not come from these, but from other assets. The Company also applies estimations over the time period during which the intangible assets will generate cash flows, cash flows from other assets, and a discount rate.
Other assets acquired, and liabilities assumed in a business combination are carried at fair value using valuation methods that are considered appropriate under the circumstances. Assumptions include the depreciated cost of recovery and recent transaction values for comparable assets, among others. These valuation techniques require certain inputs to be estimated, including the estimation of future cash flows.
2.24.32.23.3 Allowances for doubtful accountsexpected credit losses
The Company evaluates the collectability ofGroup uses a provision matrix to calculate expected credit losses for trade receivables using several factors. When the Company becomes aware of a specific inability of a customer to fulfill its financial commitments, a specific provision for doubtful accounts is estimated and recorded, which reduces the recognized receivable to the amount that the Company estimates to be able to collect. In addition to specific provisions, allowances for doubtful accountsreceivables. Provisions are also determined based on due days for various groups of customer segments that have similar loss patterns (i.e. by geography region, product type, customer type and rating, and credit letter coverage and other forms of credit insurance).
The provision matrix is initially based on the historically observed non-compliance rates for the Group. The Group will calibrate the matrix to adjust the historical collection historycredit loss experience with forward-looking information. For example, if expected economic conditions (i.e. gross domestic product) are expected to deteriorate over the next year, which can lead to more non-compliances in the industry, historical default rates are adjusted. At each closing date, the observed historical default rates are updated and a generalchanges in prospective estimates are analyzed. The assessment of trade receivables, both outstandingthe correlation between observed historical default rates, expected economic conditions and past due, among other factors.expected credit losses are significant estimates.
2.24.42.23.4 Useful life, residual value and impairment of property, plant, and equipment
Property, plant, and equipment are recorded at cost and depreciated using the straight-line method over the estimated useful life of those assets. Changes in circumstances, such as technological advances, changes to the Company’s business model, or changes in its capital strategy might modify the effective useful lives as compared to our estimates. Whenever the Company determines that the useful life of property,Property, plant and equipment might be shortened, it depreciates the excess between the net book value and the estimated recoverable amount according to the revised remaining useful life. Factors such as changes in the planned usage of manufacturing equipment, dispensers, transportation equipment and computer software could make the useful lives of assets shorter. The Company reviews its long-lived assets for impairment whenever events or changes in circumstances indicate that the carrying value of any of those assets may not be recovered. The estimate of future cash flows is based, among other factors, on certain assumptions about the expected operating profits in the future. The Company´sCompany’s estimation of discounted cash flows may differ from actual cash flows because of, among other reasons, technological changes, economic conditions, changes in the business model, or changes in operating profit. If the sum of the projected discounted cash flows (excluding interest) is less than the carrying amount of the asset, the asset shall be written-off to its estimated recoverable value.
2.24.5Liabilities
At the closing of December 2020, based on the best estimate according to the most recent reliable, reasonable and available information, management made a change in its useful life accounting estimates, for depositsthe Chilean Operation.
Changes in estimates are mainly recorded in fixed assets related to plant and equipment, which includes the following items:
| Assets | Previous year range | New year range | ||
| Buildings | 30-50 | 15-80 | ||
| Plants and equipment | 10-20 | 5-20 | ||
| Fixed installations and accessories | 10-30 | 10-50 | ||
| Furniture and materials | 4-5 | 5 | ||
| Vehicles | 5-7 | 4-10 | ||
| Other property, plant and equipment | 3-8 | 5-10 | ||
| Containers and cases | 2-8 | 2-5 |
This change in estimated useful life resulted in greater depreciation for the period between January 1 to December 31, 2020 of returnable containerapproximately CLP 7,071,114 thousand, representing approximately 6% of total consolidated depreciation.
2.24.1 New Standards, Interpretations and Amendments for annual periods beginning on or after January 1, 2020.
Standards and interpretations, as well as the improvements and amendments to IFRS, which have been issued, effective at the date of these financial statements, are detailed below:
| Standards and Interpretations | Mandatory application date | |
| Conceptual Framework | Revised Conceptual Framework | January 1, 2020 |
Revised Conceptual Framework
The Company recordsIASB issued a liabilityRevised Conceptual Framework in March 2018, incorporating some new concepts, providing updated definitions and recognition criterion for deposits receivedassets and liabilities and clarifying some important concepts. Changes in exchange for bottles and containers providedthe Conceptual Framework may affect the application of IFRS when no standard applies to its customers and distributors. This liability represents the amount of deposits that must be reimbursed if the customera given transaction or distributor returns the bottles and containers in good condition, together with the original invoice. This liability is estimated on the basisevent. Application of the number of bottles givenrevised Conceptual Framework did not have significant impacts on loan to customers and distributors, estimates of bottles in circulation and the weighted average historical cost per bottle or container. Management makes several assumptions in order to estimate this liability, including the number of bottles in circulation, the amount of deposit that must be reimbursed and the timing of disbursements.
2.25New IFRS and interpretations of the IFRS Interpretations Committee (IFRSIC)
a)The following standards, interpretations and amendments have been adopted in these consolidated financial statements:
Amendment to IAS 19 “Employee Benefits” regarding defined benefit plans — published November 2013. This amendment applies to the contributions to the defined benefit plans made by employees or third parties. The purpose of these amendments is to simplify accounting for contributions which are independent of the number of years of service of employees, for example, employee contributions are calculated in accordance with a salary fixed percentage.
Improvements to International Financial Reporting Standards (2012)
Issued in December 2013.
IFRS 3 “Business Combinations” — this standard is amended to clarify that the obligation to pay a contingent consideration that complies with the definition of financial instrument is classified as a financial liability or equity based on the definitions of IAS 32 and that every non-equity contingent consideration, financial as well as non-financial, is measured at its fair value on the date of each presentation, with changes in fair value being presented in profit and loss. Consequently, changes are also made to IFRS 9, IAS 37 and IAS 39. The amendment will be prospectively applied to business combinations acquired on or after July 1, 2014.
IFRS 8 “Operating segments” — The standard is amended to include the requirement to disclose judgments made by management in applying the aggregation criteria to operating segments. The standard is further amended to require a reconciliation of the segments’ assets to the entity’s assets when assets by segment are reported.
IFRS 13 “Fair value measurement” IASB has amended the base of conclusions of IFRS 13 to clarify that it has not removed the ability to measure short-term accounts receivables and payables if the effect of restatement is immaterial.
IAS 16, “Property, plant and equipment” and IAS 38, “Intangible assets”- Both standards are amended to clarify how gross value and accumulated depreciation is accounted for when the entity uses the revaluation method.
IAS 24, “Related parties disclosures” — The standard is amended to include, as a related party, an entity that provides key management personnel services to the reporting entity or to the parent of the reporting entity (the “managing entity”)
Improvements to International Financial Reporting Standards (2013)
Issued in December 2013..
IFRS 3 “Business Combinations” - The standard is amended to clarify that IFRS 3 is not applicable to accounting of a joint venture under IFRS 11. The amendment also clarifies that the exemption scope is only applied to the financial statements of the Company.
Amendments to IFRS which have been issued and are in effect beginning January 1, 2020 are detailed below:

| Amendments | Implementation date | |
| IFRS 3 | Definition of a business | January 1,2020 |
| IAS 1 and IAS 8 | Definition of material | January 1,2020 |
| IFRS 9, IAS 39 and IFRS 7 | Reference Interest Rate Reform | January 1,2020 |
| IFRS 16 | COVID-19-Related Rent Concessions | January 1,2020 |
IFRS 3 Business Combinations - Definition of Business
The IASB issued amendments to the definition of business in IFRS 3 Business Combinations, to help entities determine whether an acquired set of activities and assets is a business or not. The IASB clarifies the minimum requirements for defining a business, eliminates the assessment of whether market participants are able to replace any missing elements, includes guidance to help entities assess whether a process acquired is substantial, reduces the definitions of a business and products and introduces an optional fair value concentration test.
Amendments have to be applied to business combinations or asset acquisitions that occur on or after the start of the first annual reporting period beginning on or after January 1, 2020. As a result, entities do not have to review transactions that occurred in previous periods. Early application is permitted and must be disclosed.
Because the amendments apply prospectively to transactions or other events that occur on or after the date of the first application, most entities will probably not be affected by these amendments in the transition. However, those entities that consider the acquisition of a set of activities and assets after implementing the amendments must first update their accounting policies in a timely manner.
Amendments may also be relevant in other areas of IFRS (e.g. they may be relevant when a controller loses control of a subsidiary and has anticipated the sale or contribution of assets between an investor and its associate or joint agreementventure) (Amendments to IFRS 10 and IAS 28).
Company management performs the impact assessment of the amendment once these types of transactions take place.
F-34

IAS 1 Presentation of Financial Statements and IAS 8 Accounting Policies, Changes in itself.Accounting Estimates and Errors – Definition of Material
In October 2018, the IASB issued amendments to IAS 1 Presentation of Financial Statements and IAS 8 Accounting Policies, changes in accounting estimates and errors, to align the definition of "material" in all standards and to clarify certain aspects of the definition. The new definition states that information is material if when omitted, misstated, or reasonably hidden could be expected to influence decisions that primary users of general-purpose of the financial statements make based on those financial statements, which provide financial information about a specific reporting entity.
Amendments should be applied prospectively. Early application is permitted and must be disclosed.
While amendments to the definition of material are not expected to have a significant impact on an entity's financial statements, the introduction of the term "hide" in the definition could impact the way materiality judgments are made, increasing the importance of how information is communicated and organized in the financial statements.
Company management has assessed the amendment, which have not had any impact on these financial statements.
IFRS 13 “Fair Value Measurement” - Clarifies9, IAS 39 and IFRS 7 Reference Interest Rate Reform
In September 2019, the IASB issued amendments to IFRS 9, IAS 39 and IFRS 7, which concludes the first stage of its work to respond to the effects of the reform of interbank offer rate (IBOR) in financial information. The amendments provide temporary exceptions that allow hedge accounting to continue during the portfolio exemptionuncertain period, prior to replacing existing benchmark interest rates with near-risk free alternative interest rates.
Amendments should be applied retrospectively. However, any hedge relationship that has previously been discontinued cannot be reinstated with the application of these amendments, nor can a hedge relationship be designated using the retrospect reasoning benefit. Early application is permitted and must be disclosed.
Company management has assessed the amendment, which have not had significant impacts on these financial statements.
IFRS 16 COVID-19-Related Rent Concessions
In May 2020, the IASB issued an amendment to IFRS 16 Leases to provide relief for lessees in the application of IFRS 16 guidance regarding lease modifications due to rent concessions occurring as a direct consequence of the Covid-19 pandemic. The amendment does not affect lessors.
As a practical solution, a lessee may choose not to assess whether the Covid-19-related rent reduction granted by a lessor is a modification of the lease. A lessee making this choice will recognize changes in lease payments from Covid-19-related rent reductions in the same way as it would recognize the change under IFRS 13, which allows16 as if such a change was not a modification of the lease.
A lessee shall apply this practical solution retroactively, recognizing the cumulative effect of the initial application of the amendment as an entity to measure fair valueadjustment in the initial balance of a groupaccumulated results (or another component of financial assets and liabilities over its net value, is applicable to all contracts (including non-financial contracts) within the scope of IAS 39 or IFRS 9. An entity must apply amendments for future periods fromequity, as appropriate) at the beginning of the yearlyannual reporting period in which the lessee first applies the amendment.
A lessee will apply this amendment for annual periods beginning on or after September 1, 2020. Early application is permitted, including in the financial statements not authorized for publication as of May 28, 2020.
Company management has not implemented this amendment because it has no Covid-19-related lease modifications.
2.24.2 New Accounting Standards, Interpretations and Amendments with effective application for annual periods beginning on or after January 1, 2020.
Standards and interpretations, as well as IFRS 13 isamendments, which have been issued, but have still not become effective as of the date of these financial statements are set forth below. The Company has not made an early adoption of these standards:
| Standards and Interpretations | Mandator y application date | |
| IFRS 17 | Insurance Contracts | January 1, 2023 |

IFRS 17 - Insurance Contracts
In May 2017, the IASB issued IFRS 17 Insurance Contracts, a new accounting standard for insurance contracts that covers recognition, measurement, presentation and disclosure. Once effective, it will replace IFRS 4 Insurance Contracts issued in 2005. The new rule applies to all types of insurance contracts, regardless of the type of entity issuing them, as well as certain guarantees and financial instruments with certain characteristics of discretionary participation. Some exceptions within the scope may be applied.
The adoption of standards, amendments and interpretations have no significant impactIFRS 17 will be effective for periods starting on or after January 1, 2023, with comparative figures required. Early application is permitted, provided that the consolidated financial statements ofentity applies IFRS 9 Financial Instruments, on or before the Company.date on which IFRS 17 is first applied.
b)The new standards, interpretations and amendmentsAmendments to IFRS that have been issued whichto become effective in the near future are not in force for the 2015 period, for which no early adoption has been adopted are as follow:detailed below.
| Amendments |
| ||
IFRS 9, | Interest Rate Benchmark Reform—Phase 2 |
| ||
| IAS 1 | Classification of liabilities as current or non-current | January 1, 2023 | ||
IFRS | Reference to the |
| ||
| IAS 16 | Property, Plant and Equipment — Proceeds before Intended Use | January 1, 2022 | ||
| Onerous Contracts—Cost of Fulfilling a Contract | January |
|
|
| ||
|
| ||
|
| ||
| Consolidated Financial Statements - sale or contribution of assets between an investor and its associate or joint |
| |
|
| ||
|
| ||
|
|
| ||
|
| |
|
|
Management is analyzing the potential impact on the Company’s consolidated financial statements of the adoption of the previously mentioned new standards, amendments and interpretations, especially IFRS 9, Financial Instruments,IAS 39, IFRS 15 Revenues form customer contracts7, IFRS 4 and IFRS 16 Leases.Interest Rate Benchmark Reform—Phase 2
In August 2020, the IASB published the second phase of the Interest Rate Benchmark Reform containing amendments to IFRS 9, IAS 39, IFRS 7, IFRS 4 and IFRS 16. With this publication, the IASB completes its work to respond to the effects of Interbank Offer Rate Reform (IBOR) on financial information.
The amendments provide temporary exceptions that address the effects on financial information when a benchmark interest rate (IBOR) is replaced by an almost risk-free alternative interest rate.
Amendments are required and early application is permitted. A hedging ratio must be resumed if the hedging ratio was discontinued solely due to the changes required by the reform of the benchmark interest rate and would therefore not have been discontinued if the second phase of amendments had been implemented at that time. While application is retrospective, an entity is not required to restate previous periods.
NOTE 3 — BUSINESS COMBINATIONSFinancial Statements - Classification of liabilities as current or non-current
AcquisitionIn June 2020, the IASB issued amendments to paragraphs 69 to 76 of Companhia de Bebidas Ipiranga:IAS 1 to specify requirements for the classification of liabilities as current or non-current.
On June 18, 2013 the Board of Directors of Embotelladora Andina S.A., unanimously approved the acquisitionThe amendments are effective for periods beginning on or after January 1, 2022. Entities should carefully consider whether there are any aspects of the Brazilian company Companhia de Bebidas Ipiranga. The aforementioned companyamendments suggesting that the terms of their existing loan agreements should be renegotiated. In this context, it is dedicatedimportant to stress that amendments must be implemented retrospectively.

IFRS 3 Reference to the marketing and distribution of Coca-Cola products in partsConceptual Framework
In May 2020, the IASB issued amendments to IFRS 3 Business Combinations – Reference to the Conceptual Framework. These amendments are intended to replace the reference to an earlier version of the territories of São Paulo and Minas Gerais, serving approximately 23,000 customers. Such approval was reflectedIASB Conceptual Framework (1989 Framework) with a reference to the current version issued in a purchase and sale agreement signed on July 10, 2013.March 2018 without significantly changing its requirements.
AfterThe amendments shall be effective for periods beginning on or after January 1, 2022 and should be applied retrospectively. Early application is permitted if, at the transaction was approved by Coca-Cola andsame time or before, an entity also applies all amendments contained in the Administrative Council of Economic Defense of Brazil, on October 11, 2013amendments to the Brazilian subsidiary, Rio de Janeiro Refrescos Ltda., completed the acquisition of 100%Conceptual Framework References of the shares of Companhia de Bebidas Ipiranga. The acquisition price was ThR$1,155,446 (equivalent to ThCh$ 261,244,818) and was paidIFRS Standards issued in cash by Rio de Janeiro Refrescos Ltda. using proceeds from intercompany loans and a capital contribution from the parent.
Transaction costs of ThCh$ 578,864 were charged to results at the time they were incurred, and were recorded as other expenses within the Company’s consolidated income statement.March 2018.
Estimated fair valueThe amendments will provide consistency in financial information and avoid potential confusion by having more than one version of the net assets acquired of Companhia de Bebidas Ipiranga is as follows:Conceptual Framework in use.
IAS 16 Property, Plant and Equipment — Proceeds before Intended Use |
| ||
|
| ||
|
| ||
|
| ||
|
| ||
|
| ||
|
| ||
|
| ||
|
| ||
|
|
| |
|
|
| |
|
|
| |
|
|
| |
|
|
| |
|
|
| |
|
| ||
|
| ||
|
|
The fair valueamendment prohibits deducting from the cost of distribution rights andan item of property, plant and equipment was calculated byany proceeds from selling items produced while bringing that asset to the Company, using valuation models such as discounted cash flows. Distribution rights are expectedlocation and condition necessary for it to be tax deductiblecapable of operating in the manner intended by management. Instead, an entity recognizes the proceeds from selling such items, and the cost of producing those items, in profit or loss for income tax purposes.the period, pursuant to applicable standards.
F-The amendment shall be effective for periods beginning on or after January 1, 2022. The amendment 33should be applied retrospectively only property, plant and equipment items available for use on or after the beginning of the first period presented in the financial statements in which the entity first applies the amendment.
IAS 37 Onerous Contracts — Cost of Fulfilling a Contract
In May 2020, the IASB issued amendments to IAS 37 Provisions, Contingent Liabilities, and Contingent Assets to specify the costs an entity needs to include when assessing whether a contract is onerous, or it generates losses.
TableThe amendment shall be effective for periods beginning on or after January 1, 2022. The amendment should be applied retrospectively to existing contracts at the beginning of Contentsthe annual reporting period in which the entity first applies the amendment (date of initial application). Early application is permitted and must be disclosed.
The Company expectsamendments are intended to recover goodwill through synergiesprovide clarity and help ensure consistent implementation of the standard. Entities that previously applied the incremental cost approach will see an increase in provisions to reflect the inclusion of costs directly related to contract activities, while entities that previously recognized contractual loss provisions using the available production capacity. Goodwill has been assignedguidance to the Company’s cash generating unitprevious standard, IAS 11 Construction Contracts, should exclude the allocation of indirect costs from their provisions.

IFRS 10 Consolidated Financial Statements and IAS 28 Investments in Brazil forAssociates and Joint Ventures – sale or contribution of assets between an amount of ThCh$55,255,194investor and it is expected that goodwill may be tax deductible for tax income purposes.its associate or joint venture
During 2014,Amendments to IFRS 10 Consolidated Financial Statements and using the guidelinesIAS 28 Investments in Associates and Joint Ventures (2011) address a recognized inconsistency between IFRS 3 “Business Combinations” that allows to adjust values assigned to an acquisition resulting from knowledge of new information not available at the time of initial recognition, there has been a decrease10 requirements and IAS 28 (2011) requirements in the value fortreatment of the provisions forsale or contribution of assets between an investor and its associate or joint venture. The amendments, issued in September 2014, state that when the contingencies from Sociedad Brasilera Compañítransaction involves a de Bebidas Ipiranga for lawsuitsbusiness (whether it is in a subsidiary or not) all gains, or losses generated are recognized. A partial gain or loss is recognized when the transaction involves assets that already existed atdo not constitute a business, even when the assets are in a subsidiary. The mandatory implementation date of acquisition for an amountthese amendments is yet to be determined because the IASB is awaiting the results of ThCh$442,977, a value of ThCh$292,365 net of taxes was assignedits research project on accounting according to the goodwillequity method of that acquisition.accounting. These amendments must be applied retrospectively, and early adoption is allowed, which must be disclosed.
The condensed income statementCompany management will perform an impact assessment of Companhia de Bebidas Ipiranga for the period October 11, 2013 to Deceber 31, 2013 is as follows:above described amendments once they become effective.
| |||
|
| ||
|
| ||
|
|
Embotelladora Andina S.A.’s proforma condensed income statement at December 31, 2013, as if the acquisition would have occurred on January 1, 2013 is as follows:
| |||
| |||
|
| ||
|
| ||
|
|
Table of Contents3 – FINANCIAL REPORTING
NOTE 4 — REPORTING BY SEGMENT
The Company provides financial information by segments according to IFRS 8 “Operating Segments,” which establishes standards for reporting by operating segment and related disclosures for products and services, and geographic areas.
The Company’s Board of Directors and Management measures and assesses performance of operating segments based on the operating income of each of the countries where there are Coca-Cola franchises.
The operating segments are determined based on the presentation of internal reports to the Company´s chief operatingstrategic decision-maker. The chief operating decision-maker has been identified as the Company´s Board of Directors who makes the Company´sCompany’s strategic decisions.
The following operating segments have been determined for strategic decision making based on geographic location:
| · | Operation in Chile |
| · | Operation in Brazil |
| · | Operation in Argentina |
| · | Operation in Paraguay |
· Chilean operations
· Brazilian operations
· Argentine operations
· Paraguayan operations
The four operating segments conduct their businesses through the production and sale of soft drinks and other beverages, as well as packaging materials.
Expenses and revenue associated with the Corporate OfficeOfficer were allocatedassigned to the operation in Chile sincein the soft drinks segment because Chile is the country that manages and pays forthe corporate expenses, which would also arebe substantially incurred, independently fromregardless of the existence of foreign susbsidiaries.subsidiaries abroad.
Total revenues by segment include sales to unrelated customers and inter-segments, as indicated in the consolidated statement of income.income of the Company.
A summary of the Company’s operating segments in accordance to IFRS is as follows:
For the period ended December 31, 2015 |
| Chile |
| Argentina |
| Brazil |
| Paraguay |
| Intercompany |
| Consolidated |
| ||||||||||||||||||||||||
| For the period ended December 31, 2020 | Chile Operation | Argentina Operation | Brazil Operation | Paraguay Operation | Intercompany Eliminations | Consolidated total | |||||||||||||||||||||||||||||||
|
| ThCh$ |
| ThCh$ |
| ThCh$ |
| ThCh$ |
| ThCh$ |
| ThCh$ |
| ThCh$ | ThCh$ | ThCh$ | ThCh$ | ThCh$ | ThCh$ | ||||||||||||||||||
Softdrinks |
| 375,993,430 |
| 523,460,939 |
| 417,508,814 |
| 105,709,646 |
| (281,091 | ) | 1,422,391,738 |
| 407,191,500 | 260,118,269 | 317,712,571 | 126,057,797 | (578,764 | ) | 1,110,501,373 | |||||||||||||||||
Other beverages |
| 138,739,166 |
| 93,409,514 |
| 189,538,968 |
| 24,329,754 |
| — |
| 446,017,402 |
| 237,570,385 | 49,817,791 | 262,350,736 | 31,094,787 | (359,666 | ) | 580,474,033 | |||||||||||||||||
Packaging |
| — |
| 10,387,685 |
| — |
| — |
| (1,402,569 | ) | 8,985,116 |
| - | 8,891,560 | - | - | (1,585,729 | ) | 7,305,831 | |||||||||||||||||
Net sales |
| 514,732,596 |
| 627,258,138 |
| 607,047,782 |
| 130,039,400 |
| (1,683,660 | ) | 1,877,394,256 |
| 644,761,885 | 318,827,620 | 580,063,307 | 157,152,584 | (2,524,159 | ) | 1,698,281,237 | |||||||||||||||||
Cost of sales |
| (309,387,177 | ) | (351,139,902 | ) | (369,212,113 | ) | (78,650,614 | ) | 1,683,660 |
| (1,106,706,146 | ) | (392,720,439 | ) | (172,065,726 | ) | (373,444,835 | ) | (86,791,818 | ) | 2,524,159 | (1,022,498,659 | ) | |||||||||||||
Distribution expenses |
| (51,642,087 | ) | (97,485,454 | ) | (46,571,390 | ) | (6,791,861 | ) | — |
| (202,490,792 | ) | (59,897,972 | ) | (49,112,014 | ) | (34,784,528 | ) | (8,737,504 | ) | - | (152,532,018 | ) | |||||||||||||
Administrative expenses |
| (105,959,018 | ) | (115,611,438 | ) | (109,802,964 | ) | (21,227,426 | ) | — |
| (352,600,846 | ) | (112,306,460 | ) | (69,668,104 | ) | (79,674,089 | ) | (21,990,282 | ) | - | (283,638,935 | ) | |||||||||||||
Finance income |
| 1,859,795 |
| 1,669,559 |
| 6,239,526 |
| 349,495 |
| — |
| 10,118,375 |
| 6,437,945 | 1,169,193 | 7,068,396 | 270,345 | - | 14,945,879 | ||||||||||||||||||
Finance expense |
| (16,699,299 | ) | (3,916,370 | ) | (35,021,529 | ) | (32,019 | ) | — |
| (55,669,217 | ) | (23,938,992 | ) | (729,164 | ) | (30,104,681 | ) | - | - | (54,772,837 | ) | ||||||||||||||
Interest expense, net |
| (14,839,504 | ) | (2,246,811 | ) | (28,782,003 | ) | 317,476 |
| — |
| (45,550,842 | ) | (17,501,047 | ) | 440,029 | (23,036,285 | ) | 270,345 | - | (39,826,958 | ) | |||||||||||||||
Share of the entity in income of associates accounted for using the equity method, total |
| 777,620 |
| — |
| (3,105,449 | ) | — |
| — |
| (2,327,829 | ) | ||||||||||||||||||||||||
| Share of the entity in income of associates | 1,248,478 | - | 980,285 | - | - | 2,228,763 | |||||||||||||||||||||||||||||||
Income tax expense |
| (14,949,823 | ) | (16,740,817 | ) | (6,887,666 | ) | (3,064,256 | ) | — |
| (41,642,562 | ) | (23,057,195 | ) | (7,668,059 | ) | (20,536,914 | ) | (3,643,231 | ) | - | (54,905,399 | ) | |||||||||||||
Other income (loss) |
| (15,363,727 | ) | (9,902,996 | ) | (10,809,496 | ) | (1,901,094 | ) | — |
| (37,977,313 | ) | (21,231,223 | ) | (6,046,069 | ) | 3,064,104 | 222,477 | - | (23,990,711 | ) | |||||||||||||||
Net income of the segment reported |
| 3,368,880 |
| 34,130,720 |
| 31,876,701 |
| 18,721,625 |
| — |
| 88,097,926 |
| 19,296,027 | 14,707,677 | 52,631,045 | 36,482,571 | - | 123,117,320 | ||||||||||||||||||
|
|
|
|
|
|
|
|
|
|
|
|
|
| ||||||||||||||||||||||||
Depreciation and amortization |
| 40,083,270 |
| 21,171,806 |
| 26,572,048 |
| 12,805,208 |
| — |
| 100,632,332 |
| 50,271,626 | 22,895,329 | 27,339,714 | 10,413,848 | - | 110,920,517 | ||||||||||||||||||
|
|
|
|
|
|
|
|
|
|
|
|
|
| ||||||||||||||||||||||||
Current assets |
| 256,380,151 |
| 111,228,338 |
| 145,809,121 |
| 33,992,246 |
| — |
| 547,409,856 |
| 532,713,969 | 70,215,594 | 149,709,603 | 44,658,550 | - | 797,297,716 | ||||||||||||||||||
Non current assets |
| 668,605,326 |
| 102,027,611 |
| 631,923,188 |
| 259,395,043 |
| — |
| 1,661,951,168 |
| ||||||||||||||||||||||||
| Non-current assets | 636,275,547 | 144,802,176 | 643,447,811 | 226,241,150 | - | 1,650,766,684 | |||||||||||||||||||||||||||||||
Segment assets, total |
| 924,985,477 |
| 213,255,949 |
| 777,732,309 |
| 293,387,289 |
| — |
| 2,209,361,024 |
| 1,168,989,516 | 215,017,770 | 793,157,414 | 270,899,700 | - | 2,448,064,400 | ||||||||||||||||||
|
|
|
|
|
|
|
|
|
|
|
|
|
| ||||||||||||||||||||||||
Carrying amount in associates and joint ventures accounted for using the equity method, total |
| 17,793,784 |
| — |
| 36,396,762 |
| — |
| — |
| 54,190,546 |
| 50,628,307 | - | 37,328,047 | - | - | 87,956,354 | ||||||||||||||||||
Capital expenditures and other |
| 50,042,740 |
| 30,056,170 |
| 25,745,746 |
| 7,469,941 |
| — |
| 113,314,597 |
| ||||||||||||||||||||||||
| Segment disbursements of non-monetary assets | 41,114,189 | 15,803,061 | 17,075,672 | 11,882,036 | - | 85,874,958 | |||||||||||||||||||||||||||||||
|
|
|
|
|
|
|
|
|
|
|
|
|
| ||||||||||||||||||||||||
Current liabilities |
| 81,766,688 |
| 113,185,338 |
| 164,173,404 |
| 21,448,780 |
| — |
| 380,574,210 |
| 198,669,957 | 58,904,281 | 96,144,933 | 24,337,015 | - | 378,056,186 | ||||||||||||||||||
Non-current liabilities |
| 571,635,493 |
| 6,708,979 |
| 381,506,922 |
| 17,401,120 |
| — |
| 977,252,514 |
| 748,105,248 | 10,717,606 | 465,225,175 | 14,399,594 | - | 1,238,447,623 | ||||||||||||||||||
Segment liabilities, total |
| 653,402,181 |
| 119,894,317 |
| 545,680,326 |
| 38,849,900 |
| — |
| 1,357,826,724 |
| 946,775,205 | 69,621,887 | 561,370,108 | 38,736,609 | - | 1,616,503,809 | ||||||||||||||||||
|
|
|
|
|
|
|
|
|
|
|
|
|
| ||||||||||||||||||||||||
Cash flows provided by in Operating Activities |
| 105,897,100 |
| 83,290,552 |
| 66,272,643 |
| 9,448,935 |
| — |
| 264,909,230 |
| 191,911,595 | 24,603,123 | 36,409,227 | 25,845,053 | - | 278,768,998 | ||||||||||||||||||
Cash flows used in Investing Activities |
| (40,431,754 | ) | (28,732,653 | ) | (29,150,493 | ) | (4,816,170 | ) | — |
| (103,131,070 | ) | ||||||||||||||||||||||||
Cash flows provided by (used in) Financing Activities |
| (50,804,304 | ) | (15,529,951 | ) | (31,576,973 | ) | (649,149 | ) | — |
| (98,560,377 | ) | ||||||||||||||||||||||||
| Cash flows (used in) provided by Investing Activities | (178,910,100 | ) | (16,010,950 | ) | (17,075,672 | ) | (11,882,036 | ) | - | (223,878,758 | ) | ||||||||||||||||||||||||||
| Cash flows (used in) provided by Financing Activities | 117,081,470 | (167,606 | ) | (3,443,826 | ) | (429,077 | ) | - | 113,040,961 | ||||||||||||||||||||||||||||
Table(1) Financial expenses associated with external financing for the purchase of Contentscompanies, including capital contributions are presented in this item.
For the period ended December 31, 2014 |
| Chile |
| Argentina |
| Brazil |
| Paraguay |
| Intercompany |
| Consolidated |
|
|
| ThCh$ |
| ThCh$ |
| ThCh$ |
| ThCh$ |
| ThCh$ |
| ThCh$ |
|
Softdrinks |
| 363,123,062 |
| 391,798,772 |
| 490,931,489 |
| 106,579,478 |
| (190,520 | ) | 1,352,242,281 |
|
Other beverages |
| 128,948,478 |
| 61,533,214 |
| 224,796,810 |
| 22,916,498 |
| — |
| 438,195,000 |
|
Packaging |
| — |
| 7,670,802 |
| — |
| — |
| (908,206 | ) | 6,762,596 |
|
Net sales |
| 492,071,540 |
| 461,002,788 |
| 715,728,299 |
| 129,495,976 |
| (1,098,726 | ) | 1,797,199,877 |
|
Cost of sales |
| (296,893,869 | ) | (265,287,659 | ) | (440,654,978 | ) | (79,505,628 | ) | 1,098,726 |
| (1,081,243,408 | ) |
Distribution expenses |
| (50,807,225 | ) | (74,059,744 | ) | (55,131,215 | ) | (7,044,659 | ) | — |
| (187,042,843 | ) |
Administrative expenses |
| (101,676,504 | ) | (87,897,233 | ) | (130,689,621 | ) | (21,877,574 | ) | — |
| (342,140,932 | ) |
Finance income |
| 3,453,892 |
| 240,844 |
| 4,680,739 |
| 280,148 |
| — |
| 8,655,623 |
|
Finance expense |
| (16,939,606 | ) | (8,416,222 | ) | (39,454,670 | ) | (270,933 | ) | — |
| (65,081,431 | ) |
Interest expense, net |
| (13,485,714 | ) | (8,175,378 | ) | (34,773,931 | ) | 9,215 |
| — |
| (56,425,808 | ) |
Share of the entity in income of associates accounted for using the equity method, total |
| (212,439 | ) | — |
| 1,403,408 |
| — |
| — |
| 1,190,969 |
|
Income tax expense |
| (28,215,677 | ) | (5,904,815 | ) | (8,959,990 | ) | (2,273,953 | ) | — |
| (45,354,435 | ) |
Other income (loss) |
| (21,101,524 | ) | (5,814,509 | ) | (6,900,864 | ) | (332,431 | ) | — |
| (34,149,328 | ) |
Net income of the segment reported |
| (20,321,412 | ) | 13,863,450 |
| 40,021,108 |
| 18,470,946 |
| — |
| 52,034,092 |
|
|
|
|
|
|
|
|
|
|
|
|
|
|
|
Depreciation and amortization |
| 38,707,146 |
| 18,372,306 |
| 32,702,078 |
| 13,185,395 |
| — |
| 102,966,925 |
|
|
|
|
|
|
|
|
|
|
|
|
|
|
|
Current assets |
| 252,116,763 |
| 100,705,367 |
| 165,690,695 |
| 35,223,376 |
| — |
| 553,736,201 |
|
Non current assets |
| 640,425,454 |
| 126,044,044 |
| 664,110,834 |
| 284,856,758 |
| — |
| 1,715,437,090 |
|
Segment assets, total |
| 892,542,217 |
| 226,749,411 |
| 829,801,529 |
| 320,080,134 |
| — |
| 2,269,173,291 |
|
|
|
|
|
|
|
|
|
|
|
|
|
|
|
Carrying amount in associates and joint ventures accounted for using the equity method, total |
| 17,684,657 |
| — |
| 48,365,556 |
| — |
| — |
| 66,050,213 |
|
Capital expenditures and other |
| 45,109,547 |
| 25,724,227 |
| 30,280,491 |
| 13,102,590 |
| — |
| 114,216,855 |
|
|
|
|
|
|
|
|
|
|
|
|
|
|
|
Current liabilities |
| 86,641,700 |
| 125,942,946 |
| 172,228,688 |
| 25,399,093 |
| — |
| 410,212,427 |
|
Non-current liabilities |
| 527,235,725 |
| 15,151,169 |
| 379,280,707 |
| 18,295,530 |
| — |
| 939,963,131 |
|
Segment liabilities, total |
| 613,877,425 |
| 141,094,115 |
| 551,509,395 |
| 43,694,623 |
| — |
| 1,350,175,558 |
|
|
|
|
|
|
|
|
|
|
|
|
|
|
|
Cash flows provided by in Operating Activities |
| 84,409,260 |
| 31,798,589 |
| 76,107,895 |
| 23,198,687 |
| — |
| 215,514,431 |
|
Cash flows used in Investing Activities |
| (100,090,488 | ) | (25,297,402 | ) | (25,663,739 | ) | (15,724,107 | ) | — |
| (166,775,736 | ) |
Cash flows provided by (used in) Financing Activities |
| (2,382,266 | ) | (11,603,894 | ) | (31,087,316 | ) | (1,846,765 | ) | — |
| (46,920,241 | ) |

| For the period ended December 31, 2019 | Chile Operation | Argentina Operation | Brazil Operation | Paraguay Operation | Intercompany Eliminations | Consolidated total | ||||||||||||||||||
| ThCh$ | ThCh$ | ThCh$ | ThCh$ | ThCh$ | ThCh$ | |||||||||||||||||||
| Softdrinks | 408,467,731 | 313,866,082 | 360,791,744 | 124,855,857 | (366,490 | ) | 1,207,614,924 | |||||||||||||||||
| Other beverages | 200,484,390 | 70,990,286 | 258,529,540 | 34,036,153 | (450,559 | ) | 563,589,810 | |||||||||||||||||
| Packaging | - | 9,779,472 | - | - | (1,959,091 | ) | 7,820,381 | |||||||||||||||||
| Net sales | 608,952,121 | 394,635,840 | 619,321,284 | 158,892,010 | (2,776,140 | ) | 1,779,025,115 | |||||||||||||||||
| Cost of sales | (359,465,664 | ) | (214,447,259 | ) | (384,838,875 | ) | (92,368,109 | ) | 2,776,140 | (1,048,343,767 | ) | |||||||||||||
| Distribution expenses | (59,076,433 | ) | (56,421,024 | ) | (42,673,570 | ) | (8,825,262 | ) | (166,996,289 | ) | ||||||||||||||
| Administrative expenses | (114,250,801 | ) | (89,276,114 | ) | (98,071,441 | ) | (24,305,453 | ) | (325,903,809 | ) | ||||||||||||||
| Finance income | 1,286,021 | 1,346,501 | 42,327,682 | 195,587 | - | 45,155,791 | ||||||||||||||||||
| Finance expense | (13,151,176 | ) | 999,370 | (34,057,214 | ) | 0 | - | (46,209,020 | ) | |||||||||||||||
| Interest expense, net (1) | (11,865,155 | ) | 2,345,871 | 8,270,468 | 195,587 | - | (1,053,229 | ) | ||||||||||||||||
| Share of the entity in income of associates | 381,255 | - | (3,796,338 | ) | - | - | (3,415,083 | ) | ||||||||||||||||
| Income tax expense | (12,838,517 | ) | (6,902,265 | ) | (36,821,377 | ) | (4,604,732 | ) | - | (61,166,891 | ) | |||||||||||||
| Other income (loss) | (15,109,823 | ) | (3,235,926 | ) | 21,754,242 | (308,315 | ) | - | 3,100,178 | |||||||||||||||
| Net income of the segment reported | 36,726,983 | 26,699,123 | 83,144,393 | 28,675,726 | - | 175,246,225 | ||||||||||||||||||
| Depreciation and amortization | 46,105,063 | 25,369,034 | 29,945,887 | 9,667,300 | - | 111,087,284 | ||||||||||||||||||
| Current assets | 244,504,165 | 76,354,086 | 171,349,293 | 41,266,559 | - | 533,474,103 | ||||||||||||||||||
| Non-current assets | 657,069,423 | 165,116,212 | 786,979,234 | 248,309,451 | - | 1,857,474,320 | ||||||||||||||||||
| Segment assets, total | 901,573,588 | 241,470,298 | 958,328,527 | 289,576,010 | - | 2,390,948,423 | ||||||||||||||||||
| Carrying amount in associates and joint ventures accounted for using the equity method, total | 49,703,673 | - | 50,163,060 | - | - | 99,866,733 | ||||||||||||||||||
| Segment disbursements of non-monetary assets | 51,542,820 | 24,343,002 | 21,343,312 | 13,454,124 | - | 110,683,258 | ||||||||||||||||||
| Current liabilities | 193,298,799 | 68,120,885 | 124,248,587 | 25,990,081 | - | 411,658,352 | ||||||||||||||||||
| Non-current liabilities | 474,576,722 | 13,350,651 | 506,297,573 | 16,161,177 | - | 1,010,386,123 | ||||||||||||||||||
| Segment liabilities, total | 667,875,521 | 81,471,536 | 630,546,160 | 42,151,258 | - | 1,422,044,475 | ||||||||||||||||||
| Cash flows provided by in Operating Activities | 145,551,360 | 30,440,761 | 63,145,540 | 16,010,813 | - | 255,148,474 | ||||||||||||||||||
| Cash flows (used in) provided by Investing Activities | (50,706,748 | ) | (24,790,752 | ) | (21,096,376 | ) | (13,454,124 | ) | - | (110,048,000 | ) | |||||||||||||
| Cash flows (used in) provided by Financing Activities | (100,352,068 | ) | (616,475 | ) | (25,654,792 | ) | (489,302 | ) | - | (127,112,637 | ) | |||||||||||||
Table(1) Financial expenses associated with external financing for the purchase of Contentscompanies, including capital contributions are presented in this item.
For the period ended December 31, 2013 |
| Chile |
| Argentina |
| Brazil |
| Paraguay |
| Intercompany |
| Consolidated |
|
|
| ThCh$ |
| ThCh$ |
| ThCh$ |
| ThCh$ |
| ThCh$ |
| ThCh$ |
|
Softdrinks |
| 357,175,049 |
| 389,768,200 |
| 359,500,578 |
| 94,313,713 |
| (1,137,508 | ) | 1,199,620,032 |
|
Other beverages |
| 120,742,893 |
| 45,345,896 |
| 132,360,694 |
| 17,939,818 |
| — |
| 316,389,301 |
|
Packaging |
| — |
| 6,115,002 |
| — |
| — |
| (443,000 | ) | 5,672,002 |
|
Net sales |
| 477,917,942 |
| 441,229,098 |
| 491,861,272 |
| 112,253,531 |
| (1,580,508 | ) | 1,521,681,335 |
|
Cost of sales |
| (283,987,524 | ) | (250,550,829 | ) | (308,359,706 | ) | (73,500,197 | ) | 1,580,508 |
| (914,817,748 | ) |
Distribution expenses |
| (46,133,420 | ) | (70,901,210 | ) | (39,999,942 | ) | (5,988,113 | ) | — |
| (163,022,685 | ) |
Administrative expenses |
| (94,360,894 | ) | (80,644,714 | ) | (80,841,396 | ) | (16,709,434 | ) | — |
| (272,556,438 | ) |
Finance income |
| 1,751,973 |
| 48,638 |
| 3,035,143 |
| 137,558 |
| — |
| 4,973,312 |
|
Finance expense |
| (16,619,213 | ) | (5,407,881 | ) | (6,524,560 | ) | (392,369 | ) | — |
| (28,944,023 | ) |
Interest expense, net |
| (14,867,240 | ) | (5,359,243 | ) | (3,489,417 | ) | (254,811 | ) | — |
| (23,970,711 | ) |
Share of the entity in income of associates accounted for using the equity method, total |
| 724,629 |
| — |
| 58,789 |
| — |
| — |
| 783,418 |
|
Income tax expense |
| (15,339,760 | ) | (7,743,806 | ) | 1,853,334 |
| (1,736,032 | ) | — |
| (22,966,264 | ) |
Other income (loss) |
| (13,023,761 | ) | (8,434,348 | ) | (12,573,197 | ) | (832,377 | ) | — |
| (34,863,683 | ) |
Net income of the segment reported |
| 10,929,972 |
| 17,594,948 |
| 48,509,737 |
| 13,232,567 |
| — |
| 90,267,224 |
|
|
|
|
|
|
|
|
|
|
|
|
|
|
|
Depreciation and amortization |
| 35,967,369 |
| 17,282,433 |
| 19,611,566 |
| 10,475,516 |
| — |
| 83,336,884 |
|
|
|
|
|
|
|
|
|
|
|
|
|
|
|
Current assets |
| 205,826,948 |
| 89,031,091 |
| 141,763,935 |
| 23,962,112 |
| — |
| 460,584,086 |
|
Non current assets |
| 632,472,652 |
| 129,560,418 |
| 609,181,470 |
| 251,162,684 |
| — |
| 1,622,377,224 |
|
Segment assets, total |
| 838,299,600 |
| 218,591,509 |
| 750,945,405 |
| 275,124,796 |
| — |
| 2,082,961,310 |
|
Carrying amount in associates and joint ventures accounted for using the equity method, total |
| 17,881,972 |
| — |
| 50,791,427 |
| — |
| — |
| 68,673,399 |
|
Capital expenditures and other |
| 57,545,219 |
| 52,271,592 |
| 317,965,173 |
| 17,160,220 |
| — |
| 444,942,204 |
|
Current liabilities |
| 151,808,516 |
| 117,167,718 |
| 108,646,120 |
| 24,521,785 |
| — |
| 402,144,139 |
|
Non-current liabilities |
| 382,039,567 |
| 16,215,376 |
| 383,329,737 |
| 17,799,903 |
| — |
| 799,384,583 |
|
Segment liabilities, total |
| 533,848,083 |
| 133,383,094 |
| 491,975,857 |
| 42,321,688 |
| — |
| 1,201,528,722 |
|
|
|
|
|
|
|
|
|
|
|
|
|
|
|
Cash flows provided by in Operating Activities |
| 78,994,275 |
| 35,501,051 |
| 37,067,316 |
| 20,522,083 |
| — |
| 172,084,725 |
|
Cash flows used in Investing Activities |
| (76,510,197 | ) | (51,754,052 | ) | (302,125,052 | ) | (17,160,220 | ) | — |
| (447,549,521 | ) |
Cash flows provided by (used in) Financing Activities |
| 282,137,848 |
| 19,569,666 |
| 7,924,748 |
| (6,526,406 | ) | — |
| 303,105,856 |
|

| For the period ended December 31, 2018 | Chile Operation | Argentina Operation (2) | Brazil Operation | Paraguay Operation | Intercompany Eliminations | Consolidated total | ||||||||||||||||||
| ThCh$ | ThCh$ | ThCh$ | ThCh$ | ThCh$ | ThCh$ | |||||||||||||||||||
| Softdrinks | 390,782,296 | 330,874,797 | 326,015,740 | 118,095,369 | (72,170 | ) | 1,165,696,032 | |||||||||||||||||
| Other beverages | 180,156,806 | 75,341,941 | 214,493,809 | 31,492,883 | - | 501,485,439 | ||||||||||||||||||
| Packaging | - | 7,343,785 | - | - | (1,609,457 | ) | 5,734,328 | |||||||||||||||||
| Net sales | 570,939,102 | 413,560,523 | 540,509,549 | 149,588,252 | (1,681,627 | ) | 1,672,915,799 | |||||||||||||||||
| Cost of sales | (336,719,937 | ) | (214,647,052 | ) | (329,529,112 | ) | (88,813,300 | ) | 1,681,627 | (968,027,774 | ) | |||||||||||||
| Distribution expenses | (55,798,363 | ) | (62,899,574 | ) | (38,835,833 | ) | (8,241,714 | ) | (165,775,484 | ) | ||||||||||||||
| Administrative expenses | (109,373,432 | ) | (93,149,904 | ) | (88,809,386 | ) | (22,410,131 | ) | (313,742,853 | ) | ||||||||||||||
| Finance income | 1,686,041 | 14,750 | 2,019,489 | 219,964 | - | 3,940,244 | ||||||||||||||||||
| Finance expense | (23,713,774 | ) | (192,602 | ) | (31,108,284 | ) | - | - | (55,014,660 | ) | ||||||||||||||
| Interest expense, net (1) | (22,027,733 | ) | (177,852 | ) | (29,088,795 | ) | 219,964 | - | (51,074,416 | ) | ||||||||||||||
| Share of the entity in income of associates | 298,359 | - | 1,112,820 | - | - | 1,411,179 | ||||||||||||||||||
| Income tax expense | (22,000,539 | ) | (18,874,454 | ) | (10,088,988 | ) | (4,600,874 | ) | - | (55,564,855 | ) | |||||||||||||
| Other income (loss) | (11,540,167 | ) | (2,639,386 | ) | (8,399,463 | ) | (111,834 | ) | - | (22,690,850 | ) | |||||||||||||
| Net income of the segment reported | 13,777,290 | 21,172,301 | 36,870,792 | 25,630,363 | - | 97,450,746 | ||||||||||||||||||
| Depreciation and amortization | 42,353,664 | 20,474,446 | 26,830,835 | 9,935,501 | - | 99,594,446 | ||||||||||||||||||
| Current assets | 228,108,768 | 80,908,212 | 135,259,768 | 37,309,706 | - | 481,586,454 | ||||||||||||||||||
| Non-current assets | 644,395,166 | 160,587,931 | 679,183,347 | 248,751,791 | - | 1,732,918,235 | ||||||||||||||||||
| Segment assets, total | 872,503,934 | 241,496,143 | 814,443,115 | 286,061,497 | 2,214,504,689 | |||||||||||||||||||
| - | ||||||||||||||||||||||||
| Carrying amount in associates and joint ventures accounted for using the equity method, total | 50,136,065 | - | 52,274,880 | - | 102,410,945 | |||||||||||||||||||
| - | ||||||||||||||||||||||||
| Capital expenditures and other | 67,709,231 | 28,702,138 | 32,536,213 | 9,684,466 | - | 138,632,048 | ||||||||||||||||||
| - | ||||||||||||||||||||||||
| Current liabilities | 186,831,021 | 83,013,418 | 128,146,943 | 21,870,719 | - | 419,862,101 | ||||||||||||||||||
| Non-current liabilities | 477,319,648 | 17,066,746 | 420,218,066 | 16,323,385 | - | 930,927,845 | ||||||||||||||||||
| Segment liabilities, total | 664,150,669 | 100,080,164 | 548,365,009 | 38,194,104 | - | 1,350,789,946 | ||||||||||||||||||
| Cash flows provided by in Operating Activities | 150,035,425 | 28,899,457 | 44,949,860 | 11,394,620 | - | 235,279,362 | ||||||||||||||||||
| Cash flows (used in) provided by Investing Activities | (47,164,236 | ) | (28,700,733 | ) | (32,536,213 | ) | (9,684,466 | ) | - | (118,085,648 | ) | |||||||||||||
| Cash flows (used in) provided by Financing Activities | (98,560,576 | ) | (10,644,812 | ) | (5,099,823 | ) | (330,067 | ) | - | (114,635,278 | ) | |||||||||||||
F-38(1) Financial expenses associated with external financing for the purchase of companies, including capital contributions are presented in this item,
(2) Pursuant the application of IAS 19 in Argentina, assets and liabilities increased by ThCh $ 97,318,892 and ThCh $ 16,093,780, respectively. The effect in the income statement was a net loss of ThCh $ 15,743,592.
NOTE 5 — 4 – CASH AND CASH EQUIVALENTS
The composition of Cash and cash equivalents are detailedis as follows as of December 31, 2015 and 2014::
Description |
| 12.31.2015 |
| 12.31.2014 |
|
|
| ThCh$ |
| ThCh$ |
|
By item |
|
|
|
|
|
Cash |
| 633,010 |
| 595,442 |
|
Bank balances |
| 28,208,845 |
| 13,931,375 |
|
Time deposits |
| 11,621,566 |
| 13,159,563 |
|
Mutual funds |
| 88,697,518 |
| 51,828,054 |
|
Total cash and cash equivalents |
| 129,160,939 |
| 79,514,434 |
|
|
|
|
|
|
|
|
| ThCh$ |
| ThCh$ |
|
By currency |
|
|
|
|
|
Dollar |
| 13,598,302 |
| 5,747,745 |
|
Euro |
| 1,859 |
| 15 |
|
Argentine Peso |
| 27,168,042 |
| 1,317,489 |
|
Chilean Peso |
| 35,545,272 |
| 17,708,037 |
|
Paraguayan Guaraní |
| 9,631,669 |
| 9,385,359 |
|
Brazilian Real |
| 43,215,795 |
| 45,355,789 |
|
Total cash and cash equivalents |
| 129,160,939 |
| 79,514,434 |
|
5.1Time deposits
Time deposits defined as cash and cash equivalents are detailed as follows at December 31, 2015 and 2014:
Placement |
| Institution |
| Currency |
| Principal |
| Annual |
| 12.31.2015 |
|
|
|
|
|
|
| ThCh$ |
| % |
| ThCh$ |
|
11-11-2015 |
| Banco HSBC |
| Chilean pesos |
| 6,900,000 |
| 0.37 | % | 6,941,975 |
|
12-31-2015 |
| Banco Regional S.A.E.C.A. |
| Paraguayan guaraníes |
| 2,952,717 |
| 4.00 | % | 2,952,717 |
|
12-31-2015 |
| Banco Galicia |
| US$Dollars |
| 1,420,320 |
| 2.80 | % | 1,420,425 |
|
12-03-2015 |
| Banco Santander Rio |
| Argentinean pesos |
| 136,150 |
| 25.75 | % | 138,852 |
|
12-14-2015 |
| Banco Santander Rio |
| Argentinean pesos |
| 92,582 |
| 26.32 | % | 93,748 |
|
12-11-2015 |
| Banco Industrial |
| Argentinean pesos |
| 70,798 |
| 27.00 | % | 71,865 |
|
12-09-2015 |
| Banco Galicia |
| Argentinean pesos |
| 1,943 |
| 0.37 | % | 1,984 |
|
Total |
|
|
|
|
|
|
|
|
| 11,621,566 |
|
| By item | 12.31.2020 | 12.31.2019 | ||||||
| ThCh$ | ThCh$ | |||||||
| Cash | 339,628 | 2,331,714 | ||||||
| Bank balances | 82,997,449 | 51,176,617 | ||||||
| Other fixed rate instruments | 226,193,622 | 104,059,655 | ||||||
| Total cash and cash equivalents | 309,530,699 | 157,567,986 | ||||||
TableTime deposits expire in less than three months from their acquisition date and accrue market interest for this type of Contentsshort-term investment, Other fixed-income instruments mainly correspond to mutual funds with a maturity of less than 90 days, from the date of investment, There are no restrictions for significant amounts available to cash,
Placement |
| Institution |
| Currency |
| Principal |
| Annual |
| 12.31.2014 |
|
|
|
|
|
|
| ThCh$ |
| % |
| ThCh$ |
|
11-28-2014 |
| Banco de Chile |
| Chilean pesos |
| 3,800,000 |
| 3.60 |
| 3,810,980 |
|
11-28-2014 |
| Banco Santander |
| Chilean pesos |
| 2,500,000 |
| 3.72 |
| 2,508,525 |
|
12-31-2014 |
| Banco Regional S.A.E.C.A. |
| Paraguayan guaranies |
| 4,218,542 |
| 4.00 |
| 4,218,542 |
|
12-19-2014 |
| Banco Citibank NA |
| Paraguayan guaranies |
| 1,310,758 |
| 4.75 |
| 1,310,758 |
|
12-19-2014 |
| Banco Itaú Paraguay S.A. |
| Paraguayan guaranies |
| 1,310,758 |
| 4.50 |
| 1,310,758 |
|
Total |
|
|
|
|
|
|
|
|
| 13,159,563 |
|
| By currency | 12.31.2020 | 12.31.2019 | |||||
| ThCh$ | ThCh$ | ||||||
| USD | 21,332,268 | 16,733,249 | |||||
| EUR | 223,449 | 9,722 | |||||
| ARS | 14,821,502 | 3,830,199 | |||||
| CLP | 201,936,140 | 78,420,966 | |||||
| PGY | 21,688,915 | 12,383,873 | |||||
| BRL | 49,528,425 | 46,189,977 | |||||
| Cash and cash equivalents | 309,530,699 | 157,567,986 | |||||
5.2Money Market
Money market mutual fund´s shares are valued using the share values at the close of each reporting period. Below is a description for the end of each period:
Institution |
| 12.31.2015 |
| 12.31.2014 |
|
|
| ThCh$ |
| ThCh$ |
|
Mutual Fund Corporativo Banchile — Chile |
| 15,629,654 |
| 7,006,132 |
|
Mutual Fund Santander — Brasil |
| 11,457,193 |
| — |
|
Mutual Fund Soberano Banco Itaú — Brasil |
| 17,719,483 |
| 41,354,014 |
|
Fund Fima Ahorro Plus C |
| 12,561,861 |
| — |
|
Fund Fima Ahorro Pesos C |
| 12,572,400 |
| — |
|
Mutual Fund Bradesco — Brasil |
| 10,686,106 |
| — |
|
Western Assets Institutional Cash Reserves — USA |
| 7,454,378 |
| 3,313,647 |
|
Mutual Fund Wells Fargo — USA |
| 180,549 |
| 154,261 |
|
Fund Fima Premium B |
| 435,894 |
| — |
|
Total mutual funds |
| 88,697,518 |
| 51,828,054 |
|
NOTE 6 —5 – OTHER CURRENT AND NON-CURRENT FINANCIAL ASSETS
Below areThe composition of other financial assets is as follows:
| Balance | |||||||||||
| Current | Non-current | ||||||||||
| Other financial assets | 12.31.2020 | 12.31.2019 | 12.31.2020 | 12.31.2019 | |||||||
| ThCh$ | ThCh$ | ThCh$ | ThCh$ | ||||||||
| Financial assets measured at amortized cost (1) | 140,304,853 | 30,073 | 1,216,865 | 1,216,865 | |||||||
| Financial assets at fair value (2) | - | 317,205 | 150,983,295 | 98,918,457 | |||||||
| Other financial assets measured at amortized cost (3) | - | - | 9,813,118 | 10,648,989 | |||||||
| Total | 140,304,853 | 347,278 | 162,013,278 | 110,784,311 | |||||||
(1) Financial instrument that does not meet the definition of cash equivalents as defined in Note 2.13. CLP 139,449,883 of these financial assets correspond to short-term realizable instruments, heldmanaged by the Company at December 31, 2015 and 2014, other than cash and cash equivalents. They consist of time deposits with short-term maturities (more than 90 days), restricted mutual funds and derivative contracts. Financial instruments are detailed as follows:third parties.
a)Current portion 2015
Time deposits
Placement |
| Maturity |
| Institution |
| Currency |
| Principal |
| Annual |
| 12.31.2015 |
|
|
|
|
|
|
|
|
| ThCh$ |
| % |
| ThCh$ |
|
05-15-2015 |
| 02-11-2016 |
| Banco BTG Pactual— Chile |
| Unidad de fomento |
| 4,000,000 |
| 1.15 | % | 4,159,405 |
|
05-15-2015 |
| 02-11-2016 |
| Banco Itaú — Chile |
| Unidad de fomento |
| 3,500,000 |
| 0.94 | % | 3,634,643 |
|
05-15-2015 |
| 02-11-2016 |
| Banco de Chile — Chile |
| Unidad de fomento |
| 3,500,000 |
| 0.85 | % | 3,632,554 |
|
06-03-2015 |
| 01-15-2016 |
| Banco Itaú — Chile |
| Unidad de fomento |
| 5,000,000 |
| 0.91 | % | 5,169,872 |
|
06-03-2015 |
| 01-15-2016 |
| Banco Santander — Chile |
| Unidad de fomento |
| 5,000,000 |
| 0.91 | % | 5,169,872 |
|
06-03-2015 |
| 05-27-2016 |
| Banco Santander — Chile |
| Unidad de fomento |
| 5,000,000 |
| 1.00 | % | 5,172,585 |
|
06-03-2015 |
| 05-09-2016 |
| Banco de Chile — Chile |
| Unidad de fomento |
| 7,500,000 |
| 1.00 | % | 7,758,877 |
|
06-03-2015 |
| 05-09-2016 |
| Banco de Chile — Chile |
| Unidad de fomento |
| 7,500,000 |
| 1.00 | % | 7,758,877 |
|
09-01-2015 |
| 05-09-2016 |
| Banco Santander — Chile |
| Unidad de fomento |
| 3,000,000 |
| 0.01 | % | 3,051,493 |
|
09-01-2015 |
| 08-09-2016 |
| Banco Santander— Chile |
| Unidad de fomento |
| 4,000,000 |
| 0.26 | % | 4,072,077 |
|
09-01-2015 |
| 08-09-2016 |
| Banco Santander— Chile |
| Unidad de fomento |
| 6,000,000 |
| 0.26 | % | 6,108,115 |
|
09-30-2015 |
| 08-31-2016 |
| Banco BTG Pactual— Chile |
| Unidad de fomento |
| 2,000,000 |
| 0.65 | % | 2,025,626 |
|
11-11-2015 |
| 09-09-2016 |
| Banco de Chile — Chile |
| Unidad de fomento |
| 2,750,000 |
| 1.61 | % | 2,766,439 |
|
11-11-2015 |
| 10-07-2016 |
| Banco Itaú — Chile |
| Unidad de fomento |
| 5,500,000 |
| 1.83 | % | 5,534,564 |
|
06-03-2015 |
| 08-09-2016 |
| Banco BTG Pactual— Chile |
| Unidad de fomento |
| 4,350,000 |
| 1.30 | % | 4,508,016 |
|
06-22-2015 |
| 08-09-2016 |
| Banco Santander — Chile |
| Unidad de fomento |
| 3,000,000 |
| 1.06 | % | 3,096,637 |
|
06-30-2015 |
| 08-09-2016 |
| Banco Santander — Chile |
| Unidad de fomento |
| 2,800,000 |
| 1.02 | % | 2,887,391 |
|
07-20-2015 |
| 08-09-2016 |
| Banco Estado — Chile |
| Unidad de fomento |
| 3,400,000 |
| 0.36 | % | 3,485,387 |
|
09-30-2015 |
| 10-07-2016 |
| Banco BTG Pactual— Chile |
| Unidad de fomento |
| 3,700,000 |
| 0.89 | % | 3,749,703 |
|
09-30-2015 |
| 10-07-2016 |
| Banco Santander — Chile |
| Unidad de fomento |
| 3,700,000 |
| 0.85 | % | 3,749,320 |
|
Subtotal |
|
|
|
|
|
|
|
|
|
|
| 87,491,453 |
|
| |||
| |||
| |||
|
| ||
|
|
Table(2) Market value of Contents
b)Non-current portion 2015
Time Deposits
Placement |
| Maturity |
| Institution |
| Currency |
| Principal |
| Annual |
| 12.31.2015 |
|
|
|
|
|
|
|
|
| ThCh$ |
| % |
| ThCh$ |
|
03-16-2015 |
| 03-16-2017 |
| Banco Votoratim |
| $R |
| 15,358 |
| 8.82 | % | 17,221 |
|
Sub Total |
|
|
|
|
|
|
|
|
|
|
| 17,221 |
|
| |||||
| |||||
| |||||
|
| ||||
|
|
|
c)Current portion 2014
Time deposits
Placement |
| Maturity |
| Institution |
| Currency |
| Principal |
| Annual |
| 12.31.2014 |
|
|
|
|
|
|
|
|
| ThCh$ |
| % |
| ThCh$ |
|
08-14-2014 |
| 02-13-2015 |
| Banco Santander — Chile |
| Unidad de fomento |
| 4,500,000 |
| 1.65 | % | 4,632,134 |
|
08-14-2014 |
| 02-13-2015 |
| Banco de Chile — Chile |
| Unidad de fomento |
| 4,500,000 |
| 1.25 | % | 4,625,025 |
|
08-14-2014 |
| 02-13-2015 |
| Banco Estado — Chile |
| Unidad de fomento |
| 4,500,000 |
| 1.15 | % | 4,623,248 |
|
08-19-2014 |
| 02-13-2015 |
| Banco Santander — Chile |
| Unidad de fomento |
| 5,480,000 |
| 1.45 | % | 5,633,637 |
|
08-29-2014 |
| 08-31-2015 |
| Banco Itaú — Chile |
| Unidad de fomento |
| 6,000,000 |
| 0.60 | % | 6,143,820 |
|
08-29-2014 |
| 08-31-2015 |
| Banco Santander — Chile |
| Unidad de fomento |
| 6,000,000 |
| 0.70 | % | 6,145,932 |
|
09-26-2014 |
| 05-13-2015 |
| Banco Santander — Chile |
| Unidad de fomento |
| 8,950,000 |
| 0.15 | % | 9,127,301 |
|
09-26-2014 |
| 09-30-2015 |
| Banco HSBC — Chile |
| Unidad de fomento |
| 8,950,000 |
| 0.54 | % | 9,136,789 |
|
10-07-2014 |
| 09-24-2015 |
| Banco de Chile — Chile |
| Unidad de fomento |
| 4,650,000 |
| 0.35 | % | 4,738,930 |
|
11-06-2014 |
| 08-13-2015 |
| Banco de Chile — Chile |
| Unidad de fomento |
| 4,000,000 |
| 1.60 | % | 4,053,000 |
|
11-06-2014 |
| 11-12-2015 |
| Banco Santander — Chile |
| Unidad de fomento |
| 4,000,000 |
| 1.58 | % | 4,052,877 |
|
11-06-2014 |
| 08-13-2015 |
| Banco Itaú — Chile |
| Unidad de fomento |
| 4,000,000 |
| 1.47 | % | 4,052,197 |
|
12-10-2014 |
| 08-13-2015 |
| Banco Santander — Chile |
| Unidad de fomento |
| 6,580,000 |
| 3.28 | % | 6,592,590 |
|
12-10-2014 |
| 05-13-2015 |
| Banco Itaú — Chile |
| Unidad de fomento |
| 3,290,000 |
| 3.87 | % | 3,297,427 |
|
12-12-2014 |
| 08-13-2015 |
| Banco Itaú — Chile |
| Unidad de fomento |
| 400,000 |
| 3.50 | % | 400,739 |
|
12-19-2014 |
| 08-26-2015 |
| Banco Santander — Chile |
| Unidad de fomento |
| 4,100,000 |
| 3.86 | % | 4,105,275 |
|
12-19-2014 |
| 08-26-2015 |
| Banco Santander — Chile |
| Unidad de fomento |
| 3,500,000 |
| 3.59 | % | 3,504,188 |
|
12-26-2014 |
| 10-27-2015 |
| Banco Santander — Chile |
| Unidad de fomento |
| 2,000,000 |
| 2.75 | % | 2,000,764 |
|
12-29-2014 |
| 10-27-2015 |
| Banco Santander — Chile |
| Unidad de fomento |
| 4,750,000 |
| 2.81 | % | 4,750,742 |
|
12-30-2014 |
| 10-27-2015 |
| Banco de Chile — Chile |
| Unidad de fomento |
| 3,500,000 |
| 2.55 | % | 3,500,248 |
|
11-28-2014 |
| 03-02-2015 |
| Banco Citibank NA — Paraguay |
| Paraguayan guaraníes |
| 1,310,758 |
| 4.75 | % | 1,310,758 |
|
11-28-2014 |
| 03-02-2015 |
| Banco BBVA Paraguay S.A. |
| Paraguayan guaraníes |
| 1,310,758 |
| 4.75 | % | 1,310,758 |
|
11-03-2014 |
| 01-02-2015 |
| Banco Galicia — Argentina |
| Argentine pesos (1) |
| 366,130 |
| 20.75 | % | 366,130 |
|
11-05-2014 |
| 01-05-2015 |
| Banco HSBC — Argentina |
| Argentine pesos (1) |
| 148,668 |
| 20.00 | % | 148,668 |
|
11-07-2014 |
| 01-06-2015 |
| Banco Galicia — Argentina |
| Argentine pesos (1) |
| 365,348 |
| 20.75 | % | 365,348 |
|
11-17-2014 |
| 01-16-2015 |
| Banco Industrial — Argentina |
| Argentine pesos (1) |
| 291,128 |
| 22.00 | % | 291,128 |
|
12-17-2014 |
| 02-18-2015 |
| Banco Industrial — Argentina |
| Argentine pesos (1) |
| 152,652 |
| 21.00 | % | 152,652 |
|
11-21-2014 |
| 01-20-2015 |
| Banco Galicia — Argentina |
| Argentine pesos (1) |
| 304,783 |
| 20.75 | % | 304,783 |
|
12-09-2014 |
| 02-09-2015 |
| Banco Santander Río — Argentina |
| Argentine pesos (1) |
| 349,255 |
| 20.90 | % | 349,255 |
|
12-16-2014 |
| 02-18-2015 |
| Banco Industrial — Argentina |
| Argentine pesos (1) |
| 370,189 |
| 21.00 | % | 370,189 |
|
12-19-2014 |
| 02-18-2015 |
| Banco Santander Río — Argentina |
| Argentine pesos (1) |
| 383,087 |
| 20.90 | % | 383,087 |
|
12-22-2014 |
| 02-20-2015 |
| Banco ICB — Argentina |
| Argentine pesos (1) |
| 160,501 |
| 20.00 | % | 160,501 |
|
12-29-2014 |
| 02-27-2015 |
| Banco Santander Río — Argentina |
| Argentine pesos (1) |
| 211,092 |
| 20.90 | % | 211,092 |
|
Subtotal |
|
|
|
|
|
|
|
|
|
|
| 100,841,212 |
|
(1) Corresponds to time deposits entered intohedging instruments. See details in order to guaranty derivative operations in ArgentinaNote 22.
Tableorrespond to the rights in the Argentinean company Alimentos de Soya S.A., manufacturing company of Contents“AdeS” products and its distribution rights, which are framed in the purchase of the "AdeS" brand managed by The Coca-Cola Company at the end of 2016.
| |||
| |||
| |||
|
| ||
|
| ||
| |||
| |||
|
| ||
| |||
|
| ||
| |||
|
| ||
|
|
(1) Corresponds to funds that should remain restricted according to the partial results from derivative operations in Argentina.
d)Non-current portion 2014
| |||
| |||
| |||
|
| ||
| |||
| |||
|
| ||
|
|
NOTE 7 — 6 – OTHER CURRENT AND NON-CURRENT NON-FINANCIAL ASSETS
Note 7.1 Other current non-financial assets
Description |
| 12.31.2015 |
| 12.31.2014 |
|
|
| ThCh$ |
| ThCh$ |
|
Prepaid expenses |
| 7,311,951 |
| 6,231,687 |
|
Fiscal credits |
| 468,574 |
| 1,466,228 |
|
Guarantee deposit (Argentine) |
| 47,023 |
| 9,924 |
|
Other current assets |
| 858,608 |
| 79,342 |
|
Total |
| 8,686,156 |
| 7,787,181 |
|
Note 7.2 Other non-current,The composition of other non-financial assets is as follows:
Description |
| 12,31,2015 |
| 12,31,2014 |
|
|
| ThCh$ |
| ThCh$ |
|
Judicial deposits (see note 22.2) |
| 11,127,988 |
| 22,717,093 |
|
Prepaid expenses |
| 3,408,763 |
| 5,624,838 |
|
Fiscal credits |
| 3,060,733 |
| 4,409,561 |
|
Others |
| 692,417 |
| 305,288 |
|
Total |
| 18,289,901 |
| 33,056,780 |
|
| Balance | ||||||||||||||||
| Current | Non-current | |||||||||||||||
| Other non-financial assets | 12.31.2020 | 12.31.2019 | 12.31.2020 | 12.31.2019 | ||||||||||||
| ThCh$ | ThCh$ | ThCh$ | ThCh$ | |||||||||||||
| Prepaid expenses | 7,932,770 | 11,242,456 | 527,110 | 595,045 | ||||||||||||
| Tax credit remainder (1) | 234,124 | 180,695 | 76,262,417 | 103,540,639 | ||||||||||||
| Guaranty deposit | 286 | 422 | - | |||||||||||||
| Judicial deposits | - | - | 11,492,642 | 19,226,030 | ||||||||||||
| Others (2) | 5,207,201 | 4,765,392 | 1,960,503 | 2,274,436 | ||||||||||||
| Total | 13,374,381 | 16,188,965 | 90,242,672 | 125,636,150 | ||||||||||||
TableIn November 2006, Rio de Janeiro Refrescos Ltda. ("RJR") filed a court order No. 0021799-23.2006.4.02.5101 seeking recognition of Contentsthe right to exclude ICMS (Tax on Commerce and Services) from the PIS (Program of Social Integration) and COFINS (Contribution for the Financing of Social Security) calculation base, as well as recognition of the right to obtain reimbursement of amounts unduly collected since November 14, 2001, duly restated using the Selic interest rate. On May 20, 2019, the ruling favoring RJR became final, allowing the recovery of amounts overpaid from November 14, 2001 to August 2017. It is worth noting that in September 2017, RJR had already obtained a Security Mandate, which granted it the right to exclude, from that date, the ICMS from the PIS and COFINS calculation base.
The company took steps to assess the total amount of the credit at issue for the period of unduly collection of taxes from November 2001 to August 2017, totaling CLP 103,540 million (BRL 613 million, of which BRL 370 million corresponds to capital and BRL 243 million to interest and monetary restatement. These amounts were recorded as of December 31, 2019. In addition, the company acknowledged the indirect costs (attorneys' fees, consulting, auditing, indirect taxes and other obligations) resulting from the recognition of the right acquired in court, totaling BRL 175 million.
The payment of income tax occurs when liquidating the credit, therefore the respective deferred tax liability recorded was CLP 20,246 million (BRL 148 million). In 2020 already CLP 16,142 million (BRL 118 million) have been offset.
Companhia de Bebidas Ipiranga ("CBI") acquired in September 2013, also filed a court order No. 0014022-71.2000.4.03.6102 in order to recognize the same issue as the one previously described for RJR. In September 2019, the ruling favoring CBI became final, allowing the recovery of the amounts overpaid from September 12, 1989 to December 1, 2013 (date when CBI was incorporated by RJR). CBI's credit will be generated in the name of RJR, however, pursuant to the contractual clause ("Subscription Agreement for Shares and Exhibits"), as soon as collected by RJR, this payment should be immediately paid to former CBI shareholders (supervention favoring former CBI shareholders). Based on supporting documents found, for the August 1993-November 2013 period, the amount of credits related to this process have been calculated and totaled CLP 22,162 million (BRL 162 million, of which BRL 80 million corresponds to capital and BRL 82 million correspond to interest and monetary restatement), from this amount, CLP 958 million (BRL 7 million) must be deducted from indirect taxes, thus generating an account payable to former shareholders for CLP 21,204 million (BRL 155 billion) and a government receivables related to credits for that same amount. It is worth mentioning that for the September 1989-July 1993 period, the Company did not account the credit due to the lack of supporting documents.
In addition, RJR has an associate called Sorocaba Refrescos SA ("Sorocaba"), where it has a 40% shareholding in the capital, which also filed a court order seeking recognition of the right to the same issue as RJR's action. On June 13, 2019, the ruling favoring Sorocaba became final, allowing the recovery of the amounts overpaid from July 5, 1992 until the date on which the decision became final. As of December 31, 2020, the impacts were recognized in RJR's result from its ownership in Sorocaba, totaling CLP 6,703 million (BRL 49 million, of which BRL 28 million correspond to capital and BRL 21 million correspond to interest and monetary restatement). In addition, the company recognized indirect costs (attorneys' fees, consulting, auditing, indirect taxes, and other obligations) resulting from the recognition of the right acquired in court, totaling CLP 1,368 million (BRL 10 million).
Income tax payment occurs upon credit settlement, with that the respective deferred tax liability recorded was CLP 1,778 million (BRL 13 million). In 2020, CLP 684 million (BRL 5 million) of the total credit obtained by Sorocaba have already been offset.
(2) Other non-financial assets are mainly composed of advances to suppliers.
NOTE 8 — 7 – TRADETRADE AND OTHER RECEIVABLES
The composition of trade and other receivables is detailed as follows:
|
| 12.31.2015 |
| 12.31.2014 |
| ||||||||
Trade and other receivables |
| Assets |
| Allowance for |
| Commercial |
| Assets |
| Allowance |
| Commercial |
|
|
| ThCh$ |
| ThCh$ |
| ThCh$ |
| ThCh$ |
| ThCh$ |
| ThCh$ |
|
Current commercial debtors |
|
|
|
|
|
|
|
|
|
|
|
|
|
Trade debtors |
| 147,949,551 |
| (4,276,100 | ) | 143,673,451 |
| 164,026,718 |
| (7,028,207 | ) | 156,998,511 |
|
Other current debtors |
| 24,881,812 |
| (939,201 | ) | 23,942,611 |
| 30,963,659 |
| — |
| 30,963,659 |
|
Current commercial debtors |
| 172,831,363 |
| (5,215,301 | ) | 167,616,062 |
| 194,990,377 |
| (7,028,207 | ) | 187,962,170 |
|
Prepayments suppliers |
| 6,777,567 |
| — |
| 6,777,567 |
| 6,017,624 |
| — |
| 6,017,624 |
|
Other current accounts receivable |
| 2,042,131 |
| (49,924 | ) | 1,992,207 |
| 4,189,001 |
| (58,371 | ) | 4,130,630 |
|
Commercial debtors and other current accounts receivable |
| 181,651,061 |
| (5,265,225 | ) | 176,385,836 |
| 205,197,002 |
| (7,086,578 | ) | 198,110,424 |
|
|
|
|
|
|
|
|
|
|
|
|
|
|
|
Non-current accounts receivable |
|
|
|
|
|
|
|
|
|
|
|
|
|
Trade debtors |
| 95,413 |
| — |
| 95,413 |
| 100,105 |
| — |
| 100,105 |
|
Other non-current debtors |
| 5,836,586 |
| — |
| 5,836,586 |
| 6,997,704 |
| — |
| 6,997,704 |
|
Non-current accounts receivable |
| 5,931,999 |
| — |
| 5,931,999 |
| 7,097,809 |
| — |
| 7,097,809 |
|
Trade and other receivable |
| 187,583,060 |
| (5,265,225 | ) | 182,317,835 |
| 212,294,811 |
| (7,086,578 | ) | 205,208,233 |
|
| Balance | ||||||||||
| Current | Non-current | |||||||||
| Trade debtors and other accounts receivable, Net | 12.31.2020 | 12.31.2019 | 12.31.2020 | 12.31.2019 | ||||||
| ThCh$ | ThCh$ | ThCh$ | ThCh$ | |||||||
| Trade debtors | 151,017,754 | 150,509,528 | 40,432 | - | ||||||
| Other debtors | 41,688,151 | 39,620,246 | 32,219 | 466,007 | ||||||
| Other accounts receivable | 1,315,348 | 947,814 | 1,211 | 57,762 | ||||||
| Total | 194,021,253 | 191,077,588 | 73,862 | 523,769 | ||||||
Aging of debtor portfolio |
| Number of |
| 12.31.2015 |
| Number of |
| 12.31.2014 |
|
|
|
|
| ThCh$ |
|
|
| ThCh$ |
|
Up to date non-securitized portfolio |
| 7,433 |
| 61,153,091 |
| 25,834 |
| 59,916,856 |
|
1 and 30 days |
| 66,511 |
| 82,344,857 |
| 63,235 |
| 92,184,412 |
|
31 and 60 days |
| 705 |
| 1,760,954 |
| 583 |
| 1,309,832 |
|
61 and 90 days |
| 344 |
| 675,559 |
| 396 |
| 420,965 |
|
91 and 120 days |
| 316 |
| 147,289 |
| 334 |
| 481,396 |
|
121 and 150 days |
| 233 |
| 180,617 |
| 210 |
| 353,768 |
|
151 and 180 days |
| 194 |
| 172,041 |
| 197 |
| 207,522 |
|
181 and 210 days |
| 476 |
| 297,653 |
| 306 |
| 568,956 |
|
211 and 250 days |
| 241 |
| 91,308 |
| 199 |
| 548,469 |
|
More than 250 days |
| 1,522 |
| 1,221,595 |
| 1,248 |
| 8,134,647 |
|
Total |
| 77,975 |
| 148,044,964 |
| 92,542 |
| 164,126,823 |
|
|
|
|
| 12.31.2015 |
|
|
| 12.31.2014 |
|
|
|
|
| ThCh$ |
|
|
| ThCh$ |
|
Current comercial debtors |
|
|
| 147,949,551 |
|
|
| 164,026,718 |
|
Non-current comercial debtors |
|
|
| 95,413 |
|
|
| 100,105 |
|
Total |
|
|
| 148,044,964 |
|
|
| 164,126,823 |
|
| Balance | |||||||||
| Current | Non-current | ||||||||
| Trade debtors and other accounts receivable, Gross | 12.31.2020 | 12.31.2019 | 12.31.2020 | 12.31.2019 | |||||
| ThCh$ | ThCh$ | ThCh$ | ThCh$ | ||||||
| Trade debtors | 154,591,684 | 153,654,549 | 40,432 | - | |||||
| Other debtors | 44,691,925 | 42,719,679 | 32,219 | 466,007 | |||||
| Other accounts receivable | 1,533,307 | 1,196,347 | 1,211 | 57,762 | |||||
| Total | 200,816,916 | 197,570,575 | 73,862 | 523,769 | |||||
TableThe stratification of Contentsthe portfolio is as follows:
| Balance | |||||||
| Current trade debtors without impairment impact | 12.31.2020 ThCh$ | 12.31.2019 ThCh$ | |||||
| Less than one month | 147,177,119 | 148,150,717 | |||||
| Between one and three months | 2,230,594 | 1,872,144 | |||||
| Between three and six months | 1,708,015 | 838,277 | |||||
| Between six and eight months | 509,855 | 482,596 | |||||
| Older than eight months | 3,006,533 | 2,310,815 | |||||
| Total | 154,632,116 | 153,654,549 | |||||
The Company has approximately 283,500 clients, which may have balances in the different sections of the stratification. The number of clients is distributed geographically with 66,100 in Chile, 89,900 in Brazil, 69,600 in Argentina and 58,000 in Paraguay.
The movement in the allowance for doubtful accounts between January 1 and December 31, 2015 and 2014, areexpected credit losses is presented below:
|
| 12.31.2015 |
| 12.31.2014 |
| 12.31.2013 |
|
|
| ThCh$ |
| ThCh$ |
| ThCh$ |
|
Opening balance |
| 7,086,578 |
| 2,678,879 |
| 1,486,749 |
|
Bad debt expense |
| 5,762,634 |
| 4,459,276 |
| 2,519,653 |
|
Provision application |
| (6,992,793 | ) | (35,827 | ) | (1,278,400 | ) |
Change due to foreign exchange differences |
| (591,194 | ) | (15,750 | ) | (49,123 | ) |
Movement |
| (1,821,353 | ) | 4,407,699 |
| 1,192,130 |
|
Ending balance |
| 5,265,225 |
| 7,086,578 |
| 2,678,879 |
|
| 12.31.2020 | 12.31.2019 | |||||||
| ThCh$ | ThCh$ | |||||||
| Opening balance | 6,492,987 | 6,298,208 | ||||||
| Increase (decrease) | 2,321,958 | 1,762,246 | ||||||
| Provision reversal | (1,595,521 | ) | (1,184,953 | ) | ||||
| Increases (decrease) for changes of foreign currency | (423,761 | ) | (382,514 | ) | ||||
| Sub – total movements | 302,676 | 194,779 | ||||||
| Ending balance | 6,795,663 | 6,492,987 | ||||||
The composition of inventories is detailed as follows:follows:
Details |
| 12.31.2015 |
| 12.31.2014 |
| 12.31.2020 | 12.31.2019 | |||||
|
| ThCh$ |
| ThCh$ |
| ThCh$ | ThCh$ | |||||
Raw materials |
| 80,466,928 |
| 74,691,675 |
| 80,902,721 | 93,524,911 | |||||
Finished goods |
| 26,378,890 |
| 47,894,403 |
| 27,556,884 | 32,337,670 | |||||
Spare parts and supplies |
| 26,082,728 |
| 26,213,284 |
| 19,592,377 | 20,769,626 | |||||
Work in progress |
| 761,923 |
| 289,740 |
| 76,577 | 567,973 | |||||
Other inventories |
| 1,438,231 |
| 3,039,477 |
| 3,101,016 | 3,625,488 | |||||
Obsolescence provision |
| (1,795,447 | ) | (2,400,961 | ) | (3,256,925 | ) | (3,184,444 | ) | |||
Total |
| 133,333,253 |
| 149,727,618 |
| 127,972,650 | 147,641,224 | |||||
The cost of inventory recognized as cost of sales is ThCh$ 1,106,706,146, ThCh$ 1,081,243,408amounts to CLP 1,022,498,659 thousand and ThCh$ 914,817,748 atCLP 1,048,343,767 thousand as of December 31, 2015, 20142020 and 2013,2019, respectively.
(1) The provision for obsolescence is primarily related more to the obsolescence of parts classified as inventories than finished goods and raw materials.
| (1) | Approximately 80% is composed of concentrate and sweeteners used in the preparation of beverages, as well as caps and PET supplies used in the packaging of the product. |
| (2) | The obsolescence provision is related mainly with the obsolescence of spare parts classified as inventories and to a lesser extent to finished products and raw materials. The general standard is to provision all those multi-functional spare parts without utility in rotation in the last four years prior to the technical analysis technical to adjust the provision. In the case of raw materials and finished products, the obsolescence provision is determined according to maturity. |
NOTE 10 — CURRENT9 – TAX ASSETS AND DEFERRED INCOME TAXELIABILITIES
10.1Tax ReformThe composition of current tax accounts receivable is the following:
On September 29, 2014, the Official Daily Newspaper published Law N°20,780 which amends the Chilean tax regime, with the main following changes:
| Tax assets | 12-31.2020 | 12-31.2019 | |||||
| ThCh$ | ThCh$ | ||||||
| Tax credits (1) | 218,472 | 9,815,294 | |||||
| Total | 218,472 | 9,815,294 | |||||
· It establishes a new system of semi-integrated taxation, which can be used as an alternative to the integrated regime of attributed income. Taxpayers may opt freely to any of the two to pay their taxes. In the case of Embotelladora Andina S.A. by a general rule established by law the semi-integrated taxation system applies, which should be subsequently ratified by a future Shareholders Meeting.
· The semi-integrated system establishes the gradual increase in the first category tax rate for the business years 2014, 2015, 2016, 2017 and 2018 onwards, increasing to 21%, 22.5%, 24%, 25.5% and 27% respectively.
· Regarding the amendments to deferred taxes resulting from rate changes to be applied during the reversal period of differences between the bases of valuation of assets and liabilities by deferred taxes, were recognized on December 31, 2014, according to IAS 12 with a charge to net income, amounting to ThCh$23,615,151.
10.2Current tax assets
Current tax assets correspond to the following items:
Description |
| 12.31.2015 |
| 12.31.2014 |
|
|
| ThCh$ |
| ThCh$ |
|
Monthly provisional payments |
| 7,506,564 |
| 5,727,642 |
|
Tax credits (1) |
| 234,677 |
| 297,407 |
|
Total |
| 7,741,241 |
| 6,025,049 |
|
(1) Tax credits correspond to income tax credits on training expenses, purchase of property,Property, plant and equipment, and donations.
F-The composition of 48current tax accounts payable is the following:
| Current | Non-Current | |||||||||||||
| Tax liabilities | 12.31.2020 | 12.31.2019 | 12.31.2018 | 12.31.2020 | 12.31.2019 | 12.31.2018 | ||||||||
| ThCh$ | ThCh$ | ThCh$ | ThCh$ | ThCh$ | ThCh$ | |||||||||
| Income tax expense | 8,828,599 | 6,762,267 | 9,338,612 | 20,957 | - | - | ||||||||
| Total | 8,828,599 | 6,762,267 | 9,338,612 | 20,957 | - | - | ||||||||
10.3Current tax liabilities10 – INCOME TAX EXPENSE AND DEFERRED TAXES
Current tax payables correspond to the following items
Description |
| 12.31.2015 |
| 12.31.2014 |
|
|
| ThCh$ |
| ThCh$ |
|
Income tax expense |
| 7,494,832 |
| 2,931,206 |
|
Total |
| 7,494,832 |
| 2,931,206 |
|
10.410.1 Income tax expense
The current and deferred income tax expenses for the years ended December 31, 2015, 2014are detailed as follows:
| Details | 12.31.2020 | 12.31.2019 | 12.31.2018 | |||||||||
| ThCh$ | ThCh$ | ThCh$ | ||||||||||
| Current income tax expense | 55,522,189 | 35,439,707 | 38,313,980 | |||||||||
| Current tax adjustment previous period | (735,907 | ) | 713,992 | 312,403 | ||||||||
| Foreign dividends tax withholding expense | 6,987,142 | 4,534,145 | 7,364,213 | |||||||||
| Other current tax expense (income) | (47,569 | ) | (425,958 | ) | 474,105 | |||||||
| Current income tax expense | 61,725,855 | 40,261,886 | 46,464,701 | |||||||||
| Expense (income) for the creation and reversal of temporary differences of deferred tax and others | (6,820,456 | ) | 20,905,005 | 9,100,154 | ||||||||
| Expense (income) for deferred taxes | (6,820,456 | ) | 20,905,005 | 9,100,154 | ||||||||
| Total income tax expense | 54,905,399 | 61,166,891 | 55,564,855 | |||||||||
The distribution of national and 2013 are detailedforeign tax expenditure is as follows:
Item |
| 12.31.2015 |
| 12.31.2014 |
| 12.31.2013 |
|
|
| ThCh$ |
| ThCh$ |
| ThCh$ |
|
Current income tax expense |
| 33,322,550 |
| 16,313,855 |
| 31,237,950 |
|
Adjustment to current income tax from the previous fiscal year |
| (117,316 | ) | (547,549 | ) | 1,051,182 |
|
Withholding tax expense foreign subsidiaries |
| 7,027,661 |
| 4,848,794 |
| 1,032,620 |
|
Property tax expense |
| 1,212,398 |
| 784,742 |
| 668,111 |
|
Other tax expense (income) |
| — |
| (220,675 | ) | (12,281 | ) |
Current income tax expense |
| 41,445,293 |
| 21,179,167 |
| 33,977,582 |
|
Income (expense) for the creation and reversal of current tax difference |
| 197,269 |
| 840,269 |
| (11,011,318 | ) |
Tax reform |
| — |
| 23,334,999 |
| — |
|
Expense (income) for deferred taxes |
| 197,269 |
| 24,175,268 |
| (11,011,318 | ) |
Total income tax expense |
| 41,642,562 |
| 45,354,435 |
| 22,966,264 |
|
| Income taxes | 12.31.2019 | 12.31.2018 | 12.31.2018 | |||||||||
| ThCh$ | ThCh$ | ThCh$ | ||||||||||
| Current taxes | ||||||||||||
| Foreign | (39,128,690 | ) | (24,315,576 | ) | (24,442,984 | ) | ||||||
| National | (22,597,165 | ) | (15,946,310 | ) | (22,021,717 | ) | ||||||
| Current tax expense | (61,725,855 | ) | (40,261,886 | ) | (46,464,701 | ) | ||||||
| Deferred taxes | ||||||||||||
| Foreign | 7,280,487 | (24,012,798 | ) | (9,121,332 | ) | |||||||
| National | (460,031 | ) | 3,107,793 | 21,178 | ||||||||
| Deferred tax expense | 6,820,456 | (20,905,005 | ) | (9,100,154 | ) | |||||||
| Income tax expense | (54,905,399 | ) | (61,166,891 | ) | (55,564,855 | ) | ||||||
The reconciliation of the tax expense using the statutory rate with the tax expense using the effective rate is as follows:
| Reconciliation of effective rate | 12.31.2020 | 12.31.2019 | 12.31.2018 | |||||||||
| ThCh$ | ThCh$ | ThCh$ | ||||||||||
| Net income before taxes | 178,022,719 | 236,413,116 | 153,015,601 | |||||||||
| Tax expense at legal rate (27.0%) | (48,066,134 | ) | (63,831,541 | ) | (41,314,212 | ) | ||||||
| Effect of a different tax rate in other jurisdictions | 1,032,950 | (3,471,705 | ) | 967,671 | ||||||||
| Permanent differences: | ||||||||||||
| Non-taxable revenues | (2,417,582 | ) | 9,507,807 | 12,522,541 | ||||||||
| Non-deductible expenses | (6,007,898 | ) | (4,664,045 | ) | (11,141,237 | ) | ||||||
| Reversal of tax provision | 113,747 | (3,316,278 | ) | (295,632 | ) | |||||||
| Effect of monetary tax restatement Chilean companies | (5,936,464 | ) | 5,199,589 | 2,566,163 | ||||||||
| Foreign subsidiaries tax withholding expense and other legal tax debits and credits | 6,375,982 | (590,718 | ) | (18,870,149 | ) | |||||||
| Adjustments to tax expense | (7,872,215 | ) | 6,136,355 | (15,218,314 | ) | |||||||
| Tax expense at effective rate | (54,905,399 | ) | (61,166,891 | ) | (55,564,855 | ) | ||||||
| Effective rate | 30.8 | % | 25.9 | % | 36.3 | % | ||||||
The applicable income tax rates in each of the jurisdictions where the Company operates are the following:
| Rate | |||||||||||||
| Country | 2020 | 2019 | 2018 | ||||||||||
| Chile | 27.0 | % | 27.0 | % | 27.0 | % | |||||||
| Brazil | 34.0 | % | 34.0 | % | 34.0 | % | |||||||
| Argentina | 30.0 | % | 30.0 | % | 30.0 | % | |||||||
| Paraguay | 10.0 | % | 10.0 | % | 10.0 | % | |||||||
| 10.2 | Deferred income taxes |
10.5Deferred income taxes
The net cumulative balances of temporary differences whichthat give rise to deferred tax assets and liabilities are shown belowdetailed as follows:
|
| 12.31.2015 |
| 12.31.2014 |
| 12.31.2020 | 12.31.2019 | ||||||||||||||||||
Temporary differences |
| Assets |
| Liabilities |
| Assets |
| Liabilities |
| Assets | Liabilities | Assets | Liabilities | ||||||||||||
|
| ThCh$ |
| ThCh$ |
| ThCh$ |
| ThCh$ |
| CLP (000’s) | CLP (000’s) | CLP (000’s) | CLP (000’s) | ||||||||||||
Property, plant and equipment |
| 1,811,306 |
| 46,043,942 |
| 1,825,735 |
| 50,035,641 |
| 5,421,466 | 39,544,960 | 5,445,810 | 51,414,971 | ||||||||||||
Obsolescence provision |
| 1,722,802 |
| — |
| 1,789,886 |
| — |
| 1,340,235 | - | 1,588,563 | - | ||||||||||||
| ICMS exclusion credit | - | 17,679,221 | - | 25,651,794 | |||||||||||||||||||||
Employee benefits |
| 3,327,490 |
| — |
| 3,092,399 |
| — |
| 4,475,497 | 18,300 | 5,418,561 | 12,157 | ||||||||||||
Post-employment benefits |
| 102,742 |
| 1,207,337 |
| 82,299 |
| 798,459 |
| 150,027 | 101,339 | 148,853 | 787,576 | ||||||||||||
Tax loss carried-forwards (1) |
| 10,313,066 |
| — |
| 12,301,624 |
| — |
| ||||||||||||||||
Tax Goodwill Brazil |
| 34,538,542 |
| — |
| 51,257,770 |
| — |
| ||||||||||||||||
| Tax loss carry forwards (1) | 6,423,820 | - | 7,607,813 | - | |||||||||||||||||||||
| Tax goodwill Brazil | 2,080,987 | - | 10,341,033 | - | |||||||||||||||||||||
Contingency provision |
| 29,778,445 |
| — |
| 29,553,200 |
| — |
| 24,103,234 | - | 34,109,458 | - | ||||||||||||
Foreign exchange differences (2) |
| — |
| 9,600,022 |
| — |
| 2,612,804 |
| ||||||||||||||||
| Foreign Exchange differences (2) | 8,116,713 | - | 9,284,450 | - | |||||||||||||||||||||
Allowance for doubtful accounts |
| 437,113 |
| — |
| 977,330 |
| — |
| 915,562 | - | 756,895 | - | ||||||||||||
Coca-Cola incentives (Argentina) |
| 1,882,260 |
| — |
| 1,892,625 |
| — |
| ||||||||||||||||
Assets and liabilities for placement of bonds |
| — |
| 806,980 |
| — |
| 809,091 |
| 378,901 | 2,377,870 | 390,163 | 1,187,649 | ||||||||||||
Lease liabilities |
| 2,021,092 |
| — |
| 2,233,827 |
| — |
| 1,528,990 | - | 2,242,439 | - | ||||||||||||
Inventories |
| 2,512,725 |
| — |
| 1,285,918 |
| — |
| 469,416 | - | 447,192 | - | ||||||||||||
Distribution rights |
| — |
| 161,331,490 |
| — |
| 178,308,862 |
| - | 144,151,661 | - | 163,107,412 | ||||||||||||
| Hedging derivatives | - | - | - | - | |||||||||||||||||||||
Others |
| 637,737 |
| 297,250 |
| 454,312 |
| 308,215 |
| 3,785,655 | 7,060,830 | - | 3,705,078 | ||||||||||||
Subtotal |
| 89,085,320 |
| 219,287,021 |
| 106,746,925 |
| 232,873,072 |
| 59,190,503 | 210,934,181 | 77,781,230 | 245,866,637 | ||||||||||||
Total liabilities net |
| — |
| 130,201,701 |
| — |
| 126,126,147 |
| ||||||||||||||||
| Total assets and liabilities net | 1,925,869 | 153,669,547 | 1,364,340 | 169,449,747 | |||||||||||||||||||||
| (1) | Tax losses mainly associated with the subsidiary Embotelladora Andina Chile S.A. Tax losses have no expiration date in Chile |
(1) Tax losses mainly associated with the subsidiary Embotelladora Andina Chile S.A., for ThCh$ 9,960,263 and other smaller subsidiaries in Chile for ThCh$ 352,803. In Chile tax losses have no expiration date.
| (2) | Corresponds to differed taxes for exchange rate differences generated on the translation of debt expressed in foreign currency in the subsidiary Rio de Janeiro Refrescos Ltda. and which for tax purposes are recognized in Brazil then incurred. |
(2) Corresponds to differed taxes for exchange rate differences generated on the translation of debt expressed in foreign currency that are taxed differently to their accrual.
10.6Deferred tax liability movement
The movement in deferred income tax accounts is as follows:follows:
Item |
| 12.31.2015 |
| 12.31.2014 |
| 12.31.2013 |
|
|
| ThCh$ |
| ThCh$ |
| ThCh$ |
|
|
|
|
|
|
|
|
|
Opening Balance |
| 126,126,147 |
| 105,537,484 |
| 111,414,626 |
|
Increase due to merger |
|
|
|
|
| 6,938,385 |
|
Increase (decrease) in deferred tax |
| 9,474,186 |
| (4,931,757 | ) | (12,592,600 | ) |
Increase resulting from Tax Reform rates |
| — |
| 23,334,999 |
| — |
|
Increase (decrease) due to foreign currency translation |
| (5,398,632 | ) | 2,185,421 |
| (222,927 | ) |
Movements |
| 4,075,554 |
| 20,588,663 |
| (5,877,142 | ) |
Ending balance |
| 130,201,701 |
| 126,126,147 |
| 105,537,484 |
|
| Movement | 12.31.2020 | 12.31.2019 | 12.31.2018 | |||||||||
| ThCh$ | ThCh$ | ThCh$ | ||||||||||
| Opening Balance | 168,085,407 | 145,245,948 | 121,991,585 | |||||||||
| Increase (decrease) in deferred tax | 4,411,619 | 20,905,005 | 11,303,016 | |||||||||
| Increase (decrease) due to foreign currency translation (*) | (20,753,348 | ) | 1,934,454 | 11,951,347 | ||||||||
| Total movements | (16,341,729 | ) | 22,839,459 | 23,254,363 | ||||||||
| Ending balance | 151,743,678 | 168,085,407 | 145,245,948 | |||||||||
10.7Distribution of domestic and foreign tax expense(*) Includes IAS 29 effect, due to inflation in Argentina
For the years ended December 31, 2015, 2014 and 2013, domestic and foreign tax expense are detailed as follows:
Income tax |
| 12.31.2015 |
| 12.31.2014 |
| 12.31.2013 |
|
|
| ThCh$ |
| ThCh$ |
| ThCh |
|
Current income taxes |
|
|
|
|
|
|
|
Foreign |
| (36,438,137 | ) | (15,058,221 | ) | (18,135,554 | ) |
Domestic |
| (5,007,156 | ) | (6,120,946 | ) | (15,842,028 | ) |
Current income tax expense |
| (41,445,293 | ) | (21,179,167 | ) | (33,977,582 | ) |
|
|
|
|
|
|
|
|
Deferred income taxes |
|
|
|
|
|
|
|
Foreign |
| 9,745,398 |
| (2,080,538 | ) | 10,509,053 |
|
Domestic |
| (9,942,667 | ) | (22,094,730 | ) | 502,265 |
|
Deferred income tax expense |
| (197,269 | ) | (24,175,268 | ) | 11,011,318 |
|
Income tax expense |
| (41,642,562 | ) | (45,354,435 | ) | (22,966,264 | ) |
10.8Reconciliation of effective rate
Below is the reconciliation between the effective tax rate and the statutory rate:
Reconciliation of effective rate |
| 12.31.2015 |
| 12.31.2014 |
|
|
| ThCh$ |
| ThCh$ |
|
Net income before taxes |
| 129,740,488 |
| 97,388,527 |
|
Tax expense at legal rate ( 22,5%) |
| (29,191,610 | ) | — |
|
Tax expense at legal rate ( 21,0%) |
| — |
| (20,451,591 | ) |
Effect of a different tax rate in other jurisdictions |
| (8,161,392 | ) | (6,916,744 | ) |
|
|
|
|
|
|
Permanent differences: |
|
|
|
|
|
Non-taxable revenues |
| 11,778,290 |
| 16,703,891 |
|
Non-deductible expenses |
| (7,945,107 | ) | (7,336,011 | ) |
Tax reform (Chile) |
| — |
| (23,334,999 | ) |
Adjustement to current income tax from the previous fiscal year |
| 117,316 |
| (254,185 | ) |
Foreign subsidiaries tax withholding expense and other legal tax debits and credits |
| (8,240,059 | ) | (3,764,796 | ) |
Adjustments to tax expense |
| (4,289,560 | ) | (17,986,100 | ) |
|
|
|
|
|
|
Tax expense at effective rate |
| (41,642,562 | ) | (45,354,435 | ) |
Effective rate |
| 32,1 | % | 46,6 | % |
Below are the income tax rates applicable in each jurisdiction where the Company operates:
|
| Rate |
| ||
Country |
| 2015 |
| 2014 |
|
Chile |
| 22,5 | % | 21 | % |
Brazil |
| 34 | % | 34 | % |
Argentina |
| 35 | % | 35 | % |
Paraguay |
| 10 | % | 10 | % |
NOTE 11 — – PROPERTY, PLANT AND EQUIPMENT
11.1Balances
Property, plant and equipment are detailed below at the end of each period:
|
| Property, plant and equipment, |
| Cumulative depreciation and |
| Property, plant and equipment, net |
| ||||||
Item |
| 12.31.2015 |
| 12.31.2014 |
| 12.31.2015 |
| 12.31.2014 |
| 12.31.2015 |
| 12.31.2014 |
|
|
| ThCh$ |
| ThCh$ |
| ThCh$ |
| ThCh$ |
| ThCh$ |
| ThCh$ |
|
|
|
|
|
|
|
|
|
|
|
|
|
|
|
Construction in progress |
| 34,625,004 |
| 25,522,059 |
| — |
| — |
| 34,625,004 |
| 25,522,059 |
|
Land |
| 86,898,529 |
| 76,957,848 |
| — |
| — |
| 86,898,529 |
| 76,957,848 |
|
Buildings |
| 209,625,725 |
| 223,273,615 |
| (50,150,795 | ) | (51,215,168 | ) | 159,474,930 |
| 172,058,447 |
|
Plant and equipment |
| 432,853,976 |
| 489,218,564 |
| (229,474,042 | ) | (235,979,731 | ) | 203,379,934 |
| 253,238,833 |
|
Information technology |
| 17,189,199 |
| 17,527,911 |
| (12,868,543 | ) | (12,706,055 | ) | 4,320,656 |
| 4,821,856 |
|
Fixed facilities and accessories |
| 32.882.106 |
| 34,015,967 |
| (10,575,347 | ) | (8,960,420 | ) | 22,306,759 |
| 25,055,547 |
|
Vehicles |
| 33,857,560 |
| 36,966,300 |
| (15,750,855 | ) | (20,796,517 | ) | 18,106,705 |
| 16,169,783 |
|
Leasehold improvements |
| 650,815 |
| 786,269 |
| (375,870 | ) | (340,149 | ) | 274,945 |
| 446,120 |
|
Other property, plant and equipment (1) |
| 376.360.341 |
| 404,317,216 |
| (265,217,931 | ) | (265,512,424 | ) | 111,142,410 |
| 138,804,792 |
|
Total |
| 1,224,943,255 |
| 1,308,585,749 |
| (584,413,383 | ) | (595,510,464 | ) | 640,529,872 |
| 713,075,285 |
|
period(1) Other property, plant and equipment is composed of bottles, market assets, furniture and other minor assets.
| Property, plant and equipment, gross | 12.31.2020 | 12.31.2019 | ||||||
| ThCh$ | ThCh$ | |||||||
| Construction in progress | 34,194,083 | 27,290,581 | ||||||
| Land | 94,321,726 | 104,196,754 | ||||||
| Buildings | 266,921,167 | 299,282,674 | ||||||
| Plant and equipment | 515,395,328 | 571,154,695 | ||||||
| Information technology equipment | 24,323,557 | 23,912,963 | ||||||
| Fixed installations and accessories | 45,558,495 | 46,062,659 | ||||||
| Vehicles | 45,808,748 | 55,128,493 | ||||||
| Leasehold improvements | 203,164 | 214,886 | ||||||
| Rights of use (1) | 56,726,206 | 40,498,400 | ||||||
| Other properties, plant and equipment (2) | 314,602,940 | 452,600,945 | ||||||
| Total Property, plant and equipment, gross | 1,398,055,414 | 1,620,343,050 | ||||||
Accumulated depreciation of Property, plant and equipment | 12.31.2020 |
12.31.2019 | ||||||
| ThCh$ | ThCh$ | |||||||
| Buildings | (86,004,289 | ) | (87,308,899 | ) | ||||
| Plant and equipment | (369,605,125 | ) | (385,801,471 | ) | ||||
| Information technology equipment | (19,445,250 | ) | (18,911,118 | ) | ||||
| Fixed installations and accessories | (27,910,603 | ) | (26,219,378 | ) | ||||
| Vehicles | (29,397,964 | ) | (33,167,346 | ) | ||||
| Leasehold improvements | (144,022 | ) | (144,865 | ) | ||||
| Rights of use (1) | (35,388,929 | ) | (8,254,568 | ) | ||||
| Other properties, plant and equipment (2) | (224,582,687 | ) | (337,816,542 | ) | ||||
| Total accumulated depreciation | (792,478,869 | ) | (897,624,187 | ) | ||||
| Total Property, plant and equipment, net | 605,576,545 | 722,718,863 | ||||||
(1) For adoption of IFRS 16, See details of underlying assets in Note 11,1
(2) The net balance of each of these categories at December 31, 2015 and 2014 is detailed as follows:presented below:
Other property, plant and equipment |
| 12.31.2015 |
| 12.31.2014 |
|
|
| ThCh$ |
| ThCh$ |
|
|
|
|
|
|
|
Bottles |
| 67,110,520 |
| 62,769,011 |
|
Marketing and promotional assets |
| 38,061,595 |
| 66,444,241 |
|
Other property, plant and equipment |
| 5,970,295 |
| 9,591,540 |
|
Total |
| 111,142,410 |
| 138,804,792 |
|
| Other Property, plant and equipment, net | 12.31.2020 | 12.31.2019 | ||||||
| ThCh$ | ThCh$ | |||||||
| Bottles | 30,275,255 | 44,071,742 | ||||||
| Marketing and promotional assets | 44,106,959 | 57,442,154 | ||||||
| Other Property, plant and equipment | 15,638,039 | 13,270,507 | ||||||
| Total | 90,020,253 | 114,784,403 | ||||||
The Company has insurance to protect its property, plant and equipment and its inventory from potential losses. The geographic distribution of those assets is detailed as follows:
|
| |
|
| |
|
| |
|
|
11.2Movements
Movements in property,Property, plant and equipment are detailed as follows between January 1 and December 31, 2015 and 2014:follows:
|
| Construction in |
| Land |
| Buildings, net |
| Plant and |
| IT Equipment, net |
| Fixed |
| Vehicles, net |
| Leasehold |
| Other, |
| Property, plant |
| Construction in progress | Land | Buildings, net | Plant and equipment, net | IT equipment net | Fixed facilities and accessories, net | Vehicles, net | Leasehold improvements, net | Others | Rights-of-use | Property, plant & equipment, net | |||||||||||||||||||||||||||||||||
|
| ThCh$ |
| ThCh$ |
| ThCh$ |
| ThCh$ |
| ThCh$ |
| ThCh$ |
| ThCh$ |
| ThCh$ |
| ThCh$ |
| ThCh$ |
| ThCh$ | ThCh$ | ThCh$ | ThCh$ | ThCh$ | ThCh$ | ThCh$ | ThCh$ | ThCh$ | ThCh$ | ThCh$ | |||||||||||||||||||||||||||||||||
|
|
|
|
|
|
|
|
|
|
|
|
|
|
|
|
|
|
|
|
|
| ||||||||||||||||||||||||||||||||||||||||||||
Opening balance at January 1, 2015 |
| 25,522,059 |
| 76,957,848 |
| 172,058,447 |
| 253,238,833 |
| 4,821,856 |
| 25,055,547 |
| 16,169,783 |
| 446,120 |
| 138,804,792 |
| 713,075,285 |
| ||||||||||||||||||||||||||||||||||||||||||||
| Opening balance at January 1, 2020 | 27,290,581 | 104,196,754 | 211,973,775 | 185,353,224 | 5,001,845 | 19,843,281 | 21,961,147 | 70,021 | 114,784,403 | 32,243,832 | 722,718,863 | ||||||||||||||||||||||||||||||||||||||||||||||||||||||
Additions |
| 59,639,751 |
| 17,987,524 |
| 104,132 |
| 9,184,539 |
| 285,838 |
| — |
| 105,804 |
| — |
| 23,668,047 |
| 110,975,635 |
| 37,726,227 | - | 1,520,363 | 8,963,015 | 809,348 | (1,313 | ) | 1,323,740 | - | 30,536,408 | - | 80,877,788 | ||||||||||||||||||||||||||||||||
| Right-of use additions (1) | - | - | - | - | - | - | - | - | - | 1,775,457 | 1,775,457 | ||||||||||||||||||||||||||||||||||||||||||||||||||||||
Disposals |
| — |
| — |
| (16,277 | ) | (228,309 | ) | (245 | ) | — |
| (4,917 | ) | — |
| (84,020 | ) | (333,768 | ) | - | - | (164,113 | ) | (2,485,145 | ) | (2,426 | ) | - | (22,823 | ) | - | (6,046,468 | ) | (87,043 | ) | (8,808,018 | ) | ||||||||||||||||||||||||||
Transfers between items of property, plant and equipment |
| (46,527,488 | ) | — |
| 10,132,100 |
| 9,853,256 |
| 1,583,502 |
| 1,371,016 |
| 8,868,154 |
| 5,993 |
| 14,713,467 |
| — |
| ||||||||||||||||||||||||||||||||||||||||||||
| Transfers between items of Property, plant and equipment | (23,336,382 | ) | - | 2,177,344 | 8,858,066 | 1,151,754 | 1,175,520 | 906,624 | 50,356 | 9,016,718 | - | - | |||||||||||||||||||||||||||||||||||||||||||||||||||||
| Right-of-use transfers | - | - | - | - | - | - | - | - | - | - | - | ||||||||||||||||||||||||||||||||||||||||||||||||||||||
Depreciation expense |
| — |
| — |
| (5,069,161 | ) | (35,294,090 | ) | (1,879,341 | ) | (2,512,958 | ) | (3,967,423 | ) | (87,523 | ) | (49,139,913 | ) | (97,950,409 | ) | - | - | (7,240,230 | ) | (33,465,104 | ) | (2,058,555 | ) | (2,803,621 | ) | (4,963,835 | ) | (44,630 | ) | (48,830,152 | ) | (99,406,127 | ) | ||||||||||||||||||||||||||
| Amortization | - | - | - | - | - | - | - | - | - | (7,851,901 | ) | (7,851,901 | ) | ||||||||||||||||||||||||||||||||||||||||||||||||||||
Increase (decrease) due to foreign currency translation differences |
| (4,009,318 | ) | (8,046,843 | ) | (17,496,868 | ) | (29,405,268 | ) | (469,797 | ) | (1,606,846 | ) | (2,918,202 | ) | (89,645 | ) | (16,283,975 | ) | (80,326,762 | ) | (3,086,288 | ) | (9,936,257 | ) | (29,231,570 | ) | (19,859,576 | ) | (829,268 | ) | (628,317 | ) | (3,124,155 | ) | (16,605 | ) | (11,400,730 | ) | (4,728,542 | ) | (82,841,308 | ) | ||||||||||||||||||||||
Other increase (decrease) |
| — |
| — |
| (237,443 | ) | (3,969,027 | ) | (21,157 | ) | — |
| (146,494 | ) | — |
| (535,988 | ) | (4,910,109 | ) | ||||||||||||||||||||||||||||||||||||||||||||
| Other increase (decrease) (2) | (4,400,055 | ) | 61,229 | 1,881,309 | (1,574,277 | ) | 805,609 | 62,342 | 330,086 | - | 1,960,074 | (14,526 | ) | (888,209 | ) | ||||||||||||||||||||||||||||||||||||||||||||||||||
Total movements |
| 9,102,945 |
| 9,940,681 |
| (12,583,517 | ) | (49,858,899 | ) | (501,200 | ) | (2,748,788 | ) | 1,936,922 |
| (171,175 | ) | (27,662,382 | ) | (72,545,413 | ) | 6,903,502 | (9,875,028 | ) | (31,056,897 | ) | (39,563,021 | ) | (123,538 | ) | (2,195,389 | ) | (5,550,363 | ) | (10,879 | ) | (24,764,150 | ) | (10,906,555 | ) | (117,142,318 | ) | |||||||||||||||||||||||
Ending balance at December 31, 2015 |
| 34,625,004 |
| 86,898,529 |
| 159,474,930 |
| 203,379,934 |
| 4,320,656 |
| 22,306,759 |
| 18,106,705 |
| 274,945 |
| 111,142,410 |
| 640,529,872 |
| ||||||||||||||||||||||||||||||||||||||||||||
| Ending balance at December 31, 2020 | 34,194,083 | 94,321,726 | 180,916,878 | 145,790,203 | 4,878,307 | 17,647,892 | 16,410,784 | 59,142 | 90,020,253 | 21,337,277 | 605,576,545 | ||||||||||||||||||||||||||||||||||||||||||||||||||||||
| (1) | Right of use assets is composed as follows: |
| Right-of-use | Gross asset | Accumulated depreciation | Net asset | |||||||||
| ThCh$ | ThCh$ | ThCh$ | ||||||||||
| Constructions and buildings | 2,740,852 | (1,326,250 | ) | 1,414,602 | ||||||||
| Plant and Equipment | 37,671,980 | (19,802,307 | ) | 17,869,673 | ||||||||
| IT Equipment | 451,313 | (449,249 | ) | 2,064 | ||||||||
| Motor vehicles | 7,298,422 | (5,966,204 | ) | 1,332,218 | ||||||||
| Others | 8,563,639 | (7,844,919 | ) | 718,720 | ||||||||
| Total | 56,726,206 | (35,388,929 | ) | 21,337,277 | ||||||||
TableLease liabilities interest expenses at the closing of Contentsthe period reached CLP 2,047,387 thousand
|
| Construction in |
| Land |
| Buildings, net |
| Plant and |
| IT Equipment, |
| Fixed facilities |
| Vehicles, net |
| Leasehold |
| Other, |
| Property, plant |
|
|
| ThCh$ |
| ThCh$ |
| ThCh$ |
| ThCh$ |
| ThCh$ |
| ThCh$ |
| ThCh$ |
| ThCh$ |
| ThCh$ |
| ThCh$ |
|
|
|
|
|
|
|
|
|
|
|
|
|
|
|
|
|
|
|
|
|
|
|
Opening balance at January 1, 2014 |
| 36,544,802 |
| 76,063,090 |
| 151,816,612 |
| 240,721,094 |
| 5,584,185 |
| 33,207,964 |
| 15,121,864 |
| 567,041 |
| 133,323,156 |
| 692,949,808 |
|
Additions |
| 61,749,644 |
| — |
| 2,689,039 |
| 46,090,966 |
| 403,941 |
| 196,726 |
| 921,557 |
| — |
| 13,661,737 |
| 125,713,610 |
|
Disposals |
| (16,668 | ) | (109,252 | ) | (22,864 | ) | (3,017,160 | ) | (1,296 | ) | (1,940 | ) | (51,126 | ) | — |
| (1,299,940 | ) | (4,520,246 | ) |
Transfers between items of property, plant and equipment |
| (71,807,784 | ) | — |
| 22,189,920 |
| 13,217,587 |
| 920,853 |
| (5,762,142 | ) | 4,710,288 |
| — |
| 36,531,278 |
| — |
|
Depreciation expense |
| — |
| — |
| (5,510,350 | ) | (37,943,247 | ) | (2,020,178 | ) | (1,818,210 | ) | (4,661,508 | ) | (132,184 | ) | (47,832,641 | ) | (99,918,318 | ) |
Increase (decrease) due to foreign currency translation differences |
| (912,128 | ) | 1,004,086 |
| 568,887 |
| (1,733,312 | ) | 54,839 |
| (766,851 | ) | 206,760 |
| 11,208 |
| 9,964,653 |
| 8,398,142 |
|
Other increase (decrease) |
| (35,807 | ) | (76 | ) | 327,203 |
| (4,097,095 | ) | (120,488 | ) | — |
| (78,052 | ) | 55 |
| (5,543,451 | ) | (9,547,711 | ) |
Total movements |
| (11,022,743 | ) | 894,758 |
| 20,241,835 |
| 12,517,739 |
| (762,329 | ) | (8,152,417 | ) | 1,047,919 |
| (120,921 | ) | 5,481,636 |
| 20,125,477 |
|
Ending balance at December 31, 2014 |
| 25,522,059 |
| 76,957,848 |
| 172,058,447 |
| 253,238,833 |
| 4,821,856 |
| 25,055,547 |
| 16,169,783 |
| 446,120 |
| 138,804,792 |
| 713,075,285 |
|
| (2) | Corresponds mainly to the effect of adopting IAS 29 in Argentina |
| Construction in progress | Land | Buildings, net | Plant and equipment, net | IT equipment net | Fixed facilities and accessories, net | Vehicles, net | Leasehold improvements, net | Others | Rights-of-use | Property, plant & equipment, net | ||||||||||||||||||||||||||||||||||
| ThCh$ | ThCh$ | ThCh$ | ThCh$ | ThCh$ | ThCh$ | ThCh$ | ThCh$ | ThCh$ | ThCh$ | ThCh$ | ||||||||||||||||||||||||||||||||||
| Opening balance at January 1, 2019 | 26,048,670 | 100,479,196 | 214,160,351 | 207,403,985 | 5,184,721 | 21,057,169 | 21,798,601 | 32,177 | 114,606,098 | - | 710,770,968 | |||||||||||||||||||||||||||||||||
| Additions | 49,134,461 | - | 749,800 | 11,582,259 | 675,974 | 7,271 | (342,001 | ) | 1,309 | 32,640,210 | - | 94,449,283 | ||||||||||||||||||||||||||||||||
| Right-of use additions (3) | - | - | - | - | - | - | - | - | - | 21,721,728 | 21,721,728 | |||||||||||||||||||||||||||||||||
| Disposals | (8,761 | ) | - | (5,902 | ) | (352,204 | ) | (977 | ) | (8,911 | ) | (52,095 | ) | (155 | ) | (1,135,304 | ) | - | (1,564,309 | ) | ||||||||||||||||||||||||
| Transfers between items of Property, plant and equipment | (48,358,902 | ) | 2,268,316 | 430,971 | 20,735,065 | 1,019,048 | 1,379,012 | 7,650,847 | 65,250 | 14,810,393 | - | - | ||||||||||||||||||||||||||||||||
| Right-of-use transfers | (25,991 | ) | - | (266,007 | ) | (13,788,120 | ) | (23,712 | ) | - | (1,181,465 | ) | - | (2,520,405 | ) | 17,805,700 | - | |||||||||||||||||||||||||||
| Depreciation expense | - | - | (7,681,481 | ) | (37,572,910 | ) | (1,949,851 | ) | (2,977,512 | ) | (6,267,039 | ) | (30,737 | ) | (42,410,016 | ) | (98,889,546 | ) | ||||||||||||||||||||||||||
| Amortization (2) | - | - | - | - | - | - | - | - | - | (8,254,568 | ) | (8,254,568 | ) | |||||||||||||||||||||||||||||||
| Increase (decrease) due to foreign currency translation differences | 688,063 | 1,529,526 | 4,685,319 | 3,228,519 | 83,757 | 386,253 | 464,563 | 2,177 | 2,216,555 | 1,024,539 | 14,309,271 | |||||||||||||||||||||||||||||||||
| Other increase (decrease) (1) | (186,959 | ) | (80,284 | ) | (99,276 | ) | (5,883,370 | ) | 12,885 | (1 | ) | (110,264 | ) | - | (3,423,128 | ) | (53,567 | ) | (9,823,964 | ) | ||||||||||||||||||||||||
| Total movements | 1,241,911 | 3,717,558 | (2,186,576 | ) | (22,050,761 | ) | (182,876 | ) | (1,213,888 | ) | 162,546 | 37,844 | 178,305 | 32,243,832 | 11,947,895 | |||||||||||||||||||||||||||||
| Ending balance at December 31, 2019 | 27,290,581 | 104,196,754 | 211,973,775 | 185,353,224 | 5,001,845 | 19,843,281 | 21,961,147 | 70,021 | 114,784,403 | 32,243,832 | 722,718,863 | |||||||||||||||||||||||||||||||||
| (1) | Mainly correspond to effects of IAS 29 in Argentina, |
| (2) | Of the total of CLP 8,254,568 thousand recorded as amortization for the current period, CLP 5,994,037 thousand correspond to right-of-use amortization arising from the adoption of the IFRS, effective beginning on January 1, 2019, The remaining CLP 2,260,531 thousand correspond to depreciation (today amortization) of goods acquired under the financial lease method, which until December 31, 2018 were classified and valued pursuant to the accounting criteria of property, plant and equipment, |
| (3) | For IFRS 16 adoption |
| Construction in progress | Land | Buildings, net | Plant and equipment, net | IT Equipment, net | Fixed facilities and accessories, net | Vehicles, net | Leasehold improvements, net | Other, net | Property, plant and equipment, net | |||||||||||||||||||||||||||||||
| ThCh$ | ThCh$ | ThCh$ | ThCh$ | ThCh$ | ThCh$ | ThCh$ | ThCh$ | ThCh$ | ThCh$ | |||||||||||||||||||||||||||||||
| Opening balance at January 1, 2018 | 84,118,716 | 96,990,155 | 162,385,848 | 155,833,080 | 4,627,325 | 19,589,877 | 29,263,265 | 7,415 | 106,934,818 | 659,750,499 | ||||||||||||||||||||||||||||||
| Additions | 65,284,334 | - | 504,675 | 17,924,606 | 783,299 | 165,226 | 1,451,462 | 1,430 | 42,793,277 | 128,908,309 | ||||||||||||||||||||||||||||||
| Disposals | - | (5,465 | ) | (209,713 | ) | (1,002,133 | ) | - | - | (203,036 | ) | - | (1,588,050 | ) | (3,008,397 | ) | ||||||||||||||||||||||||
| Transfers between items of Property, plant and equipment | (109,893,610 | ) | - | 45,032,440 | 54,460,571 | 622,222 | 1,481,081 | (2,218,354 | ) | 22,000 | 10,493,650 | - | ||||||||||||||||||||||||||||
| Depreciation expense | - | - | (7,001,828 | ) | (39,182,401 | ) | (1,830,295 | ) | (2,668,535 | ) | (5,201,263 | ) | (11,112 | ) | (41,727,195 | ) | (97,622,629 | ) | ||||||||||||||||||||||
| Increase (decrease) due to foreign currency translation differences | (6,880,059 | ) | (4,615,830 | ) | (14,485,709 | ) | (17,048,903 | ) | (414,850 | ) | (4,048,135 | ) | (1,722,767 | ) | 169 | (16,954,922 | ) | (66,171,006 | ) | |||||||||||||||||||||
| Other increase (decrease) (1) | (6,580,711 | ) | 8,110,336 | 27,9g34,638 | 36,419,165 | 1,397,020 | 6,537,655 | 429,294 | 12,275 | 14,654,520 | 88,914,192 | |||||||||||||||||||||||||||||
| Total movements | (58,070,046 | ) | 3,489,041 | 51,774,503 | 51,570,905 | 557,396 | 1,467,292 | (7,464,664 | ) | 24,762 | 7,671,280 | 51,020,469 | ||||||||||||||||||||||||||||
| Ending balance at December 31, 2018 | 26,048,670 | 100,479,196 | 214,160,351 | 207,403,985 | 5,184,721 | 21,057,169 | 21,798,601 | 32,177 | 114,606,098 | 710,770,968 | ||||||||||||||||||||||||||||||
(1) Mainly correspond to the effects of adopting IAS 29 in Argentina,
|
| Construction in |
| Land |
| Buildings, net |
| Plant and |
| IT Equipment, net |
| Fixed facilities |
| Vehicles, net |
| Leasehold |
| Other property, |
| Property, plant and |
|
|
| ThCh$ |
| ThCh$ |
| ThCh$ |
| ThCh$ |
| ThCh$ |
| ThCh$ |
| ThCh$ |
| ThCh$ |
| ThCh$ |
| ThCh$ |
|
|
|
|
|
|
|
|
|
|
|
|
|
|
|
|
|
|
|
|
|
|
|
Opening balance at January 1, 2013 |
| 61,735,710 |
| 57,134,715 |
| 131,779,399 |
| 176,179,349 |
| 5,800,223 |
| 24,838,592 |
| 7,835,697 |
| 9,422 |
| 111,237,618 |
| 576,550,725 |
|
Additions |
| 99,023,742 |
| 13,048,106 |
| 5,123,731 |
| 16,777,829 |
| 469,280 |
| 479,487 |
| 1,097,294 |
| 7,535 |
| 43,207,810 |
| 179,234,814 |
|
Disposals |
| — |
| (733,044 | ) | (230,659 | ) | (2,198,991 | ) | (213 | ) | (700,111 | ) | — |
| — |
| (2,030,783 | ) | (5,893,801 | ) |
Transfers between items of property, plant and equipment |
| (120,904,100 | ) | (182,817 | ) | 16,005,001 |
| 61,071,686 |
| 1,666,511 |
| 10,979,455 |
| 6,629,711 |
| 639,213 |
| 24,095,340 |
| — |
|
Transfer to investment property |
| — |
| — |
| — |
| (1,565,232 | ) | — |
| — |
| — |
| — |
| — |
| (1,565,232 | ) |
Additions from business combinations (1) |
| 18,282 |
| 9,124,967 |
| 13,469,878 |
| 25,832,574 |
| 551,976 |
| — |
| 2,027,699 |
| — |
| 7,692,513 |
| 58,717,889 |
|
Depreciation expense |
| — |
| — |
| (3,912,718 | ) | (28,448,397 | ) | (1,694,902 | ) | (2,346,228 | ) | (2,153,714 | ) | (89,976 | ) | (42,943,717 | ) | (81,589,652 | ) |
Increase (decrease) due to foreign currency translation differences |
| (3,319,254 | ) | (1,389,534 | ) | (8,451,502 | ) | (5,130,748 | ) | (150,635 | ) | 2,412,608 |
| (313,103 | ) | 847 |
| (3,345,472 | ) | (19,686,793 | ) |
Other increase (decrease) |
| (9,578 | ) | (939,303 | ) | (1,966,518 | ) | (1,796,976 | ) | (1,058,055 | ) | (2,455,839 | ) | (1,720 | ) | — |
| (4,590,153 | ) | (12,818,142 | ) |
Total movements |
| (25,190,908 | ) | 18,928,375 |
| 20,037,213 |
| 64,541,745 |
| (216,038 | ) | 8,369,372 |
| 7,286,167 |
| 557,619 |
| 22,085,538 |
| 116,399,083 |
|
Ending balance at December 31, 2013 |
| 36,544,802 |
| 76,063,090 |
| 151,816,612 |
| 240,721,094 |
| 5,584,185 |
| 33,207,964 |
| 15,121,864 |
| 567,041 |
| 133,323,156 |
| 692,949,808 |
|
(1) Corresponds to balances incorporated as of October 11, 2013, resulting from the acquisition of Companhia de Bebidas Ipiranga, pursuant to the description in Note 3b).
NOTE 12 — – RELATED PARTY DISCLOSURESPARTIES
Balances and main transactions with related parties as of December 31, 2015 and 2014 are detailed as follows:follows:
12.1Accounts receivable:receivable:
12.1.1Current:
Taxpayer ID |
| Company |
| Relationship |
| Country |
| Currency |
| 12.31.2015 |
| 12.31.2014 |
|
|
|
|
|
|
|
|
|
|
| ThCh$ |
| ThCh$ |
|
|
|
|
|
|
|
|
|
|
|
|
|
|
|
96.891.720-K |
| Embonor S.A. |
| Related to Shareholder |
| Chile |
| Chilean pesos |
| 4,417,016 |
| 5,629,383 |
|
96.517.210-2 |
| Embotelladora Iquique S.A. |
| Related to Shareholder |
| Chile |
| Chilean pesos |
| 177,329 |
| 359,933 |
|
96.919.980-7 |
| Cervecería Austral S.A. |
| Related to director |
| Chile |
| Dollars |
| 14,873 |
| 4,847 |
|
77.755.610-k |
| Comercial Patagona Ltda. |
| Related to director |
| Chile |
| Chilean pesos |
| 1,282 |
| 290 |
|
|
|
|
| Total |
|
|
|
|
| 4,610,500 |
| 5,994,453 |
|
12.1.2Non current:
| 12.31.2020 | 12.31.2019 | ||||||||||||||||||||||||||||||||||||||||
Taxpayer ID |
| Company |
| Relationship |
| Country |
| Currency |
| 12.31.2015 |
| 12.31.2014 |
| Company | Relationship | Country | Currency | Current | Non-Current | Current | Non-Current | ||||||||||||||||||||
|
|
|
|
|
|
|
|
|
| ThCh$ |
| ThCh$ |
| ThCh$ | ThCh$ | ThCh$ | ThCh$ | ||||||||||||||||||||||||
| 96.891.720-K | Embonor S.A. | Shareholder related | Chile | CLP | 3,643,603 | - | 6,589,539 | - | |||||||||||||||||||||||||||||||||
| 96.714.870-9 | Coca-Cola de Chile S.A. | Shareholder | Chile | CLP | 16,024 | 138,346 | 14,839 | 283,118 | |||||||||||||||||||||||||||||||||
| Foreign | Coca Cola de Argentina | Director related | Argentina | ARS | 4,558,753 | - | 1,203,389 | - | |||||||||||||||||||||||||||||||||
| Foreign | Alimentos de Soja S.A.U. | Shareholder related | Argentina | ARS | 308,882 | - | 428,802 | - | |||||||||||||||||||||||||||||||||
| 96.517.210-2 | Embotelladora Iquique S.A. | Shareholder related | Chile | CLP | 292,801 | - | 278,176 | - | |||||||||||||||||||||||||||||||||
| 86.881.400-4 | Envases CMF S.A. | Associate | Chile | CLP | 773,732 | - | 217,510 | - | |||||||||||||||||||||||||||||||||
| 96.919.980-7 | Cervecería Austral S.A. | Director related | Chile | USD | - | - | 45,644 | - | |||||||||||||||||||||||||||||||||
| 77.755.610-K | Comercial Patagona Ltda. | Director related | Chile | CLP | - | - | 3,872 | - | |||||||||||||||||||||||||||||||||
| 77.526.480-2 | Comercializadora Nova Verde | Common shareholder | Chile | CLP | 837,837 | - | - | - | |||||||||||||||||||||||||||||||||
| 76.572.588-7 | Coca Cola del Valle New Ventures S.A. | Associate | Chile | CLP | 1,401,898 | - | 2,003,203 | - | |||||||||||||||||||||||||||||||||
| 76.140.057-6 | Monster | Associate | Chile | CLP | 41,878 | - | 50,794 | - | |||||||||||||||||||||||||||||||||
|
|
|
|
|
|
|
|
|
|
|
|
|
| Total | 11,875,408 | 138,346 | 10,835,768 | 283,118 | |||||||||||||||||||||||
96.714.870-9 |
| Coca-Cola de Chile S.A. |
| Shareholder |
| Chile |
| Chilean pesos |
| 14,732 |
| 24,752 |
| ||||||||||||||||||||||||||||
|
|
|
|
|
|
|
|
|
|
|
|
|
| ||||||||||||||||||||||||||||
|
|
|
| Total |
|
|
|
|
| 14,732 |
| 24,752 |
| ||||||||||||||||||||||||||||
12.2Accounts payable:
12.2.1Current:
| 12.31.2020 | 12.31.2019 | ||||||||||||||||||||||||||||||||||||||||
Taxpayer ID |
| Company |
| Relationship |
| Country |
| Currency |
| 12.31.2015 |
| 12.31.2014 |
| Company | Relationship | Country | Currency | Current | Non-Current | Current | Non-Current | ||||||||||||||||||||
|
|
|
|
|
|
|
|
|
| ThCh$ |
| ThCh$ |
| CLP (000’S) | CLP (000’S) | CLP (000’S) | CLP (000’S) | ||||||||||||||||||||||||
|
|
|
|
|
|
|
|
|
|
|
|
|
| ||||||||||||||||||||||||||||
Foreign |
| Recofarma do Industrias Amazonas Ltda. |
| Related to Shareholder |
| Brazil |
| Brazilian real |
| 13,394,625 |
| 13,482,012 |
| ||||||||||||||||||||||||||||
96.714.870-9 |
| Coca-Cola de Chile S.A. |
| Shareholder |
| Chile |
| Chilean pesos |
| 12,765,952 |
| 14,076,916 |
| Coca-Cola de Chile S.A. | Shareholder | Chile | CLP | 18,897,093 | - | 20,555,135 | - | ||||||||||||||||||||
Foreign |
| Leao Alimentos e Bebidas Ltda. |
| Associate |
| Brazil |
| Brazilian real |
| 7,614,888 |
| 10,356,646 |
| ||||||||||||||||||||||||||||
Foreign |
| Servicio y Productos para Bebidas Refrescantes S.R.L. |
| Shareholder |
| Argentina |
| Argentine pesos |
| 6,824,553 |
| 5,831,334 |
| Recofarma do Indústrias Amazonas Ltda. | Shareholder related | Brazil | BRL | 7,926,109 | 10,790,089 | 14,888,934 | 19,777,812 | ||||||||||||||||||||
86.881.400-4 |
| Envases CMF S.A. |
| Associate |
| Chile |
| Chilean pesos |
| 5,534,367 |
| 6,281,874 |
| Envases CMF S.A. | Associate | Chile | CLP | 3,856,973 | - | 6,359,797 | - | ||||||||||||||||||||
Foreign |
| Coca-Cola Perú |
| Related to Shareholder |
| Perú |
| Dollars |
| 2,194,644 |
| 5,354,145 |
| Ser. y Prod. para Bebidas Refrescantes S.R.L. | Shareholder | Argentina | ARS | 4,848,196 | - | 5,887,070 | - | ||||||||||||||||||||
| Foreign | Leão Alimentos e Bebidas Ltda. | Associate | Brazil | BRL | 1,323,609 | - | 1,841,377 | - | |||||||||||||||||||||||||||||||||
| Foreign | Monster Energy Brasil Com de Bebidas Ltda. | Shareholder related | Brazil | BRL | 1,156,786 | - | 827,300 | - | |||||||||||||||||||||||||||||||||
| 76.572.588-7 | Coca Cola del Valle New Ventures S.A. | Associate | Chile | CLP | 490,758 | - | 1,247,961 | - | |||||||||||||||||||||||||||||||||
89.996.200-1 |
| Envases del Pacífico S.A. |
| Related to director |
| Chile |
| Chilean pesos |
| 323,798 |
| 583,862 |
| Envases del Pacífico S.A. | Director related | Chile | CLP | 3,414 | - | 25,202 | - | ||||||||||||||||||||
| 96.891.720-K | Embonor S.A. | Shareholder related | Chile | CLP | 118,314 | - | 275,565 | - | |||||||||||||||||||||||||||||||||
| Foreign | Alimentos de Soja S.A.U. | Shareholder related | Argentina | ARS | 402,581 | - | 929,986 | - | |||||||||||||||||||||||||||||||||
| 77.526.480-2 | Comercializadora Nova Verde | Common shareholder | Chile | CLP | 518,135 | - | 765,521 | - | |||||||||||||||||||||||||||||||||
| Foreign | Coca Cola Panamá | Shareholder related | Panamá | USD | - | - | 7,739 | - | |||||||||||||||||||||||||||||||||
| Foreign | Sorocaba Refrescos S.A. | Associate | Brazil | BRL | - | - | 26,014 | - | |||||||||||||||||||||||||||||||||
|
|
|
|
|
|
|
|
|
|
|
|
|
| Total | 39,541,968 | 10,790,089 | 53,637,601 | 19,777,812 | |||||||||||||||||||||||
|
|
|
| Total |
|
|
|
|
| 48,652,827 |
| 55,966,789 |
| ||||||||||||||||||||||||||||
F-54

12.3 Transactions:
| Taxpayer ID | Company | Relationship | Country | Transaction Description | Currency | Accumulated 12.31.2020 | Accumulated 12.31.2019 | |||||||||||||||
| CLP (000’s) | CLP (000’s) | |||||||||||||||||||||
| 96.714.870-9 | Coca-Cola de Chile S.A. | Shareholder | Chile | Concentrate purchase | CLP | 139,193,479 | 150,548,253 | |||||||||||||||
| 96.714.870-9 | Coca-Cola de Chile S.A. | Shareholder | Chile | Advertising services purchase | CLP | 2,890,638 | 4,369,500 | |||||||||||||||
| 96.714.870-9 | Coca-Cola de Chile S.A. | Shareholder | Chile | Water source lease | CLP | 3,847,817 | 5,324,194 | |||||||||||||||
| 96.714.870-9 | Coca-Cola de Chile S.A. | Shareholder | Chile | Sale of raw materials and others | CLP | 1,169,944 | 1,196,793 | |||||||||||||||
| 86.881.400-4 | Envases CMF S.A. | Associate | Chile | Purchase of bottles | CLP | 12,210,449 | 19,422,280 | |||||||||||||||
| 86.881.400-4 | Envases CMF S.A. | Associate | Chile | Raw material purchase | CLP | 16,055,991 | 16,814,062 | |||||||||||||||
| 86.881.400-4 | Envases CMF S.A. | Associate | Chile | Purchase of caps | CLP | 91,778 | 281,174 | |||||||||||||||
| 86.881.400-4 | Envases CMF S.A. | Associate | Chile | Purchase of services and others | CLP | 520,221 | 6,425,579 | |||||||||||||||
| 86.881.400-4 | Envases CMF S.A. | Associate | Chile | Sale of services and others | CLP | 1,578 | - | |||||||||||||||
| 86.881.400-4 | Envases CMF S.A. | Associate | Chile | Purchase of packaging | CLP | 5,992,443 | 521,466 | |||||||||||||||
| 86.881.400-4 | Envases CMF S.A. | Associate | Chile | Sale of finished products | CLP | 2,380,574 | - | |||||||||||||||
| 86.881.400-4 | Envases CMF S.A. | Associate | Chile | Sale of packaging/raw materials | CLP | 6,344,834 | 6,132,091 | |||||||||||||||
| 96.891.720-K | Embonor S.A. | Shareholder related | Chile | Sale of finished products | CLP | 44,982,749 | 50,315,292 | |||||||||||||||
| 96.891.720-K | Embonor S.A. | Shareholder related | Chile | Sale of services and others | CLP | 447,092 | 268,526 | |||||||||||||||
| 96.891.720-K | Embonor S.A. | Shareholder related | Chile | Sale of raw material and material | CLP | 197,288 | 212,517 | |||||||||||||||
| 96.891.720-K | Embonor S.A. | Shareholder related | Chile | Minimum Dividend | CLP | 118,314 | - | |||||||||||||||
| 96.517.310-2 | Embotelladora Iquique S.A. | Shareholder related | Chile | Sale of finished products | CLP | 167,430 | 3,208,559 | |||||||||||||||
| 89.996.200-1 | Envases del Pacífico S.A. | Director related | Chile | Raw material and material purchase | CLP | 427 | 93,117 | |||||||||||||||
| Foreign | Recofarma do Indústrias Amazonas Ltda. | Shareholder related | Brazil | Concentrate purchase | BRL | 71,959,416 | 91,426,935 | |||||||||||||||
| Foreign | Recofarma do Indústrias Amazonas Ltda. | Shareholder related | Brazil | Reimbursements and other purchases | BRL | 220,708 | 5,977,419 | |||||||||||||||
| Foreign | Serv. y Prod. para Bebidas Refrescantes S.R.L. | Shareholder related | Argentina | Concentrate purchase | ARS | 81,198,463 | 97,321,567 | |||||||||||||||
| Foreign | Serv. y Prod. para Bebidas Refrescantes S.R.L. | Shareholder related | Argentina | Advertising participation | ARS | 6,395,881 | 4,111,764 | |||||||||||||||
| Foreign | KAIK Participações | Associate | Brazil | Reimbursements and other purchases | BRL | 14,162 | 39,382 | |||||||||||||||
| Foreign | Sorocaba Refrescos S.A. | Associate | Brazil | Product purchase | BRL | 3,671,472 | 1,049,709 | |||||||||||||||
| 89.862.200-2 | Latam Airlines Group S.A. | Director related | Chile | Product purchase | CLP | 85,140 | - | |||||||||||||||
| 76.572.588-7 | Coca Cola Del Valle New Ventures S.A. | Associate | Chile | Sale of services and others | CLP | 397,659 | 3,959,962 | |||||||||||||||
| 76.572.588-7 | Coca Cola Del Valle New Ventures S.A. | Associate | Chile | Purchase of services and others | CLP | 4,410,223 | - | |||||||||||||||
| Foreign | Alimentos de Soja S.A.U. | Shareholder related | Argentina | Payment of fees and services | ARS | 1,373,594 | 802,563 | |||||||||||||||
| Foreign | Alimentos de Soja S.A.U. | Shareholder related | Argentina | Product purchase | ARS | 80,761 | 4,274,236 | |||||||||||||||
| 77526480-2 | Comercializadora Novaverde S.A. | Common shareholder | Chile | Sale of raw materials | CLP | 10,914 | - | |||||||||||||||
| 77526480-2 | Comercializadora Novaverde S.A. | Common shareholder | Chile | Sale of finished products | CLP | 2,050,156 | - | |||||||||||||||
| 77526480-2 | Comercializadora Novaverde S.A. | Common shareholder | Chile | Sale of services and others | CLP | 459,707 | - | |||||||||||||||
| 77526480-2 | Comercializadora Novaverde S.A. | Common shareholder | Chile | Raw material purchase | CLP | 1,009,547 | - | |||||||||||||||
12.3 Transactions:
|
|
|
|
|
|
| |||||||
| |||||||||||||
|
|
|
|
|
|
| |||||||
|
|
|
|
|
|
| |||||||
|
|
|
|
|
|
| |||||||
|
|
|
|
|
|
| |||||||
|
|
|
|
|
|
| |||||||
|
|
|
|
|
|
| |||||||
|
|
|
|
|
|
| |||||||
|
|
|
|
|
|
| |||||||
|
|
|
|
|
|
| |||||||
|
|
|
|
|
|
| |||||||
|
|
|
|
|
|
| |||||||
|
|
|
|
|
|
| |||||||
|
|
|
|
|
|
| |||||||
|
|
|
|
|
|
| |||||||
|
|
|
|
|
|
| |||||||
|
|
|
|
|
|
| benefits received by key management |
|
|
|
|
|
|
| |||||||
| |||||||||||||
|
|
|
|
|
|
| |||||||
|
|
|
|
|
|
| |||||||
|
|
|
|
|
|
| |||||||
|
|
|
|
|
|
| |||||||
|
|
|
|
|
|
| |||||||
|
|
|
|
|
|
| |||||||
|
|
|
|
|
|
| |||||||
|
|
|
|
|
|
| |||||||
|
|
|
|
|
|
| |||||||
|
|
|
|
|
|
| |||||||
|
|
|
|
|
|
| |||||||
|
|
|
|
|
|
| |||||||
|
|
|
|
|
|
| |||||||
|
|
|
|
|
|
| |||||||
|
|
|
|
|
|
| |||||||
|
|
|
|
|
|
|
|
|
|
|
|
|
| |||||||
| |||||||||||||
|
|
|
|
|
|
| |||||||
|
|
|
|
|
|
| |||||||
|
|
|
|
|
|
| |||||||
|
|
|
|
|
|
| |||||||
|
|
|
|
|
|
| |||||||
|
|
|
|
|
|
| |||||||
|
|
|
|
|
|
| |||||||
|
|
|
|
|
|
| |||||||
|
|
|
|
|
|
| |||||||
|
|
|
|
|
|
| |||||||
|
|
|
|
|
|
| |||||||
|
|
|
|
|
|
| |||||||
|
|
|
|
|
|
| |||||||
|
|
|
|
|
|
| |||||||
|
|
|
|
|
|
| |||||||
|
|
|
|
|
|
| |||||||
|
|
|
|
|
|
| |||||||
|
|
|
|
|
|
| |||||||
|
|
|
|
|
|
| |||||||
|
|
|
|
|
|
| |||||||
|
|
|
|
|
|
| |||||||
|
|
|
|
|
|
| |||||||
|
|
|
|
|
|
| |||||||
|
|
|
|
|
|
|
12.4Key management compensation
Salaries and benefits paid to the Company’s key management personnel including directors and managers are detailed as follows:
Description |
| 12.31.2015 |
| 12.31.2014 |
| 12.31.2013 |
| 12.31.2020 | 12.31.2019 | 12.31.2018 | |||||||||
|
| ThCh$ |
| ThCh$ |
| ThCh$ |
| ThCh$ | ThCh$ | ThCh$ | |||||||||
Executive wages, salaries and benefits |
| 6,412,238 |
| 5,296,344 |
| 4,965,149 |
| 7,464,071 | 6,267,936 | 6,056,337 | |||||||||
Director allowances |
| 1,512,000 |
| 1,512,000 |
| 1,512,000 |
| 1,479,420 | 1,512,000 | 1,495,123 | |||||||||
Contract termination benefits |
| 192,920 |
| 327,000 |
| — |
| ||||||||||||
Accrued benefits during the last five years and paid during the period |
| 257,683 |
| 1,030,990 |
| 196,819 |
| ||||||||||||
| Benefit accrued in the last five years and paid during the fiscal year | 297,072 | 305,674 | 242,907 | ||||||||||||||||
| Benefit for contract termination | 115,341 | 54,819 | 51,534 | ||||||||||||||||
Total |
| 8,374,841 |
| 8,166,334 |
| 6,673,968 |
| 9,355,904 | 8,140,429 | 7,845,901 | |||||||||
NOTE 13 — – CURRENTCURRENT AND NON-CURRENT EMPLOYEE BENEFITS
Composition of employeeEmployee benefits is the following:are detailed as follows:
Description |
| 12.31.2015 |
| 12.31.2014 |
| 12.31.2020 | 12.31.2019 | ||||||
|
| ThCh$ |
| ThCh$ |
| ThCh$ | ThCh$ | ||||||
Accrued vacations |
| 18,025,589 |
| 17,363,565 |
| ||||||||
Employee remuneration payable |
| 13,765,170 |
| 10,383,180 |
| ||||||||
| Accrued vacation | 14,650,267 | 17,584,587 | |||||||||||
| Participation in profits and bonuses | 15,969,735 | 20,896,357 | |||||||||||
Indemnities for years of service |
| 8,230,030 |
| 8,125,107 |
| 14,086,575 | 10,085,264 | ||||||
Total |
| 40,020,789 |
| 35,871,852 |
| 44,706,577 | 48,566,208 | ||||||
| ThCh$ | ThCh$ | ||||||||||||
| Current | 31,071,019 | 38,392,854 | |||||||||||
| Non-current | 13,635,558 | 10,173,354 | |||||||||||
| Total | 44,706,577 | 48,566,208 | |||||||||||
|
| ThCh$ |
| ThCh$ |
|
Current |
| 31,790,759 |
| 27,746,745 |
|
Non-current |
| 8,230,030 |
| 8,125,107 |
|
Total |
| 40,020,789 |
| 35,871,852 |
|
13.1Pensions and post-employment benefitsIndemnities for years of service
This item represents post employment benefits which are determined as stated in Note 2.17.
The movements of post-employmentemployee benefits, for the periods ended December 31, 2015 and 2014valued pursuant to Note 2 are detailed as follows:
Movements |
| 12.31.2015 |
| 12.31.2014 |
| 12.31.2020 | 12.31.2019 | ||||||
|
| ThCh$ |
| ThCh$ |
| ||||||||
|
|
|
|
|
| ThCh$ | ThCh$ | ||||||
Opening balance |
| 8,125,107 |
| 8,758,111 |
| 10,085,264 | 9,415,541 | ||||||
Service costs |
| 2,022,010 |
| 1,385,620 |
| 1,675,492 | 784,984 | ||||||
Interest costs |
| 192,145 |
| 199,314 |
| 369,332 | 354,471 | ||||||
Net actuarial losses |
| 901,171 |
| 342,990 |
| ||||||||
| Actuarial losses | 3,127,398 | (210,956 | ) | ||||||||||
Benefits paid |
| (3,010,403 | ) | (2,560,928 | ) | (1,170,911 | ) | (258,776 | ) | ||||
Total |
| 8,230,030 |
| 8,125,107 |
| 14,086,575 | 10,085,264 | ||||||
F-56
13.1.1
13.1.1 Assumptions
The actuarial assumptions used at December 31, 2015 and 2014 were:are detailed as follows:
Assumptions |
| 12.31.2015 |
| 12.31.2014 |
| 12.31.2020 | 12.31.2019 | ||||||
|
|
|
|
|
| ||||||||
Discount rate |
| 2.7% |
| 2.7% |
| -0.05 | % | 2.7 | % | ||||
Expected salary increase rate |
| 2.0% |
| 2.0% |
| 2.0 | % | 2.0 | % | ||||
Turnover rate |
| 5.4% |
| 5.4% |
| 7.68 | % | 5.4 | % | ||||
Mortality rate (1) |
| RV-2009 |
| RV-2009 |
| ||||||||
| Mortality rate | RV-2014 | RV-2014 | |||||||||||
Retirement age of women |
| 60 years |
| 60 years |
| 60 years | 60 years | ||||||
Retirement age of men |
| 65 years |
| 65 years |
| 65 years | 65 years | ||||||
(1) Mortality assumption tables prescribed for use by the Chilean Superintendence of Securities and Insurance.13.2 Personnel expenses
13.2Personnel expenses
Personnel expenses included in the consolidated statement of income statement are as follows:follows:
Description |
| 12.31.2015 |
| 12.31.2014 |
| 12.31.2013 |
| 12.31.2020 | 12.31.2019 | 12.31.2018 | |||||||||
|
| ThCh$ |
| ThCh$ |
| ThCh$ |
| ||||||||||||
|
|
|
|
|
|
|
| ThCh$ | ThCh$ | ThCh$ | |||||||||
Wages and salaries |
| 230,854,998 |
| 197,343,949 |
| 164,138,911 |
| 187,600,163 | 194,740,646 | 195,162,903 | |||||||||
Employee benefits |
| 48,977,105 |
| 47,424,162 |
| 36,190,649 |
| 48,504,899 | 58,005,213 | 50,254,164 | |||||||||
Severance and post-employment benefits |
| 6,217,204 |
| 7,154,581 |
| 4,519,576 |
| ||||||||||||
| Severance benefits | 3,238,966 | 6,987,184 | 5,535,410 | ||||||||||||||||
Other personnel expenses |
| 10,561,935 |
| 12,721,326 |
| 9,334,468 |
| 12,993,234 | 13,389,967 | 16,014,364 | |||||||||
Total |
| 296,611,242 |
| 264,644,018 |
| 214,183,604 |
| 252,337,262 | 273,123,010 | 266,966,841 | |||||||||
13.3Number of Employees
F-57
Description |
| 12.31.2015 |
| 12.31.2014 |
| 12.31.2013 |
|
Number of employees |
| 16,525 |
| 16,136 |
| 16,587 |
|
Number of average employees |
| 15,504 |
| 15,703 |
| 15,913 |
|
NOTE 14 — – INVESTMENTS IN ASSOCIATES ACCOUNTED FOR USING THE EQUITY METHOD
14.1Balances
Investments in associates using equity method of accounting are detailed as follows:
|
|
|
| Country of |
| Functional |
| Carrying Value |
| Percentage interest |
| ||||
Taxpayer ID |
| Name |
| Incorporation |
| Currency |
| 12.31.2015 |
| 12.31.2014 |
| 12.31.2015 |
| 12.31.2014 |
|
|
|
|
|
|
|
|
| ThCh$ |
| ThCh$ |
| % |
| % |
|
|
|
|
|
|
|
|
|
|
|
|
|
|
|
|
|
86.881.400-4 |
| Envases CMF S.A. (1) |
| Chile |
| Chilean peso |
| 17,793,783 |
| 17,684,657 |
| 50.00 | % | 50.00 | % |
Foreign |
| Leao Alimentos e Bebidas Ltda. (2) |
| Brazil |
| Brazilian real |
| 12,393,777 |
| 14,910,530 |
| 8.82 | % | 8.82 | % |
Foreign |
| Kaik Participacoes Ltda. (2) |
| Brazil |
| Brazilian real |
| 1,106,733 |
| 1,276,042 |
| 11.32 | % | 11.32 | % |
Foreign |
| SRSA Participacoes Ltda. |
| Brazil |
| Brazilian real |
| 231,183 |
| 238,647 |
| 40.00 | % | 40.00 | % |
Foreign |
| Sorocaba Refrescos S.A. |
| Brazil |
| Brazilian real |
| 22,665,070 |
| 31,940,337 |
| 40.00 | % | 40.00 | % |
|
|
|
|
|
|
|
|
|
|
|
|
|
|
|
|
|
| Total |
|
|
|
|
| 54,190,546 |
| 66,050,213 |
|
|
|
|
|
| Investment value | Ownership interest | |||||||||||||||||||||||||||
| Taxpayer ID | Company | Country | Functional currency | 12.31.2020 | 12.31.2019 | 12.31.2020 | 12.31.2019 | |||||||||||||||||||||
| 86.881.400-4 | Envases CMF S.A. (1) | Chile | CLP | 20,185,148 | 18,561,835 | 50.00 | % | 50.00 | % | |||||||||||||||||||
| Foreign | Leão Alimentos e Bebidas Ltda. (2) | Brazil | BRL | 10,628,035 | 17,896,839 | 10.26 | % | 10.26 | % | |||||||||||||||||||
| Foreign | Kaik Participações Ltda. (2) | Brazil | BRL | 979,978 | 1,313,498 | 11.32 | % | 11.32 | % | |||||||||||||||||||
| Foreign | SRSA Participações Ltda. | Brazil | BRL | 48,032 | 65,301 | 40.00 | % | 40.00 | % | |||||||||||||||||||
| Foreign | Sorocaba Refrescos S.A. | Brazil | BRL | 20,976,662 | 24,636,945 | 40.00 | % | 40.00 | % | |||||||||||||||||||
| Foreign | Trop Frutas do Brasil Ltda. (2) | Brazil | BRL | 4,695,228 | 6,250,481 | 7.52 | % | 7.52 | % | |||||||||||||||||||
| 76.572.588.7 | Coca Cola del Valle New Ventures S.A. | Chile | CLP | 30,443,271 | 31,141,834 | 35.00 | % | 35.00 | % | |||||||||||||||||||
| Total | 87,956,354 | 99,866,733 | ||||||||||||||||||||||||||
| (1) | In Envases CMF S.A., regardless of the percentage of ownership interest, it was determined that no controlling interest was held, only a significant influence, given that there was not a majority vote of the Board of Directors to make strategic business decisions. |
| (2) | In these companies, regardless of the ownership interest, it has been defined that the Company has significant influence, given that it has the right to appoint directors. |
F-58
(1) In these company, regardless of the percentage of ownership interest, it was determined that no controlling interest was held, only a significant influence, given that there was not a majority vote of the Board of Directors to make strategic business decisions.
(2) In these companies, regardless of the percentage of ownership interest held, the Company has significant influence, given that it has a representative on each entity’s Board of Directors.
14.214.1 Movement
The movement of investments in associatesother entities accounted for using the equity method is shown below, for the period ended December 31, 2015, 2014 and 2013:below:
Details |
| 12.31.2015 |
| 12.31.2014 |
| 12.31.2013 |
|
|
| ThCh$ |
| ThCh$ |
| ThCh$ |
|
Opening Balance |
| 66,050,213 |
| 68,673,399 |
| 73,080,061 |
|
Investment in Holdfab 2 Soc Participacoes Ltda and SABB in exchange for interest in the new company Leao Alimentos e Bebidas Ltda. |
| — |
| — |
| (19,349,496 | ) |
Increase in interest in new company Leao Alimentos e Bebidas Ltda. By 9.57% |
| — |
| — |
| 18,928,747 |
|
Increase of 1.30% participation in Leao Alimentos e Bebidas Ltda. for acquisition of the Compañía de Bebidas Ipiranga, October 11, 2013. |
| — |
| — |
| 2,089,253 |
|
Dividends received |
| (1,250,000 | ) | (1,590,674 | ) | (2,085,031 | ) |
Variation of minimum dividends from equity investees |
| (217,750 | ) | 149,938 |
| 22,459 |
|
Share in operating income |
| (1,613,839 | ) | 2,169,272 |
| 1,325,518 |
|
Unrealized income |
| 85,266 |
| 85,266 |
| 85,266 |
|
Other decrease investment in associate (Sale participation in Leon Alimentos y Bebidas Ltda.). |
| — |
| (4,194,955 | ) | (3,704,831 | ) |
Other investment increases in associates (Capital Contribution Leão Alimentos e Bebidas Ltda.). |
| 915,070 |
| — |
| — |
|
Deferred tax effect resulting from change in related tax rate in associate |
| — |
| (438,347 | ) | — |
|
Increase (Decrease) due to foreign currency translation differences |
| (9,778,414 | ) | 1,196,314 |
| (1,718,547 | ) |
Ending Balance |
| 54,190,546 |
| 66,050,213 |
| 68,673,399 |
|
| Description | 12.31.2020 | 12.31.2019 | 12.31.2018 | |||||||||
| ThCh$ | ThCh$ | ThCh$ | ||||||||||
| Opening balance | 99,866,733 | 102,410,945 | 86,809,069 | |||||||||
| Other investment increases in associates (Capital contributions to Leão Alimentos e Bebidas Ltda, and Coca-Cola del Valle New Ventures S,A,) | - | - | 15,615,466 | |||||||||
| Dividends received | (1,215,126 | ) | (1,076,491 | ) | (403,414 | ) | ||||||
| Share in operating income | 3,248,680 | (2,495,621 | ) | 2,194,144 | ||||||||
| Amortization unrealized income in associates | (566,422 | ) | (919,462 | ) | 85,268 | |||||||
| Increase (decrease) in foreign currency translation, investments in associates | (13,377,511 | ) | 1,947,362 | (1,889,588 | ) | |||||||
| Ending balance | 87,956,354 | 99,866,733 | 102,410,945 | |||||||||
The main movements for the periods ended 2015, 2014 and 2013 are detailed as follows:explained below:
· During the year ended December 31, 2015, the Company received dividends from its equity investee, Envases CMF S.A. in the amount of ThCh$ 1,250,000 ( ThCh$ 760,037 at December 31, 2014).
| · | In 2020 Leão Alimentos e Bebidas Ltda. recognized the value of a plant at its value of use less the costs of sale, reducing the value previously recognized. Andina recognized as results for the 2020 period a proportional loss of CLP 2,931 million. |
| · | In the 2020 period Sorocaba Refrescos S.A., recognized a tax credit for excluding ICMS from the PIS and COFINS calculation base. Andina recognized as results for the 2020 period a proportional result of CLP 2,134 million. |
| · | Dividends declared in 2020 correspond mainly to Envases CMF S.A |
| · | In December 2019, Leão Alimentos e Bebidas Ltda, performed an impairment provision at its Linhares Plant for BRL 256 million, Andina recognized as results for the 2019 fiscal year, a loss of CLP 4,671 million. |
| · | In 2019 Sorocaba Refrescos S.A., Coca-Cola del Valle and CMF distributed dividends. |
| · | During 2018, Embotelladora Andina S.A. made a capital contribution in Coca-Cola del Valle New Ventures S.A. for CLP 15,615,466 thousand. |
· During 2015 Sorocaba Refrescos S.A. has not distributed dividends. During 2014 it distributed ThCh$830,637 in dividends.
· In October 2015 Leão Alimentos e Bebidas Ltda. carried out a capital increase. Rio de Janeiro Refrescos Ltda. participated in this capital increase regarding its ownership interest for an amount of ThCh$915,070.
· In October 2014, Rio de Janeiro Refrescos Ltda. sold 2.05% of its ownership interest in Leão Alimentos e Bebidas Ltda. for ThCh$4,495,771 generating ThCh$300,816 in earnings which was recognized as a credit in the company’s income statement.
· During the first quarter of 2013, there was a reorganization of the companies that manufacture juice products and mate in Brazil, with the merger of Holdfab2 Participações Ltda., and Sistema de Alimentos de Bebidas Do Brasil Ltda., into a single company that is the legal continuing entity, namely Leao Alimentos e Bebidas Ltda.
14.314.2 Reconciliation of share of profit in investments in associates:
Details |
| 12.31.2015 |
| 12.31.2014 |
| 12.31.2013 |
|
|
| ThCh$ |
| ThCh$ |
| ThCh$ |
|
Share of profit of investment accounted for using the equity method |
| (1,613,839 | ) | 1,730,925 |
| 1,325,518 |
|
|
|
|
|
|
|
|
|
Unrealized earnings in inventory acquired from associates and not sold at the end of period, presented as a discount in the respective asset account (containers and/or inventories) |
| (799,256 | ) | (625,222 | ) | (627,366 | ) |
Amortization of value in CMF S. A |
| 85,266 |
| 85,266 |
| 85,266 |
|
Income Statement Balance |
| (2,327,829 | ) | 1,190,969 |
| 783,418 |
|
| Description | 12.31.2020 | 12.31.2019 | 12.31.2018 | |||||||||
| ThCh$ | ThCh$ | ThCh$ | ||||||||||
| Share of profit of investment accounted for using the equity method | 3,248,680 | (2,495,621 | ) | 2,194,144 | ||||||||
| Unrealized earnings from product inventory acquired from associates and not sold at the end of the period, which is presented as a discount in the respective asset account (containers and / or inventory) | (528,122 | ) | (394,490 | ) | (868,233 | ) | ||||||
| Amortization goodwill in the sale of fixed assets of Envases CMF S.A. | 85,266 | 85,266 | 85,268 | |||||||||
| Amortization goodwill preferred rights CCDV S.A. | (523,061 | ) | (610,238 | ) | - | |||||||
| Income statement balance | 2,228,763 | (3,415,083 | ) | 1,411,179 | ||||||||
14.4
14.3 Summary financial information of associates:
The attached table presents summarized information regarding the Company´s equity investees as ofAt December 31, 2015:2020:
|
| Envases |
| Sorocaba |
| Kaik |
| SRSA |
| Leao Alimentos |
| Envases CMF S.A. | Sorocaba Refrescos | Kaik Participações Ltda. | SRSA Participações Ltda. | Leão Alimentos e Ltda. | Trop Frutas do Brasil Ltda. | Coca-Cola del Valle New Ventures S.A. | |||||||||||||||||||||
|
| ThCh$ |
| ThCh$ |
| ThCh$ |
| ThCh$ |
| ThCh$ |
| ThCh$ | ThCh$ | ThCh$ | ThCh$ | ThCh$ | ThCh$ | ThCh$ | |||||||||||||||||||||
Total assets |
| 63,174,016 |
| 72,465,279 |
| 9,777,084 |
| 577,957 |
| 311,121,542 |
| 75,089,424 | 86,802,489 | 8,657,291 | 288,440 | 144,111,310 | 76,012,734 | 105,735,317 | |||||||||||||||||||||
Total liabilities |
| 26,648,521 |
| 25,567,640 |
| 34 |
| — |
| 170,593,004 |
| 34,633,862 | 41,781,275 | 26 | 168,354 | 37,634,466 | 21,236,127 | 20,000,197 | |||||||||||||||||||||
Total revenue |
| 48,551,553 |
| 44,380,315 |
| 737,361 |
| — |
| 1,454,265,468 |
| 40,455,562 | 45,021,214 | 8,657,265 | 120,086 | 144,111,310 | 54,776,607 | 85,735,120 | |||||||||||||||||||||
Net income (loss) of associate |
| 2,983,219 |
| (2,608,333 | ) | 737,361 |
| 574,320 |
| (5,620,076 | ) | ||||||||||||||||||||||||||||
| Net income (loss) of associates | 4,717,515 | 664,208 | 96,980 | 117,350 | (39,244,393 | ) | (890,021 | ) | (475,467 | ) | |||||||||||||||||||||||||||||
|
|
|
|
|
|
|
|
|
|
|
| ||||||||||||||||||||||||||||
Reporting date |
| 12/31/2015 |
| 11/30/2015 |
| 11/30/2015 |
| 11/30/2015 |
| 11/30/2015 |
| 12.31.2020 | 11.30.2020 | 11.30.2020 | 11.30.2020 | 11.30.2020 | 11.30.2020 | 12.31.2020 | |||||||||||||||||||||
| Envases CMF S.A. | Sorocaba Refrescos | Kaik Participações Ltda. | SRSA Participações Ltda. | Leão Alimentos e Ltda. | Trop Frutas do Brasil Ltda. | Coca-Cola del Valle New Ventures S.A. | ||||||||||||||||||||||
| ThCh$ | ThCh$ | ThCh$ | ThCh$ | ThCh$ | ThCh$ | ThCh$ | ||||||||||||||||||||||
| Total assets | 77,994,582 | 116,551,131 | 11,661,828 | 393,856 | 248,493,994 | 104,778,397 | 107,388,847 | |||||||||||||||||||||
| Total liabilities | 39,826,283 | 54,650,105 | 35 | 229,780 | 38,137,061 | 27,158,470 | 18,693,717 | |||||||||||||||||||||
| Total revenue | 58,640,058 | 69,343,990 | 337,450 | 160,342 | 139,769,189 | 47,252,571 | 31,914,825 | |||||||||||||||||||||
| Net income (loss) of associates | 1,449,997 | 3,948,798 | 337,450 | 160,342 | 2,320,841 | (1,177,262 | ) | 4,297,003 | ||||||||||||||||||||
| Reporting date | 12.31.2019 | 11.30.2019 | 11.30.2019 | 11.30.2019 | 11.30.2019 | 11.30.2019 | 11.30.2019 | |||||||||||||||||||||
NOTE 15 — - INTANGIBLE ASSETS ANDOTHER THAN GOODWILL
15.1Intangible assets other than goodwill
Intangible assets other than goodwill as of the end of each reporting period are detailed as follows:
|
| December 31, 2015 |
| December 31, 2014 |
| December 31, 2020 | December 31, 2019 | ||||||||||||||||||||||||||||||
|
| Gross |
| Cumulative |
| Net |
| Gross |
| Cumulative |
| Net |
| Gross | Accumulated | Net | Gross | Accumulated | Net | ||||||||||||||||||
Detail |
| Amount |
| Amortization |
| Amount |
| Amount |
| Amortization |
| Amount |
| ||||||||||||||||||||||||
| Description | Value | Amortization | Value | Value | Amortization | Value | |||||||||||||||||||||||||||||||
|
| ThCh$ |
| ThCh$ |
| ThCh$ |
| ThCh$ |
| ThCh$ |
| ThCh$ |
| ThCh$ | ThCh$ | ThCh$ | ThCh$ | ThCh$ | ThCh$ | ||||||||||||||||||
Distribution rights (1) |
| 658,625,624 |
| — |
| 658,625,624 |
| 719,385,108 |
| — |
| 719,385,108 |
| 598,371,081 | (2,005,344 | ) | 596,365,737 | 667,148,383 | (393,187 | ) | 666,755,196 | ||||||||||||||||
Software |
| 22,378,687 |
| (15,814,299 | ) | 6,564,388 |
| 22,591,363 |
| (14,242,229 | ) | 8,349,134 |
| 35,030,003 | (26,882,550 | ) | 8,147,453 | 34,347,843 | (26,484,427 | ) | 7,863,416 | ||||||||||||||||
Water rights |
| 536,940 |
| (60,297 | ) | 476,643 |
| 521,234 |
| (74,197 | ) | 447,037 |
| ||||||||||||||||||||||||
| Others | 417,957 | (416,982 | ) | 975 | 750,309 | (293,546 | ) | 456,763 | |||||||||||||||||||||||||||||
Total |
| 681,541,251 |
| (15,874,596 | ) | 665,666,655 |
| 742,497,705 |
| (14,316,426 | ) | 728,181,279 |
| 633,819,041 | (29,304,876 | ) | 604,514,165 | 702,246,535 | (27,171,160 | ) | 675,075,375 | ||||||||||||||||
| (1) | Correspond to the contractual rights to produce and distribute Coca-Cola products in certain parts of Argentina, Brazil, Chile and Paraguay. Distribution rights result from the valuation process at fair value of the assets and liabilities of the companies acquired in business combinations. Production and distribution contracts are renewable for periods of 5 years with Coca-Cola. The nature of the business and renewals that Coca-Cola has permanently done on these rights, allow qualifying them as indefinite contracts. |
(1) Correspond to the contractual rights to produce and distribute Coca-Cola products in certain parts of Argentina, Brazil, Chile and Paraguay. Distribution rights result from the valuation process at fair value of the assets and liabilities of the companies acquired in business combinations. Production and distribution contracts are renewable for periods of 5 years with Coca-Cola. 
The nature of the business and renewals that Coca-Cola has permanently done on these rights, allow qualifying them as permanent contracts. These production and distribution rights and in conjunctiontogether with the assets that are part of the cash-generating units, are annually subjected to the impairment test.test, Such distribution rights are composed in the following mannerhave an indefinite useful life and are not subject to amortization: except for the Monster rights that are amortized in the term of the agreement which is 4 years.
|
| 12.31.2015 |
| 12.31.2014 |
| ||||||||
| Distribution rights | 12.31.2020 | 12.31.2019 | |||||||||||
|
| ThCh$ |
| ThCh$ |
| ThCh$ | ThCh$ | ||||||
Chile (excluding Metropolitan Region, Rancagua and San Antonio) |
| 300,305,727 |
| 300,305,727 |
| 303,702,092 | 305,235,247 | ||||||
Brazil (Rio de Janeiro, Espirito Santo, Riberao Preto and the investments in Sorocaba and Leão Alimentos e Bebidas Ltda.) |
| 183,687,154 |
| 230,712,143 |
| ||||||||
| Brazil (Rio de Janeiro, Espirito Santo, Ribeirão Preto and investments in Sorocaba y Leão Alimentos e Bebidas Ltda,) | 138,176,054 | 187,616,890 | |||||||||||
Paraguay |
| 173,304,596 |
| 186,636,782 |
| 152,595,420 | 171,841,663 | ||||||
Argentina (North and South) |
| 1,328,147 |
| 1,730,456 |
| 1,892,171 | 2,061,396 | ||||||
Total |
| 658,625,624 |
| 719,385,108 |
| 596,365,737 | 666,755,196 | ||||||
The movement and balances of identifiable intangible assets are detailed as follows for the period January 1 to December 31, 2015 and December 31, 2014:follows:
|
| December 31, 2015 |
| December 31, 2014 |
| January 1 to December 31, 2020 | January 1 to December 31, 2019 | ||||||||||||||||||||||||||||||||||||||||||
|
| Distribution |
|
|
|
|
|
|
| Distribution |
|
|
|
|
|
|
| Distribution | Distribution | ||||||||||||||||||||||||||||||
Details |
| Rights |
| Rights |
| Software |
| Total |
| Rights |
| Rights |
| Software |
| Total |
| ||||||||||||||||||||||||||||||||
| Description | Rights | Others | Software | Total | Rights | Others | Software | Total | |||||||||||||||||||||||||||||||||||||||||
|
| ThCh$ |
| ThCh$ |
| ThCh$ |
| ThCh$ |
| ThCh$ |
| ThCh$ |
| ThCh$ |
| ThCh$ |
| ThCh$ | ThCh$ | ThCh$ | ThCh$ | ThCh$ | ThCh$ | ThCh$ | ThCh$ | ||||||||||||||||||||||||
Opening balance |
| 719,385,108 |
| 447,037 |
| 8,349,134 |
| 728,181,279 |
| 691,355,453 |
| 453,737 |
| 8,797,302 |
| 700,606,492 |
| 666,755,196 | 456,763 | 7,863,416 | 675,075,375 | 661,026,400 | 430,196 | 7,365,957 | 668,822,553 | ||||||||||||||||||||||||
Additions |
| — |
| — |
| 1,191,200 |
| 1,191,200 |
| — |
| — |
| 3,191,059 |
| 3,191,059 |
| 94,661 | - | 2,575,125 | 2,669,786 | - | - | 3,296,558 | 3,296,558 | ||||||||||||||||||||||||
Amortization |
| — |
| (6,394 | ) | (2,681,923 | ) | (2,688,317 | ) | — |
| (4,365 | ) | (3,048,607 | ) | (3,052,972 | ) | (1,573,878 | ) | - | (2,088,612 | ) | (3,662,490 | ) | (133,753 | ) | - | (2,324,225 | ) | (2,457,978 | ) | ||||||||||||||||||
Other increases (decreases)(1) |
| (60.759.485 | ) | 36,000 |
| (294,022 | ) | (61,017,507 | ) | 28,029,655 |
| (2,335 | ) | (590,620 | ) | 27,436,700 |
| ||||||||||||||||||||||||||||||||
Total |
| 658,625,623 |
| 476,643 |
| 6,564,389 |
| 665,666,655 |
| 719,385,108 |
| 447,037 |
| 8,349,134 |
| 728,181,279 |
| ||||||||||||||||||||||||||||||||
| Other increases (decreases) (1) | (68,910,242 | ) | (455,788 | ) | (202,476 | ) | (69,568,506 | ) | 5,862,549 | 26,567 | (474,874 | ) | 5,414,242 | ||||||||||||||||||||||||||||||||||||
| Ending balance | 596,365,737 | 975 | 8,147,453 | 604,514,165 | 666,755,196 | 456,763 | 7,863,416 | 675,075,375 | |||||||||||||||||||||||||||||||||||||||||
| (1) | Mainly corresponds to restatement due to the effects of translation of distribution rights of foreign subsidiaries. |
(1) Mainly corresponds to the foreign currency effect of converting foreign subsidiaries’ distribution rights into the presentation currency.
15.2Goodwill
Goodwill is considered as the excess acquisition cost over fair value of the group´s ownership interest in identifiable net assets of the acquired subsidiary at the acquisition date.
15.2.1Measurement of recoverable goodwill value
Goodwill is annually reviewed but its recoverable value is checked during anticipated periods, if there are facts which indicate a possible impairment. These signs may include new legal dispositions, changes in the economic environment affecting business operating performance indicators, movements in the competition, or the sale of a significant part of the cash generating unit (CGU).
Management reviews business performance based on geographic segments. Goodwill is monitored by operating segment that includes different cash generating units of the operations in Chile, Brazil, Argentina and Paraguay. Impairment of distribution rights is geographically monitored at the CGU or group of cash generating units that correspond to specific territories for which Coca-Cola distribution rights have been acquired. These cash generating units or groups of cash generating units are composed by:
· Regions in Chile (excluding Metropolitan Region, province of Rancagua and province of San Antonio)
· Argentina North
· Argentina South
· Brazil (state of Rio de Janeiro and Espirito Santo)
· Brazil (Ipiranga territories)
· Brazil: the investment in the associate Sorocaba
· Brazil: the investment in the associate Leão Alimentos S.A.
· Paraguay
In order to check if goodwill has suffered an impairment loss, the company compares its book value with its recoverable value, and an impairment loss is recognized for the excess of the book value amount of the asset over its recoverable amount. To determine the recoverable values of the CGU, management considers the discounted cash flow method as the most appropriate method.
15.2.2Main assumptions used in the annual test:
a.Discount rate:
The real discount rate applied in the annual test carried out in December 2015 was estimated with the Capital Asset Pricing Model which allows estimating a discount rate according to the risk level of the CGU in the country where it operates. A nominal discount rate before taxes is used according to the following table:
|
| Discount Rate |
| ||
|
| 2015 |
| 2014 |
|
Argentina |
| 34,1 | % | 32,8 | % |
Chile |
| 7,7 | % | 7,2 | % |
Brazil |
| 11,6 | % | 10,7 | % |
Paraguay |
| 11,5 | % | 12,4 | % |
Management carried out the annual goodwill impairment test as of December 31, 2015 for each CGU.
b.Other assumptions
Financial projections to determine the net value of future cash flows are modelled considering the main variables of the historical flows of the CGU, and approved budgets. In this sense, a conservative growth rate is used, which fluctuates between 1.5% and 3% for the soft drinks category and between 6% and 7% for the less developed categories such as juices and water. Perpetuity growth rates between 2% and 3% depending on the level of per capita consumption of our products at each operation are set beyond the fifth year of projection.
The variables of greater sensitivity in these projections are the discount rates applied in determining the net present value of the projected cash flows, sales volume, sale prices and growth of unit variable cost vs. fixed cost. For the purpose of the impairment test, sensitivities were conducted in these critical variables according to the following:
·Annual volume variation: corresponds to an increase or decrease of 1 percentage point of total annual volume. This variation is applied for every year.
·Price variation: corresponds to an increase or decrease of 1 percentage point of the real price of each product. This variation is applied only during the first year, there fore prices for every year are adjusted by 1 percentage point.
·Fixed costs variation: it assumes which fixed costs (labor and other fixed expenses) have greater or lesser correlation with volume variation, for example 10 percentage points higher means that the fixed cost has less correlation with volume.
·Discount rate: corresponds to an increase or decrease of 50 bps in the discount rate of future cash flows.
15.2.3Conclusions
As a result of the annual test, no impairments have been identified in any of the CGUs assuming conservative EBITDA margin projections and in line with the markets’ history.
Despite the deterioration of the macroeconomic conditions experienced by the economies of the countries where the cash generating units develop their operations, recovery values from the impairment test were higher than the book values of assets.
15.2.4Goodwill by business segment and country16 - GOODWILL
Movement in goodwillGoodwill is detailed as follows:
Year ended December 31, 2015
| Operating segment | 01.01.2020 | Foreign currency translation differences where functional currency is different from presentation currency and hyperinflation | 12.31.2020 | |||||||||
| ThCh$ | ThCh$ | ThCh$ | ||||||||||
| Chilean operation | 8,503,023 | - | 8,503,023 | |||||||||
| Brazilian operation | 75,674,072 | (19,672,659 | ) | 56,001,413 | ||||||||
| Argentine operation | 29,750,238 | (2,406,596 | ) | 27,343,642 | ||||||||
| Paraguayan operation | 7,294,328 | (816,813 | ) | 6,477,515 | ||||||||
| Total | 121,221,661 | (22,896,068 | ) | 98,325,593 | ||||||||
|
|
|
|
|
|
|
| Foreign currency |
|
|
| ||||||||||||
|
|
|
|
|
|
|
| translation differences |
|
|
| ||||||||||||
|
|
|
|
|
|
|
| where functional |
|
|
| ||||||||||||
|
|
|
|
|
| Disposals |
| currency is different |
|
|
| ||||||||||||
Operating segment |
| 01.01.2015 |
| Additions |
| or impairments |
| from presentation currency |
| 12.31.2015 |
| 01.01.2019 | Foreign currency translation differences where functional currency is different from presentation currency and hyperinflation | 12.31.2019 | |||||||||
|
| ThCh$ |
| ThCh$ |
| ThCh$ |
| ThCh$ |
| ThCh$ |
| ThCh$ | ThCh$ | ThCh$ | |||||||||
Chilean operation |
| 8,503,023 |
| — |
| — |
| — |
| 8,503,023 |
| 8,503,023 | - | 8,503,023 | |||||||||
Brazilian operation |
| 90,122,057 |
| — |
| — |
| (18,161,097 | ) | 71,960,960 |
| 73,080,100 | 2,593,972 | 75,674,072 | |||||||||
Argentine operation |
| 10,058,725 |
| — |
| — |
| (2,338,523 | ) | 7,720,202 |
| 28,318,129 | 1,432,109 | 29,750,238 | |||||||||
Paraguayan operation |
| 8,240,394 |
| — |
| — |
| (588,643 | ) | 7,651,751 |
| 7,327,921 | (33,593 | ) | 7,294,328 | ||||||||
Total |
| 116,924,199 |
| — |
| — |
| (21,088,263 | ) | 95,835,936 |
| 117,229,173 | 3,992,488 | 121,221,661 | |||||||||
| Operating segment | 01.01.2018 | Foreign currency translation differences where functional currency is different from presentation currency and hyperinflation | 12.31.2018 | |||||||||
| ThCh$ | ThCh$ | ThCh$ | ||||||||||
| Chilean operation | 8,503,023 | - | 8,503,023 | |||||||||
| Brazilian operation | 73,509,080 | (428,980 | ) | 73,080,100 | ||||||||
| Argentine operation | 4,672,971 | 23,645,158 | 28,318,129 | |||||||||
| Paraguayan operation | 6,913,143 | 414,778 | 7,327,921 | |||||||||
| Total | 93,598,217 | 23,630,956 | 117,229,173 | |||||||||
Year ended December 31, 2014
|
|
|
|
|
|
|
| Foreign currency |
|
|
|
|
|
|
|
|
|
|
| translation differences |
|
|
|
|
|
|
|
|
|
|
| where functional |
|
|
|
|
|
|
|
|
| Disposals |
| currency is different |
|
|
|
Operating segment |
| 01.01.2014 |
| Additions |
| or impairments |
| from presentation currency |
| 12.31.2014 |
|
|
| ThCh$ |
| ThCh$ |
| ThCh$ |
| ThCh$ |
| ThCh$ |
|
Chilean operation |
| 8,522,488 |
| — |
| (19,465 | ) | — |
| 8,503,023 |
|
Brazilian operation |
| 88,659,503 |
| — |
| (292,365 | )(1) | 1,754,919 |
| 90,122,057 |
|
Argentine operation |
| 11,404,496 |
| — |
| — |
| (1,345,771 | ) | 10,058,725 |
|
Paraguayan operation |
| 7,192,580 |
| — |
| — |
| 1,047,814 |
| 8,240,394 |
|
Total |
| 115,779,067 |
| — |
| (311,830 | ) | 1,456,962 |
| 116,924,199 |
|
(1) Corresponds to the final valuation of assets and liabilities acquired at the purchase of Compañia de Bebidas Ipiranga, in accordance to what has been described in Note 3 “Business Combinations”.
Year ended December 31, 2013
Operating segment |
| 01.01.2013 |
| Additions |
| Disposals |
| Foreign currency |
| 12.31.2013 |
|
|
| ThCh$ |
| ThCh$ |
| ThCh$ |
| ThCh$ |
| ThCh$ |
|
Chilean operation |
| 8,503,023 |
| 19,465 |
| — |
| — |
| 8,522,488 |
|
Brazilian operation |
| 35,536,967 |
| 55,255,194 | (2) | — |
| (2,132,658 | ) | 88,659,503 |
|
Argentine operation |
| 13,837,339 |
| — |
| — |
| (2,432,843 | ) | 11,404,496 |
|
Paraguayan operation |
| 6,915,412 |
| — |
| — |
| 277,168 |
| 7,192,580 |
|
Total |
| 64,792,741 |
| 55,274,659 |
| — |
| (4,288,333 | ) | 115,779,067 |
|
(2) Corresponds to the final valuation of assets and liabilities acquired at the purchase of Compañia de Bebidas Ipiranga, in accordance to what has been described in Note 3 “Business Combinations”.
NOTE 16 — 17 – OTHER CURRENT AND NON-CURRENT FINANCIAL LIABILITIES
Liabilities are detailed as follows:follows:
Current |
| 12.31.2015 |
| 12.31.2014 |
|
|
| ThCh$ |
| ThCh$ |
|
Bank loans |
| 23,990,783 |
| 41,675,933 |
|
Bonds payable |
| 19,236,780 |
| 17,623,883 |
|
Deposits in guarantee |
| 16,247,026 |
| 15,982,913 |
|
Derivative contract obligations (see note 21) |
| 107,428 |
| 4,431,484 |
|
Leasing agreements |
| 2,635,671 |
| 3,688,227 |
|
Total |
| 62,217,688 |
| 83,402,440 |
|
Non-current |
| 12.31.2015 |
| 12.31.2014 |
|
|
| ThCh$ |
| ThCh$ |
|
Bank loans |
| 30,237,950 |
| 46,414,771 |
|
Bonds payable |
| 718,004,190 |
| 657,220,248 |
|
Leasing agreements |
| 17,057,204 |
| 22,981,421 |
|
Total |
| 765,299,344 |
| 726,616,440 |
|
| Balance | ||||||||||||||||
| Current | Non-current | |||||||||||||||
| 12.31.2020 | 12.31.2019 | 12.31.2020 | 12.31.2019 | |||||||||||||
| ThCh$ | ThCh$ | ThCh$ | ThCh$ | |||||||||||||
| Bank loans (17.1.1 – 2) | 799,072 | 1,438,161 | 4,000,000 | 909,486 | ||||||||||||
| Bonds payable, net1 (17.2) | 18,705,015 | 21,604,601 | 918,921,342 | 718,962,871 | ||||||||||||
| Deposits in guarantee | 12,126,831 | 11,163,005 | - | - | ||||||||||||
| Derivative contract liabilities (see note 22) | 1,217,322 | 374,576 | 51,568,854 | - | ||||||||||||
| Leasing agreements (17.4.1 – 2) | 5,718,484 | 6,013,535 | 15,339,373 | 23,454,700 | ||||||||||||
| Total | 38,566,724 | 40,593,878 | 989,829,569 | 743,327,057 | ||||||||||||
1 Amounts net of issuances expenses and discounts related to issuance.

The fair value of the aforementionedfinancial assets and liabilities is presented below:below:
Currrent |
| Book Value |
| Fair Value |
| Book Value |
| Fair Value |
|
|
| ThCh$ |
| ThCh$ |
| ThCh$ |
| ThCh$ |
|
Cash and cash equivalents (3) |
| 129,160,939 |
| 129,160,939 |
| 79,514,434 |
| 79,514,434 |
|
Other financial assets (3) |
| 87,491,931 |
| 87,491,931 |
| 106,577,042 |
| 106,577,042 |
|
Trade and other accounts receivable, net (3) |
| 176,385,386 |
| 176,385,386 |
| 198,110,424 |
| 198,110,424 |
|
Accounts receivable from related parties (3) |
| 4,610,500 |
| 4,610,500 |
| 5,994,453 |
| 5,994,453 |
|
Bank Loans (1) |
| 23,990,783 |
| 23,928,084 |
| 41,675,933 |
| 42,604,758 |
|
Bonds Payable (2) |
| 19,236,780 |
| 20,732,412 |
| 17,623,883 |
| 18,852,764 |
|
Deposits in guarantee (3) |
| 16,247,026 |
| 16,247,026 |
| 15,982,913 |
| 15,982,913 |
|
Derivative contract obligations (see note 21) |
| 107,428 |
| 107,428 |
| 4,431,484 |
| 4,431,484 |
|
Leasing agreements (3) |
| 2,635,671 |
| 2,635,671 |
| 3,688,227 |
| 3,688,227 |
|
| Current |
Book Value 12.31.2020 | Fair Value 12.31.2020 |
Book Value 12.31.2019 | Fair Value 12.31.2019 | ||||||||||||
| ThCh$ | ThCh$ | ThCh$ | ThCh$ | |||||||||||||
| Cash and cash equivalent (2) | 309,530,699 | 309,530,699 | 157,567,986 | 157,567,986 | ||||||||||||
| Other financial assets (1) | - | - | 317,205 | 317,205 | ||||||||||||
| Trade debtors and other accounts receivable (2) | 194,664,683 | 194,664,683 | 191,077,588 | 191,077,588 | ||||||||||||
| Accounts receivable related companies (2) | 11,875,408 | 11,875,408 | 10,835,768 | 10, 835,768 | ||||||||||||
| Bank loans (2) | 799,072 | 896,307 | 1,438,161 | 1,434,255 | ||||||||||||
| Bonds payable (2) | 18,705,015 | 22,471,852 | 21,604,601 | 24,188,060 | ||||||||||||
| Bottle guaranty deposits (2) | 12,126,831 | 12,126,831 | 11,163,005 | 11,163,005 | ||||||||||||
| Derivative contracts liabilities (see note 22) (1) | 1,217,322 | 1,217,322 | 374,576 | 374,576 | ||||||||||||
| Leasing agreements (2) | 5,718,484 | 5,718,484 | 6,013,535 | 6,013,535 | ||||||||||||
| Accounts payable (2) | 230,438,133 | 230,438,133 | 243,700,553 | 243,700,553 | ||||||||||||
| Accounts payable related companies (2) | 39,541,968 | 39,541,968 | 53,637,601 | 53,637,601 | ||||||||||||
Non-current |
| 12.31.2015 |
| 12.31.2015 |
| 12.31.2014 |
| 12.31.2014 |
|
|
| ThCh$ |
| ThCh$ |
| ThCh$ |
| ThCh$ |
|
Other financial assets (3) |
| 181,491,527 |
| 181,491,527 |
| 51,026,773 |
| 51,026,773 |
|
Trade and other receivables (3) |
| 5,931,999 |
| 5,931,999 |
| 7,097,809 |
| 7,097,809 |
|
Accounts receivable from related parties (3) |
| 14,732 |
| 14,732 |
| 24,752 |
| 24,752 |
|
Bank Loans (1) |
| 30,237,950 |
| 24,678,828 |
| 46,414,771 |
| 41,861,984 |
|
Bonds Payable (2) |
| 718,004,190 |
| 765,111,961 |
| 657,220,248 |
| 701,322,386 |
|
Leasing agreements (3) |
| 17,057,204 |
| 17,057,204 |
| 22,981,421 |
| 22,981,421 |
|
| Non-current | 12.31.2020 | 12.31.2020 | 12.31.2019 | 12.31.2019 | ||||||||||||
| ThCh$ | ThCh$ | ThCh$ | ThCh$ | |||||||||||||
| Other financial assets (1) | 150,983,295 | 150,983,295 | 98,918,457 | 98,918,457 | ||||||||||||
| Accounts receivable, non-current (2) | 73,862 | 73,862 | 523,769 | 523,769 | ||||||||||||
| Accounts receivable related companies (2) | 138,346 | 138,346 | 283,118 | 283,118 | ||||||||||||
| Bank loans (2) | 4,000,000 | 4,056,753 | 909,486 | 867,025 | ||||||||||||
| Bonds payable (2) | 918,921,342 | 1,088,617,557 | 718,962,871 | 803,017,145 | ||||||||||||
| Derivative contracts liabilities (see note 22) (1) | 51,568,854 | 51,568,854 | - | - | ||||||||||||
| Leasing agreements (2) | 15,339,373 | 15,339,373 | 23,454,700 | 23,454,700 | ||||||||||||
| Accounts payable, non-current (2) | 295,279 | 295,279 | 619,587 | 619,587 | ||||||||||||
| (1) | Fair values are based on discounted cash flows using market discount rates at the close of the six-month and one-year period and are classified as Level 2 of the fair value measurement hierarchies. |
| (2) | Financial instruments such as: Cash and Cash Equivalents, Trade and Other Accounts Receivable, Accounts Receivable, Bottle Guarantee Deposits and Trade Accounts Payable, and Other Accounts Payable present a fair value that approximates their carrying value, considering the nature and term of the obligation. The business model is to maintain the financial instrument in order to collect/pay contractual cash flows, in accordance with the terms of the contract, where cash flows are received/cancelled on specific dates that exclusively constitute payments of principal plus interest on that principal. These instruments are revalued at amortized cost. |
(1) The fair values
17.1.1 Bank obligations, current
| Maturity | Total | |||||||||||||||||||||||||||||||||||||||||
| Indebted entity | Creditor Entity | Type of | Nominal | Effective | Up to | 90 days to | At | At | ||||||||||||||||||||||||||||||||||
| Taxpayer ID | Name | Country | Taxpayer ID | Name | Country | Currency | Amortization | Rate | Rate | 90 days | 1 year | 12.31.2020 | 12.31.2019 | |||||||||||||||||||||||||||||
| ThCh$ | ThCh$ | ThCh$ | ThCh$ | |||||||||||||||||||||||||||||||||||||||
| 96.705.990-0 | Envases Central S.A. | Chile | 97.006.000-6 | Banco BCI | Chile | UF | Semiannually | 2.13 | % | 2.13 | % | - | 760,667 | 760,667 | 748,838 | |||||||||||||||||||||||||||
| 96.705.990-0 | Envases Central S.A. | Chile | 97.006.000-6 | Banco BCI | Chile | UF | Semiannually | 2.00 | % | 2.00 | % | 33,111 | - | 33,111 | - | |||||||||||||||||||||||||||
| Foreign | Embotelladora del Atlántico S.A. | Argentina | Foreign | Banco Galicia y Buenos Aires S.A. | Argentina | AR | Upon maturity | 82.00 | % | 82.00 | % | - | - | - | 8,453 | |||||||||||||||||||||||||||
| Foreign | Embotelladora del Atlántico S.A. | Argentina | Foreign | Banco Galicia y Buenos Aires S.A. | Argentina | AR | Monthly | 26.60 | % | 26.60 | % | 5,294 | - | 5,294 | ||||||||||||||||||||||||||||
| Foreign | Rio de Janeiro Refrescos Ltda. | Brazil | Foreign | Banco Itaú | Brazil | BRL | Monthly | 6.63 | % | 6.63 | % | - | - | - | 635,727 | |||||||||||||||||||||||||||
| Foreign | Rio de Janeiro Refrescos Ltda. | Brazil | Foreign | Banco Itaú | Brazil | BRL | Quarterly | 4.50 | % | 4.50 | % | - | - | - | 45,143 | |||||||||||||||||||||||||||
| Total | 799,072 | 1,438,161 | ||||||||||||||||||||||||||||||||||||||||
17.1.2 Bank obligations, non-current
| Maturity | ||||||||||||||||||||||||||||||||||||||||||||||||
| Indebted entity | Creditor Entity | Type of | Nominal | Effective | 1 year up to | More than 2 years | More than 3 years | More than 4 years | More than 5 | at | ||||||||||||||||||||||||||||||||||||||
| Taxpayer ID | Name | Country | Taxpayer ID | Name | Country | Currency | Amortization | Rate | Rate | 2 years | Up to 3 years | Up to 4 years | Up to 5 years | Years | 12.31.2020 | |||||||||||||||||||||||||||||||||
| ThCh$ | ThCh$ | ThCh$ | ThCh$ | ThCh$ | ThCh$ | |||||||||||||||||||||||||||||||||||||||||||
| 96.705.990-0 | Envases Central S.A. | Chile | 97.006.000-6 | Banco BCI | Chile | CLP | Semiannually | 2.00 | % | 2.00 | % | - | - | 4,000,000 | - | - | 4,000,000 | |||||||||||||||||||||||||||||||
| Total | 4,000,000 | |||||||||||||||||||||||||||||||||||||||||||||||
17.1.2 Bank obligations, non-current previous year
| Maturity | ||||||||||||||||||||||||||||||||||||||||||||||||||||
| Indebted Entity | Creditor Entity | Type | Effective | Nominal | 1 year up to | More than 2 years | More than 3 years | More than 4 years | More than 5 | at | ||||||||||||||||||||||||||||||||||||||||||
| Tax ID | Name | Country | Tax ID | Name | Country | Currency | Amortization | Rate | Rate | 2 years | Up to 3 years | Up to 4 years | Up to 5 years | Years | 12.31.2019 | |||||||||||||||||||||||||||||||||||||
| ThCh$ | ThCh$ | ThCh$ | ThCh$ | ThCh$ | ThCh$ | |||||||||||||||||||||||||||||||||||||||||||||||
| 96.705.990-0 | Envases Central S.A. | Chile | 97.006.000-6 | Banco BCI | Chile | UF | Semiannually | 2.13 | % | 2.13 | % | 736,033 | - | - | - | - | 736,033 | |||||||||||||||||||||||||||||||||||
| Foreign | Rio de Janeiro Refrescos Ltda. | Brazil | Foreign | Banco Itaú | Brazil | BRL | Monthly | 6.63 | % | 6.63 | % | 44,621 | 44,621 | 44,621 | 39,590 | - | 173,453 | |||||||||||||||||||||||||||||||||||
| Total | 909,486 | |||||||||||||||||||||||||||||||||||||||||||||||||||
17.1.3 Current and non-current bank obligations “Restrictions”
Bank obligations are based on discounted cash flows using market based discount rates as of year-end and are Level 2 fair value measurements.
(2) The fair value of coporate bonds are classified as a Level 1 fair value measurements based on quoted pricesnot subject to restrictions for the Company’s obligations.reported periods.
(3) The fair value approximates book value considering
F-64
17.2 Bonds payable
On January 21, 2020, the natureCompany issued corporate bonds on the international market for USD 300 million with a 30-year maturity, with the whole principal amount due in 2039 and terman annual interest rate of the obligations.3.950%.
TableDuring 2018, Andina carried out a debt restructuring process that consisted of Contentsa partial repurchase in the amount of USD 210 million of the 144A/RegS Senior Notes and refinancing it with the placement of Series F bonds in the local market in the amount of UF 5.7 million due 2039 and accruing an annual interest rate of 2.83%. The costs corresponding to the repurchase of bonds, associated with premium payments, overpricing and proportional amortization of placement costs and discounts in bonds in original U.S. Dollars amounting to CLP 9,583,000 thousand, were recorded in results under the item financial costs.
16.1.1Bank obligations, current
|
|
|
|
|
|
|
|
|
|
|
|
|
|
|
|
|
|
|
|
|
|
|
|
|
|
|
|
|
|
|
|
|
|
|
|
|
|
|
|
|
|
|
| Maturity |
| Total |
| ||||||||
Indebted Entity |
| Creditor Entity |
|
|
| Type |
| Effective |
| Nominal |
| Up to |
| 90 days |
| at |
| At |
| ||||||||
Tax ID, |
| Name |
| Country |
| Tax ID, |
| Name |
| Country |
| Currency |
| Amortization |
| Rate |
| Rate |
| 90 days |
| To 1 year |
| 12.31.2015 |
| 12.31.2014 |
|
|
|
|
|
|
|
|
|
|
|
|
|
|
|
|
|
|
|
|
| ThCh$ |
| ThCh$ |
| ThCh$ |
| ThCh$ |
|
91.144.000-8 |
| Embotelladora Andina S.A. |
| Chile |
| 97.036.000-K |
| Banco Santander |
| Chile |
| Chilean pesos |
| Monthly |
| 1.10 | % | 1.10 | % | — |
| — |
| — |
| 9,633 |
|
91.144.000-8 |
| Embotelladora Andina S.A. |
| Chile |
| 97.032.000-8 |
| BBVA |
| Chile |
| Chilean pesos |
| At maturity |
| 5.00 | % | 5.00 | % | — |
| — |
| — |
| 205,000 |
|
96.705.990-0 |
| Envases Central S.A. |
| Chile |
| 97.080.000-K |
| Banco BICE |
| Chile |
| Chilean pesos |
| Semiannually |
| 4.29 | % | 4.29 | % | — |
| 214,927 |
| 214,927 |
| 211,137 |
|
96.705.990-0 |
| Envases Central S.A. |
| Chile |
| 97.006.000-6 |
| Banco BCI |
| Chile |
| Chilean pesos |
| Semiannually |
| 3.43 | % | 3.43 | % | — |
| 275,268 |
| 275,268 |
| — |
|
Foreign |
| Embotelladora del Atlántico S.A. |
| Argentina |
| Foreign |
| Banco de la Ciudad de Bs.As. |
| Argentina |
| Argentine pesos |
| Quarterly |
| 15.25 | % | 15.25 | % | 129,023 |
| 130,704 |
| 259,727 |
| 658,980 |
|
Foreign |
| Embotelladora del Atlántico S.A. |
| Argentina |
| Foreign |
| Banco de la Nación Argentina (1) |
| Argentina |
| Argentine pesos |
| Monthly |
| 14.80 | % | 9.90 | % | 144,740 |
| 302,556 |
| 447,296 |
| 748,896 |
|
Foreign |
| Embotelladora del Atlántico S.A. |
| Argentina |
| Foreign |
| Banco de la Nación Argentina |
| Argentina |
| Argentine pesos |
| Monthly |
| 9.90 | % | 9.90 | % | 38,830 |
| 76,970 |
| 115,800 |
| 201,332 |
|
Foreign |
| Embotelladora del Atlántico S.A. |
| Argentina |
| Foreign |
| Banco de la Nación Argentina |
| Argentina |
| Argentine pesos |
| Monthly |
| 23.06 | % | 23.06 | % | — |
| — |
| — |
| 853,102 |
|
Foreign |
| Embotelladora del Atlántico S.A. |
| Argentina |
| Foreign |
| Banco de la Nación Argentina |
| Argentina |
| Argentine pesos |
| Monthly |
| 23.38 | % | 23.38 | % | — |
| — |
| — |
| 4,587,880 |
|
Foreign |
| Embotelladora del Atlántico S.A. |
| Argentina |
| Foreign |
| Banco Galicia y Bs. As. |
| Argentina |
| Argentine pesos |
| Monthly |
| 15.25 | % | 15.25 | % | 60,916 |
| 181,534 |
| 242,450 |
| — |
|
Foreign |
| Embotelladora del Atlántico S.A. |
| Argentina |
| Foreign |
| Banco Galicia y Bs. As. |
| Argentina |
| Argentine pesos |
| Quarterly |
| 15.00 | % | 15.00 | % | — |
| — |
| — |
| 60,977 |
|
Foreign |
| Embotelladora del Atlántico S.A. |
| Argentina |
| Foreign |
| Banco Galicia y Bs. As. |
| Argentina |
| Argentine pesos |
| Quarterly |
| 15.25 | % | 15.25 | % | 271,561 |
| 501,033 |
| 772,594 |
| 1,390,819 |
|
Foreign |
| Embotelladora del Atlántico S.A. |
| Argentina |
| Foreign |
| Banco Macro Bansud |
| Argentina |
| Argentine pesos |
| Monthly |
| 15.25 | % | 15.25 | % | 43,502 |
| 131,386 |
| 174,888 |
| 198,950 |
|
Foreign |
| Embotelladora del Atlántico S.A. |
| Argentina |
| Foreign |
| Banco Santander Río |
| Argentina |
| Argentine pesos |
| Monthly |
| 15.25 | % | 15.25 | % | 61,567 |
| 60,560 |
| 122,127 |
| 319,284 |
|
Foreign |
| Embotelladora del Atlántico S.A. |
| Argentina |
| Foreign |
| BBVA Banco Francés |
| Argentina |
| Argentine pesos |
| Monthly |
| 15.25 | % | 15.25 | % | 40,640 |
| 123,925 |
| 164,565 |
| 186,837 |
|
Foreign |
| Embotelladora del Atlántico S.A. |
| Argentina |
| Foreign |
| Nuevo Banco de Santa Fe |
| Argentina |
| Argentine pesos |
| Quarterly |
| 15.00 | % | 15.00 | % | — |
| — |
| — |
| 210,727 |
|
Foreign |
| Embotelladora del Atlántico S.A. |
| Argentina |
| Foreign |
| Nuevo Banco de Santa Fe |
| Argentina |
| Argentine pesos |
| Quarterly |
| 15.25 | % | 15.25 | % | 105,037 |
| 32,336 |
| 137,373 |
| 545,149 |
|
Foreign |
| Embotelladora del Atlántico S.A. |
| Argentina |
| Foreign |
| Nuevo Banco Santa Fe |
| Argentina |
| Argentine pesos |
| At maturity |
| 28.00 | % | 28.00 | % | — |
| — |
| — |
| 5,080,638 |
|
Foreign |
| Embotelladora del Atlántico S.A. |
| Argentina |
| Foreign |
| Comercial Bank of China |
| Argentina |
| Argentine pesos |
| Quarterly |
| 15.25 | % | 15.25 | % | 62,056 |
| 185,165 |
| 247,221 |
| 317,750 |
|
Foreign |
| Embotelladora del Atlántico S.A. |
| Argentina |
| Foreign |
| Bank HSBC Argentina S.A |
| Argentina |
| Argentine pesos |
| Quarterly |
| 15.25 | % | 15.25 | % | 62,056 |
| 185,165 |
| 247,221 |
| 317,750 |
|
Foreign |
| Andina Empaques Argentina S.A. |
| Argentina |
| Foreign |
| Banco Galicia y Bs.As. |
| Argentina |
| Argentine pesos |
| Monthly |
| 30.25 | % | 30.25 | % | — |
| — |
| — |
| 453,690 |
|
Foreign |
| Andina Empaques Argentina S.A. |
| Argentina |
| Foreign |
| Banco Galicia y Bs.As. |
| Argentina |
| Argentine pesos |
| At maturity |
| 15.25 | % | 15.25 | % | — |
| — |
| — |
| 316,153 |
|
Foreign |
| Rio de Janeiro Refrescos Ltda. |
| Brazil |
| Foreign |
| VOTORANTIM |
| Brasil |
| Brazilian real |
| Monthly |
| 9.40 | % | 9.40 | % | — |
| — |
| — |
| 65,788 |
|
Foreign |
| Rio de Janeiro Refrescos Ltda. |
| Brazil |
| Foreign |
| ITAÚ - Finame |
| Brasil |
| Dollars |
| Semiannually |
| 2.992 | % | 2.992 | % | — |
| 12,817,824 |
| 12,817,824 |
| 16,118,096 |
|
Foreign |
| Rio de Janeiro Refrescos Ltda. |
| Brazil |
| Foreign |
| Banco Santander |
| Brasil |
| Brazilian real |
| Monthly |
| 7.15 | % | 7.15 | % | 172,746 |
| 824,554 |
| 997,300 |
| 440,866 |
|
Foreign |
| Rio de Janeiro Refrescos Ltda. |
| Brazil |
| Foreign |
| Banco Bradesco |
| Brasil |
| Brazilian real |
| Quarterly |
| 3.86 | % | 3.86 | % | 172,048 |
| 181,868 |
| 353,916 |
| — |
|
Foreign |
| Rio de Janeiro Refrescos Ltda. |
| Brazil |
| Foreign |
| Banco Bradesco |
| Brasil |
| Brazilian real |
| Monthly |
| 4.50 | % | 4.50 | % | — |
| — |
| — |
| 603,278 |
|
Foreign |
| Rio de Janeiro Refrescos Ltda. |
| Brazil |
| Foreign |
| Banco Itaú |
| Brasil |
| Brazilian real |
| Quarterly |
| 4.50 | % | 4.50 | % | 658,705 |
| 1,865,061 |
| 2,523,766 |
| 3,376,088 |
|
Foreign |
| Rio de Janeiro Refrescos Ltda. |
| Brazil |
| Foreign |
| Banco Itaú |
| Brasil |
| Brazilian real |
| Monthly |
| 6.63 | % | 6.63 | % | 984,440 |
| 2,892,080 |
| 3,876,520 |
| 4,197,133 |
|
Total |
|
|
|
|
|
|
|
|
|
|
|
|
|
|
|
|
|
|
|
|
|
|
| 23,990,783 |
| 41,675,933 |
|
| Current | Non-current | Total | ||||||||||||||||||||||
| Composition of bonds payable | 12.31.2020 | 12.31.2019 | 12.31.2020 | 12.31.2019 | 12.31.2020 | 12.31.2019 | ||||||||||||||||||
| ThCh$ | ThCh$ | ThCh$ | ThCh$ | ThCh$ | ThCh$ | |||||||||||||||||||
| Bonds (face value) 1 | 19,347,033 | 22,189,595 | 925,968,913 | 721,950,553 | 945,315,946 | 744,140,148 | ||||||||||||||||||
(1) The Bicentennial credit granted by Banco de la Nación Argentina to Embotelladora del Atlántico S.A. at a preferential rate is a benefit of the Argentine Government to promote investment projects. Embotelladora del Atlántico S.A. registered investment projects and received the bicentennial credit at a preferential rate of 9.9% a year, the financial expense is recognized according to the market rate, and the financial expense differential between market and nominal rate was allocated as a lower cost of the fixed asset.
Table of Contents Gross amounts, do not consider issuance expenses and discounts related to issuance.
16.1.2Bank obligations, non-current December 31, 2015
|
|
|
|
|
|
|
|
|
|
|
|
|
|
|
|
|
|
|
| Maturity |
| ||||||||||
Indebted Entity |
| Creditor Entity |
|
|
| Type |
| Effective |
| Nominal |
| 1 year up to |
| More 2 years |
| More 3 years |
| More 4 years |
| More 5 |
| At |
| ||||||||
Tx ID |
| Name |
| Country |
| Tx ID |
| Name |
| Country |
| Currency |
| Amortization |
| Rate |
| Rate |
| 2 years |
| Up to 3 years |
| Up to 4 years |
| Up to 5 years |
| Years |
| 12.31.2015 |
|
|
|
|
|
|
|
|
|
|
|
|
|
|
|
|
|
|
|
|
| ThCh$ |
| ThCh$ |
| ThCh$ |
| ThCh$ |
| ThCh$ |
| ThCh$ |
|
Foreign |
| Rio de Janeiro Refrescos Ltda. |
| Brazil |
| Foreign |
| Banco Itaú |
| Brazil |
| Reales |
| Monthly |
| 6.63 | % | 6.63 | % | 3,323,725 |
| 1,258,291 |
| 466,032 |
| 413,519 |
| — |
| 5,461,567 |
|
Foreign |
| Rio de Janeiro Refrescos Ltda. |
| Brazil |
| Foreign |
| Banco Santander |
| Brazil |
| Reales |
| Monthly |
| 7.15 | % | 7.15 | % | 776,263 |
| 672,484 |
| 493,743 |
| 431,272 |
| — |
| 2,373,762 |
|
Foreign |
| Rio de Janeiro Refrescos Ltda. |
| Brazil |
| Foreign |
| Banco Itaú |
| Brazil |
| Dollars |
| Semiannually |
| 2.992 | % | 2.992 | % | 12,681,431 |
| — |
| — |
| — |
| — |
| 12,681,431 |
|
Foreign |
| Rio de Janeiro Refrescos Ltda. |
| Brazil |
| Foreign |
| Banco Itaú |
| Brazil |
| Reales |
| Monthly |
| 4.50 | % | 4.50 | % | 2,020,483 |
| 2,020,483 |
| 2,020,483 |
| 2,020,480 |
| — |
| 8,081,929 |
|
Foreign |
| Embotelladora del Atlántico S.A. |
| Argentina |
| Foreign |
| Banco BBVA Francés |
| Argentina |
| Pesos argentinos |
| Monthly |
| 15.25 | % | 15.25 | % | 44,560 |
| — |
| — |
| — |
| — |
| 44,560 |
|
Foreign |
| Embotelladora del Atlántico S.A. |
| Argentina |
| Foreign |
| Banco Macro Bansud |
| Argentina |
| Pesos argentinos |
| Monthly |
| 15.25 | % | 15.25 | % | 50,970 |
| — |
| — |
| — |
| — |
| 50,970 |
|
96.705.990-0 |
| Envases Central S.A. |
| Chile |
| 97.080.000-K |
| Banco Bice |
| Chile |
| Pesos chilenos |
| Semiannually |
| 4.29 | % | 4.29 | % | 1,543,731 |
| — |
| — |
| — |
| — |
| 1,543,731 |
|
|
|
|
|
|
|
|
|
|
|
|
|
|
|
|
|
|
|
|
|
|
|
|
|
|
|
|
|
|
|
|
|
Total |
|
|
|
|
|
|
|
|
|
|
|
|
|
|
|
|
|
|
|
|
|
|
|
|
|
|
|
|
| 30,237,950 |
|
16.1.2 Bank obligations, non-current December 31, 2014
|
|
|
|
|
|
|
|
|
|
|
|
|
|
|
|
|
|
|
| Maturity |
|
|
| ||||||||
Indebted Entity |
| Creditor Entity |
|
|
| Type |
| Effective |
| Nominal |
| 1 year up to |
| More 2 years |
| More 3 years |
| More 4 years |
| More 5 |
| at |
| ||||||||
Tx ID |
| Name |
| Country |
| Tx ID |
| Name |
| Country |
| Currency |
| Amortization |
| Rate |
| Rate |
| 2 years |
| Up to 3 years |
| Up to 4 years |
| Up to 5 years |
| Years |
| 12.31.2014 |
|
|
|
|
|
|
|
|
|
|
|
|
|
|
|
|
|
|
|
|
| ThCh$ |
| ThCh$ |
| ThCh$ |
| ThCh$ |
| ThCh$ |
| ThCh$ |
|
Foreign |
| Rio de Janeiro Refrescos Ltda. |
| Brazil |
| Foreign |
| Banco Itaú |
| Brazil |
| Brazilian real |
| Monthly |
| 6.63 | % | 6.63 | % | 4,169,265 |
| 3,582,205 |
| 1,133,230 |
| 65,787 |
| — |
| 8,950,487 |
|
Foreign |
| Rio de Janeiro Refrescos Ltda. |
| Brazil |
| Foreign |
| Banco Santander Río |
| Brazil |
| Brazilian real |
| Monthly |
| 7.15 | % | 7.15 | % | 476,272 |
| 310,662 |
| 158,529 |
| 117,869 |
| — |
| 1,063,332 |
|
Foreign |
| Rio de Janeiro Refrescos Ltda. |
| Brazil |
| Foreign |
| Banco Itaú |
| Brazil |
| Dollars |
| Semiannually |
| 2.992 | % | 2.992 | % | 8,280,509 |
| 8,280,509 |
| — |
| — |
| — |
| 16,561,018 |
|
Foreign |
| Rio de Janeiro Refrescos Ltda. |
| Brazil |
| Foreign |
| Banco Bradesco |
| Brazil |
| Brazilian real |
| Monthly |
| 4.50 | % | 4.50 | % | 428,302 |
| — |
| — |
| — |
| — |
| 428,302 |
|
Foreign |
| Rio de Janeiro Refrescos Ltda. |
| Brazil |
| Foreign |
| Banco Itaú |
| Brazil |
| Brazilian real |
| Monthly |
| 7.00 | % | 7.00 | % | 3,327,965 |
| 3,157,786 |
| 3,131,517 |
| 3,131,517 |
| 820,546 |
| 13,569,331 |
|
Foreign |
| Embotelladora del Atlántico S.A. |
| Argentina |
| Foreign |
| Banco de la Nación Argentina |
| Argentina |
| Argentine pesos |
| Monthly |
| 14.80 | % | 9.90 | % | 581,022 |
| — |
| — |
| — |
| — |
| 581,022 |
|
Foreign |
| Embotelladora del Atlántico S.A. |
| Argentina |
| Foreign |
| Banco de la Nación Argentina |
| Argentina |
| Argentine pesos |
| Monthly |
| 9.90 | % | 9.90 | % | 150,428 |
| — |
| — |
| — |
| — |
| 150,428 |
|
Foreign |
| Embotelladora del Atlántico S.A. |
| Argentina |
| Foreign |
| Nuevo Banco de Santa Fe |
| Argentina |
| Argentine pesos |
| Quarterly |
| 15.25 | % | 15.25 | % | 175,174 |
| — |
| — |
| — |
| — |
| 175,174 |
|
Foreign |
| Embotelladora del Atlántico S.A. |
| Argentina |
| Foreign |
| Banco Galicia y Bs. As |
| Argentina |
| Argentine pesos |
| Quarterly |
| 15.25 | % | 15.25 | % | 988,071 |
| — |
| — |
| — |
| — |
| 988,071 |
|
Foreign |
| Embotelladora del Atántico S.A. |
| Argentina |
| Foreign |
| Banco Ciudad de Bs. As. |
| Argentina |
| Argentine pesos |
| Quarterly |
| 15.25 | % | 15.25 | % | 326,400 |
| — |
| — |
| — |
| — |
| 326,400 |
|
Foreign |
| Embotelladora del Atlántico S.A. |
| Argentina |
| Foreign |
| Banco HSBC Argentina S.A |
| Argentina |
| Argentine pesos |
| Quarterly |
| 15.25 | % | 15.25 | % | 319,305 |
| — |
| — |
| — |
| — |
| 319,305 |
|
Foreign |
| Embotelladora del Atlántico S.A. |
| Argentina |
| Foreign |
| Comercial Bank of China |
| Argentina |
| Argentine pesos |
| Quarterly |
| 15.25 | % | 15.25 | % | 319,305 |
| — |
| — |
| — |
| — |
| 319,305 |
|
Foreign |
| Embotelladora del Atlántico S.A. |
| Argentina |
| Foreign |
| Banco BBVA Francés |
| Argentina |
| Argentine pesos |
| Monthly |
| 15.25 | % | 15.25 | % | 269,432 |
| — |
| — |
| — |
| — |
| 269,432 |
|
Foreign |
| Embotelladora del Atlántico S.A. |
| Argentina |
| Foreign |
| Banco Santander Río |
| Argentina |
| Argentine pesos |
| Monthly |
| 15.25 | % | 15.25 | % | 157,737 |
| — |
| — |
| — |
| — |
| 157,737 |
|
Foreign |
| Embotelladora del Atlántico S.A. |
| Argentina |
| Foreign |
| Banco Macro Bansud |
| Argentina |
| Argentine pesos |
| Monthly |
| 15.25 | % | 15.25 | % | 290,509 |
| — |
| — |
| — |
| — |
| 290,509 |
|
Foreign |
| Andina Empaques Argentina S.A. |
| Argentina |
| Foreign |
| Banco Galicia y Bs As. |
| Argentina |
| Argentine pesos |
| Monthly |
| 15.25 | % | 15.25 | % | 315,363 |
| — |
| — |
| — |
| — |
| 315,363 |
|
96.705.990-0 |
| Envases Central S.A. |
| Chile |
| 97.080.000-K |
| Banco Bice |
| Chile |
| Chilean pesos |
| At maturity |
| 4.29 | % | 4.29 | % | 1,949,555 |
| — |
| — |
| — |
| — |
| 1,949,555 |
|
|
|
|
|
|
|
|
|
|
|
|
|
|
|
|
|
|
|
|
|
|
|
|
|
|
|
|
|
|
|
|
|
Total |
|
|
|
|
|
|
|
|
|
|
|
|
|
|
|
|
|
|
|
|
|
|
|
|
|
|
|
|
| 46,414,771 |
|
(1) The Bicentennial credit granted by Banco de la Nación Argentina to Embotelladora del Atlántico S.A. at a preferential rate is a benefit of the Argentine Government to promote investment projects. Embotelladora del Atlántico S.A. registered investment projects and received the bicentennial credit at a preferential rate of 9.9% a year, the financial expense is recognized according to the market rate, and the financial expense differential between market and nominal rate was allocated as a lower cost of the fixed asset.
16.2.1Bonds payable
|
| Current |
| Non-Current |
| Total |
| ||||||
|
| 12.31.2015 |
| 12.31.2014 |
| 12.31.2015 |
| 12.31.2014 |
| 12.31.2015 |
| 12.31.2014 |
|
|
| ThCh$ |
| ThCh$ |
| ThCh$ |
| ThCh$ |
| ThCh$ |
| ThCh$ |
|
Composition of bonds payable |
|
|
|
|
|
|
|
|
|
|
|
|
|
Bonds (face value) |
| 20,172,356 |
| 18,457,970 |
| 723,191,154 |
| 662,420,327 |
| 743,363,510 |
| 680,878,297 |
|
Expenses of bond issuance and discounts on placement |
| (935,576 | ) | (834,087 | ) | (5,186,964 | ) | (5,200,079 | ) | (6,122,540 | ) | (6,034,166 | ) |
Net balance presented in statement of financial position |
| 19,236,780 |
| 17,623,883 |
| 718,004,190 |
| 657,220,248 |
| 737,240,970 |
| 674,844,131 |
|
16.2.217.2.1 Current and non-current balances
Obligations with the publicBonds payable correspond to bonds in UF issued by the parent company on the Chilean market and bonds in USU.S. dollars issued by the parent companyParent Company on the international market:market. A detail of these instruments is presented below:
|
|
|
| Face |
| Unit of |
| Interest |
| Final |
| Interest |
| Date |
|
|
|
|
|
|
| Series |
| amount |
| Adjustment |
| rate |
| Maturity |
| Payment |
| Amortization of capital |
| 12.31.2015 |
| 12.31.2014 |
|
|
|
|
|
|
|
|
|
|
|
|
|
|
|
|
| ThCh$ |
| ThCh$ |
|
Bonds, current portion |
|
|
|
|
|
|
|
|
|
|
|
|
|
|
|
|
|
|
|
SVS Registration N°640 SVS 08.23.2010 |
| A |
| 500,000 |
| UF |
| 3.0 | % | 08-15-2017 |
| Semiannually |
| 02-15-2016 |
| 6,550,372 |
| 6,363,030 |
|
SVS Registration N°254 SVS 06.13.2001 |
| B |
| 2,723,745 |
| UF |
| 6.5 | % | 06-01-2026 |
| Semiannually |
| 06-01-2016 |
| 5,213,755 |
| 4,749,263 |
|
SVS Registration N°641 08.23.2010 |
| C |
| 1,500,000 |
| UF |
| 4.0 | % | 08-15-2031 |
| Semiannually |
| 02-15-2021 |
| 571,003 |
| 548,679 |
|
SVS Registration N°759 08.20.2013 |
| C |
| 1,000,000 |
| UF |
| 3.5 | % | 08-16-2020 |
| Semiannually |
| 02-16-2017 |
| 333,479 |
| 284,837 |
|
SVS Registration N°760 08.20.2013 |
| D |
| 4,000,000 |
| UF |
| 3.8 | % | 08-16-2034 |
| Semiannually |
| 02-16-2032 |
| 1,447,249 |
| 1,236,149 |
|
SVS Registration N°760 04.02.2014 |
| E |
| 3,000,000 |
| UF |
| 3.75 | % | 03-01-2035 |
| Semiannually |
| 09-01-2032 |
| 952,223 |
| 914,996 |
|
Bonds USA |
| — |
| 575,000,000 |
| US$ |
| 5.0 | % | 10-01-2023 |
| Semiannually |
| 10-01-2023 |
| 5,104,275 |
| 4,361,016 |
|
Total current portion |
|
|
|
|
|
|
|
|
|
|
|
|
|
|
| 20,172,356 |
| 18,457,970 |
|
|
|
|
|
|
|
|
|
|
|
|
|
|
|
|
|
|
|
|
|
Bonds non-current portion |
|
|
|
|
|
|
|
|
|
|
|
|
|
|
|
|
|
|
|
SVS Registration N°640 SVS 08.23.2010 |
| A |
| 500,000 |
| UF |
| 3.0 | % | 08-15-2017 |
| Semiannually |
| 02-15-2017 |
| 6,407,273 |
| 12,313,550 |
|
SVS Registration N°254 SVS 06.13.2001 |
| B |
| 2,723,745 |
| UF |
| 6.5 | % | 06-01-2026 |
| Semiannually |
| 06-01-2017 |
| 64,965,518 |
| 67,077,946 |
|
SVS Registration N°641 08.23.2010 |
| C |
| 1,500,000 |
| UF |
| 4.0 | % | 08-15-2031 |
| Semiannually |
| 02-16-2021 |
| 38,443,635 |
| 36,940,650 |
|
SVS Registration N°759 08.20.2013 |
| C |
| 1,000,000 |
| UF |
| 3.5 | % | 08-16-2020 |
| Semiannually |
| 02-16-2017 |
| 25,629,090 |
| 24,662,705 |
|
SVS Registration N°760 08.20.2013 |
| D |
| 4,000,000 |
| UF |
| 3.8 | % | 08-16-2034 |
| Semiannually |
| 02-16-2032 |
| 102,516,360 |
| 98,662,919 |
|
SVS Registration N°760 04.02.2014 |
| E |
| 3,000,000 |
| UF |
| 3.75 | % | 03-01-2035 |
| Semiannually |
| 09-01-2032 |
| 76,887,278 |
| 73,881,307 |
|
Bonds USA |
| — |
| 575,000,000 |
| US$ |
| 5.0 | % | 10-01-2023 |
| Semiannually |
| 10-01-2023 |
| 408,342,000 |
| 348,881,250 |
|
Total non-current portion |
|
|
|
|
|
|
|
|
|
|
|
|
|
|
| 723,191,154 |
| 662,420,327 |
|
| Current | Non-current | |||||||||||||||||||||||||||||||||
| Series | Current nominal amount | Adjustment unit | Interest rate | Final maturity | Interest payment | 12.31.2020 | 12.31.2019 | 12.31.2020 | 12.31.2019 | |||||||||||||||||||||||||
| Bonds | ThCh$ | ThCh$ | ThCh$ | ThCh$ | ||||||||||||||||||||||||||||||
| CMF Registration N° 254 06.13.2001 | B | 1,648,160 | UF | 6,5 | % | 12-01-2026 | Semiannually | 7,776,693 | 7,160,809 | 40,388,468 | 46,659,296 | |||||||||||||||||||||||
| CMF Registration N° 641 08.23.2010 | C | 1,500,000 | UF | 4,0 | % | 08-15-2031 | Semiannually | 647,672 | 630,731 | 43,605,495 | 42,464,910 | |||||||||||||||||||||||
| CMF Registration N° 759 08.20.2013 | C | - | UF | 3,5 | % | 08-16-2020 | Semiannually | - | 7,168,907 | - | - | |||||||||||||||||||||||
| CMF Registration N° 760 08.20.2013 | D | 4,000,000 | UF | 3,8 | % | 08-16-2034 | Semiannually | 1,629,677 | 1,587,051 | 116,281,320 | 113,239,760 | |||||||||||||||||||||||
| CMF Registration N° 760 04.02.2014 | E | 3,000,000 | UF | 3,75 | % | 03-01-2035 | Semiannually | 1,083,063 | 1,048,938 | 87,210,999 | 84,929,828 | |||||||||||||||||||||||
| CMF Registration N° 912 10.10.2018 | F | 5,700,000 | UF | 2,83 | % | 09-25-2039 | Semiannually | 1,234,601 | 1,195,700 | 165,700,881 | 161,366,658 | |||||||||||||||||||||||
| Bonds USA 2023 10.01.2013 | - | 365,000,000 | US$ | 5,0 | % | 10-01-2023 | Semiannually | 3,243,709 | 3,397,459 | 259,496,750 | 273,290,101 | |||||||||||||||||||||||
| Bonds USA 2050 01.21.2020 | - | 300,000,000 | US$ | 3,95 | % | 01-21-2050 | Semiannually | 3,731,618 | - | 213,285,000 | - | |||||||||||||||||||||||
| Total | 19,347,033 | 22,189,595 | 925,968,913 | 721,950,553 | ||||||||||||||||||||||||||||||
Accrued interest included in the current portion of bonds totaled ThCh$8,923,499 and ThCh$8,122,961 atpayable as of December 31, 20152020 and 2014,2019 amounts to CLP 11,841,892 thousand and CLP 7,983,770 thousand, respectively.
16.2.3Non-current maturities 
|
|
|
| Year of maturity |
| Total non- |
| ||||||
|
| Series |
| 2017 |
| 2018 |
| 2019 |
| After |
| 12-31-2015 |
|
|
|
|
| ThCh$ |
| ThCh$ |
| ThCh$ |
| ThCh$ |
| ThCh$ |
|
SVS Registration N°640 08.23.2010 |
| A |
| 6,407,273 |
| — |
| — |
| — |
| 6,407,273 |
|
SVS Registration N°254 06.13.2001 |
| B |
| 5,156,294 |
| 5,491,452 |
| 5,848,396 |
| 48,469,376 |
| 64,965,518 |
|
SVS Registration N°641 08.23.2010 |
| C |
| — |
| — |
| — |
| 38,443,635 |
| 38,443,635 |
|
SVS Registration N°759 08.20.2013 |
| C |
| 6,407,273 |
| 6,407,273 |
| 6,407,273 |
| 6,407,271 |
| 25,629,090 |
|
SVS Registration N°760 08.20.2013 |
| D |
| — | �� | — |
| — |
| 102,516,360 |
| 102,516,360 |
|
SVS Registration N°760 04.02.2014 |
| E |
| — |
| — |
| — |
| 76,887,278 |
| 76,887,278 |
|
Bonds USA |
| — |
| — |
| — |
| — |
| 408,342,000 |
| 408,342,000 |
|
Total |
|
|
| 17,970,840 |
| 11,898,725 |
| 12,255,669 |
| 681,065,920 |
| 723,191,154 |
|
17.2.3 Non-current maturities
| Year of maturity | ||||||||||||||||||||||||
| Series | More than 1 up to 2 | More than 2 up to 3 | More than 3 up to 4 | More than 5 | Total non- current 12.31.2020 | |||||||||||||||||||
| ThCh$ | ThCh$ | ThCh$ | ThCh$ | ThCh$ | ||||||||||||||||||||
| CMF Registration N° 254 06.13.2001 | B | 8,013,138 | 8,533,990 | 9,088,700 | 14,752,640 | 40,388,468 | ||||||||||||||||||
| CMF Registration N° 641 08.23.2010 | C | 3,964,136 | 3,964,136 | 3,964,136 | 31,713,087 | 43,605,495 | ||||||||||||||||||
| CMF Registration N° 760 08.20.2013 | D | - | - | - | 116,281,320 | 116,281,320 | ||||||||||||||||||
| CMF Registration N° 760 04.02.2014 | E | - | - | - | 87,210,999 | 87,210,999 | ||||||||||||||||||
| CMF Registration N° 912 10.10.2018 | F | - | - | - | 165,700,881 | 165,700,881 | ||||||||||||||||||
| USA Bonds | - | - | 259,496,750 | - | - | 259,496,750 | ||||||||||||||||||
| USA 2 Bonds | - | - | - | - | 213,285,000 | 213,285,000 | ||||||||||||||||||
| Total | 11,977,274 | 271,994,876 | 13,052,836 | 628,943,927 | 925,968,913 | |||||||||||||||||||
16.2.4
17.2.4 Market rating
The bonds issued on the Chilean market had the following rating at December 31, 2015:rating:
|
|
|
|
| AA : ICR Compañía Clasificadora de Riesgo Ltda. rating AA : Fitch Chile Clasificadora de Riesgo Limitada rating |
The rating of bonds issued on the international market as of December 31, 2015 ishad the following:
|
|
|
|
|
|
16.2.5Restrictionsfollowing rating:
16.2.5.1BBB : Standard&Poors Global Ratings
BBB+ : Fitch Ratings Inc.
17.2.5 Restrictions
17.2.5.1 Restrictions regarding bonds placed abroadabroad.
On September 26, 2013, Andina issued a bond inObligations with bonds placed abroad are not affected by financial restrictions for the U.S. Market (Bonds USA) for US$575 million at a coupon rate of 5.000% maturing on October 1, 2023. These bonds do not have financial restrictions.periods reported.
16.2.5.217.2.5.2 Restrictions regarding bonds placed in the local market.
Restrictions regardingon the issuance of bonds for a fixed amount registered under number 254.
During 2001, Andina placed local bonds inIn October 2020, the Chilean market. The issuanceConsolidated Financial Liabilities/Consolidated Equity no more than 1.20 times covenant was structured into two series, one of which matured during 2008.amended as follows:
| · | Maintain an indebtedness level where Net Consolidated Financial Liabilities to Consolidated Equity does not exceed 1.20 times. For these purposes Net Consolidated Financial Liabilities shall be regarded as (i) “Other Current Financial Liabilities,” plus (ii) “Other Non-Current Financial Liabilities,” less (iii) the addition of “Cash and Cash Equivalents” plus “Other Current Financial Assets;” plus “Other Non-Current Financial Assets) (to the extent they correspond to asset balances of derivative financial instruments, taken to cover exchange rate and/or interest rate risks on financial liabilities). Consolidated Equity will be regarded as total equity including non-controlling interest. |
The outstanding series as
As of December 31, 20152020, this ratio is Series B for a nominal amount of up to UF 4 million, of which amount UF 3.7 million in bonds were placed with final maturity in the year 2026 at a 6.50% annual interest rate. The balance of outstanding capital as of December 31, 2015 is UF2,724 million.0.51 times.
| · | Maintain, and in no manner lose, sell, assign or transfer to a third party, the geographical area currently denominated as the “Metropolitan Region” (Región Metropolitana) as a territory in Chile in which we have been authorized by The Coca-Cola Company for the development, production, sale and distribution of products and brands of the licensor, in accordance to the respective bottler or license agreement, renewable from time to time. |
Series B was issued with charge to the Bonds Line registered with the Securities Registered under number 254 dated June 13, 2001.

| · | Not lose, sell, assign, or transfer to a third party any other territory of Argentina or Brazil, which as of this date is franchised by TCCC to the Company for the development, production, sale and distribution of products and brands of such licensor, as long as any of these territories account for more than 40% of the Issuer's Adjusted Consolidated Operating Cash Flow. |
| · | Maintain consolidated assets free of any pledge, mortgage or other encumbrances for an amount at least equal to 1.3 times of the issuer’s unsecured consolidated liabilities. |
Regarding Series B, the Issuer is subject to the following restrictions:
· Maintain an indebtedness level where Consolidated Financial Liabilities to Consolidated Equity does not exceed 1.20 times. For these purposes Consolidated Financial LiabilitiesUnsecured consolidated liabilities payable shall be regarded as Liabilities Receivables accruing interest, namely: (i) other current financialthe total liabilities, plus (ii) other non-current financial liabilities,obligations and debts of the issuer that are not secured by real guarantees on goods and assets of the latter, voluntarily and conventionally constituted by the issuer less (iii)the asset balances of derivative financial instruments, taken to cover exchange rate or interest rate risks on financial liabilities under “Other"Other Current Financial Assets”Assets" and “Other"Other non-current Financial Assets”Assets" of the Issuer’s Consolidated Statement of Financial Statements.Position.
·Consolidated EquityAssets free of any pledge, mortgage or other lien will only be regarded as total equity including non-controlling interest.
As of December 31, 2015, Indebtedness Level is 0.76 times of Consolidated Equity.
The breakdown of accounts with the respective amounts used for the previous calculation is summarized as follows (in thousand Chilean pesos):
|
| ||
|
| ||
|
| ||
|
| ||
|
|
· Maintain, and in no manner lose, sell, assign or transfer to a third party, the geographical area currently denominated as the “Metropolitan Region” (Región Metropolitana) as a territory in Chile in which we have been authorized by The Coca-Cola Company for the development, production, sale and distribution of products and brands of the licensor, in accordance to the respective bottler or license agreement, renewable from time to time.
· Not lose, sell, assign, or transfer to a third party any other territory of Argentina or Brazil, which as of this date is franchised by TCCC to the Company for the development, production, sale and distribution of products and brands of such licensor, as long as any of these territories account for more than 40% of the Issuer’s Adjusted Consolidated Operating Cash Flow.
· Maintain consolidatedthose assets free of any pledge, mortgage or other encumbrances for an amount at least equalreal lien voluntarily and conventionally constituted by the issuer less asset balances of derivative financial instruments, taken to 1.30cover exchange rate or interest rate risks on financial liabilities and under "Other Current Financial Assets" and "Other non-current Financial Assets" of the Issuer’s Consolidated Statement of Financial Position.
As of December 31, 2020, this ratio is 1.55 times.
Restrictions to bond lines registered in the Securities Registered under number 641, series C
| · | Maintain a level of "Net Financial Debt" within its quarterly financial statements that may not exceed 1.5 times, measured over figures included in its consolidated statement of financial position. To this end, net financial debt shall be defined as the ratio between net financial debt and total equity of the issuer (equity attributable to controlling owners plus non-controlling interest). On its part, net financial debt will be the difference between the Issuer's financial debt and cash. |
As of December 31, 2020, Net Financial Debt level was 0.51 times.
| · | Maintain consolidated assets free of any pledge, mortgage or other encumbrances for an amount at least equal to 1.3 times of the issuer’s unsecured consolidated liabilities. |
Unencumbered assets refer to the assets that are the property of the issuer; classified under Total Assets of the Issuer’s Financial Statements; and that are free of any pledge, mortgage or other liens constituted in favor of third parties, less "Other Current Financial Assets" and "Other Non-Current Financial Assets" of the Issuer’s Financial Statements (to the extent they correspond to asset balances of derivative financial instruments, taken to hedge exchange rate and interest rate risk of the financial liabilities).
Unsecured total liabilities correspond to: liabilities from Total Current Liabilities and Total Non-Current Liabilities of Issuer’s Financial Statement which do not benefit from preferences or privileges, less "Other Current Financial Assets" and "Other Non-Current Financial Assets" of the Issuer’s Financial Statements (to the extent they correspond to asset balances of derivative financial instruments, taken to hedge exchange rate and interest rate risk of the financial liabilities).
As of December 31, 2020, this ratio is 1.55 times.

| · | Maintain a level of "Net Financial Coverage" greater than 3 times in its quarterly financial statements. Net financial coverage means the ratio between the issuer's Ebitda of the last 12 months and the issuer's Net Financial Expenses in the last 12 months. Net Financial Expenses will be regarded as the difference between the absolute value of interest expense associated with the issuer's financial debt account accounted for under "Financial Costs"; and interest income associated with the issuer's cash accounted for under the Financial Income account. However, this restriction shall be deemed to have been breached where the mentioned level of net financial coverage is lower than the level previously indicated during two consecutive quarters. |
As of December 31, 2020, Net Financial Coverage level is 8.50 times.
Restrictions to bond lines registered in the Securities Registrar under number 760 D-E.
| · | Maintain an indebtedness level where Net Consolidated Financial Liabilities to Consolidated Equity does not exceed 1.20 times. For these purposes Net Consolidated Financial Liabilities shall be regarded as (i) “Other Current Financial Liabilities,” plus (ii) “Other Non-Current Financial Liabilities,” less (iii) the addition of “Cash and Cash Equivalents” plus “Other Current Financial Assets;” plus “Other Non-Current Financial Assets) (to the extent they correspond to asset balances of derivative financial instruments, taken to cover exchange rate and/or interest rate risks on financial liabilities). Consolidated Equity will be regarded as total equity including non-controlling interest. |
As of December 31, 2020, Indebtedness Level is 0.51 times of the issuer’s unsecured consolidated liabilities.Consolidated Equity.
| · | Maintain consolidated assets free of any pledge, mortgage or other encumbrances for an amount at least equal to 1.3 times of the issuer’s unsecured consolidated liabilities payable. |
Unsecured Consolidated Liabilities Payable shall be regarded as the total liabilities, obligations and debts of the issuer that are not secured by real guarantees on goods and assets of the latter, voluntarily and conventionally constituted by the issuer less the asset balances of derivative financial instruments, taken to cover exchange rate or interest rate risks on financial liabilities under “Other"Other Current Financial Assets”Assets" and “Other"Other non-current Financial Assets”Assets" of the Issuer’s Consolidated Statement of Financial Statements.Position.
The following will be considered in determining Consolidated Assets: assets free of any pledge, mortgage or other lien, as well as those assets having a pledge, mortgage or real encumbrances that operate solely by law, less asset balances of derivative financial instruments, taken to hedge exchange rate or interest rate risks on financial liabilities under “Other"Other Current Financial Assets”Assets" and “Other"Other non-current Financial Assets”Assets" of the Issuer’s Consolidated Financial Statements. Therefore, Consolidated Assets free of any pledge, mortgage or other lien will only be regarded as those assets free of any pledge, mortgage or other real lien voluntarily and conventionally constituted by the issuer less asset balances of derivative financial instruments, taken to cover exchange rate or interest rate risks on financial liabilities and under “Other"Other Current Financial Assets”Assets" and “Other"Other non-current Financial Assets”Assets" of the Issuer’s Consolidated Statement of Financial Statements.
Table of ContentsPosition.
As of December 31, 2015,2020, this indexratio is 1.64 times
The breakdown of accounts with the respective amounts used for the previous calculation is summarized as follows:1.55 times.
| · | Maintain, and in no manner, lose, sell, assign or transfer to a third party, the geographical area currently denominated as the “Metropolitan Region” as a territory franchised to the Issuer in Chile by The Coca-Cola Company, hereinafter also referred to as "TCCC" or the "Licensor" for the development, production, sale and distribution of terms of accounting with the |
| ||
|
| ||||
|
| ||||
|
| ||||
|
| ||||
|
| ||||
|
| Issuer. |
Restrictions regarding bond lines registered in the Securities Registrered under numbers 640 and 641.
As a consequence of our merger with Coca-Cola Polar S.A., Andina became a debtor of the following two bonds placed in the Chilean market in 2010:
· UF 1.0 million of Series A bonds due 2017, bearing an annual interest of 3.00%. As of December 31, 2015, the balance of outstanding capital is UF 0.5 million.
· UF 1.5 million of Series C bonds due 2031, bearing an annual interest rate of 4.00%. As of December 31, 2015, the balance of outstanding capital is UF 1.5 million.
Series A and Series C were issued with charge to the Bond Lines registered with the Securities Registrar, under numbers 640 and 641, respectively, both on August 23, 2010.
Regarding Series A and Series C, the Issuer is subject to the following restrictions:
· Maintain a level of “Net Financial Debt” within its quarterly financial statements that may not exceed 1.5 times, measured over figures included in its consolidated statement of financial position. To this end, net financial debt shall be defined as the ratio between net financial debt and total equity of the issuer (equity attributable to controlling owners plus non-controlling interest). On its part, net financial debt will be the difference between the Issuer’s financial debt and cash.
As of December 31, 2015, Net Financial Debt was 0.50 times.
The breakdown of accounts with the respective amounts used for the previous calculation is summarized as follows:
| · | Not lose, sell, assign, or transfer to a third party any other territory of |
| ||
|
| ||||
|
| ||||
|
| ||||
|
| ||||
|
| ||||
|
| equity method"; plus (v) "Depreciation"; plus (vi) "Intangibles Amortization". |
· Maintain consolidated assets free of any pledge, mortgage or other encumbrances for an amount at least equal to 1.30 times of the issuer’s unsecured consolidated liabilities.
Unencumbered assets referRestrictions to the assets that meet the following conditions: are the property of the issuer; classified under Total Assets of the Issuer’s Financial Statements; and that are free of any pledge, mortgage or other liens constituted in favor of third parties, less “Other Current Financial Assets” and “Other Non-Current Financial Assets” of the Issuer’s Financial Statements (to the extent they correspond to asset balances of derivative financial instruments, taken to hedge exchange rate and interest rate risk of the financial liabilities).
Unsecured total liabilities refers to: liabilities from Total Current Liabilities and Total Non-Current Liabilities of Issuer’s Financial Statement which do not benefit from preferences or privileges, less “Other Current Financial Assets” and “Other Non-Current Financial Assets” of the Issuer’s Financial Statements (to the extent they correspond to asset balances of derivative financial instruments, taken to hedge exchange rate and interest rate risk of the financial liabilities).
As of December 31, 2015, this index is 1.64 times.
The breakdown of accounts with the respective amounts used for the previous calculation is summarized as follows:
|
| ||
|
| ||
|
| ||
|
| ||
|
| ||
|
| ||
|
|
· Not carry out investments in instruments issued by related parties, nor carry out with these parties any other operations not related to normal business, in conditions that may be more unfavorable to the Issuer regarding those prevailing in the market.
· Maintain a level of “Financial net coverage” in its quarterly financial statements of more than 3 times. Net financial coverage means the ratio between the Issuer’s Ebitda for the past 12 months and net financial expenses (financial income less financial expenses) of the issuer for the past 12 months.
However, this restriction will be considered breached when the mentioned net financial coverage level is lower than the level previously indicated during two consecutive quarters.
As of December 31, 2015 Net Financial Coverage level is 6.46 times.
The breakdown of accounts with the respective amounts used for the previous calculation is summarized as follows:
|
| ||
|
| ||
|
| ||
|
|
Restrictions regarding bond lines registered in the Securities Registrar under numbers 759 and 760number 912.
During 2013 and 2014, Andina placed local bonds in the Chilean market. The issuance was structured into two series.
· Series C outstanding as of December 31, 2015, for a nominal value of up to UF 3 million, of which bonds were placed for a nominal amount of UF1.0 million with final maturity during year 2020 at an annual interest rate of 3.50% issued against line number 759. Outstanding capital as of December 31, 2015 is UF 1.0 million.
· Series D and E outstanding at December 31, 2015 for a total nominal value of UF 8 million, of which UF 4 million were placed in bonds during August, 2013 (series D) and UF 3 million during April, 2014 (series E), with final maturity in 2034 and 2035, respectively, issued with charge against line number 760. The anual interest rates are 3.8% for Series D and 3.75% for Series E. The oustanding capital balance at December 31, 2015 of both series amounts to UF 7.0 million.
Regarding Series C, D and E, the Issuer is subject to the following restrictions:
· Maintain an indebtedness level where Consolidated Financial Liabilities to Consolidated Equity does not exceed 1.20 times. For these purposes Consolidated Financial Liabilities shall be regarded as Liabilities Receivables accruing interest, namely: (i) other current financial liabilities, plus (ii) other non-current financial liabilities, less (iii) cash and cash equivalent and (iv) other current financial assets, and (v) other non-current financial assets (to the extent they are asset balances of derivative financial instruments, taken to hedge exchange rate or interest rate risks on financial liabilities). Consolidated Equity will be regarded as total equity including non-controlling interest.
| · | Maintain an indebtedness level where Net Consolidated Financial Liabilities to Consolidated Equity does not exceed 1.20 times. For these purposes Net Consolidated Financial Liabilities shall be regarded as (i) “Other Current Financial Liabilities,” plus (ii) “Other Non-Current Financial Liabilities,” less (iii) the addition of “Cash and Cash Equivalents” plus “Other Current Financial Assets;” plus “Other Non-Current Financial Assets) (to the extent they correspond to asset balances of derivative financial instruments, taken to cover exchange rate and/or interest rate risks on financial liabilities). Consolidated Equity will be regarded as total equity including non-controlling interest. |
As of December 31, 2015, Indebtedness Level2020, this ratio is 0.50 times of Consolidated Equity
The breakdown of accounts with the respective amounts used for the previous calculation is summarized as follows:0.51 times.
| · | Maintain consolidated assets free of |
| ||
|
| ||||
|
| ||||
|
| ||||
|
| ||||
|
| ||||
|
| Statement of Financial Position. |
· Maintain consolidated assets free of any pledge, mortgage or other encumbrances for an amount at least equal to 1.30 times of the issuer’s unsecured consolidated liabilities payable.
Unsecured Consolidated Liabilities Payable shall be regarded as the total liabilities, obligations and debts of the issuer that are not secured by real guarantees on goods and assets of the latter, voluntarily and conventionally constituted by the issuer less the asset balances of derivative financial instruments, taken to cover exchange rate or interest rate risks on financial liabilities under “Other Current Financial Assets” and “Other non-current Financial Assets” of the Issuer’s Consolidated Financial Statements.
The following will be considered in determining Consolidated Assets: assets free of any pledge, mortgage or other lien, as well as those assets having a pledge, mortgage or real encumbrances that operate solely by law, less asset balances of derivative financial instruments, taken to hedge exchange rate or interest rate risks on financial liabilities under “Other Current Financial Assets” and “Other non-current Financial Assets” of the Issuer’s Consolidated Financial Statements. Therefore, Consolidated Assets free of any pledge, mortgage or other lien will only be regarded as those assets free of any pledge, mortgage or other real lien voluntarily and conventionally constituted by the issuer less asset balances of derivative financial instruments, taken to cover exchange rate or interest rate risks on financial liabilities and under “Other Current Financial Assets” and “Other non-current Financial Assets” of the Issuer’s Consolidated Financial Statements.
As of December 31, 2015,2020, this indexratio is 1.641.55 times.
The breakdown of accounts with the respective amounts used for the previous calculation is summarized as follows:
| · | Not lose, sell, assign, or transfer to a third party any other territory of |
| ||
|
| ||||
|
| ||||
|
| ||||
|
| ||||
|
| ||||
|
| equity method"; plus (v) "Depreciation"; plus (vi) "Intangibles Amortization". |
· Maintain, and in no manner lose, sell, assign or transfer to a third party, the geographical area currently denominated as the “Metropolitan Region” as a territory franchised to the Issuer in Chile by The Coca-Cola Company, hereinafter also referred to as “TCCC” or the “Licensor” for the development, production, sale and distribution of products and brands of said licensor, in accordance to the respective bottler or license agreement, renewable from time to time. Losing said territory, means the non-renewal, early termination or cancellation of this license agreement by TCCC, for the geographical area today called “Metropolitan Region”. This reason shall not apply if, as a result of the loss, sale, transfer or disposition, of that licensed territory is purchased or acquired by a subsidiary or an entity that consolidates in terms of accounting with the Issuer.
· Not lose, sell, assign, or transfer to a third party any other territory of Argentina or Brazil, which as of the issuance date of these instruments is franchised by TCCC to the Issuer for the development, production, sale and distribution of products and brands of such licensor, as long as any of these territories account for more than 40% of the Issuer’s Adjusted Consolidated Operating Cash Flow of the audited period immediately before the moment of loss, sale, assignment or transfer. For these purposes, the term “Adjusted Consolidated Operating Cash Flow” shall mean the addition of the following accounting accounts of the Issuer’s Consolidated Statement of Financial Position: (i) “Gross Profit” which includes regular activities and cost of sales; less (ii) “Distribution Costs”; less (iii) “Administrative Expenses”; plus (iv) “Participation in profits (losses) of associates and joint ventures that are accounted for using the equity method”; plus (v) “Depreciation”; plus (vi) “Intangibles Amortization”.
As of December 31, 20152020 and 2014,2019, the Company complies with all financial collaterals.
16.2.6Repurchased bonds
In addition to UF bonds, the Company holds bonds that it has repurchased in full through companies that are included in the consolidation:
Through its subsidiaries, Abisa Corp S.A. (formerly Pacific Sterling), Embotelladora Andina S.A. repurchased its Bonds USA issued on the U.S. Market during the years 2000, 2001, 2002, 2007 and 2008. The entire placement amounted to US$350 million, of which US$200 million are outstanding at December 31, 2013. On December 15, 2014, Embotelladora Andina S.A. rescued US$200 million in outstanding bonds from its subsidiary Abisa Corp S.A., thus since legally debtor and creditor are joined in a single entity, the mentioned bond liability becomes extinguished.
The subsidiary Rio de Janeiro Refrescos Ltda. maintains a liability corresponding to a bond issuance for US $75 million due in December 2020 and semi-annual interest payments. On December 31, 2015 these issues belong to Andina, until December 31, 2012 belong to the subsidiary Abisa Corp S.A., (former Pacific Sterling). On January 1, 2013, Abisa Corp S.A. transferred the totality of this asset to Embotelladora Andina S.A., passing the latter to be the creditor of the above mentioned Brazilian subsidiary. As a result, in these consolidated financial statements the assets and liabilities related to the transaction have been eliminated. In addition, the transaction has been treated as a net investment of the group in the Brazilian subsidiary, consequently the effects of exchange rate differences between the dollar and the functional currency of each one have been recorded in other comprehensive income.
16.3.117.3 Derivative contract obligations.obligations
Please see details in Note 21.22.
16.4.117.4.1 Current liabilities for leasing agreements
|
|
|
|
|
|
|
|
|
|
|
|
|
|
|
|
|
| Maturity |
| Total |
| Maturity | Total | ||||||||||||||||||||||||||||||||||||||
Indebted Entity |
| Creditor Entity |
|
|
| Amortization |
| Effective |
| Nomina |
| Up to |
| 90 fays to |
| at |
| at |
| ||||||||||||||||||||||||||||||||||||||||||
| Debtor Entity | Debtor Entity | Creditor Entity | Type of | Effective | Nominal | Up to | 90 days to | At | At | ||||||||||||||||||||||||||||||||||||||||||||||||||||
Name |
| Country |
| Tax,ID |
| Name |
| Country |
| Currency |
| type |
| rate |
| rate |
| 90 days |
| 1 year |
| 12.31.2015 |
| 12.31.2014 |
| Country | Taxpayer ID | Name | Country | Currency | Amortization | Rate | Rate | 90 days | 1 year | 12.31.2020 | 12.31.2019 | ||||||||||||||||||||||||
|
|
|
|
|
|
|
|
|
|
|
|
|
|
|
|
|
| ThCh$ |
| ThCh$ |
| ThCh$ |
| ThCh$ |
| ThCh$ | ThCh$ | ThCh$ | ThCh$ | ||||||||||||||||||||||||||||||||
Rio de Janeiro Refrescos Ltda. |
| Brazil |
| Foreign |
| Banco Santander |
| Brazil |
| Brazilian real |
| Monthly |
| 9.65 | % | 9.47 | % | 306,220 |
| 738,064 |
| 1,044,284 |
| 1,736,508 |
| Brazil | Foreign | Cogeração - Light ESCO | Brasil | BRL | Monthly | 13.00 | % | 12.28 | % | 166,711 | 531,815 | 698,526 | 839,502 | ||||||||||||||||||||||
Rio de Janeiro Refrescos Ltda. |
| Brazil |
| Foreign |
| Banco Citibank |
| Brazil |
| Brazilian real |
| Monthly |
| 8.54 | % | 8.52 | % | 266,709 |
| 513,539 |
| 780,248 |
| 655,131 |
| Brazil | Foreign | Tetra Pack | Brasil | BRL | Monthly | 7.65 | % | 7.39 | % | 61,617 | 147,121 | 208,738 | 360,854 | ||||||||||||||||||||||
Rio de Janeiro Refrescos Ltda. |
| Brazil |
| Foreign |
| Cogeracao Ligth Esco |
| Brazil |
| Brazilian real |
| Monthly |
| 13.00 | % | 12.28 | % | 120,287 |
| 292,005 |
| 412,292 |
| 605,105 |
| Brazil | Foreign | Real estate | Brasil | BRL | Monthly | 8.20 | % | 8.20 | % | 66,160 | 117,534 | 183,694 | 300,338 | ||||||||||||||||||||||
Rio de Janeiro Refrescos Ltda. |
| Brazil |
| Foreign |
| Banco Itaú |
| Brazil |
| Brazilian real |
| Monthly |
| 10.21 | % | 10.22 | % | 49,611 |
| 148,832 |
| 198,443 |
| 369,895 |
| Brazil | Foreign | Leão | Brasil | BRL | Monthly | 6.56 | % | 6.56 | % | 68,366 | 200,944 | 269,310 | 497,386 | ||||||||||||||||||||||
Rio de Janeiro Refrescos Ltda. |
| Brazil |
| Foreign |
| Banco Bradesco |
| Brazil |
| Brazilian real |
| Monthly |
| 9.39 | % | 9.38 | % | 31,525 |
| 71,619 |
| 103,144 |
| 247,844 |
| ||||||||||||||||||||||||||||||||||||
Embotelladora del Atlántico S.A. |
| Argentina |
| Foreign |
| Tetra Pak SRL |
| Argentina |
| Dollars |
| Monthly |
| 12.00 | % | 12.00 | % | 23,237 |
| 74,023 |
| 97,260 |
| 73,744 |
| Argentina | Foreign | Tetra Pak SRL | Argentina | USD | Monthly | 12.00 | % | 12.00 | % | 20,867 | 62,602 | 83,469 | 132,815 | ||||||||||||||||||||||
| Embotelladora del Atlántico S.A. | Argentina | Foreign | Banco Comafi | Argentina | USD | Monthly | 12.00 | % | 12.00 | % | 31,232 | 93,695 | 124,927 | 88,739 | |||||||||||||||||||||||||||||||||||||||||||||||
| Embotelladora del Atlántico S.A. | Argentina | Foreign | Real estate | Argentina | ARS | Monthly | 50.00 | % | 50.00 | % | 65,656 | 148,249 | 213,905 | 189,320 | |||||||||||||||||||||||||||||||||||||||||||||||
| Embotelladora del Atlántico S.A. | Argentina | Foreign | Systems | Argentina | USD | Monthly | 1.00 | % | 1.00 | % | 20,556 | 61,671 | 82,227 | 1,169,884 | |||||||||||||||||||||||||||||||||||||||||||||||
| Vital Aguas S.A. | Chile | 76.389.720-6 | Coca Cola del Valle New Ventures S.A. | Chile | CLP | Linear | 7.50 | % | 7.50 | % | 289,312 | 882,152 | 1,171,464 | 2,198,998 | |||||||||||||||||||||||||||||||||||||||||||||||
| Envases Central S.A. | Chile | 96.705.990-0 | Coca Cola del Valle New Ventures S.A. | Chile | CLP | Linear | 8.40 | % | 8.40 | % | 565,631 | 1,724,833 | 2,290,464 | 235,699 | |||||||||||||||||||||||||||||||||||||||||||||||
| Paraguay Refrescos S.A. | Paraguay | 80.003.400-7 | Tetra Pack Ltda. Suc. Py | Paraguay | PGY | Monthly | 1.00 | % | 1.00 | % | 55,952 | 159,680 | 215,632 | - | |||||||||||||||||||||||||||||||||||||||||||||||
| Transportes Polar S.A. | Chile | 96.928.520-7 | Cons. Inmob. e Inversiones Limitada | Chile | UF | Monthly | 2.89 | % | 2.89 | % | 22,944 | 69,834 | 92,778 | - | |||||||||||||||||||||||||||||||||||||||||||||||
| Embotelladora Andina S.A. | Chile | 91.144.000-8 | Central de Restaurante Aramark Ltda. | Chile | CLP | Monthly | 1.30 | % | 1.30 | % | 20,736 | 62,614 | 83,350 | - | |||||||||||||||||||||||||||||||||||||||||||||||
|
|
|
|
|
|
|
|
|
|
|
|
|
|
|
|
|
|
|
|
|
|
|
|
|
| Total | 5,718,484 | 6,013,535 | |||||||||||||||||||||||||||||||||
Total |
|
|
|
|
|
|
|
|
|
|
|
|
|
|
|
|
|
|
|
|
| 2,635,671 |
| 3,688,227 |
| ||||||||||||||||||||||||||||||||||||
The Company maintains lease agreements on forklifts, vehicles, real estate and machinery. These leases have an average life of between one and eight years without including a renewal option in the contracts.
17.4.2 Non-current 16.4.2 Non-Current liabilities for leasing agreements, December 31, 2015non-current
|
|
|
|
|
|
|
|
|
|
|
|
|
|
|
|
|
| Maturity |
|
|
| ||||||||
Indebted Entity |
| Creditor Entity |
|
|
| Amortization |
| Effective |
| Nominal |
| 1 year to |
| 2 years to |
| 3 years to |
| 4 years to |
| more |
| at |
| ||||||
Name |
| Country |
| Tax,ID |
| Name |
| Type |
| Currency |
| type |
| rate |
| rate |
| 2 years |
| 3 years |
| 4 years |
| 5 years |
| 5 years |
| 12.31.2015 |
|
|
|
|
|
|
|
|
|
|
|
|
|
|
|
|
|
|
| ThCh$ |
| ThCh$ |
| ThCh$ |
| ThCh$ |
| ThCh$ |
| ThCh$ |
|
Rio de Janeiro Refrescos Ltda. |
| Brazil |
| Foreign |
| Cogeracao Ligth Esco |
| Brazil |
| Brazilian real |
| Monthly |
| 13.00 | % | 12.28 | % | 1,940,324 |
| 2,799,686 |
| — |
| — |
| 10,457,637 |
| 15,197,647 |
|
Rio de Janeiro Refrescos Ltda. |
| Brazil |
| Foreign |
| Banco Santander |
| Brazil |
| Brazilian real |
| Monthly |
| 9.65 | % | 9.47 | % | 437,913 |
| 84,568 |
| — |
| — |
| — |
| 522,481 |
|
Rio de Janeiro Refrescos Ltda. |
| Brazil |
| Foreign |
| Banco Itaú |
| Brazil |
| Brazilian real |
| Monthly |
| 10.21 | % | 10.22 | % | 327,205 |
| — |
| — |
| — |
| — |
| 327,205 |
|
Rio de Janeiro Refrescos Ltda. |
| Brazil |
| Foreign |
| Banco Citibank |
| Brazil |
| Brazilian real |
| Monthly |
| 8.54 | % | 8.52 | % | 269,316 |
| 245,255 |
| — |
| — |
| — |
| 514,571 |
|
Rio de Janeiro Refrescos Ltda. |
| Brazil |
| Foreign |
| Banco Bradesco |
| Brazil |
| Brazilian real |
| Monthly |
| 9.39 | % | 9.38 | % | 7,226 |
| — |
| — |
| — |
| — |
| 7,226 |
|
Embotelladora del Atlántico S.A. |
| Argentina |
| Foreign |
| Tetra Pak SRL |
| Argentina |
| Dollars |
| Monthly |
| 12.00 | % | 12.00 | % | 488,074 |
| — |
| — |
| — |
| — |
| 488,074 |
|
|
|
|
|
|
|
|
|
|
|
|
|
|
|
|
|
|
|
|
|
|
|
|
|
|
|
|
|
|
|
|
|
|
|
|
|
|
|
|
|
|
|
|
|
|
|
|
|
|
|
|
|
|
| Total |
|
|
| 17,057,204 |
|
| Maturity | ||||||||||||||||||||||||||||||||||||||||||||
Debtor Entity | Creditor Entity | Amortization | Effective | Nominal | 1 year to | 2 years to | 3 years to | 4 years to | More than | At | ||||||||||||||||||||||||||||||||||
| Name | Country | Taxpayer ID | Name | Country | Currency | Type | Rate | Rate | 2 years | 3 years | 4 years | 5 years | 5 years | 12.31.2020 | ||||||||||||||||||||||||||||||
| ThCh$ | ThCh$ | ThCh$ | ThCh$ | ThCh$ | ThCh$ | |||||||||||||||||||||||||||||||||||||||
| Rio de Janeiro Refrescos Ltda. | Brazil | Foreign | Cogeração - Light ESCO | Brazil | BRL | Monthly | 13.0 | % | 12.28 | % | 789,334 | 891,946 | 1,007,901 | 1,138,928 | 4,827,833 | 8,655,942 | ||||||||||||||||||||||||||||
| Rio de Janeiro Refrescos Ltda. | Brazil | Foreign | Tetra Pack| | Brazil | BRL | Monthly | 7.65 | % | 7.39 | % | 95,856 | - | - | - | - | 95,856 | ||||||||||||||||||||||||||||
| Rio de Janeiro Refrescos Ltda. | Brazil | Foreign | Real estate | Brazil | BRL | Monthly | 8.20 | % | 8.20 | % | 72,906 | 32,980 | 23,547 | - | - | 129,433 | ||||||||||||||||||||||||||||
| Rio de Janeiro Refrescos Ltda. | Brazil | Foreign | Leão Alimentos e Bebidas Ltda. | Brazil | BRL | Monthly | 6.56 | % | 6.56 | % | 261,577 | 249,681 | 243,911 | 225,680 | 51,007 | 1,031,856 | ||||||||||||||||||||||||||||
| Embotelladora del Atlántico S.A. | Argentina | Foreign | Banco Comafi | Argentina | USD | Monthly | 12.00 | % | 12.00 | % | - | 20,867 | - | - | - | 20,867 | ||||||||||||||||||||||||||||
| Embotelladora del Atlántico S.A. | Argentina | Foreign | Tetra Pak SRL | Argentina | USD | Monthly | 12.00 | % | 12.00 | % | - | 249,854 | - | 249,854 | 72,874 | 572,582 | ||||||||||||||||||||||||||||
| Embotelladora del Atlántico S.A. | Argentina | Foreign | Real estate | Argentina | ARS | Monthly | 50.00 | % | 50.00 | % | - | 128,930 | - | - | - | 128,930 | ||||||||||||||||||||||||||||
| Embotelladora del Atlántico S.A. | Argentina | Foreign | Real estate | Argentina | ARS | Monthly | 50.00 | % | 50.00 | % | - | 95,931 | - | - | - | 95,931 | ||||||||||||||||||||||||||||
| Vital Aguas S.A. | Chile | 76.572.588-7 | Coca Cola del Valle New Ventures S.A. | Chile | CLP | Monthly | 8.20 | % | 8.20 | % | 1,107,140 | - | - | - | - | 1,107,140 | ||||||||||||||||||||||||||||
| Envases Central S.A. | Chile | 76.572.588-7 | Coca Cola del Valle New Ventures S.A. | Chile | CLP | Monthly | 9.00 | % | 9.00 | % | 2,967,864 | - | - | - | - | 2,967,864 | ||||||||||||||||||||||||||||
| Paraguay Refrescos S.A. | Paraguay | 80.003.400-7 | Tetra Pack Ltda. Suc. Py | Paraguay | PGY | Monthly | 1.00 | % | 1.00 | % | - | 163,635 | - | - | - | 163,635 | ||||||||||||||||||||||||||||
| Transportes Polar S.A. | Chile | 76.413.243-2 | Cons. Inmob. e Inversiones Limitada | Chile | UF | Monthly | 2.89 | % | 2.89 | % | - | 193,789 | - | 161,551 | - | 355,340 | ||||||||||||||||||||||||||||
| Embotelladora Andina S.A. | Chile | 76.178.360-2 | Central de Restaurante Aramark Ltda. | Chile | CLP | Monthly | 1.30 | % | 1.30 | % | - | 13,997 | - | - | - | 13,997 | ||||||||||||||||||||||||||||
| Total | 15,339,373 | |||||||||||||||||||||||||||||||||||||||||||
16.4.2 Non-Current liabilities for leasing agreements December 31, 2014(previous year)
|
|
|
|
|
|
|
|
|
|
|
|
|
|
|
|
|
| Maturity |
|
|
| Maturity | |||||||||||||||||||||||||||||||||||||||||||||||||||
Indebted Entity |
| Creditor Entity |
|
|
| Amortization |
| Effective |
| Nominal |
| 1 year to |
| 2 years to |
| 3 years to |
| 4 years to |
| more |
| at |
| ||||||||||||||||||||||||||||||||||||||||||||||||||
| Debtor Entity | Debtor Entity | Creditor Entity | Amortization | Effective | Nominal | 1 year to | 2 years to | 3 years to | 4 years to | More than | At | ||||||||||||||||||||||||||||||||||||||||||||||||||||||||||||||
Name |
| Country |
| Tax,ID |
| Name |
| Type |
| Currency |
| type |
| rate |
| rate |
| 2 years |
| 3 years |
| 4 years |
| 5 years |
| 5 years |
| 12.31.2014 |
| Country | Taxpayer ID | Name | Country | Currency | Type | Rate | Rate | 2 years | 3 years | 4 years | 5 years | 5 years | 12.31.2019 | ||||||||||||||||||||||||||||||
|
|
|
|
|
|
|
|
|
|
|
|
|
|
|
|
|
| ThCh$ |
| ThCh$ |
| ThCh$ |
| ThCh$ |
| ThCh$ |
| ThCh$ |
| ThCh$ | ThCh$ | ThCh$ | ThCh$ | ThCh$ | ThCh$ | ||||||||||||||||||||||||||||||||||||||
Rio de Janeiro Refrescos Ltda. |
| Brazil |
| Foreign |
| Banco Itaú |
| Brazil |
| Brazilian real |
| Monthly |
| 10.21 | % | 10.22 | % | 479,460 |
| — |
| — |
| — |
| — |
| 479,460 |
| Brazil | Foreign | Cogeração - Light ESCO | Brazil | BRL | Monthly | 13.0 | % | 12.28 | % | 948,466 | 1.071.766 | 1.211.096 | 1.368.538 | 8.101.730 | 12.701.596 | ||||||||||||||||||||||||||||
Rio de Janeiro Refrescos Ltda. |
| Brazil |
| Foreign |
| Banco Santander |
| Brazil |
| Brazilian real |
| Monthly |
| 9.65 | % | 9.47 | % | 18,881 |
| — |
| — |
| — |
| — |
| 18,881 |
| Brazil | Foreign | Tetra Pack | Brazil | BRL | Monthly | 7.65 | % | 7.39 | % | 271,264 | 111.005 | - | - | - | 382.269 | ||||||||||||||||||||||||||||
Rio de Janeiro Refrescos Ltda. |
| Brazil |
| Foreign |
| Cogeracao Ligth Esco |
| Brazil |
| Brazilian real |
| Monthly |
| 13.00 | % | 13.00 | % | 1,945,291 |
| 1,945,291 |
| 1,945,291 |
| 1,945,291 |
| 11,939,924 |
| 19,721,088 |
| Brazil | Foreign | Real estate | Brazil | BRL | Monthly | 8.20 | % | 8.20 | % | 97,784 | 9.144 | - | - | - | 106.928 | ||||||||||||||||||||||||||||
Rio de Janeiro Refrescos Ltda. |
| Brazil |
| Foreign |
| Alfa |
| Brazil |
| Brazilian real |
| Monthly |
| 13.00 | % | 13.00 | % | 43,401 |
| — |
| — |
| — |
| — |
| 43,401 |
| Brazil | Foreign | Leão Alimentos e Bebidas Ltda. | Brazil | BRL | Monthly | 6.56 | % | 6.56 | % | 365,671 | 355.172 | 339.020 | 331.185 | 375.688 | 1.766.736 | ||||||||||||||||||||||||||||
Rio de Janeiro Refrescos Ltda. |
| Brazil |
| Foreign |
| Banco Bradesco |
| Brazil |
| Brazilian real |
| Monthly |
| 13.06 | % | 13.06 | % | 125,635 |
| — |
| — |
| — |
| — |
| 125,635 |
| ||||||||||||||||||||||||||||||||||||||||||||
Rio de Janeiro Refrescos Ltda. |
| Brazil |
| Foreign |
| Banco Citibank |
| Brazil |
| Brazilian real |
| Monthly |
| 12.70 | % | 12.70 | % | 786,477 |
| — |
| — |
| — |
| — |
| 786,477 |
| ||||||||||||||||||||||||||||||||||||||||||||
Rio de Janeiro Refrescos Ltda. |
| Brazil |
| Foreign |
| Banco Santander |
| Brazil |
| Brazilian real |
| Monthly |
| 12.68 | % | 12.68 | % | 1,306,378 |
| — |
| — |
| — |
| — |
| 1,306,378 |
| ||||||||||||||||||||||||||||||||||||||||||||
Embotelladora del Atlántico S.A. |
| Argentina |
| Foreign |
| Tetra Pak SRL |
| Argentina |
| Dollars |
| Monthly |
| 12.00 | % | 12.00 | % | 500,101 |
| — |
| — |
| — |
| — |
| 500,101 |
| Argentina | Foreign | Tetra Pak SRL | Argentina | USD | Monthly | 12.00 | % | 12.00 | % | - | 398.442 | - | 343.104 | - | 741.546 | ||||||||||||||||||||||||||||
| Embotelladora del Atlántico S.A. | Argentina | Foreign | Banco Comafi | Argentina | USD | Monthly | 12.00 | % | 12.00 | % | - | 110.924 | - | - | - | 110.924 | |||||||||||||||||||||||||||||||||||||||||||||||||||||||||
| Embotelladora del Atlántico S.A. | Argentina | Foreign | Real estate | Argentina | ARS | Monthly | 50.00 | % | 50.00 | % | - | 55.222 | - | - | - | 55.222 | |||||||||||||||||||||||||||||||||||||||||||||||||||||||||
| Vital Aguas S.A. | Chile | 76.572.588-7 | Coca Cola del Valle New Ventures S.A. | Chile | CLP | Monthly | 8.20 | % | 8.20 | % | 2,242,278 | - | - | - | - | 2.242.278 | |||||||||||||||||||||||||||||||||||||||||||||||||||||||||
| Envases Central S.A. | Chile | 76.572.588-7 | Coca Cola del Valle New Ventures S.A. | Chile | CLP | Monthly | 9.0 | % | 9.0 | % | 4,947,745 | - | - | - | - | 4.947.745 | |||||||||||||||||||||||||||||||||||||||||||||||||||||||||
| Paraguay Refrescos S.A. | Paraguay | 80.003.400-7 | Tetra Pack Ltda. Suc. Py | Paraguay | PGY | Monthly | 1.00 | % | 1.00 | % | 399,456 | - | - | - | - | 399.456 | |||||||||||||||||||||||||||||||||||||||||||||||||||||||||
|
|
|
|
|
|
|
|
|
|
|
|
|
|
|
|
|
|
|
|
|
|
|
|
|
|
|
|
|
| Total | 23.454.700 | ||||||||||||||||||||||||||||||||||||||||||
|
|
|
|
|
|
|
|
|
|
|
|
|
|
|
|
|
|
|
|
|
|
|
|
|
| Total |
| 22,981,421 |
| ||||||||||||||||||||||||||||||||||||||||||||
Table of ContentsLeasing agreement obligations are not subject to financial restrictions for the reported periods.
NOTE 17 — 18 – TRADE AND OTHER CURRENT ACCOUNTS PAYABLE
a)Trade and other current accounts payable are detailed as follows:
Item |
| 12.31.2015 |
| 12.31.2014 |
|
|
| ThCh$ |
| ThCh$ |
|
Trade accounts payable |
| 167,492,719 |
| 172,506,301 |
|
Withholdings tax |
| 35,009,855 |
| 47,459,313 |
|
Accounts payable Inamar Ltda. (1) |
| 7,784,836 |
| — |
|
Others |
| 11,542,182 |
| 9,429,932 |
|
Total |
| 221,829,592 |
| 229,395,546 |
|
|
|
|
|
|
|
Current |
| 212,526,368 |
| 228,179,112 |
|
Non-current |
| 9,303,224 |
| 1,216,434 |
|
Total |
| 221,829,592 |
| 229,395,546 |
|
| Classification | 12.31.2020 | 12.31.2019 | ||||||
| ThCh$ | ThCh$ | |||||||
| Current | 230,445,809 | 243,700,553 | ||||||
| Non-current | 295,279 | 619,587 | ||||||
| Total | 230,741,088 | 244,320,140 | ||||||
| Item | 12.31.2020 | 12.31.2019 | ||||||
| ThCh$ | ThCh$ | |||||||
| Trade accounts payable | 163,361,078 | 172,142,472 | ||||||
| Withholding tax | 48,566,443 | 53,326,254 | ||||||
| Others | 18,813,567 | 18,851,414 | ||||||
| Total | 230,741,088 | 244,320,140 | ||||||
b) The Company maintains commercial lease agreements for forklifts, vehicles, properties and machinery. These lease agreements have an average duration of one to five years excluding renewal options. No restrictions exist with respect to the lessee by virtue of these lease agreements.
Future payments19 – OTHER PROVISIONS, CURRENT AND NON-CURRENT
19.1 Balances
The composition of the Company´s operating leases areprovisions is as follows:
| Detail | 12.31.2020 | 12.31.2019 | ||||||
| ThCh$ | ThCh$ | |||||||
| Litigation (1) | 50,070,273 | 69,107,550 | ||||||
| Total | 50,070,273 | 69,107,550 | ||||||
| Current | 1,335,337 | 2,068,984 | ||||||
| Non-current | 48,734,936 | 67,038,566 | ||||||
| Total | 50,070,273 | 69,107,550 | ||||||
(1) |
| ||
| |||
|
| ||
|
| ||
|
| Correspond to the provision made for the probable losses of fiscal, labor and commercial contingencies, based on the opinion of our legal advisors, according to the following detail: |
Total expenses related to operating leases maintained by the Company as of December 31, 2015 and 2014 amounted to ThCh$6,604,204 and ThCh$4,915,222 respectively.
| Detail (see note 23.1) | 12.31.2020 | 12.31.2019 | ||||||
| ThCh$ | ThCh$ | |||||||
| Tax contingencies | 25,543,101 | 38,853,059 | ||||||
| Labor contingencies | 8,688,551 | 10,569,754 | ||||||
| Civil contingencies | 15,838,621 | 19,684,737 | ||||||
| Total | 50,070,273 | 69,107,550 | ||||||
F-72
(1) On December 3, 2015 a land was purchased from Industrias Metalurgicas Inamar Ltda. for an amount of ThCh$ 17,292,040 equivalent to 675,000 UFs, of which there is a balance payable of ThCh$7,784,836 equivalent to 303.750 UFs. Such balance payable will be paid in one installment maturing in 30 more months. To guarantee the payment of this obligation the land has been mortgaged to in favor of Industrias Metalurgicas Inamar Ltda.
NOTE 18 — CURRENT AND NON-CURRENT PROVISIONS
18.1Balances19.2 Movements
The balancesmovement of principal provisions recorded by the Company at December 31, 2015 and 2014 are detailed as follows:
Description |
| 12.31.2015 |
| 12.31.2014 |
|
|
| ThCh$ |
| ThCh$ |
|
Litigation (1) |
| 64,301,817 |
| 77,812,345 |
|
Total |
| 64,301,817 |
| 77,812,345 |
|
|
|
|
|
|
|
Current |
| 326,093 |
| 365,832 |
|
Non-current |
| 63,975,724 |
| 77,446,513 |
|
Total |
| 64,301,817 |
| 77,812,345 |
|
(1) Corresponds to the provision for probable fiscal, labor and trade contingency losses based on the opinion of our legal advisors, according to the following breakdown:
Detail (see note 22.1) |
| 12.31.2015 |
| 12.31.2014 |
|
|
| ThCh$ |
| ThCh$ |
|
|
|
|
|
|
|
Tax Contingencies |
| 54,208,233 |
| 68,750,633 |
|
Labor Contingencies |
| 5,774,453 |
| 4,671,795 |
|
Civil Contingencies |
| 4,319,131 |
| 4,389,917 |
|
Total |
| 64,301,817 |
| 77,812,345 |
|
18.2Movements
Movement of provisionsover litigation is detailed as follows:
| Detail | 12.31.2020 | 12.31.2019 | |||||||||||||||||||
|
| 12.31.2015 |
| 12.31.2014 |
| ThCh$ | ThCh$ | ||||||||||||||
Description |
| Litigation |
| Others |
| Total |
| Litigation |
| Others |
| Total |
| ||||||||
|
| ThCh$ |
| ThCh$ |
| ThCh$ |
| ThCh$ |
| ThCh$ |
| ThCh$ |
| ||||||||
Opening Balance at January |
| 77,812,345 |
| — |
| 77,812,345 |
| 77,812,294 |
| — |
| 77,812,294 |
| ||||||||
| Opening balance as of January 1 | 69,107,550 | 62,452,526 | |||||||||||||||||||
Additional provisions |
| 243,330 |
| — |
| 243,330 |
| — |
| — |
| — |
| 172,801 | 121,003 | ||||||
Increase (decrease) in existing provisions |
| 1,893,402 |
| — |
| 1,893,402 |
| 1,064,399 |
| — |
| 1,064,399 |
| ||||||||
| Increases (decrease) in existing provisions (*) | 4,624,789 | 17,336,285 | |||||||||||||||||||
Payments |
| 343,359 |
| — |
| 343,359 |
| (2,403,975 | ) | — |
| (2,403,975 | ) | (5,799,209 | ) | (14,977,996 | ) | ||||
Reverse unused provision |
| (182,670 | ) | — |
| (182,670 | ) | — |
| — |
| — |
| ||||||||
| Reversal of unused provision | - | 3,551,223 | |||||||||||||||||||
Increase (decrease) due to foreign exchange differences |
| (15,807,949 | ) | — |
| (15,807,949 | ) | 1,339,627 |
| — |
| 1,339,627 |
| (18,035,658 | ) | 624,509 | |||||
Total |
| 64,301,817 |
| — |
| 64,301,817 |
| 77,812,345 |
| — |
| 77,812,345 |
| 50,070,273 | 69,107,550 | ||||||
(*) During 2019, reversal of provisions consisting of fines demanded by the Brazilian tax authority on the use of tax credits resulting from favorable sentencing to Rio de Janeiro Refrescos Ltda. which are not present in 2020.
NOTE 19 — 20 – OTHER CURRENT AND NON-CURRENT NON-FINANCIAL LIABILITIES
Other current and non-current liabilities at each reporting period end are detailed as follows:
Description |
| 12.31.2015 |
| 12.31.2014 |
|
|
| ThCh$ |
| ThCh$ |
|
Minimum dividend |
| — |
| 695,729 |
|
Dividend payable |
| 17,093,596 |
| 9,164,842 |
|
Other |
| 714,538 |
| 2,192,222 |
|
Total |
| 17,808,134 |
| 12,052,793 |
|
|
|
|
|
|
|
Current |
| 17,565,643 |
| 11,620,303 |
|
Non-current |
| 242,491 |
| 432,490 |
|
Total |
| 17,808,134 |
| 12,052,793 |
|
| Current | Non-Current | |||||||||||||||
| Description | 12.31.2020 | 12.31.2019 | 12.31.2020 | 12.31.2019 | ||||||||||||
| ThCh$ | ThCh$ | ThCh$ | ThCh$ | |||||||||||||
| Dividends payable | 25,999,055 | 22,639,150 | - | - | ||||||||||||
| Others (1) | 2,267,675 | 3,863,065 | 21,472,048 | - | ||||||||||||
| Total | 28,266,730 | 26,502,215 | 21,472,048 | - | ||||||||||||
| (1) | Other non-current corresponds mainly to accounts payable to former shareholders of Companhia de Bebidas Ipiranga (“CBI”). See Note 6 for further information. |
20.1Paid-in capital21.1 Number of shares:
| Number of shares subscribed at nominal value | Number of shares paid in | Number of voting shares | |||||||||||
| Series | 2020 | 2019 | 2020 | 2019 | 2020 | 2019 | |||||||
| A | 473,289,301 | 473,289,301 | 473,289,301 | 473,289,301 | 473,289,301 | 473,289,301 | |||||||
| B | 473,281,303 | 473,281,303 | 473,281,303 | 473,281,303 | 473,281,303 | 473,281,303 | |||||||

On August 21, 2013 saw the decline of paid capital as of right for not having alienated third 67 shares of Series A and 8,065 Series B shares, which the Company acquired in 2012, to shareholders exercised their right to retire when it was merged with Embotelladoras Coca-Cola Polar S.A, thus passing the capital paid a total of ThCh $ 270,759,299 to a total of ThCh$ 270,737,574.21.1.1 Equity:
The paid-in capital of the Company totaled ThCh$270,737,574 as of December 31, 2015, 2014 and 2013. The distribution and classification is detailed as follows:
| Subscribed Capital | Paid-in capital | |||||||||||||||
| Series | 2020 | 2019 | 2020 | 2019 | ||||||||||||
| ThCh$ | ThCh$ | ThCh$ | ThCh$ | |||||||||||||
| A | 135,379,504 | 135,379,504 | 135,379,504 | 135,379,504 | ||||||||||||
| B | 135,358,070 | 135,358,070 | 135,358,070 | 135,358,070 | ||||||||||||
| Total | 270,737,574 | 270,737,574 | 270,737,574 | 270,737,574 | ||||||||||||
20.1.1Number of shares:
|
| Number of shares subscribed |
| Number of shares paid in |
| Number of voting shares |
| ||||||||||||
Series |
| 2015 |
| 2014 |
| 2013 |
| 2015 |
| 2014 |
| 2013 |
| 2015 |
| 2014 |
| 2013 |
|
A |
| 473,289,301 |
| 473,289,301 |
| 473,289,301 |
| 473,289,301 |
| 473,289,301 |
| 473,289,301 |
| 473,289,301 |
| 473,289,301 |
| 473,289,301 |
|
B |
| 473,281,303 |
| 473,281,303 |
| 473,281,303 |
| 473,281,303 |
| 473,281,303 |
| 473,281,303 |
| 473,281,303 |
| 473,281,303 |
| 473,281,303 |
|
20.1.2Equity:
|
| Subscribed Capital |
| Paid-in capital |
| ||||||||
Series |
| 2015 |
| 2014 |
| 2013 |
| 2015 |
| 2014 |
| 2013 |
|
|
| ThCh$ |
| ThCh$ |
| ThCh$ |
| ThCh$ |
| ThCh$ |
| ThCh$ |
|
A |
| 135,379,504 |
| 135,379,504 |
| 135,379,504 |
| 135,379,504 |
| 135,379,504 |
| 135,379,504 |
|
B |
| 135,358,070 |
| 135,358,070 |
| 135,358,070 |
| 135,358,070 |
| 135,358,070 |
| 135,358,070 |
|
Total |
| 270,737,574 |
| 270,737,574 |
| 270,737,574 |
| 270,737,574 |
| 270,737,574 |
| 270,737,574 |
|
20.1.321.1.2 Rights of each series:series:
· Series A : Elect 12 of the 14 Directors
· Series B : Receives an additonal 10% of dividends distributed to Series A and elects 2 of the 14 Directors.
| · | Series A: Elects 12 of the 14 Directors. | |
| · | Series B: Receives an additional 10% of dividends distributed to Series A and elects 2 of the 14 Directors. |
20.221.2 Dividend policy
According to Chilean law, cash dividends must be paid equal to at least 30% of annual net profit, barring a unanimous vote by shareholders to the contrary. If there is no net profit in a given year, the Company will not be legally obligated to pay dividends from retained earnings. At the ordinary Shareholders’ Meeting held in April 2015,2020, the shareholders agreed to pay out of the 20142019 earnings area final dividend and another additional dividend to complete the 30% required by theChile’s Law 18,046 which was paid in August 2015.18,046.
Pursuant to Circular Letter N° 1,945 of the Chilean Superintendence of Securities and InsuranceFinancial Market Commission (CMF) dated September 29, 2009, the Company’s Board of Directors decided to maintain the initial adjustments from adopting IFRS as retainedaccumulated earnings for future distribution.
Retained earnings at the date of IFRS adoption amounted to ThCh$ 19,260,703, of which ThCh$ 8,893,477 have been realized at December 31, 2015 and are available for distribution as dividends in accordance with the following:
|
| Event when |
| Amount of |
| Realized at |
| Amount of |
|
Description |
| realized |
| ThCh$ |
| ThCh$ |
| ThCh$ |
|
Revaluation of assets parent Company |
| Sale or impairment |
| 14,800,384 |
| (11,665,431 | ) | 3,134,953 |
|
Foreign currency translation differences of investments in related companies and subsidiaries |
| Sale or impairment |
| 4,653,301 |
| 2,264,615 |
| 6,917,916 |
|
Full absorption cost accounting parent Company |
| Sale of products |
| 305,175 |
| (305,175 | ) | — |
|
Post-employment benefits actuarial calculation parent Company |
| Termination of employees |
| 946,803 |
| (578,547 | ) | 368,256 |
|
Deferred taxes complementary accounts parent Company |
| Amortization |
| (1,444,960 | ) | 1,391,061 |
| (53,899 | ) |
Total |
|
|
| 19,260,703 |
| (8,893,477 | ) | 10,367,226 |
|
The dividends declared and paid during 2015, 2014 and 2013per share are presented below:
Dividend payment date |
| Dividend type |
| Profits imputable |
| Ch$ per |
| Ch$ per Series |
| ||
2013 |
| May |
| Additional |
| 2012 |
| 12,30 |
| 13,53 |
|
2013 |
| June |
| Interim |
| 2013 |
| 12,30 |
| 13,53 |
|
2013 |
| Novembre |
| Additional |
| 2012 |
| 47,00 |
| 51,70 |
|
2013 |
| December |
| Interim |
| 2013 |
| 13,10 |
| 14,41 |
|
2014 |
| May |
| Additional |
| Retained Earnings |
| 12,37 |
| 13,61 |
|
2014 |
| May |
| Final |
| 2013 |
| 1,46 |
| 1,61 |
|
2014 |
| August |
| Additional |
| Retained Earnings |
| 12,37 |
| 13,61 |
|
2014 |
| October |
| Interim |
| 2014 |
| 13,10 |
| 14,41 |
|
2015 |
| January |
| Interim |
| 2014 |
| 9,00 |
| 9,90 |
|
2015 |
| May |
| Final |
| 2014 |
| 15,00 |
| 16,50 |
|
2015 |
| August |
| Additional |
| Retained Earnings |
| 15,00 |
| 16,50 |
|
2015 |
| October |
| Interim |
| 2015 |
| 15,00 |
| 16,50 |
|
2015 |
| December (*) |
| Interim |
| 2015 |
| 17,00 |
| 18,70 |
|
| Periods | Dividend type | Profits imputable to dividends | Ch$ per Series A Share | Ch$ per Series B Share | |||||||
| 2018 | January | Interim | 2017 Earnings | 21,50 | 23,65 | ||||||
| 2018 | May | Final | 2017 Earnings | 21,50 | 23,65 | ||||||
| 2018 | August | Additional | Accumulated Earnings | 21,50 | 23,65 | ||||||
| 2018 | October | Interim | 2018 Earnings | 21,50 | 23,65 | ||||||
| 2019 | January | Interim | 2018 Earnings | 21,50 | 23,65 | ||||||
| 2019 | May | Final | 2018 Earnings | 21,50 | 23,65 | ||||||
| 2019 | August | Additional | Accumulated Earnings | 21,50 | 23,65 | ||||||
| 2019 | October | Interim | 2019 Earnings | 21,50 | 23,65 | ||||||
| 2020 | January | Interim | 2019 Earnings | 22,60 | 24,86 | ||||||
| 2020 | May | Final | 2019 Earnings | 26.00 | 28.60 | ||||||
| 2020 | August | Additional | Accumulated Earnings | 26.60 | 28.60 | ||||||
| 2020 | November | Interim | 2020 Earnings | 26.60 | 28.60 | ||||||
| 2021 | January | Interim | 2020 Earnings | 26.60 | 28.60 | ||||||
(*)As of December 31, 2015 this dividend is yet to be paid and in accordance to the agreements of the Board of Directors held during December 2015, will be available to shareholders beginning January 28, 2016.
20.321.3 Other Reserves
The balance of other reserves includeincludes the following:
Description |
| 12.31.2015 |
| 12.31.2014 |
| 12.31.2013 |
| 12.31.2020 | 12.31.2019 | 12.31.2018 | |||||||||
|
| ThCh$ |
| ThCh$ |
| ThCh$ |
| ThCh$ | ThCh$ | ThCh$ | |||||||||
Polar acquisition |
| 421,701,520 |
| 421,701,520 |
| 421,701,520 |
| 421,701,520 | 421,701,520 | 421,701,520 | |||||||||
Foreign currency translation reserves |
| (167,447,157 | ) | (53,285,698 | ) | (81,527,711 | ) | (517,496,486 | ) | (339,076,340 | ) | (306,674,528 | ) | ||||||
Cash flow hedge reserve |
| 27,087,214 |
| 6,125,615 |
| 2,258,144 |
| (24,719,533 | ) | (14,850,683 | ) | (13,668,932 | ) | ||||||
Reserve for employee benefit actuarial gains or losses |
| (1,796,285 | ) | (1,237,993 | ) | (1,128,824 | ) | (4,663,193 | ) | (2,230,752 | ) | (1,954,077 | ) | ||||||
Legal and statutory reserves |
| 5,435,538 |
| 5,435,538 |
| 5,435,538 |
| 5,435,538 | 5,435,538 | 5,435,538 | |||||||||
| Other | 6,014,568 | 6,014,568 | 6,014,568 | ||||||||||||||||
Total |
| 284,980,830 |
| 378,738,982 |
| 346,738,667 |
| (113,727,586 | ) | 76,993,851 | 110,854,089 | ||||||||
20.3.121.3.1 Polar acquisition
This amount corresponds to the difference between the valuation at fair value of the issuance of shares of Embotelladora Andina S.A., used to acquire and the book value of the paid capital of Embotelladoras Coca-Cola Polar S.A..S-A., which was finally the value of the capital increase notarized in legal terms.
20.3.221.3.2 Cash flow hedge reserve
They arise from the fair value of the existing derivative contracts that have been qualified for hedge accounting at the end of each financial period. When contracts are expired, these reserves are adjusted and recognized in the income statement in the corresponding period (see Note 21)22).
20.3.321.3.3 Reserve for employee benefit actuarial gains or losses
Corresponds to the restatement effect of employee benefits actuarial losses that according to IAS 19 amendments must be carried to other comprehensive income.
F-75
20.3.4
21.3.4 Legal and statutory reserves
In accordance with Official Circular No.N° 456 issued by the Chilean Superintendence of Securities and Insurance,Financial Market Commission (CMF), the legally required price-level restatement of paid-in capital for 2009 is presented as part of other equity reserves and is accounted for as a capitalization from Other Reserves with no impact on net income or retained earnings under IFRS. This amount totaled ThCh$CLP 5,435,538 atthousand as of December 31, 2009.
20.3.521.3.5 Foreign currency translation reserves
This corresponds to the conversion of the financial statements of foreign subsidiaries whose functional currency is different from the presentation currency of the consolidated financial statements.Consolidated Financial Statements. Additionally, exchange differences between accounts receivable kept by the companies in Chile with foreign subsidiaries are presented in this account, which have been treated as investment equivalents accounted for using the equity method. A breakdown of translationmethod, Translation reserves is presented below:are detailed as follows:
Description |
| 12.31.2015 |
| 12.31.2014 |
| 12.31.2013 |
| ||||||||||||
| Details | 12.31.2020 | 12.31.2019 | 12.31.2018 | ||||||||||||||||
|
| ThCh$ |
| ThCh$ |
| ThCh$ |
| ThCh$ | ThCh$ | ThCh$ | |||||||||
Brazil |
| (88,444,294 | ) | (30,861,504 | ) | (36,125,708 | ) | (187,071,599 | ) | (102,922,548 | ) | (99,990,343 | ) | ||||||
Argentina |
| (84,913,998 | ) | (56,273,418 | ) | (46,087,935 | ) | (291,332,402 | ) | (246,415,922 | ) | (201,118,180 | ) | ||||||
Paraguay |
| 21,728,456 |
| 41,657,749 |
| 8,586,782 |
| (22,506,692 | ) | 6,133,700 | 8,623,849 | ||||||||
Exchange rate differences in related companies |
| (15,817,321 | ) | (7,808,525 | ) | (7,900,850 | ) | (16,585,793 | ) | 4,128,430 | (14,189,854 | ) | |||||||
Total |
| (167,447,157 | ) | (53,285,698 | ) | (81,527,711 | ) | (517,496,486 | ) | (339,076,340 | ) | (306,674,528 | ) | ||||||
The movement of this reserve for the fiscal periods ended December 31, 2015, 2014 and 2013 respectivelyon the dates indicated below, is detailed as follows:
Description |
| 12.31.2015 |
| 12.31.2014 |
| 12.31.2013 |
| ||||||||||||
| Details | 12.31.2020 | 12.31.2019 | 12.31.2018 | ||||||||||||||||
|
| ThCh$ |
| ThCh$ |
| ThCh$ |
| ThCh$ | ThCh$ | ThCh$ | |||||||||
Brazil |
| (57,582,790 | ) | 5,264,204 |
| (9,220,656 | ) | (104,863,274 | ) | 15,386,079 | (10,313,069 | ) | |||||||
Argentina |
| (28,640,580 | ) | (10,185,483 | ) | (16,638,937 | ) | (44,916,480 | ) | (45,297,742 | ) | (72,770,068 | ) | ||||||
Paraguay |
| (19,929,293 | ) | 33,070,967 |
| 8,562,534 |
| (28,640,392 | ) | (2,490,149 | ) | 13,486,181 | |||||||
Exchange rate differences in related companies |
| (8,008,796 | ) | 92,325 |
| (675,107 | ) | - | - | - | |||||||||
Total |
| (114,161,459 | ) | 28,242,013 |
| (17,972,166 | ) | (178,420,146 | ) | (32,401,812 | ) | (69,596,956 | ) | ||||||
TableConsolidated statements of Contentscomprehensive income
The detail of the comprehensive income and expense for the periods ended on the dates indicated below, is detailed as follows:
| Gross Balance | Tax | Net Balance | ||||||||||
| Cash Flow for hedge (1) | (12,203,755 | ) | 2,334,037 | (9.869.718 | ) | |||||||
| Exchange rate translation differences (1) | (264,119,093 | ) | 84,571,922 | (179.547.171 | ) | |||||||
| Benefit relate to defined benefit plans | (3,146,362 | ) | 849,518 | (2.296.844 | ) | |||||||
| Total Comprenhensive income as of December 31, 2020 | (279.469.210 | ) | 87.755.477 | (191.713.733 | ) | |||||||
| Gross Balance | Tax | Net Balance | ||||||||||
| Cash Flow for hedge (1) | (1,865,233 | ) | 683,482 | (1,181,751 | ) | |||||||
| Exchange rate translation differences (1) | (41,844,584 | ) | 9,295,546 | (32,549,038 | ) | |||||||
| Benefit relate to defined benefit plans | (379,007 | ) | 102,332 | (276,675 | ) | |||||||
| Total Comprenhensive income as of December 31, 2019 | (44,088,824 | ) | 10,081,360 | (34,007,464 | ) | |||||||
F-76
20.4Non-controlling interests
| Gross Balance | Tax | Net Balance | ||||||||||
| Cash Flow for hedge (1) | (13,151,841 | ) | 2,554,551 | (10,597,290 | ) | |||||||
| Exchange rate translation differences (1) | (72,455,525 | ) | 2,476,204 | (69,979,321 | ) | |||||||
| Benefit relate to defined benefit plans | (63,463 | ) | 16,184 | (47,279 | ) | |||||||
| Total Comprenhensive income as of December 31, 2018 | (85,670,829 | ) | 5,046,939 | (80,623,890 | ) | |||||||
| (1) | These concepts will be reclassified to the statements of income when it is settled, |
The movement of comprehensive income and expense is as follows:
| As of December 31, 2020: | Cash Flow Hedge | Exchange rate Differences | Benefit related to defines benefit plans | |||||||||
| M$ | M$ | M$ | ||||||||||
| Increase (decrease) | (11,029,171 | ) | (264,119,093 | ) | (3,338,354 | ) | ||||||
| Deferred taxes | 2,029,363 | 84,571,923 | 901,356 | |||||||||
| Reclassification to the result by function | (869,910 | ) | - | 140,1536 | ||||||||
| Reclassification of deferred taxes related to other reserves | - | - | - | |||||||||
| Total Changes in Equity | (9,869,718 | ) | (179,547,170 | ) | (2,296,845 | ) | ||||||
| Majority Equity holders | (9,686,850 | ) | (178,420,146 | ) | (2,432,441 | ) | ||||||
| Non-Controlling interests | (868 | ) | (1,127,024 | ) | 135,596 | |||||||
| Total Changes in equity as of December 31, 2020 | (9,869,718 | ) | (179,547,170 | ) | (2,296,845 | ) | ||||||
| As of December 31, 2019: | Cash Flow Hedge | Exchange rate Differences | Benefit related to defines benefit plans | |||||||||
| M$ | M$ | M$ | ||||||||||
| Increase (decrease) | (1,724,004 | ) | (41,844,584 | ) | 53,511 | |||||||
| Deferred taxes | 340,835 | 9,295,546 | (14,448 | ) | ||||||||
| Reclassification to the result by function | 118,779 | - | (432,518 | ) | ||||||||
| Reclassification of deferred taxes related to other reserves | 82,639 | - | 116,780 | |||||||||
| Total Changes in Equity | (1,181,751 | ) | (32,549,038 | ) | (276,675 | ) | ||||||
| Major Equity holders | (1,181,751 | ) | (32,401,812 | ) | (276,675 | ) | ||||||
| Non-Controlling interests | - | (147,226 | ) | - | ||||||||
| Total Changes in equity as of December 31, 2019 | (1,181,751 | ) | (32,549,038 | ) | (276,675 | ) | ||||||
| As of December 31, 2018: | Cash Flow Hedge | Exchange rate Differences | Benefit related to defines benefit plans | |||||||||
| M$ | M$ | M$ | ||||||||||
| Increase (decrease) | (63,699,788 | ) | (72,455,525 | ) | (334,508 | ) | ||||||
| Deferred taxes | 20,217,065 | 2,476,204 | 89,366 | |||||||||
| Reclassification to the result by function | 48,415,956 | - | 271,045 | |||||||||
| Reclassification of deferred taxes related to other reserves | (15,530,523 | ) | - | (73,182 | ) | |||||||
| Total Changes in Equity | (10,597,290 | ) | (69,979,321 | ) | (47,279 | ) | ||||||
| Major Equity holders | (10,597,290 | ) | (69,592,296 | ) | (43,150 | ) | ||||||
| Non-Controlling interests | - | (387,025 | ) | (4,129 | ) | |||||||
| Total Changes in equity as of December 31, 2018 | (10,597,290 | ) | (69,979,321 | ) | (47,279 | ) | ||||||
F-77
|
| 21.4 | Non-controlling interests |
This is the recognition of the portion of equity and income from subsidiaries that are owned by third parties, Details of thisparties. This account at December 31, 2015, 2014 and 2013 areis detailed as follow:follows:
|
| Non-controlling Interests |
| ||||||||||||||||
|
| Percentage % |
| Shareholders Equity |
| Income |
| ||||||||||||
Details |
| 2015 |
| 2014 |
| 2013 |
| 2015 |
| 2014 |
| 2013 |
| 2015 |
| 2014 |
| 2013 |
|
|
|
|
|
|
|
|
| ThCh$ |
| ThCh$ |
| ThCh$ |
| ThCh$ |
| ThCh$ |
| ThCh$ |
|
Embotelladora del Atlántico S.A. |
| 0.0171 |
| 0.0171 |
| 0.0171 |
| 14,484 |
| 13,181 |
| 13,118 |
| 5,262 |
| 2,014 |
| 2,692 |
|
Andina Empaques Argentina S.A. |
| 0.0209 |
| 0.0209 |
| 0.0209 |
| 2,220 |
| 2,093 |
| 1,760 |
| 798 |
| 536 |
| 406 |
|
Paraguay Refrescos S.A. |
| 2.1697 |
| 2.1697 |
| 2.1697 |
| 5,522,797 |
| 5,996,843 |
| 5,051,217 |
| 406,211 |
| 400,771 |
| 287,112 |
|
Inversiones Los Andes Ltda. |
| — |
| — |
| 0.0001 |
| — |
| — |
| 51 |
| — |
| — |
| — |
|
Vital S.A. |
| 35.0000 |
| 35.0000 |
| 35.0000 |
| 8,891,548 |
| 8,910,290 |
| 9,216,505 |
| (4,556 | ) | (286,878 | ) | 502,397 |
|
Vital Aguas S.A. |
| 33.5000 |
| 33.5000 |
| 33.5000 |
| 1,967,652 |
| 1,948,634 |
| 1,913,632 |
| 50,933 |
| 21,517 |
| 115,774 |
|
Envases Central S.A. |
| 40.7300 |
| 40.7300 |
| 40.7300 |
| 4,661,764 |
| 4,832,197 |
| 4,567,226 |
| (224,206 | ) | 179,243 |
| 376,163 |
|
Andina Inversiones Societarias S.A. |
| — |
| — |
| 0.0001 |
| — |
| — |
| 37 |
| — |
| — |
| 2 |
|
Total |
|
|
|
|
|
|
| 21,060,465 |
| 21,703,238 |
| 20,763,546 |
| 234,442 |
| 317,203 |
| 1,284,546 |
|
| Non-controlling Interests | ||||||||||||||||||||||||||||||||||||
| Ownership % | Shareholders’ Equity | Income | ||||||||||||||||||||||||||||||||||
| Details | 2020 | 2019 | 2018 | December 2020 | December 2019 | December 2018 | December 2020 | December 2019 | December 2018 | |||||||||||||||||||||||||||
| ThCh$ | ThCh$ | ThCh$ | ThCh $ | ThCh $ | ThCh $ | |||||||||||||||||||||||||||||||
| Embotelladora del Atlántico S,A, | 0,0171 | 0,0171 | 0,0171 | 23,662 | 26,342 | 23,260 | 2,312 | 4,183 | 3,633 | |||||||||||||||||||||||||||
| Andina Empaques Argentina S,A, | 0,0209 | 0,0209 | 0,0209 | 2,349 | 2,290 | 2,113 | 244 | 409 | 96 | |||||||||||||||||||||||||||
| Paraguay Refrescos S,A, | 2,1697 | 2,1697 | 2,1697 | 5,037,332 | 5,368,470 | 5,378,074 | 791,576 | 622,188 | 556,112 | |||||||||||||||||||||||||||
| Vital S,A, | 35,0000 | 35,0000 | 35,0000 | 8,176,999 | 7,904,741 | 7,674,785 | 285,269 | 263,442 | 271,063 | |||||||||||||||||||||||||||
| Vital Aguas S,A, | 33,5000 | 33,5000 | 33,5000 | 1,912,023 | 1,803,884 | 1,986,493 | 109,110 | 105,870 | 36,696 | |||||||||||||||||||||||||||
| Envases Central S,A, | 40,7300 | 40,7300 | 40,7300 | 5,227,112 | 5,148,531 | 4,836,892 | (70,996 | ) | 528,205 | (20,225 | ) | |||||||||||||||||||||||||
| Total | 20,379,477 | 20,254,258 | 19,901,617 | 1,117,515 | 1,524,297 | 847,375 | ||||||||||||||||||||||||||||||
20.5Earnings per shareThe following tables presents summarized information regarding the Company´s subsidiaries owned by third parties:
| December 31,2020 | Embotelladora Del Atlantico S.A. | Andina Empaques Argentina S.A. | Paraguay Refrescos S.A. | Vital Jugos S.A. | Vital Aguas S.A. | Envases Central S.A. | ||||||||||||||||||
| Total current assets | 65,077,621 | 6,212,726 | 44,658,550 | 21,175,722 | 3,798,228 | 15,600,566 | ||||||||||||||||||
| Total non-current assets | 140,891,069 | 8,247,288 | 226,241,150 | 14,306,662 | 7,297,306 | 18,205,899 | ||||||||||||||||||
| Total current liabilities | 56,982,545 | 2,733,092 | 24,337,015 | 11,812,384 | 3,897,100 | 13,908,411 | ||||||||||||||||||
| Total non-current liabilities | 10,226,241 | 491,364 | 14,399,594 | 307,146 | 1,490,904 | 7,064,568 | ||||||||||||||||||
| Net sales | 309,936,060 | 15,148,572 | 157,152,584 | 42,955,659 | 12,929,160 | 62,267,424 | ||||||||||||||||||
| Net Income | 13,386,097 | 1,168,507 | 36,482,572 | 815,053 | 325,700 | (174,313 | ) | |||||||||||||||||
| December 31,2019 | Embotelladora Del Atlantico S.A. | Andina Empaques Argentina S.A. | Paraguay Refrescos S.A. | Vital Jugos S.A. | Vital Aguas S.A. | Envases Central S.A. | ||||||||||||||||||
| Total current assets | 73,309,861 | 4,350,074 | 41,266,559 | 18,534,272 | 5,266,575 | 16,265,862 | ||||||||||||||||||
| Total non-current assets | 160,885,628 | 9,433,294 | 248,309,451 | 15,475,979 | 8,527,624 | 20,903,184 | ||||||||||||||||||
| Total current liabilities | 66,987,371 | 2,212,255 | 25,990,081 | 11,150,695 | 5,794,282 | 18,732,369 | ||||||||||||||||||
| Total non-current liabilities | 12,732,620 | 618,031 | 16,161,177 | 274,583 | 2,615,188 | 5,796,119 | ||||||||||||||||||
| Net sales | 384,856,368 | 18,509,124 | 158,892,010 | 46,818,385 | 18,201,656 | 70,633,817 | ||||||||||||||||||
| Net Income | 24,531,815 | 1,954,024 | 28,675,727 | 752,692 | 316,031 | 1,296,840 | ||||||||||||||||||
| December 31,2018 | Embotelladora Del Atlantico S.A. | Andina Empaques Argentina S.A. | Paraguay Refrescos S.A. | Vital Jugos S.A. | Vital Aguas S.A. | Envases Central S.A. | ||||||||||||||||||
| Total current assets | 78,222,876 | 4,329,932 | 37,309,706 | 16,005,424 | 4,616,490 | 13,737,336 | ||||||||||||||||||
| Total non-current assets | 156,224,157 | 9,251,880 | 248,751,791 | 16,969,708 | 5,287,639 | 12,239,333 | ||||||||||||||||||
| Total current liabilities | 82,148,269 | 2,309,810 | 21,870,719 | 11,018,878 | 3,803,117 | 13,063,735 | ||||||||||||||||||
| Total non-current liabilities | 15,897,476 | 1,169,270 | 16,323,385 | 28,298 | 171,184 | 1,041,400 | ||||||||||||||||||
| Net sales | 406,216,738 | 16,034,964 | 149,588,252 | 56,724,318 | 15,859,403 | 59,433,099 | ||||||||||||||||||
| Net Income | 21,304,406 | 458,980 | 25,630,364 | 774,466 | 109,539 | (112,302 | ) | |||||||||||||||||
F-78
|
| 21.5 | Earnings per share |
The basic earnings per share presented in the statement of comprehensive income is calculated as the quotient between income for the period and the average number of shares outstanding during the same period.
The earningsEarnings per share used to calculate basic and diluted earnings per share is detailed as follows:
Earnings per share |
| 12.31.2015 |
| 12.31.2020 | |||||||||||
|
| SERIES A |
| SERIES B |
| TOTAL |
| SERIES A | SERIES B | ||||||
Earnings attributable to shareholders (ThCh$) |
| 41,840,108 |
| 46,023,376 |
| 87,863,484 |
| ||||||||
| Earnings attributable to shareholders (CLP 000’s) | 58,095,636 | 63,904,169 | |||||||||||||
Average weighted number of shares |
| 473,289,301 |
| 473,281,303 |
| 946,570,604 |
| 473,289,301 | 473,281,303 | ||||||
Earnings per basic and diluted share (in Chilean pesos) |
| 88.40 |
| 97.24 |
| 92.82 |
| ||||||||
| Earnings per share (in CLP) | 122.75 | 135.02 | |||||||||||||
Earnings per share |
| 12.31.2014 |
| 12.31.2019 | |||||||||||
|
| SERIES A |
| SERIES B |
| TOTAL |
| SERIES A | SERIES B | ||||||
Earnings attributable to shareholders (ThCh$) |
| 24,702,640 |
| 27,172,444 |
| 51,875,084 |
| ||||||||
| Earnings attributable to shareholders (CLP 000’s) | 82,725,427 | 90,996,501 | |||||||||||||
Average weighted number of shares |
| 473,289,301 |
| 473,281,303 |
| 946,570,604 |
| 473,289,301 | 473,281,303 | ||||||
Earnings per basic and diluted share (in Chilean pesos) |
| 52.19 |
| 57.41 |
| 54.80 |
| ||||||||
| Earnings per share (in CLP) | 174,79 | 192,27 | |||||||||||||
Earnings per share |
| 12.31.2013 |
| ||||
|
| SERIES A |
| SERIES B |
| TOTAL |
|
Earnings attributable to shareholders (ThCh$) |
| 42,373,551 |
| 46,609,127 |
| 88,982,678 |
|
Average weighted number of shares |
| 473,289,301 |
| 473,281,303 |
| 946,570,604 |
|
Earnings per basic and diluted share (in Chilean pesos) |
| 89.53 |
| 98.48 |
| 94.01 |
|
| Earnings per share | 12.31.2018 | |||||||
| SERIES A | SERIES B | |||||||
| Earnings attributable to shareholders (ThCh$) | 46,001,994 | 50,601,377 | ||||||
| Average weighted number of shares | 473,289,301 | 473,281,303 | ||||||
| Earnings per share (in CLP) | 97,20 | 106,92 | ||||||
NOTE 21 — 22 – DERIVATIVE ASSETS AND LIABILITIES
The companyEmbotelladora Andina currently maintains “Cross Currency Swaps” and “Currency Forward” agreements as derivative financial instruments.
Cross Currency Swaps ("CCS"), also known as interest rate and currency swaps are valued by the method of discounted future cash flows at a market rate corresponding to the currencies and rates of the transaction.
On the other hand, the fair value of forward currency contracts is calculated in reference to current forward exchange rates for contracts with similar maturity profiles.
As of December 31, 2020 and 2019, the Company held the following derivative instruments at December 31, 2015 and 2014:instruments:
21.1Derivatives accounted for as cash flow hedges:
a)Cross Currency Swap Itau Credit.
| 22.1 | Derivatives accounted for as cash flow hedges: |
AsAt the closing date of December 31, 2015,these financial statements, the Company maintainedmaintains derivative contracts to ensure U.S. dollar denominated banksecure part of its bond liabilities issued in Brazil amounting to ThUS$ 35,714,Unidades de Fomento totaling UF 10,148,159, to convert themthese obligations to liabilities in Brazilian Real. The valuation of theseChilean pesos.
These contracts was performedwere valued at their fair values, yielding a receivable valuenet asset of ThCh$13,463,222CLP 6,299,116 thousand at December 31, 2015the closing date of the financial statements which is presented inunder other non-current financial assets non-current. These swap contracts have the same terms of the underlying bond obligation and expire in 2017. In addition, the excess value of the derivative above the hedged items of ThCh$ 959,012 (ThCh$ 639,447 in 2014) has been recognized within other equity reserves as of December 31, 2015.assets. The amount of income recognized in results for financial liabilities in US Dollars that were neutralized by the recyclingexpiration date of derivative contracts from equity amounted to ThCh$ 6,238,586 at December 31, 2015 (ThCh$ 1,632,629 at December 31, 2014).is distributed in the years 2026, 2031, 2034 and 2035.
b)
F-79
|
Cross Currency Swaps associated with USInternational Bonds (US)
At December 31, 2015,the closing date of these financial statements, the Company entered into cross currency swapmaintains derivative contracts to convert secure US Dollar public bond obligations of US$570USD 360 million due in 2023, to convert such obligations into UF and Real liabilitiesBrazilian Real. In addition, derivative contracts amounting to hedgeUSD 300 million are held to convert such obligation into Unidades de Fomento (UF - CLP re-adjustable by the Company’s exposure to variationsConsumer Price Index) due in foreign exchange rates. These swap contracts have the same terms2050. The valuation of the underlying bond obligation and expire in 2023. Thefirst contract at its fair value of these derivatives resulted invalues generates an asset of ThCh$168,011,084 at December 31, 2015, which is presented as other financial assets non-current. In addition excess value of the derivative above the hedged items of ThCh$26,128,202 has been recognized within other equity reservesCLP 144,684,179 thousand as of December 31, 2015. The ineffective portion amount2020 (CLP 98,918,457 thousand as of ThCh$4,698,187 (ThCh$5,995,530 at December 31, 2014) associated with this hedge was recorded in other gains and losses.2019), while the valuation of the second contract at its fair values generates a liability of CLP 51,568,854 thousand at the closing date of these financial statements.
The amount of exchange differences recognized in the statement of income related to financial liabilities in U.S. dollars and are absorbed by the identified ineffective portion of the hedge derivative were compensated with the recycling to income of the financial derivative instruments reserve in otheramounts recognized under comprehensive income amounting ThCh$71,749,245 (ThCh$16,427,083 at December 31, 2014).income.
21.2Derivatives accounted for as financial assets and liabilities at fair value through profit and loss:
| 22.2 | Forward currency transactions expected to be very likely |
In 2013During 2020 and 2014, the Company2019, Embotelladora Andina entered into foreign currency forward contracts to hedgeensure the exchange rate on future commodity purchasing needs for its exposure to expected future raw materials purchases in US Dollars during the years 20144 operations, i.e. closing USD/ARS, USD/BRL, USD/CLP and 2015. The total amountUSD/GYP forward instruments. As of outstanding forward contracts were US$0.15 million at December 31, 2015 (US$125.12020, outstanding contracts amount to USD 54.0 million at December 31, 2014). These agreements were recorded at fair value, resulting in a net gains of ThCh$292,015 for the period ended December 31, 2015 (net gains of ThCh$ 196,009 at December 31, 2014). The fair value of these derivative contracts is a liability of ThCh$ 107,428 at December 31, 2015 (assets of ThCh$2,871,333 and liabilities of ThCh$4,431,484 at December 31, 2014). The agreements that ensure future flows of foreign currency have been designated as hedge beginning August 1, 2014, following hedge accounting as of that date,(USD 46.9 million as of December 31, 2015, there are no pending balances for recycling to net income. 2019).
Futures contracts that ensure prices of future raw materials have not been designated as hedge agreements, since they do not fulfill IFRS documentation requirements, whereby its effects on variations in fair value are accounted for directly under statements of income in the “other gains and losses” account.other comprehensive income.
Table of ContentsFair value hierarchy
TheseAt the closing date of these financial statements, the Company held assets for derivative contracts do not qualify for hedge accountingCLP 150,983,295 thousand (CLP 99,235,662 thousand as of December 31, 2019) and are accountedheld liabilities for as investment contracts with the changes in fair value recorded directly in the income statement each reporting period.
Fair value hierarchy
The Company had total assets related to its foreign exchange derivative contracts for CLP 52,786,176 thousand (CLP 374,576 thousand as of ThCh$181,474,306 and liabilities to ThCh$107,428 at December 31, 2015 (assets for ThCh$53,878,573 and liabilities for ThCh$4,431,484 at December 31, 2014)2019). Those contracts covering existing items have been classified in the same category of hedged, the net amount of derivative contracts by concepts covering forecasted items have been classified in financial assets and financial liabilities, liabilities. All the derivative contracts are carried at fair value in the consolidated statement of financial position, position.
|
The Company uses the following hierarchy for determining and disclosing the fair value of financial instruments by valuation technique:
Level | quoted (unadjusted) prices in active markets for identical assets or liabilities |
| Level 2: | Inputs other than quoted prices included in level 1 that are observable for the assets and liabilities, either directly (that is, as prices) or indirectly (that is, derived from prices) |
| Level 3: | Inputs for assets and liabilities that are not based on observable market data. |
During the reporting period, ended December 31, 2015, there were no transfers of items between fair value measurement categories; all of which were valued during the period using level 2.
|
| Fair Value Measurements at December, 31 2015 |
|
|
| Fair Value Measurement at December 31, 2020 | ||||||||||||||||||
|
| Quoted prices in active |
| Observable |
| Unobservable |
|
|
| Quoted prices in active markets for identical assets or liabilities | Observable market data | Unobservable market data | ||||||||||||
|
| (Level 1) |
| (Level 2) |
| (Level 3) |
|
|
| (Level 1) | (Level 2) | (Level 3) | Total | |||||||||||
|
| ThCh$ |
| ThCh$ |
| ThCh$ |
| ThCh$ |
| ThCh$ | ThCh$ | ThCh$ | ThCh$ | |||||||||||
Assets |
|
|
|
|
|
|
|
|
| |||||||||||||||
Current assets |
|
|
|
|
|
|
|
|
| |||||||||||||||
| Other current financial assets | - | - | - | - | ||||||||||||||||||||
Other non-current financial assets |
| — |
| 181,474,306 |
| — |
| 181,474,306 |
| - | 150,983,295 | - | 150,983,295 | |||||||||||
Total assets |
| — |
| 181,474,306 |
| — |
| 181,474,306 |
| - | 150,983,295 | - | 150,983,295 | |||||||||||
Liabilities |
|
|
|
|
|
|
|
|
| |||||||||||||||
Current liabilities |
|
|
|
|
|
|
|
|
| |||||||||||||||
Other current financial liabilities |
| — |
| 107,428 |
| — |
| 107,428 |
| - | 1,217,322 | - | 1,217,322 | |||||||||||
| Other non-current financial liabilities | - | 51,568,854 | - | 51,568,854 | ||||||||||||||||||||
Total liabilities |
| — |
| 107,428 |
| — |
| 107,428 |
| - | 52,786,176 | - | 52,786,176 | |||||||||||
|
| Fair Value Measurements at December, 31 2014 |
|
|
| Fair Value Measurement at December 31, 2019 | ||||||||||||||||||
|
| Quoted prices in active |
| Observable |
| Unobservable |
|
|
| Quoted prices in active markets for identical assets or liabilities | Observable market data | Unobservable market data | ||||||||||||
|
| (Level 1) |
| (Level 2) |
| (Level 3) |
|
|
| (Level 1) | (Level 2) | (Level 3) | Total | |||||||||||
|
| ThCh$ |
| ThCh$ |
| ThCh$ |
| ThCh$ |
| ThCh$ | ThCh$ | ThCh$ | ThCh$ | |||||||||||
Assets |
|
|
|
|
|
|
|
|
| |||||||||||||||
Current assets |
|
|
|
|
|
|
|
|
| |||||||||||||||
Other current financial assets |
| — |
| 2,871,333 |
| — |
| 2,871,333 |
| |||||||||||||||
| Current assets Other current financial assets | - | 317.205 | 317.205 | |||||||||||||||||||||
Other non-current financial assets |
| — |
| 51,007,240 |
| — |
| 51,007,240 |
| - | 98.918.457 | - | 98.918.457 | |||||||||||
Total assets |
| — |
| 53,878,573 |
| — |
| 53,878,573 |
| - | 99.235.662 | - | 99.235.662 | |||||||||||
Liabilities |
|
|
|
|
|
|
|
|
| |||||||||||||||
Current liabilities |
|
|
|
|
|
|
|
|
| |||||||||||||||
Other current financial liabilities |
| — |
| 4,431,484 |
| — |
| 4,431,484 |
| - | 374.576 | - | 374.576 | |||||||||||
Total liabilities |
| — |
| 4,431,484 |
| — |
| 4,431,484 |
| - | 374.576 | - | 374.576 | |||||||||||
|
NOTE 22 — CONTINGENCIES23 – LITIGATION AND COMMITMENTSCONTINGENCIES
22.1Lawsuits and other legal actions:
| 23.1 | Lawsuits and other legal actions: |
In the opinion of the Company’sCompany's legal counsel, the Parent Company and its subsidiaries do not face judiciallegal or extra-judicialextrajudicial contingencies that might result in material or significant losses or gains, except for the following:
| 1) | Embotelladora del Atlántico S.A. faces labor, tax, civil and trade lawsuits. Accounting provisions have been made for the contingency of a probable loss because of these lawsuits, totaling CLP 778,065 thousand (CLP 942,173 thousand in 2019). Management considers it unlikely that non-provisioned contingencies will affect the Company's income and equity, based on the opinion of its legal counsel. Additionally, Embotelladora del Atlántico S.A. maintains time deposits for an amount of CLP 295,856 thousand to guaranty judicial liabilities. |
1) Embotelladora del Atlántico S.A. faces labor, tax, civil and trade lawsuits. Accounting provisions have been made for the contingency of a probable loss because of these lawsuits, totaling ThCh$1,467,587. Management considers it unlikely that non-provisioned contingencies will affect the Company’s income and equity, based on the opinion of its legal counsel. Additionally Embotelladora del Atlántico S.A. maintains time deposits for an amount of ThCh$699,625 to guaranty judicial liabilities.
| 2) | Rio de Janeiro Refrescos Ltda. faces labor, tax, civil and trade lawsuits. Accounting provisions have been made for the contingency of a probable loss because of these lawsuits, totaling CLP 47,945,921 thousand (CLP 66,070,162 thousand in 2019). Management considers it unlikely that non-provisioned contingencies will affect the Company's income and equity, based on the opinion of its legal counsel. As it is customary in Brazil, Rio de Janeiro Refrescos Ltda. maintains Deposit in courts and assets given in pledge to secure the compliance of certain processes, irrespective of whether these have been classified as a possible, probable or remote. The amounts deposited or pledged as legal guarantees As of December 31, 2020 and 2019 , amounted to CLP 21,054,433 thousand and CLP 32,166,823 thousand, respectively. |
2) Rio de Janeiro Refrescos Ltda. faces labor, tax, civil and trade lawsuits. Accounting provisions have been made for the contingency of a probable loss because of these lawsuits, totaling ThCh$62,570,819. anagement considers it unlikely that non-provisioned contingencies will affect the Company’s income and equity, based on the opinion of its legal counsel. As it is customary in Brazil, Rio de Janeiro Refrescos Ltda. maintains judicial deposits and assets given in pledge to secure the compliance of certain processes, irrespective of whether these have been classified as a possible, probable or remote. The amounts deposited or pledged as a legal guarantees as of Decemberr 31, 2015 and 2014 amounted to ThCh$86,364,210 and ThCh$113,574,536 respectively.
Part of the assets given asheld under warranty by Rio de Janeiro Refrescos Ltda. as of December 31, 2014, are in the process of being released and others have already been released with thein exchange of Warranty Insurancefor guarantee insurance and Bail Letters entered into amounting to R$499,421,531bond letters for BRL 1,525,587,904, with different financial institutionsFinancial Institutions and insurance companiesInsurance Companies in Brazil, through which these entities after a 0.6%receive an annual commission fee of 0.79%. and become responsible of fulfilling obligations with the Brazilian tax authorities should any trial result against Rio de Janeiro Refrescos Ltda. Additionally, if the warranty and bail letters are executed, Rio de Janeiro Refrescos Ltda. promises to reimburse to the financial institutions and Insurance Companies any amounts disbursed by them to the Brazilian government.
Main contingencies faced by Rio de Janeiro Refrescos are as follows:
a)Tax contingencies resulting from credits on tax on industrialized products (IPI).
| a) | Tax contingencies resulting from credits on tax on industrialized products (IPI). |
Rio de Janeiro Refrescos is a party to a series of proceedings under way, in which the Brazilian federal tax authorities demand payment of value-added tax on industrialized products (Imposto sobre Produtos Industrializados, or IPI) allegedly owed by ex-Companhia de Bebidas Ipiranga. The initial amount demanded reached R$1,330,473,161 (historical amount without adjustments), corresponding to different trials related to the same cause. In June 2014, one of these trials for R$598,754,218, was resolved in favor of the Company, however, there are new law suits arising after the purchase of ex-Companhia de Bebidas Ipiranga (October 2013) that amount to R$303,518,513. These law suits include amounts originally demanded plus accrued adjustments to date.totaling BRL 2,471,137,390 at December 31, 2020.
The Company rejectsdoes not share the position of the Brazilian tax authority in these procedures and considers that Companhia de Bebidas Ipirangait was entitled to claim IPI tax credits in connection with purchases of certain exempt raw materials from suppliers located in the Manaus free trade zone.
Based on the opinion of its advisers, and judiciallegal outcomes to date, Management estimates that these procedures do not represent probable losses and has not recorded a provision on these matters.
Notwithstanding the above, the IFRS related to business combination in terms of distribution of the purchase price establish that contingencies must be measured one by one according to their probability of occurrence and discounted at fair value from the date on which it is deemed the loss can be generated. AccordingAs a result of the acquisition of Companhia de Bebidas Ipiranga in 2013 and pursuant to this criteria,criterion and although there are contingencies listed only as possible for BRL 701,660,858 (amount includes adjustments for current lawsuits) a start provision has been generated in the accounting of the business combination for BRL 139,596,221 equivalent to CLP 19,098,159 thousand.
|
| b) | Other tax contingencies. |
They refer to ICMS-SP tax administrative processes that challenge the credits derived from the acquisition of tax-exempt products acquired by the Company from a supplier located in the Manaus Free Zone. The total amount is BRL 409,075,280 being assessed by external attorneys as a remote loss, so it has no accounting provision.
The company was challenged by the federal tax authority for tax deductibility of identified contingencies amounting R$1,169,888,014 (including readjustmentsa portion of current lawsuits),goodwill in the Company recorded2014-2016 period arising from the acquisition of Companhia de Bebidas Ipiranga. The tax authority understands that the entity that acquired Companhia de Bebidas Ipiranga is Embotelladora Andina and not Rio de Janeiro Refrescos Ltda. In the view of external lawyers, such a provision R$201,880,601 equivalent to ThCh$36,715,716.statement is erroneous, classifying it as a possible loss. The value of this process is BRL 463,613,817, as of December 31, 2020.
| 3) | Embotelladora Andina S.A. and its Chilean subsidiaries face labor, tax, civil and trade lawsuits. Accounting provisions have been made for the contingency of a probable loss because of these lawsuits, totaling CLP 1,300,587 thousand (CLP 2,065,496 thousand in 2019). Management considers it is unlikely that non-provisioned contingencies will affect income and equity of the Company, in the opinion of its legal advisors. |
| 4) | Paraguay Refrescos S.A. faces tax, trade, labor and other lawsuits. Accounting provisions have been made for the contingency of any loss because of these lawsuits amounting to CLP 34,747 thousand (CLP 3,488 thousand in 2019). Management considers it is unlikely that non-provisioned contingencies will affect income and equity of the Company, in the opinion of its legal advisors. |
F-83
b)Tax contingencies on ICMS and IPI causes.
They refer mainly to tax settlements issued by advance appropriation of ICMS credits on fixed assets, payment of the replacement of ICMS tax to the operations, untimely IPI credits calculated on bonuses, among other claims.
The Company does not consider that these judgments will result in significant losses, given that their loss is considered unlikely. However, the accounting standards of financial information related to business combination in terms of distribution of the purchase price, establish contingencies must be valued one by one according to their probability of occurrence and discounted to fair value from the date on which it is deemed that the loss can be generated. According to this criteria, an initial provision has been made in the business combination accounting for an amount of R$ 96.5 million equivalent to ThCh$ 17,547,397.
3) Embotelladora Andina S.A. and its Chilean subsidiaries face labor, tax, civil and trade lawsuits. Accounting provisions have been made for the contingency of a probable loss because of these lawsuits, totaling ThCh$263,411. Management considers it is unlikely that non-provisioned contingencies will affect income and equity of the Company, in the opinion of its legal advisors.
22.223.2 Direct guarantees and restricted assets:
Guarantees and restricted December 31, 2015 and 2014assets are detailed as follows:
Guarantees that compromisecommit assets includingincluded in the financial statements:statements:
|
| Provided by |
|
|
| Committed assets |
| Balance pending payment on the |
| ||||
Guarantee in favor of |
| Name |
| Relationship |
| Guarantee |
| Guarantee in favor of |
| 12.31.2015 |
| 12.31.2014 |
|
|
|
|
|
|
|
|
|
|
| ThCh$ |
| ThCh$ |
|
Industria Metalúrgica Inamar Ltda. |
| Embotelladora Andina S.A. |
| Parent Company |
| Land |
| Property, plant and equipment |
| 17,292,040 |
| — |
|
Bodega San Francisco |
| Embotelladora Andina S.A. |
| Parent Company |
| Cash and cash equivalents |
| Trade and other receivables |
| — |
| 6,788 |
|
Gas licuado Lipigas S.A. |
| Embotelladora Andina S.A. |
| Parent Company |
| Cash and cash equivalents |
| Trade and other receivables |
| 1,140 |
| 1,140 |
|
Nazira Tala |
| Embotelladora Andina S.A. |
| Parent Company |
| Cash and cash equivalents |
| Trade and other receivables |
| 3,416 |
| 3,416 |
|
Nazira Tala |
| Embotelladora Andina S.A. |
| Parent Company |
| Cash and cash equivalents |
| Trade and other receivables |
| 3,508 |
| 3,508 |
|
Inmob. e Invers. Supetar Ltda. |
| Transportes Polar S.A. |
| Subsidiary |
| Cash and cash equivalents |
| Trade and other receivables |
| 4,579 |
| 4,579 |
|
María Lobos Jamet |
| Transportes Polar S.A. |
| Subsidiary |
| Cash and cash equivalents |
| Trade and other receivables |
| 2,565 |
| 2,565 |
|
Reclamantes ações trabalhistas |
| Rio de Janeiro Refrescos Ltda. |
| Subsidiary |
| Judicial deposit |
| Other non-current, non-financial assets |
| 2,499,232 |
| 15,017,759 |
|
Reclamantes ações civiles y tributarias |
| Rio de Janeiro Refrescos Ltda. |
| Subsidiary |
| Judicial deposit |
| Other non-current, non-financial assets |
| 7,929,131 |
| 15,817,942 |
|
Instituciones Gubernamentales |
| Rio de Janeiro Refrescos Ltda. |
| Subsidiary |
| Judicial deposit |
| Other non-current, non-financial assets |
| — |
| 6,944,052 |
|
Instituciones Gubernamentales |
| Rio de Janeiro Refrescos Ltda. |
| Subsidiary |
| Property, plant and equipment |
| Property, plant and equipment |
| 75,935,847 |
| 75,794,783 |
|
Distribuidora Baraldo S.H. |
| Embotelladora del Atlántico S.A. |
| Subsidiary |
| Judicial deposit |
| Other non-current, non-financial assets |
| 1,089 |
| 1,419 |
|
Acuña Gomez |
| Embotelladora del Atlántico S.A. |
| Subsidiary |
| Judicial deposit |
| Other non-current, non-financial assets |
| 1,634 |
| 2,129 |
|
Municipalidad Gral. Alvear |
| Embotelladora del Atlántico S.A. |
| Subsidiary |
| Judicial deposit |
| Other non-current, non-financial assets |
| — |
| 9,170 |
|
Municipalidad San Martin Mza |
| Embotelladora del Atlántico S.A. |
| Subsidiary |
| Judicial deposit |
| Other non-current, non-financial assets |
| 19,606 |
| 25,544 |
|
Nicanor López |
| Embotelladora del Atlántico S.A. |
| Subsidiary |
| Judicial deposit |
| Other non-current, non-financial assets |
| 1,168 |
| 1,522 |
|
Municipalidad Bariloche |
| Embotelladora del Atlántico S.A. |
| Subsidiary |
| Judicial deposit |
| Other non-current, non-financial assets |
| 96,045 |
| 385,720 |
|
Municipalidad San Antonio Oeste |
| Embotelladora del Atlántico S.A. |
| Subsidiary |
| Judicial deposit |
| Other non-current, non-financial assets |
| 2,316 |
| 3,017 |
|
Municipalidad Chivilcoy |
| Embotelladora del Atlántico S.A. |
| Subsidiary |
| Judicial deposit |
| Other non-current, non-financial assets |
| 538,968 |
| 979,627 |
|
Municipalidad Carlos Casares |
| Embotelladora del Atlántico S.A. |
| Subsidiary |
| Judicial deposit |
| Other non-current, non-financial assets |
| 4,862 |
| 6,334 |
|
Granada Maximiliano |
| Embotelladora del Atlántico S.A. |
| Subsidiary |
| Judicial deposit |
| Other non-current, non-financial assets |
| 9,803 |
| 12,772 |
|
CICSA |
| Embotelladora del Atlántico S.A. |
| Subsidiary |
| Guarantees CICSA for packaging |
| Other current financial assets |
| 30,335 |
| 39,524 |
|
Locadores varios |
| Embotelladora del Atlántico S.A. |
| Subsidiary |
| Guarantee deposit for rentals |
| Other current financial assets |
| 11,297 |
| 10,710 |
|
Aduana de Ezeiza |
| Embotelladora del Atlántico S.A. |
| Subsidiary |
| Machinery import |
| Other current financial assets |
| 47,023 |
| 9,924 |
|
Municipalidad de Junin |
| Embotelladora del Atlántico S.A. |
| Subsidiary |
| Judicial deposit |
| Other non-current, non-financial assets |
| 9,508 |
| 8,300 |
|
Almada Jorge |
| Embotelladora del Atlántico S.A. |
| Subsidiary |
| Judicial deposit |
| Other non-current, non-financial assets |
| 14,626 |
| 17,332 |
|
Banco Santander Rio |
| Embotelladora del Atlántico S.A. |
| Subsidiary |
| Cash and cash equivalents |
| Other current financial assets |
| — |
| 943,434 |
|
Banco Galicia |
| Embotelladora del Atlántico S.A. |
| Subsidiary |
| Cash and cash equivalents |
| Other current financial assets |
| — |
| 1,036,261 |
|
Banco HSBC |
| Embotelladora del Atlántico S.A. |
| Subsidiary |
| Cash and cash equivalents |
| Other current financial assets |
| — |
| 148,666 |
|
Banco Industrial |
| Embotelladora del Atlántico S.A. |
| Subsidiary |
| Cash and cash equivalents |
| Other current financial assets |
| — |
| 813,969 |
|
Banco ICBC |
| Embotelladora del Atlántico S.A. |
| Subsidiary |
| Cash and cash equivalents |
| Other current financial assets |
| — |
| 160,501 |
|
Rofex |
| Embotelladora del Atlántico S.A. |
| Subsidiary |
| Cash and cash equivalents |
| Other current financial assets |
| — |
| 1,729,820 |
|
|
|
|
|
|
|
|
|
|
| 104,459,738 |
| 119,942,227 |
|
| Committed assets | Accounting value | ||||||||||||||
| Guaranty creditor | Debtor name | Relationship | Guaranty | Type | 12.31.2020 | 12.31.2019 | |||||||||
| CLP (000’s) | CLP (000’s) | ||||||||||||||
| Transportes San Martin | Embotelladora Andina S.A. | Parent Company | Cash | Trade accounts and other account receivable | 2,907 | 2,805 | |||||||||
| Cooperativa Agricola Pisquera Elqui Limitada | Embotelladora Andina S.A. | Parent Company | Cash | Other non-current financial assets | 1,216,865 | 1,216,865 | |||||||||
| Inmob. e invers. supetar Ltda. | Transportes Polar | Subsidiary | Cash | Other non-current non-financial assets | 4,579 | 4,579 | |||||||||
| María Lobos Jamet | Transportes Polar | Subsidiary | Cash | Other non-current non-financial assets | 2,566 | 2,565 | |||||||||
| Bodega San Francisco | Transportes Polar | Subsidiary | Cash | Other non-current non-financial assets | 8,606 | 6,483 | |||||||||
| Workers Claims | Rio de Janeiro Refrescos Ltda. | Subsidiary | Judicial deposit | Other non-current non-financial assets | 5,329,947 | 6,600,863 | |||||||||
| Civil and tax claims | Rio de Janeiro Refrescos Ltda. | Subsidiary | Judicial deposit | Other non-current non-financial assets | 5,882,379 | 12,186,432 | |||||||||
| Governmental institutions | Rio de Janeiro Refrescos Ltda. | Subsidiary | Plant and Equipment | Property, plant & equipment | 9,842,108 | 13,379,610 | |||||||||
| Distribuidora Baraldo S.H. | Embotelladora del Atlántico S.A. | Subsidiary | Judicial deposit | Other non-current non-financial assets | 169 | 250 | |||||||||
| Acuña Gomez | Embotelladora del Atlántico S.A. | Subsidiary | Judicial deposit | Other non-current non-financial assets | 253 | 375 | |||||||||
| Nicanor López | Embotelladora del Atlántico S.A. | Subsidiary | Judicial deposit | Other non-current non-financial assets | 181 | 268 | |||||||||
| Labarda | Embotelladora del Atlántico S.A. | Subsidiary | Judicial deposit | Other non-current non-financial assets | 3 | 5 | |||||||||
| Municipalidad Bariloche | Embotelladora del Atlántico S.A. | Subsidiary | Judicial deposit | Other non-current non-financial assets | - | 36,313 | |||||||||
| Municipalidad San Antonio Oeste | Embotelladora del Atlántico S.A. | Subsidiary | Judicial deposit | Other non-current non-financial assets | 18,650 | 27,598 | |||||||||
| Municipalidad Carlos Casares | Embotelladora del Atlántico S.A. | Subsidiary | Judicial deposit | Other non-current non-financial assets | 754 | 1,116 | |||||||||
| Municipalidad Chivilcoy | Embotelladora del Atlántico S.A. | Subsidiary | Judicial deposit | Other non-current non-financial assets | 116,641 | 172,602 | |||||||||
| Others | Embotelladora del Atlántico S.A. | Subsidiary | Judicial deposit | Other non-current non-financial assets | 36 | 53 | |||||||||
| Granada Maximiliano | Embotelladora del Atlántico S.A. | Subsidiary | Judicial deposit | Other non-current non-financial assets | 1,521 | 2,250 | |||||||||
| Cicsa | Embotelladora del Atlántico S.A. | Subsidiary | Cash deposit | Other current non-financial assets | 2,114 | 3,128 | |||||||||
| Several lessors | Embotelladora del Atlántico S.A. | Subsidiary | Cash deposit | Other current non-financial assets | 13,140 | 15,289 | |||||||||
| Aduana de EZEIZA | Embotelladora del Atlántico S.A. | Subsidiary | Cash deposit | Other current non-financial assets | 286 | 422 | |||||||||
| Municipalidad de Junin | Embotelladora del Atlántico S.A. | Subsidiary | Judicial deposit | Other non-current non-financial assets | 243 | 360 | |||||||||
| Almada Jorge | Embotelladora del Atlántico S.A. | Subsidiary | Judicial deposit | Other non-current non-financial assets | 2,064 | 3,054 | |||||||||
| Mirgoni Marano | Embotelladora del Atlántico S.A. | Subsidiary | Judicial deposit | Other non-current non-financial assets | 51 | 76 | |||||||||
| Farias Matias Luis | Embotelladora del Atlántico S.A. | Subsidiary | Judicial deposit | Other non-current non-financial assets | 947 | 1,401 | |||||||||
| Temas Industriales SA - Embargo General de Fondos | Embotelladora del Atlántico S.A. | Subsidiary | Judicial deposit | Other non-current non-financial assets | 156,759 | ||||||||||
| DBC SA C CERVECERIA ARGENTINA SA ISEMBECK | Embotelladora del Atlántico S.A. | Subsidiary | Judicial deposit | Other non-current non-financial assets | 19,009 | 28,129 | |||||||||
| Coto Cicsa | Embotelladora del Atlántico S.A. | Subsidiary | Judicial deposit | Other non-current non-financial assets | 3,379 | 5,001 | |||||||||
| Cencosud | Embotelladora del Atlántico S.A. | Subsidiary | Judicial deposit | Other non-current non-financial assets | 2,112 | 3,125 | |||||||||
| Mariano Mirgoni | Embotelladora del Atlántico S.A. | Subsidiary | Judicial deposit | Other non-current non-financial assets | 105,936 | - | |||||||||
| Marcus A.Peña | Paraguay Refrescos | Subsidiary | Property | Property, plant & equipment | 4,011 | 3,955 | |||||||||
| Mauricio J Cordero C | Paraguay Refrescos | Subsidiary | Property | Property, plant & equipment | 814 | 917 | |||||||||
| José Ruoti Maltese | Paraguay Refrescos | Subsidiary | Property | Property, plant & equipment | 655 | 738 | |||||||||
| Alejandro Galeano | Paraguay Refrescos | Subsidiary | Property | Property, plant & equipment | 1,132 | 1,275 | |||||||||
| Ana Maria Mazó | Paraguay Refrescos | Subsidiary | Property | Property, plant & equipment | 1,077 | 1,213 | |||||||||
Guarantees provided without obligation of assets included in the financial statements:
|
| Provided by |
|
|
| Committed assets |
| Balance pending payment on the |
| ||||
Guarantee in favor of |
| Name |
| Relationship |
| Guarantee |
| Guarantee in favor of |
| 12.31.2015 |
| 12.31.2014 |
|
|
|
|
|
|
|
|
|
|
| ThCh$ |
| ThCh$ |
|
Linde Gas Chile |
| Embotelladora Andina S.A. |
| Parent Company |
| Guarantee insurance |
| Guarantee insurance |
| 639,144 |
| 546,075 |
|
Echeverría, Izquierdo Ingeniería y Construcción. |
| Embotelladora Andina S.A. |
| Parent Company |
| Guarantee insurance |
| Guarantee insurance |
| 536,315 |
| 515,348 |
|
Rabdstad Chile S.A. |
| Embotelladora Andina S.A. |
| Parent Company |
| Guarantee insurance |
| Guarantee insurance |
| — |
| 640,000 |
|
Aduana de Ezeiza |
| Andina Empaques Argentina S.A. |
| Subsidiary |
| Compliance of contract |
| Surety insurance |
| 235,981 |
| — |
|
Processos trabalhistas |
| Rio de Janeiro Refrescos Ltda. |
| Subsidiary |
| Guarantee insurance |
| Guarantee insurance |
| 575,583 |
| 567,285 |
|
Processos administrativos |
| Rio de Janeiro Refrescos Ltda. |
| Subsidiary |
| Guarantee insurance |
| Guarantee insurance |
| 2,370,025 |
| 2,041,360 |
|
Governo Federal |
| Rio de Janeiro Refrescos Ltda. |
| Subsidiary |
| Guarantee insurance |
| Guarantee insurance |
| 74,198,243 |
| 86,750 |
|
Governo Estadual |
| Rio de Janeiro Refrescos Ltda. |
| Subsidiary |
| Guarantee insurance |
| Guarantee insurance |
| 10,450,612 |
| 9,632,911 |
|
HSBC |
| Sorocaba Refrescos |
| Associate |
| Loan |
| co-signers |
| 3,637,369 |
| 5,162,012 |
|
Otros |
| Rio de Janeiro Refrescos Ltda. |
| Subsidiary |
| Guarantee insurance |
| Guarantee insurance |
| 3,234,566 |
| 1,246,117 |
|
| Committed assets | Amounts involved | ||||||||||||||||
| Guaranty Creditor | Debtor name | Relationship | Guaranty | Type | 12.31.2020 | 12.31.2019 | |||||||||||
| CLP (000’s) | CLP (000’s) | ||||||||||||||||
| Labor procedures | Rio de Janeiro Refrescos Ltda. | Subsidiary | Guaranty receipt | Legal proceeding | 1,527,347 | 2,819,285 | |||||||||||
| Administrative procedures | Rio de Janeiro Refrescos Ltda. | Subsidiary | Guaranty receipt | Legal proceeding | 8,860,598 | 10,432,633 | |||||||||||
| Federal Government | Rio de Janeiro Refrescos Ltda. | Subsidiary | Guaranty receipt | Legal proceeding | 147,841,989 | 138,635,908 | |||||||||||
| State Government | Rio de Janeiro Refrescos Ltda. | Subsidiary | Guaranty receipt | Legal proceeding | 46,031,398 | 54,803,911 | |||||||||||
| Sorocaba Refrescos | Rio de Janeiro Refrescos Ltda. | Subsidiary | Guaranty receipt | Guarantor | 2,736,159 | 3,715,186 | |||||||||||
| Others | Rio de Janeiro Refrescos Ltda. | Subsidiary | Guaranty receipt | Legal proceeding | 1,715,099 | 3,757,062 | |||||||||||
| Aduana de EZEIZA | Embotelladora del Atlántico S.A. | Subsidiary | Surety insurance | Faithful compliance of contract | 3,150 | 673,854 | |||||||||||
| Aduana de EZEIZA | Andina Empaques Argentina S.A. | Subsidiary | Surety insurance | Faithful compliance of contract | 143,615 | 506,623 | |||||||||||
F-85
NOTE 23 — 
24 – FINANCIAL RISK MANAGEMENT
The Company’s businesses are exposed to a variety of financial and market risks (including foreign exchange risk, interest rate risk and price risk). The Company’s global risk management program focuses on the uncertainty of financial markets and seeks to minimize potential adverse effects on the performance of the Company. The Company uses derivatives to hedge certain risks. Below is aA description of the primary policies established by the Company to manage financial risks.risks are provided below:
Interest Rate Risk
As of December 31, 2015,the closing date of these financial statements, the Company carriedmaintains all of its debt liabilities at a fixed rate variability factors are given by the currencies in which they are set: UF and US$ (are variable). As a result, the risk ofas to avoid fluctuations in market interest rates on the Company’s cash flows is low.financial expenses resulting from tax rate increases.
The Company’s greatest indebtedness corresponds to six contracts for own issued Chilean local bonds of own issuance; the portion of bonds issued in the local market areat a fixed rate for UF 15.85 million denominated in Unidades de Fomento,UF (“UF”), debt indexed to inflation in Chile (the Company’s(Company sales are correlated with the UF variations). If inflation in Chile wouldvariation), of which five of these Local Bonds have generated a UF variation of 5.0% duringbeen redenominated through Cross Currency Swaps to Chilean Pesos (CLP).
On the period between January 1 and December 31, 2015 (instead of 4.07%, excluding changes in the level of sales),other hand, there is also the Company’s income would haveindebtedness on the international market through two 144A/RegS Bonds at a fixed rate, one for USD 365 million, denominated in dollars, and practically 100% of which has been lower by ThCh$2,220,471.
There are also bondsre-denominated to BRL through Cross Currency Swaps, and another one for USD 300 million denominated in USD, and practically 100% of own issuance amountingwhich has been re-denominated to US$575 million, which are hedged against the fluctuation of the U.S. dollar with cross currency swap agreements.
Credit RiskUnidades de Fomento (UF) through Cross Currency Swaps.
Credit risk
The credit risk to which the Company is exposed primarily comes mainly from trade accounts receivable trade heldmaintained with retail customers, wholesale distributorsretailers, wholesalers and supermarket chains in domestic markets; and the financial investments held with banks and financial institutions, such as time deposits, mutual funds and derivative financial instruments.
| a) | Trade accounts receivable and other current accounts receivable |
Credit risk related to trade receivablesaccounts receivable is managed and monitored by the Administrationarea of Finance and FinanceAdministration of each business unit. The Company has a broadwide base of customers whomore than 283 thousand clients implying a high level of atomization of accounts receivable, which are subject to the policies, procedures and controls established by the Company. In accordance with such policies, credits must be based objectively, non-discretionary and uniformly granted to all clients of a same segment and channel, provided these will allow generating economic benefits to the Company. The credit limit is checked periodically considering payment behavior. Trade accounts receivable pending of payment are monitored on a monthly basis.
| i. | Sale Interruption |
In accordance with Corporate Credit limitsPolicy, the interruption of sale must be within the following framework: when a customer has outstanding debts for an amount greater than USD 250,000, and over 60 days expired, sale is suspended. The General Manager in conjunction with the Finance and Administration Manager authorize exceptions to this rule, and if the outstanding debt should exceed USD 1,000,000, and in order to continue operating with that client, the authorization of the Chief Financial Officer is required. Notwithstanding the foregoing, each operation can define an amount lower than USD 250,000 according to the country’s reality.

| ii. | Impairment |
The impairment recognition policy establishes the following criteria for provisions: 30% is provisioned for 31 to 60 days overdue, 60% between 60 and 91 days, 90% between 91 and 120 days overdue and 100% for more than 120 days. Exemption of the calculation of global impairment is given to credits whose delays in the payment correspond to accounts disputed with the customer whose nature is known and where all necessary documentation for collection is available, therefore, there is no uncertainty on recovering them. However, these accounts also have an impairment provision as follows: 40% for 91 to 120 days overdue, 80% between 120 and 170, and 100% for more than 170 days.
| iii. | Prepayment to suppliers |
The Policy establishes that USD 25,000 prepayments can only be granted to suppliers if its value is properly and fully provisioned. The Treasurer of each subsidiary must approve supplier warranties that the Company receives for prepayments before signing the respective service contract. In the case of domestic suppliers, a warranty ballot (or the instrument existing in the country) shall be required, in favor of Andina executable in the respective country, non-endorsable, payable on demand or upon presentation and its validity will depend on the term of the contract. In the case of foreign suppliers, a stand-by credit letter will be required which shall be issued by a first line bank; in the event that this document is not issued in the country where the transaction is done, a direct bank warranty will be required. Subsidiaries can define the best way of safeguarding the Company’s assets for prepayments under USD 25,000.
| iv. | Guarantees |
In Chile, we have insurance with Compañía de Seguros de Crédito Continental S.A. (AA rating –according to Fitch Chile and Humphreys rating agencies) covering the credit risk regarding trade debtors in Chile.
The rest of the operations do not have credit insurance, instead mortgage guarantees are establishedrequired for all customers based on an internal ratingvolume operations of wholesalers and behaviour payment. Thedistributors in the case of trade accounts receivable outstandingreceivables. In the case of other debtors, different types of guarantees are monthly monitored. Additionally,required according to the Company takesnature of the credit insurance that substantially cover balances Commercial Debtors.granted.
Historically, uncollectible trade accounts have been lower than 0.5% of the Company’s total sales.
| b) | Financial investments |
The Company estimateshas a Policy that additional credit risk provisions are not necessary, other than individual and collective provisions determined as of December 31 2015 and 2014. Regarding financial placements, these are made inis applicable to all the highest-rated financial institutions credit of eachcompanies of the countriesgroup in which it operates.order to cover credit risks for financial investments, restricting both the types of instruments as well as the institutions and degree of concentration. The companies of the group can invest in:
| i. | Time deposits: only in banks or financial institutions that have a risk rating equal or higher than Level 1 (Fitch) or equivalent for deposits of less than 1 year and rated A or higher (S&P) or equivalent for deposits of more than 1 year. |
| ii. | Mutual funds: investments with immediate liquidity and no risk of capital (funds composed of investments at a fixed-term, current account, fixed rate Tit BCRA, negotiable obligations, Over Night, etc.) in all those counter-parties that have a rating greater than or equal to AA-(S&P) or equivalent, Type 1 Pacts and Mutual Funds, with a rating greater than or equal to AA+ (S&P) or equivalent. |
| iii. | Other investment alternatives must be evaluated and authorized by the office of the Chief Financial Officer. |

Exchange Rate Risk
The company is exposed to three types of risk caused by exchange rate volatility:
| a) | Exposure of foreign investment |
a) Exposure of foreign investment: thisThis risk originates from the translation of net investment from the functional currency of each country (Brazilian Real, Paraguayan Guaraní, and Argentine Peso) to the Parent Company’s reporting currency (Chilean Peso). Appreciation or devaluation of the Chilean Peso with respect to each of the functional currencies of each country, originates decreases and increases in equity, respectively. The Company does not hedge this risk.risk.
a.1 Investment in Argentina
| a.1 | Investment in Argentina |
As of December 31, 2015,the closing date of these financial statements, the Company maintains a net investment of ThCh$93,361,632CLP 145,395,883 thousand. in Argentina, composed by the recognition of assets amounting to ThCh$213,255,949CLP 215,017,770 thousand and liabilities amounting to ThCh$119,894,317.CLP 69,621,887 thousand. These investments reported 33.4%accounted for 19.9% of the Company’s consolidated sales revenues.revenues
As of December 31, 2015,2020, the Argentine peso devalued 23.2%appreciated by 32.4% with respect to the Chilean peso.
During 2015 exchange restrictions existed in Argentina and until mid-December, there was a parallel foreign exchange market with a higher than the official exchange rate. With the arrival of the new Argentine Government, fixing exchange rate is lightened by increasing parity of the Argentine peso versus dollar at the close to values similar to those that kept the parallel market.
If the exchange rate of the ArgentineanArgentine Peso devaluateddevalued an additional 5% with respect to the Chilean Peso, the Company would have lower income from the operation in Argentina of ThCh$1,625,272CLP 239,096 thousand and a decrease in equity of ThCh$3,130,550, originated by lower asset recognition of ThCh$8,287,291 and by lower liabilities recognition of ThCh$5,156,741.CLP 5,148,794 thousand.
a.2 Investment in Brazil
| a.2 | Investment in Brazil |
As of December 31, 2015,the closing date of these financial statements, the Company maintains a net investment of ThCh$232,051,982CLP 231,787,304 thousand in Brazil, composed by the recognition of assets amounting to ThCh$777,732,309CLP 793,157,414 thousand and liabilities amounting to ThCh$545,680,327.CLP 561,370,108 thousand. These investments reported 32.3%accounted for 29.9% of the Company’sCompany's consolidated sales revenues.
As of December 31, 2015,2020, the Brazilian Real devaluated 20.4%appreciated by 26.4% with respect to the Chilean pesopeso.
If the exchange rate of the Brazilian Real devaluateddevalued an additional 5% with respect to the Chilean Peso, the Company would have lower income from the operation in Brazil of ThCh$1,517,936CLP 2,506,240 thousand and a decrease in equity of ThCh$10,550,913, originated by lower asset recognition of ThCh$23,178,980 and by lower liabilities recognition of ThCh$12,628,067.CLP 11,495,651 thousand.
a.3 Investment in Paraguay
| a.3 | Investment in Paraguay |
As of December 31, 2015,the closing date of these financial statements, the Company maintains a net investment of ThCh$254,537,390CLP 232,163,091 thousand in Paraguay, composed by the recognition of assets amounting to ThCh$293,387,289CLP 270,899,700 thousand and liabilities amounting to ThCh$38,849,900.CLP 38,736,609 thousand. These investments reported 6.9%accounted for 7.9% of the Company’sCompany's consolidated sales revenues.
As of December 31, 2015,2020, the Paraguayan Guarani devaluated 7.1%appreciated by 11.2% with respect to the Chilean pesopeso.
If the exchange rate of the Paraguayan Guaraní devaluated an additionaldevalued by 5% with respect to the Chilean Peso, the Company would have lower income from the operations in Paraguay of ThCh$896,581,CLP 1,737,265 thousand and a decrease in equity of ThCh$12,221,058 originated by lower asset recognition of ThCh$14,153,122 and lower liabilities recognition of ThCh$1,932,064.CLP 10,462,776.

| b) | Net exposure of assets and liabilities in foreign currency |
b)Net exposure of assets and liabilities in foreign currency: theThis risk stems mostly from carrying liabilities in US dollar, so the volatility of the US dollar with respect to the functional currency of each country generates a variation in the valuation of these obligations, with consequent effect on results.
As of December 31, 2015, the Company maintains a net liability position totaling ThCh$425,347,228, basically composed of obligations with the public and bank liabilities for ThCh$438,945,530 offset partially by financial assets denominated in dollars for ThCh$13,598,302.
Of total financial liabilities denominated in US dollars, ThCh$25,499,255 come from debts taken by the Brazilian operation and are exposed to the volatility of the Brazilian Real against the US dollar. On the other and ThCh$413,446,275 of US dollar liabilities correspond to Chilean operations, which are exposed to the volatility of the Chilean Peso against the US dollar
In order to protect the Company from the effects on income resulting from the volatility of the Brazilian Real and the Chilean Peso against the U.S. dollar, the Company maintains derivative contracts (cross currency swaps) to cover almost 100% of US dollar-denominated financial liabilities.
By designating such contracts as hedging derivatives, the effects on income for variations in the Chilean Peso and the Brazilian Real against the US dollar, are mitigated annulling its exposure to exchange rates.
The Company’s net exposure as of December 31, 2015 to foreign currency over existing assets and liabilities, discounting the derivatives contracts, is an asset position of ThCh$10,038,822.
| c) | Exposure of assets purchased or indexed to foreign currency |
c) Assets purchased or indexed to foreign currency exposure: thisThis risk originates from purchases of raw materials and investments in property,Property, plant and equipment, whose values are expressed in a currency other than the functional currency of the subsidiary. Changes in the value of costs or investments can be generated through time, depending on the volatility of the exchange rate.
Annual purchases of raw materials denominated or indexed in U.S. dollars, amountsIn order to 19% of our cost of sales or approximately US$340 million.
In addition, and depending on market conditions,minimize this risk, the Company maintains a currency hedging policy stipulating that it is necessary to enter into foreign currency derivatives contracts to lessen the effect of the exchange rate over cash expenditures expressed in US dollar, whichdollars, corresponding mainly correspond to payment to suppliers of raw materials and fixed assets. Asin each of December 31, 2015 there are no hedge agreements for future dollar purchases.the operations. This policy stipulates a 12-month forward horizon.
According to the percentage of purchases of raw materials which are carried out or indexed to U.S. dollars, a possible change in the value of the US dollar by 5% in the four countries where the Company operates, and excluding derivatives contracts taken to mitigate the effect of currency volatility, keeping everything constant, would lead to a lower accumulated result amounting to ThCh$10,905,763 as of December 31, 2015. Currently, the Company has contracts to hedge this effect in Argentina, Brazil and Chile.
d) Commodities risk
The Company is subject to a risk of price fluctuations in the international markets mainly for sugar, aluminumPET resin and PET resin,aluminum, which are inputs requiredused to produce beverages and as a whole,containers, which together, account for 35% to 40% of operating costs. Procurement and anticipated purchase contracts are made frequently to minimize and/or stabilize this risk. The possible effects in these consolidated financial statements, in case of a 5% increase in prices of its main raw materials, would be a reduction of ThCh$ 6,326,712 in earnings for the year ended December 31, 2015.To minimize this risk or stabilize often supply contracts and anticipated purchases are made when market conditions warrant.
e) Liquidity risk
The products we sell are mainly paid for in cash and short term credit,short-term credit; therefore, the Company´s main source of financing comes from the cash flow of our operations. This cash flow has historically been sufficient to cover the investments necessary for the normal course of our business, as well as the distribution of dividends approved by the General Shareholders’ Meeting. Should additional funding be required for future geographic expansion or other needs, the main sources of financing to consider are: (i) debt offerings in the Chilean and foreign capital markets (ii) borrowings from commercial banks, both internationally and in the local markets where the Company operates; and (iii) public equity offerings

The following table presents our contractual and commercial obligations asan analysis of December 31, 2015:the Company’s committed maturities for liability payments throughout the coming years, with interest calculated for each period:
|
| Maturity |
| ||||||||
Item |
| 1 year |
| More 1 year |
| More 2 |
| More 3 years |
| More 4 years |
|
|
| ThCh$ |
| ThCh$ |
| ThCh$ |
| ThCh$ |
| ThCh$ |
|
Bank debt |
| 24,591,989 |
| 20,027,145 |
| 4,671,470 |
| 3,216,844 |
| 3,397,764 |
|
Bonds payable |
| 45,517,624 |
| 51,678,519 |
| 44,905,830 |
| 44,683,510 |
| 880,189,651 |
|
Operating lease obligations |
| 10,338,214 |
| 3,646,445 |
| 2,719,674 |
| 2,103,210 |
| 14,723,714 |
|
Purchase obligations |
| 158,942,337 |
| 63,211,521 |
| 12,058,315 |
| 8,271,526 |
| 60,000,306 |
|
Total |
| 239,390,164 |
| 138,563,630 |
| 64,355,289 |
| 58,275,090 |
| 958,311,435 |
|
| Payments on the year of maturity | ||||||||||||||||||||
| Item | 1 year | More than 1 up to 2 | More than 2 up to 3 | More than 3 up to 4 | More than 5 | |||||||||||||||
| ThCh$ | ThCh$ | ThCh$ | ThCh$ | ThCh$ | ||||||||||||||||
| Bank debt | 775,684 | 849,879 | 81,111 | 81,111 | 4,081,333 | |||||||||||||||
| Bonds payable (1) | 72,133,209 | 11,977,274 | 12,498,126 | 272,549,586 | 628,943,928 | |||||||||||||||
| Lease obligations | 5,718,484 | 5,129,266 | 2,207,021 | 7,805,284 | 197,802 | |||||||||||||||
| Contractual obligations | 8,426,144 | 83,368,375 | 13,446,852 | 9,839,970 | 9,714,261 | |||||||||||||||
| Total | 87,053,521 | 101,324,794 | 28,233,110 | 290,275,951 | 642,937,324 | |||||||||||||||
F-(1) 105Includes Mark-to-Market liability valuations for bond hedge derivatives
COVID-19-Related Risk
As a result of the impact that COVID-19 is having in different countries around the world, including its more recent outbreak in the countries where we operate, Coca-Cola Andina has taken measures necessary to protect its employees and to ensure the continuity of the Company’s operations.
Among the measures it has adopted to protect its employees are the following:
| · | campaign to educate our employees on actions to be taken to avoid the spread of COVID-19; |
| · | sending home any employee that has been exposed to the virus; |
| · | implementation of additional cleaning protocols for our facilities; |
| · | modifying certain work practices and activities, keeping customer service: |
| - | home office has been implemented for those employees whose work can be performed remotely |
| - | domestic and international traveling has been canceled |
| · | providing personal protective equipment to all our employees who need to keep working at plants and distribution centers, as well as to truck drivers and assistants, including face masks and sanitizers. |
Since mid-March, governments of the countries where the Company operates, have adopted several measures to reduce infection rates of COVID-19. Among these measures are, the closing of schools, universities, shopping centers, restaurants and bars, prohibiting social gathering events, issuing stay-at-home orders and establishing quarantine requirements, imposing additional sanitary requirements on exports and imports, and limiting international travel and closing borders. Governments in the countries where we operate have also announced economic stimulus programs for families and businesses, including in Argentina a temporary restriction on workforce reductions. To date, none of our plants has had to suspend their operations.
As a result of the COVID-19 pandemic and the restrictions imposed by the authorities in the four countries where we operate, we have seen high volatility in our sales across channels. During the fourth quarter, in consolidated terms, we continue to see a reduction in our sales volumes on the on-premise channel (albeit to a lesser extent than in previous quarters), consisting mainly of restaurants and bars, which are already able to operate, but with capacity restrictions. We have also observed that volume grows again in supermarkets, albeit slightly and that the traditional and wholesale channels are the ones that continue to drive volume growth. Because the pandemic and the actions taken by governments are changing very rapidly, we believe it is too early to draw conclusions about changes in the long-term consumption pattern, and how these may affect our results of operations and financial results in the future.
Due to uncertainties regarding the COVID-19 pandemic and the above-mentioned government restrictions, including how long these conditions may persist, and the effects they will have on our sales volumes and our business in general, we cannot accurately predict the ultimate financial impact from these new trends. In any event, we estimate that we will not face liquidity constraints, or difficulties in complying with covenants under our debt instruments. We do not anticipate any significant provisions or impairments at this time. Finally, our investment plan for 2021 will return to precrisis levels, i.e. between approximately USD$ 160 – USD 180 million. Our investment plans are constantly monitored, and we cannot assure that we will completely fulfill it if there is a stronger flare-up of Contentsthis health situation in the countries where we operate or for other unforeseen circumstance.
NOTE 24 — 25 – EXPENSES BY NATURE
Other expenses by nature are:are:
|
| 01.01.2015 |
| 01.01.2014 |
| 01.01.2013 |
| 01.01.2020 | 01.01.2019 | 01.01.2018 | |||||||||
Details |
| 12.31.2015 |
| 12.31.2014 |
| 12.31.2013 |
| 12.31.2020 | 12.31.2019 | 12.31.2018 | |||||||||
|
| ThCh$ |
| ThCh$ |
| ThCh$ |
| ||||||||||||
|
|
|
|
|
|
|
| ThCh$ | ThCh$ | ThCh$ | |||||||||
Direct production costs |
| 841,498,727 |
| 841,172,891 |
| 709,805,149 |
| 862,383,664 | 877,716,948 | 759,229,954 | |||||||||
Payroll and employee benefits |
| 296,611,242 |
| 264,644,018 |
| 214,183,604 |
| 252,337,262 | 273,123,010 | 266,966,841 | |||||||||
Transportation and distribution |
| 181,481,242 |
| 172,927,314 |
| 153,775,697 |
| 126,683,586 | 138,486,337 | 137,428,173 | |||||||||
Marketing |
| 43,676,871 |
| 48,109,609 |
| 45,729,107 |
| ||||||||||||
| Advertising | 6,917,300 | 27,113,322 | 17,345,951 | ||||||||||||||||
Depreciation and amortization |
| 100,632,332 |
| 102,966,925 |
| 83,336,884 |
| 110,920,517 | 111,087,284 | 99,594,446 | |||||||||
Repairs and maintenance |
| 33,732,510 |
| 34,374,318 |
| 29,869,212 |
| 25,971,485 | 30,528,180 | 28,120,098 | |||||||||
Other expenses |
| 164,164,860 |
| 146,232,108 |
| 113,697,218 |
| 73,455,798 | 83,188,784 | 138,860,648 | |||||||||
Total |
| 1,661,797,784 |
| 1,610,427,183 |
| 1,350,396,871 |
| ||||||||||||
| Total (1) | 1,458,669,612 | 1,541,243,865 | 1,447,546,111 | ||||||||||||||||
(1) Corresponds to the addition of cost of sales, administration expenses and distribution cost,
Other operating income by function is detailed as follows:follows:
|
| 01.01.2015 |
| 01.01.2014 |
| 01.01.2013 |
| 01.01.2020 | 01.01.2019 | 01.01.2018 | |||||||||
Details |
| 12.31.2015 |
| 12.31.2014 |
| 12.31.2013 |
| 12.31.2020 | 12.31.2019 | 12.31.2018 | |||||||||
|
| ThCh$ |
| ThCh$ |
| ThCh$ |
| ThCh$ | ThCh$ | ThCh$ | |||||||||
|
|
|
|
|
|
|
| ||||||||||||
Earnings from sale of ownership interest in Leao Junior |
| — |
| 300,816 |
| — |
| ||||||||||||
Gain on disposal of property, plant and equipment |
| 233,255 |
| 2,533,546 |
| 3,345,299 |
| ||||||||||||
| Gain on disposal of Property, plant and equipment | 16,005 | 265,514 | 1,984,547 | ||||||||||||||||
| Recovery AFIP claim | - | - | 232,617 | ||||||||||||||||
| Recovery PIS and COFINS credits (1) | 6,744,341 | 40,281,550 | - | ||||||||||||||||
Others |
| 238,314 |
| 1,136,261 |
| 1,040,318 |
| 1,595,952 | 400,094 | 392,004 | |||||||||
Total |
| 471,569 |
| 3,970,623 |
| 4,385,617 |
| 8,356,298 | 40,947,158 | 2,609,168 | |||||||||
| (1) | See Note 6 for more information regarding recovery |
NOTE 26 — 27 – OTHER EXPENSES BY FUNCTION
Other expenses by function are detailed as follows:
|
| 01.01.2015 |
| 01.01.2014 |
| 01.01.2013 |
|
Details |
| 12.31.2015 |
| 12.31.2014 |
| 12.31.2013 |
|
|
| ThCh$ |
| ThCh$ |
| ThCh$ |
|
|
|
|
|
|
|
|
|
Tax on bank debits |
| 8,219,046 |
| 6,130,568 |
| 6,189,979 |
|
Contingencies and associated fees |
| 8,866,661 |
| 3,502,207 |
| 7,071,527 |
|
Disposal and write-off of property, plant and equipment |
| 3,979,594 |
| 5,812,123 |
| 7,546,982 |
|
Fiscal Credit Provision (Brazil) |
| — |
| — |
| 1,970,894 |
|
Judicial Deposits Provision (Brazil) |
| — |
| — |
| 1,255,090 |
|
Distribution restructuring project (Chile) |
| — |
| — |
| 3,148,187 |
|
Merger expenses |
| — |
| — |
| 772,689 |
|
Donations |
| 214,856 |
| 2,034,119 |
| 582,000 |
|
Others |
| 702,891 |
| 1,112,254 |
| 1,924,749 |
|
Total |
| 21,983,048 |
| 18,591,271 |
| 30,462,097 |
|
| 01.01.2020 | 01.01.2019 | 01.01.2018 | ||||||||||
| Details | 12.31.2020 | 12.31.2019 | 12.31.2018 | |||||||||
| ThCh$ | ThCh$ | ThCh$ | ||||||||||
| Contingencies and non-operating fees | 1,081,812 | 17,690,171 | 10,192,495 | |||||||||
| Tax on bank debits | 3,367,615 | 4,356,973 | 4,653,929 | |||||||||
| Write-offs, disposal and loss of Property, plant and equipment | 7,972,976 | 2,978,194 | 262,366 | |||||||||
| Others | 5,007,853 | 1,157,509 | 948,973 | |||||||||
| Total | 17.430.256 | 26,182,847 | 16,057,763 | |||||||||
NOTE 27 — 28 – FINANCIAL INCOME AND EXPENSES
Financial income and expenses are detailed as follows:follows:
| a) | Financial income |
| 01.01.2020 | 01.01.2019 | 01.01.2018 | ||||||||||
| Detail | 12.31.2020 | 12.31.2019 | 12.31.2018 | |||||||||
| ThCh$ | ThCh$ | ThCh$ | ||||||||||
| Interest income | 7,931,055 | 3,249,550 | 1,046,580 | |||||||||
| Guaranty restatement Ipiranga acquisition | 7,674 | 27,219 | - | |||||||||
| Recovery PIS and COFINS credits (1) | 5,124,810 | 39,780,620 | - | |||||||||
| Other financial income | 1,882,340 | 2,098,402 | 2,893,664 | |||||||||
| Total | 14,945,879 | 45,155,791 | 3,940,244 | |||||||||
| (1) | See Note 6 for more information regarding recovery |
| b) | Financial costs |
| 01.01.2020 | 01.01.2019 | 01.01.2018 | ||||||||||
| Details | 12.31.2020 | 12.31.2019 | 12.31.2018 | |||||||||
| ThCh$ | ThCh$ | ThCh$ | ||||||||||
| Bond interest | 45,927,500 | 38,153,036 | 38,547,682 | |||||||||
| Bank loan interest | 1,186,731 | 1,337,670 | 1,828,588 | |||||||||
| Other financial costs | 7,658,606 | 6,718,314 | 14,638,390 | |||||||||
| Total | 54,772,837 | 46,209,020 | 55,014,660 | |||||||||
a)Finance income
|
| 01.01.2015 |
| 01.01.2014 |
| 01.01.2013 |
|
Description |
| 12.31.2015 |
| 12.31.2014 |
| 12.31.2013 |
|
|
| ThCh$ |
| ThCh$ |
| ThCh$ |
|
|
|
|
|
|
|
|
|
Interest income |
| 9,175,522 |
| 7,770,198 |
| 4,497,802 |
|
Other interest income |
| 942,853 |
| 885,425 |
| 475,510 |
|
Total |
| 10,118,375 |
| 8,655,623 |
| 4,973,312 |
|
b)Finance expenses
|
| 01.01.2015 |
| 01.01.2014 |
| 01.01.2013 |
|
Description |
| 12.31.2015 |
| 12.31.2014 |
| 12.31.2013 |
|
|
| ThCh$ |
| ThCh$ |
| ThCh$ |
|
|
|
|
|
|
|
|
|
Bond interest |
| 42,096,039 |
| 44,917,601 |
| 12,441,966 |
|
Bank loan interest |
| 8,115,445 |
| 15,029,145 |
| 14,283,636 |
|
Other interest costs |
| 5,457,733 |
| 5,134,685 |
| 2,218,421 |
|
Total |
| 55,669,217 |
| 65,081,431 |
| 28,944,023 |
|
NOTE 28 — 29 – OTHER GAIN AND (LOSSES) GAINS
Other (losses) gains and (losses) are detailed as follows:follows:
|
| 01.01.2015 |
| 01.01.2014 |
| 01.01.2013 |
|
Details |
| 12.31.2015 |
| 12.31.2014 |
| 12.31.2013 |
|
|
| ThCh$ |
| ThCh$ |
| ThCh$ |
|
|
|
|
|
|
|
|
|
Gains (loss) on derivative transactions raw materials |
| (1,620,304 | ) | 196,009 |
| 1,711,816 |
|
Losses on ineffective portion of hedge derivatives (see note 21 b) |
| (4,698,187 | ) | (5,995,530 | ) | (559,875 | ) |
Previous year allowance reversals |
| — |
| 1,411,030 |
| — |
|
Restructuring of operations (new Renca plant) |
| — |
| — |
| (94,143 | ) |
Other income and (expenses) |
| 17,370 |
| (3,614 | ) | (317,425 | ) |
Total |
| (6,301,121 | ) | (4,392,105 | ) | 740,373 |
|
| 01.01.2020 | 01.01.2019 | 01.01.2018 | ||||||||||
| Details | 12.31.2020 | 12.31.2019 | 12.31.2018 | |||||||||
| ThCh$ | ThCh$ | ThCh$ | ||||||||||
| (Losses) gains on ineffective portion of hedge derivatives | - | - | (2,707,802 | ) | ||||||||
| Other income and expenses | 287 | 2,876 | (57 | ) | ||||||||
| Total | 287 | 2,876 | (2,707,859 | ) | ||||||||

NOTE 29 — 30THE ENVIRONMENT (unaudited)– LOCAL AND FOREIGN CURRENCY
The Company has made disbursements totaling ThCh$2,402,749 for improvements in industrial processes, equipment to measure industrial waste flows, laboratory analysis, consulting on environmental impactsLocal and others.foreign currency balances are the following:
| CURRENT ASSETS | 12.31.2020 | 12.31.2019 | ||||||
| ThCh$ | ThCh$ | |||||||
| Cash and cash equivalents | 309,530,699 | 157,567,986 | ||||||
| USD | 21,332,268 | 16,733,249 | ||||||
| EUR | 223,449 | 9,722 | ||||||
| CLP | 201,936,140 | 78,420,966 | ||||||
| BRL | 49,528,425 | 46,189,977 | ||||||
| ARS | 14,821,502 | 3,830,199 | ||||||
| PGY | 21,688,915 | 12,383,873 | ||||||
| Other current financial assets | 140,304,853 | 347,278 | ||||||
| CLP | 139,449,882 | 275,407 | ||||||
| BRL | 10,171 | 13,498 | ||||||
| ARS | 844,800 | 16,575 | ||||||
| PGY | - | 41,798 | ||||||
| Other current non-financial assets | 13,374,381 | 16,188,965 | ||||||
| USD | 1,723,989 | 893,571 | ||||||
| EUR | 621,516 | 615,636 | ||||||
| UF | 493,546 | 410,203 | ||||||
| CLP | 1,900,762 | 5,642,901 | ||||||
| BRL | 1,300,995 | 1,738,793 | ||||||
| ARS | 6,052,294 | 3,918,728 | ||||||
| PGY | 1,281,279 | 2,969,133 | ||||||
| Trade accounts and other accounts receivable | 194,021,253 | 191,077,588 | ||||||
| USD | 901,930 | 1,431,079 | ||||||
| EUR | - | |||||||
| UF | 65,250 | 453,469 | ||||||
| CLP | 105,340,179 | 83,328,449 | ||||||
| BRL | 67,423,832 | 79,586,461 | ||||||
| ARS | 14,928,954 | 19,088,164 | ||||||
| PGY | 5,361,108 | 7,189,966 | ||||||
| Accounts receivable related entities | 11,875,408 | 10,835,768 | ||||||
| USD | 45,644 | |||||||
| CLP | 6,965,894 | 9,157,922 | ||||||
| BRL | 41,878 | - | ||||||
| ARS | 4,867,636 | 1,632,202 | ||||||
| Inventories | 127,972,650 | 147,641,224 | ||||||
| USD | - | 6,027,076 | ||||||
| CLP | 54,112,760 | 48,320,784 | ||||||
| BRL | 31,446,180 | 43,820,564 | ||||||
| ARS | 32,214,119 | 34,262,914 | ||||||
| PGY | 10,199,591 | 15,209,886 | ||||||
| Current tax assets | 218,472 | 9,815,294 | ||||||
| CLP | 218,472 | 9,815,294 | ||||||
| BRL | - | - | ||||||
| ARS | - | - | ||||||
| Total current assets | 797,297,716 | 533,474,103 | ||||||
| USD | 23,958,187 | 25,129,648 | ||||||
| EUR | 844,965 | 625,359 | ||||||
| UF | 558,796 | 863,672 | ||||||
| CLP | 509,924,089 | 234,962,693 | ||||||
| BRL | 149,751,481 | 171,349,293 | ||||||
| ARS | 73,729,305 | 62,748,782 | ||||||
| PGY | 38,530,893 | 37,794,656 | ||||||

| NON-CURRENT ASSETS | 12.31.2020 | 12.31.2019 | ||||||
| ThCh$ | ThCh$ | |||||||
| Other non-current financial assets. | 162,013,278 | 110,784,311 | ||||||
| UF | 7,515,981 | 1,216,865 | ||||||
| BRL | 144,684,180 | 98,918,457 | ||||||
| ARS | 9,813,117 | 10,648,989 | ||||||
| Other non-current non-financial assets | 90,242,672 | 125,636,150 | ||||||
| UF | 338,014 | 318,533 | ||||||
| CLP | 47,530 | 47,531 | ||||||
| BRL | 88,001,852 | 122,922,979 | ||||||
| ARS | 1,825,631 | 2,223,600 | ||||||
| PGY | 29,645 | 123,507 | ||||||
| Accounts receivable, non-current | 73,862 | 523,769 | ||||||
| UF | 32,219 | 465,371 | ||||||
| ARS | 1,211 | 636 | ||||||
| PGY | 40,432 | 57,762 | ||||||
| Accounts receivable related entities, non-current | 138.346 | 283,118 | ||||||
| CLP | 138,346 | 283,118 | ||||||
| Investments accounted for using the equity method | 87.956.354 | 99,866,733 | ||||||
| CLP | 50,628,307 | 49,703,673 | ||||||
| BRL | 37,328,047 | 50,163,060 | ||||||
| Intangible assets other than goodwill | 604,514,165 | 675,075,375 | ||||||
| USD | 3,959,421 | 3,959,421 | ||||||
| CLP | 306,202,181 | 307,324,953 | ||||||
| BRL | 139,166,117 | 189,240,893 | ||||||
| ARS | 2,591,026 | 2,708,445 | ||||||
| PGY | 152,595,420 | 171,841,663 | ||||||
| Goodwill | 98,325,593 | 121,221,661 | ||||||
| CLP | 9,523,767 | 9,523,767 | ||||||
| BRL | 54,980,669 | 74,653,328 | ||||||
| ARS | 27,343,642 | 29,750,238 | ||||||
| PGY | 6,477,515 | 7,294,328 | ||||||
| Property, plant and equipment | 605,576,545 | 722,718,863 | ||||||
| CLP | 255,963,912 | 282,861,852 | ||||||
| BRL | 179,286,945 | 251,080,517 | ||||||
| ARS | 103,227,548 | 119,784,304 | ||||||
| PGY | 67,098,140 | 68,992,190 | ||||||
| Deferred tax assets | 1,925,869 | 1,364,340 | ||||||
| CLP | 1,925,869 | 1,364,340 | ||||||
| Total non-current assets | 1,650,766,684 | 1,857,474,320 | ||||||
| USD | 3,959,421 | 3,959,421 | ||||||
| UF | 7,886,214 | 2,000,769 | ||||||
| CLP | 624,429,912 | 651,109,234 | ||||||
| BRL | 643,447,810 | 786,979,234 | ||||||
| ARS | 144,802,175 | 165,116,212 | ||||||
| PGY | 226,241,152 | 248,309,450 | ||||||
F-94
These disbursements by country are detailed as follows:
|
|
|
| Future commitments |
| ||||
|
|
|
|
|
|
|
| to be capitalized to |
|
|
| Year ended 2015 |
|
|
| property, |
| ||
Country |
| Recorded as expenses |
| Capitalized to property, |
| to be Recorded |
| plant and |
|
|
| ThCh$ |
| ThCh$ |
| ThCh$ |
| ThCh$ |
|
|
|
|
|
|
|
|
|
|
|
Chile |
| 868,113 |
| — |
| — |
| — |
|
Argentina |
| 601,537 |
| 715 |
| 245,048 |
| — |
|
Brazil |
| 483,228 |
| 17,973 |
| 114,667 |
| — |
|
Paraguay |
| 86,788 |
| 344,395 |
| — |
| — |
|
Total |
| 2,039,666 |
| 363,083 |
| 359,715 |
| — |
|
| 12.31.2020 | 12.31.2019 | |||||||||||||||||||||||
| CURRENT LIABILITIES | Up to 90 days | 90 days to 1 year | Total | Up to 90 days | 90 days to 1 year | Total | ||||||||||||||||||
| ThCh$ | ThCh$ | ThCh$ | ThCh$ | ThCh$ | ThCh$ | |||||||||||||||||||
| Other financial liabilities, current | 9,270,838 | 29,295,886 | 38,566,724 | 9,719,894 | 30,873,984 | 40,593,878 | ||||||||||||||||||
| USD | 72,655 | 6,704,245 | 6,776,900 | 55,388 | 3,147,441 | 3,202,829 | ||||||||||||||||||
| UF | 7,799,637 | 5,272,547 | 13,072,184 | 7,535,228 | 11,836,936 | 19,372,164 | ||||||||||||||||||
| CLP | 908,790 | 13,489,310 | 14,398,100 | 842,221 | 11,700,946 | 12,543,167 | ||||||||||||||||||
| BRL | 362,854 | 1,245,940 | 1,608,794 | 1,153,072 | 2,119,141 | 3,272,213 | ||||||||||||||||||
| ARS | 70,950 | 1,578,082 | 1,649,032 | 75,060 | 704,921 | 779,981 | ||||||||||||||||||
| PGY | 55,952 | 1,005,762 | 1,061,714 | 58,925 | 1,364,599 | 1,423,524 | ||||||||||||||||||
| Trade accounts and other accounts payable, current | 227,503,270 | 2,942,539 | 230,445,809 | 228,259,216 | 15,441,337 | 243,700,553 | ||||||||||||||||||
| USD | 8,972,065 | - | 8,972,065 | 10,049,567 | - | 10,049,567 | ||||||||||||||||||
| EUR | 1,622,411 | - | 1,622,411 | 2,024,156 | - | 2,024,156 | ||||||||||||||||||
| UF | - | - | - | 2,044,871 | - | 2,044,871 | ||||||||||||||||||
| CLP | 108,670,085 | 2,942,539 | 111,612,624 | 84,602,547 | 15,441,337 | 100,043,884 | ||||||||||||||||||
| BRL | 58,136,480 | - | 58,136,480 | 75,051,089 | - | 75,051,089 | ||||||||||||||||||
| ARS | 33,511,747 | - | 33,511,747 | 40,826,489 | - | 40,826,489 | ||||||||||||||||||
| PGY | 15,878,527 | - | 15,878,527 | 13,660,497 | - | 13,660,497 | ||||||||||||||||||
| Other currencies | 711,955 | - | 711,955 | - | - | - | ||||||||||||||||||
| Accounts payable related entities, current | 39,541,968 | - | 39,541,968 | 53,637,601 | - | 53,637,601 | ||||||||||||||||||
| CLP | 23,884,687 | - | 23,884,687 | 28,471,399 | - | 28,471,399 | ||||||||||||||||||
| BRL | 10,809,085 | - | 10,809,085 | 19,279,132 | - | 19,279,132 | ||||||||||||||||||
| ARS | 4,848,196 | - | 4,848,196 | 5,887,070 | - | 5,887,070 | ||||||||||||||||||
| Other current provisions | 805,842 | 529,495 | 1,335,337 | 1,637,799 | 431,185 | 2,068,984 | ||||||||||||||||||
| CLP | 805,842 | 494,748 | 1,300,590 | 1,637,799 | 427,697 | 2,065,496 | ||||||||||||||||||
| PGY | - | 34,747 | 34,747 | - | 3,488 | 3,488 | ||||||||||||||||||
| Tax liabilities, current | 4,590,876 | 4,237,723 | 8,828,599 | 3,097,223 | 3,665,044 | 6,762,267 | ||||||||||||||||||
| CLP | 173,771 | 3,414,859 | 3,588,630 | 896,975 | - | 896,975 | ||||||||||||||||||
| BRL | 4,249,909 | - | 4,249,909 | 2,107,381 | - | 2,107,381 | ||||||||||||||||||
| ARS | 167,196 | 439,641 | 606,837 | 92,867 | 3,446,054 | 3,538,921 | ||||||||||||||||||
| PGY | - | 383,223 | 383,223 | - | 218,990 | 218,990 | ||||||||||||||||||
| Employee benefits current provisions | 17,027,427 | 14,043,592 | 31,071,019 | 26,513,813 | 11,879,041 | 38,392,854 | ||||||||||||||||||
| CLP | 1,168,973 | 5,799,389 | 6,968,362 | 1,241,603 | 5,509,351 | 6,750,954 | ||||||||||||||||||
| BRL | 15,325,256 | - | 15,325,256 | 20,681,694 | - | 20,681,694 | ||||||||||||||||||
| ARS | 533,198 | 6,701,756 | 7,234,954 | 4,590,516 | 5,260,142 | 9,850,658 | ||||||||||||||||||
| PGY | - | 1,542,447 | 1,542,447 | - | 1,109,548 | 1,109,548 | ||||||||||||||||||
| Other current non-financial liabilities | 620,609 | 27,646,121 | 28,266,730 | 328,441 | 26,173,774 | 26,502,215 | ||||||||||||||||||
| CLP | 598,769 | 27,551,000 | 28,149,769 | 327,847 | 26,064,658 | 26,392,505 | ||||||||||||||||||
| ARS | 21,840 | - | 21,840 | 594 | 5,286 | 5,880 | ||||||||||||||||||
| PGY | - | 95,121 | 95,121 | - | 103,830 | 103,830 | ||||||||||||||||||
| Total current liabilities | 299,360,830 | 78,695,356 | 378,056,186 | 323,193,987 | 88,464,365 | 411,658,352 | ||||||||||||||||||
| USD | 9,044,720 | 6,704,245 | 15,748,965 | 10,104,955 | 3,147,441 | 13,252,396 | ||||||||||||||||||
| EUR | 1,622,411 | - | 1,622,411 | 2,024,156 | - | 2,024,156 | ||||||||||||||||||
| UF | 7,799,637 | 5,272,547 | 13,072,184 | 9,580,099 | 11,836,936 | 21,417,035 | ||||||||||||||||||
| CLP | 136,210,917 | 53,691,845 | 189,902,762 | 118,020,391 | 59,143,989 | 177,164,380 | ||||||||||||||||||
| BRL | 88,883,584 | 1,245,940 | 90,129,524 | 118,272,368 | 2,119,141 | 120,391,509 | ||||||||||||||||||
| ARS | 39,153,127 | 8,719,479 | 47,872,606 | 51,472,596 | 9,416,403 | 60,888,999 | ||||||||||||||||||
| PGY | 15,934,479 | 3,061,300 | 18,995,779 | 13,719,422 | 2,800,455 | 16,519,877 | ||||||||||||||||||
| Other currencies | 711,955 | - | 711,955 | - | - | - | ||||||||||||||||||

| 12.31.2020 | 12.31.2019 | |||||||||||||||||||||||||||||||
| NON-CURRENT LIABILITIES | More than 1 up to 3 years | More than 3 up to 5 years | More than 5 years | Total | More than 1 up to 3 years | More than 3 up to 5 years | More than 5 years | Total | ||||||||||||||||||||||||
| ThCh$ | ThCh$ | ThCh$ | ThCh$ | ThCh$ | ThCh$ | ThCh$ | ThCh$ | |||||||||||||||||||||||||
| Other non-current financial liabilities | 31,811,687 | 279,600,958 | 678,416,924 | 989,829,569 | 34,794,568 | 299,661,490 | 408,870,999 | 743,327,057 | ||||||||||||||||||||||||
| USD | 366,652 | 259,746,604 | 207,280,189 | 467,393,445 | 509,366 | 271,700,335 | - | 272,209,701 | ||||||||||||||||||||||||
| UF | 24,669,188 | 13,214,387 | 414,689,041 | 452,572,616 | 22,584,954 | 24,627,105 | 400,393,581 | 447,605,640 | ||||||||||||||||||||||||
| CLP | 4,089,001 | 4,000,000 | 51,568,854 | 59,657,855 | 7,926,056 | - | - | 7,926,056 | ||||||||||||||||||||||||
| BRL | 2,394,281 | 2,639,967 | 4,878,840 | 9,913,088 | 3,319,514 | 3,334,050 | 8,477,418 | 15,130,982 | ||||||||||||||||||||||||
| ARS | 128,930 | - | - | 128,930 | 55,222 | - | - | 55,222 | ||||||||||||||||||||||||
| PGY | 163,635 | - | - | 163,635 | 399,456 | - | - | 399,456 | ||||||||||||||||||||||||
| Accounts payable, non-current | 295,279 | - | - | 295,279 | 619,587 | - | - | 619,587 | ||||||||||||||||||||||||
| CLP | 293,176 | - | - | 293,176 | 618,509 | - | - | 618,509 | ||||||||||||||||||||||||
| ARS | 2,103 | - | - | 2,103 | 1,078 | - | - | 1,078 | ||||||||||||||||||||||||
| Accounts payable related companies | 10,790,089 | - | - | 10,790,089 | 19,777,812 | - | - | 19,777,812 | ||||||||||||||||||||||||
| BRL | 10,790,089 | - | - | 10,790,089 | 19,777,812 | - | - | 19,777,812 | ||||||||||||||||||||||||
| Other non-current provisions | 789,016 | 47,945,920 | - | 48,734,936 | 968,404 | 66,070,162 | - | 67,038,566 | ||||||||||||||||||||||||
| BRL | - | 47,945,920 | - | 47,945,920 | - | 66,070,162 | - | 66,070,162 | ||||||||||||||||||||||||
| ARS | 789,016 | - | - | 789,016 | 968,404 | - | - | 968,404 | ||||||||||||||||||||||||
| Deferred tax liabilities | 10,677,151 | 38,508,424 | 104,483,972 | 153,669,547 | 12,834,788 | 49,848,536 | 106,766,423 | 169,449,747 | ||||||||||||||||||||||||
| UF | - | - | - | - | - | - | 1,298,050 | 1,298,050 | ||||||||||||||||||||||||
| CLP | 1,604,289 | 1,070,325 | 90,781,152 | 93,455,766 | 1,449,404 | 181,418 | 90,271,026 | 91,901,848 | ||||||||||||||||||||||||
| BRL | - | 37,438,099 | - | 37,438,099 | - | 49,667,118 | - | 49,667,118 | ||||||||||||||||||||||||
| ARS | 9,072,862 | - | - | 9,072,862 | 11,385,384 | - | - | 11,385,384 | ||||||||||||||||||||||||
| PGY | - | - | 13,702,820 | 13,702,820 | - | - | 15,197,347 | 15,197,347 | ||||||||||||||||||||||||
| Employee benefits non-current provisions | 911,873 | 145,165 | 12,578,520 | 13,635,558 | 1,114,051 | 148,954 | 8,910,349 | 10,173,354 | ||||||||||||||||||||||||
| CLP | 378,733 | 145,165 | 12,578,520 | 13,102,418 | 461,587 | 148,954 | 8,910,349 | 9,520,890 | ||||||||||||||||||||||||
| ARS | - | - | - | - | 88,090 | - | - | 88,090 | ||||||||||||||||||||||||
| PGY | 533,140 | - | - | 533,140 | 564,374 | - | - | 564,374 | ||||||||||||||||||||||||
| Other non-financial liabilities | 35,315 | 21,436,733 | - | 21,472,048 | - | - | - | - | ||||||||||||||||||||||||
| BRL | - | 21,436,733 | - | 21,436,733 | - | - | - | - | ||||||||||||||||||||||||
| ARS | 35,315 | - | - | 35,315 | - | - | - | - | ||||||||||||||||||||||||
| Income taxes payable, non-current | 20,597 | - | - | 20,597 | - | - | - | - | ||||||||||||||||||||||||
| CLP | 20,597 | - | - | 20,597 | - | - | - | - | ||||||||||||||||||||||||
| Total non-current liabilities | 55,331,007 | 387,637,200 | 795,479,416 | 1,238,447,623 | 70,109,210 | 415,729,142 | 524,547,771 | 1,010,386,123 | ||||||||||||||||||||||||
| USD | 366,652 | 259,746,604 | 207,280,189 | 467,393,445 | 509,366 | 271,700,335 | - | 272,209,701 | ||||||||||||||||||||||||
| UF | 24,669,188 | 13,214,387 | 414,689,041 | 452,572,616 | 22,584,954 | 24,627,105 | 401,691,631 | 448,903,690 | ||||||||||||||||||||||||
| CLP | 6,385,796 | 5,215,490 | 154,928,526 | 166,529,812 | 10,455,556 | 330,372 | 99,181,375 | 109,967,303 | ||||||||||||||||||||||||
| BRL | 13,184,370 | 109,460,719 | 4,878,840 | 127,523,929 | 23,097,326 | 119,071,330 | 8,477,418 | 150,646,074 | ||||||||||||||||||||||||
| ARS | 10,028,226 | - | - | 10,028,226 | 12,498,178 | - | - | 12,498,178 | ||||||||||||||||||||||||
| PGY | 696,775 | - | 13,702,820 | 14,399,595 | 963,830 | - | 15,197,347 | 16,161,177 | ||||||||||||||||||||||||

Table of Contents31 – SUBSEQUENT
NOTE 30 — SUBSEQUENT EVENTS
On February 17, 2021, the ordinary Boardsubsidiary Paraguay Refrescos S.A. along with the companies INPET S.A.E.C.A and CORESA. executed the Bylaws and Shareholders' Agreement for the incorporation of Directors, held and January 28, 2016, Directors of Embotelladora Andina S.A. agreed to incorporate a closed joint-stock company called Coca-Cola Del Valle New Ventures"CIRCULAR- PET S.A. (“Coca-Cola Del Valle”)" Each of the companies will hold a 33.3% ownership interest in the company's share capital.
The subscribed share capital of CIRCULAR- PET S.A. is CLP 4,326 million (PGY 42,000,000,000), where each shareholder at the incorporation act paid a share of CLP 1,030,000 (PGY 10,000,000), totaling a paid-up share capital of CLP 3,090,000 (PGY 30,000,000).
The capitalprincipal activity of Coca-Cola Del Valle will be Ch$10,000,000, 35% of which will be contributed by Embotelladora AndinaCIRCULAR-PET S.A., 15% by Embonor S.A. and 50% by Coca-Cola de Chile S.A. The main corporate purpose of Coca-Cola Del Valle will be the developmentmanufacture and productioncommercialization of juices, waterrecycled post-consumer PET resins, from the transformation of PET flakes. Participation in the company provides the Group with a fully integrated supply chain for its growing business of commercializing products in PET bottles and non-carbonated beverageswill ensure the supply of recycled resin under brands owned by The Coca-Cola Company, that Andina and Coca-Cola Embonor S.A. are authorized to commercialize and distribute in their respective franchise territories.the best conditions for the coming years.
There are noNo other subsequent events have occurred after December 31, 2020 that may significantly impactaffect the Company’sCompany's consolidated financial situation.