· changes in Peruvian, Brazilian and international governmental and regulatory policies that apply to our operations; and
· other factors discussed under “Risk Factors.”
In light ofConsidering the risks and uncertainties described above, the events referred to in the estimates and forward lookingforward-looking statements included in this report may or may not occur, and our business performance and results of operation may differ materially from those expressed in our estimates and forward lookingforward-looking statements, due to factors that include but are not limited to those mentioned above.
These forward-looking statements are made as of the date of this annual report, and we assume no obligation to update them or revise them to reflect new events or circumstances. There can be no assurance that the forward-looking statements will prove to be accurate, as actual results and future events could differ materially from those anticipated in such statements.
PRESENTATION OF FINANCIAL AND OTHER INFORMATION
| 2 |
| About the Company |
About the Company
We are a large-scale, low-cost, integrated zinc producer with over 65 years of experience developing and operating mining and smelting assets in Latin America. We currently own and operate six long-life underground polymetallic mines – three located in the Central Andes of Peru, two located in the state of Minas Gerais in Brazil, and one in the state of Mato Grosso in Brazil, the Aripuanã mine, currently in the ramp-up phase as of the date of this annual report.
Nexa Resources S.A. is a public limited liability company (société anonyme) incorporated under the laws of Luxembourg on February 26, 2014. Our registered office is located at 37A, Avenue J.F. Kennedy, L-1855, Luxembourg, Grand Duchy of Luxembourg, and we are registered with the Luxembourg Trade and Companies Register under number B185489. Our telephone number at this address is +352 28 26 3727. Our main office outside of Luxembourg is located at Avenida Engenheiro Luís Carlos Berrini, n° 105, 6th floor, São Paulo, State of São Paulo, Brazil. Our website is www.nexaresources.com. None of the information available on our website is incorporated in this annual report and it should not be relied upon in deciding to invest in our common shares.
| 3 |
| Presentation of Financial and Other Information |
Presentation of financial and other information
Certain definitions
Unless otherwise indicated or the context otherwise requires, the terms below are defined in the following manner.
· The “Company,” “we,” “us” and “our” or similar terms refer to Nexa Resources and its consolidated subsidiaries;
· “Nexa Resources” refers to Nexa Resources S.A., a Luxembourg public liability company (société anonyme);
· “Nexa CJM” refers to our subsidiary Nexa Resources Cajamarquilla S.A. (previously known as Votorantim Metais—Cajamarquilla S.A.), a corporation organized as a sociedad anónima under the laws of Peru;
· “Nexa Brazil” refers to our subsidiary Nexa Recursos Minerais S.A. (previously known as Votorantim Metais Zinco S.A.), a corporation organized as a sociedade anônima under the laws of Brazil;
· “Nexa Peru” refers to our subsidiary Nexa Resources Peru S.A.A. (previously known as Compañía Minera Milpo S.A.A.), a corporation organized as a sociedad anónima abierta under the laws of Peru and publicly traded on the Lima Stock Exchange;
· “VGmbH” refers to our subsidiary Votorantim GmbH, formerly Votorantim Metals GmbH, a corporation organized under the laws of Austria;
· “Enercan” refers to our subsidiary Campos Novos Energia S.A., a corporation organized as a sociedade anônima under the laws of Brazil;
· “VUS” refers to our subsidiary Votorantim US, Inc., a corporation organized under the laws of Delaware;
· “VSA” refers to our shareholder Votorantim S.A., a corporation organized as a sociedade anônima under the laws of Brazil;
· the “Votorantim Group” refers to VSA and its subsidiaries;
· the “real,” “reais” or “R$” refers to the Brazilian real, the official currency of Brazil; and
· “sol,” “soles” or “S/.” refers to the Peruvian sol, the official currency of Peru.
| · | “Nexa,” “we,” “us” and “our” or similar terms refer to Nexa Resources and, unless the context otherwise requires, its consolidated subsidiaries; |
| · | “Nexa Resources” refers to Nexa Resources S.A., a Luxembourg public limited liability company (société anonyme); |
| · | “Nexa CJM” refers to our subsidiary Nexa Resources Cajamarquilla S.A. (previously known as Votorantim Metais—Cajamarquilla S.A.), a corporation organized as a sociedad anónima under the laws of Peru; |
| · | “Nexa Brazil” refers to our subsidiary Nexa Recursos Minerais S.A. (previously known as Votorantim Metais Zinco S.A.), a corporation organized as a sociedade anônima under the laws of Brazil; |
| · | “Nexa Peru” refers to our subsidiary Nexa Resources Peru S.A.A. (previously known as Compañía Minera Milpo S.A.A.), a corporation organized as a sociedad anónima abierta under the laws of Peru and publicly traded on the Lima Stock Exchange; |
| · | “Pollarix” refers to our subsidiary Pollarix S.A., a corporation organized as a sociedade anônima under the laws of Brazil; |
| · | “VSA” refers to our controlling shareholder Votorantim S.A., a corporation organized as a sociedade anônima under the laws of Brazil; |
| · | the “Votorantim Group” refers to our controlling shareholder VSA and, unless the context otherwise requires, its consolidated subsidiaries; |
| · | the “real,” “reais” or “R$” refers to the Brazilian real, the official currency of Brazil; |
| · | “sol,” “soles” or “S/.” refers to the Peruvian sol, the official currency of Peru; and |
In addition, the meaning of other defined terms used in this report are set out in “Glossary.”
Financial information
Our consolidated financial statements as of December 31, 20172023 and 20162022 and for each of the three years ended December 31, 2017, 2016 and 20152023 are included in this annual report. Our consolidated financial statements wereare prepared in accordance with International Financial Reporting Standards,IFRS accounting standards and interpretations, as issued by the International Accounting Standards Board or IFRS.(“IASB”) and the IFRS Interpretations Committee (“IFRS Accounting Standards”). References in this report to “our consolidated financial statements” are to our consolidated financial statements as of December 31, 20172023 and 20162022 and for each of the three years ended December 31, 2017, 2016 and 2015,2023, and the related notes thereto included elsewhere in this report.
The financial information presented in this report should be read in conjunction with our consolidated financial statements, including the related notes, and the section of this report titled “Operating and financial review and prospects.”
The main consolidated companies included in our consolidated financial statements are:
| · | Nexa CJM – a Peruvian company that is 99.997% directly and indirectly owned by Nexa Resources and is mainly engaged in smelting zinc contained in concentrate. Nexa CJM’s functional currency is the U.S. dollar. |
| 4 |
| Forward-Looking Statements |
| · | Nexa Peru – a Peruvian company that is 83.48% directly and indirectly owned by Nexa Resources and is mainly engaged in exploring, extracting, producing and trading zinc, copper and lead concentrates, extracted from its own three mining sites. Nexa Peru’s functional currency is the U.S. dollar. Nexa Peru is a public company with its shares listed on the Lima Stock Exchange. |
| · | Nexa Brazil – a Brazilian company that is 100% owned by Nexa Resources and is mainly engaged in exploring, extracting and producing zinc, copper and lead concentrates, and smelting zinc contained in concentrate with operations in the states of Minas Gerais and Mato Grosso. Nexa Brazil’s functional currency is the real. |
·Nexa CJM isNon-IFRS Accounting Standards measures
For a Peruvian company mainly engaged in smelting zinc contained in concentrate. Nexa CJM’s functional currency is the U.S. dollar.
·Nexa Peru is a Peruvian company mainly engaged in exploring, extracting, producing and trading zinc, copper and lead concentrates, extracted from its own three mining sites. Nexa Peru’s functional currency is the U.S. dollar. Nexa Peru is a public company with its shares listed on the Lima Stock Exchange.
·Nexa Brazil is a Brazilian company mainly engaged in exploring, extracting and producing zinc, copper and lead concentrates, and smelting zinc contained in concentrate with operations in the statediscussion of Minas Gerais. Nexa Brazil’s functional currency is the real. In connection with a series of transactions regardinghow our energy assets, which includes the Enercan, Picada, Amador Aguiar I, Amador Aguiar II and Igarapava electric power plants, VSA transferred its entire participation in Nexa Brazil (11.20%) to us on June 30, 2017. See “Share ownership and trading—Related party transactions—Certain transactions with our shareholders and their affiliates.”
Non-IFRS measures
Our management uses non-IFRS Accounting Standards measures such as Adjusted EBITDA, among other measures, for internal planning and performance measurement purposes. We believe these measures provide useful information about the financialan additional measure of operational performance of our operations that facilitates period-to-period comparisons on a consistent basis. Management uses Adjusted EBITDA internally to evaluate our underlying operating performance for the reporting periods presented and to assist with the planning and forecasting of future operating results. Management believes that Adjusted EBITDA is a useful measure of our performance because it reflects our cash generation potential from our operational activities excluding exceptional items of the period. These measures should not be considered individually or as a substitute for profit (loss) or operating profit, as indicators of operating performance, or as alternatives to cash flow as measures of liquidity. Additionally, our calculation of Adjusted EBITDA and other non-IFRS measures may be different from the calculation used by other companies,Company’s business, including our competitors in the mining industry, so our measures may not be comparable to those of other companies. See “Selected financial data” for a discussion of our useAdjusted EBITDA, reconciliation with most comparable IFRS Accounting Standards figures and changes made in 2023, see “Operating and financial review and prospects—Results of Operations—Non-IFRS Accounting Standards measures and reconciliation.”
All forward-looking non-IFRS Accounting Standards financial measures in this report,document, including the reasons why we believe this informationcash cost guidance, are provided only on a non-IFRS Accounting Standards basis. This is useful to management and to investors, and a reconciliationdue to the inherent difficulty of forecasting the timing or number of items that would be included in the most directly comparable forward-looking IFRS Accounting Standards financial measures. As a result, reconciliation of the forward-looking non-IFRS Accounting Standards financial measures to IFRS Accounting Standards financial measures is not available without unreasonable effort and we are unable to assess the probable significance of the unavailable information.
Country, market and industry information
This report contains and refers to information and statistics regarding Brazil, Peruthe countries in which we operate and the markets for the metals we produce. This data is obtained from independent public sources, including publications and materials from participants in the industry, such as Wood Mackenzie and from governmental entities such as the Brazilian Central Bank, Bloomberg Finance L.P., London Metal Exchange (“LME”), London Bullion Market Association (“LBMA”), Brazilian Ministry of TreasuryEconomy (Ministério da FazendaEconomia), Brazilian Ministry of Mines and Energy (Ministério de Minas e Energia, or MME)“MME”), (Center of Custody and Financial Settlement of Securities CETIP S.A.—National Mining Agency (Mercados OrganizadosAgência Nacional de Mineração, or CETIP)“ANM”), Brazilian Institute of Geography and Statistics (Instituto Brasileiro de Geografia e Estatística), or IBGE,“IBGE”), the Getulio Vargas Foundation (Fundação Getúlio Vargas,), or FGV, the Peruvian Insurance and Private Pension Funds Supervision Authority (Superintendencia de Banca, Seguros y Administradoras de Fondos de Pensiones—AFP“FGV”), the Peruvian Central Bank, the Peruvian Ministry of Economy and FinanceStock Market Superintendency (Ministerio de Economía y Finanzas) and the Peruvian Ministry of Energy and Mines (Ministerio de Energía y Minas or MINEM). Some data is also based on our estimates, which are derived from our review of internal reports, as well as independent sources.
Volume information
All tonnage information in this report is expressed in metric tonnes, and all references to ounces are to troy ounces, in each case, unless otherwise specified.
Business risks
Our business is highly dependent on the international market prices of the metals we produce, which are both cyclical and volatile.
Our business and financial performance is significantly affected by the market prices of the metals we produce, particularly the market prices of zinc, copper, silver, lead and, to a lesser extent, gold. Historically, prices of such metals have been subject to wide fluctuations and are affected by numerous factors beyond our control, including international economic and political conditions, the cyclicality of consumption, actual or perceived changes in levels of supply and demand, the availability and costs of substitutes, inventory levels maintained by users, actions of participants in the commodities markets and currency exchange rates. We cannot predict whether, and to what extent, metal prices will rise or fall in the future.
Future declines in metal prices, and especially zinc, copper, silver and lead prices, could have an adverse impact on our results of operations and financial condition, and we might consider curtailing or modifying certain of our operations. In addition, we may not be able to adjust production volume in a timely or cost-efficient manner in response to changes in metal prices. Lower utilization of capacity during periods of weak prices may expose us to higher unit production costs since a significant portion of our cost structure is fixed in the short-term due to the high capital intensity of mining operations. Conversely, during periods of high prices, our ability to rapidly increase production capacity may be limited, which could prevent us from selling more products. Moreover, we may be unable to complete expansions and greenfield projects in time to take advantage of rising prices for zinc, copper, lead or other products.
Changes in the demand for the metals we produce could adversely affect our sales volume and revenues.
Our revenues depend on the volume of metals we sell (and, to a lesser extent, the volume of metals produced by others that are smelted in our facilities), which in turn depend on the level of industrial and consumer demand for these metals. An increase in the production of zinc, copper, silver and lead worldwide or changes in technology, industrial processes or consumer habits, including increased demand for substitute materials, may decrease the demand for these metals. A fall in demand, resulting from economic slow-downs or other factors, could also decrease the volume of metals we sell and therefore materially and adversely impact our results of operations and financial condition.
Our business, financial condition and results of operations may be adversely affected by inflation.
Brazil has historically experienced high rates of inflation. Inflation rates were 10.5% in 2015, 7.2% in 2016 and 3.0% in 2017, as measured by the General Market Price Index. Brazil may experience high levels of inflation in the future, which may impact domestic demand for our products. Inflationary pressures may also curtail our ability to access international financial markets and may lead to further government intervention in the economy, including the introduction of government policies that may materially and adversely affect the overall performance of the Brazilian economy, which in turn may materially and adversely affect us. In addition, we may not be able to adjust the prices we charge our customers to offset the effects of inflation on our cost structure.
Peru experienced periods of hyperinflation in the 1980s and high inflation in the early 1990s. In recent years, inflation has been relatively low, with an average annual inflation rate between 2012 and 2017 of 2.95% as measured by the Peruvian Consumer Price Index. If Peru experiences significant rates of inflation in the future, the economy could be adversely affected. Although the functional currency for our Peruvian operations is the U.S. dollar, high rates of inflation could increase our operating costs and adversely impact our operating margins if we are not able to pass the increased costs on to consumers.
Our results and financial condition are affected by the cyclicality of global economic activity.
The mining industry has historically been highly volatile largely due to the cyclical nature of the industrial production, which affects the demand for minerals and metals. Demand for minerals and metals thus generally correlates to macroeconomic fluctuations in the global economy. For example, this correlation and the adverse effect
of macroeconomic downturns on metal mining companies were evidenced in the 2008/2009 financial and subsequent economic crisis. Economic growth (and minerals demand) trends have varied across such markets since such period.
Interruptions of energy supply or increases in energy costs may materially and adversely affect our results of operations and financial condition.
We require substantial amounts of electricity for our operations. In Peru, we obtain electric power for our operations from third parties through electricity supply contracts. In the event of any interruption or failure of our sources of electricity or failures or congestion in any part of the SEIN (Sistema Eléctrico Interconectado Nacional) or any failure to renew or extend our existing electricity supply contracts, we cannot assure shareholders that we will have access to other energy sources in Peru at the same prices and conditions.
In Brazil, we obtain electric power for our operations from hydroelectric plants grouped into a single legal entity—which is jointly owned by us, our controlling shareholder and its affiliates—pursuant to long-term power purchase agreements with fixed prices for ten years. Although these hydroelectric plants provide 100.0% of the estimated consumption of electricity, and prices are fixed for the medium term, any unavailability or shortages of electrical power or other energy sources and interruptions of energy supply may have a material adverse impact on our results of operations. Furthermore, our energy costs could increase in the event of differences in the hydrology forecast due to these hydroelectric plants paying additional levies.
The prices for and availability of energy resources for our operations may be subject to change or curtailment due to, among other things, new laws or regulations, the imposition of new taxes or tariffs, supply interruptions, equipment damage, worldwide price levels, market conditions and any inability to renew our existing supply contracts. Disruptions in energy supply or increases in costs of energy resources could have a material adverse effect on our financial condition and results of operations.
The mining industry is highly competitive.
We face competition from other mining, processing, trading and industrial companies in Brazil, Peru and around the world. Competition principally involves the following factors: sales, supply and labor prices; contractual terms and conditions; attracting and retaining qualified personnel; and securing the services, supplies and technologies we need for our operations. In addition, mines have limited lives and, as a result, we must seek to replace and expand our mineral reserves by acquiring new properties. Significant competition exists to acquire mining concessions, land and related assets. We cannot assure shareholders that competition will not adversely affect us in the future.
Potential changes to international trade regulations and agreements, as well as other political and economic arrangements (including direct or indirect subsidies), may benefit competitors operating in countries other than where our mining operations are currently located. These changes could also adversely affect the prices we pay for the supplies we need and our export costs when we engage in international transactions. We cannot assure shareholders that we will be able to compete on the basis of price or other factors with companies that in the future may benefit from favorable regulations, trading or other arrangements or that we will be able to maintain the cost of the supplies that we require as well as our export costs.
Operational risks
The mining business is subject to inherent risks, some of which are not insurable.
The business of mining zinc, copper, silver, lead and other minerals is generally subject to numerous risks and hazards. Hazards associated with underground mining operations include underground fires and explosions, including those caused by flammable gas, gas and coal outbursts, cave-ins or falls of ground, rock falls, openings collapse, lack of oxygen, air pollution, discharges of tailings, hazardous substances and materials, gases and toxic chemicals, water ingress and flooding, sinkhole formation, ground subsidence, and other accidents and conditions resulting from underground mining activities, such as drilling, blasting, removing and processing material. In addition, we may encounter geotechnical challenges as we continue with and expand our mining activities, including the possibility of failure of underground openings. We could incur additional expenses in connection with
preventive and remediating measures related to underground openings, which could materially and adversely affect results of our operations and financial condition.
Such occurrences could result in damage to, or destruction of, our properties or production facilities, third-party property, human exposure to pollution, personal injury or death, environmental and natural resource damage or contamination, delays in mining, monetary losses and legal liability. In addition, any such occurrences could adversely affect our reputation. Damages to our reputation could result in additional environmental and health and safety legal oversight, and authorities could impose more stringent conditions in connection with the licensing process of our projects and operations. In addition, our customers may be less willing to buy metals from us if we have been subject to significant adverse publicity. We maintain insurance typical in the mining industry, and in amounts that we believe to be adequate, but which may not provide complete coverage in certain circumstances. Insurance against certain risks (including certain liabilities for environmental contamination and other hazards as a result of exploration and production) is not generally available or is uneconomical to afford.
We may be materially and adversely affected by challenges relating to slope and stability of underground openings.
Our underground mines get deeper and our waste and tailings deposits increase in size as we continue with and expand our mining activities. This presents certain geotechnical challenges, including the possibility of failure of underground openings. If we are required to reinforce such openings or take additional actions to prevent such a failure, we could incur additional expenses, and our operations and stated mineral reserves could be negatively affected. We have taken actions we consider appropriate to maintain the stability of underground openings, but additional actions may be required in the future. Unexpected failures or additional requirements to prevent such failures may materially and adversely affect our costs and expose us to health, safety and other liabilities in the event of an accident. These developments may in turn materially and adversely affect the results of our operations and financial condition, as well as potentially diminish our stated mineral reserves.
Our projects are subject to operational risks that may result in increased costs or delays that prevent their successful implementation.
We invest in increasing our mine and metal production capacity and developing new operations. Our projects are subject to a number of risks that may materially and adversely affect our growth prospects and profitability, including the following:
· we may encounter delays or higher than expected costs in obtaining the necessary equipment, machinery, materials, supplies, labor or services and in implementing new technologies to develop and operate a project;
· our efforts to develop projects according to schedule may be hampered by a lack of infrastructure, including a reliable power supply;
· we may fail to obtain, or experience delays or higher than expected costs in obtaining, the required agreements, authorizations, licenses, approvals and permits to develop a project, including the prior consultation procedure and agreements with local communities;
· changes in market conditions or regulations may make a project less profitable than expected at the time we initiated work on it;
· accidents, natural disasters, labor disputes and equipment failures;
· adverse mining conditions may delay and hamper our ability to produce the expected quantities and qualities of minerals upon which the project was budgeted;
· mineral reserves are estimates based on the interpretation of limited sampling data and testwork that may not be representative of the deposits as a whole, or the technical and economic assumptions used in the estimates may prove to be materially different when the deposits are mined, that could result in materially different economic outcomes, and
· conflicts with local communities and/or strikes or other labor disputes may delay the implementation or the development of projects.
Certain of our current operations, projects and prospects are located in remote areas, and our production, processing and product delivery rely on adequate and available infrastructure and skilled labor.
Our mining, smelting, processing, development and exploration activities depend to a large degree on adequate infrastructure. The regions where certain of our current operations, projects and prospects are located are sparsely populated and difficult to access. We require reliable roads, bridges, power sources and water supplies to access and properly conduct our operations. As a result, the availability and cost of this infrastructure affects capital and operating costs and our ability to maintain expected levels of production and sales. Unusual weather, such as the excessive rains and flooding that occurred in Peru in 2017, or other natural phenomena, sabotage, government or external interference in the maintenance or provision of such infrastructure could impact the development of a project, reduce mining volumes, increase mining or exploration costs or delay the transportation of raw materials to the mines and projects or concentrates to the customers. See “—Natural disasters, such as floods, mudslides and earthquakes, could damage our facilities.”
In addition, the mining industry is labor-intensive, and our success depends to a significant extent on our ability to attract, hire, train and retain qualified employees, including our ability to attract employees with the necessary skills in the regions in which we operate. We could experience increases in our recruiting and training costs and decreases in our operating efficiency, productivity and profit margins if we are unable to attract, hire and retain a sufficient number of skilled employees to support our operations.
The failure of a tailings dam could negatively impact our business, reputation and results of operations.
Mining companies face inherent risks in their operations of tailings dams, structures built for the containment of the metals and mining waste, known as tailings, which exposes us to certain risks. For example, in November 2015, the tailings dam of a Brazilian mining company not associated with our group failed unexpectedly, releasing muddy tailings downstream, flooding certain communities and causing extensive environmental damage to the surrounding area. The dam failure resulted in the immediate suspension of that company’s mining operations by government authorities and caused that company to incur significant expenses, write off assets and recognize provisions for remediation, which affected its balance sheet and income statement.
The unexpected failure of one of our tailings dams could subject us to any or all of the potential impacts discussed above, among others. If any such risks were to occur, this could materially and adversely affect our reputation, our ability to conduct our operations and could make us subject to liability and, as a result, have a material adverse effect on our business, financial condition and results of operations.
A disruption in zinc concentrate supply could have a material adverse effect on our production levels and financial results.
A portion of the zinc concentrate used by our smelters is obtained from third parties, and we may be adversely affected if we are not able to source adequate supplies of zinc for such operations. In 2017, approximately 39.1% of the zinc concentrate used by our smelters was obtained from third parties, with the remainder supplied by our own mining operations. The availability and price of zinc concentrate used by our smelters may be negatively affected by a number of factors largely beyond our control, including interruptions in production in our mines or by our suppliers, decisions by suppliers to allocate supplies of concentrate to other purchasers, price fluctuations and increasing transport cost. In addition, the efficiency of a smelter’s production over time is affected by the mix of the zinc concentrate qualities it processes. In circumstances where we cannot source adequate supplies of the zinc concentrate qualities that comprise the most efficient mix for our smelters, alternative types of concentrate may be available, but the use thereof may increase our costs of production or reduce the productivity of our smelters and adversely affect our business, results of operations and financial condition.
Inadequate supply of zinc secondary feed materials and zinc calcine could affect the results of our smelters.
Zinc sourced from suppliers of concentrates not extracted directly from our mines, or secondary feed materials, represented approximately 20.2% of the zinc content used by our Juiz de Fora smelter in 2017. The use of
zinc secondary feed material is a comparative advantage in relation to the use of zinc concentrate, mainly due to lower acquisition costs and, to a lesser extent, operational gains. In addition, we have recently incorporated zinc calcine processed by third parties into our operations to increase the production in our smelters. Our smelters then use this zinc calcine processed by third parties to produce additional refined zinc products that they would not produce were they to rely solely on other inputs. To the extent we are unable to obtain adequate supplies of zinc secondary feeds or zinc calcine, or if we must pay higher than anticipated prices of these inputs, our business, results of operations and financial condition may be adversely affected.
Shortages of water supply, explosives, critical spare parts, maintenance service and new equipment and machinery may materially and adversely affect our operations and development projects.
Our mining operations require the use of significant quantities of water for extraction activities, processing and related auxiliary facilities. Water usage, including extraction, containment, and recycling requires appropriate permits, which are granted by regulatory authorities in Brazil and Peru. The available water supply may be adversely affected by shortages or changes in governmental regulations. We cannot assure that water will be available in sufficient quantities to meet our future production needs or will prove sufficient to meet our water supply needs. In addition, we cannot assure shareholders that we will maintain our existing licenses related to water rights. A reduction in our water supply could materially and adversely affect our business, results of operations and financial condition. In addition, we have not yet obtained the water rights to support some of our expansion projects, and our inability to obtain those rights could prevent us from pursuing those expansions.
In addition to water and energy, our mining operations require intensive use of equipment and machinery as well as explosives. To be able to acquire and use explosives, we must first obtain the corresponding authorizations, which are granted by the relevant regulatory authorities in Brazil and Peru. A shortage in the supply of key spare parts, adequate maintenance service or new equipment and machinery to replace old ones and cover expansion requirements, or a shortage of supply of explosives, could materially and adversely affect our operations and development projects.
We may be adversely affected by labor disputes.
Mining is a labor-intensive industry. We depend on more than 12,000 workers, including employees and contractors, to carry out our operations. A portion of our employees are unionized. We cannot assure shareholders that we will not experience work slowdowns, work stoppages, strikes or other labor disputes in the future, particularly in the context of the annual renegotiation of our collective bargaining agreements, which could have a material adverse effect on our business, financial condition and results of operations.
We may be liable for certain payments to individuals employed by third-party contractors.
Under Peruvian law, outsourcing of employees from third-party contractors is permitted if certain requirements are met. To the extent that such requirements are not met, we may be jointly liable for all mandatory employment benefits and may be required to pay workers used under an outsourcing scheme with profit-sharing benefits as if they were employed directly by us. Moreover, we may be required to consider such persons employed by third-party contractors as our employees. Although we believe that we are in material compliance with Peruvian labor laws, we cannot assure shareholders that any proceedings initiated by outsourced employees will be resolved in our favor and that we will not be liable for any mandatory employment benefits or for profit-sharing benefits. See “Regulatory matters—Peruvian regulatory framework.”
Under Brazilian law, outsourcing is also permitted if certain requirements are met. In addition, Brazilian law provides that the contractor will be held liable on a secondary basis if the outsourced or subcontracted companies do not fulfill their labor obligations. In cases where the outsourced or subcontracted companies do not pay the workers the labor sums they are entitled to, the contractor is responsible for those payments. These payments may have an adverse effect on our results of operation and financial condition. Recent changes to Brazilian labor laws have affected outsourcing, and we cannot predict how these changes will be further regulated and applied by local authorities and interpreted by Brazilian labor courts. If outsourcing becomes more restrictive or costly because of these new laws, our cash flow may be reduced, affecting our financial condition and results of operations. See “Regulatory matters—Brazilian regulatory framework.”
We may be subject to misconduct by our employees or third-party contractors.
We may be subject to misconduct by our employees or third-party contractors, such as theft, bribery, sabotage, fraud, insider trading, violation of laws, slander or other illegal actions. Any such misconduct may lead to fines or other penalties, slow-downs in production, increased costs, lost revenues, increased liabilities to third parties, impairment of assets or harmed reputation, any of which may have a material adverse effect on our business, results of operations or financial condition.
The nature of our business includes risks related to litigation and administrative proceedings that could materially and adversely affect our business and financial performance in the event of unfavorable rulings.
The nature of our business exposes us to various litigation matters, including civil liability claims, environmental matters, health and safety matters, regulatory and administrative proceedings, governmental investigations, tort claims, contract disputes, labor matters and tax matters, among others. We cannot assure shareholders that these or other legal proceedings will not have a material adverse effect on our ability to conduct our business or on our financial condition and results of operations, through distraction of our management team, diversion of resources or otherwise. In addition, although we establish provisions as we deem necessary in accordance with IFRS, as issued by the IASB, the amount of provisions that we record could vary significantly from any amounts we actually pay, due to the inherent uncertainties and shortcomings in the estimation process.
We could be harmed by a failure or interruption of our information technology systems or automated machinery, including system security breaches or other cybersecurity attacks.
We rely on our information technology systems and automated machinery to effectively manage our production processes and operate our business. Any failure of our information technology systems and automated machinery to perform as we anticipate could disrupt our business and result in production errors, processing inefficiencies and the loss of sales and customers, which in turn could result in decreased revenue, increased overhead costs and excess or out-of-stock inventory levels resulting in a material adverse effect on our business results.
In recent years, cyberattacks and other tactics designed to gain access to and exploit sensitive information by breaching mission critical systems of large organizations have increased in volume sophistication. We are dependent on internal information, and we are vulnerable to failure of these systems, including through system security breaches, data protection breaches or other cybersecurity attacks. We could be exposed to a cyberattack through an internal breach from servers connected to our internal network or an external breach due to disruptions from unauthorized access to our systems, which could impact our ability to operate our existing systems. If these events occur, including a cyberattack causing critical data loss or the disclosure or use of confidential information, the exposure of such information could have a material adverse effect on our reputation and market value, which could adversely impact our results of operations.
In addition, data privacy is subject to frequently changing rules and regulations. The European Union’s General Data Protection Regulation, or GDPR, will take effect on May 25, 2018 and introduce increased regulations relating to personal data security. Any noncompliance with the GDPR or any other cybersecurity and data privacy regulations could result in the imposition of fines or penalties, which could have an adverse effect on us and our business, reputation and results of operations.
Financial risks
Our financial condition and results of operations may be materially and adversely affected by currency exchange rate fluctuations.
Our revenues are primarily denominated in U.S. dollars, and certain portions of our operating costs, principally labor costs, are denominated in reais and soles. Accordingly, when inflation in Brazil and Peru increases without a corresponding devaluation of the real or sol, our financial position, results of operations and cash flows could be materially and adversely affected. For example, for the year ended December 31, 2017, 19.6% of our production costs were denominated in reais and 13.0% of our production costs were denominated in soles.
Given the structure of our operations, a decrease in the value of the U.S. dollar relative to the foreign currencies in which we incur costs generally could have a negative impact on our results of operations or financial condition. Our foreign currency exposures increase the risk of volatility in our financial position, results of operations and cash flows. We cannot assure shareholders that currency fluctuations, or costs associated with our hedging activities (including fluctuations in exchange rates contrary to our expectations), will not have an impact on our financial condition and results of operations.
Fluctuations in interest rates in Brazil could increase the cost of servicing our debt and negatively affect our overall financial performance.
Certain of our indebtedness bears interest based on variable interest rates, including the London Interbank Offered Rate, or LIBOR. Such rate has fluctuated in response to changes in economic growth, monetary policy and governmental regulation. A significant increase in underlying interest rates, particularly in LIBOR, could have a material adverse effect on our financial expenses and materially adversely affect our overall financial performance. On the other hand, considering our cash investments, a significant reduction in the Interbank Deposit Certificate (Certificado de Depósito Interbancário), or CDI rate, and/or LIBOR could materially adversely impact the financial revenues that we derive from our investing activities, given that certain of our financial investments bear interest based on these interest rates. The CDI rate has fluctuated significantly in the past due to the impact of changes in Brazilian economic growth, inflation, Brazilian federal government policies and other factors. For example, the CDI rate decreased to 6.90% as of December 31, 2012, increased to 9.77% as of December 31, 2013, increased to 11.57% as of December 31, 2014, increased to 14.14% as of December 31, 2015, and decreased to 13.63% as of December 31, 2016. As of December 31, 2017, the CDI had decreased to 6.89%. In addition, the Brazilian Central Bank periodically establishes the System for Settlement and Custody (Sistema Especial de Liquidação e Custódia), or the SELIC rate, which is the base interest rate for the Brazilian banking system and an important policy instrument for the achievement of Brazilian inflation targets. In recent years, the SELIC rate has fluctuated, and the Brazilian Central Bank has frequently adjusted the SELIC rate in response to economic uncertainties. As of December 31, 2013, 2014, 2015, 2016 and 2017, the SELIC rate was 10.00%, 11.75%, 14.25%, 13.75% and 7.00%, respectively. Any reductions in the SELIC rate could adversely affect us by decreasing the income we earn on our interest-earning assets and could materially adversely impact our business, financial condition and results of operations.
We engage in hedging activity which may not be successful and may result in losses to us.
We may use foreign exchange and metal commodity non-deliverable forwards to reduce the risk associated with currency and metal price volatility. However, our hedging activities could cause us to lose the benefit of an increase in the prices of the metals we produce if they increase over the price level of hedge positions, or the benefit of an increase in the currency price. The cash flows and the mark-to-market values of our production hedges can be affected by factors such as the volatility of currency and the market price of metals, which are not under our control.
Our hedging agreements contain events of default and termination events that could lead to early close-outs of our hedges such as failure to pay, breach of the agreement, misrepresentation, default under our loans or other hedging agreements and bankruptcy. In the event of an early termination of our hedging agreements, the relevant hedge positions would be required to be settled at that time. In that event, there could be a lump sum payment to be made either to or by us. The magnitude and direction of such a payment would depend upon, among other things, the characteristics of the particular hedge instruments that were terminated and the relevant market prices at the time of termination. Any of the factors described above could have a material adverse effect on our financial condition, results of operations or cash flows. See “Operating and financial review and prospects—Risk management—Metal price sensitivity.”
Our business requires substantial capital expenditures and is subject to financing risks.
Our business is capital intensive. Exploration for and exploitation of mineral deposits, maintenance of machinery and equipment and compliance with applicable laws and regulations require substantial capital expenditures. We must continue to invest capital to maintain or to increase the amount of our metal reserves and our production. In 2017, we invested US$197.6 million in capital expenditures. We depend partially on our cash flows for maintenance of capital expenditures. See “Information on the Company—Capital expenditures.”
No assurance can be given that we will be able to maintain our production levels or generate sufficient cash flow, capitalize on a sufficient amount of our profit or have access to sufficient investments, loans or other financing alternatives to finance our capital expenditure program at a level necessary to continue our exploration and exploitation activities at the levels we feel appropriate. Any equity or debt financing, if available, may not be on terms that are favorable to us. If our access to external financing is limited, we may not be able to execute our strategy, which could adversely affect our business, financial condition and results of operations.
We are exposed to credit risk in relation to our contractual and trading counterparties as well as to hedging and derivative counterparty risk.
We are subject to the risk that the counterparties with whom we conduct our business (in particular our customers) and who are required to make payments to us are unable to make such payment in a timely manner or at all. Credit risk is present in our hedging operations, customer operations and cash management operations. If amounts that are due to us are not paid or not paid in a timely manner, this may impact not only our current trading and cash-flow position but also our financial and business position. In addition, our derivatives, metals hedging, and foreign currency and energy risk management activities expose us to the risk of default by the counterparties to such arrangements. Any such default could have a material adverse effect on our business, financial condition and results of operations.
Any acquisitions we make may not be successful or achieve the expected benefits.
We regularly consider and evaluate opportunities to acquire assets, companies and operations. There can be no assurance that we will be able to successfully integrate any acquired assets, companies or operations. In addition, any additional debt we incur to finance an acquisition may materially and adversely affect our financial position and results of operations. If future acquisitions are significant, they could change the scale of our business and expose us to new geographic, political, operating and financial risks.
We may experience goodwill impairment.
Goodwill is initially recorded at fair value and is not amortized but is reviewed at least annually or more frequently if events or changes in circumstances indicate evidence of impairment. If our estimates of goodwill fair value change, we may determine that impairment charges are necessary. Estimates of fair value are determined based on a complex model using discounted cash flows. If our estimates of future cash flows are inaccurate, the fair value determined could be inaccurate and impairment may not be recognized in a timely manner. If the fair value declines, we may need to recognize goodwill impairment in the future which could have a material adverse effect on our results of operations.
We have identified material weaknesses in our internal control over financial reporting and if we fail to establish and maintain effective internal control over financial reporting in the future, the accuracy and timeliness of our financial reporting may be adversely affected, which could cause investors to lose confidence in our reported financial information and may lead to a decline in the trading price of our common shares.
We have identified material weaknesses in our internal control over financial reporting. These control deficiencies resulted in revisions of our consolidated annual financial statements as of and for the years ended December 31, 2017 and December 31, 2016. We are taking steps to address these material weaknesses and continue to implement remediation measures, which we believe will address the underlying causes of the control deficiencies that led to our material weaknesses and improve our internal control over financial reporting. For more information, see “Additional information—Internal control over financial reporting—Changes in internal control over financial reporting.”
We cannot be certain that additional material weaknesses and control deficiencies will not develop or be discovered in the future. If other material weaknesses exist, we may be unable to report our financial results accurately on a timely basis, which could cause our reported financial results to be materially misstated. This could result in a loss of investor confidence and cause the market price of our common shares to decline.
Risks related to our mineral reserves
Our estimates of mineral reserves may be materially different from mineral quantities we actually recover, and market price fluctuations and changes in operating and capital costs may render certain mineral reserves uneconomical to mine.
There is a degree of uncertainty attributable to the estimation of mineral reserves. Until reserves are actually mined and processed, the quantity and grades must be considered as estimates only. The mineral reserves described in this report are estimated tonnages and grades that we have determined can be economically mined and processed under present and assumed future conditions. We may be required in the future to revise our mineral reserves estimates based on actual production experience, projects, updated exploration drilling data and other factors, and we cannot assure shareholders that the indicated amount and grade of mined and processed material will be recovered or that it will be recovered at the rates we anticipate. Market prices of our metals, increased production costs, reduced recovery rates, short-term operating factors, royalties, taxes, fees and other factors may render some or all proven and probable mineral reserves uneconomic to exploit and may ultimately result in a reduction of mineral reserves. Two of our five mines do not have estimated mineral reserves under Industry Guide 7.
We depend on our ability to replenish our mineral reserves for our long-term viability.
Mineral reserves data are only indicative of future results of operations at the time the estimates are prepared, and are depleted as we mine. We use several strategies to replenish and increase our mineral reserves, including exploration activities and the acquisition of mining concessions. We cannot assure shareholders that we will be able to continue with our strategy to replenish mineral reserves indefinitely. If we are unable to replenish our mineral reserves, our business, results of operations and prospects would be materially adversely affected.
Our mineral exploration efforts are highly speculative in nature and may be unsuccessful.
Mineral exploration is highly speculative in nature, involves many uncertainties and risks and is frequently unsuccessful. It is performed to demonstrate the dimensions, position and mineral characteristics of mineral deposits, estimate mineral reserves, assess amenability of the deposit to mining and processing scenarios and estimate potential deposit value. Substantial expenditures are required to establish proven and probable mineral reserves to determine processes to extract the metals and, if required, to construct mining and processing facilities and obtain the rights on the land and resources required to develop the mining activities. Therefore, once mineralization is discovered, it may take several years from the initial exploration phases before production is possible, during which time the potential feasibility of the project may change adversely.
Health, safety and environmental risks
Health, safety, and environmental laws and regulations, including regulations pertaining to climate change, may increase our costs of doing business, restrict our operations or result in the imposition of fines or revocation of permits.
Our mining activities are subject to Brazilian and Peruvian laws and regulations, including health and safety and environmental matters. Additional matters subject to legislation include, but are not limited to, transportation, mineral storage, water use and discharge, use of explosives, hazardous and other non-hazardous waste, and reclamation and remediation measures. Our operations are subject to periodic inspections and special inspections in certain circumstances by governmental authorities and consultation with local communities. Compliance with these laws and regulations and new or existing regulations that may be applicable to us in the future could increase our operating costs and adversely affect our financial results of operations and cash flows.
Regulatory and industry response to climate change or other controls on greenhouse gas emissions, including limits on emissions from the combustion of carbon-based fuels, controls on effluents and restrictions on the use of certain materials, could significantly increase our operating costs and affect our customers. Ongoing international efforts to address greenhouse gas emissions consist of controlling activities that may increase the atmospheric concentration of greenhouse gases. International agreements, like the Paris Agreement and Kyoto Protocol, are in different stages of negotiation and implementation. The measures included in such agreements may result in an increase of costs related to the installation of new controls aimed at reducing greenhouse gas emissions,
the purchase of credits or licenses for atmospheric emissions and the monitoring and registration of greenhouse gas emissions generated by our operations. These measures could adversely affect our business, financial condition and results of operations. The potential impact of climate change on our operations is highly uncertain and would be particular to the geographic circumstances of our facilities and operations. It may include changes in rainfall patterns, water shortages, rising sea levels, changing storm patterns and intensities and changing temperatures. These effects may materially and adversely impact the cost, production and financial performance of our operations.
Pursuant to applicable environmental regulations and laws, we could be found liable for all or substantially all the damages caused by mining activities at our current or former facilities or those of our predecessors at disposal sites. We could also be found liable for all incidental damages due to the exposure of individuals to hazardous substances or other environmental damage. We cannot assure shareholders that our costs of complying with current and future environmental and health and safety laws and regulations, including decommissioning and remediation requirements, and any liabilities arising from past or future releases of, or exposure to, hazardous substances will not materially and adversely affect our business, financial condition and results of operations.
Natural disasters, such as floods, mudslides and earthquakes, could damage our facilities.
Natural disasters could significantly damage our mining and production facilities and infrastructure and may cause a contraction in sales to countries adversely affected due to, among other factors, power outages and the destruction of industrial facilities and infrastructure. In particular, the Central Andean region, where two of our mines are located, is prone to mudslides and earthquakes of varying magnitudes. Due to the El Niño weather phenomenon, Peru recently experienced extreme weather conditions that led to flooding and mudslides and which adversely affected our operations. From March 17 to March 24, 2017, extreme flooding and mudslides in Peru interrupted the supply of metal concentrates from our El Porvenir and Atacocha mines to our customers as well as the supply of zinc products to our Cajamarquilla smelter due to the shutdown of the main roads and railways used to transport our products and raw materials, including the Peruvian central railway. Although we have insurance covering damages caused by natural disasters, extensive damage to our facilities and staff casualties due to natural disasters could materially and adversely affect our ability to conduct our operations and, as a result, reduce our future operating results.
Political, economic, social and regulatory risks
Recent changes in Brazil’s mining laws may significantly impact our mining operations.
On July 26, 2017, the Brazilian federal government enacted measures that provided for significant changes to the regulatory framework of the Brazilian mining industry. The measures modified relevant aspects of the regulatory framework, including the terms of certain mining royalties, and created a new mining agency, the ANM (Agência Nacional de Mineração). The Brazilian congress approved the provisional measures. These and other changes to the Brazilian regulatory framework that could be enacted in the future may result in an increase in our expenses, particularly mining royalties. In addition, any changes in the interpretation of any Brazilian mining laws and regulations, including changes to our concession agreement, may increase our compliance, operational or other costs. For additional information, see “Information on the Company—Regulatory matters—Brazilian regulatory framework—Mining rights and regulation of mining activities.”
Our mineral rights may be terminated or not renewed by governmental authorities.
Our business is subject to extensive regulation in Brazil and Peru, including with respect to acquiring and renewing the required authorizations, permits, concessions and/or licenses from the relevant governmental regulatory bodies. We have obtained, or are in the process of obtaining, all material authorizations, permits, concessions and licenses required to conduct our mining and mining-related operations. However, we may need to renew exploration authorizations related to our Brazilian mining operations 60 days prior to their expiration date if we determine that we continue to have an economic or business interest in the area. With respect to mining concessions, there is no renewal requirement once we have obtained such concession. These authorizations, permits, concessions and environmental licenses are subject to our compliance with conditions imposed and regulations promulgated by the relevant governmental authorities. While we anticipate that all required authorizations, permits, concessions and environmental licenses or their renewals will be granted as and when sought, there is no assurance
that these items will be granted as a matter of course, and there is no assurance that new conditions will not be imposed in connection with such renewals.
We must continue to assess the mineral potential of each mining concession to determine if the costs of maintaining the related exploration authorizations and mining concessions are justified by the results of operations to date. If such costs are not justified and we abandon the mine or suspend the mining activities without the formal consent of the regulatory authority for a period more than six months, we may lose the respective mining concessions. Alternatively, we may elect to withdraw or assign some of our exploration authorizations or mining concessions. In Brazil, if we fail to demonstrate the existence of technical and economically viable mineral deposits in an area covered by an exploration authorization, we may be required to return it to the federal government. The federal government may then grant exploration authorizations to other parties that may conduct other mineral prospecting activities at said area. Mining concessions in Peru may be terminated if the concessionaire does not comply with its obligations.
If we were to violate any of the foregoing laws and regulations or the conditions of our concessions, authorizations and environmental licenses, we may be subjected to substantial fines or criminal sanctions, revocations of operating permits or licenses and possible closings of certain of our facilities.
Our operations depend on our relations and agreements with local communities, and new projects require carrying out a prior consultation procedure.
There are several local communities that surround our operations in Brazil and Peru, most of which we have entered into agreements with that provide for the use of their land for our operations. We also interact with regional and local governments and depend on our close relations with local communities and such governments to carry out our operations. If our relations with the local communities and such governments were to deteriorate in the future, or the local communities do not comply with the existing agreements or renew them upon expiration, it could have a material adverse effect on our business, properties, operating results, financial condition or prospects.
Furthermore, to develop new projects in the countries in which we operate on land owned by, or in the possession of, third parties, we need to reach an agreement with such third parties to use that land. See “Regulatory matters—Brazilian regulatory framework.” For example, Brazilian law requires us to obtain social and environmental licenses for projects in areas with indigenous populations. Any delay or failure to reach such agreements or obtain governmental approvals for our new projects could result in a material adverse effect on our business, properties, operating results, financial condition or prospects.
Changes in tax laws may increase our tax burden and, as a result, could adversely affect our business, financial condition and results of operations.
The Brazilian, Peruvian and Luxembourg governments from time to time implement changes to tax laws and regulations. Any such changes, as well as changes in the interpretation of such laws and regulations, may result in increases to our overall tax burden, which would negatively affect our profitability. For example, in December 2016, the corporate tax rate in Peru for 2017 increased from 27.0% to 29.5% for Peruvian companies. Moreover, some tax laws may be subject to controversial interpretation by tax authorities, including, but not limited to, the regulation applicable to corporate restructurings. In the event an interpretation different than the one on which we based our transactions prevails, we may be adversely affected. We cannot assure shareholders that the Peruvian, Brazilian or Luxembourg governments will not implement additional changes to tax regulations in the future, which could adversely affect our business, financial condition and results of operations.
We are subject to anti-corruption, anti-bribery and anti-money laundering laws and regulations in Brazil, Peru, Luxembourg, Canada and the United States. Any violations of any such laws or regulations could have a material adverse impact on our reputation and results of operations and financial condition.
We are subject to anti-corruption, anti-bribery, anti-money laundering and other international laws and regulations and are required to comply with the applicable laws and regulations of Brazil, Peru, Luxembourg Canada and the United States. In addition, we are subject to economic sanctions regulations that restrict our dealings with certain sanctioned countries, individuals and entities. There can be no assurance that our internal policies and procedures will be sufficient to prevent or detect all inappropriate practices, fraud or violations of such laws,
regulations and requirements by our affiliates, employees, directors, officers, partners, agents and service providers or that any such persons will not take actions in violation of our policies and procedures. Any violations by us of anti-bribery and anti-corruption laws or sanctions regulations could have a material adverse effect on our business, reputation, results of operations and financial condition.
Corruption investigations and media reports of alleged corruption in Brazil and Peru could materially adversely affect Brazilian and Peruvian markets, us, our industry and the trading price of our securities.
Brazilian markets have experienced heightened volatility due to the uncertainties generated from, and the effects on, the local economy and political environment, from the ongoing corruption and bribery investigations by federal Brazilian prosecutors. The matters that have, and may continue to, come to light because of or in connection with the investigations have adversely affected, and are expected to continue to adversely affect, the Brazilian markets and trading prices of securities issued by certain Brazilian companies. In addition, print, online and social media, posts and reports have made allegations that certain Brazilian industries and conglomerates have been involved in conduct targeted by some of these investigations. Relatedly, Peruvian authorities are investigating corruption associated with past actions involving certain Brazilian construction companies with operations in Peru. Consequently, Peruvian lawmakers passed legislation that restricts payments made by, or to be made to, such Brazilian construction conglomerates. To the extent that any such reports, or further developments or allegations related to them or the above investigations, relate to us or to any of our affiliates, executives or directors, our public perception, reputation and the trading price of our common shares may be materially adversely affected.
Peru may experience political or economic problems that could affect our business, financial condition and results of operations.
The operations of Nexa CJM and Nexa Peru are conducted in Peru and are dependent upon the performance of the Peruvian economy. As a result, our business, financial position and results of operations may be affected by the general conditions of the Peruvian economy, price instability, inflation, interest rates, regulation, taxation, social instability, political unrest and other developments in or affecting Peru over which we have no control. In 2017, our sales in Peru represented 28.4% of our consolidated net revenue. Our results of operations and general financial condition depend in part on Peruvian markets for labor and certain services, materials, supplies, machinery and equipment, and on factors relating to Peruvian economic, social and political stability generally, and may be materially and adversely affected by economic downturns, currency depreciation, inflation, interest rate fluctuation, government policies, regulation, taxation, social instability, political unrest, terrorism and other developments in or affecting the country.
Our financial condition and results of operations may also be adversely affected by changes in Peru’s political climate to the extent that such changes affect the nation’s economic policies, growth, stability, outlook or regulatory environment. In December 2017, then-President Pedro Pablo Kuczynski faced accusations of lying about receiving bribes from the Brazilian construction company Odebrecht. He ultimately admitted to receiving such payments, despite initial denials. Following additional scandals, on March 21, 2018, President Kuczynski submitted his resignation as president of Peru. He was succeeded by Martín Vizcarra, the former Vice President of Peru, on March 23, 2018.
The uncertainty of the political climate in Peru could lead to changes in the Peruvian economy or economic policies, which may have a negative effect on our business, financial condition and results of operations. Therefore, the risk of political and economic change should be carefully considered. There can be no assurance that Peru will not face political, economic or social problems in the future or that these problems will not interfere with our ability to service our indebtedness.
General economic and political conditions in Brazil may materially adversely affect our business, financial condition and results of operations.
The operations of Nexa Brazil are conducted in Brazil and are dependent upon the performance of the Brazilian economy. As a result, general economic conditions in Brazil may have a material adverse impact on our business, financial condition and results of operations. In 2017, our sales in Brazil represented 29.5% of our consolidated net revenue.
In 2017, Brazil faced an economic recession, adverse fiscal developments and political instability, which may continue in 2018. An economic slowdown in Brazil, coupled with the ongoing effects of the global economic crisis, may result in greater economic and financial volatility and continued stagnation in terms of GDP growth, all of which could negatively affect the demand for and pricing of our products and, consequently, our business and results of operations. In addition, Brazil lost its investment grade rating for long-term debt from Standard & Poor’s Ratings Group, a division of McGraw Hill, Inc., Fitch Ratings Inc., and Moody’s Investor Service, Inc. in September 2015, December 2015 and February 2016, respectively. Due to our dependence on revenues from our Brazilian operations, we can be downgraded, which could limit our ability to obtain financing and increase our borrowing costs, and make it costlier to refinance maturing obligations, which would materially and adversely impact our business and results of operations. Any further downgrade of Brazil’s credit rating could also heighten investors’ perception of risk and, as a result, adversely affect the price of our common shares.
Actions taken by the Brazilian federal government and the Brazilian Central Bank may not promote the expected recovery of the Brazilian economy. The Brazilian government’s actions in response to exchange rate movement, monetary policies, inflation control, energy shortages and economic instability, among other matters, may have important effects on Brazilian companies, including us, and on market conditions and the competitiveness of Brazilian products abroad. Prior actions taken by the Brazilian federal government have involved wage and price controls, the implementation of new taxes and fluctuations of base interest rates. In addition, actions taken by Brazilian state and local governments with respect to labor and other laws affecting our operations may have an effect on us. Uncertainty over whether the Brazilian federal government will implement changes in policy or regulation affecting these or other factors in the future may contribute to economic uncertainty in Brazil and to heightened volatility in the market value of securities issued by Brazilian companies.
Currently, the Brazilian foreign exchange system allows the purchase and sale of foreign currency and the international transfer of reais by any person or legal entity, regardless of the amount, subject to certain regulatory procedures. We cannot predict whether the Brazilian Central Bank or the Brazilian government will continue to permit the real to float freely or will intervene in the exchange rate market through the return of a currency band system or otherwise. Furthermore, Brazilian law provides that, whenever there is a serious imbalance in Brazil’s balance of payments or there are serious reasons to foresee a serious imbalance, temporary restrictions may be imposed on remittances of foreign capital abroad.
In addition, the political situation in Brazil has influenced the performance of the Brazilian economy; in particular, political crises have adversely affected investors’ confidence and public sentiment, which has adversely affected economic development in Brazil, the credit rating of the Brazilian government and the operations and financial performance of Brazilian businesses. In August 2016, the Brazilian Congress approved the impeachment of the Brazilian president. Also, ongoing corruption investigations have led to charges against public officials, members of several political parties and directors and officers of many Brazilian companies. Political instability may aggravate economic uncertainties in Brazil and increase volatility of securities of issuers with significant Brazilian operations like us.
Peru has a history of domestic terrorism that could affect our business, financial condition and results of operations.
Peru was subject to a series of domestic terrorist attacks from groups like the Shining Path between the late 1970s and 1990s that caused thousands of casualties and affected normal political, economic and social activities in many parts of the country, including Lima, the capital. Since then, terrorist activity in Peru is mostly confined to small-scale operations in the Huallaga Valley and the Valleys of the Rivers Apurimac, Ene and Mantaro, or VRAEM, areas, both in the eastern part of the country. In 2012, the Peruvian government captured Florindo Flores, one of the last remaining leaders of Shining Path, and thus gravely weakened the organization’s activities in the Huallaga Valley. Despite these efforts, terrorist activity and the illegal drug trade continue to be key challenges for Peruvian authorities. The Huallaga Valley and VRAEM constitute the largest areas of coca cultivation in the country and thus serve as a hub for the illegal drug trade. Any violence derived from the drug trade or a resumption of large-scale terrorist activities could hurt our operations.
Political and social opposition to mining activities generally in the regions where we operate could adversely impact our business and reputation.
Disputes with communities where we operate in Brazil and Peru may arise from time to time. In some instances, our operations and mineral reserves are located on or near lands owned or used by indigenous people or other groups of stakeholders. Some of our mining and other operations are in territories where title may be subject to disputes or uncertainties, or in areas claimed for agriculture or land reform purposes, which may lead to disagreements with organized social movements, local communities and the government. We may be required to consult and negotiate with these groups as part of the process to obtain licenses required to operate, to mitigate impact on our operations or to obtain access to their lands. Disagreements or disputes with local groups, including indigenous groups, organized social movements and local communities, could cause delays or interruptions to our operations, adversely affect our reputation or otherwise hamper our ability to develop our reserves and conduct our operations. Protesters have taken actions to disrupt our operations and projects, and they may continue to do so in the future, which may harm our operations and could adversely affect our business. In recent years, Peru has experienced protests against mining projects in several regions. On several occasions, local communities have opposed these operations and accused them of polluting the environment and hurting agricultural and other traditional economic activities. Recently, mounting opposition by the neighboring communities led to the suspension of the Tia Maria mining project in the southern region of Arequipa. Social demands and conflicts could have an effect on our business and results of operations and the Peruvian or Brazilian economy in general.
Uncertainty in governmental agency interpretation or court interpretation and the application of such laws and regulations could result in unintended non-compliance.
The courts in some of the jurisdictions in which we operate may offer less certainty as to the judicial outcome of legal proceedings or a more protracted judicial process than is the case in more established economies. Businesses can become involved in lengthy court cases over simple issues when rulings are not clearly defined, and the poor drafting of laws and excessive delays in the legal process for resolving issues or disputes compound such problems. In addition, there may be limited or no relevant case law providing guidance on how courts would interpret such laws and the application of such laws to our contracts, joint ventures, licenses, license applications or other legal arrangements. Accordingly, there can be no assurance that contracts, joint ventures, licenses, license applications or other legal arrangements will not be adversely affected by the actions of government authorities and the effectiveness of and enforcement of such arrangements in these jurisdictions. Moreover, the commitment of local businesses, government officials and agencies and the judicial system in these jurisdictions to abide by legal requirements and negotiated agreements may be more uncertain and may be susceptible to revision or cancellation, and legal redress may be uncertain or delayed. These uncertainties and delays could have a material adverse effect on our business and results of operations.
Risks relating to our corporate structure
VSA owns approximately 64.25% of our outstanding common shares and has substantial control over us, which could limit our shareholders’ ability to influence the outcome of important corporate decisions.
VSA owns 64.25% of our outstanding common shares. As a result, VSA can influence or control matters requiring approval by our shareholders, including the election of directors and the approval of mergers, acquisitions or other extraordinary transactions. VSA may also have interests that differ from our other investors and may vote in a way with which our other shareholders disagree, and which may be adverse to the interests of our other investors.
Dividends or other distributions paid by us on our common shares will generally be subject to Luxembourg withholding tax.
Any dividends or other distributions paid by us on our common shares will be subject to a Luxembourg withholding tax at a rate of 15.0% unless an exemption or reduction in rate applies. The withholding tax must be withheld from the gross distribution and paid to the Luxembourg tax authorities. Under certain circumstances, distributions as share capital reductions or share premium reimbursements may not be subject to withholding tax, but there are no assurances that we will be able to make such distributions in the future. See “Taxation—Luxembourg Tax Considerations—Shareholders.”
Our shareholders’ rights and responsibilities as shareholders are governed by Luxembourg law and differ in some respects from the rights and responsibilities of shareholders under the laws of other jurisdictions, including the United States and Canada, and shareholders may have more difficulty protecting their interests than they would as shareholders of a U.S. or Canadian corporation.
Our corporate affairs are governed by our articles of association and by the laws governing limited liability companies organized under the laws of Luxembourg, as well as such other applicable local law, rules and regulations. The rights of our shareholders and the responsibilities of our directors and officers under Luxembourg law are different from those applicable to a corporation incorporated in the United States. There may be less publicly available information about us than is regularly published by or about U.S. or Canadian issuers. Also, Luxembourg regulations governing the securities of Luxembourg companies may not be as extensive as those in effect in the United States or Canada, and Luxembourg law and regulations in respect of corporate governance matters may not be as protective of non-controlling shareholders as corporation laws in the United States or Canada. Therefore, shareholders may have more difficulty protecting their interests in connection with actions taken by us, our directors and officers or our principal shareholders than they would as shareholders of a corporation incorporated in the United States or Canada.
Luxembourg insolvency laws may offer our shareholders less protection than they would have under U.S. and Canadian insolvency laws.
As a company organized under the laws of Luxembourg and with its registered office in Luxembourg, we are subject to Luxembourg insolvency laws in the event any insolvency proceedings are initiated against us including, among other things, Regulation (EU) 2015/848 of the European Parliament and of the Council of May 20, 2015 on insolvency proceedings (recast). Should courts in another European country determine that the insolvency laws of that country apply to us in accordance with and subject to such EU regulations, the courts in that country could have jurisdiction over the insolvency proceedings initiated against us. Insolvency laws in Luxembourg or the relevant other European country, if any, may offer our shareholders less protection than they would have under U.S. insolvency laws and make it more difficult for them to recover the amount they could expect to recover in a liquidation under U.S. insolvency laws.
While we currently intend to make distributions on our common shares annually, our ability to do so may be constrained by regulatory constraints and our holding company structure.
We intend to pay dividends or other distributions on our common shares in accordance with our dividend policy. See “Share ownership and trading—Distributions.” However, any determination to pay dividends or other distributions (including reimbursements of share premium) will be subject to the approval of our board of directors or our shareholders, as applicable, and will depend on a number of factors, including, but not limited to, our cash balance, cash flow, earnings, capital investment plans, expected future cash flows from operations and our strategic plans, as well as restrictions imposed by applicable law and contractual restrictions (although as of the date of this report there are no contractual restrictions on our ability to pay dividends or other distributions to our shareholders).
Luxembourg law requires at least 5.0% of our net profits per year to be allocated to the creation of a legal reserve until such reserve has reached an amount equal to 10.0% of our issued share capital. The legal reserve is not available for distribution. Luxembourg law also provides that distributions (including in the form of dividends or reimbursement of share premium) may only be declared out of net profits and/or distributable reserves, as set forth in our standalone statutory accounts prepared under Luxembourg Generally Accepted Accounting Principles (or Luxembourg GAAP). The amount of a distribution to shareholders (including in the form of a dividend or reimbursement of share premium) may not exceed the amount of profits at the end of the last financial year plus any profits carried forward and any amounts drawn from reserves available for that purpose, less any losses carried forward and sums to be allocated to non-distributable reserves in accordance with Luxembourg law or the articles of association. Furthermore, no distributions (including in the form of dividends or reimbursement of share premium) may be made if at the end of the last financial year the net assets as set out in the standalone statutory accounts prepared under Luxembourg GAAP are, or following such a distribution would become, less than the amount of the subscribed share capital plus the non-distributable reserves. Distributions in the form of dividends may only be made out of net profits and profits carried forward, whereas distributions in the form of share premium reimbursements may only be made out of available share premium. See “Share ownership and trading—Distributions.”
Our legal reserve was zero as of December 31, 2017, but we had amounts available for distribution to shareholders in the form of share premium reimbursements as of such date. There can be no assurance, however, that we will have sufficient net profits or distributable reserves in the future to pay dividends or other distributions, including as share premium reimbursements.
We are a holding company and have no material assets other than our ownership of shares in our subsidiaries. When we pay a dividend or other distribution on our common shares in the future, we generally cause our operating subsidiaries to make distributions to us in an amount sufficient to fund any such dividends or distributions. Although as of December 31, 2017, there are no material contractual restrictions on our subsidiaries’ ability to make distributions to us, their ability to do so is subject to their capacity to generate sufficient earnings and cash flow and may also be affected by statutory accounting and tax rules in Brazil and Peru.
It could be difficult for investors to enforce any judgment obtained outside Luxembourg against us or any of our associates.
We are organized under the laws of Luxembourg. Furthermore, certain of our directors and officers reside outside the United States and Canada and most of their assets are located outside the United States and Canada. Most of our assets are located outside the United States. As a result, it may not be possible for investors to effect service of process upon us or our directors and officers within the United States, Canada or other jurisdictions outside Luxembourg or to enforce against us or our directors and officers judgments obtained in the United States, Canada or other jurisdictions outside Luxembourg. Because judgments of U.S. or Canadian courts for civil liabilities based upon the U.S. federal securities laws or Canadian securities laws may only be enforced in Luxembourg if certain requirements are met, investors may face greater difficulties in protecting their interest in actions against us or our directors and officers than would investors in a corporation incorporated in a state or other jurisdiction of the United States or Canada.
The following tables present our selected consolidated financial data for each of the periods and the dates indicated below.
The selected consolidated financial data should be read in conjunction with the consolidated financial statements included elsewhere in this report. Our consolidated financial statements have been prepared in accordance with IFRS.
We have not included selected consolidated financial data as of and for the year ended December 31, 2013 because such information is not available and cannot be provided without unreasonable effort or expense.
|
| For the Year Ended December 31, |
| ||||||
|
| 2017 |
| 2016 |
| 2015 |
| 2014 |
|
|
| (in millions of US$, unless otherwise indicated) |
| ||||||
Consolidated Statement of Operations Information: |
|
|
|
|
|
|
|
|
|
Continuing operations |
|
|
|
|
|
|
|
|
|
Net revenue from products sold |
| 2,449.5 |
| 1,964.8 |
| 1,865.2 |
| 2,118.3 |
|
Cost of products sold |
| (1,681.2 | ) | (1,439.1 | ) | (1,463.3 | ) | (1,594.9 | ) |
Gross profit |
| 768.3 |
| 525.7 |
| 401.9 |
| 523.4 |
|
Operating expenses Selling expenses |
| (89.2 | ) | (90.6 | ) | (84.6 | ) | (93.1 | ) |
General and administrative expenses |
| (148.2 | ) | (127.3 | ) | (106.3 | ) | (149.8 | ) |
Other operating income (expenses), net |
| (129.2 | ) | (177.8 | ) | (47.1 | ) | (108.3 | ) |
Total operating expenses |
| (366.7 | ) | (395.7 | ) | (238.0 | ) | (351.2 | ) |
Operating profit before net financial results and loss from results of associates |
| 401.6 |
| 130.0 |
| 163.9 |
| 172.2 |
|
Financial income |
| 29.9 |
| 25.0 |
| 19.3 |
| 13.7 |
|
Financial expenses |
| (106.2 | ) | (70.4 | ) | (61.6 | ) | (73.5 | ) |
Foreign exchange gains (losses), net |
| (53.9 | ) | 124.5 |
| (299.6 | ) | (107.3 | ) |
Net financial results |
| (130.2 | ) | 79.1 |
| (341.9 | ) | (167.1 | ) |
Loss from results of associates |
| 0.1 |
| (0.2 | ) | (0.3 | ) | — |
|
Profit (loss) before taxation |
| 271.5 |
| 208.9 |
| (178.3 | ) | 5.1 |
|
Current income tax |
| (125.7 | ) | (75.3 | ) | (62.8 | ) | (81.3 | ) |
Deferred income tax |
| 19.5 |
| (23.1 | ) | 101.5 |
| 53.9 |
|
Profit (loss) for the year from continuing operations |
| 165.3 |
| 110.5 |
| (139.6 | ) | (22.3 | ) |
Discontinued operations |
| — |
| — |
| (0.3 | ) | (4.8 | ) |
Profit (loss) for the year |
| 165.3 |
| 110.5 |
| (139.9 | ) | (27.1 | ) |
Profit (loss) attributable to: |
|
|
|
|
|
|
|
|
|
Owners of the parent |
| 126.9 |
| 93.2 |
| (129.5 | ) | (33.8 | ) |
Non-controlling interests |
| 38.4 |
| 17.3 |
| (10.3 | ) | 6.7 |
|
Average number of shares (in millions)(1) |
| 116.5 |
| 80.7 |
| 1.9 |
| 1.8 |
|
Basic and diluted earnings (loss) per share (in US$)(1)(2) |
| 1.1 |
| 1.2 |
| (69.1 | ) | (18.6 | ) |
(1) Earnings per share information has been retroactively adjusted for reductions in the number of shares outstanding arising from transfers from capital to share premium, which resulted in the cancellation of 350,000,000 shares in April 2016, 200,000,000 shares in June 2017, 300,000,000 shares in September 2017 and 428,595,552 shares in October 2017, for a total of 1,278,595,552 shares.
(2) Reflects restated earnings (loss) per share for the years ended December 31, 2016 and 2015. For more information, see Notes 2.2.2 and 24(f) to our consolidated financial statements.
|
| As of December 31, |
| ||||||
|
| 2017 |
| 2016 |
| 2015 |
| 2014 |
|
|
| (in millions of US$) |
| ||||||
Consolidated Balance Sheet Information: |
|
|
|
|
|
|
|
|
|
Assets |
|
|
|
|
|
|
|
|
|
Cash and cash equivalents |
| 1,019.0 |
| 915.6 |
| 621.4 |
| 750.7 |
|
Financial investments |
| 206.2 |
| 117.0 |
| 57.9 |
| 22.6 |
|
Inventory |
| 324.9 |
| 291.8 |
| 230.6 |
| 285.9 |
|
Total current assets(1) |
| 1,838.9 |
| 1,591.8 |
| 1,143.8 |
| 1,344.6 |
|
Property, plant and equipment |
| 1,996.5 |
| 1,978.5 |
| 1,883.4 |
| 2,227.0 |
|
Total non-current assets |
| 4,122.6 |
| 4,568.5 |
| 4,488.0 |
| 4,987.1 |
|
Total assets |
| 5,961.5 |
| 6,160.6 |
| 5,657.2 |
| 6,331.7 |
|
Liabilities |
|
|
|
|
|
|
|
|
|
Loans and financing (current) |
| 40.8 |
| 62.6 |
| 41.4 |
| 102.6 |
|
Trade payables |
| 329.8 |
| 282.2 |
| 259.7 |
| 243.8 |
|
Total current liabilities |
| 768.2 |
| 875.9 |
| 532.0 |
| 585.5 |
|
Loans and financing (non-current) |
| 1,406.5 |
| 1,081.8 |
| 1,014.8 |
| 1,252.2 |
|
Total non-current liabilities |
| 2,284.4 |
| 1,960.4 |
| 1,578.1 |
| 1,869.8 |
|
Total liabilities |
| 3,052.6 |
| 2,836.2 |
| 2,128.7 |
| 2,455.3 |
|
Shareholders’ equity |
|
|
|
|
|
|
|
|
|
Total equity attributable to owners of the parent |
| 2,486.8 |
| 2,848.0 |
| 2,585.4 |
| 2,654.1 |
|
Non-controlling interests |
| 422.1 |
| 476.3 |
| 943.1 |
| 1,222.3 |
|
Total shareholders’ equity |
| 2,908.9 |
| 3,324.3 |
| 3,528.5 |
| 3,876.4 |
|
Total liabilities and shareholders’ equity |
| 5,961.5 |
| 6,160.6 |
| 5,657.2 |
| 6,331.7 |
|
(1) Includes assets held for sale.
|
| For the Year Ended |
| ||||||
Consolidated Statement of Cash Flows Information |
| 2017 |
| 2016 |
| 2015 |
| 2014 |
|
|
| (in millions of US$) |
| ||||||
Net cash provided by (used in): |
|
|
|
|
|
|
|
|
|
Operating activities |
| 378.9 |
| 585.1 |
| 414.6 |
| 392.3 |
|
Investing activities |
| (328.4 | ) | (201.4 | ) | (156.7 | ) | (432.1 | ) |
Financing activities |
| 52.8 |
| (92.2 | ) | (385.9 | ) | 200.3 |
|
Effects of exchange rates on cash and cash equivalents |
| — |
| 2.8 |
| (1.3 | ) | — |
|
Increase (decrease) in cash and cash equivalents |
| 103.5 |
| 294.2 |
| (129.3 | ) | 160.5 |
|
Cash and cash equivalents at the beginning of the year |
| 915.6 |
| 621.4 |
| 750.7 |
| 590.2 |
|
Cash and cash equivalents at the end of the year |
| 1,019.0 |
| 915.6 |
| 621.4 |
| 750.7 |
|
|
| As of and For the |
| ||||
Other Financial Information |
| 2017 |
| 2016 |
| 2015 |
|
|
| (in millions of US$, except |
| ||||
Depreciation and amortization |
| 270.5 |
| 275.0 |
| 295.3 |
|
Interest paid on loans and financing |
| (58.6 | ) | (37.3 | ) | (39.7 | ) |
Adjusted working capital(1) |
| 85.3 |
| 74.0 |
| 38.4 |
|
Adjusted EBITDA(1) |
| 667.5 |
| 403.9 |
| 467.8 |
|
Adjusted EBITDA by region(1): |
|
|
|
|
|
|
|
Brazil |
| 194.2 |
| 59.8 |
| 180.3 |
|
Peru |
| 488.3 |
| 348.5 |
| 295.5 |
|
Other(2) |
| (15.0 | ) | (4.4 | ) | (8.0 | ) |
Total |
| 667.5 |
| 403.9 |
| 467.8 |
|
Adjusted EBITDA by segment(1): |
|
|
|
|
|
|
|
Mining |
| 521.5 |
| 336.8 |
| 221.8 |
|
Smelting |
| 152.7 |
| 70.5 |
| 259.8 |
|
Other(2) |
| (6.8 | ) | (3.4 | ) | (13.8 | ) |
Total |
| 667.5 |
| 403.9 |
| 467.8 |
|
Net debt (period end)(1) |
| 225.1 |
| 126.1 |
| 366.8 |
|
Net debt to Adjusted EBITDA ratio(1) |
| 0.34 |
| 0.31 |
| 0.78 |
|
(1) See discussion below.
(2) The line item “Other” represents the residual component of Adjusted EBITDA either not pertaining to the mining or smelting segments, or, represents items that, because of their nature, are not being allocated to a specific segment.
Non-IFRS measures and reconciliation
Our management uses non-IFRS measures such as Adjusted EBITDA, among other measures, for internal planning and performance measurement purposes. We believe these measures provide useful information about the financial performance of our operations that facilitates period-to-period comparisons on a consistent basis. Management uses Adjusted EBITDA internally to evaluate our underlying operating performance for the reporting periods presented and to assist with the planning and forecasting of future operating results. Management believes that Adjusted EBITDA is a useful measure of our performance because it reflects our cash generation potential from our operational activities excluding exceptional items of the period. These measures should not be considered individually or as a substitute for profit (loss) or operating profit, as indicators of operating performance, or as alternatives to cash flow as measures of liquidity. Additionally, our calculation of Adjusted EBITDA and other non-IFRS measures may be different from the calculation used by other companies, including our competitors in the mining industry, so our measures may not be comparable to those of other companies.
In this report, we present Adjusted EBITDA, which we define as (i) profit (loss) for the year, plus (ii) profit (loss) from results of associates, plus (iii) profit (loss) from results of associates — discontinued, plus (iv) depreciation and amortization, plus/less (v) net financial results, plus/less (vi) income tax, less (vii) gain on sale of investment (loss), plus (viii) impairment of other assets, plus/less (ix) (reversion) impairment — property, plant, equipment. In addition, management may exclude non-cash items considered exceptional from the measurement of Adjusted EBITDA.
A reconciliation of Adjusted EBITDA to our profit (loss) for the periods indicated is presented below.
|
| For the Year Ended |
| ||||
|
| 2017 |
| 2016 |
| 2015 |
|
|
| (in millions of US$) |
| ||||
Reconciliation of Adjusted EBITDA: |
|
|
|
|
|
|
|
Profit (loss) for the year |
| 165.3 |
| 110.5 |
| (139.9 | ) |
(+) profit (loss) from results of associates |
| (0.1 | ) | 0.2 |
| 0.3 |
|
(+) profit (loss) from results of associates—Discontinued operations |
| — |
| — |
| 0.3 |
|
(+) Depreciation and amortization |
| 270.5 |
| 275.0 |
| 295.3 |
|
(–/+) Net financial results |
| 130.2 |
| (79.1 | ) | 341.9 |
|
(–/+) Income tax |
| 106.2 |
| 98.4 |
| (38.7 | ) |
(–) Gain on sale of investment (loss) |
| (4.6 | ) | (0.4 | ) | — |
|
(+) Impairment of other assets |
| 0.1 |
| 0.3 |
| — |
|
(–/+) (Reversion) impairment—property, plant, equipment |
| — |
| (1.0 | ) | 8.6 |
|
Adjusted EBITDA |
| 667.5 |
| 403.9 |
| 467.8 |
|
We calculate Adjusted EBITDA by region on the same basis as Adjusted EBITDA using information from the financial statements of Nexa Brazil and Enercan (for Brazil) and Nexa Peru and Nexa CJM (for Peru), plus the allocation of Nexa Resources and VUS trading revenues and costs pertaining to Brazil and Peru, as applicable, less the elimination of inter-segment operations between our subsidiaries. Selling, general and administrative expenses and the depreciation and amortization of Nexa Resources and VUS are allocated to Brazil and Peru based on their respective participation in our total cost of products sold. The line item “Other” represents the residual component of Adjusted EBITDA either not pertaining to the Brazil or Peru regions, or, represents items that, because of their nature, are not allocated to a specific region.
A reconciliation of Adjusted EBITDA by region to Adjusted EBITDA for the periods indicated is presented below.
|
| For the Year Ended |
| ||||
|
| 2017 |
| 2016 |
| 2015 |
|
|
| (in millions of US$) |
| ||||
Reconciliation of Adjusted EBITDA by region: |
|
|
|
|
|
|
|
Brazil |
| 194.2 |
| 59.8 |
| 180.3 |
|
Peru |
| 488.3 |
| 348.5 |
| 295.5 |
|
Other(1) |
| (15.0 | ) | (4.4 | ) | (8.0 | ) |
Adjusted EBITDA |
| 667.5 |
| 403.9 |
| 467.8 |
|
(1) The line item “Other” represents the residual component of Adjusted EBITDA either not pertaining to the Brazil or Peru regions or, represents items that, because of their nature, are not being allocated to a specific region.
We define Adjusted EBITDA by segment as (i) profit (loss) for the year, plus (ii) profit (loss) from results of associates, plus (iii) depreciation and amortization, plus/less (iv) net financial results, plus/less (v) income tax, plus/less (vi) components of Adjusted EBITDA by segment either not pertaining to the mining or smelting segment, or, represents items that, because of their nature, are not allocated to specific segment. See Note 30 to the consolidated financial statements.
A reconciliation of Adjusted EBITDA by segment to Adjusted EBITDA for the periods indicated is presented below.
|
| For the Year Ended |
| ||||
|
| 2017 |
| 2016 |
| 2015 |
|
|
| (in millions of US$) |
| ||||
Reconciliation of Adjusted EBITDA by segment: |
|
|
|
|
|
|
|
Mining |
| 521.5 |
| 336.8 |
| 221.8 |
|
Smelting |
| 152.7 |
| 70.5 |
| 259.8 |
|
Other(1) |
| (6.8 | ) | (3.4 | ) | (13.8 | ) |
Adjusted EBITDA |
| 667.5 |
| 403.9 |
| 467.8 |
|
(1) Represents the residual component of Adjusted EBITDA either not pertaining to the mining or smelting segments, or, represents items that, because of their nature, are not being allocated to a specific segment.
We also present herein our net debt, which we define as (i) loans and financing less (ii) cash and cash equivalents, less (iii) financial investments, plus/less (iv) the fair value of derivative financial instruments. Our management believes that net debt is an important figure because it indicates our ability to repay outstanding debts that become due simultaneously using available cash and highly liquid assets.
A reconciliation of net debt to loans and financing as of December 31, 2017, 2016 and 2015 is presented below.
|
| As of December 31, |
| ||||
|
| 2017 |
| 2016 |
| 2015 |
|
|
| (in millions of US$) |
| ||||
Calculation of Net Debt: |
|
|
|
|
|
|
|
Loans and financing |
| 1,447.3 |
| 1,144.4 |
| 1,056.2 |
|
Cash and cash equivalents |
| (1,019.0 | ) | (915.6 | ) | (621.4 | ) |
Derivative financial instruments |
| 3.3 |
| 16.8 |
| (10.1 | ) |
Financial investments |
| (206.5 | ) | (119.5 | ) | (57.9 | ) |
Net Debt |
| 225.1 |
| 126.1 |
| 366.8 |
|
We define net debt to Adjusted EBITDA ratio as net debt divided by Adjusted EBITDA.
The calculation of our net debt to Adjusted EBITDA ratio for the periods indicated is presented below.
|
| As of and For the Year |
| ||||
|
| 2017 |
| 2016 |
| 2015 |
|
|
| (in millions of US$) |
| ||||
Calculation of Net Debt to Adjusted EBITDA Ratio: |
|
|
|
|
|
|
|
Net debt (period end) |
| 225.1 |
| 126.1 |
| 366.8 |
|
Adjusted EBITDA |
| 667.5 |
| 403.9 |
| 467.8 |
|
Net Debt to Adjusted EBITDA Ratio |
| 0.34 |
| 0.31 |
| 0.78 |
|
We define Adjusted EBITDA margin as Adjusted EBITDA divided by net revenue from products sold. The calculation of our Adjusted EBITDA margin for the periods indicated is presented below.
|
| For the Year Ended |
| ||||
|
| 2017 |
| 2016 |
| 2015 |
|
|
| (in millions of US$) |
| ||||
Calculation of Adjusted EBITDA Margin: |
|
|
|
|
|
|
|
Adjusted EBITDA |
| 667.5 |
| 403.9 |
| 467.8 |
|
Net revenue from products sold |
| 2,449.5 |
| 1,964.8 |
| 1,865.2 |
|
Adjusted EBITDA Margin |
| 0.27 |
| 0.21 |
| 0.25 |
|
We calculate adjusted working capital as (i) trade accounts receivable, plus (ii) inventory, plus (iii) other taxes recoverable, plus (iv) other assets, less (v) trade payables, less (vi) confirming payable, less (vii) salaries and payroll charges, less (viii) taxes payable, less (ix) other liabilities. Our management believes that adjusted working capital is an important figure because it provides a relevant metric for the efficiency and liquidity of our operating activities.
The calculation of our adjusted working capital derived from our consolidated financial statements as of December 31, 2017, 2016 and 2015 is presented below.
|
| As of December 31, |
| ||||
|
| 2017 |
| 2016 |
| 2015 |
|
|
| (in millions of US$) |
| ||||
Calculation of Adjusted Working Capital: |
|
|
|
|
|
|
|
Trade accounts receivable |
| 182.7 |
| 120.1 |
| 52.5 |
|
Inventory |
| 324.9 |
| 291.8 |
| 230.6 |
|
Other taxes recoverable |
| 112.6 |
| 129.7 |
| 141.3 |
|
Other assets |
| 48.2 |
| 44.7 |
| 40.5 |
|
Trade payables |
| (329.8 | ) | (282.2 | ) | (259.7 | ) |
Confirming payable |
| (111.0 | ) | (102.3 | ) | (95.2 | ) |
Salaries and payroll charges |
| (79.8 | ) | (70.0 | ) | (34.9 | ) |
Taxes payable |
| (41.1 | ) | (29.8 | ) | (11.0 | ) |
Other liabilities |
| (21.4 | ) | (28.0 | ) | (25.7 | ) |
Adjusted working capital |
| 85.3 |
| 74.0 |
| 38.4 |
|
Cash cost, after by-product credits and related measures
In this report, we also present measures of costs that are widely used by peer companies operating in the mining and smelting industries. These performance measures are not IFRS measures, and they do not have a standard meaning and therefore may not be comparable to similar data presented by other mining and smelting companies. They should not be considered as a substitute for costs of sales, costs of selling and administrative expenses, or as an indicator of costs. Similar measures are also calculated by Wood Mackenzie for many market participants, but Wood Mackenzie’s methodology differs from the methodology we use below.
Our management uses cash cost, after by-product credits and related measures, among other measures, for internal planning and performance measurement purposes. We believe these measures provide useful information about the operational performance of our operations that facilitates period-to-period comparisons on a consistent basis.
In calculating cash cost, after by-product credits, we account for transactions between our mining operations and our smelting operations using the same methodology we use to evaluate the performance of our mining and smelting segments. See Note 30 to our consolidated financial statements. We prepare an internal calculation based on transfer-pricing adjustments made on an arm’s length principle basis. All information disclosed for cash cost, after by-product credits is consistent with this methodology.
Mining operations
Cash cost, after by-product credits: For our mining operations, cash cost, after by-product credits includes all direct cash cost, after by-product credits of mining, including costs associated with mining, concentrating, leaching, solvent extraction and electrowinning, on-site administration and general expenses, any off-site services essential to the operation, concentrate freight costs, marketing costs and property and severance taxes paid to state or federal agencies that are not profit-related. Treatment and refining charges on metal sales, which are typically recognized as a deduction component of sales revenues, are added to cash cost, after by-product credits. Cash cost, after by-product credits is calculated on a byproduct basis, in which byproducts sales are deducted from total cash cost, after by-product credits directly attributable to mining operations.
Sustaining cash cost, after by-product credits: Sustaining cash cost, after by-product credits is defined as the cash cost, after by-product credits plus non-expansion capital expenditure, including sustaining health, safety and snvironment, modernization and other non-expansion-related capital expenditures.
All-in sustaining cost, after by-product credits: All-in sustaining cost (or AISC) is defined as sustaining cash cost, after by-product credits plus corporate general and administrative expenses, royalties and workers’ participation.
Smelting operations
Cash cost, after by-product credits: For our smelting operations, cash cost, after by-product credits includes all the costs of smelting, such as costs associated with labor, net energy, maintenance materials, consumables and other on-site costs, as well as raw material costs. Byproduct sales are deducted from total cash cost, after by-product credits directly attributable to smelting operations.
Sustaining cash cost, after by-product credits: Sustaining cash cost, after by-product credits is defined as the cash cost, after by-product credits plus non-expansion capital expenditure, including sustaining health, safety and environment, modernization and other non-expansion-related capital expenditures.
All-in sustaining cost, after by-product credits: All-in sustaining cost is defined as sustaining cash cost, after by-product credits plus general and administrative expenses and workers’ participation.
For mining operations, we present below cash cost, after by-product credits, sustaining cash cost, after by-product credits and all-in sustaining cost and a reconciliation to our consolidated financial statements.
For the year ended December 31, 2017
Operations |
| Vazante |
| Morro |
| Cerro |
| El |
| Atacocha |
| Consolidation |
| Corporate |
| Mining |
|
Sales Volume (Zinc Contained in Concentrate) Tonnes |
| 135,379 |
| 20,969 |
| 156,034 |
| 45,564 |
| 17,038 |
| 374,984 |
| — |
| 374,984 |
|
Cost of goods sold |
| 70.1 |
| 43.3 |
| 259.3 |
| 115.0 |
| 80.0 |
| 567.8 |
| 13.3 |
| 581.0 |
|
On-site G&A |
| 5.3 |
| 3.0 |
| — |
| — |
| — |
| 8.4 |
| — |
| 8.4 |
|
By-product credits |
| (7.2 | ) | (18.6 | ) | (320.4 | ) | (70.6 | ) | (77.4 | ) | (494.2 | ) | (5.6 | ) | (499.8 | ) |
Treatment and refining charges |
| 78.5 |
| 10.1 |
| 66.8 |
| 23.3 |
| 8.3 |
| 186.9 |
| — |
| 186.9 |
|
Selling expenses |
| 0.8 |
| 4.4 |
| 12.5 |
| 3.8 |
| 2.2 |
| 23.7 |
| — |
| 23.7 |
|
Depreciation and amortization |
| (15.1 | ) | (6.1 | ) | (41.8 | ) | (17.1 | ) | (13.2 | ) | (93.3 | ) | (0.2 | ) | (93.5 | ) |
Royalties |
| (1.7 | ) | (1.6 | ) | — |
| — |
| — |
| (3.3 | ) | — |
| (3.3 | ) |
Others |
| — |
| — |
| (5.8 | ) | 0.6 |
| (3.2 | ) | (8.3 | ) | — |
| (8.3 | ) |
Cash cost, after by-product credits (sold) |
| 130.7 |
| 34.5 |
| (29.4 | ) | 55.1 |
| (3.3 | ) | 187.6 |
| 7.4 |
| 195.0 |
|
Cash cost, after by-product credits (sold) (US$/tonne) |
| 965.3 |
| 1,644.3 |
| (188.6 | ) | 1,210.2 |
| (191.1 | ) | 500.3 |
| — |
| 520.1 |
|
Non-expansion capital expenditure |
| 21.3 |
| 7.9 |
| 7.5 |
| 19.8 |
| 5.6 |
| 62.0 |
| 0.5 |
| 62.6 |
|
Sustaining cash cost, after by-product credits |
| 152.0 |
| 42.3 |
| (22.0 | ) | 74.9 |
| 2.4 |
| 249.6 |
| 8.0 |
| 257.6 |
|
Sustaining cash cost, after by-product credits (sold) (US$/tonne) |
| 1,122.5 |
| 2,019.0 |
| (140.8 | ) | 1,644.6 |
| 139.5 |
| 665.7 |
| — |
| 686.9 |
|
Workers participation & bonus |
| 1.8 |
| 0.8 |
| 25.3 |
| 3.4 |
| 1.1 |
| 32.4 |
| — |
| 32.4 |
|
Royalties |
| 1.7 |
| 1.6 |
| — |
| 1.4 |
| 1.2 |
| 5.9 |
| — |
| 5.9 |
|
Corporate G&A |
| — |
| — |
| — |
| — |
| — |
| — |
| 38.6 |
| 38.6 |
|
AISC (sold) |
| — |
| — |
| — |
| — |
| — |
| — |
| — |
| 334.4 |
|
AISC (sold) (US$/tonne) |
| — |
| — |
| — |
| — |
| — |
| — |
| — |
| 891.7 |
|
(1) “Others” includes Enercan, inactive operations and non-operational provisions and reversals.
For the year ended December 31, 2016
Operations |
| Vazante |
| Morro |
| Cerro |
| El |
| Atacocha |
| Consolidation |
| Corporate |
| Mining |
|
Sales Volume (Zinc Contained in Concentrate) Tonnes |
| 135,509 |
| 22,688 |
| 173,001 |
| 62,434 |
| 22,232 |
| 415,864 |
| — |
| 415,864 |
|
Cost of goods sold |
| 66.2 |
| 35.9 |
| 249.9 |
| 100.0 |
| 80.5 |
| 532.5 |
| (19.3 | ) | 513.1 |
|
On-site G&A |
| 4.5 |
| 1.9 |
| — |
| — |
| — |
| 6.5 |
|
|
| 6.5 |
|
By-product credits |
| (4.2 | ) | (16.0 | ) | (252.1 | ) | (72.7 | ) | (68.2 | ) | (413.3 | ) | 18.7 |
| (394.6 | ) |
Treatment and refining charges |
| 87.5 |
| 11.3 |
| 82.3 |
| 34.1 |
| 11.9 |
| 227.2 |
| — |
| 227.2 |
|
Selling expenses |
| 0.7 |
| 3.3 |
| 13.2 |
| 4.1 |
| 3.0 |
| 24.2 |
| — |
| 24.2 |
|
Depreciation and amortization |
| (17.7 | ) | (4.9 | ) | (47.2 | ) | (13.8 | ) | (11.0 | ) | (94.6 | ) | (4.1 | ) | (98.7 | ) |
Royalties |
| (1.8 | ) | (1.4 | ) |
|
|
|
|
|
| (3.3 | ) | — |
| (3.3 | ) |
Others |
|
|
|
|
| (1.2 | ) | 0.2 |
| (1.0 | ) | (2.0 | ) | — |
| (2.0 | ) |
Cash cost, after by-product credits (sold) |
| 135.2 |
| 30.3 |
| 44.8 |
| 51.7 |
| 15.2 |
| 277.3 |
| (4.7 | ) | 272.5 |
|
Cash cost, after by-product credits (sold) (US$/tonne) |
| 997.7 |
| 1,336.2 |
| 259.1 |
| 828.4 |
| 684.9 |
| 666.8 |
| — |
| 655.3 |
|
Non-expansion capital expenditure |
| 8.9 |
| 3.5 |
| 18.0 |
| 35.4 |
| 4.9 |
| 70.7 |
| 0.2 |
| 70.9 |
|
Sustaining cash cost, after by-product credits |
| 144.1 |
| 33.8 |
| 62.9 |
| 87.1 |
| 20.2 |
| 348.0 |
| (4.5 | ) | 343.5 |
|
Sustaining cash cost, after by-product credits (sold) (US$/tonne) |
| 1,063.1 |
| 1,489.9 |
| 363.4 |
| 1,395.0 |
| 906.8 |
| 836.8 |
| — |
| 825.9 |
|
Workers participation & bonus |
| 0.8 |
| 0.8 |
| 17.3 |
| 5.8 |
| 1.2 |
| 26.0 |
| — |
| 26.0 |
|
Royalties |
| 1.8 |
| 1.4 |
| — |
| 1.6 |
| 1.0 |
| 5.8 |
| — |
| 5.8 |
|
Corporate G&A |
| — |
| — |
| — |
| — |
| — |
| — |
| 41.3 |
| 41.3 |
|
AISC (sold) |
| — |
| — |
| — |
| — |
| — |
| — |
| — |
| 416.5 |
|
AISC (sold) (US$/tonne) |
| — |
| — |
| — |
| — |
| — |
| — |
| — |
| 1,001.5 |
|
(1) “Others” includes silver streaming, Enercan, inactive operations and non-operational provisions and reversals.
For the year ended December 31, 2015
Operations |
| Vazante |
| Morro |
| Cerro |
| El |
| Atacocha |
| Consolidation |
| Corporate |
| Mining |
|
Sales Volume (Zinc Contained in Concentrate) Tonnes |
| 134,004 |
| 22.922 |
| 177,059 |
| 62,251 |
| 30,325 |
| 426,560 |
| — |
| 426,560 |
|
Cost of goods sold |
| 60.5 |
| 39.3 |
| 240.3 |
| 96.9 |
| 85.2 |
| 522.2 |
| 9.9 |
| 532.1 |
|
On-site G&A |
| 4.0 |
| 1.1 |
| — |
| — |
| — |
| 5.1 |
| — |
| 5.1 |
|
By-product credits |
| (4.0 | ) | (14.7 | ) | (229.5 | ) | (61.5 | ) | (44.5 | ) | (354.3 | ) | — |
| (354.3 | ) |
Treatment and refining charges |
| 93.5 |
| 12.6 |
| 89.5 |
| 36.6 |
| 17.4 |
| 249.6 |
| — |
| 249.6 |
|
Selling expenses |
| 0.7 |
| 3.1 |
| 13.5 |
| 6.0 |
| 3.6 |
| 26.8 |
| — |
| 26.8 |
|
Depreciation and amortization |
| (11.6 | ) | (9.1 | ) | (50.1 | ) | (13.9 | ) | (16.4 | ) | (101.0 | ) | (10.4 | ) | (111.4 | ) |
Royalties |
| (1.2 | ) | (1.3 | ) | — |
| — |
| — |
| (2.5 | ) | — |
| (2.5 | ) |
Others |
| — |
| — |
| (1.7 | ) | (0.3 | ) | (1.6 | ) | (3.7 | ) | — |
| (3.7 | ) |
Cash cost, after by-product credits (sold) |
| 141.9 |
| 30.9 |
| 62.0 |
| 63.7 |
| 43.7 |
| 342.2 |
| (0.5 | ) | 341.7 |
|
Cash cost, after by-product credits (sold) (US$/tonne) |
| 1,058.7 |
| 1,347.9 |
| 350.1 |
| 1,023.8 |
| 1,441.2 |
| 802.2 |
| — |
| 801.1 |
|
Non expansion capital expenditure |
| 4.0 |
| 2.1 |
| 15.7 |
| 36.5 |
| 10.9 |
| 69.2 |
| — |
| 69.2 |
|
Sustaining cash cost, after by-product credits |
| 145.9 |
| 33.0 |
| 77.7 |
| 100.3 |
| 54.6 |
| 411.1 |
| (0.5 | ) | 410.9 |
|
Sustaining cash cost, after by-product credits (sold) (US$/tonne) |
| 1,088.5 |
| 1,440.0 |
| 438.7 |
| 1,610.5 |
| 1,800.6 |
| 964.4 |
| — |
| 963.3 |
|
Workers’ participation & bonus |
| 1.2 |
| 0.9 |
| 12.3 |
| 2.9 |
| 0.9 |
| 18.3 |
| — |
| 18.3 |
|
Royalties |
| 1.2 |
| 1.3 |
| — |
| 1.1 |
| 0.5 |
| 4.0 |
| — |
| 4.0 |
|
Corporate G&A |
| — |
| — |
| — |
| — |
| — |
| — |
| 34.3 |
| 34.3 |
|
AISC (sold) |
| — |
| — |
| — |
| — |
| — |
| — |
| — |
| 467.5 |
|
AISC (sold) (US$/tonne) |
| — |
| — |
| — |
| — |
| — |
| — |
| — |
| 1,096.0 |
|
(1) “Others” includes Enercan, inactive operations and non-operational provisions and reversals.
For our smelting operations, we present below cash cost, after by-product credits, sustaining cash cost, after by-product credits and all-in sustaining cost and a reconciliation to our consolidated financial statements.
For the year ended December 31, 2017
Operations |
| Três |
| Juiz de |
| Cajamarquilla |
| Consolidation |
| Corporate |
| Smelting |
|
Sales Volume (Zinc Contained in Products) Tonnes |
| 191,158 |
| 81,330 |
| 312,009 |
| 584,497 |
| — |
| 584,497 |
|
Cost of goods sold |
| 518.1 |
| 231.5 |
| 922.5 |
| 1,672.1 |
| 26.3 |
| 1,698.3 |
|
On-site G&A |
| 3.8 |
| 2.8 |
| 15.5 |
| 22.2 |
| 2.0 |
| 24.2 |
|
Depreciation and amortization |
| (14.4 | ) | (14.9 | ) | (67.4 | ) | (96.7 | ) | (3.7 | ) | (100.4 | ) |
By-product credits |
| (12.4 | ) | (18.6 | ) | (56.6 | ) | (87.6 | ) | (6.4 | ) | (94.0 | ) |
Cash cost, after by-product credits (sold) |
| 495.2 |
| 200.8 |
| 814.0 |
| 1,510.0 |
| — |
| 1,528.2 |
|
Cash cost, after by-product credits (sold) (per tonne) |
| 2,590.5 |
| 2,468.4 |
| 2,608.9 |
| 2,583.4 |
| — |
| 2.614,6 |
|
Non-expansion capital expenditure |
| 43.5 |
| 17.5 |
| 20.0 |
| 81.0 |
| 5.4 |
| 86.4 |
|
Sustaining cash cost, after by-product credits |
| 538.7 |
| 218.2 |
| 834.0 |
| 1,591.0 |
| — |
| 1,614.6 |
|
Sustaining cash cost, after by-product credits (sold) (per tonne) |
| 2,818.3 |
| 2,683.5 |
| 2,673.0 |
| 2,722.0 |
| — |
| 2,762.4 |
|
Workers’ participation |
| 2.0 |
| 1.6 |
| 1.7 |
| 5.2 |
| — |
| 5.2 |
|
Corporate G&A |
| — |
| — |
| — |
| — |
| 65.0 |
| 65.0 |
|
AISC (sold) |
| — |
| — |
| — |
| — |
| — |
| 1,684.8 |
|
AISC (sold) (per tonne) |
| — |
| — |
| — |
| — |
| — |
| 2,882.5 |
|
(1) “Others” includes Enercan, inactive operations and non-operational provisions and reversals.
For the year ended December 31, 2016
Operations |
| Três |
| Juiz de |
| Cajamarquilla |
| Consolidation |
| Corporate |
| Smelting |
|
Sales Volume (Zinc Contained in Products) Tonnes |
| 190,109 |
| 83,230 |
| 327,889 |
| 601,229 |
| — |
| 601,229 |
|
Cost of goods sold |
| 356.5 |
| 173.8 |
| 705.3 |
| 1,235.6 |
| 24.9 |
| 1,260.5 |
|
On-site G&A |
| 2.6 |
| 3.1 |
| 12.4 |
| 18.1 |
| 1.8 |
| 19.9 |
|
Depreciation and amortization |
| (11.2 | ) | (16.3 | ) | (66.5 | ) | (94.0 | ) | (4.6 | ) | (98.7 | ) |
By-product credits |
| (10.8 | ) | (14.5 | ) | (74.0 | ) | (99.4 | ) | (6.4 | ) | (105.8 | ) |
Cash cost, after by-product credits (sold) |
| 337.0 |
| 146.0 |
| 577.3 |
| 1,060.3 |
| 15.6 |
| 1,075.9 |
|
Cash cost, after by-product credits (sold) (per tonne) |
| 1,772.6 |
| 1,754.6 |
| 1,760.5 |
| 1,763.5 |
| — |
| 1,789.5 |
|
Non-expansion capital expenditure |
| 23.8 |
| 12.5 |
| 26.5 |
| 62.8 |
| 1.4 |
| 64.1 |
|
Sustaining cash cost, after by-product credits |
| 360.8 |
| 158.5 |
| 603.8 |
| 1,123.0 |
| 17.0 |
| 1,140.0 |
|
Sustaining cash cost, after by-product credits (sold) (per tonne) |
| 1,897.7 |
| 1,904.2 |
| 1,841.4 |
| 1,867.9 |
| — |
| 1,869.2 |
|
Workers’ participation |
| 1.7 |
| 1.3 |
| 1.6 |
| 4.6 |
| — |
| 4.6 |
|
Corporate G&A |
| — |
| — |
| — |
| — |
| 49.7 |
| 49.7 |
|
AISC (sold) |
| — |
| — |
| — |
| — |
| — |
| 1,194.3 |
|
AISC (sold) (per tonne) |
| — |
| — |
| — |
| — |
| — |
| 1,986.4 |
|
(1) “Others” includes Enercan, inactive operations and non-operational provisions and reversals.
For the year ended December 31, 2015
Operations |
| Três |
| Juiz de |
| Cajamarquilla |
| Consolidation |
| Corporate |
| Smelting |
|
Sales Volume (Zinc Contained in Products) Tonnes |
| 179,458 |
| 78,191 |
| 328,772 |
| 586,421 |
| — |
| 586,421 |
|
Cost of goods sold |
| 298.3 |
| 171.2 |
| 690.8 |
| 1,160.3 |
| 10.2 |
| 1,170.5 |
|
On-site G&A |
| 3.1 |
| 3.2 |
| 15.0 |
| 21.3 |
| 3.6 |
| 25.0 |
|
Depreciation and amortization |
| (11.9 | ) | (16.0 | ) | (70.6 | ) | (98.5 | ) | (4.9 | ) | (103.4 | ) |
By-product credits |
| (7.5 | ) | (19.2 | ) | (84.5 | ) | (111.2 | ) | (2.4 | ) | (113.6 | ) |
Cash cost, after by-product credits (sold) |
| 282.0 |
| 139.2 |
| 550.8 |
| 972.0 |
| 6.6 |
| 978.6 |
|
Cash cost, after by-product credits (sold) (per tonne) |
| 1,571.6 |
| 1,779.8 |
| 1,675.3 |
| 1,657.5 |
| — |
| 1,668.7 |
|
Non-expansion capital expenditure |
| 33.8 |
| 9.8 |
| 28.5 |
| 72.1 |
| 0.6 |
| 72.7 |
|
Sustaining cash cost, after by-product credits |
| 315.8 |
| 149.0 |
| 579.2 |
| 1,044.1 |
| 7.2 |
| 1,051.3 |
|
Sustaining cash cost, after by-product credits (sold) (per tonne) |
| 1,760.0 |
| 1,905.6 |
| 1,761.9 |
| 1,780.4 |
| — |
| 1,792.7 |
|
Workers participation |
| 1.3 |
| 1.7 |
| 1.3 |
| 4.3 |
| — |
| 4.3 |
|
Corporate G&A |
| — |
| — |
| — |
| — |
| 30.9 |
| 30.9 |
|
AISC (sold) |
| — |
| — |
| — |
| — |
| — |
| 1,086.4 |
|
AISC (sold) (per tonne) |
| — |
| — |
| — |
| — |
| — |
| 1,852.6 |
|
(1) “Others” includes Enercan, inactive operations and non-operational provisions and reversals.
Overview
We are a large scale, low cost integrated zinc producer with over 60 years of experience developing and operating mining and smelting assets in Latin America.
We operate and own five long life mines, three located in the Central Andes of Peru and two located in the state of Minas Gerais in Brazil. Our operations are large scale, modern, mechanized underground and open pit mines. Two of our mines, Cerro Lindo in Peru and Vazante in Brazil, are among the top 10 largest zinc mines in the world, and, combined with our other mining operations, place us among the top five producers of mined zinc globally in 2017, according to Wood Mackenzie. In addition to zinc, which accounted for 65.8% of our mined metal production in 2017 measured on a zinc equivalent basis, we produce substantial amounts of copper, lead, silver and gold as by-products, which reduce our overall cost to produce mined zinc.
In 2017, our mining operations produced 375.4 thousand tonnes of zinc contained in concentrates, 44.2 thousand tonnes of copper contained in concentrates, 52.6 thousand tonnes of lead contained in concentrates, 7,946 thousand ounces of silver and 32.5 thousand ounces of gold, for a total of 572.4 thousand tonnes of metal on a zinc equivalent basis.
We also own a zinc smelter in Peru (Cajamarquilla) and two zinc smelters in Brazil (Três Marias and Juiz de Fora), which produce metallic zinc, zinc oxide and byproducts. We are among the top five producers of refined zinc globally in 2017, according to Wood Mackenzie. Our smelters are the only zinc smelting units in Latin America (excluding Mexico). Cajamarquilla is the only operating zinc smelter in Peru, and the seventh largest globally in 2017 by production volume, according to Wood Mackenzie. Peru is the second largest producer of mined zinc in the world, assuring long-term supply of zinc concentrate to Cajamarquilla. Our smelters produced 583,073 tonnes of refined zinc in different formats and sizes during 2017, along with byproducts, including sulfuric acid, silver concentrate, copper cement and copper sulfate. Our smelters process zinc concentrate, 60.9% of which was sourced from our mines during 2017, and 39.1% purchased from third parties. Approximately 98.0% of the total volume of the zinc concentrates produced by our mines was processed by our own smelters in 2017, with the remainder, and all of our copper and lead concentrates sold to third parties. We market our products in Latin America and globally, through our commercial offices in Luxembourg, the United States, Brazil and Peru.
History
We commenced operating in 1956 under the name “Companhia Mineira de Metais” or CMM, in the state of Minas Gerais, Brazil. In 1996, following a restructuring of its management model, the Votorantim Group’s industrial units were reorganized according to their business activities and geographic markets. As a result of this restructuring, Votorantim Metais S.A. was incorporated in order to manage the zinc, nickel and steel businesses. Later, the aluminum business was added, and the several entities were consolidated under one single management structure.
In 2008, the steel assets and activities were separated from Votorantim Metais S.A.’s portfolio and placed under the management of a new entity, Votorantim Siderurgia.
In 2016, Votorantim Metais S.A. underwent a further restructuring process, and the business units were divided. The aluminum and nickel businesses of Votorantim Metais S.A. were consolidated under Companhia Brasileira de Alumínio, or CBA. The zinc and copper production units in Brazil and Peru were transferred to Nexa Resources.
The following timeline is a summary of our history:
· In 1956, the Votorantim Group founded CMM and commenced the exploration of zinc deposits in Vazante, located in the state of Minas Gerais.
· In 1969, startup of open cast mining operations for zinc silicate ore in the Vazante mining unit and the production of metallic zinc in the Três Marias smelter.
· In 1984, following the privatization of Mineradora Morro Agudo S.A., the Votorantim Group acquired an equity stake and became a shareholder of this entity, which primarily operates in Paracatu (state of Minas Gerais) and produces zinc sulfide concentrate, in partnership with two other companies, Mineração Areiense S.A. (Masa) and Companhia Paraibuna de Metais S.A.
· In 1988, the Votorantim Group acquired control of Mineradora Morro Agudo S.A. That same year, we initiated the construction of the Morro Agudo mining unit in Paracatu in the state of Minas Gerais.
· From 1976 to 1993, annual zinc production capacity at the Três Marias smelter doubled to 180,000 tonnes. Since then, debottlenecking activities resulted in the addition of 10,000 tonnes to the Três Marias smelter capacity, totaling 190,000 tonnes per year.
· In 2001, annual zinc production capacity at the Três Marias smelter increased to 190,000 tonnes.
· In 2002, we expanded our market share in the Brazilian zinc market with the acquisition of Companhia Paraibuna de Metais S.A., located in Juiz de Fora (state of Minas Gerais). As a result, our annual zinc production capacity increased from 180,000 tonnes to 270,000 tonnes.
· In 2004, the acquisition of the Cajamarquilla zinc smelter in Peru marked the beginning of our expansion in Latin America. The acquired facility had an annual zinc production capacity of 120,000 tonnes.
· In 2005, we increased our participation in the Peruvian market for zinc with the acquisition, through Nexa CJM, of 19.93% shareholding in Nexa Peru, Peru’s fourth largest mining company focused on zinc production, with its shares listed on the Lima Stock Exchange. That same year, we also expanded the capacity of the Cajamarquilla smelter to 160,000 tonnes.
· In 2010, we became the controlling shareholder of Nexa Peru (50.1% stake), which at the time was the third largest mining company focused on zinc production in Peru. During the same year, the capacity of the Cajamarquilla smelter in Peru doubled, increasing its annual zinc production capacity from 160,000 tonnes to 320,000 tonnes.
· In 2012, we expanded the treatment capacity for the Cerro Lindo unit from 10 to 15 thousand tonnes per day.
· In 2014, a new corporate governance model was implemented by VSA in the corporate group. VSA took on the roles of providing guidance and portfolio management, while its subsidiaries (including us) gained autonomy. The main consequence of this new corporate model was that the new governance structure demanded a higher level of empowerment and accountability of senior management, and the establishment of a board of directors at each company. In addition, in connection with the implementation of the new corporate governance model, VSA’s equity participations in Nexa CJM and Nexa Brazil were transferred to Nexa Resources on June 18, 2014 and July 1, 2014, respectively. Nexa Resources also created a governance, risk and compliance structure to develop policies based on best practices, including enterprise risk management, internal controls and compliance, dividends, insider trading, anti-corruption, disclosure and financial risk management.
· In 2014, we expanded the treatment capacity for our Cerro Lindo unit from 15 to 18 thousand tonnes per day.
· In 2016, VSA decided to reorganize the zinc, copper, aluminum and nickel businesses that were managed under the name Votorantim Metais S.A. After this business decision, Nexa Resources became the holding entity solely responsible for the zinc and copper business and CBA became responsible for the aluminum and nickel businesses.
· In April 2016, Nexa CJM acquired 264,157,507 shares of Nexa Peru from Nexa Peru’s non-controlling shareholders through transactions on the Lima Stock Exchange, thereby increasing its interest in Nexa Peru from 60.01% to 80.23%. Certain affiliates of the non-controlling shareholders acquired a non-controlling interest in Nexa Resources equivalent to 10.65% of our capital stock. See “Share ownership and trading—Major shareholders.”
· In June 2016, as part of an internal reorganization, VSA transferred the shares of VGmbH, which was the trading company for metals, to Nexa Resources. In December 2016, we reorganized our trading activities, primarily consisting of trading refined zinc, zinc concentrates and by-products, mainly from Nexa Brazil and Nexa CJM, transferring it from VGmbH, in Austria, to us.
· In October 2016, Nexa Peru launched a tender offer to repurchase its common shares’ free float through the Lima Stock Exchange, and we acquired an additional 2.75% equity interest in Nexa Peru, increasing our ownership to 83.55% of Nexa Peru’s common shares in circulation, which is equivalent to 80.23% of the total common shares issued. As a result of this repurchase, as of December 31, 2016, Nexa Peru increased to 51,996,535 its treasury shares and the common shares’ free float decreased to 16.45%. In December 2016, Nexa Peru requested that the Securities and Exchange Supervisory Agency (Superintendencia del Mercado de Valores), the Peruvian Central Bank, the Peruvian Ministry of Economy and Finance (Ministerio de Economía y Finanzas) and the Peruvian National Institute of Statistics and Informatics (Instituto Nacional de Estadística e Informática). Some data is also based on our estimates, which are derived from our review of internal reports, as well as independent sources.
Volume information
All tonnage information in this report is expressed in metric tonnes, unless stated otherwise, and all references to ounces are to troy ounces, in each case, unless otherwise specified.
| 5 |
| Risk Factors |
Risk factors
Nexa and its operations are exposed to several inherent risks and uncertainties, including those described below. The risks described below are not the only ones that we face. Additional risks that we do not presently consider material, or SMV) initiateof which we are not currently aware, may also affect us. Our business, results of operations, financial condition and cash flows could be materially and adversely affected if any of these risks materialize. You should carefully consider these risks with respect to an investment in Nexa. This section is divided in two sub-sections: the “Risk Factors Summary”, which provides a brief summary of our Risk Factors and “Detailed Risk Factors,” providing detailed information in relation to each Risk Factor identified.
Risk Factors Summary
The following summarizes the main risks to which we are subject. You should carefully consider all of the information discussed below in “Item 3—Key Information—Risk Factors—Detailed Risk Factors” in this annual report for a comprehensive description of these and other risks.
Business risks
| · | Our business is highly dependent on the international market prices of the metals we produce, which are both cyclical and volatile. |
| · | Changes in the demand for the metals we produce, including as a result of the cyclicality of global economic activity, could adversely affect our sales volume and revenues. |
| · | Adverse economic developments in China could have a negative impact on our revenues, cash flow and profitability. |
| · | The mining industry is highly competitive. |
Operational risks
| · | The mining business is subject to inherent risks, some of which are not insurable. |
| · | We may be materially adversely affected by challenges relating to slope and stability of underground openings. |
| · | Our projects are subject to operational risks that may result in increased costs or delays that prevent their successful implementation. |
| · | We may be adversely affected by the failure or unavailability of adequate infrastructure and skilled labor. |
| · | The failure of a tailings dam could negatively impact our business, reputation and results of operations, and the implementation of associated regulations and decommissioning processes may be expensive. |
| · | A disruption in zinc concentrate supply could have a material adverse effect on our production levels and financial results. |
| · | Inadequate supply of zinc secondary feed materials and zinc calcine could affect the results of our smelters. |
| · | Interruptions of energy supply or increases in energy costs may materially adversely affect our operations. |
| · | Shortages of water supply due to permitting, licensing, and other governmental regulations, explosives, critical spare parts, maintenance service and new equipment and machinery may materially adversely affect our operations and development projects. |
| · | There are unique risks inherent to the development of underground mines, which may have a material adverse impact on our cash flows. |
| · | We may be adversely affected by labor disputes, may be liable for certain payments to individuals employed by third-party contractors and may be subject to misconduct by our employees or third-party contractors. |
| · | The nature of our business includes risks related to litigation and administrative proceedings that could materially adversely affect our business and financial performance in the event of unfavorable rulings. |
Financial risks
| · | Our financial position and results of operations may be materially adversely affected by currency exchange rate fluctuations. |
| · | Fluctuations in interest rates could increase the cost of servicing our debt, affect returns on our financial investments and negatively affect our overall financial performance. |
| 6 |
| Risk Factors |
| · | We may engage in hedging activity that may not be successful and may result in losses to us. |
| · | Our business requires substantial capital expenditures and is subject to financing risks. |
| · | We are exposed to credit risk in relation to our contractual and trading counterparties as well as to hedging and derivative counterparty risk, and our results of operations may be negatively impacted by increases in expected credit losses. |
| · | Any acquisitions or divestitures we make may not be successful or achieve the expected benefits. |
| · | Changes in the assumptions underlying the carrying amount of certain assets could result in impairment charges. |
| · | We might not be able to pay the principal and interest amounts on our debt obligations in case they are accelerated as a result of the noncompliance with the restrictive covenants and clauses of our debt contracts. |
Risks related to our Mineral Reserves and Resources
| · | Our estimates of Mineral Reserves and Resources may be materially different from the total mineral quantities we actually recover, and changes in metal prices, operating and capital costs, and other assumptions used to calculate these estimates may render certain Mineral Reserves and Resources uneconomical to mine. |
| · | We depend on our ability to replenish our Mineral Reserves for our long-term viability. |
| · | Our mineral exploration efforts are highly speculative in nature and may be unsuccessful. |
Health, safety and environmental risks
| · | Health, safety and environmental laws and regulations, including regulations pertaining to climate change, may increase our costs of doing business, restrict our operations or result in the imposition of fines or revocation of permits. |
| · | ESG issues, including those related to climate change and sustainability, may have an adverse effect on our business, financial condition, and results of operations, could damage our reputation, and may increase costs. |
| · | Failure to meet environmental, social, and governance expectations or standards or achieve the Company’s environmental and social related goals could adversely affect its business, reputation, brand, results of operations, and/or financial condition. |
| · | Natural disasters and climate change could affect our business. |
| · | Global or regional health considerations, including the outbreak of a pandemic or contagious disease, such as the COVID-19 pandemic, have impacted and could continue to impact our business, financial condition and results of operations. |
Political, economic, social and regulatory risks
| · | Political, economic and social conditions in the countries in which we have operations or projects, or in which we do business, could adversely impact our business, financial condition results of operations and the trading price of our securities. |
| · | Recent and potential changes in commercial and mining laws, including trends like resource nationalism, may significantly impact our mining operations. |
| · | Our mineral rights may be terminated or not renewed by governmental authorities. |
| · | Our operations depend on our relations and agreements with local communities, and new projects require carrying out a prior consultation procedure. |
| · | Changes in tax laws, and any related tax agreements we have entered into or may enter into with local governments, may increase our tax burden and, as a result, could adversely affect our business, financial position and results of operations. |
| · | Our business, financial position and results of operations may be adversely affected by inflation. |
| · | We are subject to anti-corruption, anti-bribery and anti-money laundering laws and regulations in various jurisdictions. Any violations of any such laws or regulations could have a material adverse impact on our reputation and results of operations and financial position. |
| · | Political and social opposition to mining activities generally in the regions we operate could adversely impact our business and reputation. |
| 7 |
| Risk Factors |
| · | Differing interpretations of agency regulations or court rulings and the application of such laws and regulations could result in unintended non-compliance and may have a material effect on our business, results of operations, and financial position. |
| · | Regulation of other activities |
Risks relating to our corporate structure
| · | VSA has substantial control over us, which could limit our shareholders’ ability to influence the outcome of important corporate decisions. |
| · | Dividends or other distributions paid by us on our common shares will generally be subject to Luxembourg withholding tax. |
| · | The rights of our shareholders, and the responsibilities of VSA as our controlling shareholder, are governed by Luxembourg law and differ in some respects from the rights and responsibilities of shareholders under the laws of other jurisdictions, including the United States and Canada, and shareholders may have more difficulty protecting their interests than they would as shareholders of a U.S. corporation. |
| · | Our ability to pay dividends or other distributions and repurchase shares is subject to several factors and conditions. |
| · | It could be difficult for investors to enforce any judgment obtained outside Luxembourg against us or any of our associates. |
Detailed Risk Factors
Nexa and its operations are exposed to several inherent risks and uncertainties, including those described below.
Business risks
Our business is highly dependent on the international market prices of the metals we produce, which are both cyclical and volatile.
Our business and financial performance is significantly affected by market prices of the metals we produce, particularly the market prices of zinc, copper, silver, lead and, to a lesser extent, gold. Historically, prices of such metals have been subject to wide fluctuations and are affected by numerous factors beyond our control, including international economic and political conditions, the cyclicality of consumption, actual or perceived changes in levels of supply and demand, the availability and costs of substitutes, inventory levels maintained by users, actions of participants in the commodities markets and currency exchange rates. We cannot predict whether, and to what extent, metal prices will rise or fall in the future.
In 2023, international prices decreased for zinc, copper and lead, and increased for silver and gold as compared to their respective 2022 averages. Overall, there continued to be downward pressure on international market prices for the base metals we produce, mainly driven by the persistence of negative external factors including inflation and high interest rates, residual economic impacts on key sectors of the Chinese economy, especially civil construction and real estate market, and ongoing variable global macroeconomic conditions relating to conflicts between Russia and Ukraine and the Israel-Hamas conflict.
Mine supply also contributed to the volatility of zinc prices in 2023. The sharp drop in prices from the first to the second quarter, combined with higher levels of production costs around the world, caused a series of zinc mine closures during 2023, as some assets were operating on negative margins. None of Nexa’s mines closed or reduced production in 2023 because of the drop in prices. However, these other mine closures caused zinc prices to slightly rise, especially at the end of 2023, as well as caused the Chinese spot treatment charges to significantly drop throughout the year compared to the 2022 average. There are still assets that may have negative margins at current zinc prices, so further closures of other mines around the globe remains a possibility in 2024.
The ongoing conflict between Russia and Ukraine, and retaliatory measures by the global community have created global security concerns, including the possibility of expanded regional or global conflict, which have had, and may continue to have, adverse impacts around the globe. The fluctuating value of the US dollar, resulting in part from global conflicts, also directly impacts commodities prices.
| 8 |
| Risk Factors |
Also, on October 7, 2023, Hamas, a terrorist group in control of Gaza, carried out a surprise attack on Israeli cities and towns near the Gaza strip. Following this terrorist attack, Israel declared war on Hamas and other terrorist organizations in Gaza. The military conflict is ongoing, and its length and outcome are highly unpredictable. Further escalation of this conflict could lead to significant disruptions, which could have a material adverse effect on our business, financial position, results of operations and cash flows.
Continued ramifications of these global conflicts include disruption of the supply chain, which has led, and may continue to lead, to impacts on production, investment, and demand and prices for our products; higher and more volatile prices for commodities, including oil and gas; disruption of global financial markets, and further exacerbation of overall macroeconomic trends, including high inflation and rising interest rates. For more information see “Operating and Financial Review and Prospects—Overview”. As of the date of this report, the conflicts between Russia and Ukraine and in the Middle East have had no material impact on our business and operations. However, the conflicts are still ongoing, and we cannot predict the future impact they may have. We continue to monitor developments related to these conflicts as of the day of this report.
Future declines in metal prices, especially with respect to zinc, copper, silver and lead prices, could have an adverse impact on our results of operations and financial position, and we might consider curtailing or modifying certain operations, selling certain operations or not proceeding with our sustaining and/or growth strategy. In addition, we may not be able to adjust production volume in a timely or cost-efficient manner in response to changes in metal prices. Lower utilization of capacity during periods of weak prices may expose us to higher unit production costs since a significant portion of our cost structure is fixed in the short-term due to the high capital intensity of mining operations. Conversely, during periods of high prices, our ability to rapidly increase production capacity may be limited, which could prevent us from selling more products. Moreover, we may be unable to complete expansions and greenfield projects in time to take advantage of rising prices for zinc, copper, lead or other products.
Changes in the demand for the metals we produce, including as a result of the cyclicality of global economic activity, could adversely affect our sales volume and revenues.
Our revenues depend on the volume of metals we sell (and, to a lesser extent, the volume of metals produced by others that are smelted in our facilities), which in turn depend on the level of industrial and consumer demand for these metals. An increase in the production of zinc, copper, silver and lead worldwide, along with reduction in demand for these metals, due to changes in technology, industrial processes or consumer habits, including increased demand for substitute materials, economic slow-downs or other factors, may have the potential to impact these metal prices. In 2023, international prices decreased for zinc, copper and lead, and increased for silver and gold as compared to their respective 2022 averages. The impact of price decreases may also compromise the profitability of smelters, as we might consider reducing the volume of metals we sell and therefore materially adversely impact our operational results and financial position. Even if our volumes are not affected by reduced prices, this decrease can impact our revenues.
The mining industry has historically been highly volatile largely due to the cyclical nature of industrial production, which affects the demand for minerals and metals. Demand for minerals and metals thus generally correlates to macroeconomic fluctuations in the global economy. Changes in the demand for the metals we produce could adversely affect our sales volume and revenues.
Adverse economic developments in China could have a negative impact on our revenues, cash flow and profitability.
China has been the primary source of global demand for commodities over the last few years. According to Wood Mackenzie, in 2023, Chinese demand represented 51% of global demand for refined zinc and 56% of global demand for refined copper. Any slowdown in China’s economic growth that is not offset by increased demand or reduced supply from other regions could have an adverse effect on demand for our products or commodity prices and result in lower revenues, cash flow and profitability.
| 9 |
| Risk Factors |
The mining industry is highly competitive.
We face competition from other mining, processing, trading and industrial companies in Brazil, Peru and around the world. Competition principally involves the following factors: sales, supply and labor prices; contractual terms and conditions; attracting and retaining qualified personnel; and securing the services, supplies and technologies we need for our operations. Slower development in technology and innovation could impact costs, productivity and competitiveness. In addition, mines have limited lives and, as a result, we must seek to replace and expand our mineral reserves by acquiring new properties. Significant competition exists to acquire mining concessions, land and related assets. We cannot assure shareholders that competition will not adversely affect us in the future.
The international trade environment faces increasing uncertainty. Potential changes to international trade regulations and agreements, as well as other political and economic arrangements (including direct or indirect subsidies), may benefit competitors operating in countries other than where our mining operations are currently located. These changes could also adversely affect the prices we pay for the supplies we need and our export costs when we engage in international transactions. We cannot assure shareholders that we will be able to compete based on price or other factors with companies that in the future may benefit from favorable regulations, lower cost of capital, trading or other arrangements or that we will be able to maintain the cost of the supplies that we require as well as our export costs.
Operational risks
The mining business is subject to inherent risks, some of which are not insurable.
The business of mining zinc, copper, silver, lead and other minerals is generally subject to numerous risks and hazards. Hazards associated with underground mining operations include underground fires and explosions, including those caused by flammable gas, gas and coal outbursts, cave-ins or falls of ground, rock falls, openings collapse, lack of oxygen, air pollution, tailings dam failures or other discharges of tailings, hazardous substances and materials, gases and toxic chemicals, water ingress and flooding, sinkhole formation, ground subsidence, and other accidents and conditions resulting from underground mining activities, such as drilling, blasting, removing and processing material. In addition, we may encounter geotechnical challenges as we continue with and expand our mining activities, including the possibility of failure of underground openings.
Such occurrences could result in damage to, or destruction of, our properties or production facilities, third-party property, human exposure to pollution, personal injury or death, environmental and natural resource damage or contamination, delays in mining, monetary losses and legal liability. In addition, any such occurrences could adversely affect our reputation. Damages to our reputation could result in additional environmental and health and safety legal oversight, and authorities could impose more stringent conditions in connection with the licensing process of our projects and operations. In addition, our customers may be less willing to buy metals from us if we have been subject to significant adverse publicity. We maintain insurance typical in the mining industry, and in amounts that we believe to be adequate, but which may not provide complete coverage in certain circumstances. Insurance against certain risks (including certain liabilities for environmental contamination, tailings dam failures and other hazards as a result of exploration, production or extreme weather) may not be generally available or is uneconomical to afford. If we incur significant liability for which we are not fully insured, we may not be able to finance the uninsured liability amount on acceptable terms to us or at all, and we could be required to divert a significant portion of our cash flow from normal business operations. This could have a material impact on our financial position.
We could also incur additional expenses due to failures in our industrial drainage system or other environmental control equipment. Any such failures could also have adverse impacts on the environment, which could lead to adverse climate changes and further impact our reputation if we are found to contribute, or there is a perception that we have contributed, to adverse environmental impacts in the areas in which we operate.
| 10 |
| Risk Factors |
We may be materially adversely affected by challenges relating to slope and stability of underground openings.
Our underground mines get deeper, and our waste and tailings deposits increase in size as we continue with and expand our mining activities. This presents certain geotechnical challenges, including the possibility of failure of underground openings. If we are required to further reinforce such openings or take additional actions to prevent such a failure, we could incur additional costs and expenses, and our operations and stated mineral reserves could be negatively affected. We have taken actions we consider appropriate to maintain the stability of underground openings, but additional actions may be required in the future. Unexpected failures or additional requirements to prevent such failures may materially adversely affect our costs and expose us to health, safety and other liabilities in the event of an accident, as well as adversely impact our reputation. These developments may in turn materially adversely affect the results of our operations and financial position, as well as potentially diminish our stated mineral reserves.
Our projects are subject to operational risks that may result in increased costs or delays that prevent their successful implementation.
We invest in sustaining and increasing our mine and metal production capacity and developing new operations. Our projects are subject to several risks that may materially adversely affect our growth prospects and profitability, including the following:
| · | we may encounter delays or higher than expected costs in completing technical and engineering studies and obtaining the necessary equipment, machinery, materials, supplies, labor or services, in project execution by third-party contractors and in implementing new technologies to develop and operate a project; |
| · | we may experience delays in commencing and/or ramping up the operations of a new project or the expansion of an existing operation to its design capacity; |
| · | our efforts to develop projects according to schedule may be hampered by a lack of infrastructure, including a reliable power supply; |
| · | we may fail to obtain or renew, or experience delays or higher than expected costs in obtaining or renewing, the required agreements, authorizations, licenses, approvals and permits to develop a project, including the prior consultation procedure and agreements with local communities; |
| · | changes in market conditions or regulations may make a project less profitable than expected at the time we initiated work on it; |
| · | accidents, natural disasters, labor disputes, equipment failures, water shortages, logistical issues, interruption of energy supply and increase in energy costs; |
| · | adverse mining conditions may delay and hamper our ability to produce the expected quantities and qualities of minerals upon which the project was budgeted; |
| · | mineral reserves and resources are estimates based on the interpretation of limited sampling data and test work that may not be representative of the deposits as a whole, or the technical and economic assumptions used in the estimates may prove to be materially different when the deposits are mined, that could result in materially different economic outcomes; and |
| · | conflicts with local communities, unions and/or strikes or other labor disputes may delay the implementation or the development of projects. |
We may be adversely affected by the failure or unavailability of adequate infrastructure and skilled labor.
Our mining, smelting, processing, development and exploration activities depend to a large degree on adequate infrastructure. The regions where certain of our current operations, projects and prospects are located are sparsely populated and difficult to access. We require reliable roads, bridges, power sources and water supplies to access and properly conduct our operations. As a result, the availability and cost of this infrastructure affects capital and operating costs and our ability to maintain expected levels of production and sales. We could also experience an increase in transit-related accidents due to the need to transport employees to remote areas. Unusual weather, such as excessive rains and flooding, or other natural phenomena, sabotage, government or external interference (including protest activities from local communities that may lead to temporary suspensions of our projects) in the maintenance or provision of such infrastructure could impact the development of a project, reduce mining volumes, increase mining or exploration costs or delay the transportation of raw materials to the mines and projects or concentrates to the customers. See “Risk factors—Health, safety and environmental risks—Natural disasters and climate change could affect our business.”
| 11 |
| Risk Factors |
In addition, the mining industry is labor intensive, and our success depends to a significant extent on our ability and our contractors’ ability to attract, hire, train and retain qualified employees, including our ability and our contractors’ ability to attract employees with the necessary skills in the regions in which we operate. We could experience increases in our recruiting and training costs and decreases in our operating efficiency, productivity and profit margins if we are unable to attract, hire and retain a sufficient number of skilled employees to support our operations.
The failure of a tailings dam could negatively impact our business, reputation and results of operations, and the implementation of associated regulations and decommissioning processes may be expensive.
Mining companies face inherent risks in their operations of tailings dams—structures built for the containment of the mining or industrial waste, known as tailings—that exposes us to certain risks. Our tailings dams include, in some cases, materials that could increase the hazard potential in the event of unexpected failure. If any such risks were to occur, this could lead to negative environmental effects and materially adversely affect our reputation and our ability to conduct our operations and could make us subject to liability and, as a result, have a material adverse effect on our business, financial position and results of operations.
In addition, the changes in regulation that occurred as a result of recent dam failures, like those that have occurred in Brazil, could increase the time and costs to build, operate, inspect, maintain and decommission tailings dams, obtain new licenses or renew existing licenses to build or expand tailings dams, or require the use of new technologies. Brazilian laws include a requirement for obtaining an environmental license for new dams or for the raising of existing dams. As part of the process, companies must present a proposal for an environmental bond with the purpose of guaranteeing the socio-environmental recovery in the event of an accident or the deactivation of the dam.
In December 2023, the State of Minas Gerais published State Decree No. 48,747/2023, regulating the environmental recovery policies that companies are required to delisthave in place in the event of an accident or deactivation of a dam, pursuant to a prior state law passed in 2019. Under State Decree No. 48,747/2023, any dams that meet the requirements established under the 2019 Dam Safety Policy law must have an environmental guarantee policy in place. Nexa estimates that it will require US$27.3 million to cover the applicable dams under this policy. The guarantee can be made by one of the following methods: (i) cash deposit; (ii) bank deposit certificate – (“CDB”); (iii) bank guarantee; or (iv) guarantee insurance. The Company has until March 29, 2024 to submit an environmental recovery proposal and must contract for 50% of the policy by December 31, 2024, 25% by December 31, 2025 and 25% by December 31, 2026. For more information on State Decree No. 48,747/2023 and its common sharesimpact on Nexa, see “Information on the Company—Mining operations—Tailings disposal” and Notes 27 and 32(b) of our consolidated financial statements.
The Company has been conducting engineering studies to confirm the construction method of old inactive industrial waste containment structures that have been closed for more than 20 years. None of them contain mining tailings, water or liquid waste. Based on results of the conceptual engineering studies, Nexa recognized a provision for dams obligations in the amount of US$7.0 million in its financial statements for the year ended December 31, 2023 and the Company may reserve additional amounts related to estimated costs of anticipated additional obligations in relation to these closed dams, which could have a material impact on the Company’s financial position.
| 12 |
| Risk Factors |
Certain regulations, such as those enacted by ANM between 2020 and 2023, may also impose more restrictive requirements that may exceed our current standards, including mandated compliance with emergency plans and increased insurance requirements and premiums, or require us to pay additional fees or royalties to operate tailings dams. We may also be required to facilitate the relocation of communities and facilities impacted by tailings dam failures. Moreover, insurance coverage for damages resulting from tailings dams’ failure may not be available. For more information see “Information on the Company—Mining operations—Tailings disposal.”
A disruption in zinc concentrate supply could have a material adverse effect on our production levels and financial results.
A portion of the zinc concentrate processed in our smelters is obtained from third parties, and we may be adversely affected if we are not able to source adequate supplies of zinc for such operations. In 2023, 49.6% of the zinc concentrate processed in our smelters was obtained from third parties, with the remainder supplied by our own mining operations. The availability and price of zinc concentrate used by our smelters may be negatively affected by several factors largely beyond our control, including interruptions in production in our mines or by our suppliers, decisions by suppliers to allocate supplies of concentrate to other purchasers, price fluctuations and increasing transport cost.
In addition, the efficiency of a smelter’s production over time is affected by the mix of the zinc concentrate qualities and grades it processes. In circumstances where we cannot source adequate supplies of the zinc concentrate qualities and grades that comprise the most efficient mix for our smelters, alternative types of concentrate may be available, but the use thereof may increase our costs of production or reduce the productivity of our smelters and adversely affect our business, results of operations and financial position.
Inadequate supply of zinc secondary feed materials and zinc calcine could affect the results of our smelters.
Zinc sourced from suppliers of secondary feed materials represented approximately 16.5% of the zinc content used by our Juiz de Fora smelter in 2023. The use of zinc secondary feed material is a competitive advantage in relation to the use of zinc concentrate, mainly due to lower acquisition costs and, to a lesser extent, operational gains. In addition, since 2021 we have incorporated zinc calcine processed by third parties into our operations to increase the production in our smelters. Our smelters then use this zinc calcine processed by third parties to produce additional refined zinc products that they would not produce were they to rely solely on other inputs. To the extent we are unable to obtain adequate supplies of zinc secondary feeds or zinc calcine, or if we must pay higher than anticipated prices of these inputs, our business, results of operations and financial position may be adversely affected. In 2021, our calcine supplier in Peru shut down its facilities, impacting our smelter production. In 2021, 2022 and 2023, we were able to partially offset the reduction in calcine availability through the development and consumption of new sources of raw material, such as third party waelz oxide, however, we cannot assure shareholders that we will be able to have secure access to the raw materials required for our operations in the future. For more information, see “Information on the Company—Smelting Operations—Smelter sales.”
Interruptions of energy supply or increases in energy costs may materially adversely affect our operations.
Energy is an important component of our production costs. In Peru, we obtain almost all electric power for our operations from third parties through energy supply contracts. Although we are party to a long-term power purchase agreement with Electroperú S.A., we cannot ensure that we will have secure access to energy sources in Peru at the same prices and conditions in the event of any interruption or failure of our sources of energy, failures or congestion in any part of the Sistema Eléctrico Interconectado Nacional (“SEIN”), any failure to renew or extend our other existing energy supply contracts, or due to any regulatory changes that may impact energy rates. Between May and September 2023, there was an increase in spot prices, mainly explained by the lack of rain in central Peru, given the most energy consumption in the country comes from hydroelectric plants. In addition, the shutdown of certain Peruvian natural gas processing plants due to maintenance occurred in July 2023, led to increase in energy costs reaching US$180/MWh, which was the highest rate in fifteen years. This increase in energy prices in part resulted from inefficient energy generation in the SEIN, which currently lacks renewable energy projects (i.e., hydroelectric, wind and solar). These types of renewable projects are expected to lower the prices that energy generators are able to offer to large industrial users.
| 13 |
| Risk Factors |
In Brazil, we obtain electric power for our operations from hydroelectric plants grouped into several legal entities—which are directly or indirectly jointly owned by us, our controlling shareholder and its affiliates—pursuant to long-term power purchase agreements. In 2023, self-production plants represented 86.8% of energy supply, in terms of energy acquired via energy purchase and sale contracts. Furthermore, our energy costs under these agreements could increase in the event of differences in the hydrology forecast due to these hydroelectric plants share of the hydrological risk, in addition to payment of higher energy taxes. For more information, see “Information on the Company—Other operations—Power and energy supply.”
Prices and availability of energy resources for our operations may be subject to changes or curtailment due to, among other things, new laws or regulations, the imposition of new taxes or tariffs, supply interruptions, equipment damage, volatility and increase in worldwide price levels for energy and related components, market conditions and any inability to renew our existing supply contracts. Disruptions in energy supply or increases in costs of energy resources could increase our production costs and have a material adverse effect on our financial position and results of operations.
Shortages of water supply due to permitting, licensing, and other governmental regulations, explosives, critical spare parts, maintenance service and new equipment and machinery may materially adversely affect our operations and development projects.
Our mining and smelting operations require the use of significant quantities of water for extraction activities, processing and related auxiliary facilities. Water usage, including extraction, containment, and recycling requires appropriate permits, which are granted by regulatory authorities in Brazil and Peru. The available water supply may be adversely affected by shortages or changes in governmental regulations. We cannot assure shareholders that water will be available in sufficient quantities to meet our future production needs or will prove sufficient to meet our water supply needs. In addition, we cannot assure shareholders that we will maintain our existing licenses related to water rights, particularly if political changes lead to additional regulatory requirements or review of existing licenses. A reduction in our water supply could materially adversely affect our business, results of operations and financial position. In addition, if we are unable to obtain the necessary licenses with respect to water use, we may be prevented from pursuing some of our planned expansion projects.
In addition to water, our mining operations require intensive use of equipment and machinery as well as explosives. To be able to acquire and use explosives, we must first obtain the corresponding authorizations, which are granted by the relevant regulatory authorities in Brazil and Peru. A shortage in the supply of key spare parts, adequate maintenance service, new equipment and machinery to replace old ones and cover expansion requirements, or explosives, including due to the inability to deliver such water, energy, supplies, critical spare parts, explosives, or equipment and machinery to our operations, or regulatory change impacting our ability to obtain authorization for the acquisition of such materials, could materially adversely affect our operations and development projects.
There are unique risks inherent to the development of underground mines, which may have a material adverse impact on our cash flows.
The development of underground mines is subject to other unique risks including, but not limited to, underground floods, issues relating to ventilating harmful gases, fall-of-ground accidents, and seismic activity resulting from unexpected or difficult geological conditions. While we anticipate taking all measures to safely operate, there is no assurance that the effect of these risks will not cause schedule delays, revised mine plans, injuries to persons and property, and/or increased capital costs, any of which may have a material adverse impact on our cash flows.
We may be adversely affected by labor disputes.
Mining is a labor-intensive industry. We depend on more than 14,000 workers, including employees and contractors, to carry out our operations. A portion of our employees are unionized. We cannot assure that we will not experience work slowdowns, work stoppages, strikes or other labor disputes in the future, particularly in the context of the annual renegotiation of our collective bargaining agreements.
| 14 |
| Risk Factors |
We may also be affected by labor-related disputes that broadly develop in the countries in which we operate. Strikes and other labor disruptions at any of our operations could have a material adverse effect on our business, financial position and results of operations.
We may be liable for certain payments to individuals employed by third-party contractors.
Under Peruvian law, we may become responsible under certain circumstances to pay mandatory labor benefits or other obligations to personnel employed by our third-party contracts or sub-contractors. Although we believe that we are in substantial compliance with Peruvian labor laws, we cannot assure shareholders that any proceedings initiated by outsourced employees will be resolved in our favor and that we will not be liable for any mandatory labor benefits or for-profit sharing benefits. In the beginning of 2022, a new law was published in Peru prohibiting companies from outsourcing core operational activities. More than 70% of our Peruvian workforce is employed by third party contractors. In July 2023, the law was deemed to be unconstitutional because it was determined to be an unenforceable bureaucratic barrier by the National Institute for the Defense of Competition and the Protection of Intellectual Property (“INDECOPI”), and therefore is not expected to have any material impact on Nexa. In addition, a lawsuit was initiated by Nexa which is seeking to declare the unconstitutionality of the aforementioned law. However, any future laws or regulations that would make Nexa responsible under Peruvian law for paying mandatory labor benefits or for-profit sharing benefits for individuals employed by third-party contractors could have an adverse impact on our business, financial position and results of operations. For more information, see “Information on the Company—Regulatory matters—Peruvian regulatory framework—Regulation of other activities.”
Under Brazilian law, outsourcing is also permitted if certain requirements are met. In addition, Brazilian law provides that the contractor will be held liable on a secondary basis if the outsourced or subcontracted companies do not fulfill their labor obligations. In cases where the outsourced or subcontracted companies do not pay the workers the labor sums they are entitled to, the contractor is responsible for those payments. These payments may have an adverse effect on our results of operation and financial position.
We may be subject to misconduct by our employees or third-party contractors.
We may be subject to misconduct by our employees or third-party contractors, such as theft, bribery, sabotage, fraud, insider trading, violation of laws, slander or other illegal actions. Any such misconduct may lead to fines or other penalties, slow-downs in production, increased costs, lost revenues, increased liabilities to third parties, impairment of assets or harmed reputation, any of which may have a material adverse effect on our business, results of operations or financial position.
The nature of our business includes risks related to litigation and administrative proceedings that could materially adversely affect our business and financial performance in the event of unfavorable rulings.
The nature of our business exposes us to various litigation matters, including civil liability claims, environmental matters, health and safety matters, regulatory and administrative proceedings, governmental investigations, tort claims, contract disputes, labor matters and tax matters, among others. We cannot assure shareholders that these or other legal proceedings will not have a material adverse effect on our ability to conduct our business or on our financial position and results of operations, through distraction of our management team, diversion of resources or otherwise. In addition, although we establish provisions as we deem necessary in accordance with IFRS Accounting Standards, the level of provisions that we record could vary significantly from any amounts we actually pay, due to the inherent uncertainties in the estimation process.
Any tax-related investigations carried out by state or local governments may result in a material impact on our business, results of operations and financial condition.
In 2023, Nexa cooperated with the investigation carried out by the Fiscal Office of the State of Minas Gerais and the Public Ministry of Minas Gerais (the “MG Authorities”) of the practices of certain of our former customers with respect to commercial and value added tax (“VAT”), as well as our relationship with such former customers, that could result in liabilities for all parties involved in the commercial relationship. In the third quarter of 2023 and the first quarter of 2024, Nexa and the MG Authorities reached a resolution pursuant to which Nexa, without admitting primary responsibility for the resolved claims, agreed to make certain tax payments, including interest and penalties, to the State of Minas Gerais on behalf of certain former customers that allegedly failed to properly comply with their tax obligations. This resolution concluded the MG Authorities' investigation with respect to the Company, and the Company does not expect any further developments or provisions with respect to these matters. For more information about this investigation and its resolution, see “Additional Information—Legal Proceedings—Other legal proceedings.” For information on the financial effects of the resolution, see Note 9(iv) to our consolidated financial statements. The effects of any future tax-related investigations may have a material impact on our business and financial condition.
| 15 |
| Risk Factors |
We could be harmed by a failure or interruption of our information technology systems or automated machinery, including system security breaches or other cybersecurity attacks, and we may expend significant resources to modify and improve our cybersecurity measures.
We rely on internal and external information technology systems and automated machinery to effectively manage our production processes and operate our business. Any failure of our or third parties’ information technology systems and automated machinery to perform as we anticipate could disrupt our business and result in production errors, processing inefficiencies and the loss of sales and customers, which in turn could result in decreased revenue, increased overhead costs and excess or out-of-stock inventory levels resulting in a material adverse effect on our business results.
In recent years, there has been an increase in the number of cyberattacks in industrial and corporate environments. The tactics and techniques used by cybercriminals to gain access to and exploit sensitive information by breaching mission critical systems of large organizations have evolved in sophistication. We are dependent on internal information systems, and we are vulnerable to failure of these systems, including through system security breaches, data protection breaches or other cybersecurity attacks. We may be exposed to cyberattacks stemming from unauthorized access to our internal systems, vulnerabilities in critical systems, malware, espionage and sabotage. If these events occur, including a cyberattack causing a loss of critical data, unscheduled downtime/degradation of operations, or the disclosure or use of confidential information, these events could have a material adverse effect on our reputation and market value, which could adversely impact our results of operations. Additionally, we may incur additional costs and expend significant resources in continuing to modify and improve cybersecurity measures and investigate and remediate any weaknesses in our information technology systems.
In addition, privacy, data protection and cybersecurity are subject to frequently changing rules and regulations. The European Union’s General Data Protection Regulation (“GDPR”) took effect in 2018 and introduced increased regulations relating to personal data security. The GDPR requires companies to satisfy new requirements regarding the handling of personal and sensitive data, including its use, protection and the ability of persons whose data is stored to correct or delete such data about themselves. In 2011, Peru enacted the Law for Personal Data Protection No. 29,733, the Ley de Protección de Datos Personales (“LPDP”) and in 2018, the Brazilian president signed Law No. 13,709, the Lei Geral de Proteção de Dados (“LGPD”). Both the LGPD and LPDP represent comprehensive data protection laws, establishing detailed rules for the collection, use, processing and storage of personal data and affecting all economic sectors, including the relationship between customers and suppliers of goods and services, employees and employers and other relationships in which personal data is collected, whether in a digital or physical environment.
In July 2023, the SEC adopted new cybersecurity disclosure rules for public companies that require disclosure regarding cybersecurity risk management (including the corporate board’s role in overseeing cybersecurity risks, management’s role and expertise in assessing and managing cybersecurity risks, and processes for assessing, identifying and managing cybersecurity risks) in annual reports. These new cybersecurity disclosure rules also require the disclosure of material cybersecurity incidents in a Form 6-K promptly after the incident is disclosed or otherwise publicized in a foreign jurisdiction, any stock exchange, or to security holders. Such scrutiny from the Lima Stock ExchangeSEC increases the risk of investigations into the cybersecurity practices, and related disclosures, of companies within its investment shares fromjurisdiction, which at a minimum can result in an increase in administrative costs, distraction of management and diversion of resources for targeted businesses. Any noncompliance with the Peruvian Public RegistryGDPR, the LGPD, the LPDP, the SEC cybersecurity rules, or any other privacy, data protection and cybersecurity regulations could result in proceedings or actions against us by governmental entities, the imposition of Securitiesfines or penalties and damage to our reputation, which could have an adverse effect on us and our business, reputation and results of operations.
| 16 |
| Risk Factors |
Financial risks
Our financial position and results of operations may be materially adversely affected by currency exchange rate fluctuations.
Our revenues are primarily denominated in U.S. dollars, and certain portions of our operating costs, principally labor costs, are denominated in reais and soles. Accordingly, when inflation in Brazil and Peru increases without a corresponding devaluation of the Lima Stock Exchange,real or sol, our financial position, results of operations and cash flows could be materially adversely affected. See “Operating and Financial Review and Prospects—Key factors affecting our business and results of operations—Macroeconomic conditions of the countries and regions where we operate” for which Nexa Peru had to launch a cash tender offer for each typediscussion of share as an initial step to completeinflation in 2023.
Given the delisting processes. Pursuant to applicable regulation, the SMV designated an independent appraiser to determine the minimum price at which the tender offer had to be launched. However, because the appraisal released by the independent valuator containedstructure of our operations, a material errordecrease in the calculationvalue of such minimum price for the sharesU.S. dollar relative to the foreign currencies in which we incur costs generally could have a negative impact on our results of Nexa Peru, Nexa Peru electedoperations or financial position. Our foreign currency exposures increase the risk of volatility in our financial position, results of operations and cash flows. We cannot assure shareholders that currency fluctuations, or costs associated with our hedging activities (including fluctuations in exchange rates contrary to terminateour expectations), will not have an impact on our financial position and results of operations.
Fluctuations in interest rates could increase the processcost of delisting its shares fromservicing our debt, affect returns on our financial investments and negatively affect our overall financial performance.
Some of our indebtedness bears interest based on variable interest rates, including the Lima Stock Exchange and therefore did not launch the tender offer.Secured Overnight Financing Rate, or SOFR. As of December 31, 2023, 29.7% of our debt was variable rate debt. Such variable rates have fluctuated in response to changes in economic growth, monetary policy and governmental regulation. A significant increase in underlying interest rates, particularly in SOFR, could have a material adverse effect on our financial expenses and materially adversely affect our overall financial performance. In July 2017, Nexa Peru’s common and investment sharesthe Financial Conduct Authority (“FCA”) announced its intention to phase out LIBOR by the end of 2021. However, on March 5, 2021, the FCA announced that most tenors of U.S. Dollar LIBOR would continue to be listedpublished through June 30, 2023, extending the previously announced deadline of December 2021. For more information, see “Operating and Financial Review and Prospects—Liquidity and Capital Resources—Debt”.
We may engage in hedging activity that may not be successful and may result in losses to us.
We may use foreign exchange and metal commodity non-deliverable forwards to reduce the risk associated with currency and metal price volatility. However, our hedging activities could cause us to lose the benefit of an increase in the prices of the metals we produce if they increase over the price level of hedge positions, or the benefit of an increase in the currency price. The cash flows and the mark-to-market values of our production hedges can be affected by factors such as the volatility of currency and the market price of metals, which are not under our control.
Our hedging agreements contain events of default and termination events that could lead to early close-outs of our hedges such as failure to pay, breach of the agreement, misrepresentation, default under our loans or other hedging agreements and bankruptcy. In the event of an early termination of our hedging agreements, the relevant hedge positions would be required to be settled at that time. In that event, there could be a lump sum payment to be made either to or by us. The magnitude and direction of such a payment would depend upon, among other things, the characteristics of the particular hedge instruments that were terminated and the relevant market prices at the time of termination. Any of the factors described above could have a material adverse effect on our financial position, results of operations or cash flows. See “Operating and financial review and prospects—Risk management—Financial risk—Metal price sensitivity.”
| 17 |
| Risk Factors |
Our business requires substantial capital expenditures and is subject to financing risks.
Our business is capital intensive. Exploration for and exploitation of mineral deposits, maintenance of machinery and equipment and compliance with applicable laws and regulations require substantial capital expenditures. We must continue to invest capital to maintain and potentially expand our existing brownfield operations, develop our greenfield projects pipeline in order to sustain and grow production, in addition to carrying out investments in sustaining, health, safety and environment. In 2023, we invested US$309.0 million in capital expenditures, US$292.8 million of which was in relation to sustaining investments. We depend partially on our operating cash flows to support our capital expenditures. See “Information on the LimaCompany—Capital expenditures.”
No assurance can be given that we will be able to maintain our production levels or generate sufficient cash flow, or have access to sufficient investments, loans or other financing alternatives to finance our capital and other projects expenditure program at a level necessary to sustain and grow our current exploration and exploitation activities. Any equity or debt financing, if available, may not be on terms that are favorable to us. If our access to external financing is limited, we may not be able to execute our strategy, which could adversely affect our business, financial position and results of operations.
We are exposed to credit risk in relation to our contractual and trading counterparties as well as to hedging and derivative counterparty risk, and our results of operations may be negatively impacted by increases in expected credit losses.
We are subject to the risk that the counterparties with whom we conduct our business (in particular our customers) and who are required to make payments to us are unable to make such payment in a timely manner or at all. Credit risk is present in our hedging operations, customer operations and cash management operations. If amounts that are due to us are not paid or not paid in a timely manner, this may impact not only our current trading and cash-flow position but also our financial and business position. In addition, our derivatives, metals hedging, and foreign currency and energy risk management activities expose us to the risk of default by the counterparties to such arrangements. Any such default could have a material adverse effect on our business, financial position and results of operations.
We hold a significant balance of accounts receivable and, therefore, provide an allowance to cover the portion of this amount that may not be received due to customer default. We record expected credit losses at an amount considered sufficient to cover estimated losses in the realization of receivables, taking into account our historical losses and internal risk classification of our customers, although we cannot guarantee that these amounts are sufficient to cover any losses. Additionally, delays in payment cycles from significant customers may adversely affect our liquidity and our ability to obtain financing for working capital, such as receivables sales.
Any acquisitions or divestitures we make may not be successful or achieve the expected benefits.
We regularly consider and evaluate opportunities to acquire assets, companies and operations, as well as constantly review our portfolio of projects and assets in operation. There can be no assurance that we will be able to successfully integrate any acquired assets, companies or operations, nor guarantee success in connection with any divestment or sale of an operational or non-operational project or asset. In addition, any additional debt we incur to finance an acquisition may materially adversely affect our financial position and results of operations. If future acquisitions are significant, they could change the scale of our business and expose us to new geographic, political, operating and financial risks. Similarly, any divestitures we make may not have the anticipated positive impacts and could lead to an impairment charge or other material adverse effects on our business, financial position, and results of operations.
Changes in the assumptions underlying the carrying amount of certain assets could result in impairment charges.
We periodically test whether our tangible and intangible assets have suffered any impairment, in accordance with the accounting policy stated in our consolidated financial statements. If our estimates of the recoverable amount of an asset change or are inaccurate, we may determine that impairment charges are necessary. While impairment does not affect reported cash flows, the decrease in the recoverable amount determined could have a material adverse effect on our results of operations. Assurances cannot be given as to the absence of significant impairment charges in future periods, particularly if market conditions deteriorate.
| 18 |
| Risk Factors |
We might not be able to pay the principal and interest amounts on our debt obligations in case they are accelerated as a result of the noncompliance with the restrictive covenants and clauses of our debt contracts.
Any default on the contracts governing our debts that is not remedied or waived by loan creditors or noteholders could result in the acceleration of the obligation to pay outstanding amounts owed to holders of such debts. If we are unable to generate sufficient cash flow from our operations and, therefore, unable to obtain the necessary resources to make the principal and interest payments on our debts as a result of such acceleration, our business, financial position and results of operations could be materially and adversely affected. For more information on restrictive covenants in our debt contracts, see “Operating and financial review and prospects—Liquidity and Capital Resources—Debt.”
Risks related to our Mineral Reserves and Resources
Our estimates of Mineral Reserves and Resources may be materially different from the total mineral quantities we actually recover, and changes in metal prices, operating and capital costs, and other assumptions used to calculate these estimates may render certain Mineral Reserves and Resources uneconomical to mine.
There is a degree of uncertainty attributable to the estimation of Mineral Reserves and Resources. Until Mineral Reserves and Resources are actually mined and processed, the quantity of metal and grades must be considered as estimates only and no assurance can be given that the indicated levels of metals will be produced. In making determinations about whether to advance any of our projects to development, we must rely upon estimated calculations for the Mineral Reserves and Mineral Resources and grades of mineralization on our properties.
The estimation of Mineral Reserves and Resources is a subjective process that is partially dependent upon the judgment of the Qualified Persons preparing such estimates. The process relies on the quantity and quality of available data and is based on knowledge, mining experience, statistical analysis of drilling results and industry practices. Valid estimates made at a given time may significantly change when new information becomes available.
Our estimates of Mineral Reserves and Resources are based on geological interpretation and statistical inferences or assumptions drawn from drilling and sampling analysis made as of the date of such estimates. We periodically update our Mineral Reserves and Resources estimates based on the conclusions of the relevant Qualified Persons with respect to new data from exploratory and infill drilling, results from technical studies and the experience acquired during the operation of the mine and metallurgical processing, as well as changes to the assumptions used to calculate these estimates.
Several of the assumptions used to calculate these estimates, including the market prices of commodities and foreign exchange rates, operating and capital costs and mining and metallurgical recovery rates, among others, can greatly fluctuate, which may result in significant changes to our current estimates. These changes may also render some or all of our proven and probable Mineral Reserves and Measured and Indicated Mineral Resources uneconomic to exploit and may ultimately result in a reduction of Mineral Reserves and Resources.
In addition, Inferred Mineral Resources have a massive amount of uncertainty as to their existence and their economic and legal feasibility. You should not assume that any part of an Inferred Mineral Resource will be upgraded to a higher category or that any of the Mineral Resources not already classified as Mineral Reserves will be reclassified as Mineral Reserves.
We depend on our ability to replenish our Mineral Reserves for our long-term viability.
Mineral Reserves data is only indicative of future results of operations at the time the estimates are prepared and are depleted over time as we conduct our mining operations. We use several strategies to replenish and increase our Mineral Reserves that are depleted, including exploration activities and the acquisition of mining concessions. If we are unable to replenish our Mineral Reserves or develop our Mineral Resources, our business, results of operations and prospects would be materially adversely affected.
| 19 |
| Risk Factors |
Our mineral exploration efforts are highly speculative in nature and may be unsuccessful.
Mineral exploration is highly speculative in nature, involves many uncertainties and risks and may be unsuccessful. It is performed to demonstrate the dimensions, position and mineral characteristics of mineral deposits, estimate Mineral Reserves and Resources, assess amenability of the deposit to mining and processing scenarios and estimate potential deposit value.
Substantial expenditures are required to establish proven and probable Mineral Reserves, to determine processes to extract the metals and, if required, to construct mining and processing facilities and obtain permits to carry on mining activities. Therefore, once the mineralization is discovered, it may take several years from the initial exploration phases and Mineral Resources determination before production is possible, if at all, during which time the project’s feasibility may change adversely.
Health, safety and environmental risks
Health, safety and environmental laws and regulations, including regulations pertaining to climate change, may increase our costs of doing business, restrict our operations or result in the imposition of fines or revocation of permits.
Our mining activities are subject to Brazilian and Peruvian laws and regulations, including health, safety and environmental matters. In March 2022, the Securities and Exchange Commission (“SEC”) proposed a new set of rules regarding disclosure and reporting requirements related to climate change. We will continue to monitor developments related to the new rules, which were adopted by the SEC on March 6, 2024, and subsequently temporarily halted by an administrative stay granted by the Fifth Circuit U.S. Court of Appeals on March 15, 2024. In January 2023, the Directive (EU) 2022/2464 of the European Parliament and of the Council of 14 December 2022 (the “Directive”) entered into force. The Directive modernizes and strengthens the rules concerning certain social and environmental information that the Company has to report, ensuring that investors and other stakeholders can accurately assess the Company’s social and environmental impact. European Union Member States, including Luxembourg, have until July 2024 to adopt the provisions of the Directive into their national law, as resulting obligations will be applied on a staggered basis. The Company will be required to comply with the Directive obligations starting in 2026 with respect to the accounts for the fiscal year ending on December 31, 2025. Additional matters subject to legislation include, but are not limited to, transportation, mineral storage, water use and discharge, use of explosives, hazardous and other non-hazardous waste, and reclamation and remediation measures. Our operations are subject to periodic inspections and special inspections in certain circumstances by governmental authorities and consultation with local communities. In Peru, the Congress began a revision process of a law to prohibit economic activities in the headwaters of basins, which are currently considered vulnerable areas that require protection and mitigation measures. However, the revision process lost momentum and has shown no sign of progress to date. If adopted, this law could have a material impact on our business and projects in case any new projects were to occur in headwaters of basins. For more information about these Peruvian environmental regulations, see “Information on the Company—Regulatory matters—Peruvian regulatory framework—Environmental regulations”. Compliance with these laws and regulations and new or existing regulations that may be applicable to us in the future could increase our operating costs and adversely affect our financial results of operations and cash flows.
Regulatory and industry response to climate change or other controls on greenhouse gas emissions, including limits on emissions from the combustion of carbon-based fuels, controls on effluents and restrictions on the use of certain materials, could significantly increase our operating costs and affect our customers and suppliers. Ongoing international efforts to address greenhouse gas emissions consist of controlling activities that may increase the atmospheric concentration of greenhouse gases. International agreements, like the Paris Agreement, Kyoto Protocol and COP26, are in different stages of negotiation and implementation. The measures included in such agreements may result in an increase of costs related to the implementation of new controls aimed at reducing greenhouse gas emissions, the purchase of credits or licenses for atmospheric emissions and the monitoring and registration of greenhouse gas emissions generated by our operations. These measures could adversely affect our business, financial position and results of operations. In addition, the Brazilian government has initiatives to grant environmental licenses in connection with the license holder’s commitment to reducing greenhouse gases, especially in the state of Minas Gerais. As health, safety, and environmental regulations, requirements, best practices and industry standards are evolving and becoming stricter in Brazil, we may incur increased expenditures for compliance with these increasingly demanding requirements.
| 20 |
| Risk Factors |
Pursuant to applicable environmental regulations and laws, we could be found liable for all or substantially all the damages caused by mining activities at our current or former facilities or those of our predecessors at disposal sites. We could also be found liable for all incidental damages due to the exposure of individuals to hazardous substances or other environmental damage, all of which could significantly and negatively affect our reputation. We cannot assure shareholders that our costs of complying with current and future environmental and health and safety laws and regulations, including decommissioning and remediation requirements, and any liabilities arising from past or future releases of, or exposure to, hazardous substances will not materially adversely affect our business, financial position and results of operations.
ESG issues, including those related to climate change and sustainability, may have an adverse effect on our business, financial condition, and results of operations, could damage our reputation, and may increase costs.
There is an increasing focus from certain investors, customers, consumers, employees and other stakeholders concerning ESG matters. Additionally, public interest and legislative pressure related to public companies’ ESG practices continue to grow and change, and may continue to shift based on political conditions in the countries in which we operate and do business. If our ESG practices fail to meet regulatory requirements, our medium- and long-term ESG commitments, or investor, customer, consumer, employee or other stakeholders’ evolving expectations and standards for responsible corporate citizenship in areas including environmental stewardship, support for local communities, Board of directors and employee diversity, human capital management, employee health and safety practices, product quality, corporate governance and transparency, our reputation, brand and employee retention may be negatively impacted. Additionally, our customers and suppliers may be unwilling to continue to do business or partner with us.
Customers, consumers, investors and other stakeholders are increasingly focusing on environmental issues, including climate change, dams, energy and water use, and other sustainability concerns. Concern over climate change, in particular, may result in new or increased legal and regulatory requirements to reduce or mitigate impacts to the environment.
If we do not adapt to or comply with new regulations, or if we fail to comply with disclosure requirements and consequently fail to meet evolving regulatory, investor, industry or stakeholder expectations and concerns regarding ESG issues, investors may reconsider their capital investment in Nexa, and customers and consumers may choose to stop purchasing our products, which could have a material adverse effect on our reputation, business or financial condition.
In addition, our ESG practices and initiatives may result in increased operational costs, including monitoring and reporting costs, equipment costs, energy costs, and other costs to comply with our developing practices and initiatives. These additional costs could have a material impact on our business, results of operations and financial condition.
Failure to meet environmental, social, and governance expectations or standards or achieve the Company’s environmental and social related goals could adversely affect its business, reputation, brand, results of operations, and/or financial condition.
Nexa discloses information about its environmental, social and governance goals and initiatives in its annual sustainability report, other non-financial reports, information provided on its website, press statements, and other communications. This disclosure includes voluntary commitments made by the Company regarding greenhouse gas (GHG) emission reductions, water consumption, safety, and diversity.
| 21 |
| Risk Factors |
Execution and achievement of Nexa’s ESG and GHG goals within the currently estimated costs and expected timeline is subject to risks and uncertainties which include, but are not limited to, availability, development, and affordability of technology needed to keep our commitments; unplanned issues with design, operations, and technology; inability to obtain required permits or licenses; lack of necessary materials and parts; changing products to meet customer needs and their acceptance of environmentally sustainable supply chain solutions; shifts in public opinion and political leadership; our ability to follow new rules, taxes, orders, or regulations related to climate matters.
The Company maintains and will use its best efforts to continue to maintain standards aligned with stakeholder expectations for best practices, and comply with new environmental, social, and governance regulations and expectations, aiming to minimize potential harm to the Company’s reputation, minimize adverse impacts on its ability to attract and retain customers and talents, and minimize exposure to legal and regulatory proceedings.
Natural disasters and climate change could affect our business.
Natural disasters could significantly damage our mining and production facilities and infrastructure and may cause a contraction in sales to countries adversely affected due to, among other factors, power outages and the destruction of industrial facilities and infrastructure. In particular, the Central Andean region, where two of our mines are located, is prone to mudslides and earthquakes of varying magnitudes. Due to the El Niño weather phenomenon, Peru typically experiences extreme weather events that lead to flooding and mudslides, and which could adversely affect our operations. In the past, extreme flooding and mudslides in Peru have interrupted the supply of metal concentrates from our mines and the supply of zinc products to our plants. The physical impact of climate change on our business remains uncertain, but we are likely to experience changes in rainfall patterns, increased temperatures, water shortages, rising sea and river levels, lower water levels in rivers due to natural or operational conditions, increased storm frequency and intensity as a result of climate change, which may adversely affect our operations. For example, in March 2023 production at the Cerro Lindo mine was suspended for approximately two weeks due to unusually heavy rainfall levels and overflowing rivers caused by Cyclone Yaku, which affected the region, as well as other parts of the country. Operations resumed at full capacity in April 2023. For additional information, see “Information on the Company—Mining Operations—Cerro Lindo.” Although we have insurance covering damages caused by natural disasters, extensive damage to our facilities and staff casualties due to natural disasters may not be covered by our insurer and/or could materially adversely affect our ability to conduct our operations and, as a result, reduce our future operating results.
In addition, the potential physical impact of climate change on our operations is highly uncertain and would be particular to the geographic circumstances of our facilities and operations. It may include changes in rainfall patterns, water shortages, rising sea and river levels, changing storm patterns and intensities and changing temperatures. These effects may materially adversely impact the cost, production and financial performance of our operations.
Global or regional health considerations, including the outbreak of a pandemic or contagious disease, such as the COVID-19 pandemic, have impacted and could continue to impact our business, financial condition and results of operations.
The global economy has faced a number of challenges since the outbreak of the COVID-19 pandemic, including disruption to financial markets, rising inflation, and increased volatility due to market expectations for a global recession. The emergence of new variants of COVID-19, the outbreak of another contagious disease, or future pandemics and public crises could present risks to our operations (including the ability of employees to be physically present at work), employee health and safety, mandatory operational closures and general macroeconomic activity, including international market prices for the metals we produce, as well as have a severe impact to our business, customers, or supply chain. This impact could continue for an extended period of time or impact our financial condition and results of operations and continued weak or worsening economic conditions could negatively impact demand for our products.
| 22 |
| Risk Factors |
Political, economic, social and regulatory risks
Political, economic and social conditions in the countries in which we have operations or projects, or in which we do business, could adversely impact our business, financial condition results of operations and the trading price of our securities.
Political, economic and social conditions in the countries in which we have operations or projects, or in which we do business, may negatively affect our financial performance. Our business, financial position and results of operations may be affected by the general conditions of the Peruvian, Brazilian and other national political conditions, economies, economic recessions, price instability, exchange rate volatility, inflation, interest rates, and domestic regulatory and taxation policies. There can be no assurance that the countries in which we operate or do business will not face political, economic or social problems in the future or that these problems will not increase the volatility of the price of securities of issuers with operations in those countries, like us, or interfere with our ability to operate and service our indebtedness. For additional information, see “Operating and Financial Review and Prospects—Overview—Key factors affecting our business and results of operations.”
In all these countries, we are exposed to various additional risks over which we have no control, such as social unrest, bribery, cyberattacks, extortion, corruption, robbery, sabotage, kidnapping, civil strife, terrorism, acts of war and guerilla activities. These issues may adversely affect the economic and other conditions under which we operate in ways that could have a materially negative effect on our business.
Recent and potential changes in commercial and mining laws, including trends like resource nationalism, may significantly impact our mining operations.
Changes to the Brazilian and Peruvian regulatory framework that could be enacted in the future may result in an increase in our expenses, particularly mining royalties and tax-related expenses, among others. Any changes in the interpretation of Brazilian or Peruvian mining laws and regulations, including changes to our concession agreement and changes in commercial rules and protections, may increase our compliance, operational or other costs. In December 2022, a new tax on mining operations was approved in the state of Mato Grosso, where the Aripuanã project is located. The Brazilian Supreme Court declared the tax unconstitutional, however in December 2023, a new tax replacing the previous tax was approved by the state of Mato Grosso.
In addition, there is a risk that resource nationalism in Brazil or Peru may result in operational limitations, local content requirements, and even expropriations and nationalizations. For additional information, see “Information on the Company—Regulatory matters—Brazilian regulatory framework—Mining rights and regulation of mining activities.”
Our mineral rights may be terminated or not renewed by governmental authorities.
Our business is subject to extensive regulation in Brazil and Peru, including with respect to acquiring and renewing the required authorizations, permits, concessions and/or licenses from the relevant governmental regulatory bodies. We have obtained, or are in the process of obtaining, all material authorizations, permits, concessions and licenses required to conduct our mining and mining related operations.
In Brazil, we may need to renew exploration authorizations related to our Brazilian mining operations 60 days prior to their expiration date if we determine that we continue to have an economic or business interest in the area. If we fail to demonstrate the existence of technical and economically viable mineral deposits in an area covered by an exploration authorization, we may be required to return it to the federal government. The federal government may then grant exploration authorizations to other parties that may conduct other mineral prospecting activities at said area. With respect to mining concessions, there is no renewal requirement once we have obtained such concession. However, we must continue to assess the mineral potential of each mining concession to determine if the costs of maintaining the related exploration authorizations and mining concessions are justified by the results of operations to date. If such costs are not justified and we abandon the mine or suspend the mining activities without the formal consent of the regulatory authority for a period more than six months, we may lose the respective mining concessions. Alternatively, we may elect to withdraw or assign some of our exploration authorizations or mining concessions.
| 23 |
| Risk Factors |
In Peru, once mineral concessions are granted, they may not be revoked if the titleholder complies with two obligations, (1) payment of an annual fee and (2) either achievement of the minimum annual production target or expenditure of the equivalent amount in exploration or investments before the statutory deadline. If the production, expenditure or investment targets are not met, a statutory penalty must be paid. Accordingly, mineral concessions will lapse automatically if any of these obligations are not met within the statutory period. Mining concessions in Peru may be terminated if the concessionaire does not comply with its obligations.
These authorizations, permits, concessions and environmental licenses are subject to our compliance with conditions imposed and regulations promulgated by the relevant governmental authorities. While we anticipate that all required authorizations, permits, concessions and environmental licenses or their renewals will be granted as and when sought, there is no assurance that these items will be granted as a matter of course, and there is no assurance that new conditions will not be imposed in connection with such renewals. If we were to violate any of the foregoing laws and regulations or the conditions of our concessions, authorizations, and environmental licenses, including the failure to remove all residents who are within the self-rescue zone, we may be subjected to substantial fines or criminal sanctions, revocations of operating permits or licenses and possible closings of certain of our facilities.
Our operations depend on our relations and agreements with local communities, and new projects require carrying out a prior consultation procedure.
There are several local communities that surround our operations in Brazil and Peru, most of which we have entered into agreements with that provide for the use of their land for our operations. We also interact with regional and local governments and depend on our close relations with local communities and such governments to carry out our operations. From time to time, we may experience disputes with local communities and if our relations with the local communities and such governments were to deteriorate, or the local communities do not comply with the existing agreements or renew them upon expiration, it could have a material adverse effect on our business, reputation, properties, operating results, financial position or prospects. In addition, a disruption in the relations between the local communities, governments and other parties may affect us indirectly. For additional information, see “Mining Operations—Atacocha—Production.”
We also may face certain risks in relation to artisanal mining near the areas in which we operate. The increase of artisanal mining activity or the failure of these artisanal miners to abide with our existent agreement may have an adverse effect on the development of our operations. For example, see “Mining Operations—Aripuanã—History.”
Furthermore, to develop new projects in the countries in which we operate on land owned by, or in the possession of, third parties, we need to reach an agreement with such third parties to use that land. Any delay or failure to reach such agreements or obtain governmental approvals for our new projects could result in a material adverse effect on our business, properties, operating results, financial position or prospects.
Changes in tax laws, and any related tax agreements we have entered into or may enter into with local governments, may increase our tax burden and, as a result, could adversely affect our business, financial position and results of operations.
The Brazilian, Peruvian and Luxembourg governments from time to time implement changes to tax laws and regulations. Any such changes, as well as changes in the interpretation of such laws and regulations, or changes to former precedents on tax decisions by authorities or courts, may result in increases to our overall tax burden, which would negatively affect our profitability. Moreover, some tax laws may be subject to controversial interpretation by tax authorities, including, but not limited to, the regulation applicable to corporate restructurings. In the event an interpretation different than the one on which we based our transactions prevails, we may be adversely affected.
In addition, as a result of the VAT tax benefit adopted by Minas Gerais State on the commercialization of several products, including metallic zinc, there has been increased scrutiny by the tax authorities of companies incorporated in this State. For more information about the VAT tax benefit, see “Information on the Company—Regulatory Matters—Brazilian regulatory framework—Royalties and other taxes on mining activities.” See also “Additional Information—Legal Proceedings” for information about the investigation by the Fiscal Office of the State of Minas Gerais and the Public Ministry of Minas Gerais relating to the VAT-related practices of certain of Nexa’s former customers, as well as Nexa’s relationship with such former customers.
| 24 |
| Risk Factors |
On January 1, 2024, new transfer pricing regulations came into effect in Brazil, which adopted an arm’s length principle to transfer pricing similar to that of the Organization for Economic Co-operation and Development (OECD). Additionally, a substantial VAT tax reform for indirect and consumption taxes that eliminates existing federal, state and municipal indirect taxes and creates three classes of taxes was approved in Brazil in December 2023 and will begin as of 2026. The reform’s goals are simplification, competitiveness and uniformization of legislation, and a long and gradual transition period is expected from 2026 to 2033. The Company is currently assessing the impacts of the reform on its operations and there can be no assurance that these new regulations will not increase taxes for Nexa.
Additionally, the OECD’s Pillar Two tax reform, which establishes a global minimum effective tax rate of 15%, became effective in Luxembourg on January 1, 2024. See “Taxation—Luxembourg tax considerations” for more information about this tax regime and its potential impact on Nexa. Peru and Brazil have not yet enacted the Pillar Two legislation, however adopting this regime in either country could have a potential impact on our business, financial position and results of operations.
Further, we are engaged in ongoing tax-related matters with the Peruvian tax authorities (“SUNAT”) related to the stability agreement of Cerro Lindo’s operations. The Peruvian tax authority issued unfavorable tax decisions against the Company for the years-ended December 31, 2014, 2015, 2016 and 2017. As of the date of this annual report, SUNAT is now auditing the years-ended December 31, 2018 and 2019. Discussions with SUNAT are expected to evolve in 2024, including potential audits of the years-ended December 31, 2020 and 2021, which is the last fiscal year covered by the stability agreement. The Company continues to conclude that there are legal grounds to obtain a favorable outcome in these matters, however, the Company may have to pay the disputed amounts under discussion to continue the legal process either in the judicial or international arbitration levels which may impact Nexa’s results, cash flow and liquidity. For more information, see “Additional Information—Legal Proceedings” and Note 11(d) to our consolidated financial statements.
The Brazilian, Peruvian or Luxembourg governments may implement additional changes to tax regulations in the future, which could adversely affect our business, financial position, and results of operations.
Our business, financial position and results of operations may be adversely affected by inflation.
Certain countries in which we operate are still experiencing or have experienced high levels of inflation in the past and may continue to experience high levels of inflation in the future, which may impact the cost of operation and domestic demand for our products. Inflationary pressures somewhat decreased globally during 2023 compared to 2022 and may moderate further in 2024, but still remain at high levels. This has impacted our operating margins and may impact our ability to access international financial markets. Further, government policies may be implemented that could materially adversely affect the overall performance of the national economy of the countries in which we operate, which in turn may materially adversely affect Nexa. Furthermore, as we follow international market prices, we may not be able to adjust the prices we charge our customers to offset potential effects of inflation on our cost structure. In addition, although the functional currency for our Peruvian operations is the U.S. dollar, high rates of inflation could increase our operating costs and may further adversely impact our operating margins if we are not able to pass the increased costs on to consumers.
We are subject to anti-corruption, anti-bribery and anti-money laundering laws and regulations in various jurisdictions. Any violations of any such laws or regulations could have a material adverse impact on our reputation and results of operations and financial position.
We are subject to anti-corruption, anti-bribery, anti-money laundering and other international laws and regulations and are required to comply with the applicable laws and regulations of Brazil, Peru, Luxembourg, Canada and the United States, among others. In addition, we are subject to economic sanctions regulations that restrict our dealings with certain sanctioned countries, individuals and entities. Our governance and compliance processes may not timely identify or prevent future breaches of legal, accounting or governance standards. We may be subject to instances of fraudulent behavior, corrupt practices and dishonesty by our affiliates, employees, directors, officers, partners, agents and service providers. Any violations by us of anti-bribery and anti-corruption laws, sanctions regulations or other standards could have a material adverse effect on our business, reputation, results of operations and financial position.
| 25 |
| Risk Factors |
Political and social opposition to mining activities generally in the regions we operate could adversely impact our business and reputation.
Disputes with communities where we operate may arise from time to time. In some instances, our operations and mineral reserves are located on or near lands owned or used by indigenous people or other groups of stakeholders. Some of our mining and other operations are in territories where title may be subject to disputes or uncertainties, or in areas claimed for agriculture or land reform purposes, which may lead to disagreements with organized social movements, local communities and the government. Further social or political changes, particularly in Peru and Brazil, may lead to a potential increase in these claims. We may be required to consult and negotiate with these groups as part of the process to obtain licenses required to operate, to mitigate impact on our operations or to obtain access to their lands. Disagreements or disputes with local groups, including indigenous groups, organized social movements and local communities could cause delays or interruptions to our operations, adversely affect our reputation or otherwise hamper our ability to develop our reserves and conduct our operations. Protesters have taken actions to disrupt our operations and projects, and they may continue to do so in the future, which may harm our operations and could adversely affect our business. In recent years, Peru has experienced protests against mining projects in several regions. On several occasions, local communities have opposed these operations and accused them of polluting the environment and hurting agricultural and other traditional economic activities. For example, production at the Atacocha mine was temporarily suspended in January and June 2023, as well as in February 2024, due to blockades by local communities. For additional information, see “Mining Operations—Atacocha—Operations and infrastructure” Social demands and conflicts could have a material adverse effect on our business and results of operations and the economy in general of the countries in which we operate.
Differing interpretations of agency regulations or court rulings and the application of such laws and regulations could result in unintended non-compliance and may have a material effect on our business, results of operations, and financial position.
The courts in some of the jurisdictions in which we operate may offer less certainty as to the judicial outcome of legal proceedings or a more protracted judicial process than is the case in more established economies. Businesses can become involved in lengthy court cases over simple issues when rulings are not clearly defined, and the poor drafting of laws and excessive delays in the legal process for resolving issues or disputes compound such problems. In addition, there may be limited or no relevant case law providing guidance on how courts would interpret such laws and the application of such laws to our contracts, joint ventures, licenses, license applications or other legal arrangements. Accordingly, there can be no assurance that contracts, joint ventures, licenses, license applications, tax agreements, or other legal arrangements will not be adversely affected by the actions of government authorities and the effectiveness of and enforcement of such arrangements in these jurisdictions. Moreover, the commitment of local businesses, government officials and agencies and the judicial system in these jurisdictions to abide by legal requirements and negotiated agreements may be more uncertain and may be susceptible to revision or cancellation, and legal redress may be uncertain or delayed. These uncertainties and delays could have a material adverse effect on our business and results of operations. Finally, certain interpretations of regulations and laws may lead to increasing governmental fines and sanctions, even for non-material violations of these rules and regulations. If Nexa is deemed to be in violation of agency regulations or court rulings, and is required to make payments in connection with the alleged violations, this may have a material impact on our business, results of operations and financial position.
Regulation of other activities.
We are subject to mining and environmental regulation related to, among other activities, the use of explosives, fuel storage, controlled substances, discharges, telecommunications, archeological remains and energy concessions. We are also subject to more general legislation on data privacy, labor, occupational health and safety, and peasant and indigenous communities, among others, that may adversely affect our business. See “Information on the Company—Regulatory matters—Brazilian regulatory framework” and “Information on the Company—Regulatory matters—Peruvian regulatory framework.
| 26 |
| Risk Factors |
Risks relating to our corporate structure
VSA has substantial control over us, which could limit our shareholders’ ability to influence the outcome of important corporate decisions.
As of March 27, 2024, VSA owns 64.68% of our issued and outstanding common shares. As a result, VSA can influence or control matters requiring approval by our shareholders, including the election of directors, the allocation of profits, the appointment of external auditors and the approval of mergers, acquisitions or other extraordinary transactions. VSA may also have interests that differ from our other investors and may vote in a way with which our other shareholders disagree, and which may be adverse to the interests of our other investors. Additionally, we may experience a lack of trading liquidity associated with VSA’s control over us.
In addition, we have entered into several shared services contracts and similar agreements with other entities in the Votorantim Group in order to achieve operational economies of scale. Since we rely on the Votorantim Group for negotiation, renewal and extension of these agreements, there can be no assurances that we will always have access to the services procured pursuant to these agreements at the same prices and conditions. See “Share ownership and trading—Related Party Transactions.”
Dividends or other distributions paid by us on our common shares will generally be subject to Luxembourg withholding tax.
Any dividends or other distributions paid by us on our common shares will be subject to a Luxembourg withholding tax at a rate of 15.0% unless an exemption or reduction in rate applies. The withholding tax must be withheld from the gross distribution and paid to the Luxembourg tax authorities. Under certain circumstances, distributions as share capital reductions or share premium reimbursements may not be subject to withholding tax, but there are no assurances that we will be able to make such distributions in the future. See “Additional Information—Taxation—Luxembourg tax considerations—Shareholders.”
The rights of our shareholders, and the responsibilities of VSA as our controlling shareholder, are governed by Luxembourg law and differ in some respects from the rights and responsibilities of shareholders under the laws of other jurisdictions, including the United States and Canada, and shareholders may have more difficulty protecting their interests than they would as shareholders of a U.S. corporation.
Our corporate affairs are governed by our articles of association and by the laws governing limited liability companies organized under the laws of Luxembourg, as well as such other applicable local law, rules and regulations. The rights of our shareholders and the responsibilities of VSA as our controlling shareholder and of our directors and officers under Luxembourg law are different from those applicable to a corporation incorporated in the United States or Canada. There may be less publicly available information about us than is regularly published by or about U.S. or Canadian issuers. Also, Luxembourg regulations governing the securities of Luxembourg companies may not be as extensive as those in effect in the United States or Canada, and Luxembourg law and regulations in respect of corporate governance matters may not be as protective of non-controlling shareholders as corporation laws in the United States or Canada. Therefore, shareholders may have more difficulty protecting their interests in connection with actions taken by us, our directors and officers or our principal shareholders than they would as shareholders of a corporation incorporated in the United States or Canada.
Our ability to pay dividends or other distributions and repurchase shares is subject to several factors and conditions.
The determination to pay dividends and the payment of dividends or other distributions (including reimbursements of share premium) will be subject to the approval of our Board of directors and/or our shareholders, as applicable, and will depend on a number of factors, including, but not limited to, our cash balance, cash flow, earnings, capital investment plans, expected future cash flows from operations, our strategic plans and cash dividend distributions from our subsidiaries, as well as restrictions imposed by applicable law and contractual restrictions (although as of the date of this annual report there are no contractual restrictions on our ability to pay dividends or other distributions to our shareholders), LME metal prices and other factors our Board of directors may deem relevant at the time. Luxembourg law also imposes certain requirements regarding distributions. For additional information, see “Share ownership and trading—Distributions.”
| 27 |
| Risk Factors |
We are a holding company and have no material assets other than our ownership of shares in our subsidiaries. When we pay a dividend or other distribution on our common shares, we generally cause our operating subsidiaries, including subsidiaries that are not wholly-owned by Nexa, to make distributions to the parent company in an amount sufficient to fund any such dividends or distributions to Nexa’s shareholders. Although as of December 31, 2023, there are no material contractual restrictions on our subsidiaries’ ability to make distributions, their ability to do so is subject to, among other things, their capacity to generate sufficient earnings and cash flow and may also be affected by statutory accounting and tax rules in Brazil and Peru.
The determination to repurchase shares of our common stock is discretionary. Our ability to repurchase shares will depend on a number of factors, including, but not limited to, metal prices, restrictions imposed by applicable law, contractual restrictions, and other factors our Board of directors may deem relevant at the time. Our decision to repurchase shares could have a negative effect on the Company’s free cash flow and/or the liquidity of our common stock.
It could be difficult for investors to enforce any judgment obtained outside Luxembourg against us or any of our associates.
We are organized under the laws of Luxembourg. Furthermore, certain of our directors and officers reside outside the United States and Canada and most of their assets are located outside the United States and Canada. Most of our assets are located outside the United States or Canada. As a result, it may not be possible for investors to effect service of process upon us or our directors and officers within the United States, Canada, or other jurisdictions outside Luxembourg or to enforce against us or our directors and officers, judgments obtained in the United States, Canada or other jurisdictions outside Luxembourg. Because judgments of United States or Canadian courts for civil liabilities based upon the U.S. federal securities laws or Canadian securities laws may only be enforced in Luxembourg if certain requirements are met, investors may face greater difficulties in protecting their interest in actions against us or our directors and officers than would investors in a corporation incorporated in a state or other jurisdiction of the United States or Canada.
| 28 |
| Business Overview |
| I. | Information on the Company |
Business overview
Overview
We are a leading large-scale, low-cost integrated zinc producer with over 65 years of experience developing and operating mining and smelting assets in Latin America.
We operate and own six long life polymetallic mines, three located in the Central Andes of Peru, two located in the state of Minas Gerais in Brazil and one located in the state of Mato Grosso in Brazil.
Our operations are large-scale, modern, mechanized underground and open pit mines. Our mines are proximately located to one another, which creates efficiencies. Two of our mines, Cerro Lindo in Peru and Vazante in Brazil, are among the top 40 largest zinc-producing mines in the world and, combined with our other mining operations, placed us among the top five producers of mined zinc globally in 2023, according to Wood Mackenzie. In addition to zinc, which accounted for 54.5% of our mined metal production in 2023 measured on a zinc equivalent basis, we produce substantial amounts of copper, lead, silver and gold as by-products, which reduce our overall costs to produce mined zinc.
We also own a zinc smelter in Peru (Cajamarquilla) and two zinc smelters in Brazil (Três Marias and Juiz de Fora), which produce metallic zinc, zinc oxide and several by-products. We were the fifth largest producer of refined zinc globally in 2023, according to Wood Mackenzie. Our smelters are the only units in Latin America (excluding Mexico), resulting in benefits from higher premiums. Cajamarquilla is the only operating zinc smelter in Peru and was the fifth largest globally in 2023 by production volume, according to Wood Mackenzie. Peru is the second largest producer of mined zinc in the world, assuring long-term supply of zinc concentrates to Cajamarquilla. Given our proximity to concentrate producers (our own mines and third-party producers), we also benefit from freight parity.
In 2023, we achieved our guidance despite a challenging global macroeconomic environment and Aripuanã, whose production was behind our initial plan. The persistence of high inflation and high interest rates, ongoing global conflicts, including the Russia-Ukraine war and the conflict in the Middle East, and uncertainties about the performance of key sectors of the Chinese economy, significantly increased commodity price volatility, contributing to a slowdown in global growth, and intensifying inflationary pressures throughout the year. Production of our existing mines were at the high end, or above guidance range, and metal sales were in the middle of the guidance range, while mining and smelting cash costs were slightly above and in line with our guidance, respectively.
Mining production increased in 2023 as compared to 2022, this increase in the mining segment was mainly explained by better performance in the El Porvenir, Vazante, Morro Agudo and Aripuanã mines largely due to higher treated ore, despite lower production in the Atacocha and Cerro Lindo mines. Production in the smelting segment decreased from 2022, due to operational instabilities across our smelters as well as a slowdown in domestic demand.
In January 2023, protest activities by the Machcan community temporarily suspended operations at the Atacocha San Gerardo open pit mine for approximately one week. In June 2023, protest activities by the Machcan community again blocked access to the Atacocha San Gerardo open pit mine, temporarily suspending production for approximately one month. Finally, in February 2024 protests by the Joraoniyoc community temporarily suspended production at the Atacocha San Gerardo open pit mine for approximately three days. During the protests, mining activities were limited to critical operations with a minimal workforce to ensure appropriate maintenance, safety, and security. Even though production was temporally suspended during these periods, we were able to operate at high levels of capacity utilization rates throughout the year.
In March 2023, production at the Cerro Lindo mine was suspended for approximately two weeks due to unusually heavy rainfall levels and overflowing rivers caused by Cyclone Yaku, which affected the region, and other parts of the country. Nonetheless, following the successful underground mine dewatering process, operations resumed at full capacity in April 2023.
In 2023, zinc production increased by 12.4% compared to 2022, mainly due to the increase in production at Aripuanã and Vazante. Our mining operations produced 333.2 thousand tonnes of zinc contained in concentrates, 33.4 thousand tonnes of copper contained in concentrates, 65.2 thousand tonnes of lead contained in concentrates, 10,300.7 thousand ounces of silver and 27.6 thousand ounces of gold, for a total of 611.1 thousand tonnes of metal on a zinc equivalent basis.
| 29 |
| Business Overview |
Total production (zinc metal + oxide) in 2023 decreased 3.2% compared to 2022. Our smelters produced 587.5 thousand tonnes of zinc metal and oxide available for sale in different formats and sizes during 2023, along with by-products, including sulfuric acid, silver concentrate, copper cement and copper sulfate.
Our smelters process mostly zinc concentrate, 47.9% of which was sourced from our mines during 2023, and 52.1% purchased from third parties or obtained as secondary raw material (excluding oxide). Approximately 94.5% of the total volume of the contained zinc in concentrates produced by our mines was processed by our own smelters in 2023, with the remainder and all our copper and lead concentrates sold to third parties. We market our products in Latin America and globally, through our commercial offices in Luxembourg, the United States, Brazil and Peru. We also own energy assets (hydroelectric power plants) in both Brazil and Peru, which provide access to a reliable and competitive power supply.
The Aripuanã ramp-up activities started in July 2022. In January and February 2023, the plant operated at approximately 57% of nameplate capacity. However, in March 2023, we decided to temporarily halt operations at the plant to clear some bottlenecks, related primarily to pumping and piping systems, and to improve the drainage configuration that presented some limitations after the rainy season, which occurred from December 2022 to March 2023. At the beginning of 3Q23, the plant performance was averaging 75% of nameplate capacity. We then observed design limitations in the capacity of the flotation pumping system, identified during the detection of bottlenecks in March 2023, which required resizing and upgrade along with certain plant processing facilities and systems, as well as the clean-up and upgrading of water treatment facilities. As a result, we reduced plant throughput and the plant performed at an average of 56% in 3Q23. Despite the reduction, we continue to prioritize metal recovery and concentrate quality and grades, aiming to achieve a stable operation. With this revised plan, we achieved an average of 61% capacity utilization level in 4Q23 and expect to reach nameplate capacity in mid-2024.
In 2023, Nexa continued to demonstrate its commitment to ESG as well as its commitment to promoting safe and inclusive workplaces. For example, in April 2023, we committed to reducing CO2 emissions by using natural gas to replace diesel fuel in transport vehicles at mining sites in Peru. We also obtained authorization from the Regional Superintendence for the Environment of the State of Minas Gerais to use biofuel to replace fossil fuels in zinc oxide furnaces at the Três Marias smelter and expand the use of this biofuel to the remaining furnaces at this site over the years. In August 2023, in line with our ESG commitments targeting net-zero greenhouse gas emissions by 2050, we implemented the ON GRID solar system at our Cajamarquilla smelter, providing electric power from solar energy, resulting in a reduced footprint carbon emissions and promoting clean energy production. Further, in October 2023, Nexa announced the successful closing of a US$320 million sustainability-linked revolving credit facility, which replaced Nexa’s 2019 US$300 million revolving credit facility that was set to mature in October 2024. This new revolving credit facility has a term of five years, remains undrawn and amounts drawn are subject to an initial interest rate of 1.60% plus Term SOFR. The applicable margin is subject to compliance with carbon reduction key performance indicators, reflecting the Company’s unwavering commitment to reducing its carbon footprint.
History
We commenced operating in 1956 under the name “Companhia Mineira de Metais”, in the state of Minas Gerais, Brazil. After a series of restructurings in the subsequent fifty-eight years, in 2014, a new corporate governance model was implemented by our controlling shareholder VSA in the corporate group. The main consequence of this new corporate model was that the new governance structure demanded a higher level of empowerment and accountability of senior management, and the establishment of a Board of directors at each company. In addition, in connection with the implementation of the new corporate governance model, VSA’s equity participations in Nexa CJM (formerly Votorantim Metais – Cajamarquilla S.A.) and Nexa Brazil (formerly Votorantim Metais Zinco S.A.) were transferred to Nexa Resources on June 18, 2014 and July 1, 2014, respectively.
In October 2017, we completed our initial public offering and listed our common shares on the New York Stock Exchange (“NYSE”) and on the Securities Market Registry and Nexa Peru remains subject to applicable ongoing reporting and other requirements in Peru.
·Toronto Stock Exchange (“TSX”) under the ticker symbol NEXA. In June 2017, we expanded the treatment capacity for Cerro Lindo unit from 18 to 21 thousand tonnes per day.
· In September 2017,connection with becoming a public company, VM Holding S.A. changed its corporate name to Nexa Resources S.A. In addition,and our subsidiaries Votorantim Metais—Cajamarquilla S.A., Votorantim Metais Zinco S.A. and Compañía Minera Milpo S.A.A. began the process to formally changechanged their corporate names to Nexa CJM, Nexa Brazil and Nexa Peru, respectively. In April 2018, the name
| 30 |
| Business Overview |
Following receipt of Votorantim Metais—Cajamarquilla S.A. was formally changed to Nexa CJM. The corporate name changesapproval for a voluntary delisting of Votorantim Metais Zinco S.A. and Compañía Minera Milpo S.A.A. remain subject to local regulatory approval.
· In October 2017, we completed our initial public offering, pursuant to which we issued and sold 20,500,000 common shares and VSA sold 15,150,000 common shares tofrom the public, and listedTSX in Canada, the last trading of our common shares on the New York Stock ExchangeTSX took place on November 30, 2021. Nexa received approval for the delisting following an internal assessment of the relative advantages and Toronto Stock Exchange under the ticker symbol NEXA.
Corporate information
Nexa Resources is a public liability company (société anonyme) incorporated under the laws of Luxembourg on February 26, 2014. Our registered office is located at 26-28 rue Edward Steichen, L-2540 Luxembourg, Grand Duchy of Luxembourg, and we are registereddisadvantages associated with the Luxembourg Trade and Companies Register under number B185489. Our telephone number at this address is +352 26 00 53 43. Our main office outsidelisting of Luxembourg is located at Avenida Engenheiro Luís Carlos Berrini, n° 105, 6th floor, São Paulo, State of São Paulo, Brazil. Our website is www.nexaresources.com. Noneour common shares on the TSX. Nexa continues to be a reporting issuer in each of the information available on our website is incorporatedprovinces and territories of Canada following the delisting and continues to file in this annual reportCanada and it should not be relied upon in decidingdisseminate to invest in our common shares.
Producing mines and smelters
Our mines are:
·Cerro Lindo. Our Cerro Lindo mine is an underground mine located in Peru wholly owned by Nexa Peru. Operations began in 2007 and in 2017, Cerro Lindo mine produced approximately 155.9 thousand tonnes of zinc contained in concentrates, 43.6 thousand tonnes of copper contained in concentrates, 14.8 thousand tonnes of lead contained in concentrates, 3,546 thousand ounces of silver contained in concentrates and 4.0 thousand ounces of gold contained in concentrates. The ore is treated at a concentrate plant that has a processing capacity to 21 thousand tonnes of ore per day.
·El Porvenir. Our El Porvenir mine is an underground mine located in Peru wholly owned by Nexa Peru. Operations began in 1949 and in 2017, El Porvenir mine produced approximately 46.2 thousand tonnes of zinc contained in concentrates, 493.0 tonnes of copper contained in concentrates, 14.8 thousand tonnes of lead contained in concentrates and 2,357 thousand ounces of silver contained in concentrates and 8.4 thousand ounces of gold contained in concentrates. The ore is treated at a concentrate plant that has a processing capacity of 6.5 thousand tonnes of ore per day. Our El Porvenir and Atacocha mines are currently undergoing an integration process, through which they will form the Pasco mining complex. This complex will involve a shared tailings storage facility and shared underground infrastructure.
·Atacocha. The Atacocha mine is an underground and open pit mine located in Peru wholly owned by Compañía Minera Atacocha. Operations began in 1938 and in 2017, Atacocha mine produced approximately 16.9 thousand tonnes of zinc contained in concentrates, 99.0 tonnes of copper contained in concentrates, 15.9 thousand tonnes of lead contained in concentrates, 1,687 thousand ounces of silver contained in concentrates and 20.1 thousand ounces of gold contained in concentrates. The ore is treated at a concentrate plant that has a processing capacity of 4.5 thousand tonnes of ore per day. As mentioned above, our El Porvenir and Atacocha units are currently undergoing an integration process, through which they will form the Pasco mining complex. This complex will include a shared tailings storage facility and shared underground infrastructure.
·Vazante. Our Vazante mine is an underground and open pit mine located in Brazil wholly owned by Nexa Brazil. Operations began in 1969 and in 2017, Vazante mine produced approximately 135.4 thousand tonnes of zinc contained in concentrates, 1,153 tonnes of lead contained in concentrates and 355.0 thousand ounces of silver contained in concentrates. The ore is treated at a concentrate plant that has a processing capacity of 3.9 thousand tonnes of ore per day.
·Morro Agudo. Our Morro Agudo project includes an underground and open pit mine located in Brazil wholly owned by Nexa Brazil. Operations began in 1988 and in 2017, Morro Agudo mine produced approximately 20.9 thousand tonnes of zinc contained in concentrates and 5.8 thousand tonnes of lead contained in concentrates. The mill feed material is treated at a concentrate plant that has a processing capacity of 3.4 thousand tonnes per day.
Our smelters are:
·Cajamarquilla. Our Cajamarquilla smelter, which is wholly owned by Nexa CJM, is located in Peru and began operating in 1981. It is currently the largest zinc smelter in Latin America and the seventh largest zinc smelter in the world in 2017, according to Wood Mackenzie. Cajamarquilla uses Roast Leach Electrowin technology. With a nominal production capacity of 335,000 tonnes per year, Cajamarquilla produced 309,925 tonnes in 2017 and 334,261 tonnes in 2016. In 2017, 42,6%Canadian resident holders of the zinc containedcommon shares its continuous and periodic disclosure documents until such time as it ceases to be obligated to do so. Nexa intends to apply to cease to be a reporting issuer in concentrates used by Cajamarquilla was sourcedCanada under Canadian securities laws upon being in a position to satisfy or obtain relief from our mines in Peruapplicable regulatory requirements.
Corporate structure and 57.4% was purchased from third parties.principal subsidiaries
·Três Marias. Our Três Marias smelter, which is wholly owned by Nexa Brazil, is located in Brazil and began operating in 1969. Três Marias processes zinc silicate concentrate from our Vazante mine and zinc sulfide concentrate from our Morro Agudo mine and uses Roast Leach Electrowin technology. Três Marias produced 185,829 tonnes of zinc in 2017 and 186,708 tonnes of zinc in 2016. In 2017,
92.6% of the zinc contained in raw materials used by Três Marias was sourced from our mining operations in Brazil and Peru and 7.4% was purchased from third parties.
·Juiz de Fora. Our Juiz de Fora smelter, which is wholly owned by Nexa Brazil, is located in Brazil and began operating in 1980. This smelter uses Roast Leach Electrowin and Waelz Furnace technologies. Juiz de Fora produced 87,319 and 86,616 tonnes of zinc in 2017 and 2016, respectively. In 2017, 45.7% of the zinc contained in raw materials used by Juiz de Fora was zinc concentrate sourced from our mining operations, 34.1% was purchased from third parties and 20.2% was obtained from secondary feed materials from electric arc furnace (EAF) and brass oxide. Of the zinc contained in concentrates used by Juiz de Fora, 57.3% was sourced from our mines and 42.7% was purchased from third parties.
In addition to our mines and smelters, we have interests in five greenfield mining projects in Peru (Shalipayco, Magistral, Hilarión, Pukaqaqa and Florida Canyon Zinc) and two in Brazil (Aripuanã and Caçapava do Sul). For more information about these projects, please see “—Mining operations—Growth projects.”
Principal subsidiaries
Nexa CJM
As of December 31, 2017,Currently, Nexa Resources is the beneficial owner of 99.9125%99.916% of the outstanding shares of Nexa CJM, and the remaining outstanding shares are owned by Votorantim Investimentos Latino-AmericanosNexa Recursos Minerais S.A. (VILA) with 0.0845%0.081% and by other minority shareholders holding 0.0030%0.003% in aggregate.
Nexa Peru
As of December 31, 2017,Currently, Nexa Peru’s share capital consists of 1,309,748,2881,257,754,353 common shares. In addition to common shares, Nexa Peru has issued investment shares that represent a participation in its net worth (patrimonio). Although the investment shares do not represent a participation in the capital of the companyNexa nor grant any voting rights, they grant their holders the right, among others, to participate in any dividend distributions and liquidation proceeds, pro rata to the percentage they represent in the total net worth of Nexa Peru; as well as to participate in any capital increases (in order to maintain the participation they represent in the total net worth) and the right to have their shares redeemed in certain circumstances. As of December 31, 2017,2023, approximately 67.0%67.02% of the investment shares are free float and 33.0%32.98% are treasury shares. The investment shares currently represent 1.6% of the total shares of Nexa Peru.
Both the common shares and the investment shares of Nexa Peru are registered with the Peruvian Public Registry of Securities (Registro Público del Mercado de Valores) and listed on the Lima Stock Exchange. As a result, Nexa Peru is required to comply with certain disclosure obligations such as filing quarterly and annual financial statements, reporting on material events (hechos de importancia) and disclosing information regarding the economic group to which it belongs.
The following table sets forth information concerning the ownership of the capital stock of Nexa Peru.Peru, excluding the investment shares.
Shareholder | Number | Share Capital (%) |
| Nexa CJM | 1,048,621,896 | 83.37% |
| Nexa Resources | 2,277,601 | 0.18% |
| Public float | 206,854,856 | 16.45% |
| Total | 1,257,754,353 | 100.0% |
Nexa Brazil
On May 1, 2023, Nexa Brazil, which is 100% owned by Nexa Resources, merged its wholly-owned subsidiary Mineração Dardanelos Ltda., which owns 100% of the Aripuanã Mine, into itself.
Shareholder |
| Number |
| Share Capital (%) |
|
Nexa CJM |
| 1,048,621,896 |
| 80.06 | % |
Nexa Resources |
| 2,277,601 |
| 0.17 | % |
Public float |
| 206,854,856 |
| 15.79 | % |
Treasury shares |
| 51,993,935 |
| 3.97 | % |
Total |
| 1,309,748,288 |
| 100.0 | % |
| 31 |
| Business Overview |
Producing mines and smelters
Nexa BrazilOur mines are:
| · | Cerro Lindo. Our Cerro Lindo mine is an underground mine located in Peru wholly-owned by Nexa Peru, which is 83.48% directly and indirectly owned by Nexa Resources. Operations began in 2007 and, in 2023, the Cerro Lindo mine produced approximately 78.2 thousand tonnes of zinc contained in concentrates, 28.6 thousand tonnes of copper contained in concentrates, 13.0 thousand tonnes of lead contained in concentrates, 3,541.0 thousand ounces of silver contained in concentrates and 3.4 thousand ounces of gold contained in concentrates. The ore is treated at a concentrate plant that has a processing capacity of 21.0 thousand tonnes of ore per day. |
| · | Vazante. Our Vazante mine is an underground and open pit mine located in Brazil wholly-owned by Nexa Brazil, which is 100% owned by Nexa Resources. Operations began in 1969 and, in 2023, the Vazante mine produced approximately 145.7 thousand tonnes of zinc contained in concentrates, 1.4 thousand tonnes of lead contained in concentrates and 575.6 thousand ounces of silver contained in concentrates. The ore is treated at a concentrate plant that has a processing capacity of 5.0 thousand tonnes of ore per day. |
| · | El Porvenir. Our El Porvenir mine is an underground mine located in Peru (part of the Cerro Pasco Complex) wholly-owned by Nexa Resources El Porvenir S.A.C., which is 83.48% directly and indirectly owned by Nexa Resources. Operations began in 1949 and, in 2023, the El Porvenir mine produced approximately 55.8 thousand tonnes of zinc contained in concentrates, 0.4 thousand tonnes of copper contained in concentrates, 24.9 thousand tonnes of lead contained in concentrates, 4,270.5 thousand ounces of silver contained in concentrates and 8.7 thousand ounces of gold contained in concentrates. The ore is treated at a concentrate plant that has a processing capacity of 6.5 thousand tonnes of ore per day. |
| · | Atacocha. Our Atacocha mine is an underground and open pit mine located in Peru (part of the Cerro Pasco Complex) wholly-owned by Nexa Resources Atacocha S.A.A. (formerly Compañía Minera Atacocha), which is 75.96% directly and indirectly owned by Nexa Resources. Operations began in 1938 and, in 2023, the Atacocha mine produced approximately 8.2 thousand tonnes of zinc contained in concentrates, 11.1 thousand tonnes of lead contained in concentrates, 1,399.7 thousand ounces of silver contained in concentrates and 7.6 thousand ounces of gold contained in concentrates. The ore is treated at a concentrate plant that has a processing capacity of 4.4 thousand tonnes of ore per day. In 2020, the mine was placed under a mandatory temporary suspension period in response to COVID-19. Due to the effects of COVID-19, the uncertain macroeconomic scenario and our efforts to reduce costs and improve operational efficiency, we decided not to resume the Atacocha underground mine after the mandatory temporary suspension of our operations in Peru and we placed it under care and maintenance, which it remains to date. |
| · | Aripuanã. Our Aripuanã mine is an underground mine located in Brazil wholly-owned by Nexa Brazil, which is 100% owned by Nexa Resources. Ramp-up activities at the Aripuanã mine began in July 2022, and the mine is currently in the ramp-up phase as of the date of this annual report. In 2023, the Aripuanã mine produced approximately 22.1 thousand tonnes of zinc contained in concentrates, 4.4 thousand tonnes of copper contained in concentrates, 6.3 thousand tonnes of lead contained in concentrates, 513.9 thousand ounces of silver contained in concentrates and 8.0 thousand ounces of gold contained in concentrates. The ore is treated at a concentrate plant that has a processing capacity of 6.3 thousand tonnes of ore per day. |
| · | Morro Agudo. Our Morro Agudo mine is an underground mine located in Brazil wholly-owned by Nexa Brazil, which is 100% owned by Nexa Resources. Operations began in 1988 and, in 2023, the Morro Agudo mine produced approximately 23.2 thousand tonnes of zinc contained in concentrates and 8.3 thousand tonnes of lead contained in concentrates. The ore mill feed material is treated at a concentrate plant that has a processing capacity of 3.4 thousand tonnes per day. On March 19, 2024, Nexa announced the suspension of its mining operations in the Morro Agudo Complex effective May 1, 2024 until further notice. The suspension is part of Nexa’s portfolio optimization process to improve free cash flow in line with the Company’s disciplined capital allocation framework, along with its long-term strategy to maximize value for the Company and its shareholders. |
| 32 |
| Business Overview |
Our smelters are:
| · | Cajamarquilla. Our Cajamarquilla smelter, which is wholly-owned by Nexa CJM, which is 99.997% directly and indirectly owned by Nexa Resources, is located in Peru and began operating in 1981. It is currently the largest zinc smelter in Latin America and was the fifth largest zinc smelter in the world in 2023, according to Wood Mackenzie. Cajamarquilla uses Roast-Leach-Electrowinning technology. With a nominal production capacity of 344.4 thousand tonnes of contained zinc per year, Cajamarquilla produced 323.1 thousand tonnes of zinc metal available for sales in 2023 and 332.8 thousand tonnes in 2022. In 2023, 27.2% of the zinc contained in raw material used by Cajamarquilla was sourced from our mines in Peru and 72.8% was purchased from third parties or obtained from secondary feed materials. |
| · | Três Marias. Our Três Marias smelter, which is wholly-owned by Nexa Brazil, which is 100% owned by Nexa Resources, is located in Brazil and began operating in 1969. Três Marias processes zinc silicate concentrate from our Vazante mine and zinc sulfide concentrate from our Morro Agudo and Aripuanã mines and uses Roast-Leach-Electrowinning technology. With a nominal production capacity of 192.2 thousand tonnes of refined metal per year, Três Marias produced 182.3 thousand tonnes of zinc metal and oxide in 2023 and 189.9 thousand tonnes in 2022. In 2023, 87.3% of the zinc contained in raw materials used by Três Marias was sourced from our mining operations in Brazil and Peru and 12.7% was purchased from third parties or obtained from secondary feed materials. |
| · | Juiz de Fora. Our Juiz de Fora smelter, which is wholly-owned by Nexa Brazil, which is 100% owned by Nexa Resources, is located in Brazil and began operating in 1980. This smelter uses Roast-Leach-Electrowinning and Waelz Furnace technologies. With a nominal production capacity of 96.9 thousand tonnes per year, Juiz de Fora produced 82.1 thousand tonnes of zinc metal in 2023 and 84.2 thousand tonnes in 2022. In 2023, 41.7% the zinc raw material used in Juiz de Fora was zinc concentrate sourced from our mining operations, 41.8% was purchased from third parties and 16.5% was obtained from secondary feed materials from electric arc furnace (“EAF”) and brass oxide. |
Growth Projects
In addition to Nexa’s operating mines and smelters, a component of our business focuses on growth and exploration, which are activities associated with ascertaining the existence, location, extent or quality of a mineral deposit. Our growth and exploration activities encompass brownfield and greenfield projects. Brownfield projects are exploration or development projects near or within our existing operations, which can share infrastructure and management of our existing operations. Greenfield projects are exploration or development projects that are located outside the area of influence of our existing mine operations and/or infrastructure, which will be independently developed and managed from our existing operations. Most of our brownfield and greenfield projects are in the pre-feasibility or feasibility stages.
AsThe evolution of December 31, 2017, Nexa Resourcesa greenfield project until it reaches full/normal capacity can take decades. The steps that a project typically follows to reach full/normal capacity are: exploration (for mining projects), pre-feasibility, feasibility study, construction/execution, commissioning, ramp-up, and full/normal capacity. Aripuanã is the beneficial owneronly greenfield project that Nexa has built in recent decades and was in the ramp-up stage throughout the entirety of 88.80%2023. We expect to reach nameplate capacity in mid-2024.
| 33 |
| Business Overview |
In addition to our operating mines and smelters, we have interests in three greenfield projects in Peru (Magistral, Hilarión and Florida Canyon Zinc) and one in Namibia, as well as a number of prospects in Peru, Brazil and Namibia. For more information about the projects, please see “Information on the Company—Mining operations—Growth projects.” Nexa also owns 18.2% of the issued and outstanding shares of Nexa Brazil, and VSA is the beneficial owner of the remaining 11.20%. For accounting purposes, NexaTinka Resources holdsLimited, which in turn owns 100% of the share capitalAyawilca zinc-silver development project located 40 kilometers northwest of Nexa Brazil, which reflects the final result of implementation of all steps of the transaction regarding our energy assets. The transaction regarding our energy assets remains subject to the approval
of the transaction by the Brazilian Electric Energy Regulatory Authority (Agência NacionalCerro de Energia Elétrica), or ANEEL, which is expected to occurPasco in the first half of 2018. Nexa Resources has recognized the energy assets for all the years presented in the consolidated financial statements due to the accounting policy for common control transactions. See Note 1(vii) to our consolidated financial statements and “Related Party Transactions—Certain transactions with our shareholders and their affiliates.”Central Peru.
| 34 |
| Mining Operations |
Mining operations
VGmbH
As of December 31, 2017, Nexa Resources is the beneficial owner of 100% of the outstanding shares of VGmbH. In June 2016, as part of an internal reorganization, VSA transferred its shares in VGmbH to us.
Map 1. Mines, Projects and Prospects in Peru

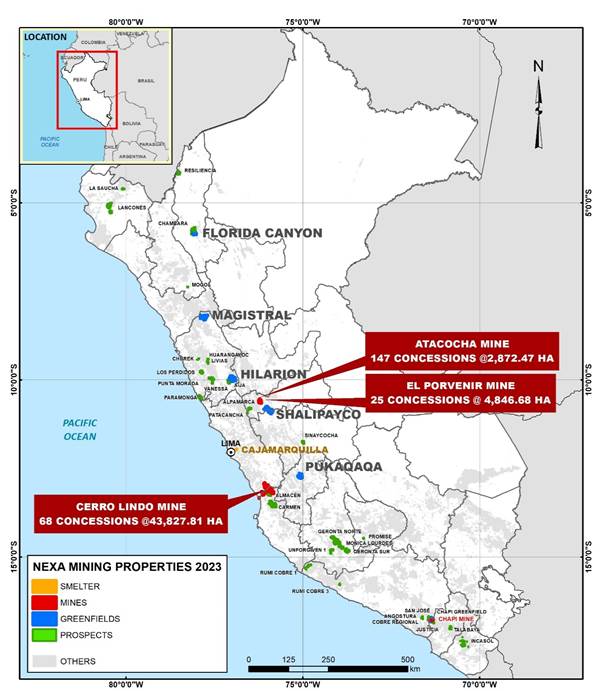
Source: Nexa Resources.
| 35 |
| Mining Operations |
Map 2. Mines, Projects and Prospects in Brazil
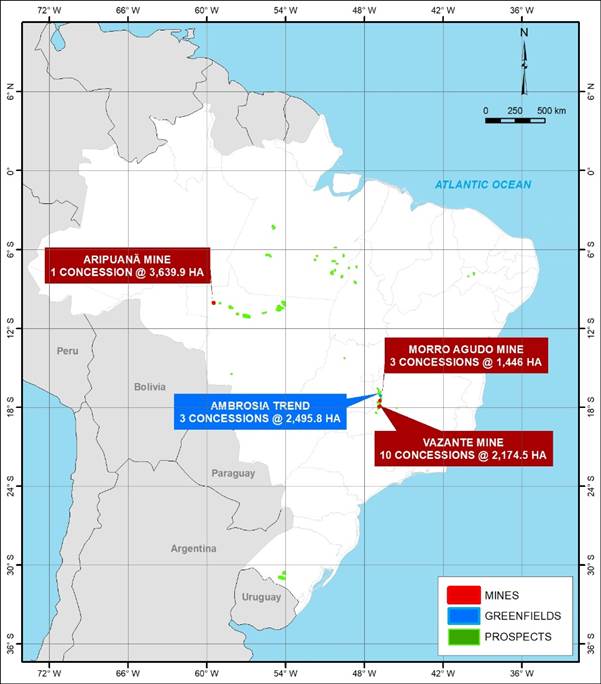
Source: Nexa Resources.
The following table summarizes our concentrate production, metal contained in concentrate production zinc equivalent production in each metal and zinc equivalent production in each of our operating mines.
To calculate the zinc equivalent production for the years ended December 31, 2023, 2022, and 2021, we convert the relevant metal contained in concentrate production used in the zinc equivalent grade based on the average benchmark prices for 2017,2023, namely, US$2,895.942,649.04 per tonne (US¢131.36(US$1.20 per pound) for zinc, US$6,165.978,483.40 per tonne (US¢279.68(US$3.85 per pound) for copper, US$2,317.462,137.18 per tonne (US¢105.12(US$0.97 per pound) for lead, US$17.0523.39 per ounce for silver and US$1,257.151,942.74 per ounce for gold.
|
| For the Year Ended December 31, |
| ||||
|
| 2017 |
| 2016 |
| 2015 |
|
Mining Production |
|
|
|
|
|
|
|
Zinc concentrates (in tonnes) |
| 791,583 |
| 860,399 |
| 866,679 |
|
Copper concentrates (in tonnes) |
| 169,582 |
| 158,503 |
| 154,998 |
|
Lead concentrates (in tonnes) |
| 96,006 |
| 104,408 |
| 94,875 |
|
Mining Production—Metal Contained in Concentrate |
|
|
|
|
|
|
|
Zinc (in tonnes) |
| 375,402 |
| 416,869 |
| 425,883 |
|
Copper (in tonnes) |
| 44,161 |
| 41,551 |
| 40,375 |
|
Lead (in tonnes) |
| 52,572 |
| 59,181 |
| 54,611 |
|
Silver (in oz.)(1) |
| 7,945,778 |
| 8,539,568 |
| 7,862,715 |
|
Gold (in oz.) |
| 32,534 |
| 27,893 |
| 17,934 |
|
Mining Production—Zinc Equivalent Production |
|
|
|
|
|
|
|
Zinc (in tonnes of zinc equivalents) |
| 375,402 |
| 416,869 |
| 425,883 |
|
Copper (in tonnes of zinc equivalents) |
| 94,026 |
| 88,471 |
| 85,965 |
|
Lead (in tonnes of zinc equivalents) |
| 42,071 |
| 47,359 |
| 43,702 |
|
Silver (in tonnes of zinc equivalents) |
| 46,776 |
| 50,271 |
| 46,287 |
|
Gold (in tonnes of zinc equivalents) |
| 14,123 |
| 12,109 |
| 7,786 |
|
Total |
| 572,398 |
| 615,079 |
| 609,623 |
|
Mining Production—Zinc Equivalent Production |
|
|
|
|
|
|
|
Cerro Lindo (in tonnes of zinc equivalents) |
| 283,208 |
| 296,007 |
| 292,600 |
|
El Porvenir (in tonnes of zinc equivalents) |
| 76,590 |
| 97,570 |
| 96,426 |
|
Atacocha (in tonnes of zinc equivalents) |
| 48,591 |
| 54,770 |
| 54,826 |
|
Vazante (in tonnes of zinc equivalents) |
| 138,395 |
| 137,535 |
| 135,958 |
|
Morro Agudo (in tonnes of zinc equivalents) |
| 25,614 |
| 29,197 |
| 29,813 |
|
Total |
| 572,398 |
| 615,079 |
| 609,623 |
|
| 36 |
(1) Silver volumes include silver in lead concentrate produced in Vazante.
| Mining Operations |
For the Year Ended December 31, | |||
2023 | 2022 | 2021 | |
| Treated Ore (in tonnes) | 13,846,530 | 12,343,018 | 12,330,469 |
| Mining Production—Metal Contained in Concentrate | |||
| Zinc (in tonnes) | 333,154 | 296,403 | 319,950 |
| Copper (in tonnes) | 33,385 | 33,219 | 29,607 |
| Lead (in tonnes) | 65,194 | 57,448 | 45,565 |
| Silver (in oz) | 10,300,672 | 9,974,462 | 8,808,291 |
| Gold (in oz) | 27,627 | 27,216 | 25,501 |
| Mining Production—Zinc Equivalent Production | |||
| Cerro Lindo (in tonnes of zinc equivalent) | 214,068 | 241,438 | 243,069 |
| Vazante (in tonnes of zinc equivalent) | 151,911 | 136,643 | 146,222 |
| El Porvenir (in tonnes of zinc equivalent) | 121,164 | 114,921 | 104,283 |
| Atacocha (in tonnes of zinc equivalent) | 35,068 | 38,767 | 33,382 |
| Aripuanã (in tonnes of zinc equivalent) | 51,815 | 1,676 | - |
| Morro Agudo (in tonnes of zinc equivalent) | 37,049 | 31,218 | 30,110 |
| Total | 611,075 | 564,663 | 557,066 |
The following table summarizes the average ore grade for the periods indicated.
For the Year Ended December 31, | |||
2023 | 2022 | 2021 | |
| Average Ore Grade | |||
| Zinc (%) | 2.89 | 2.78 | 2.98 |
| Copper (%) | 0.34 | 0.34 | 0.31 |
| Lead (%) | 0.66 | 0.62 | 0.51 |
| Silver (in ounces per tonne) | 1.02 | 1.07 | 0.95 |
| Gold (in ounces per tonne) | 0.005 | 0.005 | 0.005 |
|
| For the Year Ended |
| ||||
|
| 2017 |
| 2016 |
| 2015 |
|
Average Ore Grade |
|
|
|
|
|
|
|
Zinc (%) |
| 3.30 |
| 3.47 |
| 3.73 |
|
Copper (%) |
| 0.42 |
| 0.40 |
| 0.41 |
|
Lead (%) |
| 0.53 |
| 0.57 |
| 0.55 |
|
Silver (in grams per tonne) |
| 27.99 |
| 29.24 |
| 28.30 |
|
Gold (in grams per tonne) |
| 0.31 |
| 0.31 |
| — |
|
Each mine consists of one mine, one treatment plant and related infrastructure as summarized in the following table and further described below.
|
|
| ||
|
|
| ||
|
|
| ||
|
|
| ||
|
|
| ||
|
|
|
(1) The Cerro Lindo unit has an authorized capacity of 20,000 tonnes of ore per day, but Peruvian law allows units to operate at a capacity 5.0% higher than its authorized capacity.
infrastructure. We summarize below certain production information as of December 31, 20172023 for each of our five mines.six mines, including Aripuanã. For an overview of our reserves and resources, see “Mineral Reserves and Resources—Disclosure of Mineral Reserves and Resources”, “Mineral Reserves and Resources—Mineral Reserves” and “Mineral Reserves and Resources—Mineral Resources.”
Cerro Lindo
Location and means of access
The Cerro Lindo mine is an underground, polymetallic mine located in the Chavín District, Chincha Province, Peru, approximately 268 kilometerskm southeast of Lima and 60 kilometerskm from the coast. Access from Lima is available via the paved Pan American Highway south to Chincha, and then via an unpaved road up the Topará River valley to the mine site. Internal roadways connect the various mine-sitemine site components. The projectapproximate coordinates of the mine are 392,780m East and 8,554,165m North, using the Universal Transverse Mercator WGS84 datum and the mine site is located at an average elevation of 2,000 meters above sea level.
History
Several companies have held interests in the Cerro Lindo mine area, including BTX, Phelps Dodge, and Nexa Peru. Exploration work completed to date includes geological mapping, rock chip and soil sampling, trenching, ground geophysical surveys, and exploration, definition and underground operational core drilling. Feasibility studies were completed in 2002 and 2005, with mine construction commencing in 2006. Formal production started in 2007, and the mine has been operational since that date.
| 37 |
| Mining Operations |
Title, leases and options
All mineral concessions are held in the name of Nexa Peru. The tenure consists of 4368 mining concessions four mining claims,totaling approximately 43,827.8 hectares and one beneficiation concession, totaling approximately 26.677.48covering an area of 518.8 hectares. All but one of the mining concessions were granted and duly recorded in the public registry. Certain mineral concessions are currently subject to a penalty of US$20/hectare since the minimum required levels of production or exploration expenditures stipulated under Peruvian regulations have not been met.
Nexa Peru currently holds surface rights or easements for the following infrastructure at Cerro Lindo: mine site;site, access road,roads, power transmission line and water pipeline for the mine, old and new power transmission lines to Cerro Lindo, desalination plant, water process plant, and the water pipeline from the desalination plant to the mine site. There is sufficient suitable land available within the mineral tenure held by Nexa Peru for tailings disposal, mine waste disposal and installations such as the process plant and related mine infrastructure.
Cerro Lindo is not currently subject to third-partypayment of royalties. WhenThe tax stability agreement expired on December 31, 2021, and the current Tax Stability Agreement expires in 2021, Nexa Peru will be requiredhistorical applicability thereof is subject to pay levies to the Peruvian government for 2022, the last year of the proposed mine life.certain disputes with tax authorities. For more information, see “Regulatory“Additional Information—Legal Proceedings—Other legal proceedings.” As of January 2022, Nexa Peru is required to pay royalties and special mining tax to the Peruvian government. For more information, see “Information on the Company—Regulatory matters—Peruvian regulatory framework.” As of December 31, 2017,2023, Nexa Peru hashad a total of six water licenses, one for use of seawater, and the remaining five for ground water extraction.
Cerro Lindo holds a number of permits in support of the current operations. The permits are Directorial Resolutions issued by the Peruvian authorities upon approval of mining environmental impact assessments filed by the mining companies. Nexa Peru maintains an up-to-date record of the legal permits obtained to date.
Mineralization
Cerro Lindo is classified as a volcanogenic massive sulfide (or VMS)(“VMS”) deposit. The Cerro Lindo deposit is 1,500 meters long, 1,000 meters wide, and has a current vertical development of 470 meters.meters below the surface. Mineralization consists
of at least 10 discrete mineralized zones. The Cerro Lindo deposit comprises lens-shaped massive bodies, composed of pyrite (50.0% to 90.0%), yellow sphalerite, brown sphalerite, chalcopyrite, and minor galena. Significant barite is present mainly atin the upper portions of the deposit. A secondary-enrichment zone, composed of chalcocite and covellite, has formed near-surfacenear the surface where massive sulfides have oxidized. Silver-rich powdery barite remains at the surface as a relic of sulfide oxidation and leaching.
In 2023, mineral exploration in Cerro Lindo focused on extensions of known ore bodies to the southeast of Cerro Lindo and on the Pucasalla target, as well as starting drilling tests at the Patahuasi Millay target, located 500 meters to the northwest of Cerro Lindo mine. Underground activities in 2023 included drilling at OB-8 and OB-9 to extend the known mineralized bodies near the mine, at geophysical anomaly zones in Patahuasi Millay, as well as Pucasalla to find new mineralized zones through surface drilling.
During 2023, we completed approximately 27.5 km of diamond drilling in 29 drill holes, divided between surface and underground exploration drillings. By the end of 2023, the drill holes from surface in Pucasalla target and its extensions confirmed evidence of sulfide mineralization with lens of sphalerite, galena and chalcopyrite in a dacite host rock with gangue of barite. In underground, the focus was to confirm the continuity of the mineralization in orebody OB-8 and OB-9.
During 2024, we expect to complete a total of 23.1 km of exploratory drilling. Our goals are to continue the exploratory drilling program to identify new mineralized zones supported by new access and platforms construction in Patahuasi Millay, Pucasalla and extensions, and continue extending the known orebodies such as OB-8 and OB-9.
In 2023, we spent US$6.8 million in exploration expenses for Cerro Lindo, primarily associated with diamond drilling, geochemistry analysis and geological research works. We have budgeted US$7.8 million for 2024 to continue our exploration program, as data interpretations, geochemistry, geophysical and exploratory drilling campaign.
| 38 |
| Mining Operations |
Operations and infrastructure
The Cerro Lindo mine is completelysubstantially mechanized, using rubber-tired equipment for all development and production operations. There is no shaft; all access areis through 15 portals servicing adits, drifts and declines. Ore is extracted from nine separate orebodies,ore bodies and delivered to the process plant via a series of conveyors. All ore is commingled during transport to the concentrator stockpile; ore from different orebodiesore bodies is not segregated.
AllWe have completed construction of all key infrastructure required for mining and processing operations, is constructed, including the underground mine, access roads, powerlines,power lines, water pipelines, the desalination plant, offices and warehouses, accommodations, the process plant/concentrator, conveyor systems, waste rock facilities, temporary ore stockpiles, the paste-fill plant and the dry-stack tailings storage facilities. A new fresh waterfreshwater pipeline from the desalination plant on the coast to the mine was completed in February 2020 and is projected to be completed during 2019.operational. The national grid supplies electrical power for the mine site.
In 2017,2023, we spent US$7.537.7 million on sustaining capital expenditures for Cerro Lindo, primarily associated with mine development, equipment replacement and other major infrastructure projects.
In March 2023, production at the developmentCerro Lindo mine was suspended due to heavy rainfall levels and maintenanceoverflowing rivers caused by cyclone Yaku, resulting in the partial flooding of some lower levels of the mine. In April 2023, Cerro Lindo resumed operations at full capacity. During the temporary suspension, Nexa remained focused on the security and reparation of the mine and took all measures to ensure the safety and well-being of its employees, contractors and host communities. The temporary suspension of the mine resulted in lower production in 2023 compared to 2022.
Production
The Cerro Lindo mine is in the production stage and has a treatment plant and equipment.
Production
capacity of 21,000 tonnes of ore per day. The Cerro Lindo unit has an authorized capacity of 20,000 tonnes of ore per day, but Peruvian law allows units to operate at a capacity 5.0% higher than their authorized capacity. The table below summarizes the Cerro Lindo mine’s concentrate production, metal contained in concentrates produced and average grades for the periods indicated. Production in 2023 was lower than 2022 primarily as a result of a two-week production suspension in March due to unusual heavy rainfall levels and lower grades.
For the Year Ended December 31, | |||
2023 | 2022 | 2021 | |
| Treatment ore (in tonnes) | 5,991,156 | 6,236,058 | 6,369,044 |
| Average ore grade | |||
| Zinc (%) | 1.51 | 1.55 | 1.79 |
| Copper (%) | 0.57 | 0.61 | 0.54 |
| Lead (%) | 0.31 | 0.33 | 0.28 |
| Silver (ounces per tonne) | 0.80 | 0.89 | 0.79 |
| Gold (ounces per tonne) | 0.002 | 0.002 | 0.002 |
| Metal contained in concentrates production | |||
| Zinc (in tonnes) | 78,209 | 84,392 | 102,275 |
| Copper (in tonnes) | 28,588 | 32,758 | 29,102 |
| Lead (in tonnes) | 13,042 | 15,641 | 12,849 |
| Silver (in oz) | 3,540,975 | 4,129,736 | 3,813,731 |
| Gold (in oz) | 3,418 | 4,146 | 4,829 |
| Cash Cost, net of by-product credits (in US$/t) | (138.6) | (561.4) | (530.1) |
| Cash Cost, net of by-product credits (in US$/lb) | (0.06) | (0.25) | (0.24) |
| Non-Expansion Capital Expenditures (in millions of US$) | 43.3 | 42.5 | 40.5 |
|
| As of and for the Year Ended |
| ||||
|
| 2017 |
| 2016 |
| 2015 |
|
Treatment Ore (in tonnes) |
| 7,297,624 |
| 7,345,201 |
| 6,760,519 |
|
Average Ore Grade |
|
|
|
|
|
|
|
Zinc (%) |
| 2.33 |
| 2.56 |
| 2.83 |
|
Copper (%) |
| 0.69 |
| 0.66 |
| 0.68 |
|
Lead (%) |
| 0.27 |
| 0.29 |
| 0.30 |
|
Silver (grams per tonne) |
| 21.55 |
| 22.64 |
| 23.22 |
|
Gold (grams per tonne) |
| — |
| — |
| — |
|
Concentrate Production |
|
|
|
|
|
|
|
Zinc concentrates (in tonnes) |
| 264,377 |
| 295,082 |
| 300,870 |
|
Copper concentrates (in tonnes) |
| 166,595 |
| 154,362 |
| 147,488 |
|
Lead concentrates (in tonnes) |
| 22,791 |
| 24,526 |
| 23,237 |
|
Metal Contained in Concentrates Production |
|
|
|
|
|
|
|
Zinc (in tonnes) |
| 155,950 |
| 173,808 |
| 176,992 |
|
Copper (in tonnes) |
| 43,568 |
| 40,636 |
| 38,584 |
|
Lead (in tonnes) |
| 14,837 |
| 15,834 |
| 15,191 |
|
Silver (in oz.) |
| 3,545,824 |
| 3,598,294 |
| 3,331,796 |
|
Gold (in oz.) |
| 4,022 |
| 4,199 |
| 3,883 |
|
Cash Cost, After By-Product Credits (in US$/tonne) |
| (188.6 | ) | 259.1 |
| 350.1 |
|
Cash Cost, After By-Product Credits (in US$/lb.) |
| (0.09 | ) | 0.12 |
| 0.16 |
|
Capital Expenditures (in millions of US$) |
| 7.5 |
| 18.7 |
| 16.2 |
|
Mineral Reserves and Mineral Resources
The Cerro Lindo Mineral Reserves estimates are based on the definitions for Mineral Reserves in SK-1300 and the tables below are based on costs and modifying factors from the Cerro Lindo mine.
| 39 |
| Mining Operations |
El PorvenirCerro Lindo – Year End Mineral Reserves as of December 31, 2023 (on an 83.48% Nexa attributable ownership basis) (1)
| Grade | Contained Metal | ||||||||||
| Class | Tonnage (2) | Zinc | Copper | Silver | Lead | Gold | Zinc | Copper | Silver | Lead | Gold |
| (Mt) | (%) | (%) | (g/t) | (%) | (g/t) | (kt) | (kt) | (koz) | (kt) | (koz) | |
| Proven | 21.83 | 1.68 | 0.61 | 21.2 | 0.20 | - | 367.1 | 132.6 | 14,863 | 44.1 | - |
| Probable | 12.52 | 1.15 | 0.45 | 25.2 | 0.24 | - | 144.3 | 56.8 | 10,154 | 29.9 | - |
| Total | 34.36 | 1.49 | 0.55 | 22.6 | 0.22 | - | 511.4 | 189.4 | 25,017 | 74.1 | - |
Notes:
| 1. | Subpart 1300 of Regulation S-K definitions were followed for Mineral Reserves, which also are consistent with the CIM (2014) definitions. |
| 2. | Mineral Reserves data presented in this table are reported on 83.48% Nexa attributable ownership. |
| 3. | The Qualified Person for the Mineral Reserves estimate is Cristovao Teofilo dos Santos, B.Eng., FAusIMM, a Nexa employee. |
| 4. | Numbers may not add due to rounding. |
| 5. | The point of reference for Mineral Reserves in this table is mill feed materials. |
Cerro Lindo – Year End Mineral Reserves as of December 31, 2023 (on a 100% ownership basis) (1)
| Grade | Contained Metal | ||||||||||
| Class | Tonnage (2) | Zinc | Copper | Silver | Lead | Gold | Zinc | Copper | Silver | Lead | Gold |
| (Mt) | (%) | (%) | (g/t) | (%) | (g/t) | (kt) | (kt) | (koz) | (kt) | (koz) | |
| Proven | 26.15 | 1.68 | 0.61 | 21.2 | 0.20 | - | 439.7 | 158.8 | 17,803 | 52.8 | - |
| Probable | 15.00 | 1.15 | 0.45 | 25.2 | 0.24 | - | 172.9 | 68.1 | 12,163 | 35.9 | - |
| Total | 41.15 | 1.49 | 0.55 | 22.6 | 0.22 | - | 612.6 | 226.9 | 29,966 | 88.7 | - |
Notes:
| 1. | Subpart 1300 of Regulation S-K definitions were followed for Mineral Reserves, which also are consistent with the CIM (2014) definitions. |
| 2. | Mineral Reserves data presented in this table represents 100% of the Mineral Reserves estimates for the property. Nexa owns 83.48% |
| 3. | The Qualified Person for the Mineral Reserves estimate is Cristovao Teofilo dos Santos, B.Eng., FAusIMM, a Nexa employee. |
| 4. | Numbers may not add due to rounding. |
| 5. | The point of reference for Mineral Reserves in this table is mill feed materials. |
The Cerro Lindo Mineral Reserves are estimated at an NSR cut-off value of US$40.86/t processed. A number of incremental material (with values between US$32.99/t and US$40.86/t) was included. A minimum mining width of 5.0 m was used, inclusive of extraction factors and dilution are applied based on stope type and location. The net smelter return (“NSR”) cut-off value is determined using the mineral reserve metal prices, metal recoveries, concentrate transport, treatment and refining costs, as well as mine operating costs. Metal prices used for Mineral Reserves are based on consensus, long term forecasts from banks, financial institutions and other sources. Mineral Reserves estimates are based on average long-term metal prices of: zinc: US$2,799.04/t (US$1.27/lb); copper: US$7,669.61/t (US$3.48/lb); lead: US$2,000.29/t (US$0.91/lb); and silver: US$21.17/oz. Metallurgical recoveries are accounted for in NSR calculations based on historical processing data and are variable as a function of head grade. Recoveries at Life of Mine average head grades are 88.36% for Zn, 85.23% for Cu, 66.53% for Pb, and 68.78% for Ag. The current life of mine (“LOM”) plan continues to 2030.
Cerro Lindo – Net Difference in Mineral Reserves between December 31, 2023 versus December 31, 2022 (on an 83.48% Nexa attributable ownership basis)
| Contained Metal | ||||||||||||
| Class | Tonnage | Zinc | Copper | Silver | Lead | Gold | ||||||
| (Mt) | % | (kt) | % | (kt) | % | (koz) | % | (kt) | % | (koz) | % | |
| Proven | (0.21) | (0.9) | (18.8) | (4.9) | (9.3) | (6.5) | (33) | (0.2) | (2.6) | (5.7) | - | - |
| Probable | (0.03) | (0.2) | (13.2) | (8.4) | (5.5) | (8.8) | 16 | 0.2 | 0.7 | 2.5 | - | - |
| Total | (0.23) | (0.7) | (32.0) | (5.9) | (14.8) | (7.2) | (18) | (0.1) | (1.9) | (2.5) | - | - |
| 40 |
| Mining Operations |
Cerro Lindo – Net Difference in Mineral Reserves between December 31, 2023 versus December 31, 2022 (on a 100% ownership basis)
| Contained Metal | ||||||||||||
| Class | Tonnage | Zinc | Copper | Silver | Lead | Gold | ||||||
| (Mt) | % | (kt) | % | (kt) | % | (koz) | % | (kt) | % | (koz) | % | |
| Proven | (0.25) | (0.9) | (22.5) | (4.9) | (11.1) | (6.5) | (40) | (0.2) | (3.2) | (5.7) | - | - |
| Probable | (0.03) | (0.2) | (15.8) | (8.4) | (6.6) | (8.8) | 19 | 0.2 | 0.9 | 2.5 | - | - |
| Total | (0.28) | (0.7) | (38.3) | (5.9) | (17.7) | (7.2) | (21) | (0.1) | (2.3) | (2.5) | - | - |
In comparison to 2022, Cerro Lindo’s Mineral Reserves slightly decreased by 0.7% in mass to total 41.2 Mt from 41.4Mt and decreased by 5.9% in zinc content (kt), mainly due to a 5.1% decrease in Mineral Reserves average head grade, as a result of the depletion in higher grade areas, lower grades in areas upgraded from infill drilling and a lower cut-off grade. Mineral Reserve depletion during 2023 represented 6.0Mt containing 90.3kt of zinc.
Cerro Lindo – Year End Mineral Resources as of December 31, 2023 (on an 83.48% Nexa attributable ownership basis) (1)
| Grade | Contained Metal | ||||||||||
| Class | Tonnage (2) | Zinc | Copper | Silver | Lead | Gold | Zinc | Copper | Silver | Lead | Gold |
| (Mt) | (%) | (%) | (g/t) | (%) | (g/t) | (kt) | (kt) | (koz) | (kt) | (koz) | |
| Measured | 3.67 | 1.93 | 0.65 | 23.1 | 0.24 | - | 70.9 | 23.9 | 2,728 | 8.8 | - |
| Indicated | 2.75 | 1.06 | 0.47 | 24.4 | 0.22 | - | 29.2 | 12.9 | 2,161 | 6.1 | - |
| Total | 6.43 | 1.56 | 0.57 | 23.7 | 0.23 | - | 100.1 | 36.8 | 4,889 | 14.9 | - |
| Inferred | 7.75 | 1.54 | 0.25 | 32.6 | 0.42 | - | 119.3 | 19.4 | 8,119 | 32.6 | - |
Notes:
| 1. | Subpart 1300 of Regulation S-K definitions were followed for Mineral Resources, which also are consistent with the CIM (2014) definitions. |
| 2. | Mineral Resources Tonnes and Contained Metal presented in this table are reported on 83.48% Nexa attributable ownership. |
| 3. | Mineral Resources are reported exclusive of those Mineral Resources that were converted to Mineral Reserves, and Mineral Resources are not Mineral Reserves and do not have demonstrated economic viability. |
| 4. | The Qualified Person for the Mineral Resources estimate is Jerry Huaman Abalos, B.Geo., MAusIMM CP(Geo), a Nexa employee. |
| 5. | Numbers may not add due to rounding. |
| 6. | The point of reference for Mineral Resources in this table is mill feed materials. |
Cerro Lindo – Year End Mineral Resources as of December 31, 2023 (on a 100% ownership basis) (1)
| Grade | Contained Metal | ||||||||||
| Class | Tonnage (2) | Zinc | Copper | Silver | Lead | Gold | Zinc | Copper | Silver | Lead | Gold |
| (Mt) | (%) | (%) | (g/t) | (%) | (g/t) | (kt) | (kt) | (koz) | (kt) | (koz) | |
| Measured | 4.40 | 1.93 | 0.65 | 23.1 | 0.24 | - | 84.9 | 28.6 | 3,268 | 10.6 | - |
| Indicated | 3.30 | 1.06 | 0.47 | 24.4 | 0.22 | - | 35.0 | 15.5 | 2,589 | 7.3 | - |
| Total | 7.70 | 1.56 | 0.57 | 23.7 | 0.23 | - | 119.9 | 44.1 | 5,857 | 17.9 | - |
| Inferred | 9.28 | 1.54 | 0.25 | 32.6 | 0.42 | - | 142.9 | 23.2 | 9,726 | 39.0 | - |
| 41 |
| Mining Operations |
Notes:
| 1. | Subpart 1300 of Regulation S-K definitions were followed for Mineral Resources, which also are consistent with the CIM (2014) definitions. |
| 2. | Mineral Resources data presented in this table represents 100% of the Mineral Resources estimates for the property. Nexa owns 83.48%. |
| 3. | Mineral Resources are reported exclusive of those Mineral Resources that were converted to Mineral Reserves, and Mineral Resources are not Mineral Reserves and do not have demonstrated economic viability. |
| 4. | The Qualified Person for the Mineral Resources estimate is Jerry Huaman Abalos, B.Geo., MAusIMM CP(Geo), a Nexa employee. |
| 5. | Numbers may not add due to rounding. |
| 6. | The point of reference for Mineral Resources in this table is mill feed materials. |
The Cerro Lindo Mineral Resources estimates in the table above were completed using Datamine Studio RM (“Datamine”) and Seequent’s Leapfrog Geo (“Leapfrog”) software. Wireframes for geology and mineralization were constructed in Leapfrog based on geology sections, assay results, lithological information, underground mapping and structural data. Assays were capped to various levels based on exploratory data analysis and then composited to 2.5 m lengths. Wireframes were filled with blocks sub-celled at wireframe boundaries. Blocks were interpolated with grade using the Ordinary Krig (“OK”) and Inverse Distance to the cube (“ID3”) interpolation algorithms. Block estimates were validated using industry standard validation techniques. Classification of blocks used distance-based and other criteria. Mineral Resources estimates were reported using all the material within resource shapes generated in Deswik Stope Optimizer (“DSO”) software. The estimate satisfied the minimum mining width of 4.0 m for resource shapes and used NSR cut-off value of US$40.86/t. Mineral Resources estimates are based on average long-term metal prices of: zinc: US$3,218.90/t (US$1.46/lb); copper: US$8,820.05/t (US$4.00/lb); lead: US$2,300.33/t (US$1.04/lb); and silver: US$24.35/oz. Metallurgical recoveries are accounted for in NSR calculations based on historical processing data and are variable as a function of head grade. Recoveries at Life of Mine average head grades are 88.36% for Zn, 85.23% for Cu, 66.53% for Pb, and 68.78% for Ag.
Cerro Lindo – Net Difference in Mineral Resources between December 31, 2023 versus December 31, 2022 (on an 83.48% Nexa attributable ownership basis)
| Contained Metal | ||||||||||||
| Class | Tonnage | Zinc | Copper | Silver | Lead | Gold | ||||||
| (Mt) | % | (kt) | % | (kt) | % | (koz) | % | (kt) | % | (koz) | % | |
| Measured | (0.82) | (18.2) | (11.7) | (14.2) | (3.9) | (14.1) | (477) | (14.9) | (1.5) | (14.1) | - | - |
| Indicated | 0.06 | 2.4 | (1.7) | (5.4) | (0.3) | (2.0) | (53) | (2.4) | (0.4) | (6.2) | - | - |
| Total | (0.75) | (10.5) | (13.4) | (11.8) | (4.2) | (10.2) | (530) | (9.8) | (1.9) | (11.1) | - | - |
| Inferred | 0.66 | 9.3 | 2.3 | 2.0 | 2.4 | 13.9 | (338) | (4.0) | 0.7 | 2.1 | - | - |
Cerro Lindo – Net Difference in Mineral Resources between December 31, 2023 versus December 31, 2022 (on a 100% ownership basis)
| Contained Metal | ||||||||||||
| Class | Tonnage | Zinc | Copper | Silver | Lead | Gold | ||||||
| (Mt) | % | (kt) | % | (kt) | % | (koz) | % | (kt) | % | (koz) | % | |
| Measured | (0.98) | (18.2) | (14.1) | (14.2) | (4.8) | (14.4) | (572) | (14.9) | (1.8) | (14.5) | - | - |
| Indicated | 0.08 | 2.5 | (2.0) | (5.4) | (0.3) | (1.9) | (61) | (2.3) | (0.4) | (5.2) | - | - |
| Total | (0.90) | (10.5) | (16.1) | (11.8) | (5.1) | (10.4) | (633) | (9.8) | (2.2) | (10.9) | - | - |
| Inferred | 0.79 | 9.3 | 2.8 | 2.0 | 2.8 | 13.7 | (401) | (4.0) | 0.8 | 2.1 | - | - |
In comparison to 2022, Cerro Lindo’s Measured and Indicated Mineral Resources decreased by 10.5% in mass and by 11.8% in zinc content (kt), mainly due to the conversion to Mineral Reserves. In comparison to 2022, Cerro Lindo’s Inferred Mineral Resources increased by 9.3% in mass and by 2.0% in zinc content (kt), due to infill and brownfield drilling.
| 42 |
| Mining Operations |
For additional information, see the Technical Report Summary on Cerro Lindo, filed as Exhibit 15.1 to Nexa’s annual report on Form 20-F/A for the year-ended December 31, 2020, as filed on November 4, 2021.
Vazante
Location and means of access
The Vazante mine is an underground and open pit, polymetallic mine located about 8.5 km from the municipality of Vazante, in the state of Minas Gerais, Brazil. The approximate coordinates of the mine are 17 57’ 33” S and a longitude of approximately 46° 49’ 42” W, within Zone 23S of the Universal Transverse Mercator coordinate system (Corrego Alegre Datum) at approximately 306,000m E and 8,016,000m N and the mine area has elevations ranging from 690 to 970 meters above sea level. Access from Brasilia is via federal highway BR-040 toward Paracatu. Internal roadways connect the various mine-site components. Concentrates are trucked about 250 km to the Três Marias smelter. The closest commercial airport is located in Brasilia. The Vazante municipal airport for light aircraft is adjacent to the mine site.
History
Mineralization was initially exploited by artisanal miners during the 1950s. Mechanized open pit mining and underground mining commenced in 1969 and 1983, respectively. The current primary ore types mined are hydrothermal zinc silicates and willemite. Initial mining operations exploited supergene calamine ores and a mixture of the zinc secondary minerals hemimorphite and smithsonite, which are derived from the weathering of silicate ore.
Title, leases and options
Nexa Brazil owns 100.0% of the Vazante mine. Mineral concessions are divided into core tenements, where the known mineral deposits are located and where we have active mining operations and the surrounding exploration concessions. Nexa Brazil holds two mining concession applications, two mining concessions, and one group of mining concessions in the core area with a total area of 2,174.5 hectares. The group of mining concessions comprises six mining concessions, totaling an area of 819.5 hectares. The Mineral Reserves and Resources are located within the limits of two mining concession application and seven mining concessions with a total area of 1,864.6 hectares, which host the active mining operations. One mining concession (tenement # 14,840/1967), which is part of the group of mining concessions, has the potential to host zinc and lead mineralization, however it does not yet have associated mineral reserves and resources.
Nearby the main area, Nexa Brazil also holds three exploration applications totaling 1,140.6 hectares, 36 exploration authorizations totaling 25,647.1 hectares, one right to apply for mining concession totaling 344.5 hectares, one mining concession application totaling 190.0 hectares and one mining concession totaling 52.5 hectares, in addition to the core tenements.
Nexa Brazil holds surface rights sufficient to support the current operations. Some surface rights agreements require annual payments to the owners. Two easements have been granted in support of the mining activities. Sufficient suitable land is available within the mineral tenure held by Nexa Brazil for tailings disposal, mine waste disposal, and installations such as the process plant and related mine infrastructure.
Brazilian companies that hold mining concessions are subject to a royalty payment imposed by the National Mining Agency. For more information, see “Information on the Company—Regulatory matters—Brazilian regulatory framework—Royalties and other taxes on mining activities.”
Nexa Brazil holds nine licenses for water management and water use in the operations. Nexa Brazil has lodged renewal applications, where applicable, for the water management.
The Vazante Operation holds several permits in support of the current operations. The main instrument to regulate the Vazante Operation is a set of operating licenses issued by the COPAM from the state of Minas Gerais. The licenses are active, some of them under renewal process.
| 43 |
| Mining Operations |
Mineralization
The Vazante and Extremo Norte zinc deposits are epigenetic zinc silicate deposits, and Vazante is one of the largest deposits of its type worldwide. Mineralization exists within a sequence of pelitic carbonate rocks belonging to the Serra do Poço Verde formation of the Vazante group. The major structural control is the Vazante fault.
Mineral exploration activities in 2023 were focused on expanding the mineralization of known ore bodies, such as Extremo Norte and Sucuri Norte, and identifying the continuity of mineralized bodies along the Vazante hydrothermal breccia. We are conducting ongoing tests to explore extensions of known mineralization, intensifying drilling in areas near mine where minimal data is currently available, and identifying other areas where mineralization may be present.
In 2023, we completed approximately 7.3 km of diamond drilling, divided between exploratory (1.3 km) and extension drilling (6.0 km). The focus of the near mine extension drilling was on the extension of the Vazante mine ore bodies, exploring the target Extremo Norte and Sucuri Norte, which confirmed the mineralized system and opened lateral and depth continuity. In addition, the mineral exploration team continues to seek to identify new prospective areas, such as Vazante Sul, which confirmed the presence of mineralized breccia more than 10 km from Vazante mine.
In 2024, Nexa intends to continue extending the near mine orebodies such as Sucuri and Sucuri Norte, and to convert inferred resources into indicated resources in the BDMG area, which was acquired in 2022.
In 2023, we spent US$3.5 million on the Cerro Lindo brownfield program for life of mine extension, including drilling program and geological activities. In 2023, we drilled 12 exploration drill holes, totaling 7.3 km. We have budgeted US$4.7 million for the mine during 2024 and we expect to drill 12.4 km.
Operations and infrastructure
The Vazante operation consists of two mechanized underground mines, the Vazante mine and Extremo Norte Mine, currently operating at a rate of approximately 1.5 Mtpy. Production drilling operations have been performed by company personnel using a variety of drilling machines throughout the history of the Vazante mine.
The Vazante underground mine has been in operation since 1983 and is a fully mechanized mine using rubber-tired diesel equipment for development and production activities. Access is through two portals for Vazante and one portal for Extremo Norte. As development progresses at Extremo Norte, a connecting drift will be established from Vazante to Extremo Norte.
All infrastructure required for the current mining and processing operations has been constructed and is operational. This includes the underground mines, access roads, power lines, water pipelines, offices and warehouses, a process plant/concentrator, conveyor systems, waste rock facilities, temporary ore stockpiles, paste-fill plants, and tailings storage facilities.
The power supply to the Vazante operation is provided by one independent 138 kV transmission line that feeds the site and that can provide up to 55 MW. There are two 30/40 MVA and one 18/23 MVA transformers in the surface substation at the Vazante Operation and power is distributed to other areas of the mine at 13.8 kV and 440 V via secondary transformers to power mine equipment. The power demand by 2026 is expected to reach approximately 55 MW as dewatering demands continue to grow. There are two 700 kVA diesel generators on site to provide backup power to pump water out of the mine in case of main line interruption.
In 2023, we spent US$28.0 million on sustaining capital expenditures for this property, primarily associated with mine development, ramp deepening in the “Extremo Norte”, equipment replacement and other major infrastructure. In addition, we invested US$2.5 million in capital expenditures related to the Vazante mine deepening, focusing on expansion. For more information, see “Information on the Company—Mining Operations—Growth Projects—Vazante mine deepening project.”
| 44 |
| Mining Operations |
Production
The Vazante mine is in the production stage and has a treatment plant with a nominal design processing capacity of approximately 5,000 tonnes of ore per day. The table below summarizes the Vazante mine’s concentrate production, metal contained in concentrates produced and average grades for the periods indicated. Production in 2023 was higher than 2022 due to higher treated ore volumes and higher zinc grades.
For the Year Ended December 31, | |||
2023 | 2022 | 2021 | |
| Treatment ore (in tonnes) | 1,633,357 | 1,524,637 | 1,630,690 |
| Average ore grade | |||
| Zinc (%) | 10.19 | 9.97 | 9.98 |
| Lead (%) | 0.33 | 0.33 | 0.35 |
| Silver (ounces per tonne) | 0.67 | 0.63 | 0.67 |
| Metal contained in concentrate production | |||
| Zinc (in tonnes) | 145,662 | 131,527 | 140,500 |
| Lead (in tonnes) | 1,449 | 1,160 | 1,616 |
| Silver (in oz) | 575,636 | 473,578 | 500,549 |
| Cash cost, net of by-product credits (in US$/t) | 1,343.5 | 1,227.5 | 900.2 |
| Cash cost, net of by-product credits (in US$/lb) | 0.61 | 0.56 | 0.41 |
| Non-Expansion Capital Expenditures (in millions of US$) | 29.1 | 41.9 | 42.0 |
Mineral Reserves and Mineral Resources
The Vazante Mineral Reserves estimates are based on the definitions for Mineral Reserves in SK-1300 and the tables below are based on costs and modifying factors from the Vazante mine and Vazante Aroeira Tailings.
Vazante – Year End Mineral Reserves as of December 31, 2023 (on a 100% ownership basis)(1)
| Grade | Contained Metal | ||||||||||
| Class | Tonnage (2) | Zinc | Copper | Silver | Lead | Gold | Zinc | Copper | Silver | Lead | Gold |
| (Mt) | (%) | (%) | (g/t) | (%) | (g/t) | (kt) | (kt) | (koz) | (kt) | (koz) | |
| Proven | 5.49 | 9.84 | - | 17.1 | 0.23 | - | 539.8 | - | 3,023 | 12.5 | - |
| Probable | 7.96 | 8.00 | - | 9.9 | 0.21 | - | 636.7 | - | 2,521 | 16.6 | - |
| Total | 13.44 | 8.75 | - | 12.8 | 0.22 | - | 1,176.6 | - | 5,544 | 29.1 | - |
Notes:
| 1. | Subpart 1300 of Regulation S-K definitions were followed for Mineral Reserves, which also are consistent with the CIM (2014) definitions. |
| 2. | Mineral Reserves data presented in this table represents 100% of the Mineral Reserves estimates for the property. Nexa owns 100%. |
| 3. | The Qualified Person for the Mineral Reserves estimate is Vitor Marcos Teixeira de Aguilar, B.Eng., FAusIMM, a Nexa employee. |
| 4. | Numbers may not add due to rounding. |
| 5. | The point of reference for Mineral Reserves in this table is mill feed materials. |
| 6. | Mineral Reserves presented in this table include Mineral Reserves from Vazante mine and Vazante Aroeira Tailings. |
The Vazante Mineral Reserves estimates in the table above consider actual costs and modifying factors from the Vazante mine and Vazante Aroeira tailings, as well as operational level mine planning and budgeting. The dilution that has been applied is related to the selected mining method. The NSR cut-off value was determined using the mineral reserve metal prices, metal recoveries, transport, treatment and refining costs, as well as mine operating costs. The Vazante mine Mineral Reserves are estimated at a NSR cut-off value of US$66.31/t processed. A minimum mining width of 4.0 m. Recoveries for the Vazante mine at average head grades are 87.19% for Zn, 23.93% for Pb, and 42.00% for Ag. The Vazante Aroeira Tailings Mineral Reserves estimates in the table above consider actual costs and modifying factors from the Vazante Aroeira tailings, as well as operational level tailings storage facility (“TSF”) reclaiming plan and budgeting. The Vazante Aroeira Tailings Mineral Reserves are estimated at a NSR cut-off value of US$25.44/t processed. A minimum mining unit of 10m x 10m x 2m was applied. Recoveries for Vazante Aroeira Tailings at average head grades are 67.86% for Zn, 40.74% for Pb, and 42.00% for Ag. Metallurgical recoveries are
| 45 |
| Mining Operations |
accounted for in NSR calculations based on historical processing data and are variable as a function of head grade. Long-term metal prices used for Mineral Reserves are based on consensus and long-term forecasts from banks, financial institutions and other sources. Mineral Reserves estimates are based on average long-term metal prices of: zinc: US$2,799.04/t (US$1.27/lb); lead: US$2,000.29/t (US$0.91/lb); and silver: US$21.17/oz. The current LOM plan, based in our current reserves, continues to 2031.
Vazante – Net Difference in Mineral Reserves between December 31, 2023 versus December 31, 2022 (on a 100% ownership basis)
| Contained Metal | ||||||||||||
| Class | Tonnage | Zinc | Copper | Silver | Lead | Gold | ||||||
| (Mt) | % | (kt) | % | (kt) | % | (koz) | % | (kt) | % | (koz) | % | |
| Proven | (1.33) | (19.6) | (140.8) | (20.7) | - | - | (926) | (23.4) | (8.0) | (39.0) | - | - |
| Probable | 1.28 | 19.1 | 15.5 | 2.5 | - | - | (148) | (5.6) | 1.2 | 7.6 | - | - |
| Total | (0.06) | (0.4) | (125.2) | (9.6) | - | - | (1,074) | (16.2) | (6.8) | (19.0) | - | - |
In comparison to 2022, Vazante’s Mineral Reserves decreased by 0.4% in mass and by 9.6% in zinc content (kt), mainly due to geotechnical restrictions in a high-grade area (Lumiadeira). The decrease in mass was lower than the decrease in zinc content due to the conversion of 2.1Mt from Indicated Mineral Resources to Proven Mineral Reserves from the Vazante Aroeira Tailings. Mineral Reserve depletion during 2023 accounted for 1.7Mt containing 184.3kt of zinc.
Vazante – Year End Mineral Resources as of December 31, 2023 (on an 100% ownership basis) (1)
| Grade | Contained Metal | ||||||||||
| Class | Tonnage (2) | Zinc | Copper | Silver | Lead | Gold | Zinc | Copper | Silver | Lead | Gold |
| (Mt) | (%) | (%) | (g/t) | (%) | (g/t) | (kt) | (kt) | (koz) | (kt) | (koz) | |
| Measured | 0.48 | 8.40 | - | 12.4 | 0.25 | - | 40.3 | - | 191 | 1.2 | - |
| Indicated | 1.40 | 9.64 | - | 4.0 | 0.08 | - | 135.0 | - | 182 | 1.1 | - |
| Total | 1.88 | 9.32 | - | 6.2 | 0.12 | - | 175.3 | - | 373 | 2.3 | - |
| Inferred | 13.43 | 9.97 | - | 12.6 | 0.22 | - | 1,338.8 | - | 5,456 | 29.1 | - |
Notes:
| 1. | Subpart 1300 of Regulation S-K definitions were followed for Mineral Resources, which also are consistent with the CIM (2014) definitions. |
| 2. | Mineral Resources data presented in this table represents 100% of the Mineral Resources estimates for the property. Nexa owns 100% of property. |
| 3. | Mineral Resources are reported exclusive of those Mineral Resources that were converted to Mineral Reserves, and Mineral Resources are not Mineral Reserves and do not have demonstrated economic viability. |
| 4. | The Qualified Person for the Mineral Resources estimate is José Antonio Lopes, B.Geo., FAusIMM, a Nexa employee. |
| 5. | Numbers may not add due to rounding. |
| 6. | The point of reference for Mineral Resources in this table is mill feed materials. |
| 7. | Mineral Resources presented in this table include Mineral Resources from the Vazante mine and Vazante Aroeira Tailings. |
The Vazante Mineral Resources estimates in the table above were completed using Datamine and Leapfrog software. The Mineral Resources at Vazante comprise three styles of mineralization. The first style of mineralization is represented by the hypogene (Willemite) mineralized zones that are found in the underground portions of the Vazante and Extremo Norte deposits. The second style of mineralization is represented by the supergene (Calamine) mineralized zones found in the Cava 3A, Matas dos Paulistas, and Braquiara areas of the Extremo Norte and Vazante deposits. This supergene (Calamine) mineralization is referred to at the Vazante Operation as calamine mineralization and comprises a mixture of smithsonite and hemimorphite minerals. The third type of mineralization comprises tailings that are contained within the Aroeira TSF. The material found in the Aroeira tailings comprise a mixture of hypogene (willemite) and supergene (calamine) minerals. Mineral Resources estimates for the underground hypogene (willemite) mineralization are prepared within reporting panels using the native functions and workflows available through the DSO software package considering spatial continuity, a minimum width of 3.0 m and a NSR cut-off value of US$66.31/t for Hypogene Mineralization (Willemite). The Mineral Resources estimates for the supergene (calamine) mineralization are prepared using an open pit shell that considers appropriate metal prices, mining costs, metallurgical recoveries and geotechnical considerations with NSR cut-off value of US$23.13/t for soil and US$28.38/t for fresh rock and transition material. The Mineral Resources estimates for the tailings at Vazante are reported considering the material with an NSR value of greater than US$29.40/t which lies above the original topographic surface. Mineral Resources estimates are based on average long-term metal prices of: zinc: US$3,218.90/t (US$1.46/lb); lead: US$2,300.33/t (US$1.04/lb); and silver: US$24.35/oz. Metallurgical recoveries are accounted for in NSR calculations based on historical processing data and are variable as a function of head grade. Recoveries at LOM average: hypogene head grades are 87.19% for Zn, 23.93% for Pb, and 42.00% for Ag, supergene (calamine) is 55.00% for Zn, and tailings are 67.86% for Zn, 40.74% for Pb, and 42.00% for Ag.
| 46 |
| Mining Operations |
Vazante – Net Difference in Mineral Resources between December 31, 2023 versus December 31, 2022 (on an 100% ownership basis)
| Contained Metal | ||||||||||||
| Class | Tonnage | Zinc | Copper | Silver | Lead | Gold | ||||||
| (Mt) | % | (kt) | % | (kt) | % | (koz) | % | (kt) | % | (koz) | % | |
| Measured | (0.15) | (23.8) | (12.1) | (23.1) | - | - | (109) | (36.3) | (0.3) | (20.0) | - | - |
| Indicated | (2.50) | (64.1) | (98.0) | (42.1) | - | - | (676) | (78.8) | (6.5) | (85.5) | - | - |
| Total | (2.65) | (58.5) | (110.1) | (38.6) | - | - | (785) | (67.8) | (6.8) | (74.7) | - | - |
| Inferred | (1.72) | (11.4) | (104.3) | (7.2) | - | - | (728) | (11.8) | (0.1) | (0.3) | - | - |
In comparison to 2022, Vazante’s Inferred Mineral Resources decreased by 11.4% in mass and decreased by 7.2% in zinc content (kt), mainly due to geotechnical restrictions. In comparison to 2022, Vazante’s Measured and Indicated Mineral Resources decreased by 58.5% in mass and decreased by 38.6% in zinc content (kt), mainly as a result of the conversion to Mineral Reserves at tailings dams.
For additional information, see the Technical Report Summary on Vazante, filed as Exhibit 15.3 to Nexa’s annual report on Form 20-F/A for the year-ended December 31, 2020, as filed on November 4, 2021.
Cerro Pasco Complex
The Cerro Pasco Complex consists of the El Porvenir underground mine, which produces zinc, copper, lead, silver and gold; the Atacocha San Gerardo open pit mine, producing zinc, lead, silver and gold; and the Atacocha underground mine, which has been suspended since 2020 and remains under care and maintenance due to our efforts to reduce costs and improve our operational efficiency.
The Atacocha and El Porvenir mines are located in Peru, specifically in the province of Pasco, which is a region recognized for its intensive mineral economic activities, where many polymetallic mines have been operating for several decades.
El Porvenir is an underground mine with multiple accesses and a shaft where the mined ore is extracted and where workers and inputs are also transported. There are multiple accesses to the Atacocha underground mine from the surface and the mine is currently connected to the El Porvenir mine through two active tunnels located at 4070 and 3300 levels. These tunnels are used by operators of heavy mine equipment and conventional trucks, as well as for transporting mining crews between the Atacocha surface and the El Porvenir mine.
Currently, production from the Atacocha San Gerardo open pit mine feeds the Atacocha processing plant with a nominal throughput capacity of 4,400 tonnes of ore per day, while production from the El Porvenir underground mine feeds the El Porvenir processing plant with a nominal throughput capacity of 6,500 tonnes of ore per day. The Atacocha processing plant is expected to be decommissioned by 2027, when the Atacocha San Gerardo pit reaches the end of its mine life based on our current depletion schedule.
| 47 |
| Mining Operations |
Integration Project
The Cerro Pasco Complex integration project (“Integration Project”) involves the continued integration of the El Porvenir and Atacocha underground mines. The Cerro Pasco Complex is a material property for the purposes of S-K 1300 comprising the two mines, El Porvenir and Atacocha. The Integration Project is intended to continue to capture synergies between the two mining operations, as a result of their proximity and operational similarities, with ore from both the underground mines being processed at the El Porvenir processing plant. The goal of the Integration Project is to achieve cost and investment savings, thereby reducing the environmental footprint and extending the combined life of mine of the two mines.
The Integration Project has been developed over the past few years. The first stage involved the administrative integration of both mines, completed in 2014. The second stage, completed in 2015, involved the integration of the tailings disposal system, which allowed the Atacocha plant to send its tailings to the El Porvenir dam in the short-term, thus contributing to the reduction of our environmental footprint. Operations of the integrated tailings disposal system began in 2016. The third stage, completed in 2016, involved the construction of a new 138-kilovolt (“kV”) energy transmission line connecting both mines, replacing the two previous 50 kV transmission lines. The fourth stage, concluded in 2019, involved the development of a 3.5 km tunnel connecting both underground mines, allowing us to initiate exploration programs in the integration zone between the two mines.
In 2021, modernization and debottlenecking studies to assess the mine deepening and the extension of the LOM of El Porvenir were postponed due to Nexa’s capital allocation strategy and the reassessment of the integration with the Atacocha underground mine. In 2022, we advanced the Integration Project with an optimization study to evaluate the increase in capacity of our tailings and El Porvenir shaft, in addition to enhancing the El Porvenir processing plant to potentially increase production and extend the life of mine of both mines.
In 2023, we continued to advance with the technical studies of the Integration Project, aiming to develop a robust organic growth option for Nexa. The technical studies for the Integration Project covered diverse areas, from mine planning to projects to sustain and expand production, such as studies for underground interconnection, shaft upgrade, engineering assessments, and key routes to increase capacity to provide a long-term solution for tailings disposal. A Front-End Loading 3 (“FEL3”) study to increase the El Porvenir hoisting was completed in 1Q23 and a FEL3 tailings pumping system study was also completed in 2Q23.
The Integration Project plan includes, among others areas: (i) the restart and rehabilitation of the Atacocha underground mine; (ii) the development of an approximately 2 km long connection tunnel (Tunnel 2900), which will connect the Atacocha underground mine to the bottom of the El Porvenir (Picasso) shaft, allowing the production from both underground mines to be hoisted and fed at the El Porvenir processing plant; (iii) the expansion of the Picasso shaft capacity to support production and extraction from both underground mines; (iv) the closure of the Atacocha processing plant, with the depletion of Atacocha’s open pit Mineral Reserves in 2027; and (v) the construction of a new tailings pumping and pipeline system, which will allow the tailings from the El Porvenir processing plant to be sent to the Atacocha tailings storage facility, providing for a long-term solution for our tailings disposal and supporting the extension of the mine life of the combined mines. Nexa also continues to advance on other work fronts related to the Integration Project, including to obtain the required environmental studies and permits.
As a result of the advancements in the technical studies in 2023, we increased the overall Mineral Reserves of the El Porvenir and Atacocha mines in the Cerro Pasco Complex. For additional information on the increase of Mineral Reserves, see “Information on the Company—Mining operations—El Porvenir—Mineral Reserves and Mineral Resources” and “Information on the Company— Mining operations—Atacocha—Mineral Reserves and Mineral Resources”.
For further information about our operations, infrastructure, production, and Mineral Reserves and Mineral Resources at the El Porvenir and Atacocha mines, see the Technical Report Summary on the Cerro Pasco Complex Integration, filed as Exhibit 15.2 of this annual report on Form 20-F. We expect to submit the Integration Project for formal approval by our Sustainability and Capital Projects (“SCP”) committee and our Board of directors in 2024 in order to establish the project’s governance such as: (i) implementation schedule; (ii) organizational chart; (iii) implementation of control routines; (iv) definition of responsibilities for each project component; and (v) cost management implementation.
| 48 |
| Mining Operations |
El Porvenir
Location and means of access
The El Porvenir mine is an underground, polymetallic mine located(located in the Cerro Pasco Complex) in the central Andes mountains region of Peru, specifically in the district of San Francisco de Asís de Yarusyacán, in the province of Pasco, Peru. The propertyapproximate coordinates of the mine are 367600m E, 8826850m N, using the Universal Transverse Mercator WGS84 datum, Z18S and the mine site is located in the central Andes mountains regionat an average elevation of Peru, at approximately 4,200 meters above sea level. The mine is situated at kilometer 340 of the Carretera Central Highway (Lima—Huánuco route), 13 kilometerskm from the city of Cerro de Pasco. The mine is located in the zone of the Central Cordillera zone, which contains the communities of Parán, Lacsanga and Santo Domingo de Apache.
History
The El Porvenir mine began its operation as small-scale artisanal mine in 1949. In 1953, a gravity separation plant was built with aWe have been investing in the mine since then and, in 2012, production reached its current capacity of 54,000 t/month of minerals with an average grade of 160 g/t of silver, 4.3% of lead and 6.5% of zinc, which was expanded successively until 1978.6,500 tonnes per day. In 1979, the construction of the flotation plant was completed, with the capacity to process 1,800 ktpd, with the ability to increase such capacity to 2,700 ktpd. The flotation plant includes electronically controlled material transport/elevation, crushing circuits, and ore concentrator systems. In 1997, a new mineralization zone was discovered. In 1999, production increased to 3,000 ktpd. In 2012, production further increased to 5,600 ktpd. In 2013,2014, we commenced the integration process with the Atacocha mine. In 2015,mine, as part of the second stage of integration, the El Porvenir tailings deposit was integrated with Atacocha’s. In 2016, the third stage of integration commenced involving the integration of energy supply.
As of December 31, 2017, we aredescribed above in the process of integrating our El Porvenir and Atacocha mine operations. The integration will support increased throughput at the El Porvenir plant with ore from the Atacocha mine. For additional information“Information on the integration of the El Porvenir and Atacocha mines, see “—Growth projects—Brownfield and integration projects—Company—Mining Operations—Cerro Pasco mining complex” below.Complex—Integration Project.
Title, leases and options
The El Porvenir mine is ownedoperated by Milpo Andina Peru,Nexa Resources El Porvenir S.A.C., a subsidiary of Nexa Peru in which Nexa Peru has directly and indirectly a 99.99%100% equity interest.
The El Porvenir mine has a total of 25 concessions covering approximately 4,850.794,846.7 hectares, as well as a beneficiation plant, “Acumulacion Aquiles 101”. With respect to the surface property at the El Porvenir project,mine, there is a mining site of 450.66450.8 hectares, where the mining concession is located, as well as additional surface property where tailings dams/ponds, camps sites and other ancillary infrastructure are located.
Mining operations at the El Porvenir mine are subject to certain royalties payable by Milpo Andina PeruNexa Resources El Porvenir S.A.C. For more information, see “Regulatory“Information on the Company—Regulatory matters—Peruvian regulatory framework—Royalties and other taxes on mining activities.”
The El Porvenir Mine holds several permits in support of the current operations. The permits are Directorial Resolutions issued by the Peruvian authorities upon approval of mining environmental management instruments filed by the mining companies. Nexa Peru maintains an up-to-date record of the legal permits obtained to date.
Mineralization
The El Porvenir mine is a typical skarn deposit. The mineralization occurs within the contact of the upper Triassic limestone (i.e., exoskarn) and the granodioritic-dacitic intrusive rocks (i.e., endoskarn). There are also recognized veins and replacement manto type, minor disseminated mineralization may occur within the intrusive units. West of the Milpo-Atacocha fault within the Goyllarisquizga Group, mineralization is characterized as veins and disseminations.
Four groups of vein/mineralized structures are reported. Structurally controlled veins are sub-vertical up to 150 meters long, with a vertical extent of 350 meters. Economic mineralogy is mostly comprised of galena, sphalerite, and tetrahedrite, as well as variable and lesser pyrite, quartz and rhodochrosite.
Throughout 2023, the exploration program at El Porvenir was focused on drilling in mineralized zones in the Integration target, seeking to evaluate the mineralization continuity in strike and at depth, with the goal of extending the life of mine. In 2023, we drilled 16 drill holes totaling 9.3 km of exploration drilling, which confirmed the Integration target extensions, with emphasis on the intermediate and lower levels of the unit.
In 2024, we will continue to focus our efforts on expanding mineralized zones in the integration area, with the potential to extend existing Mineral Resources. We expect to also drill other satellite targets such as Don Lucho, Veta AM and Porvenir 9.
| 49 |
| Mining Operations |
We spent approximately US$1.9 million on the El Porvenir brownfield program in 2023, including the drilling program and geological activities. We have budgeted US$1.6 million for 2024 activities, and we expect to drill 5.5 km.
Operations and infrastructure
The majorityMost of the exploration is generally conducted simultaneously with underground development, which involves diamond core drilling and channel sampling following underground drifting.
The El Porvenir projectmine site consists of an underground mine, tailings pond, waste rock stockpiles, a process facility with associated laboratory and maintenance facilities;facilities and maintenance buildings for underground and surface equipment. Facilities and structures include a warehouse, office, change house facilities, main shaft, ventilation shaft, backfill plant, explosives storage area, hydroelectric power generating hydroelectric,generation, power lines and substation, fuel storage tanks, a warehouse and laydown area and a permanent accommodation camp.
The electrical power supply for the projectmine comes from two sources: connection to the SEIN national power grid by a main substation located near the site, and the Candelaria Hydro, which consists of three turbines connected to the projectmine through the main substation by a transmission line. All other loads of the projectmine are fed from the main substation through overhead power lines. These power lines are used to deliver power to various locations to support activities during operation of the mine.
Site roads include main roads suitable for use by mining trucks that transport concentrates to Lima and service roads for use by smaller vehicles. The site roads are used by authorized mine personnel and equipment, with access controlled by Nexa Peru. An approximately 15 to 20 kilometer15-to-20-kilometer network of service roads was constructed to provide access to the underground mine, processing plant, tailings facility, waste rock stockpile, mine offices, workshops, mine camps and other surface infrastructure.
In 2017,2023, we spent US$19.968.7 million on sustaining capital expenditures for this property, primarily associated with mine development, the developmentrestoration of tailings dams, equipment replacement and maintenanceother major infrastructure.
Production
The El Porvenir mine is in the production stage and has a treatment plant capacity of plant and equipment.
Production
6,500 tonnes of ore per day. The table below summarizes the El Porvenir mine’s concentrate production, metal contained in concentrates produced and average grades for the periods indicated. Production in 2023 was higher than 2022 due to higher treated ore volumes and higher zinc grades.
For the Year Ended December 31, | |||
2023 | 2022 | 2021 | |
| Treatment ore (in tonnes) | 2,220,011 | 2,111,961 | 2,077,591 |
| Average ore grade | |||
| Zinc (%) | 2.86 | 2.80 | 2.83 |
| Copper (%) | 0.16 | 0.16 | 0.19 |
| Lead (%) | 1.37 | 1.34 | 1.08 |
| Silver (ounces per tonne) | 2.34 | 2.46 | 2.10 |
| Gold (ounces per tonne) | 0.011 | 0.012 | 0.011 |
| Metal contained in concentrate production | |||
| Zinc (in tonnes) | 55,825 | 51,561 | 51,375 |
| Copper (in tonnes) | 355 | 266 | 505 |
| Lead (in tonnes) | 24,937 | 23,195 | 17,700 |
| Silver (in oz) | 4,270,463 | 4,195,649 | 3,467,227 |
| Gold (in oz) | 8,696 | 9,204 | 8,725 |
| Cash Cost, net of by-product credits (in US$/t) | 630.6 | 727.7 | 832.2 |
| Cash Cost, net of by-product credits (in US$/lb) | 0.29 | 0.33 | 0.38 |
| Non-Expansion Capital Expenditures (in millions of US$) | 68.6 | 36.7 | 36.5 |
| 50 |
| Mining Operations |
Mineral Reserves and Mineral Resources
|
| As of and for the |
| ||||
|
| 2017 |
| 2016 |
| 2015 |
|
Treatment Ore (in tonnes) |
| 1,834,511 |
| 2,154,151 |
| 2,108,821 |
|
Average Ore Grade |
|
|
|
|
|
|
|
Zinc (%) |
| 2.86 |
| 3.22 |
| 3.21 |
|
Copper (%) |
| 0.13 |
| 0.14 |
| 0.17 |
|
Lead (%) |
| 1.04 |
| 0.99 |
| 0.93 |
|
Silver (grams per tonne) |
| 63.61 |
| 60.24 |
| 54.38 |
|
Gold (grams per tonne) |
| 0.48 |
| 0.50 |
| 0.38 |
|
Concentrate Production |
|
|
|
|
|
|
|
Zinc concentrates (in tonnes) |
| 92,446 |
| 121,204 |
| 119,249 |
|
Copper concentrates (in tonnes) |
| 2,460 |
| 2,950 |
| 5,062 |
|
Lead concentrates (in tonnes) |
| 28,726 |
| 31,209 |
| 29,275 |
|
Metal Contained in Concentrate Production |
|
|
|
|
|
|
|
Zinc (in tonnes) |
| 46,154 |
| 62,534 |
| 61,664 |
|
Copper (in tonnes) |
| 493 |
| 653 |
| 1,208 |
|
Lead (in tonnes) |
| 14,818 |
| 17,164 |
| 16,342 |
|
Silver (in oz.) |
| 2,357,442 |
| 2,715,143 |
| 2,629,073 |
|
Gold (in oz.) |
| 8,408 |
| 9,043 |
| 8,376 |
|
Cash Cost, After By-Product Credits (in US$/tonne) |
| 1,210.2 |
| 828.4 |
| 1,023.8 |
|
Cash Cost, After By-Product Credits (in US$/lb.) |
| 0.55 |
| 0.38 |
| 0.46 |
|
Capital Expenditures (in millions of US$) |
| 19.8 |
| 35.7 |
| 37.9 |
|
AtacochaThe El Porvenir Mineral Reserves estimates are based on the definitions for Mineral Reserves in SK-1300 and the tables below are based on costs and modifying factors from the El Porvenir mine.
El Porvenir – Year End Mineral Reserves as of December 31, 2023 (on an 83.48% Nexa attributable ownership basis) (1)
| Grade | Contained Metal | ||||||||||
| Class | Tonnage (2) | Zinc | Copper | Silver | Lead | Gold | Zinc | Copper | Silver | Lead | Gold |
| (Mt) | (%) | (%) | (g/t) | (%) | (g/t) | (kt) | (kt) | (koz) | (kt) | (koz) | |
| Proven | 3.27 | 4.09 | 0.24 | 75.2 | 1.29 | - | 133.8 | 7.9 | 7,907 | 42.0 | - |
| Probable | 8.96 | 4.11 | 0.22 | 72.1 | 1.17 | - | 368.7 | 20.0 | 20,759 | 104.6 | - |
| Total | 12.23 | 4.11 | 0.23 | 72.9 | 1.20 | - | 502.5 | 28.0 | 28,666 | 146.6 | - |
Notes:
| 1. | Subpart 1300 of Regulation S-K definitions were followed for Mineral Reserves, which also are consistent with the CIM (2014) definitions. |
| 2. | Mineral Reserves data presented in this table are reported on 83.48% Nexa attributable ownership. |
| 3. | The Qualified Person for the Mineral Reserves estimate is SLR Consulting (Canada) Ltd., an independent mining consulting firm. |
| 4. | Numbers may not add due to rounding. |
| 5. | The point of reference for Mineral Reserves in this table is mill feed materials. |
El Porvenir – Year End Mineral Reserves as of December 31, 2022 (on a 100% ownership basis) (1)
| Grade | Contained Metal | ||||||||||
| Class | Tonnage (2) | Zinc | Copper | Silver | Lead | Gold | Zinc | Copper | Silver | Lead | Gold |
| (Mt) | (%) | (%) | (g/t) | (%) | (g/t) | (kt) | (kt) | (koz) | (kt) | (koz) | |
| Proven | 3.92 | 4.09 | 0.24 | 75.2 | 1.29 | - | 160.3 | 9.5 | 9,472 | 50.3 | - |
| Probable | 10.73 | 4.11 | 0.22 | 72.1 | 1.17 | - | 441.6 | 24.0 | 24,867 | 125.3 | - |
| Total | 14.65 | 4.11 | 0.23 | 72.9 | 1.20 | - | 601.9 | 33.5 | 34,338 | 175.7 | - |
Notes:
| 1. | Subpart 1300 of Regulation S-K definitions were followed for Mineral Reserves, which also are consistent with the CIM (2014) definitions. |
| 2. | Mineral Reserves data presented in this table represents 100% of the Mineral Reserves estimates for the property. Nexa owns 83.48%. |
| 3. | The Qualified Person for the Mineral Reserves estimate is SLR Consulting (Canada) Ltd., an independent mining consulting firm. |
| 4. | Numbers may not add due to rounding. |
| 5. | The point of reference for Mineral Reserves in this table is mill feed materials. |
The El Porvenir Mineral Reserves estimates in the table above were prepared using DSO software, mine design and scheduling software. Mining methods used are C&F mining, using unconsolidated rock fill and hydraulic backfill, and SLS using unconsolidated rock fill. NSR values were calculated using mineral reserve metal prices, metallurgical recovery and consideration of smelter terms, including revenue from payable metals, price participation, penalties, smelter losses, transportation, treatment, refining and sales charges. A minimum mining width of 5.0 m for C&F mining and 4.0 m for SLS mining were used for reserves shapes and development design and are reported inclusive of extraction losses and dilution. Mineral Reserves were estimated at a NSR cut-off values ranging from US$63.77/t to US$67.04/t for SLS areas and US$65.77/t to US$69.04/t for C&F areas depending on the zone. Mineral Reserves estimates are based on average long-term metal prices of: zinc: US$2,799.04/t (US$1.27/lb); copper: US$7,669.61/t (US$3.48/lb); lead: US$2,000.29/t (US$0.91/lb); and silver: US$21.17/oz. Metallurgical recoveries are accounted for in NSR calculations based on historical processing data and are variable as a function of head grade. Recoveries at Life of Mine average head grades are 89.21% for Zn, 14.60% for Cu, 80.01% for Pb, and 77.51% for Ag. The current LOM plan continues to 2033. We continued to advance with the technical studies to optimize the integration of El Porvenir and Atacocha underground mines, and as a result of the advancements in the technical studies, we increased the overall Mineral Reserves of the Cerro Pasco Complex. For further information see “Information on the Company—Mining Operations—Cerro Pasco Complex—Integration Project.”
| 51 |
| Mining Operations |
El Porvenir – Net Difference in Mineral Reserves between December 31, 2023 versus December 31, 2022 (on an 83.48% Nexa attributable ownership basis)
| Contained Metal | ||||||||||||
| Class | Tonnage | Zinc | Copper | Silver | Lead | Gold | ||||||
| (Mt) | % | (kt) | % | (kt) | % | (koz) | % | (kt) | % | (koz) | % | |
| Proven | 1.15 | 54.2 | 55.3 | 70.5 | 3.4 | 76.2 | 3,289 | 71.2 | 18.4 | 77.9 | - | - |
| Probable | (1.86) | (17.2) | (19.2) | (4.9) | (0.8) | (4.0) | (2,084) | (9.1) | (10.0) | (8.7) | - | - |
| Total | (0.71) | (5.5) | 36.1 | 7.8 | 2.6 | 10.3 | 1,205 | 4.4 | 8.4 | 6.1 | - | - |
El Porvenir – Net Difference in Mineral Reserves between December 31, 2023 versus December 31, 2022 (on a 100% ownership basis)
| Contained Metal | ||||||||||||
| Class | Tonnage | Zinc | Copper | Silver | Lead | Gold | ||||||
| (Mt) | % | (kt) | % | (kt) | % | (koz) | % | (kt) | % | (koz) | % | |
| Proven | 1.38 | 54.2 | 66.3 | 70.5 | 4.1 | 76.2 | 3,940 | 71.2 | 22.0 | 77.9 | - | - |
| Probable | (2.23) | (17.2) | (23.0) | (4.9) | (1.0) | (4.0) | (2,495) | (9.1) | (12.0) | (8.7) | - | - |
| Total | (0.85) | (5.5) | 43.3 | 7.8 | 3.1 | 10.3 | 1,444 | 4.4 | 10.1 | 6.1 | - | - |
In comparison to 2022, El Porvenir’s Mineral Reserves decreased by 5.5% in mass, while increased by 7.8% in zinc content (kt). The decrease in mass was mainly due to the increase in NSR cut-off values, while the increase in zinc content was mainly due to higher grades as a result of block model improvements as well as additions from infill drilling. Mineral Reserve depletion during 2023 accounted for 2.2Mt containing 63.5kt of zinc.
El Porvenir – Year End Mineral Resources as of December 31, 2023 (on an 83.48% Nexa Attributable ownership basis) (1)
| Grade | Contained Metal | ||||||||||
| Class | Tonnage (2) | Zinc | Copper | Silver | Lead | Gold | Zinc | Copper | Silver | Lead | Gold |
| (Mt) | (%) | (%) | (g/t) | (%) | (g/t) | (kt) | (kt) | (koz) | (kt) | (koz) | |
| Measured | 0.55 | 3.47 | 0.27 | 57.7 | 0.95 | - | 19.1 | 1.5 | 1,023 | 5.3 | - |
| Indicated | 2.69 | 3.25 | 0.20 | 63.2 | 0.97 | - | 87.4 | 5.3 | 5,460 | 26.0 | - |
| Total | 3.24 | 3.29 | 0.21 | 62.2 | 0.97 | - | 106.5 | 6.8 | 6,483 | 31.3 | - |
| Inferred | 9.23 | 3.83 | 0.24 | 82.9 | 1.32 | - | 353.6 | 22.1 | 24,602 | 121.9 | - |
Notes:
| 1. | Subpart 1300 of Regulation S-K definitions were followed for Mineral Resources, which also are consistent with the CIM (2014) definitions. |
| 2. | Mineral Resources Tonnes and Contained Metal presented in this table are reported on 83.48% Nexa attributable ownership. |
| 3. | Mineral Resources are reported exclusive of those Mineral Resources that were converted to Mineral Reserves, and Mineral Resources are not Mineral Reserves and do not have demonstrated economic viability. |
| 4. | The Qualified Person for the Mineral Resources estimate is Jerry Huaman Abalos, B.Geo., MAusIMM CP(Geo), a Nexa employee. |
| 5. | Numbers may not add due to rounding. |
| 6. | The point of reference for Mineral Resources in this table is mill feed materials. |
| 52 |
| Mining Operations |
El Porvenir – Year End Mineral Resources as of December 31, 2023 (on a 100% ownership basis) (1)
| Grade | Contained Metal | ||||||||||
| Class | Tonnage (2) | Zinc | Copper | Silver | Lead | Gold | Zinc | Copper | Silver | Lead | Gold |
| (Mt) | (%) | (%) | (g/t) | (%) | (g/t) | (kt) | (kt) | (koz) | (kt) | (koz) | |
| Measured | 0.66 | 3.47 | 0.27 | 57.7 | 0.95 | - | 22.9 | 1.8 | 1,225 | 6.3 | - |
| Indicated | 3.22 | 3.25 | 0.20 | 63.2 | 0.97 | - | 104.7 | 6.4 | 6,540 | 31.2 | - |
| Total | 3.88 | 3.29 | 0.21 | 62.2 | 0.97 | - | 127.6 | 8.2 | 7,765 | 37.5 | - |
| Inferred | 11.06 | 3.83 | 0.24 | 82.9 | 1.32 | - | 423.6 | 26.5 | 29,471 | 146.0 | - |
Notes:
| 1. | Subpart 1300 of Regulation S-K definitions were followed for Mineral Resources, which also are consistent with the CIM (2014) definitions. |
| 2. | Mineral Resources data presented in this table represents 100% of the Mineral Resources estimates for the property. Nexa owns 83.48%. |
| 3. | Mineral Resources are reported exclusive of those Mineral Resources that were converted to Mineral Reserves, and Mineral Resources are not Mineral Reserves and do not have demonstrated economic viability. |
| 4. | The Qualified Person for the Mineral Resources estimate is Jerry Huaman Abalos, B.Geo., MAusIMM CP(Geo), a Nexa employee. |
| 5. | Numbers may not add due to rounding. |
| 6. | The point of reference for Mineral Resources in this table is mill feed materials. |
The El Porvenir Mineral Resources estimates in the table above were completed using Datamine and Leapfrog software. Wireframes for geology and mineralization were constructed in Leapfrog based on geology sections, assay results, lithological information, underground mapping and structural data. Assays were capped to various levels based on exploratory data analysis and then composited to 1.0 m lengths. Wireframes were filled with blocks and sub-celling at wireframe boundaries. Blocks were interpolated with grade using the OK and ID3 interpolation algorithms. Block estimates were validated using industry standard validation techniques. Classification of blocks used distance-based and mineralization continuity criteria. Mineral Resources are reported using all the material within resource shapes generated in DSO software, satisfying minimum mining width of 4.0 m in areas with C&F stopes shapes and 3.0 m for SLS stopes. The Mineral Resources are estimated at a NSR cut-off grade values ranging from US$63.77/t to US$67.04/t for SLS areas and US$65.77/t to US$69.04/t for C&F areas depending on the zone. Mineral Resources estimates are based on average long-term metal prices of: zinc: US$3,218.90/t (US$1.46/lb); copper: US$8,820.05/t (US$4.00/lb); lead: US$2,300.33/t (US$1.04/lb); and silver: US$24.35/oz. Metallurgical recoveries are accounted for in NSR calculations based on historical processing data and are variable as a function of head grade. Recoveries at LOM average head grades are 89.21% for Zn, 14.60% for Cu, 80.01% for Pb, and 77.51% for Ag.
El Porvenir – Net Difference in Mineral Resources between December 31, 2023 versus December 31, 2022 (on an 83.48% Nexa attributable ownership basis)
| Contained Metal | ||||||||||||
| Class | Tonnage | Zinc | Copper | Silver | Lead | Gold | ||||||
| (Mt) | % | (kt) | % | (kt) | % | (koz) | % | (kt) | % | (koz) | % | |
| Measured | 0.26 | 90.0 | 9.5 | 99.1 | 0.9 | 150.4 | 366 | 55.7 | 2.1 | 64.4 | - | - |
| Indicated | 0.15 | 5.8 | 10.2 | 13.2 | 0.2 | 4.8 | 797 | 17.1 | 2.6 | 11.3 | - | - |
| Total | 0.41 | 14.5 | 19.7 | 22.7 | 1.1 | 20.1 | 1,163 | 21.9 | 4.7 | 17.7 | - | - |
| Inferred | 0.31 | 3.5 | 12.0 | 3.5 | 5.2 | 30.9 | 3,695 | 17.7 | 28.2 | 30.1 | - | - |
| 53 |
| Mining Operations |
El Porvenir – Net Difference in Mineral Resources between December 31, 2023 versus December 31, 2022 (on a 100% ownership basis)
| Contained Metal | ||||||||||||
| Class | Tonnage | Zinc | Copper | Silver | Lead | Gold | ||||||
| (Mt) | % | (kt) | % | (kt) | % | (koz) | % | (kt) | % | (koz) | % | |
| Measured | 0.31 | 88.6 | 11.3 | 97.4 | 1.1 | 157.1 | 432 | 54.5 | 2.4 | 61.5 | - | - |
| Indicated | 0.18 | 5.9 | 12.3 | 13.3 | 0.3 | 4.9 | 959 | 17.2 | 3.2 | 11.4 | - | - |
| Total | 0.49 | 14.5 | 23.6 | 22.7 | 1.4 | 20.6 | 1,391 | 21.8 | 5.6 | 17.6 | - | - |
| Inferred | 0.38 | 3.6 | 14.6 | 3.6 | 6.2 | 30.5 | 4,439 | 17.7 | 33.9 | 30.2 | - | - |
In comparison to 2022, El Porvenir’s Inferred Mineral Resources increased by 3.6% in mass and by 3.6% in zinc content (kt), mainly due to infill drilling. In comparison to 2022, El Porvenir’s Measured and Indicated Mineral Resources increased by 14.5% in mass and by 22.7% in zinc content (kt), mainly due to infill drilling.
For additional information, see the Technical Report Summary on the Cerro Pasco Complex Integration, filed as Exhibit 15.2 of this annual report on Form 20-F.
Atacocha
Location and means of access
The Atacocha mine is ana polymetallic underground mine and open pit mine located(located in the Cerro Paso Complex) in the district of San Francisco de Asís de Yarusyacán, in the province of Pasco, Peru. The property is located inat approximate coordinates of 367160m E, 8,830,400m N, using the central Andes mountains region of Peru, atUTM WGS84 datum, Z18S and approximately 4,2004,050 meters above sea level. The mine is situated at kilometer 324 of the Carretera Central Highway (Lima—Huánuco route), 16 kilometers from the city of Cerro de Pasco.
History
The Atacocha mine is locatedbegan its operation as small-scale artisanal mine in a mountain area of Central Peru. The processing plant is located near the Huallaga River valley. Cerro de Pasco and Huánuco cities are connected to1936. We have been investing in the mine area by a paved roadsince then and, in 2012, production reached its current capacity of 4,500 tonnes per day. In 2014, we commenced the Integration Project with heavy traffic.the El Porvenir mine, as described above in “Information on the Company—Mining operations—Cerro Pasco Complex—Integration Project.” In 2020, in response to COVID-19 and based on our cost management strategy, the Integration Project was temporarily suspended and Atacocha’s underground operations were not resumed after the mandatory restriction period from the Peruvian Government was lifted in mid-2020. As of the date of this annual report, the Atacocha hasunderground mine camps near the plantis suspended under care and the valley. Light fuel maintenance, and storage facilities are locatedwe expect to complete the Integration Project approval process with our technical committee and Board of directors in the area. Basic supplies are available in the city of Chicrin, with most major items and equipment provided from Lima.2024.
History
The Atacocha mining unit began operating in the early 20th century with a production of lead, silver, zinc and copper ores. In 1925, the Pucayacu Mining Company exploited Atacocha until the company was liquidated and the property was declared abandoned. Subsequently, the “Casa Gallo Hermanos” enterprise claimed the Atacocha mines, and began working the property in 1928. In 1935, Francisco Jose Gallo Diez, with the collaboration of Eulogio E. Fernandini, German Aguirre and Gino Salocchi, established Atacocha S.A. On February 8, 1936, Compañía Minera Atacocha S.A.A. was incorporated to develop exploration and exploitation of mining sites and produce lead, zinc and copper concentrates.
Nexa Peru has been conducting exploration and development work at Atacocha since 1949. Most exploration is conducted simultaneously with underground development, which involves diamond core drilling, and channel sampling following underground drifting. Prior to 1997, minor and sporadic drilling was completed; and no channel sampling is documented before 2001. Systematic underground geological mapping is completed at scale of either 1:500 or 1:250, following underground development on all levels and sub-levels. A total of 29 underground levels have been developed at Atacocha, with additional development on sub-levels. Geological mapping is completed by the mine/production geologists drawn on paper in the field, and subsequently digitized with the help of a modelling assistant. The geological level plan maps are updated and incorporated in a three-dimensional geological model on a daily basis to aid future exploration and mine development planning.
Title, leases and options
The Atacocha mine is ownedoperated by Compañía MineraNexa Resources Atacocha S.A.A., which is controlled by Nexa Peru.
The Atacocha mine has a total of 147 concessions covering approximately 2,872.512,872.5 hectares, as well as a beneficiation plant, “Chicrin N° 2”.2.” With respect to the surface property at the Atacocha project,mine, there is a mining site of 1,3431,343.0 hectares, where the mining concession is located, as well as additional surface property where tailings dams/ponds, camps sites and other ancillary infrastructure are located. There are royalties payable in respect of mining operations at the Atacocha projectmine for the mining concessions held by Compañía Minera Atacocha.Nexa Resources Atacocha S.A.A. For more information, see “Regulatory“Information on the Company—Regulatory matters—Peruvian regulatory framework—Royalties and other taxes on mining activities.”
Mineralization
At Atacocha, mineralization is characterized as either a skarn-, replacement- or hydrothermal vein/breccia-style mineralization. Skarn-related mineralization is characterized by pyrite, chalcopyrite, sphalerite, galena, with lesser bismuthinite and a variety of sulfosalts (Bi-bearing) and pyrrhotite, bornite, and covellite at lower elevation. Molybdenite may occur proximal to the skarn-related mineralization. Elevated Bi and Au are reported to be associated with skarn-related mineralization. Veins and veinlets with pyrite, chalcopyrite, sphalerite, galena, with quartz and carbonate occur within marble units, and are spatially associated with skarn bodies. Replacement bodies comprising of pyrite, sphalerite, galena, chalcopyrite, and possibly other fine undistinguished sulfides occur within garnet-skarn, marble, and silicified zones.
The Atacocha mine does not currently have any known mineral reserves under Industry Guide 7.holds a number of permits in support of the current operations. The permits are Directorial Resolutions issued by the Peruvian authorities upon approval of mining environmental management instruments filed by the mining companies. Nexa Peru maintains an up-to-date record of the legal permits obtained to date.
Operations and infrastructure
| 54 |
| Mining Operations |
Atacocha operates two mines: the Atacocha underground mine and the San Gerardo open pit.pit mine. The operationunderground mine is currently suspended due to our efforts to reduce costs and improve our operational efficiency and remains under care and maintenance. However, mining ore from both the Atacocha underground mine andcontinues in the San Gerardo open pit mine. Both mining operations feed the Atacocha processing plant.
Mineralization
TheIn 2023, we spent approximately US$0.2 million on the Atacocha site also includes older tailings ponds, waste rock stockpiles, a process plant facility with associated laboratorybrownfield program for exploration maintenance. In 2023, we had no drilling activities at Atacocha. We have budgeted US$0.4 million for the program during 2024 for maintenance and maintenance facilities; maintenance buildings for underground and surface equipment. Facilities and structures include: a warehouse, mine office, change house, tailings pumping station, main shaft, ventilation shaft, mine access ramps, main haulage drift (level 3600), backfill plant, explosives storage area, power generating hydroelectric, power lines and substation, fuel storage tanks and a permanent accommodation camp. Atacocha and El Porvenir are under a process of consolidating as a single mining unit and onedata interpretations, including 3.0 km of the first activities consists of pumpingdrilling campaign in the current tailings of Atacocha to the El Porvenir tailings pond.Integration target.
Operations and infrastructure
In 2017,2023, we spent US$5.916.1 million on sustaining capital expenditures for this property, primarily associated with mine development, equipment replacement and other major infrastructure. In addition to US$0.2 million to maintain the Mineral Exploration structure, a drilling program began in 2024 with the focus on continuing extending the mineralization of the integration target.
In January 2023, protest activities by the Machcan community temporarily suspended operations at the Atacocha San Gerardo open pit mine for approximately one week. In June 2023, protest activities by the Machcan community again blocked access to the Atacocha San Gerardo open pit mine, temporarily suspending production for approximately one month. Operations resumed at the end of July 2023 once protest activities ceased. Finally, in February 2024 protest activities by the Joraoniyoc community blocked road access to the Atacocha San Gerardo open pit mine and suspended operations for approximately three days. In each instance, mining activities were limited to critical operations with a minimum workforce to ensure appropriate maintenance, safety and security. Despite these blockages, the Atacocha mine operated at high levels of capacity utilization rates throughout the year and 2023. In each of these instances, the Company pursued active dialogue with the local community and authorities for a peaceful resolution to this situation. Nexa remains committed to complying with all existing agreements, pursuing an active dialogue with the communities and authorities, and the social development and maintenance of plant and equipment.
all its host communities.
Production
The Atacocha mine has a treatment plant capacity of 4,400 tonnes of ore per day. The table below summarizes the Atacocha mine’s concentrate production, metal contained in concentrates produced and average grades for the periods indicated. Production in 2023 was lower than in 2022 due to the temporary suspension of production due to illegal protest activities occurring in different periods throughout first half of 2023.
For the Year Ended December 31, | |||
2023 | 2022 | 2021 | |
| Treatment ore (in tonnes) | 1,397,192 | 1,353,681 | 1,271,107 |
| Average ore grade | |||
| Zinc (%) | 0.77 | 0.89 | 0.88 |
| Lead (%) | 0.93 | 0.97 | 0.82 |
| Silver (ounces per tonne) | 1.21 | 1.05 | 1.01 |
| Gold (ounces per tonne) | 0.010 | 0.015 | 0.014 |
| Metal contained in concentrate production | |||
| Zinc (in tonnes) | 8,193 | 9,552 | 8,522 |
| Lead (in tonnes) | 11,116 | 11,204 | 8,708 |
| Silver (in oz) | 1,399,681 | 1,155,002 | 1,026,783 |
| Gold (in oz) | 7,559 | 13,593 | 11,947 |
| Cash cost, net of by-product credits (in US$/t) | (959.7) | (1,566.2) | (557.7) |
| Cash cost, net of by-product credits (in US$/lb) | (0.44) | (0.71) | (0.25) |
| Non-Expansion Capital Expenditures (in millions of US$) | 16.2 | 4.5 | 11.6 |
| 55 |
| Mining Operations |
Mineral Reserves and Mineral Resources (Atacocha Underground)
|
| As of and for the |
| ||||
|
| 2017 |
| 2016 |
| 2015 |
|
Treatment Ore (in tonnes) |
| 1,506,826 |
| 1,487,390 |
| 1,431,315 |
|
Average Ore Grade |
|
|
|
|
|
|
|
Zinc (%) |
| 1.43 |
| 1.80 |
| 2.40 |
|
Copper (%) |
| 0.09 |
| 0.11 |
| 0.16 |
|
Lead (%) |
| 1.22 |
| 1.32 |
| 1.10 |
|
Silver (grams per tonne) |
| 44.52 |
| 53.21 |
| 47.77 |
|
Gold (grams per tonne) |
| 0.60 |
| 0.54 |
| 0.35 |
|
Concentrate Production |
|
|
|
|
|
|
|
Zinc concentrates (in tonnes) |
| 32,995 |
| 42,356 |
| 57,542 |
|
Copper concentrates (in tonnes) |
| 528 |
| 1,191 |
| 2,448 |
|
Lead concentrates (in tonnes) |
| 28,614 |
| 29,585 |
| 23,488 |
|
Metal Contained in Concentrate Production |
|
|
|
|
|
|
|
Zinc (in tonnes) |
| 16,950 |
| 22,330 |
| 30,301 |
|
Copper (in tonnes) |
| 99 |
| 262 |
| 583 |
|
Lead (in tonnes) |
| 15,958 |
| 17,167 |
| 13,636 |
|
Silver (in oz.) |
| 1,687,016 |
| 2,001,778 |
| 1,682,872 |
|
Gold (in oz.) |
| 20,105 |
| 14,651 |
| 5,675 |
|
Cash Cost, After By-Product Credits (in US$/tonne) |
| (191.1 | ) | 684.9 |
| 1,441.2 |
|
Cash Cost, After By-Product Credits (in US$/lb.) |
| (0.09 | ) | 0.31 |
| 0.65 |
|
Capital Expenditures (in millions of US$) |
| 5.9 |
| 7.7 |
| 11.5 |
|
VazanteThe Atacocha Underground Mineral Reserves estimates are based on the definitions for Mineral Reserves in SK-1300 and the tables below are based on costs and modifying factors from the Atacocha Underground mine.
Atacocha Underground – Year End Mineral Reserves as of December 31, 2023 (on an 75.96% Nexa attributable ownership basis) (1)
| Grade | Contained Metal | ||||||||||
| Class | Tonnage (2) | Zinc | Copper | Silver | Lead | Gold | Zinc | Copper | Silver | Lead | Gold |
| (Mt) | (%) | (%) | (g/t) | (%) | (g/t) | (kt) | (kt) | (koz) | (kt) | (koz) | |
| Proven | 1.30 | 3.86 | 0.34 | 84.9 | 1.45 | - | 50.0 | 4.4 | 3,535 | 18.7 | - |
| Probable | 3.01 | 4.54 | 0.43 | 77.7 | 1.29 | - | 136.6 | 12.8 | 7,509 | 38.8 | - |
| Total | 4.30 | 4.33 | 0.40 | 79.8 | 1.34 | - | 186.5 | 17.2 | 11,044 | 57.5 | - |
Notes:
| 1. | Subpart 1300 of Regulation S-K definitions were followed for Mineral Reserves, which also are consistent with the CIM (2014) definitions. |
| 2. | Mineral Reserves data presented in this table are reported on 75.96% Nexa attributable ownership. |
| 3. | The Qualified Person for the Mineral Reserves estimate is SLR Consulting (Canada) Ltd., an independent mining consulting firm. |
| 4. | Numbers may not add due to rounding. |
| 5. | The point of reference for Mineral Reserves in this table is mill feed materials. |
Atacocha Underground – Year End Mineral Reserves as of December 31, 2023 (on a 100% ownership basis) (1)
| Grade | Contained Metal | ||||||||||
| Class | Tonnage (2) | Zinc | Copper | Silver | Lead | Gold | Zinc | Copper | Silver | Lead | Gold |
| (Mt) | (%) | (%) | (g/t) | (%) | (g/t) | (kt) | (kt) | (koz) | (kt) | (koz) | |
| Proven | 1.71 | 3.86 | 0.34 | 84.9 | 1.45 | - | 65.8 | 5.7 | 4,654 | 24.6 | - |
| Probable | 3.96 | 4.54 | 0.43 | 77.7 | 1.29 | - | 179.8 | 16.9 | 9,886 | 51.1 | - |
| Total | 5.66 | 4.33 | 0.40 | 79.8 | 1.34 | - | 245.6 | 22.6 | 14,540 | 75.7 | - |
Notes:
| 1. | Subpart 1300 of Regulation S-K definitions were followed for Mineral Reserves, which also are consistent with the CIM (2014) definitions. |
| 2. | Mineral Reserves data presented in this table represents 100% of the Mineral Reserves estimates for the property. Nexa owns 75.96%. |
| 3. | The Qualified Person for the Mineral Reserves estimate is SLR Consulting (Canada) Ltd., an independent mining consulting firm. |
| 4. | Numbers may not add due to rounding. |
| 5. | The point of reference for Mineral Reserves in this table is mill feed materials. |
The Atacocha Underground Mineral Reserves estimates in the table above were prepared using DSO software, mine design and scheduling software. Mining methods used are C&F mining, using unconsolidated rock fill and hydraulic backfill, and SLS using unconsolidated rock fill. NSR values were calculated using mineral reserve metal prices, metallurgical recovery and consideration of smelter terms, including revenue from payable metals, price participation, penalties, smelter losses, transportation, treatment, refining and sales charges. A minimum mining width of 5.0 for C&F mining and 4.0 m for SLS mining were used for reserves shapes and development design and are reported inclusive of extraction losses and dilution. The Mineral Reserves were estimated at a NSR cut-off of US$69.00/t for SLS areas and US$71.07/t for C&F areas depending on the zone. A number of incremental material (with values between US$45.09/t and US$69.00/t for SLS and values between US$47.16/t and US$71.07/t for C&F mining) was included in the estimate. Mineral Reserves estimates are based on average long-term metal prices of: zinc: US$2,799.04/t (US$1.27/lb); copper: US$7,669.61/t (US$3.48/lb); lead: US$2,000.29/t (US$0.91/lb); and silver: US$21.17/oz. Metallurgical recoveries are accounted for in NSR calculations based on historical processing data and are variable as a function of head grade. Recoveries at Life of Mine average head grades are 89.30% for Zn, 15.73% for Cu, 80.02% for Pb, and 77.51% for Ag. The current LOM plan continues to 2033. The current LOM production planning goes from 2027 to 2033. We continued to advance with the technical studies to optimize the integration of El Porvenir and Atacocha underground mines, and as a result of the advancements in the technical studies, we increased the overall Mineral Reserves of the Cerro Pasco Complex. For further information see “Information on the Company—Mining Operations—Cerro Pasco Complex—Integration Project.”
| 56 |
| Mining Operations |
Atacocha Underground – Net Difference in Mineral Reserves between December 31, 2023 versus December 31, 2022 (on an 75.96% Nexa attributable ownership basis)
| Contained Metal | ||||||||||||
| Class | Tonnage | Zinc | Copper | Silver | Lead | Gold | ||||||
| (Mt) | % | (kt) | % | (kt) | % | (koz) | % | (kt) | % | (koz) | % | |
| Proven | 1.30 | - | 50.0 | - | 4.4 | - | 3,535 | - | 18.7 | - | - | - |
| Probable | 3.01 | - | 136.6 | - | 12.8 | - | 7,509 | - | 38.8 | - | - | - |
| Total | 4.30 | - | 186.5 | - | 17.2 | - | 11,044 | - | 57.5 | - | - | - |
Atacocha Underground – Net Difference in Mineral Reserves between December 31, 2023 versus December 31, 2022 (on a 100% ownership basis)
| Contained Metal | ||||||||||||
| Class | Tonnage | Zinc | Copper | Silver | Lead | Gold | ||||||
| (Mt) | % | (kt) | % | (kt) | % | (koz) | % | (kt) | % | (koz) | % | |
| Proven | 1.71 | - | 65.8 | - | 5.7 | - | 4,654 | - | 24.6 | - | - | - |
| Probable | 3.96 | - | 179.8 | - | 16.9 | - | 9,886 | - | 51.1 | - | - | - |
| Total | 5.66 | - | 245.6 | - | 22.6 | - | 14,540 | - | 75.7 | - | - | - |
In 2023, Atacocha’s Underground Mineral Reserves increased compared to 2022 due to the declaration of Mineral Reserves for the first time since 2019.
Atacocha Underground – Year End Mineral Resources as of December 31, 2023 (on an 75.96% Nexa Attributable ownership basis) (1)
| Grade | Contained Metal | ||||||||||
| Class | Tonnage (2) | Zinc | Copper | Silver | Lead | Gold | Zinc | Copper | Silver | Lead | Gold |
| (Mt) | (%) | (%) | (g/t) | (%) | (g/t) | (kt) | (kt) | (koz) | (kt) | (koz) | |
| Measured | 0.80 | 3.47 | 0.27 | 55.0 | 0.98 | - | 27.6 | 2.1 | 1,411 | 7.8 | - |
| Indicated | 1.91 | 3.30 | 0.36 | 54.9 | 0.92 | - | 63.2 | 6.9 | 3,379 | 17.6 | - |
| Total | 2.71 | 3.35 | 0.33 | 54.9 | 0.94 | - | 90.8 | 9.0 | 4,790 | 25.4 | - |
| Inferred | 6.12 | 4.09 | 0.56 | 77.3 | 1.21 | - | 250.4 | 34.3 | 15,216 | 74.1 | - |
Notes:
| 1. | Subpart 1300 of Regulation S-K definitions were followed for Mineral Resources, which also are consistent with the CIM (2014) definitions. |
| 2. | Mineral Resources Tonnes and Contained Metal presented in this table are reported on 75.96% Nexa attributable ownership. |
| 3. | Mineral Resources are reported exclusive of those Mineral Resources that were converted to Mineral Reserves, and Mineral Resources are not Mineral Reserves and do not have demonstrated economic viability. |
| 4. | The Qualified Person for the Mineral Resources estimate is Jerry Huaman Abalos, B.Geo., MAusIMM CP(Geo), a Nexa employee. |
| 5. | Numbers may not add due to rounding. |
| 6. | The point of reference for Mineral Resources in this table is mill feed materials. |
| 57 |
| Mining Operations |
Atacocha Underground – Year End Mineral Resources as of December 31, 2023 (on a 100% ownership basis) (1)
| Grade | Contained Metal | ||||||||||
| Class | Tonnage (2) | Zinc | Copper | Silver | Lead | Gold | Zinc | Copper | Silver | Lead | Gold |
| (Mt) | (%) | (%) | (g/t) | (%) | (g/t) | (kt) | (kt) | (koz) | (kt) | (koz) | |
| Measured | 1.05 | 3.47 | 0.27 | 55.0 | 0.98 | - | 36.4 | 2.8 | 1,857 | 10.3 | - |
| Indicated | 2.52 | 3.30 | 0.36 | 54.9 | 0.92 | - | 83.2 | 9.1 | 4,448 | 23.2 | - |
| Total | 3.57 | 3.35 | 0.33 | 54.9 | 0.94 | - | 119.6 | 11.9 | 6,305 | 33.5 | - |
| Inferred | 8.06 | 4.09 | 0.56 | 77.3 | 1.21 | - | 329.7 | 45.1 | 20,031 | 97.5 | - |
Notes:
| 1. | Subpart 1300 of Regulation S-K definitions were followed for Mineral Resources, which also are consistent with the CIM (2014) definitions. |
| 2. | Mineral Resources data presented in this table represents 100% of the Mineral Resources estimates for the property. Nexa owns 75.96%. |
| 3. | Mineral Resources are reported exclusive of those Mineral Resources that were converted to Mineral Reserves, and Mineral Resources are not Mineral Reserves and do not have demonstrated economic viability. |
| 4. | The Qualified Person for the Mineral Resources estimate is Jerry Huaman Abalos, B.Geo., MAusIMM CP(Geo), a Nexa employee. |
| 5. | Numbers may not add due to rounding. |
| 6. | The point of reference for Mineral Resources in this table is mill feed materials. |
The Atacocha Underground Mineral Resources estimates in the table above were completed using Datamine and Leapfrog software. Wireframes for geology and mineralization were constructed in Leapfrog based on geology sections, assay results, lithological information, underground mapping and structural data. Assays were capped to various levels based on exploratory data analysis and then composited to 2.0 m lengths. Wireframes were filled with blocks and sub-celling at wireframe boundaries. Blocks were interpolated with grade using the OK and ID3 interpolation algorithms. Block estimates were validated using industry standard validation techniques. Classification of blocks used distance-based and mineralization continuity criteria. Mineral Resources are reported using all the material within resource shapes generated in DSO software, satisfying minimum mining width of 4.0 m in areas with C&F stopes shapes and 3.0 m for SLS stopes. The Mineral Resources are estimated at a NSR cut-off grade values of US$69.00/t for SLS areas and US$71.07/t for C&F areas depending on the zone. Mineral Resources estimates are based on average long-term metal prices of: zinc: US$3,218.90/t (US$1.46/lb); copper: US$8,820.05/t (US$4.00/lb); lead: US$2,300.33/t (US$1.04/lb); and silver: US$24.35/oz. Metallurgical recoveries are accounted for in NSR calculations based on historical processing data and are variable as a function of head grade. Recoveries at LOM average head grades are 89.30% for Zn, 15.73% for Cu, 80.02% for Pb, and 77.51% for Ag.
Atacocha Underground – Net Difference in Mineral Resources between December 31, 2023 versus December 31, 2022 (on an 75.96% Nexa attributable ownership basis)
| Contained Metal | ||||||||||||
| Class | Tonnage | Zinc | Copper | Silver | Lead | Gold | ||||||
| (Mt) | % | (kt) | % | (kt) | % | (koz) | % | (kt) | % | (koz) | % | |
| Measured | (1.30) | (62.0) | (60.1) | (68.5) | 2.1 | 100.0 | (3,916) | (73.5) | (24.1) | (75.5) | - | - |
| Indicated | (1.36) | (41.5) | (72.5) | (53.4) | 6.9 | 100.0 | (4,611) | (57.7) | (29.2) | (62.3) | - | - |
| Total | (2.66) | (49.5) | (132.6) | (59.3) | 9.0 | 100.0 | (8,527) | (64.0) | (53.3) | (67.7) | - | - |
| Inferred | (0.04) | (0.6) | (23.7) | (8.6) | 34.3 | 100.0 | (1,024) | (6.3) | (3.5) | (4.6) | - | - |
| 58 |
| Mining Operations |
Atacocha Underground – Net Difference in Mineral Resources between December 31, 2023 versus December 31, 2022 (on a 100% ownership basis)
| Contained Metal | ||||||||||||
| Class | Tonnage | Zinc | Copper | Silver | Lead | Gold | ||||||
| (Mt) | % | (kt) | % | (kt) | % | (koz) | % | (kt) | % | (koz) | % | |
| Measured | (1.71) | (62.0) | (78.9) | (68.4) | 2.8 | 100.0 | (5,144) | (73.5) | (31.7) | (75.5) | - | - |
| Indicated | (1.79) | (41.5) | (95.7) | (53.5) | 9.1 | 100.0 | (6,083) | (57.8) | (38.4) | (62.3) | - | - |
| Total | (3.50) | (49.5) | (174.6) | (59.3) | 11.9 | 100.0 | (11,227) | (64.0) | (70.1) | (67.7) | - | - |
| Inferred | (0.05) | (0.6) | (31.2) | (8.6) | 45.1 | 100.0 | (1,350) | (6.3) | (4.7) | (4.6) | - | - |
In comparison to 2022, Atacocha’s Underground Inferred Mineral Resources decreased by 0.6% in mass and by 8.6% in zinc content (kt), mainly due to a classification revision. In comparison to 2022, Atacocha’s Underground Measured and Indicated Mineral Resources decreased by 49.5% in mass and by 59.3% in zinc content (kt), mainly due to the conversion to Mineral Reserves.
For additional information, see the Technical Report Summary on the Cerro Pasco Complex Integration, filed as Exhibit 15.2 of this annual report on Form 20-F.
Mineral Reserves and Mineral Resources (Atacocha Open Pit)
The Atacocha Open Pit Mineral Reserves estimates are based on the definitions for Mineral Reserves in SK-1300 and the tables below are based on costs and modifying factors from the Atacocha Open Pit mine.
Atacocha Open Pit – Year End Mineral Reserves as of December 31, 2023 (on an 75.96% Nexa attributable ownership basis) (1)
| Grade | Contained Metal | ||||||||||
| Class | Tonnage (2) | Zinc | Copper | Silver | Lead | Gold | Zinc | Copper | Silver | Lead | Gold |
| (Mt) | (%) | (%) | (g/t) | (%) | (g/t) | (kt) | (kt) | (koz) | (kt) | (koz) | |
| Proven | 1.45 | 1.02 | - | 38.2 | 1.16 | 0.25 | 14.8 | - | 1,779 | 16.9 | 11.5 |
| Probable | 1.88 | 0.97 | - | 32.4 | 1.14 | 0.29 | 18.2 | - | 1,958 | 21.4 | 17.4 |
| Total | 3.33 | 0.99 | - | 34.9 | 1.15 | 0.27 | 33.1 | - | 3,737 | 38.2 | 28.9 |
Notes:
| 1. | Subpart 1300 of Regulation S-K definitions were followed for Mineral Reserves, which also are consistent with the CIM (2014) definitions. |
| 2. | Mineral Reserves data presented in this table are reported on 75.96% Nexa attributable ownership. |
| 3. | The Qualified Person for the Mineral Reserves estimate is SLR Consulting (Canada) Ltd., an independent mining consulting firm. |
| 4. | Numbers may not add due to rounding. |
| 5. | The point of reference for Mineral Reserves in this table is mill feed materials. |
Atacocha Open Pit – Year End Mineral Reserves as of December 31, 2023 (on a 100% ownership basis) (1)
| Grade | Contained Metal | ||||||||||
| Class | Tonnage (2) | Zinc | Copper | Silver | Lead | Gold | Zinc | Copper | Silver | Lead | Gold |
| (Mt) | (%) | (%) | (g/t) | (%) | (g/t) | (kt) | (kt) | (koz) | (kt) | (koz) | |
| Proven | 1.91 | 1.02 | - | 38.2 | 1.16 | 0.25 | 19.5 | - | 2,342 | 22.2 | 15.2 |
| Probable | 2.47 | 0.97 | - | 32.4 | 1.14 | 0.29 | 24.0 | - | 2,577 | 28.1 | 22.9 |
| Total | 4.38 | 0.99 | - | 34.9 | 1.15 | 0.27 | 43.5 | - | 4,919 | 50.3 | 38.1 |
Notes:
| 1. | Subpart 1300 of Regulation S-K definitions were followed for Mineral Reserves, which also are consistent with the CIM (2014) definitions. |
| 2. | Mineral Reserves data presented in this table represents 100% of the Mineral Reserves estimates for the property. Nexa owns 75.96%. |
| 3. | The Qualified Person for the Mineral Reserves estimate is SLR Consulting (Canada) Ltd., an independent mining consulting firm. |
| 4. | Numbers may not add due to rounding. |
| 5. | The point of reference for Mineral Reserves in this table is mill feed materials. |
| 59 |
| Mining Operations |
The Atacocha Open Pit Mineral Reserves estimates in the table above were prepared using DSO software, mine design and scheduling software. NSR values were calculated using mineral reserve metal prices, metallurgical recovery and consideration of smelter terms, including revenue from payable metals, price participation, penalties, smelter losses, transportation, treatment, refining and sales charges. The Mineral Reserves were estimated at a NSR cut-off values of US$16.21/t. Mineral Reserves estimates are based on average long-term metal prices of: zinc: US$2,799.04/t (US$1.27/lb); lead: US$2,000.29/t (US$0.91/lb); silver: US$21.17/oz; and gold: US$1,630.93/oz. Metallurgical recoveries are accounted for in NSR calculations based on historical processing data and are variable as a function of head grade. Recoveries at Life of Mine average head grade are 70.44% for Zn, 83.97% for Pb, 75.76% for Ag, and 65.46% for gold. The current LOM plan continues to 2027. We continued to advance with the technical studies to optimize the integration of El Porvenir and Atacocha underground mines, and as a result of the advancements in the technical studies, we increased the overall Mineral Reserves of the Cerro Pasco Complex. For further information see “Information on the Company—Mining Operations—Cerro Pasco Complex—Integration Project.”
Atacocha Open Pit – Net Difference in Mineral Reserves between December 31, 2023 versus December 31, 2022 (on an 75.96% Nexa attributable ownership basis)
| Contained Metal | ||||||||||||
| Class | Tonnage | Zinc | Copper | Silver | Lead | Gold | ||||||
| (Mt) | % | (kt) | % | (kt) | % | (koz) | % | (kt) | % | (koz) | % | |
| Proven | 1.45 | - | 14.8 | - | - | - | 1,779 | - | 16.9 | - | 11.5 | - |
| Probable | 1.88 | - | 18.2 | - | - | - | 1,958 | - | 21.4 | - | 17.4 | - |
| Total | 3.33 | - | 33.1 | - | - | - | 3,737 | - | 38.2 | - | 28.9 | - |
Atacocha Open Pit – Net Difference in Mineral Reserves between December 31, 2023 versus December 31, 2022 (on a 100% ownership basis)
| Contained Metal | ||||||||||||
| Class | Tonnage | Zinc | Copper | Silver | Lead | Gold | ||||||
| (Mt) | % | (kt) | % | (kt) | % | (koz) | % | (kt) | % | (koz) | % | |
| Proven | 1.91 | - | 19.5 | - | - | - | 2,342 | - | 22.2 | - | 15.2 | - |
| Probable | 2.47 | - | 24.0 | - | - | - | 2,577 | - | 28.1 | - | 22.9 | - |
| Total | 4.38 | - | 43.5 | - | - | - | 4,919 | - | 50.3 | - | 38.1 | - |
In 2023, Atacocha’s Open Pit Mineral Reserves increased compared to 2022 due to the declaration of Mineral Reserves for the first time since 2019.
Atacocha Open Pit – Year End Mineral Resources as of December 31, 2023 (on an 75.96% Nexa Attributable ownership basis) (1)
| Grade | Contained Metal | ||||||||||
| Class | Tonnage (2) | Zinc | Copper | Silver | Lead | Gold | Zinc | Copper | Silver | Lead | Gold |
| (Mt) | (%) | (%) | (g/t) | (%) | (g/t) | (kt) | (kt) | (koz) | (kt) | (koz) | |
| Measured | 1.37 | 1.28 | - | 31.4 | 0.87 | 0.19 | 17.5 | - | 1,381 | 11.9 | 8.4 |
| Indicated | 2.95 | 1.05 | - | 29.0 | 0.90 | 0.24 | 30.9 | - | 2,747 | 26.5 | 22.7 |
| Total | 4.31 | 1.12 | - | 29.8 | 0.89 | 0.22 | 48.4 | - | 4,128 | 38.4 | 31.1 |
| Inferred | 1.29 | 1.27 | - | 32.7 | 1.15 | 0.22 | 16.4 | - | 1,357 | 14.9 | 9.1 |
| 60 |
| Mining Operations |
Notes:
| 1. | Subpart 1300 of Regulation S-K definitions were followed for Mineral Resources, which also are consistent with the CIM (2014) definitions. |
| 2. | Mineral Resources Tonnes and Contained Metal presented in this table are reported on 75.96% Nexa attributable ownership. |
| 3. | Mineral Resources are reported exclusive of those Mineral Resources that were converted to Mineral Reserves, and Mineral Resources are not Mineral Reserves and do not have demonstrated economic viability. |
| 4. | The Qualified Person for the Mineral Resources estimate is Jerry Huaman Abalos, B.Geo., MAusIMM CP(Geo), a Nexa employee. |
| 5. | Numbers may not add due to rounding. |
| 6. | The point of reference for Mineral Resources in this table is mill feed materials. |
Atacocha Open Pit – Year End Mineral Resources as of December 31, 2023 (on a 100% ownership basis) (1)
| Grade | Contained Metal | ||||||||||
| Class | Tonnage (2) | Zinc | Copper | Silver | Lead | Gold | Zinc | Copper | Silver | Lead | Gold |
| (Mt) | (%) | (%) | (g/t) | (%) | (g/t) | (kt) | (kt) | (koz) | (kt) | (koz) | |
| Measured | 1.80 | 1.28 | - | 31.4 | 0.87 | 0.19 | 23.0 | - | 1,818 | 15.7 | 11.0 |
| Indicated | 3.88 | 1.05 | - | 29.0 | 0.90 | 0.24 | 40.7 | - | 3,616 | 34.9 | 29.9 |
| Total | 5.68 | 1.12 | - | 29.8 | 0.89 | 0.22 | 63.7 | - | 5,434 | 50.6 | 40.9 |
| Inferred | 1.70 | 1.27 | - | 32.7 | 1.15 | 0.22 | 21.6 | - | 1,787 | 19.6 | 12.0 |
Notes:
| 1. | Subpart 1300 of Regulation S-K definitions were followed for Mineral Resources, which also are consistent with the CIM (2014) definitions. |
| 2. | Mineral Resources data presented in this table represents 100% of the Mineral Resources estimates for the property. Nexa owns 75.96%. |
| 3. | Mineral Resources are reported exclusive of those Mineral Resources that were converted to Mineral Reserves, and Mineral Resources are not Mineral Reserves and do not have demonstrated economic viability. |
| 4. | The Qualified Person for the Mineral Resources estimate is Jerry Huaman Abalos, B.Geo., MAusIMM CP(Geo), a Nexa employee. |
| 5. | Numbers may not add due to rounding. |
| 6. | The point of reference for Mineral Resources in this table is mill feed materials. |
The Atacocha Open Pit Mineral Resources estimates in the table above were completed using Datamine and Leapfrog software. Wireframes for geology and mineralization were constructed in Leapfrog based on geology sections, assay results, lithological information, underground and open pit mapping and structural data. Assays were capped to various levels based on exploratory data analysis and then composited to 2.0 m lengths. Wireframes were filled with blocks and sub-celling at wireframe boundaries. Blocks were interpolated with grade using the OK and ID3 interpolation algorithms. Block estimates were validated using industry standard validation techniques. Classification of blocks used distance-based and mineralization continuity criteria. Mineral Resources are reported within resources open pit shell. The Mineral Resources are estimated at a NSR cut-off grade values of US$22.44/t. Mineral Resources estimates are based on average long-term metal prices of: zinc: US$3,218.90/t (US$1.46/lb); lead: US$2,300.33/t (US$1.04/lb); and silver: US$24.35/oz. Metallurgical recoveries are accounted for in NSR calculations based on historical processing data and are variable as a function of head grade. Recoveries at Life of Mine average head grades are 70.44% for Zn, 83.97% for Pb, 75.76% for Ag, and 65.46% for Au.
| 61 |
| Mining Operations |
Atacocha Open Pit – Net Difference in Mineral Resources between December 31, 2023 versus December 31, 2022 (on an 75.96% Nexa attributable ownership basis)
| Contained Metal | ||||||||||||
| Class | Tonnage | Zinc | Copper | Silver | Lead | Gold | ||||||
| (Mt) | % | (kt) | % | (kt) | % | (koz) | % | (kt) | % | (koz) | % | |
| Measured | (1.05) | (43.5) | (7.7) | (30.7) | - | - | (1,490) | (51.9) | (12.8) | (51.7) | (11.1) | (57.2) |
| Indicated | (2.27) | (43.5) | (26.0) | (45.7) | - | - | (2,288) | (45.4) | (22.6) | (46.0) | (9.2) | (28.8) |
| Total | (3.33) | (43.5) | (33.7) | (41.1) | - | - | (3,778) | (47.8) | (35.4) | (47.9) | (20.3) | (39.6) |
| Inferred | (1.63) | (55.8) | (16.6) | (50.2) | - | - | (1,619) | (54.4) | (14.6) | (49.5) | (9.7) | (51.5) |
Atacocha Open Pit – Net Difference in Mineral Resources between December 31, 2023 versus December 31, 2022 (on a 100% ownership basis)
| Contained Metal | ||||||||||||
| Class | Tonnage | Zinc | Copper | Silver | Lead | Gold | ||||||
| (Mt) | % | (kt) | % | (kt) | % | (koz) | % | (kt) | % | (koz) | % | |
| Measured | (1.39) | (43.6) | (10.2) | (30.7) | - | - | (1,966) | (52.0) | (16.8) | (51.7) | (14.6) | (57.0) |
| Indicated | (2.99) | (43.5) | (34.2) | (45.7) | - | - | (3,010) | (45.4) | (29.7) | (46.0) | (12.1) | (28.8) |
| Total | (4.38) | (43.5) | (44.4) | (41.1) | - | - | (4,976) | (47.8) | (46.5) | (47.9) | (26.7) | (39.5) |
| Inferred | (2.14) | (55.7) | (21.8) | (50.2) | - | - | (2,127) | (54.3) | (19.2) | (49.5) | (12.7) | (51.4) |
In comparison to 2022, Atacocha’s Open Pit Inferred Mineral Resources decreased by 55.7% in mass and by 50.2% in zinc content (kt), mainly due to the limits of pit shell constraint. In comparison to 2022, Atacocha’s Open Pit Measured and Indicated Mineral Resources decreased by 43.5% in mass and by 41.1% in zinc content (kt), mainly due to the conversion to Mineral Reserves.
For additional information, see the Technical Report Summary on the Cerro Pasco Complex Integration, filed as Exhibit 15.2 of this annual report on Form 20-F.
Aripuanã
Location and means of access
The Aripuanã mine is located in the northwest corner of the Mato Grosso State in western Brazil, approximately 2,529 km by railroad and road to the Três Marias smelter, 2,831 km to the Juiz de Fora smelter or 2,660 km to the port of Santos. The approximate coordinates of the mine are 226,000m E and 8,888,000m N UTM 21L zone (South American 1969 datum) and the mine is located at an average elevation of 250 meters above sea level. The mine is accessible from the town of Aripuanã via a 25 km unpaved road, which is well maintained in the dry season. Aripuanã can be accessed from the state capital, Cuiabá, via a 16-hour drive (935 km) on paved and unpaved roads. The final 250 km between Cuiabá and Aripuanã are on unpaved roads.
The Vazante minetown of Aripuanã is also serviced by a paved airstrip suitable for light aircraft. There are no commercial flights travelling between Cuiabá and the town of Aripuanã. However, the site can be accessed via a three-hour chartered flight.
History
Aripuanã is an underground polymetallic mine containing zinc, lead and open pit minecopper, located about seven kilometers from the municipality of Vazante, in the state of Minas Gerais,Mato Grosso, Brazil. The project area has elevations ranging from 690In 2000, Dardanelos was created to 970 meters above sea level. Access from Brasilia is via federal highway BR-040 toward Paracatu. Internal roadways connectrepresent a joint venture, or “contract of association,” between Karmin and Anglo American, with the various mine-site components. Concentrates are trucked about 250 kilometers tointent of exploring the Três Marias smelter. The closest commercial airport is located in Brasilia. The Vazante municipal airport for light aircraft isareas adjacent to the town of Aripuanã for base and precious metals. Anglo American and Karmin held 70% and 28.5% of Dardanelos, respectively, with the remaining interest (1.5%) owned by SGV Merchant Bank (SGV).
| 62 |
| Mining Operations |
In 2004, the initial agreement between Karmin and Anglo American was amended to include Nexa Brazil’s participation. Nexa Brazil subsequently acquired 100% of Anglo American’s interest in the project. In 2007, Karmin purchased SGV’s interests, raising its participation to 30%. In 2015, Nexa Peru acquired 7.7% of Nexa Brazil’s interests in Dardanelos. In 2019, Nexa Brazil became the owner of 100% of the Aripuanã mine.
In 2020, we reached an agreement with artisanal miners working adjacent to the property belonging to our Aripuanã mine, site.the ANM and the state government whereby Nexa assigned these artisanal miners an area to exercise their activities subject to certain conditions. The increase of artisanal mining activity or the failure of these artisanal miners to abide with our agreement may have an adverse effect on the development of our operations in Aripuanã.
In 2021, Nexa acquired two estates (584.9 hectares) located at the vicinity of the mine and concluded the process of documenting a third acquired in the past (100.0 hectares). The total land purchase of 684.9 hectares was required to meet the Rural Environmental Registration (CAR in Brazil) which requires areas of native vegetation that are not available within the area of enterprise.
In 2022, Nexa acquired six estates (1,332.4 hectares), located at the vicinity of the mine. The Rural Environmental Registry (CAR) was updated by Nexa and is in the process of being approved by the environmental agency and we still do not have a scheduled date for completion. On January 25, 2022, we signed an offtake agreement with a third-party international player (the “offtaker”), in which Nexa agreed to sell 100% of the copper concentrate produced by Aripuanã for a 5-year period starting in February 2023 and limited to 30,810 tonnes, at the lower of current market prices or a price cap. In September 2023, the parties agreed to amend the offtake agreement, which states that no penalty will be applied in case of delays in the agreed shipment schedule per year. However, if lower volumes are delivered in any year within the contract period, at the end of the contract period, the remaining balance will be shipped in a single additional delivery to total the 30,018 tonnes. The offtake agreement was structured to completely extinguish a previous existing future royalty obligation that Nexa had with the offtaker. Additionally, the Company opted to voluntarily and irrevocably designate the entire offtake agreement at fair value through profit and loss within the scope of IFRS Accounting Standards 9 rather than separate the value of the embedded derivative associated with the price cap, recognizing a non-cash accumulated gain of US$2.3 million in the income statement for the period ended on December 31, 2023. For further details on the offtake agreement, see Note 16 to our consolidated financial statements.
Ramp-up activities at the Aripuanã mine started in July 2022, and the mine continued production in the ramp-up phase for the duration of 2023. For further information, see “Project implementation”, below.
History
Mineralization was initially exploited by artisanal miners during the 1950s. Mechanized open pit mining and underground mining commenced in 1969 and 1983, respectively. The current primary ore types mined are hydrothermal zinc silicates and largely willemite. Initial mining operations exploited supergene calamine ores, a mixture of the zinc secondary minerals hemimorphite and smithsonite derived from the weathering of silicate ore.
Title,Titles, leases and options
Nexa Brazil owns 100.0% of the Vazante project. Mineral concessions are divided into core tenements, where the known mineral deposits are located andThe mine holds one mining operations are occurring, and the surrounding exploration concessions. The Company holds eight mining concessionsconcession in the core area that havehas a total area of approximately 2,091.103,639.9 hectares, which host the activetwo mining operations. The Company also holds 14 explorationconcession applications (approximately 6,912.24(1,387.2 hectares), 44one right to apply for mining concession, (1,000.0 hectares) and nine exploration authorizations (approximately 37,442.33(27,025.9 hectares), one mining concession application (approximately 189.98 hectares) and one granted mining concession (approximately 52.50 hectares) that surround the core tenements. These total 44,597.05 hectares in addition to the core tenements..
Nexa BrazilThe Aripuanã mine holds surface rights sufficient to support the currentfuture operations. Some surface rights agreements require annual payments to the owners. Three easements have been granted in support of the mining activities. There is sufficient suitable land available within the mineral tenurerights held by Nexa Brazilthe Company for tailings disposal, mine waste disposal, and installations such as the process plant and related mine infrastructure.
Brazilian companies that hold mining concessions are subject to a royalty payment imposedThe Aripuanã mine holds several permits and licenses supporting its current operations. The operating license issued by the National Mining Agency. For more information, see “Regulatory matters—Brazilian regulatory framework—RoyaltiesEnvironmental Agency from the state of Mato Grosso is valid until October 2024 and other taxes on mining activities.”
Nexa Brazil holds six licenses for water usage forwill undergo the operations. Nexa Brazil has lodged renewal applications, where applicable, for the water licensesprocess in use.2024.
Mineralization
The VazanteAripuanã region contains polymetallic VMS deposits with zinc, lead and Extremo Norte zinc deposits are epigenetic zinc silicate deposits,copper, as well as small amounts of gold and Vazante is one of the largest deposits of its type worldwide. Somewhat similar deposits are known from elsewheresilver, present in the world.
Mineralization is hosted within a sequenceform of pelitic carbonate rocksmassive mantles and veins, located in volcano sedimentary sequences belonging to the Serra do Poço Verde FormationRoosevelt Group of Proterozoic age.
| 63 |
| Mining Operations |
Four main elongated mineralized zones have been defined in the central portion of the Vazante Group. mine: (1) Arex, (2) Link, (3) Ambrex and (4) Babaçu. Limited exploration has identified possible additional mineralized bodies including Massaranduba, Boroca and Mocotó to the south and Arpa to the north.
The Aripuanã polymetallic deposits are typical VMS deposits associated with felsic bimodal volcanism. The individual mineralized bodies have complex shapes due to intense tectonic activity. Stratabound mineralized bodies tend to follow the local folds, however, local-scale, tight isoclinal folds are frequently observed, usually with axes parallel to major structural controlreverse faults, causing rapid variations in the dips.
Massive, stratabound sulphide mineralization as well as vein and stockwork-type discordant mineralization have been described on the property. The stratabound bodies, consisting of disseminated to massive pyrite and pyrrhotite, with well-developed sphalerite and galena mineralization, are commonly associated with the contact between the middle volcanic and the upper sedimentary units. Discordant stringer bodies of pyrrhotite-pyrite-chalcopyrite mineralization are generally located in the underlying volcanic units or intersect the massive sulphide lenses and have been interpreted as representing feeder zones.
In 2023, Aripuanã’s strategy aimed to increase throughput rate and asset reliability, reduce plant downtime, improve metal recoveries, concentrate grades and quality while consuming our ore stockpile inventory, which was supported by mineral exploration efforts to upgrade the Mineral Resources at the Babaçu target and expand our Mineral Reserves.
The exploratory drilling in 2023 was focused on the infill drilling of the Babaçu target, which is located southeast of the Vazante Fault.Ambrex orebody, extending the mineralization with high zinc, lead and copper content, which aimed to update the classification and conversion of resources into reserves, as well as starting drilling tests at the Massaranduba target, located southeast of Aripuanã mine.
OngoingIn 2023, we spent a total of US$7.3 million on the Aripuanã mine, with US$2.0 million spent towards Aripuanã’s exploration tests for extensionsprogram and US$5.2 million on an infill drilling campaign. The total investment included drilling, geological activities, geochemistry, and more. In 2023, we drilled 21.8 km of diamond drilling, including Babaçu infill drilling and Massaranduba exploratory drilling. For 2024, we expect to knowninvest US$4.0 million in the brownfield exploration program to drill 9.0 km focused on the Massaranduba target to validate the presence of mineralization infilling areas where no data are currently available, and using mining knowledge and structural interpretations to identify areas where mineralization may be present. Examplesin the southeastern extension of exploration successes using these methods include Lumiadeira, Ramp 29, and Deep Exploration, within the Vazante Mine area.
Aripuanã deposit.
Ramp-up Activities
Ramp-up activities at the Aripuanã mine started in July 2022, and the mine continued in the ramp-up phase through 2023 and into 2024. Ramp-up activities continue to progress and are expected to conclude in mid-2024.
The commissioning of the paste fill circuit was completed in December 2022, the first tests of mine filling started in January 2023 and were concluded in February 2023, with the paste plant becoming fully operational only in 2024. In January and February of 2023, the processing plant performed at around 57% of nameplate capacity. Ramp-up activities focused on steadily increasing the plant throughput rate, asset reliability, as well as concentrate grades and quality. At the end of 2Q23, the plant performed at an average of 76% of nameplate capacity while the average utilization rate was 66%.
In March 2023, we decided to temporarily halt operations at the plant to address some design limitations in the capacity of the flotation pumping system, identified during the detection of bottlenecks, which required resizing and upgrade, along with certain plant processing facilities and systems, as well as the clean-up and upgrading of water treatment facilities, which contributed to a better resiliency during the rainy season (which typically occurs from December to March). Due to the aforementioned limitations, in 3Q23 we reduced plant throughput, and as a result, the utilization rate was also reduced in the period and the plant performed at an average of 56% in the quarter. Despite this reduction, our priority throughout 2023 was to continue improving metal recovery and concentrate quality and grades, aiming to achieve a stable operation and to minimize impacts related to the necessary extension of the ramp-up phase.
| 64 |
| Mining Operations |
In 4Q23, we achieved an average of 61% of capacity utilization level and we expect to reach nameplate capacity in mid-2024. At the end of February 2024, the average capacity utilization rate was around 61%, maintaining similar levels as in 4Q23, given the usual rainy season period in the region, which impacted our dry disposal capacity. However, during this period the operational focus was to maintain concentrate quality and grades, as well as the metallurgical recovery rates.
At the end of 2023, approximately 106.6kt of ore was stockpiled. Horizontal mine development reached an accumulated of 7,474 meters developed for both mines (Arex and Link). As of the date of this filing, the mine is fully operational, and underground activities are focused on developing and preparing new areas for mining operations.
As of December 31, 2023, 814 people were employed at Aripuanã. Of these employees, 23.7% are women. We also continued the qualification program for future mine and plant operating professionals, which had 146 candidates enrolled in 2023, of which 46 obtained professional qualifications in the areas of maintenance and automation, and geology and surveying. The company hired 65.8% (96) of the attendees from the qualification program, of which 52.1% (50) are men and 47.9% (46) are women.
To date, cumulative incurred expansion capital expenditures on the mine total US$632.7 million, and we did not make any new expansion capital expenditures on the mine in 2023.
Operations and infrastructure
Exploration conducted inThe Aripuanã operation consists of two mechanized underground mines, the Vazante project area to date has included geological mapping, rock, pan concentrate, stream sedimentArex Mine and soil sampling, airborne and ground magnetic surveys, auger drilling, and core drilling.Link Mine, with a rate of approximately 2.3 Mtpy. Production drilling operations have been performed by company personnel over the Vazante mine history, using a variety of drilling machines.
machines throughout the history of the Aripuanã mine.
The VazanteAripuanã underground mine has been in operation since 1983,2019 and is a fully mechanized mine using rubber tiredrubber-tired diesel equipment for development and production activities. Access to the mine is through two portalsone portal for VazanteArex and one portal for Extremo Norte. As development progresses at Extremo Norte, a connecting drift will be established from Vazante to Extremo Norte.
Link. The Aripuanã processing plant has been in operation since 2022.
All infrastructure required for the current mining and processing operations has been constructed and is operational. This includes the underground mines, access roads, powerlines,power lines, water pipelines, offices and warehouses, a process plant/concentrator, conveyor systems, waste rock facilities, temporary ore stockpiles, paste-fill plants, and tailings storage facilities.
The stateAripuanã mine is connected to the basic grid supplies electricalat 230 kV. The energy measurement and billing system takes place in SE Dardanelos, 20 km are covered at 69 kV to the unit. Power distribution is carried out at 13.8 kV and the unit has a 25/31 MW transformer. Currently, the power demand contracted with Energisa for the Vazanteunit is 23 kV, on and off-peak. There are also five 750 kVA diesel generators.
In 2023, we spent US$79.4 million on sustaining capital expenditures for this property, primarily associated with ongoing ramp-up activities, mine site. Two independent transmission lines feed the site. An additional 60 MW power transmission line is currently under development, and will be completed by 2021. Two diesel generators can provide backup power in caseconstruction of a power failure.waste pile, equipment replacement and other major infrastructure.
In 2017, we spent US$53.3 million on the expansion, maintenanceProduction
The Aripuanã mine is in ramp-up phase and modernizationhas a treatment plant with a nominal design processing capacity of this property, including the development and maintenanceapproximately 6,300 tonnes of plant and equipment.
In order to support the increase in mine production, we plan to install a Vertimill in our Vazante mine. As of April 2018, the process for implementing this equipment in our Vazante plant has been temporarily put on hold as new studies are conducted to assess its grinding circuit.
Production
ore per day. The table below summarizes the VazanteAripuanã mine’s concentrate production, metal contained in concentrates produced and average grades for the periods indicated. Production in 2023 was higher than 2022 due to the continued progress of the ramp-up phase which was focused on steadily increasing the plant throughput rate, asset reliability, as well as concentrate grades and quality.
| 65 |
| Mining Operations |
|
| As of and for the Year |
| ||||
|
| 2017 |
| 2016 |
| 2015 |
|
Treatment Ore (in tonnes) |
| 1,321,240 |
| 1,381,301 |
| 1,360,089 |
|
Average Ore Grade |
|
|
|
|
|
|
|
Zinc (%) |
| 12.30 |
| 11.35 |
| 11.32 |
|
Lead (%) |
| 0.34 |
| 0.31 |
| 0.28 |
|
Silver (grams per tonne) |
| 17.27 |
| 13.19 |
| 13.69 |
|
Concentrate Production |
|
|
|
|
|
|
|
Zinc concentrates (in tonnes) |
| 348,760 |
| 343,754 |
| 328,987 |
|
Lead concentrates (in tonnes) |
| 4,542 |
| 3,074 |
| 2,948 |
|
Metal Contained in Concentrate Production |
|
|
|
|
|
|
|
Zinc (in tonnes) |
| 135,379 |
| 135,509 |
| 134,004 |
|
Lead (in tonnes) |
| 1,153 |
| 881 |
| 831 |
|
Silver (in oz.) |
| 355,496 |
| 224,353 |
| 218,975 |
|
Cash Cost, After By-Product Credits (in US$/tonne) |
| 965.3 |
| 997.7 |
| 1,058.7 |
|
Cash Cost, After By-Product Credits (in US$/lb.) |
| 0.44 |
| 0.45 |
| 0.48 |
|
Capital Expenditures (in millions of US$) |
| 55.3 |
| 34.2 |
| 29.0 |
|
For the Year Ended December 31, | |||
2023 | 2022 | 2021 | |
| Treatment ore (in tonnes) | 1,311,430 | 100,114 | - |
| Average ore grade | |||
| Zinc (%) | 3.31 | 2.44 | - |
| Copper (%) | 0.68 | 0.49 | - |
| Lead (%) | 1.05 | 0.00 | - |
| Silver (ounces per tonne) | 0.96 | 0.61 | - |
| Gold (ounces per tonne) | 0.015 | 0.011 | - |
| Metal contained in concentrate production | |||
| Zinc (in tonnes) | 22,099 | 670 | - |
| Copper (in tonnes) | 4,443 | 195 | - |
| Lead (in tonnes) | 6,331 | 0 | - |
| Silver (in oz) | 513,916 | 20,497 | - |
| Gold (in oz) | 7,954 | 273 | - |
| Cash Cost, net of by-product credits (in US$/t) | - | - | - |
| Cash Cost, net of by-product credits (in US$/lb) | - | - | - |
| Non-Expansion Capital Expenditures (in millions of US$) | 60.1 | 68.4 | - |
Morro AgudoMineral Reserves and Mineral Resources
The Aripuanã Mineral Reserves estimates are based on the definitions for Mineral Reserves in SK-1300 and the tables below are based on costs and modifying factors from the Aripuanã mine.
Location and meansAripuanã – Year End Mineral Reserves as of accessDecember 31, 2023 (on a 100% ownership basis) (1)
| Grade | Contained Metal | ||||||||||
| Class | Tonnage (2) | Zinc | Copper | Silver | Lead | Gold | Zinc | Copper | Silver | Lead | Gold |
| (Mt) | (%) | (%) | (g/t) | (%) | (g/t) | (kt) | (kt) | (koz) | (kt) | (koz) | |
| Proven | 6.43 | 3.83 | 0.21 | 33.8 | 1.40 | 0.28 | 246.2 | 13.8 | 6,993 | 90.0 | 57.1 |
| Probable | 24.64 | 4.48 | 0.13 | 42.4 | 1.73 | 0.21 | 1,105.0 | 31.8 | 33,610 | 427.3 | 167.3 |
| Total | 31.07 | 4.35 | 0.15 | 40.6 | 1.66 | 0.22 | 1,351.3 | 45.6 | 40,602 | 517.2 | 224.4 |
Notes:
| 1. | Subpart 1300 of Regulation S-K definitions were followed for Mineral Reserves, which also are consistent with the CIM (2014) definitions. |
| 2. | Mineral Reserves data presented in this table represents 100% of the Mineral Reserves estimates for the property. Nexa owns 100% of property. |
| 3. | The Qualified Person for the Mineral Reserves estimate is Vitor Ferraz Viana, B.Eng., FAusIMM, a Nexa employee. |
| 4. | Numbers may not add due to rounding. |
| 5. | The point of reference for Mineral Reserves in this table is mill feed materials. |
The Aripuanã Mineral Reserves estimates are based on four main orebodies: Arex, Link and Ambrex and the two main types of mineralization in the deposit are stratabound and stringer. The main commodities produced are zinc, copper, lead, silver and gold. The dilution that has been applied is related to the selected mining method. The two main mining methods used at Aripuanã are longitudinal longhole retreat (“bench stoping”) and transverse longhole mining (vertical retreat mining, or “VRM”) with primary and secondary stope extraction. Dilution is applied on a percentage basis, with no grade applied to the diluting material. The NSR factors were determined using long term metal price forecasts, metallurgical recoveries, transport, treatment, and refining costs. A break-even NSR cut-off value is US$63.40/t processed was estimated from forecasted operating costs and some incremental material between US$49.20/t and US$63.40/t was included. A minimum mining width of 4.0 m was used. The long-term prices derived are in line with the consensus forecasts from banks and independent institutions. Mineral Reserves estimates are based on average long-term metal prices of: zinc: US$2,799.04/t (US$1.27/lb); copper: US$7,669.61/t (US$3.48/lb); lead: US$2,000.29/t (US$0.91/lb); silver: US$21.17/oz; and gold: US$1,630.93/oz. Metallurgical recoveries are accounted for in NSR calculations based on metallurgical testworks and are variable as a function of head grade and oretype. Recoveries at Life of Mine average head grades for a Mix of 80% Stratabound and 20% Stringer material are 90.06% for Zn, 60.00% for Cu, 84.92% for Pb, 68.00% for Ag, and 67.80% for Au. The current LOM plan continues to 2036.
| 66 |
| Mining Operations |
Aripuanã – Net Difference in Mineral Reserves between December 31, 2023 versus December 31, 2022 (on a 100% ownership basis)
| Contained Metal | ||||||||||||
| Class | Tonnage | Zinc | Copper | Silver | Lead | Gold | ||||||
| (Mt) | % | (kt) | % | (kt) | % | (koz) | % | (kt) | % | (koz) | % | |
| Proven | (1.98) | (23.5) | (27.2) | (9.9) | (10.2) | (42.7) | (870) | (11.1) | (9.1) | (9.2) | (6.9) | (10.8) |
| Probable | 2.93 | 13.5 | 349.1 | 46.2 | 5.4 | 20.6 | 10,447 | 45.1 | 148.7 | 53.4 | 11.3 | 7.2 |
| Total | 0.95 | 3.2 | 322.0 | 31.3 | (4.8) | (9.5) | 9,576 | 30.9 | 139.5 | 36.9 | 4.4 | 2.0 |
In comparison to 2022, Aripuanã’s Mineral Reserves increased by 3.2% in mass and by 31.3% in zinc content (kt), mainly due to infill drilling at the Babaçu area, focused on the conversion from Inferred Mineral Resources to Indicated Mineral Resources, enabling the increase in Probable Mineral Reserves. Mineral Reserve depletion during 2023 accounted for 1.5Mt containing 43.9kt of zinc.
Aripuanã – Year End Mineral Resources as of December 31, 2023 (on a 100% ownership basis) (1)
| Grade | Contained Metal | ||||||||||
| Class | Tonnage (2) | Zinc | Copper | Silver | Lead | Gold | Zinc | Copper | Silver | Lead | Gold |
| (Mt) | (%) | (%) | (g/t) | (%) | (g/t) | (kt) | (kt) | (koz) | (kt) | (koz) | |
| Measured | 0.35 | 2.60 | 0.39 | 23.1 | 0.86 | 0.36 | 9.1 | 1.4 | 260 | 3.0 | 4.1 |
| Indicated | 5.19 | 3.95 | 0.18 | 35.0 | 1.46 | 0.27 | 205.0 | 9.3 | 5,840 | 75.8 | 45.1 |
| Total | 5.54 | 3.86 | 0.19 | 34.2 | 1.42 | 0.28 | 214.1 | 10.7 | 6,100 | 78.8 | 49.2 |
| Inferred | 38.75 | 3.47 | 0.33 | 45.7 | 1.39 | 0.43 | 1,344.6 | 127.9 | 56,935 | 538.6 | 535.7 |
Notes:
| 1. | Subpart 1300 of Regulation S-K definitions were followed for Mineral Resources, which also are consistent with the CIM (2014) definitions. |
| 2. | Mineral Resources data presented in this table represents 100% of the Mineral Resources estimates for the property. Nexa owns 100% of property. |
| 3. | Mineral Resources are reported exclusive of those Mineral Resources that were converted to Mineral Reserves, and Mineral Resources are not Mineral Reserves and do not have demonstrated economic viability. |
| 4. | The Qualified Person for the Mineral Resources estimate is José Antonio Lopes, B.Geo., FAusIMM, a Nexa employee. |
| 5. | Numbers may not add due to rounding. |
| 6. | The point of reference for Mineral Resources in this table is mill feed materials. |
The Mineral Resources estimates for the Aripuanã mine were completed for Babaçu, Arex, Ambrex and Link. The block models were created using Datamine and Leapfrog software. Wireframes for geology and mineralization were constructed in Leapfrog based on geology sections, assay results, lithological information and structural data. Assays were capped to various levels based on exploratory data analysis and then composited to one-meter lengths. Wireframes were filled with blocks measuring 5 meters by 5 meters by 5 meters for with sub-celling at wireframe boundaries. Blocks were interpolated with grade using the OK and ID3. Blocks estimates were validated using industry standard validation techniques. Classification of blocks was based on distance-based criteria. Potentially mineable shapes of underground mineral resources are generated using DSO software. The Mineral Resources of the Aripuanã mine are reported using a cut-off value of US$63.40/t. Mineral Resources estimates are based on average long-term metal prices of: zinc: US$3,218.90/t (US$1.46/lb); copper: US$8,820.05/t (US$4.00/lb); lead: US$2,300.33/t (US$1.04/lb); silver: US$24.35/oz and gold: US$1,696.11/oz. Metallurgical recoveries are accounted for in NSR calculations based on metallurgical test work and are variable as a function of head grade and oretype. Recoveries at the LOM average head grades for stratabound material are 90.06% for Zn, 84.92% for Pb, 60.00% for Cu, 75.10% for Ag, and 67.80% for Au. Recoveries at the LOM average head grades for stringer material are 88.68% for Cu, 50.00% for Ag, and 63.00% for Au.
| 67 |
| Mining Operations |
Aripuanã – Net Difference in Mineral Resources between December 31, 2023 versus December 31, 2022 (on a 100% ownership basis)
| Contained Metal | ||||||||||||
| Class | Tonnage | Zinc | Copper | Silver | Lead | Gold | ||||||
| (Mt) | % | (kt) | % | (kt) | % | (koz) | % | (kt) | % | (koz) | % | |
| Measured | (0.05) | (12.5) | 1.6 | 21.3 | (0.2) | (12.5) | (41) | (13.6) | 0.2 | 7.1 | (1.0) | (19.6) |
| Indicated | 2.64 | 103.5 | 147.4 | 255.9 | 4.5 | 93.8 | 4,102 | 236.0 | 54.9 | 262.7 | 19.7 | 77.6 |
| Total | 2.59 | 87.8 | 149.0 | 228.9 | 4.3 | 67.2 | 4,061 | 199.2 | 55.1 | 232.5 | 18.7 | 61.3 |
| Inferred | 0.20 | 0.5 | 415.5 | 44.7 | 12.2 | 10.5 | 20,372 | 55.7 | 145.4 | 37.0 | (34.4) | (6.0) |
In comparison to 2022, Aripuanã’s Inferred Mineral Resources increased by 0.5% in mass and increased by 44.7% in zinc content (kt) in 2023, mainly due to infill drilling at Babaçu resulting in higher average grades. In comparison to 2022, Aripuanã’s Measured and Indicated Mineral Resources increased by 87.8% in mass and increased by 228.9% in zinc content (kt) in 2023, primarily due to infill drilling at Babaçu resulting in higher average grades.
For additional information, see the Technical Report Summary on Aripuanã, filed as Exhibit 15.4 to Nexa’s annual report on Form 20-F/A for the year-ended December 31, 2020, as filed on November 4, 2021.
Morro Agudo
The Morro Agudo projectComplex consists of an underground mine and open pit, polymetallic mine, as well as three deposits along what is known as the AmbrosiaAmbrósia Trend (Ambrosia(Ambrósia Sul, AmbrosiaAmbrósia Norte, and Bonsucesso). The Morro Agudo mine site is situated on Traíras Farm, about 45 kilometerskm south of the municipality of Paracatu, Brazil.Brazil, at a latitude of approximately -17 57’ 33” S and a longitude of approximately 46°49’42” W, within Zone 23S of the Universal Transverse Mercator coordinate system (Corrego Alegre Datum). The mine access from Paracatu is via the BR-040 highway. The AmbrosiaAmbrósia Trend deposits are situated about 15 to 20 kilometerskm northeast of Paracatu. Access is via the MG-188 highway to the village of Santo Antônio.
History
Modern underground mining commenced in 1988 from the Morro Agudo mine. The Ambrosia Norte deposit was discovered in 1973, Ambrosia Sul in 2011, and Bonsucesso in 2014. Mining of the Ambrosia Sul deposit commenced in 2017.
Title, leases and options
Nexa Brazil owns 100.0%100% of the Morro Agudo project.Agudo. The total Morro Agudo projectmine area is about 80 kilometerskm long and 10 kilometerskm wide at the widest extent and covers a significant strike extent of the lithologies that host mineralization at the Morro Agudo mine and along the AmbrosiaAmbrósia Trend.
On March 19, 2024, Nexa announced the suspension of its mining operations in the Morro Agudo Complex effective May 1, 2024 until further notice. Between March 19 and April 30, 2024, mining activities will be reduced while limestone production activities will continue at full capacity. The suspension is part of Nexa’s portfolio optimization process to improve free cash flow in line with the Company’s disciplined capital allocation framework, along with its long-term strategy to maximize value for the Company and its shareholders. Nexa is committed to carrying out a structured process, aiming to minimize impacts on the business and, particularly, on its employees and host communities.
Nexa Brazil holds twothree granted mining concessions in the Morro Agudo mine area of approximately 827.61 hectares, with a valid mining concession application for an additional area of approximately 618.501,446.1 hectares. In the AmbrosiaAmbrósia Trend area, Nexa
Brazil has onethree granted mining concessions totaling 2,495.8 hectares.
Nearby the Morro Agudo mine site and Ambrósia trend areas, Nexa Brazil also holds 44 exploration authorizations totaling 41,414.3 hectares, one right to apply for mining concession (999.33 hectares),totaling 917.0 hectares, three mining applications totaling 2,167.4 hectares and one mining concession application (1,320.56 hectares) and one exploration permit (262.13 hectares).
Mineralization
totaling 1,000.0 hectares, in addition to the core tenements.
The Morro Agudo and Ambrosia Trend deposits are classified as examples of Irish-style sedimentary hosted deposits. Mineralization is hosted within a sequence of pelitic carbonate rocks belonging to the Morro do Calcário Formation that is partoperation holds several permits in support of the regional Vazante group.current operations. The deposits occur onmain instrument to regulate the Brasília Fold Belt.
Both oxide and sulfide mineralization have developed inoperation is a set of operating licenses issued by the Morro Agudo and Ambrosia Trend deposits. Oxide mineralization is primarily in the form of smithsonite and cerussite. Sulfide mineralization is primarily sphalerite and galena. The geological setting and understanding of the mineralization setting are adequately known to support mineral resource and mineralized material estimation and mine planning.
Operations and infrastructure
Exploration activities conducted to date have included geological mapping, rock chip, pan concentrate, stream sediment, and soil sampling, airborne and ground geophysical surveys and drilling.
All infrastructure required for the current Morro Agudo mining and processing operations has been constructed and is operational. This includes the underground mine, access roads, powerlines, water pipelines, offices and warehouses, process plant/concentrator, conveyor systems, waste rock facilities, temporary mill feed stockpiles and tailings storage facilities. Electric power is supplied by a regional energy supplier inEnvironmental Agency from the state of Minas Gerais. The licenses are active, some of them under renewal process.
| 68 |
| Mining Operations |
The Ambrósia mine in Morro Agudo reached the end of its life of mine during the fourth quarter of 2020 and operations were suspended due to the uncertainties associated with the geological model of the area, safety considerations and a greater movement of ore compared to the original plan.
In 2017,2023, we spent US$18.62.8 million on sustaining capital expenditures for this property, primarily associated with the mine development and maintenance of plant and equipment.
Mineralization Developments
ProductionIn 2023, no exploratory drilling was carried out in the Morro Agudo area, and for 2024 no exploration activity is expected.
Morro Agudo does not currently have any estimated Mineral Reserves and is considered an exploration stage property under S-K 1300. Morro Agudo is not considered a material property for the purposes of S-K 1300.
Production
The Morro Agudo mine has a treatment plant capacity of 3,400 tonnes of mill feed per day. The table below summarizes the Morro Agudo mine’s concentrate production, metal contained in concentrates produced and average grades for the periods indicated.
|
| As of and for the Year Ended |
| ||||
|
| 2017 |
| 2016 |
| 2015 |
|
Treatment Ore (in tonnes) |
| 1,054,692 |
| 1,018,969 |
| 1,006,917 |
|
Average Ore Grade |
|
|
|
|
|
|
|
Zinc (%) |
| 2.18 |
| 2.35 |
| 2.48 |
|
Lead (%) |
| 0.69 |
| 0.92 |
| 0.98 |
|
Concentrate Production |
|
|
|
|
|
|
|
Zinc concentrates (in tonnes) |
| 53,004 |
| 58,003 |
| 60,031 |
|
Lead concentrates (in tonnes) |
| 11,332 |
| 16,014 |
| 15,927 |
|
Metal Contained in Concentrate Production |
|
|
|
|
|
|
|
Zinc (in tonnes) |
| 20,969 |
| 22,688 |
| 22,922 |
|
Lead (in tonnes) |
| 5,805 |
| 8,135 |
| 8,611 |
|
Cash Cost, After By-Product Credits (in US$/tonne) |
| 1,644.3 |
| 1,336.2 |
| 1,347.9 |
|
Cash Cost, After By-Product Credits (in US$/lb.) |
| 0.75 |
| 0.61 |
| 0.61 |
|
Capital Expenditures (in millions of US$) |
| 18.6 |
| 8.6 |
| 3.6 |
|
For the Year Ended December 31, | |||
2023 | 2022 | 2021 | |
| Treatment ore (in tonnes) | 1,293,383 | 1,016,568 | 982,036 |
| Average ore grade | |||
| Zinc (%) | 1.99 | 2.06 | 2.05 |
| Lead (%) | 0.86 | 0.85 | 0.73 |
| Metal contained in concentrate production | |||
| Zinc (in tonnes) | 23,167 | 18,700 | 17,278 |
| Lead (in tonnes) | 8,320 | 6,247 | 4.691 |
| Cash Cost, net of by-product credits (in US$/t) | 1,796.8 | 2,160.5 | 1,884.1 |
| Cash Cost, net of by-product credits (in US$/lb) | 0.82 | 0.98 | 0.85 |
| Non-Expansion Capital Expenditures (in millions of US$) | 3.0 | 6.8 | 7.6 |
Concentrate Sales
All of the metal produced by our mines is contained inprocessed into concentrates. Our mining operations sell the concentrates that they produce to third parties and to our own smelters pursuant to arm’s length transactions. Each mine bears the cost of transporting the concentrate to the point of sale where the smelter or trader purchases the concentrate. The smelter or trader pays the mine for the percentage of metals contained in the concentrate, net of charges for treating the concentrate and refining the metals. The typical payable percentage is 85% for zinc contained in concentrate and 97% for copper contained in concentrated minus treatment charges. Mines
Growth projects
In addition to Nexa’s operating mines and smelters, a component of our business focuses on growth and exploration, which are activities associated with ascertaining the existence, location, extent or quality of a mineral deposit. Our exploration activities encompass brownfield and greenfield projects. Brownfield projects are exploration or development projects near or within our existing operations, which can share infrastructure and management of our existing operations. Greenfield projects are exploration or development projects that transfer allare located outside the area of their zinc concentrates toinfluence of our own
smelters (Vazante, Morro Agudoexisting mine operations and/or infrastructure, which will be independently developed and Cerro Lindo) receive payment for the recoverable metal plus a premium, and only pay smelter conversion costs.managed from our existing operations.
Growth projects
Brownfield and integration projects
The following table summarizes our brownfield and integration projects.
|
|
| ||
|
|
| ||
|
|
| ||
|
|
| ||
|
|
|
Vazante mine deepening project
One of our principalmain brownfield projects is the Vazante Minemine Deepening Project, which we expect to extendinvolves extending the mine life of Vazante mine from 2022 until 2027.Vazante. The total capital expenditures related to this project are estimatedin 2023 totaled US$2.5 million and we expect to be R$600.7invest an additional US$2.4 million or US$184.3 million, with US$108.0 million representing the total remaining investment necessary to conclude the project.in 2024. This project began in 2013 and the completion of this project, which was expected to occur in 2024, was postponed due to our capital allocation strategy and is forecastednow expected to endbe completed in 2022. Wethe second half of 2025.
| 69 |
| Mining Operations |
In addition, we are conducting exploration activities below the mine’s current operating level of operation. We believe this project will maintainand alongside the Vazante mine’s production at 135,000 tonnes of zinc per year until 2029.orebody. As part of this project, we plan to investare investing in ongoing exploration activities and infrastructure, including expansion of an underground pumping station, expansions, increasingan increase in the capacity of the ventilation system, emergency paths, dry stack tailings, access ramps, electrical networks and substations.
Ambrósia trend
We are working on developing research on During 2020 and 2021, we assembled and commenced operating the depositsEB347 pumping station and mineral occurrences withinprogressed the Ambrósia Trend, partactivities of CEMIG’s electric power line; however, phase 2 of the Morro Agudo project. This program aimsEB-140 was rescheduled in 2022 due to identify mineralization that can be minedhydrogeological studies. In 2023, we prepared the area to receive the equipment in order to ensureaccordance with the supply of zinc for the Três Marias smelter. Any mill feed material extracted will be sent for processing at the Morro Agudo plant located 70 km to the south.
The Ambrósia Sul project is part of the Ambrósia Trend program. The infrastructure for Ambrósia Sul is located at an industrial facility approximately 2.5 km away from the open pit mine. The facility includes an administrative support area, scales and a mechanical repair shop for mine equipment. The energy required for the operation is obtained through a 2.8 km long transmission line that has a 13.8 kilovolt connection. The line was constructed by the Companhia Energética de Minas Gerais, a partially state-owned company.
The total capital expenditures related to Ambrosia Sul project were R$62.3 million or US$19.2 million, which was primarily spent on the administrative support area and pre-strip mining of the Ambrósia Sul deposit and included all necessary infrastructure. During 2017,project’s specifications, in 2024 we completed the project. We expect to complete a final transmission line interconnection that was recently authorized by local energy agencyactivities in April 2018. In 2017,accordance with the Ambrósia Sul open pit produced 1.7 thousand tonnesupdated project schedule and we expect the pumps to be installed in the second half of zinc and 0.2 thousand tonnes of lead. In 2018, the Ambrósia Sul open pit is expected to produce 8.4 thousand tonnes of zinc and 0.3 thousand tonnes of lead.2025.
Cerro Pasco mining complex
Complex Integration Project
The Cerro Pasco mining complex projectComplex Integration Project is one of our main brownfield projects, which involves the continued integration of the El Porvenir and Atacocha underground mines. The projectIntegration Project is intended to continue to capture synergies between the two mining operations, resulting fromas a result of their proximity and operational similarities, with ore from both the underground mines being processed at the El Porvenir processing plant. The goal of obtaining coststhe Integration Project is to achieve cost and investment savings, thereby reducing the environmental footprint and reducing our environmental footprint.
The integration project is being developed through four stages. The first stage involvedextending the administrative integrationcombined life of both mines, which was completed in 2014 and involved US$41.7 million in expenditures. The second stage involved the integration of the tailing disposal system, which consolidated the operationsmine of the two mines with a single tailing disposal system and thereby helped reduce the environmental footprint. This stage was completed in 2015 and the integrated tailing disposal system commenced operations in the beginning of 2016, with expenditures of US$22.0 million. The third stage, which was completed in 2016, involved the construction of a new energy transmission line with a 138 kilovolt connection that supplies both mines, replacing the prior 50 kilovolt transmission lines. We spent US$5.1 million during this third stage. The fourth and final stage consists of the integration of the underground operations and underground facilities at the two mines, which is expected to be completed in 2018.mines. We expect to spendsubmit the project to the formal approval process with our Sustainability and Capital Projects (“SCP”) committee and our Board of directors in 2024. For further information see “Information on the Company—Mining Operations—Cerro Pasco Complex—Integration Project.”
Bonsucesso
The Bonsucesso project is a brownfield underground mine project that belongs to the Morro Agudo complex (Ambrósia Trend). The project is located 8 km north of the Ambrósia Sul mine and approximately 60 km north of the Morro Agudo mine.
In 2023, we had no exploratory activities in the Bonsucesso project and no activities are expected for 2024.
The feasibility study concluded in 2022 with no amount invested in 2023. The total investments related to this project, as of December 31, 2023, totaled US$20.012.8 million, in connection with the final stage, which includes US$14.0 million thatall project studies (from the scoping study to the feasibility study) and anticipated expenses related to construction and operating infrastructure.
The strategic review of our assets continues with initiatives to optimize our portfolio. We continue to assess risk-return alternatives and we expect to spend forare currently revisiting the development of the mine.project, taking into consideration our capital allocation strategy and our focus on free cash flow generation.
Mining greenfield projects
Conversion to Jarosite process
We intend to convert our Cajamarquilla smelter to the Jarosite process, which will allow for the recovery of a greater percentage of zinc. The conversion to Jarosite process is also attractive due to the positive market outlook for zinc. Amec Foster Wheeler has completed feasibility studies on the project, and we have decided to move forward with the construction phase of the project. In addition, an independent consultant performed crosschecks of the process route. Total capital expenditure for the conversion is estimated to be US$44.9 million, and the project is expected to be completed by September 2019.
The key variations from feasibility study to construction phase are due to additional improvements and changes in engineering development that resulted from the recommendations of experienced consultants in order to optimize the project’s results. The zinc recovery at Cajamarquilla is expected to increase from the current rate of 93.8% to 97.0% after completion of the project.
Greenfield projects
Project Name | Current Project Status |
| ||
|
|
| ||
| Exploration |
| ||
|
|
| ||
|
|
| ||
|
|
| ||
Florida Canyon Zinc | Exploration |
| ||
|
|
|
We summarize below certain information, including the outlook, for each of our greenfield projects. As of the date of this annual report, none of our greenfield projects have known reservesMineral Reserves under Industry Guide 7.S-K 1300.
Aripuanã
The Aripuanã project is owned by Mineração Dardanelos Ltda., a joint venture between Nexa Brazil (which holds a 62.3% interest), Nexa Peru (which holds a 7.7% interest) and Mineração Rio Aripuanã Ltda., a subsidiary of Karmin Exploration Inc. (which holds the remaining 30%). Aripuanã is an underground polymetallic project containing zinc, lead and copper, located in the State of Mato Grosso, Brazil, with a projected start date in 2020. The estimated aggregate capital expenditure required for this project is US$354.3 million.
Aripuanã shows characteristics of a Volcanogenic Massive Sulfide, or VMS, deposit similar to those found at Cerro Lindo. The pre-feasibility study stage was completed by Worley Parsons during 2017, and Nexa Resources approved the project to move forward to the feasibility study stage. SNC Lavalin is conducting the feasibility study on the development of an operation with a 5.0 ktpd ore mining and processing capacity, with construction approval expected in the fourth quarter of 2018. The environmental impact study for this project has been submitted to the SEMA/MT and is expected to be in its approval phase by the second quarter of 2018.
In 2017, we spent approximately US$6.6 million on the Aripuanã project—US$3.0 million on pre-feasibility studies and a further US$3.6 million on feasibility studies.
Shalipayco
The Shalipayco project is a joint venture between Nexa Peru (which holds a 75.0% interest) and Pan American Silver Corp. (which holds the remaining 25.0%), located in the Central Andes of Peru. It is a potential underground polymetallic project containing zinc, lead and silver deposits. This project consists of mining concessions with evidence of MVT mineralization, which is a deposit type similar to our Morro Agudo mine. The Shalipayco mineralization is mainly located within the Chambará formation that is part of the Pucará Group, considered the most important Peruvian location for MVT mineralization.
In 2017, we spent approximately US$6.4 million on this project, primarily relating to 36,134 meters of diamond drilling focused on resources expansion, geological mapping, surface targets follow-up, hydrogeological and mineralogical studies, project maintenance and permits.
RPA developed a preliminary economic assessment for this project in 2017. During 2018, we expect to perform further studies to improve the hydrogeological assessment and evaluate alternatives to process the ore from Shalipayco.
During 2018, we expect to start and finalize a scoping study, in compliance with our investment policies, allowing pre-feasibility, or PFS, level drilling to commence in late 2018.
Magistral
The Magistral mining project is located in the Ancash department inregion of Peru, approximately 450 km northeast of the capital of Lima and approximately 140 km east of the port city of Trujillo. The Magistral property can be reached by vehicle by driving a total of 272 km from Trujillo, much of which consists of poorly maintained roads that traverse steep topography. The Magistral Project consists of a large, irregularly shaped block of contiguous concessions and two smaller, non-contiguous single concessions. The Magistral Project comprises 36 granted concessions, totaling 16,254.2 hectares. The project is intended to be an open pit copper mine.mine with molybdenum concentrate as a by-product. In 2016, ProInversión approved aan initial feasibility study, which set forth production rates starting at 10.0 ktpd. Also in10 thousand tonnes per day and achieving 30 thousand tonnes per day. In 2016, the MINEM approved an environmental impact assessment or EIA, which allows us(“EIA”), to expand our treatment capacity toprocess up to 30.030 ktpd. An EIA modification is currently under the government approval process.
| 70 |
| Mining Operations |
Nexa Peru was awarded the contract to develop the Magistral mining project in 2011, which has been amended from time to time. Nexa made an initial payment of US$8.0 million to acquire the Magistral concessions, subject to a 2.0% NSR royalty upon production. Under the terms of the contract in 2016, Nexa Peru exercised the option by committing to invest a minimum 70% of declared initial capital expenditures by September 2024 and as a result of the COVID-19 pandemic, this term was extended by the government for an additional year, starting in September 2024. In addition,2023, new alignments were finalized and an additional 35 month extension period was approved by force majeure, extending the period until August 2028. Pursuant to the terms of this commitment with the Peruvian Government, to minimum investments levels in the project during this period, Nexa Peru would be required to pay a penalty of 30% over the unexecuted minimum investment commitment. As of December 2016, we31, 2023, the unexecuted minimum investment commitment was US$323.0 million, and if not completed the penalty exposition would be US$97.0 million. Nexa Peru currently holds a 100.0% interest in 15 of the 36 concessions, Nexa holds 21 concessions by way of a lease agreement entered into an agreement with Activos MinerosCompanía Magistral S.A.C. and ProInversión for the transfer of mining concessions corresponding to, a company also controlled by Nexa Peru. We spent approximately US$0.5 million on the Magistral project in 2023.
The feasibility study of the Magistral project was conducted in 2022 and in 2023, we advanced with the EIA amendment review process by responding to inquiries from Activos Minerosthe Ministry of the Environment (SENACE). We continue to Nexa Peru.
To improveassess strategic risk-return alternatives to the project revenue, we spent approximately US$0.6 million during 2017 to analyze further optionsby taking into consideration capital allocation decisions and optimize plant size. Ausenco, an Australian firm, developed a scoping study compliant with Nexa’s investment policies and identified opportunities to improve project internal rate of return and net present value. Nexa approved the study in accordance with its governance policies. During 2018,free cash flow generation. In 2024, we expect opportunities identifiedthe final decision relating to the EIA amendment request, which was submitted to SENACE in November 2023 for its assessment.
Exploration Developments
The Magistral property is near the northeastern end of the Cordillera Blanca, a region that is underlain predominantly by Cretaceous carbonate and clastic sequences. These units strike north to northwest and are folded into a series of anticlines and synclines with northwest-trending axes.
Since acquiring the Magistral project in 2011, Nexa has initiated a comprehensive exploration program consisting of geological mapping, prospecting and sampling, ground geophysical surveying, and diamond drilling. Geological mapping at a scale of 1:2,000 was completed in the scoping studyAncapata area and the area north-northeast of Magistral. The objective was to be further developedverify and supplement the information available from Ancash Cobre’s exploration.
From October 2012 to PFS level, consistingJanuary 2014, Arce Geofisico SAC was contracted to complete ground magnetic and Induced Polarization (IP) surveying over an area of 520 hectares covering the Magistral deposit and the adjoining Ancapata area. The objective was to characterize the geophysical signature of the Magistral deposit and to survey the Ancapata area. Work was completed on 100 m spaced lines oriented at N125°W. An initial 30 line-km survey was expanded to 55.1 line-km of IP and 57.25 line-km of ground magnetics in order to delineate chargeability and resistivity anomalies.
Through the end of 2015, a total of approximately 101,900 m of surface diamond drilling bench testinghas been completed in 486 drill holes. In addition, 14 short underground diamond holes were drilled for a total of 1,298.8 m in the San Ernesto, Arizona, and PFS-level studies. We expectSara zones between 1969 and 1973. In 1999, 2000, and 2001, Anaconda drilled 76 diamond drill holes totaling 24,640 m. All surface drilling from 2000 onward was carried out on northeast (035o) and northwest (305o) oriented sections. In 2004, Ancash Cobre (or Inca Pacific) completed 34 drill holes, totaling 7,985 m, and in 2005 Ancash Cobre (or Quadra) drilled 14,349 m in 60 holes. Milpo’s drilling in 2012 was contracted to Redrilsa Drilling S.A. (or Redrilsa). Since 2012, the total budgetdrilling has been contracted to Geotecnia Peruana S.R. Ltda.
Of the 71 holes drilled in 2013, six were drilled to gain geotechnical information and the remainder were infill holes. Drilling in 2014 consisted of a combination of infill, geotechnical, and metallurgical holes. In 2015, drilling consisted entirely of infill holes, drilling ceased on the property in the same year. No exploration drilling program was carried out on since then and no exploratory drilling program is scheduled for this phase to be US$9.0 million. PFS is expected to be approved by our board of directors in early 2019. Permits for PFS-level drilling have been recently issued by the Peruvian government.2024.
| 71 |
| Mining Operations |
Hilarión
The Hilarión exploration project is located 50in the Department of Ancash, approximately 230 km north of Lima, the capital of Peru, and approximately 80 km south of the Antamina mine in the Ancash department in Perucity of Huaraz and 230 kmis accessible by paved road from Lima. It consists of 72 mineral concessions covering an area of approximately 15,841.2 hectares. Hilarión is a skarn mineral deposit made of vertical tabular orebodiesore bodies containing sulfide zinc, lead, silver and copper deposits. Hilarión and El Padrino and other occurrences in proximity to them (Mia, Eureka and others) constitute a large mineralized system, open in several directions for a potential increase in resources, extended mine life and increased production capacity in the future. The conceptual plan for the project concept isincludes the development of an underground mine that could either use its own processing plant or use one of the several existing plants in the area, such as Pachapaqui, Huanzala and Atalaya plants.
In 2020, we drilled 5 drill holes totaling 4.6 km, completed the sampling for metallurgical test studies, and filed a preliminary economic assessment (“PEA”) for the Hilarión project. In 2021, we executed 21.3 km of diamond drilling to test Hilarión Sur target, totaling 32 drill holes confirming the southeast continuity of the Hilarión deposit towards the edge of the Hilarión stock with multiple thick intersections, in addition to 0.3 km remaining from the 2020 drilling campaign. In 2022, we completed mineral exploration activities including a geological review of recent project data, an aero magnetometry survey to structure the drilling program, found new mineralized zones and expanded the known mineralization at Hilarión West, and drilled 7.2km at the Hilarión West, confirming the presence of mineralization to the west of known bodies and their continuities.
In 2017,2023, we spent approximately US$1.64.2 million on the Hilarión project, including project maintenance, geology works and permits. Asdrilling campaigns. We completed 4.1 km of December 31, 2017,diamond drilling, and the focus of the exploratory activities was to identify the mineralization continuity of the deposit in the southeast direction, at the Chaupijanca target, in addition to searching for zones with higher copper content at the El Padrino target.
In 2024, we have budgeted US$1.6 million for the Hilarión project hasmaintenance, and we have planned no drilling totaling 243,960 meters in 597 diamond drill holes at the Hilarión deposit, in addition to drilling totaling 38,290 meters in 87 diamond drill holes at the El Padrino deposit.activities.
Pukaqaqa
The Pukaqaqa project contemplates the development of an open pit copper and molybdenum mine, with gold credits. The mineralization is hosted by an epithermal breccia system that is associated with exo- and
endoskarn alterations. Given the geological setting, it is likely that a porphyry copper system remains undiscovered below the currently explored geology which will be confirmed in the following exploration phases.
In 2015, the MINEM approved Pukaqaqa’s EIA, which allowed for treatment capacity of up to 30.0 ktpd. In 2017, we spent approximately US$0.6 million on the Pukaqaqa project to develop a scoping study by JRI, a Chilean engineering firm, in compliance with our investment policies. Nexa approved the study in late 2017. During 2018, we expect to start a PFS, following approval by our board of directors, during the second half of 2019. In 2018, we expect our primary activities at Pukaqaqa to consist of drilling and testing to better understand the deposits. Permits for PFS level drilling have been recently issued by the Peruvian government. The expected budget for the PFS is US$9.4 million.
Florida Canyon Zinc
The Florida Canyon Zinc project is located in the Eastern Cordillera of Peru at the sub-Andean front in the upper Amazon River Basin, 680 km north-northeast of Lima and 245 km northeast of Chiclayo and is accessible by paved road from Lima. It is comprised of 13 contiguous mining concessions, covering approximately 10,700.0 hectares, is owned by Minera Bongará S.A. and operated by Minera Bongará S.A.,Nexa Peru, a joint venture between Nexa Peru, Solitario Exploration and Royalty Corp. and Minera SolitariaSolitario Peru S.A.C. (collectively, Solitario) in existence since 2006. As of December 31, 2017,2023, Nexa Peru owns a 61.0%61.00% interest in this joint venture, which may increase up to 70.0%70.00% upon Nexa Peru’s satisfaction of certain funding conditions.
Although a pre-feasibility study relating to the Florida Canyon Zinc iswas released in 2017, the project continues to be treated as an advanced mineral exploration project comprised of sixteen contiguous mining concessions, covering approximately 12,600 hectares.
project.
In 2017,2021, field work focused on mapping access road from 0 km up to 19.5 km; and mapping, sampling and topographic survey of Teodolfo, Matias, Berny, and Pizarro targets, in addition to a new mineral occurrence named Aron, as well as metallurgical testing using historic drill core material.
In 2022, we advanced the opening of the road that connects the project structures to the main camp and carried out geometallurgical tests to establish better mineralogical and metallurgical knowledge of the deposit, which showed high recovery of zinc and lead concentrates, as well as the presentation of the fifth environmental modification to the competent body.
| 72 |
| Mining Operations |
In 2023, drilling at the Florida Canyon began in the third quarter due to a delay in the drilling program caused by lack of transportation for drilling materials. In September, construction and maintenance of the motorized trail, which aims to reach La Florida Annex, commenced and is expected to be completed in 2024.
We spent approximately US$0.73.6 million on this project. A large drilling operation took placeproject in 2012, when2023 to drill 1.4 km and we investedhave budgeted US$4.52.0 million in order to improvefor the project’s ore classification. As of December 31, 2017, Florida Canyon Zinc has 117,260 metersproject in 2024, including road maintenance and construction of drilling in 486 diamond drill holes, which supported the reportfinal stretch that was finalized in December 2015.
In January 2017, Solitario engaged SRK Consultingconnects the road to complete a preliminary economic assessment on Florida Canyon Zinc, which was completedthe main exploration camp in the second quarterdrilling area, maintenance of 2017. However, since late 2017, wethe project structure, and social programs. No drilling activities are planned for 2024.
Other Greenfield Exploration Projects
Project in Namibia
We have been workingdeveloping exploratory work in Namibia since 2015, as part of a joint venture with the Japan, Oil, Gas and Metals National Corporation (“JOGMEC”), a Japanese state-owned company. The project was part of a farm-out process of the Namibian tenements inherited from the former strategy of Votorantim Metals to completeexplore opportunities in Africa, where Nexa has a back-in right to invest and maintain participation depending on exploration results. The exploration area is located 360 km north of Windhoek. This early-stage exploratory program is targeting sediment-hosted copper mineralization, such as the Tsumeb and project activitiesKombat mines, both of which contain rocks from the Otavi Mountain land terrain.
Nexa currently holds 560,078.1 hectares in line26 exclusive prospective licenses (“EPL”) for the Otavi and Namibia North targets.
The 2022 exploration expenditures totaled US$3.1 million (US$2.2 million for JOGMEC expenditures and US$0.8 million for Nexa expenditures) with our investment policies to begin a scoping study. As of December 31, 2017, we have completed the construction of 26 km, out of a total of 509.1 km drilled. The focus of the drilling campaign in access roads for drilling purposes, reducing logistics costs.
Caçapava do Sul
2022 was the expansion of mineralization in the Otavi target and the identification of new mineralized zones of the “Deblin” copper trend in the Namibia North target.
The Caçapava do Suldrilling campaign in 2023 was focused on extending the known mineralization from the Deblin trend, intensifying drilling to further investigate polymetallic mineralization identified at the Ondjondjo target and targeting of high-grade copper sediment deposits along the fertile Tsumeb belt. We spent approximately US$2.2 million, divided between Nexa (US$0.3 million) and JOGMEC (US$1.8 million) on this project is owned and operated by Mineração Santa Maria Ltda., a subsidiaryin 2023 to drill 4.9 km.
To date, we are defining the budget for the project as part of Nexa Brazil. Nexa Brazil and Mineração Iamgold Brasil Ltda. have entered into a joint venture agreement pursuantwith “JOGMEC” as the Japanese fiscal year ends in March 2024. Nexa is currently focusing on mapping and defining regional opportunities and we plan to which Mining Iamgold Brasil Ltda. has the option to acquire up toexecute a 25.0% equity interestgeophysical survey at Tsumeb Block, conduct exploratory drilling in Mineração Santa Maria Ltda. Mineração Santa Maria Ltda. holds a 100.0% interestTsumeb East and define opportunities in the mineral rights of the Caçapava do Sul project. The Caçapava do Sul project is a polymetallic project that has the potential to be mined by open pit methods.Namibian Kalahari Copperbelt throughout 2024.
In 2017, we spent approximately US$3.7 million on the Caçapava do Sul project, drilling 24,115 meters in 69 holes.
Permits & authorizations for greenfield projects
The following table summarizes the status of the main permits and authorizations for our greenfield projects.
Project | Status | |
| An amendment to the EIA was submitted to the Ministry of the Environment (SENACE) in the fourth quarter of 2021 for its assessment. In October 2023, we responded to SENACE inquiries. The amendment to the EIA is in the final approval stage and a decision is expected in 2024. | |
| Hilarión | The most recent environmental study is the fifth modification to the Hilarión Project’s EIS, which consisted of obtaining approval for new exploration | |
|
| |
|
| |
|
The authorization for exploratory activities at the El Padrino | |
| Florida Canyon Zinc | The most recent environmental study is the fifth modification to the Florida Canyon Project’s EIS, which consisted of obtaining approval for new exploration platforms and reviewing the drilling program. It was approved in 2023 and is valid until 2028. |
| 73 |
| Mining Operations |
Tailings disposal
Regulatory framework
We are subject to several environmental regulations related to the use of tailings dams and effluent dams.
In Brazil, tailings dams’ failures have triggered the issuance of new regulations. On January 25, 2019, there was a tragic failure of a tailings dam in the city of Brumadinho, in the state of Minas Gerais, Brazil. The Brumadinho dam was built using the upstream method and belongs to Vale S.A. A report by a panel of technical experts commissioned by Vale S.A. found that the tailings dam failure was the result of flow liquefaction within the tailings in the dam. Another upstream-method tailings dam in Brazil, the Fundão tailings dam owned by Samarco Mineração S.A., failed in November 2015. Each of these failures released muddy tailings downstream, flooded certain communities, caused fatalities and resulted in extensive environmental damage to the surrounding area.
In response to failures of tailings dams in Brazil, the state of Minas Gerais enacted regulations in February 2019 affecting the use of dams in the state, including tailings dams and effluent dams that mandate the decommissioning of all upstream tailings dams and prohibit construction of new tailings dams using the upstream method. Additionally, a rule approved by the ANM requires all inactive upstream dams to be decommissioned by 2021 and active upstream dams to be decommissioned by 2023.
In addition, in February 2019, the state of Minas Gerais enacted regulations that prohibit the construction of a new dam or the expansion of existing dams if communities are established within its self-rescue zone, an area encompassing the portion of the valley downstream of the dam where timely evacuation and intervention by the competent authorities in emergency situations is not possible. All of the tailings dams located in Minas Gerais have permission to operate, however, future licensing for new tailings storage facilities or new raises must consider any community in the hazardous zone. Due to the difficulty in licensing new dams in the state of Minas Gerais, in February 2023 we began industrial-scale testing the technology developed for dry stacking disposal at the Três Marias unit, which consists of filtering the waste pulp for subsequent disposal through the dry stacking process, as waste disposal in this unit was going directly to its tailings deposit. The initiative achieved excellent results, filtering an average of 74% of the operation’s material throughout the year. In December 2023, filtration reached more than 90% and from 2024 onwards, we expect filtration to reach between 95% and 100%. We expect that the Company will be able to utilize dry disposal in the future to reduce the risks for communities in the hazardous zones. Due to the promising progress of the dry disposal tests and the difficulties in licensing new dams and dam expansion projects, we canceled the licensing request that was in progress in Três Marias for the Central and West 1 module of the Murici Deposit to begin the licensing process of the dry stacking disposal.
In 2020, the mining authorities in Brazil enacted two regulations that establish new procedures related to dams. The first resolution (Resolução ANM 32/2020), decreed in May 2020, determines procedures to develop dam break studies and deadlines to update the Emergency Action Plan (“EAP”) depending on the dam class. This regulation updated previous mining agency standards. We have updated the dam break studies of all mining dams according to these procedures. The second resolution (Resolução ANM 51/2020), decreed in December 2020, defines procedures to certify the EAP. In 2022 the ANM enacted Resolution No. 95/2022, amended by Resolution No. 130/2023, which consolidates all dam safety standards by unifying and regulating the innovations promoted by Law No. 14,006/2020.
At the end of 2020, the Brazilian Federal Authorities decreed that the new dam safety law (Law No. 14,006/2020) updates the previous dam safety Law No. 12,334 enacted in 2010. Similar to the regulation enacted in February 2019, this new law defines that new upstream tailings dams and new raises are no longer permitted and, that the EAP is mandatory for all mining dams that store tailings. This law also limited the construction of new tailings dams if communities are established within its self-rescue zone. In this case, the mining company must remove the residents or reinforce the dam structure according to the technical solution approved by the ANM. In 2022, the mining authorities in Brazil enacted a regulation that establishes new procedures related to dams (Resolution ANM 95/2022), which consolidated the safety standards for mining dams, revoking several previous regulations (Ordinance DNPM No. 70,389/2017 and Resolutions ANM No. 13/2019, 32/2020, 40/2020, 51/2020 and 56/2021) and also regulated items by the national legislation (Law No. 14,066/2020), which modified the National Dam Safety Policy.
| 74 |
| Mining Operations |
The changes included the alteration of the assumptions of risk category and emergency level classifications, the inclusion of new suspension and interdiction assumptions, and the creation of new obligations such as the Risk Management Process for Mining Dams (“RMPMD”), for high Associated Potential Damage (“APD”) dams. The RMPMD consists of the risk assessment of the structure in acceptable and not acceptable “As Low as Reasonably Practicable” terms and integrates the management and decision-making related to mining dams.
In 2021, we began implementing the requirements covered by these regulations to all mining dams including certification of the EAP, staff safety trainings, and dam break simulations in accordance with the new regulation.
In 2022, Nexa revised the EAP for all mining dams to adapt to the new Brazilian regulations and considering the new EAP guidelines, detailed by specific terms of reference (Termos de Referência), which were published in 2021.We sent the EAP to all relevant public agencies and published the document on our website. In 2023, we also conducted the Compliance and Operational Evaluation (“COA”) of the EAP for mining, which consists of a legal requirement that aims to certify that the EAPs comply and adhere to the legislation and would be operational in practice in case of an emergency. Thus, the EAP was evaluated by an external company that issued the Compliance and Operability Report (“COR”) and Declaration of Conformity and Operability (“DCO”) of the EAP.
On December 30, 2023, the State of Minas Gerais published State Decree No. 48,747/2023, regulating the environmental recovery policies that companies are required to have in place in the event of an accident or deactivation of a dam, pursuant to a prior state law passed in 2019. Under State Decree No. 48,747/2023, any dams that meet the requirements established under the 2019 Dam Safety Policy law must have an environmental guarantee policy in place. Nexa estimates that it will require US$27.3 million to cover the applicable dams under this policy. The guarantee can be made by one of the following methods: (i) cash deposit; (ii) CDB; (iii) bank guarantee; or (iv) guarantee insurance. The Company has until March 29, 2024 to submit an environmental recovery proposal and must contract for 50% of the policy by December 31, 2024, 25% by December 31, 2025 and 25% by December 31, 2026 and expects to comply with this requirement.
In Peru, the upstream method has long been an abandoned practice due to seismic concerns in the region. As of 1995, compulsory guidelines were passed prohibiting the use of such method. Subsequently, in 2014 environmental regulators, and later technical regulators, in 2015, adopted the same guidelines prohibiting construction and operation under the upstream method, allowing only the use and construction under the centerline and downstream methods. A specialized governmental agency carries out periodically inspections of tailings dam and mining infrastructure, ensuring technical and environmental regulations are complied with. In addition, mining operations must submit biannual stability studies, to which they are held liable. We follow these guidelines, and all operative tailings dams use the downstream and centerline lift methods.
El Porvenir’s tailings dam is currently supported by an authorization for operation up to an altitude of 4,064 meters above sea level (“masl”), which was granted by the Ministry of Energy and Mines on May 25, 2023, the previous authorization was for 4,062 masl. Activities to expand the El Porvenir’s tailings dam to an elevation up to 4,066 masl are underway and the approval process for the operation will begin in April 2024, and it is expected to last up to 3 months.
For more information, see “Risk factors—Operational risks—The failure of a tailings dam could negatively impact our business, reputation and results of operations, and the implementation of associated regulations and decommissioning processes may be expensive.”
Nexa’s practices
We monitor tailings and waste dams in accordance with international best practice guidelines for management and project design based on criteria set by the International Commission on Large Dams (“ICOLD”) and the Canadian Dam Association (“CDA”) dam safety guidelines. In 2023, all of our tailings dams in Brazil received Stability Condition Declarations (“DCEs”), certifying that these facilities are safe and stable. In Brazil, these certifications are carried out twice a year for mining and smelting dams. In Peru, they occur once a year. As of the date of this annual report, all tailings dams in Peru have undergone the certification process, and we concluded a technical report for these dams during the first half of 2023. In addition, all our dams and dry stacking structures are monitored under a system known as the Sistema de Gestão de Barragens ou Depósitos / Tailing Dam Management System (“SIGBAR/SIGDEP”), which consists of procedures, tools and key performance indicators, monthly reports and monitoring and analysis by an independent Geotechnical Engineer. The monitoring procedures include regular inspections, as well as internal and external audits.
| 75 |
| Mining Operations |
In addition to the above-mentioned policies and procedures, our SCP committee assists and advises our Board in supporting safe and sustainable business practices in our conduct and activities, as well as in reviewing technical, economic and social matters with respect to our projects.
In 2020, management reviewed the EAP for all mining dams in accordance with the new Brazilian regulations released midway through 2020 and we trained our internal team in these new procedures. New EAP guidelines, detailed by specific terms of reference, were published in April, May and June 2021. In 2022, all plans for the units in Brazil were reviewed and filed with their respective government’s environmental agencies, and as of the date of this annual report, approval is pending from the respective environmental agencies. In 2023, we began conducting engineering studies to confirm the construction method of inactive industrial waste containment structures that have been closed for more than 20 years.
For more information about our SCP committee and ESG initiatives, see Information on the Company—Environmental, Social and Governance (ESG) and corporate initiatives—Sustainability Committee and Reporting.”
We use four disposal options for tailings. Our preferred option is to convert part or all of the tailings material into a commercially viable product. We use this method at our Morro Agudo mine, where most of the tailings that we produce are ZinCal, a limestone rich in zinc that is used as fertilizer, which we sell, not requiring the disposal of tailings materials.
When the conversion method is not available, we prefer to use the backfill method for our underground mines. This technique involves removing moisture from tailings, creating a mixture with cement and filling open spaces in the mines with this combination. We believe this method reduces safety risks related to tailings disposal given that it provides greater geotechnical stability and does not involve the building of a dam or dry stacking structure.
If neither the conversion nor the backfill method is available, we prefer to use the dry stacking method, which involves removing moisture from tailings and stacking them in layers to form an artificial mountain covered with soil and vegetation, causing it to integrate into the local landscape. We use the dry stacking and backfill methods at our Cerro Lindo mine in Peru since the startup of our mine. In 2019, we started operating a dry stacking facility, which substituted the tailings dam in Vazante. With this new structure, over 74.1% of our tailings disposal is done either through backfill or dry staking, reducing our exposure to dams. We are currently developing the backfill and dry stacking methods at our Aripuanã unit, which began the ramp-up in July 2022, and in February 2023 we started industrial-scale testing for dry stacking disposal at the Três Marias unit.
When neither of these three methods is possible, we use tailings dams. The dam acts as a solid barrier engineered to prevent the tailings material from escaping to the environment around the mine. We use this method in Peru at our El Porvenir and Atacocha mines and at our Cajamarquilla smelter, and in Brazil at our Vazante and Morro Agudo mines and Juiz de Fora and Três Marias smelters. We also use a combination of the backfill method and tailings dams at our El Porvenir and Atacocha mines in Peru. At the Aripuanã mine, we have built a water dam to supply water to our plant. This dam is engineered with borrowed material and uses the technical control of compaction of the soil.
We currently raise our tailings dams using the following two methods: (i) the downstream method, where the building material is disposed downstream of the crest of the dam body; and (ii) the center-line method, where the building material is disposed partially downstream and partially upstream of the crest of the dam body, while maintaining the same centerline of the crest. Historically, we have also used the upstream method – where the building material is disposed upstream of the crest of the dam body – in certain instances.
In addition, we also use effluent dams, which are dams used to treat water that contains tailings particles or other solid particles. The effluent dams separate the tailings particles or other solid particles from the water by retaining the particles and releasing the clean water downstream. Finally, we use products dams for the provisional storage of ZinCal prior to its sale.
| 76 |
| Mining Operations |
We currently have 24 active and 25 inactive disposal facilities (including tailings dams, dry stacking facilities, effluent dams and products dams), 24 located in Peru and 24 located in Brazil, and we also have one water storage dam at the Aripuanã unit. The following is an overview of the dams we have in place at our principal mining and smelting facilities:
Peru
| · | At Cerro Lindo, we have no tailings dams, and tailings are |
| · | At El Porvenir and Atacocha, tailings are disposed of using a combination of the backfill method and tailings dams; there are two tailings dams in active use and four non-operational tailings dams, which are in the process of |
| · | At Cajamarquilla, there are three tailings dams in active use and four non-operational tailings dams, which are in the process of being decommissioned. |
| · | At the Chapi mine property, which is currently inactive, there are five non-operational tailings dams. |
| · | At the Sinaycocha property, which is part of our Atacocha mine property, there are two non-operational tailings dams. |
Brazil
| · | At Morro Agudo, most tailings are converted for sale, and the product is stored temporarily at two products dams until it is sold. A separate tailings dam is used to store tailings that are not convertible into product. |
| · | At Vazante, tailings are disposed of using a |
| · | At Juiz de Fora, there is one tailings dam in active use, three effluent dams in active use and six non-operational waste dams, one is in the commissioning process and the other five have been decommissioned since 2002. |
| · | At Três Marias, there are three waste dams in active use and three non-operational tailings dams, which are in the process of being decommissioned. |
| 77 |
| ||
|
| |
|
|
Smelting operations
The table below provides an overview of our smelting facilities:
Smelting Unit | Location | Smelting | Principal | Plant | Metallic Zinc | Zinc Oxide | Other Products |
| (in tonnes of refined zinc per year) | (in tonnes of zinc metal available for sale, includes alloys) | (in tonnes of zinc oxide) | |||||
| Cajamarquilla | Peru | RLE | Metallic zinc (SHG, CGG jumbos and alloys) | 344,436 | 323,059 | 0 | Sulfuric acid, silver concentrate, copper cement and cadmium sticks |
| Três Marias | Brazil | RLE | Metallic zinc (SHG, CGG jumbos, alloys and Zamac) and zinc oxide | 192,199 | 148,354 | 33,966 | Cadmium and cobalt cement |
| Juiz de Fora | Brazil | Waelz Furnace and RLE | Metallic zinc (SHG, alloys and Zamac) | 96,923 | 82,147(1) | 0 | Sulfuric acid, sulfur dioxide, silver concentrate, copper sulfate and zinc ash |
| Total | 633,588 | 553,559 | 33,966 |
Smelting Unit |
| Location |
| Smelting |
| Principal |
| Plant |
| Metallic Zinc |
| Zinc Oxide |
| Other |
|
|
|
|
|
|
|
|
| (in tonnes of |
| (in tonnes of |
| (in tonnes of |
|
|
|
Cajamarquilla |
| Peru |
| RLE |
| Metallic zinc (SHG, CGG jumbos and alloys) |
| 335,000 |
| 309,925 |
| — |
| Sulfuric acid, silver concentrate, copper cement and cadmium sticks |
|
Três Marias |
| Brazil |
| RLE |
| Metallic zinc (SHG, CGG jumbos, alloys and Zamac) and zinc oxide |
| 190,000 |
| 185,829 | (1) | 30,827 |
| Cadmium briquettes |
|
Juiz de Fora |
| Brazil |
| Waelz Furnace and RLE |
| Metallic zinc (SHG, alloys and Zamac) |
| 89,000 |
| 87,319 | (2) | — |
| Sulfuric acid, sulfur dioxide, silver concentrate, copper sulfate and zinc ash |
|
Total |
|
|
|
|
|
|
| 614,000 |
| 583,073 |
| 30,827 |
|
|
|
| (1) | Including 1,768 tonnes of zinc cathodes transferred from Três Marias. |
(1) Including 29,335 tonnes of zinc ashes and drosses, as well as metallic zinc used in the production of zinc oxide, zinc granules and zinc powder. Does not include zinc cathode from Juiz de Fora.
| Notes: |
(2) Including 2,453 tonnes of zinc ashes and drosses and 3,601 tonnes of zinc cathodes transferred to Três Marias.
Notes:RLE means roast-leach-electrowin.
stands for Roast-Leach-Electrowinning.
Alloys are zinc-based products with the addition of up to 1.0% of a specified metal, which are primarily used in the galvanizing market.
Special alloys are zinc-based products with addition of specified metals, which are primarily used in galvanizing market.
Zamac is a zinc-based product with the addition of specified metals, which are primarily used in the die casting market.
Smelter sales
Zinc contained in smelting products sold
The tables below provide key information for the periods indicated regardingWe produce various kinds of refined zinc products, such as the typical gradeproducts. In 2023, we sold a total of 556.0 thousand tonnes of our metallic zinc in each line of products total volumes sold(including SHG, CGG jumbos, alloys, Galvalume and Zamac). In addition, we commercialized 33.9 thousand tonnes of zinc containedoxide at 80.0% standard zinc content in each line2023, totaling 589.8 thousand tonnes of productzinc metal products sold.
In March 2021, our calcine supplier in Peru shut down its facility, reducing our calcine availability and, consequently, impacting our production and sales going forward. Since 2022, we are mitigating part of this supply decrease by sourcing raw materials from other suppliers.
Metallic zinc
|
|
|
| Standard |
| Product Volume Sold for |
| Zinc Contained in |
| ||||||||
Product |
| Content |
| Content |
| 2017 |
| 2016 |
| 2015 |
| 2017 |
| 2016 |
| 2015 |
|
|
|
|
|
|
|
|
| (in tonnes) |
|
|
| (in tonnes) |
| ||||
SHG |
| Zinc |
| 99.995 | % | 336,065 |
| 343,761 |
| 366,149 |
| 336,049 |
| 343,744 |
| 366,131 |
|
CGG Jumbos |
| Zinc |
| 99.5 | % | 160,151 |
| 169,197 |
| 138,415 |
| 159,350 |
| 168,351 |
| 137,723 |
|
Alloys |
| Zinc, other metals |
| 99.3 | % | 49,475 |
| 49,699 |
| 43,179 |
| 49,129 |
| 49,351 |
| 42,877 |
|
Zamac |
| Zinc, Aluminum, Magnesium, Copper |
| 94.5 | % | 9,727 |
| 10,448 |
| 12,536 |
| 9,192 |
| 9,873 |
| 11,847 |
|
Total |
|
|
|
|
| 555,419 |
| 573,105 |
| 560,279 |
| 553,720 |
| 571,319 |
| 558,578 |
|
Zinc oxide
|
|
|
| Standard |
| Product Volume Sold for the Year |
| Zinc Contained in Product Volume |
| ||||||||
Product |
| Content |
| Content |
| 2017 |
| 2016 |
| 2015 |
| 2017 |
| 2016 |
| 2015 |
|
|
|
|
|
|
|
|
| (in tonnes) |
|
|
|
|
| (in tonnes) |
|
|
|
Zinc oxide |
| Zinc, Oxygen |
| 80.0 | % | 38,472 |
| 37,386 |
| 34,804 |
| 30,777 |
| 29,909 |
| 27,843 |
|
Cajamarquilla
The Cajamarquilla smelter is located in the district of Lurigancho/Chosica in Lima, Peru, and is accessible by road.
The Cajamarquilla smelter is currently the largest zinc smelter in Latin America and the only zinc smelter in Latin America outside Mexico and Brazil, according to Wood Mackenzie. It uses the RLE process to produce metallic zinc. With an annual production capacity of 335,000344.4 thousand tonnes of metallic zinc, the Cajamarquilla smelter produced 309,925323.1 thousand tonnes of zinc metal available for sale in 2017.2023. In recent years, Cajamarquilla developed operational efficiencies, including debottlenecking projects, which increased the production of calcine from concentrates obtained from Nexa Peru, and the use of calcine and waelz oxide processed by third parties. See “Risk factors—Operational risks—Inadequate supply of zinc secondary feed materials and zinc calcine could affect the results of our smelters.”
The Cajamarquilla smelter produces zinc primarily from zinc contained in concentrates and, to a lesser extent, recycled zinc secondary feeds (also referred to as pre-treated concentrate). In 2017,2023, the Cajamarquilla smelter consumed approximately 328.0341.0 thousand tonnes of zinc contained in concentrates. In 2017, 42.6%concentrates and secondary raw material, which consumed 27.2% of the zinc contained in concentrates used by the Cajamarquilla smelter was sourced from our mines, 68.5% of zinc contained in Peru and 57.4% was purchasedconcentrates from third parties.parties and 4.3% from secondary raw material.
| 78 |
Smelting Operations |
In 2017,2023, the Cajamarquilla smelter sold approximately 312.0326.4 thousand tonnes of metallic zinc, of which 32.0%30.6 % of the volume was sold to Latin America (including Mexico), 22.0%19.6% to Europe, 18.0%14.7% to the United States, and Canada, 3.0%20.1% to international traders 19.0%and 15.1% to Asia and 6.0% to Africa.Asia. The Cajamarquilla smelter also produces jumbo and zinc alloy, sulfuric acid, silver concentrate, copper cement, manganese dioxide, oxides (ashes) and cadmium sticks. These products are sold primarily to international traders and local customers.
The following table presents the historical concentrates processed and zinc recovery rate in Cajamarquilla for the periods indicated.
|
| For the Year Ended December 31, |
| For the Year Ended December 31, | ||||||
|
| 2017 |
| 2016 |
| 2015 |
| 2023 | 2022 | 2021 |
Input (in tonnes) |
|
|
|
|
|
|
| |||
Zinc Contained in Concentrate from Our Mines |
| 139,967 |
| 133,179 |
| 120,394 |
| 92,827 | 104,150 | 130,614 |
Zinc Contained in Concentrate from Third Parties |
| 188,318 |
| 212,658 |
| 233,714 |
| 233,425 14,745 | 239,587 17,081 | 213,703 9,583 |
Secondary Raw Material |
| 654 |
| — |
| — |
| |||
Total Inputs |
| 328,939 |
| 345,837 |
| 354,108 |
| 340,996 | 360,819 | 353,899 |
Zinc Recovery (%) |
| 95.5 |
| 93.8 |
| 93.0 |
| 93.8 | 94.7 | 94.3 |
Brownfield project
Conversion to Jarosite process
In 2017, we announced our intention to convert our Cajamarquilla smelter to the Jarosite process, which would allow for the recovery of a greater percentage of zinc. The project was estimated to improve the zinc recovery rate by 3.0% at the Cajamarquilla smelter. We initiated the construction phase in 2018 and in December 2019, the implementation of the conversion process was suspended due to problems with contractors and suppliers. We wrote off our investment and the project remained on hold following our capital allocation strategy. In 2023, our internal technical and engineering teams considered the engineering studies of the project and detailed engineering was updated. In 2024, we expect to continue working on the execution plan, enhancing the detailing around the piping tie-ins and conducting constructability exercises to optimize the project’s schedule and guarantee operational alignment with the maintenance intervention program. Further decisions on the advancement of this project will remain under review, taking into consideration our capital allocation strategy for the upcoming years.
Três Marias
The Três Marias smelter is located in the municipality of Três Marias in the state of Minas Gerais, Brazil, 250km250 km from the Morro Agudo mine and 253 km from the Vazante mine and is accessible by road.
The Três Marias smelter was built to treat the zinc silicate concentrates from the Vazante mine (willemite and calamine) and sulfide concentrates from the Morro Agudo mine,and Aripuanã mines, from Nexa Peru and from third-party concentrates. Currently, this smelter is integrated with the operations of the Vazante, and Morro Agudo and Aripuanã mines, and it uses the RLE process to produce metallic zinc and zinc oxide. The annual production capacity of our Três Marias smelter is 190,000192.2 thousand tonnes of refined metal per year. Production in 20172023 totaled 185,829182.3 thousand tonnes of zinc.zinc metal and oxide available for sale.
The Três Marias smelter produces zinc primarily from zinc contained in concentrates and, to a lesser extent, recycled zinc secondary feeds. In 2017, this2023, the Três Marias smelter consumed approximately 196.0192.1 thousand tonnes of zinc contained in concentrates and one thousand tonnessecondary raw material, which consumed 87.3% of zinc contained in concentrates from our mines, 11.7% of zinc contained in concentrates from third parties and 1.0% from secondary raw material.
In 2017,2023, Três Marias sold approximately 161.0147.1 thousand tonnes of metallic zinc and 38.533.9 thousand tonnes of zinc oxide, of which 81.0%65.2% of the volume was sold to Latin America (including Mexico), 14.0%14.1% to international traders, 2.0%18.2% to Africa, 2.0%1.2% to Asia and 1.0%1.4% to Europe. The Três Marias smelter also produces jumbo, zinc alloyscopper/cobalt cement, Oxides (ashes) and cadmium briquettes. These products are sold to international traders and local customers.
| 79 |
Smelting Operations |
The Três Marias smelter contains a zinc oxide production plant intended for the chemical, pneumatic, ceramic, animal feed and fertilizer industries. In 2017,2023, the production of zinc oxide was approximately 39.034.0 thousand tonnes, corresponding to 31.0 thousand tonnes of zinc content.tonnes. In zinc content, approximately 74.0%73.3% of the raw material was electrolytic zinc that originated from the melting stage. In addition, we purchased 26.0%26.7% of raw material from third parties, in the form of dross and skims, for the production ofto produce zinc oxide as well as the generation of by-products.
In 2021, the request for environmental licensing for a new expansion of the Três Marias tailings dam was submitted to the environmental agency of the state of Minas Gerais. In 2023, we advanced with the waste dry disposal system on an industrial scale, which consists of filtering the waste pulp for subsequent disposal through the dry stacking process, as waste disposal in this unit was going directly to its tailings deposit. The initiative achieved excellent results, filtering an average of 74% of the operation’s material throughout the year. In December 2023, filtration reached more than 90% and from 2024 onwards, we expect filtration to reach between 95% and 100%. Due to the progress of the dry stacking disposal tests and difficulties in licensing new dams and dam expansion projects, we canceled the licensing request that was in progress in Três Marias for the Central and West 1 module of the Murici Deposit to begin the licensing process of the dry stacking disposal. We expect to begin the licensing process in the first half of 2024 and subsequently will submit the license for government approval. For more information, see “Mining Operations—Tailings Disposals—Regulatory framework.” See also “Risk factors—Operational risks—The failure of a tailings dam could negatively impact our business, reputation and results of operations, and the implementation of associated regulations and decommissioning processes may be expensive.”
The following table presents the historical concentrates processed and zinc recovery rate in Três Marias for the periods indicated.
|
| For the Year Ended December 31, |
| ||||
|
| 2017 |
| 2016 |
| 2015 |
|
Inputs (in tonnes)(1) |
|
|
|
|
|
|
|
Zinc Contained in Concentrate from Our Mines |
| 181,334 |
| 193,516 |
| 191,183 |
|
Zinc Contained in Concentrate from Third Parties |
| 14,442 |
| 5,790 |
| — |
|
Secondary Raw Material |
| 717 |
| 1,231 |
| 1,190 |
|
Total Inputs |
| 196,493 |
| 200,536 |
| 192,373 |
|
Zinc Recovery (%) |
| 94.7 |
| 94.8 |
| 94.4 |
|
(1) Impacted by higher secondary raw material consumption and concentrates with contaminants (mainly iron and arsenic).
For the Year Ended December 31, | |||
2023 | 2022 | 2021 | |
| Inputs (in tonnes) | |||
| Zinc Contained in Concentrate from Our Mines | 167,726 | 146,006 | 161,070 |
| Zinc Contained in Concentrate from Third Parties | 22,430 | 38,319 | 30,148 |
| Secondary Raw Material | 1,976 | 3,320 | 3,231 |
| Total Inputs | 192,132 | 187,645 | 194,449 |
| Zinc Recovery (%) | 90.1 | 91.6 | 94.7 |
Juiz de Fora
The Juiz de Fora smelter is located in the municipality of Juiz de Fora in the state of Minas Gerais, Brazil, and is accessible by road.
The Juiz de Fora smelter produces zinc from sulfide concentrates and secondary sources such as EAF dust, batteries, and brass oxide, and uses the RLE process to produce metallic zinc. The annual production capacity of our Juiz de Fora smelter is 89,00096.9 thousand tonnes of metallic zinc per year. In 2017,2023, Juiz de Fora produced 87,31982.1 thousand tonnes of metallic zinc.zinc metal available for sale. In recent years, Juiz de Fora used calcine processed by third parties in its production process.
The Juiz de Fora smelter produces zinc primarily from zinc contained in concentrates and, to a lesser extent, recycled zinc secondary feeds. In 2017, this2023, the Juiz de Fora smelter consumed 75.087.4 thousand tonnes of zinc contained in concentrates and 19.0 thousand tonnessecondary raw material, which consumed 41.7% of zinc contained in concentrates from our mines, 41.8% of zinc contained in concentrates from third parties and 16.5% from secondary raw material and secondary sources.
material.
In 2017,2023, the Juiz de Fora smelter sold approximately 81.882.5 thousand tonnes of metallic zinc, of which 87.0%86.1% of the volume was sold to Latin America (including Mexico) and 13.0%13.9% to international traders.traders outside of Latin America. This Juiz de Fora smelter also produces zinc alloy, zinc shot, sulfuric acid, sulfur dioxide, silver concentrate, copper sulfate and copper sulfate. zinc ash. These products are sold primarily to international traders and local customers.
In 2023, 2022 and 2021, although we had planned and unplanned maintenances, the Juiz de Fora Smelter operated at high-capacity utilization rates.
| 80 |
Smelting Operations |
The following table presents the historical concentrates processed and zinc recovery rate in Juiz de Fora for the periods indicated.
For the Year Ended December 31, | |||
2023 | 2022 | 2021 | |
| Inputs (in tonnes) | |||
| Zinc Contained in Concentrate from Our Mines | 36,460 | 27,874 | 27,873 |
| Zinc Contained in Concentrate from Third Parties | 36,515 | 43,419 | 40,704 |
| Secondary Raw Material | 14,419 | 17,554 | 16,356 |
| Total Inputs | 87,394 | 88,847 | 84,933 |
| Zinc Recovery (%) | 93.6 | 93.1 | 93.6 |
| 81 |
Other Operations |
|
| For the Year Ended December 31, |
| ||||
|
| 2017 |
| 2016 |
| 2015 |
|
Inputs (in tonnes) |
|
|
|
|
|
|
|
Zinc Contained in Concentrate from Our Mines |
| 43,257 |
| 57,731 |
| 60,519 |
|
Zinc Contained in Concentrate from Third Parties |
| 32,228 |
| 17,030 |
| 11,425 |
|
Secondary Raw Material |
| 19,096 |
| 16,773 |
| 15,239 |
|
Total Inputs |
| 94,581 |
| 91,534 |
| 87,183 |
|
Zinc Recovery (%) |
| 90.7 |
| 92.7 |
| 92.3 |
|
OTHER OPERATIONSOther operations
Transportation and shipping
Concentrates in our mines
Our Cerro Lindo operation transports 100.0% of its concentrates by road. The concentrates are trucked in a dedicated fleet through the Panamericana Sur road to the port of Callao, that is approximately 255 km north, or to the Cajamarquilla smelter. This transportation is covered by long-term contracts entered with two trucking companies, Transaltisa S.A. and Servicios Generales Saturno S.A.C.
companies.
Our Atacocha and El Porvenir operations use both road and rail transportation. The concentrates are trucked through the Carretera Central roadRoad to the port of Callao, that is approximately 315 km west, or to the Cajamarquilla smelter. We also use railway transportation to secure logistic availability and maintain high environmental standards. Our use of railway transportation is covered by a long-term contract entered with Ferrocarril Central Andino S.A., or FCCA, an exclusive concessionary of the Peruvian government for the central line rail system.
contract.
The zinc concentrate produced in the Cerro Lindo, Atacocha and El Porvenir mines supply both our Peruvian and Brazilian smelters, as well as third-party customers, while the lead and copper concentrates produced by these mines are transported to third-party customers from the port of Callao. Our smelters use zinc concentrate supplied from our mines and from third-party suppliers to meet the blending needs of each smelter.
The Peruvian zinc concentrate supplied to the Brazilian smelters is loaded in bulk 25,000 tonne shipments and sent to the Port of Rio de Janeiro, where it is cleared through customs and then loaded into railcars to the Juiz de Fora smelter or into trucks and railcars to the Três Marias smelter. The ocean freight for this Peruvian zinc is covered by a long-term freight contract with Daiichi Chuo Kisen Kaisha.
contract.
All the zinc concentrates produced at our Vazante and Morro Agudo mines are transported by road to the Três Marias smelter using two trucking companies. These mines also produce lead and lead/silver concentrates, which are loaded into containers at the mine and are transported using trucks and trains to the Sepetiba Tecon Port,Terminal in Itaguaí, Rio de Janeiro.Janeiro, Brazil. The lead and lead/silver concentrates are then shipped to customers in Asiaexported in accordance with our annual contracts with container shipping lines.
All the zinc concentrates produced at our Aripuanã mine are transported by road to the Três Marias and Juiz de Fora smelters. The mine also produces lead and copper concentrates, which are either loaded into containers at the mine or transported by road to the Rondonópolis warehouse to be loaded into containers and are then transported using trucks and trains to the Terminal in Santos, São Paulo, Brazil. A small portion of zinc, and all lead and copper concentrates are then shipped to foreign customers.
Smelters
The metallic zinc produced in the Cajamarquilla smelter is transported by train or truck to a terminal near the port of Callao.terminals. The material intended for the Peruvian domestic market is distributed by truck from this terminal,these terminals, while exports to foreign markets are loaded into containers and transported by truck from this terminalthese terminals to the port of Callao.
The metallic zinc produced in the Juiz de Fora and Três Marias smelters is transported by truck for either local customers or exports. In the case of exports, the material is transported to terminals near the ports of Rio de Janeiro or Sepetiba,Itaguaí, both in the state of Rio de Janeiro, or the port of Santos, in the state of São Paulo. The material is then loaded into containers at the terminal and transported to the ports by truck, where it is shipped to customers abroad.
The metallic zinc and zinc oxide production process in our smelters also produces byproducts.by-products. The most relevant byproductsby-products are sulfuric acid and silver concentrate. Sulfuric acid produced in the Cajamarquilla smelter is loaded into dedicated FCCA tank railcars and transported to Depositos Químicos Mineros S.A., or DQM, where it isbe stored. The sulfuric acid is then loaded in bulk into chemical ship-tanks destined to our customers and discharged at the Chilean ports of Mejillones Barquito and Michilla.Barquito. The silver concentrate produced in the Cajamarquilla and Juiz de Fora smelters is loaded into containers and are dispatched to the port of Callao in Peru or to the port of Sepetiba in Brazil.Itaguaí.
| 82 |
Other Operations |
We ship all our refined zinc and silver concentrate exports in containers. Transportation of this material is covered by annual agreements with the liner shipping providers, including Hamburg Süd, Mediterranean Shipping Company and Hapag Lloyd, which are responsible for 75.0%90.0% of these shipments.
Since 2009, we have participated in joint bidding arrangements with other companies that are part of the Votorantim Group (such as Fibria Celulose S.A., Citrosuco S.A. Agroindústria and CBA) to obtain competitive rates on container ocean freight rates. We aggregate our anticipated shipping volumes with those of the aforementioned companies and jointly negotiate the terms of the ocean freight rate with container shipping companies based on this aggregate volume, thereby benefiting from economies of scale. In 2016, we jointly negotiated ocean freight rates covering more than 30,000 containers for the aforementioned companies.
Sales and marketing
We sell most of our products through supply contracts with terms between one and fourthree years. Only a small portion of our products is sold on the spot market. The agreements with our customers include customary international commercial terms, such as CIF, FOB and FOB terms.other delivery terms based on Incoterms 2010/2020. Our ability to deliver significant volumes across several regions worldwide makes us a significant supplier to a client base of end-usersend users and global traders. As a result, we can obtain competitive commercial terms for our products in the long-term.long term. In 2017,2023, our top 10 metallic zinc and zinc oxide customers represented approximately 50.0%58.0% of the total sales volume for such products, with our top 10 zinc oxide customers representing 72.0%57.0% of the total sales volume for that product, and our top threefive concentrate customers represented approximately 2.0%87% of the total sales volume for such products, in each case excluding intercompany sales.
Concentrates
In 2017, the majority (approximately 98.0%)2023, 94.5% of our total production volume of zinc concentrates went to our smelting operations in Peru and Brazil. In 2017,2023, we sold 8,863 tonnes of zinc contained inZinc concentrates produced from our Peruvian and Brazilian operations to third-party customers. Sales prices are established mainly by reference to prices quoted on the LME less a discount based on either the treatment charge or smelter charge. The LME price quotes are based on prevailing LME average prices for the period set forth in our sale agreements, and generally refer to either the month following the shipment or the period near the execution date of the relevant agreement.
We also purchase zinc contained in concentrate from third-party suppliers to meet our raw material requirements. In 2017, 60.8%2023, 47.9% of the total zinc contained in concentrateraw material consumption in our smelters was produced by our mines and 39.2%52.1% was purchased from third parties.parties or obtained from secondary raw materials (excluding oxide).
Refined Metals
Refined metals
Our metallic zinc and zinc oxide are sold worldwide through our commercial offices located in:
· São Paulo, Brazil;
· Lima, Peru;
· Houston, United States; and
· Luxembourg.
| · | São Paulo, Brazil; |
| · | Lima, Peru; |
| · | Houston, United States; and |
| · | Luxembourg, Grand Duchy of Luxembourg. |
We hold a leadership position in our home market, Latin America (including(excluding Mexico), with aan estimated market share of 54.0%78.3% in 2017.2023, according to our sales volume, import databases and demand forecasts sourced from specialized consultancy groups and customs websites. In other regions, we hold a strategic position, with estimated market share of 15.0%26.2% in Africa, 5.0%4.0% in North America, 3.0%3.4% in Europe and 1.0%0.6% in Asia. In recent years, we have increasedAsia, according to our sales of metallic zincvolumes, import databases and zinc oxide to end-users in attractive markets, consolidating a commercial network in place to support volume growth.
demand forecasts sourced from specialized consultancy groups and customs websites.
In 2017, 75.6%2023, 71.5% of our total sales of refined metals were to customers in the continuous galvanizing, general galvanizing, die casting, transformers and alloy segments and 24.4%28.5% of our total sales were to international traders. Our products are sold to end-usersend users in the transport, construction, infrastructure, consumer goods and industrial
machinery industries. Of our volume of metallic zinc and zinc oxide sales in 2017, 56.0%2023, 48.9% were to Latin America (including Mexico), 12.0%11.3% to Europe, 10.0%8.1% to the United States, and Canada, 4.0%5.6% to Africa and 11.0%8.7% to Asia, with the remaining 8.0%17.4% to international traders. Sales prices are mainly established by reference to prices quoted on the LME plus a negotiable premium. Pricing is based on prevailing LME average prices for a period set forth in our sale agreements, which generally refer to the month or month prior to shipment.
| 83 |
Other Operations |
By-products
We sell a wide variety of chemical and metallurgic by-products generated during the production processes in our smelters and mines to a broad customer base. Our sales include more than 3027 different by-products, most of which are sold locally based on the characteristics of each market or region.
Power and energy supply
Peru
Peru
With respect toWe contracted for 97.4% (1,835.2 GWh) of energy for our operations in our Peruvian operating units we obtain 96.2% (1,765.15 GWh) of the electricity for our operations from the SEIN and 3.8% (69.80consumed 100% (1,835.2 GWh) of this energy. The other 2.6% (49.7 GWh) of the energy for our Peruvian operating units was obtained from our own hydroelectric power plants.plants, the Cajamarquilla cogeneration power plant and the micro solar generation in Cajamarquilla. We own three hydroelectric power plants, two at Atacocha and one at El Porvenir, with a total installed gross rated capacity of 10,5689,726 kilowatts, or KW. kW.
We also receivehave contracts with Electroperú S.A., a well-known Peruvian state-owned company, which cover 100% (277.5 GWh), 100% (121.7 GWh) and 49.2% (29.3 GWh) of the energy requirements for our energy from third parties through electricity supply contracts. Our Cerro Lindo, El Porvenir and Atacocha units, have electricityrespectively. In 2023, we consumed 100% of the energy acquired through these contracts.
In June 2021, a spot contract was signed with Kallpa Generación S.A. for the supply contracts with Statkraft Perú S.A., which cover 100.0% (272.54 GWh), 80.4% (97.62 GWh) and 40.5% (31.29of energy to the Cajamarquilla unit. In 2023, 2.9% (40.7 GWh) of their electricitythe energy requirements respectively. These contracts expiredfor our operations in December 2017,Cajamarquilla was contracted from Kallpa Generación and the entities agreed to enter into new agreements with Engie Energia Peru S.A., which are valid until December 2019. The Cajamarquilla unit entered into a long-term electricity supply contract with Engie Energía Perú S.A. (formerly Enersur S.A.) on March 2017 and has a supply contract with Enel Generación Perú S.A.A. (formerly Edegel S.A.A.). Both contracts expire in December 2019 and cover approximately two-thirds and one-third, respectively,100% of Cajamarquilla’s total electricity demand.
this energy was consumed.
The following table sets forth the energy sources and electricityenergy consumption with respect to our Peruvian operating units in 2017.2023.
Operating Unit |
| Energy Source |
| Total Energy |
| Percentage of Total |
| Energy Source | Total Energy | Percentage of Total Energy Usage in 2023 |
| Third Party | ||||||||||
Cerro Lindo |
| Third Party (Statkraft Perú S.A.) |
| 272.54 |
| 15.4 | % | Third Party (Electroperú S.A.) | 277.5 | 15.1% |
El Porvenir |
| Third Party (Statkraft Perú S.A.) |
| 97.62 |
| 5.5 | % | Third Party (Electroperú S.A.) | 121.7 | 6.6% |
Atacocha |
| Third Party (Statkraft Perú S.A.) |
| 31,29 |
| 1.8 | % | Third Party (Electroperú S.A.) | 29.3 | 1.6% |
Cajamarquilla |
| Third Party (Engie Energia Perú S.A.) |
| 812.545 |
| 46.0 | % | Third Party (Kallpa Generación S.A.) | 40.7 | 2.2% |
Cajamarquilla |
| Third Party (Enel Generación Perú S.A.) |
| 551.326 |
| 31.2 | % | Third Party (Electroperú S.A.) | 1,366.0 | 74.5% |
Total Energy Usage |
| Third Party |
| 1,765.15 |
| 96.2 | % | 1,835.2 | 100% | |
| Own Power Plant | ||||||||||
El Porvenir |
| Own Power Plant (Candelaria) |
| 23.83 |
| 34.2 | % | Own Power Plant (Candelaria) | 0.0 | 0.0% |
Atacocha |
| Own Power Plant (Chaprin and Marcopampa) |
| 45.97 |
| 65.9 | % | Own Power Plant (Chaprin and Marcopampa) |
30.3 | 61.0% |
| Cogeneration CJM | Two steam turbines with HRSG from tostación |
19.4 | 39.0% | |||||||
Total Energy Usage |
| Own Power Plant |
| 69.80 |
| 3.8 | % | 49.7 | 100% | |
Hydroelectric plants
Candelaria
The El Porvenir unit has one hydroelectric plant, the Candelaria Hydroelectric Power Plant, which is located along the Lloclla River. The plant contains three separate hydroelectric turbines, two of which have been operational since 1957 and the third since 1998, and which together have an installed rated capacity of 4.24.8 MW. During 2017, El Porvenir consumed 23.83 GWh, which represented approximately 20.0% of the energy usage of the unit.
Chaprin and Marcopampa
The Atacocha unit has two hydroelectric plants. The Chaprin Hydroelectric Power Plant is located along the Lagia Ravine near the Huallaga river.River. The plant has been operating since 19531957 and its installed rated capacity is 5.45.9 MW. The Marcopampa Hydroelectric Power Plant has been operating since 1937,1953, and was overhauled in 1984,
increasing its installed rated capacity of 1.01.2 MW. Since the beginning of 2020, Marcopampa has been shut off indefinitely. During 2017,2023, Atacocha consumed 45.9730.3 GWh from these plants, which represented approximately 59.0%50.8% of the energy usage of the mine.
| 84 |
Other Operations |
Brazil
With respect to our Brazilian operations, as of December 31, 2017, the power and2023, energy supply comes from various contracts, and our subsidiary Pollarix S.A (“Pollarix”).
The five hydroelectric plants in which our subsidiary Pollarix S.A., or Pollarix has directly or indirectly the following interests: a 21.0%22.4% equity participation in the consortium Enercan (Campos Novos hydroelectric power plant), a 100.0% ownership of the hydroelectric power plant Picada located in Minas Gerais, a 12.6% equity participation in the consortium Amador Aguiar I, a 12.6% equity participation in the consortium Amador Aguiar II and a 23.9% equity participation in the consortium Igarapava. These consortiumsplants have hydroelectric power plantsfacilities in the states of Minas Gerais, Santa Catarina and Santa Catarina. Igaparava provides electricity exclusively to Vazante and Três Marias, while the other four sources (Picada, Amador Aguiar I and II and Campos Novos)São Paulo. The hydroelectric power plants of Pollarix provide electricityenergy to the fourfive operating units (Vazante, Morro Agudo, Três Marias, and Juiz de Fora)Fora and Aripuanã). As of December 31, 2017, we expect these sources to provide 100.0% of the expected energy consumption of our Brazilian operations over the medium term.
The only activity of Pollarix is to own our energy assets sellingand sell energy to our Brazilian operating subsidiaries at market prices. We own all the common shares of Pollarix, which represents 33.33%33.3% of its total share capital. The remaining shares are preferred shares with limited voting rights, which are owned by our shareholder VSA and/or its affiliates.Auren Energia S.A (“Auren”). Under the terms of the preferred shares, VSAAuren is entitled to dividends per share equal to 1.251.93 times the dividends per share payable on the common shares. See “Operating and financial review and prospects—keyOverview—Key factors affecting our business and results of operations—Operating costs and expenses—Energy costs.”
In November 2023, Nexa finalized a contract rearrangement with Pollarix, in which the energy delivery from the hydroelectric plants (Picada, Igarapava and Amador Aguiar) was centralized through Pollarix. Pollarix is responsible for transferring the energy to Nexa, guaranteeing the right to self-production. In 2023, Pollarix provided 124.8 GWh of energy, which represented 7.3% of Nexa’s total energy purchased.
We have a contract with Auren, which provides energy from several energy generation sites to all Nexa operations in Brazil. In 2023, Auren provided a total of supply of 6.9 MWavg of energy, representing 3.5% of Nexa’s total energy purchased.
In January 2020, we began a 15-year energy supply agreement with Furnas, a Brazilian energy company, controlled by Eletrobras, to help address the increased energy demand in our operations. Nexa Brazil currently consumes nearly all the energy supplied by Pollarix and Auren in its existing operations. Furnas provides energy to the four operating units (Vazante, Morro Agudo, Três Marias and Juiz de Fora).
The following table sets forth our energy sources and consumption with respect to our Brazilian operations in 2017.2023.
Operating Unit | Energy Source | Total Energy Consumed in 2023 (GWh) | Percentage of Total Energy Usage in 2023 |
| Third Party and Own Power Plants | Pollarix S.A, Furnas S.A., Auren and Market | ||
| Morro Agudo | 78.9 | 4.8% | |
| Vazante | 297.6 | 18.2% | |
| Três Marias | 751.0 | 46.0% | |
| Juiz de Fora | 410.4 | 25.2% | |
| Aripuanã | 93.9 | 5.8% | |
| Total Energy Usage | 1,631.8 | 100% |
Operating Unit |
| Energy Source |
| Power Plant |
| Percentage of |
| Total Energy |
| Percentage of |
|
Morro Agudo, Vazante, Três Marias and Juiz de Fora |
| Enercan Consortium |
| Campos Novos |
| 21.0 | % | 672.9 |
| 45.4 | % |
|
| Picada |
| Picada |
| 100.0 | % | 184.8 |
| 12.5 | % |
|
| Amador Aguiar I |
| Amador Aguiar I |
| 12.6 | % | 133.6 |
| 9.0 | % |
|
| Amador Aguiar II |
| Amador Aguiar II |
| 12.6 | % | 114.7 |
| 7.7 | % |
|
| Votener |
| N/A |
| N/A |
| 151.4 |
| 10.2 | % |
Vazante and Três Marias |
| Igarapava |
| Igarapava |
| 23.9 | % | 224.1 |
| 15.1 | % |
Total Energy Usage |
| — |
| — |
| — |
| 1,481.4 |
| 100.0 | % |
| 85 |
Other Operations |
Hydroelectric plants
Campos Novos
Campos Novos is a hydroelectric plant located along the Canoas River.River, in the state of Santa Catarina. The plant has an installed capacity of 880 MW and has been authorized by ANEEL,the Brazilian Energy Regulatory Agency (Agência Nacional de Energia Elétrica or ANEEL), to produce 377.90382.2 MWavg. During 2017, the plant generated a total of 3,310.40 GWh. 21.0% of the total generation is allocated to our operating plants. During 2017,2023, our Morro Agudo, Vazante, Três Marias and Juiz de Fora units consumed 672.9acquired 676.5 GWh from Campos Novos, which represented approximately 45.4%39.7% of our total energy usage.purchased.
Picada
Picada is a hydroelectric plant located along the Peixe River.River in the state of Minas Gerais. The plant has an installed capacity of 50 MW and has been authorized by ANEEL to produce 2729.6 MWavg. During 2017,2023, our Morro Agudo, Vazante, Três Marias and Juiz de Fora units consumed 184.8acquired 211.5 GWh, which represented 12.5%12.4% of our total energy usage.
Igarapavapurchased.
Igarapava
Igarapava is a hydroelectric plant located along the Grande River.River in the state of Sao Paulo. The plant has an installed capacity of 210 MW and has been authorized by ANEEL to produce 130.51127.5 MWavg. During 2017,2023, our Morro Agudo, Vazante, Três Marias and Juiz de Fora units consumed 224.1acquired 218.4 GWh from Igarapava, which represented approximately 15.1%12.8% of our total energy usage.purchased.
Amador Aguiar I
Amador Aguiar is a hydroelectric plant located along the Araguari River.River in the state of Minas Gerais. The plant has an installed capacity of 240 MW and has been authorized by ANEEL to produce 155146.7 MWavg. During 2017,2023, our Morro Agudo, Vazante, Três Marias and Juiz de Fora units consumed 133.6acquired 132.8 GWh from Amador Aguiar I, which represented 9.0%7.8% of our total energy usage.purchased.
Amador Aguiar II
Amador Aguiar is a hydroelectric plant located along the Araguari River.River in the state of Minas Gerais. The plant has an installed capacity of 210 MW and has been authorized by ANEEL to produce 131125.2 MWavg. During 2017,2023, our Morro Agudo, Vazante, Três Marias and Juiz de Fora units consumed 114.7acquired 113.4 GWh from Amador Aguiar II, which represented 7.7%6.7% of our total energy usage.purchased.
| 86 |
Mineral Reserves and Resources |
MINERAL RESERVES AND RESOURCES
Disclosure of Mineral Reserves and Resources
Sustainability initiatives
Nexa Resources has an integrated management system based on the ISO 14,000 series of environmental management standards, with an emphasis on the control of specific risks for mining. This system includes sustainability guidelines for new projects, including meeting the corporate goals of eight material issues: waste, energy and emissions, water, local development, health and safety, people, human rights and decommissioning. To ensure that project managers are aligned with these guidelines, the process includes an assessment of the phase change of a project, aligned with project management methodology front-end loading.
Research and development
We seek to encourage innovation within the metals and mining sector. We do so with programs aimed at developing new solutions for, among other things, increasing ore levels, optimizing transportation and logistics processes, stimulating cost-efficiency and reducing wasteRegistrants engaged in mining sites.operations must comply with Regulation S-K Subpart 1300 ("S-K 1300" or the "SEC Mining Modernization Rules"), which came into force on January 1, 2021. S-K 1300 governs the mineral property disclosure requirements for mining registrants.
For the meanings of certain technical terms used in this prospectus, see “Additional Information—Glossary.”
Cybersecurity
We rely on our information technology systems and automated machinery to effectively manage our production processes and operate our business. Nexa Resources’ information technology systems are integrated into the information technology infrastructure shared by the companies of the Votorantim Group, which reduces cost and leverages synergies across businesses units.
Our information technology systems may be vulnerable to damage or interruption from cyberattacks and other security breaches. To reduce the exposure to cyberattacks, we have procedures in place to prevent and minimize the impact of a potential cyberattack, including a disaster recovery system, a backup site for our enterprise resource planning system, and 24/7 monitoring of our manufacturing enterprise and legacy systems. Overall, we have 160 applications that support our operations for purposes of protecting against cyberattacks. We have incorporated antivirus, anti-malware, intrusion prevention and detection, firewall and registry inspection measures into our information technology operations, as well as a regular vulnerability test that assesses the threat of cyberattacks. Finally, we have programs in place aimed towards improving our information security policy, access control procedures, business continuity management and data loss prevention measures. Our cybersecurity and data protection measures also consider the relevant regulatory regimes, including the European Union GDPR, which will come into effect in May 2018.
Health, safety and environmental compliance
Health and safety in the workplace are among our highest priorities, and our policies and procedures seek to eliminate accidents. We have sought to improve our safety record in conformity with standards in the mining industry. In 2017, our total recordable injury frequency rate was 2.46, compared to 2.25 in 2016 and 2.27 in 2015. This rate is defined as the number of injuries with and without lost time compared to millions of man hours worked. In 2017, our lost worktime incident rate was 1.16, compared to 0.73 in 2016 and 0.81 in 2015. This rate is defined as the number of injuries with lost time compared to millions of man hours worked. Our severity rate for 2017 was 1,384, compared to 510 in 2016 and 318 in 2015.To calculate the severity rate, we consider the sum of lost, transported and debited days, divide this figure by the total number of man hours worked and multiply the resulting number by 1,000,000.
Mining is an inherently dangerous activity that involves substantial risks. We have had seven fatalities at our operations in 2017. Following these occurrences, we conducted a comprehensive review, and our board of directors approved a plan intended to prevent fatalities and reduce the frequency and severity of injuries. Some of the initiatives of this plan include leadership development, training for our employees and third-party contractors and preventive procedures, such as digital mining and our automation plan. Below is a summary of the fatal accidents that occurred in our operations in 2017.
· On January 25, 2017, an employee of Ingenieros Civiles Mineros y Metalurgistas S.A., one of our contractors, suffered a fatal accident due to falling rocks while undertaking work underground in El Porvenir.
· On March 8, 2017, an employee of Unión de Concreteras S.A., one of our contractors, suffered a fatal accident after being struck by a piece of heavy machinery in Atacocha’s underground mine site.
· On March 18, 2017, an employee of EIMEM S.A.C., one of our contractors, suffered a fatal accident inside the automatic sampler located at a conveyor belt in El Porvenir while performing plant maintenance activities.
· On March 22, 2017, an employee of Industrial Soluciones S.A.C., one of our contractors, suffered a fatal accident due to an electric discharge while performing electrical maintenance activities in Cajamarquilla.
· On May 10, 2017, an employee of Unión de Concreteras S.A. suffered a fatal accident after falling into a ventilation shaft in Cerro Lindo.
· On October 15, 2017, an employee of Martinez Contratistas e Ingeniería S.A., one of our contractors, suffered a fatal accident due to an incident involving a heavy truck while performing mechanical maintenance in Atacocha.
· On December 5, 2017, an employee of SF Services Industrial, one of our contractors, suffered a fatal accident due to an incident involving hydroblasting in Juiz de Fora.
Pursuant to applicable Peruvian law, the occurrence of more than two fatalities at the same mining unit within the last 12 months entitles the relevant government authorities to order a special inspection. After such inspection, if fatal accidents continue to occur in the same mining unit, authorities may order the total or partial preventive suspension of activities to conduct an emergency review of the occupational health and safety management in that mining unit.
To improve the management of our preventive care and healthcare programs, all of the Brazilian units implemented the Systems Applications and Products system module for hygiene and occupational health. In the case of Peru, the implementation of this system is planned for 2018. In 2016, a steering committee for occupational health and hygiene was created at the Três Marias unit. It was designed to be a pilot project and was subsequently replicated at our other units during 2017.
Disclosure of mineral reserves
This report contains disclosure that has been prepared in accordance with the requirements of Industry Guide 7 promulgated by the SEC, or Industry Guide 7.
As a reporting issuer in Canada, we are also subject to Canadian National Instrument 43-101—43-101—Standards of Disclosure for Mineral Projects, or (“NI 43-101,43-101”), which is an instrument administered by the provincial and territorial securities regulatory authorities that governs how issuers in Canada disclose scientific and technical information about their mineral projects to the public. NI 43-101 imposes certain requirements in respect of such disclosure, including the requirement to have prescribed information prepared by, or under the supervision of, a qualified personQualified Person and the filing of NI 43-101 technical reports in the prescribed circumstances. WeAny reference those reports in thisto a NI 43-101 report is for informational purposes only, and such reports are not incorporated herein by reference.
NI 43-101 requirements differ significantly from the requirements under Industry Guide 7. Among other things, Industry Guide 7 does not contemplate the term “resource,” and the requirements under Industry Guide 7 for identification of “reserves” are not the same as the requirements under NI 43-101. Under Industry Guide 7, mineralization may not be classified as a “reserve” unless the determination has been made that the mineralization could be economically and legally produced or extracted at the time the reserve determination is made. Under Industry Guide 7, a “final” or “bankable” feasibility study is required to report reserves; the three-year historical average price, to the extent possible, is used in any reserve or cash flow analysis to designate reserves; and the primary environmental analysis or report must be filed with the appropriate governmental authority. One consequence of these differences is that “reserves” calculated in accordance with Canadian requirements may not qualify as “reserves” under Industry Guide 7 standards.
Descriptions in this report of our mineral deposits prepared in accordance with Industry Guide 7,S-K 1300, as well as similar information provided by other issuers in accordance with Industry Guide 7,S-K 1300, may not be comparable to similar information prepared in accordance with NI 43-101 that is presented elsewhere outside of this report.
Disclosures of mineral reservesThe Qualified Persons that have reviewed and approved the scientific and technical information contained in this annual report have not been adjustedare identified in the footnotes to reflect our ownership interest of the entities that ultimately own the assets. The information includes each mine, smelter and project of our consolidated subsidiaries, presented as a whole; however, we do not own undivided equity interests in certain of these mines and projects.
For a tabletables summarizing the mineral reservesMineral Reserves and Resources estimates prepared in accordance with Industry Guide 7 for our mines,below, see “—“Information on the Company—Mining operations” below. For the meanings of certain technical terms used in this report, see “Glossary.“Additional information—Glossary.”
Presentation of information concerning reserves
Mineral Reserves
The estimates of proven and probable ore reserves at our mines and projects and the estimates of life of mine life included in this annual report have been prepared by our staff of experienced geologists and engineers, unless otherwise stated,the Qualified Persons referred to herein, and in accordance with the technical definitions established by the SEC.SEC Under the SEC’s Industry Guide 7:S-K 1300:
· Reserves are the part of a mineral deposit that could be economically and legally extracted or produced at the time of the reserve determination.
· Proven reserves are reserves for which (a) quantity is computed from dimensions revealed in outcrops, trenches, workings or drill holes; grade and/or quality are computed from the results of detailed sampling; and (b) the sites for inspection, sampling and measurement are spaced so closely and the geologic character is so well defined that size, shape, depth and mineral content of reserves are well-established.
· Probable reserves are reserves for which quantity and grade and/or quality are computed from information similar to that used for proven reserves, but the sites for inspection, sampling and
measurement are farther apart or are otherwise less adequately spaced. The degree of assurance, although lower than that for proven reserves, is high enough to assume continuity between points of observation.
| · | Proven Mineral Reserves are the economically mineable part of a Measured mineral resource and can only result from conversion of a measured mineral resource. |
| · | Probable Mineral Reserves are the economically mineable part of an indicated and, in some cases, a measured mineral resource. |
| · | Indicated Mineral Resource is that part of a Mineral Resource for which quantity and grade or quality are estimated based on adequate geological evidence and sampling. The level of geological certainty associated with an Indicated Mineral Resource is sufficient to allow a Qualified Person to apply modifying factors in sufficient detail to support mine planning and evaluation of the economic viability of the deposit. Because an Indicated Mineral Resource has a lower level of confidence than the level of confidence of a measured mineral resource, an indicated mineral resource may only be converted to a probable mineral reserve. |
| · | Inferred Mineral Resource is that part of a Mineral Resource for which quantity and grade or quality are estimated based on limited geological evidence and sampling. The level of geological uncertainty associated with an Inferred Mineral Resource is too high to apply relevant technical and economic factors likely to influence the prospects of economic extraction in a manner useful for evaluation of economic viability. Because an Inferred Mineral Resource has the lowest level of geological confidence of all mineral resources, which prevents the application of the modifying factors in a manner useful for evaluation of economic viability, an Inferred Mineral Resource may not be considered when assessing the economic viability of a mining project and may not be converted to a mineral reserve. |
| 87 |
Other Operations |
| · | Measured Mineral Resource is that part of a mineral resource for which quantity and grade or quality are estimated based on conclusive geological evidence and sampling. The level of geological certainty associated with a Measured Mineral Resource is sufficient to allow a Qualified Person to apply modifying factors, as defined in S-K 1300, in sufficient detail to support detailed mine planning and final evaluation of the economic viability of the deposit. Because a Measured Mineral Resource has a higher level of confidence than the level of confidence of either an Indicated Mineral Resource or an Inferred Mineral Resource, a Measured Mineral Resource may be converted to a Proven Mineral Reserve or to a Probable Mineral Reserve. |
We periodically reviseupdate our reservereserves and resources estimates when we have new geological data, economic assumptions or mining plans. During 2017,2023, we performed an analysis of our reservereserves and resources estimates for certain operations, which is reflected in new estimates as of December 31, 2017. Reserve2023. Reserves and resources estimates for each operation assume that we either have or expect to obtain all of the necessary rights and permits to mine, extract and process mineral reserves or resources at each mine. Where we own less than 100% of the operation, reservereserves and resources estimates have not been adjusted to reflect our ownership interest. Certain figures in the tables, discussions and notes have been rounded. For a description of risks relating to reservesour estimates of Mineral Reserves and reserve estimates,Resources, see “Risk factors—Risks related to our mining reserves.Mineral Reserves and Resources.”
Our reserve estimates are based on certain assumptions about future prices. We have determined that our reported reserves could be economically produced if prices for the products identified in the following table were equal to the three-year average historical prices through December 14, 2017. For this purpose, we used the three-year historical average prices set forth in the following table.
|
| |
| 88 |
| ||
|
| |
|
| |
|
| |
|
|
(1)Mineral Reserves prices were updated on different prices, each calculated on the basis of the average price of the previous three years. For more information, see the footnotes to the table of reserves estimates below.
Mining operations
The following table shows our estimates of mineral reservesAttributable Mineral Reserves for our material mining properties as of December 31, 2023, prepared in accordance with Industry Guide 7Subpart 1300 of Regulation S-K. The Morro Agudo mine does not have known Mineral Reserves under Subpart 1300 of Regulation S-K.
| Grade | Contained Metal | ||||||||||||
| Ownership Interest (%) | Class | Tonnage (1) | Zinc | Copper | Silver | Lead | Gold | Zinc | Copper | Silver | Lead | Gold | |
| (Mt) | (%) | (%) | (g/t) | (%) | (g/t) | (kt) | (kt) | (koz) | (kt) | (koz) | |||
| Cerro Lindo (3) | 83.48 | Proven | 21.83 | 1.68 | 0.61 | 21.2 | 0.20 | - | 367.1 | 132.6 | 14,863 | 44.1 | - |
| Probable | 12.52 | 1.15 | 0.45 | 25.2 | 0.24 | - | 144.3 | 56.8 | 10,154 | 29.9 | - | ||
| Subtotal | 34.36 | 1.49 | 0.55 | 22.6 | 0.22 | - | 511.4 | 189.4 | 25,017 | 74.1 | - | ||
| Vazante (4) | 100 | Proven | 5.49 | 9.84 | - | 17.1 | 0.23 | - | 539.8 | - | 3,023 | 12.5 | - |
| Probable | 5.85 | 9.40 | - | 10.7 | 0.19 | - | 549.7 | - | 2,003 | 11.3 | - | ||
| Subtotal | 11.33 | 9.62 | - | 13.8 | 0.21 | - | 1,089.5 | - | 5,206 | 23.8 | - | ||
| Vazante Aroeira Tailings (5) | 100 | Proven | - | - | - | - | - | - | - | - | - | - | - |
| Probable | 2.11 | 4.12 | - | 7.6 | 0.25 | - | 87.0 | - | 518 | 5.2 | - | ||
| Subtotal | 2.11 | 4.12 | - | 7.6 | 0.25 | - | 87.0 | - | 518 | 5.2 | - | ||
| El Porvenir (6) | 83.48 | Proven | 3.27 | 4.09 | 0.24 | 75.2 | 1.29 | - | 133.8 | 7.9 | 7,908 | 42.0 | - |
| Probable | 8.96 | 4.11 | 0.22 | 72.1 | 1.17 | - | 368.7 | 20.0 | 20,760 | 104.6 | - | ||
| Subtotal | 12.23 | 4.11 | 0.23 | 72.9 | 1.20 | - | 502.5 | 28.0 | 28,667 | 146.6 | - | ||
| Atacocha (Underground) (7) | 75.96 | Proven | 1.30 | 3.86 | 0.34 | 84.9 | 1.45 | - | 50.0 | 4.4 | 3,535 | 18.7 | - |
| Probable | 3.01 | 4.54 | 0.43 | 77.7 | 1.29 | - | 136.6 | 12.8 | 7,509 | 38.8 | - | ||
| Subtotal | 4.30 | 4.33 | 0.40 | 79.8 | 1.34 | - | 186.5 | 17.2 | 11,044 | 57.5 | - | ||
Atacocha (Open pit) (8) | 75.96 | Proven | 1.45 | 1.02 | - | 38.2 | 1.16 | 0.25 | 14.8 | - | 1,178 | 16.9 | 11.5 |
| Probable | 1.88 | 0.97 | - | 32.4 | 1.14 | 0.29 | 18.2 | - | 1,958 | 21.4 | 17.4 | ||
| Subtotal | 3.33 | 0.99 | - | 34.9 | 1.15 | 0.27 | 33.1 | - | 3,737 | 38.2 | 28.9 | ||
| Aripuanã (9) | 100 | Proven | 6.43 | 3.83 | 0.21 | 33.8 | 1.40 | 0.28 | 246.2 | 13.8 | 6,993 | 90.0 | 57.1 |
| Probable | 24.64 | 4.48 | 0.13 | 42.4 | 1.73 | 0.21 | 1,105.0 | 31.8 | 33,610 | 427.3 | 167.3 | ||
| Subtotal | 31.07 | 4.35 | 0.15 | 40.6 | 1.66 | 0.22 | 1,351.3 | 45.6 | 40,602 | 517.2 | 224.4 | ||
| Total | Proven | 39.77 | 3.40 | 0.40 | 29.8 | 0.56 | 0.06 | 1,351.7 | 159.1 | 38,100 | 224.2 | 68.7 | |
| Probable | 58.96 | 4.09 | 0.21 | 40.4 | 1.08 | 0.10 | 2,409.7 | 122.1 | 76,511 | 638.5 | 184.7 | ||
| Total | 98.73 | 3.81 | 0.28 | 36.1 | 0.87 | 0.08 | 3,761.3 | 281.3 | 114,611 | 862.7 | 253.3 | ||
| Notes: |
* Numbers may not add due to rounding.
* The point of reference for Mineral Reserves in this table is mill feed materials.
* The El Porvenir, Atacocha Underground and other information aboutAtacocha Open Pit mines are part of the Cerro Pasco Complex.
| 89 |
Other Operations |
The following table shows our minesestimates of Mineral Reserves (100% ownership basis) for our material mining properties as of December 31, 2017.2023 prepared in accordance with Subpart 1300 of Regulation S-K. The Atacocha mine and the Morro Agudo mine dodoes not have known reservesMineral Reserves under Industry Guide 7.Subpart 1300 of Regulation S-K.
| Grade | Contained Metal | |||||||||||||
| Ownership Interest | Class | Tonnage (2) | Zinc | Copper | Silver | Lead | Gold | Zinc | Copper | Silver | Lead | Gold | ||
| (%) | (Mt) | (%) | (%) | (g/t) | (%) | (g/t) | (kt) | (kt) | (koz) | (kt) | (koz) | |||
| Cerro Lindo (3) | 83.48 | Proven | 26.15 | 1.68 | 0.61 | 21.2 | 0.20 | - | 439.7 | 158.8 | 17,803 | 52.8 | - | |
| Probable | 15.00 | 1.15 | 0.45 | 25.2 | 0.24 | - | 172.9 | 68.1 | 12,163 | 35.9 | - | |||
| Subtotal | 41.15 | 1.49 | 0.55 | 22.6 | 0.22 | - | 612.6 | 226.9 | 29,966 | 88.7 | - | |||
| Vazante (4) | 100 | Proven | 5.49 | 9.84 | - | 17.1 | 0.23 | - | 539.8 | - | 3,023 | 12.5 | - | |
| Probable | 5.85 | 9.40 | - | 10.7 | 0.19 | - | 549.7 | - | 2,003 | 11.3 | - | |||
| Subtotal | 11.33 | 9.62 | - | 13.8 | 0.21 | - | 1,089.5 | - | 5,206 | 23.8 | - | |||
| Vazante Aroeira Tailings (5) | 100 | Proven | - | - | - | - | - | - | - | - | - | - | - | |
| Probable | 2.11 | 4.12 | - | 7.6 | 0.25 | - | 87.0 | - | 518 | 5.2 | - | |||
| Subtotal | 2.11 | 4.12 | - | 7.6 | 0.25 | - | 87.0 | - | 518 | 5.2 | - | |||
| El Porvenir (6) | 83.48 | Proven | 3.92 | 4.09 | 0.24 | 75.2 | 1.29 | - | 160.3 | 9.5 | 9,472 | 50.3 | - | |
| Probable | 10.73 | 4.11 | 0.22 | 72.1 | 1.17 | - | 441.6 | 24.0 | 24,867 | 125.3 | - | |||
| Subtotal | 14.65 | 4.11 | 0.23 | 72.9 | 1.20 | - | 601.9 | 33.5 | 34.338 | 175.7 | - | |||
| Atacocha (Underground) (7) | 75.96 | Proven | 1.71 | 3.86 | 0.34 | 84.9 | 1.45 | - | 65.8 | 5.7 | 4,654 | 24.6 | - | |
| Probable | 3.96 | 4.54 | 0.43 | 77.7 | 1.29 | - | 179.8 | 16.9 | 9,886 | 51.1 | - | |||
| Subtotal | 5.66 | 4.33 | 0.40 | 79.8 | 1.34 | - | 245.6 | 22.6 | 14,540 | 75.7 | - | |||
Atacocha (Open pit) (8) | 75.96 | Proven | 1.91 | 1.02 | - | 38.2 | 1.16 | 0.25 | 19.5 | - | 2,342 | 22.2 | 15.2 | |
| Probable | 2.47 | 0.97 | - | 32.4 | 1.14 | 0.29 | 24.0 | - | 2,577 | 28.1 | 22.9 | |||
| Subtotal | 4.38 | 0.99 | - | 34.9 | 1.15 | 0.27 | 43.5 | - | 4,919 | 50.3 | 38.1 | |||
| Aripuanã (9) | 100 | Proven | 6.43 | 3.83 | 0.21 | 33.8 | 1.40 | 0.28 | 246.2 | 13.8 | 6,993 | 90.0 | 57.1 | |
| Probable | 24.64 | 4.48 | 0.13 | 42.4 | 1.73 | 0.21 | 1,105.0 | 31.8 | 33,610 | 427.3 | 167.3 | |||
| Subtotal | 31.07 | 4.35 | 0.15 | 40.6 | 1.66 | 0.22 | 1,351.3 | 45.6 | 40,602 | 517.2 | 224.4 | |||
| Total | Proven | 45.60 | 3.23 | 0.41 | 30.2 | 0.55 | 0.05 | 1,471.2 | 188.5 | 44,286 | 252.5 | 72.3 | ||
| Probable | 64.76 | 3.95 | 0.22 | 41.1 | 1.06 | 0.09 | 2,560.2 | 141.6 | 85,623 | 684.2 | 190.2 | |||
| Total | 110.36 | 3.65 | 0.30 | 36.6 | 0.85 | 0.07 | 4,031.4 | 330.1 | 129,910 | 936.7 | 262.5 | |||
| Notes: |
* Numbers may not add due to rounding.
| 90 |
Other Operations |
* The point of reference for Mineral Reserves in this table is mill feed materials.
* The El Porvenir, Atacocha Underground and Atacocha Open Pit mines are part of the Cerro Pasco Complex.
| (1) | The total tonnage and content amounts presented in this table represent Nexa’s attributable ownership basis. |
|
|
| Grade |
| Contained Metal Content |
| |||||||||||||||||||||
|
| Ownership |
| Class |
| Total |
| Zinc |
| Copper |
| Silver |
| Lead |
| Gold |
| Zinc |
| Copper |
| Silver |
| Lead |
| Gold |
|
|
| (%) |
|
|
| (millions |
| (%) |
| (%) |
| (g/tonne) |
| (%) |
| (g/tonne) |
| (thousands |
| (thousands |
| (kg) |
| (thousands |
| (kg) |
|
Cerro Lindo Mine(2) |
| 80.16 | % | Proven |
| 34.10 |
| 1.83 |
| 0.64 |
| 20.6 |
| 0.21 |
| — |
| 624.1 |
| 219.1 |
| 702,506 |
| 71.6 |
| — |
|
|
|
|
| Probable |
| 20.53 |
| 1.83 |
| 0.71 |
| 22.0 |
| 0.20 |
| — |
| 375.9 |
| 145.7 |
| 451,666 |
| 41.9 |
| — |
|
|
|
|
| Subtotal |
| 54.63 |
| 1.83 |
| 0.67 |
| 21.1 |
| 0.21 |
| — |
| 1,000.0 |
| 364.9 |
| 1,152,745 |
| 113.6 |
| — |
|
El Porvenir Mine(3) |
| 80.16 | % | Proven |
| 8.67 |
| 3.11 |
| 0.17 |
| 57.1 |
| 1.02 |
| — |
| 269.9 |
| 14.7 |
| 495,337 |
| 88.3 |
| — |
|
|
|
|
| Probable |
| 11.39 |
| 3.43 |
| 0.20 |
| 53.8 |
| 0.99 |
| — |
| 390.4 |
| 22.8 |
| 613,467 |
| 113.2 |
| — |
|
|
|
|
| Subtotal |
| 20.06 |
| 3.29 |
| 0.19 |
| 55.3 |
| 1.00 |
| — |
| 660.2 |
| 37.4 |
| 1,108,804 |
| 201.5 |
| — |
|
Vazante Mine(4) |
| 100 | % | Proven |
| 10.32 |
| 10.53 |
| — |
| 19.0 |
| 0.30 |
| — |
| 1,087.0 |
| — |
| 196,094 |
| 31.3 |
| — |
|
|
|
|
| Probable |
| 7.79 |
| 9.93 |
| — |
| 14.0 |
| 0.25 |
| — |
| 773.5 |
| — |
| 109,104 |
| 19.6 |
| — |
|
|
|
|
| Subtotal |
| 18.11 |
| 10.27 |
| — |
| 16.8 |
| 0.28 |
| — |
| 1,860.5 |
| — |
| 304,313 |
| 50.8 |
| — |
|
Total |
|
|
| Proven |
| 53.09 |
| 3.73 |
| 0.44 |
| 26.3 |
| 0.36 |
| — |
| 1,980.9 |
| 233.8 |
| 1,393,936 |
| 191.1 |
| — |
|
|
|
|
| Probable |
| 39.72 |
| 3.88 |
| 0.42 |
| 29.6 |
| 0.44 |
| — |
| 1,539.8 |
| 168.5 |
| 1,174,236 |
| 174.8 |
| — |
|
|
|
|
| Total |
| 92.81 |
| 3.79 |
| 0.43 |
| 27.7 |
| 0.39 |
| — |
| 3,520.8 |
| 402.3 |
| 2,568,173 |
| 365.9 |
| — |
|
| (2) | The total amounts and content presented in this table have not been adjusted to reflect our ownership interest. The information presented in this table includes 100% of the Mineral Reserve estimates for the property. Please refer to our ownership percentage for the amounts attributable to our ownership interest in the property. |
| (3) | The Qualified Person for the Mineral Reserves estimate is Cristovao Teofilo dos Santos, B.Eng., FAusIMM, a Nexa employee. Subpart 1300 of Regulation S-K definitions were followed for Mineral Reserves, which also are consistent with the CIM (2014) definitions. Mineral Reserves are estimated at an NSR break-even cut-off value of US$40.86/t processed. Some incremental material with values between US$32.99/t and US$40.86/t was included. Mineral Reserves estimates are based on average long-term metal prices of: zinc: US$2,799.04/t (US$1.27/lb); copper: US$7,669.61/t (US$3.48/lb); lead: US$2,000.29/t (US$0.91/lb); and silver: US$21.17/oz. Metallurgical recoveries are accounted for in NSR calculations based on historical processing data and are variable as a function of head grade. Recoveries at Life of Mine average head grades are 88.36% for Zn, 85.23% for Cu, 66.53% for Pb, and 68.78% for Ag. A minimum mining width of 5.0 m was used. Dilution and extraction factors are applied based on stope type and location. Bulk density varies depending on mineralization domain. |
| (4) | The Qualified Person for the Mineral Reserves estimate is Vitor Marcos Teixeira de Aguilar, B.Eng., FAusIMM, a Nexa employee. Subpart 1300 of Regulation S-K definitions were followed for Mineral Reserves, which also are consistent with the CIM (2014) definitions. Mineral Reserves are estimated at a NSR cut-off value of US$66.31/t processed. Mineral Reserves estimates are based on average long-term metal prices of: zinc: US$2,799.04/t (US$1.27/lb); copper: US$7,669.61/t (US$3.48/lb); lead: US$2,000.29/t (US$0.91/lb); and silver: US$21.17/oz. Metallurgical recoveries are accounted for in NSR calculations based on historical processing data and are variable as a function of head grade. Recoveries at Life of Mine average head grades are 87.19% for Zn, 23.93% for Pb, and 42.00% for Ag. A minimum mining width of 4.0 m was applied. |
| (5) | The Qualified Person for the Mineral Reserves estimate is Vitor Marcos Teixeira de Aguilar, B.Eng., FAusIMM, a Nexa employee. Subpart 1300 of Regulation S-K definitions were followed for Mineral Reserves, which also are consistent with the CIM (2014) definitions. Mineral Reserves are estimated at a NSR cut-off value of US$25.44/t processed. Mineral Reserves estimates are based on average long-term metal prices of: zinc: US$2,799.04/t (US$1.27/lb); copper: US$7,669.61/t (US$3.48/lb); lead: US$2,000.29/t (US$0.91/lb); and silver: US$21.17/oz. Metallurgical recoveries are accounted for in NSR calculations based on historical processing data and are variable as a function of head grade. Recoveries at Vazante Aroeira Tailings average head grades are 67.86% for Zn, 40.74% for Pb, and 42.00% for Ag. A minimum mining unit of 10 m x 10m x 2 was applied. |
| (6) | The Qualified Person for the Mineral Reserves estimate is SLR Consulting (Canada) Ltd., an independent mining consulting firm. Subpart 1300 of Regulation S-K definitions were followed for Mineral Reserves, which also are consistent with the CIM (2014) definitions. Mineral Reserves are estimated at NSR cut-off grade values ranging from US$63.77/t to US$67.04/t for SLS areas and US$65.77/t to US$69.04/t for C&F areas depending on the zone. Mineral Reserves estimates are based on average long-term metal prices of: zinc: US$2,799.04/t (US$1.27/lb); copper: US$7,669.61/t (US$3.48/lb); lead: US$2,000.29/t (US$0.91/lb); and silver: US$21.17/oz. Metallurgical recoveries are accounted for in NSR calculations based on historical processing data and are variable as a function of head grade. Recoveries at Life of Mine average head grade are 89.21% for Zn, 14.60% for Cu, 80.01% for Pb, and 77.51% for Ag. Minimum mining width of 5.0 m for C&F mining and 4.0 m for SLS mining were used for reserves shapes and development design and are reported inclusive of extraction losses and dilution. |
| (7) | The Qualified Person for the Mineral Reserves estimate is SLR Consulting (Canada) Ltd., an independent mining consulting firm. Subpart 1300 of Regulation S-K definitions were followed for Mineral Reserves, which also are consistent with the CIM (2014) definitions. Mineral Reserves are estimated at NSR cut-off grade values ranging from US$69.00/t for SLS areas and US$71.07/t for C&F areas depending on the zone. A number of incremental material (with values between US$45.09/t and US$69.00/t for SLS and values between US$47.16/t and US$71.07/t for C&F mining) were included in the estimate. Mineral Reserves estimates are based on average long-term metal prices of: zinc: US$2,799.04/t (US$1.27/lb); copper: US$7,669.61/t (US$3.48/lb); lead: US$2,000.29/t (US$0.91/lb); and silver: US$21.17/oz. Metallurgical recoveries are accounted for in NSR calculations based on historical processing data and are variable as a function of head grade. Recoveries at Life of Mine average head grades are 89.30% for Zn, 15.73% for Cu, 80.02% for Pb, and 77.51% for Ag. Minimum mining width of 5.0 m for C&F mining and 4.0 m for SLS mining were used for reserves shapes and development design and are reported inclusive of extraction losses and dilution. |
| (8) | The Qualified Person for the Mineral Reserves estimate is SLR Consulting (Canada) Ltd., an independent mining consulting firm. Subpart 1300 of Regulation S-K definitions were followed for Mineral Reserves, which also are consistent with the CIM (2014) definitions. Mineral Reserves are estimated at a NSR cut-off values of US$16.21/t. Mineral Reserves estimates are based on average long-term metal prices of: zinc: US$2,799.04/t (US$1.27/lb); lead: US$2,000.29/t (US$0.91/lb); silver: US$21.17/oz; and gold: US$1,630.93/oz. Metallurgical recoveries are accounted for in NSR calculations based on historical processing data and are variable as a function of head grade. Recoveries at Life of Mine average heads grade are 70.44% for Zn, 83.97% for Pb, 75.76% for Ag and 65.46% for Au. |
| 91 |
Other Operations |
| (9) | The Qualified Person for the Mineral Reserves estimate is Vitor Ferraz Viana, B.Eng., FAusIMM, a Nexa employee. Subpart 1300 of Regulation S-K definitions were followed for Mineral Reserves, which also are consistent with the CIM (2014) definitions. Mineral Reserves are estimated at a NSR break-even cut-off value of US$63.40/t processed was estimated from forecasted operating costs and some incremental material between US$49.20/t and US$63.40/t was included. A minimum mining width of 4.0 m was used. The long-term prices derived are in line with the consensus forecasts from banks and independent institutions. Mineral Reserves estimates are based on average long-term metal prices of: zinc: US$2,799.04/t (US$1.27/lb); lead: US$2,000.29/t (US$0.91/lb); silver: US$21.17/oz; and gold: US$1,630.93/oz. Metallurgical recoveries are accounted for in NSR calculations based on metallurgical testworks and are variable as a function of head grade and oretype. Recoveries at Life of Mine average head grades for a Mix of 80% Stratabound and 20% Stringer material are 90.06% for Zn, 60.00% for Cu, 84.92% for Pb, 68.00% for Ag, and 67.80% for Au. A minimum mining width of 4.0 m was applied. |
| 92 |
Other Operations |
Notes: TotalsMineral Resources
The following table shows our estimates of Attributable Mineral Resources for our material mining properties as of December 31, 2023 prepared in accordance with Subpart 1300 of Regulation S-K.
| Grade | Contained Metal | ||||||||||||
| Ownership Interest (%) | Class | Tonnage (1) | Zinc | Copper | Silver | Lead | Gold | Zinc | Copper | Silver | Lead | Gold | |
| (Mt) | (%) | (%) | (g/t) | (%) | (g/t) | (kt) | (kt) | (koz) | (kt) | (koz) | |||
| Cerro Lindo (3) | 83.48 | Measured | 3.67 | 1.93 | 0.65 | 23.1 | 0.24 | - | 70.9 | 23.9 | 2,728 | 8.8 | - |
| Indicated | 2.75 | 1.06 | 0.47 | 24.4 | 0.22 | - | 29.2 | 12.9 | 2,161 | 6.1 | - | ||
| Subtotal | 6.43 | 1.56 | 0.57 | 23.7 | 0.23 | - | 100.1 | 36.8 | 4,889 | 14.9 | - | ||
| Inferred | 7.75 | 1.54 | 0.25 | 32.6 | 0.42 | - | 119.3 | 19.4 | 8,119 | 32.6 | - | ||
| Vazante (4) | 100 | Measured | 0.48 | 8.40 | - | 12.4 | 0.25 | - | 40.3 | - | 191 | 1.2 | - |
| Indicated | 1.40 | 9.64 | - | 4.0 | 0.08 | - | 135.0 | - | 182 | 1.1 | - | ||
| Subtotal | 1.88 | 9.32 | - | 6.2 | 0.12 | - | 175.3 | - | 373 | 2.3 | - | ||
| Inferred | 12.77 | 10.27 | - | 12.9 | 0.21 | - | 1,311.0 | - | 5,289 | 27.4 | - | ||
| Vazante Aroeira Tailings (4) | 100 | Measured | - | - | - | - | - | - | - | - | - | - | - |
| Indicated | - | - | - | - | - | - | - | - | - | - | - | ||
| Subtotal | - | - | - | - | - | - | - | - | - | - | - | ||
| Inferred | 0.66 | 4.21 | - | 7.9 | 0.25 | - | 27.8 | - | 167 | 1.7 | - | ||
| El Porvenir (5) | 83.48 | Measured | 0.55 | 3.47 | 0.27 | 57.7 | 0.95 | - | 19.1 | 1.5 | 1,023 | 5.3 | - |
| Indicated | 2.69 | 3.25 | 0.20 | 63.2 | 0.97 | - | 87.4 | 5.3 | 5,460 | 26.0 | - | ||
| Subtotal | 3.24 | 3.29 | 0.21 | 62.2 | 0.97 | - | 106.5 | 6.8 | 6,483 | 31.3 | - | ||
| Inferred | 9.23 | 3.83 | 0.24 | 82.9 | 1.32 | - | 353.6 | 22.1 | 24,602 | 121.9 | - | ||
| Atacocha (Underground) (6) | 75.96 | Measured | 0.80 | 3.47 | 0.27 | 55.0 | 0.98 | - | 27.6 | 2.1 | 1,411 | 7.8 | - |
| Indicated | 1.91 | 3.30 | 0.36 | 54.9 | 0.92 | - | 63.2 | 6.9 | 3,379 | 17.6 | - | ||
| Subtotal | 2.71 | 3.35 | 0.33 | 54.9 | 0.94 | - | 90.8 | 9.0 | 4,790 | 25.4 | - | ||
| Inferred | 6.12 | 4.09 | 0.56 | 77.3 | 1.21 | - | 250.4 | 34.3 | 15,216 | 74.1 | - | ||
Atacocha (Open pit) (7) | 75.96 | Measured | 1.37 | 1.28 | - | 31.4 | 0.87 | 0.19 | 17.5 | - | 1,381 | 11.9 | 8.4 |
| Indicated | 2.95 | 1.05 | - | 29.0 | 0.90 | 0.24 | 30.9 | - | 2,747 | 26.5 | 22.7 | ||
| Subtotal | 4.31 | 1.12 | - | 29.8 | 0.89 | 0.22 | 48.4 | - | 4,128 | 38.4 | 31.1 | ||
| Inferred | 1.29 | 1.27 | - | 32.7 | 1.15 | 0.22 | 16.4 | - | 1,357 | 14.9 | 9.1 | ||
| Aripuanã (8) | 100 | Measured | 0.35 | 2.60 | 0.39 | 23.1 | 0.86 | 0.36 | 9.1 | 1.4 | 260 | 3.0 | 4.1 |
| Indicated | 5.19 | 3.95 | 0.18 | 35.0 | 1.46 | 0.27 | 205.0 | 9.3 | 5,840 | 75.8 | 45.1 | ||
| Subtotal | 5.54 | 3.86 | 0.19 | 34.2 | 1.42 | 0.28 | 214.1 | 10.7 | 6,100 | 78.8 | 49.2 | ||
| Inferred | 38.75 | 3.47 | 0.33 | 45.7 | 1.39 | 0.43 | 1,344.6 | 127.9 | 56,935 | 538.6 | 535.7 | ||
| Total | Measured | 7.22 | 2.56 | 0.40 | 30.1 | 0.53 | 0.05 | 184.5 | 28.9 | 6,994 | 38.1 | 12.5 | |
| Indicated | 16.89 | 3.26 | 0.20 | 36.4 | 0.91 | 0.12 | 550.7 | 34.5 | 19,769 | 153.2 | 67.8 | ||
| Total | 24.11 | 3.05 | 0.26 | 34.5 | 0.79 | 0.10 | 735.2 | 63.4 | 26,763 | 191.3 | 80.3 | ||
| Inferred | 76.57 | 4.47 | 0.27 | 45.4 | 1.06 | 0.22 | 3,423.2 | 203.6 | 111,686 | 811.1 | 544.8 | ||
| Notes: |
* Numbers may not sumadd due to rounding.
* The estimation of Mineral Resources involves assumptions about future commodity prices and technical mining matters. Mineral Resources are reported exclusive of those Mineral Resources that were converted to Mineral Reserves, and Mineral Resources are not Mineral Reserves and do not have demonstrated economic viability.
(1)* The production and content amounts presentedpoint of reference for Mineral Resources in this table is mill feed materials.
* The El Porvenir, Atacocha Underground and Atacocha Open Pit mines are part of the Cerro Pasco Complex.
| 93 |
Other Operations |
The following table shows our estimates of Mineral Resources (100% ownership basis) for our material mining properties as of December 31, 2023 prepared in accordance with Subpart 1300 of Regulation S-K.
| Grade | Contained Metal | ||||||||||||
| Ownership Interest (%) | Class | Tonnage (2) | Zinc | Copper | Silver | Lead | Gold | Zinc | Copper | Silver | Lead | Gold | |
| (Mt) | (%) | (%) | (g/t) | (%) | (g/t) | (kt) | (kt) | (koz) | (kt) | (koz) | |||
| Cerro Lindo (3) | 83.48 | Measured | 4.40 | 1.93 | 0.65 | 23.1 | 0.24 | - | 84.9 | 28.6 | 3,268 | 10.6 | - |
| Indicated | 3.30 | 1.06 | 0.47 | 24.4 | 0.22 | - | 35.0 | 15.5 | 2,589 | 7.3 | - | ||
| Subtotal | 7.70 | 1.56 | 0.57 | 23.7 | 0.23 | - | 119.9 | 44.1 | 5,857 | 17.9 | - | ||
| Inferred | 9.28 | 1.54 | 0.25 | 32.6 | 0.42 | - | 142.9 | 23.2 | 9,726 | 39.0 | - | ||
| Vazante (4) | 100 | Measured | 0.48 | 8.40 | - | 12.4 | 0.25 | - | 40.3 | - | 191 | 1.2 | - |
| Indicated | 1.40 | 9.64 | - | 4.0 | 0.08 | - | 135.0 | - | 182 | 1.10 | - | ||
| Subtotal | 1.88 | 9.32 | - | 6.2 | 0.12 | - | 175.3 | - | 373 | 2.3 | - | ||
| Inferred | 12.77 | 10.27 | - | 12.9 | 0.21 | - | 1,311.0 | - | 5,289 | 27.4 | - | ||
| Vazante Aroeira Tailings (4) | 100 | Measured | - | - | - | - | - | - | - | - | - | - | - |
| Indicated | - | - | - | - | - | - | - | - | - | - | - | ||
| Subtotal | - | - | - | - | - | - | - | - | - | - | - | ||
| Inferred | 0.66 | 4.21 | - | 7.9 | 0.25 | - | 27.8 | - | 167 | 1.7 | - | ||
| El Porvenir (5) | 83.48 | Measured | 0.66 | 3.47 | 0.27 | 57.7 | 0.95 | - | 22.9 | 1.8 | 1,225 | 6.3 | - |
| Indicated | 3.22 | 3.25 | 0.20 | 63.2 | 0.97 | - | 104.7 | 6.4 | 6,540 | 31.2 | - | ||
| Subtotal | 3.88 | 3.29 | 0.21 | 62.2 | 0.97 | - | 127.6 | 8.2 | 7,765 | 37.5 | - | ||
| Inferred | 11.06 | 3.83 | 0.24 | 82.9 | 1.32 | - | 423.6 | 26.5 | 29,471 | 146.0 | - | ||
| Atacocha (Underground) (6) | 75.96 | Measured | 1.05 | 3.47 | 0.27 | 55.0 | 0.98 | - | 36.4 | 2.8 | 1,857 | 10.3 | - |
| Indicated | 2.52 | 3.30 | 0.36 | 54.9 | 0.92 | - | 83.2 | 9.1 | 4,448 | 23.2 | - | ||
| Subtotal | 3.57 | 3.35 | 0.33 | 54.9 | 0.94 | - | 119.6 | 11.9 | 6,305 | 33.5 | - | ||
| Inferred | 8.06 | 4.09 | 0.56 | 77.3 | 1.21 | - | 329.7 | 45.1 | 20,031 | 97.5 | - | ||
Atacocha (Open pit) (7) | 75.96 | Measured | 1.80 | 1.28 | - | 31.4 | 0.87 | 0.19 | 23.0 | - | 1,818 | 15.7 | 11.0 |
| Indicated | 3.88 | 1.05 | - | 29.0 | 0.90 | 0.24 | 40.7 | - | 3,616 | 34.9 | 29.9 | ||
| Subtotal | 5.68 | 1.12 | - | 29.8 | 0.89 | 0.22 | 63.7 | - | 5,434 | 50.6 | 40.9 | ||
| Inferred | 1.70 | 1.27 | - | 32.7 | 1.15 | 0.22 | 21.6 | - | 1,787 | 19.6 | 12.0 | ||
| Aripuanã (8) | 100 | Measured | 0.35 | 2.60 | 0.39 | 23.1 | 0.86 | 0.36 | 9.1 | 1.4 | 260 | 3.0 | 4.1 |
| Indicated | 5.19 | 3.95 | 0.18 | 35.0 | 1.46 | 0.27 | 205.0 | 9.3 | 5,840 | 75.8 | 45.1 | ||
| Subtotal | 5.54 | 3.86 | 0.19 | 34.2 | 1.42 | 0.28 | 214.1 | 10.7 | 6,100 | 78.8 | 49.2 | ||
| Inferred | 38.75 | 3.47 | 0.33 | 45.7 | 1.39 | 0.43 | 1,344.6 | 127.9 | 56,935 | 538.6 | 535.7 | ||
| Total | Measured | 8.74 | 2.48 | 0.40 | 30.7 | 0.54 | 0.05 | 216.6 | 34.6 | 8,619 | 47.1 | 15.1 | |
| Indicated | 19.51 | 3.09 | 0.21 | 37.0 | 0.89 | 0.12 | 603.6 | 40.3 | 23,215 | 173.5 | 75.0 | ||
| Total | 28.25 | 2.90 | 0.27 | 35.0 | 0.78 | 0.10 | 820.2 | 74.9 | 31,834 | 220.6 | 90.1 | ||
| Inferred | 82.28 | 4.38 | 0.27 | 46.6 | 1.06 | 0.21 | 3,601.2 | 222.7 | 123,406 | 869.8 | 547.7 | ||
| Notes: |
* Numbers may not add due to rounding.
* The estimation of Mineral Resources involves assumptions about future commodity prices and technical mining matters. Mineral Resources are reported exclusive of those Mineral Resources that were converted to Mineral Reserves, and Mineral Resources are not Mineral Reserves and do not have not been adjusted to reflect our ownership interest.demonstrated economic viability.
* The information presentedpoint of reference for Mineral Resources in this table includes 100%is mill feed materials.
* The El Porvenir, Atacocha Underground and Atacocha Open Pit mines are part of the mineral reserveCerro Pasco Complex.
| 94 |
Other Operations |
| (1) | The total tonnage and content amounts presented in this table represents Nexa’s attributable ownership basis. |
| (2) | The tonnage and content amounts presented in this table represents 100% of the Mineral Resources estimates for the property. Please refer to our ownership percentage for the amounts attributable to our ownership interest in the property. |
| (3) | The Qualified Person for the Mineral Resources estimate is Jerry Huaman Abalos, B.Geo., MAusIMM CP(Geo), a Nexa employee. Subpart 1300 of Regulation S-K definitions were followed for Mineral Resources which also are consistent with the CIM (2014) definitions. Mineral Resources are estimated at an NSR cut-off value of US$40.86/t. Mineral Resources estimates are based on average long-term metal prices of: zinc: US$3,218.90/t (US$1.46/lb); copper: US$8,820.05/t (US$3.48/lb); lead: US$2,300.33/t (US$1.04/lb); and silver: US$24.35/oz. Metallurgical recoveries are accounted for in NSR calculations based on historical processing data and are variable as a function of head grade. Recoveries at Life of Mine average head grades are 88.36% for Zn, 85.23% for Cu, 66.53% for Pb, and 68.78% for Ag. A minimum mining width of 4 m was used to create resource shapes. Bulk density varies depending on mineralization domain. |
| (4) | The Qualified Person for the Mineral Resources estimate is José Antonio Lopes, B.Geo., FAusIMM, a Nexa employee. Subpart 1300 of Regulation S-K definitions were followed for Mineral Resources, which also are consistent with the CIM (2014) definitions. Mineral Resources are estimated at various NSR cut-off values appropriate to the mineralization style and mining method. For Supergene Mineralization (Calamine) the resources are estimated at a NSR cut-off value of US$27.91/t for soil and US$32.92/t for fresh rock and transition material. For Aroeira Tailings the resources are estimated ate a NSR cut-off value of US$29.06/t and for Hypogene Mineralization (Willemite) a cut-off value of US$66.31/t for all resources shapes. Mineral Resources are estimates are based on average long-term metal prices of: zinc: US$3,218.90/t (US$1.46/lb); lead: US$2,300.33/t (US$1.04/lb); and silver: US$24.35/oz. Metallurgical recoveries are accounted for NSR calculations based on historical processing data and are variable as a function of head grade. Recoveries at Life of Mine average hypogene mineralization (Willemite) head grades are 87.19% for Zn, 23.93% for Pb, and 42.00% for Ag. Recovery at Life of Mine average supergene mineralization head grade is 55.00% for Zn. Recoveries at Life of Mine average Aroeira Tailings head grades are 67.86% for Zn, 40.74% for Pb and 42.00% for Ag. A minimum thickness of 3.0 m for underground SLS, open pit shell for Calamine and above original topography for tailings was applied. Bulk density was assigned based on rock type. |
| 95 |
Other Operations |
| (5) | The Qualified Person for the Mineral Resources estimate is Jerry Huaman Abalos, B.Geo., MAusIMM CP(Geo), a Nexa employee. Subpart 1300 of Regulation S-K definitions were followed for Mineral Resources, which also are consistent with the CIM (2014) definitions. Mineral Resources are estimated at NSR cut-off grade values ranging from of US$63.77/t to US$67.04/t for SLS areas and US$65.77/t to US$69.04for C&F areas depending on the zone. Mineral Resources estimates are based on average long-term metal prices of: zinc: US$3,218.90/t (US$1.46/lb); copper: US$8,820.05/t (US$3.48/lb); lead: US$2,300.33/t (US$1.04/lb); and silver: US$24.35/oz. Metallurgical recoveries are accounted for in NSR calculations based on historical processing data and are variable as a function of head grade. Recoveries at Life of Mine average head grades are 89.21% for Zn, 14.60% for Cu, 80.01% for Pb, and 77.51% for Ag. A minimum mining width of 4.0 m was used for C&F and a minimum mining width of 3.0 m was used for SLS resource stopes shapes respectively. Bulk density varies depending on mineralization domain. |
| (6) | The Qualified Person for the Mineral Resources estimate is Jerry Huaman Abalos, B.Geo., MAusIMM CP(Geo), a Nexa employee. Subpart 1300 of Regulation S-K definitions were followed for Mineral Resources, which also are consistent with the CIM (2014) definitions. Mineral Resources are estimated at a NSR cut-off value of US$69.00/t for SLS, and US$71.07/t for C&F. Mineral Resources estimates are based on average long-term metal prices of: zinc: US$3,218.90/t (US$1.46/lb); copper: US$8,820.05/t (US$3.48/lb); lead: US$2,300.33/t (US$1.04/lb); and silver: US$24.35/oz. Metallurgical recoveries are accounted for in NSR calculations based on historical processing data and are variable as a function of head grade. Recoveries at Life of Mine average head grades are 89.30% for Zn, 15.73% for Cu, 80.02% for Pb, and 77.51% for Ag. A minimum mining width of 4.0 m was used for C&F and a minimum mining width of 3.0 m was used for SLS resource stopes shapes respectively. Density was assigned based on rock type. |
| (7) | The Qualified Person for the Mineral Resources estimate is Jerry Huaman Abalos, B.Geo., MAusIMM CP(Geo), a Nexa employee. Subpart 1300 of Regulation S-K definitions were followed for Mineral Resources, which also are consistent with the CIM (2014) definitions. Mineral Resources are reported within optimized pit shell. Mineral Resources are estimated at a NSR cut-off value of US$22.44/t. Mineral Resources estimates are based on average long-term metal prices of: zinc: US$3,218.90/t (US$1.46/lb); lead: US$2,300.33/t (US$1.04/lb); silver: US$24.35/oz; and gold: US$1,875.57/oz. Metallurgical recoveries are accounted for in NSR calculations based on historical processing data and are variable as a function of head grade. Recoveries at Life of Mine average head grades are 70.44% for Zn, 83.97% for Pb, 75.76% for Ag, and 65.46% for Au. Mineral resources are reported within open pit shell. Density was assigned based on rock type. |
| (8) | The Qualified Person for the Mineral Resources estimate is José Antonio Lopes, B.Geo., FAusIMM, a Nexa employee. Subpart 1300 of Regulation S-K definitions were followed for Mineral Resources, which also are consistent with the CIM (2014) definitions. Mineral Resources reported using a cut-of value of US$63.40/t. Mineral Resources estimates are based on average long-term metal prices of: zinc: US$3,218.90/t (US$1.46/lb); copper: US$8,820.05/t (US$3.48/lb); lead: US$2,300.33/t (US$1.04/lb); silver: US$24.35/oz; and gold: US$1,875.57/oz. Metallurgical recoveries are accounted for in NSR calculations based on historical processing data and are variable as a function of head grade. Recoveries at Life of Mine average head grades are 90.06% for Zn, 60.00% for Cu, 84.92% for Pb, 68.00% for Ag, and 67.80% for Au. A minimum thickness of 3.0 m was used for stopes shapes. Bulk density varies depending on mineralization domain. |
| 96 |
Other Operations |
The following table shows our estimates of Attributable Mineral Resources for our consolidated subsidiariesother operating mines and zinc projects which do not currently have estimated Mineral Reserves as of our joint ventures, certainDecember 31, 2023 prepared in accordance with Regulation S-K 1300.
| Grade | Contained Metal | ||||||||||||
| Ownership (%) | Class | Tonnage (1) | Zinc | Copper | Silver | Lead | Gold | Zinc | Copper | Silver | Lead | Gold | |
| (Mt) | (%) | (%) | (g/t) | (%) | (g/t) | (kt) | (kt) | (koz) | (kt) | (koz) | |||
| Morro Agudo (3) | 100 | Measured | - | - | - | - | - | - | - | - | - | - | - |
| Indicated | 12.94 | 3.51 | - | - | 0.59 | - | 454.3 | - | - | 75.9 | - | ||
| Subtotal | 12.94 | 3.51 | - | - | 0.59 | - | 454.3 | - | - | 75.9 | - | ||
| Inferred | 3.91 | 3.91 | - | - | 0.53 | - | 152.7 | - | - | 20.7 | - | ||
| Hilarión (4) | 83.48 | Measured | 12.14 | 3.39 | - | 30.9 | 0.69 | - | 411.5 | - | 12,059 | 83.7 | - |
| Indicated | 28.41 | 3.62 | - | 27.0 | 0.54 | - | 1,028.4 | - | 24,660 | 153.4 | - | ||
| Subtotal | 40.55 | 3.55 | - | 28.2 | 0.58 | - | 1,439.9 | - | 36,719 | 237.2 | - | ||
| Inferred | 35.20 | 4.06 | - | 25.0 | 0.41 | - | 1,429.3 | - | 28,296 | 144.3 | - | ||
| Florida Canyon Zinc (5) | 50.93 | Measured | 0.41 | 11.32 | - | 15.4 | 1.40 | - | 46.7 | - | 204 | 5.8 | - |
| Indicated | 0.83 | 10.28 | - | 14.9 | 1.31 | - | 85.4 | - | 398 | 10.9 | - | ||
| Subtotal | 1.24 | 10.63 | - | 15.1 | 1.34 | - | 132.1 | - | 602 | 16.7 | - | ||
| Inferred | 7.57 | 9.63 | - | 11.3 | 1.26 | - | 728.8 | - | 2,750 | 95.3 | - | ||
| Total | Measured | 12.55 | 3.65 | - | 30.4 | 0.71 | - | 458.2 | - | 12,263 | 89.5 | - | |
| Indicated | 42.18 | 3.72 | - | 18.5 | 0.57 | - | 1,568.0 | - | 25,058 | 240.2 | - | ||
| Total | 54.73 | 3.70 | - | 21.2 | 0.60 | - | 2,026.2 | - | 37,321 | 329.7 | - | ||
| Inferred | 46.68 | 4.95 | - | 20.7 | 0.56 | - | 2,310.8 | - | 31,045 | 260.4 | - | ||
| Notes: |
* Numbers may not add due to rounding.
* The estimation of whichMineral Resources involves assumptions about future commodity prices and technical mining matters. Mineral Resources are not wholly-owned, as set outmineral reserves and do not have demonstrated economic viability.
* The point of reference for Mineral Resources in this table is mill feed materials.
| 97 |
Other Operations |
The following table shows our estimates of Mineral Resources (100% ownership interests column.basis) for our other operating mines and zinc projects which do not currently have estimated Mineral Reserves as of December 31, 2023 prepared in accordance with Regulation S-K 1300.
| Grade | Contained Metal | ||||||||||||
| Ownership (%) | Class | Tonnage (2) | Zinc | Copper | Silver | Lead | Gold | Zinc | Copper | Silver | Lead | Gold | |
| (Mt) | (%) | (%) | (g/t) | (%) | (g/t) | (kt) | (kt) | (koz) | (kt) | (koz) | |||
| Morro Agudo (3) | 100 | Measured | - | - | - | - | - | - | - | - | - | - | - |
| Indicated | 12.94 | 3.51 | - | - | 0.59 | - | 454.3 | - | - | 75.9 | - | ||
| Subtotal | 12.94 | 3.51 | - | - | 0.59 | - | 454.3 | - | - | 75.9 | - | ||
| Inferred | 3.91 | 3.91 | - | - | 0.53 | - | 152.7 | - | - | 20.7 | - | ||
| Hilarión (4) | 83.48 | Measured | 14.54 | 3.39 | - | 30.9 | 0.69 | - | 492.9 | - | 14,445 | 100.3 | - |
| Indicated | 34.03 | 3.62 | - | 27.0 | 0.54 | - | 1,231.9 | - | 29,540 | 183.8 | - | ||
| Subtotal | 48.57 | 3.55 | - | 28.2 | 0.58 | - | 1,724.8 | - | 43,985 | 284.1 | - | ||
| Inferred | 42.17 | 4.06 | - | 25.0 | 0.41 | - | 1,712.1 | - | 33,895 | 172.9 | - | ||
| Florida Canyon Zinc (5) | 50.93 | Measured | 0.81 | 11.32 | - | 15.4 | 1.40 | - | 91.7 | - | 401 | 11.3 | - |
| Indicated | 1.63 | 10.28 | - | 14.9 | 1.31 | - | 167.6 | - | 781 | 21.4 | - | ||
| Subtotal | 2.44 | 10.63 | - | 15.1 | 1.34 | - | 259.3 | - | 1,182 | 32.7 | - | ||
| Inferred | 14.86 | 9.63 | - | 11.3 | 1.26 | - | 1,431.0 | - | 5,399 | 187.2 | - | ||
| Total | Measured | 15.35 | 3.81 | - | 30.1 | 0.73 | - | 584.6 | - | 14,846 | 111.6 | - | |
| Indicated | 48.60 | 3.81 | - | 19.4 | 0.58 | - | 1,853.8 | - | 30,321 | 281.1 | - | ||
| Total | 63.95 | 3.81 | - | 22.0 | 0.61 | - | 2,438.4 | - | 45,167 | 392.7 | - | ||
| Inferred | 60.94 | 5.41 | - | 20.1 | 0.62 | - | 3,295.8 | - | 39,294 | 380.8 | - | ||
| Notes: |
* Numbers may not add due to rounding.
* The estimation of Mineral Resources involves assumptions about future commodity prices and technical mining matters. Mineral Resources are not mineral reserves and do not have demonstrated economic viability.
* The point of reference for Mineral Resources in this table is mill feed materials.
| (1) | The tonnage and content amounts presented in this table represents Nexa’s attributable ownership basis. |
| (2) | The tonnage and content amounts presented in this table represents 100% of the Mineral Resources estimates for the property. Please refer to our ownership percentage for the amounts attributable to our ownership interest in the property. |
| (3) | The Qualified Person for the Mineral Resources estimate is José Antonio Lopes, B.Geo., FAusIMM, a Nexa employee. Subpart 1300 of Regulation S-K definitions were followed for Mineral Resources, which also are consistent with the CIM (2014) definitions. Mineral Resources are reported within underground mining shapes and the NSR cut-off values are calculated based on the life of mine costs for each mine. Morro Agudo: US$51.84/t and Bonsucesso: US$55.83/t. Mineral Resources estimates are based on average long-term metal prices of: zinc: US$3,218.90/t (US$1.46/lb) and lead: US$2,300.33/t (US$1.04/lb). Metallurgical recoveries are accounted for in NSR calculations based on historical processing data and are variable as a function of head grade. Recoveries at the LOM average head grades for Morro Agudo are 89.96% for Zn and 71.69% for Pb, and for Bonsucesso are 92.50% for Zn and 61.10% for Pb. A minimum thickness of 3.0 m was applied for Bonsucesso and 4.5 m for Morro Agudo underground. Density was assigned based on rock type. |
| 98 |
Other Operations |
| (4) | The Qualified Person for the Mineral Resources estimate is Jerry Huaman Abalos, B.Geo., MAusIMM CP(Geo), a Nexa employee. Subpart 1300 of Regulation S-K definitions were followed for Mineral Resources, which also are consistent with the CIM (2014) definitions. Mineral Resources are estimated at an NSR cut-off value of US$45.00/t. Mineral Resources estimates are based on average long-term metal prices of: zinc: US$3,245.91/t (US$1.47/lb); lead: US$2,332.46/t (US$1.06/lb); and silver: US$22.66/oz. Metallurgical recoveries are accounted for in NSR calculations based on historical processing data and are variable as a function of head grade. Recoveries at the LOM average head grades for Hilarion are 90.00% for Zn, 86.00% for Pb, and 72.00% for Ag. A minimum thickness of 4.0 m was applied. Density was assigned based on rock type. |
| (5) | The Qualified Person for the Mineral Resources estimate is Jerry Huaman Abalos, B.Geo., MAusIMM CP(Geo), a Nexa employee. Subpart 1300 of Regulation S-K definitions were followed for Mineral Resources, which also are consistent with the CIM (2014) definitions. Mineral Resources are estimated at an NSR cut-off value of US$41.40/t NSR for SLS, US$42.93/t for C&F and US$40.61/t for Room & Pillar mine areas. Mineral Resources estimates are based on average long-term metal prices of: zinc: US$2,816.35/t (US$1.27/lb); lead: US$ 2,196.50/t (US$1.00/lb); and silver: US$19.38/oz. Metallurgical recoveries are accounted for in NSR calculations based on historical processing data and are variable as a function of head grade. Recoveries at the LOM average head grades for Florida Canyon are 80.00% for Zn, 74.00% for Pb, and 52.00% for Ag. A minimum thickness of 3.0 m was applied for Bonsucesso and 4.5 m for Morro Agudo underground. Density was assigned based on rock type. |
(2)
The reservefollowing table shows our estimates of Attributable Mineral Resources for our copper project which does not currently have estimated Mineral Reserves as of December 31, 2023 prepared in accordance with Regulation S-K 1300.
| Grade | Contained Metal | ||||||||||||
| Ownership (%) | Class | Tonnage (1) | Zinc | Copper | Silver | Lead | Molybdenum | Zinc | Copper | Silver | Lead | Molybdenum | |
| (Mt) | (%) | (%) | (g/t) | (%) | (g/t) | (kt) | (kt) | (koz) | (kt) | (koz) | |||
| Magistral (3) | 83.48 | Measured | 82.39 | - | 0.52 | 2.8 | - | 0.050 | - | 428.4 | 7,416 | - | 41.2 |
| Indicated | 75.70 | - | 0.43 | 2.8 | - | 0.040 | - | 325.5 | 6,814 | - | 30.3 | ||
| Subtotal | 158.09 | - | 0.48 | 2.8 | - | 0.045 | - | 753.9 | 14,231 | - | 71.5 | ||
| Inferred | 9.24 | - | 0.38 | 3.1 | - | 0.050 | - | 35.1 | 921 | - | 4.6 | ||
| Total | Measured | 82.39 | - | 0.52 | 2.8 | - | 0.050 | - | 428.4 | 7,416 | - | 41.2 | |
| Indicated | 75.70 | - | 0.43 | 2.8 | - | 0.040 | - | 325.5 | 6,814 | - | 30.3 | ||
| Total | 158.09 | - | 0.48 | 2.8 | - | 0.045 | - | 753.9 | 14,231 | - | 71.5 | ||
| Inferred | 9.24 | - | 0.38 | 3.1 | - | 0.050 | - | 35.1 | 921 | - | 4.6 | ||
| Notes: |
* Numbers may not add due to rounding.
* The estimation of Mineral Resources involves assumptions about future commodity prices and technical mining matters. Mineral Resources are not mineral reserves and do not have demonstrated economic viability.
* The point of reference for Mineral Resources in this table is mill feed materials.
The following table shows our estimates of Mineral Resources (100% ownership basis) for our copper project which does not currently have estimated Mineral Reserves as of December 31, 2023 prepared in accordance with Regulation S-K 1300.
| 99 |
Other Operations |
| Grade | Contained Metal | ||||||||||||
| Ownership (%) | Class | Tonnage (2) | Zinc | Copper | Silver | Lead | Molybdenum | Zinc | Copper | Silver | Lead | Molybdenum | |
| (Mt) | (%) | (%) | (g/t) | (%) | (g/t) | (kt) | (kt) | (koz) | (kt) | (koz) | |||
| Magistral (3) | 83.48 | Measured | 98.69 | - | 0.52 | 2.8 | - | 0.050 | - | 513.2 | 8,884 | - | 49.3 |
| Indicated | 90.68 | - | 0.43 | 2.8 | - | 0.040 | - | 389.9 | 8,163 | - | 36.3 | ||
| Subtotal | 189.37 | - | 0.48 | 2.8 | - | 0.045 | - | 903.1 | 17,047 | - | 85.6 | ||
| Inferred | 11.06 | - | 0.38 | 3.1 | - | 0.050 | - | 42.0 | 1,103 | - | 5.5 | ||
| Total | Measured | 98.69 | - | 0.52 | 2.8 | - | 0.050 | - | 513.2 | 8,884 | - | 49.3 | |
| Indicated | 90.68 | - | 0.43 | 2.8 | - | 0.040 | - | 389.9 | 8,163 | - | 36.3 | ||
| Total | 189.37 | - | 0.48 | 2.8 | - | 0.045 | - | 903.1 | 17,047 | - | 85.6 | ||
| Inferred | 11.06 | - | 0.38 | 3.1 | - | 0.050 | - | 42.0 | 1,103 | - | 5.5 | ||
| Notes: |
* Numbers may not add due to rounding.
* The estimation of Mineral Resources involves assumptions about future commodity prices and technical mining matters. Mineral Resources are not mineral reserves and do not have demonstrated economic viability.
* The point of reference for Mineral Resources in this table is mill feed materials.
| (1) | The tonnage and content amounts presented in this table represents Nexa’s attributable ownership basis. |
| (2) | The tonnage and content amounts presented in this table represents 100% of the Mineral Resources estimates for the property. Please refer to our ownership percentage for the amounts attributable to our ownership interest in the property. |
| (3) | The Qualified Person for the Mineral Resources estimate is Jerry Huaman Abalos, B.Geo., MAusIMM CP(Geo), a Nexa employee. Subpart 1300 of Regulation S-K definitions were followed for Mineral Resources, which also are consistent with the CIM (2014) definitions. Mineral Resources are estimated at a pit shell constraint and NSR cut-off value: US$5.99/t (Porf San Ernesto, Porf. Sara and Porf. H), US$5.51/t (Mixto), US$5.48/t (Skarn). Mineral Resources estimates are based on average long-term metal prices of: copper: US$8,272.00/t (US$3.75/lb); silver: US$21.34/oz; and molybdenum: US$21,829.00/t (US$ 9.90/lb). Metallurgical recoveries are accounted for in the NSR calculations based on metallurgical data and vary from 79.3% in skarn to 92.5% in San Ernesto porphyry for Cu, 51.3% in skarn and 79.2% in San Ernesto porphyry for Mo, and 70% for Ag. Density was assigned based on rock type. |
Internal Controls Disclosure
Nexa has used well-established quality assurance/quality controls (“QA/QC”) protocols since 2007 for core samples from operating mines and its Brownfield/Greenfield projects. Nexa has used a corporate database (GDMS Fusion) from Datamine since 2017, which replaced the previous corporate database system used from 2007 to 2016. The current database system has several default laboratory packages, specific for different Business Units (ore deposit types/countries) with pre-defined preparation and assay methods, reporting units and over-limit methods. All assay dispatches from all mines and projects follows the same protocols for each medium type (core, rock, soil, stream sediment samples). All written protocols are in a corporate internal system that requires revisions and updates every three years.
| 100 |
Other Operations |
Nexa Quality Control include three types of duplicates (pulp, coarse rejects and half core duplicates), blank controls and certified standards. Inter-laboratory checks are also carried out on an annual basis at certified laboratories. Fusion database has a collection of pre-defined QA/QC charts for each type of control where Nexa parameters for each control are built in. All blanks and certified standards are approved and registered in Fusion by the database administrator. Nexa protocols for construction and certification of new standards from operating mines and projects include a minimum of ten laboratories and minimum of ten samples per lab in the Round Robin. Laboratories need to be form different continents and only three laboratories from the same group are allowed.
Every mine and advanced project provides a detailed QA/QC report at least once a year, which is appended to the updated mineral resources technical reports prepared by our engineers.
With respect to Cerro Lindo mine were prepared under the supervisionverification of Amec Foster Wheeler, an independent mining consultant. Mineral reserves are reported within engineered stope outlines assuming the following underground mining methods: sublevel open stoping (SLOS) or vertical retreat mining (VRM) with paste backfill, and mechanized drift and fill/cut and fill (D&F/C&F) with paste backfill. Typical SLOS stopes are 20 m high x 20 m long x 30 m deep. Typical D&F/C&F rooms are 4 m x 4 m. Mineral reserves incorporate dilution and mining recovery. Mineral processing by flotation concentration is assumed. Mineral reserves are reported at different net smelter return (NSR) cut-off values, depending on the mining method used: for SLOS/VCM with paste backfill, the NSR cutoff is US$29.11/t; for D&F/C&F, the NSR cut-off is US$40.28/t. The NSR calculations are based on head grade and historical plant performance. Metal prices used for the NSR calculation are three-year trailing average: zinc: US$2,297/t (US$1.04/lb.); lead: US$1,986/t (US$0.90/lb.); copper: US$5,490/t (US$2.49/lb.); and silver: US$16.63/oz. NSR calculations are based on polynomial equations for eachanalytical procedures, Nexa carries out periodic reviews of the concentrate elements,QA/QC programs to ensure that an adequate level of quality is maintained in the process of sampling, preparing and incorporate considerationstesting drill core samples and that the QA/QC programs are designed and implemented to prevent or detect contamination and allow analytical precision and accuracy to be quantified. Nexa’s internal qualify person performed this review and concluded that Nexa's QA/QC programs meet or exceed industry standards and the data are suitable for Mineral Resources and Mineral Reserves purposes.
Internally, regular data verification workflows are carried out to ensure the collection of sliding smelter payments that vary depending on the gradereliable data. Coordinates, core logging, surveying, and sampling are monitored by exploration, mine geologists, and verified routinely for consistency.
The Mineral Resource and Mineral Reserve estimates are supported by a review of the concentrate.recent operation results including operating costs, production, metallurgical performance and reconciliation. The average NSRLOM plan supporting the estimates includes consideration of changes to the mineral reserve is calculatedpermits required, capital costs, tailings capacity and other production constraints. The estimates are subject to be US$65/t.normal industry risks including metal prices, metallurgical performance and geological modeling. For geological risk Nexa has entered into a silver streaming agreement with Triple Flag, beginning in December 2016. The result is that revenues from silver sales will be lower than assumed price. The reduced silver revenue has not been considered in NSR calculations or cut-off grade but is not expected to materially affect the estimates. The revenue reduction has been included in our financial analysis.
(3) The reserve estimates with respect to El Porvenir mine were prepared by SRK Consulting, an independentmodeling and estimation procedures following mining consultant. Mineral reserves are reported within engineered stope outlines assuming mechanized C&F underground mining method with hydraulicindustry best practices including drilling, borehole survey, core logging, sampling, and detritic backfill. Typical C&F stopes are 5 m high. Mineral reserves incorporate dilution and mining recovery. Mineral reserves are reported at US$40.94/t NSR cut-off. NSR cut-off is calculated based on the LOM costs: mining US$24.25/t, process US$6.37/t and other costs US$10.32/t. Metal prices used for the NSR calculation are three-year trailing average: zinc: US$2,116 /t, lead: US$1,918/t, copper: US$5,664/t, silver: US$17.05/oz. NSR is calculated using stope head grades, after application of modifying factors; including as calculation parameters: estimated metallurgical recovery and commercial terms (TC, RC, payable percentages, deductions, penalties and freight cost). Mineral processing by flotation concentration is assumed. Metallurgical recoveries are based on a recovery versus head grade curve, supported by historical plant performance. Average process plant recoveries for zinc, lead, copper and silver are 90.8%, 82.1%, 32.8% and 64.9%, respectively.density protocols.
| 101 |
Capital Expenditures |
(4) The reserve estimates with respect to Vazante mine were prepared under the supervision of Amec Foster Wheeler, an independent mining consultant. Mineral reserves are reported within engineered stope outlines assuming the following underground mining methods: SLOS, VRM with rock backfill, and mechanized C&F with rock backfill. Typical stope dimensions are 30 m high x 60 m long x 8 m deep. A minimum mining width of 4 m is applied to all stopes. Typical C&F rooms are 4 m x 4 m. Mineral reserves incorporate dilution and mining recovery factors. All mineral reserves are reported at a net smelter return (NSR) cut-off value independent of the mining method. SLOS/VRM and C&F are reported with an NSR cutoff of $US$57.78/t. Mineral processing by flotation concentration is assumed. The NSR calculations are based on head grade mill recoveries of 84.2%, 20.6% and 36.3% for zinc, lead and silver, respectively. Metal prices used for the NSR calculation are three-year trailing average: zinc: US$2,297/t (US$1.04/lb.); lead: US$1,986/t (US$0.90/lb.); copper: US$5,490/t (US$2.49/lb.); and silver: US$16.63/oz. NSR calculations are based on polynomial equations for each of the concentrate elements, and incorporate considerations of sliding smelter payments that vary depending on the grade of the concentrate.
Capital expenditures
Our capital expenditures from January 1, 20152021 through December 31, 20172023 totaled US$567.71,198.2 million and we have budgetedexpect to invest US$280.4311.0 million for 2018 for investments in projects that are currently underway, reflecting a 41.9% increasecapital expenditures in 2024, maintaining the same levels compared to our 2017 investment budget.2023 investments, mainly driven by higher HS&E and other non-expansion investments. Our guidance includes US$307.0 million directed towards non-expansion investments and US$4.0 million towards expansion investments. The following table sets forth our capital expenditures for the periods indicated.
|
| For the Year Ended |
| ||||
|
| 2017 |
| 2016 |
| 2015 |
|
|
| (in millions of US$) |
| ||||
Capital Expenditures |
|
|
|
|
|
|
|
Expansion(1) |
| 48.8 |
| 41.4 |
| 35.8 |
|
Vazante Mine Deepening Project |
| 30.1 |
| 15.8 |
| 14.9 |
|
Ambrósia |
| 11.8 |
| 5.0 |
| 1.7 |
|
Extremo Norte |
| 0.6 |
| 8.4 |
| 9.7 |
|
Shalipayco |
| — |
| — |
| — |
|
Aripuanã |
| 3.6 |
| — |
| 5.6 |
|
Magistral |
| — |
| 4.0 |
| — |
|
Others |
| 2.7 |
| 8.0 |
| 3.9 |
|
Modernization |
| 21.4 |
| 19.6 |
| 15.3 |
|
Projects to reduce operating costs |
| 6.0 |
| 4.2 |
| 0.7 |
|
Projects to improve product quality |
| 4.6 |
| 5.7 |
| 7.5 |
|
Projects for operational gains |
| 8.8 |
| 7.6 |
| 4.7 |
|
Others |
| 1.8 |
| 2.1 |
| 2.4 |
|
Sustaining |
| 59.4 |
| 54.1 |
| 49.0 |
|
Equipment replacement |
| 15.9 |
| 9.5 |
| — |
|
Equipment updates |
| 5.8 |
| 8.3 |
| 6.9 |
|
Mining equipment replacement |
| 12.8 |
| 18.4 |
| 13.6 |
|
New equipment installation |
| 13.7 |
| 0.7 |
| 5.5 |
|
Others |
| 11.1 |
| 17.2 |
| 23.0 |
|
Health, Safety and Environment |
| 62.1 |
| 58.5 |
| 72.9 |
|
Electrical substation |
| 36.3 |
| 9.8 |
| 4.7 |
|
Firefighting systems |
| 5.1 |
| 1.0 |
| 1.2 |
|
Waste treatment |
| 11.7 |
| 20.0 |
| 19.1 |
|
Others |
| 8.9 |
| 6.8 |
| 7.6 |
|
Others |
| 6.1 |
| 2.9 |
| 4.1 |
|
Manufacturing execution system |
| 2.4 |
| 1.5 |
| 3.7 |
|
Others |
| 3.7 |
| 1.3 |
| 0.4 |
|
Subtotal |
| 197.8 |
| 176.5 |
| 177.1 |
|
Reconciliation to Financial Statements(2) |
| (0.2 | ) | 6.5 |
| 10.0 |
|
Total |
| 197.6 |
| 183.0 |
| 187.1 |
|
For the Year Ended December 31, | |||
2023 | 2022 | 2021 | |
| (in millions of US$) | |||
| Capital Expenditures | |||
| Expansion (1) | 3.7 | 88.5 | 271.2 |
| Modernization | 3.8 | 10.3 | 8.8 |
| Sustaining | 292.8 | 239.7 | 189.0 |
| Health, Safety and Environment (“HS&E”) | 15.7 | 40.1 | 31.6 |
| Others | 3.5 | 1.1 | 3.6 |
| Subtotal | 319.5 | 379.7 | 504.3 |
| Reconciliation to Financial Statements (2) | (10.5) | 1.6 | 3.6 |
| Total | 309.0 | 381.2 | 507.9 |
(1) For a description of the projects, see “Mining operations—Growth projects.”
(2) The amounts under “Reconciliation to Financial Statements” are related to capitalization of interest net of advanced payments.
| (1) | For a description of the projects, see “Information on the Company—Mining operations.” |
| (2) | The amounts under “Reconciliation to Financial Statements” are mainly related to advance payment of imported materials, capitalization of interest net of advanced payments and tax credits" |
Our main capital expenditures during the years ended December 31, 2017, 20162023, 2022 and 20152021 include the following.following:
· In 2017, our capital expenditures were US$197.6 million, including in the following projects: the Vazante mine deepening project, for which the largest investment was in excavation; waste treatment and dam projects at Três Marias and El Porvenir; the Ambrosia mine project, for which the largest
investment was in excavation; and a pump station project at Vazante.
· In 2016, our capital expenditures were US$183.0 million, including in the following projects: the Vazante Mine Deepening Project, for which the largest investment was in excavation; the Vazante Extremo Norte project, for which the largest investments were in excavation, construction and equipment installation; and the installation of a gas scrubber in Cajamarquilla to reduce the sulfur dioxide content of our emissions.
· In 2015, our capital expenditures were US$187.1 million, including in the following projects: the Vazante Mine Deepening Project, for which the largest investments were in excavation and construction; the Vazante Extremo Norte project, for which the largest investments were in excavation, equipment installation and construction; and a project to reduce the SO2 content in the emissions in Cajamarquilla to comply with governmental regulations.
For 2018, we have budgeted US$280.4 million to invest in projects that are currently underway. Our main projects include the life of mine extension and implementation of dry stacking tailings in Vazante, for which we have budgeted US$43.0 million and US$22.0 million, respectively. We also intend to use US$20.0 million for the ongoing feasibility study and potential execution of the Aripuanã greenfield project, and US$20.0 million for the conversion to Jarosite process at the Cajamarquilla smelter to increase zinc recovery.
| · | In 2023, our capital expenditures were US$309.0 million, an 18.9% decrease compared to 2022, mainly due to the decrease in expansion investments with the conclusion of construction at Aripuanã, which was partially offset by an increase in sustaining capital expenditures, including US$79.4 million invested in the Aripuanã mine. |
| · | In 2022, our capital expenditures were US$381.2 million, a 24.9% decrease compared to 2021, mainly due to a decrease in growth capital expenditures related to the conclusion of construction at Aripuanã, which was partially offset by an increase in sustaining Capex, including US$45.8 million invested in the Aripuanã mine. |
| · | In 2021, our capital expenditures were US$507.9 million, a 51.0% increase compared to 2020, mainly due to expenditures related to the construction of the Aripuanã project (50.7% of total Capex) and higher non-expansion investments, including an increase in sustaining and HS&E expenses to historical levels, which were lower in 2020 due to the impact of the COVID-19 pandemic. |
We expect to meet these capital expenditure needs from our operating cash flow.flow and our current cash position. We may need to incur indebtedness to finance a portion of these expenditures particularlyor also incur indebtedness if financing is available at attractive terms. Our actual capital expenditures may vary from the expected budgeted amounts we have described here, both in terms of the aggregate capital expenditures we actually incur and when we incur them.
| 102 |
Environmental, Social and Governance (ESG) |
REGULATORY MATTERSENVIRONMENTAL, SOCIAL AND GOVERNANCE (ESG)
We are committed to fully integrating sustainability into our business through a comprehensive approach based on systematic planning and execution, prioritizing risk and impact management, and maintaining a positive social, economic and environmental legacy in the places where we operate. Our practices related to ESG are continuously evolving to adapt to new framework, and regulatory and disclosure requirements, including the SEC’s new environmental rules adopted on March 6, 2024, as well as to consider best practices and respond to stakeholder feedback.
Nexa integrates sustainability practices into its business, focused on generating a positive social, economic and environmental impact in the places where it operates. Within this context, the Company has a multidisciplinary and integrated task force that is continually assessing and refining its Environmental, Social and Governance (“ESG”) strategy and future actions including risks analyses with respect to climate change and global, regional and local weather conditions, as well as those related to the emission of greenhouse gases, among other matters. In October 2022, Nexa formally announced updated medium- and long-term goals regarding its ESG strategy. The Company disclosed updated targets related to key ESG topics, such as climate change, water consumption, safety and diversity, and social commitments. In 2022, Nexa also announced its ESG purpose as “Mining that changes with the world.” Nexa’s ESG strategy takes a long-term approach, and as a result the Company could in the future change its accounting estimates, assumptions and judgments regarding new definitions, practices or commitments that would be assumed by management in relation to its ESG strategy.
In 2023, the Company advanced on its ESG targets by progressing on projects and initiatives and also enhanced its ESG management process. In the second half of 2023, we kicked off the implementation of an ESG Data Management platform (“Deep ESG”), which will support ESG data gathering and control, enabling corporate and operations to improve the ESG strategy management process. We expect to conclude the implementation of Deep ESG by the end of 2024.
During 2023, we also conducted a materiality review process aiming to rediscuss key ESG topics that will support the Company’s strategy. More details on the materiality review process are discussed further in this section.
Our sustainability approach is set out in our Code of Conduct and Compliance and Sustainability policies. We adhere to the United Nation’s Global Compact and the goals related to our material topics discussed below seek to contribute to fulfilling the UN’s Sustainable Development Goals (“SDGs”). Our current material topics and ESG initiatives, as discussed below, strive to meet the SDGs.
We view ESG as core to our efforts to generate shareholder and social-environmental value, including:
| · | Putting the health, safety and well-being of our people first; |
| · | Being environmentally responsible and accountable; |
| · | Respecting and fostering the human rights agenda; and |
| · | Supporting and constantly dialoging with the communities where we operate. |
Board of Directors, SCP Committee, Compensation, Nominating and Governance (“CNG”) Committee, and Audit Committee reporting
Our Board of directors oversees our ESG strategy, given its strategic importance to the Company and our operations. The Board of directors is responsible for guidance, governance and oversight of ESG, and overseeing the Company’s eight current material topics described below. The Board committees, and in particular the CNG committee, the SCP committee and the Audit committee, support the Board in its monitoring and oversight of ESG matters. Specifically, our SCP committee oversees and contributes to our ESG strategy plan, ensuring that we are considering material and relevant topics to Nexa and its stakeholders, as well as proposing reasonable ESG targets and benchmarks.
Our CNG committee assists our Board of directors in fulfilling its governance and supervisory responsibilities and advises our Board of directors with respect to evaluation and monitoring of compensation models and policies and other related matters. The committee’s responsibilities also include the supervision and approval of our social responsibility plans and policies, including, but not limited to, those described in our ESG Strategy (except community related aspects, which are overseen by the SCP committee).
| 103 |
Environmental, Social and Governance (ESG) |
Our SCP committee oversees sustainability-related issues, which include the prioritization of safe and sustainable business practices with respect to environmental, health, safety and social matters, as well as the oversight of the management and governance of our tailings disposals. The SCP committee also oversees our capital projects, monitoring technical, economic and social issues with respect to our projects, including exploration, development, licensing, construction and operation of mines and metallurgical plants and key assets for our strategy and growth. In 2022, our SCP committee reaffirmed our ESG strategy, restated our framework, approved new long-term targets and reviewed management’s ESG plan. During 2023, the committee met eight times and discussed ESG topics in four of these meetings. The new ESG materiality review process was also presented to the committees.
In 2022, Nexa completed an internal ESG ownership project, which focused on introducing ESG into Nexa’s overall governance strategy and defining how the Company intends to address ESG internally with respect to key ESG topics. In 2023, we focused on building each operating unit its own ESG strategy to align with the goals and initiatives within Nexa’s ESG strategy. This process consisted of discussing and validating targets for each unit, gathering the information on projects and initiatives that support the goals and targets, discussing the goals’ advancement over time, including the amount to be invested in these projects and other relevant details.
The Audit committee is also involved in ESG matters, in particular with respect to the analysis of the impact on financial reporting, as well as preparedness in order to meet financial reporting and disclosure requirements that may be implemented in the near future.
ESG Commitments
In October 2022, we announced our new long-term ESG commitments, aligned with the Paris Agreement and focused on reducing the impacts of climate change. We adopted a new ESG Governance framework that is intended to enable Nexa to enhance our position in the industry and capture potential opportunities. Nexa’s eight long-term sustainability commitments, which we aim to achieve by 2030, are focused on four areas: emission reduction and neutrality; safety; water usage and disposal; and plurality.
Emission Reduction and Neutrality: Nexa has been reducing GHG emissions for more than a decade, and currently has one of the lowest carbon footprints in the world in the zinc production industry (scopes 1 and 2), according to the International Zinc Association (“IZA”). In alignment with the Paris Agreement, Nexa’s goal is to reach net zero by 2050. Our commitments in this category are:
| · | Absolute reduction of scope 1 emissions by 20% (52 thousand tons of CO2 equivalent), keeping Nexa’s electrical energy matrix almost entirely composed of renewable sources1 by 2030; |
| · | Reach net neutrality – the balance between carbon emissions and absorption – by 2040; and |
| · | Reach net-zero greenhouse gas emissions (“GHG”) by 2050. |
In order to reduce greenhouse gas emissions, Nexa is developing innovative projects in collaboration with different partners to improve its performance towards its decarbonization goals. For example, in 2023 we committed to reducing CO2 emissions by using natural gas to replace diesel fuel in vehicles that transport materials at mining sites in Peru. With this initiative, we expect to reduce approximately 23 tons of CO2 emitted by our vehicles annually. We also acquired 100 units of hydraGENTM equipment to be installed on diesel engines to increase the engines’ combustion efficiency, which is expected to reduce up to 3,200 tCO2eq annually. Furthermore, we obtained government authorization to use biofuel to replace fossil fuels, to be used in all 47 furnaces in the zinc oxide operation in Três Marias, which is expected to offset up to 24,700 tCO2eq annually. As of December 31, 2023, we have successfully utilized biofuel in 12 out of the 47 furnaces (offsetting 6,400 tCO2eq). As of now, we have the potential to replace 30% of the thermal capacity in our zinc recycling kiln, which would be expected to offset up to 25,600 tCO2eq. We also implemented the use of renewable energy at our Cajamarquilla smelter and have initiatives in place to expand the utilization of solar panels installed in deactivated tailings dams in Cajamarquilla.
1 98.8% electric energy from renewable sources in 2022.
| 104 |
Environmental, Social and Governance (ESG) |
In 2023, our energy matrix was mainly renewable, with renewable energy accounting for 95.5% of the matrix, emphasizing the company’s commitment to maintaining its electric energy matrix mainly from renewable sources.
In February 2024, we announced that the Carbon Disclosure Project concluded its 2023 evaluation for the year-ended 2022 and upgraded Nexa’s rating in the Climate Change Questionnaire from C to B, reflecting the efforts, disclosure, and transparency of Nexa related to ESG governance, strategy, risk management, metrics, and targets.
As of date of this filling, we are waiting for assurance related to our emissions inventory, which is currently undergoing the assurance process. While we anticipate an increase in scope 1 emissions in 2023 compared to 2022, we remain confident that we are on track to meet our 2030 targets. We expect disclosing this outcome during the first half of 2024 in Nexa’s Sustainability Report for the year-ended 2023.
Safety: Nexa seeks to be a model when it comes to safety, focusing on building a safer environment with zero fatalities and a reduction of severe accidents through a robust cultural transformation program in health and safety, including awareness campaigns, counseling, and monitoring for both employees and third parties. Our commitments in this category are:
| · | Zero fatalities in all operating units (annually); and |
| · | By 2030, consolidate all units in the first quartile of the mining industry with regard to the Total Recordable Injury Frequency Rate (“TRIFR”). |
In 2023, Nexa registered zero fatalities and its 2023 TRIFR final outcome positioned the Company in the industry’s second quartile based on 2022 benchmarks set by the International Council on Mining and Metals. As of the date of this annual report, Nexa registered one fatality in 2024.
During 2023, we continued to implement our G-MIRM project, which is focused on enhancing the culture of safety in Nexa’s operating units by providing training and discussing new safety procedures. This program follows a well-known methodology developed by the University of Queensland.
Water usage and disposal: Nexa prioritizes the responsible management of water and seeks to reduce its consumption by 2030. Our commitment in this category is:
| · | 10% reduction of consumption of water in mining operations (from 1.68 m³/ton of ROM2 to 1.51 m³/ton of ROM) and smelting operations (from 24.01 m³/ton of metal to 21.61 m³/ton of metal). |
In 2023, the average consumption of water in mining operations represented 1.97 m³/ton of ROM and 22.10 m³/ton of metal in smelting operations. The difference in mining operations consumption compared to our commitment baseline is due to the increase in water consumption in our Peruvian assets and in the Aripuanã mine.
Plurality (diversity, equity, and inclusion): Nexa is committed to being an increasingly plural company which emphasizes diversity, equity, and inclusion, to promote an environment of opportunity, recognition, and acceptance for all. Our commitments in this category are:
| · | 30% of women in the workforce by 2030; |
| · | 30% of women in leadership positions by 2030. |
As of December 31, 2023, our workforce was made up of 17.3% women, with 24.6% serving in leadership positions. The mine operations workforce at the Aripuanã mine in Brazil was made up of 23.7% women.
In 2022, alongside the announcement of our ESG commitments, we developed a dedicated website to provide our stakeholders and investors with greater transparency about our ESG initiatives: www.nexaresources.com/esg. Information contained on our website is not incorporated by reference into this report, and you should not consider it to be part of this report. Booklets and videos were also developed to expand the communication of ESG topics internally and externally throughout Nexa.
2 ROM (Run-of-mine): crude ore, extracted directly from the mine without undergoing any kind of processing.
| 105 |
Environmental, Social and Governance (ESG) |
On May 9, 2023, we published our 2022 sustainability report that highlights our ongoing commitment to corporate sustainability and socially responsible actions. The report discloses Nexa’s initiatives and achievements related to our business, employees and communities, and also discusses the strategy, risk and governance-related matters that we have implemented or are implementing to accelerate our ESG initiatives. The annual report follows the guidelines of the International Integrated Reporting Council (IIRC) and the Global Reporting Initiative (GRI), in addition to the guidelines of the Sustainability Accounting Standards Board (SASB) and recommendations of the Task Force on Climate-Related Financial Disclosure (TCFD). The information contained is submitted to external assurance.
In 2023, ESG targets were considered in senior leadership goals panels, as well as for employees who were eligible for variable compensation, representing 20% of the executive’s short-term incentives and 20% for other managerial or professional levels. Two components were adopted: (i) a corporate goal based on initiatives connected with key topics on the ESG Strategy; and (ii) specific goals that were unfolded according to the responsibilities of the area and the projects related to the theme to give a sense of responsibility to all employees on the subject.
Other ESG highlights for Nexa in 2023 include:
| · | Nexa was recognized as a leader in Social Governance and awarded “Company of the Year - Mining Sector 2023” by Brasil Mineral (a Brazilian magazine specializing in mining). This recognition was partly in acknowledgement of our training program in Aripuanã. The program trained 1,987 people, of whom 53% were women. Furthermore, 40% of program participants were placed back into the job market. It is estimated that more than 15% of the local population has benefited from this initiative, underscoring our commitment to being a collaborative force in regional development. |
| · | Our project Gente Cuidando das Águas (People Taking Care of Water), in Vazante, was the only Brazilian initiative presented among the 200 initiatives presented at the Regional Water Dialogue organized by the United Nations Economic Commission for Latin America and the Caribbean. The project aims to recover water sources in the Santa Catarina River basin by sealing off areas and activities related to environmental education in schools and surrounding communities. Since 2018, 154 springs have been protected. |
| · | Nexa partnered with Amazon Web Services with the goal of training 100,000 individuals in cloud computing fundamentals in Brazil and Peru by 2025, creating opportunities for skills development and nurturing local talents. |
| · | Nexa registered its carbon emissions on “LMEpassport”, a platform on the London Metal Exchange platform which promotes sustainability and transparency across the base metals sector. Nexa’s zinc production has one of the lowest carbon footprints recorded in the sector, with an emission intensity of 0.36 tons of CO2 equivalent (scopes 1 and 2) according to the GHG protocol methodology, an achievement that positions Nexa as a global leader in carbon reduction within the zinc industry. |
| · | Nexa announced the successful closing of a US$320 million sustainability-linked revolving credit facility. This new revolving credit facility, which remains undrawn, has a term of five years, and amounts drawn are subject to an initial interest rate of 1.60% plus Term SOFR. The applicable margin is subject to compliance with carbon reduction key performance indicators, reflecting the Company's unwavering commitment to reducing its carbon footprint. Such efforts are consistent with Nexa’s ESG ambitions, targeting net-zero greenhouse gas emissions by 2050, in alignment with the Paris Agreement. |
| · | Nexa obtained authorization from the Regional Superintendence for the Environment of the State of Minas Gerais to use biofuel to replace fossil fuels, used in all 47 furnaces in the zinc oxide operation in Três Marias. In 2023, we were able to replace the use of biofuel in 12 out of the 47 furnaces. This initiative supports our goal to reduce scope 1 CO2 emissions by 20% by 2030. |
| 106 |
Environmental, Social and Governance (ESG) |
| · | Nexa implemented the ON GRID solar system at our Cajamarquilla smelter, providing electric power from solar energy, resulting in a reduced footprint carbon emissions and promoting clean energy production. |
Nexa Materiality Matrix
The Nexa materiality matrix defines the issues that are most relevant to our business and our stakeholders, guiding how we plan and execute our ESG initiatives. We use this matrix to help inform our sustainability strategies and to ensure that our sustainability disclosures include the issues of most interest to our business and stakeholders in line with the principles established by the International Integrated Reporting Council (“IIRC”) and Global Reporting Initiative (“GRI”). In 2020, we updated our matrix to evaluate the most relevant topics for the mining and metals sector by incorporating the Sustainability Accounting Standards Board (“SASB”) guidelines for the mining and metals sector and other sector benchmarks.
In 2023, we concluded a 6-month materiality review process, focused on determining the most relevant topics to support our ESG practices and guide our reporting and management strategies. This process was conducted by a consultancy company, and we also gathered contributions from different stakeholders. The process consisted of 3 stages: (i) context and definitions, (ii) prioritization and (iii) results validation. In the prioritization stage, we conducted 27 interviews with directors, Board members, investors, sector representatives, team leaders, and others. We also conducted field work in 5 operating units (in Brazil and Peru), accessing 30 focal groups and 20 interviews with community representatives. Finally, we surveyed a wide range of stakeholders focusing on 11 different populations. Based on the results of this prioritization phase, we implemented a methodology to combine the results of these surveys with insights from our SCP committee and leadership teams to define the 8 most relevant material topics for us and our stakeholders.
Nexa’s current material topics support corporate goals and ESG management guidelines towards the following themes: dam, waste and tailings management, climate change, water resources management, social management, health, safety and well-being, plurality (formerly called diversity), innovation, governance and reputation. Nexa’s ESG long-term commitments are an important part of some of these topics, enhancing the Company’s commitment to a more sustainable operation.
Environmental
| · | Dam, waste and tailings management. We aim to reduce our residue footprint. Our activities generate a significant amount of waste. We seek to reduce the generation of mining and metallurgical waste, complying with applicable local legislation, and acting in accordance with our strategic commitment, attempting to co-create a positive legacy for society. Our Morro Agudo site is considered a pioneer in eliminating waste production with one of the main projects being agricultural lime powder, also known as Zincal200. The project is based on technology created to reprocess the tailings produced in the zinc beneficiation process, which used to be dumped in dams. In addition, our Cerro Lindo and Vazante mines already use the dry stacking method for tailings disposal and our Aripuanã mine has also begun its operation using this method. In 2023, we started testing the dry stacking process in Três Marias and we filtered 74.0% of the material from the operation by the end of 2023. Peru’s mining operating units have a significant volume of tailings disposed in the backfill system. Approximately, 25.9% of the tailings generated by Nexa were disposed of in dams in 2023, as compared to 31.8% in 2022. In August 2023, Nexa signed a partnership agreement with a local cement supplier to test and evaluate the feasibility of technological routes for Cajamarquilla’s dried neutral sludge to be used in the cement production chain, thereby reducing waste disposal. |
As tailings disposals are one of the main risks associated with mining activity, we constantly review our dam management policy, which goes beyond the requirements of the legislation of the jurisdictions in which we operate. We apply guidelines from the ICOLD to control, monitor and ensure the safety of our 24 active and 25 inactive disposal facilities (24 in Brazil and 24 in Peru) and one water storage dam at the Aripuanã unit. We also have 7 Golden Rules for Managing Dams and Tailings Sites, which are internal guidelines that we use to ensure the management of geotechnical structures and the safety of all employees and third parties. All of our projects are required to comply with these guidelines and any non-compliance must be analyzed by the audit team.
| 107 |
Environmental, Social and Governance (ESG) |
| · | Climate change. We are also committed to reducing greenhouse gas emissions to minimize our impact on climate change, contributing to a low-carbon economy. We consume large amounts of energy due to the nature of our activities and transportation processes, which is why we seek new technologies and progress in sustainable energy generation. Much of the electric energy consumed by our operations is from renewable and low emission sources, predominantly hydroelectricity. In 2020, we implemented a project for a biomass boiler at the Três Marias unit, in which fuel oil was substituted by eucalyptus wood chips and sugar cane bagasse, highlighting our commitment to energy efficiency. At the Juiz de Fora unit, we have an ongoing project to replace natural gas by reusing solid waste as fuel to generate steam. We remain committed to diminish our waste volumes and transforming them into secondary products, reducing the usage of our tailing dams. In 2022, we consolidated the use of tools for calculating GHG emissions following the GHG Protocol in all operating units and corporate areas, as well as progressed on mapping out its strategy with respect to measuring scope 3 emissions. In 2023, we committed to reducing emissions by using natural gas to replace diesel fuel in vehicles that transport materials at mining sites in Peru. Although 25% of the fleet of 20 trucks is already operating using natural gas, our goal is for our fleet to achieve 100% natural gas usage thereby reducing approximately 23 tons of CO2 emitted by our vehicles annually. In 2023 we also obtained authorization from the Regional Superintendence for the Environment of the State of Minas Gerais to use biofuel to replace the fossil fuels used in all furnaces in the zinc oxide operation in Três Marias. In 2023, we were able to use biofuel in 12 of the 47 furnaces. In our Cajamarquilla smelter, we implemented the ON GRID solar system, providing electric power from solar energy, resulting in a reduced carbon footprint and promoting clean energy production. We plan to expand the utilization of this solar system in the available locations of deactivated tailings dams in Cajamarquilla. |
| · | Water resources management. Our target is to reduce water consumption and increase recirculation. Mining activity involves technical procedures in which water assumes an important role, both for extraction and processing, making it even more important to reduce water use and increase reuse throughout the value chain. Advanced investments in efficient water recirculation programs contribute not only to lowering the intake of new water but also reducing the volume of effluents and the environmental impact of the discharge. In 2023, we have allocated approximately 22.0% of our environmental spending resources (as compared to 36.0% in 2022) towards efforts to keep our effluents disposed through proper treatment and to comply with the new dam legislation published in the year. In our Cerro Lindo mine, we have 92.2% of water recirculation. We use a desalination plant, extracting salt by a reverse osmosis process and pumping it up to a plant, at an altitude of 2,200 meters. In an area with scarcity of water resources, this technology is important to avoid competing with the local population in demand for water. In addition, we encourage and guide the community in the region to store rainwater. In February 2023, our project, Gente Cuidando das Águas (People Caring for the Waters), in Vazante, was the only Brazilian initiative selected among the 200 initiatives presented at the Regional Water Dialogue organized by the Economic Commission for Latin America and the Caribbean, of the United Nations. The project aims to recover water springs in the Santa Catarina River basin, through the fencing of areas and activities related to environmental education in schools and surrounding communities. Since 2018, 154 springs have been protected. |
Social
| · | Social development. We aim to develop mutually beneficial relationships with the communities in which we operate. The object of Nexa’s social strategy to leave a long-lasting relevant legacy for local communities (including rural producers, suppliers and local entrepreneurs) by contributing to the improvement of social indicators and the quality of life of the people living in the municipalities near our operations. In 2022, we re-prioritized our social management strategy with respect to investments, focusing on assertive and value-added projects, which demands a structured partnership with communities to minimize reputational risks and business impacts. As a result, global strategic themes were simplified to foster ongoing business development of Nexa and its host communities, as well as maintaining a social license to operate and co-creating a positive legacy. Four pillars were determined to guide the Company’s plan on social development: (i) Income Generation: to enhance local economic development through the qualification of local suppliers/entrepreneurs and rural producers; (ii) Water: to protect water springs and develop projects focused on revitalization, rainwater harvesting and/or water quality improvement; (iii) Education: to contribute to basic and technical education, aiming at improving the qualification of the local population for the job market, especially young people and adults; and (iv) Social License to Operate: to fulfill social and legal commitments to stakeholders, focused on mitigating impacts and obtaining social licenses to operate in the host communities. |
| 108 |
Environmental, Social and Governance (ESG) |
In addition, in 2023, we dedicated over 13,500 hours to volunteer action across our units, benefiting more than 11,500 people. Our focus in 2023 was to carry out volunteer work with greater social impact. In 2023, we partnered with Amazon Web Services with the goal of training 100,000 individuals in cloud computing fundamentals in Brazil and Peru by 2025, creating opportunities for skills development and fostering local talent. In Aripuanã, we have a qualification program for future mine and plant operating professionals In September 2023, Nexa was recognized as a leader in Social Governance and was awarded “Company of the Year-Mining Sector 2023” by Brasil Mineral in acknowledgment of our training program. The program trained 1,987 people, of whom 53% were women. 40% of the program participants were placed back into the job market and it is estimated that more than 15% of the local population has benefitted from this initiative.
| · | Health, safety and well-being. Our goal is to reduce our injury frequency rate and to reduce fatalities to zero. We continuously invest in strengthening a culture focused on safety and health for both our own as well as outsourced employees, through training, especially for risky activities, and in enhancing working conditions. In September 2023, we held our annual Safety Week to share insights and experiences to enhance our culture of safety and to strengthen our awareness of potential risks, promote healthy habits, and encourage safe behaviors. We launched a well-being program in 2021, seeking to emphasize the dimensions of integral health. We also have health initiatives in place for the Aripuanã project, aimed at disease prevention and a much healthier operating environment (i.e., Dust Zero Project). A prominent initiative within the well-being program is Go Nexa which encourages and helps employees monitor physical activities, healthy eating practices and hydration, and rewards users for healthy habits. Nexa also maintains ongoing initiatives related to disease prevention by providing periodic vaccinations for all employees. For further discussion of our safety records, please refer to “Health and safety compliance” in the following section. |
| · | Plurality. We target the increase of diversity in the workplace. Our personnel management model and our policies and tools have guided the development of people based on culture and performance, a focus on guaranteeing employee satisfaction, and the continuity and evolution of the business, in addition to generating an environment that fosters innovation and disruptive solutions. For further information please see “Corporate Governance, management and employees—Board of directors—Diversity” section. In 2021, we established a governance structure for the program to enhance diversity across Nexa. Affinity groups were created, which are formed by employees who are responsible for promoting diversity throughout the Company. These groups coordinate and implement initiatives to promote diversity in a transversal and uniform manner, generating greater impact in all units. |
In 2021, we received the Women on Board certificate, and we also signed the letter of adhesion and the 10 commitments of the LGBTI+ Business and Rights Forum. Additionally, we launched a talent program focused on the admission and training of diverse professionals with disabilities and/or special needs, and the program is ongoing to date.
In 2023, we focused our diversity initiatives on three main areas:
(i) the individual: we believe that an inclusive environment with emotional security encourages creativity, a sense of belonging, and innovation;
(ii) the company: we believe that plurality is a strategic pillar that expands the potential of our teams and multiplies the results of our business; and
| 109 |
Environmental, Social and Governance (ESG) |
(iii) the society: we believe that our practices and results contribute to society becoming increasingly ethical, humane, and equitable. Our diversity programming is becoming increasingly more robust and mature and has resulted in significant changes through the actions of affinity groups across the Company.
During 2022, held our first Plurality Week, which focused on fostering a deeper understanding of questions around diversity, inclusion and strengthening a culture of ethics and respect both within and outside the Company. We prepared a “Good Practices Guide” with online training modules to help all employees better understand and achieve these goals.
In 2023, Nexa Peru committed to RED (Red de Empresas y Discapacidad) to improve the employment and inclusion of professionals with disabilities, reaffirming our commitment to providing equal opportunities and promoting a diverse and inclusive organizational culture.
Governance
| · | Governance and reputation. Acting responsibly and transparently is one of our core values. We are committed to high standards of ethics and integrity across the entire company, which principles stated in our Code of Conduct and reflected in our Compliance Program. Our Board of directors is one of the main agents in promoting the program and ensuring compliance with our Code of Conduct, which is a public document shared with all stakeholders, including employees, suppliers, customers, communities, NGOs, government agencies, shareholders and other individuals and organizations with which we have a relationship. In 2021, we updated our Code of Conduct to include topics such as plurality and ESG practices, as well as adaptations to new laws, such as the general law of data. In 2022, Nexa continued to enhance its supplier assessment program to include reviews of ESG indicators and best practices and a new Code of Conduct for Suppliers was also launched in 2022. In 2023, we also launched the Code of Conduct for Customers. In 2023, as in previous years, we disseminated our Code of Conduct among all employees at a global level and started to disseminate the Code of Conduct for Suppliers with strategic vendors. In addition, in 2022, Nexa implemented the following initiatives, among others: (i) created committees against sexual harassment at the Brazilian units, based on those existing in our operations in Peru, and in 2023, this committee was implemented in Brazil’s corporate office, (ii) trained all units in Peru and Brazil on these topics, reinforcing Nexa’s commitment to zero tolerance for any harassment and discrimination, and (iii) appointed “Compliance Influencers”, employees at the units and corporate offices who will support Nexa’s culture and commitment to ethics and integrity. |
In addition, in 2022, we continued to assess the Company’s risks aimed at continuously improving our risk management and governance. We also updated the charters of each of our committees to include the responsibility of supporting the Board in monitoring enterprise risk management in matters related to the responsibilities of each committee. In 2022, we also conducted a review of the Related Party Transaction Policy and approved a new version. We also updated the Audit committee charter to incorporate new NYSE and SEC requirements, including obligations relating to related party transactions.
Regarding reputation we want to stand out from our competitors and be recognized as one of the leading players of the mining of the future, through sustainable production and by co-creating a legacy for society.
For further information on our Company's governance, see “Corporate governance, management and employees”.
Other
| · | Innovation. Enabling the strategic axes of growth and operational excellence makes our operations safer, minimizes waste and optimizes production. For seven years, we have managed a powerful tool for open innovation, the Mining Lab platform, which allows us to deliver projects in energy, circular economy, IT and automation, in Brazil and Peru. |
| 110 |
Environmental, Social and Governance (ESG) |
Nexa incorporates and develops innovative practices to extract the mineral resources necessary for its operations and works to continuously reduce the impact of its activities on the environment.
Health and safety compliance
Health and safety in the workplace are among our main values, and our policies and procedures seek to eliminate accidents. We are committed to protecting the health and wellbeing of our employees and contractors and have set standards to identify and assess health risks, manage their impact and monitor the health of our people. Nevertheless, mining is an activity that involves substantial risks. We established a Health and Safety Director Plan (“H&S Director Plan”) focused on the following objectives (i) eliminate fatalities; (ii) reduce the severity and number of accidents and illnesses; and (iii) raise the health, safety and well-being culture standards in our sites. The H&S Director Plan has facilitated the improvement of our health and safety culture and performance, and includes seven pillars of focus: (1) cultural transformation, (2) risk management, (3) emergency response systems, (4) health and safety management systems, (5) infrastructure systems, (6) restructuring of corporate guidelines, and (7) occupational hygiene and wellbeing management.
A main focus of the H&S Director Plan is cultural transformation. In 2022, we started training all leaders in the G-MIRM (“Global Minerals Industry Risk Management”) program. This program started at the University of Queensland (Australia) and currently involves several universities around the world. In Brazil, the representative is the University of São Paulo (USP). Throughout 2022 and 2023, Nexa’s leadership team had the opportunity to participate in this training provided by USP, seeking significant and lasting changes in decision-making at all hierarchical levels, and creating and improving risk management in companies in a sustainable and effective way. The main benefits of the program are: (i) awareness and early recognition at all levels of significant hazards and risks to the enterprise; (ii) development of internal competencies for the scope of a risk assessment and applying tools for comparison with good practice approaches; (iii) providing practical tools to improve risk management and advance security procedures; (iv) improved understanding of a personal commitment to safety and defining responsibilities for risk management leading to better decision-making processes; and (v) identification of new opportunities to strengthen internal security policies and procedures.
In 2023, we continued to reinforce the initiatives which have been set in the creation of the Master Plan in 2020, related to our health and safety culture, which are set to be implemented over a five-year term. Many of the initiatives, such as Global SIPAT (an internal week of discussion forums and seminars related to health and safety across our organization), Safety Workshops at all Nexa units and the PROA Movement (a year-end campaign by our safety department to promote prevention of work accidents), contribute to our enhanced safety culture.
In 2022, we reported three fatalities, two that occurred at the El Porvenir mine and one that occurred at the Cajamarquilla smelter. These incidents in El Porvenir are still under investigation by the Peruvian authorities and as of the date of this filing their work-related status has not yet been established. In 2023, there were zero fatalities within our operations. On March 2, 2024, we registered one fatality in our El Porvenir mine, which as of the date of this annual report is still under investigation.
We have also sought to improve our safety record as it relates to recordable injury frequency, lost worktime incident, and severity rates, in conformity with standards in the mining industry. In 2023, our total recordable injury frequency rate was 2.15 compared to 1.98 in 2022 and 1.92 in 2021. This rate is defined as the number of injuries with and without lost time per one million man-hours worked. In 2023, our lost worktime incident rate was 0.88 compared to 0.75 in 2022 and 0.60 in 2021. This rate is defined as the number of injuries with lost time per one million man-hours worked. Our severity rate for 2023 was 64 compared to 163 in 2022 and 24 in 2021. To calculate the severity rate, we consider the sum of lost, transported and debited days, divided by the total number of man-hours worked times one million. In addition to these efforts, we also operate programs aimed at improving working conditions, including medical services, for our mining operations and monitoring employees’ health.
| 111 |
Regulatory Matters |
Regulatory matters
We are subject to a wide range of governmental regulation in the jurisdictions in which we operate. The following discussion summarizes the kinds of regulation that have the most significant impact on our operations.
Brazilian regulatory framework
Mining rights and regulation of mining activities
Mining activities in Brazil are governed by the Brazilian Federal Constitution of 1988, the Brazilian Mining Code and other decrees, laws, ordinances and regulations, such as Decree nº 9.406/2018 which renewed the Consolidationregulation of DNPM (Departamento Nacional de Produção Mineral) Regulations.the Mining Code. These regulations impose several obligations on mining companies relating to, among other things, the way mineral deposits are exploited, the health and safety of workers and local communities where mines are located, and environmental protection and remediation measures. They also set forth the Brazilian federal government’s jurisdiction over, and scope of activities within, the industry. The MME and ANM regulate mining activities in Brazil. As of July 2017, the ANM replaced the DNPM,National Department of Mineral Production (“DNPM”), and is responsible for monitoring, analyzing and promoting the performance of the Brazilian mineral economy, granting rights related to the exploration and exploitation of mineral resources and other related activities in Brazil.
Under the Brazilian Federal Constitution, surface property rights are distinct from mineral rights, which belong exclusively to the Brazilian federal government, the sole entity responsible for governing mineral exploration and mining activity in Brazil.
Summary of Brazilian concessions
In Brazil, we hold 214 exploration authorizations, (autorizações de pesquisa),17 mining concessions, (concessões minerárias),eight mining concession requests (requerimento de lavra)applications, three rights to apply for mining concession and 41 exploration authorizations requests (requerimentos de pesquisa),authorization applications, which we broadly and collectively refer herein to as mineral rights, that cover a total area of 3,065,169.84767,289.8 hectares, of which: (i) 1,982,979.92500,331.5 hectares, or 64.7%65.2%, are exploration authorizations, (ii) 6,878.3710,725.4 hectares, or 0.2%1.4%, are mining concessions, (iii) 10,292.163,828.0 hectares, or 0.3%0.5%, are mining concession requests, andapplications, (iv) 1,065,019.392,261.5 hectares, or 34.7%0.3%, are rights to apply for mining concession and (v) 250,143.5 hectares, or 32.6%, remain as exploration authorization requestsapplications and are presently under initial geological reconnaissance.
In addition to Vazante and Morro Agudo, we hold a third mine concession in Fortaleza de Minas, where nickel production activities have been suspended since 2013 due to international market conditions. The price of nickel is not expected to recover to historical levels due to structural changes in supply, as low cost nickel pig-iron production has replaced a substantial share of traditional nickel sources.
The term of each of the mining concessions mentioned above is valid for the life of the mine, evaluated pursuant to the specific mining project. The exploration authorizations are for three years and are generally extendable upon request for another equal period; the exploration authorization requests, once approved by the ANM, are converted into exploration authorizations.
All our mineral rights in Brazil are in good standing. Maintaining our mineral rights in Brazil in good standing involves: (i) maintaining production on the mineral concessions and/or satisfying the ANM’s requirements if production has been suspended; (ii) developing exploration work and paying an annual property fee for the exploration authorizations; and (iii) complying with all the legal requirements, including not only as to mining, but also as to environmental and real estate requirements applicable to claiming a property with respect to exploration applications.
Failure to pay the applicable fees for any given year will result in us forfeiting our mineral rights. As of December 31, 2017,2023, we have paid all applicable royalties, taxes and fees on our mineral rights. Our mineral rights in Brazil that are not currently undergoing exploration or production will not expire unless we fail to timely pay the applicable royalties, taxes and fees, as well as the applicable penalties and meet the ANM’s and environmental authoritiesauthorities’ requirements, as applicable. See “Regulatory“Information on the Company—Regulatory matters—Brazilian regulatory framework—Royalties and other taxes on mining activities.”
The following table summarizes our mineral rights in Brazil.
Mineral Right | |||
Project | Titles | Area (hectares) | |
| Mines | Morro Agudo | 3 | 1,446.1 |
| Vazante | 10 | 2,174.5 | |
| Aripuanã | 1 | 3,639.9 | |
| Prospective Projects | Various | 269 | 760,029.3 |
| Total | 283 | 767,289.8 | |
| 112 |
Regulatory Matters |
|
|
|
| Mineral Rights |
| ||
|
| Project |
| Titles |
| Area (hectares) |
|
Mines |
| Morro Agudo / Ambrósia Trend |
| 6 |
| 4,028.13 |
|
|
| Vazante mine |
| 8 |
| 2,091.10 |
|
|
| Fortaleza de Minas mine |
| 1 |
| 1,000.00 |
|
Greenfield Projects |
| Aripuanã |
| 4 |
| 3,640.72 |
|
|
| Caçapava do Sul |
| 3 |
| 2,947.32 |
|
Prospective Projects |
| Various |
| 1,173 |
| 3,051,462.57 |
|
Total |
|
|
| 1,195 |
| 3,065,169.84 |
|
Exploration authorization and mining concession regimes
Exploration authorizations grant the rights to conduct exploration activities for a period from one to threefour years, which may be renewable for an additional period (and potentially additional renewals on a case-by-case basis). Exploration authorizations are granted on a first come, first serve basis, and the ANM will only grant one exploration authorization for any given area. Mining concessions are currently valid until the mineral deposit reserves are exhausted. Mining concessions may be transferred to eligible third parties with the ANM’s prior approval, pursuant to applicable legislation.
Decommissioning
In Brazil, enterprises dedicated to the exploitation of mineral resources shall submit a recovery plan to receive a mining concession. Accordingly, the environmental recovery of the degraded areas caused by mineral exploitation activities shall have been planned since their conception. According to Minas Gerais law, entrepreneurs must also submit to the environmental agency an environmental plan for closing two years before the planned mine closing.
On October 1, 2020, the Brazilian federal government issued law No. 14,066 which, among other provisions, amended the Brazilian Mining Code in order to explicitly state that all mine closure plans must be approved by the ANM as well as the environmental licensing agency. In addition, on April 30, 2021, the ANM published new rules regarding the Mine Closure Plan – PFM. We have been complying with legal requirements regarding mine closure plans and continue to comply with all regulatory and environmental requirements.
The state of Minas Gerais has also passed legislation on decommissioning plans for industrial activities. The Três Marias unit was the first metal production operation to prepare a decommissioning plan at the licensing stage, including the calculation of a financial provision. In the case of the Aripuanã and Caçapava do Sul greenfield projects, presentation of a decommissioning plan is one of the requirements for obtaining an environmental license.
Royalties and other taxes on mining activities
Revenues from mining activities are subject to CFEM (the Brazilian mining royalty, Compensação Financeira pela Exploração de Recursos Minerais (“CFEM”), which is paid to the ANM. CFEM is a monthly royalty based on the sales value of minerals, net ofgross revenue, excluding taxes levied on the respective sale.sale of minerals. When the produced minerals are used in its internal industrial processes, CFEM is determined based on deducting the costs incurred to produce them. CFEM is determined by a reference price of the respective mineral to be defined by the ANM. The applicable rate varies according to the mineral product (currently 2.0% for zinc, lead, copper and silver). In addition, we are required to make certain fee payments for exploration authorizations known as the Annual Fee per Hectare (Taxa AnualI por Hectare). There is also a monthly inspection fee related to the transfer and commercialization of certain minerals in some Brazilian states, such as Minas Gerais and Mato Grosso, where the concessions are located.
In 2019, the State of Minas Gerais ratified a tax benefit that suspended the VAT on the commercialization of several products, including metallic zinc for companies incorporated in the State. There are no formal requirements to obtain the benefit (such as demonstrating that the legal entity is the company actually industrializing the zinc), however the existence of the tax benefit has resulted in increased scrutiny by the tax authorities in the State. We are currently collaborating with all the requested information by the tax authorities in this process of reviewing the commercialization of our products throughout the zinc value chain. In case the buyer does not comply with the VAT deferred regulation, Nexa may be subject to (i) subsidiary liability (pursuant to art. 57, IN, RICMS/MG); or (ii) joint liability (pursuant to art. 124, I of National Tax Code and art. 56, XI, RICMS/MG). For additional information, see “Risk Factors—Changes in tax laws may increase our tax burden and, as a result, could adversely affect our business, financial position and results of operations.”
In December 2022, a new tax on mining operations (the “TRFM”) was approved in the State of Mato Grosso, where the Aripuanã project is located. The regulation came into force in April 2023. The Brazilian Supreme Court held that the tax was unconstitutional in December 2023. However, the state of Mato Grosso approved a new tax to replace the tax that the Court deemed unconstitutional. The new TFRM will be collected according to the nature of the extracted ore. Similar taxes on mining operations have been implemented in other Brazilian states, such as the state of Minas Gerais.
| 113 |
Regulatory Matters |
Environmental regulations
We are subject to several environmental regulations related to, among other matters, water resources, caves, waste management, contaminated areas, areas of permeantpermanent preservation, and conservation of protected areas.areas and environmental recovery policies. For more information on environmental recovery policies that Nexa is subject to, see “Information on the Company—Mining operations—Tailings disposal.” Specifically, we have taken the following actions with regard toregarding contaminated areas and areas of permanent preservation:
Contaminated areas. We have carried out environmental assessments on our operation units to verify the existence of contamination in groundwater and soil. The assessments prepared for the Brazilian units identified
deviations in soil, groundwater and surface water quality standards. We are committed to improving the management of areas identified as contaminated. For most of the identified deviations, we developed a robust remediation plan in order to comply with all legal requirements. We recorded provisions in our consolidated financial statements in respect of any potential liabilities associated with these deviations from applicable standards. See “Operating and financial review and prospects—Overview—Key factors affecting our business and results of operations—Environmental expenses.” We continue to conduct similar assessments with respect to the Peruvian operating units.
Areas of permanent preservation. Permanent Preservation Areas (Áreas de Preservação Permanente, or APP) are areas that, because of their importance for preserving water resources, geological stability, biodiversity protection and erosion control, receive special legal protection. The existence of such protected areas within a property, whether in urban or rural locations, may cause restrictions to the performance of the intended activities. Interference or removal of APP vegetation is only allowed in cases of public utility (such as mining activities), social interest or low environmental impact, if there is a prior authorization from the applicable environmental authorities. Most of our properties in the state of Minas Gerais interfere in APPs in some way.way, however all are authorized by environmental agencies. For such properties, we have either already established an advanced ongoing regularization process or have started the process for other properties. The regularization process includes the implementation of rigid controls over the properties.
Environmental licenses
The Brazilian Federal Constitution grants federal, state and municipal governments the authority to issue environmental protection laws and to publish regulations based on those laws. While the Brazilian federal government has authority to issue environmental regulations setting general standards for environmental protection, state governments have the authority to issue stricter environmental regulations. Municipal governments may only issue regulations regarding matters of local interest or as a supplement to federal or state laws.
Under Brazilian law, the construction, installation, expansion and operation of any establishment or activity that uses environmental resources, or is deemed to be actually or potentially polluting, as well as those capable of causing any kind of environmental degradation, is subject to a prior licensing process.
Notably, in addition to the general guidelines set by the Brazilian federal government, each state is legally competent to promulgate specific regulations governing environmental licensing procedures under its jurisdiction. Depending on the level of environmental impact caused by the exploratory activity,exploration/exploitation activities, the procedures for obtaining an environmental license may require assessment of the environmental impact and public hearings, which may considerably increase the complexity and duration of the licensing process and expose the exploratory activityexploration/exploitation activities to potential legal claims.
Environmental liability
Environmental liability may be determined by civil, administrative and criminal courts, with the application of administrative and criminal sanctions, in addition to the obligation to redress the damages caused. All our operating units, except for Cerro Lindo, have obtained certification under the ISO 14001 standard.
Regulation of other activities
In addition to mining and environmental regulation, we must abide by regulations related to, among other things, the use of explosives and fuel storage. We are also subject to more general legislation on labor, occupational health and safety, and support of communities near mines, among other matters.
| 114 |
Regulatory Matters |
Peruvian regulatory framework
Mining rights and regulation of mining activities
In Peru, surface land is owned by private landowners, while the government retains ownership of all subsurface land and mineral resources. The Natural Resources chapter of the Peruvian Constitution, enacted in 1993, states that mineral resources are the property of the Nation, and the Peruvian State is sovereign in their administration. The Peruvian government may establish by law the conditions for granting exploitation rights and titles to individuals and legal entities.
The General Mining Law (Texto Único Ordenado de la Ley General de Minería) is the primary law governing both metallic and non-metallic mining activities in Peru and is complemented by other regulations approved by the MINEM. Under the General Mining Law, mining activities such as exploration, exploitation, mining labor, beneficiation and mining transport (except storage, reconnaissance,sampling, prospecting and trade) are carried out exclusively by means of concessions.concessions granted by the Peruvian State. The DGM (Dirección General de Minería (“DGM”) is the regulatory body of the
MINEM responsible for proposing and evaluating regulations in the Peruvian mining sector as well as authorizing the commencement of mining activities in Peru.
A mining concession allows its holder to carry out exploration and exploitation activities within the area established in the respective concession title, provided that prior to the beginning of any mining activity, such concession title is granted by the INGEMMET (Instituto Geológico, Minero y Metalúrgico(“INGEMMET”) and other applicable administrative authorizations are obtained (e.g., mining, environmental, use of water, use of explosives, impact on indigenous communities, etc.). A concession provides its titleholder with the exclusive right to undertake mineral exploration and mining activity within a determined area but does not grant the titleholder the right to own the surface land where the concession is located. Therefore, for the holder of a mining concession to develop exploration and/or exploitation works, the latter has tomust purchase the corresponding surface land from the owners, reach an agreement with their owners for its temporary use or obtain the imposition of a legal easement by the MINEM, which is rarely granted. There are special proceedings for purchasing or acquiring temporary rights over barren lands owned by the state.
Mining concessions are irrevocable, provided the holder of a mining concession complies with the obligations set forth in the General Mining Law and applicable regulations. Such concessions have an indefinite term, subject to payment of an annual validity fee per hectare granted and achievement of minimum annual production for each hectare, or payment of a production penalty when applicable. Failure to achieve annual production targets will result in a penalty. Failure to pay annual validity fees or production penalties for two consecutive years in any mining concession will result in the cancellation of such mining concession. Failure to satisfy minimum annual production thresholds for a specified period of time (currently thirty years beginning the year after the mining concessions were granted for mining concessions granted after October 10, 2008, and thirty years beginning on January 1, 2009 for mining concessions granted before October 10, 2008) could result in cancellation of the mining concessions.
Summary of Peruvian concessions
In Peru, we hold, through Nexa Peru and its subsidiaries, 844815 mining and exploration concessions, which cover a total area of over 361,521.43345,921.3 hectares and 60 mineral claims totaling 44,352.2 hectares. Of our mines in Peru, the Atacocha mine property includes 147 mining concessions that cover an area of 2,872.512,872.5 hectares and one beneficiation concession, the El Porvenir mine property includes 25 mining concessions that cover an area of 4,850.794,846.7 hectares and one beneficiation concession, the Cerro Lindo mine has 4368 mining concessions three mining claims and one beneficiation concession that cover an area of 26,677.4843,827.8 hectares and one beneficiation concession and the inactive Chapi mine property includes 32 mining concessions that cover an area of 4,625.56 hectares.4,625.6 hectares and one beneficiation concession. In addition, we have 219225 mineral rights concessions for greenfield projects in Peru that cover a total area of 81,177.4282,596.8 hectares. Our prospective projects include 378318 mining concessions that cover an area of 241,317.68207,152.0 hectares.
All our mining and processing concessions in Peru are in good standing. Maintaining our concessions in Peru in good standing involves, among other requirements, (i) paying the annual validity fee and production penalties (when applicable) for mining concessions with no production or with no effective exploration or (ii) paying the annual validity fee and complying with minimum production or investment requirements established in mining law.
| 115 |
Regulatory Matters |
Failure to pay such validity fees or production penalties (when applicable) for two consecutive years results in the cancellation of the respective mining concessions or benefitbeneficiation concessions granted by the Peruvian government. Our mining and benefitbeneficiation concessions will not expire unless we do not timely comply in paying these fees or complying with the minimum production or investment requirements as required by law in respect of such rights and depending on the applicable regime.
The following table summarizes our mining concessions in Peru.Peru:
Concessions | |||
Project | Titles | Area (hectares) | |
| Mines | Atacocha | 147 | 2,872.5 |
| El Porvenir | 25 | 4,846.7 | |
| Cerro Lindo | 68 | 43,827.8 | |
| Chapi (inactive) | 32 | 4,625.6 | |
| Greenfield Projects | Florida Canyon Zinc | 13 | 10,700.0 |
| Hilarión | 72 | 15,841.2 | |
| Magistral | 36 | 16,254.2 | |
| Prospective Projects | Various | 422 | 246,953.4 |
| Total | 815 | 345,921.3 | |
|
|
|
| Concessions |
| ||
|
| Project |
| Titles |
| Area (hectares) |
|
Mines |
| Atacocha mine |
| 147 |
| 2,872.51 |
|
|
| El Porvenir mine |
| 25 |
| 4,850.79 |
|
|
| Cerro Lindo mine |
| 43 |
| 26,677.48 |
|
|
| Chapi mine (inactive) |
| 32 |
| 4,625.56 |
|
Greenfield Projects |
| Florida Canyon Zinc |
| 16 |
| 12,600.00 |
|
|
| Chapi Greenfield |
| 14 |
| 5,706.67 |
|
|
| Hilarión |
| 69 |
| 14,710.77 |
|
|
| Magistral |
| 34 |
| 14,340.29 |
|
|
| Pukaqaqa |
| 34 |
| 11,125.87 |
|
|
| Shalipayco |
| 52 |
| 22,693.93 |
|
Prospective Projects |
| Various |
| 378 |
| 241,317.68 |
|
Total |
|
|
| 844 |
| 361,521.43 |
|
Exploration and authorization and mining concession regimes
Mining concessions are granted for an indefinite term, though dependent on the fulfillment of certain legal obligations. The commencement and re-commencement of exploration and/or exploitation mining activities are subject to the prior obtainment of an authorization for the commencement of activities before the DGM.
Such authorizations could be subject to a prior consultation procedure with indigenous communities, carried out by MINEM, if mining activities were to impact said communities’ collective rights and territories as determined by the Ministry of Culture.
As of December 31, 2017,2023, we primarily owned metallic mining concessions with respect to zinc, copper, silver and lead. Substantially all of Nexa Peru’s concessions were granted prior to 2008. Our mining rights and concessions are in full force and effect under applicable Peruvian laws. We believe that we are in compliancecomply in all material respects with the terms and requirements applicable to our mining rights and concessions.
Decommissioning
Decommissioning
TitleholdersTitle holders of mining exploitation and beneficiation activities, and, in some cases, of exploration activities require the prior approval of a mine closure plan, which includes the environmental rehabilitation, restoration and remediation measures that shall be executed along with the mining operations and until its closure. Once the corresponding mine closure plan is approved, an environmentala guarantee (usually a bank performance bond) must be granted in favor of the MINEM to back up the environmental costs associated with the execution of the mine closure plan. Mining exploitation and beneficiation activities may only be initiated once the mine closure plan is approved, and the corresponding environmental guarantee is duly submitted before the competent authority. The referred guarantee is renewed yearly. If the titleholder of an ongoing mining operation fails to comply with this obligation, the MINEM is entitled to suspend the execution of such mining operation. For additional information, see “Risk Factors—Political, economic, social and regulatory risks—Our mineral rights may be terminated or not renewed by governmental authorities”.
Royalties and other taxes on mining activities
Holders of mining concessions are required to pay a mining royalty (regalía minera) to the Peruvian government for the exploitation of metallic and non-metallic resources. The amount of the royalty is now payable on a quarterly basis and is equal to the greater of (i) an amount determined in accordance with a statutory scale of marginal tax rates from 1.0% to 12.0% based on a company operating profitincome margin and applied to thethat company’s operating profitincome and (ii) 1.0% of a company’s net sales, in each case during the applicable quarter. We are also required to pay annual fees (derecho de vigencia) for our mining concessions and, in some cases, mining production penalties for not timely reaching the minimum production levels set by Peruvian mining law.
| 116 |
Regulatory Matters |
Holders of mining concessions are also required to pay a Special Mining Tax (Impuesto Especial a la Minería) to the Peruvian government. The Special Mining Tax is payable on a quarterly basis and is calculated based on the operating profitincome derived exclusively from the sale of metallic resources, with marginal rates between 2.0% and 8.4%.
Holders of mining concessions that are subject to administrative legal stability (in force as of the effective date) under an Agreement of Guarantees and Measures for Investment Protection entered into with the MINEM and Mining shall enter into an agreement with the Peruvian government for the payment of a Special Charge on Mining (Gravamen Especial a la MinerialMinería, or “GEM”). The Special Charge on MiningGEM is payable on a quarterly basis and is calculated based on the operating profitincome derived exclusively from the sale of metallic resources, with marginal rates between 4.00% and 13.12%.
Tax stability agreements
On March 26 of 2002, Nexa Peru entered into an Agreement of Guarantees and Measures for Investment Protection with the MINEM with respect to our Cerro Lindo unit. Pursuant to section 9 of said Agreement, until December 31, of 2021, certain guarantees will benefitand benefits were available with respect to operations of the Cerro Lindo unit including, among others, free commercialization of the products proceeding from such unit, free disposition of the currencies generated from the export of the products proceeding from such unit, the right to use the global depreciation rate applicable on the fixed assets relating to the Cerro Lindo unit up to 20.0% per year, the right to keep the accounting corresponding to the Cerro Lindo unit in U.S. dollars, and tax stability. The tax stability agreement expired on December 31, 2021. As of January 2022, Nexa Peru is required to pay taxes at statutory rates to the Peruvian government. As of the date of this report, there is an ongoing dispute between Nexa and Peruvian tax authorities in respect of the applicability of such agreement. For more information, see “Risk Factors—Changes in tax laws may increase our tax burden and, as a result, could adversely affect our business, financial position and results of operations” and “Additional Information—Legal Proceedings—Other legal proceedings.”
Municipal permits
The regularization process for Nexa CJM’s administrative offices and construction permits was fully completed on September 22, 2017.
Moreover, Nexa CJM identifiedUnder the absence of a municipal license for the operation of its water catchment plantGeneral Mining Law, all Peruvian mines located in Carapongo. Although no issues have arisen due to the lack of this license during the years in which the plant has operated, Nexa CJM has initiated procedures to obtain the license.rural areas such as Cerro Lindo, Atacocha, El Porvenir and Chapi are exempted from paying municipal taxes and obtaining municipal permits.
Environmental regulations
The development of economic activities in the Peruvian territory, such as those related to the mining industry, are subject to a broad range of general environmental laws and regulations related to the generation, storage, handling, use, disposal and transportation of hazardous and controlled materials; the emission and discharge of hazardous materials into the ground, air or water; and the protection of migratory birds and endangered and threatened species and plants. These regulations also set environmental quality standards for noise, water, air and soil, which shall be considered for the preparation, assessment and approval of the corresponding environmental management instrument.instrument, granted by the National Service for Environmental Certification of Sustainable Investments (“SENACE”) for exploitation and beneficiation activities, or the MINEM for exploration activities.
The Ministry of Environment and other administrative entities, such as the DGAAM (Dirección General de Asuntos Ambientales Mineros (“DGAAM”), have the authority to enact regulations related to environmental matters. Additionally, the Environmental Supervision Agency (Organismo de Evaluación y Fiscalización Ambiental, or OEFA)“OEFA”), is the competent authority in charge of regulating, supervising and imposing sanctions on mining companies upon non-compliance of applicable environmental legislation. In addition, there are other competent governmental agencies or authorities on specific environmental matters such as water, forestry resources, protected natural areas and aquatic environment that regulate, authorize and supervise environmental compliance and liability.
On November 23, 2023, Supreme Decree No. 028-2023-EM was enacted, amending the Regulations for Environmental Protection in Mining Exploration Activities in order to allow the simultaneous processing of various enabling permits related to water resources, such as water use authorizations or discharge permits, alongside the evaluation procedure for the respective environmental management instrument.
| 117 |
Regulatory Matters |
Additionally, on November 25, 2023, Supreme Decree No. 031-2023-EM was enacted, approving the law that specifies the mandatory environmental protection measures in the transportation and final disposal of tailings and the corresponding environmental management instruments for mining operations.
In addition, as of the date of this filing, a revision process was initiated by the Peruvian Congress of a law to prohibit economic activities in the headwaters of basins, which are considered vulnerable areas that require protection and mitigation measures. However, the revision process lost momentum and has shown no sign of progress to date. If adopted, this law could have a material impact on our business and projects in case any new projects were to occur in headwaters of basins.
Environmental permit regularization processes
Supreme Decree 040-2014-EM provided special procedures allowing us to acquire environmental and operational permits for mining operations and to regularize the mining of certain areas within the Cerro Lindo and Atacocha mines and to regularizemines. These regularization procedures, however, are independent from any sanctioning administrative procedure that the OEFA may initiate in connection with the construction and operation of certain mining components in Nexa CJM’s “Poza de Lodos Neutros” and “Poza No. 5,” which lackedthe first place without the corresponding mining and environmental permits. With respect
Similarly, Supreme Decree 013-2019-EM allowed for further regularization procedures to be carried out as of January 6, 2020, which will also allow us to acquire environmental and operational permits for infrastructure and mining areas in the Cerro Lindo, this permitAtacocha, El Porvenir and Chapi mines. The regularization processprocedure for Cerro Lindo was fully completed on July 5, 2017. With respectdenied due to an unfavorable opinion by the National Water Authority, yet proper procedure was not followed for which we have taken judicial measures to appeal the denial. Atacocha’s procedure was carried out to completion while the El Porvenir regularization procedure is currently underway. The Chapi mine procedure did not fall through and the areas subject to the Atacochaprocedure must follow the standard mine on December 18, 2017, we completed the permit regularization with respect to the areas that will be exploited. With respect to Nexa CJM’s “Poza de Lodos Neutros,” the regularization process has concluded and, therefore, this component currently has sufficient environmental and mining permits in place. With respect to Nexa CJM’s “Poza No. 5,” the regularization process is still to be completed with respect to the mining permits.closure regulations.
Regulation of other activities
In addition to mining and environmental regulation, we must abide by regulations related to, among other activities, the use of explosives, fuel storage, controlled substances, telecommunications, archeological remains, and electricityenergy concessions. We are also subject to more general legislation on labor, occupational health and safety, and peasant and indigenous communities, among others.
II.OPERATING AND FINANCIAL REVIEW AND PROSPECTS With respect to labor regulations, the Peruvian government enacted Supreme Decree 001-2022-TR in February 2022, establishing a series of measures to eliminate the outsourcing of a company’s “core business” activities, which are defined as the main activities of a company, such as any activities that differentiate and identify it within the market, generate the most income for the company or add the most value for the company’s customers. In July 2023, the law was deemed to be unconstitutional because it was determined to be an unenforceable bureaucratic barrier by INDECOPI, and therefore is not expected to have any material impact on Nexa. In addition, a lawsuit was initiated by Nexa which is seeking to declare the unconstitutionality of the aforementioned law. For additional information, see “Risk Factors—Operational risks—We may be liable for certain payments to individuals employed by third party contractors” and “Risk Factors—Operational risks—The nature of our business includes risks related to litigation and administrative proceedings that could materially adversely affect our business and financial performance in the event of unfavorable rulings.”
OVERVIEWRegarding occupational health and safety regulations, on December 30, 2023, Supreme Decree No. 034-2023-EM was enacted, amending the Regulation of Occupational Safety and Health in Mining approved by Supreme Decree No. 024-2016-EM. Among the key modifications made are the inclusion of parameters for the development of geo-mechanical, hydrogeological, seismicity, and stability studies; the elaboration of a monthly report on geotechnical supervision of tailings deposits, pads, leaching heaps, and waste rock deposits; changes regarding which entity should receive the preliminary report on hazardous incidents or fatal accidents; as well as the addition of a chapter on tailings deposit management which includes parameters for the development of a geotechnical monitoring and control program, a risk analysis and assessment, a management plan, among others. A period of 180 calendar days has been granted for mining activity holders to adapt and comply with the new obligations incorporated by the amendment.
| 118 |
Overview |
| II. | Operating and financial review and prospects |
Overview
Executive summary
During 2017, we faced operational challenges dueThe following is an overview of 2023, compared to unusually heavy rains2022. For an overview of 2022 compared to 2021, please refer to “Operating and floods in Peru during the first half of the year, internal adjustments to procedures intended to improve safety standardsfinancial review and prospects” in our mines and lower zinc grades. These factors contributed to a 6.9% reduction in our mine production, from 615.1 thousand tonnes of zinc equivalent production in 2016 to 572.4 thousand tonnes in 2017, and a 2.7% reduction in metal sales in our smelting operations, from 610.0 thousand tonnes in 2016 to 594.0 thousand tonnes in 2017.
In 2017, our revenues were 25.0% higher compared to 2016, reaching US$2,450.0 million, driven by positive base metals prices. In 2017, adjusted EBITDA was US$668.0 million, a 65.0% increase compared to 2016, primarily resulting from an increase in base metals prices combined with disciplined cost management.
Our investments totaled US$197.6 million in 2017, a US$14.7 million increase compared to 2016, which aligns with our growth strategy. In 2017, our primary focus was the mine life extension of Vazante, which aims to extend the life of the mine to 2029. We spent US$30.0 millionAnnual Report on the endeavor in 2017.
In October 2017, we successfully reached an important milestone: the initial public offering of our common shares, which are dual-listed on the New York Stock Exchange and the Toronto Stock Exchange. We raised US$312.0 million, net of fees, in the initial public offering, which will help us implement our growth plan while maintaining a healthy capital structure. We also issued a 10-year US$700.0 million bond in May 2017, reaffirming our disciplined approach to our capital structure to fund key projects. As of andForm 20-F for the year ended December 31, 2017,2022, filed with the SEC on March 20, 2023, as amended by our Annual Report on Form 20-F/A, filed with the SEC on October 27, 2023. During 2023, we safely operated our assets and delivered a solid operational performance.
In 2023, we had net revenues of US$2,573.2 million, a 15.2% decrease from 2022, mainly due to lower zinc and copper prices and lower smelting sales volume, which was partially offset by higher mining production volumes. We also had net loss of US$289.2 million, a US$365.6 million decrease as compared to 2022, as a result of the decrease in operating income, mainly due to the aforementioned reasons.
Despite rising inflation, high interest rates, aggressive monetary policy tightening, increasing commodity price volatility, and social and political instability, including the ongoing conflict in Russia-Ukraine and the Israel-Hamas conflict, supported by a solid operational performance, we delivered an Adjusted EBITDA of US$391.2 million in 2023, down 48.6% compared to 2022, negatively impacted by the decline in base metal prices, especially the strong decline in zinc prices, and lower smelting sales volume. We use Adjusted EBITDA as an additional measure of operational performance of the Company’s business (used in addition to, and not as substitute for, net income) without the impact of (i) share in the results of associates, depreciation, amortization, net financial results and income taxes, (ii) non-cash events and non-cash gains or losses that do not specifically reflect our operational performance for the specific period, and (iii) the impact of pre-operating and ramp-up expenses incurred during the commissioning and ramp-up phases of greenfield projects (currently, Aripuanã). For a discussion of our Adjusted EBITDA, reconciliation with most comparable IFRS Accounting Standards figures and changes made in 2023, see “Operating and financial review and prospects—Results of operations—Non-IFRS Accounting Standards measures and reconciliation.”
We measure our liquidity by cash flows. For a description of our cash flows, see “Operating and financial review and prospects—Liquidity and Capital Resources—Source of funds.”
Although we believe we are well-positioned, benefitting from our unique position in Latin America, in addition to the strong fundamentals of our business in the long-term, with flagship assets and a strong balance sheet, it is anticipated that challenges such as difficult macroeconomic conditions are likely to continue in 2024, which may affect our operations.
In January and June 2023, as well as in February 2024, protest activities by local communities in Peru temporarily suspended operations at Atacocha. In each of these instances, Nexa complied with all existing agreements, pursued an active dialogue with the communities and authorities, and remained committed to the social development of all its host communities. During the protests, mining activities were limited to critical operations with a minimal workforce to ensure appropriate maintenance, safety, and security. Even though production was temporally suspended during these periods, we were able to operate at high levels of capacity utilization rates throughout the year, but zinc production in Atacocha decreased by 14.2% compared to 2022. There was no material impact of these temporary suspensions, and the Company achieved its full consolidated production guidance for all metals in 2023.
In March 2023, production at the Cerro Lindo mine was suspended due to heavy rainfall levels and overflowing rivers caused by cyclone Yaku, resulting in the partial flooding of some lower levels of the mine. In April 2023, Cerro Lindo resumed its operations, and road access was restored. During the temporary suspension, Nexa remained focused on the security and reparation of the mine and took measures to ensure the safety and well-being of its employees, contractors and host communities. Despite the temporary suspension of the mine, there was no material impact on 2023 production, with Cerro Lindo achieving the upper range of our 2023 production guidance for all metals.
| 119 |
Overview |
Aripuanã’s ramp-up activities began in July 2022, and the mine remained in the ramp-up phase throughout 2023. In 3Q23, Aripuanã’s guidance production range was revised downwards for the year, as a result of design limitations in the capacity of the flotation pumping system, identified during the detection of bottlenecks, which required resizing and updating certain plant processing facilities and systems, as well as the clean-up and upgrading of water treatment facilities. In 4Q23, we achieved an average of 61% capacity utilization level and we expect to reach nameplate capacity in mid-2024. The mine is fully operational, and underground activities in 2023 were focused on developing and preparing areas for a ramp-up in mining operations, commissioning the paste back-fill plant and transitioning out a mine development contractor. Our priority in 2023 was, and for the first half of 2024 is to continue improving metal recovery and concentrate quality and grades, aiming to achieve a stable operation. At the end of February 2024, the average capacity utilization rate was around 61%, maintaining similar levels as in 4Q23, given the usual rainy season period in the region, which impacted our dry disposal capacity. However, during this period the operational focus was to maintain concentrate quality and grades, as well as the metallurgical recovery rates.
Regarding our exploration activities, in 2023 we continued to focus our investments on projects around the mines we operate. We believe that our exploration program and disciplined approach on project evaluation, will contribute to replace and increase mineral reserves and resources of our current assets, and define the materiality of exploration stage projects. We will continue to seek new regional targets to identify prospective areas and define materiality for new projects.
In terms of our brownfield projects, our objective is to extend the life of mine, therefore, most of the mineral exploration budget in 2023 was allocated to drilling activities in these projects, with emphasis on Cerro Lindo, Vazante and Aripuanã. In terms of greenfield projects, we direct continuous efforts to define the expansion of the known mineralization and identify new mineralized zones in regional prospective trends, with emphasis on Hilarión and Namibia, as well as focusing on expanding the mineral inventory of Aripuanã.
Our 2023 financial results were affected by factors including: (i) lower LME metal prices, especially zinc; (ii) higher operational costs mainly in Aripuanã during the ramp-up phase related to concentrate and stockpile costs; (iii) lower zinc metal and oxide sales volumes; (iv) lower by-products contribution; and (v) the negative impact of FX variation.
In 2023, we had an 8.2% increase in our zinc equivalent (mine production), from 564.7 thousand tonnes in 2022 to 611.1 thousand tonnes in 2023, mainly driven by the increase in production for all metals, specifically zinc and lead production increasing by 12.4% and 13.5%, respectively, mainly due to the increase in production at Aripuanã. Our total zinc metal (metallic zinc and zinc oxide) sales decreased by 4.3% in our smelting operations, from 616.2 thousand tonnes in 2022 to 589.8 thousand tonnes in 2023.
In 2023, our net debtrevenues were 15.2% lower compared to adjusted EBITDA ratio2022, reaching US$2,573.2 million, primarily driven by lower LME zinc and copper prices and lower smelting sales volume, which was 0.34x.partially offset by higher zinc mining production. See “Overview—Results of operations—Net revenues” for more information.
Our capital expenditures totaled US$309.0 million in 2023, a 18.9% decrease compared to 2022, mainly due to the decrease in expansion investments with the conclusion of construction at Aripuanã. In 2023, 94.7% of our capital expenditures was allocated to sustaining investments, including US$79.4 million invested in the Aripuanã mine.
Outlook
In 2018,2024, we estimate that we will produce (i) between 370.0323.0 thousand tonnes and 390.0381.0 thousand tonnes of zinc contained in concentrate;concentrate, (ii) between 55.030.0 thousand tonnes and 60.035.0 thousand tonnes of copper contained in concentrate, (iii) between 66.0 thousand tonnes and 82.0 thousand tonnes of lead contained in concentrate;concentrate and (iv) between 39.0 thousand tonnes and 42.0 thousand tonnes of copper contained in concentrate; between 7,600 thousand11.0 million ounces to 8,000 thousand13.0 million ounces of silver contained in concentrate; and between 17.0 thousand ounces and 19.0 thousand ounces of gold contained in concentrate. These estimates assume, among other things: (i) an increase in total treated ore by more than 6.0%; (ii) lower grades, particularly in Cerro Lindo mine, that are in line with expectations; and (iii) planned operational dilution reduction in Vazante mine.
In 2018,2024, zinc production at the mid-range of the guidance is estimated to increase 5.6% over 2023 (18.6kt) mainly driven by the Aripuanã mine. For 2025 and 2026, zinc production is estimated to be similar over 2024. For the forecasted period, zinc head grade is expected to be in the range of 2.86% and 3.18%, copper head grade is expected to be in the range of 0.26% and 0.32% and lead head grade is expected to be in the range of 0.67% and 0.77%.
| 120 |
Overview |
In 2024, we expect to sell between 560.0545.0 thousand tonnes and 580.0565.0 thousand tonnes of metallic zinc product volume;volume and between 37.035.0 thousand tonnes and 39.040.0 thousand tonnes of zinc oxide product volume.
Metal sales volume at the midpoint of the guidance range of 580.0 to 605.0 thousand tonnes in 2024 is estimated to be similar compared to 2023, as these estimates do not assume the resale of material from third parties. For 2025 and 2026, metal sales volume is forecasted to remain unchanged over 2024 (ranging from 580.0 to 605.0 thousand tonnes).
These estimates assume, among other things: (i) an increaseare based on several assumptions, including but not limited to metal prices, operational performance, grades, maintenance, input costs, exchange rates, political and social situation in the performancecountries where we operate.
Regarding our cash cost net of by-products credits estimates for 2024, for our mining segment, we estimate cash cost after by-products credits to be between US$0.23-0.42 per pound of zinc sold in 2024. This cost does not include Aripuanã, which is in the roastersramp-up phase, which is expected to be concluded in allmid-2024. The estimated decrease of our smelters; and (ii) regular production through 201819.4% compared to 2017, which experienced atypical rains2023 is mainly driven by higher by-products contribution and floodslower TCs. For our smelting segment, cash cost after by-products credits in Peru during2024, is estimated to be between US$1.07-1.18 per pound of zinc sold. The estimated cost increase compared to 2023 is mainly driven by lower TCs.
Our estimated capital expenditures for 2024 is US$311.0 million, sustaining investments are expected to total US$261.0 million, with mining accounting for US$200.0 million, including US$39.0 million at Aripuanã, and smelting accounting for US$61.0 million. In 2024, we also expect to incur US$72.0 million in mineral exploration and project evaluation expenses, with US$58.0 million allocated to exploration (including brownfields, greenfields, mineral rights, mine development, business development and administrative issues) and US$14.0 million allocated to project evaluation. In mineral exploration, we plan to continue our efforts to replace and increase mineral reserves and resources in our operating assets and define and expand the first quarter.
mineralized zones in exploration phase projects, focusing on Cerro Lindo, Aripuanã, Vazante and El Porvenir (brownfields) and copper opportunities (exploration phase), respectively.
These estimates should be considered preliminary, and subject to change. We have provided ranges, rather than specific amounts, for these estimateschange and are based on a number ofseveral assumptions that management believes to be reasonable as of the date of this report.annual report, which are subject to change based on internal and external developments. As of the date of this annual report, we continue to monitor developments related to the socio-political environment in the countries we operate and the impacts of global conflicts, including the Ukraine-Russia conflict and the Israel-Hamas conflict, on the economy, supply and demand for commodities, global security concerns, and market volatility. We cannot predict how and to what extent global conflicts, any protest activities or other operational issues may impact our current plans and objectives for 2024, including with respect to our consolidated production guidance and our current capital expenditure, mineral exploration, and project evaluation disbursements. See “Forward-looking statements.” For cash cost guidance, see “Presentation of financial and other information—Non-IFRS Accounting Standards measures.”
Key factors affecting our business and results of operations
Reporting segments
We have two reportable segments: mining and smelting. A major part of our zinc mining production, representing approximately 97.3%94.5% of production in 2017,2023, is processed in our own smelters. Similarly, a major part of the zinc concentrates used as raw material consumption for our smelting operations, representing approximately 58.8%47.9% of concentrateszinc contained in 2017,raw material (excluding oxide) in 2023, comes from our own mines. As a result, the revenues of our mining segment include sales to
the smelting segment, and the costs of our smelting segment include purchases from the mining segment. We calculate internal transfer prices from our mines to the smelters on an arm’s length basis to evaluate the performance of our mining and smelting segments individually. These revenues and costs are eliminated in our consolidated financial statements.
The profitability of our mining segment depends primarily on world prices of the metals we produce, and on our costs to produce concentrates. It is also affected by treatment charges, which are amounts representing the cost of further processing that are applied to reduce the price of concentrate. Other factors affecting pricing are discussed below.
Nexa Brazil has integrated operations, and, as a result, we calculate internal transfer prices from our Brazilian mines to the Três Marias smelter on an arm’s length principle basis to evaluate the performance of our mining and smelting segments individually.
| 121 |
Overview |
The profitability of our smelting segment does not depend directly on market prices for metals because they have a similar impact on our revenues and our costs. It is affected primarily by treatment charges (which reduce our costs to acquire concentrates), by the premium over the market price of metals that we can charge for our products, and by the operating costs of our smelters and their efficiency in recovering the metal content of the concentrates we purchase.
Segments are reported on a statutory basis in accordance with IFRS Accounting Standards 8 “Operating Segments,” and the information is presented to the board of directors and chief executive officer, onwho is the performance of each segment ischief operating decision maker in accordance with IFRS Accounting Standards 8. Segment results are derived from the accounting records and are adjusted for reallocations between segments, exceptional items,depreciation and transfer pricing adjustments.amortization and miscellaneous adjustments, if any, for the period. For more information, see “Operating and Financial Review and Prospects—Results of Operations—Non-IFRS Accounting Standards measures and reconciliation” in this report. See also Note 302 to our consolidated financial statements.
Metal prices
Our financial performance is significantly affected by the market prices of zinc, copper and lead, and, to a lesser extent, silver, gold and the other byproductsby-products of our smelting operations. Metal prices have historically been subject to wide fluctuations and are affected by numerous factors beyond our control, including the impact such factors have on industries representing first-uses and end-uses of our products. These factors, which affect each metal to varying degrees, include international economic and political conditions, levels of supply and demand, the availability and cost of substitutes, inventory levels maintained by producers and others and, to a lesser degree, inventory carrying costs and currency exchange rates. In addition, market prices have on occasion been subject to rapid short-term changes due to speculative activities.
The market prices for zinc, copper and lead are typically quoted as the daily cash seller and settlement price established by the London Metals Exchange (or LME).LME. LME zinc prices are influenced by global supply and demand for concentrate and metallic zinc and zinc oxide.zinc. The supply of metallic zinc and zinc oxide depends on the amount of zinc concentrates and secondary feed materials produced and the availability of smelting capacity to convert them into refined metal. This also applies to copper and lead.
The table below sets forth the average published market prices for the metals and periods indicated:
For the Year Ended December 31, | ||||
| Average Market | 2023 | 2022 | ||
| Prices of Base Metals | (US$/tonne) | (US¢/lb) | (US$/tonne) | (US¢/lb) |
| Zinc (LME) | 2,646.57 | 120.05 | 3,478.32 | 157.77 |
| Copper (LME) | 8,477.77 | 384.55 | 8,797.01 | 399.03 |
| Lead (LME) | 2,138.18 | 96.99 | 2,150.17 | 97.53 |
|
| For the Year Ended December 31, |
| ||||||||||
Average Market |
| 2017 |
| 2016 |
| 2015 |
| ||||||
Prices of Base Metals |
| US$/tonne |
| US¢/lb. |
| US$/tonne |
| US¢/lb. |
| US$/tonne |
| US¢/lb. |
|
Zinc (LME) |
| 2,895.94 |
| 131.36 |
| 2,094.75 |
| 95.02 |
| 1,928.30 |
| 87.47 |
|
Copper (LME) |
| 6,165.97 |
| 279.68 |
| 4,862.59 |
| 220.56 |
| 5,494.50 |
| 249.23 |
|
Lead (LME) |
| 2,317.46 |
| 105.12 |
| 1,871.58 |
| 84.89 |
| 1,783.57 |
| 80.90 |
|
For the Year Ended December 31, | |||
| Average Market Prices of Precious Metals | 2023 | 2022 | |
| (in US$/oz) | |||
| Silver (LBMA) | 23.35 | 21.73 | |
| Gold (Fix) | 1,940.54 | 1,800.09 | |
|
| For the Year Ended December 31, |
| ||||
Average Market Prices of Precious |
| 2017 |
| 2016 |
| 2015 |
|
|
| (in US$/oz.) |
|
|
|
|
|
Silver (LBMA) |
| 17.05 |
| 17.14 |
| 15.68 |
|
Gold (Fix) |
| 1,257.15 |
| 1,250.80 |
| 1,160.06 |
|
The key drivers and recent trends of each of the metals that we produce are discussed below.
Zinc
Zinc is a major material for the construction, transport and transportinfrastructure industries, which represent approximately 50.0%50%, 21% and 21.0%16% of the zinc end-use, respectively, according to Wood Mackenzie. These industries mainly use zinc for galvanizing steel and die casting, which account for approximately 59.0% and 13.0% of zinc applications, according to Wood Mackenzie.
The annual average price of zinc on the LME as of December 31, 2017,2023, was 38.2% higher than in23.9% lower when compared to the corresponding period in 2016. This2022. In 2023, the main factor contributing to the decrease in price of zinc as compared to 2022 was the lack of demand from traditional sectors such as construction in most of the consuming regions. In China, after the peak in zinc prices in the 1Q23 with expectations of the country’s recovery after the end of lockdowns, disappointing data from the real estate sector caused the steep drop in prices going into 2Q23. In the US and Europe, the high level of inflation and tax rates discouraged the real estate sector. The sectors that had increases in demand were those connected to the energy transition, such as solar power generation and electric vehicles.
| 122 |
Overview |
From the supply side, 2022 was a year of smelter closures with the increase was mainly causedin power prices, especially in Europe, but production levels were normalized by the lower availabilityfirst half of 2023, with some production that remained offline (Nordenham, for example) as demand was weak. On the other hand, as zinc concentrates inprices came down during 2Q23, reaching a minimum price of US$2,224/t by May 25, many mines ceased production as the global market, which affects smelter production, and LME stocks that endedcontinuing high level of costs caused some assets to operate with negative margins. At the period at 182.0 thousand tonnes, their lowest level since January 2007.
According to Wood Mackenzie,end of 2023, approximately 5% of the world’s zinc concentrate production was 5.6% higher in 2017 compared to 2016. Despite this increase, during 2017, prices increased by 30.0%, from US$2,552.5 per tonne on January 3, 2017, the first day of trading, to US$3,309.0 per tonne on December 29, 2017, the last day of trading.
offline.
Spot treatment charges for imported concentrates in China decreased from US$35275 per tonne in January 20172023 to US$1580 per tonne in December 2017,2023, as reported by Wood Mackenzie, while long-term contract treatment charges decreasedincreased from US$211230 per tonne in 20162022 to US$172274 per tonne in 2017,2023. The benchmark for long-term treatment charges was set in April reflecting the surplus of concentrate at the time, after Europe’s smelters closures, although this scenario changed rapidly throughout the year, as reported by Wood Mackenzie.
Zinc supply decreased in 2017, mainlysmelter production declined due to low availability ofa reduction in concentrate which led to difficulties forsupply, as mines ceased production. Energy prices also presented a major concern throughout the year, with smelters to feed their operations. In addition, strict environmental inspections in China contributedand Europe ceasing or reducing production.
According to decreasesWood Mackenzie’s December 2023 report, in supply.2023, the zinc metal market closed with a surplus of 260 thousand tonnes resulting from a metal production of 13.7 million tonnes and consumption of 13.4 million tonnes (1.6% lower than 2022). Mine supply presented a decrease of 2.3% in 2023, with a total of 12.5 million tonnes, leading to a concentrate deficit of 107 thousand tonnes, which is expected to drive benchmark treatment charges down during the negotiation of contracts in 2024.
Refined zinc supply presented an increase in 2023, mainly because of Europe’s smelters coming back online and an increase in China’s smelter production.
Copper
Copper is used for building construction, power generation and transmission, electronic product manufacturing and the production of industrial machinery and transportation vehicles. The annual average price of copper on the LME as of December 31, 20172023 was 27.0% higher3.6% lower than in the corresponding period in 2016.2022. This increase was mainly caused by an imbalance in supplya net result of positive effects related to mine disruptions, a falling US dollar value and demand between copper minesfrom sectors related to the energy transition, while traditional demand, such as civil construction and smelters and refiners. During the year, prices increased by 28.0%, from US$5,574.0 per tonne on January 3, 2017, the first day of trading,real estate, failed to US$7,157.0 per tonne on December 29, 2017, the last day of trading.
In December 2017, copper stocks in the LME decreased by 37.4%, to 201.0 thousand tonnes, compared to 322.0 thousand tonnes in December 2016. Totalgrow at a faster pace. On balance, total mine production, decreased by 0.4% in 2017 based on lower than expected grades and unexpected strikes. Globalrefined production, as well as global demand for refined copper increased by 2.1% in 2017,2023 compared to 2022 according to Wood Mackenzie.
Lead
Lead is used in batteries as energy storage and in other products such as ammunition, oxides in glass and ceramics, casting metals and sheet lead. The annual average price of lead on the LME as of December 31, 20172023 was 24.0% higher0.6% lower than in the corresponding period in 2016.2022. This increase was mainly caused by a shortage of lead concentrates, which contributed to a deficit in refined lead supply and a decline in global lead concentrate inventories. Duringdecrease reflects the year, prices increased by 24.0%, from US$2,007.0 per tonne on January 3, 2017, the first day of trading, to US$2,495.0 per tonne on December 29, 2017,market moving into surplus during the last day of trading. Mining production was 2.8% higheryear despite only a modest recovery in 2017 compared to 2016, according to Wood Mackenzie.mine, and therefore primary smelter, output, while secondary output is suffering with raw material supply.
Silver
Silver is considered a precious metal and generally seen as a store of value, so its price tends to be resilient in times of economic uncertainty. In addition, applications in electronics and solar cells have added to the already broad range of uses of silver in currency, jewelry, and silverware. The annual average London Bullion Market Association (or LBMA)LBMA silver price for the year ended December 31, 20172023 was 1.0% lower7.5% higher than in the corresponding period in 2016,2022. Silver prices hit the highest level of the year on April 14, 2023, US$26.03 per ounce, which was 0.6% below the highest point of the previous year reached on March 09, 2022, but failed to maintain a similar level over the remainder of 2023, nearing US$21 per ounce in October and recovering by the end of December with US$22.73 per ounce. This performance was mainly due to a surplusthe volatility of precious metals for the first time in four years, which was
caused by a 5.0% decrease in silver demandUS dollar and a flat supply. As of January 3, 2017, the first day of trading, the price of silver was US$15.9 per ounce and as of December 29, 2017, the last day of trading, the price of silver was US$16.9 per ounce.geopolitical risks.
| 123 |
Overview |
Production volumes, ore grade and metal mix
Our production volumes, the ore grade from our mines and the mix of metals in our product portfolio affect our business performance. The following table sets forth, for the periods indicated, our production, measured in terms of metal content in our zinc, copper and lead concentrates and the average ore grade of our production. For more details, see “Information on the Company—Mining operations.”
|
| For the Year Ended December 31, |
| ||||
|
| 2017 |
| 2016 |
| 2015 |
|
Concentrate Production |
|
|
|
|
|
|
|
Zinc concentrates (in tonnes) |
| 791,583 |
| 860,399 |
| 866,679 |
|
Copper concentrates (in tonnes) |
| 169,582 |
| 158,503 |
| 154,998 |
|
Lead concentrates (in tonnes) |
| 96,006 |
| 104,408 |
| 94,875 |
|
Metal Contained in Concentrate Production |
|
|
|
|
|
|
|
Zinc contained in concentrates (in tonnes) |
| 375,402 |
| 416,869 |
| 425,883 |
|
Copper contained in concentrates (in tonnes) |
| 44,161 |
| 41,551 |
| 40,375 |
|
Lead contained in concentrates (in tonnes) |
| 52,572 |
| 59,181 |
| 54,611 |
|
Silver contained in concentrates (in oz.) |
| 7,945,778 |
| 8,539,568 |
| 7,862,715 |
|
Average Ore Grade |
|
|
|
|
|
|
|
Zinc (%) |
| 3.30 |
| 3.47 |
| 3.73 |
|
Copper (%) |
| 0.42 |
| 0.40 |
| 0.41 |
|
Lead (%) |
| 0.53 |
| 0.57 |
| 0.55 |
|
Silver (grams per tonne) |
| 27.99 |
| 29.24 |
| 28.30 |
|
Our zinc contained in concentrates production decreased by 9.9% in 2017, mainly due to 26.2%, 24.1% and 10.3% decreases in zinc contained in concentrates production in our El Porvenir, Atacocha and Cerro Lindo mines, respectively, as a result of lower zinc grades in each of the mines and run of mine ore production in Cerro Lindo and El Porvenir. Our copper contained in concentrates production increased by 6.3%12.4%, while copper and lead increased by 0.5%, and 13.5%, respectively, in 2017, mostly due to a 7.2% increase in copper contained in concentrates production in our Cerro Lindo mine, which was the result2023. Production of an increase in the ore grade. Lead contained in concentrates production decreased by 11.2% in 2017, mainly due to lower run of mine production in Cerro Lindo, El Porvenir and Vazante, combined with lower lead grades in Morro Agudo. In 2017, silver contained in concentrates decreasedincreased by 7.0%, mainly due to lower run of mine production3.3% in Cerro Lindo, El Porvenir and Vazante, partially offset by higher ore grades in El Porvenir and Vazante.2023.
The following tables summarize zinc contained in concentrate production and zinc equivalents production in each of our operations.
|
| Zinc Contained in Concentrate |
| Zinc Equivalents Contained in |
| ||||||||
|
| 2017 |
| 2016 |
| 2015 |
| 2017 |
| 2016 |
| 2015 |
|
|
| (in tonnes of zinc contained in |
|
|
| (in tonnes) |
|
|
| ||||
Peru |
|
|
|
|
|
|
|
|
|
|
|
|
|
Cerro Lindo |
| 155,950 |
| 173,808 |
| 176,992 |
| 283,208 |
| 296,007 |
| 292,600 |
|
El Porvenir |
| 46,154 |
| 62,534 |
| 61,664 |
| 76,590 |
| 97,570 |
| 96,426 |
|
Atacocha |
| 16,950 |
| 22,330 |
| 30,301 |
| 48,591 |
| 54,770 |
| 54,826 |
|
Brazil |
|
|
|
|
|
|
|
|
|
|
|
|
|
Vazante |
| 135,379 |
| 135,509 |
| 134,004 |
| 138,395 |
| 137,535 |
| 135,958 |
|
Morro Agudo |
| 20,969 |
| 22,688 |
| 22,922 |
| 25,614 |
| 29,197 |
| 29,813 |
|
Total Zinc |
| 375,402 |
| 416,869 |
| 425,883 |
| 572,398 |
| 615,079 |
| 609,623 |
|
Commercial terms
We sell our concentrates and metallic zinc and zinc oxide products mostly through supply contracts with terms between one and fourthree years, and only a small portion is sold on the spot market. The agreements with our customers include customary international commercial terms, such as cost, insurance and freight, or CIF; free on board, or FOB; free carrier, or FCA; and cost and freight, or CFR; pursuant to Incoterms 2010,2010/2020, as published by the International Chamber of Commerce. For concentrates, revenues are recorded at provisional prices and, typically, an adjustment is then made after delivery, based on the pricing terms provided for under the relevant contract.
Sales prices for our products are based on LME and/or LBMA quotations. Concentrates are typically sold at the LME price reference minus a discount (treatment charge for zinc and lead; treatment charge and refining charge for copper). Metallic zinc and zinc oxide are typically sold at the LME quotation averaged during a quotation period, such as the month after shipment, the month prior to shipment or another agreed period, plus a negotiable premium that varies based on quality, shape, origin, and delivery terms and also according to the market where metal will be sold. In 2017, 60.9%2023, 47.1% of the total zinc concentrateraw material consumption in our smelters was produced by our mines and 39.1%52.9% was purchased from third parties.parties or was obtained from secondary raw materials (including oxide). We buy zinc concentrates from different suppliers in the market to meet our raw material requirements. We sell the balance of our zinc concentrates production and all our copper and lead concentrates production to metal producers and international traders, on international market terms.
Our sales of metallic zinc are highly diversified. Our customer base is composed mainly of end users. Our products reach the following end use industries: transport, construction, infrastructure, consumer goods and industrial machinery. In 2017, 75.6%2023, 71.5% of our total sales were to customers in the continuous galvanizing, general galvanizing, die casting, transformers and alloy segments, and 24.6%28.5% were to international traders. Our ten largest customers represented approximately 50.0%58.0% of our total sales volume in 2017.2023. In 2017,2023, we sold to more than 351330 customers across 3745 different countries.
Free zinc, treatment charges, premiums and smelter byproducts
by-products
Smelters are processing businesses that achieve a margin on the concentrates and other feedstocks they process; in large part, the price for the underlying metal is effectively passed through from the miner supplying the concentrate, or the supplier of the secondary feed material, to the smelter’s customer. Our smelters use zinc concentrate as feedstock, which is supplied from our mines and from third-party suppliers. The smelter earns revenue from (i) the treatment charge reflected as a discount in the purchase price it pays, (ii) the refined metal it can produce and sell over and above the metal content it has paid for in concentrates purchased from the miner (free metal) and (iii) any premium it can earn on the refined products it sells to its customers. ByproductsBy-products can also contribute to a smelter’s revenue. ByproductsBy-products from our smelting operations include, among others, silver, gold, copper, cement, sulfuric acid, lead concentrate, lead-silver concentrate, agricultural limesilver concentrates, limestone and copper sulfate.
Free zinc and treatment charges
Free zinc is the difference between the amount of zinc that is paid for in the concentrates and the total zinc recovered for sale by the smelter. The value of the zinc that is paid for corresponds to 85.0% of zinc content, which has historically been the industry standard, multiplied by the LME price of zinc. The zinc content which is not paid for is considered “free zinc.” The margin of a zinc smelter improves as the amount of metal in zinc concentrates that it can recover increases.
The treatment charge (or TC)(“TC”) is a discount per tonne of concentrates, which is determined by negotiation between the seller (a mine or a trading company) and the buyer (a smelter). Treatment charges can be benchmark TC (negotiated by the major miners and buyers, or Benchmark TC)buyers), spot or negotiated, and are also linked to the LME price of zinc by a parametric formula that increases the treatment charge when the LME price rises or decreases the treatment charge if the LME price falls.negotiated.
| 124 |
Overview |
We apply a Benchmark TC for our integrated mining and smelter operations in Peru. For our other purchases of zinc concentrate from third-party miners and trading companies, the treatment charge is based on the Benchmark TC, spot treatment charges or treatment charges negotiated annually with miners or trading companies, ascompanies.
In order to reduce volatility, for most of our third-party contracts, which are renewed throughout different periods during the case may be.year, we consider the 3-years average TC. The reference (average benchmark TC of 2023, 2022 and 2021) for 2023 stood at US$221/t concentrate, down 3.7% from the previous reference (average benchmark TC of 2022, 2021 and 2020).
The market trend for treatment charges reflects the supply and demand for concentrates in the market. Treatment charges tend to fall when concentrate demand increases relative to supply, and they tend to rise when demand falls. In other words, when there is an excess of concentrate compared to the smelting processing capacity, treatment charges tend to rise and when there is a deficit of concentrate in the market, treatment charges tend to fall. For information regarding our actual treatment charges, see “Information on the Company—Smelting operations.”
The following table sets forth, for the periods indicated, the zinc realized Benchmark TC, expressed in dollars per dry metric tonne (or dmt)(“dmt”) of concentrate.
For the Year Ended December 31, | ||
2023 | 2022 | |
| Treatment Charge (in US$/dmt) | 274 | 230 |
|
| For the Year Ended |
| ||||
|
| 2017 |
| 2016 |
| 2015 |
|
Treatment Charge (in US$/dmt) |
| 172 |
| 211 |
| 243 |
|
Source: Wood Mackenzie.
Premiums
Like other smelters, we sell metallic zinc and zinc oxide products at a premium over the base LME price. The premium reflects a combination of factors, including the service provided by the smelter in delivering zinc or lead of a certain size, shape or quality specified by its customers and transportation costs, as well as the conditions of supply and demand prevailing in the regional or local market where the metal is sold.
Premiums tend to vary from region to region, as transportation costs and the value attributable to customer specifications tend to be influenced by regional or local customs rather than being a function of global market dynamics.
The following table sets forth, for the periods indicated, information on premiums for the markets indicated, expressed in U.S. dollars per tonne.
For the Year Ended December 31, | ||
2023 | 2022 | |
| Rotterdam (in US$/tonne) | 371 | 457 |
| Singapore (in US$/tonne) | 131 | 144 |
| United States (in US$/tonne) | 652 | 750 |
|
| For the Year Ended |
| ||||
|
| 2017 |
| 2016 |
| 2015 |
|
Rotterdam (in US$/tonne) |
| 135 |
| 131 |
| 137 |
|
Singapore (in US$/tonne) |
| 137 |
| 130 |
| 131 |
|
United States (in US$/tonne) |
| 180 |
| 144 |
| 169 |
|
Source: Wood Mackenzie.
TheThe following table sets forth, for the periods indicated, the gross premium over the base LME price for zinc oxide realized by our smelting operations in Brazil, expressed in dollars per tonne.
|
| For the Year Ended |
| ||||
|
| 2017 |
| 2016 |
| 2015 |
|
Brazilian operations (in US$/tonne) |
| 482 |
| 484 |
| 527 |
|
For the Year Ended December 31, | ||
2023 | 2022 | |
| Brazilian operations (in US$/tonne) | 714 | 548 |
Smelter byproducts
by-products
The quantity of byproductsby-products produced in our smelters depends on several factors, including the chemical composition of the concentrate and the recovery rates achieved. Concentrates from some mines contain higher levels of byproductby-product metals than concentrates from other mines. In addition, the higher the rate of byproductby-product recovery the greaterincreases the number and volume of byproductsby-products that can be produced and sold.
| 125 |
Overview |
Sulfuric acid is the principal byproductby-product we sell. It is manufactured from the sulfur dioxide gas generated from roasting zinc concentrates. While the zinc smelters use sulfuric acid in their leach plants, almost all this requirement is generated in each zinc smelter’s electrolysis plant, and only small amounts of the sulfuric acid produced are used in its facilities, leaving the rest available for sale. We generally sell sulfuric acid under annual or multi-year contracts.contracts and spot sales.
The following table sets forth, forSilver concentrate is another relevant by-product that we produce at our Cajamarquilla and Juiz de Fora smelters. Silver concentrate is one of the periods indicated,components of zinc concentrate and is obtained during the volume of our productionzinc metallurgical flotation process. Recovered silver is sold primarily to international traders and sales of sulfuric acid and the net revenue.local customers.
|
| For the Year Ended December 31, |
| ||||
|
| 2017 |
| 2016 |
| 2015 |
|
Sulfuric acid |
|
|
|
|
|
|
|
Production (in tonnes) |
| 725,957 |
| 787,657 |
| 765,276 |
|
Sales (in tonnes) |
| 570,228 |
| 632,242 |
| 596,993 |
|
Net Revenue (in thousands of US$) |
| 6,810 |
| 21,574 |
| 31,200 |
|
The following table sets forth, for the periods indicated, the sales and net revenue of refined indium.
|
| For the Year Ended |
| ||||
|
| 2017 |
| 2016 |
| 2015 |
|
Refined indium |
|
|
|
|
|
|
|
Sales (in tonnes) |
| 0 |
| — |
| 8 |
|
Net Revenue (in thousands of US$) |
| 0 |
| — |
| 2,983 |
|
The following table sets forth, for the periods indicated, our sales and net revenue of silver concentrates.
|
| For the Year |
| ||||
|
| 2017 |
| 2016 |
| 2015 |
|
Silver concentrates |
|
|
|
|
|
|
|
Sales (in tonnes) |
| 5,332 |
| 6,096 |
| 6,598 |
|
Net Revenue (in thousands of US$) |
| 22,871 |
| 27,374 |
| 22,783 |
|
Operating costs and expenses
Our ability to manage our operating costs and expenses is a significant driver of our business performance. We focus on controlling and limiting our costs and expenses so that we are better prepared to overcome less favorable pricing conditions.
Energy costs
Our total cost of energy is composed of the operating costs of our own hydroelectric power plants, long-term electricityenergy supply contracts, transmission and distribution charges and fees.
In Peru, the energy market is more stable in terms of generation (hydrology forecast) and prices. We obtain 1.85%2.6% of the electricityenergy for our operations from our own hydroelectric power plants and 98.15%97.4% from third parties withparty contracts with terms ranging from one to two years.
the SEIN.
In Brazil, the electricityenergy for our operations comes from five hydroelectric plants in which our subsidiary Pollarix has directly or indirectly the following interests as of December 31, 2017:2023: a 21.0%22.4% participation in the consortium Enercan (Campos Novos hydroelectric power plant), 100.0%100% ownership of a hydroelectric power plant (Picada) located in Minas Gerais, a 12.6% participation in the consortium Amador Aguiar I, a 12.6% participation in the consortium Amador Aguiar II and a 23.9% participation in the consortium Igarapava. We account for the consortium interests using proportional consolidation.consortiums as joint operations, as discussed in Note 4(b) to our consolidated financial statements. On a consolidated basis, our costs for electricityenergy in Brazil reflect the operating costs of the hydroelectric facilities and are not sensitive to market prices.
The current structurea variety of our Brazilian energy assets, as described above, reflects transactions with our controlling shareholder concluded during 2017. Prior to those transactions, we owned the same energy assets through April 2016, except for Enercan, which was owned by a subsidiary of our shareholder VSA that sold us power under power purchase agreements. In our consolidated financial statements, we give retroactive effect to these transactions. See Note 1(vii) to our consolidated financial statements.factors, including hydrologic variables.
The only activity of Pollarix is to own our energy assets, and it sells energy to our Brazilian operating subsidiaries at market prices. We own all the common shares of Pollarix, which represents 33.33%33.3% of its total share capital and/or its affiliates. The remaining shares are preferred shares with limited voting rights, which are owned by our shareholder VSA.Auren. Under the terms of the preferred shares, VSAAuren is entitled to dividends per share equal to 1.251.93 times the dividends per share payable on the common shares. See “Information on the Company—Other operations—Power and energy supply.supply—Brazil.” As a result, in future periods we expect that a substantial part of the profits recognized by Pollarix from selling energy to our Brazilian operating subsidiaries will represent non-controlling interest in our income statement.
Environmental expenses
Our mines and smelters operate under licenses issued by governmental authorities that control, among other things, air emissions and water discharges and are subject to stringent laws and regulations relating to waste materials and various other environmental matters. Additionally, each operation, when it ultimately ceases operations permanently, will need to be rehabilitated.
We have made significant investments to reduce our environmental impact in the areas in which we operate and to ensure that we are able to comply with environmental standards. All our operational units have environmental improvement initiatives relating to reducing emissions and waste and improving the efficiency of use of natural resources and energy.
| 126 |
Overview |
Where appropriate, we establish environmental provisions for restoration or remediation of existing contamination and disturbance, with all material issues being reviewed annually. Provisions associated with smelter and mining operations sites primarily relate to soil and groundwater contamination.
DuringSince 2016, and 2017, we have conducted an extensive study and update of our decommissioning plans, including potential environmental obligations. During this period, we also modified our internal policies for decommissioning and environmental issues, which require frequent updates of environmental studies to reflect the best international practices. As a result of these adjustments, we recorded an additional environmental provisionprovisions of US$68.612.6 million and US$6.9 million in 20162022 and US$20.8 million in 2017.2023, respectively. Although we do not expect significant additional provisionsexpected in the near future, changes in legislation and adjustments to our internal policies andafter the ongoing evaluations could require additional resources.provisions.
Macroeconomic conditions of the countries and regions where we operate
Peru
The following table sets forth Peruvian inflation rates, interest rates and exchange rates for the dates and periods indicated.
For the Year Ended December 31, | ||
2023 | 2022 | |
| Real GDP growth rate (1)(2) | (0.6%) | 2.7% |
| Internal demand growth rate (2) | (1.7%) | 2.3% |
| Private investment growth rate (2) | (7.2%) | (0.5%) |
| Reference interest rate | 6.8% | 7.50% |
| CPI rate (2) | 6.3% | 7.9% |
| Appreciation (devaluation) of sol against the U.S. dollar | 2.7% | 4.9% |
| Exchange rate of sol to US$1.00 (end of period) (3) | 3.7042 | 3.8061 |
|
| As of and for |
| ||||
|
| 2017 |
| 2016 |
| 2015 |
|
Peruvian GDP growth rate |
| 2.5 | % | 4.0 | % | 3.3 | % |
Internal demand growth rate |
| 1.6 | % | 1.1 | % | 2.9 | % |
Private investment growth rate |
| 0.3 | % | (5.7 | )% | (4.38 | )% |
Reference interest rate |
| 3.3 | % | 4.3 | % | 3.8 | % |
CPI Index |
| 1.4 | % | 3.2 | % | 4.4 | % |
Appreciation (devaluation) of sol against the U.S. dollar(1) |
| 3.5 | % | 1.7 | % | (12.7 | )% |
Exchange rate of sol to US$1.00(1) |
| 3.2405 |
| 3.3560 |
| 3.4125 |
|
Sources: Central Reserve Bank of Perú, Ministerio de Economía y Finanzas del Perú.Peruvian Ministry of Economy and Finance.
(1) Preview: Bloomberg consensus rate.
(1) As of the last day of the relevant(2) Accumulated during each period.
Brazil(3) Official offer exchange rates.
Brazil
The following table sets forth Brazilian inflation rates, interest rates and exchange rates for the dates and periods indicated.
For the Year Ended December 31, | ||
2023 | 2022 | |
| Real GDP growth rate (1)(2) | 2.9% | 2.9% |
| Inflation rate (IGP-M) (2) | (3.2%) | 5.9% |
| Inflation rate (IPCA) (2) | 4.7% | 5.8% |
| CDI rate (end of period) | 11.7% | 13.7% |
| SELIC rate (end of period) | 11.8% | 13.8% |
| TJLP | 6.6% | 7.2% |
| Appreciation (devaluation) of real against the U.S. dollar | 7.2% | 6.5% |
| Exchange rate of real to US$1.00 (end of period) (3) | 4.8410 | 5.2174 |
|
| As of and for |
| ||||
|
| 2017 |
| 2016 |
| 2015 |
|
GDP growth rate |
| 1.0 | % | (2.5 | )% | (5.8 | )% |
Inflation rate (IGP-M)(1) |
| (0.5 | )% | 7.2 | % | 10.5 | % |
Inflation rate (IPCA)(2) |
| 3.0 | % | 6.3 | % | 10.7 | % |
CDI rate(3) |
| 6.9 | % | 13.6 | % | 14.1 | % |
SELIC rate(4) |
| 7.0 | % | 13.8 | % | 14.3 | % |
TJLP(5) |
| 7.0 | % | 7.5 | % | 7.0 | % |
Appreciation (devaluation) of real against the U.S. dollar(4) |
| (1.5 | )% | 19.8 | % | (32.0 | )% |
Exchange rate of real to US$1.00(4) |
| 3.3080 |
| 3.2591 |
| 3.9048 |
|
Sources: IBGE, the Central Bank, CETIPCetip, and FGV.
(1) Preview published by the Central Bank official report (Focus) as of December 31, 2023.
(1)(2) Accumulated during each period.
(3) Official offer exchange rates.
| 127 |
Overview |
(2) Accumulated during each period.
(3) Accumulated during each period.
(4) As of the last day of the relevant period.
(5) As of the end of each period.
Effects of exchange rate fluctuations
Prices for our products are based on international indices, such as LME prices, and denominated in U.S. dollars. A portion of our production costs, however, is denominated in reais, so there is a mismatch of currencies between our revenue and costs. In 2017, 19.6%2023, 20.5% of our production costs and operational expenses were denominated in reais. A smaller portionand 16.1% of our production costs isand operational expenses were denominated in soles, a smaller portion compared to reais, since most of our costs in Peru are in U.S. dollars. In 2017, 13.0% of our costs and expenses were denominated in soles. As a result, our results of operations and financial condition are affected by changes in exchange rates between reais and, to a lesser extent, soles, and the U.S. dollar.
In addition, our Brazilian subsidiary Nexa Brazil has substantial intercompany debt to Nexa Resources and our subsidiary VGmbH that is denominated in U.S. dollars. The functional currency of Nexa Brazil is the real, so Nexa Brazil recognizes exchange gain or loss when the value of the real rises or falls against the U.S. dollar. These gains and losses are not eliminated in consolidation because the functional currency of Nexa Resources and VGmbH is the U.S. dollar, so they do not recognize offsetting gain or loss. As of December 31, 2017, the aggregate amount outstanding under these intercompany loans was US$1,122.7 million.
Peru
The following table sets forth for the periods indicated (i) the high and low exchange rates, (ii) the average of the exchange rates on the last day of each month for each year and daily for each month and (iii) the exchange rate at the end of each period, expressed in soles per U.S. dollar (sol/US$), and reais per U.S. dollar (real/US$) as reported by the Peruvian Central Bank.Bank and the Brazilian Central Bank, respectively.
Exchange Rates of S/ and R$ per US$1.00 | ||||||||
Period-End | Average (1) | High | Low | |||||
S/ | R$ | S/ | R$ | S/ | R$ | S/ | R$ | |
| Year ended December 31, | ||||||||
| 2022 | 3.8061 | 5.2174 | 3.8344 | 5.1652 | 4.0005 | 5.7039 | 3.6350 | 4.6172 |
| 2023 | 3.7042 | 4.8410 | 3.7438 | 4.9950 | 3.8953 | 5.4456 | 3.5570 | 4.7199 |
| Month | ||||||||
| January 2024 | 3.8085 | 4.9532 | 3.7416 | 4.9141 | 3.8101 | 4.9712 | 3.6954 | 4.8540 |
| February 2024 | 3.7801 | 4.9830 | 3.8255 | 4.9641 | 3.8835 | 5.0050 | 3.7801 | 4.9300 |
| March 2024 (through March 22nd) | 3.7041 | 4.9894 | 3.7076 | 4.9776 | 3.7700 | 5.0349 | 3.6730 | 4.9361 |
|
| Exchange Rates of S/ per US$1.00 |
| ||||||
|
| Period-End |
| Average(1) |
| High |
| Low |
|
Year ended December 31, |
|
|
|
|
|
|
|
|
|
2015 |
| 3.4125 |
| 3.1864 |
| 3.4125 |
| 2.9830 |
|
2016 |
| 3.3560 |
| 3.3752 |
| 3.5367 |
| 3.2475 |
|
2017 |
| 3.2405 |
| 3.2613 |
| 3.3909 |
| 3.2310 |
|
Month |
|
|
|
|
|
|
|
|
|
January 2018 |
| 3.2154 |
| 3.2161 |
| 3.2405 |
| 3.2067 |
|
February 2018 |
| 3.2612 |
| 3.2488 |
| 3.2702 |
| 3.2115 |
|
March 2018 |
| 3.2270 |
| 3.2523 |
| 3.2721 |
| 3.2115 |
|
April 2018 (through April 4) |
| 3.2272 |
| 3.2263 |
| 3.2272 |
| 3.2255 |
|
Source: Central Reserve Bank of Peru, Brazilian Central Bank, official offer exchange rates.
(1) Annually, represents the average of the exchange rates on the last day of each month during the periods presented; monthly, represents the average of the end-of-daydaily exchange rates during the periods presented.
As of April 4, 2018, the exchange rate was S/3.2272 per US$1.00.
Brazil
The following table sets forth, for the periods indicated, (i) the high and low exchange rates, (ii) the average of the exchange rates on the last day of each month for each year and daily for each month and (iii) the exchange rate at the end of each period, expressed in reais per U.S. dollar (real/US$), as reported by the Brazilian Central Bank.
|
| Exchange Rates of R$ per US$1.00 |
| ||||||
|
| Period-End |
| Average(1) |
| High |
| Low |
|
Year ended December 31, |
|
|
|
|
|
|
|
|
|
2015 |
| 3.9048 |
| 3.3387 |
| 4.1949 |
| 2.5754 |
|
2016 |
| 3.2591 |
| 3.4833 |
| 4.1558 |
| 3.1193 |
|
2017 |
| 3.3080 |
| 3.1925 |
| 3.3807 |
| 3.0510 |
|
Month |
|
|
|
|
|
|
|
|
|
January 2018 |
| 3.1624 |
| 3.2106 |
| 3.2697 |
| 3.1391 |
|
February 2018 |
| 3.2449 |
| 3.2415 |
| 3.2821 |
| 3.1730 |
|
March 2018 |
| 3.3238 |
| 3.2792 |
| 3.3380 |
| 3.2246 |
|
April 2018 (through April 4) |
| 3.3538 |
| 3.3260 |
| 3.3538 |
| 3.3104 |
|
Source: Brazilian Central Bank.
(1) Annually, represents the average of the exchange rates on the last day of each month during the periods presented; monthly, represents the average of the end-of-day exchange rates during the periods presented.
As of April 4, 2018, the exchange rate was R$3.3538 per US$1.00.
Income taxes
Income taxes in Luxembourg, Peru and Brazil have a significant impact on our results. Due to economic and political conditions, tax rates in various jurisdictions may be subject to significant changes. Our future effective tax rates could be affected by changes in the mix of earnings in countries with different statutory tax rates, changes in the valuation of deferred tax assets and liabilities and changes in tax laws or their interpretation.
Luxembourg
The combined applicable income tax rate (including an unemployment fund contribution) was 29.2%is 24.94% from 2019 onwards for the fiscal year ending 2016. On December 14, 2016, theentities having their statutory seat in Luxembourg government approved a 2017 tax reform bill. Among other changes included in the 2017 tax reform bill, the main change announced was the decrease of the income tax rate to 27.1% in 2017 and to 26.0% from 2018 onwards.City.
Brazil
Our Brazilian subsidiaries are subject to corporate income tax on their Brazilian and non-Brazilian income. In addition to corporate income tax, a social contribution tax is imposed on their worldwide income, and the combined applicable rate is 34.0%.
The Brazilian federal government has frequently implemented multiple changes to tax regimes that affect us. In 2015, the Brazilian government changed the tax rate regarding the social integration program (programa de integração social or PIS), and contribution for the financing of social security (contribuição para financiamento de seguridade social or COFINS). Since July 2015, PIS and COFINS on financial income of legal entities subject to the non-cumulative regime has been imposed at rates of 0.65% and 4.00%, respectively.
Peru
Our Peruvian subsidiaries are subject to Peruvian income tax on their worldwide income and are eligible for a potential credit for foreign taxes paid on income derived from foreign sources. The general income tax rate is 29.5%29.5 % from 2017 onwards.
To promote investments in Peru, investors and Peruvian companies may enter into an agreement with the Peruvian government, a Legal Stability Agreement, to provide a stable legal and tax regime for a specified period. In March 2002, Nexa Peru entered into a guarantee and investment protection contract, or the stability agreement. Pursuant to the stability agreement, Nexa Peru can applyapplied a special income tax rate of 20.0% from 2007 through 2021. The 29.5% income tax rate will becomeis applicable to Nexa Peru from January 1, 2022 onwards. For more information, see “Risk Factors—Changes in 2022. While Nexa Peru remains subject to the stability agreement, it is required to pay the special charge on mining, or GEM (Gravamen Especialtax laws may increase our tax burden and, as a la Minería), at marginal rates that vary from 4.00% to 13.12%result, could adversely affect our business, financial position and results of operating income, depending on the operating margin.operations.”
| 128 |
Overview |
Our Peruvian subsidiaries Milpo Andina Peru S.A., or Milpo Andina,Nexa Resources El Porvenir S.A.C. and Compañía MineraNexa Resources Atacocha S.A.A., or Compañía Atacocha, do not have stability agreements with the Peruvian government and are therefore subject to a special mining tax or IEM (Impuesto Especial a la Minería, or “IEM”), with marginal rates from 2.00% and 8.40% of operating income, depending on the company’s operating margin. In addition, Milpo Andina and Compañía Atacochathese companies are subject to a mining royaltieslevy (regalia minera). In 2022, Nexa Peru will becomebecame subject to an IEM and mining royaltiesroyalties’ tax oncefollowing the expiration of its tax stability agreement with the Peruvian government expires.
on December 31, 2021, and to date remains subject to the IEM and mining royalties tax.
Dividends distributed to us by our Peruvian subsidiaries are subject to withholding tax, at a rate of 5.0%5.0 % for profits earned beginning in 2017 and onwards.
| 129 |
Results of Operations |
CRITICAL ACCOUNTING POLICIES AND ESTIMATES
Results of operations
The following discussion and analysis of our financial conditionposition and results of operations is based on our consolidated financial statements. The preparation of these financial statements requires us to make estimates and judgments that affect the reported amount of assets and liabilities, revenues and expenses and related disclosure of contingent assets and liabilities at the date of our consolidated financial statements. Each of the corresponding notes to our consolidated financial statements provides a detailed discussion of our significant accounting policies, as well as critical accounting estimates.
Critical accounting policies reflect significant estimates or judgments about matters that are both inherently uncertain and material to our financial condition or results of operations. Below is a description of our critical accounting policies that require significant estimates and judgments.
Impairment of goodwill and non-financial assets
We annually test whether goodwill has suffered any impairment, in accordance with the accounting policy stated in Note 15(iii) to our consolidated financial statements. We assess the recovery of the carrying amount of goodwill of each cash generating unit based on its value in use or fair value, using a discounted cash flow model.
The process of estimating the value in use and the fair value involves assumptions, judgment and projections for future cash flows. Our assumptions and estimates of future cash flow used for impairment testing of goodwill and non-financial assets are subject to risk and uncertainties, particularly for markets subjects to higher volatilities, which are partially or totally outside our control. The calculations used for the impairment testing are based on discounted cash flow models as of September 30, 2017, market assumptions, such as LME prices, market consensus models and other available data regarding global demand. The discount factor applied to the discounted cash flow model is our weighted average cost of capital for the applicable region, adjusted for country-specific risk factors. These calculations use cash flow projections before taxes on income, based on financial budgets for a five-year period approved internally and is extended until the end of the mine life. We do not use growth rates in cash flow projections of the terminal value. The discount rates used are pre-tax and reflect specific risks related to the relevant operating segment. As described in Note 15(c) to our consolidated financial statements, no material changes occurred between September 30, 2017 and December 31, 2017.
Fair value of derivatives and other financial instruments
The fair values of financial instruments that are not traded in an active market is determined by using valuation techniques. We use judgment to select among a variety of methods and make assumptions that are mainly based on market conditions existing at the end of each reporting period.
The main financial instruments and the assumptions we make for their valuation are described below.
· We consider the nature and terms of cash and cash equivalents, financial investments, trade accounts receivable and other current assets. The carrying amount approximates their realizable values.
· Financial liabilities are subject to typical market interest rates. The market value is based on the present value of expected future cash disbursement, at interest rates currently available for debt with similar maturities and terms.
· The fair value of derivative financial instruments that we use for hedging transactions is evaluated by calculating their present value through yield curves at the closing dates. The curves and prices used in the calculation for each group of instruments are developed based on data from B3 (formerly BM&F Bovespa), Central Bank of Brazil, LME and Bloomberg. When there is no price for the desired maturity, we use an interpolation between the available maturities.
· Swap contracts: The present value of both the assets and liability is calculated through the discount of forecasted cash flow by the interest rate of the currency in which the swap is
denominated. The difference between the present value of the assets and the liabilities generates its fair value.
· Forward contracts: The present value is estimated by discounting the notional amount multiplied by the difference between the future price in the reference date and contracted price. The future price is calculated using the convenience yield of the underlying asset. It is common to use Asian non-deliverable forwards for hedging non-ferrous metals positions. Asian contracts are derivatives, which the underlying is the average price of certain assets over a range of days.
Asset retirement obligations
We recognize an obligation based on the fair value of the operations of asset retirement in the period in which the obligation occurs, in accordance with Note 21(i) to our consolidated financial statements, with a corresponding entry to the respective property, plant and equipment. We consider the accounting estimates related to the recovery of degraded areas and the costs to close a mine as a critical accounting estimate since it involves provision with significant amounts, and these estimates involve several assumptions such as interest rates, inflation, useful lives of the assets reflecting the current depletion stage, costs to be incurred in the future and the dates established for the depletion of each mine. We review these estimates annually.
Tax, civil, labor and environmental provision
We are party to ongoing labor, civil, tax and environmental lawsuits, which are pending at different court levels. The provisions and contingencies against potentially unfavorable outcomes of litigation in progress are established and updated based on management evaluation, as supported by the positions of external legal counsel, and require a high level of judgment regarding the matters involved. For additional information, see Note 21(ii) to our consolidated financial statements included herein.
Income tax and other taxes
We are subject to taxes on income in all countries in which we operate. Significant judgment is required in determining the worldwide provision for taxes on income. There are many transactions and calculations for which the ultimate tax determination is uncertain. We also recognize liabilities for anticipated tax audit issues based on estimates of whether additional taxes will be due. Where the final tax outcome of these matters is different from the amounts that were initially recorded, such differences will impact the current and deferred tax assets and liabilities in the period in which such determination is made. For additional information, see Note 20 to our consolidated financial statements included herein.
Revenue recognition
Revenues represent the fair value of the consideration received or receivable for the sale of goods in our activities and are recognized only if (i) the amount of revenue can be reliably measured, (ii) it is probable that future economic benefits will flow to the entity and (iii) specific criteria are met for each of our activities as described below. Revenue will not be deemed to be reliably measured if all sale conditions are not resolved. We base our estimates on historical results, taking into consideration the type of customer, the type of transaction and the specifics of each arrangement. Revenue recognition is based on the following principles.
Sale of goods: Sales are normally recognized when the goods are delivered to the carrier and the ownership and risks of the products are transferred to the customer.
Revenue from sales of concentrates: Sales of concentrates are based on the prices of international quotes and in accordance with the contractual terms. Such revenue is initially recognized at a provisional price corresponding to the international quoted price on the shipping date. The amount of the provision for settlement is adjusted to reflect future prices according to international quotes at the closing date of each month, until a final adjustment is carried out to value the sales in accordance with the prices agreed upon with customers under contractual sales terms. The adjustments of provisional settlements are recognized in trade accounts receivable, against sales revenue when:
· the future price, mentioned above, for shipment or delivery, for a determined period (pre-final) settlement, or at the close of an accounting period is different to the price recorded.
· a debit or credit note is issued after the adjustments of the provision for settlement are recognized, based on the final weights or final contents, which results in a higher or lower amount, respectively, compared to the amount of the provision for settlement; and
· a debit or credit note is issued when the final price has been defined.
For additional information, see Note 25 to our consolidated financial statements included herein.
Determination of mineral reserves as basis to determine life of mine
Mineral reserves are deposits estimated to be economically feasible for extraction under economic conditions as of the applicable measurement date. The amortization method and rates applied to the rights to use natural resources reflect the pattern in which the benefits are expected to be used by us and based on the estimated life of mine. Any changes to life of mine, including as a result of changes in estimates of mineral deposits and mining plans, may affect prospective amortization rates and carrying values of these assets. The process of estimation of mineral deposits is based on a technical evaluation, which includes accepted geological, geophysics, engineering, environmental, legal and economic estimates. These estimates, when evaluated in the aggregate, can have a relevant impact on the economic viability of the mineral deposits. We use various assumptions with respect to expected future conditions, such as metal prices, inflation rates, exchange rates, technology improvements and production costs, among others. Estimates of mineral deposits are reviewed periodically, and any changes are adjusted to reflect life of mine and, consequently, adjustments to amortization periods. Costs for the acquisition of rights to explore and develop mineral properties are capitalized and amortized using the straight-line method over their useful lives. Considering the nature of our production year-on-year, the expense calculated under the straight-line method is not considered to be materially different as compared to the expense calculated under the unit of production method. Once the mine is operational, these costs are amortized and considered a production cost.
Use of public assets
The amount related to the use of a public asset is originally recognized as a financial liability (obligation) and as an intangible asset (right to use a public asset) which corresponds to the amount of the total annual charges over the period of the agreement discounted to present value (present value of the future cash flows).
Recently issued accounting standards and interpretations not yet adopted
For a discussion of new standards, interpretations and amendments to IFRS, see Note 3 to our consolidated financial statements.
The following table sets forth our summarized results of operations for the periods indicated.
|
| For the Year Ended |
| Variation |
| % of Net |
| ||||||||||
|
| 2017 |
| 2016 |
| 2015 |
| 2017/2016 |
| 2016/2015 |
| 2017 |
| 2016 |
| 2015 |
|
|
| (in millions of US$) |
| (percentage) |
| (percentage) |
| ||||||||||
Consolidated Income Statement Information: |
|
|
|
|
|
|
|
|
|
|
|
|
|
|
|
|
|
Continuing operations |
|
|
|
|
|
|
|
|
|
|
|
|
|
|
|
|
|
Net revenue from products sold |
| 2,449.5 |
| 1,964.8 |
| 1,865.2 |
| 24.7 |
| 5.3 |
| 100.0 |
| 100.0 |
| 100.0 |
|
Cost of products sold |
| (1,681.2 | ) | (1,439.1 | ) | (1,463.3 | ) | 16.8 |
| (1.7 | ) | (68.6 | ) | (73.2 | ) | (78.5 | ) |
Gross profit |
| 768.3 |
| 525.7 |
| 401.9 |
| 46.1 |
| 30.8 |
| 31.4 |
| 26.8 |
| 21.5 |
|
Operating expenses: |
|
|
|
|
|
|
|
|
|
|
|
|
|
|
|
|
|
Selling expenses |
| (89.2 | ) | (90.6 | ) | (84.6 | ) | (1.5 | ) | 7.1 |
| (3.6 | ) | (4.6 | ) | (4.5 | ) |
General and administrative expenses |
| (148.2 | ) | (127.3 | ) | (106.3 | ) | 16.4 |
| 19.8 |
| (6.1 | ) | (6.5 | ) | (5.7 | ) |
Other operating income (expenses), net |
| (129.2 | ) | (177.8 | ) | (47.1 | ) | (27.3 | ) | 277.5 |
| (5.3 | ) | (9.0 | ) | (2.5 | ) |
Operating profit before net financial results and loss from results of associates |
| 401.6 |
| 130.0 |
| 163.9 |
| 208.9 |
| (20.7 | ) | 16.4 |
| 6.6 |
| 8.8 |
|
Financial income |
| 29.9 |
| 25.0 |
| 19.3 |
| 19.6 |
| 29.5 |
| 1.2 |
| 1.3 |
| 1.0 |
|
Financial expenses |
| (106.2 | ) | (70.4 | ) | (61.6 | ) | 50.9 |
| 14.3 |
| (4.3 | ) | (3.6 | ) | (3.3 | ) |
Foreign exchange gains (losses), net |
| (53.9 | ) | 124.5 |
| (299.6 | ) | (143.3 | ) | (141.6 | ) | (2.2 | ) | 6.3 |
| (16.1 | ) |
Net financial results |
| (130.2 | ) | 79.1 |
| (341.9 | ) | (264.6 | ) | (123.1 | ) | (5.3 | ) | 4.0 |
| (18.3 | ) |
Loss from results of associates |
| 0.1 |
| (0.2 | ) | (0.3 | ) | (150.0 | ) | (33.3 | ) | — |
| — |
| — |
|
Profit (loss) before taxation |
| 271.5 |
| 208.9 |
| (178.3 | ) | 30.0 |
| (217.2 | ) | 11.1 |
| 10.6 |
| (9.6 | ) |
Current income tax |
| (125.7 | ) | (75.3 | ) | (62.8 | ) | 66.9 |
| 19.9 |
| (5.1 | ) | (3.8 | ) | (3.4 | ) |
Deferred income tax |
| 19.5 |
| (23.1 | ) | 101.5 |
| (184.4 | ) | (122.8 | ) | 0.8 |
| (1.2 | ) | 5.4 |
|
Profit (loss) for the year from continuing operations |
| 165.3 |
| 110.5 |
| (139.6 | ) | 49.6 |
| (179.2 | ) | 6.7 |
| 5.6 |
| (7.5 | ) |
Discontinued operations |
| — |
| — |
| (0.3 | ) | — |
| (100.0 | ) | — |
| — |
| — |
|
Profit (loss) for the year |
| 165.3 |
| 110.5 |
| (139.9 | ) | 49.6 |
| (179.0 | ) | 6.7 |
| 5.6 |
| (7.5 | ) |
For the Year Ended December 31, | Variation | % of Net Revenue from Products Sold | |||
2023 | 2022 | 2023/2022 | 2023 | 2022 | |
| (in millions of US$) | (percentage) | (percentage) | |||
| Consolidated income statement information: | |||||
| Net revenues | 2,573.2 | 3,034.0 | (15.2) | 100.0 | 100.0 |
| Cost of sales | (2,276.7) | (2,395.2) | (4.9) | (88.5) | (78.9) |
| Gross profit | 296.5 | 638.8 | (53.6) | 11.5 | 21.1 |
| Operating expenses: | |||||
| Selling, general and administrative | (126.9) | (145.5) | (12.8) | (4.9) | (4.8) |
| Mineral exploration and project evaluation | (99.7) | (98.9) | 0.8 | (3.9) | (3.3) |
| Impairment loss of long-lived assets | (114.6) | (32.5) | 252.6 | (4.5) | (1.1) |
| Other income and expenses, net | (110.6) | (2.7) | 4,035.5 | (4.3) | (0.1) |
| Operating income (loss) | (155.3) | 359.2 | (143.2) | (6.0) | (11.8) |
| Share in the results of associates | 23.5 | 1.9 | 1,148.6 | 0.9 | 0.1 |
| Results from equity investees | 23.5 | 1.9 | 1,148.6 | 0.9 | 0.1 |
| Financial income | 25.5 | 25.0 | 1.9 | 1.0 | 0.8 |
| Financial expenses | (204.2) | (168.7) | 21.0 | (7.9) | (5.6) |
| Other financial items, net | 17.0 | 9.9 | 71.3 | 0.7 | 0.3 |
| Net financial results | (161.6) | (133.7) | 20.9 | (6.3) | (4.4) |
| (Loss) income before income tax | (293.5) | 227.4 | (229.1) | (11.4) | 7.5 |
| Income tax benefit (expense) | 4.3 | (151.0) | (102.8) | 0.2 | (5.0) |
| Net (loss) income for the year | (289.2) | 76.4 | (478.6) | (11.2) | 2.5 |
Net revenue from products soldrevenues
In 2017,2023, net revenues from products sold increased decreased by 24.7%15.2%, or US$484.6 million. This increase was460.8 million, primarily due to the increasedecrease in base metalzinc and copper prices particularly zinc, which more than offset operational difficulties that resulted in 6.9% lower zinc equivalent production and 2.7% lower smelting sales comparedvolume, which was partially offset by higher mining production volumes. In 2023, zinc average LME prices (which is the key benchmark for our prices) increased by 23.9%, from US$3,478.3 per tonne in 2022 to 2016.US$2,646.6 per tonne in 2023. In 2016,2023, this decrease had a negative impact in our net revenues from products sold increased by 5.3%, orof approximately US$99.6 million. This increase was driven by higher490.6 million, based on our sales volumes of metallic zinc589.8kt in 2023 and the average LME price difference of US$831.7/t between 2023 and 2022. Additionally, we had a negative impact in our net revenues of approximately US$91.7 million, explained by lower smelting sales volume. Finally, copper prices, which decreased 3.6% from 560.3 thousand tonnesUS$8,797.0 per tonne in 20152022 to 573.1 thousand tonnesUS$8,477.8 per tonne in 2016, and an increase in sales volumes2023, had a negative impact of zinc oxide from 34.8 thousand tonnes in 2015 to 37.4 thousand tonnes in 2016.US$11.4 million. The increaseabove decrease in our net revenues was also drivenpartially offset by a positive impact of US$18.1 million, due to higher average realized prices for our metals as a result of an increase in market prices of zinc, lead and silver.
In 2017, zinc,mining production volumes related to higher copper and lead average LMEsales. For a discussion of the underlying reasons driving the change in commodity prices, increased by 38.2%, 26.8%see “Operating and 23.8%, respectively. In particular, the average LME priceFinancial Review and Prospects—Overview—Key factors affecting our business and results of zinc increased from US$2,094.75 per tonne in 2016 to US$2,895.94 per tonne in 2017. These increases were mainly a result of constraints in the global supply of zinc and lead, as well as an imbalance in supply and demand among copper mines and smelters and refineries. In 2016, the average LME price of zinc and lead increased by 8.6% and 4.9%, respectively. In particular, the average LME price for zinc increased by 8.6%, from US$1,928.30 per tonne in 2015 to US$2,094.75 per tonne in 2016. These increases were mainly a result of lower availability of zinc concentrates in the global market due to several production cuts and the depletion of large zinc mines in Australia and Ireland and a shortage of lead concentrates, which was partially offset by an increase in supply of lead from secondary sources, such as used batteries. In 2016, the average LME price of copper
decreased by 11.5%, mainly due to increased supply and high global stocks caused by the ramp up of large new operations and increased output in smaller mines.
operations—Metal Prices.”
The following table shows a breakdown of our net revenuerevenues by destination of our sales.
|
| For the Year Ended |
| ||||
|
| 2017 |
| 2016 |
| 2015 |
|
|
| (in millions of US$) |
| ||||
Peru |
| 696.5 |
| 573.9 |
| 584.5 |
|
Brazil |
| 721.6 |
| 560.9 |
| 534.1 |
|
Others |
| 1,031.3 |
| 830.1 |
| 746.6 |
|
Net revenues from products sold |
| 2,449.5 |
| 1,964.8 |
| 1,865.2 |
|
| 130 |
Results of Operations |
For the Year Ended December 31, | ||
2023 | 2022 | |
| (in millions of US$) | ||
| Peru | 654.2 | 859.8 |
| Brazil | 559.8 | 827.2 |
| Singapore | 229.3 | 166.4 |
| Switzerland | 209.3 | 124.7 |
| United States | 169.0 | 174.5 |
| Argentina | 94.1 | 94.4 |
| Chile | 83.5 | 120.1 |
| Luxembourg | 78.5 | 95.3 |
| China | 65.9 | - |
| Austria | 47.9 | 48.7 |
| South Africa | 41.4 | 55.9 |
| South Korea | 40.0 | 32.4 |
| Colombia | 36.1 | 64.0 |
| Japan | 32.1 | 71.4 |
| Taiwan | 26.9 | 65.0 |
| Turkey | 26.6 | 55.0 |
| Belgium | 19.8 | 17.9 |
| Malaysia | 18.7 | 26.0 |
| Netherlands | 16.0 | 13.6 |
| Ecuador | 14.6 | 15.4 |
| Italy | 9.5 | 9.6 |
| Vietnam | 5.0 | 8.4 |
| Other | 95.2 | 88.4 |
| Net revenues | 2,573.2 | 3,034.0 |
The following table sets forth the components of our production and sales volumes for the metals and periods indicated.
For the Year Ended December 31, | ||
2023 | 2022 | |
| Treatment Ore (in tonnes) | 13,846,530 | 12,343,018 |
| Mining Production—Metal Contained in Concentrate | ||
| Zinc contained in concentrates (in tonnes) | 333,154 | 296,403 |
| Copper contained in concentrates (in tonnes) | 33,385 | 33,219 |
| Lead contained in concentrates (in tonnes) | 65,194 | 57,448 |
| Silver contained in concentrates (in oz) | 10,300,672 | 9,974,462 |
| Gold contained in concentrates (in oz) | 27,627 | 27,216 |
| External Mining Sales—Metal Contained in Concentrate (1) | ||
| Zinc contained in concentrates (in tonnes) | 18,321 | 179 |
| Copper contained in concentrates (in tonnes) | 33,379 | 32,931 |
| Lead contained in concentrates (in tonnes) | 65,596 | 59,406 |
| Smelting Production—Zinc Contained in Product Volumes | ||
| Cajamarquilla (metal available for sale in tonnes) | 323,059 | 332,824 |
| Três Marias (metal available for sale in tonnes) | 148,354 | 149,592 |
| Juiz de Fora (2) (metal available for sale in tonnes) | 82,147 | 84,160 |
| Total zinc metal available for sale production (in tonnes) | 553,559 | 566,577 |
| Zinc Oxide Production—Zinc Contained in Product Volumes | ||
| Três Marias (Zinc oxide, contained zinc in tonnes) | 33,966 | 40,322 |
| Smelting Sales—Product Volumes | ||
| Metallic zinc (in tonnes) | 555,957 | 575,886 |
| Zinc oxide (in tonnes) | 33,885 | 40,315 |
| Total smelting sales volumes (in tonnes) | 589,843 | 616,200 |
|
| For the Year Ended |
| ||||
|
| 2017 |
| 2016 |
| 2015 |
|
Mining Production |
|
|
|
|
|
|
|
Zinc concentrates (in tonnes) |
| 791,583 |
| 860,399 |
| 866,679 |
|
Copper concentrates (in tonnes) |
| 169,582 |
| 158,503 |
| 154,998 |
|
Lead concentrates (in tonnes) |
| 96,006 |
| 104,408 |
| 94,875 |
|
Mining Production—Metal Contained in Concentrate |
|
|
|
|
|
|
|
Zinc contained in concentrates (in tonnes) |
| 375,402 |
| 416,869 |
| 425,883 |
|
Copper contained in concentrates (in tonnes) |
| 44,161 |
| 41,551 |
| 40,375 |
|
Lead contained in concentrates (in tonnes) |
| 52,572 |
| 59,181 |
| 54,611 |
|
Silver contained in concentrates (in oz.) |
| 7,590,282 |
| 8,315,215 |
| 7,643,741 |
|
Gold contained in concentrates (in oz.) |
| 32,534 |
| 27,893 |
| 17,934 |
|
External Mining Sales(1) |
|
|
|
|
|
|
|
Zinc concentrates (in tonnes) |
| 8,863 |
| 88,976 |
| 95,479 |
|
Copper concentrates (in tonnes) |
| 169,590 |
| 157,054 |
| 154,337 |
|
Lead concentrates (in tonnes) |
| 94,486 |
| 103,017 |
| 94,510 |
|
External Mining Sales—Metal Contained in Concentrate(2) |
|
|
|
|
|
|
|
Zinc contained in concentrates (in tonnes) |
| 4,459 |
| 49,004 |
| 54,319 |
|
Copper contained in concentrates (in tonnes) |
| 44,165 |
| 41,186 |
| 40,195 |
|
Lead contained in concentrates (in tonnes) |
| 50,631 |
| 58,538 |
| 54,433 |
|
Smelting Production—Zinc Contained in Product Volumes |
|
|
|
|
|
|
|
Cajamarquilla (metallic zinc in tonnes) |
| 309,925 |
| 334,261 |
| 330,113 |
|
Três Marias (metallic zinc in tonnes) |
| 185,829 | (3) | 186,708 | (3) | 177,956 | (3) |
Juiz de Fora (metallic zinc in tonnes) |
| 87,319 | (4) | 86,616 | (4) | 81,487 | (4) |
Total zinc product production (in tonnes) |
| 613,900 |
| 638,070 |
| 618,721 |
|
Smelting Sales—Product Volumes |
|
|
|
|
|
|
|
Metallic zinc (in tonnes) |
| 555,419 |
| 573,105 |
| 560,279 |
|
Zinc oxide (in tonnes) |
| 38,472 |
| 37,386 |
| 34,804 |
|
Total smelting sales volumes (in tonnes) |
| 593,891 |
| 610,491 |
| 595,083 |
|
Smelting Sales—Zinc Contained in Product Volumes(3) |
|
|
|
|
|
|
|
Metallic zinc (in tonnes) |
| 553,720 |
| 571,319 |
| 558,578 |
|
Zinc oxide (in tonnes) |
| 30,777 |
| 29,909 |
| 27,843 |
|
Total zinc contained in product volumes (in tonnes) |
| 584,497 |
| 601,228 |
| 586,421 |
|
| (1) | Based on typical zinc contents in metallic zinc products and zinc oxide. For more details, see “Information on the Company—Smelting operations—Zinc contained in smelting products sold.” |
| (2) | Including 3,067 tonnes of zinc ashes and drosses in 2023, and 3,710 in 2022. |
| 131 |
Results of Operations |
(1) Excluding intercompany sales.
(2) Based on typical zinc contents in metallic zinc products and zinc oxide. For more details, see “Information on the Company—Smelting operations—Zinc contained in smelting products sold.”
(3) Including 29,335 tonnes of zinc ashes and drosses, as well as metallic zinc used in the production of zinc oxide in 2017, 27,621 in 2016 and 26,320 in 2015.
(4) Including 2,453 tonnes of zinc ashes and drosses in 2017, 2,190 in 2016 and 3,251 in 2015.
Cost of products soldsales
In 2017,2023, our cost of products sold increasedsales decreased by 16.8%4.9%, or US$242.1118.4 million, primarilyof which approximately US$54.9 million was related to the positive impact of the reversal of the net realizable value provision of Aripuanã’s inventory and the positive impact of approximately US$166.0 million due to (i) higherlower smelting sales volume and lower third party zinc concentrate prices, which were partially offset by approximately US$102.5 million related to higher operational costs (excluding raw material).
Selling, general and administrative expenses
In 2023, our selling, general and administrative (“SG&A”) expenses decreased by 12.8%, or US$18.6 million, to US$126.9 million mainly as result of our organizational redesign that occurred in 2022 and lower third-party services in support areas.
Mineral exploration and project evaluation
In 2023, our mineral exploration and project evaluation expenses increased by 5.6%, or US$4.9 million, primarily in brownfield investments (mainly El Porvenir, Cerro Lindo, Aripuanã and Vazante) and exploration stage projects due to budget restrictions regarding the decrease in LME of base metals. In 2023, our exploration drilling (including infill drilling in Aripuanã) totaled 85.2 km, compared to 116.7 km in 2022, excluding Aripuanã infill drilling we drilled a total of 64.1 km.
Impairment loss
In 2023, Nexa performed its annual test and analyzed all impairment indicators and recorded a non-cash, pre-tax net impairment loss on long-lived assets of US$114.6 million (after-tax US$90.3 million), comprised of the Morro Agudo unit of Nexa Recursos Minerais S.A, and Nexa Resources Perú S.A.A. and subsidiaries.
For further information about our impairment assessments, please refer to Note 31 to our consolidated financial statements.
Other income and expenses, net
In 2023, our other income and expenses, net negatively impacted our smelting operations, (ii) safety-related processes implemented at our Peruvian mines and (iii) the depreciation of the U.S. dollar against the real and sol. The increase in concentrate prices represented 75.0% of the increase in cost of products sold,results by US$110.6 million, mainly due to the exposurerecognition of concentrate prices to variations in zinc LME prices, as well as an increase in purchases of zinc concentrates from third parties, mainlyexpenses related to operationsthe provisions of VAT discussions totaling US$86.9 million, variation of US$22.0 million in Offtake gains of US$2.3 million in 2023 versus a gain of US$24.3 million in 2022, the recognition of US$15.7 million related to Pollarix’s energy mark-to-market (“MTM”) balance and a variation of US$45.8 million referring to expenses recorded for the pre-operation of Aripuanã, which did not occur in 2023.
The following table sets forth our Cajamarquilla smelterother income and expenses, net for the periods indicated. For further information, please refer to Note 9 to our consolidated financial statements.
For the Year Ended December 31, | ||
2023 | 2022 | |
| (in millions of US$) | ||
| Other income and expenses, net | ||
| ICMS tax incentives | 32.3 | 56.7 |
| Changes in fair value of offtake agreement | 2.3 | 24.3 |
| Changes in fair value of derivative financial instruments | (1.4) | 1.4 |
| Loss on sale of property, plant and equipment | (3.7) | (0.7) |
| Changes in asset retirement and environmental obligations | (3.2) | (1.5) |
| Pre-operating expenses related to Aripuanã | - | (45.8) |
| Slow moving and obsolete inventory | (4.4) | (11.5) |
| Dams obligations | (7.0) | - |
| Provision for legal claims | (13.9) | (7.7) |
| Contribution to communities | (13.1) | (17.2) |
| Impairment of other assets | - | (9.3) |
| Tax voluntary disclosure – VAT discussions | (86.9) | - |
| Energy forward contracts – Changes in Fair Value | (15.7) | - |
| Others | 4.0 | 8.7 |
| Total other income and expenses, net | (110.6) | (2.7) |
| 132 |
Results of Operations |
Net financial results
We recognized a net financial expense of US$161.7 million in 2017 as2023 compared to 2016.
In 2016, our costa net financial expense of products sold decreased by 1.7%, or US$24.2 million.133.7 million in 2022. This decreaseincrease was primarily due to (i) a decrease in the consumption of zinc concentrates at our Cajamarquilla smelter in 2016 as compared to 2015, (ii) a decrease in purchase of zinc concentrates from third parties, mainly related to our Juiz de Fora smelter in 2016 as compared to 2015, and (iii) efficiency gains at our El Porvenir mine.
Selling expenses
In 2017, our selling expenses decreased 1.6%, mainly due to lower volume sold.
an increase of US$16.0 million related to the financial expenses of VAT discussions, an increase of US$11.8 million in financial expenses from factoring operations and a decrease of US$5.3 million in financial income from investments and, cash and cash equivalents.
In 2016,2023, our selling expensesfinancial income increased by 7.1%1.9%, or US$6.00.5 million, to US$25.5 million. This increase was mainly due to (i)the increase of US$5.7 million related to a monetary update on assets, interests and use of public assets, partially offset by the decrease of US$5.3 million in interest on financial investments and, cash and cash equivalents.
In 2023, our financial expenses increased by 21.0%, or US$35.5 million, to US$204.2 million. This increase was mainly due to an increase of 2.3%US$16.0 million mainly related to VAT discussions and 7.4% in our sales volumesan increase of metallic zinc and zinc oxide in 2016, respectively, (ii) an 11.2% increase in our exports sales in 2016, which resulted in higher expenses to access foreign markets, and (iii) a change in the Incoterms used for export sales by our Cajamarquilla smelter.
General and administrative expenses
US$11.8 million from factoring operations.
In 2017, our general and administrative expenses increased by 16.4%, or US$20.9 million, mainly due to the full year impact of our corporate restructuring that resulted in the redistribution of personnel expenses in our zinc, nickel and aluminum divisions starting in July 2016. Therefore, overhead expenses that were previously allocated between these three business divisions were assumed solely by us.
In 2016, our general administrative expenses increased by 19.8%, or US$21.0 million, mainly due to the corporate restructuring mentioned above that impacted half of the year 2016 compared to 2015.
Other operating results, net
In 2017,2023, our other operating expenses, net decreased by 27.3%, or US$48.6 million. This decrease is mainly explained by (i) a 94.0%, or US$45.7 million, increase in our projects expenses, (ii) our hiring of specialized consultants to review decommissioning plans of our Brazilian operational units in 2016, which resulted in a one-time US$69.0 million provision for environmental obligations, (iii) a US$15.6 million decrease in judicial provisions and (iv) a US$14.7 million decrease in hedge losses.
In 2016, our other operating expenses,financial items, net increased by 277.5%71.3%, or US$130.77.1 million, primarily as a result of (i) ato US$68.6 million17.0 million. This increase in the provision for environmental obligations, (ii) a 29.3% increase in our projects expenses and (iii) a net operating hedge loss of US$33.5 million recorded in 2016, compared to a net operating hedge gain of US$7.0 million recorded in 2015.
The following table sets forth our other operating expenses, net for the periods indicated. See Note 28 to our consolidated financial statements.
|
| For the Year |
| ||||
|
| 2017 |
| 2016 |
| 2015 |
|
|
| (in millions of US$) |
| ||||
Other operating expenses, net |
|
|
|
|
|
|
|
Environmental and asset retirement obligations |
| 433 |
| (68,605 | ) | — |
|
Mining obligations |
| (11,498 | ) | (8,967 | ) | (8,953 | ) |
Projects expenses |
| (94,280 | ) | (48,562 | ) | (37,623 | ) |
Net operating hedge gain (loss) |
| (18,785 | ) | (33,514 | ) | 7,045 |
|
Judicial (provision) reversion |
| 258 |
| (15,331 | ) | — |
|
Loss on sale of property, plant and equipment, and intangible assets |
| (694 | ) | (552 | ) | (3,446 | ) |
Gain on sale of investment |
| 4,588 |
| 408 |
| — |
|
Impairment of property, plant, equipment and intangibles |
| — |
| 979 |
| (8,574 | ) |
Other operating expenses, net |
| (9,243 | ) | (3,675 | ) | 4,446 |
|
Total other operating expenses, net |
| (129,221 | ) | (177,819 | ) | (47,105 | ) |
Net financial results
We recognized a net financial loss of US$130.2 million in 2017 compared to a net financial gain of US$79.1 million in 2016,was mainly due to the non-cash impact of exchange rate variation on U.S. dollar-denominated debt between Nexa Brazil and Nexa Resources. We recognized a net financial gain of US$79.1 million in 2016 compared to a net financial loss of US$341.9 million in 2015, mainly due to a US$424.1 million swing in the net foreign exchange gains (losses) when comparing a gain of US$124.5 million in 2016 to a loss of US$299.6 million in 2015.
Net foreign exchange gains (losses), reflectreflecting the accounting effect of the appreciation of the Brazilian real against the U.S. dollar on certain U.S. dollar-denominated loans made by Nexa Resources to Nexa Brazil (which uses the Brazilian real as its functional currency). During 2017,2023, the 1.5% depreciation3.3% average appreciation of the Brazilian real against the U.S. dollarDollar3 resulted in a foreign exchange loss. During 2016,gain.
Excluding the 19.8% appreciationeffect of the real against the U.S. dollar resulted in a foreign exchange gain. During 2015,variation, the 45.0% depreciation of the real against the U.S. dollar resultednet financial expense in a foreign exchange loss from Nexa Brazil’s U.S. dollar-denominated indebtedness.
In 2017, our financial income2023 increased by 19.6%, or US$4.9 million,23.8% to US$29.9 million. The increase in 2017 was due to a 77.8% increase in gains of financial investments due to a higher amount of financial investments. In 2016, our financial income increased by 29.5%, or US$5.7 million, to US$25.0 million (from US$19.3 million in 2015). The increase in 2016 was due to a 31.9% increase in gains of financial investments due to a higher amount of financial investments.
In 2017, our financial expenses increased by 50.9%, or US$35.8 million, to US$106.2 million due to an increase of 56.5%, or US$20.4 million, in interest on borrowings and US$8.2 million of interest on deferred revenue due to our silver streaming agreement with Triple Flag Mining Finance Bermuda Ltd. In 2016, our financial expenses increased by 14.3%, or US$8.8 million, to US$70.4179.8 million compared to US$61.6145.2 million in 2015, due to monetary adjustments to our provisions and higher interest on borrowings during 2016.2022, as a result of the aforementioned reasons.
Profit (loss)(Loss) income before income tax
As a result of the factors described above, our profitloss before income tax was US$271.5293.5 million in 2017,2023, as compared to a profitincome before income tax of US$208.9227.4 million in 2016 and a loss before income2022.
Income tax of US$178.3 million in 2015.
Income taxbenefit (expense)
In 2017,2023, we recorded an income tax expense of US$106.2 million. In 2016, we recorded an income tax expense of US$98.4 million compared to ana net income tax benefit of US$38.7 million in 2015.4.3 million.
In 2017,2023, our current income tax expense increaseddecreased by 67.0%48.4%, or US$50.471.1 million, to US$125.775.7 million, mainly due to the decrease in income before income tax for the year as a result of (i) income taxes paid or recovered in connection with our subsidiary VGmbH that are related to income tax from prior yearslower metal prices and income tax advances, (ii) paymentvolumes.
3 On December 31, 2023, the Brazilian real / U.S. dollar exchange rate at the end of withholding income tax in Luxembourg on dividends received from Peru, (iii) an increase in the Peruvian corporate income tax rate to 29.5% and (iv) an increase in LME prices. In 2016, our current income tax expense increased by 19.9%, or period was R$4.841/US$12.5 million, to US$75.3 million from US$62.8 million in 2015, mainly as a result of foreign exchange results in Brazil.
In 2017, we recorded a deferred income tax expense of US$19.5 million, mainly as a result of depreciation and amortization of fair value adjustment to property, plant, equipment and intangible assets. In 2016, we recorded a deferred income tax expense of US$23.1 million1.00 compared to a deferred income tax benefit of R$5.217/US$101.5 million in 2015, mainly as a result of foreign exchange results.1.00 on December 31, 2022.
| 133 |
Results of Operations |
In 2017, we had a nominal tax rate and an effective tax rate of 27.1% and 39.1%, respectively. The difference between the nominal and effective tax rates in 2017 is2023 and 2022 are primarily a result of permanent items that affect the calculation of current income taxes paid or recovered in Austria by our subsidiary Votorantim GmbHtax for the period, such as tax payments related to prior years and incomethe tax advances, paymentvoluntary disclosure agreement made with the State of withholding income taxMinas Gerais, impairment of goodwill in Luxembourg on dividends received from Peru, and special mining levy and mining taxes in Peru, partially offset by permanent tax adjustmentsexclusion of VAT tax incentives in Brazil and Peru, suchBrazil.
In 2023, we recorded a deferred tax income of US$80.0 million, mainly as non-deductible expenses. In 2016, we had a nominal tax rate and an effective tax rate of 29.2% and 47.1%, respectively, compared to a nominal tax rate and effective tax rate of 29.22% and 21.7%, respectively, in 2015. The difference between the nominal and effective tax rates in 2016 is primarily a result of changes in the incomerecognition of deferred tax rateasset over Brazil tax losses for the year and effects of exchange variation in Peru which impacted our deferred taxes over assets appreciationarising from the fluctuation of the historical exchange rate and the foreigncurrent exchange gains in Brazil. The tax treatmentrate of foreign exchange in Brazil implies a deferral of any foreign exchange results toproperty, plant and equipment and intangible assets.
Net (loss) income for the settlement date of the underlying transaction. In this case, the foreign exchange losses in 2015 generated an income tax benefit to be considered in the tax calculation in the future, when the related obligations and rights are settled. For additional information, see Note 20 to our consolidated financial statements.
Profit (loss)
year
As a result of the foregoing, we recordedhad a profitnet loss of US$165.3289.2 million in 20172023 as compared to a profitnet income of US$110.576.4 million in 2016 and a loss of US$139.9 million in 2015.2022.
Results by segment
The following table sets forth our summarized results of operations by segment for the periods indicated.
| For the Year Ended December 31, | Variation | Variation | ||
| 2023 | 2022 | 2023/2022 | 2023/2022 | |
| Consolidated Income Statement Information: | (in millions of US$) | (percentage) | ||
| Net revenues: | ||||
| Mining | 1,090.3 | 1,248.0 | (157.8) | (12.6) |
| Smelting | 1,946.7 | 2,467.0 | (520.3) | (21.1) |
| Intersegments Sales | (468.3) | (683.6) | 215.3 | (31.5) |
| Adjustments (1) | 4.5 | 2.6 | 2.0 | 76.3 |
| Total | 2,573.2 | 3,034.0 | (460.8) | (15.2) |
| Cost of sales: | ||||
| Mining | (1,028.3) | (905.2) | (123.0) | 13.6 |
| Smelting | (1,726.6) | (2,190.9) | 464.3 | (21.2) |
| Intersegments Sales | 468.3 | 683.6 | (215.3) | (31.5) |
| Adjustments (1) | 9.8 | 17.4 | (7.5) | (43.4) |
| Total | (2,276.8) | (2,395.2) | 118.4 | (4.9) |
| Gross profit: | ||||
| Mining | 62.0 | 342.8 | (280.8) | (81.9) |
| Smelting | 220.1 | 276.1 | (56.0) | (20.3) |
| Adjustments (1) | 14.4 | 20.0 | (5.6) | (27.9) |
| Total | 296.5 | 638.8 | (342.3) | (53.6) |
|
| For the Year Ended |
| Variation |
| Variation |
| ||||||||
|
| 2017 |
| 2016 |
| 2015 |
| 2017/2016 |
| 2016/2015 |
| 2017/2016 |
| 2016/2015 |
|
|
| (in millions of US$) |
| (percentage) |
| ||||||||||
Consolidated Income Statement Information: |
|
|
|
|
|
|
|
|
|
|
|
|
|
|
|
Net revenue from products sold: |
|
|
|
|
|
|
|
|
|
|
|
|
|
|
|
Mining |
| 1,213.2 |
| 907.4 |
| 770.7 |
| 305.8 |
| 136.7 |
| 33.7 |
| 17.7 |
|
Smelting |
| 1,952.0 |
| 1,492.0 |
| 1,421.3 |
| 460.0 |
| 70.7 |
| 30.8 |
| 5.0 |
|
Elimination and Adjustments(1) |
| (715.7 | ) | (434.6 | ) | (326.8 | ) | (281.1 | ) | (107.8 | ) | 64.7 |
| 33.0 |
|
Total |
| 2,449.5 |
| 1,964.8 |
| 1,865.2 |
| 484.7 |
| 99.6 |
| 24.7 |
| 5.3 |
|
Cost of products sold: |
|
|
|
|
|
|
|
|
|
|
|
|
|
|
|
Mining |
| (581.0 | ) | (513.1 | ) | (532.1 | ) | (67.9 | ) | 19.0 |
| 13.2 |
| (3.6 | ) |
Smelting |
| (1,698.3 | ) | (1,260.5 | ) | (1,170.5 | ) | (437.8 | ) | (90.0 | ) | 34.7 |
| 7.7 |
|
Elimination and Adjustments(1) |
| 598.2 |
| 334.6 |
| 239.4 |
| 263.6 |
| 95.2 |
| 78.8 |
| 39.8 |
|
Total |
| (1,681.1 | ) | (1,439.0 | ) | (1,463.2 | ) | (242.1 | ) | 24.2 |
| 16.8 |
| (1.7 | ) |
Gross profit: |
|
|
|
|
|
|
|
|
|
|
|
|
|
|
|
Mining |
| 632.2 |
| 394.3 |
| 238.6 |
| 237.9 |
| 155.7 |
| 60.3 |
| 65.3 |
|
Smelting |
| 253.7 |
| 231.5 |
| 250.8 |
| 22.2 |
| (19.3 | ) | 9.6 |
| (7.7 | ) |
Elimination and Adjustments(1) |
| (117.6 | ) | (100.1 | ) | (87.5 | ) | (17.6 | ) | (12.6 | ) | 17.6 |
| 14.4 |
|
Total |
| 768.3 |
| 525.7 |
| 401.9 |
| 242.6 |
| 123.8 |
| 46.1 |
| 30.8 |
|
(1) See Note 30
| (1) | See Note 2 to our consolidated financial statements. |
Mining
Mining
Net revenue from products sold
revenues
In 2017,2023, our net revenue from products soldrevenues in ourthe mining segment increaseddecreased by 33.7%12.6%, or US$305.8 million,157.8 million. This decrease was primarily due to an increase inlower LME base metal prices, forpartially offset by higher zinc and lead and copper, despite a 6.9% decrease in mining production, from 615.1 thousand tonnes of zinc equivalent production in 2016 to 572.4 thousand tonnes in 2017. In 2016, our net revenue from products sold increased by 17.7%, or US$136.7 million, primarily due to (i) an increase in LME prices of zinc, lead and silver, (ii) lower treatment charges and (iii) higher sales volume of lead and copper contained in concentrates.
volumes.
In 2017,2023, our production of zinc contained in concentrates decreasedincreased by 9.9%12.4% to 333.2 thousand tonnes in our mines,2023, primarily due to (i) unusually severe rainsthe increase in Peru in the first quarterproduction at Aripuanã and Vazante, as a result of 2017, (ii) a lower amount ofhigher treated ore due to the implementation of updated safety procedures implemented at our underground mines in Peruvolumes and (iii) lowerhigher average zinc grades. In 2016, ourOur production of zinc contained in concentrates decreased by 26.3% and 1.8% in our Atacocha and Cerro Lindo mines, respectively, due to lower zinc grades in both mines. In our El Porvenir, Vazante and Morro Agudo mines, we had an increase of production volume in 2016 due to higher run of mine production.
In 2017, our sales volumes of copper contained in concentrates increased by 7.2%,0.5% to 44.233.4 thousand tonnes of metal contained in concentrates, primarily due to higher copper grade in Cerro Lindo mine. In 2016, our sales volumes of copper contained in concentrates increased by 2.5%, to 41.2 thousand tonnes of metal contained in concentrates from 40.2 thousand tonnes in 2015, primarily due to a 2.9%the increase in our production of copper contained in concentrates. This increase was mainly due to a 5.3% increase in copper contained in concentrate production in our Cerro Lindo mine, which was a result of higher run of mine production. This positive result wasat Aripuanã, partially offset by lower sales volume of zinc contained in concentrates.
In 2017, our sales volumes of lead contained in concentrates decreased by 13.5%, to 50.6 thousand tonnes of metal contained in concentrates, primarily as a result of the same factors that drove the decrease in zinc contained in concentrates: (i) unusually severe rains in Peru in the first quarter of 2017, (ii) a lower amount of treated ore due to the implementation of updated safety proceduresproduction at Cerro Lindo. Finally, our underground mines in Peru and (iii) lower lead grades. In
2016, our salesproduction volumes of lead contained in concentrates increased by 7.5%,13.5% to 58.565.2 thousand tonnes of metal contained in concentrates from 54.4 thousand tonnes in 2015,2023 compared to 2022, primarily due to the increase in production at Aripuanã and Morro Agudo, as a result of an 8.4% increase in our production of lead contained in concentrates. The increase was primarily due to (i) increases in lead contained in concentrates in our Atacocha, Vazante, El Porvenir and Cerro Lindo mines, which was the result of higher run of mine production in Cerro Lindo, Atacocha and El Porvenir and (ii) higheraverage lead grades in El Porvenir, Vazante and Atacocha mines.higher treated ore volumes.
| 134 |
Results of Operations |
In 2017, our external sales2023, the only export volumes of zinc contained in concentrates decreased by 90.9%, to 4.5 thousand tonnes of metal contained in concentrates, primarily due to increased use zinc contained in concentrates within our own smelters. In 2016, our external sales volumes of zinc contained in concentrates decreased by 9.8%, to 49.0 thousand tonnes of metal contained inwere concentrates from 54.3 thousand tonnes in 2015, primarily dueAripuanã to a 2.1% decrease in our production of zinc contained in concentrates. This decrease was mainly due to a 26.3% and 1.8% decrease in zinc contained in concentrate production in our Atacocha and Cerro Lindo mines, respectively, as a result of lower zinc grades in both mines. These decreasesthird parties that were partially offset by a 1.4% and 1.1% increase in zinc contained in concentrate production in our El Porvenir mine, which was a result of increases in run of mine production.not within market specifications.
Cost of products soldsales
In 2017,2023, our cost of products soldsales in our mining segment increased by 13.2%13.6%, or US$67.9123.0 million, mainly due to the implementationeffect of updated safety proceduresAripuanã ramp-up activities explained by costs associated with a full-year of production in our mines and the depreciationcomparison to 2022, which was only a partial year of the U.S. dollar against the real and sol. The average exchange rate of reais to U.S. dollars decreased 8.3%, from 3.48 reais per U.S. dollar in 2016 to 3.19 reais per U.S. dollar in 2017. The average exchange rate of soles to U.S. dollars decreased 3.4%, from 3.37 reais per U.S. dollar in 2016 to 3.26 reais per U.S. dollar in 2017.production.
Smelting
Net revenues
In 2016,2023, our cost of products soldnet revenues in the smelting segment decreased by 3.6%21.1%, or US$19.0520.3 million, mainly due to better efficiency rateslower zinc prices and lower metal sales volumes, which was partially offset by higher metal premium.
Our total metal (zinc metal + zinc oxide) sales were 589.8 thousand tonnes in Atacocha and El Porvenir mines.
Smelting
Net revenue from products sold
In 2017, our net revenue from products sold in our smelting segment increased 30.8%2023, down 4.3%, or US$460.0 million, mainly due26.4 thousand tonnes compared to an increase2022, affected by lower production volumes of our smelters, in addition to a decrease in global demand, and lower domestic demand for zinc prices.oxide. In 2016,2023, our net revenue from products sold increased 5.0%, or US$70.7 million, mainly due to (i) an increase in zinc market prices and (ii) higher sales volume of metallic zinc and zinc oxide.
In 2017, our sales volumesmetal of metallic zinc (mainly SHG, CGG and alloys produced in our smelting facilities)556.0 thousand tonnes decreased by 3.1%3.5%, to 555.4 thousand tonnes. This decrease was mainly due to unusually severe rains in Peru during the first quarter of 2017. In 2016, our sales volumes of metallic zinc increased by 2.3%, to 573.1or 19.9 thousand tonnes in 2016 from 560.3 thousand tonnes in 2015. This increase was mainly due to increased consumption of zinc by Brazilian flat steel producers, which has increased exports to overseas markets, positively impacting zinc demand due to increased volumes and increased demand for export-quality flat steel specification, which requires higher zinc content.
versus 2022, following the same trend. In 2017,2023, our sales volumes of zinc oxide increaseddecreased by 2.9%15.9%, to 38.5 thousand tonnes. In 2016, our sales volumes of zinc oxide increased by 7.4%, to 37.4or 6.4 thousand tonnes, in 2016 from 34.8to 33.9 thousand tonnes in 2015. This increase was driven by (i) higher use of secondary raw material, maximizing the production of zinc oxide and (ii) the development of new regions and markets for the sale of zinc oxide.tonnes.
Cost of products sold
sales
In 2017,2023, our cost of products soldsales in our smelting segment increaseddecreased by 34.7%21.2%, or US$437.8464.3 million, primarily due to an increaselower sales volumes, the decrease in zincmetal prices and higher zinc TCs, positively impacting the zinc concentrate purchase price.
Non-IFRS Accounting Standards measures and reconciliation
Consolidated Adjusted EBITDA
In this report, we present Consolidated Adjusted EBITDA, which we define as net income (loss) for the year, adjusted by (i) share in the results of associates, depreciation and amortization, net financial results and income tax; (ii) non-cash events and non-cash gains or losses that do not specifically reflect our operational performance for the specific period (including: (loss) gain on sale of investments; impairment and impairment reversals; (loss) gain on sale of long-lived assets; write-offs of long-lived assets; and remeasurement in estimates of asset retirement obligations); and (iii) pre-operating and ramp-up expenses incurred during the commissioning and ramp-up phases of greenfield projects (currently, Aripuanã).
Our management uses Consolidated Adjusted EBITDA as an additional performance measure on a decreaseconsolidated basis, in treatment charges. In 2016,addition to, and not as a substitute for, net income. We believe this measure provides useful information about the performance of our costoperations as it facilitates consistent comparisons between periods, planning and forecasting of products sold increasedfuture operating results reflecting the operational performance of our existing business without the impact of interest, taxes, amortization, depreciation, non-cash items that do not reflect our operational performance for the specific reporting period and the impact of pre-operating and ramp-up expenses during the commissioning and ramp-up phases of greenfield projects (currently, only Aripuanã has reached these stages). Pre-operating and ramp-up expenses incurred during the commissioning and ramp-up of phases of Aripuanã are not considered infrequent, unusual or non-recurring expenses, as they have recurred in prior years with respect to Aripuanã and may recur in the future with respect to Aripuanã or any other projects that may reach the commissioning or ramp-up phases. Our management believes this adjustment is helpful because it shows our performance without the impact of specific expenses relating to a greenfield project that has reached the commissioning or ramp-up phases, with no connection with the performance of our other existing operations.
| 135 |
Results of Operations |
When applicable, Adjusted EBITDA also excludes the impact of (i) events that are non-recurring, unusual or infrequent, and (ii) other specific events that, by 7.7%their nature and scope, do not reflect our operational performance for the specific period in our management’s view. These events did not impact our Adjusted EBITDA in 2023 and 2022 but may impact future periods.
Our calculation of Adjusted EBITDA may be different from the calculation used by other companies, including our competitors in the mining industry, so our measures may not be comparable to those of other companies.
A reconciliation of Adjusted EBITDA to our net income for the years indicated is presented below.
For the Year Ended December 31, | ||
2023 | 2022 | |
| (in millions of US$) | ||
| Reconciliation of Adjusted EBITDA: | ||
| Net (loss) income for the year | (289.2) | 76.4 |
| Share in the results of associates | (23.5) | (1.9) |
| Depreciation and amortization | 298.4 | 290.9 |
| Net financial results | 161.6 | 133.7 |
| Income tax benefit (expense) | (4.3) | 151.0 |
| Other Adjustments (1) | - | - |
| Change in fair value of offtake agreement (2) | (2.3) | (24.3) |
| Impairment loss of long-lived assets (3) | 114.6 | 32.5 |
| Impairment of other assets (4) | - | 9.3 |
| Loss on sale of property, plant and equipment (5) | 3.7 | 0.7 |
| Remeasurement in estimates of asset retirement obligations (6) | (3.1) | (6.2) |
| Remeasurement adjustment of streaming agreement (7) | 10.1 | 10.6 |
| Ramp-up expenses of greenfield projects (Aripuanã) (8) | 15.5 | 87.5 |
| Energy forward contracts – Changes in Fair Value (9) | 15.7 | - |
| Tax voluntary disclosure – VAT discussion (10) | 87.0 | - |
| Dams obligations (11) | 7.0 | - |
| Adjusted EBITDA | 391.2 | 760.3 |
(1) Non-cash adjustment: Reversal of an impairment relating to immaterial PP&E assets.
(2) Non-cash adjustment: Derivative financial instrument related to an offtake sale contract.
(3) Non-cash adjustment: Cash generating unit and individual PP&E assets impairment loss.
(4) Non-cash adjustment: Value-added-taxes impairment loss.
(5) Non-cash adjustment: Results from sale and disposal of certain non-current assets.
(6) Non-cash adjustment: Asset retirement obligation remeasurement of discount rate and updated studies that are not subject to capitalization.
(7) Non-cash adjustment: Remeasurement of contractual obligation related to the forward sale contract of Cerro Lindo's Silver contained in the ore.
(8) Expenses related to pre-operating and ramp-up expenses incurred during the commissioning and ramp-up phases of greenfield projects which have not achieved their nameplate capacity. Once the Aripuanã operation is stabilized and operational at its nameplate capacity, such effects will no longer be excluded.
(9) Non-cash adjustment: The fair value adjustment of the energy surplus resulting from electric energy purchase contracts of the company’s subsidiary, Pollarix.
(10) Expenses related to the impact of accruals related to VAT discussions.
(11) Expenses related to the impact of the provisions related to dams obligations.
This definition of Adjusted EBITDA reflects a revision we made in December 2022, to exclude certain items, aiming to provide a better understanding of the operational performance of the Company’s business without the potential distortions from (i) pre-operating and ramp-up expenses incurred during the commissioning and ramp-up phases of greenfield projects (Aripuanã is currently the only greenfield project that has reached this phase) and (ii) certain non-cash events that do not specifically reflect our operational performance for the specific period (i.e., or US$90.0 million, primarily due to higher pricesloss (gain) on sale property, plant and equipment; remeasurement in estimates of electricity in Três Mariasasset retirement obligations, and Juiz de Fora. In addition, this increase was drivenremeasurement adjustment of streaming agreement).
| 136 |
Results of Operations |
Adjusted EBITDA by Segment
Adjusted EBITDA by segment is the main performance measure used by the higherchief operating decision maker to assess segment performance and to make decisions about resource allocation. Adjusted EBITDA information for Nexa’s segments is disclosed and reconciled with IFRS Accounting Standards numbers in Note 2 to Nexa’s financial statements. The use of Adjusted EBITDA as a segment performance measure is not considered a non-IFRS Accounting Standards financial measure.
A breakdown of Adjusted EBITDA by segment is presented below.
For the Year Ended December 31, | ||
2023 | 2022 | |
| (in millions of US$) | ||
| Breakdown of Adjusted EBITDA by segment: | ||
| Mining | 149.1 | 439.8 |
| Smelting | 247.0 | 326.4 |
| Other (1) | (4.9) | (5.9) |
| Adjusted EBITDA | 391.2 | 760.3 |
(1) Represents the residual component of Adjusted EBITDA either not pertaining to the mining or smelting segments, or, represents items that, because of their nature, are not being allocated to a specific segment.
Net Debt
We define net debt as (i) loans and financing and lease liabilities less (ii) cash and cash equivalents, less (iii) financial investments, plus/less (iv) the fair value of derivative financial liabilities or assets, respectively. Our management believes that net debt is an important figure because it indicates our ability to repay outstanding debts that become due simultaneously using available cash and highly liquid assets.
A reconciliation of net debt to loans and financing as of December 31, 2023 and 2022 is presented below.
As of December 31, | ||
2023 | 2022 | |
| (in millions of US$) | ||
| Calculation of Net Debt: | ||
| Loans and financings | 1,725.6 | 1,669.3 |
| Derivative financial instruments | 2.6 | 2.6 |
| Lease liabilities | 9.2 | 5.0 |
| Cash and cash equivalents | (457.3) | (497.8) |
| Financial investments | (11.1) | (18.1) |
| Net Debt | 1,269.1 | 1,161.0 |
Net Debt to Adjusted EBITDA
We define net debt to Adjusted EBITDA ratio as net debt divided by Adjusted EBITDA.
The calculation of our net debt to Adjusted EBITDA ratio for the periods indicated is presented below.
As of and For the Year | ||
2023 | 2022 | |
| (in millions of US$) | ||
| Calculation of Net Debt to Adjusted EBITDA Ratio: | ||
| Net debt (period end) | 1,269.1 | 1,161.0 |
| Adjusted EBITDA | 391.2 | 760.3 |
| Net Debt to Adjusted EBITDA Ratio | 3.24 | 1.53 |
| 137 |
Results of Operations |
Adjusted EBITDA Margin
We define Adjusted EBITDA margin as Adjusted EBITDA divided by net revenues. The calculation of our Adjusted EBITDA margin for the periods indicated is presented below.
For the Year Ended December 31, | ||
2023 | 2022 | |
| (in millions of US$) | ||
| Calculation of Adjusted EBITDA Margin: | ||
| Adjusted EBITDA | 391.2 | 760.3 |
| Net revenues | 2,573.2 | 3,034.0 |
| Adjusted EBITDA Margin | 15.2% | 25.1% |
Adjusted Working Capital
We calculate adjusted working capital as (i) trade accounts receivable, plus (ii) inventory, plus (iii) other assets, less (iv) trade payables, less (v) confirming payable, less (vi) salaries and payroll charges, less (vii) other liabilities. Our management believes that adjusted working capital is an important figure because it provides a relevant metric for the efficiency and liquidity of our operating activities.
The calculation of our adjusted working capital derived from our consolidated financial statements as of December 31, 2023 and 2022 is presented below.
As of December 31, | ||
2023 | 2022 | |
| (in millions of US$) | ||
| Calculation of Adjusted Working Capital: | ||
| Trade accounts receivables | 141.9 | 223.7 |
| Inventory | 339.7 | 395.2 |
| Other assets | 216.5 | 210.0 |
| Trade payables | (451.6) | (413.9) |
| Confirming payables | (234.4) | (216.4) |
| Other liabilities | (123.9) | (75.7) |
| Adjusted working capital | (111.8) | 123.0 |
Cash cost, net of by-products credits and related measures
In this report, we also present measures of costs that are widely used by peer companies operating in the mining and smelting industries. These performance measures are not IFRS Accounting Standards measures, and they do not have a standard meaning and therefore may not be comparable to similar data presented by other mining and smelting companies. They should not be considered as a substitute for costs of sales, costs of selling and administrative expenses, or as an indicator of costs. Similar measures are also calculated by Wood Mackenzie for many market participants, but Wood Mackenzie’s methodology differs from the methodology we use below.
Our management uses cash cost, net of by-products credits and related measures, among other measures, for internal planning and performance measurement purposes. We believe these measures provide useful information about the operational performance of our operations that facilitates period-to-period comparisons on a consistent basis.
In calculating cash cost, net of by-products credits, we account for transactions between our mining operations and our smelting operations using the same methodology we use to evaluate the performance of our mining and smelting segments. See Note 2 to our consolidated financial statements. We prepare an internal calculation based on transfer pricing adjustments made on an arm’s length principal basis. All information disclosed for cash cost, net of by-products credits is consistent with this methodology.
| 138 |
Results of Operations |
Mining operations
Cash cost, net of by-products credits: For our mining operations, cash cost, net of by-products credits includes all direct costs associated with mining, concentrating, leaching, solvent extraction, on-site administration and general expenses, any off-site services essential to the operation, concentrate freight costs, marketing costs and property and severance taxes paid to state or federal agencies that are not profit-related. Treatment and refining charges on metal sales, which are typically recognized as a deduction component of sales revenues, are added to cash cost. Cash cost is calculated on a contained zinc sold basis, which indicates the percentage of zinc concentrate duein metal sold, after the deduction of by-products credits attributable to higher LMEmining operations, such as copper, silver, gold, and lower treatmentlead, which are deducted from total cash cost.
charges. The increase was partially offset bySustaining cash cost, net of by-products credits: Sustaining cash cost, net of by-products credits is defined as the cash cost, net of by-products credits plus non-expansion capital expenditure, including sustaining health, safety and environment, modernization and other non-expansion-related capital expenditures.
All in sustaining cost, net of by-products credits: All in sustaining cost (“AISC”) is defined as sustaining cash cost, net of by-products credits plus corporate general and administrative expenses, royalties and workers’ participation.
Our cash cost and AISC net of by-products credits are measured with respect to zinc sold.
For mining operations, we present below cash cost, net of by-products credits, sustaining cash cost, net of by-products credits and all-in sustaining cost and a decrease in zinc concentrate consumption inreconciliation to our Cajamarquilla smelter.consolidated financial statements.
LIQUIDITY AND CAPITAL RESOURCESFor the year ended December 31, 2023
Vazante | Morro Agudo | Cerro Lindo | El Porvenir | Atacocha | Consolidation of Operations | Corporate | Mining | |
| Operations (in millions of US$, unless otherwise indicated) | ||||||||
| Sales Volume (Zinc Contained in Concentrate) | ||||||||
| Tonnes | 145,662 | 23,167 | 78,388 | 57,673 | 8,486 | 313,376 | 313,376 | |
| Cost of goods sold | 124.7 | 65.0 | 354.8 | 205.1 | 69.9 | 819.5 | (3.2) | 816.3 |
| On-site G&A | 0.5 | 0.5 | 0.7 | 1.5 | 1.0 | 4.2 | 4.2 | |
| By-product credits | (16.2) | (32.0) | (310.1) | (148.3) | (64.1) | (570.6) | 24.5 | (546.1) |
| Treatment and refining charges | 114.2 | 14.9 | 41.6 | 34.9 | 5.2 | 210.8 | 210.8 | |
| Selling expenses | 0.3 | (0.1) | 2.0 | 0.6 | 0.2 | 3.0 | 3.0 | |
| Depreciation and amortization | (24.1) | (4.5) | (86.2) | (45.7) | (17.3) | (177.8) | (0.1) | (177.8) |
| Royalties | (2.2) | (1.4) | (2.0) | (2.5) | (0.4) | (8.4) | (8.4) | |
| Workers’ participation & bonus | (1.9) | (1.0) | (5.2) | (2.8) | (0.9) | (11.7) | (11.7) | |
| Others | 0.5 | 0.1 | (6.6) | (6.5) | (1.8) | (14.3) | (14.3) | |
| Cash cost net of by-product credits (sold) | 195.7 | 41.6 | (10.9) | 36.4 | (8.1) | 254.7 | 21.3 | 276.0 |
| Cash cost net of by-product credits (sold) (US$/tonne) | 1,343.5 | 1,796.8 | (138.6) | 630.6 | (959.7) | 812.7 | 880.6 | |
| Non-expansion capital expenditure | 29.1 | 3.0 | 43.3 | 68.6 | 16.2 | 160.2 | 59.7 | 219.9 |
| Sustaining cash cost net of by-product credits (sold) | 224.8 | 44.6 | 32.4 | 105.0 | 8.1 | 414.8 | 81.0 | 495.8 |
| Sustaining cash cost net of by-product credits (sold) (per tonne) | 1,543.2 | 1,925.1 | 413.1 | 1,820.8 | 949.4 | 1,323.8 | 1,582.2 | |
| Workers’ participation & bonus | 1.9 | 1.0 | 5.2 | 2.8 | 0.9 | 11.7 | 11.7 | |
| Royalties | 2.2 | 1.4 | 2.0 | 2.5 | 0.4 | 8.4 | 8.4 | |
| Corporate G&A | 45.3 | 45.3 | ||||||
| AISC net of by-product credits (sold) | 561.2 | |||||||
| AISC net of by-product credits (sold) (per tonne) | 1,790.7 | |||||||
| 139 |
Results of Operations |
For the year ended December 31, 2022
Vazante | Morro Agudo | Cerro Lindo | El Porvenir | Atacocha | Consolidation of Operations | Corporate | Mining | |
| Operations (in millions of US$, unless otherwise indicated) | ||||||||
| Sales Volume (Zinc Contained in Concentrate) | ||||||||
| Tonnes | 131,527 | 18,700 | 85,910 | 52,001 | 9,560 | 297,699 | 297,699 | |
| Cost of goods sold | 116.0 | 63.8 | 396.5 | 167.9 | 75.4 | 819.6 | (1.8) | 817.8 |
| On-site G&A | 1.2 | 0.8 | 0.5 | 0.7 | 0.3 | 3.4 | 3.4 | |
| By-product credits | (10.3) | (22.6) | (351.2) | (123.3) | (72.2) | (579.7) | 11.7 | (568.0) |
| Treatment and refining charges | 91.3 | 9.6 | 39.9 | 27.6 | 5.1 | 173.5 | 173.5 | |
| Selling expenses | 0.4 | 1.4 | 1.8 | 0.6 | 0.5 | 4.7 | 4.7 | |
| Depreciation and amortization | (24.0) | (9.1) | (117.0) | (27.2) | (14.9) | (192.1) | (0.0) | (192.2) |
| Royalties | (2.1) | (1.4) | (5.6) | (3.8) | (0.9) | (13.8) | (13.8) | |
| Workers’ participation & bonus | (1.6) | (0.9) | (13.3) | (5.2) | (0.8) | (21.8) | (21.8) | |
| Others | (9.5) | (1.2) | 0.2 | 0.6 | (7.3) | (17.3) | (17.3) | |
| Cash cost net of by-product credits (sold) | 161.4 | 40.4 | (48.2) | 37.8 | (15.0) | 176.5 | 9.9 | 186.4 |
| Cash cost net of by-product credits (sold) (US$/tonne) | 1,227.5 | 2,160.5 | (561.4) | 727.7 | (1,566.2) | 592.8 | 626.0 | |
| Non-expansion capital expenditure | 41.9 | 6.8 | 42.5 | 36.7 | 4.5 | 132.4 | 69.4 | 201.8 |
| Sustaining cash cost net of by-product credits (sold) | 203.4 | 47.2 | (5.8) | 74.5 | (10.5) | 308.9 | 79.3 | 388.2 |
| Sustaining cash cost net of by-product credits (sold) (per tonne) | 1,546.2 | 2,523.8 | (67.1) | 1,433.6 | (1,096.6) | 1,037.5 | 1,304.0 | |
| Workers’ participation & bonus | 1.6 | 0.9 | 13.3 | 5.2 | 0.8 | 21.8 | 21.8 | |
| Royalties | 2.1 | 1.4 | 5.6 | 3.8 | 0.9 | 13.8 | 13.8 | |
| Corporate G&A | 52.0 | 52.0 | ||||||
| AISC net of by-product credits (sold) | 475.8 | |||||||
| AISC net of by-product credits (sold) (per tonne) | 1,598.1 | |||||||
OverviewSmelting operations
Cash cost, net of by-products credits: For our smelting operations, cash cost, net of by-products credits includes all the costs of smelting, including costs associated with labor, net energy, maintenance, materials, consumables and other on-site costs, as well as raw material costs. Cash cost is calculated on a contained zinc sold basis after the deduction of by-products credits attributable to smelting operations.
Sustaining cash cost, net of by-products credits: Sustaining cash cost, net of by-products credits is defined as the cash cost, after by-products credits plus non-expansion capital expenditure, including sustaining health, safety and environment, modernization and other non-expansion-related capital expenditures.
All in sustaining cost, net of by-products credits: All in sustaining cost is defined as sustaining cash cost, net of by-products credits plus general and administrative expenses and workers’ participation.
Our cash cost and AISC net of by-products credits are measured with respect to contained zinc sold, not considering resale operations of zinc from third parties. For our smelting operations, we present below cash cost, net of by-products credits, sustaining cash cost, net of by-products credits and all in sustaining cost and a reconciliation to our consolidated financial statements.
| 140 |
Results of Operations |
For the year ended December 31, 2023
Três | Juiz de | Cajamarquilla | Consolidation | Corporate | Smelting | |
| Operations (in millions of US$, unless otherwise indicated) | ||||||
| Sales Volume (Zinc Contained in Products) | ||||||
| Tonnes | 174,790 | 81,939 | 325,927 | 582,656 | 582,656 | |
| Cost of goods sold | 502.2 | 268.8 | 960.3 | 1,731.4 | (5.3) | 1,726.1 |
| Cost of services rendered | (22.4) | (9.5) | (43.5) | (75.4) | (75.4) | |
| On-site G&A | 1.4 | 0.7 | 5.5 | 7.5 | 7.5 | |
| Depreciation and amortization | (21.2) | (13.1) | (43.1) | (77.3) | (77.3) | |
| By-product credits | (14.2) | (26.9) | (135.6) | (176.7) | 5.3 | (171.4) |
| Workers’ participation & Bonus | (1.5) | (1.6) | (10.8) | (13.9) | (13.9) | |
| Others | 0.8 | 0.1 | 10.9 | 11.8 | 11.8 | |
| Cash cost, net of by-product credits (sold) | 445.2 | 218.5 | 743.7 | 1,407.3 | 0.0 | 1,407.3 |
| Cash cost, net of by-product credits (sold) (per tonne) | 2,546.9 | 2,666.3 | 2,281.7 | 2,415.4 | 2,415.4 | |
| Non-expansion capital expenditure | 22.2 | 14.4 | 34.5 | 71.1 | 13.9 | 85.0 |
| Sustaining cash cost, net of by-product credits (sold) | 467.4 | 232.9 | 778.1 | 1,478.4 | 13.9 | 1,492.3 |
| Sustaining cash cost net of by-product credits (sold) (per tonne) | 2,673.9 | 2,842.6 | 2,387.5 | 2,537.4 | 2,561.3 | |
| Workers’ participation | 1.5 | 1.6 | 10.8 | 13.9 | 13.9 | |
| Corporate G&A | 27.9 | 27.9 | ||||
| AISC net of by-product credits (sold) | 1,534.1 | |||||
| AISC net of by-product credits (sold) (per tonne) | 2,632.9 | |||||
For the year ended December 31, 2022
Três | Juiz de | Cajamarquilla | Consolidation | Corporate | Smelting | |
| Operations (in millions of US$, unless otherwise indicated) | ||||||
| Sales Volume (Zinc Contained in Products) | ||||||
| Tonnes | 180,029 | 83,084 | 334,076 | 597,189 | 597,189 | |
| Cost of goods sold | 621.4 | 325.2 | 1,219.4 | 2,166.1 | (6.1) | 2,159.9 |
| Cost of services rendered | (19.5) | (9.9) | (57.0) | (86.4) | (86.4) | |
| On-site G&A | 2.0 | 1.1 | 6.1 | 9.2 | 9.2 | |
| Depreciation and amortization | (18.4) | (13.1) | (47.2) | (78.7) | (78.7) | |
| By-product credits | (9.5) | (36.8) | (180.4) | (226.7) | 6.1 | (220.5) |
| Workers’ participation & Bonus | (1.6) | (1.3) | (13.7) | (16.6) | (16.6) | |
| Others | (13.5) | (6.0) | 14.7 | (4.8) | (4.8) | |
| Cash cost, net of by-product credits (sold) | 561.0 | 259.1 | 941.9 | 1,761.9 | 0.0 | 1,761.9 |
| Cash cost, net of by-product credits (sold) (per tonne) | 3,116.0 | 3,118.1 | 2,819.5 | 2,950.4 | 2,950.4 | |
| Non-expansion capital expenditure | 42.1 | 22.4 | 45.3 | 109.9 | (18.9) | 90.9 |
| Sustaining cash cost, net of by-product credits (sold) | 603.1 | 281.5 | 987.2 | 1,871.8 | (18.9) | 1,852.9 |
| Sustaining cash cost net of by-product credits (sold) (per tonne) | 3,350.1 | 3,387.9 | 2,955.1 | 3,134.4 | 3,102.7 | |
| Workers’ participation | 1.6 | 1.3 | 13.7 | 16.6 | 16.6 | |
| Corporate G&A | 31.0 | 31.0 | ||||
| AISC net of by-product credits (sold) | 1,900.6 | |||||
| AISC net of by-product credits (sold) (per tonne) | 3,183.0 | |||||
| 141 |
Liquidity and Capital Resources |
Liquidity and capital resources
Overview
In the ordinary course of business, our principal funding requirements are for working capital, requirements, capital expenditures relating to maintenance and expansion investments, servicing our indebtedness and distributions to our shareholders. We typically meet these requirements through operational cash flow,flows, long-term borrowings from private banks, and the Brazilian Economic and Social Development Bank (Banco Nacional de Desenvolvimento Econômico e Social), or BNDES,“BNDES”), international export credit agencies, and the issuance of debt securities in the international capital markets.
In October 2023, Nexa announced the successful closing of a US$320 million sustainability-linked revolving credit facility. The applicable margin is subject to compliance with carbon reduction key performance indicators, reflecting the Company’s commitment to reducing its carbon footprint. Such efforts are consistent with Nexa’s ESG ambitions, targeting net-zero greenhouse gas emissions by 2050, in alignment with the Paris Agreement.
Our financing strategy is to fund our necessary capital expenditures and to preserve our liquidity while meeting our debt payment obligations. We believe that our cash and cash equivalents on hand, cash from operations and available borrowings will be adequate to meet our capital expenditure requirements and liquidity needs for our current requirements.obligations. We may require additional capital to meet our longer-term liquidity and future growth requirements. Although we believe that our sources of liquidity are adequate, weaker economic conditions in Brazil, Peru or globally could materially adversely affect our business and liquidity.
Sources of funds
Our principal sources of funds are cash flows from operations long-term borrowings from banks and the BNDES and issuance of debt securities in the international capital markets.borrowings. The amountavailability of cash flows from operations is influencedaffected by our working capital requirements, share premium reimbursements, dividends and investment activities, as well as a need to service our indebtedness.
Uses of funds
During 2017, In 2023, we usedgenerated net cash flow generated by our operations primarily for working capital requirements, share premium reimbursements and investment activities, as well as to service our indebtedness. As of December 31, 2017, our consolidated cash, cash equivalents and financial investments totaled US$1,225.5 million, and our consolidated adjusted working capital totaled US$85.3 million.
Cash flows
The table below sets forth our cash flows from operating activities investing activitiesof US$246.8 million, a 7.4% decrease as compared to US$266.6 million in 2022, which was largely due to continued investments towards sustaining our current operations, including Aripuanã and financing activities for the years ended December 31, 2017, 2016 and 2015.our working capital needs.
|
| For the Year Ended |
| Variation |
| ||||||||||
|
| 2017 |
| 2016 |
| 2015 |
| 2017/2016 |
| 2016/2015 |
| 2017/2016 |
| 2016/2015 |
|
|
| (in millions of US$) |
| (percentage) |
| ||||||||||
Consolidated Statement of Cash Flows Information |
|
|
|
|
|
|
|
|
|
|
|
|
|
|
|
Net cash flows provided by (used in): |
|
|
|
|
|
|
|
|
|
|
|
|
|
|
|
Operating activities |
| 378.9 |
| 585.1 |
| 414.5 |
| (206.2 | ) | 170.5 |
| (35.2 | ) | 41.1 |
|
Investing activities |
| (328.4 | ) | (201.4 | ) | (156.7 | ) | (127.0 | ) | (44.7 | ) | 63.1 |
| 28.5 |
|
Financing activities |
| 52.8 |
| (92.2 | ) | (385.8 | ) | 145.0 |
| 293.6 |
| (157.3 | ) | (76.1 | ) |
Effects of exchange rates on cash and cash equivalents |
| — |
| 2.8 |
| (1.3 | ) | (2.8 | ) | 4.1 |
| (100.0 | ) | (315.4 | ) |
Increase (decrease) in cash and cash equivalents |
| 103.5 |
| 294.2 |
| (129.3 | ) | (190.7 | ) | 423.5 |
| (64.8 | ) | (327.5 | ) |
Cash and cash equivalents at the beginning of the year |
| 915.6 |
| 621.4 |
| 750.7 |
| 294.2 |
| (129.3 | ) | 47.3 |
| (17.2 | ) |
Cash and cash equivalents at the end of the year |
| 1,019.0 |
| 915.6 |
| 621.4 |
| 103.4 |
| 294.2 |
| 11.3 |
| 47.3 |
|
Uses of funds
In 2017,the ordinary course of business, our net cash flow provided by operating activities decreased by 35.2%, or US$206.2 million, primarily dueprincipal funding requirements are related to the US$250.0 million of upfront proceeds thatcapital expenditures, dividend payments and debt service. In 2023, we received in 2016 in connection with the silver streaming agreement, which was partially offset by decreases in trade receivables and inventory of US$9.0 million and US$46.9 million, respectively. In 2016,also used funds to invest towards sustaining our net cash flow provided by operating activities increased 41.1%, or US$170.5 million, primarily due to an upfront payment of US$250.0 million in connection with the silver streaming agreement pursuant to which we sold the future silver production ofcurrent operations, for our Cerro Lindo mine to a third party, US$42.3 million in salaries and payroll charges, US$36.4 million in accounts payable and other liabilities and
US$28.4 million of confirming payable transactions. These increases were partially offset by US$110.5 million and US$128.5 million in trade accounts receivable and inventory, respectively.
In 2017, adjusted working capital increased by US$11.3 million,needs and for taxes and interest to US$85.3 million, mainly due to the increase in trade account receivables and inventories. In 2017, our net cash flow used in investing activities increased by 63.1%, or US$127.0 million, mainly due to our US$81.6 million payment to CBA in connection with the Pollarix acquisition. In 2016, adjusted working capital increased by US$35.6 million, to US$74.0 million, mainly due to the fluctuation on LME prices and the average exchange rate in inventory and trade accounts receivable which was partially offset by an increase in trade payables and confirming payable. In 2016, our net cash flow used in investing activities increased 28.5%, or US$44.7 million, mainly due to a decrease of US$38.6 million related to VSA’s settlement of an intercompany receivable related to the sale by VMZ of income tax and social contribution credits for the payment of tax debts by related parties.service debt.
In 2017, our net cash flow used in financing activities decreased by 157.3%, or US$145.0 million, primarily due to the proceeds from our initial public offering, which increased our share capital and share premium by US$306.4 million in 2017. This decrease was partially offset by the capital increase of US$170.1 million in 2016 paid by our minority shareholders. The share premium is a reserve account of the net equity of a Luxembourg company, in which the premium on the issuance of shares is accounted. Since we offered 20,500,000 shares in the initial public offering at a nominal value of US$1.00 each, a portion—US$20.5 million—of the initial public offering proceeds were allocated to share capital, while the remaining amount after expenses, which represents the premium on the issuance of the shares, was allocated to the share premium reserve according to the accounting rules. We do not intend to allocate further amounts in this reserve. In 2016, our net cash flow used in financing activities decreased by 76.1%, or US$293.6 million, primarily due to the increase of new loans and financing of US$527.5 million which was partially offset by the amortization of loans and financings in an amount of US$202.4 million.
In 2017, our cash and cash equivalents increased by 11.3%, or US$103.4 million, mainly due to a decrease of US$206.2 million in net cash flows provided by operating activities and an increase of US$127.0 million used in investing activities, which was partially offset by an increase of US$145.0 million in net cash flows used in financing activities. In 2016, our cash and cash equivalents increased by US$294.2 million, mainly due to an increase of US$170.5 million in net cash flows provided by operating activities and a decrease of US$293.6 million used in financing activities, which was partially offset by an increase of US$44.7 million in net cash flows used in investing activities.
Capital expenditures
Our capital expenditures in 2017 totaled2023 amounted to US$197.6 million, including309.0 million. Of this amount, 1.2% was allocated to expansion projects, mainly driven by the Vazante mine deepening project, waste treatmentin line with our annual guidance due to lower than expected HS&E and damother non-expansion investments.
Non-expansion projects, at Três Mariaswhich includes sustaining and El Porvenir,HS&E, among others, accounted for 98.8% of the Ambrosia mine project and a pump station project at Vazante.
total capital expenditures (or US$305.3 million) in 2023, including US$79.4 million of Aripuanã.
For 2018, our estimated capital expenditures total2024, we have budgeted US$280.4311.0 million to invest in our operations and projects that are currently underway. Our main projects include a life of mine extension and implementation of dry stacking tailings in Vazante, for which we have budgeted US$43.0 million and US$22.0 million, respectively. In addition, we intend to use US$20.0 million for the ongoing feasibility study and potential execution of the Aripuanã greenfield project, and US$20.0 million for the conversion to Jarosite process at the Cajamarquilla smelter to increase zinc recovery. For more information about the specific projects for which we have budgeted funds, see “Information on the Company—Capital expenditures.”
Expenses related to exploration and project evaluation
In 2023, exploration expenses were US$57.2 million, mainly driven by brownfield investments with the objective of extending the life of the mines we are currently operating (mainly in Cerro Lindo, Aripuanã, Vazante and El Porvenir) and copper exploration phase projects to support our growth strategy. We continue with efforts to replenish and increase available mineral resources as part of our long-term strategy, advancing mineral exploration activities, focusing mainly on identifying new ore bodies through drilling campaigns and preserving our investments in greenfield projects and business development analysis.
| 142 |
Liquidity and Capital Resources |
Project evaluation investment amounted to US$35.1 million in 2023, including approximately US$27.4 million directed towards brownfield projects in FEL1 and explorationFEL2 stages and US$1.4 million to greenfield projects in the same stages.
As weWe expect to continue to advance with our exploration and drilling campaigns and develop our pipeline of projects,projects. In 2024, we expect our expenses to increase in 2018. This increase impacts our margins because early-stage projects are accounted for as other operating expenses. In 2018, we expectestimate to spend US$139.858.0 million on expenses relating primarily to drilling campaigns in brownfield projects (mainly in Cerro Lindo, Vazante and Aripuanã) to expand the mineral resources and mineral reserves inventory, and on the development of our copper portfolio in the exploration stage.
Distributions
On March 24, 2023, we paid approximately US$25.0 million (US$0.19 per common share) of share premium (or special dividend) to our shareholders. This share premium will be ratified, in accordance with Luxembourg laws, by our shareholders at the annual shareholders’ meeting for early-stage projects, including US$86.2 million with respect to mineral exploration and US$53.6 million with respect to project development.
Distributions and repurchasesthe fiscal year ended December 31, 2023, which will occur on June 13, 2024.
During 2017, we made distributions to our shareholders through share premium reimbursements. The share premium is a reserve account of the net equity of a Luxembourg company and can be distributed to the shareholders. We distributed US$430.0 million as share premium reimbursements to our shareholders during 2017, including US$140.0 million in the first half of 2017 and US$290.0 million after July 1, 2017, represented by a US$140.0 million share premium reimbursement on September 15, 2017 and a US$150.0 million share premium reimbursement on October 20, 2017. The US$150.0 million share premium reimbursement was funded by dividends paid by our subsidiary Nexa Peru to its shareholders on October 16, 2017 in the total amount of US$335.0 million, of which Nexa Peru’s non-controlling shareholders received US$58.3 million and we received US$268.7 million (net of US$8.0 million in Peruvian withholding tax). In October 2017, US$285.0 million of the proceeds from our initial public offering were allocated to share premium. On February 15, 2018, the board of directors approved the distribution of a US$80.0 million share premium reimbursement, corresponding to US¢60.0 per share paid to the shareholders on March 28, 2018. We have not incurred indebtedness to fund these distributions to our shareholders, and we do not expect to incur indebtedness to fund such distributions in the future. Because any future payment of dividends or other distributions pursuant to our dividend policy will be subject to the approval of our board of directors or our shareholders, as applicable, based on a number of factors, including but not limited to, our cash balance, cash flow, earnings, capital investment plans, other potential cash disbursements, expected future cash flows from operations and strategic plans, as well as legal requirements and other factors we may deem relevant at the time. See “Share ownership and trading—Distributions.”
We did not repurchase any of our shares in 2017.
Debt
As of December 31, 2017,2023, our total outstanding consolidated indebtedness (non-current(current and currentnon-current loans and financings)financings, including accrued interest as of December 31, 2023) is US$1,447.31,725.6 million, consisting of US$40.8143.2 million of short-term indebtedness, including the current portion of long-term indebtedness (or 2.8%8.3% of the total indebtedness), and US$1,406.51,582.4 million of long-term indebtedness (or 97.2%91.7% of the total indebtedness). As of December 31, 2017, our totalOur outstanding consolidated indebtedness guaranteedincreased by sureties was US$93.4 million, which represented 6.0% of the total consolidated indebtedness.3.4% compared to December 31, 2022.
Our U.S.-dollarU.S. dollar denominated indebtedness as of December 31, 20172023 was US$1,285.51,446.2 million (or 89.0% of our total indebtedness) and our foreign currency-denominated indebtedness was US$161.8 million (or 11.0%83.8% of our total indebtedness), of whichour Brazilian real denominated indebtedness was US$161.8279.3 million (or 11.0%16.2% of theour total indebtedness) was real-denominated consolidated indebtedness and the remaining US$1,285.5 million was denominated in other currencies and currency baskets..
As of December 31, 2017,2023, US$317.6513.0 million, or 22.0%29.7% of our total consolidated indebtedness, bears interest at floating rates, including US$86.4279.3 million of real-denominated indebtedness that borebear interest at rates based on the CDI rate, SELIC rate or TJLP rateTaxa de Juros de Longo Prazo (“TJLP”) and Taxa de Longo Prazo (“TLP”) rates (the long-term interest raterates set by the Brazilian National Monetary Council and the basic costcosts of financing of the BNDES), and US$231.2233.7 million of foreign currency-denominated indebtedness that borebear interest at rates based on LIBOR orSOFR.
Only 8.3% (US$143.2 million) of the BNDES Monetary Unit (Unidade Monetária BNDES or UMBNDES), rate.total debt matures in 2024, 5.9% (US$101.9 million) matures between 2025 and 2026, while 85.8% (US$1,480.5 million) of total debt matures in and after 2027.
We continuously assess short-term and mid-term commodities prices, Nexa’s capital structure, financial position and the quantum and maturity profile of our debt. Actions in relation to our capital structure, including, but not limited to, improving the profile of outstanding debt, focusing on extending maturity and assessing financing alternatives are constantly being evaluated.
The following table sets forth selected information with respect to our total outstanding consolidated indebtedness as of December 31, 2017.2023.
As of December 31, 2023 | ||||
Indebtedness | Average Annual Interest Rate | Current | Long-term | Total |
| (in millions of US$) | ||||
| Eurobonds – USD | Pre-USD + 5.84% | 18.5 | 1,194.0 | 1,212.6 |
| BNDES | TJLP + 2.82% SELIC + 3.10% TLP – IPCA + 5.46% | 28.6 | 180.3 | 208.9 |
| Export Credit Notes | SOFR + 1.85% 134.20% CDI SOFR + 2.5% | 95.7 | 142.1 | 237.9 |
| Other | SOFR + 2.57% | 0.3 | 65.9 | 66.2 |
| Total | 143.2 | 1,582.4 | 1,725.6 | |
|
|
|
| As of December 31, 2017 |
| ||||
Indebtedness |
| Average Annual Interest Rate |
| Current |
| Long-term |
| Total |
|
|
|
|
| (in millions of US$) |
| ||||
Debt with banks |
| 3-month LIBOR plus 2.57% |
| 0.4 |
| 199.2 |
| 199.6 |
|
|
| 6-month LIBOR plus 2.51% |
|
|
|
|
|
|
|
Eurobonds (US$) |
| 5.19% Fixed USD |
| 8.8 |
| 1,032.7 |
| 1,041.4 |
|
BNDES |
| TJLP plus 2.68% |
| 19.8 |
| 73.7 |
| 93.4 |
|
|
| 4.74% Fixed BRL |
|
|
|
|
|
|
|
|
| SELIC plus 2.78% |
|
|
|
|
|
|
|
|
| UMBNDES plus 2.44% |
|
|
|
|
|
|
|
|
|
|
| As of December 31, 2017 |
| ||||
Indebtedness |
| Average Annual Interest Rate |
| Current |
| Long-term |
| Total |
|
|
|
|
| (in millions of US$) |
| ||||
Export credit note |
| 118.00% CDI |
| 1.1 |
| 61.6 |
| 62.7 |
|
|
| 3-month LIBOR plus 1.85% |
|
|
|
|
|
|
|
Finep |
| TJLP plus 0.68% |
| 0.7 |
| 2.1 |
| 2.7 |
|
Debentures |
| 107.77% CDI |
| 8.9 |
| 32.4 |
| 41.3 |
|
Finame |
| 4.59% Fixed BRL |
| 0.4 |
| 1.4 |
| 1.8 |
|
Other (US$) |
| 5.93% Fixed USD |
| 0.8 |
| 3.5 |
| 4.3 |
|
Total |
|
|
| 40.8 |
| 1,406.5 |
| 1,447.3 |
|
(1)Includes principal and interest.
| 143 |
Liquidity and Capital Resources |
As of December 31, 2017,2023, US$93.4208.9 million remains outstanding under our loan agreements with BNDES withregarding to Nexa Brazil as borrower and Hejoassu Administração S.A. and our controlling shareholder VSA as guarantors.Brazil’s facility agreement which are guaranteed only by Nexa Resources.
ManySome of our debt instruments also contain other covenants that restrict, among other things, our ability and the ability of certain of our subsidiaries to incur liens and merge or consolidate with any other person or sell or otherwise dispose of all or substantially all of its assets. These instruments also contained covenants requiring that we comply with certain financial ratios, including:
· a debt service coverage ratio of 1.0:1.0;
· a net debt to EBITDA ratio of 4.0:1.0; and
· a total debt to total capitalization ratio of 0.7:1.0.
| · | a debt service coverage ratio of 1.0:1.0; |
| · | a net debt to EBITDA ratio of 4.0:1.0; and |
| · | a total debt to total capitalization ratio of 0.7:1.0. |
As of December 31, 2017,2023 we were in compliance with thesethe above stated ratios.
Short-term indebtedness and revolving credit lines
Our consolidated short-term indebtedness, including the current portion of our long-term debt, was US$40.8143.2 million, including principal and interest, as of December 31, 2017.2023.
In October 2023, we announced the closing of a US$320 million sustainability-linked revolving credit facility, which replaces Nexa’s 2019 US$300 million revolving credit facility that was set to mature in October 2024. The new sustainability-linked credit facility supports Nexa’s liquidity profile and the applicable margin is subject to compliance with carbon reduction key performance indicators, reflecting the Company’s commitment to reducing its carbon footprint. Such efforts are consistent with Nexa’s ESG ambitions, targeting net-zero greenhouse gas emissions by 2050, in alignment with the Paris Agreement. The new facility is guaranteed by Nexa Brazil and Nexa CJM and will mature on October 20, 2028, and amounts drawn are subject to an initial interest rate of 1.60% plus Term SOFR per annum. As of December 31, 2017,2023, no amounts were drawn under this facility.
In March 2024, we had access toentered into a committed line of credit4131 Note agreement in an aggregatethe total principal amount of US$500.0R$150 million under(approximately €30 million) at an annual gross interest rate of 5.6%, maturing in June 2024. Additionally, a revolving credit facilityGlobal Derivatives Contract was established to swap the currency fluctuation of the euro to hedge this loan operation at a cost of CDI + 0.90%.
Also in March 2024, we extended by five years, one of our remaining Export Credit Notes which was maturing on October 2024 with a syndicatecost of financial institutions, orTERM SOFR + 2.4%, in the VSA Revolving Facility. Thistotal initial facility was entered into by VSA, as borrower and guarantor, and Nexa Resources, VGmbH, Nexa CJM, Nexa Brazil and other subsidiariesamount of VSA, as borrowers, on June 29, 2015. Loans under the VSA Revolving Facility are guaranteed by VSA and bear interest at a rate of LIBOR plus an applicable margin that varies based upon VSA’s credit rating. Loans under the VSA Revolving Facility have a final maturity date of July 29, 2020. As of December 31, 2017, no disbursements had been made to any of the borrowers under this facility.
US$90.0 million.
We believe that we will continue to be able to obtain sufficient credit to finance our working capital needs based on current market conditions and our liquidity position. See “Risk factors—Financial risk— Our business requires substantial capital expenditures and is subject to financing risks.”
Long-term indebtedness
The following discussion briefly describes our principal financing agreements as of December 31, 2017.the date of this annual report. For additional information, see Note 24 to our consolidated financial statements.
| 144 |
Liquidity and Capital Resources |
Debentures. On March 22, 2024, Nexa Recursos Minerais S.A. (Nexa Brazil), a wholly-owned subsidiary of Nexa Resources, announced the public offering of 650,000 non-convertible ESG-linked debentures, each with a par value of R$1,000.00, totaling R$650 million (approximately US$130 million). The debentures mature on March 28, 2030, are unsecured, bullet, and bear interest at 100% of CDI interest rate plus 1.50% per annum. The settlement date is expected to occur between March 28, 2024 and April 3, 2024, and will be characterized as debentures linked to ESG targets, aligning with the same ESG framework of our US$320 million sustainability-linked revolving credit facility mentioned above. The offering is part of Nexa’s balance sheet and liability management strategy.
Export credit notes.4131 Note. In December 2023, we entered into a 4131 Note agreement in the first quartertotal principal amount of 2017, Nexa Brazil issued to Banco ABN Amro S.A. a R$100.0US$50 million (US$31.2 million aswith maturity date of five years and costs of 2.57% plus TERM SOFR. As of December 31, 2017) export credit note2023, our outstanding principal amount under this 4131 Note was US$50.2 million.
Export Credit Notes. In March and April 2020, we entered into five Export Credit Note agreements in the total principal amount of R$1,477 million (approximately US$300 million) with maturity dates between one and five years and costs between 134.2% of CDI and CDI +1.8% up to CDI + 4.2%. In 2020, we prepaid the principal and accrued interest of two Export Credit Notes. As of December 31, 2023, our outstanding principal amount under the two remaining Export Credit Notes was US$145.8 million. In March 2024, we extended by five years, one of our remaining Export Credit Notes which was maturing on October 2024 with a cost of TERM SOFR + 2.4%, in the total initial facility amount of US$90.0 million.
Export Credit Notes. On March 18, 2022, we entered into an Export Credit Note agreement in the total principal amount of US$90 million with a maturity date of five years and costs of 2.5% plus TERM SOFR. As of December 31, 2023, our outstanding principal amount under these Export Credit Notes was US$92.1 million.
Nexa Resources Bonds due February2028. On June 18, 2020, we issued an aggregate principal amount of US$500.0 million in bonds maturing in 2028 and bearing interest at 118.0% of the CDI rate. In the second quarter of 2017,6.500% per year. The bonds are guaranteed by our subsidiaries Nexa Brazil, issued to Banco Citibank S.A. a US$31.4 million export credit note due April 2020Nexa Peru and bearing interest at three-month LIBOR plus 1.85%. Each export credit note is guaranteed by Nexa Resources.CJM. As of December 31, 2017,2023, the aggregate outstanding amount under these export credit notesbonds was US$62.7510.7 million, which is related to a principal amount of US$500.0 million plus an accrual of US$14.7 million related to interest, net of borrowing costs of US$10.7 million.
Nexa Resources Bond.Bonds due 2027. On May 4, 2017, we issued an aggregate principal amount of US$700.0 million in bonds maturing in 2027 and bearing interest at 5.375% per year, receiving net proceeds of US$691.2 million.year. The proceeds from our initial public offering were used to repay a portion of our existing consolidated debt with banks, thereby extending the maturity of our outstanding debt. These securitiesbonds are guaranteed by our subsidiaries Nexa
Brazil, Nexa Peru and Nexa CJM. As of December 31, 2017,2023, the outstanding amount under these bonds was US$695.9701.8 million, which is related to a principal amount of US$700.0 million plus an accrual of US$5.96.0 million related to interest, net of borrowing costs of US$10.31.8 million. See Note 1(ii) to our consolidated financial statements.
Export prepayment facilities. In November and December 2016, VGmbH entered into three separate export prepayment facility agreements with ABN Amro Bank N.V., Natixis New York Branch and Banco Bilbao Vizcaya Argentaria, S.A., in an aggregate amount of US$275.0 million, maturing in 2021. Loans under these facilities bear interest at LIBOR plus an applicable margin that ranges between 2.50% and 2.75%. Of the US$275.0 million, US$100.0 million is guaranteed by Nexa Resources and Nexa CJM and US$175.0 million is guaranteed by Nexa Resources, Nexa Brazil and Nexa CJM. These export prepayment facilities are secured by liens on certain collection accounts associated with these facilities. The proceeds of these loans were used to repay a portion of the existing 2014 export prepayment facility described below. As of December 31, 2017, the outstanding principal amount under these loan agreements was US$199.6 million, including US$99.6 million with Natixis New York Branch and US$100.0 million with ABN Amro Bank N.V.
Nexa Peru Bond. On March 28, 2013, Nexa Peru issued 4.625% senior notes due 2023, or the 2023 Notes, in an aggregate principal amount of US$350.0 million, maturing on March 28, 2023. The 2023 Notes bear interest at a rate of 4.625% per annum, payable on a semi-annual basis on March 28 and September 28 of each year. As of December 31, 2017, the outstanding amount under these notes was US$345.5 million.
BNDES and FINEP. BNDES has been an important source of debt financing for our capital expenditures in Brazil. We, through our Brazilian subsidiaries, have entered into several loan agreements with BNDES for the expansion and modernization of certain fixed assets, studies and engineering projects, environmental investments and the acquisition of machinery and equipment. As of December 31, 2017,2023, our aggregate outstanding principal amount under BNDES loan agreements was US$93.4208.9 million. For further details on our long-term financings with BNDES, please see the table below.
In October 2020, we disbursed the first tranche of the Credit Facility Agreement related to the Aripuanã Project signed with BNDES in the amount of approximately R$225.0 million or US$39.9 million. In December 2020, we disbursed the second tranche of this facility in the amount of approximately R$250.0 million or US$47.7 million. In May 2021, we disbursed the third tranche of this facility in the amount of approximately R$160.0 million or US$30.6 million. In June 2021, we disbursed the fourth tranche of this facility in the amount of approximately R$101.3 million or US$20.1 million. This loan was contracted at a cost of TLP plus 3.39%, with maturity in 2040.
In December 2014, Nexa Brazil entered into a loan agreement with the Brazilian Financing Agency for Studies and Projects (Financiadora de Estudos e Projetos or “FINEP”), or FINEP, to finance the research and development of various projects. As of December 31, 2017,2023, our outstanding principal amount under this loan agreement was US$2.716.0 million.
The following table sets forth selected information with respect to Nexa Brazil’s principal long-termlong term financings with BNDES and our outstanding amount under these financings as of December 31, 2017.2023.
| 145 |
Liquidity and Capital Resources |
Indebtedness | Borrower | Guarantor | Interest Rate | Principal Payment Dates |
|
|
|
| Principal |
|
| 2023 | ||||||
(in millions | ||||||||||||||||||
R$1,000.0 million BNDES Revolving Credit Agreement | Nexa Brazil | Nexa |
|
|
| December 15, 2028 |
|
| 17.0 | |||||||||
Total | 17.0 | |||||||||||||||||
| R$ | Nexa Brazil | Nexa |
|
| 60 monthly installments commencing on October 15, 2021 | September 15, 2026 | 24.4 | |||||||||||
| Nexa Brazil | Nexa Resources | TJLP plus | 60 monthly installments commencing on September 15, 2017 |
| 10.5 | |||||||||||||
| Nexa Brazil | Nexa Resources | TLP plus 2.22% per annum | 120 monthly installments commencing on January 15, | December 15, 2028 |
|
| 12.3 | |||||||||||
| 47.2 | |||||||||||||||||
| Credit Facility Agreement | Nexa Dardanelos | Nexa |
|
|
| August 15, 2040 | 144.7 | |||||||||||
| Total | 144.7 | |||||||||||||||||
| Total BNDES Long-Term Indebtedness |
|
| 208.9 |
(1) Consists of three tranches.
Cash flows
The table below sets forth our cash flows from operating activities, investing activities and financing activities for the years ended December 31, 2023 and 2022.
For the Year Ended December 31, | ||
2023 | 2022 | |
| (in millions of US$) | ||
| Consolidated Statement of Cash Flows Information | ||
| Net cash flows provided by (used in): | ||
| Operating activities | 246.8 | 266.6 |
| Investing activities | (270.4) | (378.9) |
| Financing activities | (25.3) | (149.2) |
| Foreign exchange effects on cash and cash equivalents | 8.2 | 15.5 |
| Decrease in cash and cash equivalents | (40.6) | (246.0) |
| Cash and cash equivalents at the beginning of the year | 497.8 | 743.8 |
| Cash and cash equivalents at the end of the year | 457.3 | 497.8 |
In 2023, our net cash flow provided by operating activities was US$246.8 million, primarily due to positive working capital variations, as a result of initiatives deployed throughout the year relating to inventory, as well as trade account receivables payment terms.
| 146 |
Liquidity and Capital Resources |
In 2023, our net cash flow used in investing activities was US$270.4 million to maintain the sustainability of our business and invest in our growth, mainly related to sustaining investments in our operations including Aripuanã.
In 2023, our net cash flow used in financing activities was US$25.3 million due to the payment of share premiums to shareholders, contractual dividends paid to non-controlling interests (Pollarix) and payments of loans and financings, partially offset by new loans and financings.
As a result, at December 31, 2023, our cash and cash equivalents were US$457.3 million, US$40.6 million lower compared to our cash and cash equivalents at December 31, 2022.
| 147 |
Liquidity and Capital Resources |
Critical accounting estimates
The following table sets forth certaindiscussion and analysis of our contractual obligationsfinancial position and results of operations is based on our consolidated financial statements. The preparation of the Company’s consolidated financial statements requires the use of estimates, assumptions, and judgments that affect the reported amounts of revenues, expenses, assets and liabilities, the accompanying disclosures, and the disclosure of contingent liabilities at the date of the consolidated financial statements. By definition, critical estimates, assumptions, and judgments will seldom equal the actual results and are continually evaluated to reflect changing expectations about future events. Management also needs to exercise judgment in applying the Company’s accounting policies.
This note provides an overview of the areas that involve a higher degree of judgment or complexity, and of items which are more likely to be materially adjusted due to estimates and assumptions turning out to be wrong due to their uncertainty. Detailed information about each of these estimates, assumptions and judgments is included in other notes together with information about the basis of calculation for each affected item in the financial statements. Below is a description of our critical accounting policies that require significant estimates and judgments.
Impairment of goodwill
We annually test whether goodwill has suffered any impairment, in accordance with the accounting policy stated in Note 31 to our consolidated financial statements. We assess the recovery of the carrying amount of goodwill of each cash generating unit or group of cash generating units based on value in use or fair value less costs to sell, using a discounted cash flow model.
We also assess at each reporting date, whether there is an indication that goodwill may be impaired. If any indication exists, such as volume and price reductions or unusual events that can affect the business, we estimate the recoverable amount of the cash generating unit or group of cash generating units.
The process of estimating the value in use and the fair value less costs to sell involves assumptions, judgment and projections of future cash flows. Our assumptions and estimates of future cash flow used for impairment testing of goodwill are subject to risk and uncertainties, particularly for markets—such as metals— subject to higher volatilities, which are outside our control. The calculations used for the impairment testing are based on discounted cash flow models as of December 31, 2017.2023 (due to impairment indicators identified during the fourth quarter), market assumptions, such as LME prices, market interest rates and other available data regarding global demand. The discount factor applied to the discounted cash flow model is our pre-tax (for value in use calculation method) or post-tax (for fair value less cost of disposal calculation method) weighted average cost of capital for the applicable region, adjusted for country-specific risk factors. These calculations use cash flow projections before taxes on income, based on financial and operational budgets for a five-year period. After the five-year period, the projections are extended to the end of the mine life for our mines and indefinitely for our smelters. We do not use growth rates in cash flow projections of the terminal value for our smelters.
Impairment analysis
|
| Payments Due by Period |
| ||||||||
|
| Total |
| Less |
| 1 - 3 years |
| 3 - 5 years |
| More than |
|
|
| (in millions of US$) |
| ||||||||
Loans and financings(1) |
| 1,941.0 |
| 102.3 |
| 373.3 |
| 236.9 |
| 1,228.5 |
|
Derivative financial instruments(2) |
| 15.0 |
| 12.6 |
| 2.4 |
| — |
| — |
|
Trade payables |
| 329.8 |
| 329.8 |
| — |
| — |
| — |
|
Confirming payable(3) |
| 111.0 |
| 111.0 |
| — |
| — |
| — |
|
Salaries and payroll charges |
| 79.8 |
| 79.8 |
| — |
| — |
| — |
|
Dividends payable(4) |
| 4.1 |
| 4.1 |
| — |
| — |
| — |
|
Related Parties(5) |
| 89.9 |
| 87.7 |
| 2.2 |
| — |
| — |
|
Provisions - Asset Retirement Obligation(6) |
| 331.9 |
| 7.5 |
| 53.4 |
| 33.2 |
| 237.8 |
|
Use of public assets(7) |
| 55.0 |
| 1.7 |
| 3.8 |
| 4.2 |
| 45.3 |
|
Total |
| 2,957.5 |
| 736.5 |
| 435.1 |
| 274.3 |
| 1,511.6 |
|
(1) Includes paymentsWhen performing its annual impairment assessments and after analyzing all impairment indicators the Company identified impairment indicators mainly related to the: (i) Três Marias System (“STM”) cash-generating unit (“CGU”) (previously formed by the combined operations of principalthe Três Marias smelter and interestthe Vazante and Morro Agudo mines) split in two for: (a) STM CGU (comprised of the Três Marias smelter and the Vazante mine) and (b) Morro Agudo CGU (comprised of the Morro Agudo mine and Bonsucesso greenfield), based on management's conclusion that the implicit value of Morro Agudo’s zinc concentrate processed in the Três Marias smelter could no longer continue to be recognized, based on an understanding of the current and specific macroeconomic and price scenarios, as well as on possible future operational scenarios; (ii) Aripuanã and Juiz de Fora CGUs – reduction in Aripuanã's life of mine, a lower exchange rate of the Brazilian real against the U.S. dollar and an increase of operational costs for their operations; and (iii) Mining Peru Group of CGUs (comprised of Cerro Pasco and Cerro Lindo CGUs) – increase in operational costs.
The impairment assessment as of December 31, 2017.
(2) See2023 resulted in a non-cash, pre-tax net impairment loss of US$114.6 million (after-tax US$90.3 million), comprised of (i) an impairment loss of US$59.0 million in the Morro Agudo cash-generating unit (“CGU”); (ii) an impairment loss of US$42.7 million in goodwill in the Mining Peru Group of CGUs; and (iii) individual assets impairment in the amount of US$13.0 million, mainly within assets and projects under construction. For further information, please refer to Note 631 to our consolidated financial statements.
| 148 |
Liquidity and Capital Resources |
(3) CertainFair value of derivatives and other financial instruments
We determine the fair value of financial instruments not traded in an active market by using valuation techniques. We use judgment to select among a variety of methods and make assumptions that are mainly based on market conditions existing at the end of each reporting period.
The main financial instruments and the assumptions we make for their valuation are described below.
| · | We consider the nature, terms and maturity of cash and cash equivalents, financial investments, trade accounts receivable and other current assets. The carrying amount of these items are similar to their respective fair value. |
| · | Financial liabilities are subject to typical market interest rates. The market value is based on the present value of expected future cash disbursement, at interest rates currently available for debt with similar maturities and terms. We also consider Nexa’s credit risk when assessing the fair value of financial liabilities. |
| · | The fair value of derivative financial instruments that we use for hedging transactions is evaluated by calculating their present value through yield curves at the closing dates. The curves and prices used in the calculation for each group of instruments are developed based on data from the Brazilian Securities, Commodities and Futures Exchange, Central Bank of Brazil, LME and Bloomberg, interpolated between the available maturities. |
| · | Swap contracts: The present value of both the assets and liabilities is calculated through the discount of forecasted cash flows by the interest rate of the currency in which the swap is denominated. The difference between the present value of the assets and the liabilities generates its fair value. |
| · | Forward contracts: The present value is estimated by discounting the notional amount multiplied by the difference between the future price in the reference date and contracted price. The future price is calculated using the convenience yield of the underlying asset. It is common to use Asian non-deliverable forwards for hedging non-ferrous metals positions. Asian contracts are derivatives in which the underlying asset price is the average price of certain assets over a range of days. |
| · | Option contracts: The present value is estimated based on pricing methodologies such as the Black Scholes model, with assumptions that include the underlying asset price, strike price, volatility, time to maturity and interest rate. The underlying asset price is the average price of the foreign exchange rate in the fixing month. |
Asset retirement and environmental obligations
In 2023, as part of its annual asset retirement and environmental obligations review, the Company increased its expected disbursements on decommissioning obligations in certain operations, in accordance with updates in their asset retirement or environmental obligations studies and update in the discount rates. As a result, Nexa recognized a non-cash net expense of US$3.2 million in “Other income and expenses” in 2023, and increased its “Operational assets, property, plant and equipment” by US$12.0 million. In addition, a provision of US$7.0 million was recognized in 2023, based on results of conceptual engineering studies conducted on inactive industrial waste containment structures that do not contain mining tailings, water or liquid waste and that have been closed for more than 20 years. The Company has reserved amounts related to estimated costs of anticipated additional obligations in relation to these closed dams, which may include obligations to de-characterize closed and inactive dams. For further information, please refer to Note 27 to our subsidiaries have entered into agreements extending payment terms from 90consolidated financial statements included herein.
| 149 |
Liquidity and Capital Resources |
Tax, civil, labor and environmental provision
We are party to 180 daysongoing labor, civil, tax and environmental lawsuits, which are pending at different court levels. We establish provisions for potentially unfavorable outcomes of litigation in progress and update them based on management evaluation, with several suppliers. These suppliers have discounted their receivables with banks.
(4) Dividends payable of Enercan.
(5) The compensation to VSA of an amount equivalent to the economic benefitsupport from the energy assets. Seepositions of external legal counsel. For additional information, see Note 1328 to our consolidated financial statements.
(6) ProvisionIncome tax and other taxes
We are subject to income tax in all countries in which we operate. Significant judgment is maderequired in determining the income tax provision. The ultimate tax determination is uncertain for asset retirement, restorationmany transactions and environmental costs whencalculations. We also recognize liabilities for anticipated tax audit issues based on estimates of whether additional taxes will be due. Where the obligation occurs,final tax outcome of these matters is different from the amounts that were initially recorded, such differences will impact the current and deferred tax assets and liabilities in the period in which such determination is made. For additional information, see Note 11 to our consolidated financial statements.
Determination of Mineral Reserves and Mineral Resources as basis to determine life of mine
Mineral reserves are deposits estimated to be economically feasible for extraction under economic conditions as of the applicable measurement date. The amortization method and rates applied to the rights to use natural resources reflect the pattern in which the benefits are expected to be used by us and based on the net present valueestimated life of estimated future costs with, where appropriate, probability weightingmine. Any changes to the life of mine, including as a result of changes in estimates of mineral deposits and mining plans, may affect prospective amortization rates and carrying values of these assets. The process of estimation of mineral deposits is based on a technical evaluation, which includes accepted geological, geophysics, engineering, environmental, legal and economic estimates. These estimates, when evaluated in the aggregate, can have a relevant impact on the economic viability of the different remediationmineral deposits. We use various assumptions with respect to conditions, such as metal prices, inflation rates, exchange rates, technology improvements and closure scenarios.production costs, among others. Estimates of mineral reserves and resources are reviewed periodically, and any changes are adjusted to reflect life of mine and, consequently, adjustments to amortization periods. Costs for the acquisition of rights to explore and costs to develop mineral properties incurred as of the start of the feasibility study phase known as FEL3, are capitalized. Since April 1, 2018, these costs are amortized using the units of production method over the estimated life of the mines. The ultimate costimpacts of closedownthe change in the accounting estimation were not considered to be material, and restorationthe change was accounted for prospectively. Once the mine is uncertain,operational, these costs are amortized and considered a production cost.
Recently issued accounting standards and interpretations
For a discussion of new standards, interpretations and amendments to IFRS Accounting Standards, see Note 5 to our consolidated financial statements.
| 150 |
Risk Management |
Risk management
Risk management usesis considered one of the key points in our business strategy and contributes to value creation and increasing the level of confidence in Nexa by its judgmentmain stakeholders, including shareholders, employees, customers, suppliers and experiencethe local communities.
As a result, we have adopted an Enterprise Risk Management (“ERM”) Policy, that describes Nexa’s Risk Management Model, and its activities are an integral part of the processes in our operational units, corporate departments and projects, and provides support for decision-making by our executive officers and Board of directors.
The risk assessment cycle is performed annually focusing on our strategy, operational aspects and key projects. We seek to determineidentify material risks, which are then assessed with consideration of the potential scopehealth, safety, environmental, social, reputational, legal and financial impacts. By embedding risk management into our work processes and critical business systems, we work to ensure we make decisions based on our risk appetite, defined in 2022, on relevant inputs and valid data. The material risks identified during the risk management process are monitored and reported to the executive team, Audit committee and Board of rehabilitation work requireddirectors. We use a risk management platform, BWise, to manage and assess our risks, to monitor our action plans and to provide for the costs associated with that work. Adjustments are made to provisions when the range of possible outcomes becomes sufficiently narrow to permit reliable estimation.
(7) Represents the amounts established in the concession contracts regarding the rights to hydroelectric power generation (onerous concession) under use of public assets agreements.
OFF-BALANCE SHEET ARRANGEMENTS
We did not have any off-balance sheet arrangements as of December 31, 2017.
create related reports.
We consider market risk to be the potential loss arising from adverse changes in market rates and prices. We are exposed to several market risks arising from our normal business activities. These market risks, which are beyond our control, principally involve the possibility that changes in commodity prices, interest rates or exchange rates will adversely affect the value of our inventory, financial assets and liabilities or future cash flows and earnings. For information on our risk management policies, see Note 512 to our consolidated financial statements.
Financial risk
Our financial risk management policy seeks to preserve our liquidity and protect our cash flow and its operating components (revenues and costs), as well as financial components (financial assets and liabilities) against adverse credit and market events such as fluctuations in currency and interest rates.
A significant portion of the products we sell are commodities, with prices based on international indices and denominated in U.S. dollars. A portion of our costs, however, are denominated in reais and soles, and therefore leads to a mismatch of currencies between our revenues and costs. Additionally, our indebtedness is based on different indices and currencies, which may impact our cash flows.
Our current financial risk management policy includes:
| · | Foreign Exchange Exposure Management. Foreign exchange exposure is our exposure to fluctuations in the currencies that make up our commercial, operational and financial relations (the real and sol), and that may impact our U.S. dollar cash flow. All actions in the financial risk management process are intended to hedge our cash flow in U.S. dollars, to maintain our ability to pay our financial obligations and to comply with liquidity and indebtedness levels defined by our management team. Our foreign exchange hedge mechanisms are based on the foreign exchange exposure that is projected at least for 12 months after a reference date. |
| · | Interest Rate Exposure Management. Exposure to the interest rate is our exposure to fluctuations in each of the indices of interest rates (mainly CDI, LIBOR/SOFR and TJLP) from loans and financing transactions and financial investment that may impact our cash flow. Interest rate fluctuations would also result in gains or losses in the market value of our fixed rate debt portfolio due to differences in market interest rates and the rates at the execution of the debt agreements. |
| · | Commodity Exposure Management. Exposure to commodity prices is our exposure to income and operating costs fluctuations due to changes in the reference prices for commodities (e.g., zinc, copper, silver) based on demand, production capacity, producers’ inventory levels and commercial strategies and the availability of substitutes in the global market. We calculate our exposure at least for 12 months after a reference date, considering any derivative financial instrument that has a certain commodity as the underlying asset. |
| 151 |
| · | Counterparties’ and Issuers’ Risk Management. This policy establishes exposure limits for financial and non-financial institutions that are counterparties of financial transactions and/or issuers of debt securities. The purpose of our counterparties’ and issuers’ risk management is to mitigate the occurrence of negative impacts on our cash flows from the non-fulfillment of financial obligations by these issuers and counterparties. In the case of financial investments (cash allocation), we measure exposure to credit risk of issuers by the sum of gross balances of financial investments. In the case of derivative transactions, the credit risk exposure of a certain counterparty and transaction is measured by the pre-settlement risk using statistical models. Exposure limits are determined based on ratings assigned by rating agencies and the equity of the relevant financial institution. |
| · | Liquidity and Financial Indebtedness Management. This policy establishes guidelines for managing our liquidity and financial indebtedness. The main instrument for measuring and monitoring liquidity is a cash flow projection, considering a minimum projection period of 12 months from the reference date. Liquidity and debt management considers as an objective the comparable metrics provided by global credit rating agencies for investment grade entities. With respect to indebtedness, metrics considered compatible with the relevant objective are considered. |
All proposals must comply with the guidelines and rules set forth in our Financial Risk Management Policy and subsequently submitted for review by our financeFinance committee and then for our boardBoard of directors’ approval, under the governance structure set forth in our Financial Risk Management Policy.
Foreign exchange risk
We are subject to foreign exchange risks resulting from the fluctuation of the real and the sol against the U.S. dollar, our functional currency. All actions in the marketfinancial risk management process related to our foreign exchange exposure are intended to hedge our cash flow in U.S. dollars, to maintain our ability to pay our financial obligations and to comply with liquidity and indebtedness levels defined by our management. In 2017, we recorded losses in translation of balances in foreign currency of US$53.9 million. In 2016, we recorded gains in translation of balances in foreign currency of US$124.5 million. In 2015 we recorded losses in translation of balances in foreign currency of US$299.6 million.
Assuming an exchange rate appreciation (devaluation) of 10.0% of the real against the U.S. dollar as of December 31, 2017, we estimate that our profit for the year would have increased (decreased) by US$25.0 million for 2017.
We are also exposed to marketfinancial risk associated with changes in foreign currency exchange rates as certain costs incurred are in currencies other than our functional currency.
Assuming an exchange rate appreciation or devaluation of 10.0% of the U.S. dollar against the real as of December 31, 2023, we estimate that our Adjusted EBITDA for the year would have increased or decreased by US$48.4 million for 2023. This calculation assumes that each exchange rate would change in the same direction relative to the U.S. dollar. In addition to the direct effects of changes in exchange rates, changes in exchange rates may also affect the volume of sales as other market participants become more or less competitive. This sensitivity analysis does not factor in a potential change in sales levels or actions that management could take to manage the potential impact. Accordingly, the actual effect of exchange rate fluctuations will vary from period to period. However, assuming all other factors are held constant, we would expect future fluctuations like those analyzed above to have a similar potential impact on our results for future periods. See “Forward-looking statements.”
Interest rate risk
A portion of our outstanding debt bears interest at variable rates and, accordingly, is sensitive to changes in interest rates. Based upon our indebtedness as of December 31, 2017,2023, an increase increase/(decrease) in LIBORSOFR of 25.0%25% would impact our profitnet income (loss) before income tax for the year and cash flows by US$0.23.1/(3.1) million. We calculate our exposure to fluctuations in interest rates at least for 12 months after a reference date, taking into accountconsidering any derivative financial instrument that has certain index as the underlying asset. Based on these exposures, we prepare financial protection proposals, which are submitted for our financeFinance committee’s approval. The hedges of interest rates, in general, seek to exchange fixed interest rate to floating interest rate or vice versa.
Metal price sensitivity
We are subject to marketfinancial risks arising from the volatility of prices of zinc, copper, lead and silver, and to a lesser extent gold. Assuming that expected metal production and sales are achieved, that tax rates are unchanged, and giving no effect to potential hedging programs, metal price sensitivity factors would indicate the following change in our 2017 profit2023 Adjusted EBITDA (as previously defined) attributable to us resulting from metal price changes.
|
| Zinc |
| Copper |
| Silver |
|
Change in metal price (in percentage) |
| 10.0 | % | 10.0 | % | 10.0 | % |
Annual change in profit attributable to us (in millions of US$) |
| 69 |
| 15 |
| 6 |
|
Change in EBITDA (in millions of US$) |
| 114 |
| 25 |
| 10 |
|
| 152 |
Risk Management |
Zinc | Copper | Silver | |
| Change in metal price (in percentage) | 10.0 | 10.0 | 10.0 |
| Change in Adjusted EBITDA (in millions of US$) | 94.5 | 26.4 | 22.8 |
Derivative instruments
To hedge against marketfinancial risk, we enter into derivative transactions under our Financial Risk Management Policy. Those transactions are carried out in the over-the-counter market under master agreements such as International Swaps and Derivative Association and Brazilian CGD (Contrato Geral de Derivativos(“CGD”) Agreements.
None of the derivative transactions we are party to as of December 31, 20172023 have corporate guarantees or require margin calls or any kind of collateral. None of the derivatives we were party to as of December 31, 20172023 was entered into for speculative or arbitrage purposes.
We have the following recurring hedge programs in place:
· Hedges for fixed price commercial transactions: Hedging transactions that seek to convert commercial transactions with customers who purchase products at a fixed price to floating market prices.
· Hedges for “quotation periods”: Hedging transactions that aim to lock in the prices of purchases of certain inputs (metal concentrate) and sale of products arising from the processing of these inputs. Such purchases and sales are done with different floating market prices, based on quotation periods that are mismatched.
· Hedges for “operating margins”: hedging transactions that seek to lock in the operating margin for a portion of the production of certain of our operating subsidiaries.
| · | Fixed price commercial transactions (customer hedge): Hedging transactions that convert sales at fixed prices to floating prices in commercial transactions with customers interested in purchasing products at fixed prices. The purpose of this strategy is to maintain the revenue flow of the business unit with prices linked to the LME prices. These operations usually relate to purchases of zinc for future settlement on the over-the-counter market. |
| · | Hedges for mismatches of “quotation periods” (book hedge): Hedges that set prices for the different “quotation periods” between the purchases of certain inputs (metal concentrate) and the sale of products arising from the processing of these inputs, or different “quotation periods” between the purchase and the sale of the same product. These operations usually relate to purchases and sales of zinc and silver for future trading on the over-the-counter market. |
To execute our hedge programs, as well as any sporadic hedging demands, we and our subsidiaries mainly enter into average-rateaverage rate (Asian) forwards, collars and swaps and standard interest rate swaps. These are the types of derivatives applicable for the hedge of our exposures, according to our Financial Risk Management Policy.
We initially recognize derivative instruments at fair value on the date a derivative contract is entered into and subsequently re-measure at their fair value. The method of recognizing the resulting gain or loss depends on whether we designate the derivative as a hedging instrument, in the case of adoption of hedge accounting, and if so, the nature of the item being hedged. We adopt the hedge accounting procedure and designate certain derivatives as either:
· hedges of the fair value of recognized assets or liabilities or a firm commitment (fair value hedge); or
· hedges of a particular risk associated with a recognized asset or liability or a highly probable forecast transaction (cash flow hedge).
| · | hedges of the fair value of recognized assets or liabilities or a firm commitment (fair value hedge); or |
| · | hedges of a particular risk associated with a recognized asset or liability or a highly probable forecast transaction (cash flow hedge). |
We document the relationship between hedging instruments and hedged items at the inception of the hedging transaction, as well as the risk management objective and strategy for the undertaking of the various hedge transactions. We also document our assessment, both at the inception of the hedge and on an ongoing basis, of whether the derivatives that are used in hedging transactions have been and will continue to be highly effective in offsetting changes in fair values or cash flows or fair values of hedged items.
III.SHARE OWNERSHIP AND TRADINGCybersecurity
Risk Management and Strategy
MAJOR SHAREHOLDERSWe maintain a comprehensive process for assessing, identifying, recording, addressing and managing material risks associated with cybersecurity that may impact our business, including risks related to disruption of business operations, financial reporting systems or our financial statements, as well as fraud, regulatory, reputational and business continuity risks.
| 153 |
Risk Management |
Nexa prioritizes the identification and management of cyber risks, focusing on adopting controls, technologies and processes that support cybersecurity, developing IT systems and infrastructure, emphasizing the confidentiality and privacy of data and information and complying with legal and regulatory requirements. Nexa’s cybersecurity risk management process includes the following:
| · | Adapting our cybersecurity risk management practices to ISO 27005 and the best practices outlined in the National Institute of Standards and Technology (“NIST”) Framework. We adopted NIST’s framework based on five pillars: Identification, Protection, Detection, Response and Recovery, and in collaboration with external partners, we assess our adherence to the NIST framework through an analysis of our cybersecurity processes and technologies; |
| · | Utilizing material components within our cybersecurity framework, such as firewalls, endpoint detect and response mechanisms, phishing tests and annual penetration and intrusion tests to identify threats and vulnerabilities that could be exploited by cybersecurity attacks and reviewing relevant tactics, techniques, and procedures to prepare for a cyber-attack; |
| · | Involving a dedicated team of professionals who monitor and act on cybersecurity events and risks including the Information Technology and Automation Technology areas. This team is responsible for creating, implementing, overseeing, and managing controls provided for in specific cybersecurity policies and procedures, in addition to presenting priorities and strategies for information and cyber security. This team is overseen by a Chief Information Security Officer (“CISO”) who reports to the Cybersecurity committee (“COSEG”); |
| · | Providing requisite training and ensuring employees comply with cybersecurity programs and policies; |
| · | Utilizing a comprehensive Cybersecurity Materiality Matrix to identify material cybersecurity incidents; |
| · | Maintaining a comprehensive incident response plan in the event of a cyber-attack that consists of defined policies, processes, and protocols for identifying a cybersecurity attack, analyzing the materiality of a cyber incident, responding to and recovering the technological environment, communicating the incidents to internal parties, and if necessary or required under various regulatory regimes, external parties, and completing a closing analysis to identify possible improvements of processes and controls. |
Governance
Board of directors and Audit committee
Nexa’s Board of directors has delegated direct oversight over cybersecurity matters to the Audit committee. The Audit committee is working with management to implement processes to: monitor cybersecurity matters; receive regular updates on cybersecurity tests, the incident response plan and the Company’s cybersecurity policies and procedures from the COSEG; ensure that management is conducting regular risk assessments; receive periodic reports related to designated cybersecurity incidents from management; establish with management an agreed upon approach for communication during a cybersecurity incident; monitor material cybersecurity developments through update calls with management and provide guidance on key decisions; review and debrief with management on post-incident remediation; monitor the content and timing of required cybersecurity disclosures, as well as the Company’s methodology and consistency in its materiality assessment used to disclose material cybersecurity incidents; ensure that the Company is in compliance with the regulations and rules related to cybersecurity, including but not limited to SEC rules; and encourage the Company to provide regular education and training to the Board, the Board committees and management on cybersecurity, consulting with outside experts when appropriate.
| 154 |
Risk Management |
Management
The cybersecurity risk management processes described above are managed by the Management committee through COSEG. COSEG is the executive committee responsible for overseeing the Company’s cybersecurity strategies and policies, including but not limited to, assessing and managing Nexa’s material risks from cybersecurity threats. COSEG is composed of seven senior managers and executives of the Company, including the CIO and CISO. On a regular basis, the results of operational cybersecurity indicators are presented to COSEG by the CISO. Our cybersecurity management is established based on cybersecurity policies and processes, a dedicated cybersecurity budget, technological solutions, human resources, suppliers, and a departmental structure for cybersecurity. COSEG regularly reviews, tests, and updates cybersecurity processes and holds discussions on materiality determinations, ransomware attacks and cybersecurity breaches. Additionally, the Management committee monitors technological, industry, and public policy developments concerning cybersecurity risks, keeping abreast of evolving cybersecurity best practices. The Management committee considers whether engagement with external experts or law enforcement is necessary and conducts investigations to gain a comprehensive understanding of cyber breaches.
As of December 31, 2017, our total issued and outstanding shares are represented by 133,320,513the date of this filing, Nexa has not identified any incidents that would be deemed material within the context of the SEC's requirements.
| 155 |
Major Shareholders |
| III. | Share ownership and trading |
Major shareholders
As of March 27, 2024, Nexa Resources has 132,438,611 common shares outstanding, with par value of US$1.00 per share. The table below sets forth the list of our shareholders and their participation in our capital stock.
Votorantim S.A., or VSA, is Nexa Resources’ controlling shareholder. The address for VSA is Rua Amauri, 255, 14o andar, Room A, indoes not have any different voting rights, but as long as it holds a majority of our voting stock, it can influence or control matters requiring approval by our shareholders, including the cityappointment of São Paulo, state of São Paulo, Brazil.directors. VSA acquired all its shares in Nexa Resources on February 26, 2014.
Shareholder | Number | Share Capital (%) |
| VSA | 85,655,128 | 64.68% |
| Public | 46,783,483 | 35.32% |
| Total | 132,438,611 | 100.00% |
Shareholder |
| Number |
| Share |
|
VSA |
| 85,655,128 |
| 64.25 | % |
Other (1) |
| 12,015,385 |
| 9.01 | % |
Public |
| 35,650,000 |
| 26.74 | % |
Total |
| 133,320,513 |
| 100.00 | % |
(1) Consists of shares beneficially owned by minority shareholders, including certain directors, that each hold less than 5% of our common shares.
VSA
As of December 31, 2017,March 27, 2024, Hejoassu Administração S.A., or Hejoassu, is the sole shareholder of the entirety of VSA’s capital stock, which consists of 18,278,788,894 common shares. Hejoassu is indirectly wholly owned by Ermírio Pereira de Moraes, Maria Helena Moraes Scripilliti, José Ermírio de Moraes Neto, José Roberto Ermírio de Moraes, Neide Helena de Moraes and the descendantsa number of Antonioindividuals, some of whom are related to our Board member Luís Ermírioro de Moraes, through controlled companies. The business address of Hejoassu is Rua Amauri, 255, 12° andar, in the city of São Paulo, State of São Paulo, Brazil.
| 156 |
Related Party Transactions |
Related party transactions
We enter into transactions with our shareholdersrelated parties, including VSA and companies that are owned or controlled, directly or indirectly, by VSA, in our ordinary course of business. These transactions are conducted on an arms’arm’s length basis and in accordance with applicable laws and our corporate governance policies. This discussionSee “Risk factors—Risks relating to our corporate structure—VSA has substantial control over us, which could limit our shareholders’ ability to influence the outcome of certain relationships and related party transactions does not address transactions between us and any of our consolidated subsidiaries that are eliminated in the process of preparing our consolidated financial information.
important corporate decisions.” In accordance with article 57441-7 of the Luxembourg law of August 10, 1915 (or concerning commercial companies, as amended (“1915 Law)Law”), any member of our boardBoard of directors having a direct or indirect financial interest conflicting with that of Nexa Resources in a transaction put before the boardBoard for consideration must advise the boardBoard thereof and cause a record of such member’s statement to be included in the minutes of the meeting. The director may not take part in these deliberations and at the next following general meeting of shareholders of Nexa Resources, before any other resolution is put to vote, a special report shall be made on any such conflicted transactions. This shall not apply where the decision of the boardBoard relates to ordinary business entered into under normal market conditions. A similar rule is stated in the article 441-12 of the Law 1915 and applies to the members of the Management committee.
Nexa has controls in place in order to identify related parties on a quarterly basis and approve related party transactions in advance. Such controls include an analysis by the related party group, an internal committee, and in certain circumstances, the Audit committee, which is required for the execution of related party transactions.
The table below sets forth the balances of our principal related party transactions as of the dates and periods indicated.
The entities disclosed are entities part of the Votorantim Group. The transactions relate to shared project costs such as environmental protection; administrative services provided by the Center of Excellence (Centro de Excelência); sales of limestones and cement purchases, mainly for the Aripuanã project; purchases of energy to be used in Nexa Brazil operation units and construction services for the Aripuanã project, among others.
Related Party Transaction Balances | As of | 2023 | |
Related Party Assets |
| ||
(in millions of US$) | |||
| |||
| |||
| |||
Companhia Brasileira de Alumínio |
| 0.2 | |
Auren Comercializadora de Energía Ltda. | - | ||
| Votorantim Cimentos S.A. |
| 0.7 | |
Other |
| - | |
Total |
| 0.9 | |
| |||
Votorantim |
| 2.0 | |
|
| 10.9 | |
| |||
|
| ||
Companhia Brasileira de Alumínio | - | ||
| Votorantim Cimentos S.A. | 0.1 | ||
| Auren Comercializadora de Energía Ltda. | - | ||
| Campos Novos Energia S.A. | 14.8 | ||
| Votorantim International CSC S.A.C | - | ||
| Other | 0.1 | ||
| Total | 28.0 | ||
| Dividends payable | |||
| Other | 2.8 | ||
| Total | 2.8 | ||
| Related parties liabilities | |||
| Votorantim International CSC S.A.C | 0.9 | ||
| Votorantim S.A | 2.5 | ||
| Other | 0.5 | ||
| Total | 3.9 |
| 157 |
Related Party Transactions |
We summarize below some of our principal related party transactions.
| For the Year Ended December 31, | ||
|
| 2023 | |
|
| ||
| |||
|
| ||
|
| ||
|
| ||
| |||
|
| ||
|
| ||
|
|
| |||
| |||
(in millions of | |||
| |||
| |||
Companhia Brasileira de Alumínio |
| 0.2 | |
|
| 0.7 | |
Total |
| 0.9 | |
Purchases | |||
Votorantim S.A. | 7.5 | ||
| Andrade Gutierrez Engenharia Group | 73.8 | ||
| Companhia Brasileira de Alumínio |
| 0.2 | |
|
| 8.0 | |
Campos Novos Energia S.A. | 61.5 | ||
| Votorantim Cimentos S.A. |
| 1.1 | |
|
| 5.1 | |
|
| 0.4 | |
| |||
|
| ||
|
|
Certain transactions with our shareholders and their affiliatesAndrade Gutierrez Engenharia Group
Beginning in April 2016, when a group of investors acquired a minority stake in Nexa Resources, we had in place a mechanism pursuant to which certain benefits derived from the Brazilian energy generation assets held by our subsidiary Nexa Brazil were transferred to our controlling shareholder VSA. This mechanism required us to pay annual compensation to VSA in an amount equivalent to the economic benefits we derived from the energy generation assets, which was calculated based on the difference between a predetermined comparable market rate and the cost of producing the energy consumed by our Brazilian subsidiaries. See Note 1(vii) to our consolidated financial statements. In 2016, this mechanism resulted in a total compensation of US$52.8 million, paid to VSA during the first quarter of 2017, that we recognized directly in equity.
During 2017, our shareholders agreed to replace the mechanism described above with a new arrangement intended to ensure access to energy supply at market rates while allowing us to continue to obtain some benefits associated with holding the energy generation assets, such as discounts on the charges applicable on the transportation and delivery of energy to end users. Pursuant to this arrangement, eachAs part of the energy generation assets were transferred to a holding company called Pollarix, which became our consolidated subsidiary, and Nexa Brazilexecution of the Aripuanã project, in June 2019 we entered into power purchase agreements at market pricesa mining development services agreement with each of the energy generation assets owned by Pollarix. We hold 33.33% of Pollarix’s total share capital (represented by ordinary shares) and VSA and/or its affiliates hold the remaining 66.67% of Pollarix’s total share capital (represented by preferred shares with limited voting rights). Under the terms of the preferred shares, VSA is entitled to dividends per share equal to 1.25 times the dividends per share payable on the common shares. See “Information on the Company—Other operations—Power and energy supply.”
Because this arrangement has been formally approved at the general meetingAndrade Gutierrez Engenharia S.A., in which one of our shareholders and the Brazilian energy generation assets are under common control with VSA, wedirector’s close family members may have reflected the changes associated with the new arrangement retroactivelysignificant influence at its holding level. Additionally, in our consolidated financial statements to improve the comparability of the results for the periods presented. See Note 1(vii) to our consolidated financial statements.
The transfer of the energy assets remains subject to the approval of the ANEEL, which is expected to occur in the first half of 2018.
Cost-sharing agreement with VSA
WeJune 2020, Nexa entered into an additional agreement with VSA on September 4, 2008, for services provided byConsórcio Construtor Nova Aripuanã, a consortium of the Shared Solutions Center (Centro de Soluções Compartilhadas, or CSC),Andrade Gutierrez group of VSA related to administrative activities, human resources, back office, accounting, taxes, technical assistance, training, as well as leasing of equipment and office space for companies, controlled by VSA. Because these activities are contracted for the benefit of all the companies controlled by VSA, we reimburse VSA for the expenses related to these activities. We do not expect to negotiate any material changes in the terms and conditions of our cost-sharing agreement with VSA.
Loans to CBA
On February 3, 2017, Nexa Brazil and CBA entered into agreements pursuant to which Nexa Brazil assumed all of CBA’s obligations under the intercompany loan agreements with VGmbH and Nexa Resources. As a result, Nexa Brazil recognized an account receivable with CBA (which was recognized by CBA as an account payable) in an aggregate amount of US$390.0 million. This indebtedness was assumed by Nexa Brazil in connection with construction and operational services for the transactions described under “—Certain Transactions with Our Shareholders and Their Affiliates.” On June 30, 2017, Nexa Brazil and CBA entered into an agreement pursuant to which CBA liquidated the account payable by transferring assets to Nexa Brazil, including certain fixed assets and an equity participation in VILA. As a result, as of December 31, 2017, Nexa Brazil does not have the US$390.0 million account receivable with CBA.
Purchases of electricity from Votener
We purchased electricity from Votener, a subsidiary of VSA, in an aggregate amount of US$11.3 million in 2017. The price of electricity we purchased was based on market prices. Upon concluding the current structure related to our Brazilian energy assets, we do not expect to negotiate additional purchases of electricity in the near future. See “Operating and financial review and prospects—Key factors affecting our business and results of operations—Energy costs’’ and ‘‘Other operations—Power and energy supply.”
Guarantees by VSA and Hejoassu
VSA and Hejoassu, the controlling shareholder of VSA, have guaranteed obligations of our Brazilian subsidiaries under certain financing agreements with BNDES.Aripuanã project. As of December 31, 2017, VSA and Hejoassu guaranteed2023, the amount of this contract is US$93.4 million73.8 million.
Shared arrangements
We have entered into a number of Nexa Brazil’s outstanding indebtedness. VSA also guarantees any loans made to Nexa Resources, Nexa Brazil and Nexa CJM under the VSA Revolving Facility. As of December 31, 2017, US$31.5 million has been disbursed under this facility. Although we do not currently compensate VSA or Hejoassu in exchange for their provision of these guarantees, we may begin to pay a guarantee fee on arms-length market terms to VSA and Hejoassu in respect of our guaranteed obligationsshared services contracts with other entities in the future. We intendVotorantim Group in an effort to seek to enter into financingsachieve operational efficiencies. These include joint contracts for insurance coverage and information technology. Entities in the future without these guarantees.
DISTRIBUTIONSVotorantim Group with whom we maintain such contracts have access to a substantial level of information about us. In addition, VSA negotiates our insurance coverage at the level of the Votorantim group and we thus depend on choices made by VSA for selecting the service providers to be used for all insurances contracted by us, including coverage related to property, transport, liability, credit and engineering risk insurances. We retain the right of approval of contract renewal terms negotiated by VSA.
In addition, all executive officers participate in the Fundação Senador José Ermírio de Moraes (“FUNSEJEM”) pension fund, a private, closed and not-for-profit pension fund responsible for the management of the pension plans for the employees of companies linked to the Votorantim Group.
We intendSee “Risk Factors—Risks relating to make annual distributions on our common shares. The amountcorporate structure—VSA has substantial control over us, which could limit our shareholders’ ability to influence the outcome of distributions will beimportant corporate decisions.”
| 158 |
Distributions |
Distributions
Distributions to our shareholders are subject to the requirements of Luxembourg law and the approval of our boardBoard of directors or our shareholders, as applicable, and will depend on a number of factors, including, but not limited to, our cash balance, cash flow, earnings, capital investment plans, expected future cash flows from operations, and our strategic plans and cash dividend distributions from our subsidiaries, as well as legal requirements and other factors we may deem relevant at the time. As of December 31, 2017,2023, there are no contractual restrictions on our ability to make distributions to our shareholders. Subject to these considerations, we intendestimate to distribute each year amounts equal to at least 2.0% of our average market capitalization for the previous fiscal year. For this purpose, our average market capitalization for a fiscal year is the sum of the daily market capitalization for each NYSE trading date in such fiscal year divided by the number of NYSE trading days in such fiscal year, where the daily market capitalization for any trading day is the product of the NYSE closing price per share in U.S. dollars of our common shares on such trading day and the number of common shares outstanding on such trading day.
capitalization.
Each common share entitles the holder to participate equally in distributions, unless the right to distributions has been suspended in accordance with our articles of association or applicable law.
We intend to declare and make distributionsDistributions in our common shares may be made in the form of either dividends or reimbursements of share premium. Under Luxembourg law, dividends are determined by a simple majority vote at a general shareholders’ meeting based on the recommendation of our boardBoard of directors. Furthermore, pursuant to our articles of association, the boardBoard of directors has the power to declare interim dividends andand/or proceed with reimbursements of share premium.
premium in accordance with the 1915 Law.
We and our subsidiaries are subject to certain legal requirements that may affect our ability to pay dividends or other distributions. Distributions to shareholders (including in the form of dividends or reimbursement of share premium) may only be made from amounts available for distribution in accordance with Luxembourg law, determined based on the basis of our standalone statutory accounts prepared under Luxembourg GAAP. Under Luxembourg law, the amount of a distribution paid to shareholders (including in the form of dividends or reimbursement of share premium) may not exceed the amount of the profits at the end of the last financial year plus any profits carried forward and any amounts drawn from reserves that are available for that purpose, less any losses carried forward and sums to be placed in reserve in accordance with Luxembourg law or our articles of association. Furthermore, no distributions (including in the form of dividends or reimbursement of share premium) may be made if at the end of the last financial year the net assets as set out in the standalone statutory accounts prepared under Luxembourg GAAP are, or following such a distribution would become, less than the amount of the subscribed share capital plus the non-distributable reserves. Distributions in the form of dividends may only be made from net profits and profits carried forward, whereas distributions in the form of share premium reimbursements may only be made from available share premium.
Luxembourg law also requires at least 5.0% of our net profits per year to be allocated to the creation of a legal reserve until such reserve has reached an amount equal to 10.0% of our issued share capital. If the legal reserve subsequently falls below the 10.0% threshold, at least 5.0% of net profits again must be allocated toward the reserve. The legal reserve is not available for distribution. See “Additional information—Articles of association—Distributions.”
As of December 31, 2017,2023, the legal reserve of Nexa Resources, based on our standalone statutory accounts prepared under Luxembourg GAAP, was zero, and we would not have been able to declare or pay any dividends. We can provide Nexa Resources with the capacity to pay dividends by causing our subsidiaries to pay dividends to Nexa Resources, subject to any conditions under the corporate law applicable to each subsidiary. This would result, after any related costs, in profits at Nexa Resources, which would contribute to creating amounts that, after mandatory allocations of profits, are available for distribution as dividends in accordance with Luxembourg law as described above.is US$13,332,051.30.
The balance of the share premium account as of December 31, 2017 was US$1,121.4 million. This amount was calculated based on the share premium reserve, plus any profits made since the end of last financial year, less losses carried forward, as set forth in our standalone statutory accounts as of December 31, 2017 prepared under Luxembourg GAAP.
The table below describes the distributions paid to our shareholdersshareholders. Distributions for 2021 were made in the form of a cash dividend. Distributions for 2022 were made in the form of cash dividend and share premium. Distributions for 2023 were made in the form of share premium.
| For the Year Ended December 31, | |||
2023 | 2022 | 2021 | |
| (in millions of US$) | |||
| Distributions to shareholders | 25.0 | 50.0 | 35.0 |
On March 24, 2023, we paid US$25.0 million (US$0.19 per common share) of share premium reimbursements(or special dividend) to our shareholders. This share premium will be ratified, in accordance with Luxembourg laws, by our shareholders at the annual shareholders’ meeting for the periods indicated.fiscal year ended December 31, 2023, which will occur on June 13, 2024.
For the Year Ended December 31, |
| ||||||
2017 |
| 2016 |
| 2015 |
| 2014 |
|
(in millions of US$) |
| ||||||
430.0 |
| 69.9 |
| — |
| — |
|
We areNexa Resources is a holding company and havehas no material assets other than ourits ownership of shares in ourits subsidiaries. When we payNexa Resources pays a dividend or other distribution on ourits common shares in the future, weit generally cause ourcauses its operating subsidiaries to make distributions to usit in an amount sufficient to cover any such dividends or distributions. Our subsidiaries’The ability of subsidiaries of Nexa Resources to make distributions to usNexa Resources is subject to their capacity to generate sufficient earnings and cash flow and may also be affected by statutory accounting and tax rules in Brazil and Peru. As of December 31, 2017, there are no material contractual restrictions on our subsidiaries’ abilityPeru, as well as any conditions under the corporate law applicable to make distributions to us.each subsidiary.
| 159 |
Distributions |
A Luxembourg withholding tax of 15.0% is generally due on dividends and similar distributions made by usNexa Resources to ourits shareholders. However, distributions on ourNexa Resources’ common shares that are sourced from a reduction of share capital or share premium areshould not be subject to Luxembourg withholding tax if we doNexa Resources does not have distributable reserves or profits in ourits standalone statutory accounts prepared under Luxembourg GAAP.GAAP and provided that such distributions are made for genuine economic reasons. See “Additional information—Taxation—Luxembourg tax considerations—Shareholders.”
There is no law, governmental decree or regulation in Luxembourg that would affect the remittance of dividends or other distributions by usNexa Resources to nonresidentnon-resident holders of ourits common shares, other than withholding tax requirements. In certain limited circumstances, the implementation and administration of international financial sanctions may affect the remittance of dividends or other distributions. There are no specified procedures for nonresident holders to claim dividends or other distributions.
Computershare Trust Company, N.A. is the paying agent for shareholders who hold common shares listed on the NYSE and on the TSX.NYSE. Dividends and other distributions on our common shares will be declared and paid in U.S. dollars. Dividends and other distributions on common shares listed on the NYSE will be the same as for common shares listed on the TSX.
| 160 |
Trading Markets |
Trading markets
Our publicly traded share capital consists of common shares with a par value of US$1.00 per share. Our common shares are publicly traded in the United States on the New York Stock Exchange (or NYSE), under the ticker symbol NEXA. Our common shares also trade on the Toronto Stock Exchange (or TSX),NYSE, under the ticker symbol NEXA. On April 20, 2018,March 27, 2024, there were 133,320,513132,438,611 common shares issued and outstanding.
| 161 |
Purchases of Equity Securities by the Issuer and Affiliated Purchasers |
The following table sets forth trading information for our common shares, as reportedPurchases of equity securities by the NYSEissuer and the TSX.
|
| NYSE (US$ per share) |
| TSX (C$ per share) |
| ||||
|
| Common share |
| Common ADS |
| ||||
|
| High |
| Low |
| High |
| Low |
|
2017 |
|
|
|
|
|
|
|
|
|
1Q |
| N/A |
| N/A |
| N/A |
| N/A |
|
2Q |
| N/A |
| N/A |
| N/A |
| N/A |
|
3Q |
| N/A |
| N/A |
| N/A |
| N/A |
|
4Q |
| 19.61 |
| 15.64 |
| 24.77 |
| 20.04 |
|
Monthly prices |
|
|
|
|
|
|
|
|
|
November 2017 |
| 18.11 |
| 15.64 |
| 23.38 |
| 20.04 |
|
December 2017 |
| 19.61 |
| 16.44 |
| 24.77 |
| 21.14 |
|
January 2018 |
| 21.06 |
| 19.90 |
| 25.96 |
| 24.81 |
|
February 2018 |
| 20.85 |
| 18.27 |
| 26.30 |
| 23.04 |
|
March 2018 |
| 20.67 |
| 17.11 |
| 26.42 |
| 22.10 |
|
April 2018 (through April 4) |
| 17.39 |
| 17.35 |
| 22.43 |
| 21.98 |
|
PURCHASES OF EQUITY SECURITIES BY THE ISSUER AND AFFILIATED PURCHASERS
affiliated purchasers
Nexa did not repurchase any of its shares during 2017.2023. As of December 31, 2023, there were no authorized share buyback programs.
| 162 |
Corporate Governance |
| IV. | Corporate governance, management and employees |
IV.CORPORATE GOVERNANCE, MANAGEMENT AND EMPLOYEES
Corporate governance
Our corporate governance model is aimed at facilitating the flow of information between our executives and other key decision-makers on our management team, specifically, our boardBoard of directors, Board committees and Management committee. Our corporate governance model also provides a framework for the duties of our management team, including oversight of Nexa’s performance and decision-making. Our main corporate governance activities include support for Board of directors, Board advisory committees and executive boards. Board meetings (management committee); contribution to the process of preparing the annual report on governance practices; and elaboration of governance documents and updating of best practices.
Our corporate governance model ensuresis designed to ensure that the proper corporate governance principles are consistently applied within our organization. Our main corporate governance activities include support for executive board meetings, board advisory committees and board of directors; contribution to the process of preparing the annual report on governance practices; elaboration of governance documents and updating of best practices; and participation in the development of corporate governance communication material.
The Canadian Securities Administrators have issued corporate governance guidelines pursuant to National Policy 58-201— Corporate Governance Guidelines (the “Canadian Corporate Governance Guidelines”), together with certain related disclosure requirements pursuant to National Instrument 58-101— Disclosure of Corporate Governance Practices, or NI 58-101. The Canadian Corporate Governance Guidelines are recommended as “best practices” for issuers to follow. We recognize that good corporate governance plays an important role in our overall success and in enhancing shareholder value and, accordingly, we have adopted certain corporate governance policies and practices which reflect our consideration of the recommended Canadian Corporate Governance Guidelines. Thesethat include adopting internal rules for the boardBoard of directors being equivalent to a board mandate and appointing key committees that have independent representation and leadership, including an audit committee comprised of all independent directors, and a compensation, nominating and governance committee, of which one of the two committee members is independent.committee. The internal rules, equivalent to a committee charter for the compensation, nominating and governanceCNG committee includes responsibility for reviewing and assessing the size, composition and operation of the boardBoard of directors to ensure effective and independent decision making, advising on potential conflicts of interest situations and developing corporate governance guidelines and principles. These include ensuring that appropriate processes and structures are implemented to facilitate the exercise of independent judgment by the members of the board.principles, in line with ESG standards. The disclosure set out below describes in further detail our approach to corporate governance in relation to the Canadian Corporate Governance Guidelines.governance.
Meetings of the board of directors and attendance
The board of directors ordinarily meets in person or by other means of communication as may be required. The frequency of and agenda items for board meetings will vary depending on the state of affairs, requirements for approvals and opportunities available to the Company and the risks and issues which the Company faces. The agenda for meetings places priority and focuses on key issues for the Company, which are identified by the chairman of our board. Routine business is dealt with after substantive discussions on the key issues.
In fiscal year 2017, our board of directors held nine meetings, in which the rate attendance was 99% of the directors.
Meeting of the independent directors
As set forth in the internal rules for the board of directors, the independent directors may hold meetings in which members of the management team and the non-independent directors are not present.
Committees of our board of directors
Our board of directors has an audit committee, a finance committee and a compensation, nominating and governance committee. Our board of directors is expected to have such other committees as it may determine from time to time. Each of the standing committees of our board of directors has the composition and responsibilities assigned to them by the meeting of the board of directors that created such committee and as set forth in their respective internal rules, being an equivalent to a committee charter. As set forth in the respective internal rules of the committees, each of the committees may meet with or without the management, as the case may be, at the discretion of the committee. The charter for each of the committees of our board of directors is available on our website.
Audit committee
Our audit committee was established by our board of directors on March 28, 2017 and may be composed of three to five members, each elected by our board of directors for a term of one year. Our audit committee is composed of three members: Daniella Dimitrov, Edward Ruiz and Jane Sadowsky. These individuals are independent under Rule 10A-3 and applicable NYSE standards. In addition, each of them satisfies the financial literacy requirement under applicable rules. Our board of directors has determined that Mr. Edward Ruiz qualifies as an “audit committee financial expert.”
Our audit committee’s primary responsibilities are to assist the board of directors’ oversight of: (1) quality and integrity of our financial reporting and related financial disclosure; (2) the effectiveness of our internal control over financial reporting and disclosure controls and procedures; (3) our compliance with legal and statutory requirements as they relate to financial statements and related financial disclosures; (4) risk management and monitoring processes; and (5) the qualifications, performance and independence of our independent auditors and performance of the internal audit function.
Nexa has established policies and procedures that require any engagement of our independent auditor for audit or non-audit services to be submitted to and pre-approved by the audit committee. In addition, our audit committee may delegate the authority to pre-approve non-audit services to one or more of its members. All non-audit services that are pre-approved pursuant to such delegated authority must be presented to the full audit committee at its first scheduled meeting following such pre-approval. Our audit committee shall pre-approve all audit and non-audit services to be provided to us by our independent auditor and also has the authority to recommend pre-approval policies and procedures to our board of directors and for the engagement of our independent auditor’s services.
Finance committee
Our finance committee was established by our board of directors on March 28, 2017. The finance committee reports to our board of directors and is composed of three to five members, each elected by our board of directors for a term of one year. Diego Cristóbal Hernandez Cabrera, Edward Ruiz and João Henrique Batista de Souza Schmidt are members of the finance committee.
Our finance committee is responsible for: (1) assisting the board in analyzing the potential effects of the Brazilian and global economic situation on our financial position, as well as in the discussion of scenarios and trends and in the definition of strategies to be adopted by us within the scope of our financial policy; (2) referring, submitting and monitoring the approved financial risk management policies; (3) evaluating the policy regarding entry into insurance contracts and the scope of their coverage; (4) evaluating and monitoring the Company’s investment plan; (5) proposing cash and liquidity management guidelines for the Company; and (6) evaluating and validating the mechanisms for setting variable and long-term executive compensation and advising the compensation, nominating and governance committee in respect thereof.
Compensation, nominating and governance committee
Our compensation committee was established by our board of directors on March 28, 2017. Our compensation committee reports to our board of directors and may be composed of two to five members, each elected by our board of directors for a term of one year. Luis Ermírio de Moraes and Eduardo Borges de Andrade Filho currently serve as its members. Previously, our compensation committee was mainly responsible for determining the corporate standards and guidelines for compensation of our board members, officers and committee members.
Following our initial public offering, we modified the structure of the compensation committee in order to include aspects related to corporate governance and the nomination of board members, officers and committee members. Therefore, our new compensation, nominating and governance committee is responsible for: (1) new compensation models and changes to compensation models currently used by us, in order to guide and influence our actions; (2) the compensation of the executive board, of the members of the board of directors and of the members of the committees of the board of directors; (3) the proposal of candidates to the chair of chief executive officer,
when applicable, or any serious restrictions on the candidates proposed by the chief executive officer to the other chairs of the executive board; (4) developing corporate governance guidelines and principles for us; (5) identifying individuals qualified to be nominated as members of the board of directors and suggesting nominees to fill any vacancies on the board of directors; (6) the structure and composition of board committees; (7) evaluating the performance and effectiveness of the board of directors, the chief executive officer and each of the board’s standing committees; and (8) any related matters required by applicable laws and stock exchange rules.
Under Luxembourg law, in the case of a vacancy of the office of a director appointed by the general meeting of shareholders, the remaining directors may, unless the articles of association provide differently, fill the vacancy on a provisional basis. In these circumstances, the following general meeting of shareholders shall make the final appointment of the director.
Appointment of members of our board of directors
In accordance with our articles of association and the Luxembourg law of August 10, 1915 on commercial companies, as amended (the “1915 Law”), the members of our board of directors are elected by a resolution of a general meeting of shareholders adopted with a simple majority of the votes validly cast, regardless of the portion of capital represented at such general meeting. Votes are cast for or against each nominee proposed for election to the board and cast votes shall not include votes attaching to shares for which the shareholder has not participated in the vote, has abstained or has returned a blank or invalid vote.
Internal rules for the board of directors
Our board of directors is responsible for supervising and directing the management of our business and affairs, including providing guidance and strategic oversight to our executives and other members of our management team. Our board of directors adopted internal rules for the board, an equivalent to a formal board mandate, which includes the following, among other things:
· establish the general guidance of our business, defining its mission, its strategic goals and its guidelines;
· adopt a strategic planning process, and approving, on at least an annual basis, a strategic plan which takes into account, among other things, the opportunities and risks of the business;
· approve and recommend the shareholders to approve, subject to any thresholds and pursuant to our articles of association and the 1915 Law, any transactions relating to capital expenditure investments, loans or derivative contracts, mergers, spin-offs, divestitures, incorporation or joint venture operations;
· deliberate and decide on the annual programs of expenditure and investments;
· protect and create value for us;
· promote and comply with our corporate objectives and those of our subsidiaries;
· ensure our continuity in a long-term perspective and sustainability including the economic, social, environmental considerations and good corporate governance, in the definition of business and operations;
· approve the apportionment of directors’ compensation, prepared with the support of the compensation, nominating and governance committee;
· develop our approach to corporate governance, including developing a set of corporate governance principles and guidelines that are specifically applicable to us;
· adopt a responsive management structure, composed of qualified professionals and spotless reputation, including satisfying itself as to the integrity of the chief executive officer and other executives and that
the chief executive officer and other executives create a culture of integrity throughout the organization;
· ensure that strategies and guidelines are implemented by the management team;
· oversee the implementation of appropriate: capital structure, risk management, evaluation and compensation of our executives, internal controls system, people management policy and internal rules, and corporate communications;
· evaluate the performance and effectiveness of our chief executive officer, based on the recommendation of the compensation, nominating and governance committee;
· maintain an updated succession plan for the chief executive officer and all of our other key personnel; and
· other matters required by applicable law and our articles of association.
The internal rules for our board are available on our website.
Chairman
The chairman of our board of directors is not an independent director of the Company, as he is also the Vice-Chairman of VSA. The board of directors has carefully considered governance issues relating to chairman independence and believes that the chairman carries out separate responsibilities diligently and that, with the compensating practices in place, the board of directors operates effectively.
The board has at its disposal a set of provisions and practices that promotes independence in the decision-making process of the board. In accordance with the internal rules of the board, the independent members of the board may hold separate meetings and each director has a duty to declare, prior to any board meeting, the existence of a particular reason or conflict of interest with the Company with respect to a subject matter being discussed or considered by the board. Accordingly, such board member would be refrained from discussing and voting on a matter that could present a conflict of interest. Additionally, our board members are prohibited in holding executive positions with the Company and/or participating on more than four boards of directors of companies that do not belong to the same conglomerate.
Position descriptions
Our board of directors has developed a written position description for the chairman of the board of directors. The chairman of the board has the following responsibilities, subject to any other matters that may be set forth in our articles of association or provided for under applicable law:
· ensure the efficiency and proper performance of the board of directors;
· ensure the efficacy of the evaluation system applicable to the board of directors, the management team and the members of each of these bodies;
· streamline the activities of the board of directors with our interests, our shareholders and other stakeholders;
· organize and coordinate the agenda for meetings of the board of directors in cooperation with the secretary to the board, chief executive officer and other board members, as applicable;
· ensure that board members receive timely and comprehensive information about the items included on the agenda for each meeting;
· coordinate the activities of other board members;
· propose to the board of directors, on an annual basis, the appointment of a secretary;
· propose to the board of directors, in consultation with the board’s committees, the annual budget of the board of directors;
· preside over the board meetings and general shareholders meetings;
· coordinate with the chief executive officer and propose the annual corporate calendar to the board of directors, setting forth the dates of corporate events;
· organize, together with the chief executive officer, an integration and training program for each newly elected board member, and providing continuing education opportunities for all board members; and
· arrange for continuing education opportunities for all directors, to ensure that they enhance their relevant skills as directors and maintain updated knowledge and understanding of our business.
Our board of directors adopted internal rules, an equivalent to a committee charter, for each of its committees. These internal rules set out, among other things, the roles and responsibilities of the coordinator (chairman) of each of the committee.
Orientation and continuing education
We implemented an orientation program for new directors under which each new director meets with the chairman of our board of directors and our executives. New directors are provided with comprehensive orientation and education as to our business, operations and corporate governance (including the role and responsibilities of the board of directors and each committee).
The chairman of our board of directors is responsible for overseeing director continuing education designed to maintain or enhance the skills and abilities of our directors and to ensure that their knowledge and understanding of our business remains current. The coordinator of each committee is responsible for coordinating orientation and continuing director development programs relating to the committee’s mandate.
Our ongoing director education programs entails, as a matter of routine each year, site visits, presentations from outside experts and consultants, briefings from staff and management, and reports on issues relating to our projects and operations, sustainability and social matters, competitive factors, reserves, the economy, accounting and financial disclosure issues, mineral and hydrocarbon education and other initiatives intended to keep the board abreast of new developments and challenges that we may face.
Evaluation of directors
Our compensation, nominating and governance committee established an annual framework for the implementation and administration of processes to assess the effectiveness of the board and each of its members. This includes peer reviews of each director’s performance and self-assessments, as well as full board and committee review of the board and the respective committees, by way of questionnaires, interviews and sessions with the chairman. In addition to hiring external advisors to develop and undertake this assessment, the compensation, nominating and governance committee is also responsible for overseeing the process and evaluating the results, with the objective of improving the performance of each director and the board of directors as a whole.
Considerations in evaluating director nominees
Our board of directors is responsible for nominating members for election to the board and for filling vacancies on the board that may occur between annual meetings of shareholders. The process for nominating a new director initiates with our compensation, nominating and governance committee which evaluates the Company’s current circumstances and establishes a profile for a director candidate. Such profile is then shared with a specialized headhunter, who assists the compensation, nominating and governance committee in selecting candidates for
interviews. Prior to the interview, the specialized headhunter is responsible for a background check with former employers and colleagues of the respective candidates.
Following the interview(s), our compensation, nominating and governance committee recommends the nomination of the director candidate to our Board of Directors based upon an assessment of the independence, skills, qualifications and experience of such candidate. Specifically, the board seeks members from diverse professional and personal backgrounds who combine a broad spectrum of experience and expertise with a reputation for integrity.
Director term limits and other mechanisms of board renewal
Our articles of association provide that members of the board of directors are appointed for a period not exceeding one year by the general meeting of shareholders, with the possibility of renewal. In the event that a director appointed by the general meeting ceases to be a director for any reason, the remaining directors, by a simple majority vote of the directors present or represented, shall fill such vacancy by replacing such director with a new director nominated for appointment in place thereof. This director will be in office until the next general meeting of shareholders.
Diversity
We value diversity of abilities, experience, perspective, education, gender, background, race and national origin. We believe that having a diverse board of directors can offer a breadth and depth of perspectives that enhance our performance. Recommendations concerning director nominees are based on merit and past performance as well as expected contribution to the board’s performance and, accordingly, diversity is taken into consideration. We believe that having a diverse and inclusive organization overall is beneficial to our success, and we are committed to diversity and inclusion at all levels of our organization to ensure that we attract, retain and promote the brightest and most talented individuals. We have recruited and selected executives that represent a diversity of business understanding, personal attributes, abilities and experience.
The compensation, nominating and governance committee and our board of directors have the responsibility to review and assess the composition of the board and each of its committees, and to identify, evaluate and recommend potential new directors. With respect to our executive officers, the compensation, nominating and governance committee reviews candidates recommended by the chief executive officer and makes the final recommendation to the board of directors. In new director and executive officer appointments and ongoing evaluations of the effectives of our board and management team, each of the board’s committees and each director, the board will take into consideration diversity as one of the factors in order to maintain an appropriate mix and balance of diversity, attributes, skills, experience and background on our board of directors and each of its committees and the management team. Ultimately, appointments to our board of directors and management team are based on merit against objective criteria and with due regard to the benefits of diversity in board and management team composition and the desire to maximize the effectiveness of corporate decision-making, having regard to the best interests of the Company and its strategies and objectives, including the interests of its shareholders and other stakeholders. Currently, two (or 22%) of our nine members of the board are women and one (or 11%) of our nine executives is a woman, and on a general basis, 10.3% of our overall employees are women.
Further, we established a Diversity Committee composed of three levels: Strategic Diversity Committee, Corporate Diversity Committee and Local Diversity Committees representing each of our corporate offices and production plants. Pursuant to these committees’ guidelines, “diversity” discussions include attributes such as gender, disability, ethnicity, age and other factors. In connection with this diversity initiative, we have adopted targets for gender at companywide levels and expect to adopt targets for other diversity representation. In 2017, our gender target was to have 10.4% of women represented companywide, and we achieved 10.3% representation of women in total. For 2018, our gender target is to reach 11.9%, while for 2025 we intend to increase such target to 20% of women companywide. These targets are frequently monitored, global and locally, and action plans are implemented to achieve the proposed targets.
Compensation-setting process
Our compensation, nominating and governance committee is responsible for assisting our board of directors in fulfilling its governance and supervisory responsibilities, and advising our board of directors with respect to evaluation and monitoring of compensation models and policies performed every two years, which takes into account peer companies and the challenges we face. The committee’s responsibilities also include administering and determining our compensation objectives and programs, reviewing and making recommendations to our board of directors concerning the level and type of the compensation payable, evaluating performance, implementing evaluation and improvement processes, and ensuring that policies and processes are consistent with our philosophy and the objectives of our compensation program.
Code of conduct
We work with all of our employees, as well as third parties who interactwe work with, them, to ensure they behave in a manner consistent with our values, codeCode of conductConduct and the key principles of itsour compliance program, particularly as these relate to the environment, human rights and labor related issues, health and safety, and anti-bribery and corruption. The Code of Conduct reflects our commitment to the principles of anti-corruption, anti-money laundering, anti-terrorist financing, integrity, ethics, human rights, social and environmental responsibilities and antitrust policies based on laws in effect in the countries where we operate. Our directors and executives have certified that they have read and that they will comply with our Code of Conduct. Furthermore, our Board of directors periodically monitors compliance related topics. We also launched our Code of Conduct for Suppliers in 2022. A Conduct Committeecommittee is in charge of promoting the disseminationimplementation of the code and supervising the application of disciplinary measures. The last update on our Code of Conduct occurred in 2021, since then we continued with its dissemination to current and new employees at a global level and in 2024, we expect to review our Code of Conduct and consequently issue a new version. In 2022, we also launched our Code of Conduct for Suppliers started to disseminate it to any suppliers considered to be strategic vendors. In 2023, we launched the Code of Conduct for Customers and started disseminating it as well.
Our code of conduct supplements our global compliance program, which is based on anti-corruption best practicesAnti-corruption, anti-money laundering and anti-corruption legislation such as the Brazil Clean Company Act, the U.S. Foreign Corrupt Practices Act of 1977, or the FCPA, and the UK Bribery Act of 2010.
Weantitrust programs have introduced several anti-corruption initiatives,been implemented, including, among other things, ethics and compliance training and an ethics hotline which enables employees and third parties to report misconduct. Information reported through our ethics hotline is investigated and following the investigation, disciplinary action may be taken, if necessary. Further, we intend to implement a formal compliance monitoring system, which would include key risk indicators and risk assessments. We have not granted any implicit or explicit waivers from any provision of our codeCode of conductConduct since its adoption.
Our codeCode of conduct isConduct, Code of Conduct for Suppliers and compliance-related policies are publicly available on our website at https://www.nexaresources.com. We will disclose future amendments to, or waivers of, our codeCode of conductConduct on the same page of our corporate website. Information contained on our website is not incorporated by reference into this report, and you should not consider information contained on our websiteit to be part of this report.
Foreign private issuer and controlled company exemptions
Because we are a foreign private issuer, the NYSE rules applicable to us are considerably different from those applied to U.S. companies. Accordingly, we intendhave been, and expect to takecontinue, taking advantage of certain exemptions from NYSE governance requirements provided in the NYSE rules for foreign private issuers. Subject to the items listed below, as a foreign private issuer we are permitted to follow home country practice in lieu of the NYSE’s corporate governance standards. Luxembourg law does not require that a majority of our boardBoard consist of independent directors or the implementation of a compensation committee or nominating and corporate governance committee. As a foreign private issuer, we must comply with four principal NYSE corporate governance rules: (1)(i) we must satisfy the requirements of Exchange Act Rule 10A-3 relating to audit committees; (2)(ii) our chief executive officer must promptly notify the NYSE in writing after any executive officer becomes aware of any non-compliance with the applicable NYSE corporate governance rules; (3)(iii) we must provide the NYSE with annual and interim written affirmations as required under the NYSE corporate governance rules; and (4)(iv) we must provide a brief description of any significant differences between our corporate governance practices and those followed by U.S. companies under NYSE listing standards.
| 163 |
Corporate Governance |
In addition, for purposes of the NYSE rules, as VSA beneficially owns a majority of our outstanding common shares, we are a “controlled company.” “Controlled companies” under those rules are companies of which more than 50.0% of the voting power is held by an individual, a group or another company. Accordingly, we are eligible to take advantage of certain exemptions from NYSE governance requirements provided in the NYSE rules. Specifically, as a controlled company under NYSE rules, we are not required to have a majority of independent
directors or a compensation, nominating and corporate governance committee composed entirely of independent directors.
As described further above, we recognize that good corporate governance plays an important role in our overall success and in enhancing shareholder value and, accordingly, we have adopted certain corporate governance policies and practices whichthat reflect our consideration of the recommended Canadian Corporate Governance Guidelines.these considerations. The following table briefly describes the significant differences between our practices and the practices of U.S. domestic issuers under NYSE corporate governance rules.
Section | NYSE corporate governance rule for | Our approach | ||
| 303A.01 | ||||
| A listed company must have a majority of independent directors. “Controlled companies” and “foreign private issuers” are not required to comply with this requirement. | We are a controlled company because more than a majority of our voting power for the appointment of directors is controlled by VSA. We are a foreign private issuer because we are incorporated in Luxembourg. As a controlled company and foreign private issuer, we are not required to comply with the majority of independent director requirements. Five of our ten directors are independent. Our Board of directors has adopted internal rules equivalent to a charter. See Board and processes our Board has implemented to promote the exercise of independent judgment. | ||
303A.03 | The non-management directors of a listed company must meet at regularly scheduled executive sessions without management. | We |
| 164 |
Corporate Governance |
| 303A.04 | A listed company must have a nominating/corporate governance committee composed entirely of independent directors, with a written charter that covers certain minimum specified duties. “Controlled companies” and “foreign private issuers” are not required to comply with this requirement. | As a controlled company and foreign private issuer, we are not required to comply with the nominating/corporate governance committee requirements. However, we do have a compensation, nominating and governance committee composed of As set ·identifying individuals qualified to be nominated as members of the · ·developing corporate governance guidelines and principles; and ·evaluating the performance and effectiveness of the directors, the CEO and each of committees. See | ||
303A.05 | A listed company must have a compensation committee composed entirely of independent directors, with a written charter that covers certain minimum specified duties. “Controlled companies” and “foreign private issuers” are not required to comply with this requirement. | As a controlled company and foreign private issuer, we are not required to comply with the compensation committee requirements. However, we do have a compensation, nominating and governance committee composed of As set forth in the committee’s charter, this committee is responsible for, among other matters: |
|
|
| ||
·reviewing and proposing new compensation models and changes to current compensation models; and ·determining compensation of See |
| 165 |
Corporate Governance |
303A.06 303A.07 | A listed company must have an audit committee with a minimum of three independent directors who satisfy the independence requirements of Rule 10A-3 under the Exchange Act, with a written charter that covers certain minimum specified duties. | We have an audit committee composed of three members, all of whom qualify as independent under Rule 10A-3 and applicable NYSE standards. Each member of the As set forth in the committee’s ·quality and integrity of ·the effectiveness of · · ·the qualifications, performance and independence of See | ||
303A.08 | Shareholders must be given the opportunity to vote on all equity-compensation plans and material revisions thereto, with limited exemptions set forth in the NYSE rules. |
| ||
303A.09 | A listed company must adopt and disclose corporate governance guidelines that cover certain minimum specified subjects. | We have |
| 166 |
Corporate Governance |
| 303A.10 | A listed company must adopt and disclose a code of business conduct and ethics for directors, officers and employees, and promptly disclose any waivers of the code for directors or executive officers. | We have adopted a formal |
|
|
| ||
303A.12 | (a) Each listed company CEO must certify to the NYSE each year that he or she is not aware of any violation by the (b) Each listed company CEO must promptly notify the NYSE in writing after any executive officer of the listed company becomes aware of any non-compliance with any applicable provisions of this Section 303A. (c) Each listed company must submit an executed Written Affirmation annually to the NYSE. In addition, each listed company must submit an interim Written Affirmation as and when required by the interim Written Affirmation form specified by the NYSE. | As a foreign private issuer, we are subject to and comply with (b) and (c) of these requirements, but are not subject to (a). |
| 167 |
Board of directors |
Board of directors
Our boardBoard of directors is responsible for the general guidance of our business and affairs, including providing general guidance, governance and strategic oversight to our executives and other members of our management team. It is also responsible for ensuring that we meet our objectives, as well as for monitoring our performance and ensuring business continuity. The boardBoard of directors is vested with broad powers to act on behalf of the CompanyNexa and to perform or authorize all acts of administrative or ancillary nature necessary or useful to accomplish our corporate purpose. All powers not expressly reserved by law to the shareholders fall within the competence of our boardBoard of directors.
Our boardAppointment and term of members of our Board of directors is comprised
In accordance with our articles of association and the 1915 Law, the members of our Board of directors are elected by a resolution of a minimumgeneral meeting of five andshareholders adopted with a maximum of eleven members and currently has nine members, of which four are independent directors and five are non-independent, as set out below. The non-independent directors are non-independent on the account of such directors either also being executive officerssimple majority of the Company, its subsidiariesvotes validly cast, regardless of the portion of capital represented at such general meeting. Votes are cast for or its controlling shareholder, as applicable, or having been retained to provide consulting servicesagainst each nominee proposed for election to the Company. Board and cast votes shall not include votes attaching to shares for which the shareholder has not participated in the vote, has abstained or has returned a blank or invalid vote.
Our directors are appointed at the general meeting of our shareholders for a mandate of a one-year termtwo-year terms and may be reelected. Members of our boardBoard of directors may be removed at any time, with or without cause, by a resolution adopted at a general meeting of our shareholders. Under Luxembourg law, in the case of a vacancy of the office of a director appointed by the general meeting of shareholders, the remaining directors may, by a simple majority vote of the directors present or represented, fill the vacancy. In these circumstances, the following general meeting of shareholders shall make the final appointment of the director.
Composition of the Board of directors
The following table sets forth our currentOur Board of directors their respective board positionsis comprised of a minimum of five and their respective datea maximum of election to the board. Mosteleven members and currently has ten members, of our currentwhich five are independent directors were elected when our articles of association provided for two-year terms for directors. On August 11, 2017, we amended our articles of association to provide that directorsand five are appointed for terms not to exceed one year. non-independent, as set out below.
The term of each and all of our directors expires on August 25, 2018.
at the 2024 annual general meeting of shareholders. The following table sets forth our current directors as of the date of this filing, their respective Board positions and their respective date of election to the Board.
Name | Age |
| Position |
|
|
| ||||||
| 68 | Aventura, USA | Chair of the Board | June 18, 2019 | ||||||||
| Daniella Dimitrov (1)(2)* | 54 | Toronto, Canada | Director | December 14, 2017** | ||||||||
| Diego Hernandez (2) | 75 | Vitacura, Chile | Director | August 25, 2016 | ||||||||
| Eduardo Borges de | 57 |
| São Paulo, Brazil | Director |
| August 25, 2016 | ||||||
| 73 | New Jersey, USA | Director | December 14, 2017** |
|
|
|
| ||||
Gianfranco Castagnola (4) | 63 | Lima, Peru | Director | June 4, 2020 | ||||||||
| Hilmar Rode (2)* | 57 | Woluwe-Saint-Pierre, Belgium | Director | June 22, 2023 | ||||||||
| Jane Sadowsky (1)(3)* | 62 | New York, USA | Director | December 14, 2017** | ||||||||
| João Henrique Batista de Souza | 45 |
| São Paulo, Brazil | Director |
| October 18, 2016 | ||||||
| 63 |
| São Paulo, Brazil | Director |
| August 25, 2016 | ||||||
|
|
|
|
| ||||||||
|
|
|
|
| ||||||||
|
|
|
|
| ||||||||
|
|
|
|
| ||||||||
|
|
|
|
|
(1) Member of the Audit committee.
(2) Member of the SCP committee.
(3) Member of the CNG committee.
(4) Member of the Finance committee.
* Independent pursuant to Rule 10A-3 under the Exchange Act (Rule 10A-3) and applicable NYSE standards, as well as National Instrument 52-110 Audit Committees.
** The Audit Committees’ members were elected in December 2017 and Section 311the effective date of the TSX Company Manual.
(2) Edward Ruiz is a member of both the audit and finance committees.
* Member of the compensation, nomination and governance committee.
** Member of the audit committee.
*** Member of the finance committee.
mandate starting period January 2018.
The business address of each member of our boardBoard of directors is Nexa’sour corporate office, which is 26-28 rue Edward Steichen, L-254037A, Avenue J.F. Kennedy, L-1855, Luxembourg, Grand Duchy of Luxembourg.
| 168 |
Board of directors |
We present below a brief biographical description of each member of our boardBoard of directors:
Luís Ermírio de MoraesJaime Ardila.. Mr. MoraesArdila has been a member and the Chairman of our boardBoard of directors since 2016.June 2019 and has been Chair of the Board since July 30, 2020. Mr. Ardila founded The Hawksbill Group in 2016, which provides business advisory services, including strategy, operations, public relations, communications and investment advice. Prior to that, he held several positions at General Motors Company in the U.S., Europe and South America in a career spanning 30 years. He has also been a memberworked at the Planning Department and the ChairmanMinistry of Industry and Trade for the government of Colombia from 1981 to 1984 and the investment bank Rothschild from 1996 to 1998. At General Motors, Mr. Ardila served CFO of General Motors Chile; President and Managing Director of General Motors Ecuador; President of General Motors Colombia; President of General Motors Argentina; CFO for Latin America, Africa and the Middle East; President for Brazil and Mercosur; and President of General Motors South America from 2010-2016. He is currently a member of the board of directors of Nexa Brazil since 2014. Mr. Moraes has over 35 years of experience working in miningAccenture and metallurgical operations. He is currently Vice President of VSA, which is the Portfolio Manager Board of the Votorantim Group. Mr. Moraes is Chairman of CBA,Goldman Sachs, BDC. Mr. Ardila earned his master’s degree in Economics at the largest integrated aluminum producerLondon School of Economics in Brazil. He is a board member of Hejoassu, which is the ownership board of Votorantim. Mr. Moraes previous roles include director of VSA since 2000. Mr. Moraes also worked as an engineer in various processes in the areas of alumina refinery, smelter1981 and aluminum smelting, pyrometallurgical and hydrometallurgical mineral processing of nickel laterites, developing novel projects for the separation and refining of cobalt. In the early 2000s, Mr. Moraes was the shareholder responsible for the creation and development of a new
Votorantim business area with investments in IT and biotechnology. Mr. Moraes received ahis bachelor’s degree in mineral and chemistry engineering fromEconomics at the Colorado SchoolUniversity of Mines,Bogota in the state of Colorado, United States, in 1982.
1977.
Daniella Dimitrov. Ms. Dimitrov has been a member of our boardBoard of directors since January 2018. Ms. Dimitrov has over 2025 years of leadership experience in building, leading and operating businesses in mining and financial services, including as CEO, COO and CFO. She is currently aMs. Dimitrov’s previous roles include President and CEO, Interim CEO, CFO of multi mine gold/copper producers, partner at Sprott Capital Partners, a division of Sprott Private Wealth LP, a merchant bank with a focus on natural resources. Ms. Dimitrov is also a director of Excellon Resources Inc. Ms. Dimitrov’s previous roles include President and CEO and CFO of a multi-mine gold/copper producer;resources, Executive Vice-ChairVice Chair of an iron ore developer through its acquisition following a hostile take-over bid;takeover bid, COO of a Canadian national wealth management and capital markets firm;firm, and various corporate development roles in mining and financial services. Ms. Dimitrov has also been a director of various companies in the mining, companiesoil, gas and chemicals industries and has served as a member and chair of various board committees, including audit, technical, health and safety.safety, compensation and governance. Ms. Dimitrov is currently also a director of Chemtrade Logistics Income Fund. Ms. Dimitrov has received the NACD Directorship Certification and the ESG Global Competent Boards Designation and is a candidate for the Cyber Risk Oversight Certificate from the CERT Division of the Software Engineering Institute at Carnegie Mellon University. She has a Global EMBA from Kellogg School of Management and Schulich School of Business and a law degree from University of Windsor.degree. She was chosen as one of the top 100 Global Inspirational Women in Mining in 2016.
João Henrique Batista de Souza Schmidt.Diego Hernandez. Mr. SchmidtHernández has been a member of our boardBoard of directors since 2016. He is currently the Executive Director for Corporate Development at VSA, a position he has held since August 2014. Mr. Schmidt has been a member of the Board of Directors of Fibria Celulose S.A. since 2014, the President of the Board of Directors of Votorantim Geração de Energia S.A. since 2014, member of the Board of Directors of Citrosuco S.A. since 2014 and Nexa Brazil since 2016. Prior to joining VSA, Mr. Schmidt had 15 years of experience in the financial sector. Mr. Schmidt was a Managing Director of Goldman Sachs do Brasil Banco Múltiplo S.A. from April 2010 to August 2014, and prior to that worked at Citigroup and Goldman Sachs in different capacities. Mr. Schmidt received a bachelor’s degree in Business Administration from Fundação Getulio Vargas in 2001.
Eduardo Borges de Andrade Filho. Mr. Andrade has been a member of our board of directors since 2016. He has also been a member of the board of directors of Nexa Brazil until 2018. Mr. Hernández has 50 years of experience in the mining industry. He is currently Corporate Director of BAL Group in Mexico. He served as President of the Sociedad Nacional de Minería in Chile (2016 to 2022) and CEO of Antofagasta Minerals from August 2012, and CEO of Antofagasta plc from September 2014 to April 2016. He was CEO of CODELCO in 2010/2012 and President of Base Metals in BHP Billiton and Chairman of Minera Escondida during 2004/2010. He served as Executive Director, Non-Ferrous Metals in Vale in 2001/2004, CEO of Compañía Minera Doña Inés de Collahuasi in 1996/2001 and has held other senior positions in Anglo American and Rio Tinto. Mr. Hernandez received a civil mining engineer degree from the University of Chile and from the École Nationale Supérieure des Mines de Paris. In 2010, he received the Ankh award granted by the Copper Club of New York, and in 2013 the Chilean Institute of Engineers awarded him the “Gold Medal” for his distinguished career and important contribution to the development of engineering in Chile.
Eduardo Borges de Andrade Filho. Mr. Andrade has been a member of our Board of directors since 2014.2016. He was a member of the board of directors of Nexa Brazil until 2018 and has been member of the board of directors of CBA since 2017. Mr. Andrade has over 20 years of experience working with large industrial conglomerates and international consulting firms on relevant issues related to strategy, corporate development, corporate finance, governance and organization. He is founder and managing director of Otinga Investimentos, a private equity firm focusing on mid-size companies in Brazil. Between 2011 and 2014, he was corporate planning officer at VSA and served as board member of four other companies of the Votorantim Group. From 2010 to 2011, he was vice president for corporate development at Usiminas, a steel company, where he was responsible for mining and capital goods businesses, as well as strategy, business development and M&A. Prior to that, between 1997 to 2010, he was a Partner at McKinsey & Company, a consulting firm, where he took various leadership roles such as the Basic Materials Practice and the Knowledge Committee in Latin America. He started his professional career as an entrepreneur and engineer in his home state of Minas Gerais. Mr. Andrade received a bachelor’s degree in civil engineering from Fundação Mineira de Educação e Cultura in 1991 and holds aan MBA from the University of Chicago in 1995.
| 169 |
Board of directors |
Diego Hernandez C. Mr. Hernández has been a member of our board of directors since 2016. He has also been a member of the board of directors of Nexa Brazil since 2014. Mr. Hernández has over 44 years of experience in the mining industry. He is currently the President of the Sociedad Nacional de Minería in Chile, Director of the Chilean Institute of Engineers and Advisor to the Chairman of BAL Group. He also integrates the Executive Committee of the Confederación de la Producción y del Comercio de Chile. He served as CEO of Antofagasta Minerals from August 2012, and in September 2014 was appointed CEO of Antofagasta plc, a position he held until April 2016. He was CEO of CODELCO in 2010/2012 and President of Base Metals in BHP Billiton and Chairman of Minera Escondida during 2004/2010, based in Santiago. He served as Executive Director non-ferrous metals in Vale in 2001/2004, CEO of Compañía Minera Doña Inés of Collahuasi in 1996/2001 and has held other senior positions in Anglo American and Rio Tinto. Mr. Hernandez received a civil mining engineer degree from the University of Chile and from the École Nationale Supérieure des Mines de Paris. In 2010, he received an award granted by the Copper Club of New York, and in 2013 the Chilean Institute of Engineers awarded him the “Gold Medal” for his distinguished career and important contribution to the development of engineering in Chile.
Jean Simon. Mr. Simon has been a member of our board of directors since 2016. He has also been a member of the board of directors of Nexa Brazil since 2014. He has over 33 years of professional experience in aluminum primary metals, bauxite and alumina and in strategy, business management, operations and R&D, labor negotiations and stakeholder management. Mr. Simon served as served as general manager of several facilities and as regional vice president and president of Primary Metal North America; then president for Rio Tinto Alcan Primary Metal, with operations in North America, Europe, Middle East and Africa. He is currently a board member of the Bank of Canada and a board member of Aluquebec, an aluminum cluster, which coordinates working groups within the Québec aluminum processing industry. Mr. Simon received a bachelor’s degree in physics engineering from Laval University in 1978 and a degree in Business Administration from the Université du Québec in 1982. He also graduated from the Directors Education Program in partnership with the Institute of Corporate Directors, the Mc Gill Executive Institute and the Rotman School of Management, University of Toronto in 2013.
Edward Ruiz. Mr. Ruiz has been a member of our boardBoard of directors since January 2018. Mr. Ruiz brings over 4651 years of experience in public and private accounting. Mr. Ruiz currently serves on the audit committee of several publicly traded companies in Brazil, including Iochpe-Maxion SA and Arezzo & Co. He is a Certified Public Accountant since 1972 and has been responsible for audits of companies in the mining and energy sectors in Brazil and the United States. Mr. Ruiz retired from Deloitte in 2012, where he was employed since 1997 and most recently served as an audit partner and member of Deloitte’s IFRS Accounting Standards specialist group. As head of the Capital Markets group for Deloitte, Mr. Ruiz advised companies on financial and regulatory reporting matters related to initial public offerings and secondary offerings in the Brazilian, United States and European capital markets. Prior to Deloitte, he held executive positions in internal audit at JP Morgan and PepsiCo in the United States. He started his career in public accounting with Arthur Young in 1971. Mr. Ruiz obtained his bachelor’s degree from Pace University, New York City in 1971.
Ivo Ucovich.Gianfranco Castagnola. Mr. UcovichCastagnola has been a member of our Board of directors since June 2020. Mr. Castagnola is partner and CEO of Apoyo Consultoría, a leading firm specialized in economic, business and financial advisory services in Peru. He also serves as chairman of the board of directors of its subsidiary, AC Capitales SAFI, one of the largest Peruvian investment fund managers. He has been a member of the board of directors of the Peruvian Central Bank from 1996 to 2001 and was president of the Universidad del Pacífico board of trustees. He is chairman of the board of directors of Scotiabank Peru S.A., and member of the board of directors of Saga Falabella, the Austral Group and IKSA. Mr. Castagnola’s previous roles include serving as member of the board of directors of Nexa Peru, Nexa Resources Atacocha S.A.A., Lima Airport Partners, Quimica Suiza, Cementos Pacasmayo, Camposol Holding and Redesur. Mr. Castagnola earned his master’s degree in public policy from Harvard University and his bachelor’s degree in Economics from the Universidad del Pacífico.
Hilmar Rode. Mr. Rode has been a member of our Board of directors since 2016.June 2023. Mr. Ucovich bringsRode has over 5030 years of experience in the global mining, materials, chemicals, and administration.industrial gases industries. He began his career in process development and research engineering before joining Anglo American, where he worked for 12 years in leadership positions in its industrial diamonds, base metals and paper divisions in South Africa, United Kingdom and Austria. He joined Glencore in 2007 as CEO of its zinc division in Bolivia, returning in 2019 to the copper division to work on operational strategy, technical services, projects and capital management. Between 2015 and 2019, Mr. Ucovich has been the ChairmanRode was president of Nexa Peru’s board since 2002. He has servedBHP’s Minera Escondida Ltda. in Chile and then Chief Executive Officer of zinc producer Nyrstar. Since September 2020, Mr. Rode joined Sibelco as Chairman of Atacocha since 2008. He is also Director of Química Suiza, Sociedad de Minería Petróleo y Energía and Comex Perú. He receivedgroup CEO. Mr. Rode holds a bachelor’s degree in MetallurgicalChemical Engineering from Lafayette Collegethe University of Stellenbosch, South Africa, a Master’s in 1965.
Environmental Engineering and a Doctorate in Chemical Engineering from State University, Buffalo, New York, and a Certificate in the Advanced Management Program from Harvard Business School.
Jane Sadowsky. Ms. Sadowsky has been a member of our boardBoard of directors since January 2018. Ms. Sadowsky has a broad and diverse range of finance and deal-related expertise and also has sector expertise in power and utilities and the related fields of commodities, renewables, power technology, infrastructure, and energy. She has a depth of knowledge and experience in mergers and acquisitions, public and private debt and equity, corporate restructurings and cross border transactions. Ms. Sadowsky retired from Evercore Partners, after more than 22 years as an investment banker. Prior to Evercore Partners, she worked in Citigroup’s Investment Bank and began her investment-banking career at Donaldson, Lufkin & Jenrette. Currently, Ms. Sadowsky serves on the board, the audit and the audit committeecompensation committees of Allied Gold, Inc. (former Yamana Gold,Gold), and chairs Allied Gold’s nomination and governance committee. She also serves as a senior advisor with responsibility for diversity and inclusion at Moelis &. Company, a U.S. publicly traded gold miningcompany. Ms. Sadowsky also serves on the board and Remuneration Committee of Scientific Games, a PE-backed company based in Toronto, Canada,the US and chairs Yamana’s governance committee.the NY Chapter of NACD. Ms. Sadowsky earned her MBA from the Wharton School in 1989 and her bachelor’s degree in Political Science and International Relations from the University of Pennsylvania in 1983. Ms. Sadowsky has received the NACD Directorship Certification. She is a National Association of Corporate Directors Governance Fellowfellow and a frequent speaker at board governance conferences throughout the United States.
João Henrique Batista de Souza Schmidt. Mr. Schmidt has been a member of our Board of directors since 2016. He has held the position of executive officer for Corporate Development at VSA, and in 2020 he assumed the position of CEO. He is a board member of Auren, a position he has held since 2017. He served as Chairman of the board of directors of CESP – Companhia Energética de São Paulo in part of 2019. He also served as member of the board of directors of Citrosuco S.A. from 2014 to 2019 and Nexa Brazil from 2016 to 2018. Mr. Schmidt was previously a member of the board of directors of Fibria Celulose S.A. from 2014 to 2019. Prior to joining VSA, Mr. Schmidt had 15 years of experience in the financial sector. Mr. Schmidt was a Managing Director of Goldman Sachs do Brasil Banco Múltiplo S.A., where he worked from April 2010 to August 2014, and prior to that worked at Citigroup and Goldman Sachs in different capacities. Mr. Schmidt received a bachelor’s degree in Business Administration from Fundação Getulio Vargas in 2001.
| 170 |
Board of directors |
Luís Ermírio de Moraes. Mr. Moraes has been a member of our Board of directors since 2016, and was the Chair of the Board until July 30, 2020. He was a member and the Chairman of the board of directors of Nexa Brazil until 2018. Mr. Moraes has over 35 years of experience working in mining and metallurgical operations. He is a member of the board of directors of VSA, which is the Portfolio Manager Board of the Votorantim Group. Mr. Moraes is Chairman of the board of directors of CBA, the largest integrated aluminum producer in Brazil. He is a board member of Hejoassu, which is the ownership board of Votorantim. Mr. Moraes previous roles include director of VSA since 2000. Mr. Moraes also worked as an engineer in various processes in the areas of alumina refinery, smelter and aluminum smelting, pyrometallurgical and hydrometallurgical mineral processing of nickel laterites, developing novel projects for the separation and refining of cobalt. In the early 2000s, Mr. Moraes was the shareholder responsible for the creation and development of a new Votorantim business area with investments in IT and biotechnology. Mr. Moraes received a bachelor’s degree in mineral and chemistry engineering from the Colorado School of Mines, in the state of Colorado, United States, in 1982.
Internal rules of the Board of directors
Our Board of directors adopted Board internal rules, which includes the following, among other things:
| · | approve the general guidance of our business, its mission, strategic goals and guidelines; |
| · | ensure that the executive officers comply with such mission, strategic goals and guidelines; |
| · | approve the budget and a strategic plan which takes into account, among other things, the opportunities and risks of the business; |
| · | approve the annual commercial agreements strategy; |
| · | recommend the shareholders to approve mergers, spin-offs, incorporations, acquisitions, divestitures and joint venture operations related to Nexa and its subsidiaries according to our articles of association; |
| · | promote and ensure compliance with our corporate purpose; |
| · | ensure Nexa’s long-term and sustainable continuity with respect to the Company’s ESG and economic goals, including, but not limited to, supporting the Board committees to oversee and revise the implementation of the Company’s ESG strategy pursuant to applicable laws, when applicable; |
| · | develop our approach to corporate governance, including the creation and review, from time to time, of corporate governance principles and guidelines that are specifically applicable to us; |
| · | evaluate the performance of our CEO and executive officers; |
| · | exemplify and, together with the Management committee, implement a culture of integrity throughout the organization; |
| · | approve and monitor compliance, directly and/or through its committees, with the following policies: (a) code of conduct; (b) disclosure policy; (c) insider trading policy; (d) dividend policy; (e) compliance policy; (f) antitrust/competition policy; (g) anti-corruption policy; (h) money laundering and terrorist financing prevention policy; (i) financial risk management policy (and complementary policies proposed by the Management committee, such as the hedge, derivatives, leverage, liquidity and foreign exchange exposure policy); (j) ERM policy; (k) Clawback policy; and (l) authorization policy; |
| 171 |
Board of directors |
| · | approve Board members and executive officers’ compensation, the amount of which shall not exceed the amount determined by the general meeting; |
| · | ensure appropriate succession planning for our Board of directors, CEO and executive officers; |
| · | deliberate and approve the terms and conditions of any compensation arrangements or proposed material amendments to any terms and conditions of existing compensation arrangements entered between Nexa and any of our executive officers; and |
| · | all further tasks as required by applicable laws. |
The Board internal rules are available on our website.
The Board has at its disposal a set of provisions and practices that promotes independence in the decision-making process of the Board. In accordance with the Board’s internal rules, the independent members of the Board may hold separate meetings and each director has a duty to declare, prior to any Board meeting, the existence of a particular reason or conflict of interest with Nexa with respect to a subject matter being discussed or considered by the Board. Accordingly, such Board member would be refrained from discussing and voting on a matter that could present a conflict of interest. Additionally, our Board members are prohibited from holding executive positions with Nexa and/or serving on more than four boards of directors of companies that do not belong to the same conglomerate. As discussed above, our Audit committee is comprised entirely of independent directors and we also have independent representation on all other committees.
Description of the position of Chair
Our Board of directors has developed a written position description for the chair of the Board of directors. The chair of the Board has the following responsibilities, subject to any other matters that may be set forth in our articles of association or provided for under applicable law:
| · | ensure the efficiency and proper performance of the Board of directors; |
| · | preside over the Board meetings; |
| · | prepare, organize, elaborate and distribute the agenda and minutes of the meetings aided by the Board secretary, including all information necessary to discuss the matters on the agenda; |
| · | coordinate the activities of other Board members; |
| · | ensure that all Board members receive comprehensive information about the items on the Board agenda in a timely manner; |
| · | propose the annual corporate calendar to the Board in coordination with Nexa’s CEO, which shall necessarily set forth the dates of corporate events; |
| · | organize the onboarding and education sessions for incoming members of the Board in coordination with Nexa’s CEO; and |
| · | periodically arrange for continuing education opportunities for all Board members, so that individuals may maintain or enhance their skills and abilities as members and ensure that their knowledge and understanding of Nexa’s business remains current. |
The chair of our Board of directors is not an independent director of Nexa Resources. The Board of directors has carefully considered governance issues relating to chair independence and believes that the chair carries out separate responsibilities diligently and that, with the compensating practices in place, the Board of directors operates effectively and in Nexa’s best interest.
| 172 |
Board of directors |
Meetings of the Board of directors and attendance
The Board of directors ordinarily meets in person or by other means of communication as may be required. The frequency of and agenda items for Board meetings will vary depending on the state of affairs, requirements for approvals and opportunities available to Nexa and the risks and issues which Nexa faces. The agenda for meetings places priority and focuses on key issues for Nexa, which are identified by the chair of our Board. Routine business is dealt with after substantive discussions on the key issues.
Under the Board of directors’ internal rules and our articles of association, the Board can validly consider any matters and make decisions provided at least a majority of the members are in attendance in person or by representation. The Board of directors’ internal rules further provides that each member is entitled to one vote either in person or where duly represented as required by the Board’s internal rules. In fiscal year 2023, our Board of directors held eight meetings, in which the rate of attendance in person or by representation was 100% of the directors. In addition, we had (i) nine Audit committee meetings, (ii) five Finance committee meetings, (iii) six CNG committee meetings, and (iv) eight SCP committee meetings.
Director | Board Meetings | Meetings Attended | Overall % Attendance |
| Jaime Ardila | 8 | 8 | 100 |
| Daniella Dimitrov | 8 | 8 | 100 |
| Diego Hernandez | 8 | 8 | 100 |
| Eduardo Borges de Andrade Filho | 8 | 8 | 100 |
| Edward Ruiz | 8 | 8 | 100 |
| Gianfranco Castagnola | 8 | 8 | 100 |
| Hilmar Rode | 4 | 4 | 100 |
| Jane Sadowsky | 8 | 8 | 100 |
| João Henrique Batista de Souza Schmidt | 8 | 8 | 100 |
| Luís Ermírio de Moraes | 8 | 8 | 100 |
As set forth in the Board of directors’ internal rules, the independent directors may hold meetings in which members of the management team and the non-independent directors are not present. In 2023, our directors held in camera sessions without members of the management team prior and/or at the conclusion of each Board meeting.
Committees of our Board of directors
Our Board of directors has an Audit committee, a Finance committee, a CNG committee and a SCP committee. Our Board of directors may have other committees as it may determine from time to time. Each of the standing committees of our Board of directors has the composition and responsibilities assigned to them by the meeting of the Board of directors that created such committee and as set forth in their respective committee charters. These charters set out, among other things, the roles and responsibilities of the chair of each committee. As set forth in the respective charters of the committees, each of the committees may meet with or without the management, as the case may be, at the discretion of the committee. The charter for each of the committees of our Board of directors is available on our website.
Audit committee
Our Audit committee is a standing committee established by our Board of directors on March 28, 2017 to assist the Board of directors in fulfilling certain of its oversight responsibilities. The Audit committee may be composed of three to five members, each appointed by our Board of directors for a term of one year. Daniella Dimitrov, Edward Ruiz and Jane Sadowsky currently serve as its members. These individuals are independent under Rule 10A-3 and applicable NYSE standards, as well as Canadian securities regulators’ National Instrument 52-110 Audit Committees. In addition, each of them satisfies the financial literacy requirement under applicable rules. Our Board of directors has determined that Mr. Edward Ruiz qualifies as an “audit committee financial expert.”
| 173 |
Board of directors |
Our Audit committee’s primary responsibilities are to assist the Board of directors’ oversight of: (i) quality and integrity of our financial reporting and related financial disclosure; (ii) the effectiveness of our internal control over financial reporting and disclosure controls and procedures; (iii) our compliance with legal and statutory requirements as they relate to financial statements and related financial disclosures; (iv) the monitoring of risk management controls and processes, according to the ERM policy, and the oversight of financial reporting and related compliance, internal control over financial reporting and fraud risks; (v) the compliance and ethics program; (vi) review of all related party transactions; (vii) the qualifications, performance and independence of our independent auditors and performance of the internal audit function; (viii) the adherence to internal controls related to our ESG disclosures, targets and public commitments, pursuant to applicable laws; and (ix) the Company’s cybersecurity risk management program, including policies, procedures and controls.
Nexa has established policies and procedures that require any engagement of our independent auditor for audit or non-audit services to be submitted to and pre-approved by the Audit committee. In addition, our Audit committee may delegate the authority to pre-approve non-audit services to one or more of its members. All non-audit services that are pre-approved pursuant to such delegated authority must be presented to the full Audit committee at its first scheduled meeting following such pre-approval. Our Audit committee shall pre-approve all audit and non-audit services to be provided to us by our independent auditor and also has the authority to recommend pre-approval policies and procedures to our Board of directors and for the engagement of our independent auditor’s services.
Finance committee
Our Finance committee is a standing committee established by our Board of directors on March 28, 2017 to assist the Board of directors in fulfilling certain of its oversight responsibilities. The Finance committee may be composed of three to five members, each appointed by our Board of directors for a term of one year. Gianfranco Castagnola, Edward Ruiz and João Henrique Batista de Souza Schmidt currently serve as its members. It is also the Finance committee attribution to support the Board in its monitoring of the enterprise risk management in matters related to the responsibility of this committee.
Our Finance committee’s primary responsibilities are to assist the Board of directors in fulfilling its oversight responsibilities with respect to monitoring Nexa’s balance sheet and by providing recommendations on our capital management strategy and capital structure, including indebtedness, investments and returns, support the Board in its monitoring of the enterprise risk management in matters related to the responsibilities of the committee, among others.
CNG committee
Our CNG committee is a standing committee established by our Board of directors on March 28, 2017, to assist the Board of directors in fulfilling certain of its oversight responsibilities. The CNG committee may be composed of two to five members, each appointed by our Board of directors for a term of one year. Luís Ermírio de Moraes, Eduardo Borges de Andrade Filho, Jaime Ardila and Jane Sadowsky currently serve as its members. Two of the four members of the compensation, nominating and governance committee are independent directors.
Our CNG committee is responsible for: (1) new compensation models and changes to compensation models currently used by us, in order to guide and influence our actions; (2) the compensation of the executive officers, of the members of the Board of directors and of the members of the committees of the Board of directors; (3) the proposal of candidates to the chair of chief executive officer, when applicable, or any serious restrictions on the candidates proposed by the chief executive officer to the other chairs of the executive officers; (4) development of corporate governance guidelines and principles; (5) the governance structure related to the Company’s ESG strategy as it applies to the Company and its value chain; (6) identification of individuals qualified to be nominated as members of the Board of directors and suggesting nominees to fill any vacancies on the Board of directors; (7) the structure and composition of Board committees; (8) evaluation of the performance and effectiveness of the Board of directors, the chief executive officer and each of the Board’s standing committees; (9) the supervision and approval of our social responsibility plans and policies (other than community-related aspects which are overseen by the SCP committee), including, but not limited to, our ESG strategy; (10) support the Board in its monitoring of the enterprise risk management in matters related to the responsibilities of the committee; (11) any related matters required by applicable laws; and (12) administering the policy for the recovery of erroneously awarded compensation. For more information regarding our corporate governance policies, see “Information on the Company—Environmental, Social and Governance (ESG)—Nexa Materiality Matrix—Governance.
| 174 |
Board of directors |
SCP committee
Our SCP committee is a standing committee established by our Board of directors on April 29, 2019 to assist the Board of directors in fulfilling certain of its oversight responsibilities. The SCP committee may be composed of at least three and no more than five members, each appointed by our Board of directors for a term of one year. Diego Hernandez, Daniella Dimitrov, Hilmar Rode and Jaime Ardila currently serve as its members.
Our SCP committee’s primary responsibilities are to assist the Board of directors by supporting safe and sustainable business practices in the conduct of our activities in respect of environmental, health, safety and social matters, including relationships with local communities, tailings management, water, waste, biodiversity, and GHG emissions (climate change), as well as with respect to the estimation and disclosure of mineral resources and reserves at all operations and projects (collectively “Sustainability Matters”). The committee also assists the Board with the oversight of our ESG strategy, including its revision and implementation, in connection with the Sustainability Matters and all related applicable laws.
The SCP committee is also responsible for assisting the Board with the review of technical, economic and social matters with respect to our projects, including exploration, development, permitting, construction and operation of our mining and smelting assets, which are core to our strategy and growth. For more information regarding our sustainability policies, see “Information on the Company—Environmental, Social and Governance (ESG)—Nexa Materiality Matrix—Environmental” and “Information on the Company—Environmental, Social and Governance (ESG)—Nexa Materiality Matrix—Social.”
Orientation and continuing education
We implemented an orientation program for new directors under which each new director meets with the chair of our Board of directors and our executives. New directors are provided with comprehensive orientation and education as to our business, operations and corporate governance (including the role and responsibilities of the Board of directors and each committee).
The chair of our Board of directors is responsible for overseeing directors’ continuing education and ensure that it is designed to maintain or enhance the skills and abilities of our directors and to ensure that their knowledge and understanding of our business remains current. The chair of each committee is responsible for coordinating orientation and continuing director development programs relating to the committee’s mandate.
Our ongoing director education programs entails site visits, presentations from outside experts and consultants, discussions on ongoing governance trends and guidelines for public companies, briefings from staff and management, and reports on issues relating to our projects and operations, sustainability and social matters, competitive factors, reserves, legal issues, economic, accounting and financial disclosure, mineral and hydrocarbon education and other initiatives intended to keep the Board abreast of new developments and challenges that we may face. As part of the education session, certain directors obtained international certifications related to the competencies necessary for their activities, such as National Association of Corporate Directors (“NACD”) Directorship Certification.
Evaluation of directors
Our CNG committee established a framework for the implementation and administration of processes to assess the effectiveness of the Board and each of its members. This includes peer reviews of each director’s performance and self-assessments, as well as full Board and committee review of the Board and the respective committees, by way of questionnaires, interviews and sessions with the chair. In addition to hiring external advisors to develop and undertake this assessment, the CNG committee is also responsible for overseeing the process and evaluating the results, with the objective of improving the performance of each director and the Board of directors as a whole.
| 175 |
Board of directors |
Considerations in evaluating director nominees
Our Board of directors is responsible for nominating members for election to the Board and for filling vacancies on the Board that may occur between annual meetings of shareholders. The process for nominating a new director initiates with our CNG committee which evaluates Nexa’s current circumstances and establishes a profile for a director candidate. Such profile is then shared with a specialized external executive search firm, who assists the CNG committee in selecting candidates for interviews. Prior to the interview, the specialized external firm is responsible for a background check with former employers and colleagues of the respective candidates.
Following the interview(s), our CNG committee recommends the nomination of the director candidate to our Board of directors based upon an assessment of the independence, skills, qualifications and experience of such candidate. Specifically, the Board seeks members from diverse professional and personal backgrounds who combine a broad spectrum of experience and expertise with a reputation for integrity.
Diversity
We value diversity of abilities, experience, perspective, education, gender, background, race and national origin. We believe that having a diverse Board of directors can offer a breadth and depth of perspectives that enhance our performance. Recommendations concerning director nominees are based on merit and past performance as well as expected contribution to the Board’s performance and, accordingly, diversity is taken into consideration. We believe that having a diverse and inclusive organization overall is beneficial to our success, and we are committed to diversity and inclusion at all levels of our organization to ensure that we attract, retain and promote the brightest and most talented individuals. We have recruited and selected executives that represent a diversity of business understanding, personal attributes, abilities and experience.
The CNG committee and our Board of directors have the responsibility to review and assess the composition of the Board and each of its committees, and to identify, evaluate and recommend potential new directors. With respect to our executive officers, the CNG committee reviews candidates recommended by the chief executive officer and makes the final recommendation to the Board of directors. In new director and executive officer appointments and ongoing evaluations of the effectives of our Board and management team, each of the Board’s committees and each director, the Board will take into consideration diversity as one of the factors in order to maintain an appropriate mix and balance of diversity, attributes, skills, experience and background on our Board of directors and each of its committees and the management team. Ultimately, appointments to our Board of directors and management team are based on merit against objective criteria and with due regard to the benefits of diversity in Board and management team composition and the desire to maximize the effectiveness of corporate decision making, having regard to our best interests and strategies and objectives, including the interests of our shareholders and other stakeholders. During our selection process for Board appointments, we seek to ensure that women candidates are always considered on the shortlist for nominations. Currently, two (or 20%) of our ten members of the Board are women, and on a general basis, 17.5% of our overall employees are women.
Further, we developed a diversity program in 2019 as part of the Nexa Way program. This program is composed of affinity groups, which are formed by employees on a volunteer basis and divided into five themes: (i) women, (ii) race and ethnicity, (iii) LGBTQIA+, (iv) people with disabilities and (v) multigenerational. The affinity groups are assisted by a technical committee composed of executive officers and employees in key areas such as human resources, compliance, legal and institutional relations.
The program promotes knowledge, improvements and awareness of diversity in the workplace for our employees. In 2023, we held the Plurality Week, a week dedicated to discussions on the 5 affinity groups, including lectures with external guests. We also continued participating in the Companies and Rights Forum LGBTI+ and continued our partnership with Women in Mining (“WIM”) in Brazil and Peru. In 2023, we signed a letter of commitment to expand and strength the representation of women in the mining industry, fostering a dynamic business environment that not only attracts and retains woman employes, but also harnesses their unique strengths and recognizes their significant contributions. Nexa’s Empodera (Empower) group remained active in community events, promoting discussions about motherhood, harassment, female empowerment and women in the local communities in which our projects are located. We also continued working with our affinity group for people with disabilities and carried out an accessibility survey in all units and offices to evaluate how our structures are serving the disabled. We also launched a podcast to discuss the inclusion of people with disabilities and publicized the digital tools we have implemented into our workplaces. In Brazil, 4.2% of our employees identify as people with disabilities, and by 2030 our diversity target is to have a workforce composed 30% of women employees and 30% of women in leadership positions. These targets are frequently monitored both globally and locally, and action plans are currently being implemented to achieve the proposed targets.
| 176 |
Board of directors |
For more information on our practices related to diversity, see “Information on the Company—Environmental, Social and Governance (ESG)—Nexa Materiality Matrix—Social” and “Information on the Company—Environmental, Social and Governance (ESG)—Nexa Materiality Matrix—Governance.”
Compensation-setting process
Our CNG committee is responsible for assisting our Board of directors in fulfilling its governance and supervisory responsibilities and advising our Board of directors with respect to evaluation and monitoring of compensation models and policies performed every two years, which takes into account peer companies and the challenges and opportunities we face. The committee’s responsibilities also include administering and determining our compensation objectives and programs, reviewing and making recommendations to our Board of directors concerning the level and type of the compensation payable, evaluating performance, implementing evaluation and improvement processes, and ensuring that policies and processes are consistent with our philosophy and the objectives of our compensation program.
Share ownership
Luís Ermírio de Moraes, the chairmana member of our boardBoard of directors, indirectly owns 2,379,071,approximately 2,379,242, or 1.78%1.79%, of our common shares. Ivo Ucovich, a member of our board of directors, indirectly owns 4,955,058, or 3.72%, of our common shares. Mr. Ucovich was appointed by our shareholders to our board of directors pursuant to a shareholders’ agreement among Nexa Resources and its existing shareholders. This shareholders agreement ceased to be in effect prior to consummation of our initial public offering. As of December 31, 2017,2023, none of our executivesexecutive officers own, beneficially or of record, any of our common shares.
| 177 |
Executive Officers and Management Committee |
EXECUTIVE OFFICERS AND MANAGEMENT COMMITTEE
Executive officers and management committee
Executive officers
We have global executives and management teams for our main subsidiaries. Each subsidiary team has a management structure that adheres to our corporate governance rules. Our executives currently are as follows:
Name | Age |
|
| Position | ||
| 54 |
| São Paulo, Brazil | President and Chief Executive Officer | ||
| 54 |
| Senior Vice President of Finance and Group Chief Financial Officer; Chief Executive Officer of Nexa Peru | |||
| Mauro Davi Boletta | 63 | São Paulo, Brazil | Senior Vice President | |||
| 46 |
| Senior Vice President of Mining Operations | |||
| Marcio Luis Silva Godoy | 58 | São Paulo, Brazil | Senior Vice President | |||
| 56 |
|
| Senior Vice President | ||
| 48 |
| São Paulo, Brazil |
| ||
| 40 |
| São Paulo, Brazil |
| ||
|
|
|
| |||
|
|
|
| |||
|
|
|
|
The business address of our executives is 26-28 rue Edward Steichen, L-2540 Luxembourg, Grand DuchyAvenida Engenheiro Luís Carlos Berrini, n° 105, 6th floor, São Paulo, State of Luxembourg.
São Paulo, Brazil.
A brief biographical description of each of our executives is presented below:
Tito Botelho Martins Junior.Ignacio Rosado. Mr. MartinsRosado has been our Chief Executive Officer since 2012. Mr. MartinsJanuary 2022. He has more than 3016 years of experience in the metals and mining industry, and extensive board experience in different countries. Currently he servesMr. Rosado led the initial public offering of Hochschild Mining Plc, and its acquisition strategy on Canadian Mining Assets. He also led the boardreorganization and transformation of CBA, Nexa PeruVolcan Compañia Minera S.A.A. (“Volcan”) which included the construction of two new polymetallic mines and Compañía Minera Atacocha, both listed in the Peruvian Stock Exchange. In 2014 and 2015, he was Chairmanissuance of the Board of the Brazilian Aluminum Association (ABAL).bonds for more than US$1 billion. Prior to joining Nexa Resources, Mr. Martins was Executive Director for Base Metals at Vale S.A., a leading Brazilian mining company, from 2006 to 2012. During this period, he also served as board member of Norsk Hydro, an aluminum producer listed in Norway. He was also a member of the Brazilian Mining Institute. From 2003 to 2006, Mr. MartinsRosado was the CEO of Caemi S.A.,Volcan since 2014 and its Deputy CEO since 2010. Prior to Volcan, he served as Director and Chief Financial Officer at Hochschild Mining Plc. since 2005 and as a Brazilian diversified mining company listed on the São Paulo Stock Exchange. Earlier inSenior Project Manager at McKinsey & Company since 2000. During his career, he worked for Vale S.A, from 1985 to 2003, where he held several positions inalso served on the financeboard of directors of Lake Shore Gold Corp., Zincore Metals, Cordoba Minerals, and corporate areas. HeKaizen Discovery. Mr. Rosado graduated with a degree in Economics in 19841992 from Universidade Federal de Minas Gerais in BrazilUniversidad del Pacifico and has an MBA in 1984 from the Instituto de Pesquisa Economica e AdministrativaRoss School of Universidade Federal do Rio de Janeiro, Brazil. In May 2017, the newspaper Valor Economico recognized Mr. Martins as the Valor ExecutiveBusiness, University of the mining and metallurgy sector.
Michigan in 2000.
Mario Antonio Bertoncini. José Carlos del Valle. Mr. Bertoncinidel Valle has been our Senior Vice President of Finance and Group Chief Financial Officer since 2014. He has been a memberOctober 3, 2022, and he also serves as Chief Executive Officer of Nexa Peru since November 2022. He has extensive knowledge of the metals and Atacocha board of directors since 2013,mining industry and he was an alternate board member of Fibria Celulose S.A. from January 2012 until December 2013. With more than 25 years of experience in finance capital markets, M&A and risk management in both financialplanning. Mr. del Valle joined Nexa after spending nine years as CFO at Compañía Minera Antamina, where he led a successful company-wide transformation program and non-financial companies, Mr. Bertoncinia US$1 billion syndicated loan financing initiative, among other key efforts. Before Antamina, he was the CFO of Volcan Compañía Minera and he held the position of Corporate Treasury Officer at VSA between 2011 and 2013 and prior to this he worked in senior managementvarious leadership positions at Banco Itaú BBA S.A.well-known companies, including McKinsey & Company, Standard Chartered Bank, and Unibanco S.A, in investment and commercial banking areas. He graduated withWells Fargo Bank, among others. Mr. del Valle holds a Business Administration degree in business administration from Fundação Getulio Vargas, in São Paulo, Brazil, and holdsCalifornia State University, as well as an MBA in Financefrom The Wharton School. He also graduated from the Wharton SchoolAdvanced Management Program at the University of Pennsylvania in the United States.
Harvard Business School.
Mauro Davi Boletta. Mr. Boletta has been our Senior Vice President of Smelting Operations and Commercial since 2016. Mr. Boletta has over 30 years of experience with operations. He joined Votorantim Metais S.A. in 1986, having served in several production areas. Between 2010 and 2011, he was responsible for the design review of an aluminum smelter in Trinidad and Tobago. Mr. Boletta graduated with a
degree in electrical engineering from the Federal University of Itajubá, UNIFEI in 1985 and holds an MBA from FGV.
Leonardo Nunes Coelho. Mr. Coelho has been our Senior Vice President of Mining Operations since 2017. Mr. Coelho has over 1620 years of experience managing mining operations with focus at gold and zinc. Prior to joining us, Mr. Coelho worked for Anglo Gold Ashanti Ltd. for 15 years, where he initiated his career as a Trainee. In Anglo Gold Ashanti Ltd., Mr. Coelho has led mining operations and the expansion of mining projects and served as General Manager of the Cuiabá and Lamego complexes as his last position at this company. Mr. Coelho graduated with a degree in Mine Engineering in 2001 from the Federal University of the State of Minas Gerais (UFMG),(“UFMG”) and has obtained graduate degrees from the Kellogg Graduate School of Management in 2015 in the United States, the Dom Cabral Foundation in 2009 in Brazil and the University of Cape Town in 2005 in South Africa as well as a qualification at INSEAD in digital transformation in 2018.2018 and MIT in 2019.
| 178 |
Executive Officers and Management Committee |
Valdecir Aparecido Botassini.Marcio Luis Silva Godoy Mr.Botassini. Mr. Godoy has been our Senior Vice President Project Development & Executionof Technical Services and Projects since 2016.June 2020 and has also been responsible for engineering and IT. Mr. Godoy has over 27 years of experience in the mining industry. He joined Votorantim Metais S.A.has worked in 1985.Mr.Botassini helddifferent roles related to mineral exploration, mineral technology, project development and implementation and mining operations in several leadership positions, between 1985countries including Brazil, Mozambique, Chile, Zambia, Australia and 2016, serving as General ManagerSuriname. Mr. Godoy previously worked in well-known companies including Vale, Phelps Dodge, Golden Star Resources and Novo Astro Mining. He was also the chairman of the Agency for the technological development of the Brazilian Mining Industry (“ADIMB”). Mr. Godoy is a graduated Geologist and Metallurgy Operations, Nickel Business Director, Zinc Business Director and Polymetallic Operations Director. Mr. Botassini graduated withhas a degreeMasters in mechanical engineering from Universidade Presbiteriana Mackenzie in Brazil and holds a specialization certificate in Process EngineeringGeology from the Escola Politécnica of the University of São Paulo USP. He also attended the STC program at the Dom Cabral Foundation in Brazil, in partnership with the Kellogg School of Management in the United States.
State University (“UNESP”).
Jones Aparecido Belther. Mr. Belther has been our Senior Vice President of Mineral Exploration & TechnologyBusiness Development since 2014. He has over 2728 years of experience in the area. He held the same position at Votorantim Metais S.A. between 2004 and 2014. Prior to joining us, he was country manager at Vale in Peru between 2002 and 2004. He has worked in Brazil and abroad in companies such as Rio Tinto Brasil, Golden Star Resources, in Suriname, Phelps Dodge in Brazil and Chile, Vale in Brazil and Peru, and other companies. Mr. Belther graduated with a degree in Geology in 1991 from the São Paulo State University, UNESP, in Brazil, where he also obtained a Master’s degree in 2000 in Mineral Exploration.
Gustavo Cicilini. Mr. Cicilini became Vice President Human Resources and Corporate Affairs in 2019. Mr. Cicilini joined Nexa Resources in 2018 as senior Human Resources manager for attraction, development and culture and has been responsible for leading a culture transformation program. He has over 20 years of professional experience in various business sectors, including telecommunication, food and beverage, mobility solutions, industrial technology, consumer goods, energy and building technology. He has previously worked in companies including Algar Telecom, AmBev and Robert Bosch and been located throughout Latin America, including in Peru, Colombia, Ecuador, Venezuela, Panama and Costa Rica. Mr. Cicilini previously worked as Regional Corporate Human Resources Project Manager and has been responsible for change management and innovation, business intelligence and cross-selling functions. He holds a degree in Psychology and an MBA in Business Administration.
FelipeRenata Penna Moreira Gunzburger. Baldassari Guardiano. Mr. GuardianoMs. Penna has been our Vice President Sustainabilityof Legal & Strategic PlanningGovernance since 2014.April 2023. Ms. Penna joined Nexa as Chief Legal Counsel and Head of Governance in 2017. With more than 20 years of experience, Ms. Penna has focused on M&A, project finance and capital market transactions and she served as counsel and project manager on Nexa’s initial public offering in October 2017. Prior to that, he served as DirectorNexa, she led LATAM, M&A and Finance divisions within the Legal Department of Performance Management at Votorantim Metais S.A. between 2012 and 2014. He is responsibleCimentos for developing and implementing company policies for sustainability and coordinating the elaboration and implementation of the company strategic plan. In addition, he is responsible for establishing targets for performance improvement at all operations and corporate divisions through the development and implementation of the Votorantim Performance Management System. In 2012, before joining Votorantim Metais S.A., he worked at Vale for sevensix years, as Director of Performance Management and, later, as a Director of Pellet Plants. Prior to Vale, he worked as a consultant, serving as an engagement manager associate at McKinsey & Co. for approximately five years. Prior to 1999, he lived in the United States for 12 years, where he worked as a Geostatistician and Reserve Specialist for Mineral Resources Development Inc., or MRDI. While at MRDI, he provided advisory expertise on mines in the United States, Canada, Africa, Brazil, Australia, Chile and other countries. Mr. Guardiano graduated in Mining Engineering from the Ouro Preto School of Mines (Minas Gerais, Brazil), and holds a Master’s degree in Mining Engineering from the Montana College of Mineral Sciences and Technology (Butte, Montana, United States), as well as executive education program certificatesworked for law firms such as Linklaters, Lobo & de Rizzo and Barbosa Mussnich & Aragão Advogados. Ms. Penna has a Bachelor from Pontifícia Universidade Católica de São Paulo and a Master of Law Degree (LL.M.) from the Massachusetts Institute of Technology (Boston, Massachusetts, United States), and the IMD (Lausanne, Switzerland).
Arlene Heiderich Domingues. Ms. Domingues has been our Vice President Human Resources & Communications since 2013. Since 2017, she has also been in charge of Corporate Affairs at Nexa Resources. She held the same position at Votorantim Metais S.A. between 2013 and 2016. Prior to that, she built her 22 year career at Bosch, where she had the opportunity to work at Bosch, in Stuttgart, Germany for two years, acting in a global function, as executive and organizational development. Ms. Domingues graduated with a degree in business administration in 1990 from FIIB in Brazil and completed a controlling specialization course in 1998 from FGV.
Ricardo Moraes Galvão Porto. Mr. Porto has been our Vice President Commercial and Supply Chain since 2014. Mr. Porto held a management position at Votorantim Metais S.A. between 2013 and 2014. Mr. Porto began its career as commercial manager at Esso do Brasil, an Exxon Mobil affiliate. Prior to joining Votorantim Metais S.A.,
from 2004 until 2012, Mr. Porto worked in several senior management positions as supply chain executive at Vale S.A., reaching the position of officer Procurement Director. After, served as Executive Officer at the Bravante Group, an oil & gas company. Mr. Porto graduated with a degree in chemical engineering from the Federal University of Rio de Janeiro, UFRJ, and holdsChicago Law School, an Executive MBA from Fundação Dom Cabral. He has also obtained executive education program certificatesInstituto de Ensino e Pesquisa and completed an Executive Education Program on Women on Board from the Massachusetts Institute of Technology, and Kellogg Graduate School of Management in the United States and the IMD in Switzerland.Harvard Business School.
Evaluation of executive officers
On an annual basis, the performance of our executive officers is evaluated by the chief executive officer, the compensation, nomination and governanceCNG committee and ultimately, the boardBoard of directors. We strive to create a strong ethical and high performancehigh-performance culture, as well work to ensure an appropriate succession plan that ensures the continuity of our business. In addition to future business needs, we consider the core skills, experience and diversity necessary to carry out our strategy.
Each year, our chief executive officer presents to the boardBoard of directors a report on potential successors to his position, which considers the ability of succession candidates to succeed the chief executive officer in an emergency, on an interim or permanent basis, as well as critical experiences and other attributes required in order for each candidate to enhance his or her readiness for succession. Our boardBoard of directors discusses potential successors with the chief executive officers, as well as potential successors to each member of the management team.
| 179 |
Executive Officers and Management Committee |
Position descriptions
Our boardBoard of directors has developed position descriptions for each of the chief executive officer and chief financial officer, which are discussed below.
Chief executive officer
Our boardBoard of directors believes that our chief executive officer must have experience in, among other things: leading businesses of a similar complexity and scale; carrying out growth and value creation mandates; participating in mergers and acquisitions; articulating and executing long-term corporate strategies; and facilitating development within high-achievinghigh achieving organizations. In addition, our boardBoard of directors expects our chief executive officer to have knowledge of the mining and metals industry, international experience and an extensive global network. According to our boardBoard of directors, our chief executive officer should possess the following attributes, among others: a hands-on approach to the business; an alignment with our values; resiliency and credibility; a good reputation within the market; and the ability to communicate with and influence stakeholders.
Chief financial officer
Our boardBoard of directors believes that our chief financial officer must have experience in, among other things: leading accounting, controllership, financial planning and analysis, investor relations, treasury matters, mergers and acquisitions and risk management activities; formulating a company’s plan and direction for the future; developing financial, operational and tax-related strategies; managing transactions; overseeing internal controls in compliance with applicable laws and regulations; and implementing all financial-related activities within a company. In addition, our boardBoard of directors expects our chief financial officer to have public company experience, strong analytical and business valuation skills and knowledge of national securities exchanges, such as the NYSE, and TSX, international experience and an extensive global network. According to our boardBoard of directors, our chief financial officer should possess the following attributes, among others: a hands-on approach to the business; an alignment with our values; resiliency and credibility; a good reputation in the market; and the ability to communicate with and influence stakeholders.
Management committee
In accordance with our articles of association, the boardBoard of directors may delegate its powers to conduct our management and affairs, as well as its representation of us with respect to such matters, to a managementManagement committee. The managementManagement committee consists of at least three, and a maximum of seven, members. The members are not
required to be shareholders or directors of the Company.Nexa. The boardBoard of directors may not delegate its powers related to general guidance of our business or acts reserved to the boardBoard of directors pursuant to the 1915 Law.
The following table sets forth the current members of our managementManagement committee, and their respective positions as of December 31, 2017.positions. The term of the members of our managementManagement committee expires on August 17, 2018.
the day of the first Board meeting held after the 2024 general shareholders’ meeting.
Name | Age |
|
| Position | ||
| 54 |
| São Paulo, Brazil | President and Chief Executive Officer | ||
| 54 |
| Senior Vice President of Finance and Group Chief Financial Officer | |||
| Mauro Davi Boletta | 63 | São Paulo, Brazil | Senior Vice President | |||
| 46 |
| Senior Vice President of Mining Operations | |||
| Marcio Luis Silva Godoy | 58 | São Paulo, Brazil | Senior Vice President | |||
| 56 |
|
|
| ||
|
| São Paulo, Brazil |
| |||
|
|
| Senior Vice President Mineral Exploration & |
Conduct Committee
Our Conduct committee reports to the Chief Executive Officer and was created on January 1, 2014. Its internal rules were revised and updated on December 2, 2019.
| 180 |
Executive Officers and Management Committee |
The Conduct committee may be composed of at least seven members, such members being necessarily the Chief Executive Officer, the Vice President of Human Resources, the Vice President of Legal & Governance, the Head of Internal Audit, Compliance and Internal Controls, the Compliance Manager and two representatives of the Ethics Line program, a confidential reporting system managed by a qualified and independent external entity available to internal and external parties designed to allow anonymous reporting of violations of our Code of Conduct, policies and internal procedures or applicable laws.
Our Conduct committee’s primary responsibilities are to assist the Management committee in enforcing the Code of Conduct, reviewing any claims raised through the Ethics Line program, and identifying claims that should be rated as critical. The Conduct committee also assists our Audit committee by ensuring that any claim filed through the Ethics Line program and rated as critical is properly elevated to the Audit committee for further review.
Family relationships among executives
Our executives do not have any family relationships among themselves or with any other of our employees.
| 181 |
Executive and Director Compensation |
EXECUTIVE AND DIRECTOR COMPENSATION
Executive and director compensation
The following discussion describes the significant elements of the compensation of our executive officers and directors for the year ending December 31, 2017.
2023.
In 20172023 our executive compensation program includes cash compensation in the form of base salary, short-term incentives and long-term incentives and the opportunity to participate in an investment program.incentives. We provide base salary to compensate executives for their day-to-day responsibilities, which is aligned to a market reference based on industry analysis. We evaluate our total compensation practices on an annual basis to ensure that our compensation remains competitive in light of market and industry trends.
Our compensation, nominating and governanceCNG committee is responsible for assisting our boardBoard of directors in fulfilling its governance and supervisory responsibilities and advising our boardBoard of directors with respect to evaluation and monitoring of compensation models and policies and other related matters. The committee’s responsibilities also include administering and determining our compensation objectives and programs, reviewing and making recommendations to our boardBoard of directors concerning the level and type of the compensation payable, evaluating performance, implementing evaluation and improvement processes, and ensuring that policies and processes are consistent with our philosophy and the objectives of our compensation program.
Compensation framework
2017Our compensation
During fiscal year 2017, our executive officers received cash compensation in an aggregate amount is comprised of approximately US$6,832,922. The following table summarizes the top five individual compensation we paid to our executive officers during fiscal year 2017, includingthree principal components: (i) base salary, (ii) short-term incentive programs or bonuses,and (iii) long-term incentive programs and pension value.incentive.
|
|
|
| Non-equity Incentive Plan Compensation |
|
|
|
|
| ||
Name and Title |
| Base Salary |
| Short-term |
| Long-term |
| Pension |
| Total |
|
Tito Botelho |
| 888,504 |
| 1,255,560 |
| 328,158 |
| 47,655 |
| 2,519,877 |
|
Chief Executive Officer |
|
|
|
|
|
|
|
|
|
|
|
Mario Bertoncini |
| 360,835 |
| 457,047 |
| 101,103 |
| 21,650 |
| 940,635 |
|
Senior Vice President Finance & Chief Financial Officer |
|
|
|
|
|
|
|
|
|
|
|
Valdecir Botassini |
| 316,585 |
| 310,956 |
| 80,077 |
| 17,100 |
| 724,718 |
|
Senior VP Project Development & Execution |
|
|
|
|
|
|
|
|
|
|
|
Ricardo Porto |
| 239,637 |
| 256,063 |
| 45,763 |
| 12,975 |
| 554,438 |
|
VP Commercial & Supply Chain |
|
|
|
|
|
|
|
|
|
|
|
Felipe Guardiano |
| 211,279 |
| 259,338 |
| 48,230 |
| 12,677 |
| 531,524 |
|
VP Sustainability & Strategic Planning |
|
|
|
|
|
|
|
|
|
|
|
The investment program was discontinued in 2017. The investment program included a matching award; due to the program’s elimination, the matching concept will be implemented partially within the short-term incentive program, with the remainder implemented within the long-term incentive program.
During fiscal year 2017, our directors received cash compensation in an aggregate amount of US$1,378,333 for services as a member of our board of directors. Each member of our board of directors is entitled to reimbursement for reasonable travel and other expenses incurred in connection with attending board meetings and meetings for any committee on which he or she serves.
Principal elements of compensation
Base salary
Base salaries for executive officers are established based on the scope of their responsibilities and competencies and taking into consideration the median market reference. Adjustments to base salaries are expected
to be determined annually and may be increased based on performance, as well as to maintain market competitiveness. Additionally, base salaries may be adjusted as warranted throughout the year to reflect promotions or other changes in the scope or breadth of roles or responsibilities.
Short-term incentive program / bonuses
The annual bonus or short-term incentive program aims to align short-term priorities with the Company’sour strategic planning by rewarding achievement of our goals and targeted annual results, resulting in an alignment with the interests of the Company.our interests. Each named executive officer has a panel of individual goals, with scales of minimum performance, target and surpass results. Measurement in these panels is based on financial and non-financial indicators. These indicators represent the specific goals and challenges attributable to the position in alignment with the Company’s performance. our performance and strategic planning.
Financial indicators are based on internal managerial-level metrics and represent 40% to 50% of the employee panel for corporate positions. In 2023, the metrics used were Free Cash Flow (“FCF”) and Management Gains (“MGs”). The target of FCF is structured around the combined total of all our revenue versus costs and considers metal prices, and floating exchange rates. For MGs, the target is to capture opportunities for working capital gains, fixed costs, production costs, and synergies, among other metrics, measured in millions of dollars, and it considers fixed metal prices and exchange rates.
Strategic goals represent up to 60.0%20% of the individual panel while the remaining 40.0% isand are comprised of people and strategic goals assessed based on qualitative and quantitative factors. In 2023, the metrics used in this assessment included risk management indicators, heat maps and ESG projects, maps of critical environmental issues, including decarbonization and sustainability initiatives, and work environment. We also recognize individual performance through targets that support different strategies in line with Nexa’s broader plan. The financial indicators applicable to our CEO represented 50% of the individual panel, and the metrics used were FCF and MGs.
| 182 |
Executive and Director Compensation |
In 2023, up to 20% of the compensation of our executive officers was related to the achievement of ESG goals and additional ESG goals have been set for our executive officers in 2024.
Long-term incentive program
Our long-term incentive (or LTI)(“LTI”) program is designed to provide strong incentives for making decisions with a view to creating value for shareholders by linking cash compensation to Companyour long-term performance, and by guiding executive actions towards the achievement of our strategic goals and growth plans.
The LTI program aligns interests among our executives and shareholders to ensure continued value creation. This incentive system is also intended to engage management in developing and delivering a consistent strategic plan, as well to attract and retain executive officers.
In 2023, the LTI program was based on a five-year vesting period and comprised of three parts: (i) restricted grant, (ii) absolute performance grant and (iii) relative performance grant. All grants were defined amounts approved by the Board of directors to be paid out at the end of the five-year vesting period. The main purposesrestricted grant amount appreciates according to the total shareholder return (“TSR”) over the vesting period. The payment of the absolute performance grant was based on a targeted Company TSR combined with a performance curve, both approved by our Board of directors at each granting period. The performance curve determines the amount to be paid in case of a performance equal or lower than expected in the targeted TSR. If the targeted TSR is achieved, the payment is fully due. If the performance of the TSR was greater than expected, the supplementary grant to be paid will be adjusted by up to 100%. The payment of relative performance grant depended on Nexa’s TSR performance when compared to a selected peer group approved by the Board of directors.
In April 2023, Nexa began a revision process of our LTI program. The new LTI program are to align interests among executives, the Company and shareholders by linking a portion of compensation to the creation of value for shareholders, attract and retain executives and must engage management to develop and deliver a strategic plan of value creation for the shareholders, applied from a meritocracy perspective.
came into effect in February 2024. The new LTI program is based on a five-year vesting period and comprised of two parts, baseparts: (i) restricted grant and supplementary(ii) absolute performance grant. The base grant is aBoth grants are defined amountamounts approved by the Board of directors to be paid out at the end of the five-year vesting period. Thisthird, fourth and fifth year, considering one third of the total payment to be made on each of the three payments. The restricted grant amount appreciates according to the total shareholder return (TSR) calculated for the CompanyTSR over the vestingeach payment period. The supplementarypayment of the absolute performance grant is based on a definedtargeted Company TSR combined with a performance curve, over each payment period, both approved by our Board of directors at each granting period. The performance curve determines the amount to be paid out atin case of a performance equal or lower than expected in the targeted TSR. If the targeted TSR is achieved, the payment is fully due. If the performance of the TSR is greater than expected, the supplementary grant to be paid will be adjusted by up to 100%. At the end of the five-year vesting period, if the amount paid on the previous two payments will be adjusted with the fifth year TSR calculated for the Company over the vesting period exceeds the target TSR determined by our board of directors. result.
The amount payable, if any, also appreciates according to the TSR calculated for the Company over the vesting period.
After completing our initial public offering, the performance metric for the LTI grants was transitioned from the TSR (currently calculated based on an internal methodology) to a new methodology is referenced to the market value of the Company’sNexa Resources’ shares at the end of the vesting period, calculated based on the weighted average price of the common shares on the TSX during the months of October, November and December in the year immediately prior to the year in which the respective settlement date for the award occurs, together with dividends paid during the respective grant cycle.
Change of control
One-time premiumUpon the occurrence of a change of control event, all of the phantom shares will continue under the same terms, conditions and due dates, with the following exceptions:
| · | If Nexa terminates an executive’s employment without cause or if the executive resigns for good reason within 24 months of the change of control event, any unvested phantom shares will immediately fully vest as of the date of such termination or resignation for good reason. The exercise price will be calculated based on the weighted average price of the common shares during the three months immediately preceding the month of termination. In case termination occurs on the same date of the change of control event, the exercise price will be the share price (in US$/share) used as reference for the transaction that resulted in the change of control event. |
| · | If the executive resigns within twelve months of the change of control event, he or she will be entitled to a portion of the granted shares, proportionate to the length of time served (1/60 for each 30-day period served), which will become immediately vested as of the date of resignation. The exercise price will be calculated based on the weighted average price of the common shares during the three months immediately preceding the month of resignation. The Board may approve special cases and adjust the aforementioned rules provided that the basic rights of the new shareholders as well as the executives are preserved. |
| 183 |
Executive and Director Compensation |
Insider trading policies
According to our insider trading policy, directors, officers and employees of Nexa and its subsidiaries must refrain from improper trading, and the appearance of improper trading, in Nexa’s securities. This applies to all transactions in any securities of Nexa, including, but not limited to, any of Nexa’s shares, securities convertible or exchangeable into shares or other securities of Nexa, securities that Nexa may issue from time to time, such as preferred stock, warrants, and convertible debentures, as well as debt instruments, puts, calls, options and any other rights or obligations to buy or sell Nexa’s securities. It also applies to derivative securities relating to Nexa’s securities, including securities exchangeable into Nexa’s securities, whether or not issued by Nexa, such as exchange-traded options and the purchase of the Nexa’s securities with the intention of quickly reselling them. In addition, directors, officers and employees may not purchase financial instruments, such as prepaid variable forward contracts, equity swaps or collars, designed to hedge or offset a decrease in the market value of Nexa’s securities. Our policy applies to not only all securities owned by Nexa directors, officers, and employees, but also all securities owned by others where Nexa directors, officers, or employees have a direct or indirect control over investment decisions.
In connectionOur insider trading policy is made available to directors, officers and employees directly or by posting the policy on Nexa’s website and such individuals are informed whenever significant changes are made to the policy. Violations to the policy will result in disciplinary action, including possible termination. Additionally, our policy applies to individuals even after termination of employment or service with our initial public offering, our board of directors grantedNexa.
2023 executive compensation
During fiscal year 2023, our executive officers one-time share appreciation rightsreceived cash compensation in the forman aggregate amount of phantom share units. On the third anniversary of the granting of such units, a beneficiary still employed with us shall receive, in cash, an amount determined based on changes in the quoted market price of our common shares, based on a predetermined floor price and an established measurement date. The phantom share units do not give the beneficiary the rightapproximately US$5,329,512, which includes compensation paid to actually receive any common shares of Nexa Resources; the shares merely serve as basis for the calculation of the cash amount to be received by the beneficiary. Basedofficers whose terms ended on the initial public offering pricefirst business day of our common shares on October 27, 2017, the phantom share units granted2023. The following table summarizes compensation we paid to our executive officers would representduring the fiscal year 2023, including base salary, short-term incentive programs or bonuses, long-term incentive programs and pension value.
| Non-equity Incentive Plan Compensation | |||||
Name and Title | Base Salary (US$) | Short-term incentive programs / bonuses (US$) | Long-term incentive programs (US$) | Pension Value (US$) | Total Compensation (US$) |
Ignacio Rosado President and Chief Executive Officer | 570,359 | 835,193 | - | 33,147 | 1,438,700 |
José Carlos del Valle (1) Senior Vice President of Finance and Group Chief Financial Officer | 387,389 | 558,576 | - | - | 945,965 |
Mauro Davi Boletta Senior Vice President of Smelting Operations and Commercial | 201,673 | 172,838 | 21,229 | 12,094 | 407,835 |
Leonardo Nunes Coelho Senior Vice President of Mining Operations | 369,558 | 420,640 | 32,809 | 10,622 | 833,629 |
Marcio Luiz Silva Godoy Senior Vice President of Technical Services and Projects | 331,207 | 327,932 | - | 17,885 | 677,024 |
Jones Aparecido Belther Senior Vice President of Mineral Exploration & Business Development | 211,374 | 189,736 | 19,299 | 11,698 | 432,107 |
Gustavo Cicilini Vice President of Human Resources and Corporate Affairs | 184,419 | 143,602 | - | 9,704 | 337,725 |
Renata Penna Moreira Gunzburger (2) Vice President of Legal & Governance | 152,846 | 93,374 | 3,667 | 6,640 | 256,527 |
| (1) | José Carlos del Valle joined the Company on October 1, 2022; therefore, he was ineligible for long-term incentives paid in 2023 with respect to 2022 performance. |
| (2) | Renata Penna Moreira Gunzburger was promoted from Head of Legal & Governance to Vice President of Legal & Governance in April 2023. |
| 184 |
Executive and Director Compensation |
2023 director compensation
During fiscal year 2023, our directors received total compensation in an aggregate amount of US$2,145,495.
EMPLOYEES2,238,333 for their services as members of our Board of directors. The chair of our Board of directors received US$280,000 in annual fees, while each Board member received an average of US$55,958 per quarter. In addition, each director is entitled to reimbursement for reasonable travel and other expenses incurred in connection with attending Board meetings and meetings for any committee on which he or she serves.
We have no service contracts with members of our Board of directors providing for benefits upon termination of employment.
Annual compensation levels for the directors are as set out below:
Name | Base | Total Compensation |
| Jaime Ardila (1) | 280,000 | 280,000 |
| Daniella Dimitrov (2) | 230,000 | 230,000 |
| Diego Hernandez (3) | 230,000 | 230,000 |
| Eduardo Borges de Andrade Filho (3) | 230,000 | 230,000 |
| Edward Ruiz (2) | 240,000 | 240,000 |
| Gianfranco Castagnola (3) | 230,000 | 230,000 |
| Hilmar Rode | 128,333 | 128,333 |
| Jane Sadowsky (2) | 230,000 | 230,000 |
| João Henrique Batista de Souza Schmidt | 220,000 | 220,000 |
| Luís Ermírio de Moraes | 220,000 | 220,000 |
| (1) | The chair of the Board is entitled to additional compensation of US$60,000.00 per year. |
| (2) | The Audit committee members are entitled to additional compensation of US$10,000.00 per year. The chair of the Audit committee is entitled to additional compensation of US$20,000.00 per year. |
| (3) | Chairs of the other committees receive compensation of US$10,000.00. There are no additional payments per meeting for members who are members of two committees concurrently. |
Compensation consultants
We retained Korn Ferry in 2023 to provide competitive market analysis to assist in determining the appropriate level of compensation for executives, providing comprehensive competitive market clearing information on incentives, policies and benefits for each executive position. Korn Ferry has over 40 years of experience and deep knowledge in the Brazilian market. We paid Korn Ferry US$52,104 in consulting services fees in 2023.
| 185 |
Executive and Director Compensation |
Retirement benefit plans
All executive officers participate in the FUNSEJEM pension fund, a private, closed and not-for-profit pension fund responsible for the management of the pension plans for the employees of the companies that are linked with the Votorantim group.
The pension plan is a defined contribution plan. Participation is voluntary and thus supplemental to the Brazilian government’s mandatory social security system. The plan is offered to employees through a specific fund that is maintained separately from the funds of each of the sponsoring organizations.
The plan’s assets correspond to 100% of the value of the liabilities. Annually, an actuarial assessment is made in compliance with the current legislation. However, there is no risk of deficit, since it is a defined contribution plan, whose formation of the reserve results from the capitalization of the respective contributions to the plan.
Nexa also matches the contribution made by the participant depending on their salary range. This contribution is monthly and varies between 1.5% and 6.0%, depending on the chosen percentage of the participant’s contribution.
| 186 |
Employees |
Employees
As of December 31, 2017,2023, we had 5,4465,771 employees and 6,8828,784 independent contractors. The following tables show the number of employees and contractors as of December 31, 2017, 20162023, 2022 and 2015.2021.
Number of Employees | |||
As of December 31, | |||
2023 | 2022 | 2021 | |
| Brazil | 3,658 | 3,509 | 3,631 |
| Peru | 2,095 | 2,096 | 2,185 |
| United States and Luxembourg | 18 | 20 | 24 |
| Total | 5,771 | 5,625 | 5,840 |
Number of Employees
|
| As of December 31, |
| ||||
|
| 2017 |
| 2016 |
| 2015 |
|
Brazil |
| 3,163 |
| 3,110 |
| 3,173 |
|
Peru |
| 2,254 |
| 2,241 |
| 2,386 |
|
United States, Austria and Luxembourg |
| 29 |
| 36 |
| 43 |
|
Total |
| 5,446 |
| 5,387 |
| 5,602 |
|
Number of Independent Contractors
Number of Independent Contractors* | Number of Independent Contractors* | |||||||||
|
| As of December 31, |
| As of December 31, | ||||||
|
| 2017 |
| 2016 |
| 2015 |
| 2023 | 2022 | 2021 |
Brazil |
| 1,026 |
| 912 |
| 2,274 |
| 7,011 | 2,788 | 1,773 |
Peru |
| 5,856 |
| 6,029 |
| 5,782 |
| 1,773 | 5,808 | 5,889 |
Total |
| 6,882 |
| 6,941 |
| 8,056 |
| 8,784 | 8,596 | 7,662 |
(1) Control over operations in Peru established in 2015.
*Refers to fixed-term contracts only.
Most of our employees are represented by labor unions. We negotiate annual collective bargaining agreements, relating to salaries, working conditions and welfare, with the various unions that represent our employees. With respect to our Cerro Lindo unit, negotiations take place every two years. Although we believe our present labor relations are good, there can be no assurance that a work slowdown, stoppage or strike will not occur prior to or upon the expiration of the current collective bargaining agreements, and we are unable to estimate the effect of any such work slowdown, stoppage or strike on our production levels, in spite of an established contingency plan. In April and May 2017, we faced the possibility of a labor strike at our Cajamarquilla smelter, but ultimately reached an agreement with labor union leaders. Interactions between the Company and the labor unions are carried out by members of our human resources area, consistent with market practice.
We regularly invest in programs that ensure employee development and meet our specific business needs while continuously enhancing the qualifications of our staff so as to maintain and reinforce our competitiveness and our know-how as we continue to grow. The training programs include Technical/OperationalOperative Trainings, Mentoring Program, Leadership Development Program, Young Professional Training and an Individual Development Plan that, among other things, indicates the training that a given employee requires in order to continue to grow within Nexa Resources. In addition, Votorantim has a Trainee Program and thewe have an Academy of Excellence, a program created by Votorantim for leaders within Votorantim.
| 187 |
Legal Proceedings |
| V. | Additional information |
Legal proceedings
As of December 31, 2017,2023, we were party to various legal and administrative proceedings relating to labor, civil, environmental and tax matters in which the disputed amount for probable and possible claims was an aggregate of approximately US$395.5727.8 million. It is our policy to make provisions for legal contingencies when, based upon our judgment and the advice of our legal counsel, the risk of loss is probable. As of December 31, 2017,2023, we had established a net provision in the amount of US$57.970.6 million to cover contingencies for proceedings for which the risk of loss was deemed probable.
The following tables summarize judicial and administrative proceedings to which we are a party, the amounts in dispute in these proceedings in which a loss is considered probable or possible and the aggregate amount of the net provision established for losses that may arise from these proceedings.
As of December 31, 2023 | ||
Total | Total Net | |
| (in millions of US$) | ||
| Civil and environmental (3) | 162.2 | 24.6 |
| Tax | 495.0 | 23.8 |
| Labor | 70.6 | 22.3 |
| Total | 727.8 | 70.6 |
|
| As of December 31, 2017 |
| ||
|
| Total |
| Total Net |
|
|
| (in millions of US$) |
| ||
Civil and other proceedings(3) |
| 182.4 |
| 22.9 |
|
Tax judicial and administrative proceedings |
| 146.3 |
| 18.6 |
|
Labor judicial and administrative proceedings |
| 67.6 |
| 16.4 |
|
Total |
| 396.3 |
| 57.9 |
|
| (1) | Does not include claims with expectation of loss classified as remote. |
| (2) | Only includes claims with expectation of loss classified as probable, net of judicial deposits. |
| (3) | Includes environmental legal and administrative proceedings. |
(1) Does not include claims with expectation of loss classified as remote.
(2) Net of judicial deposits.
(3) Includes environmental legal and administrative proceedings.
Civil and environmental liabilities and contingencies
As of December 31, 2017,2023, we were party to 207 civil judicial proceedings and environmental judicial and administrative proceedings, with a probable or possible chance of loss in the aggregate amount of US$182.4162.2 million, for which we have recorded a net provision in the amount of US$22.924.6 million for proceedings with probable losses. Furthermore, we were party to 34 civil and environmental judicial and administrative proceedings with a remote chance of loss.
The civil and environmental judicial claims filed against us primarily relate to pollution and collection lawsuits, repossession actions and indemnity actions related to contract disputes.
Tax liabilities and contingencies
As of December 31, 2017,2023, we were party to 200 tax-relatedtax related judicial and administrative proceedings, with a probable or possible chance of loss in the aggregate amount of US$145.5495.0 million, for which we have recorded a net provision in the amount of US$18.623.8 million for proceedings with probable losses. Furthermore, we were party to 35 tax-related judicial and administrative proceedings with a remote chance of loss.
The tax-related judicial and administrative claims filed against us primarily relate to (1)(i) value added tax on salesSales and on transportation and telecommunication services (imposto sobre operações relativas à circulação de mercadorias e sobre prestações de serviços de transporte interestadual e intermunicipal e de comunicaçõesServices (“VAT”), or ICMS, (2)(ii) corporate income tax (imposto de renda de pessoa juridíca), or IRPJ, and social contribution on net profit (contribuição social sobre o lucro líquido(“CIT”), or CSLL, (3) CFEM, (4) PIS(iii) Brazilian mining royalty (“CFEM”), (iv) Social Contributions (“PIS” and (5) COFINS.“COFINS”).
Labor liabilities and contingencies
As of December 31, 2017,2023, we were party to 1,232 labor-relatedlabor judicial and administrative proceedings related to employment benefits, with a probable or possible chance of loss in the aggregateof a total amount of US$67.670.6 million, for which we have recorded a net provision in the amount of US$16.422.3 million for proceedings with probable losses. Furthermore, we were party to 90 labor-related judicial and administrative proceedings with a remote chance of loss
The labor-related judicial and administrative claims related to labor benefits that were filed against us primarily relateare mainly related to (1)(i) overtime payments, (2) health(ii) compensation for illness-related damages and safety conditions(iii) payment of social benefits.
| 188 |
Legal Proceedings |
Other legal proceedings
VAT investigation
Throughout 2023, Nexa continued to cooperate with the investigation being carried out by the Fiscal Office of the State of Minas Gerais and (3) outsourcingthe Public Ministry of Minas Gerais (the “MG Authorities”) of the practices of certain of Nexa’s former customers with respect to commercial transactions and subcontractingrelated value added tax (“VAT”), as well as Nexa’s relationship with such former customers, that could result in liabilities for all parties involved in the commercial relationship.
In the third quarter of 2023, Nexa and the MG Authorities reached a resolution (the “Tax Resolution”) whereby Nexa, without admitting primary responsibility for the resolved claims, agreed to make certain activities.
ARTICLES OF ASSOCIATIONtax payments to the State of Minas Gerais on behalf of certain customers that allegedly failed to properly make their tax payments (“tax portion”), and subsequently on October 20, 2023 entered into a related additional agreement (the “Related Agreement”, and together with the Tax Resolution, the “Agreements”) to make a contribution to the State of Minas Gerais to support its ESG-related efforts (“ESG portion”), recognizing a total amount of US$75.8 million in "Other liabilities”, comprised of US$65.5 million as “Other Income and Expenses, net” and US$10.3 million as “Financial Expenses” related to the interest charged in connection with the VAT-related practices of its former customers. In funding this agreement, the Company applied an offset of US$25.0 million of VAT accumulated credits, paid a portion of US$1.5 million in cash up front, offset an amount of US$6.4 million which was classified as a judicial deposit, and will pay the remainder in up to 46 monthly installments, to be adjusted by the Brazilian federal funds rate (“SELIC”) interest rate.
On February 8, 2024, a second and final Tax Resolution was filed with the MG Authorities whereby Nexa, without admitting primary responsibility for the resolved claims, agreed to make tax payments on behalf of certain customers, including interest and penalties, to the State of Minas Gerais, recognizing a total amount of US$27.1 million in "Other liabilities”, comprised of US$21.4 million as “Other Income and Expenses, net” and US$5.7 million as “Financial Expenses” related to the interest charged in connection with the VAT-related practices of this former customers. In funding this agreement, the Company will apply an offset of US$10.8 million of VAT accumulated credits, will pay US$0.8 million in cash up front, and will pay the remainder in up to 59 monthly installments, to be adjusted by the SELIC interest rate.
This resolution concludes the MG Authorities’ investigation with respect to the Company, and the Company does not expect any further developments or provisions with respect to these matters, although reserves its legal right to recover from certain customers the amounts that it has paid, or will pay, on their behalf in connection with the tax portion of the Agreements. These amounts will only be recognized upon recovery. For further details on this investigation, see Note 9(iv) to our consolidated financial statements.
Cerro Lindo stability agreement
We are engaged in ongoing tax-related discussions with the Peruvian tax authorities SUNAT related to the stability agreement of Cerro Lindo’s operations. The Peruvian tax authority issued unfavorable tax decisions against the Company for the years-ended December 31, 2014, 2015, 2016 and 2017, arguing that the stability income tax rate (20%) granted by the stability agreement applies only to the income generated from 5,000 tons per day of its production (i.e., income exclusively related to the investments informed in the Cerro Lindo Feasibility Study), and not from Cerro Lindo’s entire production capacity expanded over time. The total amount estimated for the contingency materialized from 2014 to 2017 is US$293.1 million.
As of the date of this annual report, SUNAT is now auditing the years-ended December 31, 2018 and 2019. Discussions with SUNAT are expected to evolve in 2024, including potential audits of the years ended December 31, 2020 and 2021, which is the last fiscal year covered by the stability agreement, depending on the ongoing legal proceedings, which may impact Nexa’s results, cash flow and liquidity. For further details on these legal proceedings, see Note 11(d) to our consolidated financial statements.
| 189 |
Articles of Association |
Articles of association
Company objectives and purposes
We were incorporated in Luxembourg as a public limited liability company (société anonyme) on February 26, 2014. Our articles of association provide that our corporate purpose is to, among others, (i) carry out any trade, business or commercial activities whatsoever, including but not limited to the purchase, exchange and sale of goods and/or services to third parties; (ii) take participations and interests, in any form whatsoever, in any commercial, industrial, financial or other, Luxembourg or foreign companies or enterprises; (ii)(iii) acquire through participations, contributions, underwriting, purchases or options, negotiation or in any other way any securities, rights, patents and licenses and other property, rights and interest in property as we shall deem fit; (iii)(iv) generally to hold, manage, develop, sell or dispose of the same, in whole or in part, for such consideration as Nexa Resources may deem fit, and in particular for shares or securities of any company purchasing the same; (iv)(v) enter into, assist or participate in financial, commercial and other transactions; (v)(vi) grant to any holding company, subsidiary or sister company, or any other company that belongbelongs to the same group as Nexa Resources, any assistance, loans, advances or guarantees (in the latter case, even in favor of a third-party lender of any affiliates); (vi)(vii) borrow and raise money in any manner and to secure the repayment of any money borrowed; (vii) to carry out any trade, business or commercial activities whatsoever, including, but not limited to, the purchase, exchange and the sale of goods and/or services to third parties; and (viii) generally to do all such other things as may appear to Nexa Resources to be incidental or conducive to the attainment of the above objects or any of them. We can perform all commercial, technical and financial operations, connected directly or indirectly in all areas as described above, in order to facilitate the accomplishment of its purpose, provided always that Nexa Resources will not enter into any transaction that would constitute a regulated activity of the financial sector without due authorization under Luxembourg law.
Our common shares are governed by Luxembourg law and our articles of association. Our articles of association were amended in June and August 2021. The following is a summary of the material terms of our common shares based on our articles of association and Luxembourg law. These rights may differ from those typically provided to shareholders of U.S. companies under the corporation laws of some states of the United States. We encourage you to read the complete form of our articles of association.association, filed as Exhibit 2.4 of this annual report on Form 20-F.
Common shares
On July 1, 2014, our shareholders approved the issuance of 998,503,863 new common shares fully paid through contributions in cash, increasing our capital from EUR998,503,863 to EUR998,534,863. VSA contributed 99.93% and minority shareholders contributed 0.06%.
On July 27, 2015, our shareholders approved the issuance of 84,000 new common shares fully paid via contributions in cash by VSA, increasing our capital by US$84,000, from US$1,280,421,254 to US$1,280,505,254.
On April 11, 2016, our shareholders approved the reduction of our share capital through the cancellation of 350,000,000 common shares, decreasing our share capital from US$1,280,505,254 to US$930,505,254.
On April 19, 2016, our shareholders approved the issuance of 110,910,811 new common shares fully paid via cash contributions by our certain shareholders, increasing our capital from US$930,505,254 to US$1,041,416,065.
On June 28, 2017, our shareholders approved the reduction of our share capital through the cancellation of 200,000,000 common shares, decreasing our share capital from US$1,041,416,065 to US$841,416,065.
On September 18, 2017, our shareholders approved the reduction of our share capital through the cancellation of 300,000,000 common shares, decreasing our share capital from US$841,416,065 to US$541,416,065.
On October 6, 2017, our shareholders approved the reduction of our share capital through the cancellation of 428,595,552 common shares, decreasing our share capital from US$541,416,065 to US$112,820,513.
On October 31, 2017, our shareholders approved the issuance of 20,500,000 new common shares fully paid via cash contributions by certain shareholders, increasing our share capital from US$112,820,513 to US$133,320,513.
On September 13, 2018, our shareholders approved a general authorization to the Board of directors to establish share buyback programs for a period of three years. On September 20, 2018, our Board of directors approved a share buyback program under which we, directly or indirectly through our subsidiaries, may repurchase, from time to time, up to US$30.0 million of our outstanding common shares listed on the NYSE over a 12-month period beginning on November 6, 2018 and ending on November 6, 2019. As of March 25, 2019, we have repurchased 466,231 common shares, at an average price of US$10.63 per share, for an aggregate purchase price of US$4.96 million. All of the repurchased common shares were cancelled on June 4, 2020.
| 190 |
Articles of Association |
On June 4, 2020, our shareholders approved the reduction of our share capital through the cancellation of 881,902 treasury shares, decreasing our share capital from US$133,320,513 to US$132,438,611.
As of December 31, 2017,2023, our issued share capital was US$133,320,513132,438,611 represented by 133,320,513132,438,611 common shares fully paid, with par value of US$1.00 per share. In addition to our issued share capital, we have an authorized share capital of US$231,924,819, represented by 231,924,819 common shares.
Distributions
Pursuant to our articles of association, the general meeting of shareholders may approve dividends and the boardBoard of directors may declare interim dividends, in each case to the extent permitted by Luxembourg law. Pursuant to our articles of association, the boardBoard of directors may also declare distributions to our shareholders in the form of reimbursement of share premium or interim dividends to the extent permitted by Luxembourg law. Under Luxembourg law, distributions (including in the form of dividends or share premium reimbursement) may be lawfully declared and paid if our net profits and/or distributable reserves, as set forth in our standalone statutory accounts prepared under Luxembourg GAAP, are sufficient under Luxembourg law.
The amount of a distribution to shareholders (including in the form of dividends or reimbursement of share premium) may not exceed the amount of profits at the end of the last financial year plus any profits carried forward and any amounts drawn from reserves available for that purpose, less any losses carried forward and sums to be allocated to non-distributable reserves in accordance with Luxembourg law or the articles of association. Furthermore, no distributions (including in the form of dividends or reimbursement of share premium) may be made if at the end of the last financial year the net assets as set out in the standalone statutory accounts prepared under Luxembourg GAAP are, or following such a distribution would become, less than the amount of the subscribed share capital plus the non-distributable reserves. Distributions in the form of dividends may only be made out of net profits and profits carried forward, whereas distributions in the form of share premium reimbursements may only be made out of available share premium.
Each common share entitles the holder to participate equally in any distributions, if and when declared by the general meeting of shareholders or, in the case of interim dividends or reimbursements of share premium, the boardBoard of directors, out of funds legally available for such purposes.
In accordance with Luxembourg law, each year at least 5.0% of the net profits must be allocated to the creation of a legal reserve that is not available for distribution. This allocation ceases to be compulsory when the reserve has reached an amount equal to 10.0% of the share capital, but is again compulsory if the reserve falls below such 10.0%.
Declared and unpaid distributions held by us for the account of the shareholders shall not bear interest. Under Luxembourg law, claims for unpaid distributions will lapse in our favor five years after the date such distribution has been declared.
For additional information regarding our policy on distributions, including procedures provided by Luxembourg law, see “Share ownership and trading—Distributions.”
Voting rights
There are no restrictions on the rights of Luxembourg or non-Luxembourg residents to vote our shares. All of our shareholders, including our public shareholders, hold common shares with identical voting rights, preferences and privileges. Each common share entitles the shareholder to attend a general meeting of shareholders in person or by proxy, to address the general meeting of shareholders and to vote. Each common share entitles the holder to one vote at the general meeting of shareholders.
The boardBoard of directors may also decide to allow shareholders to vote by correspondence by means of a proxy form providing for a positive or negative vote or an abstention on each agenda item. The conditions for voting by correspondence are set out in the articles of association and in the convening notice.
The boardBoard of directors may decide to arrange for shareholders to be able to participate in the general meeting by conference call, video conference or similar means of communication, whereby (i) the shareholders attending the meeting can be identified, (ii) all persons participating in the meeting can hear and speak to each other,
(iii) the transmission of the meeting is performed on an ongoing basis and (iv) the shareholders can properly deliberate without the need for them to appoint a proxyholder who would be physically present at the meeting.
General meeting of shareholders
In accordance with Luxembourg law and our articles of association, any regularly constituted general meeting of our shareholders has the power to order, carry out or ratify acts relating to theour operations of the Company to the extent that such decisions are the domain of the shareholders and not the boardBoard of directors.
Our annual general meeting of shareholders shall be held at our registered office, or at such other place in Luxembourg as may be specified in the notice of the meeting, within six months after the end of the relevant financial year. Except as otherwise specified in our articles of association, resolutions at a general meeting of shareholders are adopted by a simple majority of shares present or represented and voting at such meeting.
A shareholder entitled to vote may act at any general meeting of shareholders by appointing another person (who need not be a shareholder) as his proxy, which proxy shall be in writing and comply with such requirements as determined by our boardBoard with respect to the attendance to the general meeting, and proxy forms in order to enable shareholders to exercise their right to vote. All proxies must be received by us (or our agents) no later than the day determined by our boardBoard of directors.
| 191 |
Articles of Association |
If we decide to issue new shares in the future and do not exclude the preferential subscription rights of existing shareholders, we will publish the decision by placing an announcement in the Luxembourg official journal Recueil Electronique des Sociétés et Associations and in a newspaper published in Luxembourg. The announcement will specify the period in which the preferential subscription rights may be exercised and such period may not be shorter than 14 days from the publication of the offer. The announcement will also specify details regarding the procedure for exercise of the preferential subscription rights. Under Luxembourg law preferential subscription rights are transferable and tradable property rights.
Issuance of shares and preferential subscription rights
Our shares may be issued pursuant to a resolution of the general meeting of shareholders. The general meeting of shareholders may also delegate the authority to issue shares to the boardBoard of directors for a renewable period of five years. The boardBoard of directors has been authorized to issue up to 231,924,819 common shares. Such authorization will expire five years after the date publication in the Luxembourg legal gazette (Recueil Electronique des Sociétés et Associations) of the minutes of the of the general meeting of shareholders held on August 11, 2017June 4, 2020 (unless amended or extended by the general meeting of shareholders).
Each holder of shares has preferential subscription rights to subscribe for any issue of shares pro rata to the aggregate amount of such holder’s existing holding of the shares. Each shareholder shall, however, have no preferential subscription right on shares issued for a contribution in kind.
Preferential subscription rights may be restricted or excluded by a resolution of the general meeting of shareholders, or by the boardBoard of directors if the shareholders so delegate. The general meeting of shareholders has delegated to the boardBoard of directors the power to cancel or limit the preferential subscription rights of the shareholders when issuing new shares, so long as the issuance of new shares is carried out through a public offering.
If we decide to issue new shares in the future and do not exclude the preferential subscription rights of existing shareholders, we will publish the decision by placing an announcement in the Luxembourg official journal Recueil Electronique des Sociétés et Associations and in a newspaper published in Luxembourg. The announcement will specify the period in which the preferential subscription rights may be exercised. Such period may not be shorter than 14 days from the publication of the offer. The announcement will also specify details regarding the procedure for exercise of the preferential subscription rights. Under Luxembourg law preferential subscription rights are transferable and tradable property rights.
Repurchase of shares
Nexa Resources is prohibited by the 1915 Law from subscribing for its own shares. Nexa Resources may, however, repurchase its own shares or have another person repurchase shares on its behalf, subject to certain conditions, including:
| · | prior authorization of the general meeting of shareholders setting out the terms and conditions of the proposed repurchase, including the maximum number of shares to be repurchased, the duration of the period for which the authorization is given (which may not exceed five years) and the minimum and maximum consideration per share; |
| · | the repurchase may not reduce the net assets of Nexa Resources on a non-consolidated basis to a level below the aggregate of the issued share capital and the reserves that Nexa Resources must maintain pursuant to the 1915 Law or our articles of association; |
| · | only fully paid-up shares may be repurchased; and |
| · | the acquisition offer is made on the same terms and conditions to all the shareholders who are in the same position; however, listed companies may repurchase their own shares on the stock exchange without making an acquisition offer to the shareholders. |
On September 13, 2018, our shareholders authorized us to purchase, acquire, receive or hold and sell shares of Nexa Resources in accordance with the 1915 Law and any other applicable laws and regulations. The authorization was effective immediately after the general meeting and valid for a period of three years. For more information, see “Share ownership and trading—Purchases of equity securities by the issuer and affiliated purchasers.”
| 192 |
Articles of Association |
Form and transfer of shares
Our shares are issued in registered form only and are freely transferable. Luxembourg law does not impose any limitations on the rights of Luxembourg or non-Luxembourg residents to hold or vote our shares.
Under Luxembourg law, the ownership of registered shares is generally evidenced by the inscription of the name of the shareholder, the number of shares held by him or her in the shareholders’ register, which is maintained at our registered office. Each transfer of shares is made by a written declaration of transfer recorded in our shareholders’ register, dated and signed by the transferor and the transferee or by their duly appointed agent. We may accept and enter into its shareholders’ register any transfer based on an agreement between the transferor and the transferee provided a true and complete copy of the agreement is provided to us.
Our articles of association provide that, in case our shares are recorded in the register of shareholders on behalf of one or more persons in the name of a securities settlement system or the operator of such a system, or in the name of a professional depositary of securities or any other depositary or of a sub-depositary designated by one or more depositaries, the Company—Nexa—subject to a confirmation in proper form received from the depositary—will permit those persons to exercise the rights attaching to those shares, including admission to and voting at general meetings of shareholders. The boardBoard of directors may determine the requirements with which such confirmations must comply. Shares held in such manner generally have the same rights and obligations as any other shares recorded in our shareholder register(s).
| 193 |
Taxation |
Luxembourg tax considerations
Scope of Discussion
This summary is based on the laws of Luxembourg, including the Income Tax Law of December 4, 1967, as amended, the Municipal Business Tax Act of December 1, 1936, as amended and the Net Wealth Tax Act of October 16, 1934, as amended, to which we jointly refer as the “Luxembourg tax law”, existing and proposed regulations promulgated thereunder, and published judicial decisions and administrative pronouncements, each as in effect on the date of this report or with a known future effective date. This discussion does not generally address any aspects of Luxembourg taxation other than income tax, corporate income tax, municipal business tax, withholding tax and net wealth tax. This discussion, while not being a complete analysis or listing of all of the possible tax consequences of holding and disposing of shares, addresses the material tax issues. Also, there can be no assurance that the Luxembourg tax authorities will not challenge any of the Luxembourg tax consequences described below; in particular, changes in law and/or administrative practice, as well as changes in relevant facts and circumstances, may alter the tax considerations described below.
For purposes of this discussion, a “Luxembourg shareholder” is any beneficial owner of shares that for Luxembourg income tax purposes is:
· an individual resident of Luxembourg under article 2 of the Luxembourg Income Tax Law, as amended; or
· a corporation or other entity taxable as a corporation that is organized under the laws of Luxembourg or effectively managed from Luxembourg under article 159 of the Income Tax Law, as amended.
| § | an individual resident of Luxembourg under article 2 of the Luxembourg Income Tax Law (“LITL”), as amended; or |
| § | a corporation or other entity taxable as a corporation that is organized under the laws of Luxembourg or effectively managed from Luxembourg under article 159 of the Income Tax Law, as amended. |
This discussion does not constitute tax advice and is intended only as a general guide. Shareholders should also consult their own tax advisors as to the Luxembourg tax consequences of the ownership and disposition of our common shares. The summary applies only to shareholders who will own our common shares as capital assets and does not apply to other categories of shareholders, such as dealers in securities, trustees, insurance companies, collective investment schemes and shareholders who have, or who are deemed to have, acquired their shares in the capital of Nexa Resources by virtue of an office or employment.
Shareholders
Shareholders
Luxembourg income tax on dividends and similar distributions
A non-Luxembourg shareholder will not be subject to Luxembourg income taxes on dividend income and similar distributions in respect of our common shares, other than a potential Luxembourg withholding tax as described below, unless the shares are attributable to a permanent establishment or a fixed place of business maintained in Luxembourg by such non Luxembourgnon-Luxembourg shareholder.
An individual Luxembourg shareholder will be subject to Luxembourg income tax on dividend income and similar distributions in respect of its shares in Nexa Resources at the applicable progressive rates. Such payments may benefit from a 50.0% exemption set forth in Article 115 15a of the Luxembourg Income Tax Law (LITL),LITL, subject to the conditions set out therein (the “50.0% exemption”).therein. If the 50.0% exemption applies, the applicable income tax will be levied on 50% of the gross amount of the dividends at the applicable progressive rates. Taxable dividends are also subject to dependence insurance contribution levied at a rate of 1.4% on the net income where certain Luxembourg shareholders are affiliated to the Luxembourg social security administration.
A corporate Luxembourg shareholder iswas subject to Luxembourg corporate income tax (CIT)(“CIT”) and municipal business tax (MBT)(“MBT”) at the aggregate rate of 27.08% in 2017 (i.e. Luxembourg CIT is 20.33% including the surcharge24.94% for the unemployment and MBT is 6.75% forentities having itstheir statutory seat in Luxembourg City). The rate will be decreased to 26.01% as from 2018.City. The taxable basis of a corporate Luxembourg shareholder will, in principle, correspond to its accounting results, unless a specific treatment is provided for by the LITL. A corporate Luxembourg shareholder may benefit from the Luxembourg participation exemption (the “participation exemption”)
with respect to dividends received if the following two conditions are met: (a) the shareholder holds or commits itself to hold at least 10.0% of the share capital of Nexa Resources or a participation with an acquisition price of at least EUR 1.2€1.2 million for an uninterrupted period of at least twelve months and (b) the shareholder is a Luxembourg fully taxable corporation. If these cumulative conditions are met, dividends received by the corporate Luxembourg shareholder wouldshould be fully exempt from CIT and MBT at the level of the corporate Luxembourg shareholder.
| 194 |
Taxation |
If the conditions with respect to the Luxembourg participation exemption are not met, the corporate Luxembourg shareholders can still benefit from the aforementioned 50.0% exemption, subject to the conditions set out therein.
Luxembourg withholding tax—Share capital reductions or share premium reimbursements
Share capital reductions or share premium reimbursements made by Nexa Resources to the Luxembourg and non-Luxembourg shareholders are in principle subject to a 15% Luxembourg withholding tax, unless they have been motivated by genuine economic reasons. GenuineAlthough genuine economic reasons are not defined by law, but are subject to appreciation by the Luxembourg tax authorities. The Companyauthorities may examine the given reasons and determine that Nexa Resources does not have distributable reserves or profits in its chart of accounts according to Luxembourg regulations. We do not intend to make capital reductions in the near future. Nexa Resources discloses distributable reserves, retained earnings and profits in its chart of accounts according to Decree dated June 10, 2009. Our legal reserve and profits reserve were zero asAs of December 31, 2017, but2023, we have the Company had amounts available for distribution asability to pay dividends and share premiums. The share premium, reimbursements.if any, may be distributed to the shareholders in accordance with Luxembourg Commercial Companies Act by a resolution of the Board of directors. See “Share ownership and trading—Distributions”.
Luxembourg withholding tax—Distributions to shareholders
A Luxembourg withholding tax of 15.0% is due on dividends and similar distributions made by Nexa Resources to its Luxembourg and non-Luxembourg shareholders unless a Luxembourg domestic dividend withholding tax exemption or a double tax treaty reduction is applicable, as described below. The tax will be withheld by Nexa Resources and remitted to the Luxembourg tax authorities within 8 days as fromof the date the income is made available to the Luxembourg and non-Luxembourg shareholders.
Exemption from Luxembourg withholding tax—Distributions to shareholders
Dividends paid by Nexa Resources will be exempt from Luxembourg withholding tax provided that the following cumulative conditions are met (the “domestic exemption”)(or domestic exemption):
| · | at the date of the distribution, the shareholder holds at least 10% of the share capital of Nexa Resources or a participation with an acquisition price of at least €1.2 million for an uninterrupted period of at least twelve months; and |
| · | the dividend is paid to a (i) fully taxable company resident in Luxembourg, (ii) a company resident in a EU Member State fulfilling the conditions of Article 2 of the Parent Subsidiary Directive and listed in the appendix to this directive, (iii) a company resident in a country with which Luxembourg has concluded a double tax treaty and which is fully subject to income tax comparable to the Luxembourg corporate income tax as well as a Luxembourg permanent establishment of such a company, (iv) a company resident of Switzerland and subject to tax without being exempt, (v) a company or a cooperative company resident in a Member State of the European Economic Area, other than a Member State of the EU, and that is fully subject to tax equivalent to the Luxembourg corporate income tax, or (vi) a Luxembourg permanent establishment of a company under (ii) or (v). |
· at the date of the distribution, the shareholder holds at least 10% of the share capital of Nexa Resources or a participation with an acquisition price of at least EUR 1.2 million for an uninterrupted period of at least twelve months; and
· the dividend is paid to a (i) fully taxable company resident in Luxembourg, (ii) a company resident in a EU Member State fulfilling the conditions of Article 2 of the Parent Subsidiary Directive and listed in the appendix to this directive, (iii) a company resident in a country with which Luxembourg has concluded a double tax treaty and which is fully subject to income tax comparable to the Luxembourg corporate income tax as well as a Luxembourg permanent establishment of such a company, (iv) a company resident of Switzerland and subject to tax without being exempt, (v) a company or a cooperative company resident in a Member State of the European Economic Area, other than a Member State of the EU, and that is fully subject to tax equivalent to the Luxembourg corporate income tax, or (vi) a Luxembourg permanent establishment of a company under (ii) or (v).
Shareholders that are companies resident in countries that have entered into a double tax treaty with Luxembourg may qualify for the domestic exemption described above.
For a shareholder to benefit from such exemption upon a distribution date, Nexa Resources must file a properly competed form 900 with the Luxembourg tax authorities within 8 days following the earlier of (a) the payment date set in the distribution decision or (b) the day following the distribution decision date and (b) the effectivein case no payment date of payment of the dividend. Allis fixed. Luxembourg tax authorities may request all relevant documentation showing fulfillment of the above-mentioned conditions have to be appended to the form 900 (e.g., including a tax residency certificate). The CompanyNexa makes no representation that this exemption procedure will be practicable with respect to shares held through a clearing system such as DTC (in the United States) or CDS (in Canada).
| 195 |
Taxation |
Alternatively, a
shareholder may file a refund request (form 901bis, stamped and validated by the tax authorities of the State of residency of the shareholder) with the Luxembourg tax authorities before December 31 of the year following the taxable event (i.e., the distribution). The CompanyNexa makes no representation that this refund procedure will be practicable for a shareholder residing in the United States Canada or any other specific jurisdiction.
A shareholder that does not meet the twelve-month holding period described in the first bullet above can request a refund when the twelve-month period has elapsed. The refund request (form 901bis, stamped and validated by the tax authorities of the State of residency of the shareholder) has to be filed with the Luxembourg tax authorities before December 31 of the year following the taxable event.
Forms 900 and 901bis are generally made available on the website of the Luxembourg tax authorities (Administration des contributions directes).
The application of the dividend withholding tax exemption to taxable companies residentcompanies’ residents in other EU member states or to their EU permanent establishments is not granted if the income allocated is part of a tax avoidance scheme.
Reduction of Luxembourg withholding tax—Distributions to shareholders
As mentioned above, pursuant to the provisions of certain bilateral treaties for the avoidance of double taxation concluded between Luxembourg and other countries, and if certain conditions are met, the aforementioned Luxembourg dividend withholding tax may be reduced. Many such treaties, including the double tax treaty with the United States, provide for a tax rate lower than 15 percent only for a shareholder that holds a substantial (generally, 10 percent or 25 percent) portion of a Luxembourg company’s shares. Shareholders that hold such shares should consult their tax advisors to determine how to benefit from the reduction in withholding tax rates.
A shareholder that is a company resident in a country that has entered into a double tax treaty with Luxembourg may qualify for the domestic exemption even if the treaty would not reduce the withholding tax rate applicable to dividends paid to that shareholder.
Luxembourg NWT
A non-Luxembourg shareholder will not be subject to Luxembourg net wealth tax (NWT)(“NWT”) unless the shares are attributable to a permanent establishment or a fixed place of business maintained in Luxembourg by such non Luxembourgnon-Luxembourg shareholder.
Luxembourg individual shareholders are not subject to Luxembourg NWT. A Luxembourg corporate shareholder willshould be subject to Luxembourg NWT in respect of the shares held in the capital of Nexa Resources unless it holds more than 10% or EUR 1.2€1.2 million of our common shares.
Luxembourg capital gains tax upon disposal of shares
Capital gains derived by a non-Luxembourg shareholder on the sale of our common shares will not be subject to taxation in Luxembourg, unless one of the following conditions applies:
| · | the shareholder does not benefit from a double tax treaty and (i) holds shares in Nexa Resources representing more than 10% of the share capital of Nexa Resources and such shares were held for less than six months prior to their sale or (ii) has been a resident taxpayer in Luxembourg for at least fifteen years and had acquired nonresident status less than five years prior to the disposal; or |
| · | Our common shares are attributable to a permanent establishment or a fixed place of business maintained in Luxembourg by such non-Luxembourg shareholder. In such case, the non-Luxembourg shareholder is required to recognize capital gains or losses on the sale of such shares, which will be subject to CIT and MBT, unless the participation exemption applies. |
| 196 |
Taxation |
Capital gains realized upon the sale of our common shares by a Luxembourg resident individual will be subject to Luxembourg income tax at the level of the Luxembourg resident individual only in case of (i) speculation gains or (ii) gains realized on a substantial participation.
Speculation gains
Capital gains realized upon the sale of our common shares within a shareholding period not exceeding six months will be subject to personal income taxation (unless such capital gain does not exceed EUR500)€500) in the hands of a Luxembourg resident individual.
Substantial participation
In case where the Luxembourg resident individual has held the shares for at least six months and had a substantial participation, the capital gains realized will be subject to income tax at a rate equal to half the normal progressive rate applicable. A participation is considered as a substantial participation when a Luxembourg resident individual, jointly with his/her spouse and children under the age of 18, holds or has held, directly or indirectly, at any time during the five years prior to the date of the sale, 10.0% or more of the share capital of Nexa Resources.
Capital gains realized by the Luxembourg corporate shareholder (socié(société de capitaux)capitaux) should be exempt from capital gains tax in Luxembourg if at the date of the disposal, the Luxembourg shareholder has held or undertakes to hold, for an uninterrupted period of at least 12 months, a direct participation which represents at least 10.0% of the share capital of Nexa Resources, or which acquisition price was at least EUR6.0€6.0 million. If these conditions are not met, the Luxembourg corporate shareholder would be fully taxed on the capital gains realized upon the sale of the common share. The exempt amount of the capital gains realized will be, however, reduced by the amount of any expenses related to the participation, including decreases in the acquisition cost that could have previously reduced the company’ssuch shareholder’s Luxembourg taxable income.
ATAD rules
The European Council has adopted two Anti-Tax Avoidance Directives: Council Directive (EU) 2016/1164 of 12 July 2016 laying down rules against tax avoidance practices that directly affect the functioning of the internal market (“ATAD I”) and Directive 2017/952/EU of 29 May 2017 amending ATAD I as regards hybrid mismatches with third countries (“ATAD II”) that address many of the issues mentioned above. The measures included in ATAD I were implemented into Luxembourg law on December 21, 2018 and almost all of them have been applicable since January 1, 2019. The measures included in ATAD II were implemented into Luxembourg law on December 19, 2019 and almost all of them have been applicable since January 1, 2020, subject to certain exceptions. ATAD I and ATAD II may have a material impact on how returns to shareholders are taxed.
Pillar Two
Pillar Two is focused on implementing a global minimum tax designed to ensure that large multinationals pay a minimum effective tax rate of 15% in every jurisdiction they operate in. Pillar Two is expected to apply to multinational groups with turnover in excess of €750 million. The Pillar Two proposals involve a framework of complex rules which, broadly, would impose top-up taxes on certain entities within a multinational group where the overall tax paid on the group’s profit in any jurisdiction falls below the minimum 15% effective tax rate. The proposed rules for determining whether a top-up tax is required in respect of the group’s profits in a jurisdiction and the allocation of any such top-up tax between the members of the group are detailed and are designed to prevent multinational groups from being able to structure around the rules. It should be noted that a group’s effective tax rate in a jurisdiction may fall below the minimum 15% rate, and therefore a top-up tax may be required, even if that jurisdiction’s statutory headline tax rate is over 15%. On December 15, 2022, the EU Member States adopted a Council Directive (2022/2523) on ensuring a global minimum level of taxation for multinational enterprise (“MNE”) groups and large-scale domestic groups in the EU (“Minimum Tax Directive”). EU Member States had the obligation to implement the Minimum Tax Directive into their national laws before December 31, 2023. The Minimum Tax Directive was implemented into Luxembourg national law on December 22, 2023, and applies to fiscal years starting on or after December 31, 2023.
| 197 |
Taxation |
Peruvian tax considerations
The following is a general summary of material Peruvian tax matters, as in effect on the date of this report, and describes our understanding of the principal tax consequences of an investment in our common shares by a person or entity who is not considered a resident of Peru for tax purposes. This summary is not intended to be a comprehensive description of all the tax considerations that may be relevant to a decision to make an investment in the offered shares.
This summary is based on provisions of the Peruvian income tax law and its regulations in force as of the date hereof. No rulings from the Peruvian tax authorities or judicial rulings address the tax treatment of instruments similar to the shares of Nexa Resources. Accordingly, no assurance can be given that the Peruvian tax authorities will agree with the conclusions described below. If the Peruvian tax authorities were to take a position different from the conclusions described below, the Peruvian income tax consequences of investing in Nexa Resources may differ from those summarized below.
Sale, exchange or disposition of the shares or a beneficial interest therein
Investors who decide to invest in the shares of Nexa Resources hold the shares in book-entry form, in the name of a nominee holding such shares for the investors’ benefit. Any future trading of such shares will be effected through a conveyance of the beneficial interest held by the investors thereupon through the designated clearing mechanism. Because the conveyance of such beneficial interest does not imply the actual transfer of shares, any capital gains resulting from the conveyance of the beneficial interest in such shares, obtained by a person or entity who is not considered a resident of Peru for Peruvian tax purposes, should not be subject to taxation in Peru.
If, contraryContrary to the conclusion stated above, if the sale of our common shares were to qualify as an “indirect transfer of Peruvian shares” (and the transfer of the beneficial interest in the shares were to be considered as an actual transfer of such shares), different rules would apply.
According to Peruvian income tax law, an “indirect transfer of Peruvian shares” is deemed to occur when there is a transfer of shares issued by a non-resident company which, in turn, owns—directly or through one or more companies—shares issued by a Peruvian company, and the following two conditions are concurrently met:
(i) during any of the 12 months preceding the transfer, the fair market value (FMV)(“FMV”) of the shares issued by the Peruvian company held directly or indirectly by the nonresident company which
shares are being sold, is equivalent to 50% or more of the FMV of all the shares issued by said non-resident company; and
(ii) during any 12-month period, the shares transferred by a party, including those transferred by its related parties, represent at least 10% of the shares issued by such non-resident company.
Due to recent modifications to Peruvian income tax law, as of January 1, 2019, even if the abovementioned conditions are not met, an indirect transfer of Peruvian shares will also be deemed to exist if the “total value” of shares of the Peruvian company indirectly transferred within any 12-month period is equivalent to or higher than 40,000 Peruvian tax units (S/176 million or US$50.0 million approximately). Said “total value” is determined by multiplying: i) the “percentage” that the FMV of the shares issued by the Peruvian company held (directly or indirectly) by the non-resident company which shares are actuallybeing transferred, during arepresents with regard to the FMV of all the shares issued by said non-resident company; and ii) the price agreed for the shares issued by the non-resident company directly transferred. To determine the “total value” threshold, transfers made by those parties which qualify as related to the transferor should also be considered. Nonetheless, the “taxable base” shall be determined, in any case, per party, considering the transfers made by the latter within the abovementioned 12-month period.
period, but excluding those transfers previously taxed.
In case the sale of the shares were to qualify as an “indirect transfer of Peruvian shares” (and the transfer of the beneficial interest on the shares were to be considered as an actual transfer of such shares), any capital gain resulting therefrom will be subject to a 30% tax rate in Peru.
In case the corporate investor that makes the indirect transfer of Peruvian shares has a branch or a permanent establishment with assigned assets in Peru, said corporation will be jointly and severally liable for any income tax that resulted from the transfer of Peruvian shares; it will also be obligated to present to the Peruvian tax authority all the information related to the Peruvian shares of the non-resident investor that are being sold, particularly the information referred to the FMV; participation percentages; capital increase or reduction; issuance and placement of shares or participations; reorganization processes; patrimonial values and balance sheets; etc. Investors should consult their own tax advisors about the consequences of the acquisition, ownership, and disposition of their investment in the offered shares or any beneficial interest therein, including the possibility that the tax consequences of investing in the offered shares may differ from the description above.
| 198 |
Taxation |
United States federal income tax considerations
The following is a summary of certain U.S. federal income tax considerations that are likely to be relevant to the purchase, ownership and disposition of our common shares by a U.S. Holder (as defined below).
This summary is based on provisions of the Internal Revenue Code of 1986, as amended (the Code)“Code”), and U.S. Treasury regulations (Regulations)(“Regulations”), rulings and judicial interpretations thereof, in force as of the date hereof, and the U.S.-Luxembourg Treaty dated December 20, 2000 (as amended by any subsequent protocols) (the “Treaty”). Those authorities may be changed at any time, perhaps retroactively, so as to result in U.S. federal income tax consequences different from those summarized below.
This summary is not a comprehensive discussion of all of the tax considerations that may be relevant to a particular investor’s decision to purchase, hold, or dispose of our common shares. In particular, this summary is directed only to U.S. Holders that hold common shares as capital assets and does not address tax consequences to U.S. Holders who may be subject to special tax rules, such as banks, brokers or dealers in securities or currencies, traders in securities electing to mark to market, financial institutions, life insurance companies, tax exempt entities, entities that are treated as partnerships for U.S. federal income tax purposes (or partners therein), holders that own or are treated as owning 10% or more of our common shares by vote or value, persons holding common shares as part of a hedging or conversion transaction or a straddle, nonresident alien individuals present in the United States for more than 182 days in a taxable year, or persons whose functional currency is not the U.S. dollar. Moreover, this summary does not address state, local or foreign taxes, U.S. federal estate and gift taxes, or the Medicare contribution tax applicable to net investment income of certain non-corporate U.S. Holders, or the alternative minimum tax consequences of acquiring, holding or disposing of common shares.
For purposes of this summary, a “U.S. Holder” is a beneficial owner of common shares that is a citizen or resident of the United States, a U.S. domestic corporation or that otherwise is subject to U.S. federal income taxation on a net income basis in respect of such common shares.
U.S. Holders should consult their tax advisors about the consequences of the acquisition, ownership, and disposition of the common shares, including the relevance to their particular situation of the considerations discussed below and any consequences arising under foreign, state, local or other tax laws.
Taxation of dividends
Subject to the discussion below under “—Passive“Passive Foreign Investment Company Status,” the gross amount of any distribution of cash or property with respect to our common shares that is paid out of our current or accumulated earnings and profits (as determined for U.S. federal income tax purposes) will generally be includible in a U.S. Holder’s taxable income as ordinary dividend income on the day on which the U.S. Holder receives the dividend and will not be eligible for the dividends-receiveddividends received deduction allowed to corporations under the Code.
We do not expect to maintain calculations of our earnings and profits in accordance with U.S. federal income tax principles. U.S. Holders therefore should expect that distributions generally will be treated as dividends for U.S. federal income tax purposes.
Subject to certain exceptions for short-term positions, dividends received by an individual with respect to the common shares will be subject to taxation at a preferential rate if the dividends are “qualified dividends.” Dividends paid on the common shares will be treated as qualified dividends if:
| · | the common shares are readily tradable on an established securities market in the United States; and |
| 199 |
Taxation |
| · | we were not, in the year prior to the year in which the dividend was paid, and are not, in the year in which the dividend is paid, a passive foreign investment company (“PFIC”). |
The common shares will beare listed on the NYSE and will qualify as readily tradable on an established securities market in the United States so long as they are so listed. Based on our consolidated financial statements and relevant marketcertain estimates of our gross income and shareholder data,gross assets, and relying on the Commodity Exception (as defined below under “Passive Foreign Investment Company Status”), we do not believe that we were not classified as a PFIC with respect tofor our prior2023 or 2022 taxable year. In addition, based on our consolidated financial statementsyears, and our current expectations regarding the value and nature of our assets, the sources and nature of our income and relevant market and shareholder data, we do not anticipate becoming a PFIC for our current taxable year or in the foreseeable future. Accordingly, we expect that dividends paid on the common shares will be treated as qualified dividends. U.S. Holders should consult their tax advisors regarding the availability of the reduced dividend tax rate in light of their own particular circumstances.
Dividend distributions with respect to our common shares generally will be treated as “passive category” income from sources outside the United States for purposes of determining a U.S. Holder’s U.S. foreign tax credit limitation. Subject to thegenerally applicable limitations and conditions, provided in the Code and the applicable Regulations, a U.S. Holder may be able to claim a foreignLuxembourg dividend withholding tax credit against its U.S. federal income tax liability in respect of any Luxembourg income taxes withheldpaid at the appropriate rate applicable to the U.S. Holder frommay be eligible for a dividend paid tocredit against such U.S. Holder’s U.S. federal income tax liability. These generally applicable limitations and conditions include new requirements recently adopted by the U.S. Internal Revenue Service (“IRS”) in Regulations promulgated in December 2021, and any Luxembourg tax will need to satisfy these requirements in order to be eligible to be a creditable tax for a U.S. Holder. Alternatively,In the case of a U.S. Holder that either (i) is eligible for, and properly elects, the benefits of the Treaty, or (ii) consistently elects to apply a modified version of these rules under recently issued temporary guidance and complies with specific requirements set forth in such guidance, the Luxembourg tax on dividends will be treated as meeting the new requirements and therefore as a creditable tax. In the case of all other U.S. Holders, the application of these requirements to the Luxembourg tax on dividends is uncertain, and we have not determined whether these requirements have been met. If the Luxembourg dividend tax is not a creditable tax for a U.S. Holder or the U.S. Holder does not elect to claim a foreign tax credit for any foreign income taxes paid or accrued in the same taxable year, the U.S. Holder may be able to deduct the Luxembourg tax in computing such LuxembourgU.S. Holder’s taxable income taxes from itsfor U.S. federal taxable income providedtax purposes. Dividend distributions will constitute income from sources without the United States and, for U.S. Holders that the U.S. Holder electselect to deduct rather than credit all foreign income taxes for the relevant taxable year. The rules with respect toclaim foreign tax credits, are complexgenerally will constitute “passive category income” for foreign tax credit purposes.
The availability and involve the applicationcalculation of rules thatforeign tax credits and deductions for foreign taxes depend on a U.S. Holder’s particular circumstances and involve the application of complex rules to those circumstances. Accordingly,The temporary guidance discussed above also indicates that the Treasury and IRS are considering proposing amendments to the December 2021 Regulations and that the temporary guidance can be relied upon until additional guidance is issued that withdraws or modifies the temporary guidance. U.S. Holders are urged toshould consult their own tax advisors regarding the availabilityapplication of the foreign tax credit underthese rules to their particular circumstances.
situations.
U.S. Holders that receive distributions of additional common shares or rights to subscribe for common shares as part of a pro rata distribution to all our shareholders generally will not be subject to U.S. federal income tax in respect of the distributions.
Taxation of dispositions of common shares
Subject to the discussion below under “—Passive Foreign Investment Company Status,” a U.S. Holder generally will recognize gain or loss on the sale, exchange or other disposition of common shares in an amount equal to the difference, if any, between the amount realized upon the sale, exchange or other disposition and the U.S. Holder’s adjusted tax basis in the common shares. A U.S. Holder’s adjusted tax basis in its common shares generally will equal the purchase price for the common shares. Any gain or loss will be capital gain or loss and generally will be long-term capital gain or loss if the common shares have been held for more than one year. Long-term capital gain realized by a U.S. Holder that is an individual generally is subject to taxation at a preferential rate. The deductibility of capital losses is subject to limitations. Gain, if any, realized by a U.S. Holder on the sale or other disposition of the common shares generally will be treated as U.S. source income for U.S. foreign tax credit purposes.
Passive foreign investment company status
Special U.S. tax rules apply to companies that are considered to be PFICs. We will be classified as a PFIC in a particular taxable year if eithereither:
· 75 percent or more of our gross income for the taxable year is passive income; or
· the average percentage of the value of our assets that produce or are held for the production of passive income is at least 50 percent.
| 200 |
Taxation |
| · | 75 percent or more of our gross income for the taxable year is passive income; or |
| · | the average percentage of the value of our assets that produce or are held for the production of passive income is at least 50 percent. |
Passive income generally includes dividends, interest, royalties, rents, annuities, net gains from the sale or exchange of property producing such income, net foreign currency gains, and gains from commodities transactions other than gains derivedthat are active business gains from “qualified active sales”the sale of commodities and “qualifiedor arise from “commodity hedging transactions” involving commodities,transactions,” within the meaning of the applicable Regulations (Commodity Exception)rules (“Commodity Exception”).
Based on our consolidated financial statements and certain estimates of our gross income and gross assets, and relying on the Commodity Exception, we do not believe that we currently arewere a PFIC for our 2023 or 2022 taxable years, and we do not anticipate becoming a PFIC for our current taxable year or in the foreseeable future. However, since PFIC status will be determined by us on an annual basis and since such status depends upon the composition of our income and assets, and the nature of our activities (including our ability to qualify for the Commodity Exception or any similar exceptions), from time to time, there can be no assurance that we will not be considered a PFIC for any taxable year. In the event that, contrary to our expectation, we are classified as a PFIC in any year, and a U.S. Holder does not make a mark-to-market election, as described in the following paragraph, the U.S. Holder will be subject to a special tax at ordinary income tax rates on “excess distributions,” including certain distributions by us and gain that the U.S. Holder recognizes on the sale of the common shares. The amount of income tax on any excess distributions will be increased by an interest charge to compensate for tax deferral, calculated as if the excess distributions were earned ratably over the period that the U.S. Holder holds the common shares. Classification as a PFIC may also have other adverse tax consequences.
A U.S. Holder can avoid the unfavorable rules described in the preceding paragraph by electing to mark the common shares to market. If a U.S. Holder makes this mark-to-market election, the U.S. Holder will be required in any year in which we are a PFIC to include as ordinary income the excess of the fair market value of the U.S. Holder’s common shares at year-end over the U.S. Holder’s basis in those shares. If a U.S. Holder’s basis in the common shares exceeds the shares’ fair market value at the end of the U.S. Holder’s taxable year, the U.S. Holder will be entitled to deduct the excess as an ordinary loss, but only to the extent of its net mark-to-market gains from previous years. The U.S. Holder’s basis in the shares will be adjusted to reflect the gain or loss. In addition, any gain that the U.S. Holder recognizes upon the sale of the common shares will be taxed as ordinary income in the year of sale.
A U.S. Holder that owns an equity interest in a PFIC must annually file IRS Form 8621 and may be required to file other IRS forms. A failure to file one or more of these forms as required may toll the running of the statute of limitations in respect of each of the U.S. Holder’s taxable years for which such form is required to be filed. As a result, the taxable years with respect to which the U.S. Holder fails to file the form may remain open to assessment by the IRS indefinitely, until the form is filed.
U.S. Holders should consult their tax advisors regarding the U.S. federal income tax considerations discussed above and the desirability of making a mark-to-market election if we were to be classified as a PFIC.
Foreign financial asset reporting
CertainIndividual U.S. Holders that own “specified foreign financial assets” with an aggregate value in excess of US$50,000 on the last day of the taxable year or US$75,000 at any time during the taxable year are generally required to file an information statement along with their tax returns, currently on Form 8938, with respect to such assets. “Specified foreign financial assets” include any financial accounts held at a non-U.S. financial institution, as well as securities issued by a non-U.S. issuer that are not held in accounts maintained by financial institutions. The understatementHigher reporting thresholds apply to certain individuals living abroad and to certain married individuals. Regulations extend this reporting requirement to certain entities that are treated as formed or availed of income attributable to “specifiedhold direct or indirect interests in specified foreign financial assets” in excess of US$5,000 extends the statute of limitations with respect to the tax return to six years after the return was filed.assets based on objective criteria. U.S. Holders who fail to report the required information could be subject to substantial penalties. In addition, the statute of limitations for assessment of tax would be suspended, in whole or part. Prospective investors are encouraged to consult with their tax advisors regarding the possible application of these rules, including the application of the rules to their particular circumstances.
| 201 |
Taxation |
Backup withholding and information reporting
Dividends paid on, and proceeds from the sale or other disposition of, the common shares to a U.S. Holder generally may be subject to the information reporting requirements of the Code and may be subject to backup withholding unless the U.S. Holder provides an accurate taxpayer identification number and makes any other required certification or otherwise establishes an exemption. Backup withholding is not an additional tax. The amount of any backup withholding from a payment to a U.S. Holder will be allowed as a refund or credit against the U.S. Holder’s U.S. federal income tax liability, provided the required information is furnished to the U.S. Internal Revenue ServiceIRS in a timely manner.
A holder that is a foreign corporation or a non-resident alien individual may be required to comply with certification and identification procedures in order to establish its exemption from information reporting and backup withholding.
| 202 |
Exchange Controls and Other Limitations Affecting Security Holders |
EXCHANGE CONTROLS AND OTHER LIMITATIONS AFFECTING SECURITY HOLDERS
Exchange controls and other limitations affecting security holders
We are not aware of any governmental laws, decrees, regulations or other legislation in Luxembourg that restrict the export or import of capital, including the availability of cash and cash equivalents for use by our affiliated companies, or that affect the remittance of dividends, interest or other payments to non-resident holders of our securities.securities, except for regulations restricting the remittance of dividends and other payments in compliance with United Nations and EU sanctions.
| 203 |
Evaluation of Disclosure Controls and Procedures |
EVALUATION OF DISCLOSURE CONTROLS AND PROCEDURES
Evaluation of disclosure controls and procedures
Our management, with the participation of our chief executive officer and chief financial officer, has evaluated the effectiveness of our disclosure controls and procedures as of December 31, 2017.2023. There are inherent limitations to the effectiveness of any system of disclosure controls and procedures, including the possibility of human error and the circumvention or overriding of the controls and procedures. Accordingly, even effective disclosure controls and procedures can only provide reasonable assurance of achieving their control objectives.
We have evaluated, with the participation of our chief executive officer and chief financial officer, the effectiveness of our disclosure controls and procedures as of December 31, 2017.2023. Based on our evaluation, our chief executive officer and chief financial officer concluded that as a result of the material weaknesses in our internal control over financial reporting described below, our disclosure controls and procedures were not effective as of December 31, 2017.2023.
| 204 |
Internal Control Over Financial Reporting |
INTERNAL CONTROL OVER FINANCIAL REPORTINGInternal control over financial reporting
This annualManagement report does not include a report of management’s assessment regardingon internal control over financial reporting
Our management is responsible for establishing and maintaining adequate internal control over financial reporting and for assessing its effectiveness.
Our internal control over financial reporting is a process designed by, or an attestation reportunder the supervision of, our chief executive officer and our chief financial officer, and effected by our Board of directors, management and other employees, and is designed to provide reasonable assurance regarding the reliability of financial reporting and of the Company’s independent registered publicpreparation of our consolidated financial statements, in accordance with IFRS accounting firm due to a transition period established by rules of the Securitiesstandards and Exchange Commission, or SEC, for newly public companies. This transition period expiresinterpretations, as issued by the endInternational Accounting Standards Board (“IASB”) and the IFRS Interpretations Committee (“IFRS Accounting Standards”).
Due to its inherent limitations, internal control over financial reporting may not prevent or detect misstatements. In addition, projections of 2018, and therefore, for each fiscal year, beginningany evaluation of effectiveness of internal control over financial reporting to future periods are subject to the risk that controls may become inadequate because of changes in conditions, or that the degree of compliance with the year ended December 31, 2018, we will be required to: (a) evaluateour policies or procedures may deteriorate.
Our management has assessed the effectiveness of our internal control over financial reporting as of December 31, 2023, based upon the endcriteria established in Internal Controls—Integrated Framework (2013), issued by the Committee of Sponsoring Organizations of Treadway Commission (“COSO”). Based on this assessment and criteria, our management has concluded that our internal control over financial reporting was effective as of December 31, 2023.
Audit of the fiscal year; (b) report on our conclusion as to its effectiveness in our annual report on Form 20-F; and (c) include in our annual report on Form 20-F an attestation report of ourinternal control over financial reporting
Our independent registered public accounting firm, on its effectiveness.PricewaterhouseCoopers Auditores Independentes Ltda., has audited the effectiveness of our internal control over financial reporting, as stated in their report as of December 31, 2023.
Changes in internal control over financial reporting
Except for improvements to our internal control over financial reporting that are being carried out to remediate the material weaknesses described below, thereThere were no changes in our internal control over financial reporting during 2017 thatthe fiscal year of 2023, which have materially affected, or are reasonably likely to materially affect, our internal control over financial reporting.
| 205 |
Principal Accountant Fees and Services |
During our preparation for our initial public offering, in September 2017, we identified material weaknesses in our internal control over financial reporting related to the effectiveness of controls intended to ensure the accuracy of the designation of a hedging instrument as net investment hedgePrincipal accountant fees and the calculation of earnings per share. The controls were ineffective due to failures in the process applied to consider the impact of internal legal entity reorganizations on hedging instruments designation and in the process applied to consider the effects of reverse stock splits retroactively in the earnings per share calculations.
Subsequently, we identified an error in the calculation of earnings per share in our previously issued financial statements for the year ended December 31, 2017. We incorrectly calculated earnings per share using the wrong amount for Profit (loss) attributable to owners of the parent. The error revealed a material weakness in our internal control over financial reporting related to the effectiveness of controls associated with the review of our consolidated financial statements and related disclosure in accordance with IFRS.
Since their identification, we began implementing and will continue to implement several measures to improve our internal control over financial reporting to remediate these material weaknesses, including: (i) implementing specific review procedures, including additional levels of review by accounting management and involvement of external specialists, when necessary designed to enhance controls over the formal review processes and documentation of earnings per share calculations, hedge accounting transactions, and other non-routine transactions and calculations, (ii) creation of an internal accounting review commission to review non-recurring events, complex or unusual transactions and their accounting effects on the consolidated financial statements and related disclosures (iii) improving controls over the review process for our financial statements and related disclosure in accordance with IFRS and strengthening the use of financial statement reporting and disclosure checklists, approved by accounting management and included in the documentation related to the preparation, review and approval of the Company’s consolidated financial statements in accordance with IFRS, (iv) strengthening the qualifications of accounting and financial reporting personnel through periodic and IFRS-related training programs in order to improve financial reporting team qualifications and (v) enhancing our accounting policies, manuals-and closing and reporting procedures to improve our period-end financial closing and reporting process, including with respect to the impact of non-routine transactions and earnings per share calculations.
We are implementing these remediation measures, which we believe will address the underlying causes of the material weaknesses that have been identified. However, we will not be able to determine whether the material weaknesses have been fully remediated until we evaluate the effectiveness of our internal control over financial reporting as of December 31, 2018. Our independent registered public accounting firm will also perform tests to conclude on the effectiveness of internal control over financial reporting.
PRINCIPAL ACCOUNTANT FEES AND SERVICES
services
The following table summarizes the fees billed to us by our independent auditors PricewaterhouseCoopers Auditores Independentes Ltda. for professional services in 20172023 and 2016:2022:
For the Year Ended December 31, | ||
2023 | 2022 | |
| (US$ thousand) | ||
| Audit fees | 1,839.7 | 2,132.1 |
| Audit-related fees | 128.4 | 107.0 |
| Tax fees | - | - |
| Other fees | - | - |
| Total fees | 1,968.1 | 2,239.1 |
|
| Year ended December 31, |
| ||
|
| 2016 |
| 2017 |
|
|
| (US$ thousand) |
| ||
Audit fees |
| 1,042.4 |
| 2,052.9 |
|
Audit-related fees |
| — |
| 1,264.1 |
|
Tax fees |
| — |
| — |
|
Other fees |
| — |
| — |
|
Total fees |
| 1,042.4 |
| 3,317.0 |
|
“Audit fees” are the aggregate fees billed by PricewaterhouseCoopers Auditores Independentes Ltda. for the audit of our annual financial statements, the audit of the statutory financial statements of our subsidiaries, and reviews of interim financial statements and attestation services that are provided in connection with statutory and regulatory filings or engagements. They also include fees for services that only the independent auditor reasonably can provide, including the provision of comfort letters and consents in connection with statutory and regulatory filings and the review of documents filed with the SEC and other capital markets or local financial reporting regulatory bodies. “Audit-related fees” are fees charged by PricewaterhouseCoopers Auditores Independentes Ltda. for assurance and related services that are reasonably related to the performance of the audit or review of our consolidated financial statements and are not reported under “Audit fees.”fees”. “Tax fees” are the aggregate fees billed by PricewaterhouseCoopers Auditores Independentes Ltda. for services rendered for tax compliance, tax advice and tax planning.
“Other fees” are the aggregate fees billed by PricewaterhouseCoopers Auditores Independentes Ltda. for services related with assurance and review procedures not related with regulatory or financial reporting of our consolidated financial statements.
Nexa has established policies and procedures that require any engagement of our independent auditor for audit or non-audit services to be submitted to and pre-approved by the auditAudit committee. In addition, our auditAudit committee may delegate the authority to pre-approve non-audit services to one or more of its members. All non-audit services that are pre-approved pursuant to such delegated authority must be presented to the full auditAudit committee at its first scheduled meeting following such pre-approval. Our auditAudit committee also has the authority to recommend pre-approval policies and procedures to our boardBoard of directors and for the engagement of our independent auditor’s services.
| 206 |
Information Filed with Securities Regulators |
INFORMATION FILED WITH SECURITIES REGULATORS
Information filed with securities regulators
We are subject to various information and disclosure requirements in those countries in which our securities are traded, and we file financial statements and other periodic reports with the SEC and Canadian securities regulatory authorities.
·
| · | United States. We are subject to the information requirements of the Securities Exchange Act of 1934, as amended, and accordingly file reports and other information with the SEC. |
| 207 |
Glossary
Brownfields project: An exploration or development project near or within an existing operation, which can share infrastructure and management.
Concentration: The process by which crushed and ground ore is separated into metal concentrates and reject material through processes such as flotation.
Concentrate plant: A plant where metal concentration occurs.
Cut-off grade: is the grade (i.e., the concentration of metal or mineral in rock) that determines the destination of the material during mining.
Development: The process of constructing a mining facility and the infrastructure to support the facility is known as mine development.
Diamond drilling:: An exploration or development project near or within an existing operation, which can share infrastructure and management.
Concentration: The process by which crushed and ground ore is separated into metal concentrates and reject material through processes such as flotation.
Concentrate plant: A plant where metal concentration occurs.
Development: The process of constructing a mining facility and the infrastructure to support the facility is known as mine development.
Diamond drilling: A method of drilling that uses a diamond bit, which rotates at the end of a drill rod or pipe. The opening at the end of a drill rod or pipe.
Exploration: Activities associated with ascertaining the existence, location, extent or quality of a mineral deposit.
Exploration stage property:is a property that has no mineral reserves disclosed.
Greenfields project: An exploration or development project that is located outside the area of influence of existing mine operations and/or infrastructure and will be independently developed and managed.
Indicated Mineral Resource: is that part of a Mineral Resource for which quantity and grade or quality are estimated on the basis of adequate geological evidence and sampling. The level of geological certainty associated with an indicated mineral resource is sufficient to allow a qualified person to apply modifying factors in sufficient detail to support mine planning and evaluation of the economic viability of the deposit.
Inferred Mineral Resource: is that part of a Mineral Resource for which quantity and grade or quality are estimated on the basis of limited geological evidence and sampling. The level of geological uncertainty associated with an inferred mineral resource is too high to apply relevant technical and economic factors likely to influence the prospects of economic extraction in a manner useful for evaluation of economic viability.
km: kilometer.
ktpd: thousand tonnes per day.
LBMA: The London Bullion Market Association.
LME: London Metal Exchange.
LOM: life of mine.
Measured Mineral Resource:is that part of a Mineral Resource for which quantity and grade or quality, are estimated on the basis of conclusive geological evidence and sampling. The level of geological certainty associated with a measured mineral resource is sufficient to allow a qualified person to apply modifying factors, as defined in this section, in sufficient detail to support detailed mine planning and final evaluation of the economic viability of the deposit.
Metal concentrate: The crushed and ground material obtained after concentration, including zinc, lead and copper concentrates. This is the product from our mining operations. Most of the zinc concentrate we produce is used in our smelting operations and the remaining portion, along with our lead and copper concentrates, is sold to our customers.
| 208 |
Glossary |
Metallic zinc: Pure metal (99.995% zinc) obtained from the electrodeposition of a zinc sulfate solution, free of impurities, through the Roaster-Leaching-Electrolysis (“RLE”) process.
Mineralization: The process or processes by which a mineral or minerals are introduced into a rock, resulting in a potentially valuable or valuable deposit.
Mineralized material: Mineral bearing material that has been physically delineated by one or more methods, including drilling and underground work, and is supported by sampling and chemical analysis. This material has been found to contain a sufficient amount of mineralization of an average grade of metal or metals to have economic potential that warrants further exploration evaluation. While this material is not currently or may never be classified as ore reserves, it is reported as mineralized material only if the potential exists for reclassification into the reserves category. This material cannot be classified in the reserves category until final technical, economic and legal factors have been determined. Under the SEC’s standards, a mineral deposit does not qualify as a reserve unless it can be economically and legally extracted at the time of reserve determination and it constitutes a proven or probable reserve (as defined below).
Mineral Reserve:is an estimate of tonnage and grade or quality of indicated and measured mineral resources that, in the opinion of the qualified person, can be the basis of an economically viable project. More specifically, it is the economically mineable part of a measured or indicated mineral resource, which includes diluting materials and allowances for losses that may occur when the material is mined or extracted.
Mineral Resource: is a concentration or occurrence of material of economic interest in or on the Earth's crust in such form, grade or quality, and quantity that there are reasonable prospects for eventual economic extraction. A mineral resource is a reasonable estimate of mineralization, taking into account relevant factors such as cut-off grade, likely mining dimensions, location or continuity that, with the assumed and justifiable technical and economic conditions, is likely to, in whole or in part, become economically extractable.
Mine site: An economic unit comprised of an underground and/or open pit mine, a treatment plant and equipment and other facilities necessary to produce metals concentrates, in existence at a certain location.
NSR: Net Smelter Return is the net revenue that the owner of a mining property receives from the sale of the mine’s metal/nonmetal products less transportation and refining costs.
Open pit: Surface mining in which the ore is extracted from a pit. The geometry of the pit may vary with the characteristics of the ore body.
Ore: A mineral or aggregate of minerals from which metal can be economically mined or extracted.
Ore grade: The average amount of metal expressed as a percentage, grams per tonne or in ounces per tonne.
Ounces or oz: Unit of weight. A troy ounce equals 31.1034 grams. All references to ounces in this report are to troy ounces unless otherwise specified.
Probable Mineral Reserve:is the economically mineable part of an indicated and, in some cases, a measured mineral resource.
Production stage property: is a property with material extraction of mineral reserves.
Proven Mineral Reserve: is the economically mineable part of a measured mineral resource and can only result from conversion of a measured mineral resource.
Qualified Person: An individual who is a mineral industry professional with at least five years of relevant experience in the type of mineralization and type of deposit under consideration in the specific type of activity that person is undertaking on behalf of the registrant and an eligible member or licensee n good standing of a recognized professional organization at the time the technical report is prepared.
Reclamation: The process of stabilizing, contouring, maintaining, conditioning and/or reconstructing the surface of disturbed land (i.e., used or affected by the execution of mining activities) to a state of “equivalent land ” Reclamation standards vary widely, but usually address issues of ground and surface water, topsoil, final slope gradients, overburden and revegetation.
| 209 |
Glossary |
Refining: The process of purifying an impure metal; the purification of crude metallic substances.
Secondary feed materials: By-products of industrial processes such as smelting and refining that are then available for further treatment/recycling. It can cover foundry ashes, zinc oxides from brass and bronze production, electric arc furnace (“EAF”) dust and slags.
SHG: Special High Grade.
Skarn: Metamorphic zone developed in the contact area around igneous rock intrusions when carbonate sedimentary rocks are invaded by large amounts of silicon, aluminum, iron and magnesium. The minerals commonly present in a skarn include iron oxides, calc-silicates, andradite and grossularite garnet, epidote and calcite. Many skarns also include ore minerals. Several productive deposits of copper or other base metals have been found in and adjacent to skarns.
Tailings: Finely ground rock from which valuable minerals have been extracted by concentration.
Tonne: A unit of weight. One metric tonne equals 2,204.6 pounds or 1,000 kilograms. One short tonne equals 2,000 pounds. Unless otherwise specified, all references to “tonnes” in this report refer to metric tonnes.
Zinc equivalent: A metric used to compare mineralization that is comprised of different metals in terms of zinc. Copper, lead, silver and gold contents in our concentrate production have been converted to a zinc equivalent grade at the average benchmark prices for 2023, i.e., US$2,649.04 per tonne (US$1.20 per pound) for zinc, US$8,483.40 per tonne (US$3.85 per pound) for copper, US$2,137.18 per tonne (US$0.97 per pound) for lead, US$23.39 per ounce for silver and US$1,942.74 per ounce for gold.
Zinc oxide: A chemical compound that results from the sublimation of zinc (Zn-metal) by oxygen in the atmosphere. Zinc oxide is in the form of powder or fine grains that is insoluble in water but very soluble in acid solutions.
| 210 |
Exhibits |
Exhibits
| 211 |
Signatures
The registrant hereby certifies that it meets all of the requirements for filing on Form 20-F and that it has duly caused and authorized the undersigned to sign this annual report on its behalf.
Date: March 27, 2024
Nexa Resources S.A. Financial Statements
Nexa Resources S.A. Consolidated financial statements at December 31, 2023 and report of independent registered public accounting firm Contents Consolidated financial statements
Notes to the consolidated financial statements
Nexa Resources S.A. Consolidated income statement Years ended on December 31 All amounts in thousands of US dollars, unless otherwise stated
The accompanying notes are an integral part of these consolidated financial statements
Nexa Resources S.A. Consolidated statement of comprehensive income Years ended on December 31 All amounts in thousands of US dollars, unless otherwise stated
The accompanying notes are an integral part of these consolidated financial statements
Nexa Resources S.A. Consolidated statement of balance sheet Years ended on December 31 All amounts in thousands of US dollars, unless otherwise stated
The accompanying notes are an integral part of these consolidated financial statements
Nexa Resources S.A. Consolidated statement of cash flow Years ended on December 31 All amounts in thousands of US dollars, unless otherwise stated
The accompanying notes are an integral part of these consolidated financial statements
Nexa Resources S.A. Consolidated statement of changes in shareholders’ equity At and for the years ended on December 31 All amounts in thousands of US dollars, unless otherwise stated
The accompanying notes are an integral part of these consolidated financial statements
Nexa Resources S.A. Consolidated statement of changes in shareholders’ equity At and for the years ended on December 31 All amounts in thousands of US dollars, unless otherwise stated
The accompanying notes are an integral part of these consolidated financial statements
Nexa Resources S.A. (“NEXA” or “Parent Company”) is a public limited liability company (société anonyme) incorporated and domiciled in the Grand Duchy of Luxembourg. Its shares are publicly traded on the New York Stock Exchange (“NYSE”). The Company’s registered office is located at 37A, Avenue J. F. Kennedy in the city of Luxembourg in the Grand Duchy of Luxembourg. NEXA and its subsidiaries (the “Company”) have operations that include large-scale, mechanized underground and open pit mines and smelters. The Company owns and operates three polymetallic mines in Peru, and two polymetallic mines in Brazil and is currently progressing with the ramp-up of its third polymetallic mine in Aripuanã, Brazil. The Company also owns and operates a zinc smelter in Peru and two zinc smelters in Brazil. NEXA’s majority shareholder is Votorantim S.A. (“VSA”), which holds 64.68% of its equity. VSA is a Brazilian privately-owned industrial conglomerate that holds ownership interests in metal, steel, cement, and energy companies, among others.
Business segment definition The Company’s Chief Executive Officer has been identified as the chief operating decision maker (“CODM”) since the role encompasses authority over resource allocation decisions and performance assessment, mainly analyzing performance from the production obtained in the operations. The Company has identified two operating segments: • Mining: consists of six long-life polymetallic mines, three located in the Central Andes of Peru and three located in Brazil (two in the state of Minas Gerais and one in the state of Mato Grosso). In addition to zinc, the Company produces substantial amounts of copper, lead, silver, and gold as by-products, which reduce the overall cost to produce mined zinc. • Smelting: consists of three operating units, one located in Cajamarquilla in Peru and two located in the state of Minas Gerais in Brazil. The facilities recover and produce metallic zinc (SHG zinc and zinc alloys), zinc oxide and by-products, such as sulfuric acid. Accounting policy Segment performance is assessed based on Adjusted EBITDA, since net financial results, comprising financial income and expenses and other financial items, and income tax are managed at the corporate level and are not allocated to operating segments. The Company defines Adjusted EBITDA as follows: net income (loss) for the year, adjusted by (i) share in the results of associates, depreciation and amortization, net financial results and income tax; (ii) non-cash events and non-cash gains or losses that do not specifically reflect its operational performance for the specific period, such as: gain (loss) on sale of investments; impairment and impairment reversals; gain (loss) on sale of long-lived assets; write-offs of long-lived assets; remeasurement in estimates of asset retirement obligations; and dams obligations; and (iii) pre-operating and ramp-up expenses incurred during the commissioning and ramp-up phases of greenfield projects. In addition, management may adjust the effect of certain types of transactions that in its judgments are (i) events that are non-recurring, unusual or infrequent, and (ii) other specific events that, by their nature and scope, do not reflect Nexa’s operational performance for the period.
The adjusted EBITDA is derived from internal information prepared in accordance with the International Financial Reporting Standards (“IFRS Accounting Standards”) and based on accounting measurements and management reclassifications between income statement lines items, which are reconciled to the consolidated financial statements in the column “Adjustments”, as shown in the tables below. These adjustments include reclassifications of certain overhead costs and revenues from “Other income and expenses, net” to “Net Revenues, Cost of sales and/or Selling”, “general and administrative expenses”. The Company uses customary market terms for intersegment sales. The Company’s corporate headquarters expenses are allocated to the operating segments to the extent they are included in the measures of performance used by the CODM. The presentation of segments results and reconciliation to income before income tax in the consolidated income statement is as follows:
(i) This amount represents the change in the fair value of the offtake agreement described in note 16, which is being measured at Fair value through profit and loss (“FVTPL”). This change in the fair value is a non-cash item and has not been considered in the Company’s Adjusted EBITDA calculation. (ii) Excludes the impact of commissioning, pre-operating, and ramp-up expenses of greenfield projects. For the year 2023, corresponds to the effects of idle capacity costs of the Aripuanã of USD 55,615 and excludes the net reversal of the net realizable value provision of Aripuanã’s inventory of USD 40,121 (excluding the depreciation portion). (iii) Annual remeasurement adjustment of the Company’s silver streaming revenues given the changes in long-term prices and in the mine plan for the Cerro Lindo mining unit.
(iv) The fair value adjustment of the energy surplus resulting from electric energy purchase contracts of NEXA’s subsidiary, Pollarix. This adjustment to EBITDA, has the objective to exclude from the current year´s performance the remeasurement effects of energy contracts without cash impact for the specific period. (v) Impact of accruals related to VAT’s discussions disclosed in note 9 (iv). These liabilities are not directly related to Nexa´s operations and performance and are excluded from EBITDA. (vi) The impact of the provisions related to dams obligations in Brazil was excluded in Company’s Adjusted EBITDA calculation. This adjustment was made considering these industrial waste containment structures have been closed for more than 20 years, even before they were acquired by Nexa as disclosed in note 27 (a). As such, they have never contributed to Nexa’s operational performance.
These consolidated financial statements have been prepared in accordance with the IFRS accounting standards and interpretations, as issued by the International Accounting Standards Board (“IASB”) and the IFRS Interpretations Committee. The consolidated financial statements have been prepared under the historical cost convention, except for certain financial assets and financial liabilities (including other financial instruments) measured at fair value at the end of each reporting period. The consolidated financial statements of the Company for the year ended December 31, 2023, were approved for issue in accordance with a resolution of the Board of Directors on February 21, 2024.
The consolidated financial statements comprise the financial statements of NEXA and its direct and indirect subsidiaries (“subsidiaries”), which reflect the assets, liabilities and transactions of the Parent Company and its subsidiaries. Intercompany balances and transactions, which include unrealized profits, are eliminated. A list of the most relevant companies, including subsidiaries, associates and joint operations, and the accounting policies applied in the preparation of the consolidated financial statements are described below.
(i) Dardanelos was incorporated on May 1, 2023, by NEXA BR. (ii) Nexa, through its wholly owned subsidiary NEXA BR, holds 100% of the common shares of Pollarix which carries the total voting rights. Auren a subsidiary of VSA, holds 100% of the preference shares, which carry the right to receive dividends 93% higher than the amount received for each common share. (iii) On November 17, 2022, NEXA, through Pollarix, acquired 1.46% of Enercan’s additional shares for BRL 21,731 (USD 4,136) by exercising its proportional pre-emptive rights due to the withdrawal of one of Enercan’s previous shareholders. Prior to this date, NEXA and the other shareholders jointly controlled Enercan’s assets and liabilities. However, with the withdrawal, Enercan’s remaining shareholders exercised their option to acquire these additional shares, resulting in the loss of joint control by NEXA. Since then, NEXA ceased recognizing its share of Enercan’s jointly held assets, liabilities, revenues, and expenses, and began treating it as an investment in an associate through the equity method, maintaining significant influence over the entity.
Subsidiaries include all entities over which the Company has control. The Company controls an entity when it (i) has the power over the entity; (ii) is exposed, or has the right, to variable returns from its involvement with the entity; and (iii) has the ability to affect those returns through its power over the entity. Subsidiaries are fully consolidated from the date on which control is transferred to the Company, except when the predecessor basis of accounting is applied. Subsidiaries are unconsolidated from the date that control ceases. Accounting policies of subsidiaries are usually consistent with the policies adopted by the Company. If there are differences, to ensure the accounting policies’ standardization, an adjustment is performed in the consolidation process. Non-controlling interests in the subsidiaries’ equity and results are shown separately in the consolidated balance sheet, income statement, statement of comprehensive income and statement of changes in shareholders’ equity. A change in a subsidiary’s ownership interest, without loss of control, is accounted for as an equity transaction. If the Company loses control over a subsidiary, it derecognizes the related assets, liabilities, non-controlling interests and other equity components and any resultant gain or loss is recognized in the income statement. Any investment retained is recognized at fair value. In general, there is a presumption that a majority of voting rights results in control. When the Company has less than a majority of the voting rights of an investee, it considers all relevant facts and circumstances to determine whether it has power over this investee. This may include contractual arrangements with the other holders of voting rights in the investee; rights arising from other contractual arrangements; and the Company’s voting rights and potential voting rights that will give it the practical ability to direct the relevant activities of the investee unilaterally. Intercompany transactions, balances, and unrealized gains on transactions between companies in the consolidated group are eliminated in full on consolidation. Unrealized losses are also eliminated unless the transaction indicates impairment of the transferred asset.
The Company recognizes its direct right to the assets, liabilities, revenues and expenses of joint operations and its share of any jointly held assets or incurred liabilities or revenues and expenses. These have been included in the consolidated financial statements under the appropriate headings. A joint operation is a joint arrangement whereby the parties that have joint control of the arrangement have rights to the assets, and obligations for the liabilities, relating to the arrangement.
Joint control is the contractually agreed sharing of control of an arrangement, which exists only when decisions about the relevant activities require unanimous consent of the parties sharing control.
Associates are initially recognized at cost and adjusted thereafter for the equity method, being increased, or reduced from its interest in the investee's income after the acquisition date. For an entity to become an associate the Company must have significant influence, which is the power to participate in the financial and operating policy decisions of the investee, without having its control or joint control of those policies.
Transactions with non-controlling interests that do not result in a loss of control are recognized within shareholders’ equity as transactions with equity owners of the consolidated group. A change in ownership interest results in an adjustment between the carrying amounts of the controlling and non-controlling interests to reflect their relative interests in the subsidiary. Any difference between the amount of the adjustment to non-controlling interests and any consideration paid or received is recognized in Additional paid in capital within shareholders’ equity.
Items included in the financial statements of each of the Company’s entities are measured using the currency of the primary economic environment in which each entity operates (“the functional currency”). The Company’s consolidated financial statements are presented in US Dollars ("USD"), which is NEXA’s functional currency and the Company’s reporting currency. Foreign currency transactions are initially recorded by each of the Company’s entities at their respective functional currency spot rates at the date the transaction is recognized. Foreign exchange gains and losses resulting from the settlement of such transactions and from the translation of monetary assets and liabilities denominated in foreign currencies at the functional currency spot rate at the end of each reporting period are recognized in the income statement. Non-monetary items that are measured at historical cost in a foreign currency are translated using the exchange rate at the date of the initial transaction. Translation differences on assets and liabilities carried at fair value are reported as part of the fair value gain or loss.
The results of operations and financial position All resulting exchange differences are recognized in other comprehensive income and accumulated in a separate component of shareholders’ equity. When a foreign operation is totally or partially disposed, the monetary exchange differences that were previously recorded in equity are recognized in the income statement for the respective year. Nexa Resources S.A. At and All amounts in thousands of US dollars, unless otherwise stated There were some new standards and amendments effective for annual periods commencing on January 1, 2023. The adoption of these new standards and amendments did not have a material impact on the Company’s financial statements, except for the amendment for IAS 12, which additional disclosures are required and effective for the Company’s December 31, 2023 financial statements. IAS 12 – Income taxes Main aspects introduced by the amendments. On 23 May 2023, the IASB issued an amendments to IAS 12. The amendments provide a temporary exception from the requirement to recognise and disclose deferred taxes arising from enacted or substantively enacted tax law that implements the Pillar Two model rules published by the Organisation for Economic Co-operation and Development (OECD), including tax law that implements qualifying domestic minimum top-up tax (QDMTT) described in those rules. The amendments to IAS 12 made narrow-scope amendments to IAS 12 to (a) provide a temporary exception from accounting for deferred taxes arising from legislation enacted to implement OECD’s Pillar Two model rules, and (b) introduce additional disclosure requirements. The mandatory temporary exception – the use of which is required to be disclosed – applies immediately. The remaining disclosure requirements apply for annual reporting periods beginning on or after 1 January 2023, but not for any interim periods ending on or before 31 December 2023. Impacts of adoption The amendments require an entity to provide disclosure on expected impacts, which is presented at note 11(e). The Company early adopted the following amendment, which has been issued but is not yet effective. Additionally, it has not early adopted any other standards, interpretations, or amendments that have been issued but are not yet effective, and it does not anticipate that the adoption of any of them will materially impact the Company’s financial statements: IAS 7 – “Statement of Cash Flow” and IFRS 7 - "Financial Instruments: Disclosure" The amendments are effective for years starting January 1, 2024, and allow early adoption permitted by IFRS. To enhance transparency in confirming payable operations, the Company opted for IFRS 7 and IAS 7 early adoption according to note 26. Main aspects introduced by the amendments. On May 25, 2023, the IASB issued the final amendments to IAS 7 and IFRS 7 which addresses the disclosure requirements to improve transparency regarding supplier finance arrangements and their impact on a company’s liabilities, cash flows and exposure to liquidity risk. Transition method The Company will early apply IAS 7 and IFRS 7 amendments starting on December 31, 2023, using the simplified transition approach. There will be not restatement of comparative periods for the years preceding the adoption, in accordance with the reliefs available during the initial adoption. Nexa Resources S.A. (Original) Adjustment (Revised) Net revenue from products sold 1,912,813 52,028 1,964,841 Cost of products sold (1,387,073 ) (52,028 ) (1,439,101 ) Gross profit 525,740 — 525,740 (Original) Adjustment (Revised) Net revenue from products sold 1,824,840 40,343 1,865,183 Cost of products sold (1,422,947 ) (40,343 ) (1,463,290 ) Gross profit 401,893 — 401,893 (Original) Adjustment (Revised) Gross Revenue 2,193,867 — 2,193,867 Taxes on sales and returns (281,054 ) 52,028 (229,026 ) Net revenue from products sold 1,912,813 52,028 1,964,841 (Original) Adjustment (Revised) Gross Revenue 2,072,439 — 2,072,439 Taxes on sales and returns (247,599 ) 40,343 (207,256 ) Net revenue from products sold 1,824,840 40,343 1,865,183 Notes to the consolidated financial statements All amounts in thousands of US dollars, unless otherwise stated Impacts of adoption The amendments require an entity to provide information about the impact of supplier finance arrangements on liabilities and cash flows, including: - Terms and conditions of the supplier finance arrangements. - The carrying amounts of supplier finance arrangement financial liabilities and the line items in which those liabilities are presented; - The carrying amounts of financial liabilities and the line items, for which the finance providers have already settled the corresponding trade payables; - The range of payment due dates for financial liabilities owed to the finance providers and for comparable trade payables that are not part of those arrangements; - The type and effect of non-cash changes in the carrying amounts of supplier finance arrangement financial liabilities, which prevent the carrying amounts of the financial liabilities from being comparable. The preparation of the Company’s consolidated financial statements requires the use of estimates, assumptions and judgments that affect the reported amounts of revenues, expenses, assets and liabilities, the accompanying disclosures, and the disclosure of contingent liabilities at the date of the consolidated financial statements. Critical estimates, assumptions and judgments, by definition, will seldom equal the actual results and are continually evaluated to reflect changing expectations about future events. Management also needs to exercise judgment in applying the Company’s accounting policies. This note provides an overview of the areas that involve a higher degree of judgment or complexity, and of items which are more likely to be materially adjusted due to estimates and assumptions turning out to be wrong due to their uncertainty. Detailed information about each of these estimates, assumptions and judgments is included in other notes together with information about the basis of calculation for each affected item in the financial statements. The critical accounting estimates, assumptions and judgments applied by the Company in the preparation of these financial statements are as follows: Estimates, assumptions and judgments are continuously evaluated. They are based on historical experience and other factors, including expectations of future events that may have a financial impact on the Company and that are believed to be reasonable under the circumstances. Among others, the Company has considered the effects of the Environmental, Social and Governance (“ESG”) commitments when making its critical estimates, assumptions and judgments based on the updated long-term ESG commitments. Events and changes in circumstances arising after December 31, 2023, will be reflected in management’s estimates for future periods, as well as the effective disbursements will be capitalized or expensed, depending on its nature and function, in the period in which they are incurred. (Original) Adjustment (Revised) Peru 521,856 52,028 573,884 Brazil 560,878 — 560,878 United States 156,634 — 156,634 Luxembourg 100,631 — 100,631 Korea 66,887 — 66,887 Switzerland 59,873 — 59,873 Chile 67,546 — 67,546 Singapore 42,666 — 42,666 Germany 42,560 — 42,560 Colombia 39,137 — 39,137 Japan 36,005 — 36,005 Austria 22,982 — 22,982 Turkey 19,498 — 19,498 China 12,838 — 12,838 Italy 3,608 — 3,608 Other 159,214 — 159,214 1,912,813 52,028 1,964,841 (Original) Adjustment (Revised) Peru 544,107 40,343 584,450 Brazil 534,141 — 534,141 United States 99,884 — 99,884 Luxembourg 98,159 — 98,159 Korea 51,181 — 51,181 Switzerland 135,450 — 135,450 Chile 52,865 — 52,865 Singapore 72,514 — 72,514 Germany 22,348 — 22,348 Colombia 42,007 — 42,007 Japan 32,994 — 32,994 Austria 18,731 — 18,731 Turkey 23,265 — 23,265 China 639 — 639 Italy 1,399 — 1,399 Other 95,156 — 95,156 1,824,840 40,343 1,865,183 Nexa Resources S.A. Notes to the consolidated financial statements All amounts in thousands of US dollars, unless otherwise stated Accounting policy Revenues represent the amount of the consideration received or receivable for the sale of goods in the ordinary course of the Company’s activities. Revenues are shown net of value-added tax, returns, rebates and discounts, after eliminating sales between the consolidated companies. The Company recognizes revenues when a performance obligation is satisfied by transferring a promised good or service to a customer. The asset is transferred when the customer obtains control of that asset. To determine the point in time at which a customer obtains control of a promised asset the Company considers the following indicators: (i) the Company has a present right to payment for the asset; (ii) the customer has legal title to the asset; (iii) the Company has transferred physical possession of the asset; (iv) the customer has the significant risks and rewards of ownership of the asset; (v) the customer has accepted the asset. Identification and timing of satisfaction of performance obligations The Company has two distinct performance obligations included in certain sales contracts: (i) the promise to provide goods to its customers; and (ii) the promise to provide freight and to contract insurance services to its customers. Promise to provide goods: this performance obligation is satisfied when the control of such goods is transferred to the final customer, which is substantially determined based on the Incoterms agreed upon in each of the contracts with customers. Promise to provide freight and contracting insurance services: this performance obligation is satisfied when the freight and insurance services contracted to customers are completed. As a result of the distinct performance obligations identified, part of the Company’s revenues is presented as revenues from services. Cost related to revenues from services is presented as Cost of sales. Revenues from the sale of goods and from freight and contracting insurance services are recognized at a point in time when control is transferred and when contracted services are provided. It is at this point that a trade receivable is recognized because only the passage of time is required before the consideration is due. The Company does not have any contract assets, which give right to consideration in exchange for goods or services that the Company has transferred to the customer, since all rights to consideration of the contracts are unconditional. In 2023, revenues of USD 773,230 are derived from two main customers. These revenues are attributed to both segments, mining and smelting. Contractual obligations are an entity’s obligation to transfer goods or services to a customer for which the entity has received consideration from the customer (or the payment is due) but the transfer has not yet been completed. For contracts where performance obligations are satisfied over a period of time, the stage of completion is required to calculate how much revenue should be recognized to date and revenue shall be deducted from the prepayment to the extent that performance obligations are delivered. Refer to note 29 for the specific accounting policy and information related to NEXA’s contractual obligations. Determining the transaction price and the amounts allocated to performance obligations The Company considers the terms of the contract and its customary business practices to determine the transaction price. The transaction price is the amount of consideration that the Company expects to be entitled to receive in exchange for transferring promised goods or services to its customers. Transaction price is allocated to each performance obligation on a relative standalone selling price basis. Nexa Resources S.A. (Original) Adjustment (Revised) U.S. Dollar 1,362,964 52,028 1,414,992 Real 547,537 — 547,537 Other 2,312 — 2,312 1,912,813 52,028 1,964,841 (Original) Adjustment (Revised) U.S. Dollar 1,294,535 40,343 1,334,878 Real 529,218 — 529,218.0 Other 1,087 — 1,087 1,824,840 40,343 1,865,183 (Original) Adjustment (Revised) Raw materials and consumables used 904,881 52,028 956,909 Employee benefit expenses 233,755 — 233,755 Depreciation and amortization 275,034 — 275,034 Freight costs 68,962 — 68,962 Services, miscellaneous 89,426 — 89,426 Other Expenses 32,967 — 32,967 1,605,025 52,028 1,657,053 Reconciliation Cost of products sold 1,387,073 52,028 1,439,101 Selling expenses 90,647 — 90,647 General and administrative expenses 127,305 — 127,305 1,605,025 52,028 1,657,053 (Original) Adjustment (Revised) Raw materials and consumables used 940,190 40,343 980,533 Employee benefit expenses 202,876 — 202,876 Depreciation and amortization 295,258 — 295,258 Freight costs 73,871 — 73,871 Services, miscellaneous 77,772 — 77,772 Other Expenses 23,838 — 23,838 1,613,805 40,343 1,654,148 Reconciliation Cost of products sold 1,422,947 40,343 1,463,290 Selling expenses 84,559 — 84,559 General and administrative expenses 106,299 — 106,299 1,613,805 40,343 1,654,148 Notes to the consolidated financial statements All amounts in thousands of US dollars, unless otherwise stated The transaction prices included in the Company’s sales contracts are mainly based on international prices references and subject to price adjustments based on the market price at the end of the relevant quotation period stipulated in the sales contract. These are referred to as provisional pricing arrangements which are subject to a monthly price adjustment as per the London Metal Exchange (LME) quotational periods. As of December 31, 2023, the pending price adjustments to be made were not material. Additionally, the Company has a contractual obligation related to a long-term silver streaming arrangement linked to specific production of its Cerro Lindo mine. The Company received an upfront payment in advance of this specific production. The transaction price is linked to the silver production and spot market prices, which change over time and, therefore, it is accounted for as variable consideration. For more details about this streaming transaction see note 29. The geographical areas are determined based on the location of the Company’s customers. The net revenues of the Company, classified by geographical location and currency, are as follows: Nexa Resources S.A. Original - 2016 Mining Smelting Elimination Adjustment Total Revenue from products sold - third parties 417,159 1,491,988 — 3,666 1,912,813 Intersegment revenues 490,266 — (490,266 ) — — Total revenue 907,425 1,491,988 (490,266 ) 3,666 1,912,813 Cost of products sold (513,135 ) (1,260,519 ) 490,266 (103,685 ) (1,387,073 ) Gross Profit 394,290 231,469 — (100,019 ) 525,740 Revised - 2016 Mining Smelting Elimination Adjustment Total Revenue from products sold - third parties 469,187 1,491,988 — 3,666 1,964,841 Intersegment revenues 438,238 — (438,238 ) — — Total revenue 907,425 1,491,988 (438,238 ) 3,666 1,964,841 Cost of products sold (513,135 ) (1,260,519 ) 438,238 (103,685 ) (1,439,101 ) Gross Profit 394,290 231,469 — (100,019 ) 525,740 Original - 2015 Mining Smelting Elimination Adjustment Total Revenue from products sold - third parties 380,320 1,421,307 — 23,213 1,824,840 Intersegment revenues 390,384 — (390,384 ) — — Total revenue 770,704 1,421,307 (390,384 ) 23,213 1,824,840 Cost of products sold (532,097 ) (1,170,545 ) 390,384 (110,689 ) (1,422,947 ) Gross Profit 238,607 250,762 — (87,476 ) 401,893 Revised - 2015 Mining Smelting Elimination Adjustment Total Revenue from products sold - third parties 420,663 1,421,307 — 23,213 1,865,183 Intersegment revenues 350,041 — (350,041 ) — — Total revenue 770,704 1,421,307 (350,041 ) 23,213 1,865,183 Cost of products sold (532,097 ) (1,170,545 ) 350,041 (110,689 ) (1,463,290 ) Gross Profit 238,607 250,762 — (87,476 ) 401,893 Original - 2016 Net revenue from Cost of products Gross profit Brazil 714,946 (473,006 ) 241,940 Peru 1,178,354 (896,940 ) 281,414 Holding 19,513 (17,127 ) 2,386 Total 1,912,813 (1,387,073 ) 525,740 Revised - 2016 Net revenue from Cost of products Gross profit Brazil 714,946 (473,006 ) 241,940 Peru 1,230,382 (948,967 ) 281,415 Holding 19,513 (17,128 ) 2,385 Total 1,964,841 (1,439,101 ) 525,740 Original - 2015 Net revenue from Cost of products Gross profit Brazil 665,573 (460,284 ) 205,289 Peru 1,159,264 (962,663 ) 196,601 Holding 3 — 3 Total 1,824,840 (1,422,947 ) 401,893 Revised - 2015 Net revenue from Cost of products Gross profit Brazil 665,573 (460,284 ) 205,289 Peru 1,199,607 (1,003,006 ) 196,601 Holding 3 — 3 Total 1,865,183 (1,463,290 ) 401,893 Notes to the consolidated financial statements All amounts in thousands of US dollars, unless otherwise stated Accounting policy Cost of sales mainly consists of the cost of manufacturing the products sold by the Company and is recognized in the income statement on the date of delivery to the customer at the same time revenue is recognized from the related sale. Selling, general and administrative expenses are recognized on the accrual basis and, if applicable, in the same period in which the income they are related to is recognized. Mineral exploration and project evaluation Nexa Resources S.A. (Original) (Restated) 2016 Adjustment 2016 Earnings per share in US Dollars 1.37 (0.22 ) 1.15 (Original) (Restated) 2015 Adjustment 2015 Earnings per share in US Dollars (74.60 ) 5.52 (69.08 ) Notes to the consolidated financial statements All amounts in thousands of US dollars, unless otherwise stated (i) As of December 31, 2023, the Company recognized USD 12,455 in Cost of sales related to idle-capacity costs: (a) USD 6,191 in the first quarter in Cerro Lindo, due to the suspension of the mine for almost two weeks caused by unusually heavy rainfall levels and overflowing rivers originated by cyclone Yaku; (b) USD 3,065 in June and July in Atacocha, due to the Unit’s temporary suspension caused by illegal protest activities undertaken by communities (December 31, 2022 was USD 2,197); and, (iii) USD 3,199 in November due to unplanned maintenance in Cajamarquilla. Idle capacity costs are calculated considering the significant reduction in the level of production due to unusual events. (ii) Cost of sales of 2023 includes: (i) a reversal of USD 54,906, including depreciation of USD 14,785 (USD 52,215, including depreciation of USD 16,377 as of December 31, 2022) related to the net realizable value provision of Aripuanã’s inventory, for both its ore stockpile and its produced concentrates, as explained in note 18; and, (ii) USD 77,639, including depreciation of USD 22,024 (USD 15,681, including depreciation of USD 5,911 as of December 31, 2022) related to the idleness of the Aripuanã mine and plant capacity incurred during the ramp-up phase. Accounting policy Mineral exploration and project evaluation costs are expensed in the year in which they are incurred. Mineral exploration activities involve the search for mineral resources from potential areas up to the determination of commercial viability and technical feasibility of an identified resource. Mineral exploration costs include gathering exploration data through geological and geophysical studies, conducting exploratory drilling and sampling, and determining and examining the volume and grade of the identified resources. Nexa Resources S.A. Notes to the consolidated financial statements All amounts in thousands of US dollars, unless otherwise stated Project evaluation costs are mainly related to scoping, pre-feasibility and feasibility studies for greenfield and brownfield projects. Additionally, these evaluation costs could also include costs incurred for studies related to other corporate projects, research, innovation, automation, and information technology projects. Note 22 describes when mineral exploration and project evaluation costs begin to be capitalized. Composition (i) Between December 2021 and December 2023, the Company adhered to a Brazilian Law that states that government grants of the “Imposto sobre circulação de mercadorias e serviços” (“ICMS”) tax incentives are considered investment subsidies and should be excluded from taxable income for the purpose of calculating the Corporate Income Tax and the Social Contribution on Net Income tax. On December 29, 2023 a new law No. 14,789/2023 was published, revoking the treatment for purposes of IRPJ and CSLL of subsidies for investments by creating a new tax credit mechanism. The new rule also provides a limited concept of subsidy of investments only covering VAT benefits aimed to implement or expand an economic enterprise. This new regulation will come into effect in 2024. The Company is still evaluating the impacts of the new Law and legal procedures that should be adopted. (ii) In 2022, the main amounts were related to the idleness of the Aripuanã mine and plant relative to its nameplate capacity, which were recorded in this account until Aripuanã started to generate revenues in November 2022, when the idleness amounts started to be recorded as Cost of sales. (iii) Amounts mainly related to the write-off of some non-commercial account receivables and taxes, which the Company does not expect to recover. (iv) As previously reported throughout 2023, Nexa cooperated with the investigation carried out by the Fiscal Office of the State of Minas Gerais and the Public Ministry of Minas Gerais (the “MG Authorities”) of the practices of certain of Nexa’s former customers with respect to commercial transactions and related value-added tax (VAT), as well as Nexa’s relationship with such former customers. Nexa Resources S.A. 2017 2016 Assets denominated in foreign currency Cash, cash equivalents and financial investments 229,876 154,693 Derivative financial instruments 4,280 10,005 Trade accounts receivable 66,834 45,194 300,990 209,892 Liabilities denominated in foreign currency Loans and financing 161,706 95,124 Derivative financial instruments 3,634 — Trade payables 78,286 61,075 243,626 156,199 Net exposure 57,364 53,693 Notes to the consolidated financial statements All amounts in thousands of US dollars, unless otherwise stated In the third quarter of 2023, Nexa and the MG Authorities reached a resolution (the “Tax Resolution”) whereby, without admitting primary responsibility for the resolved claims, the Company agreed to make tax payments, including interest and penalties, to the State of Minas Gerais on behalf of certain customers that allegedly failed to properly comply with their tax obligations (“tax portion”), and subsequently on October 20, 2023 entered into a related additional agreement (the “Related Agreement”, and together with the Tax Resolution, the “Agreements”) to make a contribution to the State of Minas Gerais to support its ESG-related efforts (“ESG portion”), recognizing a total amount of USD 75,811 in "Other liabilities”, comprised of USD 65,512 as “Other Income and Expenses, net” and USD 10,299 as “Financial Expenses” related to the interest charged in connection with the VAT-related practices of its former customers. In funding this agreement, the Company applied an offset of USD 24,951 of VAT accumulated credits, paid a portion of USD 1,515 in cash up front, offset an amount of USD 6,398 which was classified as a judicial deposit, and will pay the remainder in up to 46 monthly installments, to be adjusted by the SELIC (the Brazilian federal funds rate) interest rate. In addition to the Agreements, on February 8, 2024, a second and final Tax Resolution was filed with the MG Authorities whereby Nexa, without admitting primary responsibility for the resolved claims, agreed to make tax payments on behalf of certain customers, including interest and penalties, to the State of Minas Gerais, recognizing a total amount of USD 27,128 in "Other liabilities”, comprised of USD 21,394 as “Other Income and Expenses, net” and USD 5,734 as “Financial Expenses” related to the interest charged in connection with the VAT-related practices of this former customers. In funding this agreement, the Company will apply an offset of USD 10,796 of VAT accumulated credits, will pay USD 828 in cash up front, and will pay the remainder in up to 59 monthly installments, to be adjusted by the SELIC (the Brazilian federal funds rate) interest rate. This resolution concludes the MG Authorities’ investigation with respect to the Company, and the Company does not expect any further developments or provisions with respect to these matters, although reserves its legal right to recover from certain customers the amounts that it has paid, or will pay, on their behalf in connection with the tax portion of the Agreements. These amounts will only be recognized upon recovery. Accounting policy (i) Financial expenses Financial costs of obligations are recognized as expenses when accrued, except for those directly attributable to the acquisition or the construction of qualifying assets, that is, assets that require a substantial time to be ready for use, which are capitalized at cost within property, plant and equipment and/or intangibles assets to which they relate. (ii) Financial income Financial income is mainly composed of interest income and is recognized on an accrual basis to reflect the asset’s effective yield under the effective interest rate method. (iii) Other financial items, net is composed by the net of the income and expenses related to the fair value of loans and financings, derivative financial instruments, and foreign exchange losses. Nexa Resources S.A. Notes to the consolidated financial statements All amounts in thousands of US dollars, unless otherwise stated Interest accrual on asset retirement and environmental obligations - note 27 (i) The amounts for years 2023 and 2022 are mainly due to (i) exchange variation gain on the outstanding USD accounts receivables and accounts payables of NEXA BR with NEXA in the amount of USD 23,662 and USD 24,010, respectively, and (ii) exchange variation loss of USD 3,863 and USD 331, respectively, mainly related to the intercompany loan of Nexa BR with its related parties which is not eliminated in the consolidation process. The transactions were impacted by the volatility of the Brazilian Real (“BRL”), which appreciated against the USD during 2023. Accounting policy The current income tax is calculated based on the tax laws enacted or substantively enacted as of the balance sheet date in the countries where the Company’s entities operate and generate taxable income. Management periodically evaluates positions taken by the Company in the taxes on income returns with respect to situations in which the applicable tax regulations are subject to interpretation. The Company establishes provisions or records a liability, where appropriate, and when the Company has a present obligation, considering amounts expected to be paid to the tax authorities. The current income tax is presented net, separated by tax paying entity, in liabilities when there are amounts payable, or in assets when the amounts prepaid exceed the total amount due on the reporting date. Deferred income tax is provided in full, using the balance sheet liability method, on temporary differences arising between the tax bases of assets and liabilities and their carrying amounts for financial reporting purposes at the reporting date. However, deferred tax liabilities are not recognized if they arise from the initial recognition of goodwill. Deferred income tax is determined using tax rates (and laws), of the Company’s entities, that have been enacted or substantially enacted at the end of the reporting period and that are expected to be applied when the related deferred income tax asset is realized, or the deferred income tax liability is settled. Nexa Resources S.A. Notes to the consolidated financial statements All amounts in thousands of US dollars, unless otherwise stated Deferred tax assets are recognized only to the extent it is probable that future taxable income will be available against which the temporary deductible differences and/or tax losses can be utilized. Deferred tax assets and liabilities are offset when there is a legally enforceable right and an intention to offset them in the calculation of current taxes, generally when they are related to the same legal entity and the same tax authority. Accordingly, deferred tax assets and liabilities in different entities or in different countries are generally presented separately, and not on a net basis. Deferred tax liabilities and assets are not recognized for temporary differences between the carrying amounts and tax bases of investments in foreign operations where the Company is able to control the timing of the reversal of the temporary differences and it is probable that the differences will not be reversed in the foreseeable future. Current and deferred tax is recognized in profit or loss, except to the extent that it relates to items recognized in other comprehensive income or directly in equity. In this case, the tax is also recognized in other comprehensive income or directly in equity, respectively. Critical accounting estimates, assumptions and judgments The Company is subject to income tax in all countries in which it operates where uncertainties arise in the application of complex tax regulations. Significant estimates, assumptions and judgments are required to determine the amount of deferred tax assets that would be recovered since this amount may be affected by factors including, but not limited to: (i) internal assumptions on the projected taxable income, which are based on production and sales planning, commodity prices, operational costs and planned capital costs; (ii) macroeconomic environment; and (iii) trade and tax scenarios. In addition, there are many transactions and calculations for which the ultimate tax determination is uncertain. The Company also exercises judgment in the identification of these uncertainties over income tax treatments which could impact the consolidated financial statements as the Company operates in a complex multinational environment. The Company and its subsidiaries are subject to reviews of income tax filings and other tax payments, and disputes can arise with the tax authorities over the interpretation of the applicable laws and regulations. Tax effects of translation of non-monetary assets/liabilities to functional currency (i) VAT expense related to the tax voluntary disclosure (refer to note 9) is not deductible for income tax purposes and, consequently, Nexa did not recognize a deferred tax asset. (ii) On December 31, 2023 Nexa has not recognized deferred tax on net operating losses over a taxable basis of USD 154,261 (2022: USD 211,780), after an assessment made by management considering the future recoverability of these net operating losses. As of December 31, 2023 the Company has an estimated accumulated amount of USD 861,295 not recognized as deferred taxes on net operating losses. Of the total amount of unused tax losses, USD 86 have an expiration limit of 5 years, USD 481,342 of 17 years, USD 15,695 of 20 years, and USD 364,172 can be carried forward indefinitely. Less than 1 Between 1 and Between 3 and Over 5 years Total At December 31, 2017 Loans and financing 102,294 373,324 236,927 1,228,474 1,941,018 Derivative financial instruments 12,588 2,449 — — 15,037 Trade payables 329,814 — — — 329,814 Confirming payable 111,024 — — — 111,024 Salaries and payroll charges 79,798 — — — 79,798 Dividends payable 4,138 — — — 4,138 Related parties 87,686 2,238 — — 89,924 Provisions - Asset Retirement Obligation 7,526 53,429 33,186 237,788 331,929 Use of public assets 1,740 3,755 4,233 45,309 55,037 736,607 435,195 274,346 1,511,571 2,957,719 At December 31, 2016 Loans and financing 104,191 438,569 432,587 375,480 1,350,827 Derivative financial instruments 37,458 — — — 37,458 Trade payables 282,241 — — — 282,241 Confirming payable 102,287 — — — 102,287 Salaries and payroll charges 70,022 — — — 70,022 Dividends payable 7,185 — — — 7,185 Related parties 222,917 7,596 — — 230,513 Provisions - Asset Retirement Obligation 33,143 25,296 35,813 123,827 218,079 Use of public assets 1,754 3,832 4,319 51,449 61,354 861,198 475,293 472,719 550,756 2,359,966 Notes to the consolidated financial statements All amounts in thousands of US dollars, unless otherwise stated (b)Analysis of deferred income tax assets and liabilities There are discussions and ongoing disputes with tax authorities related to uncertain tax positions adopted by the Company in the calculation of its income tax, and for which management, supported by its legal counsel, has concluded that it is more-likely-than-not that its positions will be sustained upon examination. As of December 31, 2023, the main legal proceedings are related to: (i) the interpretation of the application of the Cerro Lindo´s stability agreement; and (ii) litigation of transfer pricing adjustments over transactions made with related parties. The estimated amount of these contingent liabilities on December 31, 2023, is USD 478,329 which increased compared to that estimated on December 31, 2022, of USD 349,322, mainly due to the new tax assessment of Cerro Lindo Stability Agreements for 2017 and the change of the risk evaluation from remote to possible of some expenses deductions, in view of the evaluation made by internal and external advisors. In such cases, tax provisions are not recognized. Nexa Resources S.A. At and for the year ended on December 31, 2023 All amounts in thousands of US dollars, unless otherwise stated Regarding Cerro Lindo´s stability agreement, the Peruvian tax authority (hereinafter SUNAT) issued unfavorable decisions against the Company for the years 2014, 2015, 2016 and 2017, arguing that the stability income tax rate granted by the stability agreement applies only to the income generated from 5,000 tons per day of its production, and not from its entire production capacity expanded over time. The Company has filed strong appeals against these decisions. SUNAT is currently auditing 2018 and 2019, while the years 2020 and 2021 (when the term of the stability agreement expires) remain open. Although SUNAT maintains its position disregarding the stabilized rate and taxing the Company’s total income at the statutory income tax rate for these years, the Company continues to maintain its position in relation to the applicability of the Cerro Lindo stability agreement. The Company’s Management, supported by the opinion of its external advisors, continues to conclude that there are legal grounds to obtain a favorable outcome in these matters related to the tax stability rate discussion. However, the Company may have to pay the disputed amounts under discussion to continue the legal process either in the judicial or international arbitration levels. Such payments may be made in several installments provided that a guarantee is placed before the courts and may impact the Company’s results. Note 2017 2016 2015 Loans and financing 16 1,447,299 1,144,385 1,056,210 Cash and cash equivalents 8 (1,019,037 ) (915,576 ) (621,415 ) Derivative financial instruments 5.4 3,260 16,718 (10,105 ) Financial investments 9 (206,547 ) (119,498 ) (57,856 ) Net debt (A) 224,975 126,029 366,834 Profit for the year 165,265 110,509 (139,796 ) Plus (less): Results of investees (60 ) 158 256 Results of investees - Discontinued operations — — 318 Depreciation and amortization 14 and 15 270,454 275,034 295,258 Net financial results 29 130,181 (79,081 ) 341,931 Taxes on income 20(a) 106,194 98,383 (38,779 ) EBITDA 672,034 405,003 459,188 Exceptional items Gains on sales of investments 28 (4,588 ) (408 ) — Impairment of other assets 73 308 — (Reversal) Impairment - property, plant, equipment 28 — (979 ) 8,574 Adjusted EBITDA (B) 667,519 403,924 467,762 Gearing ratio (A/B) 0.34 0.31 0.78 NEXA is within the scope of the OECD Pillar Two model rules which establish a new global minimum tax framework of 15% minimum tax. Pillar Two legislation was enacted in Luxembourg and will come into effect for financial year beginning 1 January 2024, however, no legislation regarding Pillar Two was enacted in Peru and Brazil yet. The Company has performed an assessment of the group’s potential exposure to Pillar Two income taxes by running initial testing under the OECD transitional safe harbor rules based on the most recent information available of tax filings, country-by-country reporting and financial statements for the constituent entities in the group. Based on the assessment performed, the jurisdictions where the Company operates should qualify for one of the transitional safe harbor rules and management is not currently aware of any circumstances under which this might change. Therefore, the Company does not expect a potential exposure to Pillar Two top-up tax. Financial risk factors The Company’s activities expose it to a variety of financial risks: a) market risk (including currency risk, interest rate risk and commodities risk); b) credit risk; and c) liquidity risk. A significant portion of the products sold by the Company are commodities, with prices pegged to international indices and denominated in USD. Part of the production costs, however, is denominated in BRL and Peruvian Soles (“PEN”), and therefore, there is a mismatch of currencies between revenues and costs. Additionally, the Company has debts linked to different indices and currencies, which may impact its cash flows. In order to mitigate the potential adverse effects of each financial risk factor, the Company follows a Financial Risk Management Policy that establishes governance and guidelines for the financial risk management process, as well as metrics for measurement and monitoring. This policy establishes guidelines and rules for: (i) Commodities Exposure Management, (ii) Foreign Exchange Exposure Management, (iii) Interest Rate Exposure Management, (iv) Issuers and Counterparties Risk Management, and (v) Liquidity and Financial Indebtedness Management. All strategies and proposals must comply with the Financial Risk Management Policy guidelines and rules, be presented to and discussed with the Finance Committee of the Board of Directors, and, when applicable, submitted for the approval of the Board of Directors, under the governance structure described in such Policy. The purpose of the market risk management process and all related actions are intended to protect the Company’s cash flows against adverse events, such as changes in foreign exchange rates, interest rates and commodity prices, to maintain the ability to pay financial obligations, and to comply with liquidity and indebtedness levels defined by management. Nexa Resources S.A. At and for the year ended on December 31, 2023 All amounts in thousands of US dollars, unless otherwise stated Presented below is a sensitivity analysis of the main risk factors that affect the pricing of the outstanding financial instruments related to cash and cash equivalents, financial investments, loans and financings, and other financial instruments. The main sensitivities are the exposure to changes in the USD exchange rate, the Interbank Deposit Certificate (“CDI”) interest rates, the National Broad Consumer Price Index (“IPCA”) and the commodity prices. The scenarios for these factors are prepared using market sources and other relevant sources, in compliance with the Company's policies. The scenarios on December 31, 2023 are described below: Nexa Resources S.A. Cash and cash Financial Derivative financial Loans and financing Net debt Net debt as at 1 January 2017 (915,576 ) (119,498 ) 16,718 1,144,385 126,029 Cash flows (103,413 ) (65,661 ) 39,006 236,306 106,238 Foreign exchange ajustments (48 ) — — (2,873 ) (2,921 ) Other non-cash movements — (21,388 ) (52,464 ) 69,481 (4,371 ) Net debt as at 31 December 2017 (1,019,037 ) (206,547 ) 3,260 1,447,299 224,975 Notes to the consolidated financial statements At and for the year ended on December 31, 2023 All amounts in thousands of US dollars, unless otherwise stated Foreign exchange risk is managed through the Company’s Financial Risk Management Policy, which states that the objectives of derivative transactions are to reduce cash flow volatility, hedge against foreign exchange exposure and minimize currency mismatches. Presented below are the financial assets and liabilities in foreign currencies on December 31, 2023. These mainly result from NEXA BR’s operations, for which the functional currency is the BRL. Intercompany loans balances are fully eliminated in the consolidated financial statements. However, the related foreign exchange gain or loss is not, and is presented as foreign exchange effects. The Company's interest rate risk arises mainly from long-term loans. Loans at variable rates expose the Company to cash flow interest rate risk. Loans at fixed rates expose the Company to fair value risk associated with interest rates. For further information related to interest rates, refer to note 24. The Company’s Financial Risk Management Policy establishes guidelines and rules to hedge against changes in interest rates that impact the Company’s cash flows. Exposure to each interest rate is projected until the maturity of the assets and liabilities exposed to this index. Occasionally the Company enters into floating to fixed interest rate swaps to manage its cash flow interest rate risk. In the case of loans and financings contracted together with swaps, the Company accounts for them under the fair value option to eliminate the accounting mismatch that would arise if amortized cost were used. The commodity price risk is related to the volatility in the prices of the Company's commodities. Prices fluctuate depending on demand, production capacity, inventory levels, commercial strategies adopted by large producers, and the availability of substitutes for these products in the global market. The Company’s Financial Risk Management Policy establishes guidelines to mitigate the risk of fluctuations in commodity prices that could impact the Company's cash flows. The exposure to the price of each commodity considers the monthly production projections, inputs purchases and the maturity flows of hedges associated with them. Commodity prices hedge transactions are classified into the following hedging strategies: Hedges for sales of zinc at a fixed price (Customer Hedge) The objective is to convert fixed priced sales to floating prices, observed on the London Metal Exchange (LME). The purpose of the strategy is to maintain the revenues of a business unit linked to the LME prices. These transactions usually relate to purchases of zinc for future settlement on the over-the-counter market. Nexa Resources S.A. Notes to the consolidated financial statements At and for the year ended on December 31, 2023 All amounts in thousands of US dollars, unless otherwise stated Hedges for mismatches of quotational periods (Hedge Book) The objective is to hedge quotational periods mismatches arising between the purchases of metal concentrate or processed metal and the sale of the processed metal. These transactions usually relate to purchases and sales of zinc for future trading on the over-the-counter market. Trade receivables, derivative financial instruments, term deposits, bank deposit certificates ("CDBs") and government securities create exposure to credit risk with respect to the counterparties and issuers. The Company has a policy of making deposits in financial institutions that have, at least, a rating from two of the following international rating agencies: Fitch, Moody’s or Standard & Poor’s. The minimum rating required for counterparties is determined as follows: - Onshore operations: rating "A", or equivalent, on a local scale by two rating agencies. In the case of foreign financial institutions that have a local rating by only one rating agency, it should be at least "AA-", and its headquarters should have a rating "A" minimum on a global scale. - Offshore operations: rating "BBB-", or equivalent, on a global scale by two rating agencies. In the case of financial institutions in Peru or in Luxembourg, local ratings from local agencies associated with rating agencies approved in the Company’s policy are accepted. In case that only a global rating is available, it will be eligible provided that it has a rating "BBB-" at least by one rating agency. In the case of financial institutions that do not have a rating available for a specific country, it will be eligible provided that its headquarters follow the minimum ratings specified above. The pre-settlement risk methodology is used to assess counterparty risks in derivative transactions. This methodology consists of determining the risk associated with the likelihood (via Monte Carlo simulations) of a counterparty defaulting on the financial commitments defined by contract. The global ratings were obtained from the rating agencies Fitch, Moody’s or Standard & Poor’s ratings and are related to commitments in foreign or local currency and, in both cases, they assess the capacity to honor these commitments, using a scale applicable on a global basis. Therefore, both ratings in foreign currency and in local currency are internationally comparable ratings. The ratings used by the Company are always the most conservative ratings of the referred agencies. In the case of credit risk arising from customer credit exposure, the Company assesses the credit quality of the customer, considering mainly the history of the relationship and financial indicators defining individual credit limits, which are continuously monitored. The Company performs initial analyses of customer credit and, when deemed necessary, guarantees or letters of credit are obtained to mitigate the credit risk. Additionally, most sales to the United States of America, Europe and Asia are collateralized by letters of credit and credit insurance. The carrying amount of the Company’s financial instruments best represents the maximum exposure to their credit risk. The following table reflects the credit quality of issuers and counterparties for transactions involving cash and cash equivalents, financial investments and derivative financial instruments. The variations presented are mainly related to the Company's transactions in the year and not to changes in the counterparties’ ratings. Notes to the consolidated financial statements At and for the year ended on December 31, 2023 All amounts in thousands of US dollars, unless otherwise stated (i) Refers to subsidiaries of international financial institutions that do not have a global rating available in the international rating agencies. According to the Company's policy, for these financial institutions, the rating of the financial institution controlling entities is assumed, which must be at least BBB-. Liquidity risk is managed through the Company's Financial Risk Management Policy, which aims to ensure the availability of funds to meet the Company’s financial obligations. The main liquidity measurement and monitoring instrument is the cash flow projection, using a minimum projection period of 12 months from the benchmark date. Financial institutions that provide the Company with financial services are within Nexa’s rating policies and in the same level of the ones provided for the Company’s credit risk. A substantial part of the confirming payables arrangement is with one financial institution. However, there are other financial institutions that the Company has relations with that could be considered for future supplier financing transactions. If this service is not available, the entity may be required to increase its debt levels which may negatively impact its leverage ratios. The table below shows the Company's financial obligations to be settled by the Company based on their maturity (the remaining period from the balance sheet up to the contractual maturity date). The amounts below represent the estimated undiscounted future cash flows, which include interests to be incurred and, accordingly, do not reconcile directly with the amounts presented in the consolidated balance sheet. Nexa Resources S.A. Notes to the consolidated financial statements At and for the year ended on December 31, 2023 All amounts in thousands of US dollars, unless otherwise stated The Company’s objectives when managing capital are to safeguard its ability to continue as a going concern, so it can continue to provide returns for shareholders and benefits for other stakeholders; and to maintain an optimal capital structure to reduce the cost of capital. To maintain or adjust the capital structure, the Company may adjust the dividends level paid to shareholders, return capital to shareholders, issue new shares or sell assets to reduce debt. The Company monitors capital mainly using the leverage ratio, calculated as net debt to Adjusted EBITDA. Net debt and Adjusted EBITDA measures should not be considered in isolation or as a substitute for net income or operating income, as indicators of operating performance, or as alternatives to cash flow as measures of liquidity. Additionally, management’s calculation of Adjusted EBITDA may be different from the calculation used by other companies, including competitors in the mining and smelting industry, so these measures may not be comparable to those of other companies. (i) Net debt is defined as (a) loans and financings, plus lease liabilities, plus or minus (b) the fair value of derivative financial instruments, less (c) cash and cash equivalents, less (d) financial investments. (ii) Adjusted EBITDA for capital management calculation uses the same assumptions described in note 2 for Adjusted EBITDA by segment. Nexa Resources S.A. Notes to the consolidated financial statements At and for the year ended on December 31, 2023 All amounts in thousands of US dollars, unless otherwise stated Accounting policy Normal purchases and sales of financial assets are recognized on the trade date – the date on which the Company commits to purchase or sell the asset. Financial assets are initially recognized at fair value plus transaction costs for all financial assets not carried at fair value through profit or loss. Financial assets carried at fair value through profit or loss, if any, are initially recognized at fair value, and transaction costs are expensed in the income statement. Financial assets are derecognized when the rights to receive cash flows from the investments have expired or the Company has transferred substantially all the risks and rewards of ownership. Financial assets at fair value through profit or loss and at fair value through other comprehensive income are subsequently carried at fair value. Financial assets at amortized costs are subsequently measured using the effective interest rate method. Equity instruments may be irrevocably elected on their initial recognition for their fair value changes to be presented in other comprehensive income instead of in the income statement. Since the objective of the Company’s equity instruments is to buy more participation in a project and not sell the investment, they have been classified as fair value through other comprehensive income. Then, the Company classifies its financial assets and liabilities under the following categories: amortized cost, fair value through profit or loss and fair value through other comprehensive income. Financial assets measured at amortized cost are assets held within a business model whose objective is to hold financial assets to collect contractual cash flows and for which the contractual terms of the financial asset give rise on specified dates to cash flows that are solely payments of principal and interest (“SPPI”) on the principal amount outstanding. Financial liabilities are measured at amortized cost, except for financial liabilities at fair value through profit or loss such as derivatives and some specific loans and financings. Financial assets measured at fair value through profit or loss are assets which an entity manages with the objective of realizing cash flows through the sale of such assets and financial assets that do not give rise to cash flows that are SPPI on the principal amount outstanding. Financial liabilities measured at fair value through profit or loss are liabilities which were not measured at amortized cost, such as derivatives and loans and financings that are designated at fair value option when is necessary to eliminate the accounting mismatch that would arise if amortized cost were used. For these loans and financings, the portion of the variation in credit risk is recorded in the OCI. Nexa Resources S.A. Notes to the consolidated financial statements At and for the year ended on December 31, 2023 All amounts in thousands of US dollars, unless otherwise stated Financial assets measured at fair value through other comprehensive income are held within a business model whose objective is achieved by both collecting contractual cash flows and selling financial assets and for which the contractual terms of the financial asset give rise on specified dates to cash flows that are SPPI on the principal amount outstanding. Investments in equity instruments are measured at fair value through other comprehensive income as mentioned before. The Company’s financial assets and liabilities are classified as follows: (i) Classified as Other assets in the consolidated balance sheet. (ii) Classified as Other liabilities in the consolidated balance sheet. Nexa Resources S.A. Notes to the consolidated financial statements At and for the year ended on December 31, 2023 All amounts in thousands of US dollars, unless otherwise stated Critical accounting estimates, assumptions and judgments The fair value of financial instruments that are not traded in an active market is determined using valuation techniques. The Company uses judgment to select among a variety of methods and makes estimates and assumptions that are mainly based on market conditions existing at the end of each reporting period. Although management has used its best judgment in estimating the fair value of its financial instruments, any technique for making said estimates and assumptions involves some level of inherent fragility. The main financial instruments and the estimates and assumptions made by the Company for their valuation are described below: fair value. terms and adjusted for the Company’s credit risk. Loans and financings are measured at amortized cost, except for certain contracts for which the Company has elected the fair value option. Nexa Resources S.A. 2017 Fair value measured based on Price quoted in Valuation Note Level 1 Level 2 Total fair value Assets Cash and cash equivalents 8 1,019,037 — 1,019,037 Financial investments 9 134,168 72,379 206,547 Derivative financial instruments 5.4 — 11,777 11,777 1,153,205 84,156 1,237,361 Liabilities Loans and financing 16(a) 1,120,901 414,231 1,535,132 Derivative financial instruments 5.4 — 15,037 15,037 1,120,901 429,268 1,550,169 2016 Fair value measured based on Price quoted in Valuation Note Level 1 Level 2 Total fair value Assets Cash and cash equivalents 8 915,576 — 915,576 Financial investments 9 65,964 53,534 119,498 Derivative financial instruments 5.4 — 20,740 20,740 981,540 74,274 1,055,814 Liabilities Loans and financing 16(a) 342,156 808,729 1,150,885 Derivative financial instruments 5.4 — 37,458 37,458 342,156 846,187 1,188,343 Notes to the consolidated financial statements All amounts in thousands of US dollars, unless otherwise stated (i) To determine the fair value of the investments in equity instruments, the Company uses the share’s quotation as of the last day of the reporting period. (ii) Loans and financings are measured at amortized cost, except for certain contracts for which the Company has elected the fair value option. The Company discloses fair value measurements based on their level on the following fair value measurement hierarchy: Level 1: When fair value is calculated with quoted prices (unadjusted) in active markets for identical assets and liabilities traded in active markets at the balance sheet date. A market is regarded as active if quoted prices are readily and regularly available from an exchange, dealer, broker, industry group, pricing service, or regulatory agency, and those prices represent actual and regularly occurring market transactions on an arm’s length basis. The quoted market price used for financial assets held by the Company is the current bid price. Level 2: When fair value is calculated with valuation techniques since the financial instruments are not traded in an active market and all of the significant inputs required to identify the fair value of an instrument are observable. Specific valuation techniques used to value financial instruments include: and Other techniques, such as discounted cash flows analysis, are used to determine the fair value of the remaining financial instruments. Nexa Resources S.A. Notes to the consolidated financial statements All amounts in thousands of US dollars, unless otherwise stated Level 3: When fair value is calculated with inputs for the asset or liability that are not based on observable market data (that is, unobservable inputs). As of December 31, 2023, there were no financial assets and liabilities carried at fair value classified as Level 3. In 2021, the Company acquired 9.0% of the issued and outstanding common shares of Tinka Resources Limited (“Tinka”), an exploration and development company which holds 100% of the Ayawilca zinc-silver project in Peru. On May 31, 2022, the Company subscribed to an additional common shares in a private transaction at a price of CAD 0.22 per share (approximately USD ) for a total consideration of CAD 8,974 thousand (USD 7,000). After this subscription, the Company holds 18.23% of the issued and outstanding common shares of Tinka. Similar to the original acquisitions made in 2021, this transaction has been accounted for as an investment in equity instruments at its acquisition cost and all are being subsequently measured at fair value through other comprehensive income. Accounting policy Cash and cash equivalents include cash, bank deposits, and highly liquid short-term investments (investments with an original maturity less than 90 days), which are readily convertible into a known amount of cash and subject to an immaterial risk of changes in value. Bank overdrafts are shown within Loans and financings in current liabilities in the balance sheet. Accounting policy Derivatives are initially recognized at fair value as at the date on which a derivative contract is entered into and are subsequently measured at fair value. Derivatives are only used for risk mitigation purposes and not as speculative investments. When derivatives do not meet the hedge accounting criteria, they are classified as held for trading and accounted for at fair value through profit or loss. For derivatives that meet the hedge accounting criteria, the Company documents at the inception of the hedging transaction the relationship between hedging instruments and hedged items, as well as its risk management objectives and strategy for undertaking the hedge transactions. The Company also documents its assessment, both at hedge inception and on an ongoing basis, whether the derivatives that are used in hedging transactions and accounted for as hedge accounting were, and will continue to be, highly effective in offsetting changes in the fair value or cash flow of hedged items. Derivatives that are designated for hedge accounting recognition are qualified as cash flow hedges when they are related to a highly probable forecasted transaction. The effective portion of the changes in fair value is recognized in shareholders’ equity in Accumulated other comprehensive income and is subsequently reclassified to the income statement in the same period when the hedged expected cash flows affect the income statement. The reclassification adjustment is recognized in the same income statement line item affected by the highly probable forecasted transaction, while gains or losses related to the non-effective portion are immediately recognized as “Other income and expenses, net”. Nexa Resources S.A. Notes to the consolidated financial statements All amounts in thousands of US dollars, unless otherwise stated When a hedging instrument expires, is sold or no longer meets the criteria for hedge accounting, any cumulative gain or loss existing in shareholders’ equity at that time remains in shareholders’ equity and is recognized when the forecast transaction is ultimately recognized in the income statement. When a forecasted transaction is no longer expected to occur, the cumulative gain or loss that was previously accounted in shareholders’ equity is immediately transferred to the income statement within Other income and expenses, net. Currently, the Company classifies as cash flow hedge only some strategies related to mismatches of quotational periods. Derivatives that are designated for hedge accounting recognition are qualified as fair value hedges when they are related to assets or liabilities already recognized in the consolidated balance sheet. Changes in the fair values of derivatives that are designated and qualify as fair value hedges and changes in the fair value of the hedged item are recorded in the income statement in the same period. Currently, the Company does not have any derivatives designated as fair value hedge. Changes in the fair value of derivative financial instruments not designated as hedge accounting are recognized in the income statement in the line affected by the related transaction. The Company through its energy subsidiaries is an energy self-producer and authorized to sell energy both in the free and regulated markets as Energy Traders. A portion of these transactions involve contracts for delivery of energy for internal use to meet production demands and are not therefore classified as financial instruments. Another portion of these transactions consists of sales of energy not used in production process. These transactions take place in an active market meet the definition of financial instruments, because they are settled in energy and readily convertible into cash. Such contracts are recorded as derivatives and are recognized in the Company's statement of balance sheet at fair value on the date on which the derivative is entered, and subsequently revalued at their fair values at the reporting date. The fair value recognition and realization of these financial instruments are recorded under “Other income and expenses, net”. The fair values of these derivatives are estimated partly based on price quotes in active markets, as long as such market data exists, and partly through the use of valuation techniques, which consider: (i) prices established in the purchase and sale operations; (ii) the risk margin on the supply; and (iii) the projected market price during the period of availability. Whenever the fair value upon initial recognition for these contracts differs from the transaction price, a loss or gain on the fair value is recognized in the profit or loss for the year. The transactions carried out by the company Pollarix S.A. in the Free Contracting Environment (“ACL”) led to a loss from the sale of surplus energy, which was recognized at its fair value on the transaction date. On January 25, 2022, the Company signed an offtake agreement with an international offtaker (the “Offtaker”) a subsidiary of a BBB rated company, in which it agreed to sell 100% of the copper concentrate to be produced by Aripuanã for a 5-year period starting in February 2023 up to a total of 30,810 tons, at the lower of current spot market prices or a price cap. Nexa Resources S.A. Notes to the consolidated financial statements All amounts in thousands of US dollars, unless otherwise stated The offtake agreement resulted from negotiations with the Offtaker to sell the copper concentrate in lieu of paying future royalties related to the previous acquisition of the Aripuanã project mining rights from the Offtaker. The amount of USD 46,100, representing the fair value of the agreement at its inception date, was recognized as an intangible asset and will be amortized over the life of the mine according to the Units of Production (“UoP”) method. Additionally, the Company opted to voluntarily and irrevocably designate the entire offtake agreement at fair value through profit and loss within the scope of IFRS 9, rather than separate the value of the embedded derivative associated with the price cap, recognizing a non-cash accumulated gain of USD 2,268 in the income statement for year ended on December 31, 2023. (i) On December 31, 2023, due to the current scenario of high energy supply in Brazil, the Company has a projected energy surplus on forward contracts with some suppliers. Consequently, the Company recognized the fair value arising from the mark-to-market of current purchase until 2026, which resulted in an expense in the amount of USD 15,663. This amount was accounted for as a loss within “Other income and expenses, net” (Note 9) and will vary according to the market’s energy prices. Nexa Resources S.A. Principal Average Fair value Realized gain Fair value by maturity Program 2017 2016 per unit (days) 2017 2016 2017 2018 2019 2020 Hedging instrument for sales of zinc at a fixed price Zinc forward 2,230 615 ton 127 603 369 1,288 589 14 — 603 369 1,288 589 14 — Hedging instrument for mismatches of quotation periods Zinc forward 240,747 146,515 ton 23 (4,304 ) 4,471 (2,183 ) (4,304 ) — — Silver forward 238 — k oz 17 196 — (24 ) 196 — — (4,108 ) 4,471 (2,207 ) (4,108 ) — — Hedging instrument for the operating margin of metals Zinc forward — 10,790 — — — (7,110 ) — — — — US Dollar forward — 8,039 — — — 1,784 — — — — — (5,326 ) — — — — Hedging instrument for interest rates in US Dollar LIBOR floating rate vs. US Dollar fixed rate swaps 31,393 — USD 849 646 — (1,200 ) (1,186 ) (1,543 ) 3,375 646 — (1,200 ) (1,186 ) (1,543 ) 3,375 Total (assets and liabilities, net) (2,859 ) (486 ) (2,119 ) (4,705 ) (1,529 ) 3,375 Principal Average Fair value Realized gain Fair value Program 2017 2016 per unit (days) 2017 2016 2017 2018 Hedging instruments for mismatches of quotation periods - Fair value Zinc forward 87,693 22,390 ton 43 (3,319 ) 32 (12,310 ) (3,319 ) (3,319 ) 32 (12,310 ) (3,319 ) Hedging instruments for mismatches of quotation periods - Cash flow Zinc forward 58,800 43,294 ton 47 2,986 (1,728 ) 4,450 2,986 Silver forward 265 — k oz 58 (68 ) — (94 ) (68 ) 2,918 (1,728 ) 4,356 2,918 Hedge accounting - Cash flow hedge Zinc forward — 94,559 — — — (22,967 ) (43,898 ) — Copper forward — 540 — — — 210 (171 ) — US Dollar forward — 93,467 — — — 8,221 15,134 — — (14,536 ) (28,935 ) — (401 ) (16,232 ) (36,889 ) (401 ) Current assets 7,483 20,740 Non-current assets 4,294 — Current liabilities (12,588 ) (37,458 ) Non-current liabilities (2,449 ) — (3,260 ) (16,718 ) Notes to the consolidated financial statements All amounts in thousands of US dollars, unless otherwise stated (i) On January 25, 2022, the Company signed an offtake agreement with an Offtaker to sell 100% of the copper concentrate produced by Aripuanã for a 5-year period, up to a specified volume, at the lower of current market prices or a price cap. In June 2023, the Company began with the deliveries of copper concentrates in relation to the offtake agreement mentioned above. In 2023, when the sales occurred the copper price was lower than the price cap, and therefore, there was no fair value impact on revenues for these deliveries. Accounting policy Trade accounts receivables are amounts due from customers for goods sold or services provided in the ordinary course of the Company’s business. Trade accounts receivables are recognized initially at fair value and subsequently measured at: (i) Fair value through profit or loss when are related to the Company’s accounts receivables portfolio outstanding at the balance sheet date that is designated at inception to be included in a forfaiting program whereby the Company, at its discretion, can discount certain outstanding trade accounts receivables and receive payments in advance. The program is used to meet short-term liquidity needs. Trade accounts receivables within this program are derecognized since all risks and rewards, control of the assets and contractual rights to receive the assets cash flows are transferred to the counterparty. (ii) Fair value through profit or loss when are related to sales that are subsequently adjusted to changes in LME prices, which is recorded on net revenues. These accounts receivable do not meet the SPPI criteria because there is a component of commodity price risk that modifies the cash flows that otherwise would be required by the sales contract. (iii) Amortized cost using the effective interest rate method, less impairment, when the receivables do not meet the aforementioned classifications. Credit risk can arise from non-performance by counterparties of their contractual obligations to the Company. To ensure an effective credit risk evaluation, management applies procedures related to the application for credit granting and approvals, renewal of credit limits, continuous monitoring of credit exposure in relation to established limits and events that trigger requirements for secured payment terms. As part of the Company’s process, the credit exposures with all counterparties are regularly monitored and assessed. The Company applies the IFRS 9 simplified approach to measure the impairment losses for trade accounts receivables. This approach requires the use of the lifetime expected credit losses on its trade accounts receivables measured at amortized cost. To calculate the lifetime expected credit losses the Company uses a provision matrix and forward-looking information. The additions to impairment of trade accounts receivables are included in selling expenses. Trade accounts receivables are generally written off when there is no expectation of recovering additional cash. Nexa Resources S.A. Impacts on profit (loss) Impacts on comprehensive income Scenario I Scenarios II e III Scenario I Scenarios II e III Risk factor Cash and cash Loans and Principal of Unit Changes Results of -25% -50% +25% +50% Results of -25% -50% +25% +50% Exchange variation rate USD 11,339 40,274 31,393 USD -3.81 % (153 ) (3,328 ) (17,218 ) (897 ) (3,906 ) — — — — — BRL 203,392 161,706 — — 3.97 % — — — — — 6,127 53,441 156,447 (28,963 ) (49,564 ) EUR 1,692 — — EUR -1.66 % (28 ) (423 ) (846 ) 423 846 — — — — — PEN 22,830 — — PEN 0.68 % 155 (5,707 ) (11,415 ) 5,707 11,415 — — — — — Interest rates BRL - CDI 202,311 70,720 103,849 BRL 0 bps — (2,029 ) (4,044 ) 2,043 4,098 USD - LIBOR — 130,610 1,282,900 USD -2 bps 14 217 435 (217 ) (435 ) (0 ) (6 ) (12 ) 6 12 US Dollar coupon — — 31,393 USD 3 bps (21 ) 515 1,047 (499 ) (981 ) — — — — — Price - commodities Zinc — — 389,470 ton -2.90 % 13,073 51,744 103,488 (51,744 ) (103,488 ) (580 ) (2,297 ) (4,594 ) 2,297 4,594 Silver — — 503 k oz 5.20 % (9 ) 281 562 (281 ) (562 ) (36 ) 1,124 2,248 (1,124 ) (2,248 ) Notes to the consolidated financial statements All amounts in thousands of US dollars, unless otherwise stated Accounting policy Inventory is stated at the lower of cost and net realizable value. Cost is determined using the weighted average cost method. The cost of finished goods and work in progress comprises raw materials, direct labor, other direct costs and related fixed production overheads (based on normal operating capacity). The normal operating capacity is supported by the historical annual production. The idle capacity cost is calculated considering the reduction in the level of production due to unusual events and the level of production not achieved in the ramp-up period. Variable production overhead costs are included in inventory costs based on the actual production level. Imports in transit are stated at the accumulated cost of each import. At the end of the reporting period, the net realizable value of inventories is assessed and a provision for non-realizable, losses on obsolete or slow-moving inventory may be recognized. The provision for net realizable value is estimated considering the current selling price in the ordinary course of business, less any additional selling expenses. The write-downs and reversals are recognized within Cost of sales. Nexa Resources S.A. Notes to the consolidated financial statements All amounts in thousands of US dollars, unless otherwise stated A provision for obsolete inventory, finished products, semi-finished products, raw materials and auxiliary materials is recognized when items cannot be used in normal production or sold because they are damaged or do not meet the Company’s specification and is recognized as Other income and expenses. Slow-moving provision is recognized for inventory items that are in excess of the expected normal use or sale. The amount of slow-moving provision recognized is determined based on 20% of the carrying amount for each six-month period without use or sale and is recognized as Other income and expenses. The main amount is related to the reversal of the net realizable value provision of Aripuanã’s inventory for both its ore stockpile and its produced concentrates in the total amount of USD 54,906 (including depreciation of USD 14,785) as of December 31, 2023. (i) Other recoverable taxes is composed mainly from tax credits related to ICMS (Tax on Circulation of Goods and Services), primarily generated from purchases. Additionally, there are PIS and COFINS credits, essentially arising from credits on the acquisition of fixed assets. The Company’s related parties are subsidiaries, joint ventures, associates, shareholders and its related entities and key management personnel of the Company. Nexa Resources S.A. 2017 Assets per balance sheet Note Loans and Assets held for Held-to- Derivatives Total Cash and cash equivalents 8 1,019,037 — — — 1,019,037 Financial investments 9 — 206,547 — — 206,547 Derivative financial instruments 5.4 — 8,811 — 2,966 11,777 Trade accounts receivable 10 182,713 — — — 182,713 Related parties 13 738 — — — 738 1,202,488 215,358 — 2,966 1,420,812 2017 Liabilities per balance sheet Note Liabilities at Derivatives Other financial Total Loans and financing 16 — — 1,447,299 1,447,299 Derivative financial instruments 5.4 12,842 2,195 — 15,037 Trade payables — — 329,814 329,814 Confirming payable 17 — — 111,024 111,024 Use of public assets 22 — — 24,309 24,309 Related parties 13 — — 89,924 89,924 12,842 2,195 2,002,370 2,017,407 2016 Assets per balance sheet Note Loans and Assets held for Held-to- Derivatives Total Cash and cash equivalents 8 915,576 — — — 915,576 Financial investments 9 — 119,498 — — 119,498 Derivative financial instruments 5.4 — 6,649 — 14,091 20,740 Trade accounts receivable 10 120,062 — — — 120,062 Related parties 13 400,798 — — — 400,798 1,436,436 126,147 — 14,091 1,576,674 2016 Liabilities per balance sheet Note Liabilities at Derivatives Other financial Total Loans and financing 16 — — 1,144,385 1,144,385 Derivative financial instruments 5.4 2,564 34,894 — 37,458 Trade payables — — 282,241 282,241 Confirming payable 17 — — 102,287 102,287 Use of public assets 22 — — 25,920 25,920 Related parties 13 — — 230,513 230,513 2,564 34,894 1,785,346 1,822,804 Notes to the consolidated financial statements All amounts in thousands of US dollars, unless otherwise stated (i) As part of the execution of the Aripuanã project, in June 2019 the Company entered into a mining development services agreement with Andrade Gutierrez Engenharia S.A., in which one of the Company director’s close family members may have significant influence at its holding level. Additionally, in June 2020, NEXA entered into one additional agreement with Consórcio Construtor Nova Aripuanã (a consortium of the Andrade Gutierrez group of companies) in connection with construction and operational services for the Aripuanã project. 2017 2016 Local rating Global rating Total Local rating Global rating Total Cash and cash equivalents AA+ 1,089 — 1,089 5,917 — 5,917 AA- — 115,269 115,269 13,699 250,038 263,737 A+ — 172,052 172,052 4,919 109,544 114,463 A — 235,445 235,445 — 65,398 65,398 A- 3 86,189 86,192 15,515 94,454 109,969 BBB+ — 96,436 96,436 75,952 20 75,972 BBB — 110,733 110,733 121,111 209 121,320 BB — — — 2,239 — 2,239 No rating — 201,821 201,821 80,365 76,196 156,561 1,092 1,017,945 1,019,037 319,717 595,859 915,576 Financial investments AA+ 17,111 — 17,111 — — — AA- 180,127 4,238 184,365 113,732 — 113,732 A- 5,053 — 5,053 — 3,225 3,225 No rating — 18 18 — 2,541 2,541 202,291 4,256 206,547 113,732 5,766 119,498 Derivative financial instruments AA- 4,769 3,634 8,403 5,511 — 5,511 A+ — 3,141 3,141 1,587 80 1,667 A — 233 233 — 4,826 4,826 A- — — — — 8,736 8,736 4,769 7,008 11,777 7,098 13,642 20,740 208,152 1,029,209 1,237,361 440,547 615,267 1,055,814 2017 2016 Cash and banks 319,920 338,054 Term deposits 699,117 577,522 1,019,037 915,576 Notes to the consolidated financial statements All amounts in thousands of US dollars, unless otherwise stated Key management includes the members of the Company's global executive team and Board of Directors. Key management compensation, including all benefits, was as follows: Short-term benefits include fixed compensation, payroll charges and short-term benefits under the Company’s variable compensation program. Other long-term benefits relate to the variable compensation program. Accounting policy Property, plant and equipment are stated at their historical cost of acquisition or construction less accumulated depreciation and any recognized impairment losses. Historical cost includes expenditures that are directly attributable to the acquisition and construction of the assets. The mining projects development costs that are registered within Property, plant and equipment include (i) direct and indirect costs attributed to building the mining facilities; (ii) financial charges incurred during the construction period; (iii) depreciation of other fixed assets used during construction; and (iv) estimated decommissioning and site restoration expenses. Subsequent costs are included in the asset’s carrying amount, or recognized as a separate asset as appropriate, only when it is probable that future economic benefits associated with the item will flow to the Company and they can be measured reliably. The carrying amount of any component accounted for as a separate asset is derecognized when replaced. All other repairs and maintenance are charged to the income statement during the reporting period in which they are incurred. Replacement costs are included in the carrying amount of the asset when it is probable that the Company will realize future economic benefits in excess of the benefits expected from the asset in its current condition. Replacement costs are depreciated over the remaining useful life of the related asset. Land is not depreciated. Depreciation of other assets is calculated using the straight-line method to reduce their costs to their residual values over their estimated useful lives. The assets' residual values and useful lives are reviewed annually and adjusted if appropriate. An asset's carrying amount is reduced to its recoverable amount when it is greater than the estimated recoverable amount, in accordance with the criteria adopted by the Company to determine the recoverable amount. Gains and losses on disposals are determined by comparing the proceeds with the carrying amount and are recognized within Other income and expenses, net in the income statement. Loans and financings costs directly related to the acquisition, construction or production of a qualifying asset that requires a substantial period of time to prepare for its intended use or sale are capitalized as part of the cost of that asset when it is probable that future economic benefits associated with the item will flow to the Company and costs can be measured reliably. Nexa Resources S.A. Held for trading 2017 2016 Investment fund quotas (i) 138,945 95,504 Bank Deposit Certificate 42,067 15,042 Repurchase agreements 18,289 — Credit Rights Investment Funds 5,053 4,682 Financial Treasury Bills 1,123 4,270 Other 1,070 — 206,547 119,498 2017 2016 Repurchase agreements - Public securities 131,999 60,803 Repurchase agreements 5,900 20,797 Bank Deposit Certificate — 13,009 Financial Treasury Bills 1,046 891 Credit Right Investment Funds — 4 138,945 95,504 Notes to the consolidated financial statements All amounts in thousands of US dollars, unless otherwise stated Stripping costs In its surface mining operations, the Company must remove overburden and other waste to gain access to mineral ore deposits. The removal process is referred to as stripping. During the development of a mine, before production commences, when the stripping activity improves access to the ore body, the component of the ore body for which access has been improved can be identified and the costs can be measured reliably, a stripping activity asset is capitalized as part of the investment in the construction of the mine and is accounted for as part of Property, plant and equipment within assets and projects under construction. Subsequently, when the operation starts, the stripping costs are transferred to “Dams and Buildings” and are depreciated by a linear calculation considering the asset’s useful life. Stripping costs incurred during the production phase of operations are treated as production costs and are part of the inventory cost. Mining Projects The Company starts to capitalize a project’s mineral exploration and evaluation costs at the beginning of its feasibility study phase, following completion of a pre-feasibility study in which probability of economic feasibility has been established and where there is sufficient geologic and economic certainty of converting mineral resources into proven and probable mineral reserves at a development stage (construction or execution phase) or production stage based on various factors including the known geology, metallurgy and life-of-mine (“LOM”) plans. Capitalized costs incurred during a project’s mineral exploration and evaluation stages are classified within Mining projects, under Property, plant and equipment until the project starts its development stage and are only depreciated by the UoP method once the development stage finishes and the project’s operation starts. Costs incurred during a project’s development stage are also capitalized under Property, plant, and equipment but within Assets and projects under construction. In this way, the capitalized mineral exploration and evaluation costs will remain within Mining projects and will only be depreciated by the UoP method once the development stage finishes and the project´s operation starts. Once the development stage is finished and the project’s operation starts, the capitalized development costs are reclassified to the appropriate group of assets considering their nature and are depreciated on a linear calculation based on the assets’ useful life. Based on the above, once a project begins operation, there will be depreciation coming from the project’s capitalized mineral exploration and evaluation costs within the Mining projects account and based on the UoP method and from the project’s capitalized development costs within the corresponding group of assets based on their useful life. The carrying value of the capitalized mineral exploration and evaluation costs, which remain within Mining projects, and the capitalized development costs, which are within Assets and projects under construction, of the projects are assessed for impairment at least annually or whenever evidence indicates that the assets may be impaired in accordance with IFRS 6 and IAS 36. If the Company decides at any moment to discontinue the project, this could be an impairment indicator that will be assessed under the impairment test. For purposes of this impairment assessment, the projects are allocated to cash generating units (“CGUs”) when applicable. The annual impairment test is disclosed in note 31. Refer to note 8 for the Company’s accounting policy related to expensed mineral exploration and project evaluation costs for mining projects. Nexa Resources S.A. Note 2017 2016 Trade receivables 181,084 115,291 Related parties 13 3,775 6,389 Provision for uncollectible trade receivables (2,146 ) (1,618 ) 182,713 120,062 2017 2016 Balance at the beginning of the year (1,618 ) (2,047 ) Reversals (additions), net (521 ) 653 Exchange variation losses (7 ) (224 ) Balance at the end of the year (2,146 ) (1,618 ) 2017 2016 Brazilian Real 66,486 44,924 US Dollar 115,879 74,868 Other 348 270 182,713 120,062 2017 2016 To fall due 163,196 113,155 Up to 3 months 19,775 6,054 From 3 to 6 months 914 1,169 Over 6 months 974 1,302 184,859 121,680 Provision for uncollectible trade receivables (2,146 ) (1,618 ) 182,713 120,062 Notes to the consolidated financial statements All amounts in thousands of US dollars, unless otherwise stated Costs to acquire exploration legal mining rights are included as Intangible within Rights to use natural resources as explained in note 23. Asset retirement obligations An asset retirement obligation is an obligation related to the permanent removal from service of a tangible long-lived asset that results from the acquisition, construction or development, or the normal operations of a tangible long-lived asset. At the initial recognition of an asset retirement obligation and at the periodical revisions of the expected disbursements and the discount rate, the changes in the liability are charged to Property, plant and equipment. The capitalized amount recognized in Property, plant and equipment is depreciated based on the UoP method. Any reduction in the provision that exceeds the carrying amount of the asset, is immediately recognized in the income statement as “Other income and expenses, net.” Impairment Refer to note 31 for the Company’s accounting policy related to impairment of Property, plant and equipment. Nexa Resources S.A. 2017 2016 Finished products 106,026 121,969 Semi-finished products 85,458 65,054 Raw materials 30,128 17,511 Auxiliary materials and consumables 81,261 104,972 Imports in transit 41,878 20,631 Other 863 15 Provision for obsolete and slow-moving inventory (20,736 ) (38,384 ) 324,878 291,768 2017 2016 Finished Semi- Raw Auxiliary Total Total Balance at the beginning of the year (768 ) (10,167 ) (153 ) (27,296 ) (38,384 ) (36,985 ) Reversals (additions), net 727 (2 ) (63 ) 16,773 17,435 3,090 Exchange variation gains (losses) 1 150 2 60 213 (4,489 ) Balance at the end of the year (40 ) (10,019 ) (214 ) (10,463 ) (20,736 ) (38,384 ) 2017 2016 Value-added Tax on Sales and Services 50,616 64,428 Corporate taxes on Net Income 25,165 34,130 Social Contribution on Revenue 18,824 16,831 Social Integration Program 4,302 3,959 Other 13,737 10,384 112,644 129,732 Current 80,134 102,996 Non-current 32,510 26,736 112,644 129,732 Notes to the consolidated financial statements All amounts in thousands of US dollars, unless otherwise stated Mining projects (i) Nexa Resources S.A. Trade accounts receivable Non-current assets Trade payables Dividends payable Current and non-current 2017 2016 2017 2016 2017 2016 2017 2016 2017 2016 Parent Votorantim S.A. (i) 8 75 3 3 336 257 — — 87,686 52,873 Related parties Companhia Brasileira de Alumínio (ii) 1,843 3,847 — 399,725 5,246 9,064 — 2,423 13 5,614 Votorantim Cimentos S.A. 1,696 1,891 735 750 47 24 — — — — Other 228 576 — 320 1,414 680 655 — 2,225 1,956 Non-controlling interests (iii) — — — — — 3,483 4,762 — 170,070 3,775 6,389 738 400,798 7,043 10,025 4,138 7,185 89,924 230,513 Current 3,775 6,389 — 7,043 10,025 4,138 7,185 87,686 222,917 Non-current — 738 400,798 — — — 2,238 7,596 3,775 6,389 738 400,798 7,043 10,025 4,138 7,185 89,924 230,513 Notes to the consolidated financial statements All amounts in thousands of US dollars, unless otherwise stated (i) Only the amounts of the operating unit Atacocha are being depreciated under the UoP method. Sales Purchases Financial results 2017 (Revised) (Revised) 2017 (Revised) (Revised) 2017 (Revised) (Revised) Related parties Companhia Brasileira de Alumínio 2,125 70 23 42,434 31,162 3,924 1,012 3,582 — Votoratim Metais S.A. (i) — — — — 51 29 — 3,583 5,702 Votener - Votorantim Comercializadora de Energia Ltda. — — 12,436 13,510 13,400 28,869 — — — Votorantim Cimentos S.A. 138 45 73 365 273 338 — — — Other — 2,856 1,265 1,134 1,427 9,755 — — — 2,263 2,971 13,797 57,443 46,313 42,915 1,012 7,165 5,702 Notes to the consolidated financial statements All amounts in thousands of US dollars, unless otherwise stated Accounting policy Goodwill Goodwill arising from business combinations is measured as the excess of the sum of the consideration transferred, the amount of any non-controlling interests in the acquiree, and the fair value of the acquirer’s previously held equity interest in the acquiree (if any) over the net assets acquired. Goodwill is not amortized but is tested for impairment annually and whenever circumstances indicate that the carrying amount may not be recovered. Refer to note 31 for the Company’s impairment accounting policy and critical estimates and assumptions and judgments. Rights to use natural resources The significant costs incurred for the acquisition of legal rights to explore mining concessions and develop mineral properties are capitalized and are amortized as production costs when the associated projects start their commercial operation using the UoP method over their useful lives. Useful lives consider the period of extraction for both mineral reserves and mineral resources, which includes a portion of the Company’s inferred resources in the Company’s mining operations. The costs for the acquisition of legal rights attributed to mining projects are not depreciated until the project becomes operational and production activities start. The costs incurred are impaired if the Company determines that the projects and their mineral rights associated have no future economic value. For purposes of impairment assessment, rights to use natural resources are allocated to CGUs. Refer to note 31 for the Company’s impairment accounting policy. Critical accounting estimates, assumptions and judgments - Quantification of mineral reserves and resources for useful life calculation The Company classifies proven and probable reserves, and measured, indicated and inferred resources based on the definitions of the United States Securities and Exchange Commission’s (SEC) Modernized Property Disclosure Requirements for Mining Registrants as described in Subpart 229.1300 of Regulation S-K, Disclosure by Registrants Engaged in Mining Operations (S-K 1300) and Item 601 (b)(96) Technical Report Summary. The useful life determination applied to the rights to use natural resources reflect the pattern in which the benefits are expected to be derived by the Company and is based on the estimated life of mine (“LOM”). Any changes to the LOM, based on new information regarding estimates of mineral reserves and mineral resources and mining plan, may affect prospectively the LOM and amortization rates. The estimation process of mineral reserves and mineral resources is based on a technical evaluation, which includes geological, geophysics, engineering, environmental, legal and economic estimates and may have relevant impact on the economic viability of the mineral reserves and mineral resources. These estimates are reviewed periodically, and any changes are reflected in the expected LOM. Management is confident based on testing, continuity of the ore bodies and conversion experience that a part of the inferred resources will be converted into measured and indicated resources, and if they are economically recoverable, and such inferred resources may also be classified as proven and probable mineral reserves. Where the Company can demonstrate the expected economic recovery with a high level of confidence, inferred resources are included in the amortization calculation. Nexa Resources S.A. 2017 2016 2015 Short-term benefits to managers 6,668 7,310 4,945 Other long-term benefits to key management 1,162 1,686 836 7,830 8,996 5,781 Notes to the consolidated financial statements All amounts in thousands of US dollars, unless otherwise stated However, the future conversion of inferred resources is inherently uncertain and involves estimates, assumptions and judgments that could have a material impact on the Company’s results of operations. Goodwill (i) (i) At December 31, 2023, the balances of the Company’s recognized goodwill were: USD 95,830 (2022 - USD 95,485) allocated to Cajamarquilla CGU, USD 4,972 (2022 - USD 4,613) allocated to Juiz de Fora, and USD 206,423 (2022 - USD 249,082) allocated to the Mining Peru group of CGU. In 2023, the recoverability of goodwill was tested, as explained in note 31. Accounting policy Right-of-use assets represent the right to use an underlying asset for the lease term and lease liabilities represent the Company’s obligation to make lease payments arising from the lease. Lease terms are negotiated on an individual asset basis and contractual provisions contain a wide range of different terms and conditions. The lease agreements do not impose any covenants, but leased assets may not be used as security for borrowing purposes. Nexa Resources S.A. Notes to the consolidated financial statements All amounts in thousands of US dollars, unless otherwise stated The Company accounts for non-lease components such as service costs separately, whenever applicable. The Company’s lease terms may include options to extend or terminate the lease and when it is reasonably certain that we will exercise that option, the financial effect is included in the contract’s measurement. Measurement Liabilities arising from a lease contract are initially measured on a present value basis, using the incremental borrowing rate approach. The incremental borrowing rate is determined by the Company based on equivalent financial costs that would be charged by a counterparty for a transaction with the same currency and a similar amount, term and risk of the lease contract. The finance cost charged to the income statement produces a constant periodic rate of interest over the lease term. On December 31, 2023, incremental borrowing rate were between 5.68% to 11.39% for Brazil; and 2.85% to 9.53% for Peru. Lease contracts are recognized as a liability with a corresponding right-of-use asset at the date at which the leased asset is available for use by the Company. The right-of-use asset also includes any lease payments made and it is amortized over the shorter of the asset’s useful life and the lease term on a straight-line basis. Amortization expenses are classified either in Cost of sales or Administrative expenses based on the designation of the related assets. When the lease liability is remeasured, a corresponding adjustment is made to the carrying amount of the right-of-use asset or is recorded in profit or loss if the carrying amount of the right-of-use asset has been reduced to zero. Nexa Resources S.A. 2017 Machinery, Assets and Land and Dam and equipment and Furniture and projects under Asset retirement improvements buildings facilities Vehicles fixtures construction obligation (ARO ) Mining projects Other Total Balance at the beginning of the year Cost 24.036 980.242 2.466.265 22.263 6.895 219.254 132.824 271.466 7.345 4.130.590 Accumulated depreciation (257 ) (435.372 ) (1.485.939 ) (20.440 ) (4.443 ) — (96.108 ) (102.828 ) (6.741 ) (2.152.128 ) Net balance 23.779 544.870 980.326 1.823 2.452 219.254 36.716 168.638 604 1.978.462 Acquisitions 46 100 5.761 272 307 185.688 4.303 240 — 196.717 Disposals (930 ) (92 ) (2.915 ) (121 ) (6.917 ) — — (7 ) (10.982 ) Depreciation (22 ) (34.175 ) (142.519 ) (1.174 ) (509 ) — (5.834 ) (11.121 ) (83 ) (195.437 ) Exchange variation losses (231 ) (4.309 ) (6.381 ) (101 ) (9 ) (3.965 ) (1.839 ) (2.115 ) (8 ) (18.958 ) Transfers 1.573 71.152 83.297 2.236 131 (158.559 ) — 2.841 — 2.671 Cost and interest revision — — — — — — 43.789 — — 43.789 Transfers of assets held for sale — — 252 — — — — — — 252 Balance at the end of the year 24.215 577.546 917.821 3.056 2.251 235.501 77.135 158.483 506 1.996.514 Cost 24.490 1.030.686 2.422.254 21.135 6.743 235.501 178.662 243.938 7.177 4.170.586 Accumulated depreciation (275 ) (453.140 ) (1.504.433 ) (18.079 ) (4.492 ) — (101.527 ) (85.455 ) (6.671 ) (2.174.072 ) Net balance at the end of the year 24.215 577.546 917.821 3.056 2.251 235.501 77.135 158.483 506 1.996.514 Average annual depreciation rates - % — 4 7 24 10 — 5 8 — — Notes to the consolidated financial statements All amounts in thousands of US dollars, unless otherwise stated Machinery, Assets and Land and Dam and equipment and Furniture and projects under Asset retirement improvements buildings facilities Vehicles fixtures construction obligation (ARO) Mining projects Other Total Balance at the beginning of the year Cost 20,657 816,001 2,223,583 20,551 6,278 206,094 116,695 246,208 6,079 3,662,146 Accumulated depreciation (85 ) (332,034 ) (1,259,830 ) (18,066 ) (3,441 ) — (74,229 ) (85,544 ) (5,563 ) (1,778,792 ) Net balance 20,572 483,967 963,753 2,485 2,837 206,094 42,466 160,664 516 1,883,354 Acquisitions — — 489 2 151,302 148 28,915 — 180,856 Disposals (46 ) (593 ) (1,525 ) (95 ) (37 ) (42 ) — (11,000 ) (1 ) (13,339 Depreciation (20 ) (31,145 ) (145,450 ) (1,487 ) (477 ) — (7,301 ) (14,096 ) (67 ) (200,043 Reversal of provision for asset impairment (i) 979 979 Exchange variation gains 2,274 38,640 64,510 259 43 16,987 4,589 2,652 139 130,093 Transfers 999 54,001 98,801 661 84 (156,066 ) 1,503 17 Cash flow review and restatement of interest rates — — — — — — (3,186 ) — — (3,186 ) Assets transferred to held for sale — — (252 ) — — — — — — (252 ) Balance at the end of the year 23,779 544,870 980,326 1,823 2,452 219,254 36,716 168,638 604 1,978,462 Cost 24,036 980,242 2,466,265 22,263 6,895 219,254 132,824 271,466 7,345 4,130,590 Accumulated depreciation (257 ) (435,372 ) (1,485,939 ) (20,440 ) (4,443 ) — (96,108 ) (102,828 ) (6,741 ) (2,152,128 ) Net balance at the end of he year 23,779 544,870 980,326 1,823 2,452 219,254 36,716 168,638 604 1,978,462 Average annual depreciation rates -% — 4 7 21 11 — 7 8 — —
2017 2016 Cost 19,763 13,794 Accumulated depreciation (10,930 ) (9,657 ) 8,833 4,137 2017 2016 Mining projects 101,922 91,174 Acquisition and renovation of equipment 42,239 52,284 Security, health and enviroment projects 35,858 44,674 New production line construction 25,477 5,472 Information technology 3,084 151 Modernization and increased production projects 10,563 10,004 Other 16,358 15,495 235,501 219,254 2017 Goodwill Rights to use Software Use of public Assets and Other Total Balance at the beginning of the year Cost 675,561 1,673,091 1,507 11,581 6,974 35,053 2,403,767 Accumulated amortization — (469,381 ) (1,106 ) (4,159 ) — (25,969 ) (500,615 ) Net balance 675,561 1,203,710 401 7,422 6,974 9,084 1,903,152 Acquisitions — — 921 — — 921 Disposals — — (36 ) — — (36 ) Amortization — (74,024 ) (576 ) (394 ) (23 ) (75,017 ) Exchange variation losses (2,274 ) (682 ) (21 ) (96 ) (424 ) (133 ) (3,630 ) Transfers — — 4,768 — (6,546 ) (893 ) (2,671 ) Balance at the end of the year 673,287 1,129,004 5,457 6,932 4 8,035 1,822,719 Cost 673,287 1,672,931 21,823 11,410 4 28,847 2,408,302 Accumulated amortization — (543,927 ) (16,366 ) (4,478 ) — (20,812 ) (585,583 ) Net balance at the end of the year 673,287 1,129,004 5,457 6,932 4 8,035 1,822,719 Average annual amortization rates % — 5 20 3 — — —
Accounting policy Loans and financings are initially recognized at fair value, net of transaction costs incurred, and are subsequently measured at amortized cost, unless they are designated as fair value option, if necessary to eliminate the accounting mismatch that would arise if amortized cost were used. Any difference between the proceeds (net of transaction costs) and the total amount payable is recognized in the income statement as interest expense over the period of the loans using the effective interest rate method, except for the loans measured at fair value. Loans and financings are classified as current liabilities unless the Company has the unconditional right to defer repayment of the liability for at least 12 months after the reporting period. Fees paid on the establishment of loan facilities are recognized as transaction costs of the loan to the extent that it is probable that some or all of the facility will be drawn down. In this case, the fee is deferred until the drawdown occurs.
(i) On June 30, 2023 LIBOR (London Interbank Offered Rate) was last issued and discontinued. The decision to discontinue LIBOR was made due to concerns about a lack of liquidity and the lack of underlying transactions supporting the taxes. As a result, regulators and financial authorities around the world have encouraged the transition to more robust and sustainable alternative benchmark interest rates. The transition involves transferring financial contracts and instruments that rely on LIBOR to other reference rates, such as short-term interest rates based on real transactions, such as SOFR (Secured Overnight Financing Rate). Therefore, as guided by regulators and financial authorities, the Company adopted the change in indexes in its financial contracts and instruments indexed on LIBOR to SOFR as of July 1, 2023.
On October 20, 2023, the Company entered into a sustainability-linked revolving credit facility with a group of financial institutions of lenders, which allows the Company to borrow up to USD 320,000. The revolving credit facility has a term of five years, and the amounts drawn are subject to an initial interest rate of 1.60% plus Term SOFR (Secured Overnight Financing Rate). The applicable margin is subject to compliance with certain sustainability key performance indicators. The new facility replaces Nexa’s 2019 USD 300,000 revolving credit facility, which was set to mature in October 2024. As of December 31, 2023, the Company has not drawn on this revolving credit facility. On December 12, 2023, the Company entered into a Bank Credit Note agreement in the total principal amount of USD 50,000 (equivalent to BRL 245,250 thousand) with maturity in 2028, and an interest rate of 2.57% plus the 12-month TERM SOFR (Secured Overnight Financing Rate). On December 18, 2023, the Company entered into a financing agreement in the total principal amount of USD 6,012 with maturity in 2031, and an interest rate of 0.86% plus TJLP index.
(i)The negative balances refer to related funding costs (fee) amortization.
The Company has loans and financings that are subject to certain financial covenants at the consolidated level, such as: (i) leverage ratio; (ii) capitalization ratio; and (iii) debt service coverage ratio. When applicable, these compliance obligations are standardized for all debt agreements. No changes to the contractual guarantees occurred in the year ended on December 31, 2023. As of December 31, 2023, the Company was in compliance with all its financial covenants, as well as the Company was compliant with other qualitative covenants.
Accounting policy Trade payables represent liabilities for goods and services that were provided to the Company before the end of the financial year which are unpaid. Trade and other payables are presented as current liabilities unless payment is not due within 12 months after the reporting period. These amounts are recognized initially at their fair value and subsequently measured at amortized cost using the effective interest method.
Accounting policy The Company has contracts with some suppliers whose commercial payment varies between 90 and 180 days, which can be negotiated individually with the supplier and reach 210 days, without any additional guarantees, except for a specific supplier for which a letter of guarantees is provided. In these contracts, the supplier has the option to request a bank to advance the payment of their commercial invoice within 180 days, before the invoice matures. As a result of those contracts between the suppliers and the bank, the commercial terms agreed with the Company do not change. In accordance with the commercial agreement, the supplier communicates to the Company its interest in selling the invoice to the bank, and it is only the supplier who can decide to sell its invoice at any time during the commercial period. With this option, suppliers can improve their working capital position. The bank pays the supplier with an interest discount and the Company assumes part of the interest payment to the supplier, in certain cases the supplier assumes the integral payment of interest. The Company, however, understands that the separate presentation of these accounts within “Confirming payables” is relevant to the understanding of the Company's financial position. Based on concepts of IFRS 9, the Company assesses whether the payment term extension arrangement substantially modifies the original liability based on qualitative and quantitative assessments. If the original liability has not been substantially modified, the original liability remains and is disclosed as “Confirming Payable”. If the original liability has been substantially modified, the Company derecognizes the original liability (confirming payables) and recognizes a new financial liability as “Other financial liabilities”. Any gain/loss is recognized in the “Income Statement”. The Company concluded that for December 31, 2023, the transactions maintain their essence as “confirming payables” taking into consideration Nexa’s assessment policy. Payments of the principal amounts and interest reimbursements are presented within the “operating activities group” in the Company's cash flow statement, in accordance with IAS 7, as the Company classifies the actual transactions as confirming payable.
As of December 31, 2023, financial institutions have paid the total amount of confirming payables to the suppliers.
There were no business combinations or material foreign exchange differences in either periods.
Accounting policy Provision for asset retirement obligations include costs for restoration and closure of the mining assets and is recognized due to the development or mineral production, based on the net present value of estimated closure costs. Dam obligations regarding the de-characterization of their structures includes estimated mandatory costs as required by the Brazilian Government. Management uses its judgment and previous experience to determine the potential scope of rehabilitation work required and the related costs associated with that work, which are recognized as a “Property, plant and equipment” for asset retirement obligations relating to operating mining assets or as “Other income and expenses, net” for non-operating structures and for de-characterization of dams, environmental obligations include costs related to rehabilitation of areas damaged by the Company in its extractive actions (for example - soil contamination, water contamination, among others) or penalties. Therefore, it becomes an event that creates obligations when these environmental damages are detected by the Company, when a new law requires that the existing damage be rectified or when the Company publicly accepts any responsibility for the rectification, creating a constructive obligation. The costs to remedy an eventual unexpected contamination, which give rise to a probable loss and can be reliably estimated, must be recognized in “Other income and expenses, net” in income statement. In addition, investments in infrastructure, machinery and equipment regarding operational improvements to avoid future environmental damage, are not provisioned, because it is expected that these assets will bring future economic benefits to the operating units, thus it is capitalized as Property, plant and equipment. The liabilities are discounted to present value using a credit risk-adjusted rate that reflects current market assessments of the time value of the money and the specifics risks for the asset to be restored. The interest rate charges relating to the liability are recognized as an accretion expense in the Net financial results. Difference in the settlement amount of the liability is recognized in the income statement. Critical accounting estimates, assumptions and judgments The initial recognition and the subsequent revisions of the asset retirement obligations, dams obligations, and environmental obligations consider critical future closure and repairing costs and several assumptions such as interest rates, inflation, useful lives of the assets and the estimated moment that the expenditure will be executed. These estimates are reviewed annually by the Company or when there is a relevant change in these assumptions. Cost estimates can vary in response to many factors of each site that include timing, expected LOM, changes to the relevant legal or government requirements and commitments with stakeholders, review of remediation and relinquishment options, emergence of new restoration techniques, stage of engineering evaluation maturity among others. Engineering projects for each liability are in different stages of maturity, some of them still in the conceptual engineering phase, for which the estimation of expenditures includes in its methodology a high degree of uncertainty in the definition of the total cost of the project in accordance with best market practices. External experts support the cost estimation process where appropriate. These factors either isolated or consolidated could significantly affect the future income statement and balance sheet position.
(i) As of December 31, 2023, the credit risk-adjusted rate used for Peru was between 10.86% and 12.52% (December 31, 2022: 10.92 % and 12.04 %) and for Brazil was between 6.94% and 11.11% (December 31, 2022: 8.22% and 8.61%). (ii) The change in the year ended on December 31, 2023, was mainly due to the time change in the expected disbursements on decommissioning obligations in certain operations, in accordance with updates in their asset retirement and environmental obligations studies, and by the increase in the discount rates, as described above. In this way, asset retirement obligations for operational assets, increased in an amount of USD 11,972 (December 31, 2022: decrease of USD 6,773) as shown in note 21; and asset retirement and environmental obligations for non-operational assets expense in USD 3,165 (December 31, 2022: expense of USD 1,512) as shown in note 9. (iii) The Company has been conducting engineering studies to confirm the construction method of some very old inactive industrial waste containment structures that have been closed for more than 20 years. None of them contain mining tailings, water or liquid waste. Based on results of the conceptual engineering studies, the Company has reserved amounts related to estimated costs of anticipated additional obligations in relation to these closed dams.
Accounting policy Provisions for legal claims and judicial deposits Provisions for legal claims are recognized when there is a combination of the following conditions: (i) the Company has a present legal or constructive obligation as a result of past events; (ii) it is probable (more likely than not) that an outflow of resources will be required to settle the obligation; and (iii) the amount can be reliably estimated. The provisions are periodically estimated, and the likelihood of losses is supported by the Company's legal counsel. Provisions are measured at the present value of the expenditure expected to be required to settle the obligation using a discount rate that reflects current market assessments of the time value of money and the risks specific to the obligation. The increase in the provision due to the passage of time is recognized as Financial Expenses.
When a claim is secured by a judicial deposit, the Company offsets the provision with the judicial deposit amount in the consolidated balance sheet. However, the Company also has judicial deposits for claims for which the likelihood of loss is possible or remote and for which no provision is recognized. In such cases, these amounts are recognized as outstanding judicial deposits in the Company’s assets. Critical accounting estimates and assumptions – Provisions for legal claims The Company is part of ongoing tax, labor, civil and environmental lawsuits which are pending at different court levels. The provisions for potentially unfavorable outcomes of litigation in progress are established and updated based on management evaluation and require a high level of judgment regarding the matters involved, supported by the positions of external legal advisors. Income tax claims are discussed at the current and deferred income tax section (note 11).
The provisions and the corresponding judicial deposits are as follows:
The outstanding judicial deposits of the Company as of December 31, 2023 that are not presented net of the provisions are USD 20,287 (December 31, 2022: USD 16,753).
Legal claims that have a possible likelihood that an obligation will arise are disclosed in the Company’s financial statements. The Company does not recognize a liability because it is not probable that an outflow of resources will be required or because the amount of the liability cannot be reliably calculated. These legal claims are summarized below:
The main contingent liabilities relating to tax lawsuits are discussed below. Income tax over transfers of shares in Peru Relates to assessments issued by the SUNAT, where the Company was jointly and severally liable for the payment of income tax by a foreign investor, in a supposed capital gain on transfer of shares. The estimated financial effect of this contingent liability is USD . Compensation for exploration for mineral resources Relates to assessments issued by the Brazilian National Department of Mineral Production for the alleged failure to pay or underpayment of financial compensation for the exploration of mineral resources (“CFEM”). The estimated financial effect of this contingent liability is USD 12,927.
Indirect taxes on sales Relates to assessments issued by the Brazilian Internal Revenues Service concerning certain credits taken by the Company when calculating those indirect taxes on sales. The estimated financial effect of this contingent liability is USD 4,272. Value-added tax on sales Relates to assessments issued by the tax authorities of the State of Minas Gerais concerning the following:
Include several claims filed by former employees, third parties and labor unions and labor public attorney’s office mostly claiming the payment of indemnities related to dismissals, such as overtime, work at night hours, commuting hours, health hazard premiums and hazardous duty premiums, as well as indemnity claims by former employees and third parties based on alleged occupational illnesses, work accidents and payment of social benefits. The individual amount of the claims are not material.
The main contingent civil liability is related to indemnity lawsuits against the Company alleging property, contractual and general damages/losses. The estimated financial effect of this contingent liability is USD 12,823.
The main contingent environmental liabilities in Brazil were filed by fishermen communities against the Company for indemnification, compensation for material and moral damages due to alleged pollution of the São Francisco River close to the Company’s Três Marias operation in Brazil. The estimated financial effect of these contingent liabilities is USD 85,399.
Accounting policy Contractual obligations consist of advance payments received by the Company under a silver streaming agreement, signed with a counterparty (the “Streamer”) and by which referential silver contents found in the ore concentrates produced by the Company’s Cerro Lindo mining unit are sold to the Streamer. Determining the accounting treatment of silver streaming transactions requires the exercise of high degree of judgment. The Company assesses whether those advances obtained under this agreement should be recognized as contractual obligations (a sale of a non-financial item) or as a financial liability. For that purpose, the Company takes into consideration factors such as which party is exposed to the operational risk, the risk of access to the resources, the price risk, and assesses whether the transaction involves a sale of an own use asset for the counterparty. In those cases, in which the Company concludes that, in essence, the Streamer shares substantially the operational risks, the resource access and price risks, it delivers a non-financial item that qualifies as an “own use” item; any advance payment obtained is recognized as a contractual obligation in the framework of IFRS 15: Revenue from contracts with customers. Otherwise, the Company would recognize a financial liability in the framework of the provisions of IFRS 9: Financial instruments. When a contractual obligation is recognized, the balance is initially recognized at the amount received, and it is subsequently recognized as revenue when the control of the respective assets is transferred, that is, upon the physical delivery of the nonfinancial item (silver certificate). Contractual obligations are recognized within non-current liabilities, except for the portion of silver certificates that are estimated to be delivered over the 12 months following the balance sheet date. The advance payment obtained under the silver streaming transaction entered by the Company in 2016 is recognized as contractual obligation to the extent that the risk assessment conducted by the management indicates the relevant risks are substantially shared with the Streamer and the qualifying conditions of a sale of an “own use” item are met. Determination of the transaction price The transaction price is the amount of consideration to which the Company expects to be entitled in return for transferring the promised goods to its counterparty. The transaction price is allocated to each performance obligation based on the relative standalone selling prices. In the silver streaming transaction, the Company has variable considerations related to the production capacity of the mine linked to its LOM and to the LME. IFRS 15 requires that for contracts containing variable considerations, the transaction price be continually updated and re-allocated to the transferred goods. For this purpose, the contractual obligations require an adjustment to the transaction price per unit each time there is a change in the underlying production profile of a mine or the expected metal prices. The change in the transaction price per unit results in a retroactive adjustment to revenues in the period in which the change is made, reflecting the new production profile expected to be delivered under the streaming agreement or the expected metal prices. A corresponding retroactive adjustment is made to accretion expenses, reflecting the impact of the change in the contractual obligation balance.
Critical accounting estimates, assumptions and judgments The recognition of revenues and of the contractual obligation related to the silver transaction require the use of critical accounting estimates and assumptions including, but not limited to: (i) allocation of revenues on relative prices; (ii) estimate prices for determining the upfront payment; (iii) discount rates used to measure the present value of future inflows and outflows; and (iv) estimates of LOM, reserves and mineral production.
In 2016, the Company entered a silver streaming arrangement for the anticipated sale of a portion of the silver contained in the ore concentrates produced by the Cerro Lindo mining unit, which consisted of: i) an upfront payment of USD 250,000 and ii) additional payments at the date of each delivery of the ounces of payable silver equivalent to 10% of the spot price at the date of settlement. In addition, by this agreement, sales of silver certificates to Triple Flag are limited to a total of 19.5 million of the ounces that Nexa Peru sells to its customers. Once that limit is reached, sales under the streaming will be made for 25% of the silver content in the Nexa Peru’s sales of concentrate for a period equivalent to the life of said mining unit. The advance payment was recognized as a Contractual obligation and the corresponding revenues are recognized as the silver is delivered, which is the time that the contractual performance obligations are satisfied. The changes in the contractual obligation are shown below:
(i) In September 2023 and December 2023, the Company recognized a remeasurement adjustment in its contractual obligations of silver streaming with a corresponding reduction in revenues for an amount of USD 2,323 and USD 8,252, respectively, and an increase in accretion for an amount of USD 284 and USD 989 (September 30, 2022: reduction in revenues for an amount of USD 10,565 and an increase in accretion for an amount of USD 1,041), given the higher long-term prices and the updated mine plan for its Cerro Lindo Mining Unit. According to the Company’s silver streaming accounting policy, prices and changes in the LOM given an update in mine plans are variable considerations and then, the recognized income under the streaming agreement should be adjusted to reflect the updated variables.
Accounting policy Common shares are classified in shareholders’ equity. Each time a share premium is paid to the Company for an issued share, the respective share premium is allocated to the share premium account. Each time the repayment of a share premium is decided, such repayment shall be done pro-rata to the existing shareholders. The distribution of dividends to the Company’s shareholders is recognized as a liability in the Company’s consolidated financial statements in the period in which the dividends are approved by the Company’s shareholders. Shares repurchased under buyback programs that are not cancelled, are reported as treasury shares and are deducted from shareholders’ equity. These shares are also deducted in the earnings per share calculation.
As of December 31, 2023, the outstanding capital of USD 132,439 (2022: USD 132,439) is comprised of thousand subscribed and issued common shares (2022: thousand), with par value of US$ per share. In addition to the subscribed and issued common shares, NEXA also has an authorized, but unissued and unsubscribed share capital set at USD .
On June 4, 2020, at NEXA’s Extraordinary General Meeting (“EGM”), the Company’s shareholders approved the cancellation of the shares held in treasury, purchased based on a share buyback program in prior years. For this reason, after the cancellation that occurred on June 4, 2020, VSA holds % of NEXA’s equity.
The share premium, if any, may be distributed to the shareholders in accordance with Luxembourg Commercial Companies Act by a resolution of the Board of Directors.
Additional paid in capital arises from transactions recognized in equity that do not qualify as capital or share premium in accordance with Luxembourg Commercial Companies Act and, therefore, cannot be distributed to the shareholders of the Company.
The changes in the accumulated other comprehensive income are as follows:
Basic earnings per share are computed by dividing the net income attributable to NEXA’s shareholders by the average number of outstanding shares for the year. Diluted earnings per share is computed in a similar way, but with the adjustment in the denominator when assuming the conversion of all shares that may be dilutive. The Company does not have any potentially dilutive shares and consequently the basic and diluted earnings per share are the same.
On February 15, 2023, the Company’s Board of Directors approved, subject to ratification by the Company’s shareholders at the 2024 annual shareholders’ meeting in accordance with Luxembourg laws, a cash distribution to the Company’s shareholders of approximately USD 25,000, which was paid on March 24, 2023 as share premium (special cash dividend). On May 15, 2023, Enercan’s Board of Directors approved an additional dividend distribution to its shareholders related to the 2022 fiscal year and the Company’s subsidiary Pollarix S.A. (“Pollarix”) will be entitled to receive USD 15,426 (BRL 76,430). Pollarix received in cash the amount of (i) USD 1,059 (BRL 5,245) on April 27, 2023, (ii) USD 5,474 (BRL 27,124) on June 7, 2023, (iii) USD 9,199 (BRL 44,887) on September 20, 2023, (iv) USD 4,556 (BRL 22,567) on November 21, 2023, and (v) USD 1,812 (BRL 8,977) on December 14, 2023, from the outstanding amount of the dividend’s distribution. On August 2, 2023, Pollarix's Board of Directors approved an additional distribution of dividends to its shareholders for the 2022 fiscal year. Nexa BR will be entitled to receive USD 4,959 (BRL 24,197) for common shares and the non-controlling interest will be entitled to receive USD (BRL ) for preferred shares. Pollarix paid in cash the total amount of USD 13,282 (BRL 64,806) by the end of September to the non-controlling interest.
On December 15, 2023, Pollarix’s Board of Directors approved an early distribution of dividends to its shareholders for the 2023 fiscal year. Nexa BR will be entitled to receive USD 1,542 (BRL 7,638) for common shares and the non-controlling interest will be entitled to receive USD (BRL ) for preferred shares. Pollarix paid in cash the total amount of USD 10,307 (BRL 51,058) by the end of December to the non-controlling interest. Additionally, it is important to mention that Nexa Peru paid a total amount of USD 124 to the non-controlling interest regarding to the dividends distributed in previous years.
Accounting policy Impairment of goodwill As part of the impairment testing procedures, the goodwill arising from a business combination is allocated to a CGU or groups of CGUs that are expected to benefit from the related business combination and is tested at the lowest level that goodwill is monitored by management. Goodwill is tested annually for impairment, regardless of whether there has been an impairment indicator or, more frequently, if circumstances indicate that the carrying amount may not be recovered.
Impairment of long-lived assets The Company assesses at each reporting date, whether there are indicators that the carrying amount of an asset or CGU, including goodwill balance, may not be recovered. If any indicator exists, such The recoverable amount is estimated by reference to the higher of an asset’s or CGU’s fair value less cost of disposal (“FVLCD”) and its value in use (“VIU”). The recoverable amount is determined for an individual asset unless the asset does not generate cash inflows that are largely independent of those from other assets or groups of assets, in which case, the asset is tested as part of a larger CGU to which it belongs. If the carrying amount of an asset or CGU exceeds its recoverable amount, the asset or CGU is considered impaired and is reduced to its recoverable amount. Non-financial assets other than goodwill that were adjusted due to impairment are subsequently reviewed for possible reversal of the impairment at each reporting date. Generally, the opposite of indicators that gave rise to an impairment loss would be considered indicators that impairment losses might have to be reversed. If the underlying reasons for the original impairment have been removed or the service potential of the asset or CGU has increased, an assessment of impairment reversals is performed by the Company. Reversals of impairment losses that arise simply from the passage of time or related with prior goodwill impairments are not recognized. For individual assets, if there is any indicator that an asset become unusable by damage or a decision that would lead the asset to not contribute economically to the Company, it is impaired. In addition, greenfield projects for which the Company decides to quit exploration and there is no expectation that in the future will bring cash inflows are also impaired. Impairment of exploration and evaluation costs and development projects costs Exploration assets (greenfield) representing mineral rights acquired in business combinations, mineral rights, and other capitalized exploration and evaluation costs, as well as development projects costs capitalized included in Property, plant and equipment are tested for impairment in aggregation with CGU or groups of CGUs that include producing assets or tested individually through FVLCD when there are indicators that capitalized costs might not be recoverable. The allocation of exploration and evaluation costs, and development project costs to CGUs or group of CGUs is based on 1) expected synergies or share of producing assets infrastructure, 2) legal entity level, and 3) country level. When testing a CGU or a group of CGUs that include exploration and evaluation costs and development project costs, the Company performs the impairment test in two steps. In the first step, producing assets or group of producing assets are tested for impairment on an individual basis. In the second step, exploration and evaluation costs and development project costs are allocated to a CGU or a group of CGUs and tested for impairment on a combined basis.
Valuation methods and assumptions for recoverable amount based on FVLCD FVLCD FVLCD is an estimate of the price that the Company would receive to sell an asset, CGU or group of CGUs in an orderly transaction between market participants at the measurement date, less the cost of disposal. FVLCD is not an entity-specific measurement but is focused on market participants’ assumptions for a particular asset when pricing the asset. FVLCD is estimated by the Company using discounted cash flows techniques (using a post-tax discount rate) and market past transaction multiples (amount paid per ton of minerals for projects in similar stages) for greenfield projects for which resources allocation is under review, although the Company considers observable inputs, a substantial portion of the assumptions used in the calculations are unobservable. These cash flows are classified as level 3 in the fair value hierarchy. No CGUs are currently assessed for impairment by reference to a recoverable amount based on FVLCD classified as level 1 or level 2. VIU VIU is determined as the present value of the estimated future cash flows expected to arise from the continued use of the asset in its current condition and its residual value. VIU is determined by applying assumptions specific to the Company’s continued use and does not consider enhancements or future developments. These assumptions are different from those used in calculating FVLCD and consequently the VIU calculation is likely to give a different result (usually lower) than a FVLCD calculation. Additionally, it is applied to the estimated future cash flows a pre-tax discount rate. Forecast assumptions The cash flow forecasts are based on management’s best estimates of expected future revenues and costs, including the future cash costs of production, capital expenditure, and closure, restoration, and environmental costs. The resulting estimates are based on detailed LOM and long-term production plans. When calculating FVLCD, these forecasts include capital and operating expenditures related to expansions and restructurings of both brownfield and greenfield projects that a market participant would consider in seeking to obtain the highest and best use of the asset, considering their evaluation, eventual changes in their scope or feasibility, and their development stage. The cash flow forecasts may include net cash flows expected to be realized from the extraction, processing and sale of material that does not currently qualify for inclusion in ore reserves. Such non-reserve material is only included if the Company has a high level of confidence that it will be converted to reserves. This expectation is usually based on preliminary drilling and sampling of areas of mineralization that are contiguous with existing ore reserves, as well as on the historical internal conversion ratio. Typically, the additional evaluation required for conversion to reserves of such material has not yet been done because this would involve incurring evaluation costs earlier than is required for the efficient planning and operation of the producing mine. For purposes of determining FVLCD from a market participant’s perspective, the cash flows incorporate management’s internal price forecasts that also reflects the view of market participants. The internal price forecasts are developed using a robust model that incorporates market-based supply, demand and cost data. The internal price forecasts used for ore reserve estimation testing and the Company’s strategic planning are generally consistent with those used for the impairment testing.
Cost levels incorporated in the cash flow forecasts are based on the current LOM plan and long-term production plan for the CGU, which are based on detailed research, analysis and iterative modeling to optimize the level of return from investment, output and sequence of extraction. The mine plan considers all relevant characteristics of the orebody, including waste-to-ore ratios, ore grades, haul distances, chemical and metallurgical properties of the ore, process recoveries and capacities of processing equipment that can be used. The LOM plan and long-term production plans are, therefore, the basis for forecasting production output and production costs in each future year. The discount rates applied to the future cash flow forecasts represent the Company’s estimate of the rate that a market participant would apply to the time value of money and the risks specific to the asset for which the future cash flow estimates have not been adjusted. The Company’s weighted average cost of capital is generally used for determining the discount rates, with appropriate adjustments for the risk profile of the countries in which the individual CGUs operate. With respect to the estimated future cash flows of capitalized exploration assets and development projects, for some assets the Company applies a price to net assets value ratio discount in order to reflect the inherent risk of such projects and that are neither adjusted in the discount rate nor in the future cash flows. The discount is based on the stage of the project and the type of metal. Critical accounting estimates, assumptions and judgments - Impairment of long-lived assets Impairment is assessed at the CGU level. A CGU is the smallest identifiable asset or group of assets that generates independent cash inflows. Judgment is applied to identify the Company’s CGUs, particularly when assets belong to integrated operations, and changes in CGUs could impact impairment charges and reversals. External and internal factors are quarterly monitored for impairment indicators. Judgment is required to determine, for example, whether the impact of adverse spot commodity price movements is significant and structural in nature. Also, the Company’s assessment of whether internal factors, such as an increase in production costs and delays in projects, result in impairment indicators requires significant judgment. Among others, the long-term zinc price, foreign exchange rate considering Brazilian real (BRL) per US dollar (USD) for Brazilian operations, and the discount rate may have a significant impact on the Company’s’ impairment estimations. The process of estimating the recoverable amount involves the use of assumptions, judgment and projections for future cash flows. These calculations use cash flow projections based on financial and operational budgets for a five-year period. After the five-year period, the cash flows are extended until the end of the useful LOM or indefinitely for the smelters. The smelters cash flows do not use growth rates in the cash flow projections of the terminal value. Management’s assumptions and estimates of future cash flows used for the Company’s impairment testing of goodwill and long-lived assets are subject to risk and uncertainties, including metal prices and macroeconomic conditions, which are particularly volatile and partially or totally outside the Company’s control. Future changes in these variables may differ from management’s expectations and may materially change the recoverable amounts of the CGUs. Impairment test analysis Along 2023 the Company, at each reporting date, assessed whether there were indicators that the carrying amount of an asset, goodwill, or cash generation unit (CGU) might not be recoverable, or if a previously recorded impairment needed to be reversed for its entire CGU located in Brazil and Peru.
Goodwill assessment As of December 31, 2023, Nexa conducted its annual impairment test for the CGUs to which goodwill has been previously allocated, including Mining Peru group of CGUs (composed of Cerro Pasco and Cerro Lindo CGUs), Cajamarquilla and Juiz de Fora. As a result, there was an impairment loss of USD 42,660 in the goodwill allocated to the Mining Peru Group of CGUs. The Company assessed for impairment the goodwill allocated to the Cajamarquilla CGU and Juiz de Fora CGU and did not identify any loss to be recognized. Três Marias System and Morro Agudo CGUs During 2023, after analyzing the operational optimization and strategic alternatives for the Três Marias System (STM) (previously formed by the combined operations of the Três Marias smelter and the Vazante and Morro Agudo mines), based on the current and projected macroeconomic and price scenarios, as well as on possible future operational scenarios, management concluded that the implied value of processing zinc concentrate from Morro Agudo in the Três Marias smelter could no longer continue to be recognized. As a result, the Company concluded that there could be scenarios where it was not necessary to consider the two operations in an integrated manner. Thus, the CGU of the STM was split in two: (i) the STM CGU (comprising the Três Marias smelter and the Vazante mine) and (ii) the Morro Agudo CGU (comprised of Morro Agudo mine and Bonsucesso greenfield). This triggered an impairment test for Morro Agudo and Três Marias System CGUs. Considering key assumptions from the strategic planning process, as of December 31, 2023, the impairment assessment resulted in the recognition of an impairment loss of USD 59,007 for Morro Agudo CGU, concluding that its long-lived assets were entirely impaired. Furthermore, the Company assessed Três Marias System for impairment and did not identify impairment loss to be recognized. Aripuaña and Juiz de Fora CGUs The Company tested Juiz de Fora and Aripuanã CGUs after identifying impairment indicators related to (i) reduction in Aripuanã's life of mine; (ii) a lower exchange rate of BRL/USD; and (iii) an increase in operational costs for their operations. No impairment was identified after the impairment assessment for both CGUs. In addition, in relation to Aripuanã CGU, Nexa observed that there is no more excess over recoverable amount. Based on that, the Company performed a sensitivity analysis and concluded that there is no impairment to be recognized as of December 31, 2023. However, the Company continues to work to finalize the operational ramp-up and stabilize the operation as well as to reduce the operation costs and idle capacity. Peruvian CGU As of December 31, 2023, Nexa conducted its annual impairment test for the CGUs Cerro Pasco, Cerro Lindo and Cajamarquilla, after identifying impairment indicators mainly related to increased operational costs. For these CGUs, an impairment assessment was performed, considering key assumptions from the strategic planning process, and as a result, no impairment was identified. Impairment test summary In addition to the economic impairments described above, the Company recognized individual assets impairments for USD 12,976, mainly related to “Assets and projects under construction”.
In summary, Nexa recognized a net impairment loss of USD 114,643 (after-tax USD 90,349) registered for the year ended on December 31, 2023. For the year ended on December 31, 2022, the Company recognized an impairment loss of USD 32,512 (after-tax USD 30,971).
The recoverable amounts for each CGU were determined based on the FVLCD method, which were higher than those determined based on the VIU method. The Company identified long-term zinc prices, discount rate, exchange rate considering Brazilian real (BRL) and LOM as key assumptions for the recoverable amounts determination, due to the material impact such assumptions may cause on the recoverable value. Part of these assumptions are summarized below:
Before the impairment test performed on December 31, 2023, the Mining Peru group of CGU’s, which also includes greenfield projects including the Magistral, Florida Canyon and Hilarion Projects, included a goodwill of USD 249,082. After the impairment loss mentioned above, the goodwill, included in Intangible assets, has a balance of USD 206,423.
The Company performed a stress test on the key assumptions used for the calculation of the recoverable amount of the CGU Mining Peru. A decrease of 5% in the long-term LME zinc price to USD 2,660 per ton compared to management´s estimation as of December 31, 2023, would have resulted in an impairment loss of USD 79,590 (or an additional impairment loss of USD 36,931). Also, an increase of 5% in the discount rate compared to management´s estimation as of December 31, 2023, would have resulted in an impairment loss of USD 49,820 (or an additional impairment loss of USD 7,161).
The Company estimated the amount by which the value assigned to the key assumptions must change in order for the assessed CGU recoverable amount, which was not impaired, to be equal to its carrying amount:
As part of NEXA’s activities for the execution of certain greenfield projects, the Company has agreed, with the Peruvian Government, to minimum investments levels in the Magistral Project, that if the Company does not meet by August 2028, would require additional disbursements of 30% over the unexecuted minimum investment commitment. As of December 31, 2023, the unexecuted minimum investment commitment was USD 323,000, and if not completed by August 2028, the penalty exposition would be USD 97,029.
On December 30, 2023, the Decree 48,747 of 2023 of Minas Gerais State was published, which regulates the need for an environmental guarantee, provided for in Law 23,291, of February 25, 2019 – State Policy for Dam Safety, to guarantee environmental recovery in the event of an accident or deactivation of the dams. According to the Decree, the environmental guarantee is applicable to all dams that present the characteristics established by the Law. The Company estimates a guarantee need of approximately USD 27,283 (BRL 132,083) for all structures in the state of Minas Gerais which was calculated based on a methodology specified by the decree itself, which takes into account the reservoir area, a cost factor related to the decommissioning of dams, and considerations about risk classification of the dam and inflation for the period. The Company has until March 28, 2024, to submit a proposal and may choose the following methods: (i) cash deposit; (ii) Bank Deposit certificate-CDB; (iii) bank guarantee; and (iv) guarantee insurance. By December 31, 2024, the Company will contract 50% of the guarantee chosen, 25% must be made by December 31, 2025, and 25% by the end of 2026. *.*.*
Report of Independent Registered Public Accounting Firm To the Board of Directors and Shareholders of Nexa Resources S.A. Opinions on the Financial Statements and Internal Control over Financial Reporting We have audited the accompanying consolidated balance sheets of Nexa Resources S.A. and its subsidiaries (the “Company”) as of December 31, 2023 and 2022, and the related consolidated income statement, consolidated statement of comprehensive income, consolidated statement of changes in shareholders’ equity and consolidated statement of cash flows for each of the three years in the period ended December 31, 2023, including the related notes (collectively referred to as the “consolidated financial statements”). We also have audited the Company's internal control over financial reporting as of December 31, 2023, based on criteria established in Internal Control - Integrated Framework (2013) issued by the Committee of Sponsoring Organizations of the Treadway Commission (COSO). In our opinion, the consolidated financial statements referred to above present fairly, in all material respects, the financial position of the Company as of December 31, 2023 and 2022, and the results of its operations and its cash flows for each of the three years in the period ended December 31, 2023 in conformity with IFRS Accounting Standards as issued by the International Accounting Standards Board. Also in our opinion, the Company maintained, in all material respects, effective internal control over financial reporting as of December 31, 2023, based on criteria established in Internal Control - Integrated Framework (2013) issued by the COSO. Basis for Opinions The Company's management is responsible for these consolidated financial statements, for maintaining effective internal control over financial reporting, and for its assessment of the effectiveness of internal control over financial reporting, included in the Management’s Report on Internal Control over Financial Reporting appearing under Item 15. Our responsibility is to express opinions on the Company’s consolidated financial statements and on the Company's internal control over financial reporting based on our audits. We are a public accounting firm registered with the Public Company Accounting Oversight Board (United States) (PCAOB) and are required to be independent with respect to the Company in accordance with the U.S. federal securities laws and the applicable rules and regulations of the Securities and Exchange Commission and the PCAOB. We conducted our audits in accordance with the standards of the PCAOB. Those standards require that we plan and perform the audits to obtain reasonable assurance about whether the consolidated financial statements are free of material misstatement, whether due to error or fraud, and whether effective internal control over financial reporting was maintained in all material respects. Our audits of the consolidated financial statements included performing procedures to assess the risks of material misstatement of the consolidated financial statements, whether due to error or fraud, and performing procedures that respond to those risks. Such procedures included examining, on a test basis, evidence regarding the amounts and disclosures in the consolidated financial statements. Our audits also included evaluating the accounting principles used and significant estimates made by management, as well as evaluating the overall presentation of the consolidated financial statements. Our audit of internal control over financial reporting included obtaining an understanding of internal control over financial reporting, assessing the risk that a material weakness exists, and testing and evaluating the design and operating effectiveness of internal control based on the assessed risk. Our audits also included performing such other procedures as we considered necessary in the circumstances. We believe that our audits provide a reasonable basis for our opinions. Definition and Limitations of Internal Control over Financial Reporting A company’s internal control over financial reporting is a process designed to provide reasonable assurance regarding the reliability of financial reporting and the preparation of financial statements for external purposes in accordance with generally accepted accounting principles. A company’s internal control over financial reporting includes those policies and procedures that (i) pertain to the maintenance of records that, in reasonable detail, accurately and fairly reflect the transactions and dispositions of the assets of the company; (ii) provide reasonable assurance that transactions are recorded as necessary to permit preparation of financial statements in accordance with generally accepted accounting principles, and that receipts and expenditures of the company are being made only in accordance with authorizations of management and directors of the company; and (iii) provide reasonable assurance regarding prevention or timely detection of unauthorized acquisition, use, or disposition of the company’s assets that could have a material effect on the financial statements. Because of its inherent limitations, internal control over financial reporting may not prevent or detect misstatements. Also, projections of any evaluation of effectiveness to future periods are subject to the risk that controls may become inadequate because of changes in conditions, or that the degree of compliance with the policies or procedures may deteriorate. Critical Audit Matters The critical audit matters communicated below are matters arising from the current period audit of the consolidated financial statements that were communicated or required to be communicated to the audit committee and that (i) relate to accounts or disclosures that are material to the consolidated financial statements and (ii) involved our especially challenging, subjective, or complex judgments. The communication of critical audit matters does not alter in any way our opinion on the consolidated financial statements, taken as a whole, and we are not, by communicating the critical audit matters below, providing separate opinions on the critical audit matters or on the accounts or disclosures to which they relate. Impairment Assessments – Goodwill and long-lived assets As described in Notes 22 and 31 to the consolidated financial statements, the Company’s goodwill balance was US$ 307,112 thousand as of December 31, 2023, comprised by the goodwill allocated to the following cash generating units (CGU): Cajamarquilla in the amount of US$ 95,830 thousand, Juiz de Fora in the amount of US$ 4,972 thousand and Mining Peru in the amount of US$ 206,423 thousand. Management conducts a goodwill impairment test on an annual basis or, more frequently, if circumstances indicate that the carrying value of goodwill may be impaired. Management also evaluates impairment indicators for the long-lived assets, such as intangible, property plant and equipment and investments in associate companies. Potential impairment is identified by comparing the Fair Value Less Cost of Disposal (FVLCD) of a reporting unit to its carrying value, including goodwill, when applicable. Fair value is estimated by management using a discounted cash flow model or by market past transaction multiples. Management’s cash flow projections included significant judgments and assumptions mainly related to long-term zinc price and discount rates. The impairment assessments performed by management resulted in the recognition of an impairment loss of US$ 42,660 thousand on the goodwill allocated to the Mining Peru CGU and US$ 59,007 thousand on Morro Agudo CGU, which long-lived assets were fully impaired. Additionally, the Company recognized an impairment loss of US$ 12,976 thousand related to individual assets classified in “Assets and projects under construction”. The total impairment loss of US$ 114,643 thousand was recorded in 2023. The principal considerations for our determination that performing procedures relating to impairment assessments of the goodwill and long-lived assets is a critical audit matter are (i) the significant judgment by management when developing the fair value estimates of the CGUs; (ii) a high degree of auditor judgment, subjectivity, and effort in performing procedures and evaluating management’s significant assumptions related to long-term zinc price and discount rates; and (iii) the audit effort involved the use of professionals with specialized skill and knowledge. Addressing the matter involved performing procedures and evaluating audit evidence in connection with forming our overall opinion on the consolidated financial statements. These procedures included testing design and the effectiveness of controls relating to management’s impairment assessments, including controls related to the significant assumptions. These procedures also included, among others (i) testing management’s process for developing the fair value estimates; (ii) evaluating the appropriateness of the discounted cash flow model used by management; (iii) testing the completeness and accuracy of underlying data used in the discounted cash flow model; and (iv) evaluating the reasonableness of the significant assumptions used by management related to long-term zinc price and discount rates. Evaluating management’s assumptions related to long-term zinc price and discount rates involved evaluating whether the assumptions used by management were reasonable considering (i) the consistency with external market and industry data; and (ii) whether the assumptions were consistent with evidence obtained in other areas of the audit. Professionals with specialized skill and knowledge were used to assist in evaluating (i) the appropriateness of the discounted cash flow model and (ii) the reasonableness of the long-term zinc price and discount rates used. VAT discussions As described in Note 9 to the consolidated financial statements, the Company has incurred costs and recorded provisions, as a result of the investigation being carried out by the Fiscal Office of the State of Minas Gerais and the Public Ministry of Minas Gerais (the “MG Authorities”) with respect to certain commercial transactions and related Value-Added Taxes (VAT) between the Company and certain of its former customers. Nexa and the MG Authorities entered into two main tax agreements whereby the Company, without admitting primary responsibility for the resolved claims, agreed to make tax payments, including interest and penalties, to the State of Minas Gerais on behalf of certain former customers that allegedly failed to properly comply with their tax obligations. In connection with the first agreement signed during the third quarter of 2023, the Company recorded the total amount of US$ 75,811 thousand in "Other liabilities”, of which US$ 24,951 thousand was offset by VAT credits, US$ 6,398 thousand was offset by judicial deposits and the amount of US$ 1,515 thousand was paid in cash, while the remaining amount due will be paid in forty-six consecutive monthly installments. In connection with the second agreement signed on February 8, 2024, the Company recorded the total amount of US$ 27,128 thousand in "Other liabilities", of which US$ 10,796 thousand will be offset by VAT credits and the amount of US$ 828 thousand will be paid in cash, while the remaining amount due will be paid in fifty-nine consecutive monthly installments. The principal considerations for our determination that performing procedures relating to VAT discussions is a critical audit matter are (i) a high degree of auditor effort in performing procedures and evaluating audit evidence related to management’s assessment of the recorded amounts; (ii) the audit effort involved the use of professionals with specialized skill and knowledge; and (iii) it relates to accounts and disclosures that are material to the consolidated financial statements. Addressing the matter involved performing procedures and evaluating audit evidence in connection with forming our overall opinion on the consolidated financial statements. These procedures included testing the effectiveness of controls relating to management’s assessment of loss and provision recorded as well as financial statement disclosures. These procedures also included, among others (i) confirming with internal and external legal counsel the possibility or probability of an unfavorable outcome and the extent to which the loss is reasonably estimable; (ii) evaluating the reasonableness of management’s assessment regarding whether an unfavorable outcome is reasonably probable and reasonably estimable; and (iii) evaluating the sufficiency of the Company’s disclosures. In addition, professionals with specialized skills and knowledge were used to assist in the evaluation of the reasonableness of the estimate of loss. /s/ PricewaterhouseCoopers Auditores Independentes Ltda. Curitiba, Brazil, February 21, 2024 We have served as the Company’s auditor since 2001.
| |||||||||||||||||||||||||||||||||||||||||||||||||||||||||||||||||||||||||||||||||||||||||||||||||||||||||||||||||||||||||||||||||||||||||||||||||||||||||||||||||||||||||||||||||||||||||||||||||||||||||||||||||||||||||||||||||||||||||||||||||||||||||||||||||||||||||||||||||||||||||||||||||||||||||||||||||||||||||||||||||||||||||||||||||||||||||||||||||||||||||||||||||||||||||||||||||||||||||||||||||||||||||||||||||||||||||||||||||||||||||||||||||||||||||||||||||||||||||||||||||||||||||||||||||||||||||||||||||||||||||||||||||||||||||||||||||||||||||||||||||||||||||||||||||||||||||||||||||||||||||||||||||||||||||||||||||||||||||||||||||||||||||||||||||||||||||||||||||||||||||||||||||||||||||||||||||||||||||||||||||||||||||||||||||||||||||||||||||||||||||||||||||||||||||||||||||||||||||||||||||||||||||||||||||||||||||||||||||||||||||||||||||||||||||||||||||||||||||||||||||||||||||||||||||||||||||||||||||||||||||||||||||||||||||||||||||||||||||||||||||||||||||||||||||||||||||||||||||||||||