UNITED STATES
SECURITIES AND EXCHANGE COMMISSION
WASHINGTON, D.C. 20549
FORM 20-F
☐□ REGISTRATION STATEMENT PURSUANT TO SECTION 12(b) OR (g)
OF THE SECURITIES EXCHANGE ACT OF 1934; or
☒⌧ ANNUAL REPORT PURSUANT TO SECTION 13 OR 15(d) OF
THE SECURITIES EXCHANGE ACT OF 1934
For the fiscal year ended August 31, 2017;2019; or
☐□ TRANSITION REPORT PURSUANT TO SECTION 13 OR 15(d) OF
THE SECURITIES EXCHANGE ACT OF 1934
For the transition period from ________ to ________;1934; or
☐□ SHELL COMPANY REPORT PURSUANT TO SECTION 13 OR 15(d) OF
THE SECURITIES EXCHANGE ACT OF 1934
Date of event requiring this shell company report
For the transition period from ________ to ________;
Commission File No. 0-30895
EXFO INC.
(Exact name of Registrant as specified in its charter)
Not Applicable
(Translation of Registrant'sRegistrant’s name into English)
Canada
(Jurisdiction of incorporation or organization)
400 Godin Avenue, Quebec, Quebec, G1M 2K2, Canada
(Address of principal executive offices)
Benoit Ringuette, (418) 683-0211, benoit.ringuette@exfo.com,, (418) 683-9839, 400 Godin Avenue, Quebec, Quebec, G1M 2K2, Canada
(Name, Telephone, E-mail and/or Facsimile number and Address of Company Contact Person)
Securities registered or to be registered pursuant to Section 12(b) of the Act.
| Title of each class | Name of each exchange on which registered |
| Subordinate Voting Shares without par value | NASDAQ |
| Subordinate Voting Shares without par value | TSX |
Securities registered or to be registered pursuant to Section 12(g) of the Act.
None
(Title of Class)
Securities for which there is a reporting obligation pursuant to Section 15(d) of the Act.
None
(Title of Class)
As of August 31, 2017,2019, the registrant had 23,068,77723,703,675 Subordinate Voting Shares outstanding and 31,643,000 Multiple Voting Shares outstanding.
Indicate by check mark if the registrant is a well-known seasoned issuer, as defined in Rule 405 of the Securities Act.
Yes ☐□ No ☒⌧
If this report is an annual report or transition report, indicate by check mark if the registrant is not required to file reports pursuant to Section 13 or 15 (d) of the Securities Exchange Act of 1934.
Yes ☐□ No ☒⌧
Indicate by check mark whether the registrant (1) has filed all reports required to be filed by Section 13 or 15(d) of the Securities Exchange Act of 1934 during the preceding 12 months (or for such shorter period that the registrant was required to file such reports), and (2) has been subject to such filing requirements for the past 90 days.
Yes ☒⌧ No ☐□
Indicate by check mark whether the registrant has submitted electronically and posted on its corporate Web site, if any, every Interactive Data File required to be submitted and posted pursuant to Rule 405 of Regulation S-T (§232.405 of this chapter) during the preceding 12 months (or for such shorter period that the registrant was required to submit and post such files).
Yes ☒⌧ No ☐□
Indicate by check mark whether the registrant is a large accelerated filer, an accelerated filer, a non-accelerated filer, or an emerging growth company. See definition of "large“large accelerated filer"filer”, "accelerated filer"“accelerated filer” and "emerging“emerging growth company"company” in Rule 12b-2 of the Exchange Act.
Large accelerated filer ☐□ | Accelerated filer ☒⌧ | Non-accelerated filer ☐□ |
| | | Emerging growth company ☐□ |
Indicate by check mark which basis of accounting the registrant has used to prepare the financial statements included in this filing:
U.S. GAAP ☐□ | International Financial Reporting Standards as issued by the ☒⌧ International Accounting Standards Board | Other ☐□ |
If "Other" has been checked in response to the previous question, indicate by check mark which financial statement item the registrant has elected to follow.
Item 17 ☐ Item 18 ☐
If this is an annual report, indicate by check mark whether the registrant is a shell company (as defined in Rule 12b‑2 of the Exchange Act).
Yes ☐□ No ☒⌧
DISCLOSURE REGARDING FORWARD-LOOKING INFORMATION
This Annual Report contains forward-looking statements within the meaning of the U.S. Private Securities Litigation Reform Act of 1995, and we intend that such forward-looking statements be subject to the safe harbors created thereby. Forward-looking statements are statements other than historical information or statements of current condition. Words such as may, expect, believe, plan, anticipate, intend, could, estimate, continue, or similar expressions or the negative of such expressions are intended to identify forward-looking statements. In addition, any statements that refer to expectations, projections or other characterizations of future events and circumstances are considered forward-looking statements. They are not guarantees of future performance and involve risks and uncertainties. Actual results may differ materially from those in forward-looking statements due to various factors including, but not limited to, macroeconomic uncertainty, as well asincluding trade wars and recessions; our ability to successfully integrate businesses that we acquire; capital spending and network deployment levels in the telecommunications industry (including our ability to quickly adapt cost structures to anticipated levels of business and our ability to manage inventory levels with market demand); future economic, competitive, financial and market conditions; consolidation in the global telecommunicationscommunications test, service assurancemonitoring and analytics solutions markets and increased competition among vendors; our ability to successfully integrate businesses that we acquire; capacity to adapt our future product offering to future technological changes; limited visibility with regard to the timing and nature of customer orders; delay in revenue recognition due to longer sales cycles for complex systems involving customers'customers’ acceptance; fluctuating exchange rates; concentration of sales; timely release and market acceptance of our new products and other upcoming products; our ability to successfully expand international operations;operations and to conduct business internationally; and the retention of key technical and management personnel. Assumptions relating to the foregoing involve judgments and risks, all of which are difficult or impossible to predict and many of which are beyond our control. Other risk factors that may affect our future performance and operations are detailed in this Annual Report. We believe that the expectations reflected in the forward-looking statements are reasonable based on information currently available to us, but we cannot assure that the expectations will prove to have been correct. Accordingly, you should not place undue reliance on these forward-looking statements. These statements speak only as of the date of this document. Unless required by law or applicable regulations, we undertake no obligation to revise or update any of them to reflect events or circumstances that occur after the date of this document.
All dollar amounts in this Annual Report are expressed in US dollars, except as otherwise noted.
| Identity of Directors, Senior Management and Advisers |
Not Applicable.
| Offer Statistics and Expected Timetable |
Not Applicable.
1
The consolidated statements of earnings data for the years ended August 31, 2015, 20162017, 2018 and 20172019 and the consolidated balance sheets data as at August 31, 20162018 and 20172019 have been derived from our audited consolidated financial statements that are included elsewhere in this Annual Report on Form 20-F. Consolidated statementstatements of earnings data for the years ended August 31, 20132015 and 20142016 and consolidated balance sheets data as at August 31, 2013, 20142015, 2016 and 20152017 have been derived from our audited consolidated financial statements not included in this Annual Report on Form 20-F.
Consolidated financial statements from which the selected financial data has been derived, have been prepared in accordance with International Financial Reporting Standards (IFRS), as issued by the International Accounting Standards Board (IASB).
The selected financial data should be read in conjunction with "Item“Item 5. Operating and Financial Review and Prospects"Prospects” and our audited consolidated financial statements and the related notes thereto, included in this Annual Report on Form 20-F.
| | | Years ended August 31, | | | Years ended August 31, | |
| | | 2017 | | | 2016 | | | 2015 | | | 2014 | | | 2013 | | | 2019 | | | 2018 | | | 2017 | | | 2016 | | | 2015 | |
| | | (in thousands of US dollars, except share and per share data) | | | (in thousands of US dollars, except share and per share data) | |
| Consolidated Statements of Earnings Data: | | | | | | | | | | | | | | | | | | | | | | | | | | | | | | |
| Sales | | $ | 243,301 | | | $ | 232,583 | | | $ | 222,089 | | | $ | 230,806 | | | $ | 242,150 | | | $ | 286,890 | | | $ | 269,546 | | | $ | 243,301 | | | $ | 232,583 | | | $ | 222,089 | |
| | | | | | | | | | | | | | | | | | | | | | | | | | | | | | | | | | | | |
Cost of sales (1) | | | 94,329 | | | | 87,066 | | | | 85,039 | | | | 86,836 | | | | 92,469 | | | 118,677 | | | 105,004 | | | 94,329 | | | 87,066 | | | 85,039 | |
Selling and administrative (2) | | | 86,256 | | | | 82,169 | | | | 82,200 | | | | 86,429 | | | | 88,756 | | | 98,646 | | | 98,794 | | | 86,256 | | | 82,169 | | | 82,200 | |
| Net research and development | | | 47,168 | | | | 42,687 | | | | 44,003 | | | | 44,846 | | | | 45,444 | | | 50,553 | | | 57,154 | | | 47,168 | | | 42,687 | | | 44,003 | |
| Depreciation of property, plant and equipment | | | 3,902 | | | | 3,814 | | | | 4,835 | | | | 4,995 | | | | 6,028 | | | 5,469 | | | 5,444 | | | 3,902 | | | 3,814 | | | 4,835 | |
| Amortization of intangible assets | | | 3,289 | | | | 1,172 | | | | 2,883 | | | | 4,398 | | | | 6,643 | | | 9,012 | | | 10,327 | | | 3,289 | | | 1,172 | | | 2,883 | |
| Changes in fair value of cash contingent consideration | | | (383 | ) | | ‒ | | | ‒ | | | ‒ | | | ‒ | | | – | | | (670 | ) | | (383 | ) | | – | | | – | |
| Interest and other (income) expense | | | 303 | | | | (828 | ) | | | (155 | ) | | | (326 | ) | | | (113 | ) | | 718 | | | 1,378 | | | 303 | | | (828 | ) | | (155 | ) |
| Foreign exchange (gain) loss | | | 978 | | | | (161 | ) | | | (7,212 | ) | | | (1,634 | ) | | | (4,082 | ) | | 949 | | | (1,309 | ) | | 978 | | | (161 | ) | | (7,212 | ) |
Unusual charge (2) | | ‒ | | | ‒ | | | | 603 | | | | 720 | | | | 540 | | | – | | | – | | | – | | | – | | | 603 | |
| Earnings before income taxes | | | 7,459 | | | | 16,664 | | | | 9,893 | | | | 4,542 | | | | 6,465 | | |
Share in net loss of an associate | | | – | | | 2,080 | | | – | | | – | | | – | |
| Gain on deemed disposal of the investment in an associate | | | – | | | | (2,080 | ) | | – | | | – | | | – | |
| Earnings (loss) before income taxes | | | 2,866 | | | (6,576 | ) | | 7,459 | | | 16,664 | | | 9,893 | |
| Income taxes | | | 6,608 | | | | 7,764 | | | | 5,036 | | | | 4,286 | | | | 5,519 | | | | 5,346 | | | | 5,678 | | | | 6,608 | | | | 7,764 | | | | 5,036 | |
| Net earnings for the year | | $ | 851 | | | $ | 8,900 | | | $ | 4,857 | | | $ | 256 | | | $ | 946 | | |
| Basic net earnings per share | | $ | 0.02 | | | $ | 0.17 | | | $ | 0.09 | | | $ | 0.00 | | | $ | 0.02 | | |
| Diluted net earnings per share | | $ | 0.02 | | | $ | 0.16 | | | $ | 0.08 | | | $ | 0.00 | | | $ | 0.02 | | |
| Basic weighted average number of shares used in per share calculations (000's) | | | 54,423 | | | | 53,863 | | | | 56,804 | | | | 60,329 | | | | 60,323 | | |
| Diluted weighted average number of shares used in per share calculations (000's) | | | 55,555 | | | | 54,669 | | | | 57,457 | | | | 61,015 | | | | 61,110 | | |
Net earnings (loss) for the year | | | (2,480 | ) | | (12,254 | ) | | 851 | | | 8,900 | | | 4,857 | |
| Net loss for the year attributable to non-controlling interest | | | – | | | | (352 | ) | | – | | | – | | | – | |
| Net earnings (loss) for the year attributable to parent interest | | | $ | (2,480 | ) | | $ | (11,902 | ) | | $ | 851 | | | $ | 8,900 | | | $ | 4,857 | |
| Basic net earnings (loss) attributable to parent interest per share | | | $ | (0.04 | ) | | $ | (0.22 | ) | | $ | 0.02 | | | $ | 0.17 | | | $ | 0.09 | |
| Diluted net earnings (loss) attributable to parent interest per share | | | $ | (0.04 | ) | | $ | (0.22 | ) | | $ | 0.02 | | | $ | 0.16 | | | $ | 0.08 | |
| Basic weighted average number of shares used in per share calculations (000’s) | | | 55,325 | | | 54,998 | | | 54,423 | | | 53,863 | | | 56,804 | |
| Diluted weighted average number of shares used in per share calculations (000’s) | | | 55,325 | | | 54,998 | | | 55,555 | | | 54,669 | | | 57,457 | |
| Other Consolidated Statements of Earnings Data: | | | | | | | | | | | | | | | | | | | | | | | | | | | | | | | | | | | |
| Gross research and development | | $ | 53,124 | | | $ | 47,875 | | | $ | 50,148 | | | $ | 52,423 | | | $ | 54,334 | | | $ | 57,972 | | | $ | 65,243 | | | $ | 53,124 | | | $ | 47,875 | | | $ | 50,148 | |
| Net research and development | | $ | 47,168 | | | $ | 42,687 | | | $ | 44,003 | | | $ | 44,846 | | | $ | 45,444 | | |
2
| | | As at August 31, | | | As at August 31, | |
| | | 2017 | | | 2016 | | | 2015 | | | 2014 | | | 2013 | | | 2019 | | | 2018 | | | 2017 | | | 2016 | | | 2015 | |
| | | (in thousands of US dollars) | | | (in thousands of US dollars) | |
| Consolidated Balance Sheets Data: | | | | | | | | | | | | | | | | | | | | | | | | | | | | | | |
Cash | | $ | 38,435 | | | $ | 43,208 | | | $ | 25,864 | | | $ | 54,121 | | | $ | 45,386 | | | $ | 16,518 | | | $ | 12,758 | | | $ | 38,435 | | | $ | 43,208 | | | $ | 25,864 | |
Short-term investments | | | 775 | | | | 4,087 | | | | 1,487 | | | | 5,726 | | | | 4,868 | | | 2,918 | | | 2,282 | | | 775 | | | 4,087 | | | 1,487 | |
Total assets | | | 259,241 | | | | 237,793 | | | | 217,478 | | | | 276,948 | | | | 280,982 | | | 277,602 | | | 284,544 | | | 259,241 | | | 237,793 | | | 217,478 | |
Long-term debt (excluding current portion) | | | 3,293 | | | 5,907 | | | – | | | – | | | – | |
Share capital | | | 90,411 | | | | 85,516 | | | | 86,045 | | | | 111,491 | | | | 109,837 | | | 92,706 | | | 91,937 | | | 90,411 | | | 85,516 | | | 86,045 | |
Shareholders' equity | | $ | 196,790 | | | $ | 181,401 | | | $ | 169,227 | | | $ | 230,287 | | | $ | 235,896 | | |
Shareholders’ equity | | | $ | 172,564 | | | $ | 177,921 | | | $ | 196,790 | | | $ | 181,401 | | | $ | 169,227 | |
| (1) | The cost of sales is exclusive of depreciation and amortization, shown separately. |
| (2) | Selling and administrative is exclusive of unusual charge, shown separately, which represents bad debt expenses. |
| Capitalization and Indebtedness |
Not Applicable.
| C. | Reasons for the Offer and Use of Proceeds |
Not Applicable.
Our business may be adversely affected by unfavorable general economic and market conditions.
Our business is subject to general global and regional economic conditions, particularly those in the telecommunicationscommunications test, service assurancemonitoring and analytics markets. In the past, our operating results were adversely affected by unfavorable economic conditions and reduced or delayed capital spending in the Americas, Europe, Middle East and Africa (EMEA) as well as Asia-Pacific regions.
Global and regional economic conditions continue to be volatile and uncertain. If global and/or regional economic and market conditions, or economic conditions in key markets, remain uncertain or deteriorate into a recession, we may experience material adverse effects on our business. Unfavorable and/or uncertain economic and market conditions may result in lower capital spending or delayed spending by our customers on network test, service assurancemonitoring and analytics solutions and, therefore, demand for our products could decline and adversely impact our revenue. Adverse economic and/or market conditions could also result in, among other things:
difficulty in forecasting, budgeting and planning due to the uncertain spending plans of current or prospective customers;
· | difficulty in forecasting, budgeting and planning due to the uncertain spending plans of current or prospective customers; |
increased competition for fewer network projects and sales opportunities;
· | increased competition for fewer network projects and sales opportunities; |
increased pricing pressure that may adversely affect revenue and gross margin;
· | increased pricing pressure that may adversely affect revenue and gross margin; |
higher cost structure compared to revenue level;
· | higher cost structure compared to revenue level; |
increased risk of charges related to excess and obsolete inventories, write-offs of deferred tax assets and tax credits, and impairment of intangible assets and goodwill;
· | increased risk of charges related to excess and obsolete inventories, write-offs of deferred tax assets and tax credits, and impairment of intangible assets and goodwill; |
customers’ financial difficulties and increased difficulty in collecting accounts receivable;
· | customers' financial difficulties and increased difficulty in collecting accounts receivable; and |
additional restructuring costs; and
· | additional restructuring costs. |
increased protectionism or international trade barriers.
These effects, as well as any other unforeseeable effects, are difficult to forecast and mitigate. As a result, we may experience material adverse effects on our business, operating results, financial condition, and stock price.
3
Geopolitical and economic policies favoring national interests could adversely affect our results of operations.
Our overall performance depends to a certain extent upon international economic and political conditions. Many of our suppliers, vendors, partners and other entities with whom we do business have ties to China, and their ability to supply materials to us or otherwise work with us is strongly affected by their ability to do business in China. If the United States’ relationship with China deteriorates or results in additional protectionist measures, retaliatory actions, more tariffs, increased barriers, increased import and export licensing requirements, or other restrictions or policies that favor domestic industries, then our operations may be adversely affected.
We have significant operations, including a large number of employees, R&D centers and other facilities in the United States, United Kingdom, France, India, Finland and Canada, among other countries. Nationalistic economic policies and political trends in some of these territories, such as opposition to globalization and free trade, sanctions or trade restrictions, withdrawal from or re-negotiation of global trade agreements, tax policies that favor domestic industries and interests, the anticipated exit of the United Kingdom from the European Union (known as Brexit), the distancing or potential exit of other countries from the European Union, and other similar actions may result in increased transaction costs, reduced ability to hire employees, diminished access to supplies and materials, lower demand or access to customers in international markets, and inability to conduct our operations as they have been conducted historically. Each of these factors may adversely affect our business.
Fluctuations in the exchange rates between the Canadian dollar, US dollar, euro, British Pound and other currencies may adversely affect our revenues and operating results.
Our functional currency is the Canadian dollar, but we report our results in US dollars. As a result, any increase in the value of the US dollar versus the Canadian dollar, euro and British Pound could adversely affect our revenues because we generate a certain percentage of our sales in Canadian dollars, euros and British Pounds but we report them in US dollars in our financial statements.
We are also exposed to a currency risk in terms of operating results for any fluctuation in the exchange rate between the Canadian dollar, on one hand, and the US dollar, euro, British Pound and other currencies on the other. In fact, the majority of our revenues are denominated in US dollars, euros and British Pounds, but a significant portion of our cost of sales, operating expenses and capital expenditures are denominated in Canadian dollars, US dollars, euros and other currencies such as euros, British Pounds, Rupees (India) and Renminbis (China). Even though we partially manage our exposure to currency risks with forward exchange contracts (by selling US dollars for Canadian dollars and US dollars for Indian Rupees) and even though certainsome of our operating expenses are denominated in currencies other than the Canadian dollar, namely the US dollar, euro and British Pound, we remain exposed to fluctuations in the exchange rates between the Canadian dollar, on one hand, and the US dollar, euro and other currencies on the other. Any increase in the value of the Canadian dollar relative to the US dollar and other currencies, or any unfavorable variance between the value of the Canadian dollar and the contractual rates of our US-Canadian dollar forward exchange contracts, could result in increased expenses reported in US dollars or foreign exchange losses and have a material adverse effect on our operating results.
Foreign exchange rate fluctuations also flow through statement of earnings line items, since a significant portion of our cost of sales and operating expenses are denominated in Canadian dollars, euros, British Pounds and Indian rupees, and we report our results in US dollars. Any decrease in the value of the US dollar relative to the Canadian dollar and other currencies, could have a material adverse effect on our operating results and provide competitive advantages to our competitors.
We must continue to overcome significant competition in our targeted industries in order to keep or gain market share and achieve our growth strategy.
The market for our business activity ─ namely designing, manufacturing, marketing and selling test, service assurancemonitoring and analytics solutions for communications service providers, data center, cloud and web-scale operators as well as network equipment manufacturers ─ is rapidly evolving and is marked by intense competition, consolidation and technical innovation. We anticipate the pace of change to remain high or even accelerate for our targeted industriesmarkets in the future. We might see the emergence of new competitors or the consolidation of current competitors, as the markets for telecommunicationscommunications test, service assurancemonitoring and analytics solutions evolve in response to technical innovations and economic conditions.
Main competitors in the test equipmentand measurement environment include global suppliers like Anritsu Corporation, Fortive Corporation (Fluke Networks), Keysight and Viavi Solutions, as well as othersmaller players such as AFL Noyes, Keysight (IXIA),Deviser Instruments, Kingfisher International, ShinewayTech, Spirent Communications plc,Shineway Tech, VeEX Inc., and Yokogawa Electric Corporation. On the service assurance, systems and analyticsservices side, we mainly compete against Accedian Networks, Anritsu Corporation, Empirix, Keysight (IXIA), Netrounds, NetScout Systems, Inc., Elisa (Polystar), Radcom, Spirent Communications plc, and Viavi Solutions.
Some competitors have greater financial, technical and/or marketing resources than us. Consequently, they may be able to devote greater resources to the development, marketing, manufacturing, selling and support of their products in order to capture market share.
Competitors also may be better positioned than us to capture market share or to acquire companies and new technologies that would potentially displace our products or render them obsolete. We cannot predict whether current or future competitors will develop or market products that offer higher performance, more features, or are more cost-effective than our current or future products. To remain competitive and achieve our growth strategy, we must develop products internally or purchase technologies through acquisitions that offer higher performance and more functionality, in current and new sectors, so that we can increase our market share. Our failure to do so may harm our business, results of operations and financial condition.
We may not be able to make the acquisitions or strategic alliances needed for the development of our business and, if we do make such acquisitions or strategic alliances, we may not be able to successfully integrate the acquired businesses, products, technologies and personnel or realize the expected benefits of strategic alliances.
We intend to carefully seek businesses through acquisitions and alliances, whose products and technologies are complementary to ours, or which will enable us to expand our markets and/or our market share. For example, we made two technology acquisitions in fiscal 2017, namely Absolute Analysis and Ontology Systems. Following the year-end, we closed the acquisition of Yenista Optics and are in the process of acquiring publicly held Astellia via a public tender offer. However, we may not be able to make any such beneficial transactions or a sufficient number of such transactionsthem in the future to meet our strategic goals. Our competitors may be in a better position to acquire the same businesses, products and technologies that we wishwant to acquire. Our fluctuating stock price, cash position, or ability to raise capital or issue debt on favorable terms at the time of an acquisition may also affect our ability to complete such an acquisition. Acquisitions or alliances could also distract management'smanagement’s attention from our day-to-day business and operations. In the event of any future acquisition or strategic alliance, we could, among other things:
issue shares that would dilute individual shareholder percentage ownership;
incur additional debt, be subject to additional debt covenants, and incur additional interest expense;
assume liabilities and commitments;
incur significant expenses related to acquisition costs;
incur significant expenses related to amortization of additional intangible assets;
incur significant impairment losses of goodwill and intangible assets related to such acquisitions; and
incur losses from operations.
· | issue shares that would dilute individual shareholder percentage ownership; |
· | incur debt and be required to comply with debt covenants; |
· | assume liabilities and commitments; |
5· | incur significant expenses related to acquisition costs; |
· | incur significant impairment losses of goodwill and intangible assets related to such acquisitions; and |
· | incur losses from operations. |
In the event we complete acquisitions or sign strategic alliances, we may be unable to successfully integrate acquired companies or realize the expected benefits of alliances. Integration risks include, among other things:
· | the risk of not realizing the expected benefits or synergies from such acquisitions or alliances; |
problems integrating the acquired operations, technologies, products and personnel;
· | problems integrating the acquired operations, technologies, products and personnel; |
risks associated with the transfer of acquired know-how and technology;
· | risks associated with the transfer of acquired know-how and technology; |
unanticipated costs or liabilities;
· | unanticipated costs or liabilities; |
diversion of management’s attention from our core business;
· | diversion of management's attention from our core business; |
adverse effects on existing business relationships with suppliers and customers;
· | adverse effects on existing business relationships with suppliers and customers; |
risks associated with entering markets in which we have no or limited prior experience; and
· | risks associated with entering markets in which we have no or limited prior experience; and |
potential loss of key employees, particularly those of acquired organizations.
· | potential loss of key employees, particularly those of acquired organizations. |
Ultimately, the failure to make acquisitions or strategic alliances, or the inability to effectively integrate acquisitions and realize the expected benefits of alliances, could disrupt our overall business and harm our financial condition.
If we fail to adapt appropriately to the challenges associated with operating internationally, the expected growth of our business may be impeded, and our operating results may be affected.
For the fiscal year ended August 31, 2017,2019, customers outside of Canada accounted for 90.7%94.5% of our sales. Our international sales will be limited if we cannot establish and maintain relationships with international distributors, set up additional foreign operations, expand international sales channel management, hire additional personnel, develop relationships with international communications service providers, web-scale operators and network equipment manufacturers, and operate adequate after-sales support internationally.
Even if we are able to successfully operate and expand our international operations, we may not be able to maintain or increase international market demand for our products. Our international operations are subject to a number of risks, including, among other things:
· | challenges in staffing and managing foreign operations due to the limited number of qualified candidates, employment laws and business practices in foreign countries, any of which could increase the cost and reduce the efficiency of operating in foreign countries; |
· | fluctuations among currencies; |
· | our inability to comply with import/export, environmental and other trade compliance regulations of the countries in which we do business, together with unexpected changes in such regulations, including NAFTA renegotiations; |
· | measures to ensure that we design, implement and maintain adequate and effective controls over our financial processes and reporting in the future; |
· | failure to adhere to laws, regulations and contractual obligations relating to customer contracts in various countries; |
· | difficulties in establishing and enforcing our intellectual property rights; |
· | inability to maintain a competitive list of distributors for indirect sales; |
· | tariffs and other trade barriers; |
· | economic instability in foreign markets, including Britain's decision to exit the European Union and the impact this choice may have on doing business in Europe; |
· | wars, acts of terrorism and political unrest; |
· | language and cultural barriers; |
· | lack of integration of foreign operations; |
· | potential foreign and domestic tax consequences; |
· | technology standards that differ from those on which our products are based, which could require expensive redesign and retention of personnel familiar with those standards; |
· | longer accounts receivable payment cycles and possible difficulties in collecting payments which may increase our operating costs and hurt our financial performance; and |
· | failure to meet certification requirements. |
fluctuations among currencies;
our inability to comply with import/export, environmental and other trade compliance regulations of the countries in which we do business, together with unexpected changes in such regulations and bilateral trade agreements between countries;
measures to ensure that we design, implement and maintain adequate and effective controls over our financial processes and reporting in the future;
failure to adhere to laws, regulations and contractual obligations relating to customer contracts in various countries;
difficulties in establishing and enforcing our intellectual property rights;
inability to maintain a competitive list of distributors for indirect sales;
tariffs and other trade barriers, including those between the US and China;
economic instability in foreign markets, including Britain’s decision to exit the European Union, and the impact this choice may have on doing business in Europe;
wars, acts of terrorism and political unrest;
language and cultural barriers;
lack of integration of foreign operations;
potential foreign and domestic tax consequences;
technology standards that differ from those on which our products are based, which could require expensive redesign and retention of personnel familiar with those standards;
longer accounts receivable payment cycles and possible difficulties in collecting payments which may increase our operating costs and hurt our financial performance; and
failure to meet certification requirements.
Any of these factors could harm our international operations and negatively affect our business, results of operations and financial condition. The recurrence of weakness in these economies or of weakness in other foreign economies could also have a significant negative effect on our future operating results.
Our reliance on software development resources in India and manufacturing personnel in China may expose us to unanticipated costs or liabilities.
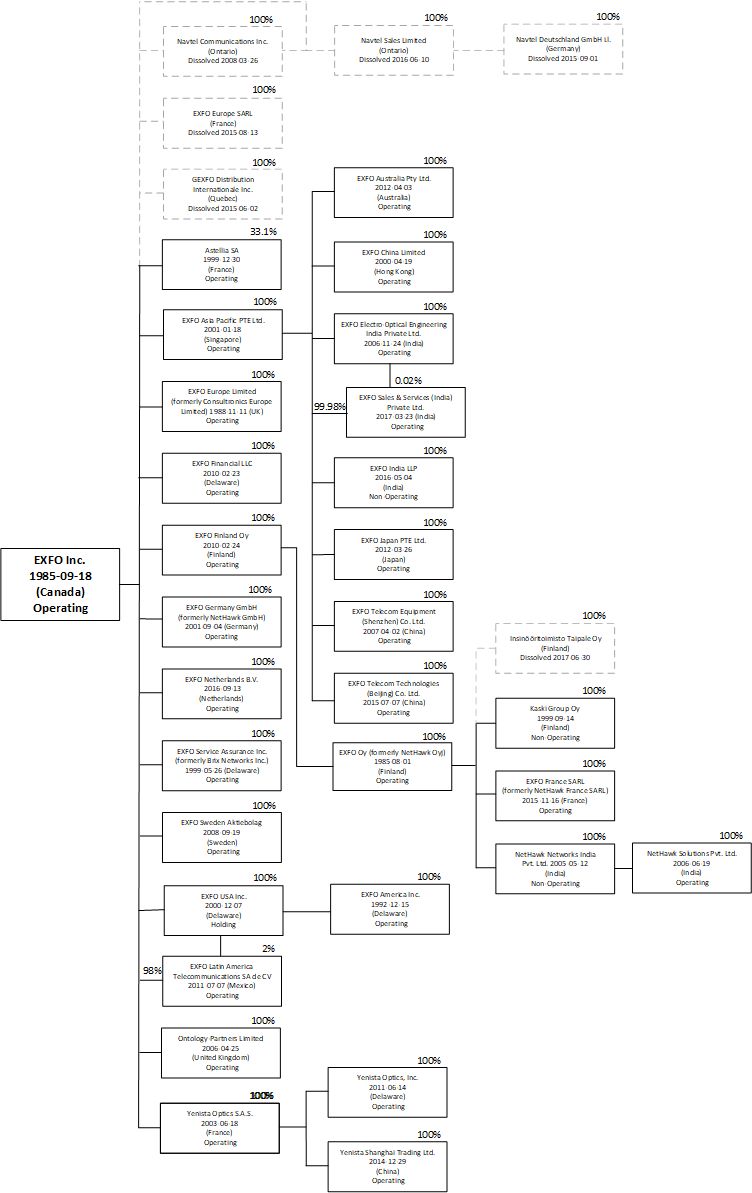
In addition to research and development centers in Quebec City, Canada, Montreal, Canada, Concord, Canada, Boston, United States,Oulu, Finland, Rennes, France, Lannion, France and Oulu, Finland,Valencia, Spain, we maintain a software development center in Pune, India. We also manufacture products at our wholly-owned production facility in Shenzhen, China.
Over the years, we have significantly increased our software development and manufacturing activities in India and China, respectively. There is no assurance that our reliance on software development resources in India and manufacturing personnel in China will enable us to maintain our cost structure at current levels, achieve additional cost savings, or generate greater resource efficiency. Furthermore, our software development and manufacturing efforts abroad involve significant risks in addition to the ones disclosed in other risk factors:
· | difficulty in hiring and retaining appropriate engineering and manufacturing resources due to intense competition for such resources and resulting wage inflation; |
difficulty in hiring and retaining appropriate engineering and manufacturing resources due to intense competition for such resources and resulting wage inflation;· | exposure to misappropriation of intellectual property and proprietary information; |
exposure to misappropriation of intellectual property and proprietary information;
· | heightened exposure to changes in the economic, regulatory, security, and political conditions of these countries; |
heightened exposure to changes in the economic, regulatory, security, and political conditions of these countries;
· | fluctuations in currency exchange rates; |
fluctuations in currency exchange rates;
· | changes in tax laws and regulations in India and China, including transfer pricing policies; |
changes in tax laws and regulations in India and China, including transfer pricing policies;
· | cash management and repatriation of profit; and |
cash management and repatriation of profit; and
· | high inflation rates which could increase our operating costs. |
high inflation rates which could increase our operating costs and render these operations too expensive.
If we are unable to adapt to current and future changes in technology or if we are unable to introduce new and enhanced products on a timely basis, our products may become obsolete, which could prevent us from achieving our growth strategy and adversely affect our operating results.
The industriesmarkets that we serve are characterized by rapidly evolving technology and industry standards that result in frequent new product introductions. For example, we are gradually transforming ourselves from a supplier of dedicated test instruments into a supplier of end-to-end service assurancesoftware-intensive monitoring and analytics solutions to meet the emerging needs of communications service providers, who are increasingly virtualizing their networks or specific network functions.providers. While we are devoting substantial resources to meet these needs, this trend may result in lower demand for our hardware test equipment. Additionally, barriers to entry are generally lower for such software-based solutions, which may lead to increased competition for our products and services. Any failure by us to anticipate or respond to new technological developments, customer requirements or evolving standards could cause us to incur significant impairment losses of goodwill and/or losses from operations. Consequently, this could have a material adverse effect on our business, results of operations and financial condition. The development of proprietary technology entails significant technical and business risks and requires substantial expenditures and lead times. The success of our new product introductions will depend on several factors, including, among other things, our ability to:
· | properly identify and anticipate customer needs; |
properly identify and anticipate customer needs;
· | innovate and develop new products on a timely basis; |
innovate and develop new products on a timely basis;
· | gain timely market acceptance for new products; |
gain timely market acceptance for new products;
· | manufacture and deliver our new products on time, in sufficient volume and with adequate quality; |
manufacture and deliver our new products on time, in sufficient volume and with adequate quality;
· | price our products competitively; |
price our products competitively;
· | continue investing in our research and development programs; |
continue investing in our research and development programs;
· | anticipate competitors' announcements of new products; and |
anticipate competitors’ announcements of new products; and
· | successfully transform the company into an end-to-end service assurance and analytics supplier. |
successfully transform the company into an end-to-end monitoring and analytics supplier.
Failure to do the above could be exploited by our competitors. If we lose market share due to lapses in our product development, our business would suffer.
7
Markets for the 5G infrastructure investment cycle may not develop in the manner or in the time period that we anticipate. If global economic conditions worsen, overall spending on 5G infrastructure may be reduced, which would adversely impact demand for our solutions in these markets. In addition, unfavorable developments with evolving laws and regulations worldwide related to 5G may limit or slow the rate of global adoption, impede our strategy and negatively affect our long-term expectations in this area. Even if the 5G infrastructure market and rate of adoption develop in the manner or in the time period that we anticipate, if we do not have timely, competitively priced, market-accepted solutions available to meet our customers’ planned rollout of 5G platforms and systems, we may miss a significant market opportunity and our business, financial condition, results of operations and cash flows could be materially and adversely affected.
We offer technical support services for many of Contents
We have faced pricing pressure on our existing products and expect this pressure will continue. If we do not continue to lower our manufacturing costs or introduce new products with higher margins, our gross margin may decrease, and our operating results may be adversely affected.
Increased competition in the telecommunicationscommunications test, service assurancemonitoring and analytics markets, along with consolidation among competitors and customers, will likely result in ongoing downward pressure on average selling prices. For example, some of our customers have been subject to consolidation and could obtain products from a vendor other than us or demand more favorable terms and conditions from us, which would harmus. This, in turn, may negatively affect our sales and operating results.gross margin. In addition, some customers may merge with or acquire our competitors and discontinue their relationships with us. This, in turn, may negatively affect our gross margin. Pricing pressure can result from a number of factors such as, among other things:
· | increased competition for business; |
· | limited number of potential customers; |
· | competition from companies with lower production costs, including companies operating in lower-cost environments; |
· | introduction of new products by competitors; |
· | greater economies of scale for higher-volume competitors; |
· | large customers, who buy in high volumes, can exert substantial negotiating leverage over us; and |
· | resale of used equipment. |
limited number of potential customers;
competition from companies with lower production costs, including companies operating in lower-cost environments;
introduction of new products by competitors;
greater economies of scale for higher-volume competitors;
large customers, who buy in high volumes, can exert substantial negotiating leverage over us; and
resale of used equipment.
As pricing pressure will likely continue to affect our existing products, we may have to increase the number of units sold to maintain our existing sales levels. If we are unable to increase our sales levels, lower our manufacturing costs, or introduce new products with higher margins, our gross margin may decline, and our operating results may suffer.
Our products may have unforeseen defects, offer substandard technical specifications or fail to deliver the key features that customers want, all of which could harm our reputation, impede market acceptance of our products and negatively impact our business, results of operations and financial condition.
Given their complexity, our products may contain undetected software or hardware defects, inaccurate calibration or compatibility problems, or regulatory compliance issues, particularly when they are first introduced or when new versions are released. Our new products could also be substandard in terms of technical specifications or fail to deliver the key features that customers want. There can be no assurance that, despite our testing and diligent efforts, defects will not be found in new products after they have been fully deployed and operated under peak stress conditions, or that customized products will meet customer sign-off acceptance requirements. If we are unable to fix defects or other problems or meet customcustomized requirements, we could experience, among other things:
· | additional development and support costs; |
additional development and support costs;
· | product returns or recalls; |
product returns or recalls;
· | damage to our brand reputation; |
damage to our brand reputation;
· | loss of customers, failure to attract new customers or achieve market acceptance; |
loss of customers, failure to attract new customers or achieve market acceptance;
· | diversion of development and engineering resources; |
diversion of development and engineering resources;
· | legal actions by our customers, including claims for consequential damages and loss of profits; and |
legal actions by our customers, including claims for consequential damages and loss of profits; and
· | legal actions by governmental entities, including actions to impose product recalls and/or forfeitures. |
legal actions by governmental entities, including actions to impose product recalls and/or forfeitures.
The occurrence of any one or more of the foregoing could seriously harm our business, results of operations and financial condition.
Our intellectual property and proprietary technology are important to the continued success of our business. Our failure to protect this proprietary technology may significantly impair our competitive position.
Our success and ability to compete depend to a significant extent on our proprietary technology, with which we attempt to prevent others from using the innovations that are central to our existing and future products. As of August 31, 2017,2019, our records indicatedindicate that we held the following portfolio of utility patents: 7594 active granted US patents, 50118 granted or validated patents in European countries of the European Union, 8 patents in Canada, 15 patents in China, and 745 patents in other jurisdictions. In addition, we have 2153 utility patent applications (including provisional applications) pending in the US, 2619 utility patent applications at the European Patent Office or directly entered at the nationalpending in Europe and 19 utility patent office of an EU member country, 3 applications in Canada, 14 applications in China and 7 applicationspending in other countries. The expiration dates of our active issued patents range from 20182019 to 2037, with no significant active patent expiring in the near future.
Our records also indicatedindicate that, as of August 31, 2017,2019, we held 2636 active granted design patents, as well as 411 pending design patent applications, in the United States, Europe, China and several other international jurisdictions.
We also rely on a combination of copyright and trademark laws, trade secrets, confidentiality procedures, contractual provisions and license agreements to protect our proprietary technology.
We may have to engage in litigation, formal opposition proceedings, or the like to defend our patents and other intellectual property rights or to determine the validity or scope of the proprietary rights of others. Such litigation and opposition proceedings can be time-consuming and expensive, regardless of whether we win or lose.
The process of seeking patent protection can be long and expensive and we cannot be certain that any currently pending or future application will actually result in issued patents, or that, even if a patent is issued in a particular jurisdiction, it will not be subsequently invalidated at the patent office as a result of a third-party-initiated opposition procedure. Moreover, we cannot be certain that an issued patent will be of sufficient scope or strength to provide meaningful protection or commercial advantage to us.
We also rely on trade secret protection for our technology, in part through confidentiality agreements with our employees, consultants, distributors and third parties. However, these agreements may be breached or otherwise rendered ineffective and we may not have adequate remedies for any breach or shortfall of these agreements. In any case, others may come to know about our trade secrets through a variety of methods. In addition, the laws of some jurisdictions in which we sell our products may not protect our intellectual property rights to the same extent as do the laws of Canada and the United States.
Our intellectual property rights, particularly our existing or future patents, may be invalidated, circumvented, challenged or required to be licensed to others.
Our intellectual property rights are important assets for us. Various events outside of our control pose a threat to our intellectual property rights, as well as to our products, services and technologies. For example, effective intellectual property protection may not be available in every country in which our products and services are distributed. Also, the efforts we have undertaken to protect our proprietary rights may not be sufficient or effective.
Furthermore, others may develop technologies that are similar or superior to our technology, duplicate or reverse engineer our technology, or design around the patents owned or licensed by us. We cannot be sure that the steps that we take to protect our technology will prevent misappropriation or infringement. If we fail or are unable to protect our technology, thereby enabling others to copy or use it, we will be less able to differentiate our products and our sales may decline.
Others may claim that our products infringe upon their intellectual property rights, or they may infringe our intellectual property, and we may expend significant resources enforcing or defending our rights or suffer competitive injury.
Litigation regarding intellectual property rights is common in the technology industry and third-party infringement claims involving technologies may increase. If an infringement claim is filed against us, we may be prevented from using some of our technologies and may incur significant costs to resolve the claim. Conversely, we may be required to spend significant resources to monitor and enforce our intellectual property rights.
Non-practicingWhile non-practicing entities (NPEs – also informally known as "patent trolls"“patent trolls”) are increasinglycontinually asserting patent claims against companies working in the Information and Communications Technology domain. Becausedomain, “trademark trolls” are also becoming increasingly common. These “trademark trolls” will file trademarks in countries where the trademark has not yet been registered. In both cases, because their entire business model is predicated upon undertaking legal action to extract licensing and/or royalty fees from legitimate "practicing"“practicing” entities, such as EXFO, they often initiate such litigation even if the purported relevance of their trademark or patent claims may be questionable. Consequently, we may be obliged to reach a negotiated monetary settlement or embark upon costly legal proceedings if an NPEa “patent troll” or a ‘’trademark troll’’ asserts such claims against us.
More generally, we could incur substantial costs in defending ourselves and our customers against infringement claims asserted by any third party (including notably competitors), or in bringing infringement claims against others. Litigation could also adversely affect sales of the challenged product or technology and divert the efforts of our management and technical personnel. In the event of an infringement claim, we may be required to obtain one or more licenses from third parties. We cannot assure you that we, or our customers, could obtain necessary licenses from third parties at a reasonable cost or at all. If we fail to obtain a license where one is required, we could incur substantial liabilities and be forced to suspend the marketing of the challenged products.
Our use of open source software in our products could adversely affect our ability to sell our products and subject us to possible litigation.
Some of our products contain software licensed to us by third-party authors under "open source"“open source” licenses. If our proprietary commercial software were to incorporate open source software, we might, under the terms of certain open source licenses, be required to license that combined software as well as release the source code of the combined software to third parties. This could allow third parties to use our proprietary software at no charge, could enable our competitors to create similar products with lower development effort and time, and ultimately could result in a loss of product sales and lower revenues for us.
We also could be subject to suits by parties claiming infringement of intellectual property rights in what we believe to be licensed open source software. Moreover, we cannot assure you that our internal processes for controlling our use of open source software in our products will be effective. If we are held to have breached the terms of an open source software license, we could be required to seek licenses from third parties to continue offering our products, to re-engineer our products, to discontinue the sale of our products if re-engineering could not be accomplished in a timely manner, to allow third parties to use our products at no charge under the terms of that open source software license, or to make generally available, in source code form, our proprietary software, any of which could adversely affect our business, operating results, and financial condition.
Our quarterly revenues and operating results are subject to significant fluctuations and you should not rely on them as an indication of our future performance.
Our sales and operating results have fluctuated from quarter to quarter in the past and significant fluctuations may occur in the future. Given that orders for our service assurancemonitoring and analytics solutions vary in size and complexity and in certain instances require customer acceptance before revenue recognition occurs, our sales may fluctuate significantly on a quarterly basis. As well, many of our deals involve lengthy sales cycles, contract negotiations, professional services, as well as extensive product testing, installation, laboratory or network certification, including network-specific or region-specific processes. In addition, our sales and operating results generally depend on the volume and timing of the orders we receive from customers as well as our ability to fulfill received orders.
On the other hand, our cost of sales and operating expenses, which include manufacturing overhead costs, selling and administrative, research and development, as well as depreciation and amortization expenses, are relatively fixed in the short term. If we sell fewer products than anticipated, if there is a delay in the launch of new products, or if prices for our products decline, we may not be able to quickly reduce our cost of sales and operating expenses in response to lower sales. Factors that could affect the amount and timing of our sales and cause quarterly fluctuations in our revenue and operating results include, among other things:
· | length of the sales cycle for certain products, especially those that are higher priced and more complex; |
length of the sales cycle for certain products, especially those that are higher priced and more complex;· | sales cycle prolonged by lengthy customer acceptance; |
sales cycle prolonged by lengthy customer acceptance;
· | timing of product launches and market acceptance of our new products as well as those of our competitors; |
timing of product launches and market acceptance of our new products as well as those of our competitors;
· | our ability to sustain product volumes and high levels of quality across all product lines; |
our ability to sustain product volumes and high levels of quality across all product lines;
· | timing of shipments for large orders; |
timing of shipments for large orders;
· | effect of seasonality on sales and bookings; and |
effect of seasonality on sales and bookings; and
· | losing key accounts and not successfully developing new ones. |
losing key accounts and not successfully developing new ones.
Our sales and operating results could also be volatile due to a number of factors, some of which we have little or no control over, including, without limitation:
· | fluctuating demand for test, service assurance and analytics solutions; |
fluctuating demand for test, monitoring and analytics solutions;
· | changes in the capital spending and operating budgets of our customers, which may cause seasonal or other fluctuations in product mix, volume, timing and number of orders we receive from our customers; |
changes in the capital spending and operating budgets of our customers, which may cause seasonal or other fluctuations in product mix, volume, timing and number of orders we receive from our customers;
· | order cancellations or rescheduled delivery dates; |
· | pricing changes by our competitors or suppliers; |
11· | insufficient or excess inventory; |
· | customer bankruptcies and difficulties in collecting accounts receivable; |
order cancellations or rescheduled delivery dates;
· | restructuring and impairment charges; |
pricing changes by our competitors or suppliers;
· | foreign exchange rate fluctuations; |
insufficient or excess inventory;
· | general economic conditions, including a slowdown or recession; |
variations in the mix between higher and lower-margin products and services;
· | distorted effective tax rate due to non-taxable/deductible elements and unrecognized deferred tax assets; and |
customer bankruptcies and difficulties in collecting accounts receivable;
· | effects of recent acquisitions of businesses. |
restructuring and impairment charges;
foreign exchange rate fluctuations;
general economic conditions, including a slowdown or recession;
distorted effective tax rate due to non-taxable/deductible elements and unrecognized deferred tax assets; and
effects of recent acquisitions of businesses.
We may in the future choose to reduce prices, increase spending, or modify our product portfolio in response to actions by competitors or in an effort to pursue new market opportunities. These actions may also adversely affect our business and operating results and may cause our quarterly results to be lower than the results of previous quarters. Due to these factors, you should not rely on quarter-to-quarter comparisons of our results of operations as an indication of our future performance.
We depend on short-term arrangements with a single supplier or a limited number of suppliers for some key components and materials in our products, which makes us susceptible to supply shortages or price fluctuations that could adversely affect our operating results.
We depend on a single supplier or a limited number of suppliers for several parts used to manufacture our products for which alternative sources may not be readily available. In addition, all of our orders are placed through individual purchase orders and, therefore, our suppliers may stop supplying parts to us at any time. Our reliance on a single source or limited number of suppliers could result in increased costs, delivery problems, reduced control over product pricing and quality and could require us to stockpile critical parts. Financial difficulties of suppliers could also affect our ability to obtain necessary parts in a timely manner. Any interruption or delay in the supply of any of these parts could significantly harm our ability to meet scheduled product deliveries to our customers and cause us to lose sales. Furthermore, the process of qualifying a new manufacturer for complex parts designed to our specifications, such as our optical, electronic and mechanical parts, is lengthy and would consume a substantial amount of time offrom our technical personnel and management. If we were required to change a supplier in a short period of time, our business would be disrupted. In addition, we may be unsuccessful in identifying a new supplier capable of meeting and willing to meet our needs on acceptable terms. Consolidation involving suppliers could further reduce the number of alternatives available to us and increase the cost of parts, which would makerender our products less competitive and result in lower margins.
Our failure to maintain an effective system of internal control over financial reporting means that we may not be able to accurately report our financial information or prevent fraud, which could harm our operating results and cause investors to lose confidence in our reported financial information.
Our management is responsible for establishing and maintaining adequate internal control over financial reporting. Internal control over financial reporting is a process designed to provide reasonable assurance regarding the reliability of financial reporting and the preparation of financial statements for external purposes in accordance with International Financial Reporting Standards (IFRS) as issued by the International Accounting Standards Board (IASB). As previously disclosed, we identified a material weakness in our internal control over financial reporting as at August 31, 2016, resulting in the improper aging
We devote significant resources and time to comply with the requirements of the Sarbanes-Oxley Act of 2002. Our efforts to comply with the annual internal control reporting requirement for each fiscal year depends on the effectiveness of our financial reporting as well as data systems and controls throughout our company and operating subsidiaries. We cannot be certain that these measures will ensure that we design, implement and maintain adequate controls over our financial processes and reporting in the future. Our failure to implement newly required or improved controls or adapt our controls, or difficulties encountered in their operation, or difficulties in the assimilation of acquired businesses into our control system, can harm our operating results, or prevent us from meeting our financial reporting obligations or result in a restatement of previously disclosed financial statements. Inferior internal controls could also cause investors to lose confidence in our reported financial information, which could have a negative effect on our share price and our access to capital.
We require employees and managers who are knowledgeable about the specialized nature of our business. If we are unable to attract and retain sufficient numbers of highly skilled technical, sales, marketing, senior management and other personnel, our operations and financial results will suffer.
Due to the specialized nature of our business, we are highly dependent on the continued service of and on our ability to attract qualified engineering, sales, marketing, senior management and other personnel. If we are unable to attract and retain such qualified personnel, it could have a material adverse effect on our business, results of operations and financial condition.
We must also provide significant training for our employees due to the highly specialized nature of the telecommunicationscommunications test, service assurancemonitoring and analytics markets. The knowledge base of our current personnel may be inadequate, or we may fail to assimilate and train new employees. Highly skilled employees with the education and training that we require – especially employees with significant experience and expertise in international business development, product management, sales, engineering and operations – may be difficult to find. Once trained, our employees may leave the organization or be hired by our competitors and reveal highly sensitive information to them.
We may become involved in various lawsuits and legal proceedings that may substantially increase our costs and harm our business.
We may from time to time become involved in various lawsuits and legal proceedings. Litigation is subject to inherent uncertainties and an adverse result may arise from time to time that could have a material adverse effect on our business, results of operations or financial condition. Any litigation to which we are subject could require significant involvement of our senior management and may divert management attention from our business and operations.
In addition, the failure of our products to perform to customer expectations could give rise to product liability and warranty claims. We carry insurance for product liability and take accounting reserves for warranty claims that we consider adequate in view of industry practice, but this may not be sufficient to cover all potential liability.
We may also face other types of claims by third parties in relation to the conduct of our business. A successful claim against us for an amount exceeding our policy limits would force us to use our own resources to pay the claim, which could result in a reduction of our cash available for other uses, increase our expenses and have a negative effect on our business, results of operations and financial condition.
If we suffer loss to our factories or facilities, our operations could be seriously harmed.
Our factories and facilities may be subject to catastrophic losses due to fire, vandalism, terrorism or other natural or man-made disasters. We do not have redundant multiple-site capacity and if any of our facilities or factories were to experience a catastrophic loss, it would disrupt our operations, delay production, shipments and revenue and result in large expenses, thereby harming our results of operations.
Unexpected declines in our research and development and other tax credits and grants may have an adverse effect on our business.
Our historical operating results reflect substantial benefits from programs sponsored by Canadian federal and provincial governments for the support of research and development activities conducted in Canada. In addition, EXFO Oy is entitled to government grants from a Finnish technology organization for researchCanada and development activities conducted in Finland. Altogether, researchFrance. Research and development tax credits and grants represented 11.2%12.8% of our gross research and development expenses for the year ended August 31, 2017.
Our research and development projects entitled to government grants from the Finnish technology organization must be pre-approved and the grant is subject to certain conditions. In the event a specific condition is not met, we may be required to reimburse a portion or the entire amount of the grant received, which would have material adverse effect on our results of operations and financial condition.2019.
If changes in laws or government policies terminate or adversely modify the Canadian, federal and provincialFrench or Finnish government programs, or the Finnish government program, under which we receive the majority of our research and development and other tax credits and grants, or if we unexpectedly become unable to participate in or take advantage of these programs, then our net research and development and other expenses will materially increase or we may decrease our research and development activities.
In addition, to the extent that we may increase our research and development activities in India, or potentially acquire new companies, our increased R&D activities may not be eligible for these programs. If we were required to decrease our research and development activities or were unable to benefit from other tax credits and grants, this could have a material adverse effect on our business, results of operations and financial condition.
Changes in our effective tax rate or adverse outcomes resulting from tax audits, including international inter-company transfer price audits, may have an adverse impact on our results.
As an international corporation, we are subject to taxation in the various jurisdictions in which we conduct business. Significant judgment is required in the determination of our worldwide provision for income taxes and this determination requires the interpretation and application of complex tax laws and regulations. Our global effective tax rate may be adversely impacted by the level of earnings, by changes in the mix of earnings/losses among companies and countries which may have different statutory tax rates, by the write-off of our deferred tax assets, by the intercompany transfer price used and by changes in tax rules and regulations. We are also subject to income tax and transfer pricing audits in the respective jurisdictions in which we conduct business. We regularly assess the likelihood of adverse outcomes resulting from these audits and review the adequacy of our provisions for income taxes. There can be no assurance that the outcomes of these tax audits will not result in liabilities in excess of our provisions, which cancould have an adverse impact on our results and financial condition.
Our current principal stockholder has effective control over our company.
As of November 1, 2017,2019, Germain Lamonde, our Executive Chairman of the Board, held 94.27%94.06% of the voting rights in our stock. By virtue of his stock ownership, Mr. Lamonde has effective control over all matters submitted to our stockholders, including the election of our Directors, and exercises significant control over our policies and affairs. Such concentration of voting power could have the effect of delaying, deterring or preventing a change in control or other business combinations that might otherwise be beneficial to our stockholders and may harm the market price of our shares.
If we complete major acquisitions of complementary businesses, products or technologies, we may need additional capital, and may not be able to raise additional capital on favorable terms or at all, which could limit our ability to grow and could increase our costs.
Our future liquidity and capital requirements are difficult to predict because they depend on numerous factors, including the success of our existing and new product offerings as well as competing technology and market developments. As a result, we may not be able to generate sufficient cash flows from our operations to meet additional working capital requirements, support additional capital expenditures or take advantage of acquisition opportunities. As at August 31, 2017,2019, we held $39.2$19.4 million in cash and short-term investments.investments, while total debt and bank loans reached $10.7 million. We also had revolving credit facilities of $56.5 million available to us as at August 31, 2019.
We may need to raise additional capital in the future. Our ability to obtain additional financing will be subject to a number of factors, including market conditions, access to credit facilities, and our operating performance.performance, as well as current debt level. These factors may render the timing, amount, terms and conditions of additional financing unattractive for us. If we raise additional funds by selling equity securities, the relative ownership of our existing investors could be diluted, or new investors could obtain terms more favorable than previous investors. If we raise funds through debt financing, we could incur significant borrowing costs and be required to meet restrictive debt covenants. If we are unable to raise additional funds when needed or at terms satisfactory to us, our ability to operate and grow our business could be impeded.
On September 8, 2017, we acquired a 33.1% interest
We implemented restructuring plans in Astellia SA (Astellia) for a cash consideration of €8.6 million (US$10.3 million). In addition, on October 2, 2017, we acquired all issuedprevious years to realign our cost structure to current and outstanding shares of Yenista Optics S.A.S. (Yenista) in an all cash deal of €8.3 million (US$9.7 million), net of cash acquired. These two acquisitions reduced our cash by US$20.0 million inanticipated future market conditions. The latest restructuring plan was completed after the firstsecond quarter of fiscal 2018.
2019. Delays in the implementation of anticipated workforce reductions in highly regulated locations outside of Canada and the US could materially impair our ability to achieve expected cost reductions or may disrupt our business. We may also fail to meet operational targets due to the loss of key employees. In addition, the anticipated cost savings and other benefits that we hope to achieve from these actions are based on many estimates and assumptions. These estimates and assumptions are subject to significant economic, competitive and other uncertainties, some of which are beyond our control. If these estimates and assumptions are incorrect, if we experience delays, or if other unforeseen events occur, our business and results of operations could be adversely affected.
We have outstanding indebtedness and may incur additional indebtedness in the future, which could adversely affect our financial condition, liquidity and results of operations.
Finally, on October 10, 2017, we reached an agreement with AstelliaWe currently have outstanding indebtedness as well as availability to acquire Astellia's remaining sharesincur additional indebtedness under revolving credit facilities. We may borrow additional amounts in the future and use the proceeds from any future borrowing for a total cash consideration of €17.3 million (approximately US$20.0 million) by way of a public tender offer. To finance this acquisition, we modified certaingeneral corporate purposes, future acquisitions, capital expenditures, expansion of our business or repurchases of our outstanding subordinate voting shares. Our incurrence of this debt, and increases in our aggregate levels of debt, may adversely affect our operating results and financial condition by, among other things:
requiring a portion of our cash flows from operations to make interest payments on this debt;
increasing our vulnerability to general adverse economic and industry conditions;
reducing cash flows available to fund capital expenditures and other corporate purposes and to grow our business; and
limiting our flexibility in planning for, or reacting to, changes in our business and the industry.
Our current revolving credit facilities which increased available financingand bank loan imposes restrictions on us, including restrictions on our ability to approximately US$29.0 million.
create liens on our assets and the ability of our subsidiaries to incur indebtedness, and requires us to maintain compliance with specified financial ratios. Our ability to comply with these ratios may be affected by events beyond our control. If we breach any of the covenants and do not obtain a waiver from the lenders, then, subject to applicable cure periods, our outstanding indebtedness could be declared immediately due and payable.
Our business and operations would suffer in the event of a failure of our information technology infrastructure.
We rely upon the capacity, efficiency and security of our information technology hardware and software infrastructures and those from third parties, as well as our ability to expand and update these infrastructures, in response to our evolving needs. Any failure to manage, expand, update or secure our information technology infrastructures or any failure in the operation of these infrastructures could harm our business.
Our information systems and third-party systems may be vulnerable to damages from computer viruses, natural disasters, unauthorized access, theft of information and other similar disruptions. Any system failure, accident or security breach could result in disruptions to our operations. To the extent that any disruption, security breach or cyber-attack results in a loss or damage to our data, or inappropriate disclosure of confidential information, it could harm our business. In addition, these events may force us to devote more money and resources in order to protect ourselves against damages caused by these disruptions or security breaches in the future.
The enactment of new privacy laws and regulations in the jurisdictions in which we do business could require significant company resources or limit the way our customers can use our products.
The enactment of new federal, provincial, or foreign data privacy laws and regulations could prevent customers from taking advantage of all the features or capabilities of our products which, in turn, could reduce demand for certain of our products. In addition, changes in international privacy laws have required an adjustment to some of our internal processes and significant resources in the past, and future changes could require similar efforts and resources with regard to compliance. The adoption of or changes to any such data privacy laws and regulations could affect demand for our products, increase the cost of selling our products and divert time and attention of our management, all of which could have a material and adverse effect on our financial condition and results of operations. For example, the European Union (EU) data protection law, the General Data Protection Regulation (GDPR), which became effective in May 2018, is wide-ranging in scope. To adapt to these new requirements, we have invested resources necessary to enhance our policies and controls across our business units and services, relating to how we collect and use personal data from customers and employees and how vendors handle personal data we provide to them. We will also evaluate the potential impact of the Canadian “Digital Privacy Act” and the “People’s Republic of China Network Security Law” that were implemented on November 1, 2018, and June 1, 2017, respectively, as well as that of the “California Consumer Privacy Act” coming into effect on January 1, 2020. Going forward, we expect that the international transfer of personal data will present ongoing compliance challenges and complicate our business transactions as we negotiate and implement suitable arrangements with international customers as well as international and domestic vendors.
Compliance with SEC rules relating to "conflict minerals"“conflict minerals” may require us and our suppliers to incur substantial expense and may result in disclosure by us that certain minerals used in components and/or products we contract to manufacture may contain such "conflict minerals"“conflict minerals”.
The SEC adopted disclosure requirements under Section 1502 of the Dodd-Frank Act, regarding the source of certain conflict minerals for issuers for which such conflict minerals are necessary to the functionality or production of a product manufactured, or contracted to be manufactured, by that issuer, which are mined from the Democratic Republic of Congo ("DRC"(“DRC”) and adjoining countries. The metals covered by the rules include tin, tantalum, tungsten and gold, commonly referred to as "3TG."“3TG.” Because we use components which contain tin, tantalum, tungsten or gold, the SEC rules require us to conduct a reasonable country of origin inquiry to determine if we know or have reason to believe any of the minerals used in the production process may have originated from the DRC or an adjoining country (collectively referred to as "covered countries"“covered countries”) and, depending on the results of such inquiry, to perform further supply chain due diligence on the source and chain of custody of those minerals to determine if they originated in one of the covered countries and, if so, whether they financed or benefited armed groups in the covered countries. Our material sourcing is broad based and multi-tiered, and we may not be able to easily verify the origins for all metals used in our products. As a result, the costs of the aforementioned diligence efforts by us and by our suppliers could be significant. In addition, disclosures by us mandated by the new rules which are perceived by the market to be "negative"“negative” may cause customers to refuse to purchase our products. We are unable to assess the cost of continuing compliance with this rule, and there can be no assurance that the cost will not have an adverse effect on our business, financial condition or results of operations.
If we are held liable for the violation of the applicable anti-bribery laws, it could have a material adverse effect on our business.
We are subject to the applicable anti-bribery laws in countries we do business, which generally prohibit companies, their subsidiaries, their affiliates and their intermediaries from making improper payments to government officials for the purpose of obtaining or retaining business or otherwise obtaining favorable treatment. The anti-bribery laws generally apply to companies, individual directors, officers, employees and agents. Under the applicable anti-bribery laws, companies may be held liable for actions taken by agents, local partners or representatives. If we or our intermediaries fail to comply with the requirements of the applicable anti-corruption laws, governmental authorities in the U.S., in Canada or other countries could seek to impose civil and/or criminal penalties, which could have a material adverse effect on our business, results of operations, financial condition and cash flows.
1516
Our stock price is volatile.
Our stock price has experienced substantial volatility in the past and may remain volatile in the future. Volatility in our stock price can arise from a number of factors discussed in this "Risk Factors"“Risk Factors” section. Our stock price will fluctuate based on our financial performance and growth expectations. It can also be affected by public announcements from our competitors and our customers in the telecommunicationscommunications industry. In addition, turmoil in credit markets and in the broader economy can contribute to share price and volume fluctuations in global stock markets. During fiscal 2017,2019, our closing stock price on NASDAQ ranged from a high of $6.05$4.80 per share to a low of $3.42$2.75 per share. These aforementioned factors, including volatility often unrelated to the operating performance of our company, may materially affect our stock price in the future.
1617
| Information on the Company |
Item 4.Information on the Company
| History and Development of the Company |
Our legal name and commercial name is EXFO Inc. / EXFO inc. Our head office is located at 400 Godin Avenue, Quebec, Quebec, Canada, G1M 2K2 and our main telephone number is (418) 683-0211. Our e-mail address is info@EXFO.com and our website is www.EXFO.com. Information on our website is not incorporated by reference in this Annual Report. Our agent for service in the United States is CT Corporation System, 111 Eighth Avenue, 13th Floor, New York, New York 10011. Our Transfer Agent and Registrar is AST Trust Company (Canada) (AST), 2001 Robert-Bourassa Blvd., Suite 1600, Montreal, Quebec, Canada, H3A 2A6. This Annual Report contains trademarks and registered trademarks of us and other companies.
We were incorporated in Canada on September 18, 1985 pursuant to the Canada Business Corporations Act. Since that date, we have amended our articles on various occasions mainly to modify our legal and corporate names and our share capital.
Since we are using this Form 20-F as an annual report, we have provided herein the information required pursuant to Item 4A(4) for the period beginning as at September 1, 20162018 until the date of this Annual Report. For information responsive to this Item 4A(4) for prior periods, please refer to our previously filed Annual Reports on Form 20-F. Information in our previously filed Annual Reports on Form 20-F is not incorporated by reference in this Annual Report.
In October 2018, as part of our restructuring plan, we shut down our operations in Chelmsford, Massachusetts, USA. On October 31, 2016,December 1, 2018, we acquired substantially all the assets of Absolute Analysis Inc., a privatelyalso transferred certain intellectual property held company located in the United States supplying solutions for radio frequency testingto Canada. This transfer created a one-time deferred income tax recovery of fiber-based radio access networks which will extend our commitment to meet the needs of mobile network operators deploying fiber-based fronthaul networks and radio access networks architectures. This acquisition-date fair value of the total consideration transferred equaled $8.5 million and consisted of $5.0$2.4 million in cash and the issuancestatement of 793,070 subordinate voting shares, valued at $3.5 million.
On March 2, 2017, we acquired all issued and outstanding shares of Ontology Partners Limited (Ontology), a privately held company located in the United Kingdom, a supplier of real-time network topology discovery and service-chain mapping. The acquisition-date fair value of the total consideration equaled $9.2 million and consisted of $7.8 million in cash, net of Ontology's cash of $2.2 million at the acquisition date, plus cash contingent consideration based on certain sales volume of Ontology products over the 12-month period following the acquisition, valued at $1.4 million at the acquisition date.earnings for fiscal 2019.
On March 29, 2017,January 8, 2019, we announced the appointmentthat our Board of Philippe Morin as our new Chief Executive Officer (CEO), effective April 1, 2017. Mr. Morin, who has more than 25 years of experience in the telecommunications industry, initially was named EXFO's Chief Operating Officer in November 2015. Prior to joining EXFO, Mr. Morin was Senior Vice-President of Worldwide Sales and Field Operations at Ciena. He also held senior management positions at Nortel Networks, including President of the Optical Networking Division. EXFO founder Germain Lamonde, who had fulfilled the roles of CEO and Chairman of the Board for more than 30 years, became Executive Chairman. He maintains leadership of EXFO's acquisition strategy and remains actively involved in defining EXFO's growth initiatives, customer outreach as well as corporate governance.
On May 2, 2017, we announced a restructuring plan to streamline our passive monitoring solutions portfolio, which falls under our protocol-layer product line. This plan resulted in severance expenses of $4.1 million and inventory write-offs of $1.0 million, for total restructuring charges of $5.1 million during the year. As result of this plan, we expect annual savings of approximately $9 million.
On September 8, 2017, we acquired 33.1% of all issued and outstanding shares of Astellia SA ("Astellia"), a publicly traded company on the NYSE Euronext Paris stock exchange. Astellia is a provider of network and subscriber intelligence enabling mobile operators to drive service quality, maximize operational efficiency, reduce churn and develop revenue. Its vendor-independent, real-time monitoring and troubleshooting solution is used to optimize networks end-to-end form radio to core. The acquisition-date fair value of the consideration transferred equaled €8.6 million (US$10.3 million) in an all-cash deal.
On October 2, 2017, we acquired all issued and outstanding shares of Yenista Optics S.A.S (Yenista), a privately held company located in France, a supplier of advanced optical test equipment for the research and development and manufacturing markets. Its portfolio includes benchtop optical spectrum analyzers, tunable lasers, tunable filters and passive optical component test systems for NEMs and optical component vendors. The acquisition-date fair value of the total consideration equaled €9.4 million (US$11.1 million) and consisted of €8.3 million (US$9.7 million) in cash, net of Yenista's cash of €1.1 million (US$1.4 million) at the acquisition date.
On October 10, 2017, we reached an agreement with Astellia to acquire Astellia's remaining shares atDirectors approved a share price of €10, for total consideration of €17.3 million (approximately US$20 million)repurchase program, by way of a public tender offer.normal course issuer bid on the open market of up to 1,200,000 subordinate voting shares at the prevailing market price. The public offering will open in late calendar 2017 or early 2018, subject to the approval of French foreign investment authorities and permission from l'Autorité des marchés financiers. If the public tender offering is successful, the settlementperiod of the acquisition is expectednormal course issuer bid commenced on January 14, 2019 and will end on January 13, 2020. From January 14, 2019 through November 11, 2019, we spent approximately US$0.6 million (including fees) to take place early in calendar 2018.
On October 25, 2017, we modified certain credit facilities whereby existing lines of credits, that provided advances up to CA$4.8 million (US$3.8 million) and up to US$6.0 million for operating purposes, were cancelled and replaced by credit facility of CA$28.9 million (US$23.1 million) mainly for the acquisition of the remaining shares of Astellia under the public tender offer.
repurchase 127,604 subordinate voting shares.
We provide communications service providers (CSPs) andas well as data center, cloud and web-scale operators with field test, service assurancemonitoring and analytics solutions to ensure the smooth deployment, maintenance and management of next-generation fixed and mobile networks. We have also forged strong relationships with network equipment manufacturers (NEMs) to develop deep expertise that migrates from the lab to the field and beyond. We believe that our key differentiation comes from combining intelligent, automated and cloud-based test and monitoring solutions with real-time analytics to deliver what we believe to be unmatched end-to-end visibilitysuperior network performance, service reliability and assurance—from a network, services and end-user level.subscriber insights. We are no.1number one in optical testing in terms of global market share and have deployedare among the largest active, probe-based service assurance solutiontop five suppliers of monitoring and analytics solutions for the communications industry worldwide.
We believe that our unique blend of hardware equipment, software and services accelerates digital transformations related to fixed and mobile network deployments. More specifically, we target high-growth market opportunities relatedthat enable customers to increasingincrease bandwidth capacity and improvingimprove quality of experience on network infrastructures: 5G and Internet of Things (IoT), 4G/LTE (long-term evolution), wireless backhaul and fronthaul, small cells and distributed antenna systems (DAS), 400G and 100G network upgrades as well as fiber-to-the-home (FTTH)/fiber-to-the-curb (FTTC)/fiber-to-the-node (FTTN) deployments.
We were founded in 1985 in Quebec City, Canada. Our original products were focused on the needs of installers and operators of fiber-optic networks. Customers use these field-portable test solutions for the installation, maintenance and troubleshooting of optical networks. Over the past several years, we have enhanced our competitive position in telecommunicationsthe communications test, service assurancemonitoring and analytics markets through acquisitions of transport and datacom, copper/xDSL and wireless test companies, an IP service assurance business, an analytics software company, radio frequency (RF) test technologies for fiber-based radio access networks (RANs), automated network topology discovery software, and optical test equipment for lab and research applications.
We launched 16 new products and/or major enhancements in fiscal 2017, addressing four key technology areas: fiber, Cloud, network virtualizationapplications, as well as performance analysis solutions for mobile networks and 5G. New product introductions included a 400 Gbit/s optical transport test solution for the lab and manufacturing markets; an automated inspection probe for testing multi-fiber connectors in data centers and radio access networks; a software-based solution, Universal Virtual Synch, enabling communications service providers to accurately and cost-effectively measure network latency; and optical RF over OBSAI (open base station architecture initiative) link test capabilities to complement optical RF over CPRI (common public radio interface) test technology for centralized radio access networks.subscriber experience.
Industry Background
Market conditions continued to improveEXFO benefited from ongoing fiber buildouts and early 5G wireless deployments in fiscal 20172019 as CSPs deployed fiber deeper intransformed their networks and at higher speeds to address growing Internet usage, proliferation of smart phones and tablets, and an explosion in videosvideo services. As such,On the wireline side, the 100G optical investmentupgrade cycle moved intocontinued throughout metropolitan networks, and400G made its way into some data centers, from long-haul networks. Withwhile early 800G designs were seen in labs. We also witnessed fiber rollouts and small cell deployments closer to the advent of new technologies like 5G wireless and Internet of Things (IoT), CSPs also increased spending on front-haul and backhaul networksnetwork edge to support the ultra-high speeds and low-latency requirements of tomorrow's networktomorrow’s wireless infrastructures. The transition towards virtualized network functions, however, didOn the wireless end, service providers worldwide became embroiled in a race to deliver 5G services first to their subscribers. Already, the two largest CSPs in the US are claiming bragging rights with partial deployments of 5G services in certain metropolitan areas. Leading service providers in South Korea and China also rolled out 5G services in calendar 2019, but massive commercial deployments are not take full flight asexpected until 2020 when 5G smartphones become widely available.
Against this backdrop, CSPs grappledare grappling with the complex architectures required to manage hybridvirtualized networks, both physicalwhich are essential to monetizing 5G services and virtualized.
These market drivers withinlowering operating costs. Early use cases revolve around fixed wireless and enhanced mobile broadband (eMBB) for ultra-high-definition video streaming, augmented reality and virtual reality applications. Next in line are massive machine type communications (mMTC), requiring a connection density of 1 million devices per square kilometer, to support the telecommunications industry in 2017 were affected by consolidation issues among large CSPsInternet of Things (IoT). Finally, ultra-reliable, low-latency communications (URLLC) are slated to come later in the Americas, slowing growth in the Asia-Pacific region, especially China,5G cycle to enable delay-sensitive applications like autonomous cars and industrial automation that require a mixed economic environment in Europe, Middle East and Africa (EMEA).response time as low as 1 ms.
Growth Strategy
Our long-term goal is to become the global leader in the global telecomcommunications test, service assurancemonitoring and analytics markets. GivenWe believe that digital transformations are taking place throughout the communications industry to cope with surging bandwidth demand and the need to better monetize networks, we believe thatnetworks. Consequently, CSPs, webscale companies and NEMs must makeare making considerable investments to transform theirmodernize network infrastructures.
Our growth strategy focuses on internal investments and acquisitions in four keytwo main technology areas: fiber the Cloud, network virtualization and 5G.
First, fiber is being deployed everywhere, supporting 1Geverywhere. Communications service providers are continuing fiber buildouts and high-speed deployments in Metro, regional and access networks to meet bandwidth demand. Cable companies are following suit with Fiber Deep initiatives to remain competitive. Webscale operators are building data transmission ratescenters closer to the network edge to ensure a superior quality of experience for end-users.
All these customer groups rely on fiber testing and we believe that the depth and breadth of our product portfolio and No. 1 position in the home, 100G in Metro links and data centers, and even 400G in lab environments. As theoptical test equipment market leader in optical and high-speed transport testing, EXFO will continue to leverage the 100G investment cycle. We also believe we are well positioned for the next wave of customer spending with a commercially available 400G test solution and high-end optical instruments from the recent Yenista Optics acquisition.
Second, the Cloud. EXFO is helping webscale companies deliver reliable cloud services with a dedicated test offering for inside and outside their data centers. For interconnecting data centers, our 100G test solutions ensure smooth fiber deployments and quality of service. Inside data centers, solutions like our new automated multifiber inspection probe are significantly improving efficiency and reducing operating expenses.
Third, network virtualization. As telecom networks are increasingly becoming virtualized to increase service agility and save on costs, EXFO has taken the lead to enable a virtualized world. We have designed virtual verifiers that are released on generic, white-label servers alongside virtual network functions. In 2017, we evolved from a proof-of-concept to commercial deployment phase for our virtual monitoring solutions. We also acquired real-time network topology discovery technology from Ontology Systems to complement our active service assurance offering. Ontology Systems' software uses semantic searches to build real-time views of network services and their related elements. This mapping is essential for automated root cause analysis, especially because networks can change on the fly in a virtualized environment.continued growth.
19
Second, 5G mobility. The 5G investment cycle got underway in limited geographies in 2019. Initial use cases revolve around fixed wireless and enhanced mobile broadband, but we believe that 5G is all about machines and incremental revenue. We should see massive machine type communications and ultra-reliable, low-latency applications later in the cycle.
EXFO is currently benefiting from the 5G network densification phase. Service providers are deploying small cells in densely populated areas to deliver the next-generation services that subscribers expect. These small cells need to be connected with fiber and we expect to capitalize with our leadership position in optical testing.
The next phase of 5G deployment will get underway in mid-2020 as mobile network operators deploy radio equipment for the standalone 5G standard. EXFO provides RAN optimization solutions for network operators, who must cope with the tradeoff between capacity and coverage on high-, mid- and low-band spectrum.
Finally, the network monitoring phase will begin in mid- to late-2020 when commercial rollouts of 5G represents the next technology milestone for mobile networks. CSPs are investing heavily in fiber, fronthaul,networks become mainstream. This is when EXFO’s troubleshooting and backhaul network initiatives to get prepared for 5G mobility. Early in fiscal 2017, we acquired from Absolute Analysis optical RF technology for testing fiber-based mobile networks. Thesemonitoring solutions are critical for analyzing RF interference issues in fiber to the antenna, distributed antenna systems, remote radio heads and baseband units that support 4G/LTE and upcomingwill provide end-to-end visibility of 5G networks.
We are also in the process of acquiring Astellia,These full-fledged 5G networks will be built around a leading provider of networkvirtualized architecture to increase monetization opportunities and subscriber intelligence for mobile operators. Should this friendly takeover bid be successful,reduce operating costs. Already, we believe it would allow EXFO to strengthen itshave successfully deployed a virtualized service assurance offeringsolution with passive wireless monitoring, rich subscriber analytics and professional services. Equally important, we believe it would provide EXFO with3UK, a strong foothold with globalBritish mobile operators, who are investing in high-speed, low-latency 5G wireless infrastructures.network operator.
Customers
Customers on a global basis use our test, service assurancemonitoring and analytics solutions to enable their networks to perform optimally during their complete life cycles: research, development, manufacturing, installation, maintenance and monitoring.
We initially developed test equipment for wireline CSPs and, to a lesser extent, component vendors and network equipment manufacturers, but over the years we have expanded our offering to wireless CSPs, cable television companies, data center, cloud and web-scale operators, public utilities, private network operators, third-party installers, equipment rental companies, large enterprises and laboratory researchers.
In fiscal 2017,2019, our top customer accounted for 10.1%6.9% of our sales and our top three customers represented 18.4%18.1%. In comparison, our top customer accounted for 7.1%9.1% of sales and our top three customers represented 15.6%15.9% in 2016,2018, while our top customer accounted for 7.1%10.1% of sales and our top three customers represented 14.4%18.4% in 2015.2017.
Products
Beginning in fiscal 2019, we started reporting sales and bookings results based on two newly defined product families: Test and Measurement (T&M) and Service Assurance, Systems and Services (SASS). Optical, transport and copper test solutions make up the T&M product family, including portable equipment for the field and benchtop units for the lab and manufacturing environments. The SASS family mainly consists of service assurance, fiber monitoring, analytics and professional services as well as other systems-related solutions like network simulation and network topology. The SASS product family tends to be software-intensive with longer sales and revenue-recognition cycles than the T&M group. We believe this product breakdown better reflects our long-term strategy, while enhancing comparisons against industry peers and investors’ understanding of our business.
Test and Measurement (T&M)
We offer an extensivea broad range of wireline and wireless test service assurance and analytics solutions forthat support customers in the global telecommunications industry. We believe our success has been largely predicated on ourdigital transformation of their networks from the core expertise in developing test equipment for optical networks. Overto the years, we have completed acquisitions in adjacent markets including copper, wireless and optical RF testing, service assurance, real-time network topology discovery and analytics.
edge. We believe the competitive advantages of our products include a high degree of innovation, modularity (especially wireline products) and ease of use. Ultimately, we believe our products enable NEMs, CSPs as well as data center, cloud and web-scale operators to design, deploy, troubleshoot and monitortroubleshoot wireline and wireless networks, and alsoas well as help customers reduce their operating expenses.
Products for Communications Service Providers (CSPs)
Wireline Test Equipment
We provide an extensive range of portable test solutions that are mainly used by CSPs to install, turn up and maintain their optical, wireless and copper-based telecommunicationscommunications networks. These products are available as handheld test instruments, portable platforms with related modules, and as rack-mounted chassis with related modules.
Our handheld instruments are durable, compact and easy to use. They include dedicated testersinstruments like power meters or theyfor optical networks and digital subscriber line (DSL) testers for copper access networks. They can also be multi-function units that carry out several different measurements.
Our field-test platforms, namely the FTB-1 Pro Platform, FTB-1 Platform, FTB-2 Pro Platform, FTB-4 Pro Platform and FTB-500 Platform, are at the core of our wirelineportable product portfolio. Our FTB-1 Pro, designed for frontline technicians in the field, is a single-slot, modular platform dedicated to carry out optical, Ethernet and multiservice tests simply and efficiently. It differentiates itself through ultra-strong processing power and rich features like a multi-touch, high-resolution widescreen display. The FTB-1 Platform does not possess the same processing power or rich feature set of the FTB-1 Pro, but it is suitable for optical, copper, Ethernet and multiservice testing applications.
Our FTB-2 Pro offers the power and scalability of a multi-technology, high-performance unit, but in a smaller form factor. The FTB-2 Pro Platform can host two single-slot test modules, such as an OTDR (optical time domain reflectometer), automated optical loss test set (OLTS) with a variety of fiber inspection probes (FIPs), and Ethernet tester that can characterize transmission rates up to 100 Gbit/s.
The FTB-4 Pro, the latest addition to our platform family, supports as many as four modules for tests in high-speed networks, data centers and R&D labs. It provides field technicians with a combination of 400 Gbit/s commissioning, turn-up and troubleshooting tools on a single platform for both transport and advanced dispersion testing.
Our FTB-500 platform is available in two configurations for various high-end tasks with transmission rates up to 100 Gbit/s. The four-slot model of the FTB-500 is designed for datacom testing, OTDR analysis, optical loss, Ethernet and multiservice transport (SONET/SDH/OTN) testing. The eight-slot model is a high-performance, multiple-protocol unit that allows users to combine next-generation SONET/SDH functions with Ethernet, Fibre Channel and optical-layer testing capabilities. It can handle dispersion characterization (PMD and CD), as well as DWDM/ROADM testing with optical spectrum analysis, and a variety of FIPs.
All five portable platforms support USB, mobile, Wi-Fi, and Bluetooth connectivity capabilities to efficiently manage testing and reporting operations in the field. These PC-centric, open-ended platforms, combined with cloud-based software applications, can be transformed into a fully connected test environment that allows CSPs to automate complex, labor-intensive tasks like fiber-to-the-antenna (FTTA), distributed antenna system (DAS) and small cell deployments. Leveraging platform connectivity, customers can also keep track of their entire test fleet, manage software updates and schedule calibration procedures. All test data can be stored in a central database and used as a point of reference against future measurements within our cloud-based solution. Consequently, this enhanced test environment enables customers to increase productivity and reduce operating expenses.
Wireless Test EquipmentOur network equipment manufacturer (NEM) solutions, mainly built around our LTB-8 Rackmount Platform, are available as test modules or stand-alone benchtop instruments.
Our highly scalable LTB-8 platform, which can host as many as eight 100G test modules, addresses the numerous requirements that NEMs demand from their multiservice transport and datacom network equipment. Lab users can carry out tests for a variety of technologies including Ethernet, OTN, Fibre Channel and SONET/SDH. Optical tests can also be carried out via power meters, variable attenuators and switches. Remote control of one or several LTB‑8 platforms is available via a proprietary web-based interface. We provide 2G, 3Galso have a 400G test module for the LTB-8 platform that is dedicated to the lab and 4G/LTE network simulators for CSP labs. EXFO's network simulators emulate real-world, large-scale network traffic and end-user behavior in a laboratory environment in order to predict network behavior, uncover faults and optimize networks before wireless networks and services are deployed. Typical tests include wireless node (EPC, IMS) functional and network load testing.manufacturing markets.
We alsoApart from our LTB-8 platform, we offer protocol analyzers which analyze mobile network elements to validate functionality according to wireless technology specifications, whether these elements interoperate with each other effectively when combined to form a network, and how well the live network performs. These test tools allow engineers to troubleshoot networks in order to find the source of errors and quickly fix them. Our protocol analyzers support multi-interface testing and all major mobile technologies: GSM/GPRS/EDGE/UMTS/LTE. These analyzers have also been integrated into passive probes within our service assurance offering to better meet the emerging requirements of our customers. These new hardware probes complement our active verifiers to form a fully integrated active and passive service assurance solution.
In addition, we provideadvanced optical radio frequency (RF) test equipment for analyzing RF interference issues in fiber to the antenna, distributed antennaR&D labs. This high-end product portfolio includes benchtop optical spectrum analyzers, tunable lasers, tunable filters and passive optical component test systems remote radio headsfor network equipment manufacturers and baseband units that support 4G/LTE and upcoming 5G networks.optical component vendors.
21
Service Assurance, Systems and Services (SASS)
We provide a comprehensive service assurance solution, called the EXFO Worx System,portfolio of monitoring solutions for wireline and wireless CSPs, as well as fordelivering full visibility of the managed services arms of NEMs in support of service-level agreements (SLAs) required by their customers.network, service and subscriber levels.
TheAt the network level, we offer fiber monitoring solutions, which leverage OTDR (optical time domain reflectometry) technology, enabling centralized monitoring to detect fiber breaks or performance issues 24 hours per day, seven days per week.
At the service level, the EXFO Worx System is a hardware and softwarean active monitoring solution that delivers real-time, end-to-end quality of service (QoS) and quality of experience (QoE) service monitoring for next-generation IP networks. Built around a distributed architecture, we believe the EXFO Worx System enables the successful launch and ongoing profitable operation of Ethernet/IP-based voice, video and data networks and services across wireline and wireless networks.
We have also transformed our service assuranceactive monitoring portfolio to address the growing need for virtualized solutions. The EXFO Worx solution offers a variety of software-based probes, enabling the interworking with virtualized network architectures and functions.
We believe a competitive advantage of EXFO's service assuranceEXFO’s active monitoring solution is the ability to implement SLA (service level agreement) monitoring and assure any IP service, over any network, to any endpoint—all from the same open and extensible platform. Key capabilities include:
· | Layer 2-7 service performance monitoring and analysis for business and residential services; |
Layer 2-7 service performance monitoring and analysis for business and residential services;
· | mobile backhaul and metro Ethernet service activation and assurance; |
Mobile backhaul and metro Ethernet service activation and assurance;
· | IP/MPLS core monitoring and analysis; |
IP/MPLS core monitoring and analysis;
· | IP video service assurance; |
IP video service assurance;
· | advanced data correlation and analysis engine with comprehensive northbound APIs; |
Advanced data correlation and analysis engine with comprehensive northbound APIs;
· | advanced analytics and reports; and |
Advanced analytics and reports; and
· | custom solutions and back-office integration services. |
Custom solutions and back-office integration services.
The EXFO Worx System offers a multi-play capability such that customers can leverage one, several or all of the aforementioned capabilities on a single platform, which we believe delivers significant savings in capital and operating expenditures.
We believeOur active monitoring solution is complemented by network topology software for automated root cause analysis and network inventory applications (physical, virtual and hybrid). As such, we recognized a $4.9 million deal in fiscal 2019 from a US service provider for our network topology software solution. This key contract win came with a related multi-million-dollar customer support plan over the highly scalable next three years.
EXFO Worx correlationalso offers a passive monitoring, analytics and analysis engine architecturetroubleshooting solution for multi-technology mobile networks (2G, 3G, 4G), including the subscriber level. The EXFO-Astellia Nova solution provides mobile network operators with capabilities to detect, correlate, analyze, report, geolocate and troubleshoot issues related to network performance, handset behavior and service usage. It is well suitedfully virtualized and integrates rich information from call traces, probes, CRM, billing, etc., to make the most of big data.
This virtualized solution is used by 3UK for the needspassive monitoring of CSP networks and related IP services. It works together with network-wide monitoring sources — including EXFO's physical and virtual verifiers, third-party devices and standards-based interfaces.its recently launched, cloud-native, mobile core network.
In additionThe EXFO-Astellia Nova solution improves customer experience and mobile operators’ business performance, optimizes end-to-end service quality, and provides the required insights to ourenhance subscriber experience. It meets the requirements of network operations, service assurance offering, we provide complementary root-cause analysis solutions to help service providers troubleshoot network performanceoperations, customer care and qualitymarketing teams. Key strengths of service issues.this solution include:
Products for Network Equipment Manufacturers (NEMs)
Wireline Test Equipment
Our network equipment manufacturer (NEM) solutions, mainly built around our LTB-8 Rackmount Platform, are available as test modules or stand-alone benchtop instruments.
Our highly scalable LTB-8 platform, which can host as many as eight 100G test modules, was introduced in 2016 to address the numerous requirements that NEMs demand from their multiservice transport and datacom network equipment. Lab users can carry out tests for a variety of technologies including Ethernet, OTN, Fibre Channel and SONET/SDH. Optical tests can also be carried out via power meters, variable attenuators and switches. Remote control of one or several LTB-8 platforms is available via a proprietary web-based interface. In March 2017, we introduced a 400G test solution for the LTB-8 platform that is dedicated to the lab and manufacturing markets.
We also offer the IQS-600 platform which can efficiently run as many as 100 optical test modules using a single controller unit. Its system-based approach – one box, several test modules – combined with an open architecture (PXI, Windows, LabVIEW™, etc.) and ease of programming, produces a highly flexible test environment.
The IQS-600 also provides backward compatibility with previous IQ-generation test modules, while delivering all the powerRadio access network (RAN) optimization;
Geolocation capabilities;
Data agnostic (call traces, probe data, third party);
End-to-end, from radio to core;
Big data based; and advantages of a next-generation platform. EXFO's wide selection of test modules includes multiservice test solutions covering optical transport network (OTN), Ethernet and SONET/SDN technologies, high-speed power meters, light sources, WDM laser sources, tunable laser sources, variable attenuators, polarization controllers, optical spectrum analyzers and optical switches.
OutsideTo allow customers to get the most out of these modular-based products, we offer advanced, stand-alone test solutions for NEMs in the process of developing ultra-high-speed optical networkstheir monitoring and analytics investments, our experts work hands‑on with them through value-added services that include quality assurance and performance audits as well as high-end test equipment for labsbusiness consulting and research facilities.
Wireless Test Equipmentcustomization. Additional services include training, project management and 24/7 customer support.
We also provide 2G, 3G, 4G/LTE and 4G/LTE5G network simulators for the NEMs market. EXFO'sCSP labs and NEMs. EXFO’s network simulators emulate real-world, large-scale network traffic and end-user behavior in a laboratory environment in order to predict network behavior, uncover faults and optimize networks before wireless networks and services are deployed. Typical tests include regressionwireless node (EPC, IMS) functional and network load testing.
We alsoThese various assets are key building blocks of the automated service assurance offering that EXFO is proposing for increasingly complex, cloud-native and 5G networks.
Finally, we offer communications intelligence tools for police, armed forces and other governmental organizations to help fight organized crime and terrorists.
Research and Development
Our global R&D operations fall under the management of a vice-president.vice president. We maintain R&D centers in Quebec City, Canada, Montreal, Canada, Toronto, Canada, Chelmsford, USA, Oulu, Finland, Pune, India, Lannion, France, Rennes, France, Valencia, Spain, and London, UK. Gross research and development expenditures totaled $58.0 million in fiscal 2019 compared to $65.2 million in 2018 and $53.1 million in fiscal 2017 compared2017.
Aligned with our strategic imperative to $47.9 millionincrease R&D synergies and efficiencies, we transferred activities from Toronto, Canada and Chelmsford, US to primary R&D centers within the company. These two R&D centers were closed down in 2016 and $50.1 million in 2015.October 2018.
We believe that our future success largely depends on our ability to introduce new solutions and product enhancements to our core technologies. Through market-oriented product portfolio review processes, we ensure that our investments in research and development are aligned with market opportunities and customers'customers’ needs. This process enables us to maximize our returns on R&D investments by focusing our resources on prioritized projects. Product portfolio review meetings, which occur threetwo times per year, enable us to select the right mix of new products and allocate the necessary resources for their development. All our projects, including those already underway, are reviewed, given a priority rating and allocated budgets and resources. Existing projects can be stopped or substantially redefined if there have been significant changes in market conditions, or if the project development schedule or budget has significantly changed.
Product development projects, once they are underway, are managed through a structured process known as the stage-gate approach combined with an Agile methodology. The stage-gate approach is based on a systematic review of a project'sproject’s progress at various stages of its lifecycle. The following are the key review stages of the stage-gate approach:
· | market study and research feasibility; |
· | development feasibility; |
23
market study and research feasibility;
At each stage, we review our project risks, costs and estimated completion time. We compare our design to anticipated market needs and ensure that our new product development is synchronized with other internal departments and external industry events.
The Agile methodology allows for software development to be done in small increments with constant validation with lead customers. Efficient execution is done through collaborative teams called SCRUM team, ensuring that each increment is fully tested and validated.
Sales
We sell our wireline and wireless test, service assurancemonitoring and analytics solutions through direct and indirect sales channels in the Americas (US, Canada, Central and South America), Europe, Middle East and Africa (EMEA) and Asia-Pacific regions.
In the Americas, we use a hybrid model, combining key account management with direct and indirect sales coverage. We typically use key account managers to serve large customers that generate high sales volumes or might potentially represent high sales volumes in the future. These key account managers are supplemented by regional sales managers, sales engineers, sales representatives and distributors in the US as well as Central and South American metropolitan areas, and regional sales managers and sales engineers in Canada.
We opt for a direct sales approach when selling higher-end, highly technical products to sophisticated buyers. Sales of low- to medium-level complexity products to less stringent technical buyers are usually done through a manufacturer representative organization or distributors supported by regional sales managers. Our main sales offices in the Americas are located in Richardson, Texas, Quebec City, Canada Toronto, Canada and Mexico D.F., Mexico. They are supplemented by a regional presence in cities across the US, Central and South America, as well as Canada.
On the international front, we have a direct sales force covering strategic accounts in EMEA and Asia-Pacific and distribution partners for smaller customers from lower revenue-generating regions.
Our sales network in EMEA is supported by a main office and service center in Chandler'sChandler’s Ford, Hampshire, UK, which serves as headquarters of our European sales operations and also provides repair, calibration and technical support services for our EMEA customers. We also have additional sales offices in multiple countries across EMEA to serve and support our various customers and distribution partners.
As for Asia-Pacific, our main sales office for South East Asia is locatedregional headquarters are based in Singapore, while our main sales offices for mainland China are located in Beijing, Shenzhen and Shenzhen.Shanghai. In addition, we have other sales offices in strategic locations around the worldAsia-Pacific region to support our network of distributorscustomers and various customers.distribution partners.
We rely on a network of distributors worldwide to work with us in supporting mostly our international sales and to participate in a large number of international events. We believe that the local presence and cultural attributes of our distributors allow us to better serve our global markets.
Our sales team is led by our chief executive officer (CEO), who is supported by a vice-presidentvice president responsible for each major geographic region: Americas, EMEA and Asia-Pacific. These sales executives, in turn, are backedassisted by regional sales directors that lead a widely distributed team acting as key account managers, regional sales managers, sales engineers and application engineers. Our sales people are located throughout major metropolitan areas around the world. This group of sales professionals has on average more than 15 years of experience in the fields of telecommunications, fiber optics, or test and service assurance.monitoring. Within each major geographic region, we have sales staff dedicated to wireline and wireless test, service assurancemonitoring and analytics customers.
We also have an in-house Customer Service Group to meet the needs of existing and new customers. This group is responsible for providing quotations to customers, supporting our sales force, managing demonstration units, order management, technical support and training as well as calibration and repair services.
Sales to customers in the Americas represented 55%50% of our sales in fiscal 2017,2019, while sales to customers in EMEA and Asia-Pacific accounted for 26%32% and 19%18% of our sales, respectively. In comparison, the Americas, EMEA and Asia-Pacific accounted for 55%50%, 25%32% and 20%18% of our sales in 2016,2018, respectively, and 54%55%, 26% and 20%19% in 2015,2017, respectively.
Product Management, Marketing/Communications and Global Services
Product Management
All product management duties fall under the leadership of our CEO, who is supported by two vice-presidentsvice presidents responsible for test and measurement (T&M) as well as service assurance, systems and services.services (SASS). Each product management executive, in turn, is backedassisted by directors and/or product managers who have various degrees in engineering, science and business administration. Directors and product managers are responsible for allsome aspects of our telecom marketing program, includingspecifically product strategy, new product introductions, definition of new features and functions, pricing, product launches and advertising campaigns. We follow up our marketing initiatives by attending industry trade shows. Furthermore, we have a customer relationship management (CRM) system to compile market and customer information including forecasts, opportunities, leads and competitive data. We use this information to make strategic business decisions.
Marketing/Communications
Likewise, allAll marketing and communications activities fall under the leadership of our CEO. Our marketing-communications team, which mainly consists ofCEO, who is supported by a director group managers, project managers,of corporate marketing. The department is responsible for promoting EXFO’s brand globally; further strengthening the company’s relevance to our customers, market and industry; positioning the T&M and SASS portfolios; supporting our Sales team and partners; and helping improve customer experience.
To accomplish these tasks, marketing writers, translators and graphic artists, supportscommunications strategies are developed and executed by five multidisciplinary groups, responsible for the following:
Digital Marketing: Achieving marketing objectives through applying digital technologies and media;
Marketing Campaign Management: Marketing campaign planning and execution for all EXFO’s portfolios, collaborating closely with product management;
Commercial Insights: Generating and ensuring adoption of commercial insights to support our product management team by producingsales organization and partners; analyst relations; and our e-learning and training platform;
Field Marketing and Communications: Shining the spotlight on EXFO across the globe, showcasing our expertise and depth of portfolio at industry events, in the media, and other targeted external and internal audiences; and
In-house agency: Producing marketing and corporate documentation in-house. Literature includes specification sheets, application notes, product catalogues, advertising copy and an electronic corporate newsletter. This Marketing-Communications team also provides the sales tools required by our worldwide sales force like webinars and for updating the marketing contents of our website. In addition, it is responsible for engaging with key industry analysts and media as well as for field marketing, campaign management and digital marketing activities.communications collateral (graphic design, writing, etc.).
Global Services
EXFO'sEXFO’s Global Services operation provides customers with a broad array of support and services worldwide. This team has in-house staff in North America, Europe, and Asia. It also provides local support in specific countries through select partners. Such a strategy enables EXFO to have a global reach while maintaining strong local ties.
This team'steam’s objective is to ensure customer satisfaction through a flawless business experience and to achieve our long-term mission by providing internal and customer-facing services. Specifically, it fulfills its mission by offering:
· | Customer Relationship Management (CRM) Administration – Business ownership of our CRM toolset and evolution;Sales Support – Leverage the effectiveness of our sales force by providing pre-sales and demo support, as well as guiding customers in purchasing the correct equipment for their respective applications, issuing quotations, and promoting our extended warranty service and support program; |
· | Sales Support – Leverage the effectiveness of our sales force by providing pre-sales and demo support, as well as guiding customers in purchasing the correct equipment for their respective applications, issuing quotations, and promoting our extended warranty service and support program;
|
· | Order Management – Accurately process customer orders from entry through fulfillment and delivery, and manage order changes;
|
· | Customer Service – Serve as a primary interface for inbound and outbound customer communication. Provide customers with one central point of contact and work with the customer from purchasing equipment to helping them arrange for service, if necessary;
|
· | Technical Support – Provide post-sales technical support to Test & Measurement product end-users, by providing software fixes and upgrades, troubleshooting malfunction or wrong usage of equipment and suggesting ways to improve equipment productivity and performance.
|
25
Order Management – Accurately process customer orders from entry through fulfillment and delivery, and manage order changes;
· | Field Support – Provide expert technical support and deliver product service worldwide. Support our Worldwide Service Centers and directly manage the Service Partner Program. Where applicable, furnish installation and on-site servicing for more complex equipment and applications;Customer Service – Serve as a primary interface for inbound and outbound customer communication. Provide customers with one central point of contact and work with the customer from purchasing equipment to helping them arrange for service, if necessary; |
· | Systems Services – Provide pre-sale, delivery, post-sale technical support, and systems actualization of customer's network monitoring and converged service assurance systems;Technical Support – Provide post-sales technical support to Test & Measurement product end-users, by providing software fixes and upgrades, troubleshooting malfunction or wrong usage of equipment and suggesting ways to improve equipment productivity and performance; |
· | Education Services – Aggregate expertise, develop material, and deliver free and fee-based training;Field Support – Provide expert technical support and deliver product service worldwide. Support our Worldwide Service Centers and directly manage the Service Partner Program. Where applicable, furnish installation and on-site servicing for more complex equipment and applications; |
· | Customer Care Services – Provide pre-sale, delivery, post-sale technical support, and systems actualization of customer’s network monitoring and converged service assurance systems; Education Services – Aggregate expertise, develop material, and deliver free and fee-based training; Professional Services – Provide value-added solution services for our test and system customers. |
Manufacturing
Our manufacturing operations consist mainly of material planning, supply-chain management, sub-assembly, final assembly and test, software loading, calibration, quality control, shipping, billing and customs management. Most of our manufacturing activities, which occupy a total of 125,000 square feet, take place at our facility compound in Quebec City, Canada, and Shenzhen, China, and Lannion, France, but we also have facilities in Chelmsford, USA,Rennes, France and Oulu, Finland, for final assemblyproduct configuration, software loading, quality control and shipping of service assurance and wireless test equipment, respectively.monitoring systems. All our manufacturing operations fall under the supervision of a vice-president.vice president.
Our Quebec City, Canada, operations mainly produce low-volume, high-complexity telecom products. It has maintained ISO 9001 certification since 1994 and first obtained TL 9000 certification in July 2012. Our manufacturing plant in Shenzhen, China, which started operations in September 2007, is responsible for the production of high-volume, low-complexity telecom products. Our Shenzhen plant, which follows the same corporate quality standards, was first certified ISO 9001 in January 2009 and also obtained TL 9000 certification in July 2012. Acquired from Yenista in 2017, our Lannion, France, operations, produce low-volume, high complexity test and measurement equipment for laboratory, university and production of optical components.
All of our products meet required industry standards, and some of our products address additional voluntary standards, such as those set by Telcordia, IEC, IETF, ETSI and other bodies that issue industry standards. During manufacturing, each product has a specific quality control plan, with rigorous checkpoints, to ensure product conformity. Various tasks in the quality assurance process include quality control, conformity testing, product documentation, product improvement, regulatory compliance, metrology and calibration.
Our manufacturing operations include the following responsibilities:
· | Production. From production planning to product shipment, our production department is responsible for manufacturing high-quality products on time. Factories are organized in work cells; each cell consists of specialized technicians with equipment and has full responsibility over a product family. Technicians are cross-trained and versatile enough, so that they can carry out specific functions in more than one cell. This allows shorter lead times by alleviating bottlenecks. |
· | Manufacturing and Test Engineering. This department, which supports our production cells, acts like a gatekeeper to ensure the quality of our products and the effectiveness of our manufacturing processes. It is responsible for the transfer of products from research and development to manufacturing, product improvement, documentation, metrology, and the quality control and regulatory compliance process. Quality control represents a key element in our manufacturing operations. Quality is assured through product testing at numerous stages in the manufacturing process to ensure that our products meet both stringent industry and customer performance requirements. |
· | Supply-Chain Management. This department is responsible for sales forecasting, raw material procurement, material-cost reduction and vendor performance management. Our products consist of optical, electronic and mechanical parts, which are purchased from suppliers around the world. Approximately one-third of our parts are manufactured to our specifications. Materials represent the largest portion of our cost of goods. Our performance is tightly linked to vendor performance, requiring greater emphasis on this critical aspect of our business.
|
26
Supply-Chain Management. This department is responsible for sales forecasting, raw material procurement, material-cost reduction and vendor performance management. Our products consist of optical, electronic and mechanical parts, which are purchased from suppliers around the world. Approximately one-third of our parts are manufactured to our specifications. Materials represent the largest portion of our cost of goods. Our performance is tightly linked to vendor performance, requiring greater emphasis on this critical aspect of our business.
Our manufacturing operations are subject to environmental laws in various jurisdictions around the world. Our product designs comply with WEEE Directive and RoHS Directive legislation enacted by the European Union regarding, respectively, the disposal of waste electrical and electronic equipment and the restriction of the use of certain hazardous substances in electrical and electronic equipment, for all products exported to Europe. As the world undergoes climate changes, environmental and biodiversity issues have become critical to our society. We obtained ISO 14001 certification in October 2013 and, therefore, started continuous improvement in reducing our environmental footprint.
Sources and Availability of Raw Materials
We use various suppliers to provide parts for the manufacture and support of multiple product lines. Although our intent is to establish at least two sources of supply for materials whenever possible, we obtain several parts from single or limited source supply arrangements. We may not be able to procure these parts from alternative sources at acceptable prices within a reasonable time; therefore, the loss or interruption of such arrangements could have an impact on our ability to deliver certain products on a timely basis. See Item 3D of this Annual Report under "Risk Factors"“Risk Factors ‒ We depend on short-term arrangements with a single supplier or a limited number of suppliers for some key components and materials in our products, which makes us susceptible to supply shortages or price fluctuations that could adversely affect our operating results."”
We will continue to mitigate the risk of production interruptions and shortages of parts by: (1) carrying safety stock of critical components, (2) monitoring the delivery performance of our suppliers, (3) selecting and qualifying alternative sources of supplies for key parts whenever possible, and (4) promptly assessing potential effects of worldwide natural disasters.
Seasonality
Historically, we have been subject to seasonality mainly in our second quarter (December, January and February) due to the Christmas holidays and delays in approval of CSP spending budgets for the new calendar year. These two factors can have negative effects on our bookings in our second quarter, but they are mitigated by the renewal of annual maintenance contracts and sometimes calendar year-end spending on the part of CSPs. We are alsoincreasingly subject to increased seasonality in the fourth quarter (June, July and August), because bookings activity tends to slow down during the summer months, especially in Europe. The acquisition of Astellia in 2018 could also render us more vulnerable to seasonality in the summer, since its sales are largely concentrated in Europe, Middle East and Africa (EMEA). These seasonal effects do not apply consistently and do not always correlate to our financial results. Accordingly, they should not be considered as reliable indicators of future revenue or results of operations.
Competition
The communications test, service assurancemonitoring and analytics markets in telecommunications are highly competitive and subject to rapid change because of technological developments and market conditions. We compete with many different companies, depending on product family and geographical market. We believe that the main competitive factors in the industry include the following:
· | level of technical compliance and alignment to use-case; |
level of technical compliance and alignment to use-case;
· | product performance and reliability; |
product performance and reliability;
· | solution's contribution to productivity; |
solution’s contribution to productivity;
· | price and quality of products; |
price and quality of products;
· | level of technological innovation; |
level of technological innovation;
· | breadth of product offerings; |
breadth of product offerings;
· | customer service and technical support; |
· | strength of sales and distribution relationships; and |
· | financial stability of supplier. |
customer service and technical support;
strength of sales and distribution relationships; and
financial stability of supplier.
Main competitors in the test equipmentand measurement environment include global suppliers like Anritsu Corporation, Fortive Corporation (Fluke Networks), Keysight and Viavi Solutions, as well as othersmaller players such as AFL Noyes, Keysight (IXIA),Deviser Instruments, Kingfisher International, ShinewayTech, Spirent Communications plc,Shineway Tech, VeEX Inc., and Yokogawa Electric Corporation. On the service assurance, systems and analyticsservices side, we mainly compete against Accedian Networks, Anritsu Corporation, Empirix, Keysight (IXIA), Netrounds, NetScout Systems, Inc., Elisa (Polystar), Radcom, Spirent Communications plc, and Viavi Solutions. See Item 3D of this Annual Report under "Risk“Risk Factors ‒ We must continue to overcome significant competition in our targeted industries in order to keep or gain market share and achieve our growth strategy."”
Employees
As at November 1, 2017,2019, we had 1,5771,810 full-time employees compared to 1,5511,803 and 1,4991,577 for the same periods in 20162018 and 2015,2017, respectively. Our workforce as of November 1, 20172019 included 341401 employees in manufacturing, 636656 employees in research and development, and 600753 employees in sales and marketing as well as general and administrative functions.
Our future performance depends, to a significant degree, on our continued ability to attract and retain highly skilled and qualified technical, sales and marketing, and senior management personnel. OurThe majority of our employees are not represented by a labor union with the exception of our manufacturing personnel in Quebec City, Canada.Canada, R&D and Service employees in Valencia and Madrid, Spain, and R&D and Service employees in Rennes, France. We consider relations with our employees to be good. See Item 3D of this Annual Report under "Risk“Risk Factors ‒ We require employees and managers who are knowledgeable about the specialized nature of our business. If we are unable to attract and retain sufficient numbers of highly skilled technical, sales, marketing, senior management and other personnel, our operations and financial results will suffer"suffer”.
Regulatory Environment
In most countries where our products are sold, our products must comply with the regulations of one or more governmental entities. These regulations often are complex and vary from country to country. Depending upon the country and the relevant product, the applicable regulations may require product testing, approval, registration, marking and unique design restrictions. Accordingly, we have appointed a team of engineersspecialists who are responsible for ensuring that our products comply with all applicable regulations.
In the United States, our products must comply with the regulations of some agencies of the U.S. federal government, including the Federal Communications Commission (FCC), the Food and Drug Administration (FDA) and the Occupational Safety and Health Administration (OSHA). Under the FCC'sFCC’s regulations, our products must comply with certain electromagnetic interference (EMI) requirements to insure they do not generate electromagnetic noise which could possibly cause undesirable operation, as well as affect other surrounding devices. Additionally, some of our products must comply with the FDA'sFDA’s non-medical performance standards and related rules concerning light-emitting products, such as lasers. The FDA'sFDA’s regulations applicable to our products are intended to promote safety by limiting human exposure to harmful non-iodizing radiation. Similarly, our products must comply with safety standards adopted by OSHA.
Similar regulations apply in other countries. For example, in Canada our products must comply with the applicable standards adopted by the Standards Council of Canada (SCC). These include product safety standards developed in collaboration with the Canadian Standards Association as well as EMI requirements adopted by Innovation, Science and Economic Development Canada. Countries in the European Union require product compliance as dictated by the applicable directives, which are required to be authorized to apply the CE marking on the product. This includes testing to ensure compliance with harmonized European Norm (EN) standards for product safety, EMC and Wireless products requirements and RoHS.
In Europe, with the implementation of the WEEE directives (2012/19/EU) for recycling of electronic products in selected European Countries, EXFO has established a process to ensure full compliance with regulations and oversee the management, logistics, recycling rate, disposal services and activities related to recycling of electronic equipment and products within the member states.
28
Additionally, toTo address the issue of environmental compliance, the European Union has mandated the Restriction of the Use of Certain Hazardous Substances or "RoHS"“RoHS” Directive (2011/65/EU), which applies to all products included within the scope of WEEE directive.Directive. Mandatory product compliance includes the ban of certain substances within specified concentrations, unless formally exempted by the directive.Directive. To ensure compliance to this directive,Directive, a formal restricted substancessubstance control (RSC) program was implemented for our products included within the scope of WEEE. This program ensures the design, procurement and manufacturing of affected products prevents the inclusion of the banned substances as specified by the RoHS directive.Directive.
Other significant types of regulations not described in this Annual Report also may apply, depending upon the relevant product and country of destination.
Intellectual Property
Our success and ability to compete are dependent in part on our ability to develop and protect our proprietary technology. We file U.S. as well as other foreign (utility) patent applications to protect technology, inventions and improvements important to the development of our business. We also rely on a combination of design patents, copyright, trademark, trade secret rights, licensing and confidentiality agreements.
Our intellectual property and proprietary technology are important to the continued success of our business. Were we to inadequately protect our intellectual property and proprietary technology, our competitive position might be significantly impaired. There also remains a risk that our intellectual property rights, particularly our existing or future patents might be invalidated, circumvented, challenged or required to be licensed to others. Furthermore, others may claim that our products infringe upon their intellectual property rights, or they may infringe our intellectual property, and we may expend significant resources enforcing or defending our rights or suffer competitive injury.
Our success and ability to compete depend to a significant extent on our proprietary technology, with which we attempt to prevent others from using the innovations that are central to our existing and future products. As of August 31, 2017,2019, our records indicatedindicate that we held the following portfolio of utility patents: 7594 active granted US patents, 50118 granted or validated patents in countries of the European Union, 8 patents in Canada, 15 patents in China,Europe and 745 patents in other jurisdictions. In addition, we have 2153 utility patent applications (including provisional applications) pending in the US, 2619 utility patent applications at the European Patent Office or directly entered at the nationalpending in Europe and 19 utility patent office of an EU member country, 3 applications in Canada, 14 applications in China and 7 applicationspending in other countries. The expiration dates of our active issued patents range from 20182019 to 2037, with no significant active patent expiring in the near future.
Our records also indicatedindicate that, as of August 31, 2017,2019, we held 2636 active granted design patents, as well as 411 pending design patent applications, in the United States, Europe, China and several other international jurisdictions.
We consider sevenfive of our inventions for which patents either are granted or are pending to be material. These inventions are:are protected by granted patents and/or pending patent applications and can be described as follows:
· | a method and apparatus for improved characterization of loss-inducing "events" along an optical fiber using an Optical Time Domain Reflectometer (OTDR). This invention describes how, by a judicious combination of OTDR data corresponding to different optical-pulse durations, the location and loss characteristics of an event can be quantified with much better accuracy and/or more rapidly than via conventional approaches. This invention is offered as an option for almost all of the current EXFO OTDR-based products; |
a method and apparatus for improved characterization of loss-inducing “events” along an optical fiber using an Optical Time Domain Reflectometer (OTDR). By a judicious combination of OTDR data corresponding to different optical-pulse durations, the location and loss characteristics of an event can be quantified with much better accuracy and/or more rapidly than via conventional approaches;
· | a method for determining the optical signal-to-noise ratio on polarization-multiplexed signals used in high-bandwidth DWDM optical networks by employing an optical spectrum analyzer. This invention employs a reference trace acquired with one channel being turned off. This invention is a key value-added option to our FTB/IQS-5240S-P and FTB/IQS-5240BPseries of optical spectrum analyzers;a method for determining the optical signal-to-noise ratio on polarization-multiplexed signals used in high-bandwidth DWDM optical networks by employing an optical spectrum analyzer (OSA). It employs a reference trace acquired with one channel being turned off; |
a scalable system for monitoring network elements, for which only a non-redundant subset of the identified network information is stored, thereby enabling monitoring of a much larger group of network elements than is possible with conventional memory-constrained monitoring systems. Furthermore, this system employs a multi-threaded architecture that dynamically spawns an array of multi-technology monitoring sub-systems. The user can leverage data from a multitude of sources and define a sequence of activities based on templates in order to accomplish a given task;
· | a method and apparatus to determine the theoretical and practical data rates for a cable under test. This invention uses a single test device to predict the performance of a pair of ADSL (Asymmetric Digital Subscriber Line) modems, and in case of problems, analyze the cause of the modems' failure to synchronize. It is a key functionality of our FTB-610, FTB-635, MaxTester 610, MaxTester 635 and MaxTester 635G; |
· | a scalable system for monitoring network elements, for which only a non-redundant subset of the identified network information is stored, thereby enabling monitoring of a much larger group of network elements than is possible with conventional memory-constrained monitoring systems. Furthermore, this system employs a multi-threaded architecture that dynamically spawns an array of multi-technology monitoring sub-systems. This invention forms the basis of the web-based EXFO Xtract Open Analytics Platform, enabling the user, among other things, to leverage data from a multitude of sources and to define a sequence of activities based on templates in order to accomplish a given task; |
a method for actively analyzing a data packet delivery path to provide diagnostics and root cause analysis of network delivery path issues;
· | a method for actively analyzing a data packet delivery path to provide diagnostics and root cause analysis of network delivery path issues, which is embedded in certain software applications of the EXFO Worx System of EXFO Service Assurance; |
a communication methodology used to perform independent bi-directional protocol testing over a connection or connectionless network between two test instruments, wherein the transfer mechanism of status and intermediate test results during an active test and the transmission of the final results to one of the instruments enables the user to perform a bidirectional single-ended test.
· | a distributed protocol analyzer for quality-of-service measurement. This invention underlies the combined QoS measurements offered in the NetHawk iPro and NetHawk M5 products; and |
· | a communication methodology used to perform independent bi-directional protocol testing over a connection or connectionless network between two test instruments, wherein the transfer mechanism of status and intermediate test results during an active test and the transmission of the final results to one of the instruments enables the user to perform a bidirectional single-ended test. This invention is at the heart of the EXFO Datacom product families, including applications in conformity with our EtherSAM standard test suite. |
Confidentiality and proprietary information agreements with our senior management, employees and others generally stipulate that all confidential information developed or made known to these individuals by us during the course of their relationship is to be kept confidential and not disclosed to third parties, except under specific circumstances. The agreements also generally provide that all intellectual property developed by the individual in the course of rendering services to us belongs exclusively to us. However, these efforts afford only limited protection.
Disclosure pursuant to Section 219 of the Iran Threat Reduction and Syria Human Rights Act of 2012
Under Section 219 of the Iran Threat Reduction and Syria Human Rights Act of 2012, which added section 13(r) of the Securities Exchange Act of 1934, as amended (“the Exchange Act”), public reporting issuers are required to disclose whether they or any of their affiliates knowingly engaged in certain activities, transactions, or dealings relating to Iran or certain designated individuals or entities.
From September 2018 until November 2018, EXFO Solutions (formerly Astellia), a subsidiary of EXFO organized and existing under the laws of France, engaged in transactions involving the sale of passive monitoring and troubleshooting solutions and associated services to end users in Iran. EXFO Solutions (formerly Astellia) sold the equipment for end use by Iranian mobile network operators, Mobile Communications Company of Iran (“MCCI”) and MTN Irancell. Although it is difficult to evaluate with any reasonable degree of certainty, we have concluded that we cannot exclude the possibility that MCCI or MTN Irancell is owned or controlled, directly or indirectly, by the government of Iran.
Gross revenues reported by EXFO Solutions (formerly Astellia) in connection with these transactions, for the three-month period mentioned above, were approximately US$122,379; estimated net result from these transactions was nominal.
Prior to its acquisition by EXFO, EXFO Solutions (formerly Astellia), through a subsidiary located in Lebanon, employed four (4) employees delivering services in Iran, a practice that was continued after the acquisition through the end of October 2018. These activities complied in all material respects with applicable sanction laws and regulations; however, they were inconsistent with EXFO’s internal policies. EXFO discovered this activity during the pre-acquisition due diligence of EXFO Solutions (formerly Astellia) and has conducted a comprehensive internal investigation and review. As a result of this investigation and review, EXFO has implemented additional compliance procedures designed to prevent future violations of its internal policy and is currently in the process of withdrawing from any direct activities, transactions, or dealings relating to Iran or certain designated individuals or entities and will no longer have employees providing services in Iran. In addition, EXFO revised its internal policies to allow indirect support and maintenance of EXFO Solutions’ systems deployed at MCCI and MTN Irancell through a non‑related third-party based outside Iran to honor EXFO Solutions’ (formerly Astellia) prior engagement with existing customers in compliance with applicable export controls, sanctions and other laws, rules and regulation. The withdrawal process was completed on November 4, 2018 and support services through a non-related third party was established at that date.
Gross revenues reported by EXFO Solutions (formerly Astellia) in connection with these support services through a non-related third party for fiscal year 2019 were approximately US$50,472; estimated net result from these transactions was nominal.
30
| C. | Organizational Structure
|
As of November 1, 2017,2019, the following chart presents our corporate structure, the jurisdiction of incorporation of our subsidiaries and the percentage of shares (which is also the percentage of voting power) that we hold in those subsidiaries.
31
| Property, Plant and Equipment |
Our head offices are located in Quebec City, Province of Quebec, Canada where we occupy two buildings. These buildings house our executive and administrative offices, research and development facilities and production facilities. We also have offices in Montreal, Province of Quebec, Canada, in Concord, Ontario, Canada, in Chelmsford, Massachusetts,Richardson, Texas, United States (EXFO Service AssuranceAmerica Inc.), in Chandler's Ford, Hampshire, United Kingdom (EXFO Europe Limited), in Shenzhen, China (EXFO Telecom Equipment (Shenzhen) Co. Ltd.), in Pune, India (EXFO Electro-Optical Engineering India Private Ltd.), in Chandler’s Ford, Hampshire, United Kingdom (EXFO Europe Limited), in Lannion, France (EXFO Optics SAS), in Oulu, Finland (EXFO Oy), in Rennes, France (EXFO Solutions SAS), in Shenzhen, China (EXFO Telecom Equipment (Shenzhen) Co. Ltd.), in Valencia, Spain (EXFO Telecom Spain SL) and in Richardson, Texas,London, United States (EXFO America Inc.)Kingdom (Ontology-Partners Limited).
In addition, we maintain sales offices and/or have regional sales managers located in Australia, China, Czech Republic, France, Germany, Great Britain, India, Japan, Lebanon, Mexico, Morocco, Singapore, South Africa, Spain, Sweden, United Arab Emirates and the United States.
The following table sets forth information with respect to the main facilities that we occupy as at November 1, 2017.2019.
| Location | Use of Space | Square Footage | % of Utilization | Type of Interest | | | | |
436 Nolin Street
Quebec (Quebec)
G1M 1E7 | Occupied for manufacturing of products | 44,000 | 95% | Owned | |
400 Godin Avenue
Quebec (Quebec)
G1M 2K2 | Occupied for research and development, customer services, repair/calibration services, manufacturing, management and administration | 129,000 (1) | 85% | Owned | Occupied for research and development, customer services, repair/calibration services, manufacturing, management and administration | 129,000 | (1) | 95% | Owned |
2500 Alfred-Nobel
Montreal (Quebec)
H4S 2C3 | Occupied for research and development, management and administration | 75,000 | 70% | Owned | Occupied for research and development, management and administration | 75,000 | | 70% | Owned |
2500 Alfred-Nobel
Montreal (Quebec)
H4S 2C3 | Leased to a third party | 10,000 | 100% | Owned | Leased to third parties | 23,736 | | 100% | Owned |
2500 Alfred-Nobel
Montreal (Quebec)
H4S 2C3 | Available for rent | 40,000 | 0% | Owned | Available for rent | 26,264 | | 0% | Owned |
160 Drumlin Circle
Concord (Ontario)
L4K 3E5 | Occupied for research and development, product management and administration | 23,500 | 40% | Owned | |
250 Apollo Drive
Chelmsford, MA 01824
United States | Occupied for research and development, manufacturing, management and administration | 25,400 | 75% | Leased | |
F1 to F3, No. 71-3, Xintian Avenue, Xintian Community
Fuhai Subdistrict, Bao’an District
Shenzhen, Guangdong 518103
China | | Occupied for manufacturing of products, repair/calibration services | 64,000 | | 90% | Leased |
ZAC Airlande
2, rue Jacqueline Auriol
CS 69123 Saint-Jacques-de-la-Lande
35091 Rennes Cedex 9
France | | Occupied for research and development, customer services, manufacturing, management and administration | 50,235 | | 90% | Leased |
436 Nolin Street
Quebec (Quebec)
G1M 1E7 | | Occupied for manufacturing of products | 44,000 | | 95% | Owned |
| | | | |
Offices No 602, 603, 604, 701 and 702, Tower S-4 Cybercity
Magarpatta, Hadapsar
Pune 411 013
India | Occupied for research and development | 33,981 | | 85% | Owned |
250 Apollo Drive
Chelmsford, MA 01824
United States | Unoccupied | 25,400 | | 0% | Leased |
4 rue de Louis de Broglie
Lannion 22300
France | Occupied for research and development, manufacturing, management and administration | 24,800 | | 50% | Leased |
Elektroniikkatie 2
FI-90590 Oulu
Finland | Occupied for research and development, manufacturing, management and administration | 13,380 | | 100% | Leased |
Winchester House
School Lane
Chandlers Ford, Eastleigh
Hampshire SO53 4DG
United Kingdom | Occupied for European customer service, repair/calibration services, sales management and administration | 13,000 | | 85% | Leased |
Ronda Narciso Monturiol 6 Oficina 110B, 111B, 112B and 113B, Parque Technologico
Paterna, Valencia 46980
Spain | Occupied for research and development and customer services | 10,398 | | 100% | Leased |
Offices No 102
Tower S-4 Cybercity
Magarpatta, Hadapsar
Pune 411 013
India | Leased to a third party | 5,979 | | 100% | Owned |
Phoenix Yard
65-69 Kings Cross Road
London WC1X 9LW
United Kingdom | Occupied for research and development, management and administration | 5,000 | | 100% | Leased |
| (1) | Including the warehouse space. Premises without the warehouse are approximately 115,000 square feet. |
Location | Use of Space | Square
Footage
| % of Utilization | Type of Interest |
4 rue de Louis de Broglie
Lannion 22300
France | Occupied for research and development, manufacturing, management and administration | 24,800 | 50% | Leased |
Phoenix Yard
65-69 Kings Cross Raod
London WC1X 9LW
United Kingdom | Occupied for research and development, management and administration | 2,423 | 100% | Leased |
Winchester House
School Lane
Chandlers Ford, Eastleigh
Hampshire SO53 4DG
United Kingdom | Occupied for European customer service, repair/calibration services, sales management and administration | 13,000 | 85% | Leased |
3rd Floor, Building 10
Yu Sheng Industrial Park
(Gu Shu Crossing)
No. 467, National Highway 107
Xixiang, Bao An District
Shenzhen 518126
China | Occupied for manufacturing of products, repair/calibration services | 64,000 | 85% | Leased |
Offices No 602, 603, 604, 701 and 702
Tower S-4 Cybercity
Magarpatta , Hadapsar
Pune 411 013
India | Occupied for research and development | 33,981 | 85% | Owned |
Offices No 102
Tower S-4 Cybercity
Magarpatta , Hadapsar
Pune 411 013
India | Leased to a third party | 5,979 | 100% | Owned |
Elektroniikkatie 2
FI-90590 Oulu
Finland | Occupied for research and development, manufacturing, management and administration | 30,338 | 55% | Leased |
| Item 4A. | Unresolved Staff Comments |
Not applicable.
33
| Operating and Financial Review and Prospects |
Item 5.Operating and Financial Review and Prospects
This discussion and analysis contains forward-looking statements within the meaning of the U.S. Private Securities Litigation Reform Act of 1995, and we intend that such forward-looking statements be subject to the safe harbors created thereby. Forward-looking statements are statements other than historical information or statements of current condition. Words such as may, expect, believe, plan, anticipate, intend, could, estimate, continue, or similar expressions or the negative of such expressions are intended to identify forward-looking statements. In addition, any statements that refer to expectations, projections or other characterizations of future events and circumstances are considered forward-looking statements. They are not guarantees of future performance and involve risks and uncertainties. Actual results may differ materially from those in forward-looking statements due to various factors including, but not limited to, macroeconomic uncertainty, as well asincluding trade wars and recessions; our ability to successfully integrate businesses that we acquire; capital spending and network deployment levels in the telecommunications industry (including our ability to quickly adapt cost structures to anticipated levels of business and our ability to manage inventory levels with market demand); future economic, competitive, financial and market conditions; consolidation in the global telecommunicationscommunications test, service assurancemonitoring and analytics solutions markets and increased competition among vendors; our ability to successfully integrate businesses that we acquire; capacity to adapt our future product offering to future technological changes; limited visibility with regard to the timing and nature of customer orders; delay in revenue recognition due to longer sales cycles for complex systems involving customers'customers’ acceptance; fluctuating exchange rates; concentration of sales; timely release and market acceptance of our new products and other upcoming products; our ability to successfully expand international operations;operations and to conduct business internationally; and the retention of key technical and management personnel. Assumptions relating to the foregoing involve judgments and risks, all of which are difficult or impossible to predict and many of which are beyond our control. Other risk factors that may affect our future performance and operations are detailed in thisour Annual Report, on Form 20-F.20-F, and our other filings with the U.S. Securities and Exchange Commission and the Canadian securities commissions. We believe that the expectations reflected in the forward-looking statements are reasonable based on information currently available to us, but we cannot assure you that the expectations will prove to have been correct. Accordingly, you should not place undue reliance on these forward-looking statements. These statements speak only as of the date of this document. Unless required by law or applicable regulations, we undertake no obligation to revise or update any of them to reflect events or circumstances that occur after the date of this document. This discussion and analysis should be read in conjunction with the consolidated financial statements.
The following discussion and analysis of financial condition and results of operations is dated November 24, 2017.26, 2019.
All dollar amountsfinancial data are expressed in US dollars, except as otherwise noted.noted, and determined based on International Financial Reporting Standards (IFRS) as issued by the International Accounting Standards Board (IASB). This discussion and analysis also contains financial data that do not comply with IFRS. Where such measures are presented, they are defined, and the reader is informed.
COMPANY OVERVIEW
We are a leading provider of next-generation test, service assurancemonitoring and analytics solutions for fixed and mobile communications service providers (CSPs), web-scale operators as well asand network equipment manufacturers (NEMs) in the global telecommunicationscommunications industry. Our broad portfolio of intelligent hardware and software solutions with contextually relevant analytics are designedenable transformations related to fiber, 5G and network virtualization. Ultimately, customers rely on our solutions to increase network capacity and improve end-user quality of experience enhance network performance and drivefor end-users while driving operational efficiencies throughout the network and service delivery lifecycles. We target high-growth market opportunities related to increasing bandwidth and improving quality of experience on network infrastructures: 5G, Internet of Things (IoT), 4G/LTE (long-term evolution), wireless backhaul, small cells and distributed antenna systems (DAS), 100G and 400G network upgrades, as well as fiber-to-the-home (FTTH)/fiber-to-the-curb (FTTC)/fiber-to-the-node (FTTN) deployments.efficiencies.
34
Our success has been largely predicated on our core expertise in developing test equipment for fixed networks. These solutions are available as handheld test instruments, portable platforms with related modules, and as rack-mounted chassis with related modules. Our PC-centric, open-ended platforms, combined with cloud-based software applications, can be transformed into a fully connected test environment that allows CSPs to automate complex, labor-intensive tasks like fiber-to-the-antenna (FTTA), DASdistributed antenna system (DAS) and small cell deployments. Leveraging platform connectivity, CSPs can also keep track of their entire test fleet, manage software updates and schedule calibration procedures. All test data can be stored in a central database and used as a point of reference against future measurements. Consequently, this enhanced test environment enables customers to increase productivity and reduce operating expenses.
Over the years, we have expanded our product portfolio into fiber monitoring, service assurance for next-generation IP (Internet protocol) networks and test equipment forservice assurance as well as monitoring of 2G, 3G, 4G/LTE and soon 5G mobile networks. Our fiber monitoringfiber-monitoring solution leverages EXFO'sEXFO’s expertise and market leadership in optical time domain reflectometry (OTDR) by using themthis technology as remote test units (RTUs) to monitor an optical plant 24 hours per day, seven days per week. As such, thisThis fiber monitoring solution proactively detects any fiber degradation or locates any fiber cut to optimize quality of service along long-haul,long‑haul, metro and access networks. Our IP service assurance solution called the Brix System, is a probe-based hardware and software offering that delivers quality of service and quality of experiencequality-of-service visibility as well as real-time service monitoring and verification of next-generation IP networks. We have enriched our IP service assurance offering, which can also be virtualized, with infrastructure performance management tools, analytics software and network topology discovery topology solutions via technology acquisitions. Built around
Following the acquisition of Astellia S.A. (renamed EXFO Solutions S.A.S.) in January 2018, EXFO offers monitoring solutions for multi-technology mobile networks (2G, 3G, 4G, 5G). The EXFO-Astellia portfolio provides mobile CSPs with capabilities to detect, correlate, analyze, report, geolocate and troubleshoot issues related to network performance, handset behavior and service usage. These solutions can be fully virtualized and combined with information from call traces, third-party probes, CRM, billing, etc., to optimize a distributed architecture, the Brix System enables the successful launch and ongoing profitable operation of IP-based voice, video andbig data applications and services across fixed and mobile networks.framework.
Our mobile network portfolio mainlyalso consists of network simulators and optical radio frequency (RF) test solutions. Our network simulators simulate real-world, large-scale network traffic and end-user behavior in a laboratory environment in order to predict network behavior, uncover faults and optimize networks before mobile networks and services are deployed. Our optical RF test solutions are dedicated to tuningturning up and troubleshooting fiber-based mobile networks. These solutions are critical for locating and analyzing RF interference issues in FTTA, DAS, remote radio heads and baseband units that support 4G/LTE and upcoming 5G networks. These software applications can be combined with optical and Ethernet modules in our FTB-1 Pro platform to create an all-in-one test solution for cell technicians and maintenance engineers.
The competitive advantages of our products include a high degree of innovation, modularity (especially wireline products) and ease of use. Ultimately, ourOur products enable NEMs, CSPs and web-scale operators to design, deploy, troubleshoot and monitor fixed and mobile networks and, in the process, they help them reduce the cost of operating their networks.
We have a staff of approximately 1,6001,900 people in 25 countries, supporting more than 2,000 customers around the world. We operate three main manufacturing sites, which are located in QuebecQuébec City, Canada, in Shenzhen, China, and Lannion, France, and we have facilities in Rennes, France, and Oulu, Finland.Finland, for product configuration, software loading, quality control and shipping of monitoring systems. We also have sixfive main research and development expertise centers in Boston, Toronto, Montreal, QuebecMontréal, Québec City, Rennes, Oulu and London, supported by a software development center in India.
We launched 16 new products and/or major enhancementsreleased a number of key solutions in fiscal 2017, addressing four key technology areas:2019 that enable customers to accelerate their network transformations. We introduced a new category of fiber-testing solutions with the launch of the industry’s first optical fiber Cloud, network virtualizationmultimeter. This innovative test instrument simplifies the task of frontline technicians by automatically evaluating the quality of fiber links in a matter of seconds. We also expanded our 400G test portfolio with the launch of a module featuring an Open Transceiver System. This modular design enables compatibility between current and 5G. New product introductions included a 400 Gbit/s optical transportfuture high-speed transceivers with EXFO’s field and lab test solution for the lab and manufacturing markets;platforms. In addition, we released an automated fiber inspection probetool for testing multi-fiber connectors in data centerspolarity, continuity and radio access networks; a software-based solution, Universal Virtual Synch, enabling communications service providers to accurately and cost-effectively measure network latency; and optical RF over OBSAI (open base station architecture initiative) link test capabilities to complement optical RF over CPRI (common public radio interface) test technology for centralized radio access networks.connector cleanliness on multifiber cables.
35
Our sales, which include a full-year contribution from newly acquired EXFO Solutions S.A.S. (formerly Astellia S.A.), compared to a seven-month contribution last year, increased 4.6%6.4% to $243.3$286.9 million in fiscal 2017 compared to $232.62019 from $269.5 million in 2016.2018. Bookings which represent purchase(purchase orders received from customers,customers), which include a full-year contribution from EXFO Solutions, increased 4.8%11.2% to $251.8$297.8 million in fiscal 2017 compared to $240.3 million in 2016,2019, for a book-to-bill ratio of 1.03.1.04, from $267.7 million in 2018.
Net earningsloss attributable to the parent interest amounted to $0.9$2.5 million, or $0.02$0.04 per diluted share, in fiscal 2017,2019, compared to $8.9$11.9 million, or $0.16$0.22 per diluted share in fiscal 2016.2018. Net earningsloss attributable to the parent interest in fiscal 20172019 included net expenses totaling $10.6$15.1 million, comprising $2.7$7.8 million in after-tax amortization of intangible assets, $1.4$1.8 million in stock-based compensation costs, $4.8$3.2 million in after-tax restructuring charges, $0.4$1.4 million for the acquisition-related deferred revenue fair value adjustment, and a foreign exchange loss of $0.9 million. Net loss attributable to the parent interest also includes $1.7 million for a gain on disposal of capital assets and $2.4 million for a deferred income tax recovery. Net loss attributable to the parent interest in fiscal 2018 included net expenses totaling $17.1 million, comprising $9.4 million in after-tax amortization of intangible assets, $1.7 million in stock-based compensation costs, $3.4 million in after-tax restructuring charges, $2.1 million for the acquisition-related deferred revenue fair value adjustment, $0.7 million in positive change in the fair value of the cash contingent consideration, $1.1$2.5 million in after-tax acquisition-related costs, and a foreign exchange loss of $1.0 million. Net earnings in fiscal 2016 included net expenses totaling $2.3 million comprising $1.1 million in after-tax amortization of intangible assets, $1.4 million in stock-based compensation costs, and a foreign exchange gain of $0.2$1.3 million.
Adjusted EBITDA (net earnings (loss) attributable to the parent interest before interest and other expense, income taxes, depreciation and amortization, stock-based compensation costs, restructuring charges, acquisition-related deferred revenue fair value adjustment, change in fair value of cash contingent consideration, and foreign exchange gain or loss) amounted to $22.0$25.6 million, or 9.1%8.9% of sales, in fiscal 2017,2019, compared to $22.0$17.2 million, or 9.5%6.4% of sales in 2016. As disclosed in the third quarter of fiscal 2017, expected adjusted EBITDA for fiscal 2017 amounted to approximately $20 million, based on the midpoint of our earnings guidance for the fourth quarter. In the fourth quarter of fiscal 2017, actual sales were at the high end of our earnings guidance, which explains higher than expected2018. Adjusted EBITDA for the whole fiscal year.is a non-IFRS measure. See page 5556 of this document for a complete reconciliation of adjusted EBITDA andto IFRS net earnings.earnings (loss) attributable to the parent interest.
On October 31, 2016,In September 2018, as part of our fiscal 2018 restructuring plan and the shutdown of our operations in Toronto, Canada, we acquired substantially allentered into a binding agreement to sell one of our buildings for net proceeds of $3.3 million. The transfer of ownership occurred during fiscal 2019 and resulted in a gain of $1.7 million that was recorded in interest and other income (expense) line item in our consolidated statement of earnings for that year.
In addition, in fiscal 2019, as part of our fiscal 2018 restructuring plan and the assetsshutdown of Absolute Analysis Inc. (Absolute), a privately held company locatedsome of our facilities in the United States, supplying solutions for radio frequency testingwe transferred the ownership of fiber-based radio access networks. The acquisition-date fair valuecertain intellectual property held in the United States to Canada. This created a deductible tax asset in Canada and resulted in the recognition of the total consideration amounted to $8.5 million, and consisteda one-time deferred income tax recovery of $5.0$2.4 million in cash andfiscal 2019 as the issuancerecovery of 793,070 subordinate voting shares valued at $3.5 million.this asset is probable. This acquisitiondeferred income tax recovery was accounted for by applying the acquisition method as required by IFRS 3, "Business Combinations", and the requirements of IFRS 10, "Consolidated Financial Statements"; consequently, the fair value of the total consideration was allocated to the assets acquired and liabilities assumed based on management's estimate of their fair value as at the acquisition date. The results of operations of the acquired business have been includedrecorded in our consolidated financial statements since October 31, 2016, beingstatement of earnings for that year.
Adjusted EBITDA outlook
Short-term target
Fiscal 2019
In fiscal 2018, we had established an adjusted EBITDA target of $24 million for fiscal 2019. Actual adjusted EBITDA reached $25.6 million, or 8.9% of sales, slightly higher than expected.
Fiscal 2020
For fiscal 2020, considering results achieved in fiscal 2019, the dateanticipated increase in sales volume and the resulting improved fixed-cost absorption, the full impact of acquisition. For additional disclosure on the accounting for the acquisition, see note 3 to our fiscal 2017 consolidated financial statements.2018 restructuring plan, as well as the impact of the upcoming adoption of IFRS 16, ‘’Leases’’, on September 1, 2019, we forecast adjusted EBITDA of $33 million. The adoption of IFRS 16 is expected to increase adjusted EBITDA by approximately $4 million in fiscal 2020. Our adjusted EBITDA target also considers constant currencies.
On March 2, 2017, we acquired all issued and outstanding shares of Ontology Partners Limited (Ontology), a privately held company located in the United Kingdom, a supplier of real-time network topology discovery and service-chain mapping. The acquisition-date fair value of the total consideration amounted to $9.2 million and consisted of $7.8 million in cash, net of Ontology's cash of $2.2 million at the acquisition date, plus a cash contingent consideration based on certain sales volume of Ontology products over the 12-month period following the acquisition, valued at $1.4 million at the acquisition date. This acquisition was accounted for by applying the acquisition method as required by IFRS 3, "Business Combinations", and the requirements of IFRS 10, "Consolidated Financial Statements"; consequently, the fair value of the total consideration transferred was allocated to the assets acquired and liabilities assumed based on management's estimate of their fair value as at the acquisition date. The results of operations of the acquired business were included in our consolidated financial statements since March 2, 2017, being the date of acquisition. For additional disclosure on the accounting for the acquisition, see note 3 to our fiscal 2017 consolidated financial statements.
36
Medium-term target
On March 29, 2017,
In fiscal 2018, we announcedestablished an adjusted EBITDA margin target of 15% of sales for the appointmentnext three years (2019 to 2021). This medium-term adjusted EBITDA target was established based on expected sales increase mainly from our service assurance, systems and services (SASS) product line (which represented 27% of Philippe Morinsales in fiscal 2018). This product line delivers a higher gross margin before depreciation and amortization than our test and measurement (T&M) product line (which represented 73% of our sales in fiscal 2018), due to its richer software content. In addition, we expect higher growth from our SASS product line over the next three years, as it represents a much larger addressable market ($2.5 billion+) compared to our new Chief Executive Officer (CEO), effective April 1, 2017. Mr. Morin, who has more than 25 years of experience in the telecommunications industry, initially was named EXFO's Chief Operating Officer in November 2015. PriorT&M product line ($900 million) and for which our market share is lower compared to joining EXFO, Mr. Morin was Senior Vice-President of Worldwide Sales and Field Operations at Ciena. He also held senior management positions at Nortel Networks, including President of the Optical Networking Division. EXFO founder Germain Lamonde, who had fulfilled the roles of CEO and Chairman of the Board for more than 30 years, became Executive Chairman. He maintains leadership of EXFO's acquisition strategy and remains actively involved in defining EXFO'sour T&M product line. This growth initiatives, customer outreachis expected to come from organic growth as well as corporate governance.
On May 2,through acquisitions, like those completed in fiscal 2017 we announced a restructuring plan to streamlineand 2018 (Absolute Analysis Inc. (Absolute), Ontology Partners Limited (Ontology) and EXFO Solutions) and from related synergies. Furthermore, this sales growth should result in better absorption of our passive monitoring solutions portfolio,fixed manufacturing costs, which falls underwould increase our protocol-layer product line. This plan resulted in severance expensesgross margin before depreciation and amortization and our adjusted EBITDA. A large portion of $4.1 million and inventory writeoffs of $1.0 million,our operating costs is fixed mainly for total restructuring charges of $5.1 million during the year. As a result of this plan, we expect annual savings of approximately $9 million.
On September 8, 2017, we acquired 33.1% of all issued and outstanding shares of Astellia SA ("Astellia"), a publicly traded company on the NYSE Euronext Paris stock exchange. Astellia is a provider of network and subscriber intelligence enabling mobile operators to drive service quality, maximize operational efficiency, reduce churn and develop revenue. Its vendor-independent, real-time monitoring and troubleshooting solution is used to optimize networks end-to-end from radio to core. The acquisition-date fair value of the consideration transferred amounted to €8.6 million (US$10.3 million) in an all-cash deal.
On October 2, 2017, we acquired all issued and outstanding shares of Yenista Optics S.A.S (Yenista), a privately held company located in France, a supplier of advanced optical test equipment for the research and development and manufacturing markets. Its portfolio includes benchtop optical spectrum analyzers, tunable lasers, tunable filters and passive optical component test systems for NEMs and optical component vendors. The acquisition-date fair value ofexpenses as well as administrative expenses. Our adjusted EBITDA target also considers constant currencies.
Despite the total consideration amounted to €9.4 million (US$11.1 million) and consisted of €8.3 million (US$9.7 million) in cash, net of Yenista's cash of €1.1 million (US$1.4 million) atpositive impact the acquisition date. This acquisition will be accounted for by applying the acquisition method as required by IFRS 3, "Business Combinations", and the requirementsadoption of IFRS 10, "Consolidated Financial Statements"; consequently,16 will have on Adjusted EBITDA going forward, we reaffirm our adjusted EBITDA target of 15% for the fair value of the total consideration transferred will be allocated to the assets acquired and liabilities assumed based on management's estimate of their fair value as at the acquisition date. The results of operations of the acquired business will be included in our consolidated financial statements starting October 2, 2017, being the date of acquisition.
On October 10, 2017, we reached an agreement with Astellia to acquire Astellia's remaining shares at a share price of €10, for total consideration of €17.3 million (approximately US$20 million) by way of a public tender offer. The public offering will open in late calendar 2017 or early 2018, subject to the approval of French foreign investment authorities and permission from l'Autorité des marchés financiers. If the public tender offering is successful, the settlement of the acquisition is expected to take place early in calendar 2018.next two years.
On October 25, 2017, we modified certain credit facilities whereby existing linesThese short-term and medium-term adjusted EBITDA targets are forward-looking statements. In addition, as they exclude items that pertain to future events that are not currently estimable with a reasonable degree of credits, that provided advances up to CA$4.8 million (US$3.8 million)accuracy, such as foreign exchange gain or loss and up to US$6.0 million for operating purposes, were cancelled and replaced by a credit facility of CA$28.9 million (US$23.1 million) mainly for the acquisition of the remaining shares of Astellia under the public tender offer.income taxes, no corresponding IFRS measure has been provided.
Sales
We sell our products to a diversified customer base in approximately 100 countries through our direct sales force and channel partners, such as sales representatives and distributors. Most of our sales are denominated in US dollars, euros and Canadian dollars.
In fiscal 20152018 and 2016,2019, no customer accounted for more than 10% of our sales, with our top customer representing 7.1%9.1% and 7.1%6.9% of our sales respectively. In fiscal 2017, our top customer represented 10.1% of our sales, with our top three customers representing 18.4% of our sales.
We believe that we have a vast array of products, a diversified customer base and a good spread across geographical areas, which provides us with reasonable protection against the concentration of sales and credit risk.
Cost of Sales
The cost of sales includes raw materials, salaries and related expenses for direct and indirect manufacturing personnel and professional services, as well as overhead costs. Excess, obsolete and scrapped materials are also included in the cost of sales. However, the cost of sales is presented exclusive of depreciation and amortization, which are shown separately in the consolidated statements of earnings.
Operating Expenses
We classify our operating expenses into three main categories: sellingSelling and administrative, expenses,and research and development expenses as well as depreciation and amortization expenses.
Selling and administrative expenses consist primarily of salaries and related expenses for personnel, sales commissions, travel expenses, marketing programs, professional services, information systems, human resources and other corporate expenses.
Gross research and development expenses consist primarily of salaries and related expenses for engineers and other technical personnel, material component costs as well as fees paid to third-party consultants. We are eligible to receive research and development tax credits on research and development activities carried out in Canada.Canada and France. All related research and development tax credits are recorded as a reduction of gross research and development expenses.
3837
RESULTS OF OPERATIONS
(in thousands of US dollars, except per share data, and as a percentage of sales for the years indicated)
| | | Years ended August 31, | |
Consolidated statement of earnings data (1): | | 2017 | | | 2016 | | | 2015 | | | 2017 | | | 2016 | | | 2015 | |
| Sales | | $ | 243,301 | | | $ | 232,583 | | | $ | 222,089 | | | | 100.0 | % | | | 100.0 | % | | | 100.0 | % |
| | | | | | | | | | | | | | | | | | | | | | | | | |
Cost of sales (2) | | | 94,329 | | | | 87,066 | | | | 85,039 | | | | 38.8 | | | | 37.4 | | | | 38.3 | |
Selling and administrative (3) | | | 86,256 | | | | 82,169 | | | | 82,200 | | | | 35.5 | | | | 35.3 | | | | 37.0 | |
| Net research and development | | | 47,168 | | | | 42,687 | | | | 44,003 | | | | 19.4 | | | | 18.4 | | | | 19.8 | |
| Depreciation of property, plant and equipment | | | 3,902 | | | | 3,814 | | | | 4,835 | | | | 1.6 | | | | 1.6 | | | | 2.2 | |
| Amortization of intangible assets | | | 3,289 | | | | 1,172 | | | | 2,883 | | | | 1.4 | | | | 0.5 | | | | 1.3 | |
| Change in fair value of cash contingent consideration | | | (383 | ) | | | – | | | | – | | | | (0.2 | ) | | | – | | | | – | |
| Interest and other (income) expense | | | 303 | | | | (828 | ) | | | (155 | ) | | | 0.1 | | | | (0.4 | ) | | | (0.1 | ) |
| Foreign exchange (gain) loss | | | 978 | | | | (161 | ) | | | (7,212 | ) | | | 0.4 | | | | – | | | | (3.2 | ) |
Unusual charge (3) | | | – | | | | – | | | | 603 | | | | – | | | | – | | | | 0.3 | |
| Earnings before income taxes | | | 7,459 | | | | 16,664 | | | | 9,893 | | | | 3.0 | | | | 7.2 | | | | 4.4 | |
| Income taxes | | | 6,608 | | | | 7,764 | | | | 5,036 | | | | 2.7 | | | | 3.4 | | | | 2.2 | |
| Net earnings for the year | | $ | 851 | | | $ | 8,900 | | | $ | 4,857 | | | | 0.3 | % | | | 3.8 | % | | | 2.2 | % |
| | | | | | | | | | | | | | | | | | | | | | | | | |
| Basic net earnings per share | | $ | 0.02 | | | $ | 0.17 | | | $ | 0.09 | | | | | | | | | | | | | |
| Diluted net earnings per share | | $ | 0.02 | | | $ | 0.16 | | | $ | 0.08 | | | | | | | | | | | | | |
| | | | | | | | | | | | | | | | | | | | | | | | | |
| Other selected information: | | | | | | | | | | | | | | | | | | | | | | | | |
| | | | | | | | | | | | | | | | | | | | | | | | | |
Gross margin before depreciation and amortization (4) | | $ | 148,972 | | | $ | 145,517 | | | $ | 137,050 | | | | 61.2 | % | | | 62.6 | % | | | 61.7 | % |
| | | | | | | | | | | | | | | | | | | | | | | | | |
| Research and development data: | | | | | | | | | | | | | | | | | | | | | | | | |
| Gross research and development | | $ | 53,124 | | | $ | 47,875 | | | $ | 50,148 | | | | 21.8 | % | | | 20.6 | % | | | 22.6 | % |
| Net research and development | | $ | 47,168 | | | $ | 42,687 | | | $ | 44,003 | | | | 19.4 | % | | | 18.4 | % | | | 19.8 | % |
| | | | | | | | | | | | | | | | | | | | | | | | | |
| Restructuring charges included in: | | | | | | | | | | | | | | | | | | | | | | | | |
| Cost of sales | | $ | 1,697 | | | $ | – | | | $ | 290 | | | | 0.7 | % | | | – | % | | | 0.1 | % |
| Selling and administrative expenses | | $ | 1,150 | | | $ | – | | | $ | 586 | | | | 0.5 | % | | | – | % | | | 0.3 | % |
| Net research and development expenses | | $ | 2,232 | | | $ | – | | | $ | 761 | | | | 0.9 | % | | | – | % | | | 0.3 | % |
| | | | | | | | | | | | | | | | | | | | | | | | | |
Adjusted EBITDA (4) | | $ | 22,041 | | | $ | 22,039 | | | $ | 13,779 | | | | 9.1 | % | | | 9.5 | % | | | 6.2 | % |
| | | | | | | | | | | | | | | | | | | | | | | | | |
Consolidated balance sheet data (1): | | | | | | | | | | | | | | | | | | | | | | | | |
| Total assets | | $ | 259,241 | | | $ | 237,793 | | | $ | 217,478 | | | | | | | | | | | | | |
Consolidated statement of earnings data: (1) | | 2019 | | | 2018 | | | 2017 | | | 2019 | | | 2018 | | | 2017 | |
Sales | | $ | 286,890 | | | $ | 269,546 | | | $ | 243,301 | | | | 100.0 | % | | | 100.0 | % | | | 100.0 | % |
| | | | | | | | | | | | | | | | | | | | | | | | | |
Cost of sales (2) | | | 118,677 | | | | 105,004 | | | | 94,329 | | | | 41.4 | | | | 39.0 | | | | 38.8 | |
| Selling and administrative | | | 98,646 | | | | 98,794 | | | | 86,256 | | | | 34.4 | | | | 36.7 | | | | 35.5 | |
| Net research and development | | | 50,553 | | | | 57,154 | | | | 47,168 | | | | 17.6 | | | | 21.2 | | | | 19.4 | |
| Depreciation of property, plant and equipment | | | 5,469 | | | | 5,444 | | | | 3,902 | | | | 1.9 | | | | 2.0 | | | | 1.6 | |
| Amortization of intangible assets | | | 9,012 | | | | 10,327 | | | | 3,289 | | | | 3.1 | | | | 3.8 | | | | 1.4 | |
| Change in fair value of cash contingent consideration | | | – | | | | (670 | ) | | | (383 | ) | | | – | | | | (0.3 | ) | | | (0.2 | ) |
| Interest and other expense | | | 718 | | | | 1,378 | | | | 303 | | | | 0.3 | | | | 0.5 | | | | 0.1 | |
| Foreign exchange (gain) loss | | | 949 | | | | (1,309 | ) | | | 978 | | | | 0.3 | | | | (0.5 | ) | | | 0.4 | |
| Share in net loss of an associate | | | – | | | | 2,080 | | | | – | | | | – | | | | 0.8 | | | | – | |
| Gain on deemed disposal of the investment in an associate | | | – | | | | (2,080 | ) | | | – | | | | – | | | | (0.8 | ) | | | – | |
| Earnings (loss) before income taxes | | | 2,866 | | | | (6,576 | ) | | | 7,459 | | | | 1.0 | | | | (2.4 | ) | | | 3.0 | |
Income taxes | | | 5,346 | | | | 5,678 | | | | 6,608 | | | | 1.9 | | | | 2.1 | | | | 2.7 | |
| Net earnings (loss) for the year | | | (2,480 | ) | | | (12,254 | ) | | | 851 | | | | (0.9 | ) | | | (4.5 | ) | | | 0.3 | |
| Net loss for the year attributable to non-controlling interest | | | – | | | | (352 | ) | | | – | | | | – | | | | (0.1 | ) | | | – | |
| Net earnings (loss) for the year attributable to the parent interest | | $ | (2,480 | ) | | $ | (11,902 | ) | | $ | 851 | | | | (0.9 | )% | | | (4.4 | )% | | | 0.3 | % |
| | | | | | | | | | | | | | | | | | | | | | | | | |
| Basic and diluted net earnings (loss) attributable to the parent interest per share | | $ | (0.04 | ) | | $ | (0.22 | ) | | $ | 0.02 | | | | | | | | | | | | | |
| | | | | | | | | | | | | | | | | | | | | | | | | |
| Other selected information: | | | | | | | | | | | | | | | | | | | | | | | | |
| | | | | | | | | | | | | | | | | | | | | | | | | |
Gross margin before depreciation and amortization (3) | | $ | 168,213 | | | $ | 164,542 | | | $ | 148,972 | | | | 58.6 | % | | | 61.0 | % | | | 61.2 | % |
| | | | | | | | | | | | | | | | | | | | | | | | | |
| Research and development data: | | | | | | | | | | | | | | | | | | | | | | | | |
| Gross research and development | | $ | 57,972 | | | $ | 65,243 | | | $ | 53,124 | | | | 20.2 | % | | | 24.2 | % | | | 21.8 | % |
| | | | | | | | | | | | | | | | | | | | | | | | | |
| Restructuring charges included in: | | | | | | | | | | | | | | | | | | | | | | | | |
Cost of sales | | $ | 304 | | | $ | 517 | | | $ | 1,697 | | | | 0.1 | % | | | 0.2 | % | | | 0.7 | % |
| Selling and administrative expenses | | $ | 495 | | | $ | 673 | | | $ | 1,150 | | | | 0.2 | % | | | 0.2 | % | | | 0.5 | % |
| Net research and development expenses | | $ | 2,506 | | | $ | 3,219 | | | $ | 2,232 | | | | 0.9 | % | | | 1.2 | % | | | 0.9 | % |
| | | | | | | | | | | | | | | | | | | | | | | | | |
Adjusted EBITDA (3, 4) | | $ | 25,585 | | | $ | 17,198 | | | $ | 22,041 | | | | 8.9 | % | | | 6.4 | % | | | 9.1 | % |
| | | | | | | | | | | | | | | | | | | | | | | | | |
Consolidated balance sheet data: (1) | | | | | | | | | | | | | | | | | | | | | | | | |
Total assets | | $ | 277,602 | | | $ | 284,544 | | | $ | 259,241 | | | | | | | | | | | | | |
| (1) | Consolidated statement of earnings and balance sheet data has been derived from our consolidated financial statements prepared according with IFRS, as issued by the IASB, except for non-IFRS measures (4). measures. |
| (2) | The cost of sales is exclusive of depreciation and amortization, shown separately. |
| (3) | Selling and administrative is exclusive of a one-time charge relatingRefer to an unusual bad debt in fiscal 2015.
page 55 for non-IFRS measures. |
| (4) | Refer to page 55 for non-IFRS measures.
Includes acquisition-related costs of $2.2 million or 0.8% of sales in fiscal 2018 and $1.1 million or 0.4% of sales in 2017 (nil in 2019). |
3938
RESULTS OF OPERATIONS
Sales and Bookings
The following tables summarize sales and bookings by product line, in thousands of US dollars:
Sales
| | | Years ended August 31, | |
| | | 2017 | | | 2016 | | | 2015 | |
| | | | | | | | | | |
| Physical-layer product line | | $ | 161,864 | | | $ | 151,910 | | | $ | 144,060 | |
| Protocol-layer product line | | | 81,905 | | | | 83,324 | | | | 80,591 | |
| | | | 243,769 | | | | 235,234 | | | | 224,651 | |
| Foreign exchange losses on forward exchange contracts | | | (468 | ) | | | (2,651 | ) | | | (2,562 | ) |
| Total sales | | $ | 243,301 | | | $ | 232,583 | | | $ | 222,089 | |
| | | Years ended August 31, | |
| | | 2019 | | | 2018 | | | 2017 | |
| | | | | | | | | | |
| Test and measurement | | $ | 204,693 | | | $ | 197,423 | | | $ | 193,863 | |
| Service assurance, systems and services | | | 82,788 | | | | 71,248 | | | | 49,906 | |
| | | | 287,481 | | | | 268,671 | | | | 243,769 | |
| Foreign exchange gains (losses) on forward exchange contracts | | | (591 | ) | | | 875 | | | | (468 | ) |
| Total sales | | $ | 286,890 | | | $ | 269,546 | | | $ | 243,301 | |
Bookings
| | | Years ended August 31, | |
| | | 2017 | | | 2016 | | | 2015 | |
| | | | | | | | | | |
| Physical-layer product line | | $ | 165,886 | | | $ | 155,320 | | | $ | 144,673 | |
| Protocol-layer product line | | | 86,348 | | | | 87,631 | | | | 80,948 | |
| | | | 252,234 | | | | 242,951 | | | | 225,621 | |
| Foreign exchange losses on forward exchange contracts | | | (468 | ) | | | (2,651 | ) | | | (2,562 | ) |
| Total bookings | | $ | 251,766 | | | $ | 240,300 | | | $ | 223,059 | |
| | | Years ended August 31, | |
| | | 2019 | | | 2018 | | | 2017 | |
| | | | | | | | | | |
| Test and measurement | | $ | 210,055 | | | $ | 193,836 | | | $ | 198,583 | |
| Service assurance, systems and services | | | 88,341 | | | | 72,982 | | | | 53,651 | |
| | | | 298,396 | | | | 266,818 | | | | 252,234 | |
| Foreign exchange gains (losses) on forward exchange contracts | | | (591 | ) | | | 875 | | | | (468 | ) |
| Total bookings | | $ | 297,805 | | | $ | 267,693 | | | $ | 251,766 | |
Sales by geographic region
The following table summarizes sales by geographic region:
| | | Years ended August 31, | |
| | | 2019 | | | 2018 | | | 2017 | |
| | | | | | | | | | |
| Americas | | | 50 | % | | | 50 | % | | | 55 | % |
| Europe, Middle East and Africa (EMEA) | | | 32 | | | | 32 | | | | 26 | |
| Asia-Pacific (APAC) | | | 18 | | | | 18 | | | | 19 | |
| | | | 100 | % | | | 100 | % | | | 100 | % |
Fiscal 20172019 vs. 20162018
In fiscal 2017,2019, our sales increased 4.6%6.4% to $243.3$286.9 million, compared to $232.6$269.5 million in 2016,2018, while our bookings increased 4.8%11.2% year-over-year to $251.8$297.8 million in 20172019 from $240.3$267.7 million in 2016,2018, for a book-to-bill ratio of 1.03 (1.03 in 2016).
1.04.
Sales
In fiscal 2017, we made progress2019, the 6.4% increase in total sales (6.6%)year-over-year can be attributed to the positive effect of the acquisition of EXFO Solutions. EXFO Solutions contributed to our sales for the full reporting year in fiscal 2019 versus seven months in 2018. We also benefited from a $4.9 million order that was recognized in fiscal 2019 for our physical-layerreal-time network topology solution (no such order in fiscal 2018). Otherwise, our total sales were negatively affected by currency fluctuations year-over-year.
In fiscal 2019, sales of our T&M product line (opticalimproved 3.7% year-over-year, despite a negative currency impact. In fiscal 2019, we generated increased sales from our high-speed optical transport solutions, as well as higher sales from EXFO Optics for advanced solutions dedicated to labs and copper testing),NEM environments, compared to 2018.
In fiscal 2019, sales of our SASS product line increased 16.2% year-over-year, despite a negative currency impact, mainly because we benefited from the EXFO Solutions acquisition for the full reporting year versus seven months in 2018. We also benefited from a $4.9 million order that was recognized in fiscal 2019 for our real-time network topology solution (no such order in fiscal 2018).
Bookings
In fiscal 2019, our total bookings increased 11.2% year-over-year, mainly due to the positive effect of the acquisition of EXFO Solutions. EXFO Solutions contributed to our bookings for the full reporting year in fiscal 2019 versus seven months in 2018.
We also benefited from larger calendar year-end budget spending from CSPs in the Americas comparedfor our T&M products and we received a $4.9 million order for our real-time network topology solution (no such order in fiscal 2018), as well as four monitoring orders related to 2016, mostly5G deployments in fiscal 2019. Otherwise, in fiscal 2019, total bookings were negatively impacted by currency fluctuations year-over-year.
In fiscal 2019, bookings of our T&M product line increased 8.4% year-over-year mainly due to our leadership position in portable optical testing, a 100G investment cycle among CSPs in this region, and growing business with web-scale operators for their data center interconnects. In addition, in fiscal 2017, we benefited to some extent fromlarger calendar year-endyear‑end budget spending on the part of some CSPs in the Americas,Americas. Our high-speed optical transport and advanced solutions for NEMs and R&D labs also delivered higher bookings compared to 2018. This bookings increase was partially mitigated by the negative currency impact year-over-year.
In fiscal 2019, bookings of our SASS product line increased 21.0% year-over-year mainly due to the positive effect of the acquisition of EXFO Solutions. EXFO Solutions contributed to our bookings for the full period in fiscal 2019 versus seven months in 2018. We also benefited from the $4.9 million order for our real-time network topology solution, as well as four monitoring orders related to 5G deployments. Otherwise, in fiscal 2019, total bookings were negatively impacted by currency fluctuations year-over-year.
Fiscal 2018 vs. 2017
In fiscal 2018, our sales increased 10.8% to $269.5 million, compared to $243.3 million in 2017, while our bookings increased 6.3% year-over-year to $267.7 million in 2018 from $251.8 million in 2017, for a nominal amountbook-to-bill ratio of 0.99.
Sales
In fiscal 2018, the increase in 2016. To a lesser extent,total sales year-over-year comes from the positive effect of our acquisitions of EXFO Solutions (seven-month contribution) and EXFO Optics (eleven-month contribution), as well as the positive currency impact.
In fiscal 2018, sales of our physical-layerT&M line increased 1.8% year-over-year mainly due to the acquisition of EXFO Optics and the positive currency impact.
Sales of our SASS product line increased 42.8% year-over-year in Europe, Middle East and Africa (EMEA) despitefiscal 2018, due to the decrease in the average valuepositive effect of the British pound and the euro compared to the US dollar year-over-year, which had to some extent a negative impact on our sales and bookings to this region in 2017 compared to 2016. In the Asia-Pacific (APAC) region,acquisition of EXFO Solutions, higher sales of our physical-layer product line decreased year-over-year in fiscal 2017, especially in China, mainly due to delayed investments from NEMs.
In fiscal 2017,network-quality fiber-monitoring systems (NQMS), as well as the positive currency impact. Otherwise, sales of our protocol-layerSASS product line slightly decreased 1.7% year-over-year mainly in the Americas, despite the positive impact of newly acquired Absolute. In fiscal 2016, we also had recognized a large order from a North American Tier-1 network operator for our EXFO Xtract solution, and we did not close such large order in fiscal 2017. In addition,due to the streamlining of our passive monitoring product line in the second half of fiscal 2017, had a negative impact on our salesas well as the year‑over-year decrease in 2017 compared to 2016. Furthermore, in fiscal 2016, our transport and datacom product line (a subgroup within our protocol-layer product line) benefited, to a greater extent, from the 100G investment cycle, especially in the United States, compared to 2017. Otherwise, sales of our protocol-layerlegacy active monitoring product line increased in the EMEA year-over-year, mainly due to the positive impact of recently acquired Ontology, despite the decrease in the average value of the British pound and the euro compared to the US dollar year-over-year. Sales of our protocol-layer product line were flat overall in APAC year-over-year in fiscal 2017.line.
Finally, in fiscal 2017, we reported lower losses on our forward exchange contracts, which had a $2.2 million positive impact on our total sales year-over-year.
Overall, the year-over-year increase in total sales in fiscal 2017 comes from the Americas, mainly in Canada and to a lesser extent in the United States, and from the EMEA. On the other hand, sales to APAC slightly decreased year-over-year, as sales to China decreased year-over-year after a robust performance in 2016.
Bookings
In fiscal 2017, we reported a year-over-year2018, the 6.3% increase in total bookings which mainlyyear-over-year comes from the Americas forpositive effect of our physical-layeracquisitions of EXFO Solutions (seven-month contribution), EXFO Optics (eleven-month contribution) and Ontology (full-year contribution in 2018 versus six-month contribution in 2017), a solid performance of our NQMS worldwide, as well as the positive currency impact, offset in part by lower bookings from our Transport and Datacom and passive monitoring product line and from the EMEA for our protocol-layer product line, despite negative currency impacts from the British pound and the euro.lines.
In fiscal 2017,2018, bookings of our physical-layerT&M product line decreased 2.4% year-over-year, despite the positive effect of the acquisition of EXFO Optics, as well as the positive currency impact year-over-year. In fiscal 2018, we reported significant year-over-year increase inlower bookings in the Americas as we benefited from heightened penetration of mobile network operatorsAPAC for their fronthaulour Transport and backhaul networks, increased traction with fixed network operators for their 100G long-haul and metro links and growing business with web-scale operators for their data center interconnects. In addition, as mentioned earlier,Datacom product line, which had delivered strong bookings in fiscal 2017 we have benefited to some extent from calendar year-end budget spending on the part of some CSPs in the Americas, versus a nominal amountthis region. In addition, T&M bookings decreased year-over-year in 2016. Otherwise, bookingsAPAC for both our physical-layer product line were flat in the EMEA and APAC year-over-year. The EMEA was to some extent negatively impacted by the decrease in the average value of the British pound and the euro compared to the US dollar year-over-year. In APAC, bookings were negatively impacted by the decrease in bookingsoptical (mainly in China mainly due to delayed investments from NEMs offset by traction gained in the rest of APAC.
Our protocol-layeras they prepare for 5G investments) and copper-access product lines, reported decrease in total bookings in fiscal 2017 compared to 2016. Most of the decrease comes from the Americas, despite the positive impact our newly acquired Absolute and Ontology businesses, as our transport and datacom product line (a subgroup within our protocol-layer product line) did not reach the same level of orders from the 100G investment cycle, especially in the United States compared to 2016. In addition, in 2016, we received a large order from a North American Tier 1 network operator for our EXFO Xtract solution, and we did not close such large order in 2017. Otherwise, we made progress in bookings in the EMEA thanks to the recent acquisition of Ontology. In addition, in fiscal 2017, bookings in APAC slightly increased year-over-year. Finally, the streamlining or our passive monitoring product line in fiscal 2017 negatively impacted the bookings of our protocol-layer product line compared to 2016.
Fiscal 2016 vs. 2015
In fiscal 2016, our sales increased 4.7% to $232.6 million, compared to $222.1 million in 2015, while our bookings increased 7.7% year-over-year to $240.3 million in 2016 from $223.1 million in 2015, for a book-to-bill ratio of 1.03 (1.00 in 2015).
Sales
In fiscal 2016, despite year-over-year sales increase, we suffered from a headwind from a stronger US dollar compared to 2015. Given that we generate a portion of our revenue in Canadian dollars (Americas) and in euros (EMEA) but report our results in US dollars, it had a negative impact on our total sales and bookings year-over-year,well as the US dollar increased against these currencies. In fact, in fiscal 2016, our total sales would have increased by approximately 6% and our total bookings would have increased by approximately 9% year-over-year in constant currencies.
In fiscal 2016, despite the negative currency impact, both product lines delivered year-over-year increases in sales, with respective increases of 5.4% and 3.4% for our physical and protocol-layer product lines.
In fiscal 2016, the year-over-year sales increase in our physical-layer product line is mainly due to our leadership position in portable optical testing and a 100G investment cycle among CSPs, especially in the United States. This 100G investment cycle also benefited our transport and datacom product line (a subgroup within our protocol-layer product line), especially in the United States. In addition, in fiscal 2016, sales of our newly launched analytics software solution EXFO Xtract (which is also a subgroup of our protocol-layer product line) contributed to the year-over-year sales increase.
Overall, the year-over-year increase in sales in fiscal 2016 comes from the Americas, namely the United States, and from APAC, namely China. Both the United States and China delivered a robust year-over-year sales increase. On the other hand, sales to EMEA slightly decreased year-over-year, due to negative currency impact. Otherwise, this region would have reported slight sales increase year-over-year, despite uncertain market conditions in many European countries. The United Kingdom, however, delivered a strong sales increase in 2016, after a steady decline in sales over the last couple of years.
Bookings
In fiscal 2016, we delivered solid year-over-year increases in bookings for our two product lines, despite the negative currency impact. The year-over-year increase in bookings was manifested through heightened penetration of mobile network operators for their fronthaul and backhaul networks, increased traction with fixed network operators for their 100G long-haul and metro links, and growing business with web-scale operators for their data center interconnects. In addition, in fiscal 2016, we received orders in the Americas for our copper-access product line. Bookings of copper-testing solutions are characterized by large intermittent orders from customers.
Bookings of our SASS product line increased 36.0% year-over-year in fiscal 2018, due to the positive effect of the recent acquisition of EXFO Xtract solution, which resulted in increasedSolutions, higher bookings for our protocol-layerNQMS solutions worldwide, as well as the positive currency impact. Bookings of NQMS are characterized by large intermittent orders from customers. However, we reported lower bookings for our passive-monitoring product line year-over-year.
Overall,due to the streamlining of this product line in the second half of fiscal 2016, we reported robust year-over-year bookings increases in every geographic area.2017.
As we gradually evolve from a supplier of dedicated test instruments to a supplier of end-to-end system-based solutions, our quarterly sales and bookings are becoming increasingly subject to quarterly fluctuations, as we are managing more complex, multimillion dollarmultimillion-dollar deals that have prolonged sales and revenue recognition cycles related to our protocol-layer products. This has been amplified with the recent acquisitionacquisitions of EXFO Solutions and Ontology.
Sales by geographic region
The following table summarizes sales by geographic region:
| | | Years ended August 31, |
| | | 2017 | | 2016 | | 2015 |
| | | | | | | |
| Americas | | 55 | % | | 55 | % | | 54 | % |
| EMEA | | 26 | | | 25 | | | 26 | |
| APAC | | 19 | | | 20 | | | 20 | |
| | | 100 | % | | 100 | % | | 100 | % |
GROSS MARGIN BEFORE DEPRECIATION AND AMORTIZATION
(non-IFRS measure – refer to page 55 of this document)
Gross margin before depreciation and amortization (gross margin) amounted to 61.2%58.6%, 62.6%61.0% and 61.7%61.2% of sales in fiscal 2017, 20162019, 2018 and 20152017 respectively.
Fiscal 20172019 vs. 20162018
In fiscal 2017,2019, EXFO Solutions, which contributed to our gross margin before depreciation and amortization for the full period compared to seven months in the same period last year, delivered lower margins than our typical corporate margin, as a large portion of its sales comprise professional services, which had a negative impact on our gross margin before depreciation and amortization year-over-year.
In addition, in fiscal 2019, our gross margin before depreciation and amortization was negatively affected by a less favorable sales mix compared to 2018.
Furthermore, in fiscal 2019, we recorded in our sales foreign exchange losses on our forward exchange contracts of $0.6 million, compared to foreign exchange gains of $0.9 million in 2018. This gap reduced our gross margin before depreciation and amortization by 0.2% year-over-year.
In addition, in fiscal 2019, we recorded higher inventory writeoffs compared to 2018, which contributed to decrease our gross margin before depreciation and amortization by 0.3% year-over-year.
Fiscal 2018 vs. 2017
In fiscal 2018, gross margin before depreciation and amortization included $1.7a negative impact of 0.3% of sales for the acquisition-related deferred revenue fair value adjustment from the acquisition of EXFO Solutions (nil in 2017).
In fiscal 2018, gross margin before depreciation and amortization included $0.5 million, or 0.7%0.2% of sales in restructuring charges for severance expenses, and inventory writeoffs. Excluding those charges, gross margin would have amountedcompared to 61.9%$1.7 million or 0.7% of sales in fiscal 2017, slightly lower (0.7%) compared to 2016.
In fiscal 2017, our gross margin (excluding the impact of our restructuring charges) was unfavorably affected by product mix within both product lines compared to 2016. In particular, in fiscal 2016, we recognized a large order with a Tier-1 network operator for our EXFO Xtract solution, which had a positive impact on our gross margin during that year as this product delivers strong margins. We did not have such high-margin deals this year. before depreciation and amortization year-over-year.
In addition, in fiscal 2017, our physical-layer product line represented a larger portion of2018, we recorded in our sales year-over-year,foreign exchange gains on our forward exchange contracts, compared to foreign exchange losses in 2017, which contributed to an increase of 0.2% in gross margin before depreciation and this product line deliversamortization year-over-year.
However, newly acquired EXFO Solutions delivered lower margins than our protocol-layer product line (protocol-layer products have a richer software content),typical average corporate margin, and we recorded slightly higher writeoffs (excluding those in restructuring expenses) compared to 2017, which had a negative impact on our gross margin year-over-year.
However, in fiscal 2017, we recorded in our sales lower foreign exchange losses on our forward exchange contracts, compared to 2016, which contributed to increase our gross margin by 0.3% year-over-year.
In addition, in fiscal 2017, we recorded lower inventory writeoffs compared to 2016, which contributed to increase our gross margin by an additional 0.2% year-over-year.
Fiscal 2016 vs. 2015
In fiscal 2016, our gross margin was favorably affected by a richer product mix within our protocol-layer product line. Namely, year-over-year sales increases for our transportbefore depreciation and datacom products, as well as the recognition of orders for our EXFO Xtract software analytics solution, had a positive impact on our gross margin in fiscal 2016, compared to 2015; this was offset in part by an unfavorable product mix within our physical-layer product line year-over-year.
In addition, in fiscal 2016, we recorded lower inventory writeoffs compared to 2015, which contributed to increase our gross margin by 0.2% year-over-year.
Furthermore, in fiscal 2015, we recorded $0.3 million in restructuring charges in the cost of sales (nil in 2016) which negatively affected our gross margin for that year by 0.1%.
Finally, in fiscal 2016, a stronger US dollar compared to other currencies reduced our manufacturing costs and had a positive impact on our gross marginamortization year-over-year.
SELLING AND ADMINISTRATIVE EXPENSES
Selling and administrative expenses amounted to $86.3$98.6 million, $82.2$98.8 million and $82.2$86.3 million for fiscal 2017, 20162019, 2018 and 20152017 respectively. As a percentage of sales, selling and administrative expenses amounted to 35.5%34.4%, 35.3%36.7% and 37.0%35.5% for fiscal 2017, 20162019, 2018 and 20152017 respectively.
Fiscal 20172019 vs. 20162018
In fiscal 2019, our selling and administrative expenses were slightly down ($0.2 million) in dollars compared to 2018.
In fiscal 2019, our selling and administrative expense includes $0.5 million in restructuring expenses compared to $ 0.7 million in fiscal 2018. In addition, in fiscal 2018, our selling and administrative expenses included $2.1 million (1.0% of sales) in acquisition-related costs following our business acquisitions, compared to nil in 2019.
In addition, in fiscal 2019, the positive impact of our 2018 restructuring plan reduced our selling and administrative expenses compared to 2018. Finally, the increase in the average value of the US dollar compared to other currencies had a positive impact on our selling and administrative expenses year-over-year.
However, in fiscal 2019, we incurred additional expenses compared to 2018, as we had the full-year contribution of EXFO Solutions, compared to a seven-month contribution in 2018. In addition, inflation and salary increases contributed to increasing our selling and administrative expenses year-over-year.
Fiscal 2018 vs. 2017
In fiscal 2018, our selling and administrative expenses increased $4.1$12.5 million year-over-year, mainly due to restructuring charges of $1.2 million, additional expenses following the acquisitions of AbsoluteEXFO Solutions (seven-month contribution), EXFO Optics (eleven-month contribution) and Ontology and to support the growth of our business,(full contribution in 2018 versus six-month contribution in 2017), inflation, salary increases, as well as one-timeincreased acquisition-related costs of $1.1 million following the recent business acquisitions. In addition, in fiscal 2018, the decrease in the average value of the US dollar compared to other currencies had a negative impact on our selling and administrative expenses year-over-year.
However, in fiscal 2018, selling and administrative expenses included $0.7 million in restructuring charges compared to $1.2 million in 2017. In addition, the positive impact of our 2017 restructuring plan reduced our selling and administrative expenses year-over-year in fiscal 2018.
Excluding restructuring charges and acquisition-related costs for business combinations, which represent 0.9% of sales, our selling and administrative expenses would have represented 35.7% of sales, 1.1% higher compared to 34.6% of sales lower comparedin 2017, due to 35.3% of sales in 2016.
Fiscal 2016 vs. 2015
In fiscal 2016, our selling and administrative expenses were positively affected by the significant increase in the average valueimpact of the US dollar compared to the Canadian dollarrecent acquisitions and the euro year-over-year, as a portion of our selling and administrative expenses are incurred in Canadian dollars and euros and we report our results in US dollars, as well as by the positive impact of our 2015 restructuring plan. In addition, our 2015 restructuring plan resulted in severance expenses of $0.6 million (or 0.3% of sales) recorded in the fourth quarter of 2015 (nil in 2016); these elements offset inflation, salary increases and increased commission expenses on increased sales.
As percentage of sales, our selling and administrative expenses decreased in fiscal 2016 compared to 2015 as these expenses were flat year-over-year and our sales increased.negative currency impact.
RESEARCH AND DEVELOPMENT EXPENSES
Gross research and development expenses
Gross research and development expenses totaled $53.1$58.0 million, $47.9$65.2 million and $50.1$53.1 million for fiscal 2017, 20162019, 2018 and 20152017 respectively. As a percentage of sales, gross research and development expenses amounted to 21.8%20.2%, 20.6%24.2% and 22.6%21.8% for fiscal 2017, 20162019, 2018 and 20152017 respectively, while net research and development expenses accounted for 19.4%17.6%, 18.4%21.2% and 19.8%19.4% of sales for these respective years.
Fiscal 20172019 vs. 20162018
In fiscal 2017,2019, our gross research and development expenses increased $5.2decreased $7.3 million year-over-year duecompared to restructuring charges of $2.2 million, additional expenses following2018.
In fiscal 2019, the acquisitions of Absolute and Ontology and to support the growthpositive impact of our business, inflation, salary increases, as well as a shift in the mix and timing of research and development projects, compared to 2016.
Excluding2018 restructuring charges, which represent 0.9% of sales,plan reduced our gross research and development expenses would have represented 20.9% of sales, almost flat compared to 20.6% of sales2018. In addition, in 2016.
Fiscal 2016 vs. 2015
In fiscal 2016,2019, the year-over-year significant increase in the average value of the US dollar compared to the Canadian dollar and the euroother currencies had a positive impact on our gross research and development expenses as a large portion of these expenses are incurred in Canadian dollars and euros and we report our results in US dollars. year-over-year.
In addition, the 2015in fiscal 2018, we incurred restructuring charges of $3.2 million as part of our 2018 plan, positively affectedcompared to $2.5 million in 2019, which reduced our gross research and development expenses year-over-year.
On the other hand, in 2016. Finally,fiscal 2019, we incurred additional expenses compared to 2018, as we had the full contribution of EXFO Solutions, compared to a seven-month contribution in 2018. Gross research and development expenses were also subject to inflation and salary increases in fiscal 2019, which increased our 2015expenses year-over-year.
In fiscal 2019, the impact of our fiscal 2018 restructuring plan resulted in severancelower gross research and development expenses as a percentage of $0.8sales compared to 2018.
Fiscal 2018 vs. 2017
In fiscal 2018, our gross research and development expenses increased $12.1 million (or 0.3%year-over-year, mainly due to additional expenses following the acquisitions of sales)EXFO Solutions (seven-month contribution), EXFO Optics (eleven-month contribution) and Ontology (full contribution in 20152018 versus nilsix-month contribution in 2016. However, these positive effects year-over-year were offset in part by inflation, salary increases,2017), as well as a shiftinflation and salary increases.
In addition, in the mix and timing offiscal 2018, our gross research and development projects,expenses included $3.2 million in restructuring charges compared to 2015.$2.2 million in 2017.
Finally, in fiscal 2018, the decrease in the average value of the US dollar compared to other currencies had a negative impact on our gross research and development expenses year-over-year.
However, our gross research and development expenses decreased year-over-year due to the positive impact of our 2017 recent restructuring plan.
Excluding restructuring charges, which represent 1.2% of sales in fiscal 2018 compared to 0.9% of sales in 2017, our gross research and development expenses would have represented 23.0% of sales in 2018, 2.1% higher compared to 20.9% of sales in 2017, due to the impact of the recent acquisitions and the negative currency impact.
As a percentage of sales, our gross research and development decreased in fiscal 2016 compared to 2015 as these expenses decreased year-over-year and our sales increased.
Tax Credits and Grants
We are entitled to tax credits from the Canadian federal and provincial governments for eligible research and development activities conducted in Canada. We are also eligible for grants by a Finnish technology organization on certain researchCanada and development projects conducted in Finland.France.
Tax credits and grants for research and development activities were $6.0$7.4 million, $5.2$8.1 million and $6.1$6.0 million for fiscal 2017, 20162019, 2018 and 20152017 respectively. As a percentage of gross research and development expenses, tax credits and grants reached 11.2%12.8%, 10.8%12.4% and 12.3%11.2% for fiscal 2017, 20162019, 2018 and 20152017 respectively.
Fiscal 20172019 vs. 20162018
The decrease in our tax credits and grants in fiscal 2019, compared to 2018, comes from reduced gross research and development expenses in Canada and France as a result of the impact of our 2018 restructuring plan.
Fiscal 2018 vs. 2017
The increase in our tax credits and grants in fiscal 2017,2018, compared to 2016,2017, is mainly results fromdue to the increase in our grossacquisitions of EXFO Solutions (seven-month contribution) and EXFO Optics (eleven-month contribution) that are entitled to tax credits and grants on research and development expenses year-over-year.
In fiscal 2017,activities carried out in France. This also explains the increase in tax credits and grants as a percentage of gross research and development expenses compared to 2016, mainly comes from the shift in mix of eligible projects.
Fiscal 2016 vs. 2015
The decrease in our tax credits and grants in fiscal 2016, compared to 2015, results from the decrease in our gross research and development expenses, the shift in mix of eligible projects, namely in Finland, as well as from the increase in the average value of the US dollar compared to the Canadian dollar year-over-year, as our tax credits are denominated in Canadian dollars and we report our results in US dollars.
In fiscal 2016, the decrease in tax credits and grants as a percentage of gross research and development expenses, compared to 2015, mainly comes from the shift in mix of eligible projects.
DEPRECIATION OF PROPERTY, PLANT AND EQUIPMENT
Depreciation of property, plant and equipment totaled $3.9 million, $3.8 million and $4.8 million for fiscal 2017, 2016 and 2015 respectively.
In fiscal 2016, the year-over-year increase in the average value of the US dollar compared to the Canadian dollar had a positive effect on our depreciation expenses, as these expenses are incurred in Canadian dollars and we report our results in US dollars.year-over-year.
AMORTIZATION OF INTANGIBLE ASSETS
In conjunction with the business combinations we completed, we recorded intangible assets primarily consisting of core technologytechnologies and customer relationships. In addition, intangible assets include software. These intangible assets resulted in amortization expenses of $3.3$9.0 million, $1.2$10.3 million and $2.9$3.3 million for fiscal 2017, 20162019, 2018 and 20152017 respectively.
Fiscal 20172019 vs. 20162018
In fiscal 2019, amortization of intangible assets decreased of 1.3 million year-over-year, despite the full contribution of EXFO Solutions, compared to a seven-month contribution in 2018. The year-over-year decrease is due to the fact that some acquired intangible assets became fully amortized in fiscal 2019.
The increase in our amortization expense in fiscal 2017,2018, compared to 2016, was2017, is due to the acquisitions of Absolute (October 31, 2016)EXFO Solutions (seven-month contribution), EXFO Optics (eleven-month contribution) and Ontology (March 2,(full contribution in 2018 compared to six-month contribution in 2017).
Fiscal 2016 vs. 2015
The, as well as the decrease in our amortization expense in fiscal 2016, compared to 2015, is mainly due to the fact that core technology related to the acquisition of NetHawk Oyj (acquired in fiscal 2010) became fully amortized in the third quarter of fiscal 2015, and that the average value of the US dollar increased compared to the Canadian dollar year-over-year, as our amortization expense is incurred in this currency and we report our results in US dollars.other currencies year-over-year.
FOREIGN EXCHANGE GAIN (LOSS)
Foreign exchange gains and losses are mainly the result of the translation of operating activities denominated in currencies other than our functional currency, which is the Canadian dollar. A portion of our foreign exchange gains or losses resultresults from the translation of cash balances and deferred income taxes denominated in US dollars. We manage our exposure to currency risk in part with forward exchange contracts. In addition, some of our entities'entities’ operating activities are denominated in US dollars, euros and British pounds, which further hedges this risk. However, we remain exposed to a currency risk; namely, any increase in the value of the Canadian dollar compared to the US dollar would have a negative impact on our operating results.
We reported a foreign exchange loss of $0.9 million in fiscal 2019, compared to a gain of $1.3 million in 2018 and a loss of $1.0 million in 2017.
Fiscal 2019
In fiscal 20172019, we witnessed some volatility in the value of the Canadian dollar as it fluctuated compared to the US dollar, which overall resulted in a foreign exchange loss of $0.9 million. The period-end value of the Canadian dollar decreased 1.8% versus the US dollar to CA$1.3294 = US$1.00 in fiscal 2019 compared to CA$1.3055 = US$1.00 at the end of the previous year. In fiscal 2019, the average value of the Canadian dollar versus the US dollar was CA$1.3247 = US$1.00.
Fiscal 2018
In fiscal 2018, the period-end value of the Canadian dollar decreased versus the US dollar, compared to the previous year-end, which resulted in a foreign exchange gain of $0.2$1.3 million during that year. The period-end value of the Canadian dollar decreased 4.1% versus the US dollar to CA$1.3055 = US$1.00 in 2016 and $7.2 million in 2015.fiscal 2018, compared to CA$1.2536 = US$1.00 at the end of the previous year. In fiscal 2018, the average value of the Canadian dollar versus the US dollar was CA$1.2768 = US$1.00.
Fiscal 2017
In fiscal 2017, the period-end value of the Canadian dollar increased versus the US dollar compared to the previous year-end, which resulted in a foreign exchange loss of $1.0 million during the year. The period-end value of the Canadian dollar increased 4.6%4.4% versus the US dollar to CA$1.2536 = US$1.00 in fiscal 2017 compared to CA$1.3116 = US$1.00 at the end of the previous year. In fiscal 2017, the average value of the Canadian dollar versus the US dollar was CA$1.3212 = US$1.00.
Fiscal 2016
In fiscal 2016, we witnessed some volatility in the value of the Canadian dollar as it fluctuated compared to the US dollar, which overall resulted in a foreign exchange gain of $0.2 million during that period. The period-end value of the Canadian dollar slightly increased 0.3% versus the US dollar to CA$1.3116 = US$1.00 in fiscal 2016 compared to CA$1.3157 = US$1.00 at the end of the previous year. In fiscal 2016, the average value of the Canadian dollar versus the US dollar was CA$1.3278 = US$1.00.
Fiscal 2015
In fiscal 2015, the period-end value of the Canadian dollar significantly decreased versus the US dollar and the euro compared to the previous year end, which resulted in a significant foreign exchange gain of $7.2 million during the year. The period-end value of the Canadian dollar decreased 17.5% to CA$1.3157 = US$1.00 in fiscal 2015 compared to CA$1.0858 = US$1.00 at the end of the previous year, and decreased 3.0% to CA$1.4755 = €1.00 in fiscal 2015 compared to CA$1.4319 = €1.00 at the end of the previous year. In fiscal 2015, the average value of the Canadian dollar versus the US dollar was CA$1.2093 = US$1.00.
Foreign exchange rate fluctuations also flow through the P&Lconsolidated statement of earnings line items as a portionportions of our sales are dominated in Canadian dollars and euros and a significant portionportions of our cost of sales and operating items are denominated in Canadian dollars, euros, Indian rupees, and British pounds, and CNY, and we report our results in US dollars. In fiscal 2016,2019, the increase in the average value of the US dollar compared to the Canadian dollar, the euro, the British pound, the Indian Rupee and the Indian rupeeCNY year-over-year, resulted in a positive impact on our financial results.expenses. The average value of the US dollar increased 8.9%3.8%, 4.6%4.9%, 4.8%, 7.2% and 6.3%3.9% respectively year-over-year, compared to the Canadian dollar, the euro, the British pound, the Indian Rupee and the Indian rupee. In fiscal 2017, overall, there were no significant changes in the average value of our main currencies compared to the US dollar, which had no significant impact on our financial results during the year compared to 2016.CNY.
INCOME TAXES
In fiscal 2017,2019, we reported income tax expenses of $5.3 million on earnings before income taxes of $2.9 million, compared to income tax expenses of $5.7 million on a loss before income taxes of $6.6 million in 2018 and income tax expenses of $6.6 million on earnings before income taxes of $7.5 million compared toin 2017.
Discrete items affecting our effective income tax expensesrate
Fiscal 2019
In fiscal 2019, as part of $7.8 million on earnings beforeour fiscal 2018 restructuring plan and the shutdown of some of our facilities in the United States, we transferred the ownership of certain intellectual property held in the United States to Canada. This created a deductible tax asset in Canada and resulted in the recognition of a deferred income taxestax recovery of $16.7$2.4 million in 2016fiscal 2019 as the recovery of this asset is probable.
In December 2017, the US tax reform ("Tax Cuts and Jobs Act") was substantively enacted and reduced the maximum corporate income tax expensesrate from 35% to 21%, effective January 1, 2018. Based on our estimate of $5.0 million on earnings beforedeferred tax assets expected to be used in fiscal 2018 and beyond against taxable income taxesin the United States, we recorded a deferred income tax expense of $9.9$1.5 million in 2015.
fiscal 2018 to account for the effect of this new substantively enacted tax rate.
TheseOur distorted tax rates for all periods mainly resulted from the fact that we did not recognize deferred income tax assets for some of our subsidiaries at loss a significant portion of our restructuring charges recorded in fiscal 2017 related to these subsidiaries, and acquisition-related costs for business combinations areincurred in fiscal 2017 and 2018 were non-deductible for tax purposes. In addition, we had some other non-deductible losses and expenses, such as stock-based compensation costs. However, a significant portion of our foreign exchange gain or loss was a result of the translation of the financial statements of our foreign subsidiaries from their local currency to the functional currency and was therefore non-taxable or deductible.non-deductible. Otherwise, our effective tax rate would have been closer to the combined Canadian and provincial statutory tax rate of 27% for these years.this year.
Please refer to note 1920 to our consolidated financial statements for a full reconciliation of our income tax provision.
LIQUIDITY AND CAPITAL RESOURCES
Cash Requirements and Capital Resources
As at August 31, 2017,2019, cash and short-term investments totaled $39.2$19.4 million, while our working capital was at $74.4$39.1 million. Our cash and short-term investments decreased $8.1increased $4.4 million in fiscal 2017,2019, compared to 2016. In fiscal 2017, we made cash payments2018.
The following table summarizes the increase of $12.8 million for the acquisitions of Absolute and Ontology, $7.2 million for the purchase of capital assets and $1.5 million for the repayment of the long-term debt assumed as part of the Ontology acquisition. Otherwise, in fiscal 2017, we generated $12.9 million in cash flows from operating activities and we recorded an unrealized foreign exchange gain on our cash and short-term investments in fiscal 2019 in thousands of $0.5 million. This unrealized foreign exchange gain resulted from the translation, into US dollars, of our Canadian-dollar-denominated cash and short-term investments and was included in the accumulated other comprehensive income in the balance sheet.dollars:
| Cash flows provided by operating activities | | $ | 17,242 | |
| Proceeds from disposal of capital assets | | | 3,318 | |
| Purchases of capital assets | | | (7,498 | ) |
| Repayment of bank loan | | | (5,195 | ) |
| Repayment of long-term debt and other liabilities | | | (2,817 | ) |
| Redemption of share capital | | | (312 | ) |
| Unrealized foreign exchange loss on cash and short-term investments | | | (342 | ) |
| | | | | |
| | | $ | 4,396 | |
Our short-term investments consist of debt instruments issued by high-credit quality corporations; therefore, we consider the risk of non-performance of these financial instruments to be limited. These debt instruments are not expected to be affected by a significant liquidity risk. For the purpose of managing our cash position, we have established a cash management policy, which we follow and monitor on a regular basis. Our cash and short-term investments will be used for working capital and other general corporate purposes, and for potential acquisitions. As at August 31, 2017, cash balances included an amount of $6.7 million that bears interest at an annual rate of 1.2%.
We believe that our cash balances and short-term investments totaling $19.4 million, combined with our available revolving credit facilities of $39.2up to $56.5 million, will be sufficient to meet our liquidity and capital requirements for the foreseeable future, including the payment of $10.3 million for the 33.1% investment in Astellia, the payment of $9.7 million for the acquisition of Yenista, and any potential payment for the cash contingent consideration related to the acquisition of Ontology.possible working capital requirements from our new acquisitions. In addition on October 25, 2017, to finance the potential acquisition of the remaining share of Astellia under the public tender offer, we modified certainthese assets and credit facilities, whereby existing lines of credits, that provided advances up to CA$4.8 million (US$3.8 million) and up to US$6.0 million for operating purposes, were cancelled and replaced by a credit facility of CA$28.9 million (US$23.1 million). Finally, we have unused available lines of credit totaling $6.2 million for working capital and other general corporate purposes, and unused lines of credit of $25.7$21.9 million for foreign currency exposure related to forward exchange contracts.
However, possible operating losses, additional restructuring chargescosts and/or possible investments in or acquisitions of complementary businesses, products or technologies may require additional financing. There can be no assurance that additional debt or equity financing will be available when required or, if available, that it can be secured on satisfactory terms.
Sources and Uses of Cash
We finance our operations and meet our capital expenditure requirements mainly through a combination of cash flows from operating activities, the use of our cash and short-term investments, borrowing under our existing credit facilities as well as the issuance of subordinate voting shares.
Operating activities
Cash flows provided by operating activities were $17.2 million in fiscal 2019, compared to $14.4 million in 2018 and $12.9 million in fiscal 2017, compared to $24.4 million in 2016 and $6.5 million in 2015.2017.
Fiscal 20172019 vs. 20162018
Cash flows provided by operating activities in fiscal 20172019 were attributable to the net earnings after items not affecting cash of $13.0$21.8 million, slightly offset in part by the negative net change in non-cash operating items of $0.1$4.6 million; this was mainly due to the negative effect on cash of the increase of $4.8 million in our accounts receivable due to the timing of receipts and sales during the year, the negative effect on cash of the increase of $1.3 million in our prepaid expenses due to timing of payments during the year, the negative effect on cash of the $1.5 million increase in our other assets due to the timing of payments during the year, and the negative effect on cash of the $1.6 million decrease in our other liabilities due to the repayments made during the year. These negative effects on cash were offset in part by the positive effect on cash of the $1.5 million decrease in our income tax and tax credits recoverable due to tax credits recovered during the year and the positive effect on cash of the increase of $3.2 million in our accounts payable and accrued liabilities and provisions due to timing of purchases and payments during the year.
Fiscal 2018 vs. 2017
Cash flows provided by operating activities in fiscal 2018 were attributable to net earnings after items not affecting cash of $8.4 million, and the positive net change in non-cash operating items of $6.0 million; this was mainly due to the positive effect on cash of the decrease of $4.0$7.3 million in our accounts receivable due to the timing of receipts and sales during the year, and by the positive effect on cash of the decrease of $0.9 million in our inventories due to improved inventory turns during the year; these positive effects on cash were more than offset by the negative effect on cash of the $2.4 million increase in our income tax and tax credits recoverable due to tax credits earned during the year not yet recovered, the negative effect on cash of the increase of $0.9 million in our prepaid expenses due to timing of payments during the year, and by the negative effect on cash of the decrease of $1.7$1.0 million in our accounts payable and accrued liabilities and provisions due to timing of purchases and payments during the year.
Fiscal 2016 vs. 2015
Cash flows provided by operating activities in fiscal 2016 were attributable to the net earnings after items not affecting cash of $20.7 million, and the positive net change in non-cash operating items of $3.6 million. This was mainly due to the positive effect on cash of the decrease of $2.7 million in our accounts receivable due to the timing of receipts and sales during the year, the positive effect on cash of the $0.9 million decrease in our income tax and tax credits recoverable due to tax credits earned in previous periods recovered during the year, and the positive effect on cash of the $4.9 million increase in our accounts payable, accrued liabilities and provisions due to the timing of purchases and payments during the year. These positive effects on cash were offset in part by the negative effect on cash of the $4.7$1.0 million increase in our inventories to meet future demand and the negative effect on cash of the $1.3 million increase of $0.3 million in our prepaid expensesother assets due to the timing of payments during the year.
Investing activities
Cash flows used by investing activities amounted to $4.9 million in fiscal 2019, compared to $43.9 million in 2018 and $16.5 million in 2017.
Fiscal 2019
In fiscal 2017, compared to $7.02019, we made cash payments of $7.5 million in 2016for the purchase of capital assets and $2.3we acquired (net of disposal) $0.7 million in 2015.
worth of short-term investments. However, during the year, we received net proceeds of $3.3 million from the sale of capital assets.
Fiscal 2018
In fiscal 2018, we made cash payments of $10.5 million and $32.1 million respectively for the purchase of capital assets and the acquisitions of EXFO Optics and EXFO Solutions. In addition, we acquired (net of disposal) $1.3 million worth of short-term investments during the year.
4847
In fiscal 2017, we made cash payments of $12.8 million and $7.2 million respectively for the acquisitions of Absolute and Ontology and the purchase of capital assets. Otherwise, we disposed (net of acquisitions) of $3.5 million worth of short-term investments.
Fiscal 2016
In fiscal 2016, we paid $4.4 million for the purchase of capital assets and we acquired (net of disposal) $2.6 million worth of short-term investments.
Fiscal 2015
In fiscal 2015, we paid $5.9 million for the purchase of capital assets but we disposed (net of acquisitions) of $3.6 million worth of short-term investments.
Financing activities
Cash flows used by financing activities amounted to $8.3 million in fiscal 2019, compared to cash flows provided of $4.3 million in 2018 and cash flows used of $1.5 million in 2017.
Fiscal 2019
In fiscal 2017, compared to $1.62019, our bank loan decreased by $5.2 million, we repaid $2.8 million of our long-term debt and other liabilities, and we redeemed share capital for $0.3 million.
Fiscal 2018
In fiscal 2018, our bank loan increased by $11.1 million, but we repaid $3.1 million of our long-term debt and other liabilities and paid $3.7 million for the purchase of the non-controlling interest in 2016 and $25.5 million in 2015.EXFO Solutions.
Fiscal 2017
In fiscal 2017, we repaid the long-term debt of $1.5 million assumed as part of the acquisition of Ontology.
Fiscal 2016Contractual obligations
We are committed under the terms of contractual obligations which have various expiration dates, primarily for the rental of premises and equipment, licensing of intellectual property and long-term debt. The following table summarizes our contractual obligations, on an undiscounted basis, as at August 31, 2019 in thousands of US dollars:
| | | Long-term debt | | | Operating leases | | | Licensing agreements | | | Total | |
| | | | | | | | | | | | | |
| No later than one year | | $ | 2,449 | | | $ | 2,895 | | | $ | 2,289 | | | $ | 7,633 | |
| Later than one year and no later than five years | | | 3,237 | | | | 6,323 | | | | 2,444 | | | | 12,004 | |
| Later than five years | | | 56 | | | | 23 | | | | – | | | | 79 | |
| | | $ | 5,742 | | | $ | 9,241 | | | $ | 4,733 | | | $ | 19,716 | |
Upon the adoption of IFRS 16, ‘’Leases’’, on September 1, 2019, obligations under operating leases will be accounted in the consolidated balance sheet as right-of-use assets and lease liabilities measured at the present value of lease payments on date of adoption. See the New IFRS pronouncements section further in this document for a complete description of the impacts of the adoption of IFRS 16.
In addition, on August 31, 2019, we had letters of guarantee amounting to $0.7 million for our own selling and purchasing requirements, which were reserved from our lines of credit; these letters of guarantee expire at various dates through fiscal 2016, we redeemed share capital under our share repurchase program for a cash consideration of $1.6 million.2022.
Fiscal 2015
In fiscal 2015, we redeemed share capital under our share repurchase programs (namely our substantial issuer bid) for a cash consideration48
FORWARD EXCHANGE CONTRACTS
We are exposed to a currency risk as a result of our export sales of products manufactured in Canada, China, France, and Finland, the majority of which are denominated in US dollars and euros. In addition, we are exposed to a currency risk as a result of our research and development activities in India (Indian rupees). These risks are partially hedged by forward exchange contracts. Forward exchange contracts, which are designated as cash flow hedging instruments, qualify for hedge accounting.
As at August 31, 2017,2019, we held forward exchange contracts to sell US dollars for Canadian dollars and Indian rupees at various forward rates, which are summarized as follows:
US dollars – Canadian dollars
| Expiry dates | | Contractual amounts | | | Weighted average contractual forward rates | | | Contractual amounts | | | Weighted average contractual forward rates | |
| | | | | | | | | | | | | |
| September 2017 to August 2018 | | $ | 18,300,000 | | | | 1.3407 | | |
| September 2018 to August 2019 | | | 10,900,000 | | | | 1.3426 | | |
| September 2019 to August 2020 | | | $ | 35,500,000 | | | 1.3013 | |
| September 2020 to August 2021 | | | 19,900,000 | | | 1.3107 | |
| September 2021 to July 2022 | | | | 6,000,000 | | | | 1.3216 | |
| Total | | $ | 29,200,000 | | | | 1.3414 | | | $ | 61,400,000 | | | | 1.3063 | |
US dollars – Indian rupees
| Expiry dates | | Contractual amounts | | | Weighted average contractual forward rates | |
| | | | | | | |
| September 2017 to August 2018 | | $ | 3,400,000 | | | | 69.49 | |
| September 2018 to February 2019 | | | 1,600,000 | | | | 67.26 | |
| Total | | $ | 5,000,000 | | | | 68.78 | |
| Expiry dates | | Contractual amount | | | Weighted average contractual forward rate | |
| | | | | | | |
| September 2019 to August 2020 | | $ | 3,500,000 | | | | 71.48 | |
The carrying amount of forward exchange contracts is equal to fair value, which is based on the amount at which they could be settled based on estimated current market rates. The fair value of forward exchange contracts amounted to net losses of $0.1$0.5 million and net gains of $2.3$1.0 million as at August 31, 20162018 and 20172019 respectively. The US dollar – Canadian dollar year-end exchange rate was CA$1.25361.3294 = US$1.00 as at August 31, 2017.2019.
SHARE CAPITAL
As at November 13, 2017,11, 2019, EXFO had 31,643,000 multiple voting shares outstanding, entitling to 10 votes each and 23,224,396 23,869,117 subordinate voting shares outstanding. The multiple voting shares and the subordinate voting shares are unlimited as to number and are without par value.
OFF-BALANCE SHEET ARRANGEMENTS
As at August 31, 2017,2019, our off-balance sheet arrangements consisted of letters of guarantee amounting to $0.6$0.7 million for our own selling and purchasing requirements, which were reserved from our lines of credit; these letters of guarantee expire at various dates through fiscal 2020.2022.
STRUCTURED ENTITIES
As at August 31, 2017,2019, we did not have interests in any structured entities.
5049
CRITICAL ACCOUNTING POLICIES AND ESTIMATES
The preparation of financial statements in accordance with IFRS requires us to make judgments, estimates and assumptions that affect the reported amounts of assets, liabilities, revenue and expenses and the disclosures of contingent assets and liabilities at the date of the financial statements. On an ongoing basis, we evaluate these estimates and assumptions, including those related to the fair value of assets and liabilities acquired in business combinations, the fair value of financial instruments, the allowance for doubtful accounts receivable, the amount of tax credits recoverable, the provision for excess and obsolete inventories, the estimated useful lives of capital assets, the valuation of long-lived assets, the impairment of goodwill, the recoverable amount of deferred income tax assets, the amount of certain accrued liabilities, provisions and deferred revenue as well as stock-based compensation costs. We base our estimates and assumptions on historical experience and on other factors that we believe to be reasonable under the circumstances.
Critical Judgments in Applying Accounting Policies
| (a) | Determination of functional currency |
We operate in multiple countries and generate revenue and incur expenses in several currencies, namely the Canadian dollar, the US dollar, the euro, the British pound, the Indian rupee and the CNY (Chinese currency). The determination of the functional currency of EXFO and its subsidiaries may require significant judgment. In determining the functional currency of EXFO and its subsidiaries, we take into account primary, secondary and tertiary indicators. When indicators are mixed, and the functional currency is not obvious, we use our judgment to determine the functional currency.
| (b) | Determination of cash generating units and allocation of goodwill |
For the purpose of impairment testing, goodwill must be allocated to each cash-generating unit (CGU) or group of CGUs that are expected to benefit from the synergies of the business combination. Initial allocation and possible reallocation of goodwill to a CGU or a group of CGUs requires judgment.
Critical Estimates and Assumptions
We state our inventories at the lower of cost, determined on an average cost basis, and net realizable value, and we provide reserves for excess and obsolete inventories. We determine our reserves for excess and obsolete inventories based on the quantities on hand at the reporting dates compared to foreseeable needs, taking into account changes in demand, technology or market. It is possible that additional inventory reserves may occur if future sales are less than our forecasts or if there is a significant shift in product mix compared to our forecasts, which could adversely affect our results.
We are subject to income tax laws and regulations in several jurisdictions. Under these laws and regulations, uncertainties exist with respect to the interpretation of complex tax regulations and the amount and timing of future taxable income. We maintain provisions for uncertain tax positions that we believe appropriately reflect our risk based on our interpretation of laws and regulations. In addition, we make reasonable estimates and assumptions to determine the amount of deferred tax assets that can be recognized in our consolidated financial statements, based upon the likely timing and level of anticipated future taxable income together with tax planning strategies. The ultimate realization of our deferred income tax assets is dependent upon the generation of sufficient future taxable income during the periods in which those assets are expected to be realized.
As at August 31, 2017, we had deferred income tax assets in the consolidated balance sheet in the amount of $3.2 million for operating losses in the United States. To recover these deferred income tax assets, we need to generate approximately $9.5 million in pre-tax earnings in the United States, and to do so over the estimated recovery period of three years, we must generate pre-tax earnings compound annual growth rate (CAGR) of 2%, which we believe is probable. Our losses in the United States can be carried forward over a 20-year period.
| (c) | Tax credits recoverable |
Tax credits are recorded provided thatif there is reasonable assurance that we have complied and will comply with all the conditions related to the tax credits and that the tax credits will be received. The ultimate recovery of our Canadian non-refundable tax credits is dependent upon the generation of sufficient future taxable income during the tax credits carry-forward periods. We have made reasonable estimates and assumptions to determine the amount of non-refundable tax credits that can be recognized in our consolidated financial statements, based upon the likely timing and level of anticipated future taxable income together with tax planning strategies.
As at August 31, 2017,2019, our Canadian non-refundable research and development tax credits recognized in the consolidated balance sheet amounted to $40.5$38.9 million. To recover these non-refundable research and development tax credits, we need to generate approximately $262$260 million (CA$328345 million) in pre-tax earnings at the Canadian federal level and approximately $12 million at the Canadian provincial level. To generate $262 million inthis level pre-tax earnings at the Canadian federal level over the estimated recovery period of 1516 years, we must generate a pre-tax earnings CAGRcompound annual growth rate of 21%, which we believe is probable. Our non-refundable research and development tax credits can be carried forward over a 20-year period.
| (d) | Impairment of non-financial assets |
Impairment exists when the carrying value of an asset or group of assets (cash generating unit (CGU)) exceeds its recoverable amount, which is the higher of its fair value less costs of disposal and its value in use. The fair value less costs of disposal calculation for our CGUs is based on a market approach that relies on input from implicit valuation multiples and recent transactions for comparable assets or businesses, within the same industry. We apply judgment in making adjustments for factors such as size, risk profile or profitability and also consider EXFO'sEXFO’s value derived from its market capitalization considering a control premium based on comparable situations. Depending on the market evidence available, we, from time to time, may further supplement this market approach with an income approach that considers discounted cash flows.flows to determine fair value less costs of disposal, as well as the nature and magnitude of research and development activities carried out by the CGU. The discounted cash flow model involves significant judgment with respect to estimating cash flows (based on market participant assumptions) and the appropriate discount rate.
In the fourth quarter of fiscal 2017,2019, we performed our annual goodwill impairment test for all CGUs.
For the purposes of the impairment test, goodwill has been allocated to the lowest level within the company at which it is monitored by management to make business decisions, which are the following CGUs:
| | EXFO CGU | | $ | 13,772,000 | |
| | Brix CGU | | | 13,878,000 | |
| | Ontology CGU | | | 7,427,000 | |
| | Total | | $ | 35,077,000 | |
| | EXFO CGU | | $ | 12,949,000 | |
| | EXFO Optics CGU | | | 3,376,000 | |
| | Service assurance, systems and services (SASS) CGU | | | 22,323,000 | |
| | Total | | $ | 38,648,000 | |
Prior to fiscal 2019, the Brix, Ontology and EXFO Solutions CGUs have been identified as three separate CGUs for goodwill impairment testing as they represented the lowest level within EXFO at which the goodwill was monitored for internal management purposes, and the smallest group of assets that generated cash inflows that were largely independent of the cash inflows from other CGUs. However, at the end of August 2018, we implemented a restructuring plan to fast-track the integration of newly acquired EXFO Solutions’ and Ontology’s technologies with those of our service assurance on a common monitoring and analytics platform to better position the company’s offering and reduce its costs. Consequently, starting September 1, 2018, following the announcement of this plan, all future operating and investing decisions related to these three CGUs have been aligned with the restructuring plan and related goodwill, previously allocated to each of these three CGUs, has been monitored for internal management purposes on a combined basis under the Service assurance, systems and services (SASS) CGU, which represented the smallest group of assets that would generate future cash inflows that would largely be independent of the cash inflows from the other CGUs.
In fiscal 2018, the goodwill impairment test has been performed closely to the date of the goodwill reallocation from the Brix, Ontology and EXFO Solutions’ GCUs to the SASS CGU and goodwill of each of the three CGUs was not impaired. Consequently, no goodwill impairment test was performed on the date of goodwill reallocation to the combined goodwill.
In performing the fiscal 2019 goodwill impairment review of our CGUs, we determined the recoverable amount of goodwill based on fair value less costs of disposal. In estimating the recoverable amount of ourits CGUs, we used a market approach, which is based on sales multiples within the range of 0.61.0 to 2.97.6 times sales, for comparable businesses with similar operations within the same industry over the past year. We applied judgment in making certain adjustments for factors such as size, risk profile or profitability of the comparable businesses, when compared to our CGUs.
Furthermore, as In addition, for the sales and operations of the EXFOSASS CGU, constitutes the significant majority of our sales and operations, we also comparedused a liquidation approach based on the carrying amountlevel of research and development expenses incurred over the EXFO CGU to our overall market capitalization, after adjustment for a control premium and the adjustment to deduct the recoverable amount of the Brix and Ontology CGUs. Based on this calculation, we calculated a recoverable amount which resulted in an implied sales multiple that was within the 0.6 to 2.9 times range, as used in our market approach described above.last two years.
As at August 31, 2017,2019, the recoverable amount for all CGUs exceeded their carrying value. The recoverable amount of EXFO CGU, Brix CGU and Ontology CGU would equal their carrying value using sales multiples of 0.7, 0.6 and 2.2 times sales respectively.
| (e) | Purchase price allocation in business combinations |
The fair value of the total consideration transferred in business combinations (purchase price) must be allocated based on the estimated fair value of acquired net assets at the date of acquisition. Allocating the purchase price requires management to make estimates and judgments to determine assets acquired and liabilities assumed, useful lives of certain long-lived assets and the respective fair value of assets acquired, and liabilities assumed; this may require the use of unobservable inputs, including management'smanagement’s expectations of future revenue growth, operating costs and profit margins as well as discount rates.
The assumptions used are based on acquired companies'companies’ historical growth, expectations of future revenue growth, expected synergies as well as industry and market trends.
The company usesWe use a discount rate to calculate the present value of estimated future cash flows, which represents itsour weighted average cost of capital (WACC).
| (f) | Identification of performance obligations |
Customer contracts may include promises to transfer multiple products and services to a customer. Determining whether the products and services are considered distinct performance obligations that should be accounted for separately or as one single performance obligation may require significant judgment. We assess whether each promised good or service is distinct for the purpose of identifying the various performance obligations in each contract. Promised goods and services are considered distinct provided that: (i) the customer can benefit from the good or service either on its own or together with other resources that are readily available to the customer; and (ii) our promise to transfer the good or service to the customer is separately identifiable or distinct from other promises in the contract.
NEW IFRS PRONOUNCEMENTS NOT YET ADOPTED
IFRS Pronouncements Adopted in Fiscal 2019
Financial Instrumentsinstruments
The final version of IFRS 9, "“Financial Instruments"”, was issued in July 2014 and will replacereplaces IAS 39, "“Financial Instruments: Recognition and Measurement"”. IFRS 9 uses a single approach to determine whether a financial asset is measured at amortized cost or fair value, replacing the multiple rules in IAS 39. The approach in IFRS 9 is based on how an entity manages its financial instruments in the context of its business model and the contractual cash flow characteristics of theits financial assets. Most of the requirements in IAS 39 for classification and measurement of financial liabilities were carried forward unchanged to IFRS 9. The new standard also requires a single impairment method to be used, replacing the multiple impairment methods in IAS 39. Requirements relating to hedge accounting, representing a new hedge accounting model, have also been added to IFRS 9. The new standard is effectiveiseffective for annual periods beginning on or after January 1, 2018 and must be applied retrospectively. We will adoptadopted this new standard on September 1, 2018. We are currently assessing2018 using the modified retrospective method. The following table summarizes the impact that the new standard will haveof its adoption on our consolidated balance sheet as at September 1, 2018, in thousands of US dollars:
| | | As reported as at August 31, 2018 | | | Adjustments | | | As adjusted as at September 1, 2018 | |
| | | | | | | | | | |
Accounts receivables – Trade | | $ | 47,273 | | | $ | (303 | ) | | $ | 46,970 | |
| Income taxes and tax credits recoverable | | $ | 4,790 | | | $ | 50 | | | $ | 4,840 | |
| Total assets | | $ | 284,544 | | | $ | (253 | ) | | $ | 284,291 | |
| | | | | | | | | | | | | |
| Retained earnings | | $ | 114,906 | | | $ | (253 | ) | | $ | 114,653 | |
| Shareholders’ equity | | $ | 177,921 | | | $ | (253 | ) | | $ | 177,668 | |
In addition, our financial statements.instruments are accounted for as follows under IFRS 9 as compared to our previous accounting policy with IAS 39:
| Financial assets | Classification – IAS 39 | Classification – IFRS 9 |
| | |
| Cash | Loans and receivables | Amortized cost |
| Short-term investments | Available for sale | Fair value through other comprehensive income |
| Accounts receivable | Loans and receivables | Amortized cost |
| Forward exchange contracts | Derivatives used for hedging | Fair value through other comprehensive income |
| Financial liabilities | Classification – IAS 39 | Classification – IFRS 9 |
| | |
| Bank loan | Other financial liabilities | Amortized cost |
| Accounts payable and accrued liabilities | Other financial liabilities | Amortized cost |
| Other liabilities | Other financial liabilities | Amortized cost |
| Long-term debt | Other financial liabilities | Amortized cost |
| Forward exchange contracts | Derivatives used for hedging | Fair value through other comprehensive income |
Hedge accounting
All existing hedge relationships that were designated as effective hedging relationships under IAS 39, continue to qualify for hedge accounting under IFRS 9. IFRS 9 does not change the general principles of how we account for effective hedges.
53
Revenue from Contractscontracts with Customerscustomers
IFRS 15, "“Revenue from Contracts with Customers"”, was issued in May 2014. The objective of this new standard is to provide a single, comprehensive revenue recognition model for all contracts with customers to improve comparability. This new standard contains principles that an entity willmust apply to determine the measurement of revenue and timing of when it is recognized. The underlying principle is that an entity will recognizerecognizes revenue to depict the transfer of goods or services to customers at an amount that the entity expects to be entitled to in exchange for those goods or services. This new standard is effective for annual periods beginning on or after January 1, 2018. Early adoption is permitted. We have performed an assessmentadopted this new standard on September 1, 2018 using the modified retrospective method. We applied this standard retrospectively only to identify significant areascontracts that are not completed at the date of impact, if any, between our current accounting treatment under IAS 18, "Revenue" and the new requirements of IFRS 15. Based on the assessments to date, we anticipateinitial application.
We concluded that the main areas of impact will relate to the allocation of the transaction price to the various performance obligations under the contracts, the timing of revenue recognition for sales arrangementarrangements that contain customer acceptance clauses, and the sale of licenses that provide customers with the "right“right to use"use” our intellectual property. We will adopt this new standard on September 1, 2018 using the modified retrospective method, with the cumulative effectThe adoption of the initial application of the standard recognized as an adjustment to the opening balance of retained earnings as at the date of initial application. We will apply this standard retrospectively only to contracts that are not completed at the date of initial application.
Leases
IFRS 16, "Leases", was issued in January 2016. IFRS 16 sets out the principles for the recognition, measurement, presentation and disclosure of leases for both parties to a contract, that is the customer (lessee) and the supplier (lessor). IFRS 16 will supersede IAS 17, "Leases", and related Interpretations. This new standard is effective for annual periods beginning on or after January 1, 2019, with earlier adoption permitted if IFRS 15, "Revenue from Contracts with Customers", is also applied. We have not yet assessed the impact that the new standard will havehad no material impact on our consolidated financial statements.
Foreign Currency Transactionscurrency transactions and Advance Considerationadvance consideration
IFRIC 22, "“Foreign Currency Transactions and Advance Consideration"”, was issued in December 2016. IFRIC 22 addresses how to determine the date of the transaction for the purpose of determining the exchange rate to use on initial recognition of the related asset, expense or income (or part of it) and on the derecognition of a non-monetarynon‑monetary asset or non-monetary liability arising from the payment or receipt of advance consideration in a foreign currency. IFRIC 22 is effective for annual periods beginning on or after January 1, 2018. Early adoption is permitted. We will adoptadopted this interpretation retrospectively on September 1, 2018 and are currently assessing theits adoption did not have a material impact that it will have on our consolidated financial statements.
New IFRS pronouncements not yet Adopted
Leases
IFRS 16, “Leases”, was issued in January 2016. IFRS 16 sets out the principles for the recognition, measurement, presentation and disclosure of leases for both parties to a contract, i.e., the customer (lessee) and the supplier (lessor). IFRS 16 will supersede IAS 17, “Leases”, and related interpretations. Under IFRS 16, lessees will recognize a right-of-use asset and a lease liability measured at the present value of lease payments for virtually all of their leases. Short-term leases with a term of 12 months or less are not required to be recognized. This new standard is effective for annual periods beginning on or after January 1, 2019.
We will adopt this new standard on September 1, 2019, using the modified retrospective method, which does not require adjustments to comparative periods. We will apply IFRS 16 at the adoption date and recognize right-of-use assets and lease liabilities in the period of adoption. The new standard provides a number of optional practical expedients in transition. Upon implementation of the new standard, we intend to elect the practical expedients to combine lease and non-lease components, and to not recognize right-of-use assets and lease liabilities for short-term leases. We are in the process of identifying appropriate changes to our accounting policies, information technology systems, business processes, and related internal controls to support recognition and disclosure requirements under IFRS 16. We expect that the adoption of IFRS 16 will increase our assets and liabilities by approximately $11 million, as we will recognize a right-of-use asset and a lease liability for all our long-term leases. However, we do not expect the adoption of this standard to have a significant impact on net earnings. The lease expense, previously recorded under cost of sales, selling and administrative expenses and net research and development expenses line items will be recorded as depreciation expenses for the right-of-use asset and as interest expenses on the lease liability in the consolidated statements of earnings. In addition, lease payments for the right-of-use asset, previously reported in cash flow from operating activities, will be reported in cash flow from financing activities in the consolidated statements of cash flows.
Uncertainty over Income Tax Treatmentsincome tax treatments
IFRIC 23, "“Uncertainty over Income Tax Treatments"”, was issued in June 2017. IFRIC 23 provides guidance on how to value uncertain income tax positions based on the probability of whether the relevant tax authorities will accept the company's tax treatments. A company is to assume that a taxation authority with the right to examine any amounts reported to it will examine those amounts and will have full knowledge of all relevant information when doing so. IFRIC 23 is effective for annual periods beginning on or after January 1, 2019. We will adopt this interpretation on September 1, 2019, and are currently assessing thewe do not expect its adoption to have a material impact that it will have on our consolidated financial statements.
CONTROLS
As described in Form 20-F/A filed on January 9, 2017, we concluded that EXFO's internal control over financial reporting was not effective as at August 31, 2016, as a result of the identification of a material weakness as we did not maintain sufficient controls over the trade accounts receivable ledger, which included a failure to maintain appropriate segregation of duties and a lack of supervisory review and monitoring of journal entries recorded to the trade accounts receivable ledger. See item 15(b) of Form 20-F/A filed on January 9, 2017 for more details on the impact of the material weakness on EXFO's financial reporting.
In the second quarter of fiscal 2017, we completed the implementation of our remediation plans to address the material weakness, which included additional segregation of duties. As at August 31, 2017, we concluded, through testing, that these controls were operating effectively and that the material weakness was considered remediated as of that date.
NON-IFRS MEASURES
We provide non-IFRS measures (constant currency data, gross(gross margin before depreciation and amortization and adjusted EBITDA) as supplemental information regarding our operational performance. Gross margin before depreciation and amortization represents sales, less cost of sales, excluding depreciation and amortization. Adjusted EBITDA represent net earnings (loss) attributable to the parent interest before interest and other expense, income taxes, depreciation and amortization, stock-based compensation costs, restructuring charges, acquisition-related deferred revenue fair value adjustment, change in fair value of cash contingent consideration, and foreign exchange gain or loss.
These non-IFRS measures eliminate the effect on our IFRS results of non-cash statement of earnings elements, restructuring charges as well as elements subject to significant volatility such as foreign exchange gain or loss. We use these measures for evaluating our historical and prospective financial performance, as well as our performance relative to our competitors. These non-IFRS measures are also used by financial analysts that evaluate and compare our performance against that of our competitors and industry players in our sector.
Finally, these measures help us to plan and forecast future periods as well as to make operational and strategic decisions. We believe that providing this information to our investors, in addition to the IFRS measures, allows them to see the company'scompany’s results through the eyes of management, and to better understand our historical and future financial performance. More importantly, it enables the comparison of our performance on a relatively similar basis against that of other public and private companies in our industry worldwide.
The presentation of this additional information is not prepared in accordance with IFRS. Therefore, the information may not necessarily be comparable to that of other companies and should be considered as a supplement to, not a substitute for, the corresponding measures calculated in accordance with IFRS.
Constant currency data represents data before foreign currency impact. Data for the current period is translated using foreign exchange rates
Gross margin before depreciation and amortization represents sales less cost of sales, excluding depreciation and amortization.
Adjusted EBITDA represents net earnings before interest, income taxes, depreciation and amortization, stock-based compensation costs, restructuring charges, change in fair value of cash contingent consideration, unusual charge, and foreign exchange gain or loss.
The following table summarizes the reconciliation of adjusted EBITDA to IFRS net earnings (loss) attributable to the parent interest, in thousands of US dollars:
| | | Years ended August 31, | |
| | | 2019 | | | 2018 | | | 2017 | |
| | | | | | | | | | |
| IFRS net earnings (loss) attributable to the parent interest for the year | | $ | (2,480 | ) | | $ | (11,902 | ) | | $ | 851 | |
| | | | | | | | | | | | | |
| Add (deduct): | | | | | | | | | | | | |
| | | | | | | | | | | | | |
| Depreciation of property, plant and equipment | | | 5,469 | | | | 5,444 | | | | 3,902 | |
| Amortization of intangible assets | | | 9,012 | | | | 10,327 | | | | 3,289 | |
| Interest and other expense | | | 718 | | | | 1,378 | | | | 303 | |
| Income taxes | | | 5,346 | | | | 5,678 | | | | 6,608 | |
| Stock-based compensation costs | | | 1,831 | | | | 1,748 | | | | 1,414 | |
| Restructuring charges | | | 3,305 | | | | 4,409 | | | | 5,079 | |
| Change in fair value of cash contingent consideration | | | – | | | | (670 | ) | | | (383 | ) |
| Acquisition-related deferred revenue fair value adjustment | | | 1,435 | | | | 2,095 | | | | – | |
| Foreign exchange (gain) loss | | | 949 | | | | (1,309 | ) | | | 978 | |
Adjusted EBITDA for the year (1) | | $ | 25,585 | | | $ | 17,198 | | | $ | 22,041 | |
| | | | | | | | | | | | | |
| Adjusted EBITDA in percentage of total sales | | | 8.9 | % | | | 6.4 | % | | | 9.1 | % |
Adjusted EBITDA
| (1) | Includes acquisition-related costs of $1.1 million and $2.2 million in fiscal 2017 and 2018 respectively (nil in fiscal 2019). |
| | | Years ended August 31, | |
| | | 2017 | | | 2016 | | | 2015 | |
| | | | | | | | | | |
| IFRS net earnings for the year | | $ | 851 | | | $ | 8,900 | | | $ | 4,857 | |
| | | | | | | | | | | | | |
| Add (deduct): | | | | | | | | | | | | |
| | | | | | | | | | | | | |
| Depreciation of property, plant and equipment | | | 3,902 | | | | 3,814 | | | | 4,835 | |
| Amortization of intangible assets | | | 3,289 | | | | 1,172 | | | | 2,883 | |
| Interest and other (income) expense | | | 303 | | | | (828 | ) | | | (155 | ) |
| Income taxes | | | 6,608 | | | | 7,764 | | | | 5,036 | |
| Stock-based compensation costs | | | 1,414 | | | | 1,378 | | | | 1,295 | |
| Restructuring charges | | | 5,079 | | | | – | | | | 1,637 | |
| Change in fair value of cash contingent consideration | | | (383 | ) | | | – | | | | – | |
| Unusual charge | | | – | | | | – | | | | 603 | |
| Foreign exchange (gain) loss | | | 978 | | | | (161 | ) | | | (7,212 | ) |
| Adjusted EBITDA for the year | | $ | 22,041 | | | $ | 22,039 | | | $ | 13,779 | |
| | | | | | | | | | | | | |
| Adjusted EBITDA in percentage of total sales | | | 9.1 | % | | | 9.5 | % | | | 6.2 | % |
5556
| Directors, Senior Management and Employees |
| Directors and Senior Management |
The following table sets forth information about our executive officers, senior managers and Directors as of November 1, 2017.2019.
Name and Municipality of Residence | | |
PIERRE-PAUL ALLARDABDELKRIM BENAMAR
Pleasanton, CaliforniaLe Raincy, France
| | Independent DirectorVice President, Service Assurance, Systems and Services
|
STEPHEN BULL
Quebec City, Quebec | | Vice-Vice President, Research and Development
|
STÉPHANE CHABOT
Quebec City, Quebec | | Vice President, Test and Measurement |
FRANÇOIS CÔTÉ
Montreal, Quebec | | Independent Director |
SUZANNE DANEAU
Beauharnois, Quebec | | Vice President, Human Resources |
ETIENNE GAGNON
Quebec, City, Quebec | | Vice President, Commercial Transformation |
LUC GAGNON
St-Augustin-de-Desmaures, Quebec | | Vice President, Manufacturing Operations and Global ServicesCustomer Service |
FLOYD ALLEN JOHNSTON
Richardson, Texas | | Vice President, Sales — Americas |
GERMAIN LAMONDE
St-Augustin-de-Desmaures, Quebec | | Executive Chairman of the Board |
ANGELA LOGOTHETIS
Bath, United Kingdom | | Independent Director |
CLAUDIO MAZZUCA
LaSalle, Quebec | | Vice President, SystemsStrategic Partnerships and AnalyticsAlliance |
PHILIPPE MORIN
Senneville, Quebec | | Chief Executive Officer |
PIERRE PLAMONDON
Quebec City, Quebec | | Chief Financial Officer and Vice President, Finance |
BENOIT RINGUETTE
Boischatel, Quebec | | General Counsel and Corporate Secretary |
MICHAEL SCHEPPKE
Singapore, Singapore | | Vice President, Sales — Asia-Pacific |
CLAUDE SÉGUIN
Westmount, Quebec | | Independent Director |
WILLEM JAN TE NIET
Harfsen, Netherlands | | Vice President, Sales — Europe Middle East and Africa |
RANDY E. TORNES
Frisco, Texas | | Independent Director |
|
DANA YEARIAN
Lake Forest, Illinois
| Vice President, Sales — Americas
|
The address of each of our executive officers, senior managers and Directors is c/o EXFO Inc., 400 Godin Avenue, Quebec, Quebec, Canada, G1M 2K2. The following is a brief biography of each of our executive officers, senior managers and Directors.
Pierre-Paul AllardAbdelkrim Benamar was appointed a memberEXFO’s Vice President of our Board of DirectorsService Assurance, Systems and Services Division in September 2008 and has been a board member of many other technology companies in Canada and inMay 2018, following the US.Astellia acquisition. In this role, Mr. Allard is Senior Vice-President, Worldwide Sales and President Global Field Operations at Check Point Software Technologies Inc. As Chief Revenue Officer, Mr. AllardBenamar is responsible for all go-to-marketthe overall product and services portfolio for monitoring and analytics. He brings over 25 years of experience in the telecom industry with proven leadership, business transformation and change management skills. Before joining EXFO, Mr. Benamar successively held the positions of COO (July 2015) and CEO (June 2016) of Astellia. He previously held several executive roles at Check Point. Prior to joining Check Point in July 2016, Mr. Allard led the go to marketAlcatel-Lucent including Vice President EMEA, CEO Alcatel-Lucent International, and sales teams at Avaya Inc. for 4 years. Prior to this, heVice President Global Head of Financial Analysis and Risk Assessment. He has also worked for nineteen (19) years at Cisco Systems, Inc.leading telecom companies such as Ericsson Group (2000–2007), where he most recently held the position of Vice-President, SalesMotorola (1996–2000) and Operations, Global Enterprise. Previously,Alcatel Mobile Phones, in areas such as R&D, Communications & Public Affairs, and Strategy and Sales. Mr. Allard was President of Cisco Systems Canada,Benamar holds an engineering degree from Telecom SudParis (formerly known as Institut National des Télécommunications) and before that he held various management roles at IBM Canada for twelve (12) years. In 2002, Mr. Allard co-chaired the Canadian e-Business Initiative, a private-public partnership aiming to measure the role e-Business playsPhD in increasing productivity levels, job creation and competitive position. In 1998, he was the laureate of the Arista-Sun life Award, for Top Young Entrepreneur in Large Enterprise, conferred by the Montreal Chamber of Commerce. In 2003, he received the Queen's Golden Jubilee Medal, which highlights significant contributions to Canada. In the same year, he was also awarded the prestigious Trudeau Medalelectrical engineering from the University of Ottawa, Telfer School of Management. Pierre-Paul Allard holds a bachelor's and masters' degree in business administration from the University of Ottawa, Canada.Université Paris-Sud.
Stephen Bull joined EXFO in 1995 as an Engineering Manager (project management) for the Advanced Optics group. From September 1997 to December 1999, he held the position of Assistant Director of Engineering responsible for all the software development. Mr. Bull was then appointed EXFO's Vice-PresidentVice President of Research and Development in December 1999. Today, he manages a department that includes more than 760 engineers and technicians spread outacross over three continents and nine locations. He is responsible for EXFO's product development initiatives and managesoversees the Project Management Office and related processes. Prior to joining EXFO, Mr. Bull was General Manager and Managing Director ofat Space Research Corporation, a military engineering company in Belgium, from June 1986 to March 1990, as well as ofthen at Taurus, an IT consulting firm, from 1990 to 1995. He is currently the President of the Institut de développement de produits (an institute dedicated to the advancement of product development practices) and a member of the Product Development Management Association (PDMA). He speaks regularly at conferences on product development. StephenMr. Bull holds a bachelor's degree in electrical engineering from Université Laval in Quebec City, and is a certifiedPDMA-certified New Product Development Professional from the PDMA.Professional.
Stéphane Chabot first joined EXFO as a Product Line Manager in 1998 and was promoted to Product Line Manager—Manager – Network Service Provider Market in 2001. As Vice-President,Vice President, Test and Measurement, Mr. Chabot is responsible for the Optical and Access &and Platform product lines. Prior to this appointment, he was Director of EXFO'sEXFO’s Optical Business Unit, a position he had held since 2006. In this role, Mr. Chabot led the main team in its responsibility for developing theEXFO's worldwide optical business and strategy, developing and maintaining the product family roadmap and vision, developing and controlling yearlyannual marketing, ensuring go-to-market plans, developing new markets, providing key market watch and competitive updates, analyzing product line performance and metrics, providing periodic benchmarking, and developing partnerships/OEMs/acquisitions within the product line family. Mr. Chabot was highly successful as Director of the Optical Business Unit, doubling its annual revenues to more than $120M$120 million and 38%increasing EXFO's global share of the portable optical solutions market share in optical portable solutions, withto 38 percent. His leadership has been instrumental in many key worldwide applications with global reach, such as Fiber-to-the-Home.fiber-to-the-home. Prior to his employment at EXFO, Mr. Chabot was a Telecommunications Officer attelecommunications officer in the Canadian Armed Forces from 1992 to 1998. StéphaneMr. Chabot holds a bachelor'sbachelor’s degree in Space Sciencespace science from Thethe Royal Military College of Canada, and a Diplomadiploma in Business Administrationbusiness administration from Université Laval University.in Quebec City.
François Côté was appointed a member of our Board of Directors in January 2015. Mr. Côté is a director as a full-time occupation, for corporations in the public, private and non-profit sectors, bringing his expertise in strategy, M&A, governance and passion for growth. Mr. Côté held a variety of executive positions at Bell Canada prior to becoming President and Chief Executive Officer of Emergis. Following the acquisition of Emergis by TELUS in January 2008, he was appointed President of TELUS Quebec, TELUS Health and TELUS Ventures. In this role, Mr. Côté was responsible for broadening TELUS Quebec'sQuebec’s presence and driving the company'scompany’s national health strategy through timely investments in information technology and innovative wireless solutions. Mr. Côté holds a Bachelor'sbachelor’s degree in Industrial Relations from Laval University. In 2007, he was named Entrepreneur of the Year by Ernst & Young, in the Corporate Restructuring category for the province of Quebec. Mr. Côté serves on the boards of Alithya,Purkinje, a Montreal health IT growth company as Chairman, Aspire Food Group, CPUHZB Pharma Canada also as Chairman and ofDiagnos Inc. a new publicly listed company on the Fondation Martin Matte.TSX Venture Exchange. Mr. Côté is also on the Consultative Committee of Medfar Solutions and serves on the Advisor Committee of Groupe Morneau. Mr. Côté
Suzanne Daneau joined EXFO in October 2019 as Vice President of Human Resources. In her role, she is responsible to lead the global human resources function, develop and implement the HR strategy in support of the business plan while ensuring the outreach, acquisition, development and retention of talent. With more than 25 years of experience in well-known and well-established organizations in their communities, Suzanne has led several strategic transformation projects and has been involved in numerous acquisitions. Through her business acumen, she supports her senior management colleagues and actively participates in building organizational capacity as well as reinforcing a culture of performance. She is recognized for her expertise in organizational development, talent management and the optimization and efficiency of the human resources function. Suzanne holds a bachelor's degree in industrial relations from the University of Montreal and is currently studying for an EMBA from McGill University. In addition to being a CRHA member, she is also actingactively involved in Women's Governance and the Parity Certification Committee. Passionate about the importance of children's health, she gives her time with the Governors of Hope Foundation, a foundation that supports research on childhood and helps families through major hardships.
Étienne Gagnon was appointed Vice President, Commercial Transformation in February 2019. Mr. Gagnon is a noted international business and B2B marketing professional. Over the past 25 years, he has held leadership roles in sales team management, marketing strategy implementation and innovation management in high-growth, international tech companies. From 2017 to 2019, he headed up global commercial efforts as advisorSenior Global Vice President of Sales and Marketing at Eddyfi Technologies, a fast-growing company in the field non-destructive testing inspection technology. From 2015 to different companies' CEO's.2017, he served as Vice President and then President of Optel Vision, positioning the company as the undisputed leader in the field of pharmaceutical product serialization. Under his leadership, the international sales team generated growth and market share in pharmaceutical packaging rapid inspection and serialization. From 2003 to 2015, he worked at EXFO. As part of his responsibilities as Vice President of Test and Measurement and Corporate Marketing, he was responsible for EXFO's wireline and wireless test and measurement business units (Optical, Transport and Datacom, Access, Simulators and Analyzers) and Corporate Marketing for the company. Mr. Gagnon previously held sales and innovation roles at TeraXion, EXFO and Bombardier Aerospace. He holds a bachelor's degree in mechanical engineering from Polytechnique Montréal and a master's degree in European affairs from Télécom Bretagne.
Luc Gagnon was appointed Vice-President,Vice President, Manufacturing Operations in May 2003 and, in May 2007, he also took on the vice-presidencyrole of theVice President of Global Services department.Services. He is responsible for ensuringoversees the smooth operation of all manufacturing activities which include production,including purchasing, product engineering, quality assurance, planning, manufacturing engineering, product configuration, transportation and customs, as well asand material resources. In addition, heMr. Gagnon must ensure that there is an ongoing and efficient relationrelationship between the manufacturing process and the end customer. Prior to his nomination in 2003, Mr. GagnonHe also held the position of Production Director since 2000.from 2000 to 2003. Before joining EXFO, he hadMr. Gagnon held similar roles in several other high-technology companies. He worked for Mendes from 1999 to 2000, for C-MAC from 1997 to 1999, for STERIS from 1993 to 1997 and for MITELMitel from 1985 to 1993. LucMr. Gagnon holds a bachelor's degree in electrical engineering and master's degree in engineering, both from the Université de Sherbrooke, in Canada.Sherbrooke.
Floyd Allen Johnston was appointed as Vice President, Sales – Americas in September 2019. Mr. Johnston has 27 years’ experience in the telecommunications industry and extensive expertise in both wireline and wireless technology. Before joining EXFO, he served as vice president of the North America and Americas divisions for Mavenir. He previously held leadership roles at Oracle, Acme Packet and Tekelec. Mr. Johnston has an MBA in telecommunications from University of Dallas, and a master’s degree in mediation and conflict resolution from Southern Methodist University (SMU) in Dallas, Texas.
Germain Lamonde, a founder of EXFO, has been President and Chiefis Executive Officer of EXFO since its inception in 1985. He has also been Chairman of the Board since EXFO went public in 2000. Responsibleand served as the company’s Chief Executive Officer (CEO) for the overall management and strategic direction of EXFO,over 30 years. During his tenure as CEO, Mr. Lamonde has growngrew the company from the ground up, turning it into a global leader in the communications test, service assurancemonitoring and analytics markets.market and the world’s #1 fiber/highspeed testing company, with customers in over one hundred countries. Today as Executive Chairman, Mr. Lamonde leads EXFO’s acquisitions strategy and is actively involved in defining the company’s growth and investment strategies, strategic direction and corporate governance policies. Mr. Lamonde has served on the board of directors of several public and private organizations, such as the Canadian Institutefulfilled numerous speaking engagements, and received several industry awards for Photonic Innovations, the POLE QCA Economic Development Corporation, the National Optics Institute of Canada (INO)his leadership, innovation and Université Laval in Quebec City, to name a few.global development. Mr. Lamonde has also been involved in numerous charity organizations such as United Waypresently serves on the Board of QG100 and served as honorary President for the Leucan Shaved Head initiative forwas recently appointed Chairman of the Quebec City Region. GermainDigital Transformation Council and Chairman of ENCQOR the Canada–Quebec-Ontario partnership focused on research and innovation in the field of 5G/IoT innovation. Mr. Lamonde holds a bachelor'sbachelor’s degree in engineering physics from the UniversityUniversité de Montréal’s school of Montreal's School of Engineering (École Polytechnique),engineering (Polytechnique Montréal) and a master'smaster’s degree in optics from Université Laval, and in Québec City. He is also a graduate of the Ivey Executive Management Program offered byat Western University in London, Ontario, and a Fellow of the UniversityCanadian Academy of Western Ontario.Engineering.
Angela Logothetis has more than twenty-five (25) years of international experience in the telecommunications industry. She has been strategically engaged in the industry'sindustry’s major network transformations. Ms. Logothetis has an outstanding software pedigree having worked for market-leading software companies including Amdocs, Cramer, PricewaterhouseCoopers and Accenture as well as start-up software companies Clarity and Time Quantum Technology. She has held senior leadership positions in ANZ, APAC and EMEA and has held global responsibility for the past ten (10) years. Ms. Logothetis is the Head of Network Strategy, Technology and ServicesCTO for Amdocs.Amdocs Open Network. Amdocs is the market leader in customer experience software solutions and services for the world'sworld’s largest communications, entertainment and media service providers. Ms. Logothetis has held several senior leadership positions at Amdocs including Head of OSS Product and Technology, Vice-PresidentVice President of OSS Product Management and Executive Site Lead for Amdocs Bath. She has chaired high-caliber software forums in Amdocs including the Divisional Leadership Team, the Technical Advisory Council, and has served as an executive on the Product Business Management Team and the Product Leadership Forum. Ms. Logothetis holds a Bachelor of Science degree, with first class honors, in Business Information Technology from the University of New South Wales, Australia. She completed dual majors in accountancy and information technology.
Claudio Mazzuca was appointed Vice-President, Systems and ServicesVice President, Strategic Partners in March 2012.May 2018. Prior to this appointment, he held the role of Directorhad served as Vice President, Systems and Analytics since 2012 and director of EXFO's Transport and Datacom business unitBusiness Unit since 2006. In this role, he was responsible for the development and execution of business and product strategy for this businessthe unit, which now is a leading player in the Ethernet and next-generation packet transport test market segments. Mr. Mazzuca began his career as a systems engineer for Nortel Networks, where he worked on the launch of the highly successful 10G High-Speed Transport and DWDM product line, and later on Nortel's Preside Network Management solution. He then moved to technology startup Hyperchip Systems as Senior Product Manager, focusing on the development of large-scale metro and core IP routers and switches, and associated OEM components. In 2004, heMr. Mazzuca joined EXFO's Transport and Datacom business unitBusiness Unit as Product Line Manager for the next-generation SONET/SDH products, and in 2005, was promoted to Group Manager for the entire Transport and Datacom product line. ClaudioMr. Mazzuca holds a bachelor's degree in electrical engineering from Montreal's Concordia University and a master's degree in business from McGill University, also in Montreal.
Philippe Morinwas appointed Chief Executive Officer (CEO) of EXFO in April 2017.2017 and is responsible for the company’s strategy and financial directions, goals and results. He has more than 25thirty (30) years of experience in the telecommunications industry and became EXFO'sjoined EXFO in November 2015 as Chief Operating Officer (COO) in November 2015, leading the company'scompany’s global sales leadership, market development, marketing and product strategy. Before joining EXFO, Mr. Morin was Senior Vice-PresidentVice President of Worldwide Sales and Field Operations at Ciena. He previously held senior leadership roles at Nortel Networks, including President of Metro Ethernet Networks and Vice-PresidentVice President and General Manager of Optical Networks. Philippe Morin holds a bachelor'sbachelor’s degree in electrical engineering from Université Laval in Quebec City, Canada, and a master'smaster’s degree in business (MBA) from McGill University in Montréal,Montreal, Canada.
Pierre Plamondon was appointed Vice-President, Finance and Chief Financial Officer (CFO)and Vice President, Finance of EXFO in January 1996. He is responsible for the accounting, legal and IT services, as well as financial reporting legal services,and investor relations and information technology services.relations. Prior to joining EXFO, Mr. Plamondon served as Senior Manager for Price Waterhouse, now PricewaterhouseCoopers LLP, from September 1981 to December 1995, in Canada and France. PierreMr. Plamondon is a member of the Order of Chartered Professional Accountants of Quebec. Over the years, he has served on the boards of several organizations, including Urbanimmersive, a public company listed on the TSX Venture Exchange, as well as non-profits, such as the Fondation de l’Université Laval and SOVAR Inc. (Société de valorisation des applications de la recherche de l'Université Laval). Mr. Plamondon holds a bachelor's degree in business administration and a license in accounting, both from Université Laval in Quebec City. Mr. Plamondon is a member of the Quebec Chartered Professional Accountants Order. He is currently a director of Urbanimmersive Inc., a public company listed on the TSX Venture Exchange. Over the years, he has been a member of the Board of Directors of several non-profit organizations among which the Fondation de l'Université Laval and SOVAR Inc. (Société de valorisation des applications de la recherche de l'Université Laval).
Benoit Ringuette has been our in-house LegalGeneral Counsel and Corporate Secretary since April 2004. Prior to joining EXFO, Mr. Ringuette practiced mainly in commercial, corporate and securities law from 1998 to 2003 as an associate in the law firms of O'Brien,O’Brien, Flynn Rivard in Quebec City and Desjardins Ducharme Stein Monast in Quebec City. Mr. Ringuette has been a member of the Quebec Bar since 1998. Mr. Ringuette holds a bachelor'sbachelor’s degree in Civil Law and a master'smaster’s degree in Business Administration (MBA) from Laval University in Quebec City, Canada.
Michael Scheppke was appointed EXFO's Vice-President,EXFO’s Vice President, Sales – APAC in October 2016. He is responsible for managing telecom sales, both direct and indirect, and the execution ofexecuting sales strategies across APAC regions. Michaelthe Asia-Pacific (APAC) region. Mr. Scheppke developed his expertise working in ourthe industry in both the USA and Asia. Following several years at HP and Agilent, he spent a significant part of his career at Ixia, where he held various senior roles. He has developed and executed the go-to-market strategy for their network monitoring business in APAC by successfully leading diverse sales teams and expanding sales coverage with channel partners. MichaelMr. Scheppke holds a bachelor of science degree in electrical engineering from the University of Florida.
Claude Séguin was appointed a member of EXFO'sEXFO’s Board of Directors in February 2013. He brings to EXFO nearly forty (40) years of corporate, financial, executive and provincial government experience gained through senior management positions in major corporations and government departments. Mr. Séguin is currentlywas Special advisor to the Founder and Executive Chairman at CGI Group Inc., a global leader in information technology and business process services.services, until March 2018. He was, until OctoberNovember 2016, Senior Vice-President,Vice President, Corporate Development and Strategic Investments. In this position, he was responsible for all merger and acquisition activities. Prior to joining CGI in 2003, he served as President of CDP Capital—Private Equity, and prior to this position, he served as Teleglobe Inc.'s’s Executive Vice-President,Vice President, Finance and Chief Financial Officer, a position that he held from 1992 to 2000. Mr. Séguin also has extensive senior-level government experience, having served as Deputy Finance Minister of the Province of Quebec from 1987 to 1992, in addition to Assistant Deputy Finance Minister in prior years. Prior to that, he has been Director of Planning and Assistant Director of Social Programsheld senior positions at the Province of Quebec Treasury Board. Mr. Séguin is a member of the boardsboard of HEC-Montréal andHEC‑Montréal. He also chairs the Boards of Centraide of Greater Montreal Foundation as well as being Chairman of the Board of Finance – Montreal, an organization regrouping financial institutions in the Province of Quebec. He also serves on the board of directorsand of Fonds de solidarité FTQ, a trade union sponsored investments fund.$15B Labour Sponsored Investment Fund in Québec. Claude Séguin graduated from HEC-Montréal and earned a master'smaster’s and a Ph.D. in public administration from Syracuse University in New York State. He also followed the Advanced Management Program at Harvard Business School.
Willem Jan te Niet was appointed Vice-President,Vice President, Sales – EMEA in August 2016. He is responsible for managing telecom sales, both direct and indirect, and the execution ofexecuting sales strategies across Europe, the Middle East and Africa. Prior to joining EXFO, WimMr. te Niet was on the senior management teams for global leaders such as Citrix Systems, Equinix, Ericsson-LG and Nortel. He brings considerable expertise in the areas of cloud, networking and big data mobile analytics. WimMr. te Niet also has more than 20 years of experience in managing sales teams and executingimplementing successful business development strategies with wireline and mobile operators. WimMr. te Niet holds a master of sciencemaster's degree in business administration from the University of Groningen.
Randy E. Tornes was appointed a member of EXFO'sEXFO’s Board of Directors in February 2013. He brings to EXFO over thirty (30) years of telecommunications experience gained through senior management positions at leading network equipment manufacturers. Mr. Tornes is Vice-President,Vice President, Client Partner for AT&T at Aricent, An Altran Company. Prior to joining Aricent, Mr. Tornes was Vice President Strategic Alliances at Juniper Networks, a worldwide leader in high-performance networking and telecommunications equipment. Prior to his current role at Juniper, he wasMr. Tornes has also worked as the Operating Area Leader for AT&T and responsible for all sales, service and support of Juniper products and services. Prior to joining Juniper Networks in May 2012, he spent two (2) years at Ericsson, where he was Vice-PresidentVice President Sales (AT&T account). Previous to that position, he worked for Nortel for twenty-six (26) years, holding various sales management positions, including Vice-PresidentVice President Sales, GSM Americas. Mr. Tornes also served as member of the Board of Governors at 3G Americas LLC. Randy E. Tornes holds a Bachelor of Science degree in business—organizational development and production and operations management, from the University of Colorado in Colorado Springs.
Dana Yearian was appointed EXFO's Vice-President, Sales – Americas in March 2007. Prior to this appointment, Mr. Yearian held the position of Vice-President, Telecom Sales, North America. He is responsible for managing telecom sales, both direct and indirect, and the execution of sales strategies across North, Central and South America regions. From 2005 to 2006, Mr. Yearian held senior executive sales positions at Spirent Communications Service Assurance division. In 2003, he founded The Katrixx Group, which provided consulting and contracting services to high-technologies companies. Before founding this company, Mr. Yearian worked as Vice-President of Sales at Acterna Corp. (from 1991 to 2003), where he led both North American and International sales and support operations. Prior to working for Acterna, Mr. Yearian held various executive positions, namely at Toshiba America, Silicon Sensors (Advanced Photonix, Inc.) and Impell Corporation (ABB Ltd.). Dana Yearian holds a bachelor's degree in electrical engineering from the Illinois Institute of Technology in Chicago, and has completed MBA course work at DePaul University, also in Chicago, Illinois, USA.
Term of Executive Officers
Executive officers are appointed annually by the Board of Directors and serve until their successors are appointed and qualified or until earlier resignation or removal. There are no family relations among directors and officers and no arrangements with third parties (customers, suppliers) pursuant to which they were appointed as officers or directors.
COMPENSATION OF DIRECTORS AND EXECUTIVE OFFICERS
Compensation Discussion and Analysis
This Compensation Discussion and Analysis focuses primarily on: (i) significant elements of the Corporation'sCorporation’s executive compensation program; (ii) principles on which the Corporation makes compensation decisions and determines the amount of each element of executive and director compensation; and (iii) an analysis of the material compensation decisions made by the Human Resources Committee for the financial year ended August 31, 2017.2019.
The following is a discussion of the compensation arrangements with the Corporation'sCorporation’s Executive Chairman, Chief Executive Officer ("CEO"(“CEO”), Chief Financial Officer ("CFO"(“CFO”) and each of the two most highly compensated executive officers of the Corporation and its subsidiaries whose total compensation was, individually, more than CA$150,000 (collectively with the Executive Chairman, CEO and CFO, the "Named“Named Executive Officers"Officers” or "NEOs"“NEOs”). The NEOs for the financial year ended August 31, 20172019 were Mr. Germain Lamonde (Executive Chairman), Mr. Philippe Morin (CEO), Mr. Pierre Plamondon (CFO and Vice-President,Vice President, Finance), Mr. Willem Jan te Niet (Vice-President,(Vice President, Sales — Europe Middle East and Africa)EMEA) and Mr. Dana Yearian (Vice-President,(Vice President, Sales — Americas). Mr. Lamonde stepped down as CEO as of April 1, 2017 and was nominated Executive Chairman of the Corporation. Mr. Morin was promoted from Chief Operating Officer of the Corporation to CEO of the Corporation as of April 1, 2017.
Members of the Human Resources Committee
During the financial year ended August 31, 2017,2019, the Human Resources Committee was composed of:
· | Mr. François Côté (Chairman) |
Mr. François Côté (Chairman)
· | Mr. Darryl Edwards (until January 10, 2017) |
Mr. Claude Séguin
· | Ms. Angela Logothetis (since January 11, 2017) |
Mr. Randy E. Tornes
None of these members were officers or employees, or former officers or employees of the Corporation or its subsidiaries. All of the members of the Human Resources Committee are considered "independent"“independent”, as defined in applicable securities legislation and regulations. They each have experience in executive compensation either as a chief executive officer or a senior executive officer of a publicly-tradedpublicly traded corporation. Mr. Pierre-Paul Allard has held management and executive positions for the last thirty (30) years. Mr. François Côté held a variety of executive positions, including president and chief executive officer, for approximately twenty (20) years. Mr. Côté also holds a Bachelor'sBachelor’s degree in Industrial Relations. Ms. Angela Logothetis holds a Bachelor of Science degree, with first class honors, in Business Information Technology. She completed dual majors in accountancy and information technology. She has more than twenty-five (25) years of international experience in the telecommunications industry. Mr. Claude Séguin has held various senior management and executive positions in major corporations in the last forty (40) years. Mr. Randy E. Tornes has approximately thirty (30) years of management experience through senior sales management positions. Over the course of their careers, all members have been exposed at various degrees to the complexity of balancing efficient executive compensation strategies with the evolution of business requirements, having to manage directly or indirectly impacts and consequences of executive compensation decisions. The Board of Directors believes that the Human Resources Committee collectively has the knowledge, experience and background required to fulfill its mandate.
Mandate of the Human Resources Committee
The Human Resources Committee of the Board of Directors is responsible for establishing the annual compensation and assessing the risks related thereto and overseeing the assessment of the performance of all the Corporation'sCorporation’s executive officers, including the Executive Chairman and CEO. The Human Resources Committee also reviews and submits to the Board of Directors recommendations for the salary structure and the short-term and long-term incentive compensation programs for all employees of the Corporation. The Human Resources Committee also evaluates and makes recommendations to the Board of Directors regarding the compensation of directors, including the number of Deferred Share Units (“DSUs”) credited to the non-employee directors pursuant to the Deferred Share Unit Plan. The Human Resources Committee'sCommittee’s goal is to develop and monitor executive compensation programs that are consistent with strategic business objectives and shareholders'shareholders’ interests. Though the Human Resources Committee is responsible for the review of employees'employees’ performance and approval of the identity of the employees that will receive Performance Share Units (“PSUs”), Restricted Share Units (“RSUs”) or options to purchase shares of the Corporation, in accordance with policies established by the Board of Directors and the terms of the Long-Term Incentive Plan, these functions may be shared between the Board of Directors and the Human Resources Committee. During the period from September 1, 20162018 to August 31, 2017,2019, these functions have been shared by the Board of Directors and the Human Resources Committee but have mainly been performed by the Human Resources Committee.
The Human Resources Committee has reviewed and discussed with the Executive Chairman, the CEO and the Vice-President,Vice President, Human CapitalResources of the Corporation, the compensation disclosure in this document, and has recommended to the Board of Directors that the disclosure be included in this Annual Report.
From September 1, 20162018 to November 1, 2017,2019, the Human Resources Committee held five (5) meetings and at all of those meetings executive compensation was discussed. The Human Resources Committee meetings were attended by all the members of the Human Resources Committee, except Mr. Allard and Mr. Edwards, each of whom wereSeguin who was absent at one (1) meeting. The following table outlines the main activities of the Human Resources Committee during the period from September 1, 20162018 to November 1, 2017:2019:
Meeting | Main Activities of the Human Resources Committee |
October 12, 201611, 2018 | ● | Review of the Business Performance Measures results for the financial year ended August 31, 2016;2018; |
● | Review of the Business Performance Measures for the financial year started September 1, 2016;2018; |
● | Review of the Short-Term Incentive Plan results for the financial year ended August 31, 2016;2018; |
● | Update on the Short-Term Incentive Plan for the financial year started September 1, 2016;2018; |
● | Review of the proposed salary scales and salary increases for the year started September 1, 2016;2018; |
● | Review of the compensation plans of executive officers for the financial year started September 1, 2016 being the Base Salary, the Short-Term Incentive Plan and the stock-based compensation delivered through the Long-Term Incentive Plan; |
●
| Review and approval of the stock-based compensation plan for the sales force delivered through the Long-Term Incentive Plan for the financial year started September 1, 2016;
|
●
| Review and approval of the quantum for the stock-based compensation plan for the performing employees delivered through the Long-Term Incentive Plan for the financial year started September 1, 2016;
|
●
| Review and approval of the executive compensation section of the Management proxy circular for the financial year ended
August 31, 2016;
|
●
| Review and approval of the CEO objectives and compensation plan;
|
●
| Selection of New Board Members;
|
●
| Annual Sales Force Achievement and Key staffing update;
|
●
| Review and approval of the retirement policy of the Corporation;
|
●
| Annual Review of the Human Resources Committee Charter;
|
●
| Review of the Risk Assessment of Executive Compensation disclosure obligations.
|
Meeting
| Main Activities of the Human Resources Committee
|
January 10, 2017
| ●
| Executive Chairman role, transition and compensation;
|
●
| Review and approval of the Short-Term Incentive Plan of some executive officers for the financial year started September 1, 2016, including the CEO objectives;
|
●
| Employee Survey Update;
|
●
| Review of the quarterly results under the Short-Term Incentive Plan for the financial year started September 1, 2016 and being part of the Short-Term Incentive Plan;
|
●
| Review and approval of the stock-based compensation for performing employees delivered through the Long-Term Incentive Plan for the financial year started September 1, 2016;
|
●
| Global Compensation and Board Members Compensation Review;
|
●
| Leadership program and Talent Management.
|
March 29, 2017
| ●
| Review of the quarterly results under the Short-Term Incentive Plan for the financial year started September 1, 2016 and being part of the Short-Term Incentive Plan;
|
●
| Succession Planning;
|
●
| Executive Chairman role, transition and compensation;
|
●
| Review of the Key Human Resources Initiatives;
|
●
| Nomination and Compensation of new CEO;
|
●
| Update on the key initiatives following Employee survey;
|
●
| Board Members Compensation and stock ownership;
|
●
| Review of the Talent Management and Leadership program.
|
June 29, 2017
| ●
| Review of the quarterly results under the Short-Term Incentive Plan for the financial year started September 1, 2016 and being part of the Short-Term Incentive Plan;
|
●
●
| Board Members stock ownership;
Update on Restructuring;
|
●
| Update on the Global Compensation Review;
|
●
| Update on the Management Structure Review;
|
●
●
| Update on the Talent Management Review;
Update on the key initiatives following Employee survey;
|
●
| Review of the Key Human Resources Initiatives.
|
October 11, 2017
| ●
| Review of the Business Performance Measures results for the financial year ended August 31, 2017;
|
●
| Review of the Business Performance Measures for the financial year started September 1, 2017;
|
●
| Review of the Short-Term Incentive Plan results for the financial year ended August 31, 2017;
|
●
| Update on the Short-Term Incentive Plan for the financial year started September 1, 2017;
|
●
| Review of the proposed salary scales and salary increases for the year started September 1, 2017;
|
●
| Review of the compensation plans of executive officers for the financial year started September 1, 20172018 being the Base Salary, the Short-Term Incentive Plan and the stock-based compensation delivered through the Long-Term Incentive Plan;
|
● | Review and approval of the executive compensation section of the Management proxy circular for the financial year ended August 31, 2017;2018; |
● | Review and approval of the CEO and Executive Chairman objectives and compensation plan; |
● | Human Resources Key staffing update;Accomplishments; |
● | Annual Sales Force Achievement; |
● | Annual Review of the Human Resources Committee Charter; |
● | Review and approval of the stock-based compensation for executive officers delivered through the Long-Term Incentive Plan for the financial year started September 1, 2018. |
January 9, 2019 | ● | Review of the Short-Term Incentive Plan results of some executive officers for the financial year ended August 31, 2018; |
● | Review and approval of the Short-Term Incentive Plan of some executive officers for the financial year started September 1, 2018, including the CEO and Executive Chairman; |
● | Review of the quarterly results under the Short-Term Incentive Plan for the financial year started September 1, 2018 and being part of the Short-Term Incentive Plan; |
● | Review and approval of the stock-based compensation for performing employees delivered through the Long-Term Incentive Plan for the financial year started September 1, 2018; |
● | Leadership program and Talent Management; |
● | Review of the Risk Assessment of Executive Compensation. |
April 10, 2019 | ● | Review of the quarterly results under the Short-Term Incentive Plan for the financial year started September 1, 2018 and being part of the Short-Term Incentive Plan; |
● | Succession Planning; |
● | Review of the Key Human Resources Initiatives; |
● | Compensation disclosure obligations.Review; |
● | Review of the stock-based compensation for performing and critical employees; |
● | Review of the Talent Management and Leadership program. |
July 10, 2019 | ● | Review of the quarterly results under the Short-Term Incentive Plan for the financial year started September 1, 2018 and being part of the Short-Term Incentive Plan; |
● | Global Employment Status; |
● | Review and approval of the compensation package of recently hired executive officer; |
● | Review of the Talent Management and Leadership program; |
● | Review of the Key Human Resources Initiatives. |
Meeting | Main Activities of the Human Resources Committee |
October 9, 2019 | ● | Review of the Business Performance Measures results for the financial year ended August 31, 2019; |
● | Review of the Business Performance Measures for the financial year started September 1, 2019; |
● | Review of the Short-Term Incentive Plan results for the financial year ended August 31, 2019; |
● | Review of the Short-Term Incentive Plan for the financial year started September 1, 2019; |
● | Review of the proposed salary scales and salary increases for the year started September 1, 2019; |
● | Review of the compensation plans of executive officers for the financial year started September 1, 2019 being the Base Salary, the Short-Term Incentive Plan and the stock-based compensation delivered through the Long-Term Incentive Plan; |
● | Review and approval of the executive compensation section of the Management proxy circular for the financial year ended August 31, 2019; |
● | Review and approval of the CEO and Executive Chairman objectives and compensation plan; |
● | Review and approval of the stock-based compensation for senior management and officers delivered through the Long-Term Incentive Plan for the financial year started September 1, 2019; |
● | Annual Sales Force Achievement; |
● | Annual Review of the Human Resources Committee Charter; |
● | Review of the Directors’ Compensation; |
● | Review of the Key Human Resources Initiatives; |
● | Review of the Risk Assessment of Executive Compensation. |
Compensation Plan Control -– Compensation Consultant and Internal Review
As a general practice, the Corporation'sCorporation’s relative position in terms of compensation levels is determined periodically through studies performed by independent consulting firms using a selected reference market of comparable companies. The benchmarking activities are further detailed below under the heading – "Benchmarking"“Benchmarking”.
For the financial year that ended on August 31, 2017,2019, the Human Resources Committee retained the services of Willis Towers Watson to have access to benefits and compensation data and surveys relating to executive compensation.
For the financial year ended on August 31, 2018, the Human Resources Committee retained the services of Willis Towers Watson to evaluate the market competitivenessestablishment of the compensation package that is currently offered to the external members of its Board of Directors. The compensation elements covered by the analysis were: annual board retainer, committee chaira performance share plan and member retainers, board and committee meeting fees and stock-based compensation. Willis Towers Watson's work included assistanceLee Hecht Harrison Knightsbridge in benchmarking, assessing potential gaps between the market and the external Board members' compensation levels and proposing potential changes to ensure alignmentconnection with the market and with the Corporation's compensation policy. With a few exceptions, Willis Towers Watson used the same compensation group to benchmark the external members of the Board of Directors as it used to benchmark executive compensation (as further described below).
For the financial year that ended on August 31, 2017, the Human Resources Committee also retained theoutplacement services of Willis Towers Watson to evaluate the market competitiveness of the compensation package that is currently offered to its Chief Executive Officer and its Executive Chairman. The compensation elements covered by the analysis were: base salary; target bonus; long-term incentive; perquisites and pension (hereinafter in this Annual Report referred to as the "Target Total Compensation"). Willis Towers Watson's work included assistance in benchmarking, assessing potential gaps between the market and the executives' compensation levels and proposing potential changes to ensure alignment with the market and with the Corporation's compensation policy.
In 2016, the Corporation engaged Willis Towers Watson to performfor an executive total compensation review (hereinafter in this Annual Report referred to as the "Target Compensation Positioning"). The analysis covered the Target Total Compensation. Willis Towers Watson's work included assistance in benchmarking, assessing potential gaps between the market and the executives' compensation levels and proposing potential changes to ensure alignment with the market and with the Corporation's compensation policy. In 2016, eleven (11) executive positions were covered by the executive total compensation review, eight (8) located in Canada and three (3) outside of Canada. Willis Towers Watson also provided recommendations regarding the short-term incentive and long-term incentive compensation design of the Corporation and assessed the competitiveness of the compensation offered to the independent Directors of the Board and proposed changes to ensure alignment with market practices.executive.
In addition, internal pay equity studies are a key factor used by the Corporation to complete the compensation review process and indicate where necessary adjustments may be required. During the financial year ended August 31, 2017,2019, this practice continued, and certain compensation adjustments were made as have been made in previous years.
The Human Resources Committee has the authority to retain any independent consultants of its choice to advise its members on total executive compensation policy matters, and to determine the fees and the terms and conditions of the engagement of these consultants. The Human Resources Committee is ultimately responsible for its own decisions, which may take into consideration more than the information and recommendations provided by its compensation consultants or Management.
For the financial years that ended on August 31, 20162018 and 2017,2019, the Corporation also retained the services of, Willis Towers Watson, Mercer,Aon, D‑Teck Solutions, Eckler, Aon, Great Place to Work, Lee Hecht Harrison Knightsbridge, OPEX Conseils, SMA Transformation, SPB Organizational Psychology, RecrutXL Inc.,Optonique and Xactly CorporationWillis Towers Watson for services which were not related to executive compensation. The services provided by Aon related to the access to compensation data and surveys for employees in various countries. The services provided by D-Teck Solutions related to psychometric testing. The services provided by Eckler related to pension plan analysis, retirement policy, governance and communication to employees. The Corporation retained the services of Great Place to Work for culture audit services. The services provided by Optonique related to the access to compensation data and surveys. The services provided by Willis Towers Watson concerned the access to benefits and compensation data and surveys for employees in Canada, United States and United Kingdom. The services provided by Eckler related to pension plan analysis, retirement policy, governance and communication to employees. The services provided by OPEX Conseils concerned various work related to the logistic and the administration of compensation of sales employees including improvement of processes. The services provided by Aon related to the access to compensation data and surveys for sales employees in various countries. The Corporation retained the services of Great Place to Work for culture audit services. The services provided by Lee Hecht Harrison Knightsbridge related to outplacement services.
The Corporation consulted Mercer for assistance with compensation data for expatriate employees and assistance with the compliance of the Pay Equity Act established by the Government of Quebec, Canada. The Corporation consulted SMA Transformation and RecrutXL Inc. for assistance with employees' training. The Corporation consulted SPB Organizational Psychology for tests before promoting. The Corporation consulted Xactly Corporation for the software improvement with respect to commission calculation. Fees for the services performed that are not related to executive compensation are not required to be approved by the Human Resources Committee.
The aggregate fees paid to Willis Towers Watson,Aon, D-TECK Solutions, Eckler, Aon, Great Place to Work, Lee Hecht Harrison Knightsbridge, Mercer, OPEX Conseils, SMA Transformation, SPB Organizational Psychology, RecrutXL Inc.Optonique and Xactly CorporationWillis Towers Watson for consulting services provided to the Human Resources Committee related to determining compensation for any of the Corporation'sCorporation’s directors and executive officers and to the Corporation for all other services provided during the financial years ended August 31, 20162018 and 20172019 were as follows:
Type of Fee | Financial 2018 Fees | Percentage of
Financial 2018 Fees | Financial 2019 Fees | Percentage of
Financial 2019 Fees |
Executive Compensation – Related Fees | CA$5,736 | | 7% | | CA$807 | | 2% | |
All Other Fees | CA$76,774 | | 93% | | CA$39,793 | | 98% | |
Total | CA$82,510 | | 100% | | CA$40,600 | | 100% | |
Type of Fee | Financial 2016 Fees | Percentage of
Financial 2016 Fees | Financial 2017 Fees | Percentage of
Financial 2017 Fees |
Executive Compensation - Related Fees | CA$28,734 | | 14% | | CA$25,107 | | 10% | |
All Other Fees | CA$175,202 | | 86% | | CA$230,417 | | 90% | |
Total | CA$203,936 | | 100% | | CA$255,524 | | 100% | |
Benchmarking
BenchmarkingIn 2016, the Corporation engaged Willis Towers Watson to perform an executive total compensation review (hereinafter in this Annual Report referred to as the “Target Compensation Positioning”). The compensation elements covered by the analysis were: base salary; target bonus; long-term incentive; perquisites and pension (hereinafter in this Annual Report referred to as the “Target Total Compensation”). Willis Towers Watson’s work included assistance in benchmarking, assessing potential gaps between the market and the executives’ compensation levels and proposing potential changes to ensure alignment with the market and with the Corporation’s compensation policy. In 2016, eleven (11) executive positions were covered by the executive total compensation review, eight (8) located in Canada and three (3) outside of Canada.
For the purpose of assessing the competitiveness of the Target Total Compensation of senior executives, the Corporation considered compensation data from a comparator group including private and publicly-tradedpublicly traded companies of comparable size and similar industry, operations in multiple countries and attracting similar profiles of employees, professionals and experts. The comparator group has been revised in 2016 with the guidance and advice from Willis Towers Watson.
· | Canada executives: For the executives based in Canada, the Corporation used the following comparator group: 5N Plus Inc., ACCEO Solutions, AgJunction Inc, Atos IT Services and Solutions, Inc., Avigilon Corporation, Callian Technologies Ltd., Ciena, COM DEV International Ltd., Constellation Software inc., Evertz Technologies Ltd., GTECH, Open Text Corporation, Redline Communications Group Inc., Sandvine Corporation, Sierra Wireless Inc., Smart Technologies Inc., Vecima Networks Inc., Vidéotron Ltée and Wi-Lan Inc. |
· | United States executives: For the executives based in the United States, the Corporation used the following comparator group: AMETEK, Avangate, BMC Software, CDK Global, Communications Systems, Crown Castle, Intelsat, Itron, Keysight Technologies, Laird Technologies, MTS Systems, Plexus, SAS Institute, SunGard Data Systems, Teradata, TomTom, Total System Services, Truphone and Verint Systems. |
· | United Kingdom executives: For the executives based in the United Kingdom, the Corporation used the following comparator group: BAE Systems Applied Intelligence, COLT Telecom, Flextronics, Fujitsu, Irdeto, McCain Foods, PepsiCo, Premier Food Group, QinetiQ, Qualcomm, Rentokil Initial, Talk Talk Group and Viacom. |
6566
Asia executives: For the executives based in Asia, the Corporation used a broader comparator group, based on general industry data: A.Menarini Asia-Pacific, Abbott Laboratories, AbbVie, Accenture, ACE Asia Pacific Services, ACE Insurance, ACE Life Insurance Company Ltd, ACR Capital Holdings, AIA Company, Aimia, Alcatel-Lucent, Amazon.com, ANZ Banking Group, ASML, AstraZeneca, Avanade, Aviva Ltd, AXA Insurance Singapore, AXA Life Insurance Singapore, Bank of New York Mellon, Baxter, Beckman Coulter, Becton Dickinson, BHP Billiton, Bio-Rad Laboratories, Biosensors, BT Global Services, Cerebos Pacific Limited, Chubb Pacific Underwriting, Cigna, CommScope, DHL, DHL Express, DHL GBS, DHL Global Forwarding, DHL Mail, DHL Supply Chain, Discovery Communications, Experian, Federal Insurance Company, Fujitsu, GE Energy, GE Healthcare, General Electric, Great Eastern Life Insurance, Hap Seng Consolidated, HSBC Holdings, IHS Global, IMI, Ingenico, Intel, Intercontinental Hotels Group, International Flavors & Fragrances, ITT Corporation, Johnson & Johnson, Lexmark, Liberty Insurance, M1 Limited, Manulife, MasterCard, Merck KgaA, Microsoft, Molex, MSD International GMBH (Singapore Branch), National Australia Bank, NBC Universal, NCR, Overseas Assurance Corporation, Pfizer, Pramerica Financial Asia HQ, Proximus, Prudential Assurance Company, Prudential Services, QBE Insurance, Qualcomm, Reinsurance Group of America, RELX Group, Rio Tinto, Roche Pharmaceuticals, Sabre Holdings, Sealed Air, Smiths Group, Spirax Sarco, Standard Chartered Bank, StarHub, Starwood Hotels & Resorts, Straits Developments, Swiss Reinsurance International, Teva Pharmaceutical Industries, Thermo Fisher Scientific, Trayport, TUI, UBS, Unilever, United Overseas Bank, Verizon, Zurich Insurance Company and Zurich Life Insurance.
· | Asia executives: For the executives based in Asia, the Corporation used a broader comparator group, based on general industry data: A.Menarini Asia-Pacific, Abbott Laboratories, AbbVie, Accenture, ACE Asia Pacific Services, ACE Insurance, ACE Life Insurance Company Ltd, ACR Capital Holdings, AIA Company, Aimia, Alcatel-Lucent, Amazon.com, ANZ Banking Group, ASML, AstraZeneca, Avanade, Aviva Ltd, AXA Insurance Singapore, AXA Life Insurance Singapore, Bank of New York Mellon, Baxter, Beckman Coulter, Becton Dickinson, BHP Billiton, Bio-Rad Laboratories, Biosensors, BT Global Services, Cerebos Pacific Limited, Chubb Pacific Underwriting, Cigna, CommScope, DHL, DHL Express, DHL GBS, DHL Global Forwarding, DHL Mail, DHL Supply Chain, Discovery Communications, Experian, Federal Insurance Company, Fujitsu, GE Energy, GE Healthcare, General Electric, Great Eastern Life Insurance, Hap Seng Consolidated, HSBC Holdings, IHS Global, IMI, Ingenico, Intel, Intercontinental Hotels Group, International Flavors & Fragrances, ITT Corporation, Johnson & Johnson, Lexmark, Liberty Insurance, M1 Limited, Manulife, MasterCard, Merck KGaA, Microsoft, Molex, MSD International GMBH (Singapore Branch), National Australia Bank, NBC Universal, NCR, Overseas Assurance Corporation, Pfizer, Pramerica Financial Asia HQ, Proximus, Prudential Assurance Company, Prudential Services, QBE Insurance, Qualcomm, Reinsurance Group of America, RELX Group, Rio Tinto, Roche Pharmaceuticals, Sabre Holdings, Sealed Air, Smiths Group, Spirax Sarco, Standard Chartered Bank, StarHub, Starwood Hotels & Resorts, Straits Developments, Swiss Reinsurance International, Teva Pharmaceutical Industries, Thermo Fisher Scientific, Trayport, TUI, UBS, Unilever, United Overseas Bank, Verizon, Zurich Insurance Company, Zurich Life Insurance.
|
To be considered in the comparator group, a company had to meet the following specific criteria:
| a) | Similar industry: Technology Hardware and Equipment, Telecommunications Equipment and Services or Software and Services; and |
| b) | Comparable in size: revenues under CA$1 billion. Only one publicly traded company had revenues above the equivalent of CA$1 billion. The compensation market comparison is done using the regression analysis which is a method to predict the "size-adjusted"“size-adjusted” competitive level of compensation to reflect the size of the Corporation in relation to that of the other companies of the reference group. This method mitigates the impact that larger companies may have on the competitive compensation levels for the Corporation. |
The Corporation also participates in two (2) major surveys on an annual basis and accordingly is permitted to purchase the results in order to continue the benchmarking of our compensation on a regular basis. The first one is Willis Towers Watson High Tech Middle Management, Professional and Support Compensation Survey, providing and receiving data for Canada, USA, UK, Finland and Lebanon. The other one is Radford (AON)(Aon) Global Sales Survey, providing and receiving data for all the countries where the Corporation employs sales force.
Guiding Principles for Compensation of Executive Officers
The Corporation'sCorporation’s executive compensation plans are designed to attract, retain and motivate key executives who directly impact the Corporation'sCorporation’s long-term success and the creation of shareholder value. In determining executive compensation, the Human Resources Committee considers the following four (4) principles:
· | Performance-based: Executive compensation levels reflect both the results of the Corporation and individual results based on specific quantitative and qualitative objectives established at the beginning of each financial year in keeping with the Corporation'sPerformance-based: Executive compensation levels reflect both the results of the Corporation and individual results based on specific quantitative and qualitative objectives established at the beginning of each financial year in keeping with the Corporation’s long-term strategic objectives. |
· | Aligned with shareholder interests: An important portion of incentive compensation for executives is composed of equity awards to ensure that executives are aligned with the principles of sustained long-term shareholder value growth. |
· | Market competitive: Compensation of executives is designed to be externally competitive when compared against executives of comparable peer companies, and in consideration of the Corporation'sMarket competitive: Compensation of executives is designed to be externally competitive when compared against executives of comparable peer companies, and in consideration of the Corporation’s results. |
6667
Individually equitable: Compensation levels are also designed to reflect individual factors such as scope of responsibility, experience, and performance against individual measures.
· | Individually equitable: Compensation levels are also designed to reflect individual factors such as scope of responsibility, experience, and performance against individual measures.
|
Compensation Policies and Practices
In April 2007, the Corporation adopted a Best Practice Regarding the Granting Date of Stock Incentive Compensation. The purpose of this best practice is to ensure that the Corporation complies with securities regulation and avoids the back-datingbackdating of equity basedequity-based incentive compensation. The best practice states that the Corporation shall: (i) grant recurrent equity basedequity-based incentive compensation pursuant to its Long-Term Incentive Plan on the fifth business day following the public release of the Corporation'sCorporation’s financial results; and (ii) grant recurrent stock basedstock-based incentive compensation pursuant to its Deferred Share Unit Plan on the last business day of each quarter. In October 2014, the Corporation amended the Human Resources Committee Charter in order to adapt it to the latest NASDAQ Rules on independency of directors, nomination and compensation committees and to better describe the nomination process of directors' processdirectors and in October 2017 the Corporation amended the Human Resources Committee Charter in order to specifically add the compensation review of the Executive Chairman.
Risk-Assessment of Executive Compensation Program
The Human Resources Committee Charter provides that it is the responsibility of the Human Resources Committee to conduct an annual assessment of the risks associated with the Corporation’s executive compensation policies and procedures. The Human Resources Committee considers the implications of the risks associated with the Corporation'sCorporation’s compensation policies and practices when establishing recommendations for the compensation of executive officers. As such, for the financial year ended August 31, 2017,2019, the Human Resources Committee conducted an internal risk assessment for executive compensation. The Human Resources Committee individually examined the compensation plans for each potential NEO against a list of elements that could trigger executives taking inappropriate or excessive risks. For the financial year ended August 31, 2017,2019, the Human Resources Committee did not identify any risks associated with the Corporation'sCorporation’s executive compensation policies and practices that are reasonably likely to have a material adverse effect on the Corporation.
On October 9, 2012, the Human Resources Committee Charter was amended in order to expressly reflect the responsibility of the Human Resources Committee to conduct an annual assessment of the risks associated with the Corporation's executive compensation policies and procedures.
Purchase of Hedging Financial Instruments by an Executive Officer or Director
While the Corporation has not adopted a policy prohibiting or restricting its executive officers and directors from purchasing financial instruments, including prepaid variable forward contracts, equity swaps, collars, or units of exchange funds, that are designated to hedge or offset a decrease in market value of equity securities granted as compensation or held, directly or indirectly, by the executive officer or director, to Management'sManagement’s knowledge, no executive officer or director has purchased any such financial instruments as of November 1, 2017.2019. In addition, according to the Security Trading Policy of the Corporation, executive officers and directors are required to pre-clear with the Corporation'sCorporation’s legal counsel'scounsel’s office any transaction concerning the Corporation'sCorporation’s securities, which includes the entering into any of the above-mentioned financial instruments.
Compensation Elements
The key elements of the Corporation's 2017Corporation’s 2019 executive compensation program were (i) base salary, (ii) short-term incentive compensation (by way of the Short-Term Incentive Plan or the Sales Incentive Plan) and (iii) the stock-based incentive compensation delivered through the Long-Term Incentive Plan. In addition, the Corporation has also offered benefit plans and, if applicable, contributed to a Deferred Profit-Sharing Plan or a 401K Plan. To determine appropriate compensation levels for each compensation component, the Human Resources Committee considered all key elements of the executive compensation program. The Human Resources Committee did not assign specific weightings to any key element of the Corporation's 2017Corporation’s 2019 executive compensation program.
6768
Base Salaries
In establishing the base salaries of senior officers, including the Executive Chairman of the board of directors and the CEO, the Corporation takes into consideration responsibilities, job descriptions and salaries paid by other similar organizations for positions similar in magnitude, scope and complexity. The Human Resources Committee'sCommittee’s objective is to align executive compensation levels with the Target Compensation Positioning offered within a reference market of comparable companies that are similar in size to the Corporation, with a particular focus on those within the high-technology/telecommunications and manufacturing-durable goods industries. The Human Resources Committee reviews the base salary of each executive officer on an annual basis at the beginning of each financial year and recommends that the Board of Directors approve appropriate adjustments, if required, within the salary range in order to maintain a competitive position within the market place.marketplace.
Short-Term Incentive Compensation
The Short-Term Incentive Plan ("STIP"(“STIP”), or the Sales Incentive Plan ("SIP"(“SIP”) for the executive officers that are included within the sales force, provides executive officers with the opportunity to earn annual bonuses based on the Corporation'sCorporation’s financial performance and the achievement of strategic corporate and departmental objectives established on a yearly basis (the "Business“Business Performance Measures"Measures”) as well as the achievement of individual performance objectives ("(“Individual Performance Measures"Measures”). The Business Performance Measures under the STIP also apply to all other employees of the Corporation, except the sales force, for which the SIP applies. The Individual Performance Measures only apply to executive officers and directors'directors’ levels of the Corporation.
Annually the Human Resources Committee determines the annual incentive target for each executive officer, being a percentage of the executive'sexecutive’s base salary ("(“Annual Incentive Target"Target”). The Annual Incentive Targets for executive officers eligible for incentive bonuses in the financial year ended August 31, 20172019 were established to be progressively in line with the objective of the Human Resources Committee of aligning compensation with the Target Compensation Positioning offered in the reference market. For the most recently ended financial year, the Annual Incentive Target for the NEOs was:
Name & Position | Annual Incentive Target as % of Base Salary |
Germain Lamonde, Executive Chairman | 65.0% |
Philippe Morin, CEO | 51.0%52.5%
|
Pierre Plamondon, CFO and Vice President, Finance | 45.0% |
Willem Jan te Niet, Vice President, Sales — EMEA | 67.0%73.0%
|
Dana Yearian, Vice President, Sales — Americas | 90.0% |
Short-Term Incentive Plan
The STIP awards (for executive officers not in sales force) are calculated as follows:
| Base Salary | X | Annual Incentive Target (%) | X | Business Performance Measures (%) | X | Individual Performance Measures (%) |
At the beginning of each financial year, the Human Resources Committee recommends for approval by the Board of Directors the Business Performance Measures that will account for the annual incentive compensation. The following table provides the Business Performance Measures, their weight and result within the overall Business Performance Measures applicable to all executive officers and employees of the Corporation except those executives and employees that are within the sale force:
6869
Business Performance Measures (1) | Weight | Result in % of the Weight | Result of the Metrics |
Consolidated revenues (2) | 30% | | 14.66% | | US$243.3 million |
Profitability (3) | 45% | | 13.64% | | US$23.0 million |
Quality (4) | 15% | | 13.95% | | 101% |
Net Promoter Score (5) | 5% | | 4.65% | | 67% |
On-time delivery (6) | 5% | | 2.43% | | 93.8% |
Total | 100% | | 49.33% | | |
Business Performance Measures (1) | Weight | Result in % of the Weight | Result of the Metrics |
Consolidated revenues (2) | 30% | | 20.56% | | US$286.9 million |
Profitability (3) | 45% | | 28.75% | | US$25.6 million |
Quality (4) | 18% | | 22.50% | | 115.0% |
Net Promoter Score (5) | 7% | | 7.59% | | 73.00 |
Total | 100% | | 79.40% | | |
| | |
| | |
| (1) | The corporate Profitability result for the year must be positive (above 0) for the whole Business Performance Measure to trigger a payout. The corporate Profitability represents net earnings before interest, income taxes, depreciation and amortization, restructuring charges, change in fair value of cash contingent consideration, stock-based compensation costs, foreign exchange gain and certain one-time items. |
| (2) | For consolidated revenues metric, results will be based onrange from 40% to 100% of the achievement from 25% to 125%, calculated onweight upon attainment of a pro-rated basis, from the revenues attained in the previous financial yearminimum threshold (US$232.5275.0 million) up to the target defined at the beginning of the financial year (US$277.8286.9 million) and from 100% to 125% of the weight from such annual target to the maximum threshold (US$310.0 million). |
| (3) | For Profitability metric, results will be based onrange from 40% to 100% of the achievement from 25% to 125%, calculated onweight upon attainment of a pro-rated basis, from the corporate Profitability attained in the previous financial yearminimum threshold (US$22.0 million) up to the target defined at the beginning of the financial year (US$41.731.0 million) and from 100% to 125% of the weight from such annual target to the maximum threshold (US$35.5 million). |
| (4) | For quality, results will range from nil25% to 100% of the weight upon attainment of a minimum threshold of 50% up to the annual target defined at the beginning of the financial year (106.25%(100%) and from 100% to 125% of the weight from such annual target to the maximum threshold of 125%115%. |
| (5) | For Net Promoter Score metrics, results will range from nil25% to 100% of the weight upon attainment of a minimum threshold of 50%62 up to the annual target defined at the beginning of the financial year (68.75%)(72) and from 100% to 125% of the weight from such annual target to the maximum threshold of 75%.75. |
(6) | For on-time delivery, results will range from nil to 100% of the weight upon attainment of a minimum threshold of 92%, up to the annual target defined at the beginning of the financial year (97.78%) and from 100% to 125% of the weight from such annual target to the maximum threshold of 99.7%. |
The Individual Performance Measures are determined annually by the executive'sexecutive’s supervisor or the Human Resources Committee and approved by the Board of Directors of the Corporation. They are based upon the position, role and responsibilities of each executive within the Corporation, departmental objectives and personal management objectives. At the conclusion of each year, the executive'sexecutive’s supervisor or the Human Resources Committee evaluates the performance of the executive against the pre-determined objectives and the executive'sexecutive’s performance is evaluated by progress, achievements and contributions. The following tables provide for each NEO subject to the STIP an overview of the elements included within the Individual Performance Measures, their weight and result for financial year 20172019 within the overall Individual Performance Measures:
Germain Lamonde, Executive Chairman |
Elements of Individual Performance Measures1(1) | Weight
(from 0% to 160%120%) (2) | Result
(%) |
Financial objectives |
Corporate EBITDA | From 0% to 30% | 19.76% | |
Corporate revenues | From 0% to 40%30% | 27.58%26.32%
| |
Corporate EBITDAStrategic contribution
|
Positioning and transforming the Corporation’s divisions as set forth in the Corporation’s strategic plan, Maximizing the value from the Corporation’s Mergers & Acquisitions activities | From 0% to 50%30% | 19.72%19.88%
| |
Strategic contribution
|
Merger and Acquisition activities aiming towards a Solutions oriented companyCorporate Development & Governance
| From 0% to 20%30% | 20.00%25.65%
| |
Establishment and implementation of a strategic plan that will result in revenue growth in identified services and
products familyTotal
| From 0% to 20%
| 20.00%91.61%
| |
Employee Satisfaction
| From 0% to 20%
| 20.00%
| |
Customer Satisfaction
| From 0% to 10%
| 7.00%
| |
Total
| | 114.30%
| |
Total of Business Performance Measures (49.33%(79.40%) X Individual Performance Measures (114.30%(91.61%) | | 56.38%72.74%
| |
| | |
| | |
| (1) | If the minimum level of the Corporate EBITDA, as determined at the beginning of the financial year, is not achieved, payment of any variable compensation to the Executive Chairman will be at the discretion of the Human Resources Committee. |
| (2) | The weight of each individual objective is not capped but the total is capped at 150%. |
Philippe Morin, CEO |
Elements of Individual Performance Measures1(1) | Weight
(from 0% to 150%120%) (2) | Result
(%) |
Financial objectives |
Corporate EBITDA | From 0% to 40%
| 17.72%
| |
Corporate revenues
| From 0% to 30% | 20.51%19.76%
| |
Strategic contribution
|
Expending corporate revenues, profitability and positioning in selected strategic markets
| From 0% to 30%
| 12.57%
| |
Delivering the strategies and objectives under the NEO's responsibility as set forth in the Corporation's strategic plan
| From 0% to 30%
| 25.63%
| |
Positioning and transforming the Corporation to allow significant growth in Corporate EBITDA and revenues
| From 0% to 20% | 15.50%14.76%
| |
TotalCorporate cash flow from operations (3)
| From 0% to 10% | 91.93%15.00%
| |
Strategic contribution |
Positioning and transforming the Corporation’s divisions as set forth in the Corporation’s strategic plan, Maximizing the value from the Corporation’s Mergers & Acquisitions activities | From 0% to 40% | 18.57% | |
Delivering the strategic transformation imperatives as set forth in the Corporation’s strategic plan and strengthening the Corporation’s strategic capabilities | From 0% to 20% | 17.39% | |
Total | | 85.48% | |
Total of Business Performance Measures (49.33%(79.40%) X Individual Performance Measures (91.93%(85.48%) | | 45.35%67.87%
| |
| | |
| | |
| (1) | If the minimum level of the Corporate EBITDA, as determined at the beginning of the financial year, is not achieved, payment of any variable compensation to the CEO will be at the discretion of the Human Resources Committee. |
| (2) | The weight of each individual objective, with the exception of the corporate cash flow from operations objective, is not capped but the total is capped at 150%. |
| (3) | This objective is capped. |
Pierre Plamondon, CFO and Vice President of Finance |
Elements of Individual Performance Measures(1) | Weight
(from 0% to 150%120%) (2) | Result
(%) |
Financial objectives |
WeightCorporate EBITDA
| From 0% to 70%30% | 32.18%19.76%
| |
Corporate EBITDA
| 40%
|
Corporate revenues | 30%
|
Strategic contribution
| Weight
| From 0% to 80%20% | 58.60%14.76%
| |
Delivering the strategies and objectives under the NEO's responsibility as set forth in the Corporation's
strategic planCorporate cash flow from operations
| 30%
|
Delivering the objectives under the NEO's responsibility as set forth in the Corporation's operational planFrom 0% to 10%
| 30%
|
Delivering a Strategic Contribution and Support in the Corporation's information technology management,
investors relations and legal services
| 20%
|
Total
| | | 90.78%17.24%
| |
Strategic contribution |
Contribute to the Corporation’s finance function transformation set forth in the Corporation’s strategic plan | From 0% to 30% | 26.00% | |
Contribute to the Corporation’s digital transformation set forth in the Corporation’s strategic plan | From 0% to 20% | 17.00% | |
Leadership performance | From 0% to 10% | 8.00% | |
Total | | 102.76% | |
Total of Business Performance Measures (49.33%(79.40%) X Individual Performance Measures (90.78%(102.76%) | | 44.78%81.59%
| |
| |
| |
| (1) | If the minimum level of the Corporate EBITDA, as determined at the beginning of the financial year, is not achieved, payment of any variable compensation to the CFO and Vice President of Finance will be at the discretion of the Human Resources Committee. |
| (2) | The weight of each individual objective is not capped but the total is capped at 150%. |
Sales Incentive Plan
The SIP objectives for executive officers in the sales force are aimed to reward three (3) elements: two (2) elements that are shareholder oriented (contribution margins, contribution margin growthbookings and billings) and one (1) is based on specific objectives.EBITDA). The objectives are determined by the executive'sexecutive’s supervisor and are for the territory under the executive'sexecutive’s supervision. The following tables outline the SIP objectives for each NEO who is within the sales force:
7071
Willem Jan te Niet, Vice-President, Sales — EMEA | |
Willem Jan te Niet, Vice President, Sales — EMEA | | Willem Jan te Niet, Vice President, Sales — EMEA |
Business Performance Measures | Business Performance Measures | Incentive Targets (US$) | Results (US$) | Incentive Targets (US$) | Results (US$) |
Contribution Margin Bonus (1) | Contribution Margin Bonus (1) | 88,280 | | 73,527 | | 107,616 | | 94,135 | |
Bonus on Billings (2) | 29,427 | | 22,727 | | |
Bonus on Strategic Sales Objectives (3) | 29,427 | | 7,840 | | |
Bonus on Bookings Achievement (2) | | 35,872 | | 26,498 | |
Corporate EBITDA (3) | | 35,872 | | 19,687 | |
Total | Total | 147,134 | | 104,094 | | 179,360 | | 140,320 | |
| | | |
| | | |
| (1) | The amount of bonus for the attainment of the quarterly contribution margin targets for the territory of the EMEA is based on the percentage of achievement up to 100% of the quarterly and annual contribution margin targets defined at the beginning of the financial year. An accelerated amount of bonus based on the percentage of attainment of the quarterly and annual contribution margin targets above 100% is also payable. |
| (2) | The amount of bonus for the attainment of the billingsbookings’ targets for the territory of the EMEA is based on the percentage of achievement up to 100% of the quarterly and annual billings targets defined at the beginning of the financial year. An additional amount of bonus based on the percentage of attainment from above 100% to 125% of the quarterly billings targets is also payable. Upon percentage of achievement above 125% of the quarterly billings targets, such corresponding exceeding portion of percentage achievement is added to the next quarter for the calculation of the amount of bonus and capped to 150% of achievement. An additional amount of bonus based on the percentage of attainment from above 100% of the annual billings target is also payable. |
(3) | The amount of bonus for the attainment of the specific product lines bookings targets for the territory of the EMEA is based on the percentage of achievement from above 50% to 100% of the annual bookings targets of the specific product lines defined at the beginning of the financial year. An accelerated amount of bonus based on the percentage of attainment from above 100%, 150% and 200% of the specific product linesannual bookings targets for the territory of the EMEA above 100%target is also payable. |
| (3) | If the minimum level of the Corporate EBITDA, as determined at the beginning of the financial year, is achieved then 25% up to 100% of achievement is payable and capped at 125% but if it is not achieved, payment of any variable compensation to the NEO will be at the discretion of the Human Resources Committee. |
Dana Yearian, Vice-President, Sales — Americas | |
Dana Yearian, Vice President, Sales — Americas | | Dana Yearian, Vice President, Sales — Americas |
Business Performance Measures | Business Performance Measures | Incentive Targets (US$) | Results (US$) | Incentive Targets (US$) | Results (US$) |
Contribution Margin Bonus (1) | Contribution Margin Bonus (1) | 128,593 | | 113,694 | | 131,094 | | 115,328 | |
Bonus on Billings (2) | 42,864 | | 39,340 | | |
Bonus on Strategic Sales Objectives (3) | 42,864 | | 3,641 | | |
Bonus on Bookings Achievement (2) | | 43,698 | | 39,182 | |
Corporate EBITDA (3) | | 43,698 | | 23,974 | |
Total | Total | 214,321 | | 156,675 | | 218,490 | | 178,484 | |
| | | |
| | | |
| (1) | The amount of bonus for the attainment of the quarterly contribution margin targets for the territory of the Americas is based on the percentage of achievement up to 100% of the quarterly and annual contribution margin targets defined at the beginning of the financial year. An accelerated amount of bonus based on the percentage of attainment of the quarterly and annual contribution margin targets above 100% is also payable. |
| (2) | The amount of bonus for the attainment of the billingsbookings’ targets for the territory of the Americas is based on the percentage of achievement up to 100% of the quarterly and annual billings targets defined at the beginning of the financial year. An additional amount of bonus based on the percentage of attainment from above 100% to 125% of the quarterly billings targets is also payable. Upon percentage of achievement above 125% of the quarterly billings targets, such corresponding exceeding portion of percentage achievement is added to the next quarter for the calculation of the amount of bonus and capped to 150% of achievement. An additional amount of bonus based on the percentage of attainment from above 100% of the annual billings target is also payable. |
(3) | The amount of bonus for the attainment of the specific product lines bookings targets for the territory of the Americas is based on the percentage of achievement from above 50% to 100% of the annual bookings targets of the specific product lines defined at the beginning of the financial year. An accelerated amount of bonus based on the percentage of attainment from above 100%, 150% and 200% of the specific product linesannual bookings targets for the territory of the Americas above 100%target is also payable. |
| (3) | If the minimum level of the Corporate EBITDA, as determined at the beginning of the financial year, is achieved then 25% up to 100% of achievement is payable and capped at 125% but if it is not achieved, payment of any variable compensation to the NEO will be at the discretion of the Human Resources Committee. |
Long-Term Incentive Compensation
The long-term incentive compensation offered by the Corporation is made up of two (2) main initiatives: i) the LTIPLong-Term Incentive Plan (the “LTIP”) for directors, officers, employees and other persons or companies providing ongoing management or consulting services ("Consultants"(“Consultants”) of the Corporation and its subsidiaries and ii) the DSU planDeferred Share Unit Plan (the “DSU Plan”) for non-employee directors of the Corporation.
Under the amending provisions, the Board of Directors may amend the LTIP and the DSU Plan or any options, Performance Share Units (“PSUs”), Restricted Share Units (“RSUs”) and Deferred Share Units (“DSUs”) issuable thereunder at any time without the consent of the holders of such securities provided that such amendment shall (i) not adversely alter or impair any securities previously granted except as permitted by the terms of the plans, (ii) be subject to any required approval of any securities regulatory authority or stock exchange, and (iii) be subject to shareholder approval, where required, by law, stock exchange requirements or the plans themselves, provided however that actions which do not require shareholder approval include, without limitation, the following actions:
7172
amendments of a general housekeeping or clerical nature that, among others, clarify, correct or rectify any ambiguity, defective provision, error or omission in the LTIP or the DSU Plan;
amendments necessary to comply with applicable laws or the requirements of any securities regulatory authority or stock exchange;
changing the eligibility for, and limitations on, participation in the LTIP and the DSU Plan;
modifying the terms and conditions of any options, PSUs, RSUs and DSUs, including restrictions, not inconsistent with the terms of the LTIP and the DSU Plan, which terms and conditions may differ among individual grants and holders of such securities;
modifying the periods referred to in the LTIP during which vested options may be exercised, provided that the option period is not extended beyond ten years after the date of the granting of the option;
amendments with respect to the vesting period, with respect to circumstances that would accelerate the vesting of options, PSUs or RSUs, or the redemption of DSUs;
any amendment resulting from or due to the alteration of share capital as more fully set out in the LTIP and the DSU Plan;
amendments to the provisions relating to the administration of the LTIP and the DSU Plan; and
suspending or terminating the LTIP and the DSU Plan.
For greater certainty, the Board of Directors shall be required to obtain shareholder approval to make the following amendments:
a reduction in the exercise price of options held by an insider;
an extension of the exercise period of options held by an insider;
any amendment to remove or to exceed the limits on insider participation;
an increase to the maximum number of Subordinate Voting Shares issuable under the LTIP and the DSU Plan; and
any amendment to the amendment provisions of the LTIP and the DSU Plan.
For the first three bullet points above, the votes attached to shares held directly or indirectly by insiders benefiting directly or indirectly from the amendment must be excluded. In addition, with respect to the last bullet point above, where the amendment will disproportionately benefit one or more insiders over other holders of options, DSUs, PSUs or RSUs, the votes of shares held directly or indirectly by those insiders receiving the disproportionate benefit must be excluded. The LTIP refers to “Units” and a Unit is defined as a PSU or a RSU granted under the LTIP.
Long-Term Incentive Plan (LTIP)
The principal component of the long-term incentive compensation offered by the Corporation is the LTIP. Introduced in May 2000, the LTIP is designed to provide directors, officers, employees and Consultants of the Corporation and its subsidiaries with an incentive to create value and accordingly ensures that their interests are aligned with those of the Corporation'sCorporation’s shareholders and to further attract, motivate and retain all of its employees, including the NEOs with the exception of the Executive Chairman who, as of August 31, 2012, is no longer participating. The LTIP is subject to review by the Human Resources Committee to ensure maintenance of its market competitiveness. The LTIP was amended in January 2005, in January 2016, in January 2018 and in January 2016.2019.
The Board of Directors has full and complete authority to interpret the LTIP and to establish the rules and regulations applying to it and to make all other determinations it deems necessary or useful for the administration of the LTIP, provided that such interpretations, rules, regulations and determinations are consistent with the rules of all stock exchanges on which the securities of the Corporation are then traded and with all applicable securities legislation and regulations. The Board of Directors or the Human Resources Committee may, at any time, with the prior approval of the competent regulatory authorities, amend, suspend or terminate the LTIP in whole or in part. Under the current amending provisions, any material amendment (including an increase in the maximum number of Subordinate Voting Shares covered by options or Restricted Share Units under the LTIP) or a reduction in the subscription price of an option (other than for standard anti-dilution purposes) or a change in the terms of a Restricted Share Unit award shall be approved by a majority of votes cast at a meeting of shareholders of the Corporation.
In addition to the foregoing, any material amendment to an award held by an insider, including a change in the subscription price or expiry date, shall be approved by a majority
The LTIP provides for the issuance of options to purchase Subordinate Voting Shares and the issuance of Restricted Share Units ("RSUs")PSUs and RSUs redeemable for Subordinate Voting Shares issued from treasury to participating directors, officers, employees and Consultants of the Corporation and its subsidiaries. The Board of Directors, upon recommendation from the Human Resources Committee, designates the recipients of options, PSUs or RSUs and determines the number of Subordinate Voting Shares covered by each optionoptions, PSUs or RSU,RSUs, the dates of vesting, the expiry date and any other conditions relating to these options, PSUs or RSUs, in each case in accordance with the applicable legislation of the securities regulatory authorities.
During the financial year ended August 31, 2017,2019, target awards for eligible officers under the LTIP were established to be in line with the objective of the Human Resources Committee to align compensation with the Target Compensation Positioning offered in the reference market. Each NEO, with the exception of the Executive Chairman since the end of the financial year ended August 31, 2012, is entitled to receive PSUs or RSUs annually in accordance with the following policy:
Name & Position | Grant Levels (1) (% of Previous Year Base Salary) |
Philippe Morin, CEO | 50.0%55.0%
| |
Pierre Plamondon, CFO and Vice President, Finance | 45.0% | |
Willem Jan te Niet, Vice President, Sales ─ EMEA | 30.0%35.0%
| |
Dana Yearian, Vice President, Sales ─ Americas | 42.5% | |
| | |
| | |
| (1) | Actual grant value may differ from the grant level guidelines as the stock price may vary between the time of the grant and its approval. |
PSU or RSU awards are based on the expected impact of the role of the executive officer on the Corporation'sCorporation’s performance and strategic development as well as market benchmarking. The Human Resources Committee undertakes an analysis from time to time to determine the possible payouts pursuant to the LTIP under various scenarios and at various levels of share price growth to ensure that the LTIP is aligned with the interests of the Corporation'sCorporation’s shareholders.
PSUs or RSUs are also used to attract and retain top executives, as well as in business acquisitions. For the year ended August 31, 2017,2019, the Corporation determined the number of PSUs or RSUs granted to each executive officer according to their individual contribution, specifically with respect to additional responsibilities as the case may be. As disclosed under the section "Summary“Summary Compensation Table"Table” hereof, all of the NEOs, with the exception of the Executive Chairman as described earlier, were granted RSUs during the last financial year. The purpose of the grants was to focus the executives on developing and successfully implementing the continuing growth strategy of the Corporation and to align the executives with the principles of sustained long-term shareholder value growth. The grants were also considered to contribute to the Corporation'sCorporation’s objective to align the compensation of the executives with the reference market. The Corporation did not take into account the amount and terms of outstanding options, PSUs or RSUs or the restrictions on resale of such units when determining the grants mentioned above.
The exercise price of the options is determined by the Board of Directors at the time of granting the options, subject to compliance with the rules of all stock exchanges on which the Subordinate Voting Shares are listed and with all applicable securities legislation and regulation. In any event, the exercise price may not be lower than the highest of the closing prices of the Subordinate Voting Shares on the Toronto Stock Exchange and the NASDAQ Global Select Market on the last trading day preceding the grant date, using the noon buying rate of the Bank of Canada from September 1, 2016 to January 31, 2017 and the daily exchange rate of the Bank of Canada since February 1, 2017 on the last trading day preceding the grant date to convert either the NASDAQ Global Select Market closing price to Canadian dollars or the Toronto Stock Exchange closing price to United States dollars. Any option issued is non-transferable, except in the event of death, for legal representative. As at November 1, 20172019, there were no options granted and none outstanding.
The fair value at the time of grant of ana PSU or RSU is equal to the market value of Subordinate Voting Shares at the time the PSU or RSU is granted. The grant date market value is equal to the highest of the closing prices of the Subordinate Voting Shares on the Toronto Stock Exchange and the NASDAQ Global Select Market on the last trading day preceding the grant date, using the noon buying rate of the Bank of Canada from September 1, 2016 to January 31, 2017 and the daily exchange rate of the Bank of Canada since February 1, 2017 on the last trading day preceding the grant date to convert either the NASDAQ Global Select Market closing price to Canadian dollars or the Toronto Stock Exchange closing price to United States dollars. Any PSU or RSU issued is non-transferable, except in the event of death, for legal representative. As at November 1, 2017,August 31, 2019, there were no PSUs granted and outstanding and a total of 1,675,3741,836,446 RSUs granted and outstanding pursuant to the LTIP having a weighted average fair value at the time of grant of US$3.973.78 (CA$4.99)4.88) per RSU.
Prior to the adoption of the amendments to the LTIP and DSU Plan as proposed in this Annual Report, theThe maximum number of Subordinate Voting Shares that are issuable under the LTIP and DSU Plan shall not exceed 6,306,15311,792,893 Subordinate Voting Shares, which represents 11.5%21.3% of the Corporation'sCorporation’s issued and outstanding voting shares as of November 1, 2017.August 31, 2019. From this total, 4,241,1394,806,810 Subordinate Voting Shares have been issued and 1,849,6532,087,953 Subordinate Voting Shares are issuable under actual awards held by participants, which represents 11.1%12.5% of the Corporation'sCorporation’s issued and outstanding voting shares as of November 1, 2017,August 31, 2019, leaving 215,3614,898,130 Subordinate Voting Shares available for grant under the LTIP and DSU Plan, representing 0.4%8.8% of the issued and outstanding voting shares as of November 1, 2017. If the proposed amendments are adopted, the aggregate number of Subordinate Voting Shares reserved for issuance under the LTIP and DSU Plan will be increased from 6,306,153 to 11,792,893 Subordinate Voting Shares. This would mean that Subordinate Voting Shares available for future grants under the LTIP and DSU Plan would then increase from 215,361 to 5,702,101, representing 10.4% of the total 54,867,396 issued and outstanding voting shares of the Corporation as of November 1, 2017.August 31, 2019.
All of the Subordinate Voting Shares covered by options that expire or are cancelled become reserved Subordinate Voting Shares for the purposes of options, PSUs or RSUs that may be subsequently granted under the terms of the LTIP. No participant shall hold in total options to purchase, PSUs, RSUs and DSUs representing more than 5% of the number of Subordinate Voting Shares issued and outstanding from time to time. There are additional limitations for insiders of the Corporation. The number of Subordinate Voting Shares issuable at any time pursuant to options, PSUs, RSUs and DSUs granted to insiders of the Corporation shall not exceed 10% of the total issued and outstanding Subordinate Voting Shares. The number of Subordinate Voting Shares issued to insiders, within a one (1) year period, pursuant to the exercise, settlement or redemption of options, PSUs, RSUs and DSUs shall not exceed 10% of the number of issued and outstanding Subordinate Voting Shares, and the number of Subordinate Voting Shares issued to any one insider and such insider'sinsider’s associates, within a one-year period, pursuant to the exercise, settlement or redemption of options, PSUs, RSUs and DSUs shall not exceed 5% of the total issued and outstanding Subordinate Voting Shares of the Corporation. Options vest at a rate as determined by the Board of Directors. Options may be exercised in whole or in part once vested. Options that are granted under the LTIP must be exercised within a maximum period of ten (10) years following the date of their grant (the “Option Period”) or they will be forfeited.forfeited provided however that the Option Period shall be automatically extended if the date on which it is scheduled to terminate falls during a blackout period or within ten (10) business days after the last day of a blackout period. In such cases, the Option Period shall terminate ten (10) business days after the last day of a blackout period.
The vesting dates of PSUs or RSUs are subject to a minimum term of three (3) years and a maximum term of ten (10) years from the award date. The following table presents, for the last five (5) financial years, the RSUs granted and their respective vesting schedule. No PSUs were granted as of August 31st, 2019.
Financial
Year Ended | Grant Date | RSUs
Granted (#) | Fair Value
at the Time of Grant
(US$/RSU) | Vesting Schedule |
August 31, 2017 | October 19, 2016 | 38,300 | | 4.01 | 50% on each of the third and fourth anniversary dates of the grant. |
January 18, 2017 | 153,700 | | 5.10 |
April 5, 2017 | 123,110 | | 4.89 |
October 19, 2016 | 207,269 | | 4.01 | 100% on the fifth anniversary date of the grant subject to early vesting of up to 1/3 on the third anniversary date of the grant and up to 50% of the remaining units on the fourth anniversary date of the grant if performance objectives namely related to long-term growth of revenue and profitability, as determined by the Board of Directors of the Corporation, are fully attained. |
April 5, 2017 | 4,764 | | 4.89 |
| | Total | 527,143 | | | |
August 31, 2016 | October 15, 2015 | 36,900 | | 3.23 | 50% on each of the third and fourth anniversary dates of the grant. |
November 9, 2015 | 109,890 | | 3.43 |
January 13, 2016 | 151,400 | | 3.00 |
July 7, 2016 | 2,500 | | 3.30 |
August 15, 2016 | 10,000 | | 3.33 |
October 15, 2015 | 206,373 | | 3.23 | 100% on the fifth anniversary date of the grant subject to early vesting of up to 1/3 on the third anniversary date of the grant and up to 50% of the remaining units on the fourth anniversary date of the grant if performance objectives namely related to long-term growth of revenue and profitability, as determined by the Board of Directors of the Corporation, are fully attained. |
November 9, 2015 | 54,945 | | 3.43 |
| | Total | 572,008 | | | |
August 31, 2015 | October 16, 2014 | 29,150 | | 3.71 | 50% on each of the third and fourth anniversary dates of the grant. |
January 14, 2015 | 163,400 | | 3.55 |
March 31, 2015 | 5,000 | | 3.78 |
July 2, 2015 | 12,299 | | 3.27 |
October 16, 2014 | 197,726 | | 3.71 | 100% on the fifth anniversary date of the grant subject to early vesting of up to 1/3 on the third anniversary date of the grant and up to 50% of the remaining units on the fourth anniversary date of the grant if performance objectives namely related to long-term growth of revenue and profitability, as determined by the Board of Directors of the Corporation, are fully attained. |
July 2, 2015 | 1,946 | | 3.27 |
| | Total | 409,521 | | | |
Financial
Year Ended | Grant Date | RSUs
Granted
(#) | Fair Value
at the Time
of Grant
(US$/RSU) | Vesting Schedule |
August 31, 2019 | October 18, 2018 | 166,161 | | 3.17 | 100% on the third anniversary date of the grant. |
January 15, 2019 | 238,500 | | 3.42 |
July 17, 2019 | 30,571 | | 3.85 |
October 18, 2018 | 197,699 | | 3.17 | 100% on the third anniversary date of the grant if performance objectives related to long-term growth of revenue and profitability, as determined by the Board of Directors of the Corporation, are fully attained. |
| | Total | 632,931 | | | |
Financial
Year Ended | Grant Date | RSUs
Granted (#) | Fair Value
at the Time of Grant
(US$/RSU) | Vesting Schedule |
August 31, 2014 | October 16, 2013 | 36,950 | | 5.28 | 50% on each of the third and fourth anniversary dates of the grant. |
January 15, 2014 | 132,000 | | 4.36 |
July 3, 2014 | 29,502 | | 4.77 |
October 16, 2013 | 138,233 | | 5.28 | 100% on the fifth anniversary date of the grant subject to early vesting of up to 1/3 on the third anniversary date of the grant and up to 50% of the remaining units on the fourth anniversary date of the grant if performance objectives namely related to long-term growth of revenue and profitability, as determined by the Board of Directors of the Corporation, are fully attained. |
| | Total | 336,685 | | | |
August 31, 2013 | October 16, 2012 | 30,006 | | 5.06 | 50% on each of the third and fourth anniversary dates of the grant. |
January 16, 2013 | 145,750 | | 5.61 |
October 16, 2012 | 140,404 | | 5.06 | 100% on the fifth anniversary date of the grant subject to early vesting of up to 1/3 on the third anniversary date of the grant and up to 50% of the remaining units on the fourth anniversary date of the grant if performance objectives namely related to long-term growth of revenue and profitability, as determined by the Board of Directors of the Corporation, are fully attained. |
| | Total | 316,160 | | | |
Financial
Year Ended | Grant Date | RSUs
Granted
(#) | Fair Value
at the Time
of Grant
(US$/RSU) | Vesting Schedule |
August 31, 2018 | October 19, 2017 | 15,000 | | 4.00 | 50% on each of the third and fourth anniversary dates of the grant. |
January 16, 2018 | 154,833 | | 4.45 |
February 2, 2018 | 30,000 | | 4.62 |
October 19, 2017 | 211 155 | | 4.00 | 100% on the fifth anniversary date of the grant subject to early vesting of up to 1/3 on the third anniversary date of the grant and up to 50% of the remaining units on the fourth anniversary date of the grant if performance objectives namely related to long-term growth of revenue and profitability, as determined by the Board of Directors of the Corporation, are fully attained. |
November 13, 2017 | 9,633 | | 4.30 |
| | Total | 420,621 | | | |
August 31, 2017 | October 19, 2016 | 38,300 | | 4.01 | 50% on each of the third and fourth anniversary dates of the grant. |
January 18, 2017 | 153,700 | | 5.10 |
April 5, 2017 | 123,110 | | 4.89 |
October 19, 2016 | 207,269 | | 4.01 | 100% on the fifth anniversary date of the grant subject to early vesting of up to 1/3 on the third anniversary date of the grant and up to 50% of the remaining units on the fourth anniversary date of the grant if performance objectives namely related to long-term growth of revenue and profitability, as determined by the Board of Directors of the Corporation, are fully attained. |
April 5, 2017 | 4,764 | | 4.89 |
| | Total | 527,143 | | | |
August 31, 2016 | October 15, 2015 | 36,900 | | 3.23 | 50% on each of the third and fourth anniversary dates of the grant. |
November 9, 2015 | 109,890 | | 3.43 |
January 13, 2016 | 151,400 | | 3.00 |
July 7, 2016 | 2,500 | | 3.30 |
August 15, 2016 | 10,000 | | 3.33 |
October 15, 2015 | 206,373 | | 3.23 | 100% on the fifth anniversary date of the grant subject to early vesting of up to 1/3 on the third anniversary date of the grant and up to 50% of the remaining units on the fourth anniversary date of the grant if performance objectives namely related to long-term growth of revenue and profitability, as determined by the Board of Directors of the Corporation, are fully attained. |
November 9, 2015 | 54,945 | | 3.43 |
| | Total | 572,008 | | | |
August 31, 2015 | October 16, 2014 | 29,150 | | 3.71 | 50% on each of the third and fourth anniversary dates of the grant. |
January 14, 2015 | 163,400 | | 3.55 |
March 31, 2015 | 5,000 | | 3.78 |
July 2, 2015 | 12,299 | | 3.27 |
October 16, 2014 | 197,726 | | 3.71 | 100% on the fifth anniversary date of the grant subject to early vesting of up to 1/3 on the third anniversary date of the grant and up to 50% of the remaining units on the fourth anniversary date of the grant if performance objectives namely related to long-term growth of revenue and profitability, as determined by the Board of Directors of the Corporation, are fully attained. |
July 2, 2015 | 1,946 | | 3.27 |
| | Total | 409,521 | | | |
If any vesting dates fall into any blackout period or any other restrictive period during which the PSU or RSU holder is not entitled to trade the Corporation'sCorporation’s Subordinate Voting Shares, the PSUs or RSUs shall: (i) vest on the fifth trading day the PSU or RSU holder is entitled to trade after such blackout period or restrictive period; or (ii) if the PSU or RSU holder decides, prior to such vesting date, to pay his/her income tax without using any of the Subordinate Voting Shares'Shares’ proceeds, then and only then, the vesting date shall remain the one determined on the granting date for such RSUs. If the proposed amendments are adopted, the LTIP will include a provision whereby the Option Period shall be automatically extended if the date on which it is scheduled to terminate falls during a blackout periodPSUs or within 10 business days after the last dayRSUs.
With the exceptions mentioned under the section entitled "Termination“Termination and Change of Control Benefits"Benefits”, unless otherwise determined by the Board of Directors, any option granted pursuant to the LTIP will lapse: (i) immediately upon the termination of the relationship with the Corporation or one of its subsidiaries for a good and sufficient cause for employees or officers or at the date on which an employee or an officer resigns or leaves his employment with the Corporation or one of its subsidiaries (or within thirty (30) days if the holder'sholder’s employment is terminated for reasons not related to cause); and (ii) thirty (30) days after a director ceases to be a member of the Board of Directors of the Corporation or one of its subsidiaries for any reason other than death or permanent disability. The LTIP provides that, in the event of death or permanent disability, any option held by the optionee lapses six (6) months after the date of permanent disability and the option shall become exercisable no later than the date of termination by reason of death or permanent disability of the employee or the officer. In the event of retirement, any option held by an employee lapses thirty (30) days after the date of any such retirement. Nevertheless, in case of retirement or early retirement of an officer or employee, the Board of Directors or the Human Resources Committee may at its own discretion extend the period an option will lapse in accordance with the terms of the LTIP.
With the exceptions mentioned under the section entitled "Termination“Termination and Change of Control Benefits"Benefits”, unless otherwise determined by the Board of Directors, any PSU or RSU granted pursuant to the LTIP will lapse: (i) immediately, where vesting of a unit is subject to the attainment of performance objectives, if such performance objectives have not been attained (or postponed at a further vesting date as determined by the Board of Directors); and (ii) immediately, whether or not subject to attainment of performance objectives, upon the termination of the relationship with the Corporation or one of its subsidiaries for a good and sufficient cause for employees or officers or at the date on which an employee or an officer resigns or leaves his employment with the Corporation or one of its subsidiaries.
The LTIP provides that any PSU or RSU granted will vest immediately, to a certain proportion as determined by the LTIP, upon the termination of the relationship of an employee or officer with the Corporation or one of its subsidiaries for reasons not related to cause. The LTIP provides that any PSU or RSU granted pursuant to the LTIP will vest immediately upon the termination of the relationship of an employee or officer with the Corporation or one of its subsidiaries because of death or permanent disability. The LTIP also provides that upon participant attainment of the retirement conditions established by the Corporation and continued compliance with the confidentiality, non-solicitationnon‑solicitation and non-competition obligations of the PSU or RSU holder, the PSU or RSU holder shall be entitled to the regular vesting as established by the Board of Directors at the time of grant pursuant to the LTIP. Furthermore, in case of ana PSU or RSU holder employment with the Corporation is terminated following a change of control, the Board of Directors or the Human Resources Committee may, at its own discretion, increase the number of Subordinate Voting Shares to which ana PSU or RSU holder is entitled.
In the event of a change of control, the Board of Directors or the Human Resources Committee may, prior or following the change of control, accelerate the time at which an option, PSU or RSU may first be exercised or the time during which an option, PSU or RSU or any part thereof will become exercisable.
The full text of the current LTIP is included in our 20172018 Annual Information Form on Form 20-F under Exhibit 4.57,4.59, which was filed on November 24, 201727, 2018 on SEDAR at www.sedar.com in Canada or on EDGAR at www.sec.gov/edgar.shtml in the U.S.
Performance Share Units Grants in Last Financial Year
There were no PSUs redeemable for Subordinate Voting Shares granted during the financial year ended August 31, 2019. As at November 1, 2019, there were 140,995 PSUs granted and outstanding.
Restricted Share Unit Grants in Last Financial Year
The aggregate number of RSUs granted from September 1, 20162018 to November 1, 2017,August 31, 2019, was 753,298632,931 having a weighted average fair value at the time of grant of US$4.383.30 (CA$5.70)4.32) per RSU. The fair value at the time of grant of a RSU is equal to the market value of Subordinate Voting Shares at the time RSUs are granted. At November 1, 2017,August 31, 2019, there were a total of 1,675,3741,836,446 RSUs granted and outstanding pursuant to the LTIP having a weighted average fair value at the time of grant of US$3.973.78 (CA$4.99)4.88) per RSU.
The PSUs or RSUs are redeemed for Subordinate Voting Shares issued from treasury on the vesting dates established by the Board of Directors of the Corporation at the time of grant in its sole discretion.
Therefore, the value at vesting of a RSU, when converted to Subordinate Voting Shares, is equivalent to the market value of a Subordinate Voting Share at the time the conversion takes place and is taxable as employment income. The table above shows information regarding RSU grants made under the LTIP during the financial year ended August 31, 2017.2019. No PSUs were granted during the financial year ended August 31, 2019.
During the financial year ended August 31, 2017,2019, the following RSUs were granted to the following NEOs:
Name | RSUs
Granted
(#) | Percentage of Total
RSUs Granted to
Employees in
Financial Year (%) (1) | Fair Value
at the Time
of Grant
(US$/RSU) (2) | Grant Date | Vesting Schedule (3) | |
Philippe Morin | 47,529 | 9.02% | 4.01 | October 19, 2016 | 100% on the fifth anniversary date of the grant subject to early vesting up to 1/3 on the third anniversary date of the grant and up to 50% of the remaining units on the fourth anniversary date of the grant if performance objectives namely related to long-term growth of revenue and profitability, as determined by the Board of Directors of the Corporation are fully attained. (4) | |
38,110 | 7.23% | 4.89 | April 5, 2017 | 50% on each of the third and fourth anniversary dates of the grant. | |
4,764 | 0.90% | 4.89 | April 5, 2017 | 100% on the fifth anniversary date of the grant subject to early vesting up to 1/3 on the third anniversary date of the grant and up to 50% of the remaining units on the fourth anniversary date of the grant if performance objectives namely related to long-term growth of revenue and profitability, as determined by the Board of Directors of the Corporation are fully attained. (4) | |
Pierre Plamondon | 25,162 | 4.77% | 4.01 | October 19, 2016 | 100% on the fifth anniversary date of the grant subject to early vesting up to 1/3 on the third anniversary date of the grant and up to 50% of the remaining units on the fourth anniversary date of the grant if performance objectives namely related to long-term growth of revenue and profitability, as determined by the Board of Directors of the Corporation are fully attained. (4) | |
Willem Jan te Niet | 16,681 | 3.16% | 4.01 | October 19, 2016 | 100% on the fifth anniversary date of the grant subject to early vesting up to 1/3 on the third anniversary date of the grant and up to 50% of the remaining units on the fourth anniversary date of the grant if performance objectives namely related to long-term growth of revenue and profitability, as determined by the Board of Directors of the Corporation are fully attained. (4) | |
Dana Yearian | 24,744 | 4.69% | 4.01 | October 19, 2016 | 100% on the fifth anniversary date of the grant subject to early vesting up to 1/3 on the third anniversary date of the grant and up to 50% of the remaining units on the fourth anniversary date of the grant if performance objectives namely related to long-term growth of revenue and profitability, as determined by the Board of Directors of the Corporation are fully attained. (4) | |
Name | RSUs
Granted
(#) | Percentage of Total
RSUs Granted to
Employees in
Financial Year (%) (1) | Fair Value
at the Time
of Grant
(US$/RSU) (2) | Grant Date | Vesting Schedule (3) | |
Philippe Morin | 34,892 | 12.40% | 3.17 | October 18, 2018 | 100% on the third anniversary date of the grant. | |
43,615 | 100% on the third anniversary date of the grant if performance objectives namely related to long-term growth of revenue and profitability, as determined by the Board of Directors of the Corporation are fully attained. (4) | |
Pierre Plamondon | 16,842 | 5.99% | 3.17 | October 18, 2018 | 100% on the third anniversary date of the grant. | |
21,052 | 100% on the third anniversary date of the grant if performance objectives namely related to long-term growth of revenue and profitability, as determined by the Board of Directors of the Corporation are fully attained. (4) | |
Willem Jan te Niet | 13,117 | 4.66% | 3.17 | October 18, 2018 | 100% on the third anniversary date of the grant. | |
16,397 | 100% on the third anniversary date of the grant if performance objectives namely related to long-term growth of revenue and profitability, as determined by the Board of Directors of the Corporation are fully attained. (4) | |
Dana Yearian | 16,282 | 5.79% | 3.17 | October 18, 2018 | 100% on the third anniversary date of the grant. | |
20,353 | 100% on the third anniversary date of the grant if performance objectives namely related to long-term growth of revenue and profitability, as determined by the Board of Directors of the Corporation are fully attained. (4) | |
| | |
| | |
| (1) | Such percentage does not include any cancelled RSUs. |
| (2) | The fair value at the time of grant of a RSU is equal to the market value of Subordinate Voting Shares at the time RSUs are granted. The grant date market value is equal to the highest of the closing prices of the Subordinate Voting Shares on the Toronto Stock Exchange and the NASDAQ Global Select Market on the last trading day preceding the grant date, using the noon buying rate of the Bank of Canada from September 1, 2016 to January 31, 2017 and the daily exchange rate of the Bank of Canada since February 1, 2017 on the last trading day preceding the grant date to convert either the NASDAQ Global Select Market closing price to Canadian dollars or the Toronto Stock Exchange closing price to United States dollars as required. |
| (3) | All RSUs first vesting cannot be earlier than the third anniversary date of their grant. |
| (4) | Those RSUs granted in the financial year ended August 31, 20172019 vest on the fifththird anniversary date of the grant but are subject to early vesting on the third and fourth anniversary date of the grant on the attainment of performance objectives, as determined by the Board of Directors of the Corporation. Accordingly, subject to the attainment of performance objectives, the first early vesting is up to 1/3 of the units on the third anniversary date of the grant and the second early vesting is up to 50% of the remaining units on the fourth anniversary date of the grant. The early vesting shall be subject to the attainment of performance objectives. Such performance objectives are based on the attainment of a sales growthprofitability metric combined with profitability metric. The sales growth metric is determined by the Compound Annual Growth Rate of sales of the Corporationtarget for the period described below (SALES CAGR).upcoming three fiscal years. The profitability metric is determined as the Cumulative Corporation'supcoming three fiscal year ‘s cumulative Corporation’s IFRS net earnings (loss) before interest and other expense, income taxes, depreciation of property, plant and equipment, amortization, of intangible assets,stock-based compensation costs, restructuring charges, acquisition-related deferred revenue fair value adjustment and foreign exchange gain or loss, change in fair value of cash contingent consideration, and extraordinary gain or loss over the Cumulative Sales for the same period (LTIP EBITDA)(“LTIP EBITDA”). Accordingly, the first early vesting performance objectives will be attained, calculated on a pro-rated basis as follows: i) 100% for a SALES CAGR of 20% or more and 0% for a SALES CAGR of 5% or lessLTIP EBITDA below target for the three-year period ending on August 31, 2019; cumulated with2021; ii) 50% to 100% for a LTIP EBITDA of 15%at target or above and 0% for a LTIP EBITDA of 7.5% or lesscaped at two times the target for the three-year period ending on August 31, 2019. The second early vesting performance objectives will be attained on the same premises as described above but for the four-year period ending on August 31, 2020.2021. |
7778
The following table summarizes information about RSUs granted to the members of the Board of Directors and to Management and Corporate Officers of the Corporation and its subsidiaries as at August 31, 2017:2019:
| | Number of
RSUs (#) | % of Issued and
Outstanding RSUs | Weighted Average Fair Value at
the Time of Grant ($US/RSU) | Number of
RSUs (#) | % of Issued and
Outstanding RSUs | Weighted Average Fair Value at
the Time of Grant ($US/RSU) |
Executive Chairman (one (1) individual) | – | | – | | – | | – | | – | | – | |
CEO (one (1) individual) | 255,238 | | 15.84% | | 3.78 | | 327,039 | | 17.81% | | 3.73 | |
Board of Directors (five (5) individuals) | – | | – | | – | | |
Management and Corporate Officers (nine (9) individuals) | 578,088 | | 35.88% | | 4.08 | | |
Board of Directors (four (4) individuals) | | – | | – | | – | |
Management and Corporate Officers (ten (10) individuals) | | 844,544 | | 45.99% | | 3.58 | |
Option Grants in Last Financial Year
There were no options to purchase the Corporation'sCorporation’s Subordinate Voting Shares granted during the financial year ended August 31, 20172019 and thereafter until November 1, 2017.2019. As at November 1, 2017,2019, there were no optionoptions granted and none outstanding.
Deferred Share Unit Plan (DSU Plan)
Introduced in October 2004 and effective as of January 2005, the Corporation'sCorporation’s DSU Plan (the Deferred Share Unit Plan) is designed to align more closely the interests of the Corporation'sCorporation’s non-employee directors with those of its shareholders.
Under the DSU Plan, non-employee directors may elect to receive up to 100% of their retainer fees in the form of DSUs, each of which has an estimated value determined based on the highest of the closing prices of the Subordinate Voting Shares on the Toronto Stock Exchange and the NASDAQ Global Select Market on the last trading day preceding the grant date, using the noon buying rate of the Bank of Canada from September 1, 2016 to January 31, 2017 and the daily exchange rate of the Bank of Canada since February 1, 2017on the last trading day preceding the grant date to convert either the NASDAQ Global Select Market closing price to Canadian dollars or the Toronto Stock Exchange closing price to United States dollars, as required. DSUs entitle the holder thereof to dividends in the form of additional DSUs at the same rate as dividends on Subordinate Voting Shares. Any DSU issued is non-transferable, except by will or other testamentary document or according to the laws respecting the devolution and allotment of estates.
When a participant ceases to act as a director, the participant (or in the case of death, the beneficiary of the DSUs) may cause the Corporation to redeem the DSUs by filing a notice of redemption with the Corporation'sCorporation’s Secretary specifying the redemption date. If the participant or his/her beneficiary or legal representative, as the case may be, fails to file such a notice, the redemption date shall be December 15 of the first calendar year commencing after the year the participant ceased to act as a director. Within ten business days after the redemption date, the participant shall receive, at the discretion of the Corporation, in satisfaction of the number of DSUs credited to his or her account on such date, any of the following: (a) a number of Subordinate Voting Shares purchased on the open market having a value, net of any applicable withholdings, equal to the market value of a Subordinate Voting Share on the redemption ratedate multiplied by the number of DSUs credited to his or her notional account on the payment date, (b) a number of Subordinate Voting Shares issued by the Corporation equal to the number of DSUs credited to his or her notional account on the payment date, or (c) any combination of clauses (a) and (b). If a participant dies after ceasing to act as a director, but before filing a redemption notice, these provisions shall apply with such modifications as the circumstances require.
7879
Subordinate Voting Shares issued by the Corporation will be issued from the same pool of Subordinate Voting Shares reserved for issuance pursuant to the LTIP. There are additional limitations for insiders of the Corporation. The number of Subordinate Voting Shares issuable at any time pursuant to options, PSUs, RSUs and DSUs granted to insiders of the Corporation shall not exceed 10% of the total issued and outstanding Subordinate Voting Shares. The number of Subordinate Voting Shares issued to insiders, within a one (1) year period, pursuant to the exercise, settlement or redemption of options, PSUs, RSUs and DSUs shall not exceed 10% of the number of issued and outstanding Subordinate Voting Shares, and the number of Subordinate Voting Shares issued to any one insider and such insider'sinsider’s associates, within a one-year period, pursuant to the exercise, settlement or redemption of options, PSUs, RSUs and DSUs shall not exceed 5% of the total issued and outstanding Subordinate Voting Shares of the Corporation.
Under the current amending provisions, the DSU Plan may be amended or terminated at any time and from time to time by the Board of Directors, with the prior approval of the competent regulatory authorities, provided that any such amendment or termination does not in any way infringe upon any rights of participants in respect of DSUs previously credited to the account of participants. For a summary of the proposed new amending provisions, see "Amendments to the Long-Term Incentive Plan and the Deferred Share Unit Plan - Adoption of New Amending Provisions".
Deferred Share Unit Grants in Last Financial Year
The aggregate number of DSUs credited to non-employee directors during the financial year ended August 31, 20172019 was 45,058.69,818. The estimated value at the time of grant of a DSU is determined based on the highest of the closing prices of the Subordinate Voting Shares on the Toronto Stock Exchange and the NASDAQ Global Select Market on the last trading day preceding the grant date, using the noon buying rate of the Bank of Canada from September 1, 2016 to January 31, 2017 and the daily exchange rate of the Bank of Canada since February 1, 2017 on the last trading day preceding the grant date to convert either the NASDAQ Global Select Market closing price to Canadian dollars or the Toronto Stock Exchange closing price to United States dollars, as required. The value at vesting of a DSU is equivalent to the market value of the Subordinate Voting Shares when a DSU is converted to such Subordinate Voting Shares. As at August 31, 2017,2019, there were a total of 174,279251,507 DSUs credited and outstanding pursuant to the DSU Plan having a weighted average fair value at the time of grant of US$4.093.90 (CA$4.94)4.99).
During the financial year ended August 31, 2017,2019, the following DSUs were granted to the non-employee members of the Board of Directors:
DSUs
Granted (#) | Weighted Average Fair Value
at the Time of Grant (US$/DSU) | Total of the Fair Value
at the Time of Grant (US$) | Vesting | Weighted Average Fair Value
at the Time of Grant (US$/DSU) | Total of the Fair Value
at the Time of Grant (US$) | Vesting |
45,058 | 4.36 | 196,453 | At the time director ceases to be a member of the Board of Directors of the Corporation | |
69,818 | | 3.63 | 253,439 | At the time director ceases to be a member of the Board of Directors of the Corporation |
The following table summarizes information about DSUs granted to the non-employee members of the Board of Directors as at November 1, 2017:2019:
| | Number of
DSUs (#) | % of Issued and
Outstanding DSUs | Total of the Fair Value at
the Time of Grant (US$) | Weighted Average Fair Value
at the Time of Grant (US$/DSU) |
Board of Directors (five (5) individuals) | 174,279 | 100% | 4.09 | 712,801 |
| | DSUs
Granted (#) | % of Issued and
Outstanding DSUs | Total of the Fair Value at
the Time of Grant (US$) | Weighted Average Fair Value
at the Time of Grant (US$/DSU) |
Board of Directors (four (4) individuals) | 251,507 | 100% | 980,877 | 3.90 |
Number of Subordinate Voting Shares Reserved for Future Issuance
During the financial year ended August 31, 2017, 45,0582019, 69,818 DSUs and 527,143632,931 RSUs were granted to directors, officers and employees. Such awards were issued from the pool of Subordinate Voting Shares reserved for issuance pursuant to the LTIP and the DSU Plan of which the maximum number of Subordinate Voting Shares issuable shall not exceed 6,306,153,11,792,893, which represents 11.5%21.3% of the Corporation'sCorporation’s issued and outstanding voting shares as at November 1, 2017.August 31, 2019. As at November 1, 2017,August 31, 2019, the number of Subordinate Voting Shares reserved for future issuance is 215,3614,898,130 representing 0.4%8.8% of the Corporation'sCorporation’s issued and outstanding voting shares as at November 1, 2017. If the proposed increase is approved the aggregate number of Subordinate Voting Shares reserved for issuance under the LTIP and DSU Plan will increase from 6,306,153 to 11,792,893 Subordinate Voting Shares. This would mean that Subordinate Voting Shares available for future grants under the LTIP and the DSU Plan would increase from 215,361 to 5,702,101, representing 10.4% of the total 54,867,396 issued and outstanding voting shares of the Corporation as of November 1, 2017. See "Amendments to the Long-Term Incentive Plan and the Deferred Share Unit Plan - Increase in Shares Reserved for Issuance".August 31, 2019.
Stock Appreciation Rights Plan
On August 4, 2001, the Corporation established a Stock Appreciation Rights Plan (the "SAR Plan"“SAR Plan”), as amended on January 12, 2010, for the benefit of certain employees residing in countries where the granting of stock-based compensation under the LTIP is not feasible in the opinion of the Corporation. The Board of Directors has full and complete authority to interpret the SAR Plan and to establish the rules and regulations applying to it and to make all other determinations it deems necessary or useful for the administration of the SAR Plan.
Under the SAR Plan, eligible employees are entitled to receive a cash amount equivalent to the difference between the market price of the Subordinate Voting Shares on the date of exercise or the date of vesting and the exercise price determined on the date of grant. No Subordinate Voting Shares are issuable under the SAR Plan.
The Board of Directors has delegated to Management the task of designating the recipients of stock appreciation rights, the date of exercise or vesting, the expiry date and other conditions. Under the terms of the SAR Plan, the exercise price determined on the date of grant of the stock appreciation right is equal to zero (0) if the stock appreciation right is to reflect a PSU or RSU under the LTIP or, if the stock appreciation right is to reflect an option under the LTIP, the exercise price determined on the date of grant may not be lower than the highest of the closing prices of the Subordinate Voting Shares on the Toronto Stock Exchange and on the NASDAQ Global Select Market on the last trading day preceding the grant date, using the noon buying rate of the Bank of Canada from September 1, 2016 to January 31, 2017 and the daily exchange rate of the Bank of Canada since February 1, 2017 on the last trading day preceding the grant date to convert either the NASDAQ Global Select Market closing price to Canadian dollars or the Toronto Stock Exchange closing price to United States dollars. Stock appreciation rights are non‑transferable.
The stock appreciation rights, reflecting a PSU or RSU under the LTIP, vest at a rate of 50% annually commencing on the third anniversary date of the date of grants made in January 2014, October 2014, January 2015, October 2015, January 2016, October 2016, January 2017 and January 2017.2018 and at a rate of 100% on the third anniversary date of the date of grants made in January 2019.
The stock appreciation rights, reflecting a PSU or RSU under the LTIP, will: i) lapse immediately upon the termination of the relationship with the Corporation or one (1) of its subsidiaries for a good and sufficient cause or at the date on which an employee resigns or leaves his employment with the Corporation or one (1) of its subsidiaries; and ii) vest immediately, to a certain proportion as determined by the SAR Plan, upon the termination without cause of the relationship of an employee with the Corporation or one (1) of its subsidiaries.
The stock appreciation rights, reflecting an option under the LTIP, vest over a four-year period, with 25% vesting annually commencing on the first anniversary date of the date of grant. However, since October 2007, some stock appreciation rights, representing an option under the LTIP, vest at a rate of 50% annually commencing on the third anniversary date of the grants made in October 2008 and October 2009.
For stock appreciation rights, reflecting an option under the LTIP, once vested, such right may be exercised between the second and the fifteenth business day following each release of the Corporation'sCorporation’s quarterly financial results and will lapse immediately upon the termination of the relationship with the Corporation or one (1) of its subsidiaries for a good and sufficient cause or at the date on which an employee resigns or leaves his employment with the Corporation or one (1) of its subsidiaries (or within thirty (30) days if the holder is dismissed without cause). In the event of retirement or disability, any stock appreciation right held by an employee lapses thirty (30) days after the date of any such disability or retirement. In the event of death, any stock appreciation right lapses six (6) months after the date of death.
All of the stock appreciation rights that are granted under the SAR Plan may be exercised within a maximum period of ten (10) years following the date of their grant.
From September 1, 20162018 until November 1, 2017, 14,1042019, 10,046 Stock Appreciation Rights ("SARs"(“SARs”) were exercised.
During the financial year ended August 31, 2017, 7,9002019, 6,000 SARs were granted to employees. As at August 31, 2017,2019, there were 27,29621,000 SARs outstanding.
Benefits and Perquisites
Certain employees of the Corporation, including the NEOs, are eligible to participate in the Corporation'sCorporation’s benefits programs, which may include life insurance, extended health and dental coverage, short and long-term disability coverage, accidental death and dismemberment (AD&D) compensation and emergency travel assistance. Although the majority of costs of the benefits are paid by the Corporation, employees (including the NEOs) may also be required to contribute to obtain such benefits.
With the exception of car allowances that are provided to the Corporation'sCorporation’s Executive Chairman and Vice Presidents of Sales, executive officers, including other NEOs, do not receive any perquisites. The value of the perquisites for each of the NEOs, if applicable, is less than CA$50,000 or 10% of total annual salary and bonus for the financial year and, as such, is not included in the table provided under the heading "Summary“Summary Compensation Table"Table” and in the table provided under the heading "Termination“Termination and Change of Control Benefits"Benefits”.
Deferred Profit-Sharing Plan
The Corporation maintains a deferred profit-sharing plan (the "DPSP"“DPSP”) for certain eligible Canadian resident employees, including NEOs but excluding the Corporation'sCorporation’s Executive Chairman, under which the Corporation may elect to match the employees'employees’ contributions up to a maximum of 4% of an employee'semployee’s gross salary, provided that the employee has contributed to a tax-deferred registered retirement savings plan. Cash contributions, for eligible employees to the DPSP, and expenses for the years ended August 31, 2015, 20162017, 2018 and 20172019 amounted to US$1,492,000,1,571,000, US$1,374,0001,610,000 and US$1,571,000,1,592,000, respectively. The amounts contributed to the DPSP are invested at the employee'semployee’s will in the investment vehicles offered by Manufacturers Life Insurance Company (Manulife) (previously Standard Life), the Corporation'sCorporation’s fund administrator. Withdrawals of funds from the DPSP account are not permitted. In the event of termination of the employment, if the employee has been a member of the DPSP for more than two (2) years, the employee is entitled to receive the funds accumulated in his DPSP account.
401K Plan
The Corporation maintains a 401K plan for eligible United States resident employees of its subsidiaries. Employees become eligible to participate in the 401K plan on the date they are hired. Under this plan, the Corporation must contribute an amount equal to 3% of an employee'semployee’s current compensation. In addition, employees may elect to defer their current compensation up to the lesser of 1% of eligible compensation or the statutorily prescribed annual limit and have the deferral contributed to the 401K plan. The 401K plan permits, but does not require, the Corporation to make additional matching contributions to the 401K plan on behalf of the eligible participants, subject to a maximum of 50% of the first 6% of the participant'sparticipant’s current compensation subject to certain legislated maximum contribution limits. The Corporation contributes up to 3% of the participant'sparticipant’s current compensation, subject to certain legislated maximum contribution limits. In the years ended August 31, 2015, 20162017, 2018 and 2017,2019, the Corporation made aggregate contributions of US$628,000,630,000, US$622,000591,000 and US$630,000460,000 respectively, to the 401K plan. Contributions by participants or by the Corporation to the 401K plan and income earned on plan contributions are generally not taxable to the participant until withdrawn and contributions by the Corporation are generally deductible by the Corporation when made. At the direction of each participant, the trustees of the 401K plan invest the assets of the 401K plan in selected investment options.
20172019 Performance and Compensation
Compensation for the NEOs is awarded through the Corporation'sCorporation’s executive compensation plan, which aligns compensation with key strategic objectives and individual performance. The Corporation has established Business Performance Measures outlining key performance indicators which are applicable to all employees. You will find more information on such indicators under the heading "Short-Term“Short-Term Incentive Compensation"Compensation”. These performance indicators focus efforts, communicate priorities and enable performance to be benchmarked.
The following table highlights the NEOs early vesting achievement in accordance with the Corporation'sCorporation’s LTIP:
Long-Term Incentive Plan (LTIP) - RSUs | |
Date of Grant | Vesting Date | % of Early Vesting Achievement (1) |
October 16, 201315, 2015 | October 16, 201715, 2019 | 3%8%
|
October 16, 201419, 2016 | October 16, 201721, 2019 | 6%11%
|
| | |
| | |
| (1) | The vesting schedules are provided in the table under the heading "Long-Term“Long-Term Incentive Plan"Plan”. |
Conclusion
By way of application of the Corporation'sCorporation’s executive compensation policy, an important part of executive compensation is linked to corporate performance and long-term value creation. The Human Resources Committee continuously reviews executive compensation programs to ensure that they maintain their competitiveness and continue to focus on the Corporation'sCorporation’s objectives, values and business strategies.
For the financial year ending August 31, 2012, we made a significant change to the Executive Chairman compensation structure. Following the evaluation of the share ownership of the Executive Chairman, it was decided by the Human Resources Committee that the Executive Chairman should no longer receive equity-based compensation within his compensation as the share ownership of the Executive Chairman has been determined to be sufficient and that equity-based compensation was no longer reasonably considered as an incentive to performance.
Depending on specific circumstances, the Human Resources Committee may also recommend employment terms and conditions that deviate from the policies and the execution by the Corporation or its subsidiaries of employment contracts on a case-by-case basis.
Executive Chairman Performance Compensation during Last Three (3) Financial Years
The following table compares the compensation awarded to Mr. Germain Lamonde in respect of his performance as CEO until April 1, 2017 and then as Executive Chairman to the Total Market Capitalization Growth for the last three (3) financial years. The compensation includes base salary, short-term incentive payments, as well as long-term incentive payments at grant date pursuant to the LTIP.
Compensation Elements | Compensation Elements | 2017(1) | 2016 | 2015 | Three-Year Total | Compensation Elements | 2019 | 2018 | 2017 (1) | Three-Year Total |
Cash | Cash | Cash |
Base Salary | Base Salary | CA$717,500 | | CA$700,000 | | CA$615,332 | | CA$2,032,832 | | Base Salary | CA$486,735 | | CA$588,350 | | CA$717,500 | | CA$1,792,585 | |
Short-Term Incentive | Short-Term Incentive | CA$262,962 | | CA$331,115 | | CA$101,022 | | CA$695,099 | | Short-Term Incentive | CA$230,128 | | CA$160,800 | | CA$262,962 | | CA$653,890 | |
Equity | Equity | Equity |
Long-Term Incentive | Long-Term Incentive | – | | – | | – | | – | | Long-Term Incentive | – | | – | | – | | – | |
Total Direct Compensation | Total Direct Compensation | CA$980,462 | | CA$1,031,115 | | CA$716,354 | | CA$2,727,931 | | Total Direct Compensation | CA$716,863 | | CA$749,150 | | CA$980,462 | | CA$2,446,475 | |
Contribution to DPSP | Contribution to DPSP | – | | – | | – | | – | | Contribution to DPSP | – | | – | | – | | – | |
All Other Compensation | All Other Compensation | – | | – | | – | | – | | All Other Compensation | – | | – | | – | | – | |
Total Compensation | Total Compensation | CA$980,462 | | CA$1,031,115 | | CA$716,354 | | CA$2,727,931 | | Total Compensation | CA$716,863 | | CA$749,150 | | CA$980,462 | | CA$2,446,475 | |
Annual Average | Annual Average | – | | – | | – | | CA$909,310 | | Annual Average | – | | – | | – | | CA$815,492 | |
Total Market Capitalization (CA$ millions) as at August 31 (2) | 322.3 | | 231.9 | | 217.6 | | 257.3 | | |
Total Market Capitalization (CA$ millions) as at August 31 | | Total Market Capitalization (CA$ millions) as at August 31 | 268.4 | | 318.0 | | 322.3 | | 302.9 | |
Total Cost as a % of Market Capitalization | Total Cost as a % of Market Capitalization | 0.30% | | 0.44% | | 0.33% | | 0.35% | | Total Cost as a % of Market Capitalization | 0.27% | | 0.24% | | 0.31% | | 0.27% | |
| | | |
| | | |
| (1) | On April 1, 2017, Mr. Germain Lamonde stepped down as CEO and became Executive Chairman of the Corporation. |
(2) | In fiscal year 2015, the Corporation redeemed 6,521,739 subordinate voting shares under its substantial issuer bid. |
CEO Performance Compensation during Last Three (3) Financial Years
The following table compares the compensation awarded to Mr. Philippe Morin in respect of his performance as COO until April 1, 2017 and then as CEO to the Total Market Capitalization Growth for the last three (3) financial years. The compensation includes base salary, short-term incentive payments, as well as long-term incentive payments at grant date pursuant to the LTIP.
Compensation Elements | 2017(1) | 2016(2) | 2015 | Three-Year Total |
Cash |
Base Salary | CA$512,500 | | CA$394,231 | | – | | CA$906,731 | |
Short-Term Incentive | CA$118,531 | | CA$142,590 | | – | | CA$261,121 | |
Equity |
Long-Term Incentive | CA$531,256 | | CA$749,999 | | – | | CA$1,281,255 | |
Total Direct Compensation | CA$1,162,287 | | CA$1,286,820 | | – | | CA$2,449,107 | |
Contribution to DPSP | CA$14,346 | | CA$9,135 | | – | | CA$23,481 | |
All Other Compensation | – | | – | | – | | – | |
Total Compensation | CA$1,176,633 | | CA$1,295,955 | | – | | CA$2,472,588 | |
Annual Average | – | | – | | – | | CA$1,236,294 | |
Total Market Capitalization (CA$ millions) as at August 31 | 322.3 | | 231.9 | | – | | 277.1 | |
| | | | | | | | | |
Total Cost as a % of Market Capitalization | 0.37% | | 0.56% | | – | | 0.45% | |
| | |
| | |
Compensation Elements | 2019 | 2018 | 2017 (1) | Three-Year Total |
Cash |
Base Salary | CA$531,898 | | CA$522,750 | | CA$512,500 | | CA$1,567,148 | |
Short-Term Incentive | CA$189,528 | | CA$115,396 | | CA$118,531 | | CA$423,455 | |
Equity |
Long-Term Incentive | CA$323,449 | | CA$256,251 | | CA$531,256 | | CA$1,110,956 | |
Total Direct Compensation | CA$1,044,875 | | CA$894,397 | | CA$1,162,287 | | CA$3,101,559 | |
Contribution to DPSP | CA$24,156 | | CA$986 | | CA$14,346 | | CA$39,488 | |
All Other Compensation | – | | – | | – | | – | |
Total Compensation | CA$1,069,031 | | CA$895,383 | | CA$1,176,633 | | CA$3,141,047 | |
Annual Average | – | | – | | – | | CA$1,047,016 | |
Total Market Capitalization (CA$ millions) as at August 31 | 268.4 | | 318.0 | | 322.3 | | 302.9 | |
Total Cost as a % of Market Capitalization | 0.40% | | 0.28% | | 0.37% | | 0.35% | |
| | |
| | |
| (1) | Mr. Philippe Morin was nominated CEO on April 1, 2017. |
(2) | Mr. Philippe Morin was nominated COO on November 9, 2015. |
Summary Compensation Table of Named Executive Officers
The table below shows compensation information during the three (3) most recently completed financial years for the NEOs. This information includes, as applicable, the Canadian and US dollar and Euro value of base salaries, share-based and option-based awards, non-equity incentive plan compensations, pension value and all other compensation, if any, whether paid or deferred.
Name and
Principal Position | Financial
Year | Salary (1) (2)
($) | Share-Based
Awards (2) (3)
($) | Option-
Based
Awards
($) | Non-Equity Incentive
Plan Compensation ($) | Pension
Value
($) | All Other
Compensation
($) (2) (5) | Total
Compensation
($) |
Annual
Incentive
Plans (2) (4) | Long-Term
Incentive
Plan |
Germain Lamonde,
Executive Chairman (6) | 2019 | | 367,430 (US)
486,735 (CA) | ─
─ | (US)
(CA) | – | 173,721
230,128 | (US)
(CA) | – | – | – | | 541,151
716,863 | (US)
(CA) |
2018 | | 460,800 (US)
588,350 (CA) | ─
─ | (US)
(CA) | – | 125,940
160,800 | (US)
(CA) | – | – | – | | 586,740
749,150 | (US)
(CA) |
2017 | | 543,067 (US)
717,500 (CA) | ─
─ | (US)
(CA) | – | 199,032
262,962 | (US)
(CA) | – | – | – | | 742,099
980,462 | (US)
(CA) |
Philippe Morin,
CEO (7) | 2019 | | 401,523 (US)
531,898 (CA) | 244,168
323,449 | (US) (CA) | – | 143,072
189,528 | (US)
(CA) | – | – | 18,235
24,156 | (US)
(CA) | 806,998
1,069,031 | (US)
(CA) |
2018 | | 409,422 (US)
522,750 (CA) | 200,698 256,251 | (US) (CA) | – | 90,379
115,396 | (US)
(CA) | – | – | 772
986 | (US)
(CA) | 701,271
895,383 | (US)
(CA) |
2017 | | 387,905 (US)
512,500 (CA) | 402,101
531,256 | (US)
(CA) | – | 89,715
118,531 | (US)
(CA) | – | – | 10,858
14,346 | (US)
(CA) | 890,579
1,176,633 | (US)
(CA) |
Pierre Plamondon,
CFO and Vice President, Finance | 2019 | | 235,129 (US)
311,476 (CA) | 117,856
156,123 | (US)
(CA) | – | 86,330
114,362 | (US)
(CA) | – | – | 10,368
13,734 | (US)
(CA) | 449,683
595,695 | (US)
(CA) |
2018 | | 241,535 (US)
308,392 (CA) | 106,561
136,057 | (US)
(CA) | – | 60,189
76,850 | (US)
(CA) (8) | – | – | 7,833
10,002 | (US)
(CA) | 416,118
531,301 | (US)
(CA) |
2017 | | 228,841 (US)
302,345 (CA) | 100,176
132,352 | (US)
(CA) | – | 46,116
60,928 | (US)
(CA) | – | – | 11,006
14,541 | (US)
(CA) | 386,139
510,166 | (US)
(CA) |
Name and
Principal Position | Financial
Year | Salary (1) (2)
($) | Share-Based
Awards (2) (3)
($) | Option-
Based
Awards
($) | Non-Equity Incentive
Plan Compensation ($) | Pension
Value
($) | All Other
Compensation
($) (2) (5) | Total
Compensation
($) |
Annual
Incentive
Plans (2) (4) | Long-Term
Incentive
Plan |
Germain Lamonde,
Executive
Chairman (6) | 2017 | | 543,067 (US)
717,500 (CA) | ─ (US)
─ (CA) | | – | 199,032 (US)
262,962 (CA) | | – | – | – | | 742,099 (US)
980,462 (CA) | |
2016 | | 527,188 (US)
700,000 (CA) | ─ (US)
─ (CA) | | – | 249,371 (US)
331,115 (CA) | | – | – | – | | 776,559 (US)
1,031,115 (CA) | |
2015 | | 508,833 (US)
615,332 (CA) | ─ (US)
─ (CA) | | – | 83,537 (US)
101,022 (CA) | | – | – | – | | 592,370 (US)
716,354 (CA) | |
Philippe Morin,
CEO (7) | 2017 | | 387,905 (US) (8)
512,500 (CA) | 402,101 (US)
531,256 (CA) | | – | 89,715 (US)
118,531 (CA) | | – | – | 10,858 (US)
14,346 (CA) | | 890,579 (US)
1,176,633 (CA) | |
2016 | | 296,905 (US) (8)
394,231 (CA) | 564,844 (US)
749,999 (CA) | | – | 107,388 (US)
142,589 (CA) | | – | – | 6,879 (US)
9,135 (CA) | | 976,016 (US)
1,295,954 (CA) | |
Pierre Plamondon,
CFO and Vice President, Finance | 2017 | | 228,841 (US)
302,345 (CA) | 100,176 (US)
132,352 (CA) | | – | 46,116 (US)
60,928 (CA) | | – | – | 11,006 (US)
14,541 (CA) | | 386,139 (US)
510,166 (CA) | |
2016 | | 221,502 (US)
294,110 (CA) | 91,220 (US)
121,122 (CA) | | – | 82,291 (US)
109,266 (CA) | | – | – | 9,064 (US)
12,035 (CA) | | 404,077 (US)
536,533 (CA) | |
2015 | | 235,665 (US)
284,990 (CA) | 95,847 (US)
115,907 (CA) | | – | 31,095 (US)
37,603 (CA) | | – | – | 12,212 (US)
14,768 (CA) | | 374,819 (US)
453,268 (CA) | |
Willem Jan te Niet,
Vice President,
Sales — EMEA (9) | 2017 | | 226,587 (US)
299,367 (CA)
206,625 (€) | 66,891 (US)
88,376 (CA)
60,998 (€) | | – | 104,094 (US)
137,529 (CA)
94,923 (€) | | – | – | 7,912 (US)
10,454 (CA)
7,215 (€) | | 405,484 (US)
535,726 (CA)
369,761 (€) | |
2016 | | 9,160 (US) (10) 12,162 (CA)
8,250 (€) | 32,384 (US)
43,000 (CA)
29,168 (€) | | – | – | | – | – | – | | 41,544 (US)
55,162 (CA)
37,418 (€) | |
Dana Yearian,
Vice President,
Sales — Americas | 2017 | | 238,134 (US)
314,623 (CA) | 99,223 (US)
131,094 (CA) | | – | 156,675 (US)
206,999 (CA) | | – | – | 7,049 (US)
9,314 (CA) | | 501,081 (US)
662,030 (CA) | |
2016 | | 233,465 (US)
309,995 (CA) | 97,087 (US)
128,913 (CA) | | – | 181,465 (US)
240,949 (CA) | | – | – | 7,049 (US)
9,360 (CA) | | 519,066 (US)
689,217 (CA) | |
2015 | | 228,439 (US)
276,251 (CA) | 95,369 (US)
115,330 (CA) | | – | 156,372 (US)
189,100 (CA) | | – | – | 7,049 (US)
8,525 (CA) | | 487,229 (US)
589,206 (CA) | |
84
Name and
Principal Position | Financial
Year | Salary (1) (2)
($) | Share-Based
Awards (2) (3)
($) | Option-
Based
Awards
($) | Non-Equity Incentive
Plan Compensation ($) | Pension
Value
($) | All Other
Compensation
($) (2) (5) | Total
Compensation
($) |
Annual
Incentive
Plans (2) (4) | Long-Term
Incentive
Plan |
Willem Jan te Niet,
Vice President, Sales — EMEA | 2019 | | 235,956 (US)
312,571 (CA)
208,019 (€) | 93,559
123,938
82,482 | (US)
(CA)
(€) | – | 140,320
185,882
123,706 | (US)
(CA)
(€) | – | – | 18,877
25,006
16,642 | (US)
(CA)
(€) | 488,712
647,397
430,849 | (US)
(CA)
(€) |
2018 | | 243,191 (US)
310,506 (CA)
203,940 (€) | 80,612
102,925
67,601 | (US)
(CA)
(€) | – | 141,296
180,406
118,491 | (US)
(CA)
(€) | – | – | 19,455
24,841
16,315 | (US)
(CA)
(€) | 484,554
618,678
406,347 | (US)
(CA)
(€) |
2017 | | 226,587 (US)
299,367 (CA)
206,625 (€) | 66,891
88,376
60,998 | (US)
(CA)
(€) | – | 104,094
137,529
94,923 | (US)
(CA)
(€) | – | – | 7,912
10,454
7,215 | (US)
(CA)
(€) | 405,484
535,726
369,761 | (US)
(CA)
(€) |
Dana Yearian,
Vice President, Sales — Americas | 2019 | | 242,897 (US)
321,766 (CA) | 116,133
153,841 | (US)
(CA) | – | 178,484
236,438 | (US)
(CA) | – | – | 8,400
11,127 | (US)
(CA) | 545,914
723,172 | (US)
(CA) |
2018 | | 242,897 (US)
310,131 (CA) | 101,208
129,222 | (US)
(CA) | – | 152,285
194,438 | (US)
(CA) | – | – | 7,667
9,789 | (US)
(CA) | 504,057
643,580 | (US)
(CA) |
2017 | | 238,134 (US)
314,623 (CA) | 99,223
131,094 | (US)
(CA) | – | 156,675
206,999 | (US)
(CA) | – | – | 7,049
9,314 | (US)
(CA) | 501,081
662,030 | (US)
(CA) |
| (1) | Base salary earned in the financial year, regardless when paid. |
| (2) | The compensation information for Canadian residents has been converted from Canadian dollars to US dollars based upon an average foreign exchange rate of CA$ 1.3247 = US$1.00 for the financial year ended August 31, 2019, CA$1.2768 = US$1.00 for the financial year ended August 31, 2018 and CA$1.3212 = US$1.00 for the financial year ended August 31, 2017, CA$1.3278 = US$1.00 for the financial year ended August 31, 2016 and CA$1.2093 = US$1.00 for the financial year ended August 31, 2015.2017. The compensation information for the Netherlands resident has been converted from Euros to US dollars based upon an average foreign exchange rate of €0.8816 = US$1.00 for the financial year ended August 31, 2019, €0.8386 = US$1.00 for the financial year ended August 31, 2018 and €0.9119 = US$1.00 for the financial year ended August 31, 2017 and €0.9007 = US$1.00 for the financial year ended August 31, 2016 and the conversion from US dollars to Canadian dollars is made as described above. |
| (3) | Indicates the dollar amount based on the grant date fair value of the RSUs awarded under the LTIP for the financial year. The fair value at the time of grant of a RSU is equal to the market value of Subordinate Voting Shares at the time RSUs are granted. The grant date fairmarket value is equal to the highest of the closing prices of the Subordinate Voting Shares on the Toronto Stock Exchange and the NASDAQ Global Select Market on the last trading day preceding the grant date, using the noon buying rate of the Bank of Canada from September 1, 2016 to January 31, 2017 and the daily exchange rate of the Bank of Canada since February 1, 2017 on the last trading day preceding the grant date to convert either the NASDAQ Global Select Market closing price to Canadian dollars or the Toronto Stock Exchange closing price to United States dollars.dollars as required. Grants of RSUs to NEOs are detailed under section "Compensation“Compensation Discussion and Analysis – Long-Term Incentive Plan"Plan”. |
| (4) | Indicates the total bonus earned during the financial year whether paid during the financial year or payable on a later date: |
| | Name | Paid during the
Financial Year Ended
August 31, 20172019 (i)
($) | Paid in the First Quarter
of the Financial Year
Ending on August 31, 20182020 (i)
($) | Total Bonus Earned during
the Financial Year
Ended August 31, 20172019 (i)
($) |
| | Germain Lamonde | ‒ –
–
| (US)
‒ (CA) | 173,721
230,128 | 199,032 (US)
262,962 (CA)
| 173,721
230,128 | 199,032 (US)
262,962 (CA)
| |
| | Philippe Morin | ‒ –
–
| (US)
‒ (CA) | 143,072
189,528 | 89,715 (US)
118,531 (CA)
| 143,072
189,528 | 89,715 (US)
118,531 (CA)
| |
| | Pierre Plamondon | ‒ –
–
| (US)
‒ (CA) | 86,330
114,362 | 46,116 (US)
60,928 (CA)
| 86,330
114,362 | 46,116 (US)
60,928 (CA)
| |
| | Willem Jan te Niet | 61,371 85,619
113,419
75,482
| (US)
81,084 (CA)
55,964 (€) | 54,701
72,463
48,224 | 42,723 (US)
56,445 (CA)
38,959 (€)
| 140,320
185,882
123,706 | 104,094 (US)
137,529 (CA)
94,923 (€)
| |
| | Dana Yearian | 92,480 109,973
145,681
| (US)
122,185 (CA) | 68,511
90,757 | 64,195 (US)
84,814 (CA)
| 178,484
236,438 | 156,675 (US)
206,999 (CA)
| |
| (i) | Refer to note 2 above. |
| (5) | Indicates the amount contributed by the Corporation during the financial year to the DPSP as detailed under section "Compensation“Compensation Discussion and Analysis – Deferred Profit-Sharing Plan"Plan”, the 401K plan as detailed under section "Compensation“Compensation Discussion and Analysis – 401K plan"plan”, as applicable, for the benefit of the NEOs. Mr. Lamonde is not eligible to participate in the DPSP. |
| (6) | Mr. Lamonde stepped down as CEO as of April 1, 2017 and was nominated Executive Chairman of the Corporation. |
| (7) | Mr. Morin was promoted from Chief Operating Officer of the Corporation to CEO of the Corporation as of April 1, 2017. He joined the Corporation as COO on November 9, 2015. |
| (8) | This amount represents the salary paid to Mr. Philippe Morin from November 9, 2015 to August 31, 2016 which is based on an annual salaryIncluding a discretionary bonus of US$376,563 (CA$500,000) for the financial year ended August 31, 2016.CA$10,000 (US$7,832). |
(9) | Mr. Willem Jan te Niet joined the Corporation as Vice President, Sales — EMEA on August 15, 2016.
|
(10) | This amount represents the salary paid to Mr. te Niet from August 15, 2016 to August 31, 2016 which is based on an annual salary of €198,000 (US$219,829, CA$291,889) for the financial year ended August 31, 2016. |
Incentive Plan Awards
The significant terms of all plan-based awards and non-equity incentive plan awards, issued or vested, or under which options have been exercised, during the financial year, or outstanding at the end of the financial year are described herein under the section entitled "Compensation“Compensation Discussion and Analysis – Long-Term Incentive Plan"Plan” and "Compensation“Compensation Discussion and Analysis – Short Term Incentive Compensation"Compensation”.
Outstanding Share-Based Awards and Option-Based Awards
The following sets out for each NEO all option, PSUs and RSU awards outstanding as at August 31, 2017,2019, if any, including those granted before August 31, 2017.2019.
Name | Outstanding Option-Based Awards (Options) | Outstanding Share-Based Awards (RSUs) |
Number of
Securities
Underlying
Unexercised
Options
(#) | Option
Exercise
Price | Option
Expiration
Date | Value of
Unexercised
"in-the-money"
Options | Number of
Shares
or Units of
Shares
that Have Not
Vested (#) | Market or
Payout Value of
Share-Based
Awards that
Have Not Vested
(US$) (1) | Market or
Payout Value of
Vested Share-
Based Awards
Not Paid Out or
Distributed
(US$) |
Germain Lamonde | – | – | – | – | – | | – | | – |
Philippe Morin | – | – | – | – | 255,238 | | 1,199,619 | | – |
Pierre Plamondon | – | – | – | – | 121,516 | | 571,125 | | – |
Willem Jan te Niet | – | – | – | – | 26,681 | | 125,401 | | – |
Dana Yearian | – | – | – | – | 116,178 | | 546,037 | | – |
Name | Outstanding Option-Based Awards (Options) | Outstanding Share-Based Awards (PSUs or RSUs) |
Number of
Securities
Underlying
Unexercised
Options
(#) | Option
Exercise
Price | Option
Expiration
Date | Value of
Unexercised
“in-the-money”
Options | Number of
Shares
or Units of
Shares
that Have Not
Vested (#) | Market or
Payout Value of
Share-Based
Awards that
Have Not Vested
(US$) (1) | Market or
Payout Value of
Vested Share-
Based Awards
Not Paid Out or
Distributed
(US$) |
Germain Lamonde | – | – | – | – | – | | – | | – |
Philippe Morin | – | – | – | – | 327,039 | | 1,193,692 | | – |
Pierre Plamondon | – | – | – | – | 143,945 | | 525,399 | | – |
Willem Jan te Niet | – | – | – | – | 71,348 | | 260,420 | | – |
Dana Yearian | – | – | – | – | 139,346 | | 508,613 | | – |
| | | | | | | | | | |
| | | | | | | | | | |
| (1) | The value of unvested PSUs or RSUs at the financial year-end is the market value of the Subordinate Voting Shares on August 31, 2017,2019, which was US$4.703.65 (CA$5.89)4.85). The market value of the Subordinate Voting Shares was calculated by using the highest of the closing prices of the Subordinate Voting Shares on the Toronto Stock Exchange and on the NASDAQ Global Select Market on August 31, 201730, 2019 using the daily exchange rate of the Bank of Canada to convert either the NASDAQ Global Select Market closing price to Canadian dollars or the Toronto Stock Exchange closing price to United States dollars as required. The actual gains on vesting will depend on the value of the Subordinate Voting Shares on the date of vesting. There can be no assurance that these values will be realized. |
Exercised Option-Based Awards
No option-based awards of the Corporation were held during the financial year ended August 31, 20172019 by the NEOs.
Incentive Plan Awards – Value Vested or Earned during the Year
The following table summarizes, for each of the NEOs, the value of share-based awards vested during the financial year ended August 31, 2017,2019, if any, and the value of non-equity incentive plan compensation earned during the financial year ended August 31, 2017,2019, if any.
Name | Share-Based Awards – Value
Vested during the Year (US$) (1) | Non-Equity Incentive Plan Compensation –
Value Earned during the Year (US$) (2) |
Germain Lamonde | 247,698 | | 199,032 | |
Philippe Morin | ‒ | | 89,715 | |
Pierre Plamondon | 68,380 | | 46,116 | |
Willem Jan te Niet | ‒ | | 104,094 | |
Dana Yearian | 71,384 | | 156,675 | |
| | |
| | |
Name | Share-Based Awards – Value
Vested during the Year (US$) (1) | Non-Equity Incentive Plan Compensation –
Value Earned during the Year (US$) (2) |
Germain Lamonde | – | | 173,721 | |
Philippe Morin | 171,020 | | 143,072 | |
Pierre Plamondon | 66,009 | | 86,330 | |
Willem Jan te Niet | 32,775 | | 140,320 | |
Dana Yearian | 60,382 | | 178,484 | |
| | |
| | |
| (1) | The aggregate dollar value realized is equivalent to the market value of the Subordinate Voting Shares underlying the PSUs or RSUs at vesting. This value, as the case may be, has been converted from Canadian dollars to US dollars based upon the daily exchange rate of the Bank of Canada on the day of vesting. |
| (2) | Includes total non-equity incentive plan compensation earned by each NEO in respect to the financial year ended on August 31, 20172019 (as indicated under the "Summary“Summary Compensation Table"Table”). |
Pension Plan Benefits
The Corporation does not have a defined benefit pension plan. The significant terms of the DPSP and the 401K plan of the Corporation are described herein under the sections entitled "Compensation“Compensation Discussion and Analysis – Deferred Profit-Sharing Plan"Plan” and "Compensation“Compensation Discussion and Analysis – 401K plan"plan”. The amounts paid by the Corporation to the NEOs under such plans are detailed in the column entitled "All“All other compensation"compensation” in the "Summary“Summary Compensation Table"Table”.
Termination and Change of Control Benefits
The Corporation has an employment agreement with Mr. Germain Lamonde, the Corporation'sCorporation’s Executive Chairman. The agreement is for an indeterminate period and compensation is reviewed annually. In the event of the termination of Mr. Lamonde'sLamonde’s employment without cause, Mr. Lamonde will be entitled to a severance payment equal to twenty-four (24) months of his current rate of remuneration (base salary, STIP compensation and benefits) and the immediate vesting of all stock options, PSUs and RSUs.RSUs if any. In addition, in the event that Mr. Lamonde'sLamonde’s employment is terminated following a merger or an acquisition by a third party of substantially all of the Corporation'sCorporation’s assets or of the majority of its share capital (“Change of Control”), he will be entitled to a severance payment equal to twenty-four (24) months of his current rate of remuneration (base salary, STIP compensation and benefits) and to the immediate vesting of all stock options, PSUs and RSUs.RSUs if any. If Mr. Lamonde voluntarily resigns, he will be entitled to immediate vesting of all stock options, PSUs and RSUs.
The Corporation has an employment agreement with Mr. Philippe Morin, the Corporation'sCorporation’s Chief Executive Officer. The agreement is for an indeterminate period and compensation is reviewed annually. In the event of termination of Mr. Morin'sMorin’s employment without cause, Mr. Morin will be entitled to a severance payment equal to twelve (12) months of his current base salary.salary and to the immediate vesting, to a certain proportion as determined by the LTIP, of PSUs and RSUs if any. In addition, in the event Mr. Morin'sMorin’s employment is terminated following a merger or an acquisition by a third partyChange of substantially all of the Corporation's assets or of the majority of its share capital,Control, he will be entitled to a severance payment equal to twelve (12) months of his current base salary and to the immediate vesting of all stock options, PSUs and RSUs.
RSUs if any.
The Corporation has an employment agreement with Mr. Pierre Plamondon, the Corporation'sCorporation’s CFO and Vice President, Finance. The agreement is for an indeterminate period and compensation is reviewed annually. In the event of termination of Mr. Plamondon'sPlamondon’s employment without cause, Mr. Plamondon will be entitled to a severance payment equal to twelve (12) months of his current base salary.salary and to the immediate vesting, to a certain proportion as determined by the LTIP, of PSUs and RSUs if any. In addition, in the event Mr. Plamondon'sPlamondon’s employment is terminated following a merger or an acquisition by a third partyChange of substantially all of the Corporation's assets or of the majority of its share capital,Control, he will be entitled to a severance payment equal to eighteen (18) months of his current rate of remuneration (base salary, STIP compensation and benefits) and to the immediate vesting of all stock options, PSUs and RSUs.RSUs if any.
The Corporation has an employment agreement with Mr. Willem Jan te Niet, the Corporation's Vice-President,Corporation’s Vice President, Sales — EMEA. The agreement is for an indeterminate period and compensation is reviewed annually. In the event of termination of Mr. te Niet'sNiet’s employment without cause, Mr. te Niet will be entitled to severance payments equal to one (1) month per year of service as a Vice-PresidentVice President of the Corporation with a minimum of six (6) months but in no case exceeding twelve (12) months of his current base salary.salary and to the immediate vesting, to a certain proportion as determined by the LTIP, of PSUs and RSUs if any. In addition, in the event Mr. te Niet'sNiet’s employment is terminated following a merger or an acquisition by a third partyChange of substantially all of the Corporation's assets or of the majority of its share capital,Control, he will be entitled to severance payments equal to one (1) month per year of service as a Vice-PresidentVice President of the Corporation with a minimum of six (6) months but in no case exceeding twelve (12) months of his current rate of remuneration (base salary, SIP compensation and benefits) and to the immediate vesting of all RSUs.stock options, PSUs and RSUs if any.
The Corporation has an employment agreement with Mr. Dana Yearian, the Corporation'sCorporation’s Vice President, Sales — Americas. The agreement is for an indeterminate period and compensation is reviewed annually. In the event of termination of Mr. Yearian'sYearian’s employment without cause, Mr. Yearian will be entitled to a severance payment equal to twelve (12) months of his current base salary.salary and to the immediate vesting, to a certain proportion as determined by the LTIP, of PSUs and RSUs if any. In addition, in the event Mr. Yearian'sYearian’s employment is terminated following a merger or an acquisition by a third partyChange of substantially all of the Corporation's assets or of the majority of its share capital,Control, he will be entitled to a severance payment equal to eighteen (18) months of his current rate of remuneration (base salary, SIP compensation and benefits) and to the immediate vesting of all stock options, PSUs and RSUs.RSUs if any.
The following table outlines the estimated incremental payments NEOs would be entitled to receive if a termination payment event occurred on August 31, 2017,2019, which includes all payments, payables and benefits that would be given by the Corporation to a NEO upon such termination payment event.
Named Executive Officer | Termination Payment Event |
Without Cause ($) (1) (2) | Change of Control ($) (2) (3) (4) | Voluntary ($) |
Germain Lamonde | 1,672,966 986,740
1,295,070
| (US) (4)
(CA) | 986,740
1,295,070 | (US)
2,097,230 (CA) | 0 | (5) | 1,672,966 (US)
2,097,230 (CA)
| | 0
| (6)
|
Philippe Morin(6) | 837,045 1,094,815
1,453,122
| (US)
1,049,144 (CA) | 1,595,215
2,118,037 | 1,608,442 (US)
2,015,852 (CA)
| | – | |
Pierre Plamondon(6) | 550,685 535,834
711,043
| (US)
690,213 (CA) | 968,376
1,280,622 | 1,063,640 (US)
1,333,146 (CA)
| | – | |
Willem Jan te Niet(6) | 164,517 284,405
377,188
250,731
| (US)
206,228 (CA)
139,115 (€) | 437,387
580,466
385,600 | 261,991 (US)
328,381 (CA)
221,538 (€)
| | – | |
Dana Yearian(6) | 527,739 534,616
709,393
| (US)
661,445 (CA) | 1,101,386
1,450,134 | 1,175,436 (US)
1,473,303 (CA)
| | – | |
| (1) | The aggregate amount disclosed includes an evaluation of the amount that the NEO would have been entitled to should a termination of employment without cause have occurred on August 31, 20172019 and includes, as the case may be for each NEO, the base salary that would have been received and total value of PSUs, RSUs and options that would have vested (with the exception of Mr. Lamonde'sLamonde’s evaluation which is described in note 6 below and includes: the base salary, STIP compensation, and total value of PSUs, RSUs and options that would have vested). The amount for base salary compensation is calculated according to those amounts provided under the section entitled "Summary“Summary Compensation Table"Table” included in this Annual Report. The amount for the total value attached to the vesting of PSUs, RSUs and options determined pursuant to the LTIP as described in the section entitled "Long-Term“Long-Term Incentive Compensation – Long-Term Incentive Plan"Plan” for termination without cause. |
| (2) | The aggregate amount for Canadian residents has been converted from Canadian dollars to US dollars based upon a foreign exchange rate of CA$1.25361.3247 = US$1.00 as of August 31, 2017.2019. The aggregate amount for Netherlands resident has been converted from Euros to US dollars based upon a foreign exchange rate of €0.8456€0.8816 = US$1.00 as of August 31, 2017.2019. |
| (3) | "Change of Control" is defined as a merger or an acquisition by a third party of substantially all of the Corporation's assets or of the majority of its share capital. |
(4) | The aggregate amount disclosed includes, as the case may be for each NEO, an evaluation of the amount that the NEO would have been entitled to should a termination of employment for Change of Control have occurred on August 31, 20172019 and includes, as the case may be, namely, the base salary, STIP or SIP compensation and total value of PSUs, RSUs and options that would have vested. The amount for base salary and STIP or SIP compensation are calculated according to those amounts provided under the section entitled "Summary“Summary Compensation Table"Table” included in this Annual Report, the total value attached to the vesting of PSUs, RSUs and options is calculated according to those amounts provided in the columns named "Value“Value of unexercised "in-the-money" options"“in-the-money” options” and "Market“Market or payout value of share-based awards that have not vested"vested” of the table included under the heading entitled "Outstanding“Outstanding share-based awards and option-based awards"awards”. |
(5)(4) | The aggregate amount disclosed includes an evaluation of the amount that Mr. Lamonde would have been entitled to should a termination of employment without cause have occurred on August 31, 20172019 and includes: the base salary, STIP compensation, and total value of PSUs, RSUs and options that would have vested. The amount for base salary and STIP compensation are calculated according to those amounts provided under the section entitled "Summary“Summary Compensation Table"Table” included in this Annual Report; the total value attached to the vesting of PSUs or RSUs and options are calculated according to those amounts provided in the columns named "Value“Value of unexercised "in-the-money" options"“in-the-money” options” and "Market“Market or payout value of share-based awards that have not vested"vested” of the table included under the heading entitled – "Outstanding“Outstanding share-based awards and option-based awards"awards”. |
(6)(5) | Mr. Lamonde did not hold any PSUs, RSUs or options on August 31, 2017.2019. |
| (6) | None of these NEOs held any PSUs or options on August 31, 2019. |
Compensation of Directors
Director Compensation Table
In the financial year ended August 31, 2014, the decision was made to increase the Annual Retainer and eliminate the attendance fees and each Director who was not an employee of the Corporation or any of its subsidiaries received an Annual Retainer as set forth in the following table, payable in a combination of cash and DSUs as chosen by the director pursuant to the DSU Plan. Since June 2017 pursuant to our internal policy, our Directors have the obligation to elect to receive at least seventy-five (75%) of their Annual Retainer in form of DSUs until their cumulative Annual Retainers equal or exceed three (3) times the sum of: i) the Annual Retainer for Directors; ii) the Annual Retainer for Audit Committee Members; and iii) the Annual Retainer for Human Resources Committee Members. The significant terms of the DSU Plan are described herein under the section entitled "Long-Term“Long-Term Incentive Compensation – Deferred Share Unit Plan"Plan”.
| | From September 1, 20162018
to February 28, 2017 | From March 1, 2017
to August 31, 20172019
|
Annual Retainer for Directors (1) | CA$57,00070,000 | (2) | US$43,143 | (2)52,842
| CA$63,500
| (3) | US$48,062
| (4)
|
Annual Retainer for Lead Director | CA$8,00010,000 | | US$6,055 | | CA$9,000
| | US$6,8127,549
| (4)(3) |
Annual Retainer for Audit Committee Chairman | CA$8,00012,000 | | US$6,055 | | CA$10,000
| | US$7,5699,059
| (4)(3) |
Annual Retainer for Audit Committee Members | CA$4,0004,500 | (4) | US$3,028 | | CA$4,250
| | US$3,2173,397
| (5)(3) |
Annual Retainer for Human Resources Committee Chairman | CA$6,0007,000 | | US$4,541 | | CA$6,500
| | US$4,9205,284
| (4)(3) |
Annual Retainer for Human Resources Committee Members | CA$3,0004,500 | (4) | US$2,271 | | CA$3,750
| | US$2,8383,397
| (5)(3) |
| | |
| | |
| (1) | All the Directors elected to receive 100% of their Annual Retainer for Directors in form of DSUs except Mr. Pierre-Paul Allard who elected to receive 50% of his Annual Retainer in form of DSUs and Mr. François Côté, Ms. Angela Logothetis and Mr. Claude Seguin who elected to receive 50% of their Annual Retainer in form of DSUs until March 1, 2017 and Mr. François Côté who elected to receive 75% of his Annual Retainer in form of DSUs starting March 1, 2017.DSUs. |
| (2) | The Annual Retainer for Mr. Pierre-Paul Allard,François Côté and Mr. Claude Séguin is CA$70,000 (US$52,842). The Annual Retainer for Ms. Angela Logothetis and Mr. Randy E. Tornes is US$57,00070,000 (CA$75,308)92,729). |
| (3) | The Annual Retainer for Mr. Pierre-Paul Allard, Ms. Angela Logothetis and Mr. Randy E. Tornes is US$63,500 (CA$83,896). |
(4) | The compensation information has been converted from Canadian dollars to US dollars based upon an average foreign exchange rate of CA$1.32121.3247 = US$1.00 for the financial year ended August 31, 2017.2019. |
(5)(4) | The Annual Retainer for Audit Committee Members and Human Resources Committee Members is CA$4,2504,500 (US$3,397) for Mr. François Côté and Mr. Claude Séguin and US$4,2504,500 (CA$5,615)5,961) for Mr. Pierre-Paul Allard, Ms. Angela Logothetis and Mr. Randy Tornes since March 2017. The Annual Retainer for Human Resources Committee Members is CA$3,750 for Mr. François Côté and Mr. Claude Séguin and US$3,750 (CA$4,955) for Mr. Pierre-Paul Allard, Ms. Angela Logothetis and Mr. Randy Tornes since March 2017.Tornes. |
In the financial year ended August 31, 2017,2019, the Directors who were not employees of the Corporation earned the following compensation:
Name | Fees
Earned (1)
($) | Share-Based
Awards
($) | Option-
Based
Awards
($) | Non-Equity
Incentive Plan
Compensation
($) | Pension
Value
($) | All Other
Compensation
($) | Total
($) |
Pierre-Paul Allard | 62,899 (US)
83,102 (CA) | – | – | – | – | – | 62,899 (US)
83,102 (CA) |
François Côté | 59,889 (US)
79,125 (CA) | – | – | – | – | – | 59,889 (US)
79,125 (CA) |
Darryl Edwards | 17,627 (US)
23,289 (CA) | – | – | – | – | – | 17,627 (US)
23,289 (CA) |
Angela Logothetis | 42,343 (US)
55,944 (CA) | – | – | – | – | – | 42,343 (US)
55,944 (CA) |
Claude Séguin | 54,969 (US)
72,625 (CA) | – | – | – | – | – | 54,969 (US)
72,625 (CA) |
Randy E. Tornes | 66,899 (US)
88,387 (CA) | – | – | – | – | – | 66,899 (US)
88,387 (CA) |
Name | Fees
Earned (1)
($) | Share-Based
Awards
($) | Option-
Based
Awards
($) | Non-Equity
Incentive Plan
Compensation
($) | Pension
Value
($) | All Other
Compensation
($) | Total
($) |
François Côté | 69,073
91,500 | (US)
(CA) | – | – | – | – | – | 69,073
91,500 | (US)
(CA) |
Angela Logothetis | 79,000
104,651 | (US)
(CA) | – | – | – | – | – | 79,000
104,651 | (US)
(CA) |
Claude Séguin | 65,298
86,500 | (US)
(CA) | – | – | – | – | – | 65,298
86,500 | (US)
(CA) |
Randy E. Tornes | 79,000
104,651 | (US)
(CA) | – | – | – | – | – | 79,000
104,651 | (US)
(CA) |
| | |
| | |
| (1) | The compensation information has been converted from Canadian dollars to US dollars based upon an average foreign exchange rate of CA$1.32121.3247 = US$1.00 for the financial year ended August 31, 20172019 except for compensation amounts paid to Mr. Pierre-Paul AllardMs. Angela Logothetis and Mr. Randy E. Tornes which were paid in US dollars fordollars. Subject to our internal policy, the portion of their annual retainer for Directors. Since March 1st, 2017, the compensation amounts paid to Mr. Pierre-Paul Allard, Ms. Angela Logothetis and Mr. Randy E. Tornes were paid in US dollars. The fees are always payable in cash, but executives are provided the opportunity to elect to exchange all or a portion of their Annual Retainer for Directors into DSUs. The following table identifies the portion of the fees earned by the directors that were paid in DSUs and the portion that were paid in cash. |
| | Name | Fees Earned |
| | DSUs ($) (i) | Cash ($) | Total ($) |
| | Pierre-Paul Allard François Côté
| 39,632
52,500 | (ii) (US)
(CA)
| 30,125 29,441
39,000
| (US)
39,801 (CA) | 69,073
91,500 | 32,774 (US)
43,301 (CA)
| | 62,899 (US)
83,102 (CA)
| |
| | François Côté Angela Logothetis
| 79,000
104,651 | (iii) (US)
(CA)
| 31,080 –
–
| (US)
41,063 (CA) | 79,000
104,651 | 28,809 (US)
38,062 (CA)
| | 59,889 (US)
79,125 (CA)
| |
| | Darryl Edwards Claude Séguin
| 65,298
86,500 | (ii) (US)
(CA)
| 7,850 –
–
| (US)
10,371 (CA) | 65,298
86,500 | 9,777 (US)
12,918 (CA)
| | 17,627 (US)
23,289 (CA)
| |
| | Angela Logothetis Randy E. Tornes
| 70,000
92,729 | (iv) (US)
(CA)
| 38,686 (US)9,000
51,112 (CA)11,922
| | 3,657 (US)
4,832 (CA)
| | 42,343 (US)
55,944 (CA)
| |
| Claude Séguin (iv)
| 35,550 (US)79,000
46,969 (CA)
| | 19,419 (US)
25,656 (CA)
| | 54,969 (US)
72,625 (CA)
| |
| Randy E. Tornes (v)104,651
| 60,250 (US)
79,602 (CA)
|
| | 6,649 (US)
8,785 (CA)
| | 66,899 (US)
88,387 (CA)
| |
| (i) | The estimated value at the time of grant of a DSU is determined based on the highest of the closing prices of the Subordinate Voting Shares on the Toronto Stock Exchange and the NASDAQ Global Select Market on the last trading day preceding the grant date, using the noon buying rate of the Bank of Canada from September 1, 2016 to January 31, 2017 and the daily exchange rate of the Bank of Canada since February 1, 2017on the last trading day preceding the grant date to convert either the NASDAQ Global Select Market closing price to Canadian dollars or the Toronto Stock Exchange closing price to United States dollars, as required. The value at vesting of a DSU is equivalent to the market value of a Subordinate Voting Share when a DSU is converted to such Subordinate Voting Share. |
(ii) | Elected to receive 50% of his Annual Retainer for Directors in form of DSUs. |
(iii) | Elected to receive, until March 1, 2017, 50% and, thereafter, 75% of his Annual Retainer for Directors in form of DSUs. |
(iv) | Elected to receive, until March 1, 2017, 50% and, thereafter, 100% of his Annual Retainer for Directors in form of DSUs. |
(v) | Elected to receive 100% his Annual Retainer for Directors in form of DSUs. |
Director Incentive Plan Awards
The significant terms of all plan-based awards and non-equity-incentive plan awards, issued or vested, or under which options have been exercised, during the year, or outstanding at the end of the financial year are described herein under section entitled "Compensation“Compensation Discussion and Analysis – Long-Term Incentive Plan"Plan”.
Outstanding Share-Based Awards and Option-Based Awards
The following table sets out for each Director of the Corporation all awards outstanding as at August 31, 2017,2019, if any, including awards granted before August 31, 2017.2019.
Name | Name | Outstanding Share-Based Awards (DSUs) | Name | Outstanding Share-Based Awards (DSUs) |
Number of Shares or Units of
Shares that Have Not Vested
(#) | Market or Payout Value of
Share-Based Awards that
Have Not Vested
(US$) (1) | Market or Payout Value of
Vested Share-Based Awards
Not Paid Out or Distributed
(US$) | Number of Shares or Units of
Shares that Have Not Vested
(#) | Market or Payout Value of
Share-Based Awards that
Have Not Vested
(US$) (1) | Market or Payout Value of
Vested Share-Based Awards
Not Paid Out or Distributed
(US$) |
Pierre-Paul Allard | 55,452 | | 260,624 | | ‒ | |
François Côté | François Côté | 17,730 | | 83,331 | | – | François Côté | 38,582 | | 140,824 | | – |
Angela Logothetis | Angela Logothetis | 8,639 | | 40,603 | | – | Angela Logothetis | 49,714 | | 181,456 | | – |
Claude Séguin | Claude Séguin | 29,855 | | 140,319 | | – | Claude Séguin | 64,211 | | 234,370 | | – |
Randy E. Tornes | Randy E. Tornes | 62,603 | | 294,234 | | – | Randy E. Tornes | 99,000 | | 361,350 | | – |
| | | |
| | | |
| (1) | The value of unvested DSUs at the financial year-end is the market value of the Subordinate Voting Shares on August 31, 2017,30, 2019, which was US$4.703.65 (CA$5.89)4.85). The market value of the Subordinate Voting Shares was calculated by using the highest of the closing prices of the Subordinate Voting Shares on the Toronto Stock Exchange and on the NASDAQ Global Select Market on August 31, 201730, 2019 using the daily exchange rate of the Bank of Canada to convert either the NASDAQ Global Select Market closing price to Canadian dollars or the Toronto Stock Exchange closing price to United States dollars as required. The actual gains on vesting will depend on the value of the Subordinate Voting Shares on the date of vesting. There can be no assurance that these values will be realized. |
No Director holds outstanding option-based awards of the Corporation as at August 31, 2017. On January 23, 2017 and March 24, 2017, Mr. Darryl Edwards converted 29,456 DSUs and 450 DSUs respectively into 29,906 Subordinate Voting Shares of the Corporation.
Exercised Share-Based Awards
In the financial year that ended August 31, 2017,2019, none of the DSUs of Directors vested with the exception of Mr. Darryl Edwards, a former Director, as detailed below and the Directors did not receive any non-equity incentive compensation from the Corporation.
The following table summarizes information about DSUs converted and paid in Subordinate Voting Shares when a Director ceased to be a member of the Board as at November 1, 2017:
Name | Number of DSUs Converted | Aggregate Value Realized (US$) (1) |
Darryl Edwards (2) | 29,456 | | 147,380 | |
Darryl Edwards (2) | 450 | | 2,631 | |
| | |
| | |
(1) | The aggregate value realized is equivalent to the market value of the securities underlying the DSUs at conversion. |
(2) | Mr. Edwards ceased to be a member of the Board of Directors as of January 10, 2017.
|
Securities Authorized for Issuance under Equity Compensation Plans
The following table sets forth the number of Subordinate Voting Shares of the Corporation issued and outstanding as at August 31, 2017,2019, or that may be issued, under the Corporation'sCorporation’s LTIP and DSU Plan, both of which were approved by the Corporation'sCorporation’s shareholders.
Plan Category | Plan Category | Number of Securities to Be
Issued upon Exercise of
Outstanding Options,
RSUs and DSUs (#)
(a) | Weighted-Average Exercise
Price of Outstanding Options,
RSUs and DSUs (US$)
(b) | Number of Securities Remaining
Available for Future Issuance under
Equity Compensation Plans (Excluding
Securities Reflected in Column (a)) (#)
(c) | Plan Category | Number of Securities to Be
Issued upon Exercise of
Outstanding DSUs, Options,
PSU and RSUs (#)
(a) | Weighted-Average Exercise
Price of Outstanding DSUs,
Options, PSU and RSUs (US$)
(b) | Number of Securities Remaining
Available for Future Issuance under
Equity Compensation Plans (Excluding
Securities Reflected in Column (a)) (#)
(c) |
DSU Plan – DSUs | | DSU Plan – DSUs | 251,507 | | n/a (1) | | 4,898,130 |
LTIP – Options | | LTIP – Options | – | | – | |
LTIP - PSUs | | LTIP - PSUs | – | | – | |
LTIP – RSUs | LTIP – RSUs | 1,611,330 | | n/a (1) | | 435,024(2) | LTIP – RSUs | 1,836,446 | | n/a (1) | |
LTIP – Options | – | | – | | |
DSU Plan – DSUs | 174,279 | | n/a (1) | | |
| | | |
| | | |
| (1) | The value of RSUsDSUs, PSUs and DSUsRSUs will be equal to the market value of the Subordinate Voting Shares of the Corporation on the date of vesting. |
(2) | Following the approval of the proposed increase of the aggregate number of Subordinate Voting Shares reserved for issuance under the LTIP and DSU Plan, the number of securities remaining available for future issuance under such plans would be 5,702,101. See "Amendments to the Long-Term Incentive Plan and the Deferred Share Unit Plan - Increase in Shares Reserved for Issuance". |
Annual Burn Rate
In accordance with the requirements of section 613 of the TSX Company Manual the following table sets out the burn rate of the awards granted under the Corporation’s security-based compensation arrangements as of the end of the financial years ended August 31, 2019, August 31, 2018 and August 31, 2017. As at November 1, 2019 the only security-based compensation arrangements are the LTIP and the DSU Plan. The table below sets out the burn rate for such security-based compensation arrangements. The burn rate is calculated by dividing the number of DSUs, options, PSUs or RSUs, as applicable, granted under the respective plans during the relevant fiscal year by the weighted average number of securities outstanding for the applicable fiscal year:
| | Year ended
August 31, 2019 | Year ended
August 31, 2018 | Year ended
August 31, 2017 |
Number of DSUs granted | 69,818 | | 65,745 | | 45,058 | |
Number of Options granted | – | | – | | – | |
Number of PSUs granted | – | | – | | – | |
Number of RSUs granted | 632,931 | | 420,621 | | 527,143 | |
Weighted average number of securities outstanding for the applicable year | 55,325,000 | | 54,998,000 | | 54,423,000 | |
Annual burn rate of the DSUs | 0.1% | | 0.1% | | 0.1% | |
Annual burn rate of Options | – | | – | | – | |
Annual burn rate of PSUs | – | | – | | – | |
Annual burn rate of RSUs | 1.1% | | 0.8% | | 1.0% | |
PERFORMANCE GRAPH
The below line graph of the next page compares the cumulative total shareholder return of the Corporation'sCorporation’s Subordinate Voting Shares with the cumulative shareholder return of the S&P/TSX Composite Index for the last five (5) financial years ended August 31, 2017.2019. It assumes that the initial value of the investment in the Corporation'sCorporation’s Subordinate Voting Shares and in the S&P/TSX Composite Index was CA$100 on September 1, 2012.2014. The bar chart below illustrates the trend in total compensation paid to the NEOs in office during such periods; the Executive Chairman, CEO and CFO are included in each period but the other named executive officers changed from one period to another. For further information about the identity and compensation of the NEOs, please refer to our previous five (5) Annual Reports and this Annual Report under the section "Summary“Summary Compensation Table"Table”.
The Corporation’s Stock Performance
(September 1, 2014 to August 31, 2019)
The Corporation's Stock Performance
(September 1, 2012 to August 31, 2017)
| | | August 31, | |
| | | 2014 | | | 2015 | | | 2016 | | | 2017 | | | 2018 | | | 2019 | |
EXFO Subordinate Voting Shares (CA$) | | $ | 100 | | | $ | 84 | | | $ | 89 | | | $ | 121 | | | $ | 120 | | | $ | 101 | |
S&P/TSX Composite Index (CA$) | | $ | 100 | | | $ | 89 | | | $ | 93 | | | $ | 97 | | | $ | 104 | | | $ | 105 | |
NEOs’ total compensation (in millions of CA$) | | $ | 2.6 | | | $ | 2.6 | | | $ | 4.1 | | | $ | 3.9 | | | $ | 3.4 | | | $ | 3.8 | |
| | | August 31, | |
| | | 2012 | | | 2013 | | | 2014 | | | 2015 | | | 2016 | | | 2017 | |
| EXFO Subordinate Voting Shares (CA$) | | $ | 100 | | | $ | 99 | | | $ | 98 | | | $ | 84 | | | $ | 89 | | | $ | 120 | |
| S&P/TSX Composite Index (CA$) | | $ | 100 | | | $ | 106 | | | $ | 131 | | | $ | 116 | | | $ | 122 | | | $ | 127 | |
| NEOs' total compensation (in millions of CA$) | | $ | 2.5 | | | $ | 2.3 | | | $ | 2.6 | | | $ | 2.6 | | | $ | 4.1 | | | $ | 3.9 | |
The line graph reflects that EXFO underperformed the S&P/TSX Composite Index betweenin fiscal years 20132015, 2018 and 2015,2019, but performed relatively better in 2016 and particularly in 2017. Consequently, EXFO narrowedAt the end of the five-year measurement period, the performance gap between EXFO and the S&P/TSX Composite Index and itself at the end of the five-year period.was relatively small. Total shareholder return for the Corporation remained relatively stable in 2013 and 2014, dropped in 2015, and recovered in 2016 and especiallyparticularly in 2017.2017, stabilized in 2018 and slipped in 2019. Total shareholder return for the Index decreased in 2015, steadily increased in financial 2013, 2014, 2016, 2017 and 2017, while it declined2018, then stabilized in 2015.2019.
The Corporation was negatively impacted by uneven macro-economic conditions and unevenirregular telecom spending during this five-year period. Its sales were also affected by global exchange rates, notably the increase of the US dollar versus a basket of currencies like the Canadian dollar, British pound and Euro. The Index, meanwhile, suffered from lower prices for natural resources in 2015, but it was less perturbed by unsteady macro-economic conditions. Due to the relatively small size of the Corporation and its market capitalization, its Subordinate Voting Shares tend to be more volatile and more severely impacted, either positively or negatively, than the Index.Index.
The bar chart aboveon the previous page illustrates that over the same five-year period, the total level of compensation received by the NEOs, as expressed in Canadian dollars, followed the Corporation'sCorporation’s share price performance in 2016, but not between 2013in 2015, 2017, 2018 and 2015 as well as in 2017.2019. The following information should be considered when analyzing the chart:
· | Despite the relative stability of the Corporation's share price as at August 31, 2013 compared to the previous financial year, total compensation to the NEOs decreased. This decrease in NEOs compensation reflected financial results below expectations for financial 2013 and consequently was aligned with shareholders' interests. |
The Corporation’s share price decreased as at August 31, 2015 compared to the previous financial year, while total NEO compensation as expressed in Canadian dollars remained flat for the same period. It should be noted, however, three out of five NEOs were remunerated in currencies other than the Canadian dollar. On a constant currency basis, total NEO compensation would have decreased by about CA$100,000 year-over-year. As a result, total compensation received by the NEOs for this period was aligned with share price performance.
The Corporation’s share performance increased from September 1, 2015 to August 31, 2016. Total compensation received by the NEOs during this period also increased but at a higher rate than the Corporation’s share price. It should be noted that the Corporation hired an executive to the newly created position of Chief Operating Officer in the early part of the financial year, which contributed to the increase in total compensation received by the NEOs during this period.
The Corporation’s share performance increased from September 1, 2016 to August 31, 2017. Total compensation received by the NEOs decreased during this period as certain financial targets were not met, which consequently was aligned with shareholders’ interests.
The Corporation’s share price remained relatively flat as at August 31, 2018 compared to the previous financial year, while total compensation received by the NEOs decreased during that period as certain financial targets were not met. In addition, fewer Restricted Share Units (RSUs) were attributed to the CEO in 2018 than in the previous year, while the Executive Chairman accepted a reduced compensation plan after transitioning from his former role as CEO.
The Corporation’s share performance decreased from September 1, 2018 to August 31, 2019. Total compensation received by the NEOs increased during this period since most financial targets were met with revenues, bookings, IFRS net loss, adjusted EBITDA and cash flows from operations improving year-over-year.
· | The Corporation's share price remained relatively flat as at August 31, 2014 compared to the previous financial year, but total NEO compensation increased for that year. This rise in NEO compensation can be explained mainly by the progressive adjustment of the CEO's base salary, as he no longer received equity-based compensation, as well as adjustments to align executive compensation with the Target Compensation Positioning offered within a reference market of comparable companies similar in size to the Corporation. This was deemed necessary to maintain a competitive position within the marketplace and retain key executives. |
· | The Corporation's share price decreased as at August 31, 2015 compared to the previous financial year, while total NEO compensation as expressed in Canadian dollars remained flat for the same period. It should be noted, however, three out of five NEOs were remunerated in currencies other than the Canadian dollar. On a constant currency basis, total NEO compensation would have decreased by about CA$100,000 year-over-year. As a result, total compensation received by the NEOs for this period was aligned with share price performance.
|
· | The Corporation's share performance increased from September 1, 2015 to August 31, 2016. Total compensation received by the NEOs during this period also increased but at a higher rate than the Corporation's share price. It should be noted that the Corporation hired an executive to the newly created position of Chief Operating Officer in the early part of the financial year, which also contributed to the increase in total compensation received by the NEOs during this period. |
· | The Corporation's share performance increased from September 1, 2016 to August 31, 2017. Total compensation received by the NEOs decreased during this period as certain financial targets were not met, which consequently was aligned with shareholders' interests. |
Total compensation to NEOs of the Corporation is defined as the aggregate of base salary, short-term compensation and long-term compensation. Base salary is established at the beginning of each financial year, according to recommendations made by the Board of Directors'Directors’ Human Resources Committee. Short-term compensation, which varies from one year to the next, is contingent upon the achievement of pre-established objectives measured against corporate and individual targets for a given financial year. For more information about short-term compensation, refer to the heading entitled "Short“Short Term Incentive Compensation."” Long-term compensation, which is provided in the form of RSUs, vests over a three- to five-year period, depending on the achievement of pre-establishedpre‑established corporate goals. For more information about long-term compensation, refer to the heading entitled "Long-Term“Long-Term Incentive Plan"Plan”.
Consequently, base salary and short-term compensation do not necessarily track the market value of our share price. Long-term compensation, however, is directly aligned with share-price performance, since the market value of RSUs is equal to the market value of our shares on any vesting day. Accordingly, the market value of the Corporation'sCorporation’s share price will affect the planned value of NEOs'NEOs’ total compensation, thereby partially aligning their experience with that of shareholders.
DIRECTORS AND OFFICER'SOFFICERS’ LIABILITY INSURANCE
Our by-laws require us, subject to the limitations provided by law, to indemnify our present or former Directors and officers or any persons who act or acted at our request as Directors or officers of a body corporate for all costs, losses, charges and expenses that arose or may arise by reason of their status as Directors or officers of us or such body corporate. We maintain a Directors' and officers' liability insurance policy, which insures our Directors and officers and those of our subsidiaries against liability incurred by, arising from or against them for certain of their acts, errors or omissions. Accordingly, we maintainThe Corporation maintains insurance protection against liability incurred by the Corporation'sits officers and directors as well as those of its subsidiaries in the performance of their duties. The entire premium, amounting to US$130,000176,554 from September 30, 20172019 to September 30, 2018,2020, is paid by the Corporation. The aggregate limit of liability in respect of any and all claims is US$1520 million per year, subject to a deductible of US$250,000. A separate excess director and officer liability policy (Chubb Executive Elite) with aggregate limit of US$5 million provides broad form side A coverage, featuring difference-in-conditions (DIC) drop-down coverage that fills in potential coverage gaps that may exist under restrictive or unresponsive underlying insurance. This specific policy provides coverage for personal directors and officers liability if the organization fails or refuses to indemnify, or is financially unable to do so, or is prevented by law from indemnifying and will also respond if the primary D&O policy limit is consumed.
Board of Directors
Our Directors are elected at the annual meeting of shareholders for one-year terms and serve until their successors are elected or appointed, unless they resign or are removed earlier. We plan to hold our next annual meeting of shareholders on January 10, 2018.8, 2020. Our articles of incorporation provide for a Board of Directors of a minimum of three (3) and a maximum of twelve (12) Directors. Our Board of Directors presently consists of six Directors. Under the Canada Business Corporations Act, twenty-five percent of the Directors and of the members of any committee of the Board of Directors must be resident Canadians. We have no arrangements with any of our Directors providing for the payment of benefits upon their termination of service as Director except for the vesting of their respective Deferred Share Units as detailed above.
The following charts and notes set out the name of each of the individuals proposed to be nominated at the Meeting for election as a director of the Corporation. Included in these charts is information relating to the proposed directors'directors’ committee memberships, meeting attendance, period of service as a director, principal directorships with other organizations and equity ownership (or securities over which each of them exercises control or direction) in the Corporation.
94
GERMAIN LAMONDE |
| St-Augustin-de-Desmaures,
Quebec, Canada Director since
September 1985 Not Independent
(Management) Principal Occupation:
Executive Chairman of the Board of Directors of the Corporation since April 1, 2017 President and Chief Executive Officer of the Corporation until April 1, 2017 | Germain Lamonde, a founder of EXFO, is Executive Chairman of the Board and served as the company's Chief Executive Officer (CEO) for over 30 years. During his tenure as CEO, Mr. Lamonde grew the company from the ground up into a global leader in the test, service assurance and analytics markets. Today, he is actively involved in leading the acquisition strategy, defining the company's growth strategies, customer outreach, select projects and corporate governance policies. Mr. Lamonde has served on the board of directors of several organizations, including the Canadian Institute for Photonic Innovations, Quebec City's economic development corporation (Québec International), the National Optics Institute (INO) and Université Laval in Quebec City. Germain Lamonde holds a bachelor's degree in engineering physics from the Université de Montreal's school of engineering (Polytechnique Montréal), a master's degree in optics from Université Laval, and is a graduate of the Ivey Executive Management Program offered by Western University. |
Board/Committee Membership | Attendance (1) | Board Memberships of Another Reporting Issuer |
Chairman of the Board of Directors | 10/10 | 100% | – |
Securities Held |
As at | Subordinate
Voting Shares (#) | Multiple Voting
Shares (#) | RSUs (#) | Total Shares (2)
and RSUs (#) | Total Market Value (3)
of Shares (2) and RSUs (US$) |
August 31, 2017 | 3,769,508 (4) | 31,643,000 (5) | ‒ | 35,412,508 | 166,438,788 |
GERMAIN LAMONDE |
| St-Augustin-de-Desmaures,
Quebec, Canada Director since
September 1985 Not Independent
(Management) Principal Occupation:
Executive Chairman of the Board of Directors | Germain Lamonde, founder of EXFO, is Executive Chairman of the Board and served as the company’s Chief Executive Officer (CEO) for over 30 years. During his tenure as CEO, Mr. Lamonde grew the company from the ground up, turning it into a global leader in the communications test, monitoring and analytics market and the world’s #1 fiber/highspeed testing company, with customers in over one hundred countries. Today as Executive Chairman, Mr. Lamonde leads EXFO’s acquisitions strategy and is actively involved in defining the company’s growth and investment strategies, strategic direction and corporate governance policies. Mr. Lamonde has served on the board of directors of several public and private organizations, fulfilled numerous speaking engagements, and received several industry awards for his leadership, innovation and global development and was named EY Entrepreneur of the Year 2018 Canada. Mr. Lamonde is presently Chairman of ENCQOR, the Canada–Quebec-Ontario partnership focused on research and innovation in the field of 5G/IoT innovation and serves on the Board of QG100 – a CEO development forum. Mr. Lamonde holds a bachelor’s degree in engineering physics from Polytechnique Montréal and a master’s degree in optics from Université Laval in Québec City. He is a graduate of the Ivey Executive Program at Western University in London, Ontario, and is also a Fellow of the Canadian Academy of Engineering. |
Board/Committee Membership | Attendance (1) | Board Memberships of Another Reporting Issuer |
Board of Directors | 5/6 | 83% | – |
Securities Held |
As at | Subordinate
Voting Shares (#) | Multiple Voting
Shares (#) | PSUs (#) | RSUs (#) | Total Shares (2)
and PSUs, RSUs (#) | Total Market Value (3)
of Shares (2) and PSUs, RSUs (US$) |
August 31, 2019 | 3,672,474 (4) | 31,643,000 (5) | – | – | 35,315,474 | 128,901,480 |
| | |
| | |
| (1) | From September 1, 20162018 until November 1, 2017,2019, Mr. Lamonde attended six (6)four (4) board meetings in person and four (4)one (1) board meetingsmeeting by telephone. |
| (2) | Includes both Subordinate Voting Shares and Multiple Voting Shares. |
| (3) | The value of unvested PSUs or RSUs at the financial year-end is the market value of the Subordinate Voting Shares on August 31, 2017,2019, which was US$4.703.65 (CA$5.89)4.85). The market value of the Subordinate Voting Shares and Multiple Voting Shares was calculated by using the highest of the closing prices of the Subordinate Voting Shares on the Toronto Stock Exchange and on the NASDAQ Global Select Market on August 31, 201730, 2019 using the daily exchange rate of the Bank of Canada to convert either the NASDAQ Global Select Market closing price to Canadian dollars or the Toronto Stock Exchange closing price to United States dollars as required. The actual gains on vesting of PSUs or RSUs will depend on the value of the Subordinate Voting Shares on the date of vesting. There can be no assurance that these values will be realized. |
| (4) | Mr. Lamonde exercises control over 3,000,0003,191,666 Subordinate Voting Shares through 9356-9036 Québec Inc., a company controlled by Mr. Lamonde. Mr.G. Lamonde exercises control over 400,000 Subordinate Voting Shares through 9356-9010 QuébecInvestissements Financiers Inc., a company controlled by Mr. Lamonde. Mr. Lamonde exercises control over 316,247 Subordinate Voting Shares through 9356-8988 Québec Inc., a company controlled by Mr. Lamonde. Mr. Lamonde exercises direct control over 164,561 Subordinate Voting Shares. |
| (5) | Mr. Lamonde exercises control over 24,743,00029,743,000 Multiple Voting Shares through G. Lamonde Investissements Financiers Inc., a company controlled by Mr. Lamonde. Mr. Lamonde exercises control over 5,000,0001,900,000 Multiple Voting Shares through 9356-90369356-8988 Québec Inc., a company controlled by Mr. Lamonde. Mr. Lamonde exercises control over 1,900,000 Multiple Voting Shares through Fiducie Germain Lamonde, a family trust for the benefit of Mr. Lamonde's family. |
95
FRANÇOIS CÔTÉ |
| Montreal, Quebec, Canada Director since
January 2015 Lead Director Independent Principal Occupation: Director
Director
| François Côté was appointed a member of our Board of Directors in January 2015. Mr. Côté is a director as a full-time occupation, for corporations in the public, private and non-profit sectors, bringing his expertise in strategy, M&A, governance and passion for growth. Mr. Côté held a variety of executive positions at Bell Canada prior to becoming President and Chief Executive Officer of Emergis. Following the acquisition of Emergis by TELUS in January 2008, he was appointed President of TELUS Quebec, TELUS Health and TELUS Ventures. In this role, Mr. Côté was responsible for broadening TELUS Quebec'sQuebec’s presence and driving the company'scompany’s national health strategy through timely investments in information technology and innovative wireless solutions. Mr. Côté holds a Bachelor'sbachelor’s degree in Industrial Relations from Laval University. In 2007, he was named Entrepreneur of the Year by Ernst & Young, in the Corporate Restructuring category for the province of Quebec. Mr. Côté serves on the boards of Alithya,Purkinje, a Montreal health IT growth company as Chairman, Aspire Food Group, CPUHZB Pharma Canada also as Chairman and ofDiagnos Inc. a new publicly listed company on the Fondation Martin Matte.TSX Venture Exchange. Mr. Côté is also on the Consultative Committee of Medfar Solutions and serves on the Advisor Committee of Groupe Morneau. Mr. Côté is also acting as advisor to different companies' CEO's. |
Board/Committee Membership | Attendance (1) | Board Memberships of Another Reporting Issuer |
Board of Directors
Audit Committee
Human Resources Committee
Independent Board of Directors | 9/10
6/6
5/5
5/5
5/5
| 90%100%
100%
100%
100%
| –Diagnos Inc.
|
Securities Held | Securities Held | Securities Held |
As at | Subordinate
Voting Shares (#) | DSUs (#) | Total Shares
and DSUs (#) | Total Market Value (2)
of Shares (3) and DSUs (US$) | Subordinate
Voting Shares (#) | DSUs (#) | Total Shares (2)
and DSUs (#) | Total Market Value (3)
of Shares (2) and DSUs (US$) |
August 31, 2017 | 6,500 | 17,730 | 24,230 | 113,881 | |
August 31, 2019 | | 6,500 | 38,582 | 45,082 | 164,549 |
| (1) | From September 1, 20162018 until November 1, 2017,2019, Mr. Côté attended six (6)five (5) board meetings in person and three (3)one (1) board meetingsmeeting by telephone. |
| (2) | Refers to Subordinate Voting Shares. |
| (3) | The value of unvested DSUs at the financial year-end is the market value of the Subordinate Voting Shares on August 31, 2017,2019, which was US$4.703.65 (CA$5.89)4.85). The market value of the Subordinate Voting Shares was calculated by using the highest of the closing prices of the Subordinate Voting Shares on the Toronto Stock Exchange and on the NASDAQ Global Select Market on August 31, 201730, 2019 using the daily exchange rate of the Bank of Canada to convert either the NASDAQ Global Select Market closing price to Canadian dollars or the Toronto Stock Exchange closing price to United States dollars as required. The actual gains on vesting of DSUs will depend on the value of the Subordinate Voting Shares on the date of vesting. There can be no assurance that these values will be realized. |
(3) | Refers to Subordinate Voting Shares. |
96
ANGELA LOGOTHETIS |
| Bath
United Kingdom Director since
January 2017 Independent Principal Occupation:
Vice-President, Head of TechnologyVice President and Services
CTO,
Amdocs Open Network (1) | Angela Logothetis has more than twenty-five (25) years of international experience in the telecommunications industry. She has been strategically engaged in the industry'sindustry’s major network transformations. Ms. Logothetis has an outstanding software pedigree having worked for market-leading software companies including Amdocs, Cramer, PricewaterhouseCoopers and Accenture as well as start-up software companies Clarity and Time Quantum Technology. She has held senior leadership positions in ANZ, APAC and EMEA and has held global responsibility for the past ten (10) years. Ms. Logothetis is the Head of Network Strategy, Technology and ServicesCTO for Amdocs.Amdocs Open Network. Amdocs is the market leader in customer experience software solutions and services for the world'sworld’s largest communications, entertainment and media service providers. Ms. Logothetis has held several senior leadership positions at Amdocs including Head of OSS Product and Technology, Vice-PresidentVice President of OSS Product Management and Executive Site Lead for Amdocs Bath. She has chaired high-caliber software forums in Amdocs including the Divisional Leadership Team, the Technical Advisory Council, and has served as an executive on the Product Business Management Team and the Product Leadership Forum. Ms. Logothetis holds a Bachelor of Science degree, with first class honors, in Business Information Technology from the University of New South Wales, Australia. She completed dual majors in accountancy and information technologytechnology.. |
Board/Committee Membership | Attendance (2) | Board Memberships of Another Reporting Issuer |
Board of Directors
Audit Committee
Human Resources Committee
Independent Board of Directors | 4/6/6
5/5
3/35/5
3/3
3/35/5
| 80%100%
100%
100%
100%
| – |
Securities Held | Securities Held | Securities Held |
As at | Subordinate
Voting Shares (#) | DSUs (#) | Total Shares
and DSUs (#) | Total Market Value (3)
of Shares (4) and DSUs (US$) | Subordinate
Voting Shares (#) | DSUs (#) | Total Shares (3)
and DSUs (#) | Total Market Value (4)
of Shares (3) and DSUs (US$) |
August 31, 2017 | – | 8,639 | 40,603 | |
August 31, 2019 | | – | 49,714 | 181,456 |
| (1) | Amdocs is a market leader in software solutions and services for communications, media and entertainment service providers. |
| (2) | From January 11, 2017September 1, 2018 until November 1, 2017,2019, Ms. Logothetis attended three (3)five (5) board meetings in person and one (1) board meeting by telephone. |
| (3) | Refers to Subordinate Voting Shares. |
| (4) | The value of unvested DSUs at the financial year-end is the market value of the Subordinate Voting Shares on August 31, 2017,2019, which was US$4.703.65 (CA$5.89)4.85). The market value of the Subordinate Voting Shares was calculated by using the highest of the closing prices of the Subordinate Voting Shares on the Toronto Stock Exchange and on the NASDAQ Global Select Market on August 31, 201730, 2019 using the daily exchange rate of the Bank of Canada to convert either the NASDAQ Global Select Market closing price to Canadian dollars or the Toronto Stock Exchange closing price to United States dollars as required. The actual gains on vesting of DSUs will depend on the value of the Subordinate Voting Shares on the date of vesting. There can be no assurance that these values will be realized. |
PHILIPPE MORIN |
| Montreal, Quebec
Canada Director since
January 2018 Not Independent
(Management) Principal Occupation:
CEO of the Corporation | Philippe Morin was appointed Chief Executive Officer (CEO) of EXFO in April 2017 and is responsible for the Corporation’s strategy and financial directions, goals and results. He has more than thirty (30) years of experience in the telecommunications industry and joined EXFO in November 2015 as Chief Operating Officer (COO) leading the company’s global sales leadership, market development, and product strategy. Before joining EXFO, Mr. Morin was Senior Vice President of Worldwide Sales and Field Operations at Ciena. He previously held senior leadership roles at Nortel Networks, including President of Metro Ethernet Networks and Vice President and General Manager of Optical Networks. Philippe Morin holds a bachelor’s degree in electrical engineering from Université Laval in Quebec City, Canada, and a master’s degree in business administration (MBA) from McGill University in Montreal, Canada. |
Board/Committee Membership | Attendance (1) | Board Memberships of Another Reporting Issuer |
Board of Directors | 6/6 | 100% | – |
Securities Held |
As at | Subordinate
Voting Shares (#) | PSUs (#) | RSUs (#) | Total Shares (2)
and PSUs, RSUs (#) | Total Market Value (3)
of Shares (2) and PSUs, RSUs (US$) |
August 31, 2019 | 658,059 | – | 327,039 | 985,098 | 3,595,608 |
| | |
| | |
(4)(1) | From September 1, 2018 until November 1, 2019, Mr. Morin attended five (5) board meetings in person and one (1) board meeting by telephone. |
| (2) | Refers to Subordinate Voting Shares. |
PHILIPPE MORIN
|
| Montreal, Quebec
Canada
Proposed nominee for Director
to the January 2018
shareholders' meeting
Not Independent
(Management)
Principal Occupation:
CEO of the Corporation since
April 1, 2017
| Philippe Morin was appointed Chief Executive Officer (CEO) of EXFO in April 2017. He has more than twenty-five (25) years of experience in the telecommunications industry, and became EXFO's Chief Operating Officer (COO) in November 2015, leading the company's global sales leadership, market development, marketing and product strategy. Before joining EXFO, Mr. Morin was Senior Vice-President of Worldwide Sales and Field Operations at Ciena. He previously held senior leadership roles at Nortel Networks, including President of Metro Ethernet Networks and Vice-President and General Manager of Optical Networks. Philippe Morin holds a bachelor's degree in electrical engineering from Université Laval in Quebec City, Canada, and a master's degree in business (MBA) from McGill University in Montreal, Canada.
|
Board/Committee Membership
| Attendance (1)
| Board Memberships of Another Reporting Issuer
|
Board of Directors
Audit Committee
Human Resources Committee
Independent Board of Directors
| N/A
N/A
N/A
N/A
| N/A
N/A
N/A
N/A
| –
|
Securities Held |
As at | Subordinate
Voting Shares (#) | RSUs (#) | Total Shares
and RSUs (#) | Total Market Value (2)
of Share (3) and RSUs (US$) |
August 31, 2017 | 600,000 | 255,238 | 855,238 | 4,019,619 |
(1) | Mr. Morin, if elected, will join our Board of Directors on January 10, 2018. Hence, from September 1, 2016 until November 1, 2017, Mr. Morin did not attend any meetings as a board member. |
(2)(3) | The value of unvested PSUs or RSUs at the financial year-end is the market value of the Subordinate Voting Shares on August 31, 2017,2019, which was US$4.703.65 (CA$5.89)4.85). The market value of the Subordinate Voting Shares and Multiple Voting Shares was calculated by using the highest of the closing prices of the Subordinate Voting Shares on the Toronto Stock Exchange and on the NASDAQ Global Select Market on August 31, 201730, 2019 using the daily exchange rate of the Bank of Canada to convert either the NASDAQ Global Select Market closing price to Canadian dollars or the Toronto Stock Exchange closing price to United States dollars as required. The actual gains on vesting of PSUs or RSUs will depend on the value of the Subordinate Voting Shares on the date of vesting. There can be no assurance that these values will be realized. |
(3) | Refers to Subordinate Voting Shares. |
98
CLAUDE SÉGUIN |
| Westmount, Quebec,
Canada Director since
February 2013 Independent Principal Occupation:
Special Advisor to the Founder and Executive Chairman,
CGI Group Inc. (1)
Director | Claude Séguin was appointed a member of EXFO'sEXFO’s Board of Directors in February 2013. He brings to EXFO nearly forty (40) years of corporate, financial, executive and provincial government experience gained through senior management positions in major corporations and government departments. Mr. Séguin is currentlywas Special advisor to the Founder and Executive Chairman at CGI Group Inc., a global leader in information technology and business process services.services, until March 2018. He was, until OctoberNovember 2016, Senior Vice-President,Vice President, Corporate Development and Strategic Investments. In this position, he was responsible for all merger and acquisition activities. Prior to joining CGI in 2003, he served as President of CDP Capital—Private Equity, and prior to this position, he served as Teleglobe Inc.'s’s Executive Vice-President,Vice President, Finance and Chief Financial Officer, a position that he held from 1992 to 2000. Mr. Séguin also has extensive senior-level government experience, having served as Deputy Finance Minister of the Province of Quebec from 1987 to 1992, in addition to Assistant Deputy Finance Minister in prior years. Prior to that, he has been Director of Planning and Assistant Director of Social Programsheld senior positions at the Province of Quebec Treasury Board. Mr. Séguin is a member of the boardsboard of HEC-Montréal andal. He also chairs the Boards of Centraide of Greater Montreal Foundation as well as being Chairman of the Board of Finance – Montreal, an organization regrouping financial institutions in the Province of Quebec. He also serves on the board of directorsand of Fonds de solidarité FTQ, a trade union sponsored investments fund.$15B Labour Sponsored Investment Fund in Québec. Claude Séguin graduated from HEC-Montréal and earned a master'smaster’s and a Ph.D. in public administration from Syracuse University in New York State. He also followed the Advanced Management Program at Harvard Business School. |
Board/Committee Membership | Attendance (2)(1) | Board Memberships of Another Reporting Issuer |
Board of Directors
Audit Committee
Human Resources Committee
Independent Board of Directors | 10/105/6
6/6
5/5
5/4/5
4/5
| 83%
100%
100% 80%
100%
100% 80% | –Fonds de solidarité FTQ
|
Securities Held | Securities Held | Securities Held |
As at | Subordinate
Voting Shares (#) | DSUs (#) | Total Shares
and DSUs (#) | Total Market Value (3)
of Shares (4) and DSUs (US$) | Subordinate
Voting Shares (#) | DSUs (#) | Total Shares (2)
and DSUs (#) | Total Market Value (3)
of Shares (2) and DSUs (US$) |
August 31, 2017 | – | 29,855 | 140,318 | |
August 31, 2019 | | 5,000 | 64,211 | 69,211 | 252,620 |
| (1) | CGI Group Inc. is an information technology consulting, systems integration, outsourcing and solutions company. |
(2) | From September 1, 20162018 until November 1, 2017,2019, Mr. Séguin attended sixfour (64) board meetings in person and fourone (41) board meetingsmeeting by telephone. |
| (2) | Refers to Subordinate Voting Shares. |
| (3) | The value of unvested DSUs at the financial year-end is the market value of the Subordinate Voting Shares on August 31, 2017,2019, which was US$4.703.65 (CA$5.89)4.85). The market value of the Subordinate Voting Shares was calculated by using the highest of the closing prices of the Subordinate Voting Shares on the Toronto Stock Exchange and on the NASDAQ Global Select Market on August 31, 201730, 2019 using the daily exchange rate of the Bank of Canada to convert either the NASDAQ Global Select Market closing price to Canadian dollars or the Toronto Stock Exchange closing price to United States dollars as required. The actual gains on vesting of DSUs will depend on the value of the Subordinate Voting Shares on the date of vesting. There can be no assurance that these values will be realized. |
(4) | Refers to Subordinate Voting Shares. |
99
RANDY E. TORNES |
| Frisco, Texas, USA Director since
February 2013 Independent Principal Occupation:
Vice-President Strategic Alliances,Vice President, Client Partner
Juniper Networksfor AT&T at Aricent (1)
| Randy E. Tornes was appointed a member of EXFO'sEXFO’s Board of Directors in February 2013. He brings to EXFO over thirty (30) years of telecommunications experience gained through senior management positions at leading network equipment manufacturers. Mr. Tornes is Vice-President,Vice President, Client Partner for AT&T at Aricent, An Altran Company. Prior to joining Aricent, Mr. Tornes was Vice President Strategic Alliances at Juniper Networks, a worldwide leader in high-performance networking and telecommunications equipment. Prior to his current role at Juniper, he wasMr. Tornes has also worked as the Operating Area Leader for AT&T and responsible for all sales, service and support of Juniper products and services. Prior to joining Juniper Networks in May 2012, he spent two (2) years at Ericsson, where he was Vice-PresidentVice President Sales (AT&T account). Previous to that position, he worked for Nortel for twenty-six (26) years, holding various sales management positions, including Vice-PresidentVice President Sales, GSM Americas. Mr. Tornes also served as member of the Board of Governors at 3G Americas LLC. Randy E. Tornes holds a Bachelor of Science degree in business—organizational development and production and operations management, from the University of Colorado in Colorado Springs. |
Board/Committee Membership | Attendance (2) | Board Memberships of Another Reporting Issuer |
Board of Directors
Audit Committee
Human Resources Committee
Independent Board of Directors | 10/10
6/6
5/5
5/5
5/5
| 100%
100%
100%
100% | – |
Securities Held | Securities Held | Securities Held |
As at | Subordinate
Voting Shares (#) | DSUs (#) | Total Shares
and DSUs (#) | Total Market Value (3)
of Shares (4) and DSUs (US$) | Subordinate
Voting Shares (#) | DSUs (#) | Total Shares (3)
and DSUs (#) | Total Market Value (4)
of Shares (3) and DSUs (US$) |
August 31, 2017 | – | 62,603 | 294,234 | |
August 31, 2019 | | – | 99,000 | 361,350 |
| (1) | Juniper NetworksAricent is a manufacturer of networking equipment.global design and engineering company. |
| (2) | From September 1, 20162018 until November 1, 2017,2019, Mr. Tornes attended sixfive (6)(5) board meetings in person and fourone (41) board meetingsmeeting by telephone. |
| (3) | Refers to Subordinate Voting Shares. |
| (4) | The value of unvested DSUs at the financial year-end is the market value of the Subordinate Voting Shares on August 31, 2017,2019, which was US$4.703.65 (CA$5.89)4.85). The market value of the Subordinate Voting Shares was calculated by using the highest of the closing prices of the Subordinate Voting Shares on the Toronto Stock Exchange and on the NASDAQ Global Select Market on August 31, 201730, 2019 using the daily exchange rate of the Bank of Canada to convert either the NASDAQ Global Select Market closing price to Canadian dollars or the Toronto Stock Exchange closing price to United States dollars as required. The actual gains on vesting of DSUs will depend on the value of the Subordinate Voting Shares on the date of vesting. There can be no assurance that these values will be realized. |
(4) | Refers to Subordinate Voting Shares. |
100
The information as to Subordinate Voting Shares and Multiple Voting Shares beneficially owned or over which the above-named individuals exercise control or direction is not within the direct knowledge of the Corporation and has been furnished by the respective individuals. The information as to the Principal Board Memberships is also not within the direct knowledge of the Corporation and has been furnished by the respective individuals.
NoneWith the exception of Mr. Philippe Morin (as disclosed below), none of the individuals who are proposed to be nominated at the Meeting for election as a director of the Corporation:
a) | is, as at the date hereof, or has been, within ten (10) years before the date hereof, a director, chief executive officer or chief financial officer of any company that (i) was subject to an order that was issued while such individual was acting in the capacity as director, chief executive officer or chief financial officer, or (ii) was subject to an order that was issued after such individual ceased to be a director, chief executive officer or chief financial officer and which resulted from an event that occurred while that person was acting in the capacity as director, chief executive officer or chief financial officer; |
b) | is, as at the date hereof, or has been within ten (10) years before the date hereof, a director or executive officer of any company that, while such individual was acting in that capacity, or within a year of that individual ceasing to act in that capacity, became bankrupt, made a proposal under any legislation relating to bankruptcy or insolvency or was subject to or instituted any proceedings, arrangement or compromise with creditors or had a receiver, receiver manager or trustee appointed to hold its assets; |
c) | has, within the ten (10) years before the date hereof, become bankrupt, made a proposal under any legislation relating to bankruptcy or insolvency, or become subject to or instituted any proceedings, arrangement or compromise with creditors, or had a receiver, receiver manager or trustee appointed to hold his assets; or |
d)
| has been subject to (i) any penalties or sanctions imposed by a court relating to securities legislation or by a securities regulatory authority or has entered into a settlement agreement with a securities regulatory authority, or (ii) any other penalties or sanctions imposed by a court or regulatory body that would likely be considered important to a reasonable security holder in deciding whether to vote for such individual. |
Mr. Philippe Morin acted as an executive officer of Nortel Networks Corporation (“Nortel”) and its affiliates from 2006 to 2010 as President Metro Ethernet Networks. Nortel and certain of its affiliates filed for bankruptcy protection in a number of jurisdictions in January 2009.
From September 1, 20162018 through November 1, 2017,2019, the Board met a total of ten (10)six (6) times. Each member attended all meetings, except for Mr. Allard who was absent at two (2) meetings,Lamonde and Mr. Côté and Ms. Logothetis whoSéguin who were absent at one (1) meeting and Mr. Edwards who was absent at three (3) meetings.
meeting.Committees of the Board of Directors
Our Board of Directors has established an audit committee, a human resources committee and a disclosure committee.
Our audit committee will recommend a firm to be appointed as independent auditors to audit financial statements and to perform services related to the audit, review the scope and results of the audit with the independent auditors, review with management and the independent auditors our annual operating results and consider the adequacy of the internal accounting procedures and the effect of the procedures relating to the auditors'auditors’ independence. Further to changes to NASDAQ corporate governance rules and Securities and Exchange Act rules flowing from the adoption of the Sarbanes-Oxley Act, we review our audit committee charter annually to ensure that we comply with all new requirements. Accordingly, in October 2017,2019, the Audit Committee reviewed the Audit Committee Charter, a copy of which is filed as Exhibit 11.5 to this Annual Report and is also readily available from EXFO'sEXFO’s website at www.EXFO.comwww.EXFO.com.. Information on our Web site is not incorporated by reference in this Annual Report. As at November 1, 2017,2019, the audit committee is composed of fivefour independent Directors: Pierre-Paul Allard, François Côté, Angela Logothetis, Claude Séguin and Randy E. Tornes. The chairperson of the audit committee is Claude Séguin.
From September 1, 20162018 through November 1, 2017,2019, the Audit Committee met a total of six (6)five (5) times. Each member attended all meetings except for Mr. Allard and Mr. Edwards who were absent at two (2) meetings.
Our human resources committee will evaluate, review and supervise our procedures with regards to human resources and will assess the performance of our executive officers and the chief executive officer. This committee will also review annually the remuneration of the Directors and will recommend to the Board of Directors general remuneration policies regarding salaries, bonuses and other forms of remuneration for our Directors, executive officers and employees as a whole. Finally, the human resources committee will review our organizational structure annually and the development and maintenance of a succession plan. In October 2014 and in October 2017, the Human Resources Committee reviewed and amended the Human Resources Committee Charter which integrates the Compensation Committee Charter and the Nominating and Governance Committee Charter, copy of which is filed as Exhibit 11.6 to our 2014 Annual Report and in Octoberas Exhibit 11.15 to our 2017 Annual Report, the Human Resources Committee reviewed and amended the Human Resources Committee Charter in order to specifically add the compensation review of the Executive Chairman which is also readily available from EXFO'sEXFO’s website at www.EXFO.com.www.EXFO.com. Information on our Web site is not incorporated by reference in this Annual Report. As at November 1, 2017,2019, the human resources committeeHuman Resources Committee is composed of five (5)four (4) independent Directors: Pierre-Paul Allard, François Côté, Angela Logothetis, Claude Séguin and Randy E. Tornes. The chairperson of the Human Resources Committee is François Côté.
From September 1, 20162018 through November 1, 2017,2019, the Human Resources committee met a total of five (5) times and all members attended all meetings except for Mr. Allard and Mr. EdwardsSéguin who werewas absent at one (1) meeting.
The disclosure committee is responsible for overseeing our disclosure practices. This committee consists of the executive chairman, the chief executive officer, the chief financial officer, the director of investor relations, the director of financial reporting and accounting as well as our general counsel and corporate secretary.
Furthermore, our independent Directors hold regularly scheduled meetings at which non-independent directors and members of management are not in attendance. The independent Directors hold as many meetings, as needed, annually and any Director may request such meeting at any time. From September 1, 20162018 through November 1, 2017,2019, five (5) meetings of independent Directors without management occurred and all members attended all meetings except Mr. Allard and Mr. EdwardsSéguin who werewas absent at one (1) meeting. In June 2011, an Independent Members Committee Charter was adopted. A copy of this Independent Members Committee Charter has been filed as Exhibit 11.9 to our 2011 Annual Report.
REPORT ON CORPORATE GOVERNANCE PRACTICES
Corporate Governance Developments in Canada
In January 2004, the Canadian Securities Administrators (the "CSA"“CSA”) adopted Multilateral Instrument 52-110—Audit Committees, which was last amended in November 2015 ("(“MI 52‑110"110”). MI 52‑110 sets forth certain requirements regarding Audit Committee composition and responsibilities, as well as reporting obligations with respect to audit-related matters. The disclosure of the MI 52-110 requirements is included in our 20172019 Annual Information Form on Form 20-F under Exhibit 11.5 (Audit Committee Charter), Items 6.A (Directors and Senior Management) and 16.C (Principal Accountant Fees and Services) available as described below. For the composition of the Audit Committee, refer to the table provided under heading "Nominees“Nominees for Election as Directors and their Beneficial Ownership of Voting Securities"Securities”.
Effective June 30, 2005, the CSA also adopted National Instrument 58-101—Disclosure of Corporate Governance Practices ("(“NI 58‑101"101”) and National Policy 58‑201—Effective Corporate Governance ("(“NP 58‑201"201” and, together with MI 52‑110, the "CSA“CSA Corporate Governance Standards"Standards”). NP 58‑201 provides guidance to Canadian issuers with respect to corporate governance practices, while NI 58‑101 requires issuers to make certain disclosures regarding their governance practices. The CSA Corporate Governance Standards, particularly NI 58‑101 and NP 58‑201, have replaced the former guidelines of the Toronto Stock Exchange that had, prior to the coming into force of the CSA Corporate Governance Standards, served as the primary source of codified recommendations in respect of corporate governance practices in Canada.
102
EXFO’s Corporate Governance Practices
In accordance with NI 58‑101, we are required to disclose information with respect to our system of corporate governance. Over the past few years, we have undertaken a comprehensive review of our corporate governance practices in order to best comply with and, whenever practicable, exceed the CSA Standards.
We adopted in March 2005, and are updating on a regular basis, a number of charters and policies, including an Audit Committee Charter, a Board of Directors Corporate Governance Guidelines, a Code of Ethics for our Principal Executive Officer and Senior Financial Officers, a Disclosure Guidelines, an Ethics and Business Conduct Policy, a Human Resources Committee Charter, a Securities Trading Policy and a Statement on Reporting Ethical Violations (Whistleblower Policy). We adopted in October 2006 a policy regarding Hiring Employees and Former Employees of Independent Auditor. We adopted in June 2011 an Independent Members Committee Charter. We also adopted in October 2011 a majority voting policy for the election of our Directors and amended it in order to comply with the TSX Rules in March 2016. We amended in October 2012 the Human Resources Committee Charter in order to expressly reflect the responsibility of the Human Resources Committee to conduct an annual assessment of the risks associated with the Corporation'sCorporation’s executive compensation policies and procedures.
In July 2018, we amended our Ethics and Business Conduct Policy and our Agent Code of Conduct to remove the exception for facilitation payments. In March 2017, we amended our Disclosure Guidelines to add the Executive Chairman as a member of the Disclosure Committee. In June 2017, we also amended our Director Share Ownership Policy and our Board of Directors Corporate Governance Guidelines in order to introduce mandatory obligations for our Directors to elect to receive at least seventy-five (75%) of their Annual Retainer in form of DSUs until their cumulative Annual Retainers equal or exceed three (3) times the sum of: i) the Annual Retainer for Directors; ii) the Annual Retainer for Audit Committee Members; and iii) the Annual Retainer for Human Resources Committee Members.
We amended in January 2013, in October 2014 and in October 2017 the Human Resources Committee Charter in order to respectively receive and discuss suggestions from shareholders for potential Directors'Directors’ nominees, to adapt it to the latest NASDAQ Rules on compensation committee along with an update on the nomination of Directors process and in order to specifically add the compensation review of the Executive Chairman. We adopted in January 2013 a Policy Regarding Conflict Minerals. We amended our Ethics and Business Conduct Policy and our Statement on Reporting Ethical Violations (Whistleblower Policy) in June 2013 and adopted in September 2013 the Agent Code of Conduct to formalize our anti-corruption compliance program. We adopted also in September 2013 a Director Share Ownership Policy. We also amended in October 2014 the Audit Committee Charter in order to harmonize its terminology with MI 52-110. We are also implementing best practices such as Best Practice regarding the Granting Date of Stock Incentive Compensation and the establishment of guidelines regarding the filing and disclosure of material contracts. We refer to our Board of Directors and Committee Charters as our "Corporate“Corporate Governance Rules"Rules”.
We are of the view that adopting and implementing good corporate governance practices is a cornerstone of our corporate and management practices and policies and that our existing corporate governance practices already meet the prevailing corporate governance standards. We further believe that the measures we have adopted with respect to corporate governance comply substantially with the CSA Standards.
We encourage our shareholders to consult our Corporate Governance Rules and Ethics and Business Conduct Policy available on our website (www.EXFO.com)(www.EXFO.com) and also available in print to any shareholder who requests copies by contacting our Corporate Secretary.
Our 2019 Annual Information Form on Form 20-F (also filed with the Securities and Exchange Commission (“SEC”)), which will be available on or before November 29, 2019 and which may be obtained free of charge upon request to the Corporate Secretary or at www.sedar.com in Canada or www.sec.gov/edgar.shtml in the U.S., will also contain certain information with respect to our corporate governance practices.
We are dedicated to updating our corporate governance practices on an ongoing basis in order to respond to the evolution of best practices. We and our Board of Directors are of the view that our corporate governance practices, as summarized in the Exhibit 11.7 attached to this Annual Report, are in substantial compliance with the CSA Corporate Governance Standards. Copies of our Corporate Governance Rules and all related policies (including those mentioned above) are available on our website (www.EXFO.com)(www.EXFO.com) as mentioned in Exhibit 11.7.
We have fostered a corporate culture where growth and change are strongly encouraged. In fact, employees are constantly evolving with the rapid pace of technology to meet new challenges and realities. We believe that we possess a good cross-section of experience and youth to handle these inevitable changes in the industry.
As of November 1, 2017,2019, we had a total of 1,5771,810 employees, up from a total of 1,5511,803 on November 1, 2016.2018. We have 751725 employees in Canada, primarily based in the province of Quebec, and 8261,085 employees based outside of Canada. 636656 are involved in research and development, 341401 in manufacturing, 309318 in sales and marketing, 200130 in general administrative positions and 91305 in communications and customer support. We have agreements with almost allthe majority of our employees covering confidentiality and non-competition. Only our 91Our 97 manufacturing employees based in Quebec City plantsplant are represented by a collective bargaining agreement through "Syndicat“Syndicat des employé(e)s d'EXFO"d’EXFO”. Our 51 employees in Spain are represented by a collective agreement through an independent union and 169 employees in Rennes, France, are represented by collective agreements through CFDT and CGT. We have never experienced a work stoppage. We believe that relations with our employees and bargaining unit are good.
The following table presents information regarding the ownership of Subordinate Voting Shares, Exercisable "in-the-money"“in‑the‑money” and "out-of-the-money"“out-of-the-money” options and the beneficial ownership of our share capital as at November 1, 20172019 by our Executive Chairman, our Chief Executive Officer, our Chief Financial Officer, our Directors, our two other most highly compensated executive officers, our other executive officers as a group, all of our Directors and executive officers as a group.
Each multiple voting share is convertible at the option of the holder into one subordinate voting share. Holders of our subordinate voting shares are entitled to one (1) vote per share and holders of our multiple voting shares are entitled to ten (10) votes per share.
Name | Subordinate Voting
Shares Owned | Currently Exercisable Options
Owned as at November 1, 2019 | Total Subordinate
Voting Shares
Beneficially Owned (1) | Multiple Voting Shares
Beneficially Owned (1) | Total Percentage of Voting Power |
| “In-the-money” | “Out-of-
the-money” |
Number | | Percent | Number | Percent | Number | Percent | Number | Percent | Number | | Percent | Percent |
Germain Lamonde | 3,672,474 | (2) | 15.38 | – | * | – | * | 3,672,474 | 15.38 | 31,643,000 | (3) | 100 | 94.06 |
Philippe Morin | 658,835 | | 2.76 | – | * | – | * | 658,835 | 2.76 | – | | – | * |
Pierre Plamondon | 112,505 | | * | – | * | – | * | 112,505 | * | – | | – | * |
François Côté | 6,500 | | * | – | * | – | * | 6,500 | * | – | | – | * |
Angela Logothetis | – | | * | – | * | – | * | – | * | – | | – | * |
Claude Séguin | 5,000 | | * | – | * | – | * | 5,000 | * | – | | – | * |
Randy E. Tornes | – | | * | – | * | – | * | – | * | – | | – | * |
Willem Jan te Niet | 2,635 | | * | – | * | – | * | 2,635 | * | – | | – | * |
Dana Yearian | – | | * | – | * | – | * | – | * | – | | – | * |
Other executive officers as a group | 88,903 | | * | – | * | – | * | 88,903 | * | – | | – | * |
All of our Directors and executive officers as a group | 4,546,852 | | 19.04 | – | * | – | * | 4,546,852 | 19.04 | 31,643,000 | | 100 | 94.32 |
Name | Subordinate Voting
Shares Owned | Currently Exercisable Options
Owned as at November 1, 2017 | Total Subordinate
Voting Shares
Beneficially Owned (1) | Multiple Voting Shares
Beneficially Owned (1) | Total Percentage of Voting Power |
"In-the-money" | Out-of-the-money |
Number | | Percent | Number | Percent | Number | Percent | Number | Percent | Number | | Percent | Percent |
Germain Lamonde | 3,769,508 | (2) | 16.23 | – | * | – | * | 3,769,508 | 16.23 | 31,643,000 | (3) | 100 | 94.27 |
Philippe Morin | 600,000 | | 2.58 | – | * | – | * | 600,000 | 2.58 | – | | – | * |
Pierre Plamondon | 136,772 | (4) | * | – | * | – | * | 136,772 | * | – | | – | * |
Pierre-Paul Allard | 8,000 | | * | – | * | – | * | 8,000 | * | – | | – | * |
François Côté | 6,500 | | * | – | * | – | * | 6,500 | * | – | | – | * |
Angela Logothetis | – | | * | – | * | – | * | – | * | – | | – | * |
Claude Séguin | – | | * | – | * | – | * | – | * | – | | – | * |
Randy E. Tornes | – | | * | – | * | – | * | – | * | – | | – | * |
Willem Jan te Niet | – | | * | – | * | – | * | – | * | – | | – | * |
Dana Yearian | 34,181 | | * | – | * | – | * | 34,181 | * | – | | – | * |
Other executive officers as a group | 75,161 | | * | – | * | – | * | 75,161 | * | – | | – | * |
All of our Directors and executive officers as a group | 4,630,122 | | 19.94 | – | * | – | * | 4,630,122 | 19.94 | 31,643,000 | | 100 | 94.53 |
104
| (1) | Beneficial ownership is determined in accordance with the rules of the SEC and generally includes voting or investment power with respect to securities. Options that are currently exercisable or exercisable within sixty (60) days as at November 1, 20172019 (including options that have an exercise price above the market price) are deemed to be outstanding and to be beneficially owned by the person holding such options for the purpose of computing the percentage ownership of such person, but are not treated as outstanding for the purpose of computing the percentage ownership of any other person. Accordingly, DSUs, PSUs and RSUs are not included. |
| (2) | The number of shares held by Germain Lamonde includes 3,000,0003,191,666 subordinate voting shares held of record by 9356-9036 Québec Inc., 400,000 subordinate voting shares held of record by 9356-9010 QuébecG. Lamonde Investissements Financiers Inc., 316,247 subordinate voting shares held of record by 9356-8988 Québec Inc. and 164,561 subordinate voting shares held by Germain Lamonde. |
| (3) | The number of shares held by Germain Lamonde includes 24,743,00029,743,000 multiple voting shares held of record by G. Lamonde Investissements Financiers Inc., 5,000,000 multiple voting shares held of record by 9356-9036 Québec Inc. and 1,900,000 multiple voting shares held of record by Fiducie Germain Lamonde. |
(4) | The number of shares held by Pierre Plamondon includes 6,874 subordinate voting shares held of record by Fiducie Pierre Plamondon.9356-8988 Québec Inc. |
There are no options outstanding as at November 1, 2017.2019.
The following table presents information regarding Deferred Share Units, Performance Share Units and Restricted Share Units held by our Executive Chairman, our Chief Executive Officer, our Chief Financial Officer, our Directors, our two other most highly compensated executive officers, our other executive officers as a group, all of our Directors and executive officers as a group, as at November 1, 2017.2019.
| Name | DSUs | | RSUs |
| Number | | Percentage | Estimated Average Value at the time of grant US$/DSU (1) | | Number | | Percentage | Fair Value at the time of grant US$/RSU (2) |
| Germain Lamonde | – | | – | | – | | | – | | – | | – | |
| Philippe Morin | – | | – | | – | | | 109,890 | (3) | 6.56 | % | 3.43 | |
| – | | – | | – | | | 54,945 | (4) | 3.28 | % | 3.43 | |
| – | | – | | – | | | 47,529 | (5) | 2.84 | % | 4.01 | |
| – | | – | | – | | | 38,110 | (6) | 2.27 | % | 4.89 | |
| – | | – | | – | | | 4,764 | (7) | 0.28 | % | 4.89 | |
| – | | – | | – | | | 51,353 | (8) | 3.07 | % | 4.00 | |
| Pierre Plamondon | – | | – | | – | | | 19,541 | (9) | 1.17 | % | 5.28 | |
| – | | – | | – | | | 27,174 | (10) | 1.62 | % | 3.71 | |
| – | | – | | – | | | 29,046 | (11) | 1.73 | % | 3.23 | |
| – | | – | | – | | | 25,162 | (5) | 1.50 | % | 4.01 | |
| – | | – | | – | | | 27,266 | (8) | 1.63 | % | 4.00 | |
| Pierre-Paul Allard | 55,452 | (12) | 31.82 | % | 4.34 | | | – | | – | | – | |
| François Côté | 17,730 | (12) | 10.17 | % | 3.79 | | | – | | – | | – | |
| Angela Logothetis | 8,639 | (12) | 4.96 | % | 4.48 | | | – | | – | | – | |
| Claude Séguin | 29,855 | (12) | 17.13 | % | 4.02 | | | – | | – | | – | |
| Randy E. Tornes | 62,603 | (12) | 35.92 | % | 3.92 | | | – | | – | | – | |
| Willem Jan te Niet | – | | – | | – | | | 10,000 | (13) | 0.60 | % | 3.33 | |
| – | | – | | – | | | 16,681 | (5) | 1.00 | % | 4.01 | |
| – | | – | | – | | | 20,153 | (8) | 1.20 | % | 4.00 | |
| Dana Yearian | – | | – | | – | | | 17,411 | (9) | 1.04 | % | 5.28 | |
| – | | – | | – | | | 25,192 | (10) | 1.50 | % | 3.71 | |
| – | | – | | – | | | 30,058 | (11) | 1.79 | % | 3.23 | |
| – | | – | | – | | | 24,744 | (5) | 1.48 | % | 4.01 | |
| – | | – | | – | | | 25,302 | (8) | 1.51 | % | 4.00 | |
| Other executive officers as a group | – | | – | | – | | | 77,521 | (5) | 4.63 | % | 4.01 | |
| – | | – | | – | | | 87,081 | (8) | 5.20 | % | 4.00 | |
| – | | – | | – | | | 41,842 | (9) | 2.50 | % | 5.28 | |
| – | | – | | – | | | 57,510 | (10) | 3.43 | % | 3.71 | |
| – | | – | | – | | | 74,247 | (11) | 4.43 | % | 3.23 | |
| – | | – | | – | | | 1,925 | (14) | 0.11 | % | 4.36 | |
| – | | – | | – | | | 5,000 | (15) | 0.30 | % | 3.55 | |
| – | | – | | – | | | 1,946 | (16) | 0.12 | % | 3.27 | |
| – | | – | | – | | | 2,500 | (17) | 0.15 | % | 3.00 | |
| – | | – | | – | | | 4,000 | (18) | 0.24 | % | 4.01 | |
| – | | – | | – | | | 2,500 | (19) | 0.15 | % | 5.10 | |
| Total | 174,279 | | 100 | % | 4.09 | | | 960,393 | | 57.32 | % | 3.90 | |
| Name | DSUs | | PSUs | | RSUs |
| Number | Percentage | Estimated Average Value at the time of grant US$/DSU (1) | | Number | Percentage | Fair Value at the time of grant US$/PSU (2) | | Number | Percentage | Fair Value at the time of grant US$/RSU (3) |
| Germain Lamonde | – | | – | | – | | | – | | – | | – | | | – | | – | | – | |
| Philippe Morin | – | | – | | – | | | 28,965 | (4) | 20.54 | % | 3.83 | | | 54,945 | (5) | 3.11 | % | 3.43 | |
| – | | – | | – | | | | | | | | | | 51,831 | (6) | 2.93 | % | 3.43 | |
| – | | – | | – | | | | | | | | | | 45,786 | (7) | 2.59 | % | 4.01 | |
| – | | – | | – | | | | | | | | | | 38,110 | (8) | 2.16 | % | 4.89 | |
| – | | – | | – | | | | | | | | | | 4,764 | (9) | 0.27 | % | 4.89 | |
| – | | – | | – | | | | | | | | | | 51,353 | (10) | 2.91 | % | 4.00 | |
| – | | – | | – | | | | | | | | | | 34,892 | (11) | 1.98 | % | 3.17 | |
| – | | – | | – | | | | | | | | | | 43,615 | (12) | 2.47 | % | 3.17 | |
| – | | – | | – | | | | | | | | | | 28,965 | (13) | 1.64 | % | 3.83 | |
| – | | – | | – | | | | | | | | | | 15,000 | (14) | 0.85 | % | 3.83 | |
| Pierre Plamondon | – | | – | | – | | | 13,878 | (4) | 9.84 | % | 3.83 | | | 27,140 | (15) | 1.54 | % | 3.23 | |
| – | | – | | – | | | | | | | | | | 24,239 | (7) | 1.37 | % | 4.01 | |
| – | | – | | – | | | | | | | | | | 27,266 | (10) | 1.54 | % | 4.00 | |
| – | | – | | – | | | | | | | | | | 16,842 | (11) | 0.95 | % | 3.17 | |
| – | | – | | – | | | | | | | | | | 21,052 | (12) | 1.19 | % | 3.17 | |
| – | | – | | – | | | | | | | | | | 13,878 | (13) | 0.79 | % | 3.83 | |
| François Côté | 38,582 | (16) | 15.34 | % | 3.82 | | | – | | – | | – | | | – | | – | | – | |
| Angela Logothetis | 49,714 | (16) | 19.77 | % | 3.96 | | | – | | – | | – | | | – | | – | | – | |
| Claude Séguin | 64,211 | (16) | 25.53 | % | 3.93 | | | – | | – | | – | | | – | | – | | – | |
| Randy E. Tornes | 99,000 | (16) | 39.36 | % | 3.90 | | | – | | – | | – | | | – | | – | | – | |
| Willem Jan te Niet | – | | – | | – | | | 11,553 | (4) | 8.19 | % | 3.83 | | | 5,000 | (17) | 0.28 | % | 3.33 | |
| – | | – | | – | | | | | | | | | | 16,069 | (7) | 0.91 | % | 4.01 | |
| – | | – | | – | | | | | | | | | | 20,153 | (10) | 1.14 | % | 4.00 | |
| – | | – | | – | | | | | | | | | | 13,117 | (11) | 0.74 | % | 3.17 | |
| – | | – | | – | | | | | | | | | | 16,397 | (12) | 0.93 | % | 3.17 | |
| – | | – | | – | | | | | | | | | | 11,553 | (13) | 0.65 | % | 3.83 | |
| – | | – | | – | | | | | | | | | | 15,000 | (14) | 0.85 | % | 3.83 | |
| Dana Yearian | – | | – | | – | | | – | | – | | – | | | – | | – | | – | |
105
| Name | DSUs | | PSUs | | RSUs |
| Number | Percentage | Estimated Average Value at the time of grant US$/DSU (1) | | Number | Percentage | Fair Value at the time of grant US$/PSU (2) | | Number | Percentage | Fair Value at the time of grant US$/RSU (3) |
| Other executive officers as a group | – | | – | | – | | | 86,599 | (4) | 61.42 | % | 3.83 | | | 1,840 | (18) | 0.10 | % | 3.27 | |
| – | | – | | – | | | | | | | | | | 69,376 | (15) | 3.93 | % | 3.23 | |
| – | | – | | – | | | | | | | | | | 1,250 | (19) | 0.07 | % | 3.00 | |
| – | | – | | – | | | | | | | | | | 74,679 | (7) | 4.23 | % | 4.01 | |
| – | | – | | – | | | | | | | | | | 2,000 | (20) | 0.11 | % | 4.01 | |
| – | | – | | – | | | | | | | | | | 2,500 | (21) | 0.14 | % | 5.10 | |
| – | | – | | – | | | | | | | | | | 87,081 | (10) | 4.93 | % | 4.00 | |
| – | | – | | – | | | | | | | | | | 7,233 | (22) | 0.41 | % | 4.45 | |
| – | | – | | – | | | | | | | | | | 69,892 | (11) | 3.96 | % | 3.17 | |
| – | | – | | – | | | | | | | | | | 87,362 | (12) | 4.95 | % | 3.17 | |
| – | | – | | – | | | | | | | | | | 88,678 | (13) | 5.02 | % | 3.83 | |
| – | | – | | – | | | | | | | | | | 51,742 | (14) | 2.93 | % | 3.83 | |
| Total | 251,507 | | 100.00 | % | 3.90 | | | 140,995 | | 100.00 | % | 3.83 | | 1,140,600 | | 64.57 | % | 3.66 | |
All of the directors and executive officers as a group | – | | – | | – | | | 140,995 | | 100.00 | % | 3.83 | | | 54,945 | (5) | 3.11 | % | 3.43 | |
| – | | – | | – | | | – | | – | | – | | | 51,831 | (6) | 2.93 | % | 3.43 | |
| – | | – | | – | | | – | | – | | – | | | 160,773 | (7) | 9.10 | % | 4.01 | |
| – | | – | | – | | | – | | – | | – | | | 38,110 | (8) | 2.16 | % | 4.89 | |
| – | | – | | – | | | – | | – | | – | | | 4,764 | (9) | 0.27 | % | 4.89 | |
| – | | – | | – | | | – | | – | | – | | | 185,853 | (10) | 10.52 | % | 4.00 | |
| – | | – | | – | | | – | | – | | – | | | 134,743 | (11) | 7.63 | % | 3.17 | |
| – | | – | | – | | | – | | – | | – | | | 168,426 | (12) | 9.53 | % | 3.17 | |
| – | | – | | – | | | – | | – | | – | | | 143,074 | (13) | 8.10 | % | 3.83 | |
| – | | – | | – | | | – | | – | | – | | | 81,742 | (14) | 4.63 | % | 3.83 | |
| – | | – | | – | | | – | | – | | – | | | 96,516 | (15) | 5.46 | % | 3.23 | |
| – | | – | | – | | | – | | – | | – | | | 5,000 | (17) | 0.28 | % | 3.33 | |
| – | | – | | – | | | – | | – | | – | | | 1,840 | (18) | 0.10 | % | 3.27 | |
| – | | – | | – | | | – | | – | | – | | | 1,250 | (19) | 0.07 | % | 3.00 | |
| – | | – | | – | | | – | | – | | – | | | 2,000 | (20) | 0.11 | % | 4.01 | |
| – | | – | | – | | | – | | – | | – | | | 2,500 | (21) | 0.14 | % | 5.10 | |
| – | | – | | – | | | – | | – | | – | | | 7,233 | (22) | 0.41 | % | 4.45 | |
| Total | 251,507 | | 100.00 | % | 3.90 | | | 140,995 | | 100.00 | % | 3.83 | | 1,140,600 | | 64.57 | % | 3.66 | |
| | | | | | | | | | | | | | | | | | | | | |
| Name | DSUs | | RSUs |
| Number | | Percentage | Estimated Average Value at the time of grant US$/DSU (1) | | Number | | Percentage | Fair Value at the time of grant US$/RSU (2) |
All of the directors and executive officers as a group | – | | – | | – | | | 109,890 | (3) | 6.56 | % | 3.43 | |
| | – | | – | | – | | | 54,945 | (4) | 3.28 | % | 3.43 | |
| | – | | – | | – | | | 191,637 | (5) | 11.44 | % | 4.01 | |
| | – | | – | | – | | | 38,110 | (6) | 2.27 | % | 4.89 | |
| | – | | – | | – | | | 4,764 | (7) | 0.28 | % | 4.89 | |
| | – | | – | | – | | | 211,155 | (8) | 12.60 | % | 4.00 | |
| | – | | – | | – | | | 78,794 | (9) | 4.70 | % | 5.28 | |
| | – | | – | | – | | | 109,876 | (10) | 6.56 | % | 3.71 | |
| | – | | – | | – | | | 133,351 | (11) | 7.96 | % | 3.23 | |
| | – | | – | | – | | | 10,000 | (13) | 0.60 | % | 3.33 | |
| | – | | – | | – | | | 1,925 | (14) | 0.11 | % | 4.36 | |
| | – | | – | | – | | | 5,000 | (15) | 0.30 | % | 3.55 | |
| | – | | – | | – | | | 1,946 | (16) | 0.12 | % | 3.27 | |
| | – | | – | | – | | | 2,500 | (17) | 0.15 | % | 3.00 | |
| | – | | – | | – | | | 4,000 | (18) | 0.24 | % | 4.01 | |
| | – | | – | | – | | | 2,500 | (19) | 0.15 | % | 5.10 | |
| Total | 174,279 | | 100 | % | 4.09 | | | 960,393 | | 57.32 | % | 3.90 | |
| (1) | The estimated average value at the time of grant of a DSU is the average of the estimated value at the time of grant of a DSU which is determined based on the highest of the closing prices of the Subordinate Voting Shares on the Toronto Stock Exchange and the NASDAQ Global Select Market on the last trading day preceding the grant date, using the daily exchange rate of the Bank of Canada on the last trading day preceding the grant date to convert either the NASDAQ Global Select Market closing price to Canadian dollars or the Toronto Stock Exchange closing price to United States dollars, as required. The value at vesting of a DSU is equivalent to the market value of a Subordinate Voting Share when a DSU is converted to such Subordinate Voting Share. |
| (2) | The fair value at the time of grant of a PSU is equal to the market value of Subordinate Voting Shares at the time PSUs are granted. |
| (3) | The fair value at the time of grant of a RSU is equal to the market value of Subordinate Voting Shares at the time RSUs are granted. |
(3)(4) | Those PSUs will vest on the third anniversary date of the grant in October 2019 on the attainment of performance objectives as determined by the Board of Directors. |
| (5) | Those RSUs will vest at a rate of 1/2 annually commencing on the third anniversary date of the grant in November 2015. |
(4)(6) | Those RSUs will vest on the fifth anniversary date of the grant in November 2015 but are subject to early vesting on the third and fourth anniversary date of the grant on the attainment of performance objectives as determined by the Board of Directors. Accordingly, subject to the attainment of performance objectives, the first early vesting is up to 1/3 of the units on the third anniversary date of the grant and the second early vesting is up to 50% of the remaining units on the fourth anniversary date of the grant. |
(5)(7) | Those RSUs will vest on the fifth anniversary date of the grant in October 2016 but are subject to early vesting on the third and fourth anniversary date of the grant on the attainment of performance objectives as determined by the Board of Directors. Accordingly, subject to the attainment of performance objectives, the first early vesting is up to 1/3 of the units on the third anniversary date of the grant and the second early vesting is up to 50% of the remaining units on the fourth anniversary date of the grant. |
(6)(8) | Those RSUs will vest at a rate of 1/2 annually commencing on the third anniversary date of the grant in April 2017. |
(7)(9) | Those RSUs will vest on the fifth anniversary date of the grant in April 2017 but are subject to early vesting on the third and fourth anniversary date of the grant on the attainment of performance objectives as determined by the Board of Directors. Accordingly, subject to the attainment of performance objectives, the first early vesting is up to 1/3 of the units on the third anniversary date of the grant and the second early vesting is up to 50% of the remaining units on the fourth anniversary date of the grant. |
(8)(10) | Those RSUs will vest on the fifth anniversary date of the grant in October 2017 but are subject to early vesting on the third and fourth anniversary date of the grant on the attainment of performance objectives as determined by the Board of Directors. Accordingly, subject to the attainment of performance objectives, the first early vesting is up to 1/3 of the units on the third anniversary date of the grant and the second early vesting is up to 50% of the remaining units on the fourth anniversary date of the grant. |
(9)(11) | Those RSUs will vest on the fifththird anniversary date of the grant in October 2013 but are subject to early vesting2018. |
| (12) | Those RSUs will vest on the third and fourth anniversary date of the grant in October 2018 on the attainment of performance objectives as determined by the Board of Directors. Accordingly, subject to the attainment of performance objectives, the first early vesting is up to 1/3 of the units |
| (13) | Those RSUs will vest on the third anniversary date of the grant and the second early vesting is up to 50% of the remaining units on the fourth anniversary date of the grant.in October 2019. |
(10)(14) | Those RSUs will vest on the fifth anniversary date of the grant in October 2014 but are subject to early vesting on the third and fourth anniversary date of the grant on the attainment of performance objectives as determined by the Board of Directors. Accordingly, subject to the attainment of performance objectives, the first early vesting is up to 1/3 of the units on the third anniversary date of the grant and the second early vesting is up to 50% of the remaining units on the fourth anniversary date of the grant.in October 2019. |
(11)(15) | Those RSUs will vest on the fifth anniversary date of the grant in October 2015 but are subject to early vesting on the third and fourth anniversary date of the grant on the attainment of performance objectives as determined by the Board of Directors. Accordingly, subject to the attainment of performance objectives, the first early vesting is up to 1/3 of the units on the third anniversary date of the grant and the second early vesting is up to 50% of the remaining units on the fourth anniversary date of the grant. |
(12)(16) | Those DSUs will vest at the time Director ceases to be a member of the Board of the Corporation. |
(13)(17) | Those RSUs will vest at a rate of 1/2 annually commencing on the third anniversary date of the grant in August 2016. |
(14) | Those RSUs will vest at a rate of 1/2 annually commencing on the third anniversary date of the grant in January 2014. |
(15) | Those RSUs will vest at a rate of 1/2 annually commencing on the third anniversary date of the grant in January 2015. |
(16)(18) | Those RSUs will vest on the fifth anniversary date of the grant in July 2015 but are subject to early vesting on the third and fourth anniversary date of the grant on the attainment of performance objectives as determined by the Board of Directors. Accordingly, subject to the attainment of performance objectives, the first early vesting is up to 1/3 of the units on the third anniversary date of the grant and the second early vesting is up to 50% of the remaining units on the fourth anniversary date of the grant. |
(17)(19) | Those RSUs will vest at a rate of 1/2 annually commencing on the third anniversary date of the grant in January 2016. |
(18)(20) | Those RSUs will vest at a rate of 1/2 annually commencing on the third anniversary date of the grant in October 2016. |
(19)(21) | Those RSUs will vest at a rate of 1/2 annually commencing on the third anniversary date of the grant in January 2017. |
| (22) | Those RSUs will vest at a rate of 1/2 annually commencing on the third anniversary date of the grant in January 2018. |
Escrowed Securities
To our knowledge as at November 1, 2017, 528,713 subordinate voting shares2019, none of the equity securities of the Company were held in escrow.
| Major Shareholders and Related Party Transactions |
The following table presents information regarding the beneficial ownership of our share capital as at November 1, 20172019 by persons or groups of affiliated persons known by us to own more than 5% of our voting shares.
| | | Multiple Voting Shares Beneficially Owned (1) | | | Subordinate Voting Shares Beneficially Owned (1) | | | Total Percentage of Voting Power | |
| | | | | | | | | | |
| | | | | | | | | | | | | | | |
| | | | | | | | | | | | | | | | |
Germain Lamonde (2) | | | 31,643,000 | | | | 100.00 | % | | | 3,672,474 | | | | 15.38
| % | | | 94.06
| % |
9356-8988 Quebec Inc. (3) | | | 1,900,000 | | | | 6.00 | % | | | 316,247 | | | | 1.32
| % | | | 5.68
| % |
G. Lamonde Investissements Financiers Inc. (3) | | | 29,743,000 | | | | 94.00 | % | | | 3,191,666 | | | | 13.37
| % | | | 88.34
| % |
| Graham Partners LP (Harber Capital) | | | – | | | | – | | | | 1,295,345
| | | | 5.43
| % | | | * | |
| | | Multiple Voting Shares Beneficially Owned (1) | | | Subordinate Voting Shares Beneficially Owned (1) | | | Total Percentage of Voting Power | |
| | | | | | | | | | |
| Name | | Number | | | Percent | | | Number | | | Percent | | | Percent | |
| | | | | | | | | | | | | | | | |
Germain Lamonde (2) | | | 31,643,000 | | | | 100.00 | % | | | 3,769,508 | | | | 16.23 | % | | | 94.27 | % |
9356-8988 Quebec Inc. (3) | | | – | | | | – | | | | 316,247 | | | | 1.36 | % | | | * | |
9356-9010 Quebec Inc. (3) | | | – | | | | – | | | | 400,000 | | | | 1.72 | % | | | * | |
9356-9036 Quebec Inc. (3) | | | 5,000,000 | | | | 15.80 | % | | | 3,000,000 | | | | 12.92 | % | | | 15.60 | % |
Fiducie Germain Lamonde (4) | | | 1,900,000 | | | | 6.00 | % | | | – | | | | – | | | | 5.59 | % |
G. Lamonde Investissements Financiers Inc. (3) | | | 24,743,000 | | | | 78.19 | % | | | – | | | | – | | | | 72.85 | % |
| EdgePoint Investment Group, Inc. | | | – | | | | – | | | | 3,011,136 | | | | 12.97 | % | | | * | |
| Soros Fund Management | | | – | | | | – | | | | 2,306,000 | | | | 9.93 | % | | | * | |
| Renaissance Technologies | | | – | | | | – | | | | 1,543,200 | | | | 6.64 | % | | | * | |
| (1) | Beneficial ownership is determined in accordance with the rules of the SEC and generally includes voting or investment power with respect to securities. Options that are currently exercisable within 60 days of November 1, 20172019 (including options that have an exercise price above the market price) are deemed to be outstanding and to be beneficially owned by the person holding such options for the purpose of computing the percentage ownership of such person, but are not treated as outstanding for the purpose of computing the percentage ownership of any other person. |
| (2) | The number of shares held by Germain Lamonde includes 5,000,000 multiple voting shares held of record by 9356-9036 Quebec Inc., 1,900,000 multiple voting shares held of record by Fiducie Germain Lamonde and 24,743,0009356-8988 Quebec Inc., 29,743,000 multiple voting shares held of record by G. Lamonde Investissements Financiers Inc., 316,247 subordinate voting shares held of record by 9356-8988 Quebec Inc., 3,191,666 subordinate voting shares held of record by G. Lamonde Investissements Financiers Inc. and 164,561 subordinate voting shares held directly by Germain Lamonde. |
| (3) | 9356-8988 Quebec Inc., 9356-9010 Quebec Inc., 9356-9036 Quebec Inc. and G. Lamonde Investissements Financiers Inc. are companies controlled by Mr. Lamonde. |
(4) | Fiducie Germain Lamonde is a family trust for the benefit of Mr. Lamonde and members of his family. |
Each multiple voting share is convertible at the option of the holder into one subordinate voting share. Holders of our subordinate voting shares are entitled to one vote per share and holders of our multiple voting shares are entitled to ten votes per share.
Ever since EXFO became a publicly traded company in June 2000, including the most recent three-year period, Mr. Lamonde and his related companies havehas maintained majority ownership. Mr. Lamonde converted five million multiple voting shares into subordinate voting shares in fiscal 2011 and sold one million of those subordinate voting shares on the open market. (Only subordinate voting shares can be traded on the open market). According to publicly available information, EdgePoint Investment Group remains EXFO'sGraham Partners LP (Harber Capital) is EXFO’s second-largest shareholder with 3.01.3 million subordinate voting shares or 13.0%5.4% of the public float. Soros Fund Management owns 9.9% (2.3 million shares) of the public float, while Renaissance Technologies holds 6.6% of the public float (1.5 million shares).
As at November 13, 2017, 23,224,39611, 2019, 23,869,117 subordinate voting shares were outstanding. Approximately 93.04% (21,607,208)96.33% (22,992,223) of our subordinate voting shares were held in bearer form and the remainder (1,617,188(876,894 subordinate voting shares) was held by 224219 record holders. As at November 13, 2017,11, 2019, we believe approximately 59.15%57.57% of our outstanding subordinate voting shares were held in the United States.
| Related Party Transactions |
Indebtedness of Directors, Executive Officers and Employees
From September 1, 20162018 through the date of this Annual Report, none of our directors, executive officers, associates or affiliates had any material interest in any transaction with us or in any proposed transaction which has materially affected or could materially affect us.
| C. | InterestsInterests of Experts and Counsel |
Not applicable.
109
Item 8.Financial Information
| Consolidated Statements and Other Financial Information |
See Item 18, "Financial Statements"“Financial Statements” for certain other information required by this item.
Export Sales
Export and domestic sales in thousands of US dollars and as a percentage of sales are as follows:
| | | Years ended August 31, | | | Years ended August 31, | |
| | | 2017 | | | 2016 | | | 2015 | | | 2019 | | | 2018 | | | 2017 | |
| | | | | | | | | | | | | | | | | | | | | | | | | | | | | | | | | | | | | |
| Export Sales | | $ | 220,715 | | | | 91 | % | | $ | 214,566 | | | | 92 | % | | $ | 202,367 | | | | 91 | % | | $ | 270,977 | | | 94 | % | | $ | 251,121 | | | 93 | % | | $ | 220,715 | | | 91 | % |
| Domestic Sales | | | 22,586 | | | | 9 | | | | 18,027 | | | | 8 | | | | 19,722 | | | | 9 | | | | 15,913 | | | | 6 | | | | 18,425 | | | | 7 | | | | 22,586 | | | | 9 | |
| | | $ | 243,301 | | | | 100 | % | | $ | 232,583 | | | | 100 | % | | $ | 222,089 | | | | 100 | % | | $ | 286,890 | | | | 100 | % | | $ | 269,546 | | | | 100 | % | | $ | 243,301 | | | | 100 | % |
Legal Proceedings
There are no legal or arbitration proceedings pending or threatened of which we are aware which may have or have had a significant effect on our financial position.
Dividend Policy
We do not currently anticipate paying dividends for at least the next three years. Our current intention is to reinvest any earnings in our business long-term growth. Any future determination by us to pay dividends will be at the discretion of our Board of Directors and in accordance with the terms and conditions of any outstanding indebtedness and will depend on our financial condition, results of operations, capital requirements and such other functions as our Board of Directors considers relevant.
In September 2018, as part of our fiscal 2018 restructuring plan and the shutdown of our operations in Toronto, Canada, we entered into a binding agreement to sell one of our buildings for net proceeds of $3.3 million. The transfer of ownership occurred during fiscal 2019 and resulted in a gain of $1.7 million that was recorded in interest and other income-expense line item in our consolidated statement of earnings for that year.
In addition, in fiscal 2019, as part of our fiscal 2018 restructuring plan and the shutdown of some of our facilities in the United States, we transferred the ownership of certain intellectual property held in the United States to Canada. This created a deductible tax asset in Canada and resulted in the recognition of a one-time deferred income tax recovery of $2.4 million in fiscal 2019 as the recovery of this asset is probable. This deferred income tax recovery was recorded in our consolidated statement of earnings for that year.
On October 31, 2016,January 8, 2019, we acquired substantially allannounced that our Board of Directors approved a share repurchase program, by way of a normal course issuer bid on the assetsopen market of Absolute Analysis Inc., a privately held company located in United States, supplying solutions for radio frequency testing of fiber-based radio access networks which will extend our commitmentup to meet need of mobile network operators deploying fiber-based fronthaul networks and radio access networks architectures. This acquisition-date fair value of the total consideration transferred amounted to $8.5 million and consisted of $5.0 million in cash and the issuance of 793,0701,200,000 subordinate voting shares valued at $3.5 million.
the prevailing market price. The period of the normal course issuer bid commenced on January 14, 2019 and will end on January 13, 2020. From January 14, 2019 through November 11, 2019, we spent approximately US$0.6 million (including fees) to repurchase 127,604 subordinate voting shares.
On March 2, 2017, we acquired all issued and outstanding shares of Ontology Partners Limited (Ontology), a privately held company located in the United Kingdom, a supplier of real-time network topology discovery and service-chain mapping. The acquisition-date fair value of the total consideration amounted to $9.2 million and consisted of $7.8 million in cash, net of Ontology's cash of $2.2 million at the acquisition date, plus a cash contingent consideration based on certain sales volume of Ontology products over the 12-month period following the acquisition, valued at $1.4 million at the acquisition date.
On March 29, 2017, we announced the appointment of Philippe Morin as our new Chief Executive Officer (CEO), effective April 1, 2017. Mr. Morin, who has more than 25 years of experience in the telecommunications industry, initially was named EXFO's Chief Operating Officer in November 2015. Prior to joining EXFO, Mr. Morin was Senior Vice-President of Worldwide Sales and Field Operations at Ciena. He also held senior management positions at Nortel Networks, including President of the Optical Networking Division. EXFO founder Germain Lamonde, who had fulfilled the roles of CEO and Chairman of the Board for more than 30 years, became Executive Chairman. He maintains leadership of EXFO's acquisition strategy and remains actively involved in defining EXFO's growth initiatives, customer outreach as well as corporate governance.
On May 2, 2017, we announced a restructuring plan to streamline our passive monitoring solutions portfolio, which falls under our protocol-layer product line. This plan resulted in severance expenses of $4.1 million and inventory write-offs of $1.0 million, for total restructuring charges of $5.1 million during the year. As result of this plan, we expect annual savings of approximately $9 million.
On September 8, 2017, we acquired 33.1% of all issuedItem 9.The Offer and outstanding shares of Astellia SA ("Astellia"), a publicly traded company on the NYSE Euronext Paris stock exchange. Astellia is a provider of network and subscriber intelligence enabling mobile operators to drive service quality, maximize operational efficiency, reduce churn and develop revenue. Its vendor-independent, real-time monitoring and troubleshooting solution is used to optimize networks end-to-end form radio to core. The acquisition-date fair value of the consideration transferred amounted to €8.6 million (US$10.3 million) in an all-cash deal.
On October 2, 2017, we acquired all issued and outstanding shares of Yenista Optics S.A.S (Yenista), a privately held company located in France, a supplier of advanced optical test equipment for the research and development and manufacturing markets. Its portfolio includes benchtop optical spectrum analyzers, tunable lasers, tunable filters and passive optical component test systems for NEMs and optical component vendors. The acquisition-date fair value of the total consideration amounted to €9.4 million (US$11.1 million) and consisted of €8.3 million (US$9.7 million) in cash, net of Yenista's cash of €1.1 million (US$1.4 million) at the acquisition date.Listing
On October 10, 2017, we reached an agreement with Astellia to acquire Astellia's remaining shares at a share price of €10, for total consideration of €17.3 million (approximately US$20 million) by way of a public tender offer. The public offering will open in late calendar 2017 or early 2018, subject to the approval of French foreign investment authorities and permission from l'Autorité des marchés financiers. If the public tender offering is successful, the settlement of the acquisition is expected to take place early in calendar 2018.
On October 25, 2017, we modified certain credit facilities whereby existing lines of credits, that provided advances up to CA$4.8 million (US$3.8 million) and up to US$6.0 million for operating purposes, were cancelled and replaced by credit facility of CA$28.9 million (US$23.1 million) mainly for the acquisition of the remaining shares of Astellia under the public tender offer.
Not Applicable, except for Item 9A (4) and Item 9C.
| Offer and Listing Details |
| | NASDAQ (US$) | TSX (CA$) |
| | High | Low | High | Low |
| | | | | |
| September 1, 2014 to August 31, 2015 | 4.40 | 2.45 | 4.92 | 3.32 |
| September 1, 2015 to August 31, 2016 | 4.32 | 2.57 | 5.44 | 3.61 |
| September 1, 2016 to August 31, 2017 | 6.05 | 3.42 | 7.99 | 4.41 |
| September 1, 2017 to August 31, 2018 | 4.70 | 3.20 | 5.81 | 4.29 |
| September 1, 2018 to August 31, 2019 | 4.97 | 2.66 | 6.70 | 3.51 |
| | | | | |
September 1, 2017 to November 30, 2017 (2018 1st Quarter) | 4.45 | 3.75 | 5.61 | 4.79 |
December 1, 2017 to February 28, 2018 (2018 2nd Quarter) | 4.70 | 4.06 | 5.81 | 5.25 |
March 1, 2018 to May 31, 2018 (2018 3rd Quarter) | 4.40 | 3.35 | 5.63 | 4.35 |
June 1, 2018 to August 31, 2018 (2018 4th Quarter) | 4.41 | 3.20 | 5.77 | 4.29 |
| | | | | |
September 1, 2018 to November 30, 2018 (2019 1st Quarter) | 4.45 | 2.66 | 5.77 | 3.51 |
December 1, 2019 to February 28, 2019 (2019 2nd Quarter) | 3.90 | 2.74 | 5.16 | 3.66 |
March 1, 2019 to May 31, 2019 (2019 3rd Quarter) | 4.97 | 3.20 | 6.70 | 4.30 |
June 1, 2019 to August 31, 2019 (2019 4th Quarter) | 4.30 | 3.41 | 5.61 | 4.53 |
| | | | | |
| May 2019 | 4.80 | 3.86 | 6.47 | 5.20 |
| June 2019 | 4.25 | 3.51 | 5.61 | 4.77 |
| July 2019 | 4.30 | 3.47 | 5.47 | 4.53 |
| August 2019 | 3.89 | 3.41 | 5.20 | 4.67 |
| September 2019 | 3.99 | 3.47 | 5.27 | 4.80 |
| October 2019 | 4.30 | 3.61 | 5.59 | 4.81 |
| November 2019 (until November 11) | 4.38 | 4.03
| 5.75
| 5.35
|
| | NASDAQ (US$) | | TSX (CA$) |
| | High | Low | | High | Low |
| | | | | | |
| September 1, 2012 to August 31, 2013 | 5.90 | 4.00 | | 5.86 | 4.14 |
| September 1, 2013 to August 31, 2014 | 5.70 | 4.13 | | 5.88 | 4.51 |
| September 1, 2014 to August 31, 2015 | 4.40 | 2.45 | | 4.92 | 3.32 |
| September 1, 2015 to August 31, 2016 | 4.32 | 2.57 | | 5.44 | 3.61 |
| September 1, 2016 to August 31, 2017 | 6.05 | 3.42 | | 7.99 | 4.41 |
| | | | | | |
September 1, 2015 to November 30, 2015 (2016 1st Quarter) | 3.43 | 2.77 | | 4.55 | 3.61 |
December 1, 2015 to February 29, 2016 (2016 2nd Quarter) | 3.42 | 2.57 | | 4.51 | 3.70 |
March 1, 2016 to May 31, 2016 (2016 3rd Quarter) | 4.32 | 2.85 | | 5.44 | 3.85 |
June 1, 2016 to August 31, 2016 (2016 4th Quarter) | 4.08 | 3.16 | | 5.25 | 4.12 |
| | | | | | |
September 1, 2016 to November 30, 2016 (2017 1st Quarter) | 4.45 | 3.42 | | 6.00 | 4.41 |
December 1, 2016 to February 28, 2017 (2017 2nd Quarter) | 5.90 | 4.10 | | 7.66 | 5.51 |
March 1, 2017 to May 31, 2017 (2017 3rd Quarter) | 6.05 | 4.55 | | 7.99 | 6.08 |
June 1, 2017 to August 31, 2017 (2017 4th Quarter) | 5.30 | 3.83 | | 7.15 | 4.84 |
| | | | | | |
| May 2017 | 4.93 | 4.60 | | 6.65 | 6.25 |
| June 2017 | 5.30 | 4.70 | | 7.15 | 6.05 |
| July 2017 | 4.50 | 4.10 | | 5.77 | 5.13 |
| August 2017 | 4.70 | 3.83 | | 5.80 | 4.84 |
| September 2017 | 4.35 | 3.75 | | 5.32 | 4.79 |
| October 2017 | 4.15 | 3.85 | | 5.16 | 4.94 |
| November 2017 (until November 13) | 4.30 | 3.85 | | 5.45 | 5.00 |
Our subordinate voting shares have been quoted on the NASDAQ Global Select Market under the symbol EXFO and listed on The Toronto Stock Exchange under the symbol EXF since our initial public offering on June 29, 2000. Prior to that time, there was no public market for our subordinate voting shares. The table above sets forth, for the periods indicated, the high and low closing sales prices per subordinate voting share as reported on the NASDAQ Global Select Market and the Toronto Stock Exchange.
On November 13, 2017,11, 2019, the last reported sale price for our subordinate voting shares on the NASDAQ Global Select Market was US$4.154.21 per share and the last reported sale price for our subordinate voting shares on the Toronto Stock Exchange was CA$5.355.59 per share.
Not Applicable
| Memorandum and Articles of Association |
Our Amended Articles of Incorporation and By-laws are incorporated by reference to our registration statement on Form F-1 dated June 9, 2000 (File No. 333‑38956) and amendments to our Articles by reference to Exhibit 1.4 to our fiscal year 2009 Annual Report on Form 20-F and Exhibit 1.5 to our fiscal year 2010 Annual Report on Form 20-F.
Except as otherwise disclosed in this Annual Report and our consolidated financial statements and notes included elsewhere in this Annual Report, we have no other material contracts.
Subject to the following paragraph, there is no law or governmental decree or regulation in Canada that restricts the export or import of capital, or affects the remittance of dividends, interest or other payments to non-resident holders of our subordinate voting shares, other than withholding tax requirements.
There is no limitation imposed by Canadian law or by our articles of incorporation or our other charter documents on the right of a non-resident to hold or vote subordinate voting shares, other than as provided by the Investment Canada Act, the North American Free Trade Agreement Implementation Act (Canada) and the World Trade Organization Agreement Implementation Act. The Investment Canada Act requires notification and, in certain cases, advance review and approval by the Government of Canada of an investment to establish a new Canadian business by a non-Canadian or of the acquisition by a "non-Canadian"“non-Canadian” of "control"“control” of a "Canadian business"“Canadian business”, all as defined in the Investment Canada Act. Generally, the threshold for review will be higher in monetary terms for a member of the World Trade Organization or North American Free Trade Agreement.
United States Taxation
The information set forth below under the caption "United“United States Taxation"Taxation” is a summary of the material U.S. federal income tax consequences of the ownership and disposition of subordinate voting shares by a U.S. Holder, as defined below. These discussions are not a complete analysis or listing of all of the possible tax consequences of such transactions and do not address all tax considerations that may be relevant to particular holders in light of their personal circumstances or to persons that are subject to special tax rules. In particular, the information set forth under the caption "United“United States Taxation"Taxation” deals only with U.S. Holders that hold subordinate voting shares as capital assets within the meaning of Section 1221 of the Internal Revenue Code of 1986, as amended (the "Code"“Code”), and who do not at any time own, individually, nor are treated as owning, 10% or more of the total combined voting power of all classes of our stock entitled to vote.vote or 10% or more of the total value of shares of all classes of our stock.
113112
In addition, this description of U.S. tax consequences does not address the tax treatment of special classes of U.S. Holders, such as financial institutions, regulated investment companies, traders in securities who elect to mark-to-market their securities, tax-exempt entities, insurance companies, partnerships, persons holding subordinate voting shares as part of a hedging, integrated or conversion transaction or as part of a "straddle,"“straddle,” U.S. expatriates, persons subject to the alternative minimum tax, persons who acquired their subordinate voting shares through the exercise or cancellation of employee stock options or otherwise as compensation for services, dealers or traders in securities or currencies and holders whose "functional currency"“functional currency” is not the U.S. dollar. This summary does not address U.S. estate and gift tax consequences or tax consequences under any state and local tax laws or non-U.S. tax laws.
As used in this section, the term "U.S. Holder"“U.S. Holder” means a beneficial owner of subordinate voting shares that is for U.S. federal income tax purposes:
| (a) | an individual citizen or resident of the United States; |
| (b) | a corporation created or organized under the laws of the United States or any state thereof and the District of Columbia; |
| (c) | an estate the income of which is subject to United States federal income taxation regardless of its source; |
| (d) | a trust if (1) a court within the United States is able to exercise primary supervision over its administration and one or more U.S. persons as described in Section 7701 (a) (30) of the Code have authority to control all substantial decisions of the trust or (2) the trust has a valid election in effect under applicable U.S. Treasury regulations to be treated as a U.S. person; or |
| (e) | any other person whose worldwide income or gain is otherwise subject to U.S. federal income taxation on a net income basis. |
If a partnership or other flow-through entity holds subordinate voting shares, the U.S. federal income tax treatment of a partner or other owner will generally depend upon the status of the partner or other owner and upon the activities of the partnership or other flow-through entity. If you are a partner or other owner of a partnership or other flow-through entity holding subordinate voting shares, you should consult your tax advisor.
Holders of subordinate voting shares who are not U.S. Holders, sometimes referred to as "Non-U.S. Holders"“Non-U.S. Holders”, should also consult their own tax advisors, particularly as to the applicability of any tax treaty.
The following discussion is based upon:
· | U.S. judicial decisions; |
U.S. judicial decisions;
· | administrative pronouncements; |
administrative pronouncements;
· | existing and proposed Treasury regulations; and |
existing and proposed Treasury regulations; and
· | the Canada – U.S. Income Tax Treaty. |
the Canada – U.S. Income Tax Treaty.
Any of the above is subject to change, possibly with retroactive effect, so as to result in U.S. federal income tax consequences different from those discussed below. We have not requested, and will not request, a ruling from the U.S. Internal Revenue Service (the "IRS"“IRS”) with respect to any of the U.S. federal income tax consequences described below, and as a result, there can be no assurance that the IRS will not disagree with or challenge any of the conclusions we have reached and described here.
114113
The following discussion is for general information only and is not intended to be, nor should it be construed to be, legal or tax advice to any holder of subordinate voting shares and no opinion or representation with respect to the U.S. federal income tax consequences to any holder is made. Holders of subordinate voting shares are urged to consult their tax advisors as to the particular consequences to them under U.S. federal, state, local and applicable non-U.S. tax laws of the acquisition, ownership and disposition of subordinate voting shares.
Dividends
Subject to the discussion of passive foreign investment companies below, the gross amount of any distribution paid by us to a U.S. Holder will generally be subject to U.S. federal income tax as foreign source dividend income to the extent paid out of our current or accumulated earnings and profits, as determined under U.S. federal income tax principles. Such income will be includable in the gross income of a U.S. Holder on the day received by the U.S. Holder. The amount of any distribution of property other than cash will be the fair market value of such property on the date of the distribution. In the case of a taxable corporate U.S. Holder, such dividends will be taxable as ordinary income and will not be eligible for the corporate dividends received deduction, which is generally allowed to U.S. corporate shareholders on dividends received from a domestic corporation. In the case of a non-corporate U.S. Holder, including individuals, such dividends should generally be eligible for a maximum tax rate of 23.8% provided, as we believe to be the case, that we are not a "passive“passive foreign investment company"company”. To the extent that an amount received by a U.S. Holder exceeds such holder'sholder’s allocable share of our current and accumulated earnings and profits, such excess will be applied first to reduce such U.S. Holder'sHolder’s tax basis in his subordinate voting shares, thereby increasing the amount of gain or decreasing the amount of loss recognized on a subsequent disposition of the subordinate voting shares. Then, to the extent such distribution exceeds such U.S. Holder'sHolder’s tax basis, it will be treated as capital gain. We do not currently maintain, nor do we plan on maintaining, calculations of our earnings and profits for U.S. federal income tax purposes.
The gross amount of distributions paid in Canadian dollars, or any successor or other foreign currency, will be included in the income of such U.S. Holder in a U.S. dollar amount calculated by reference to the spot exchange rate in effect on the day the distributions are paid regardless of whether the payment is in fact converted into U.S. dollars. If the Canadian dollars, or any successor or other foreign currency, are converted into U.S. dollars on the date of the payment, the U.S. Holder should not be required to recognize any foreign currency gain or loss with respect to the receipt of Canadian dollars as distributions. The U.S. Holder will have a basis in any Canadian dollars or other foreign currency distributed equal to their U.S. dollar value on the payment date. If, instead, the Canadian dollars are converted at a later date, any currency gains or losses resulting from the conversion of the Canadian dollars will be treated as U.S. source ordinary income or loss. U.S. Holders are urged to consult their own tax advisors concerning the U.S. tax consequences of acquiring, holding and disposing of Canadian dollars.
A U.S. Holder may be entitled to deduct, or claim a foreign tax credit for, Canadian taxes that are withheld on dividends received by the U.S. Holder, subject to applicable limitations in the Code. The limitation on foreign taxes eligible for credit is calculated separately with respect to specific classes of income. For this purpose, such dividends should generally constitute foreign source "passive“passive category income"income” or, in the case of certain U.S. Holders, "general“general category income"income”. The rules governing the foreign tax credit are complex. U.S. Holders are urged to consult their tax advisors regarding the availability of the foreign tax credit under their particular circumstances.
A Non-U.S. Holder of subordinate voting shares generally will not be subject to U.S. federal income or withholding tax on dividends received on subordinate voting shares unless such income is effectively connected with the conduct by such Non-U.S. Holder of a trade or business in the United States.
115114
Sale or Exchange
A U.S. Holder'sHolder’s initial tax basis in the subordinate voting shares will generally be cost to the holder. A U.S. Holder'sHolder’s adjusted tax basis in the subordinate voting shares will generally be the same as cost, but may differ for various reasons including the receipt by such holder of a distribution that was not made up wholly of earnings and profits as described above under the heading "Dividends."“Dividends.” Subject to the discussion of passive foreign investment companies below, gain or loss realized by a U.S. Holder on the sale or other disposition of subordinate voting shares will be subject to U.S. federal income taxation as capital gain or loss in an amount equal to the difference (if any) between the U.S. Holder'sHolder’s adjusted tax basis (determined in U.S. dollars) in the subordinate voting shares and the U.S. dollar value of the amount realized on the disposition of such subordinate voting shares. Capital gains of non-corporate U.S. Holders, including individuals, derived with respect to a sale, exchange or other disposition of subordinate voting shares held for more than one year are subject to a maximum federal income tax rate of 23.8%. The deductibility of capital losses is subject to limitations. In the case of a non-corporate U.S. Holder, the federal tax rate applicable to capital gains will depend upon:
· | the holder's holding period for the subordinate voting shares, with a preferential rate available for subordinate voting shares held for more than one year; and |
the holder’s holding period for the subordinate voting shares, with a preferential rate available for subordinate voting shares held for more than one year; and
· | the holder's marginal tax rate for ordinary income. |
the holder’s marginal tax rate for ordinary income.
Any gain realized will generally be treated as U.S. source gain, and loss realized by a U.S. Holder generally also will be treated as from sources within the United States.
The ability of a U.S. Holder to utilize foreign taxes as a credit to offset U.S. taxes is subject to complex limitations and conditions. The consequences of the separate limitation calculation will depend upon the nature and sources of each U.S. Holder's income and the deductions allocable thereto. Alternatively, a U.S. Holder may elect to claim all foreign taxes paid as an itemized deduction in lieu of claiming a foreign tax credit. A deduction does not reduce U.S. tax on a dollar-for-dollar basis like a tax credit, but the availability of the deduction is not subject to the same conditions and limitations applicable to foreign tax credits.
If a U.S. Holder receives any foreign currency on the sale of subordinate voting shares, such U.S. Holder may recognize ordinary income or loss as a result of currency fluctuations between the date of the sale of subordinate voting shares and the date the sale proceeds are converted into U.S. dollars.
A Non-U.S. Holder of subordinate voting shares generally will not be subject to U.S. federal income or withholding tax on any gain realized on the sale or exchange of such subordinate voting shares unless:
· | such gain is effectively connected with the conduct by such Non-U.S. Holder of a trade or business in the United States; or |
such gain is effectively connected with the conduct by such Non-U.S. Holder of a trade or business in the United States; or
· | in the case of any gain realized by an individual Non-U.S. Holder, such Non-U.S. Holder is present in the United States for 183 days or more in the taxable year of such sale and certain other conditions are met. |
in the case of any gain realized by an individual Non-U.S. Holder, such Non-U.S. Holder is present in the United States for 183 days or more in the taxable year of such sale and certain other conditions are met.
Passive Foreign Investment Company
We believe that our subordinate voting shares should not currently be treated as stock of a passive foreign investment company for United States federal income tax purposes, but this conclusion is a factual determination made annually and thus may be subject to change based on future operations as well as the composition and valuation of our assets. In particular, a significant portion of our gross assets is comprised of cash and short-term investments, which the PFIC rules treat as passive without regard to the purpose for which we hold those assets. If the proportion of these passive assets were to increase relative to the fair market value of our other assets, we may be treated as a passive foreign investment company. In general, we will be a passive foreign investment company with respect to a U.S. Holder if, for any taxable year in which the U.S. Holder holds our subordinate voting shares, either:
at least 75% of our gross income for the taxable year is passive income; or
at least 50% of the average value of our assets is attributable to assets that produce or are held for the production of passive income.
· | at least 75% of our gross income for the taxable year is passive income; or |
· | at least 50% of the average value of our assets is attributable to assets that produce or are held for the production of passive income. |
For this purpose, passive income includes, among other things, income such as:
· | rents or royalties, other than certain rents or royalties derived from the active conduct of trade or business; |
rents or royalties, other than certain rents or royalties derived from the active conduct of trade or business;
· | gains from assets that produce passive income. |
gains from assets that produce passive income.
If a non-U.S. corporation owns at least 25% by value of the stock of another corporation, the non-U.S. corporation is treated for purposes of the passive foreign investment company tests as owning its proportionate share of the assets of the other corporation and as receiving directly its proportionate share of the other corporation'scorporation’s income.
If we are treated as a passive foreign investment company, a U.S. Holder that did not make a qualified electing fund election, if available, or a mark-to-market election, as described below, would be subject to special rules with respect to:
· | any gain realized on the sale or other disposition of subordinate voting shares; and |
any gain realized on the sale or other disposition of subordinate voting shares; and
· | any "excess distribution" by us to the U.S. Holder. |
any “excess distribution” by us to the U.S. Holder.
Generally, "excess distributions"“excess distributions” are the parts of any distributions to the U.S. Holder in respect of the subordinate voting shares during a single taxable year that are greater than 125% of the average annual distributions received by the U.S. Holder in respect of the subordinate voting shares during the three preceding taxable years or, if shorter, the U.S. Holder'sHolder’s holding period for the subordinate voting shares.
Under the passive foreign investment company rules,
· | the gain or excess distribution would be allocated ratably over the U.S. Holder's holding period for the subordinate voting shares; |
the gain or excess distribution would be allocated ratably over the U.S. Holder’s holding period for the subordinate voting shares;
· | the amount allocated to the taxable year in which the gain or excess distribution was realized and to taxable years prior to the first year in which we were classified as a PFIC would be taxable as ordinary income; and |
the amount allocated to the taxable year in which the gain or excess distribution was realized and to taxable years prior to the first year in which we were classified as a PFIC would be taxable as ordinary income; and
· | the amount allocated to each other prior year would be subject to tax as ordinary income at the highest tax rate in effect for that year, and the interest charge generally applicable to underpayments of tax would be imposed in respect of the tax attributable to each such year. |
the amount allocated to each other prior year would be subject to tax as ordinary income at the highest tax rate in effect for that tax year, and the interest charge generally applicable to underpayments of tax would be imposed in respect of the tax attributable to each such year.
A U.S. Holder owning actually or constructively "marketable stock"“marketable stock” of a passive foreign investment company may be able to avoid the imposition of the passive foreign investment company tax rules described above by making a mark-to-market election. Generally, pursuant to this election, a U.S. Holder would include in ordinary income or, subject to the following sentence, loss, for each taxable year during which such stock is held, an amount equal to the difference as of the close of the taxable year between the fair market value of its stock and its adjusted tax basis in such stock. Any mark-to-market loss is treated as an ordinary deduction, but only to the extent of the ordinary income that the U.S. Holder has included pursuant to the election in prior taxable years. The electing U.S. Holder'sHolder’s basis in its stock would be adjusted to reflect any of these income or loss amounts. Holders desiring to make the mark-to-market election should consult their tax advisors with respect to the application and effect of making such election.
In the case of a U.S. Holder who does not make a mark-to-market election, the special passive foreign investment company tax rules described above will not apply to such U.S. Holder if the U.S. Holder makes an election to have us treated as a qualified electing fund and we provide certain required information to holders. For a U.S. Holder to make a qualified electing fund election, we would have to satisfy certain reporting requirements. We have not determined whether we will undertake the necessary measures to be able to satisfy such requirements in the event that we were treated as a passive foreign investment company.
A U.S. Holder that makes a qualified electing fund election will be currently taxable on its pro rata share of our ordinary earnings and net capital gain, at ordinary income and capital gains rates, respectively, for each of our taxable years, regardless of whether or not distributions were received. The U.S. Holder'sHolder’s basis in the subordinate voting shares will be increased to reflect taxed but undistributed income. Distributions of income that had previously been taxed will result in a corresponding reduction of basis in the subordinate voting shares and will not be taxed again as a distribution to the U.S. Holder. U.S. Holders desiring to make a qualified electing fund election should consult their tax advisors with respect to the advisability of making such election.
United States Backup Withholding and Information Reporting
A U.S. Holder will generally be subject to information reporting with respect to dividends paid on, or proceeds of the sale or other disposition of, our subordinate voting shares that are paid within the United States or through some U.S. related financial intermediaries to U.S. Holders, unless the U.S. Holder is a corporation or comes within certain other categories of exempt recipients. A U.S. Holder that is not an exempt recipient will generally be subject to backup withholding with respect to the proceeds from the sale or the disposition of, or with respect to dividends on, subordinate voting shares unless the U.S. Holder timely provides a taxpayer identification number and complies with the other applicable requirements of the backup withholding rules. A U.S. Holder who fails to provide a correct taxpayer identification number may be subject to penalties imposed by the United States Internal Revenue Service.
Non-U.S. Holders will generally be subject to information reporting and possible backup withholding with respect to the proceeds of the sale or other disposition of subordinate voting shares effected within the United States, unless the holder certifies to its foreign status or otherwise establishes an exemption and the broker does not have actual knowledge or reason to know that the holder is a U.S. Holder. Payments of dividends on or proceeds from the sale of subordinate voting shares within the United States by a payor within the United States to a non-exempt U.S. or Non-U.S. Holder will be subject to backup withholding if such holder fails to provide appropriate certification. In the case of such payments by a payor within the United States to a foreign partnership other than a foreign partnership that qualifies as a "withholding“withholding foreign partnership"partnership” within the meaning of such Treasury regulations, the partners of such partnership will be required to provide the certification discussed above in order to establish an exemption from backup withholding tax and information reporting requirements.
Backup withholding is not an additional tax. Any amounts withheld under the backup withholding rules will be allowed as a refund or credit against a holder'sholder’s U.S. federal income tax liability, provided that the required information is furnished to the IRS.
Canadian Federal Income Tax Considerations
The following is a summary of the material Canadian federal income tax considerations generally applicable to a U.S. person who holds subordinate voting shares and who, for the purposes of the Income Tax Act (Canada) (the "ITA"“ITA”), and the Canada-United States Income Tax Convention (1980) (the "Convention"“Convention”), as applicable and at all relevant times:
· | is resident in the United States and not resident in Canada; |
is resident in the United States and not resident in Canada;
· | holds the subordinate voting shares as capital property; |
holds the subordinate voting shares as capital property;
· | does not have a "permanent establishment" or "fixed base" in Canada, as defined in the Convention; and |
does not have a “permanent establishment” or “fixed base” in Canada, as defined in the Convention; and
deals at arm’s length with us. Special rules, which are not discussed below, may apply to “financial institutions”, as defined in the ITA, and to non-resident insurers carrying on an insurance business in Canada and elsewhere.
· | deals at arm's length with us. Special rules, which are not discussed below, may apply to "financial institutions", as defined in the ITA, and to non-resident insurers carrying on an insurance business in Canada and elsewhere. |
This discussion is based on the current provisions of the ITA and the Convention and on the regulations promulgated under the ITA, all specific proposals to amend the ITA or the regulations promulgated under the ITA announced by or on behalf of the Canadian Minister of Finance prior to the date of this Annual Report and the current published administrative practices of the Canada Revenue Agency. It does not otherwise take into account or anticipate any changes in law or administrative practice nor any income tax laws or considerations of any province or territory of Canada or any jurisdiction other than Canada, which may differ from the Canadian federal income tax consequences described in this document.
Under the ITA and the Convention, dividends paid or credited, or deemed to be paid or credited, on the subordinate voting shares to a U.S. person who owns less than 10% of the voting shares will be subject to Canadian withholding tax at the rate of 15% of the gross amount of those dividends or deemed dividends. If a U.S. person is a corporation and owns 10% or more of the voting shares, the rate is reduced from 15% to 5%. Subject to specified limitations, a U.S. person may be entitled to credit against U.S. federal income tax liability for the amount of tax withheld by Canada.
Under the Convention, dividends paid to specified religious, scientific, charitable and similar tax exempt organizations and specified organizations that are resident and exempt from tax in the United States and that have complied with specified administrative procedures are exempt from this Canadian withholding tax.
A capital gain realized by a U.S. person on a disposition or deemed disposition of the subordinate voting shares will not be subject to tax under the ITA unless the subordinate voting shares constitute taxable Canadian property within the meaning of the ITA at the time of the disposition or deemed disposition. In general, the subordinate voting shares will not be "taxable“taxable Canadian property"property” to a U.S. person if they are listed on a prescribed stock exchange, which includes The Toronto Stock Exchange, unless, at any time within the five-year period immediately preceding the disposition, the U.S. person, persons with whom the U.S. person did not deal at arm'sarm’s length, or the U.S. person together with those persons, owned or had an interest in or a right to acquire more than 25% of any class or series of our shares.
If the subordinate voting shares are taxable Canadian property to a U.S. person, any capital gain realized on a disposition or deemed disposition of those subordinate voting shares will generally be exempt from tax by virtue of the Convention if the value of the subordinate voting shares at the time of the disposition or deemed disposition is not derived principally from real property, as defined by the Convention, situated in Canada. The determination as to whether Canadian tax would be applicable on a disposition or deemed disposition of the subordinate voting shares must be made at the time of the disposition or deemed disposition.
Holders of subordinate voting shares are urged to consult their own tax advisors to determine the particular tax consequences to them, including the application and effect of any state, local or foreign income and other tax laws, of the acquisition, ownership and disposition of subordinate voting shares.
| Dividends and Paying Agents |
Not Applicable.
Not Applicable.
Not Applicable.
119118
Any statement in this Annual Report about any of our contracts or other documents is not necessarily complete. If the contract or document is filed as an exhibit to the registration statement, the contract or document is deemed to modify the description contained in this Annual Report. You must review the exhibits themselves for a complete description of the contract or document.
You may review a copy of our filings with the SEC, including exhibits and schedules filed with it, at the SEC'sSEC’s public reference facilities at 100 F Street, N.E., Washington, D.C. 20549 and at the regional offices of the SEC located at 233 Broadway, New York, New York 10279 and at the Northwestern Atrium Center, 500 West Madison Street, Suite 1400, Chicago, Illinois 60661. You may also obtain copies of such materials from the Public Reference Section of the SEC, 100 F Street, N.E., Washington, D.C. 20549, at prescribed rates. You may call the SEC at 1-800-SEC-0330 for further information on the public reference rooms. The SEC maintains a Web site (http://www.sec.gov) that contains reports, proxy and information statements and other information regarding registrants that file electronically with the SEC.
You may read and copy any reports, statements or other information that we file with the SEC at the addresses indicated above and you may also access them electronically at the Web site set forth above. These SEC filings are also available to the public from commercial document retrieval services.
We are required to file reports and other information with the SEC under the Securities Exchange Act of 1934. Reports and other information filed by us with the SEC may be inspected and copied at the SEC'sSEC’s public reference facilities described above. As a foreign private issuer, we are exempt from the rules under the Exchange Act prescribing the furnishing and content of proxy statements and our officers, directors and principal shareholders are exempt from the reporting and short-swing profit recovery provisions contained in Section 16 of the Exchange Act. Under the Exchange Act, as a foreign private issuer, we are not required to publish financial statements as frequently or as promptly as United States companies.
See Item 4.C. of this Annual Report.
| Qualitative and Quantitative Disclosures about Market Risk |
Item 11.Qualitative and Quantitative Disclosures about Market Risk
Market Risk
Currency Risk
Our functional currency is the Canadian dollar. We have adopted the US dollar as our reporting currency as it is the most commonly used reporting currency in our industry. We are exposed to a currency risk as a result of our export sales of products manufactured in Canada, China, France and Finland, the majority of which are denominated in US dollars and euros. This risk is partially hedged by forward exchange contracts and certain cost of sales and operating expenses (US dollars and euros). In addition, we are exposed to a currency risk as a result of our research and development activities in India (Indian rupees). This risk is partially hedged by forward exchange contracts. We do not enter into forward exchange contracts for trading or speculative purposes. Forward exchange contracts, which are designated as cash flow hedging instruments, qualify for hedge accounting.
The following tables summarize the forward exchange contracts in effect as at August 31, 2017,2019, classified by expected transaction dates, none of which exceed twothree fiscal years, as well as the notional amounts of such contracts (in thousands of US dollars) along with the weighted average contractual forward rates under such contracts. The notional amounts of such contracts are used to calculate the contractual payments to be made under these contracts.
US dollars – Canadian dollars forward exchange contracts
| | | Years ending August 31, | | | Years ending August 31, | |
| | | 2018 | | | 2019 | | | 2020 | | | 2021 | | | 2022 | |
| | | | | | | | | | | | | | | | |
| Forward exchange contracts to sell US dollars in exchange for Canadian dollars | | | | | | | | | | | | | | | |
Contractual amounts | | $ | 18,300 | | | $ | 10,900 | | | $ | 35,500 | | | $ | 19,900 | | | $ | 6,000 | |
Weighted average contractual forward rates | | | 1.3407 | | | | 1.3426 | | | 1.3013 | | | 1.3107 | | �� | | 1.3216 | |
US dollars – Indian rupees forward exchange contracts
| | | Years ending August 31, | |
| | | 2018 | | | 2019 | |
| | | | | | | |
| Forward exchange contracts to sell US dollars in exchange for Indian rupees | | | | | | |
Contractual amounts | | $ | 3,400 | | | $ | 1,600 | |
Weighted average contractual forward rates | | | 69.49 | | | | 67.26 | |
| | | Year ending August 31, 2020 | |
| | | | |
| Forward exchange contracts to sell US dollars in exchange for Indian rupees | | | |
Contractual amount | | $ | 3,500 | |
Weighted average contractual forward rate | | | 71.48 | |
Fair Value
The carrying amount of forward exchange contracts is equal to fair value, which is based on the amount at which they could be settled based on estimated current market rates. The fair value of forward exchange contracts amounted to net gains $2.3 million as at August 31, 2017.
The following table summarizes significant derivative and non-derivative financial assets and liabilities that are subject to currency risk as at August 31, 20172019 and for which such risk is charged to earnings:
| | | Carrying/nominal amount (in thousands of US dollars) | | | Carrying/nominal amount (in thousands of euros) | | | Carrying/nominal amount (in thousands of US dollars) | | | Carrying/nominal amount (in thousands of euros) | |
| | | | | | | | | | | | | |
| Financial assets | | | | | | | | | | | | |
| Cash | | $ | 20,120 | | | € | 6,235 | | | $ | 5,531 | | | € | 3,129 | |
| Accounts receivable | | | 28,420 | | | | 6,164 | | | | 30,451 | | | | 6,389 | |
| | | | 48,540 | | | | 12,399 | | | | 35,982 | | | | 9,518 | |
| Financial liabilities | | | | | | | | | | | | | | |
| Bank loan | | | 5,000 | | | – | |
| Accounts payable and accrued liabilities | | | 12,447 | | | | 2,725 | | | 12,563 | | | 2,218 | |
| Forward exchange contracts (nominal amount) | | | 3,600 | | | ‒ | | |
| Forward exchange contracts (nominal value) | | | | 5,800 | | | | – | |
| | | | 16,047 | | | | 2,725 | | | | 23,363 | | | | 2,218 | |
| Net exposure | | $ | 32,493 | | | € | 9,674 | | | $ | 12,619 | | | € | 7,300 | |
In addition to these assets and liabilities, we have derivatives financial liabilities for our outstanding forward exchange contracts in the amount (nominal value) of $29.2$61.4 million as at August 31, 2017,2019, for which the currency risk is charged to other comprehensive income.
The value of the Canadian dollar compared to the US dollar was CA$1.25361.3294 = US$1.00 as at August 31, 2017.2019.
The value of the Canadian dollar compared to the euro was CA$1.48251.4672 = €1.00 as at August 31, 2017.2019.
The following sensitivity analysis summarizes the effect that a change in the value of the Canadian dollar (compared to the US dollar and euro) on derivatives and non-derivatives financial assets and liabilities denominated in US dollars and euros, would have on net earnings, net earnings per diluted share and comprehensive income, based on the foreign exchange rates as at August 31, 2017:
· | An increase (decrease) of 10% in the period-end value of the Canadian dollar compared to the US dollar would decrease (increase) net earnings by $2.7 million, or $0.05 per diluted share, as at August 31, 2017. |
2019:
· | An increase (decrease) of 10% in the period-end value of the Canadian dollar compared to the euro would decrease (increase) net earnings by $1.0 million or $0.02 per diluted share, as at August 31, 2017. |
An increase (decrease) of 10% in the period-end value of the Canadian dollar compared to the US dollar would decrease (increase) net earnings by $1.2 million, or $0.02 per diluted share, as at August 31, 2019.
· | An increase (decrease) of 10% in the period-end value of the Canadian dollar compared to the US dollar would increase (decrease) other comprehensive income by $2.7 million as at August 31, 2017. |
An increase (decrease) of 10% in the period-end value of the Canadian dollar compared to the euro would decrease (increase) net earnings by $0.8 million or $0.01 per diluted share, as at August 31, 2019.
An increase (decrease) of 10% in the period-end value of the Canadian dollar compared to the US dollar would increase (decrease) other comprehensive income by $4.1 million as at August 31, 2019.
The impact of the change in the value of the Canadian dollar compared to the US dollar and the euro on these derivative and non-derivative financial assets and financial liabilities is recorded in the foreign exchange gain or loss line item in the consolidated statements of earnings, except for outstanding forward contracts, whichand except for those of foreign operations, whose impact is recorded in other comprehensive income. The change in the value of the Canadian dollar compared to the US dollar and the euro also impactsaffects our balances of income tax recoverable or payable, as well as deferred income tax assets and liabilities denominated in US dollars and euros; this may result in additional and significant foreign exchange gains or losses. However, these tax-related assets and liabilities are not considered financial instruments and are therefore excluded from the sensitivity analysis above. The foreign exchange rate fluctuations also flow through the consolidated statements of earnings line items, as a significant portion of our cost of sales and operating expenses isare denominated in Canadian dollars, euros, British poundpounds and Indian rupees, and we report our results in US dollars; that effect is not reflected in the sensitivity analysis above.
122121
Interest rate risk
We have limited exposure to interest rate risk. We are mainly exposed to interest rate risks through our cash, short-term investments, bank loan and short-term investments.long-term debt.
Cash
As at August 31, 2017,We analyse our cash balances includedinterest risk exposure on an amount of $6.7 million that bearsongoing basis. A change in interest at an annual rate of 1.2%.1% would have an insignificant impact on net earnings and other comprehensive income.
Short-term investments
As at August 31, 2017,2019, our short-term investments, in the amount of $0.8$2.9 million, mainly consist of a term deposits denominated in Indian rupees, bearing interest at annual rates of 4.3%5.1% to 6.9%7.0%, maturing on different dates between October 2017September 2019 and October 2018.May 2020.
Due to their short-term maturity, our short-term investments are not subject to significant fair value interest rate risk. Accordingly, changes in fair value have been nominal to the degree that amortized cost approximates the fair value. Any change in the fair value of our short-term investments, all of which are classified as available for sale,financial assets at fair value through other comprehensive income, is recorded in otherthe consolidated statements of comprehensive income. Based on market value, the fair value of our short-term investments amounted to $0.8 million as at August 31, 2017.
Other financial instruments
Short-term other liabilities bear interest at EURIBOR, plus a margin. Accounts receivable other assets,and accounts payable and accrued liabilities and the contingent liability are non-interest-bearing financial assets and liabilities. Accounts receivable, other assets, accounts payable and the cash contingent consideration are financial instruments whose carrying value approximates their fair value due to their relatively short-term maturity.
Credit risk
Financial instruments that potentially subject us to credit risk consist of cash, short-term investments, accounts receivable, other assets and forward exchange contracts (with a positive fair value). As at August 31, 2017,2019, our short-term investments consist of debt instruments issued by high-credit quality corporations. These debt instruments are not expected to be affected by a significant credit risk. Our cash and forward exchange contracts are held with or issued by high-credit quality financial institutions; therefore, we consider the risk of non-performance on these instruments to be limited.
Generally, we do not require collateral or other security from our customersWe apply the IFRS 9 simplified approach to measuring expected credit losses which uses a lifetime expected loss allowance for all trade accounts receivable and contract assets. To measure the expected credit losses, trade accounts receivable and contract assets have been grouped based on shared credit risk characteristics and the days past due. The contract assets relate to unbilled work in progress and have substantially the same risk characteristics as the trade accounts receivable for the same type of contracts. We have therefore concluded that the expected loss rates for trade accounts receivable; however, credit is extendedreceivable are a reasonable approximation of the loss rates for the contract assets. The expected loss rates are based on the payment profiles of sales over a period of 60 months. The historical loss rates are adjusted to reflect current and forward-looking information on economic factors affecting the ability of the customers following an evaluation of creditworthiness. In addition, we perform ongoing credit reviews of all our customers and establish an allowance for doubtfulto settle the accounts receivable when accounts are determined to be uncollectible. Allowance for doubtful accounts amounted to $3.0 million as at August 31, 2017.receivable.
For the year ended August 31, 2017, the company's top2019, no customer represented 10.1%more than 10% of our sales.
The following table summarizes the age of trade accounts receivable as at August 31, 20172019 (in thousands of US dollars):
| Current | | $ | 35,100 | | | $ | 39,054 | |
| Past due, 0 to 30 days | | | 3,049 | | | 3,529 | |
| Past due, 31 to 60 days | | | 1,289 | | | 2,006 | |
| Past due, more than 60 days, less allowance for doubtful accounts of $2,960 | | | 1,692 | | |
| Past due, more than 60 days | | | | 6,928 | |
| Total trade accounts receivable | | $ | 41,130 | | | $ | 51,517 | |
123122
Changes in the allowance for doubtful accounts are as follows as at August 31, 20172019 (in thousands of US dollars):
| Balance – Beginning of year | | $ | 3,752 | | | $ | 772 | |
| IFRS 9 adoption initial adjustment | | | 303 | |
| Addition charged to earnings | | | 654 | | | 864 | |
| Write-off of uncollectible accounts | | | (1,446 | ) | |
| Writeoff of uncollectible accounts | | | | (404 | ) |
| Balance – End of year | | $ | 2,960 | | | $ | 1,535 | |
Liquidity risk
Liquidity risk is defined as the potential that we cannot meet our obligations as they become due.
The following table summarizes the contractual maturity of our derivative and non-derivative financial liabilities as at August 31, 20172019 (in thousands of US dollars):
| | | 0-12 months | | | 13-24 months | | | No later
than
one year | | | Later than
1 year and
no later than
5 years | | | Later than
5 years | |
| | | | | | | | | | | | | | | | |
| Bank loan | | | $ | 5,000 | | | $ | – | | | $ | – | |
| Accounts payable and accrued liabilities | | $ | 36,776 | | | $ | – | | | 49,945 | | | – | | | – | |
| Contingent liability | | | 1,092 | | | | – | | |
| Forward exchange contracts | | | | | | | | | | | | | | | | | |
| Outflow (nominal amount) | | | 21,700 | | | | 12,500 | | |
| Outflow | | | 39,000 | | | 25,900 | | | – | |
| Inflow | | | (23,265 | ) | | | (13,357 | ) | | (38,252 | ) | | (25,585 | ) | | – | |
| Long-term debt | | | 2,449 | | | 3,237 | | | 56 | |
| Other liabilities | | | | 1,606 | | | | – | | | | – | |
| Total | | $ | 36,303 | | | $ | (857 | ) | | $ | 59,748 | | | $ | 3,552 | | | $ | 56 | |
As at August 31, 2017,2019, we had $39.2$19.4 million in cash and short-term investments and $45.0$54.9 million in accounts receivable. In addition to these financial assets, we have unused available lines of credit totaling $15.4$56.5 million for working capital and other general corporate purposes, including potential acquisitions as well as unused lines of credit of $25.7$21.9 million for foreign currency exposure related to our forward exchange contracts.
On October 25, 2017, we modified certain credit facilities whereby existing lines of credits, that provided advances up to CA$4.8 million (US$3.8 million) and up to US$6.0 million for operating purposes, were cancelled and replaced by a credit facility of CA$28.9 million (US$23.1 million).
| Description of Securities Other than Equity Securities |
Item 12.Description of Securities Other than Equity Securities
Not Applicable.
| Defaults, Dividend Arrearages and Delinquencies |
Item 13.Defaults, Dividend Arrearages and Delinquencies
Not Applicable.
| Material Modifications to the Rights of Security Holders and Use of Proceeds |
Not Applicable.
124123
Item 15.Controls and Procedures | (a) | Disclosure Controls and Procedures |
Disclosure controls and procedures are designed to provide reasonable assurance that information required to be disclosed by EXFO under applicable securities legislation is gathered and reported to senior management, including our Chief Executive Officer and Chief Financial Officer on a timely basis so that appropriate decisions can be made regarding public disclosure.
As of the end of the Company'sCompany’s fiscal year ended August 31, 2017,2019, an evaluation of the effectiveness of the Company'sCompany’s disclosure controls and procedures was carried out by management with the participation of our Chief Executive Officer and Chief Financial Officer. Based on that evaluation, our Chief Executive Officer and our Chief Financial Officer concluded that these disclosure controls and procedures were effective as at August 31, 2017.2019.
Our management, including the Chief Executive Officer and Chief Financial Officer, believe that any disclosure controls and procedures or internal control over financial reporting, no matter how well conceived and operated, can provide only a reasonable and not absolute assurance that the objectives of the control system are met. Further, the design of a control system reflects the fact that there are resource constraints, and the benefits of controls must be considered relative to their costs. Because of the inherent limitations in all control systems, they cannot provide absolute assurance that all control issues and instances of fraud, if any, within the Company have been prevented or detected. Controls can be circumvented by the individual acts of some persons, by collusion of two or more people, or by unauthorized override of the control. The design of any systems of controls is also based in part on certain assumptions about the likelihood of certain events, and there can be no assurance that any design can achieve its stated goals under all potential future conditions. Accordingly, because of the inherent limitations in a cost effectivecost-effective control system, misstatements due to error or fraud may occur and not be detected.
| (b) | Management'sManagement’s Annual Report on Internal Control over Financial Reporting |
Our management is responsible for establishing and maintaining adequate internal control over financial reporting. Our internal control over financial reporting is a process designed to provide reasonable assurance regarding the reliability of financial reporting and the preparation of financial statements for external purposes in accordance with International Financial Reporting Standards (IFRS) as issued by the International Accounting Standards Board (IASB).
EXFO'sEXFO’s internal control over financial reporting includes those policies and procedures that (i) pertain to the maintenance of records that, in reasonable detail, accurately and fairly reflect the transactions and dispositions of the assets of EXFO; (ii) provide reasonable assurance that transactions are recorded as necessary to permit preparation of financial statements in accordance with IFRS, and that receipts and expenditures of the company are being made only in accordance with authorizations of management and directors of EXFO; and (iii) provide reasonable assurance regarding prevention or timely detection of unauthorized acquisition, use, or disposition of EXFO'sEXFO’s assets that could have a material effect on the financial statements.
Because of its inherent limitations, internal control over financial reporting may not prevent or detect misstatements. Also, projections of any evaluation of effectiveness to future periods are subject to the risk that controls may become inadequate because of changes in conditions, or that the degree of compliance with the policies or procedures may deteriorate.
Our management conducted an evaluation of the effectiveness of EXFO's internal control over financial reporting based on the criteria established in Internal Control – Integrated Framework (2013) issued by the Committee of Sponsoring Organizations of the Treadway Commission (COSO). Management has elected to exclude Ontology Partners Limited, included in our consolidated financial statements for the year ended August 31, 2017, from its assessment of internal control over financial reporting as of August 31, 2017, because the business was acquired by the company in fiscal 2017. Based on this evaluation, management concluded that EXFO's internal control over financial reporting was effective as of August 31, 2017.
2019.
125124
| (c) | Attestation Report of the Independent AuditorRegistered Public Accounting Firm
|
The effectiveness of our internal control over financial reporting as of August 31, 20172019 has been audited by PricewaterhouseCoopers LLP, an independent auditor,registered public accounting firm, as stated in its report which appears herein.
| (d) | Changes in Internal Control over Financial Reporting |
In order to address the material weakness disclosed in our 2016 Form 20-F/A, during the year ended August 31, 2017, we made changes to our internal control policies and procedure, included strengthening our segregation of duties and supervisory review procedure and ongoing monitoring of journal entries recorded to the trade accounts receivable ledger. These changes, whichThere were implemented in the second quarter of fiscal 2017, resulted in the remediation of, the material weakness that was identified with respect to fiscal 2016 pertaining to our trade accounts receivable ledger.
Except as described above, there were no other changes in our internal control over financial reporting that occurred during the period covered by this Annual Report on Form 20-F, that hadhave materially affected, or isare reasonably likely to materially affect, our internal control over financial reporting.
126125
Item 16.Item 16 | [Reserved] |
| Item 16A. | Audit Committee Financial Expert |
Our Board of Directors has determined that Mr. Claude Séguin, chairman of our Audit Committee, is an Audit Committee financial expert. Mr. Séguin is independent of management, in accordance with the CSA Standards as described in Item 6C – Board Practices of this Annual Report. For a description of Mr. Séguin'sguin’s education and experience, please refer to Item 6A. The other members of the Audit Committee are Mr. Pierre-Paul Allard, Mr. François Côté, Mr. Darryl Edwards (until January 2017), Ms. Angela Logothetis (starting in January 2017) and Mr. Randy E. Tornes, all of whom are independent. For a description of their respective education and experience, please also refer to Item 6A.
In 2003, we adopted a code of ethics that applies to our chief executive officer, our chief financial officer and our manager of financial reporting and accounting. A copy of this code of ethics has been filed as exhibit 11.1 to our 2010 Annual Report. In March 2005, the Board adopted and, in 2010, 2013, 2017 and 2017,2018, updated the following policies:
· | Code of Ethics for our Principal Executive Officer and Senior Financial Officers; |
Code of Ethics for our Principal Executive Officer and Senior Financial Officers;
· | Board of Directors Corporate Governance Guidelines; |
Board of Directors Corporate Governance Guidelines;
· | Ethics and Business Conduct Policy; |
Ethics and Business Conduct Policy;
· | Statement of Reporting Ethical Violations (Whistleblower). |
Statement of Reporting Ethical Violations (Whistleblower).
A copy of those policies has been filed respectively as exhibit 11.1 to our 2010 Annual Report, as exhibit 11.13 to our 2017 Annual Report, as exhibit 11.16 to our 2018 Annual Report and as exhibits 11.3 andexhibit 11.4 to our 2013 Annual Report. All these policies are also readily available on our website at www.EXFO.com.www.EXFO.com. Accordingly, we believe that our corporate governance practices are in alignment to current regulatory requirements. We will provide without charge to each person, on the written or oral request of such person, a copy of our code of ethics. Requests for such copies should be directed to us at the following address: 400 Godin Avenue, Quebec, Quebec, G1M 2K2, Canada, Attention: Corporate Secretary, telephone number (418) 683-0211.
| Item 16C. | Principal Accountant Fees and Services |
Audit Fees
During the financial years ended August 31, 20162018 and 2017,2019, our principal accountant, PricewaterhouseCoopers LLP, billed us aggregate amounts of $415,000CA$525,000 and $481,000CA$587,000 respectively for the audit of our annual consolidated financial statements and services in connection with statutory and regulatory filings.
Audit-Related Fees
During the financial years ended August 31, 20162018 and 2017,2019, our principal accountant, PricewaterhouseCoopers LLP, billed us aggregate amounts of $45,000CA$113,000 and $299,000CA$99,000 respectively for audit-related fees namely for the quarterly review of interim consolidated financial statements.
Tax Fees
During the financial years ended August 31, 20162018 and 2017,2019, our principal accountant, PricewaterhouseCoopers LLP, billed us aggregate amounts of $154,000CA$114,000 and $173,000CA$177,000 respectively for services related to tax compliance, tax advice and tax planning.
All Other Fees
No other fees were billed in fiscal 20162018 and 2017.2019.
127126
Audit Committee Pre-Approval Policies and Procedures
Our Audit Committee Charter requires that the Audit Committee give prior approval of the annual audit plan (refer to Item 6C for further details on the Audit Committee Charter). In the event any adjustments to the audit plan may be required during the course of a financial year, such adjustments shall be approved by the chairman of the Audit Committee, acting alone, and shall be reported to the full Audit Committee at its next meeting.
In the case of non-audit services (excluding tax matters), the policy provides that proposals shall be submitted to the chairman of the Audit Committee and our chief financial officer at the same time and the chairman of the Audit Committee will be responsible for approval of such proposal, subject to any modifications that he may require. The chairman will make a report to the full Audit Committee at its next meeting.
As concerns tax services to be provided by our principal accountant, our policy provides that the principal accountant will present to the Audit Committee for pre-approval, on or before the beginning of each financial year, an engagement for tax matters that are foreseeable for the upcoming year and the Audit Committee shall be responsible for pre-approval thereof, subject to any modifications it may make to such proposals. In the event tax services are required that were not pre-approved by the Audit Committee, the procedure set forth in the previous paragraph will apply.
During the financial year ended on August 31, 2017,2019, 100% of tax fees were approved by the Audit Committee pursuant to this policy.
| Item 16D. | Exemptions from the Listing Standards for Audit Committees |
Not Applicable.
| Item 16E. | Purchases of Equity Securities by the Issuer and Affiliated Purchasers |
Issuer Purchases of Equity Securities
From September 1, 2017 through November 12, 2018, no repurchase occurred.
On March 29, 2016,January 8, 2019, we announced that our Board of Directors approved the renewal of oura share repurchase program, by way of a normal course issuer bid on the open market of up to 6.6% of our issued and outstanding subordinate voting shares, representing 900,0001,200,000 subordinate voting shares at the prevailing market price. The period of the normal course issuer bid commenced on April 1, 2016January 14, 2019 and endedwill end on March 31, 2017 ("2016 NCIB").January 13, 2020.
From September 1, 2016January 14, 2019 through November 13, 2017, no11, 2019, we spent approximately US$0.6 million (including fees) to repurchase occurred.127,604 subordinate voting shares.
| Period | (a) Total Number
of Shares (or Units) Purchased
(#) | (b) Average Price Paid
per Share (or Units) | (c) Total Number of Shares (or Units)
Purchased as Part of Publicly Announced
Plans or Programs
(#) | (d) Maximum Number of Shares (or Units) that May Yet Be Purchased
Under the Plans or Programs
(#) |
NASDAQ
(US$) | TSX
(CA$) |
| From September 1, 2018 | – | | – | | – | | – | | – | |
| To September 30, 2018 |
| From October 1, 2018 | – | | – | | – | | – | | – | |
| To October 31, 2018 |
| From November 1, 2018 | – | | – | | – | | – | | – | |
| To November 30, 2018 |
| From December 1, 2018 | – | | – | | – | | – | | – | |
| To December 31, 2018 |
| From January 1, 2019 | – | | – | | – | | – | | – | |
| To January 13, 2019 |
| From January 14, 2019 | 32,032 | | 3.23 | | 4.37 | | 32,032 | | 1,200,000 | |
| To January 31, 2019 |
| From February 1, 2019 | 200 | | 3.25 | | 4.25 | | 200 | | 1,167,968 | |
| To February 28, 2019 |
| From March 1, 2019 | – | | – | | – | | – | | 1,167,768 | |
| To March 31, 2019 |
| From April 1, 2019 | – | | – | | – | | – | | 1,167,768 | |
| To April 30, 2019 |
| From May 1, 2019 | – | | – | | – | | – | | 1,167,768 | |
| To May 31, 2019 |
| From June 1, 2019 | – | | – | | – | | – | | 1,167,768 | |
| To June 30, 2019 |
| From July 1, 2019 | 29,396 | | – | | 5.02 | | 29,396 | | 1,138,372 | |
| To July 31, 2019 |
| From August 1, 2019 | 24,764 | | – | | 5.06 | | 24,764 | | 1,113,608 | |
| To August 31, 2019 |
| From September 1, 2019 | – | | – | | – | | – | | 1,113,608 | |
| To September 30, 2019 |
| From October 1, 2019 | 28,522 | | – | | 5.28 | | 28,522 | | 1,085,086 | |
| To October 31, 2019 |
| From November 1, 2019 | 12,690
| | – | | 5.59 | | 12,690
| | 1,072,396
| |
| To November 11, 2019 |
| Total | 127,604
| | | | | | 127,604
| | 1,072,396
| |
| Item 16F. | Change in Registrant'sRegistrant’s Certifying Accountant |
Not Applicable.
| Item 16G. | Corporate Governance |
The Corporation'sCorporation’s corporate governance practices do not differ significantly from the practices followed by United States domestic companies listed on the NASDAQ Global Select Market. A copy of the Corporation'sCorporation’s Corporate Governance Policies is included as Exhibits 11.1 and 11.2 to our 2010 Annual Report on Form 20-F; as Exhibit 11.9 to our 2011 Annual Report on Form 20-F, as Exhibit 11.3, 11.4, 11.10, 11.11 and 11.12, to our 2013 Annual Report on Form 20-F, as Exhibit 11.6 to our 2014 Annual Report on Form 20-F, as Exhibits 11.5, 11.7 and 11.8 to our 2016 Annual Report on Form 20-F, and as Exhibits 11.5, 11.7, 11.13, 11.14 and 11.15 to thisour 2017 Annual Report on Form 20-F, as Exhibits 11.5, 11.7, 11.16 and 11.17 to our 2018 Annual Report on Form 20-F and as Exhibits 11.5, 11.7 and 11.18 to our 2019 Annual Report on Form 20-F.
| Item 16H. | Mine Safety Disclosure |
Not Applicable.
Not Applicable.
Not Applicable.
| |
1.1 | |
1.2 | |
1.3 | |
1.4 | |
1.5 | |
2.1 | |
2.2 | |
3.1 | |
4.1 | Agreement of Merger and Plan of Reorganization, dated as of November 4, 2000, by and among EXFO, EXFO Sub, Inc., EXFO Burleigh Instruments, Inc., Robert G. Klimasewski, William G. May, Jr., David J. Farrell and William S. Gornall (incorporated by reference to Exhibit 4.1 of EXFO'sEXFO’s Annual Report on Form 20-F dated January 18, 2001, File No. 000-30895). |
4.2 | Amendment No. 1 to Agreement of Merger and Plan of Agreement, dated as of December 20, 2000, by and among EXFO, EXFO Sub, Inc., EXFO Burleigh Instruments, Inc., Robert G. Klimasewski, William G. May, Jr., David J. Farrell and William S. Gornall (incorporated by reference to Exhibit 4.2 of EXFO'sEXFO’s Annual Report on Form 20-F dated January 18, 2001, File No. 000-30895). |
4.3 | |
4.4 | |
4.5 | Offer to purchase shares of Nortech Fibronic Inc., dated February 6, 2000 among EXFO, Claude Adrien Noel, 9086-9314 Québec Inc., Michel Bédard, Christine Bergeron and Société en Commandite Capidem Québec Enr. and Certificate of Closing, dated February 7, 2000 among the same parties (including summary in English) (incorporated by reference to Exhibit 10.2 of EXFO'sEXFO’s Registration Statement on Form F-1 filed on June 9, 2000, File No. 333-38956). |
4.6 | |
130
4.7 | Amendment Number One, dated as of March 15, 2001, to Share Purchase Agreement, dated as of March 5, 2001, among EXFO Electro-Optical Engineering, Inc., John Kennedy, Glenn Harvey and EFOS Corporation. (incorporated by reference to Exhibit 4.2 of EXFO'sEXFO’s Registration Statement on Form F-3 filed on July 13, 2001, File No. 333-65122). |
4.8 | |
4.9 | |
4.10 | |
4.11 | |
4.12 | |
4.13 | |
4.14 | |
4.15 | |
4.16 | |
4.17 | |
4.18 | |
4.19 | |
4.20 | |
131
4.21 | |
4.22 | |
4.23 | |
4.24 | |
4.25 | |
4.26 | |
4.27 | Asset Purchase Agreement by and Among EXFO Electro-Optical Engineering Inc., EXFO Gnubi Products Group Inc., gnubi communications, L.P., gnubi communications General Partner, LLC, gnubi communications Limited Partner, LLC, gnubi communications, Inc., Voting Trust created by The Irrevocable Voting Trust Agreement Among Carol Abraham Bolton, Paul Abraham and James Ray Stevens, James Ray Stevens and Daniel J. Ernst dated September 5, 2002 (incorporated by reference to Exhibit 4.30 of EXFO'sEXFO’s Annual Report on Form 20-F dated January 16, 2003, File No. 000-30895). |
4.28 | |
4.29 | |
4.30 | |
4.31 | |
4.32 | |
4.33 | |
4.34 | |
4.35 | |
4.36 | |
132
4.37 | |
4.38 | |
4.39 | |
4.40 | |
4.41 | |
4.42 | |
4.43 | |
4.44 | |
4.45 | |
4.46 | |
4.47 | |
4.48 | |
4.49 | |
4.50 | |
4.51 | |
133
4.52 | |
4.53 | |
4.54 | |
4.55 | |
4.56 | |
4.57 | |
4.58 | |
4.59 | |
4.60 | |
8.1 | Subsidiaries of EXFO (list included in Item 4C of this Annual Report). |
11.1 | |
11.2 | |
11.3 | |
11.4 | |
11.5 | Audit Committee Charter (incorporated by reference to Exhibit 11.5 of EXFO'sEXFO’s Annual Report on Form 20-F dated November 24, 2017,26, 2019, File No. 000-30895). |
11.6 | |
11.7 | Corporate Governance Practices (incorporated by reference to Exhibit 11.7 of EXFO'sEXFO’s Annual Report on Form 20-F dated November 24, 2017,26, 2019, File No. 000-30895). |
11.8 | |
11.9 | |
11.10 | |
11.13 | |
11.14 | |
11.15 | |
11.16 | |
11.17 | |
11.18 | Policy Regarding Conflict Minerals dated January 9, 2013 and amended on December 12, 2018 (incorporated by reference to Exhibit 11.18 of EXFO’s annual report on Form 20-F dated November 26, 2019, File No. 000-30895). |
12.1 | Certification of the Chief Executive Officer Pursuant to Section 302 of the Sarbanes-Oxley Act of 2002. |
12.2 | Certification of the Chief Executive Officer Pursuant to Section 906 of the Sarbanes-Oxley Act of 2002. |
13.1 | Certification of the Chief Financial Officer Pursuant to Section 302 of the Sarbanes-Oxley Act of 2002. |
13.2 | Certification of the Chief Financial Officer Pursuant to Section 906 of the Sarbanes-Oxley Act of 2002. |
135
SIGNATURES
The registrant hereby certifies that it meets all of the requirements for filing on Form 20-F and that it has duly caused and authorized the undersigned to sign this Annual Report on its behalf.
EXFO INC.
By: /s/ Philippe Morin
Name: Philippe Morin
Title: Chief Executive Officer
Date: November 24, 2017
26, 2019
136
Report of Independent Auditor's ReportRegistered Public Accounting Firm
To the Board of Directors and Shareholders of
EXFO Inc.
We have completed integrated audits of EXFO Inc.'s and its subsidiaries' 2017, 2016 and 2015 consolidatedOpinions on the financial statements and their internal control over financial reporting as at August 31, 2017. Our opinions, based on our audits, are presented below.
Report on the consolidated financial statements
We have audited the accompanying consolidated financial statementsbalance sheets of EXFO Inc. and its subsidiaries which comprise(together, the consolidated balance sheets"Company") as at August 31, 20172019 and August 31, 20162018, and the related consolidated statements of earnings, comprehensive income (loss), changes in shareholder'sshareholders' equity and cash flowsfor each of the three years in the period ended August 31, 2017, and the related notes, which comprise a summary of significant accounting policies and other explanatory information.
Management's responsibility for the consolidated financial statements
Management is responsible for the preparation and fair presentation of these consolidated financial statements in accordance with International Financial Reporting Standards as issued by the International Accounting Standards Board and for such internal control as management determines is necessary to enable the preparation of consolidated financial statements that are free from material misstatement, whether due to fraud or error.
Auditor's responsibility
Our responsibility is to express an opinion on these consolidated financial statements based on our audits. We conducted our audits in accordance with Canadian generally accepted auditing standards and the standards of the Public Company Accounting Oversight Board (United States). Those standards require that we plan and perform the audit to obtain reasonable assurance about whether the consolidated financial statements are free from material misstatement. Canadian generally accepted auditing standards also require that we comply with ethical requirements.
An audit involves performing procedures to obtain audit evidence, on a test basis, about the amounts and disclosures in the consolidated financial statements. The procedures selected depend on the auditor's judgment, including the assessment of the risks of material misstatement of the consolidated financial statements, whether due to fraud or error. In making those risk assessments, the auditor considers internal control relevant to the company's preparation and fair presentation of the consolidated financial statements in order to design audit procedures that are appropriate in the circumstances. An audit also includes evaluating the appropriateness of accounting principles and policies used and the reasonableness of accounting estimates made by management, as well as evaluating the overall presentation of the consolidated financial statements.
We believe that the audit evidence we have obtained in our audits is sufficient and appropriate to provide a basis for our audit opinion on the consolidated financial statements.
PricewaterhouseCoopers LLP/s.r.l./s.e.n.c.r.l.
1250 René-Lévesque Boulevard West, Suite 2500, Montréal, Quebec, Canada H3B 4Y1
T: +1 514 205 5000, F: +1 514 876 1502
"PwC" refers to PricewaterhouseCoopers LLP/s.r.l./s.e.n.c.r.l., an Ontario limited liability partnership.
Opinion
In our opinion, the consolidated financial statements present fairly, in all material respects, the financial position of EXFO Inc. and its subsidiaries as at August 31, 2017 and August 31, 2016 and their financial performance and their cash flows for each of the three years in the period ended August 31, 2017 in accordance with International Financial Reporting Standards2019, including the related notes (collectively referred to as issued by the International Accounting Standards Board.
Report on internal control overconsolidated financial reporting
statements). We also have also audited EXFO Inc.'s and its subsidiaries'the Company's internal control over financial reporting as at August 31, 2017,2019, based on criteria established in Internal Control – Integrated Framework (2013), issued by the Committee of Sponsoring Organizations of the Treadway Commission (COSO).
Management's responsibilityIn our opinion, the consolidated financial statements referred to above present fairly, in all material respects, the financial position of the Company as at August 31, 2019 and 2018, and its financial performance and its cash flows for each of the three years in the period ended August 31, 2019 in conformity with International Financial Reporting Standards as issued by the International Accounting Standards Board (IFRS). Also in our opinion, the Company maintained, in all material respects, effective internal control over financial reporting as of August 31, 2019, based on criteria established in Internal Control – Integrated Framework (2013) issued by the COSO.
Management
Basis for opinions
The Company's management is responsible for these consolidated financial statements, for maintaining effective internal control over financial reporting, and for its assessment of the effectiveness of internal control over financial reporting included in "Management's Annual Report on Internal Control over Financial Reporting" included in Item 15b)15(b) of the Annual Report on Form 20-F for the fiscal year ended August 31, 2017.
Auditor's responsibility
2019. Our responsibility is to express an opinionopinions on the company'sCompany's consolidated financial statements and on the Company's internal control over financial reporting based on our audit. audits. We are a public accounting firm registered with the Public Company Accounting Oversight Board (United States) (PCAOB) and are required to be independent with respect to the Company in accordance with the US federal securities laws and the applicable rules and regulations of the Securities and Exchange Commission and the PCAOB.
We conducted our audit of internal control over financial reportingaudits in accordance with the standards of the Public Company Accounting Oversight Board (United States).PCAOB. Those standards require that we plan and perform the auditaudits to obtain reasonable assurance about whether the consolidated financial statements are free of material misstatement, whether due to error or fraud, and whether effective internal control over financial reporting was maintained in all material respects.
An
Our audits of the consolidated financial statements included performing procedures to assess the risks of material misstatement of the consolidated financial statements, whether due to error or fraud, and performing procedures that respond to those risks. Such procedures included examining, on a test basis, evidence regarding the amounts and disclosures in the consolidated financial statements. Our audits also included evaluating the accounting principles used and significant estimates made by management, as well as evaluating the overall presentation of the consolidated financial statements. Our audit of internal control over financial reporting includesincluded obtaining an understanding of internal control over financial reporting, assessing the risk that a material weakness exists, and testing and evaluating the design and operating effectiveness of internal control based on the assessed risk, andrisk. Our audits also included performing such other procedures as we considerconsidered necessary in the circumstances.
We believe that our audit providesaudits provide a reasonable basis for our audit opinion on the company's internal control over financial reporting.
opinions.Definition and limitations of internal control over financial reporting
A company's internal control over financial reporting is a process designed to provide reasonable assurance regarding the reliability of financial reporting and the preparation of financial statements for external purposes in accordance with generally accepted accounting principles. A company's internal control over financial reporting includes those policies and procedures that (i) pertain to the maintenance of records that, in reasonable detail, accurately and fairly reflect the transactions and dispositions of the assets of the company; (ii) provide reasonable assurance that transactions are recorded as necessary to permit preparation of financial statements in accordance with generally accepted accounting principles, and that receipts and expenditures of the company are being made only in accordance with authorizations of management and directors of the company; and (iii) provide reasonable assurance regarding prevention or timely detection of unauthorized acquisition, use, or disposition of the company's assets that could have a material effect on the financial statements.
Inherent limitations
Because of its inherent limitations, internal control over financial reporting may not prevent or detect misstatements. Also, projections of any evaluation of effectiveness to future periods are subject to the risk that controls may become inadequate because of changes in conditions, or that the degree of compliance with the policies or procedures may deteriorate.
As described in the Management's Annual Report on Internal Control over Financial Reporting, management has excluded Ontology Partners Limited from its assessment of internal control over financial reporting as of Augusts 31, 2017, because it was acquired by the company in a purchase business combination during 2017. 
Montréal, Canada November 26, 2019 |
We have also excluded Ontology Partners Limited from our audit of internal control over financial reporting. Ontology Partners Limited is a wholly-owned subsidiary whose total assets and total revenues represent 6% and 1%, respectively, ofserved as the related consolidated financial statement amounts as of and for the year ended August 31, 2017.
Opinion
In our opinion, EXFO Inc. and its subsidiaries maintained, in all material respects, effective internal control over financial reporting as at August 31, 2017, based on criteria established in Internal Control – Integrated Framework (2013) issued by COSO.
Montréal, Quebec
November 24, 2017Company's auditor since 1994.
__________________________
1 CPA auditor, CA, public accountancy permit No. A119427
A111799
F-3F-2
EXFO Inc.
Consolidated Balance Sheets
(in thousands of US dollars)
| | | As at August 31, | | | As at August 31, | |
| | | 2017 | | | 2016 | | | 2019 | | | 2018 | |
| Assets | | | | | | | | | | | | |
| | | | | | | | | | | | | |
| Current assets | | | | | | | | | | | | |
| Cash | | $ | 38,435 | | | $ | 43,208 | | | $ | 16,518 | | | $ | 12,758 | |
| Short-term investments (note 6) | | | 775 | | | | 4,087 | | | 2,918 | | | 2,282 | |
| Accounts receivable (note 6) | | | | | | | | | | | | | | |
| Trade | | | 41,130 | | | | 42,993 | | | 51,517 | | | 47,273 | |
| Other | | | 3,907 | | | | 2,474 | | | 3,396 | | | 4,137 | |
| Income taxes and tax credits recoverable (note 19) | | | 4,955 | | | | 4,208 | | |
| Income taxes and tax credits recoverable (note 20) | | | 3,159 | | | 4,790 | |
| Inventories (note 7) | | | 33,832 | | | | 33,004 | | | 38,017 | | | 38,589 | |
| Prepaid expenses | | | 4,202 | | | | 3,099 | | | 6,510 | | | 5,291 | |
| Other assets (note 19) | | | | 3,083 | | | | 2,279 | |
| | | | | | | | | | | 125,118 | | | 117,399 | |
| | | | 127,236 | | | | 133,073 | | | | | | | |
| | | | | | | | | | |
Tax credits recoverable (note 19) | | | 38,111 | | | | 34,594 | | |
Property, plant and equipment (notes 8 and 21) | | | 40,132 | | | | 35,978 | | |
Intangible assets (notes 9 and 21) | | | 11,183 | | | | 3,391 | | |
Goodwill (notes 9 and 21) | | | 35,077 | | | | 21,928 | | |
Deferred income tax assets (note 19) | | | 6,555 | | | | 8,240 | | |
Tax credits recoverable (note 20) | | | 46,704 | | | 47,677 | |
Property, plant and equipment (notes 8 and 22) | | | 39,364 | | | 44,310 | |
Intangible assets (notes 9 and 22) | | | 21,654 | | | 29,866 | |
Goodwill (notes 9 and 22) | | | 38,648 | | | 39,892 | |
Deferred income tax assets (note 20) | | | 4,821 | | | 4,714 | |
| Other assets | | | 947 | | | | 589 | | | | 1,293 | | | | 686 | |
| | | | | | | | | | |
| | | $ | 259,241 | | | $ | 237,793 | | | $ | 277,602 | | | $ | 284,544 | |
| Liabilities | | | | | | | | | | | | | | |
| | | | | | | | | | | | | | | |
| Current liabilities | | | | | | | | | | | | | | |
| Bank loan (note 10) | | | $ | 5,000 | | | $ | 10,692 | |
| Accounts payable and accrued liabilities (note 11) | | $ | 36,776 | | | $ | 37,174 | | | 50,790 | | | 47,898 | |
| Provisions (note 11) | | | 3,889 | | | | 299 | | | 1,065 | | | 2,954 | |
| Income taxes payable | | | 663 | | | | 971 | | | 704 | | | 873 | |
| Deferred revenue | | | 11,554 | | | | 9,486 | | |
| Deferred revenue (note 19) | | | 24,422 | | | 16,556 | |
| Other liabilities | | | 1,606 | | | 3,197 | |
| Current portion of long-term debt (note 12) | | | | 2,449 | | | | 2,921 | |
| | | | 86,036 | | | 85,091 | |
| | | | | | | | |
Provisions (note 11) | | | 2,737 | | | 2,347 | |
Deferred revenue (note 19) | | | 9,056 | | | 6,947 | |
Long-term debt (note 12) | | | 3,293 | | | 5,907 | |
Deferred income tax liabilities (note 20) | | | 3,598 | | | 5,910 | |
| Other liabilities | | | | 318 | | | | 421 | |
| | | | | 105,038 | | | | 106,623 | |
Commitments (note 13) | | | | | | | |
| | | | | | | | |
| Shareholders’ equity | | | | | | | |
| Share capital (note 14) | | | 92,706 | | | 91,937 | |
| Contributed surplus | | | 19,196 | | | 18,428 | |
| Retained earnings | | | 112,173 | | | 114,906 | |
| Accumulated other comprehensive loss (note 15) | | | | (51,511 | ) | | | (47,350 | ) |
| | | | | | | | | | | | 172,564 | | | | 177,921 | |
| | | | 52,882 | | | | 47,930 | | | | | | | |
| | | | | | | | | | | $ | 277,602 | | | $ | 284,544 | |
| Deferred revenue | | | 6,257 | | | | 5,530 | | |
Deferred income tax liabilities (note 19) | | | 3,116 | | | | 2,857 | | |
| Other liabilities | | | 196 | | | | 75 | | |
| | | | | | | | | | |
| | | | 62,451 | | | | 56,392 | | |
Commitments (notes 12 and 22) | | | | | | | | | |
| | | | | | | | | | |
| Shareholders' equity | | | | | | | | | |
| Share capital (note 13) | | | 90,411 | | | | 85,516 | | |
| Contributed surplus | | | 18,184 | | | | 18,150 | | |
| Retained earnings | | | 127,160 | | | | 126,309 | | |
| Accumulated other comprehensive loss (note 14) | | | (38,965 | ) | | | (48,574 | ) | |
| | | | | | | | | | |
| | | | 196,790 | | | | 181,401 | | |
| | | | | | | | | | |
| | | $ | 259,241 | | | $ | 237,793 | | |
The accompanying notes are an integral part of these consolidated financial statements.
On behalf of the Board | |
/s/ Philippe Morin
PHILIPPE MORIN, Chief Executive Officer | /s/ Claude Séguin
CLAUDE SÉGUIN, Chairman, Audit Committee |
F-4F-3
EXFO Inc.
Consolidated Statements of Earnings
(in thousands of US dollars, except share and per share data)
| | | Years ended August 31, | |
| | | 2017 | | | 2016 | | | 2015 | |
| | | | | | | | | | |
Sales (note 21) | | $ | 243,301 | | | $ | 232,583 | | | $ | 222,089 | |
| | | | | | | | | | | | | |
Cost of sales (1) (note 17) | | | 94,329 | | | | 87,066 | | | | 85,039 | |
Selling and administrative (2) (note 17) | | | 86,256 | | | | 82,169 | | | | 82,200 | |
Net research and development (note 17) | | | 47,168 | | | | 42,687 | | | | 44,003 | |
| Depreciation of property, plant and equipment (note 17) | | | 3,902 | | | | 3,814 | | | | 4,835 | |
| Amortization of intangible assets (note 17) | | | 3,289 | | | | 1,172 | | | | 2,883 | |
| Change in fair value of cash contingent consideration (note 3) | | | (383 | ) | | | – | | | | – | |
| Interest and other (income) expense | | | 303 | | | | (828 | ) | | | (155 | ) |
| Foreign exchange (gain) loss | | | 978 | | | | (161 | ) | | | (7,212 | ) |
| Unusual charge | | | – | | | | – | | | | 603 | |
| | | | | | | | | | | | | |
| Earnings before income taxes | | | 7,459 | | | | 16,664 | | | | 9,893 | |
| | | | | | | | | | | | | |
Income taxes (note 19) | | | 6,608 | | | | 7,764 | | | | 5,036 | |
| | | | | | | | | | | | | |
| Net earnings for the year | | $ | 851 | | | $ | 8,900 | | | $ | 4,857 | |
| | | | | | | | | | | | | |
| Basic net earnings per share | | $ | 0.02 | | | $ | 0.17 | | | $ | 0.09 | |
| | | | | | | | | | | | | |
| Diluted net earnings per share | | $ | 0.02 | | | $ | 0.16 | | | $ | 0.08 | |
| | | | | | | | | | | | | |
| Basic weighted average number of shares outstanding (000's) | | | 54,423 | | | | 53,863 | | | | 56,804 | |
| | | | | | | | | | | | | |
Diluted weighted average number of shares outstanding (000's) (note 20) | | | 55,555 | | | | 54,669 | | | | 57,457 | |
| | | Years ended August 31, | |
| | | 2019 | | | 2018 | | | 2017 | |
| | | | | | | | | | |
Sales (note 22) | | $ | 286,890 | | | $ | 269,546 | | | $ | 243,301 | |
| | | | | | | | | | | | | |
Cost of sales (1) | | | 118,677 | | | | 105,004 | | | | 94,329 | |
| Selling and administrative | | | 98,646 | | | | 98,794 | | | | 86,256 | |
| Net research and development | | | 50,553 | | | | 57,154 | | | | 47,168 | |
| Depreciation of property, plant and equipment | | | 5,469 | | | | 5,444 | | | | 3,902 | |
| Amortization of intangible assets | | | 9,012 | | | | 10,327 | | | | 3,289 | |
| Change in fair value of cash contingent consideration | | | – | | | | (670 | ) | | | (383 | ) |
| Interest and other expense | | | 718 | | | | 1,378 | | | | 303 | |
| Foreign exchange (gain) loss | | | 949 | | | | (1,309 | ) | | | 978 | |
| Share in net loss of an associate (note 3) | | | – | | | | 2,080 | | | | – | |
| Gain on deemed disposal of the investment in an associate (note 3) | | | – | | | | (2,080 | ) | | | – | |
| | | | | | | | | | | | | |
| Earnings (loss) before income taxes | | | 2,866 | | | | (6,576 | ) | | | 7,459 | |
| | | | | | | | | | | | | |
Income taxes (note 20) | | | 5,346 | | | | 5,678 | | | | 6,608 | |
| | | | | | | | | | | | | |
| Net earnings (loss) for the year | | | (2,480 | ) | | | (12,254 | ) | | | 851 | |
| | | | | | | | | | | | | |
| Net loss for the year attributable to non-controlling interest | | | – | | | | (352 | ) | | | – | |
| | | | | | | | | | | | | |
| Net earnings (loss) for the year attributable to parent interest | | $ | (2,480 | ) | | $ | (11,902 | ) | | $ | 851 | |
| | | | | | | | | | | | | |
| Basic and diluted net earnings (loss) attributable to parent interest per share | | $ | (0.04 | ) | | $ | (0.22 | ) | | $ | 0.02 | |
| | | | | | | | | | | | | |
| | | | | | | | | | | | | |
| Basic weighted average number of shares outstanding (000’s) | | | 55,325 | | | | 54,998 | | | | 54,423 | |
| | | | | | | | | | | | | |
Diluted weighted average number of shares outstanding (000’s) (note 21) | | | 55,325 | | | | 54,998 | | | | 55,555 | |
| (1) | The cost of sales is exclusive of depreciation and amortization, shown separately. |
(2) | Selling and administrative is exclusive of a one-time charge relating to an unusual bad debt expense in fiscal 2015. |
The accompanying notes are an integral part of these consolidated financial statements.
F-5F-4
EXFO Inc.
Consolidated Statements of Comprehensive Income (Loss)
(in thousands of US dollars)
| | | Years ended August 31, | | | Years ended August 31, | |
| | | 2017 | | | 2016 | | | 2015 | | | 2019 | | | 2018 | | | 2017 | |
| | | | | | | | | | | | | | | | | | | |
| Net earnings for the year | | $ | 851 | | | $ | 8,900 | | | $ | 4,857 | | |
| Net earnings (loss) for the year | | | $ | (2,480 | ) | | $ | (12,254 | ) | | $ | 851 | |
| Other comprehensive income (loss), net of income taxes | | | | | | | | | | | | | | | | | | | | | |
| Items that will not be reclassified subsequently to net earnings | | | | | | | | | | | | | |
| Items that may be reclassified subsequently to net earnings | | | | | | | | | | |
| Foreign currency translation adjustment | | | 8,262 | | | | 707 | | | | (39,175 | ) | | (4,177 | ) | | (6,491 | ) | | 8,262 | |
| Items that may be reclassified subsequently to net earnings | | | | | | | | | | | | | |
| Unrealized gains/losses on forward exchange contracts | | | 1,403 | | | | 862 | | | | (5,583 | ) | | (795 | ) | | (1,476 | ) | | 1,403 | |
| Reclassification of realized gains/losses on forward exchange contracts in net earnings | | | 423 | | | | 2,797 | | | | 2,107 | | | 744 | | | (972 | ) | | 423 | |
| Deferred income tax effect of gains/losses on forward exchange contracts | | | (479 | ) | | | (935 | ) | | | 905 | | | | 67 | | | | 554 | | | | (479 | ) |
| | | | | | | | | | | | | | | | | | | | | | |
| Other comprehensive income (loss) | | | 9,609 | | | | 3,431 | | | | (41,746 | ) | | | (4,161 | ) | | | (8,385 | ) | | | 9,609 | |
| | | | | | | | | | | | | | | | | | | | | | |
| Comprehensive income (loss) for the year | | $ | 10,460 | | | $ | 12,331 | | | $ | (36,889 | ) | | (6,641 | ) | | (20,639 | ) | | 10,460 | |
| | | | | | | | | | | |
| Comprehensive loss for the year attributable to non-controlling interest | | | | – | | | | (352 | ) | | | – | |
| | | | | | | | | | | |
| Comprehensive income (loss) for the year attributable to parent interest | | | $ | (6,641 | ) | | $ | (20,287 | ) | | $ | 10,460 | |
The accompanying notes are an integral part of these consolidated financial statements.
EXFO Inc.
Consolidated Statements of Changes in Shareholders'Shareholders’ Equity
(in thousands of US dollars)
| | | Year ended August 31, 2015 | |
| | | Share
capital | | | Contributed
surplus | | | Retained
earnings | | | Accumulated
other
comprehensive
loss | | | Total
shareholders'
equity | |
| | | | | | | | | | | | | | | | |
| Balance as at September 1, 2014 | | $ | 111,491 | | | $ | 16,503 | | | $ | 112,552 | | | $ | (10,259 | ) | | $ | 230,287 | |
| Redemption of share capital (note 13) | | | (26,827 | ) | | | 1,333 | | | | – | | | | – | | | | (25,494 | ) |
| Reclassification of stock-based compensation costs (note 13) | | | 1,381 | | | | (1,381 | ) | | | – | | | | – | | | | – | |
| Stock-based compensation costs | | | – | | | | 1,323 | | | | – | | | | – | | | | 1,323 | |
| Net earnings for the year | | | – | | | | – | | | | 4,857 | | | | – | | | | 4,857 | |
| Other comprehensive loss | | | | | | | | | | | | | | | | | | | | |
| Foreign currency translation adjustment | | | – | | | | – | | | | – | | | | (39,175 | ) | | | (39,175 | ) |
| Changes in unrealized losses on forward exchange contracts, net of deferred income taxes of $905 | | | – | | | | – | | | | – | | | | (2,571 | ) | | | (2,571 | ) |
| | | | | | | | | | | | | | | | | | | | | |
| Total comprehensive loss for the year | | | | | | | | | | | | | | | | | | | (36,889 | ) |
| | | | | | | | | | | | | | | | | | | | | |
| Balance as at August 31, 2015 | | $ | 86,045 | | | $ | 17,778 | | | $ | 117,409 | | | $ | (52,005 | ) | | $ | 169,227 | |
| | | Year ended August 31, 2017 | |
| | | Share
capital | | | Contributed
surplus | | | Retained
earnings | | | Accumulated
other
comprehensive
loss | | | Total
shareholders’
equity | |
| | | | | | | | | | | | | | | | |
| Balance as at September 1, 2016 | | $ | 85,516 | | | $ | 18,150 | | | $ | 126,309 | | | $ | (48,574 | ) | | $ | 181,401 | |
| Issuance of share capital (note 14) | | | 3,490 | | | | – | | | | – | | | | – | | | | 3,490 | |
| Reclassification of stock-based compensation costs (note 14) | | | 1,405 | | | | (1,405 | ) | | | – | | | | – | | | | – | |
| Stock-based compensation costs | | | – | | | | 1,439 | | | | – | | | | – | | | | 1,439 | |
| Net earnings for the year | | | – | | | | – | | | | 851 | | | | – | | | | 851 | |
| Other comprehensive income | | | | | | | | | | | | | | | | | | | | |
| Foreign currency translation adjustment | | | – | | | | – | | | | – | | | | 8,262 | | | | 8,262 | |
| Changes in unrealized gains/losses on forward exchange contracts, net of deferred income taxes of $479 | | | – | | | | – | | | | – | | | | 1,347 | | | | 1,347 | |
| Total comprehensive income for the year | | | | | | | | | | | | | | | | | | | 10,460 | |
| Balance as at August 31, 2017 | | $ | 90,411 | | | $ | 18,184 | | | $ | 127,160 | | | $ | (38,965 | ) | | $ | 196,790 | |
| | | Year ended August 31, 2018 | |
| | | Share
capital | | | Contributed
surplus | | | Retained
earnings | | | Accumulated
other
comprehensive
loss | | | Non-controlling
interest | | | Total
shareholders’
equity | |
| | | | | | | | | | | | | | | | | | | |
| Balance as at September 1, 2017 | | $ | 90,411 | | | $ | 18,184 | | | $ | 127,160 | | | $ | (38,965 | ) | | $ | – | | | $ | 196,790 | |
| Reclassification of stock-based compensation costs (note 14) | | | 1,526 | | | | (1,526 | ) | | | – | | | | – | | | | – | | | | – | |
| Stock-based compensation costs | | | – | | | | 1,770 | | | | – | | | | – | | | | – | | | | 1,770 | |
| Business combination (note 3) | | | – | | | | – | | | | – | | | | – | | | | (3,662 | ) | | | (3,662 | ) |
| Acquisition of non-controlling interest on acquisition of subsidiary (note 3) | | | – | | | | – | | | | (352 | ) | | | – | | | | 4,014 | | | | 3,662 | |
| Net loss for the year | | | – | | | | – | | | | (11,902 | ) | | | – | | | | (352 | ) | | | (12,254 | ) |
| Other comprehensive loss | | | | | | | | | | | | | | | | | | | | | | | | |
| Foreign currency translation adjustment | | | – | | | | – | | | | – | | | | (6,491 | ) | | | – | | | | (6,491 | ) |
| Changes in unrealized gains/losses on forward exchange contracts, net of deferred income taxes of $554 | | | – | | | | – | | | | – | | | | (1,894 | ) | | | – | | | | (1,894 | ) |
| Total comprehensive loss for the year | | | | | | | | | | | | | | | | | | | | | | | (20,639 | ) |
| Balance as at August 31, 2018 | | $ | 91,937 | | | $ | 18,428 | | | $ | 114,906 | | | $ | (47,350 | ) | | $ | – | | | $ | 177,921 | |
| | | Year ended August 31, 2019 | |
| | | Share
capital | | | Contributed
surplus | | | Retained
earnings | | | Accumulated
other
comprehensive
loss | | | Total
shareholders’
equity | |
| | | | | | | | | | | | | | | | |
| Balance as at August 31, 2018 | | $ | 91,937 | | | $ | 18,428 | | | $ | 114,906 | | | $ | (47,350 | ) | | $ | 177,921 | |
| Adoption of IFRS 9 (note 2) | | | – | | | | – | | | | (253 | ) | | | – | | | | (253 | ) |
| Adjusted balance as at September 1, 2018 | | | 91,937 | | | | 18,428 | | | | 114,653 | | | | (47,350 | ) | | | 177,668 | |
| Reclassification of stock-based compensation costs (note 14) | | | 1,106 | | | | (1,106 | ) | | | – | | | | – | | | | – | |
| Redemption of share capital (note 14) | | | (337 | ) | | | 25 | | | | – | | | | – | | | | (312 | ) |
| Stock-based compensation costs | | | – | | | | 1,849 | | | | – | | | | – | | | | 1,849 | |
| Net loss for the year | | | – | | | | – | | | | (2,480 | ) | | | – | | | | (2,480 | ) |
| Other comprehensive income (loss) | | | | | | | | | | | | | | | | | | | | |
| Foreign currency translation adjustment | | | – | | | | – | | | | – | | | | (4,177 | ) | | | (4,177 | ) |
| Changes in unrealized gains/losses on forward exchange contracts, net of deferred income taxes of $67 | | | – | | | | – | | | | – | | | | 16 | | | | 16 | |
| Total comprehensive loss for the year | | | | | | | | | | | | | | | | | | | (6,641 | ) |
| Balance as at August 31, 2019 | | $ | 92,706 | | | $ | 19,196 | | | $ | 112,173 | | | $ | (51,511 | ) | | $ | 172,564 | |
| | | Year ended August 31, 2016 | |
| | | Share
capital | | | Contributed
surplus | | | Retained
earnings | | | Accumulated
other
comprehensive
loss | | | Total
shareholders'
equity | |
| | | | | | | | | | | | | | | | |
| Balance as at September 1, 2015 | | $ | 86,045 | | | $ | 17,778 | | | $ | 117,409 | | | $ | (52,005 | ) | | $ | 169,227 | |
| Redemption of share capital (note 13) | | | (1,768 | ) | | | 217 | | | | – | | | | – | | | | (1,551 | ) |
| Reclassification of stock-based compensation costs (note 13) | | | 1,239 | | | | (1,239 | ) | | | – | | | | – | | | | – | |
| Stock-based compensation costs | | | – | | | | 1,394 | | | | – | | | | – | | | | 1,394 | |
| Net earnings for the year | | | – | | | | – | | | | 8,900 | | | | – | | | | 8,900 | |
| Other comprehensive income | | | | | | | | | | | | | | | | | | | | |
| Foreign currency translation adjustment | | | – | | | | – | | | | – | | | | 707 | | | | 707 | |
| Changes in unrealized gains/losses on forward exchange contracts, net of deferred income taxes of $935 | | | – | | | | – | | | | – | | | | 2,724 | | | | 2,724 | |
| | | | | | | | | | | | | | | | | | | | | |
| Total comprehensive income for the year | | | | | | | | | | | | | | | | | | | 12,331 | |
| | | | | | | | | | | | | | | | | | | | | |
| Balance as at August 31, 2016 | | $ | 85,516 | | | $ | 18,150 | | | $ | 126,309 | | | $ | (48,574 | ) | | $ | 181,401 | |
| | | Year ended August 31, 2017 | |
| | | Share
capital | | | Contributed
surplus | | | Retained
earnings | | | Accumulated
other
comprehensive
loss | | | Total
shareholders'
equity | |
| | | | | | | | | | | | | | | | |
| Balance as at September 1, 2016 | | $ | 85,516 | | | $ | 18,150 | | | $ | 126,309 | | | $ | (48,574 | ) | | $ | 181,401 | |
| Issuance of share capital (note 13) | | | 3,490 | | | | – | | | | – | | | | – | | | | 3,490 | |
| Reclassification of stock-based compensation costs (note 13) | | | 1,405 | | | | (1,405 | ) | | | – | | | | – | | | | – | |
| Stock-based compensation costs | | | – | | | | 1,439 | | | | – | | | | – | | | | 1,439 | |
| Net earnings for the year | | | – | | | | – | | | | 851 | | | | – | | | | 851 | |
| Other comprehensive income | | | | | | | | | | | | | | | | | | | | |
| Foreign currency translation adjustment | | | – | | | | – | | | | – | | | | 8,262 | | | | 8,262 | |
| Changes in unrealized gains/losses on forward exchange contracts, net of deferred income taxes of $479 | | | – | | | | – | | | | – | | | | 1,347 | | | | 1,347 | |
| | | | | | | | | | | | | | | | | | | | | |
| Total comprehensive income for the year | | | | | | | | | | | | | | | | | | | 10,460 | |
| | | | | | | | | | | | | | | | | | | | | |
| Balance as at August 31, 2017 | | $ | 90,411 | | | $ | 18,184 | | | $ | 127,160 | | | $ | (38,965 | ) | | $ | 196,790 | |
The accompanying notes are an integral part of these consolidated financial statements.
F-7F-6
EXFO Inc.
Consolidated Statements of Cash Flows
(in thousands of US dollars)
| | | Years ended August 31, | |
| | | 2019 | | | 2018 | | | 2017 | |
| Cash flows from operating activities | | | | | | | | | |
| Net earnings (loss) for the year | | $ | (2,480 | ) | | $ | (12,254 | ) | | $ | 851 | |
| Add (deduct) items not affecting cash | | | | | | | | | | | | |
| Stock-based compensation costs | | | 1,831 | | | | 1,748 | | | | 1,477 | |
| Depreciation and amortization | | | 14,481 | | | | 15,771 | | | | 7,191 | |
| Gain on disposal of capital assets (note 4) | | | (1,732 | ) | | | – | | | | – | |
| Writeoff of capital assets | | | 1,386 | | | | 592 | | | | – | |
| Change in fair value of cash contingent consideration | | | – | | | | (670 | ) | | | (383 | ) |
| Deferred revenue | | | 10,477 | | | | 1,998 | | | | 1,723 | |
| Deferred income taxes | | | (2,103 | ) | | | 1,368 | | | | 1,054 | |
| Share in net loss of an associate | | | – | | | | 2,080 | | | | – | |
| Gain on deemed disposal of the investment in an associate | | | – | | | | (2,080 | ) | | | – | |
| Changes in foreign exchange gain/loss | | | (46 | ) | | | (181 | ) | | | 1,096 | |
| | | | 21,814 | | | | 8,372 | | | | 13,009 | |
| Changes in non-cash operating items | | | | | | | | | | | | |
| Accounts receivable | | | (4,786 | ) | | | 7,275 | | | | 3,955 | |
| Income taxes and tax credits | | | 1,536 | | | | 86 | | | | (2,386 | ) |
| Inventories | | | (134 | ) | | | (1,020 | ) | | | 911 | |
| Prepaid expenses | | | (1,307 | ) | | | 57 | | | | (918 | ) |
| Other assets | | | (1,459 | ) | | | (1,311 | ) | | | (121 | ) |
| Accounts payable and accrued liabilities and provisions | | | 3,184 | | | | 1,033 | | | | (1,745 | ) |
| Other liabilities | | | (1,606 | ) | | | (122 | ) | | | 165 | |
| | | | 17,242 | | | | 14,370 | | | | 12,870 | |
| Cash flows from investing activities | | | | | | | | | | | | |
| Additions to short-term investments | | | (1,879 | ) | | | (1,550 | ) | | | (2,910 | ) |
| Proceeds from disposal and maturity of short-term investments | | | 1,168 | | | | 234 | | | | 6,374 | |
| Purchases of capital assets (notes 8 and 9) | | | (7,498 | ) | | | (10,452 | ) | | | (7,175 | ) |
| Proceeds from disposal of capital assets (note 4) | | | 3,318 | | | | – | | | | – | |
| Investment in an associate (note 3) | | | – | | | | (12,530 | ) | | | – | |
| Business combinations, net of cash acquired (note 3) | | | – | | | | (19,600 | ) | | | (12,792 | ) |
| | | | (4,891 | ) | | | (43,898 | ) | | | (16,503 | ) |
| Cash flows from financing activities | | | | | | | | | | | | |
| Bank loan | | | (5,195 | ) | | | 11,061 | | | | – | |
| Repayment of long-term debt | | | (2,817 | ) | | | (1,688 | ) | | | (1,480 | ) |
| Redemption of share capital (note 14) | | | (312 | ) | | | – | | | | – | |
| Other liabilities | | | – | | | | (1,449 | ) | | | – | |
| Acquisition of non-controlling interest (note 3) | | | – | | | | (3,657 | ) | | | – | |
| | | | (8,324 | ) | | | 4,267 | | | | (1,480 | ) |
| | | | | | | | | | | | | |
| Effect of foreign exchange rate changes on cash | | | (267 | ) | | | (416 | ) | | | 340 | |
| | | | | | | | | | | | | |
| Change in cash | | | 3,760 | | | | (25,677 | ) | | | (4,773 | ) |
| Cash – Beginning of year | | | 12,758 | | | | 38,435 | | | | 43,208 | |
| Cash – End of year | | $ | 16,518 | | | $ | 12,758 | | | $ | 38,435 | |
| | | | | | | | | | | | | |
| Supplementary information | | | | | | | | | | | | |
| | | | | | | | | | | | | |
| Income taxes paid | | $ | 2,577 | | | $ | 2,376 | | | $ | 2,866 | |
| | | Years ended August 31, | |
| | | 2017 | | | 2016 | | | 2015 | |
| Cash flows from operating activities | | | | | | | | | |
| Net earnings for the year | | $ | 851 | | | $ | 8,900 | | | $ | 4,857 | |
| Add (deduct) items not affecting cash | | | | | | | | | | | | |
| Stock-based compensation costs | | | 1,477 | | | | 1,378 | | | | 1,295 | |
| Depreciation and amortization | | | 7,191 | | | | 4,986 | | | | 7,718 | |
| Change in fair value of cash contingent consideration | | | (383 | ) | | | – | | | | – | |
| Unusual charge | | | – | | | | – | | | | 603 | |
| Deferred revenue | | | 1,723 | | | | 4,238 | | | | 396 | |
| Deferred income taxes | | | 1,054 | | | | 1,578 | | | | 403 | |
| Changes in foreign exchange gain/loss | | | 1,096 | | | | (332 | ) | | | (3,842 | ) |
| | | | 13,009 | | | | 20,748 | | | | 11,430 | |
| Changes in non-cash operating items | | | | | | | | | | | | |
| Accounts receivable | | | 3,955 | | | | 2,682 | | | | (10,828 | ) |
| Income taxes and tax credits | | | (2,386 | ) | | | 939 | | | | (2,062 | ) |
| Inventories | | | 911 | | | | (4,713 | ) | | | 820 | |
| Prepaid expenses | | | (918 | ) | | | (280 | ) | | | (982 | ) |
| Other assets | | | (121 | ) | | | 170 | | | | 61 | |
| Accounts payable and accrued liabilities and provisions | | | (1,745 | ) | | | 4,882 | | | | 8,132 | |
| Other liabilities | | | 165 | | | | (65 | ) | | | (87 | ) |
| | | | 12,870 | | | | 24,363 | | | | 6,484 | |
| Cash flows from investing activities | | | | | | | | | | | | |
| Additions to short-term investments | | | (2,910 | ) | | | (3,546 | ) | | | (20,067 | ) |
| Proceeds from disposal and maturity of short-term investments | | | 6,374 | | | | 873 | | | | 23,685 | |
| Purchases of capital assets (notes 8 and 9) | | | (7,175 | ) | | | (4,356 | ) | | | (5,933 | ) |
| Business combinations, net of cash acquired (note 3) | | | (12,792 | ) | | | – | | | | – | |
| | | | (16,503 | ) | | | (7,029 | ) | | | (2,315 | ) |
| Cash flows from financing activities | | | | | | | | | | | | |
| Repayment of long-term debt (note 3) | | | (1,480 | ) | | ‒ | | | ‒ | |
| Redemption of share capital (note 13) | | | – | | | | (1,551 | ) | | | (25,494 | ) |
| | | | (1,480 | ) | | | (1,551 | ) | | | (25,494 | ) |
| | | | | | | | | | | | | |
| Effect of foreign exchange rate changes on cash | | | 340 | | | | 1,561 | | | | (6,932 | ) |
| | | | | | | | | | | | | |
| Change in cash | | | (4,773 | ) | | | 17,344 | | | | (28,257 | ) |
| Cash – Beginning of year | | | 43,208 | | | | 25,864 | | | | 54,121 | |
| Cash – End of year | | $ | 38,435 | | | $ | 43,208 | | | $ | 25,864 | |
| | | | | | | | | | | | | |
| Supplementary information | | | | | | | | | | | | |
| Income taxes paid | | $ | 2,866 | | | $ | 2,015 | | | $ | 1,491 | |
The accompanying notes are an integral part of these consolidated financial statements.
EXFO Inc.
Notes to Consolidated Financial Statements
(tabular amounts in thousands of US dollars, except share and per share data and as otherwise noted)
| 1 | Nature of Activities and Incorporation |
EXFO Inc. and its subsidiaries (together "EXFO"“EXFO” or the company)“company”) develops manufactures and markets smarter network test, monitoring and analytics solutions for the world's leading communications service providers,fixed and mobile network operators, webscale companies and equipment manufacturers and webscale companies.in the global communications industry.
EXFO is a company incorporated under the Canada Business Corporations Act and is domiciled in Canada. The address of its headquarters is 400 Godin Avenue, Quebec, Province ofQuébec City, Quebec, Canada, G1M 2K2.
These consolidated financial statements were authorized for issue by the Board of Directors on November 24, 2017.26, 2019.
These consolidated financial statements have been prepared in accordance with the International Financial Reporting Standards (IFRS), as issued by the International Accounting Standards Board (IASB). The company has consistently applied the same accounting policies through all periods presented.presented, except as described below.
These IFRS Pronouncements Adopted in Fiscal 2019
Financial instruments
The final version of IFRS 9, “Financial Instruments”, was issued in July 2014 and replaces IAS 39, “Financial Instruments: Recognition and Measurement”. IFRS 9 uses a single approach to determine whether a financial asset is measured at amortized cost or fair value, replacing the multiple rules in IAS 39. The approach in IFRS 9 is based on how an entity manages its financial instruments in the context of its business model and the contractual cash flow characteristics of its financial assets. Most of the requirements in IAS 39 for classification and measurement of financial liabilities were carried forward unchanged to IFRS 9. The new standard also requires a single impairment method to be used, replacing the multiple impairment methods in IAS 39. Requirements relating to hedge accounting, representing a new hedge accounting model, have also been added to IFRS 9. The new standard is effective for annual periods beginning on or after January 1, 2018 and must be applied retrospectively. The company adopted this new standard on September 1, 2018 using the modified retrospective method. The following table summarizes the impact of its adoption on the company’s consolidated balance sheet as at September 1, 2018:
| | | As reported as at August 31, 2018 | | | Adjustments | | | As adjusted as at September 1, 2018 | |
| | | | | | | | | | |
Accounts receivable – Trade (note 6) | | $ | 47,273 | | | $ | (303 | ) | | $ | 46,970 | |
| Income taxes recoverable | | $ | 4,790 | | | $ | 50 | | | $ | 4,840 | |
| Total assets | | $ | 284,544 | | | $ | (253 | ) | | $ | 284,291 | |
| | | | | | | | | | | | | |
| Retained earnings | | $ | 114,906 | | | $ | (253 | ) | | $ | 114,653 | |
| Shareholders’ equity | | $ | 177,921 | | | $ | (253 | ) | | $ | 177,668 | |
EXFO Inc.
Notes to Consolidated Financial Statements
(tabular amounts in thousands of US dollars, except share and per share data and as otherwise noted)
In addition, the company’s consolidated financial statements have been prepared basedinstruments are accounted for as follows under IFRS 9 as compared to the company’s previous accounting policy with IAS 39:
| Financial assets | Classification – IAS 39 | Classification – IFRS 9 |
| | |
| Cash | Loans and receivables | Amortized cost |
| Short-term investments | Available for sale | Fair value through other comprehensive income |
| Accounts receivable | Loans and receivables | Amortized cost |
| Forward exchange contracts | Derivatives used for hedging | Fair value through other comprehensive income |
| Financial liabilities | | |
| | |
| Bank loan | Other financial liabilities | Amortized cost |
| Accounts payable and accrued liabilities | Other financial liabilities | Amortized cost |
| Other liabilities | Other financial liabilities | Amortized cost |
| Long-term debt | Other financial liabilities | Amortized cost |
| Forward exchange contracts | Derivatives used for hedging | Fair value through other comprehensive income |
Hedge accounting
All existing hedge relationships that were designated as effective hedging relationships under IAS 39 were re-designated, and continue to qualify for hedge accounting under IFRS 9. The adoption of IFRS 9 did not change the application of hedge accounting for the company’s effective hedges.
Revenue from contracts with customers
IFRS 15, “Revenue from Contracts with Customers”, was issued in May 2014. The objective of this new standard is to provide a single, comprehensive revenue recognition model for all contracts with customers to improve comparability. This new standard contains principles that an entity must apply to determine the measurement of revenue and timing of when it is recognized. The underlying principle is that an entity recognizes revenue to depict the transfer of goods or services to customers at an amount that the entity expects to be entitled to in exchange for those goods or services. This new standard is effective for annual periods beginning on or after January 1, 2018. The company adopted this new standard on September 1, 2018 using the modified retrospective method. The company applied this standard retrospectively only to contracts that were not completed at the date of initial application.
The company concluded that the main areas of impact relate to the allocation of the transaction price to the various performance obligations under the contracts, the timing of revenue recognition for sales arrangement that contain customer acceptance clauses, and the sale of licenses that provide customers with the “right to use” the company’s intellectual property. The adoption of the new standard had no material impact on the following accounting policies:company’s consolidated financial statements.
Foreign currency transactions and advance consideration
IFRIC 22, “Foreign Currency Transactions and Advance Consideration”, was issued in December 2016. IFRIC 22 addresses how to determine the date of the transaction for the purpose of determining the exchange rate to use on initial recognition of the related asset, expense or income (or part of it) and on the derecognition of a non-monetary asset or non-monetary liability arising from the payment or receipt of advance consideration in a foreign currency. IFRIC 22 is effective for annual periods beginning on or after January 1, 2018. The company adopted this interpretation retrospectively on September 1, 2018, and its adoption did not have a material impact on its consolidated financial statements.
EXFO Inc.
Notes to Consolidated Financial Statements
(tabular amounts in thousands of US dollars, except share and per share data and as otherwise noted)
Basis of measurement
These consolidated financial statements have been prepared under the historical cost convention, except for the revaluation of derivative financial instruments, available-for-saleshort-term investments and the contingent liability.
Consolidation
These consolidated financial statements include the accounts of the company and its domestic and foreign subsidiaries. Intercompany accounts and transactions have been eliminated.
Revenue recognition under IFRS 15
Revenue comprisesThe company exercises judgment and use estimates in connection with determining the fair valueamounts of product and services revenues to be recognized in each accounting period.
The company accounts for revenue once a legally enforceable contract with a customer has been approved by the consideration receivedparties and the related promises to transfer products or receivableservices have been identified. A contract is defined by the company as an arrangement with commercial substance identifying payment terms, each party’s rights and obligations regarding the products or services to be transferred and collection is probable. The company’s contracts usually take the form of a customer purchase order.
Customer contracts may include promises to transfer multiple products and services to a customer. Determining whether the products and services are considered distinct performance obligations that should be accounted for separately or as one single performance obligation may require significant judgment. The company assesses whether each promised good or service is distinct for the salespurpose of identifying the various performance obligations in each contract. Promised goods and services are considered distinct provided that: (i) the customer can benefit from the good or service either on its own or together with other resources that are readily available to the customer; and (ii) the company's promise to transfer the good or service to the customer is separately identifiable or distinct from other promises in the ordinary course of business.
contract. The company derives revenues from goods and services. Sales of goods,
Revenue from sales of goods, which represent the majority of the sales of the company, consist of standalone hardware products, hardware products with embedded software that are essential to providing customers the intended functionality of the solutions, standalone software licenses, as well as hardware products bundled with a software license. Sales of services mainly consist of professional services, consulting, stand-ready software-as-a-service (SAAS), maintenance contracts, extended warranties, installation, integration and training. The company’s performance obligations consist of a variety of products and services.
Revenue is recognized when the significant risks and rewards of ownershipcontrol of the goods have passedproducts or services are transferred to the buyer, usually upon delivery ofcustomers in an amount that reflects the goods. consideration the company expects to be entitled to in exchange for products and services. Revenue is recorded based onrecognized at the price specifiedpoint in time control is transferred to the customer. For hardware sales, arrangements.
Maintenance contracts
Maintenance contracts are usually offeredtransfer of control to customersthe customer typically occurs at the point the product is shipped or delivered to the customer’s designated location. For ‘’right of use’’ software license sales, transfer of control to the customer typically occurs upon shipment, electronic delivery, or when the software is available for periodsdownload by the customer. For instances where software license is sold along with essential services, such as integration or installation, transfer of 12control occurs, and revenue is typically recognized upon customer acceptance. In certain instances, acceptance is deemed to 36 months. They generally includehave occurred if all acceptance provisions lapse, or if the right to unspecified software upgrades and enhancements on a when-and-if-available basis as well as customer service. company has evidence that all acceptance provisions will be, or have been, satisfied. Revenue from these contractssoftware and hardware support is recognized ratably over the terms ofsupport period. Support services generally include rights to unspecified upgrades (when and if available), telephone and internet-based support, updates, bug fixes and hardware repair and replacement. SAAS services are recognized ratably over the maintenance contracts on a straight-line basis.contract term.
F-9F-10
EXFO Inc.
Notes to Consolidated Financial Statements
(tabular amounts in thousands of US dollars, except share and per share data and as otherwise noted)
Extended warranties
Extended warranties are usually offeredIf the contract contains a single performance obligation, the entire transaction price is attributed to customers for periodsthat performance obligation. Some of 6 to 48 months. Revenue from these extended warranties is recognized ratably over the warranty period oncompany’s contracts include multiple distinct performance obligations with a straight-line basis.
Multiple-component arrangements
When a sales arrangement includes multiple separately identifiable components such as goods, extended warranties,combination of products and services, maintenance contracts, installation and training, the revenue recognition criteria are applied to each separately identifiable component. A component is considered separately identifiable if the delivered item has value to the customer on a stand-alone basis and the fair value associated with the component can be measured reliably. support, professional services and/or training. The company allocates the transaction price among the performance obligations in an amount that depicts the relative standalone selling priceprices (SSP) of each obligation. Judgment is required to determine the SSP for each distinct performance obligation. The company assesses SSP based on historical pricing for products and services, whether sold alone or as part of a multiple-component arrangementmultiple element transaction. The company reviews sales of the product and services elements on a regular basis and updates, when appropriate, its SSP for such elements to each componentensure that it reflects recent pricing experience.
Payments for products and services are typically due up front with payment terms of 30 to 90 days. However, the company has contracts pursuant to which payments are due over a certain period generally not exceeding one year based on agreed-upon payments terms either prior or following the fair valuetransfer of each componentcontrol for the contracted performance obligations. Payments on multi-year maintenance, consulting services are typically due in relation toannual, quarterly or monthly installments over the fair value of the arrangementcontract term. The company did not have any material variable consideration such as a whole.
Sales arrangements may include acceptance clauses. When a sales arrangement does include an acceptance provision, acceptance occurs upon the earliest of receipt of a written customer acceptanceobligations for returns, refunds or expiration of the acceptance period. For these sales arrangements, the sale is recognized when acceptance occurs.warranties as at August 31, 2019.
Presentation currency
The functional currency of the company is the Canadian dollar. The company has adopted the US dollar as its presentation currency as it is the most commonly used reporting currency in its industry. The consolidated financial statements are translated into the presentation currency as follows: assets and liabilities are translated at the exchange rate in effect on the date of the consolidated balance sheet; revenues and expenses are translated at the monthly average exchange rate. The foreign currency translation adjustment arising from such translation is included in accumulated other comprehensive income in shareholders'shareholders’ equity.
Foreign currency translation
| (a) | Foreign currency transactions |
Transactions denominated in currencies other than the functional currency are translated into the relevant functional currency as follows: Monetary assets and liabilities are translated at the exchange rate in effect on the date of the consolidated balance sheet, and revenues and expenses are translated at the exchange rate in effect on the date of the transaction. Non-monetary assets and liabilities measured at historical cost and denominated in a foreign currency are translated using the exchange rate at the date of the transaction, whereas non-monetary items that are measured at fair value and denominated in a foreign currency are translated using the exchange rates at the date when the fair value was determined. Foreign exchange gains and losses arising from such translation are included in the consolidated statements of earnings.
Each foreign operation determines its own functional currency and items included in the financial statements of each foreign operation are measured using that functional currency. The financial statements of each foreign operation that has a functional currency different from the company are translated into Canadian dollars as follows: assets and liabilities are translated at the exchange rate in effect on the date of the consolidated balance sheet; revenues and expenses are translated at the monthly average exchange rate. The foreign currency translation adjustment arising from such translation is included in accumulated other comprehensive income in shareholders'shareholders’ equity.
EXFO Inc.
Notes to Consolidated Financial Statements
(tabular amounts in thousands of US dollars, except share and per share data and as otherwise noted)
Financial instruments
The classification of financial instruments depends on the intended purpose when the financial instruments were acquired or issued, as well as on their characteristics and designation by the company.
Classification
EXFO Inc.
Notes to Consolidated Financial Statements
(tabular amounts in thousands of US dollars, except share and per share data and as otherwise noted)
Financial assets
Cash | Loans and receivables |
Short-term investments | Available for sale |
Accounts receivable | Loans and receivables |
Other assets | Loans and receivables |
Forward exchange contracts | Derivatives used for hedging |
at amortized cost
Financial liabilities
Accounts payable and accrued liabilities | Other financial liabilities |
Contingent liability | Financial liabilities at fair value through profit or loss |
Forward exchange contracts | Derivatives used for hedging |
Available-for-sale financial assets
Available-for-sale financial assets are non-derivative financial assets that are designated as available for sale, or are not classified in any of the other categories. They are initially recognized at fair value plus transaction costs and are subsequently measured at fair value. After their initial recognition, any changes in their fair value are reflected in other comprehensive income.
Loans and receivables
Loans and receivables are non-derivative financial assets with fixed or determinable payments that are not quoted in an active market. After their initial measurement at fair value plus transaction costs, they are carried at amortized cost using the effective interest rate method, which generally corresponds to the nominal amount due to their short-term maturity.
Other financial liabilities
Other financial liabilities are non-derivative financial liabilities initially measured at fair value plus transaction costs, andif they are subsequently carried at amortized cost, usingheld within a business model whose objective is to hold assets to collect contractual cash flows, and their contractual terms give rise on specified dates to cash flows that are solely payments of principal and interest on the effective interest rate method, which generally corresponds to the nominalprincipal amount due to their short-term maturity.
Financial liabilitiesoutstanding. Otherwise, they are classified at fair value through profit or loss through other comprehensive income.
Financial liabilities at amortized cost
Financial liabilities are measured at amortized cost.
Financial assets at fair value through profit or lossother comprehensive income
Financial assets at fair value through other comprehensive income are non-derivative financial liabilities initially measuredrecognized at fair value plus transaction costs and are subsequently measured at fair value. After their initial recognition, any changes in their fair value are reflected in the consolidated statements of earnings.comprehensive income.
EXFO Inc.
Notes to Consolidated Financial Statements
(tabular amounts in thousands of US dollars, except share and per share data and as otherwise noted)
Derivative financial instruments and hedging activities
Forward exchange contracts are utilized by the company to manage its foreign currency exposure. Forward exchange contracts are entered into by the company to hedge anticipated US-dollar-denominated sales and the related accounts receivable as well as Indian-rupee-denominated operating expenses and the related accounts payable. The company'scompany’s policy is not to utilize those derivative financial instruments for trading or speculative purposes.
The company'scompany’s forward exchange contracts, which are designated as cash flow hedging instruments, qualify for hedge accounting.
Forward exchange contracts are classified as financial instruments at fair value through other comprehensive income. They are initially recorded at fair value plus transaction costs and subsequently measured at fair value. The fair value of forward exchange contracts is determined using quotedobservable prices and forward exchange rates at the consolidated balance sheet date, with the resulting value discounted back to present value. After initial recognition, the effective portion of changes in their fair value is reflected in other comprehensive income. Any ineffective portion is recognized immediately in the consolidated statements of earnings. Upon recognition of related hedged sales and operating expenses, accumulated changes in fair value of forward exchange contracts are respectively reclassified in sales and net research and development expenses in the consolidated statements of earnings.
At the inception of a hedge relationship, the company formally designates and documents the hedge relationship to which the company wishes to apply hedge accounting, the risk management objectives, the hedging instrument, the hedged item and the method used to test effectiveness. The company assesses effectiveness of the hedge relationship at inception and on an ongoing basis using the dollar-offset method.
Fair value hierarchy
The company classifies its derivative and non-derivative financial assets and financial liabilities measured at fair value using the fair value hierarchy as follows:
| Level 1: | Quoted prices (unadjusted) in an active market for identical assets or liabilities; |
| Level 2: | Inputs other than quoted prices included within Level 1 that are observable for the asset and liability, either directly or indirectly; and |
| Level 3: | Unobservable inputs for the asset or liability. |
EXFO Inc.
Notes to Consolidated Financial Statements
(tabular amounts in thousands of US dollars, except share and per share data and as otherwise noted)
The company'scompany’s short-term investments and forward exchange contracts and contingent liability are measured at fair value at each balance sheet date. The company'scompany’s short-term investments are classified within Level 1 of the fair value hierarchy because they are valued using quoted market prices in active markets. The company'scompany’s forward exchange contracts are classified within Level 2 of the fair value hierarchy because they are valued using quotedobservable prices and forward foreign exchange rates at the balance sheet dates. The company's contingent liability is classified within level 3 of the fair value hierarchy because it is valued using unobservable inputs such as expected future sales of Ontology.
Short-term investments
All investments with original terms to maturity of three months or less and that are not required for the purposes of meeting short-term cash requirements are classified as short-term investments. Short-term investments can be hold to maturity or sold and are classified as available-for-sale financial assets;assets at fair value through other comprehensive income; therefore, they are carried at fair value in the consolidated balance sheet, and any changes in their fair value are reflected in other comprehensive income. Upon the disposal or maturity of these assets, accumulated changes in their fair value are reclassified infrom other comprehensive income to the consolidated statements of earnings.
EXFO Inc.
Notes to Consolidated Financial Statements
(tabular amounts in thousands of US dollars, except share and per share data and as otherwise noted)
Inventories
Inventories are valued on an average cost basis, at the lower of cost and net realizable value. Net realizable value is the estimated selling price in the ordinary course of business less the estimated costs necessary to make the sale.
The cost of work in progress and finished goods includes material, labor and an allocation of manufacturing overhead.
Property, plant and equipment and depreciation
Property, plant and equipment are recorded at cost, net of accumulated depreciation and accumulated impairment losses. Such cost is reduced by related research and development tax credits.
Depreciation is provided on a straight-line basis over the estimated useful lives of the asset as follows:
| | Term |
| Land improvements | 15 years |
| Buildings | 20 to 60 years |
| Equipment | 3 to 15 years |
| Leasehold improvements | The lesser of useful life and remaining lease term |
The assets'assets’ residual values and useful lives are reviewed at each financial year-end and are adjusted prospectively, if appropriate.
Intangible assets, goodwill and amortization
Intangible assets
Intangible assets with finite useful lives primarily include the cost of core technology, customer relationships and software. The cost of intangible assets acquired in a business combination is the fair value of the assets at the date of acquisition. Following initial recognition, intangible assets are carried at cost less accumulated amortization and accumulated impairment losses. Amortization is provided on a straight-line basis over the estimated useful lives of onetwo to fiveeight years for core technology,technologies, three months to five years for customer relationships, one year for brand name, and fourtwo and eight years for software. None of the company'scompany’s intangible assets were developed internally.
The amortization method and the useful lives of intangible assets are reviewed at each financial year-end, and adjusted prospectively, if appropriate.
EXFO Inc.
Notes to Consolidated Financial Statements
(tabular amounts in thousands of US dollars, except share and per share data and as otherwise noted)
Goodwill
Goodwill represents the excess of the purchase price of acquired businesses over the estimated fair value of net identifiable assets acquired and is allocated to each cash-generating unit (CGU) or group of CGUs that are expected to benefit from the related business combination. A group of CGUs represents the lowest level within the company at which the goodwill is monitored for internal management purposes, which is not higher than an operating segment. Goodwill is not amortized but must be tested for impairment on an annual basis or more frequently if events or circumstances indicate that it might be impaired.
EXFO Inc.
Notes to Consolidated Financial Statements
(tabular amounts in thousands of US dollars, except share and per share data and as otherwise noted)
Research and development
All costs related to research are expensed as incurred, net of related tax credits and grants. Development costs are expensed as incurred, net of related tax credits and grants, unless they meet the recognition criteria of IAS 38, "“Intangible Assets''’’, in which case they are capitalized, net of related tax credits and grants and amortized on a straight-line basis over the estimated benefit period. Research and development expenses mainly comprise salaries and related expenses, material costs as well as fees paid to third-party consultants. As at August 31, 20162018 and 2017,2019, the company had not capitalized any development costs.
The company elected to account for non-refundable research and development tax credits under IAS 20, "“Accounting for Governmental Grants and Disclosures of Governmental Assistance''’’, and as such, these tax credits are presented against gross research and development expenses in the consolidated statements of earnings. Non-refundable research and development tax credits are included in earnings or deducted from the related assets, provided there is reasonable assurance that the company has complied and will comply with the conditions related to the tax credits and that the tax credits will be received.
Impairment of non-financial assets
The company assesses at each reporting date whether there is an indication that the carrying value of property, plant and equipment and finite-life intangible assets may not be recoverable. Non-financial assets that are not amortized (such as goodwill) are subject to an annual impairment test. If any indication exists, or when annual impairment testing is required, the company estimates the asset or asset group'sgroup’s recoverable amount. For the purpose of measuring recoverable amounts, assets are grouped at the lowest levels for which there are separately identifiable cash flows (CGUs). The recoverable amount is the higher of an asset or CGU'sCGU’s fair value less costs of disposal and its value in use. Where the carrying value of an asset or CGU exceeds its recoverable amount, the asset or the CGU is considered impaired and is written down to its recoverable amount. The company performs its annual goodwill impairment test in the fourth quarter of each fiscal year.
For property, plant and equipment and finite-life intangible assets, the reversal of impairment is limited so that the carrying value of the asset does not exceed its recoverable amount, nor exceed the carrying value that would have been determined, net of depreciation or amortization, had no impairment loss been recognized for the asset in prior periods. Impairment losses on goodwill are not reversed.
Leases
Operating leases are leases for which the company does not assume substantially all the risks and rewards of ownership of the asset. Operating lease rentals are charged to the consolidated statements of earnings on a straight-line basis over the lease term.
As at August 31, 20162018 and 2017,2019, all significant leases of the company were classified as operating leases.
EXFO Inc.
Notes to Consolidated Financial Statements
(tabular amounts in thousands of US dollars, except share and per share data and as otherwise noted)
Government grants
Grants related to operating expenses are included in earnings when the related expenses are incurred. Grants related to capital expenditures are deducted from the related assets. Grants are included in the consolidated statements of earnings or deducted from the related assets, provided there is reasonable assurance that the company has complied and will comply with all the conditions related to the grants and that the grants will be received.
EXFO Inc.
Notes to Consolidated Financial Statements
(tabular amounts in thousands of US dollars, except share and per share data and as otherwise noted)
Warranty
The company offers its customers basic warranties of one to three years, depending on the specific products and terms of the purchase agreement. The company'scompany’s typical warranties require it to repair or replace defective products during the warranty period at no cost to the customer. Costs related to basic warranties are accrued at the time of shipment, based upon estimates of expected rework and warranty costs to be incurred. Costs associated with separately priced extended warranties are expensed as incurred.
Income taxes
Income taxes comprise current and deferred income taxes.
Current income taxes
Current income tax assets and liabilities for the current and prior years are measured at the amount expected to be recovered or paid to the taxation authorities. Income tax rates used to calculate the amount are those that are enacted or substantively enacted at the balance sheet dates in the tax jurisdictions where the company generates taxable income/loss.
Deferred income taxes
The company provides for deferred income taxes using the liability method. Under this method, deferred income tax assets and liabilities are determined based on deductible or taxable temporary differences between financial statement values and tax values of assets and liabilities as well as the carry-forward of unused tax losses and deductions, using enacted or substantively enacted income tax rates at the balance sheet dates, that are expected to be in effect for the years in which the assets are expected to be recovered or the liabilities to be settled.
Deferred income tax assets are recognized only to the extent that it is probable that future taxable income will be available against which the deductible temporary differences as well as unused tax losses and deductions can be utilized.
Deferred tax liabilities are recognized for all taxable temporary differences and for taxable temporary differences arising on investments in subsidiaries, except where the reversal of these temporary differences can be controlled, and it is probable that the differences will not reverse in the foreseeable future.
Deferred income tax assets and liabilities are presented as non-current in the consolidated balance sheets.
EXFO Inc.
Notes to Consolidated Financial Statements
(tabular amounts in thousands of US dollars, except share and per share data and as otherwise noted)
Uncertain tax positions
The company is subject to income tax laws and regulations in several jurisdictions. There are many transactions and calculations during the course of business for which the ultimate tax determination is uncertain. The company maintains provisions for uncertain tax positions that it believes appropriately reflect its risk. These provisions are made using the best estimate of the amount expected to be paid based on a qualitative assessment of all relevant factors. The company reviews the adequacy of these provisions at the end of the reporting periods and any changes in the provisions are recognized in the consolidated statements of earnings when they occur. However, it is possible that at some future dates, liabilities in excess of the company'scompany’s provisions could result from audits by, or litigation with, the relevant taxing authorities. Where the final outcome of these tax-related matters is different from the amounts that were initially recorded, such differences will be recognized in the consolidated statement of earnings in the period in which such determination is made.
EXFO Inc.
Notes to Consolidated Financial Statements
(tabular amounts in thousands of US dollars, except share and per share data and as otherwise noted)
Earnings per share
Basic earnings per share are calculated by dividing net earnings attributable to common equity holders of the company by the weighted average number of common shares outstanding during the year.
Diluted earnings per share are calculated by dividing net earnings attributable to common equity holders of the company by the weighted average number of common shares outstanding during the year, plus the effect of dilutive potential common shares outstanding during the year. This method requires that diluted earnings per share be calculated (using the treasury stock method) as if all dilutive potential common shares had been exercised at the latest at the beginning of the year or on the date of issuance, as the case may be, and that the funds obtained thereby (plus an amount equivalent to the unamortized portion of related stock-based compensation costs) be used to purchase common shares of the company at the average market price of the common shares during the year.
Stock-based compensation
Equity-settled awards
The company'scompany’s stock options, restricted share units and deferred share units are equity-settled awards. The company accounts for stock-based compensation costs on equity-settled awards using the Black-Scholes option valuation model. The fair value of equity-settled awards is measured at the date of grant. Stock-based compensation costs are amortized to expense over the vesting periods together with a corresponding change in contributed surplus in shareholders'shareholders’ equity. For equity-settled awards with graded vesting, each tranche is considered a separate grant with a different vesting date and fair value, and each tranche is accounted for separately.
Cash-settled awards
The company'scompany’s stock appreciation rights are cash-settled awards. The company accounts for stock-based compensation costs on cash-settled awards using the Black-Scholes option valuation model. The fair value of the cash-settled awards is remeasured at the end of each reporting period, with any changes in the fair value recognized in the consolidated statements of earnings.
EXFO Inc.
Notes to Consolidated Financial Statements
(tabular amounts in thousands of US dollars, except share and per share data and as otherwise noted)
Operating segments
Operating segments are defined as components of an entity engaged in business activities from which it may earn revenues and incur expenses, and whose operating results are regularly reviewed by the chief operating decision makerdecisionmaker (CODM) to make decisions about resources to be allocated to segments and assess their performance and for which discrete information is available. The function of the CODM is performed by the Chief Executive Officer who reviews consolidated results for the purposes of allocating resources and evaluating performance. Accordingly, the company determines that it has one operating segment as of, and for the years ended August 31, 2015, 20162017, 2018 and 2017.2019. Entity-wide disclosures are presented in note 21.22.
Critical accounting judgments in applying accounting policies and estimates
The preparation of financial statements in accordance with IFRS requires management to make judgments, estimates and assumptions that affect the reported amounts of assets, liabilities, revenue and expenses as well as the disclosures of contingent assets and liabilities at the date of the financial statements. Actual results could differ from those judgments, estimates and assumptions.
EXFO Inc.
Notes to Consolidated Financial Statements
(tabular amounts in thousands of US dollars, except share and per share data and as otherwise noted)
Critical judgments, estimates and assumptions are the following:
Critical judgments in applying accounting policies
| (a) | Determination of functional currency |
The company operates in multiple countries and generates revenue and incurs expenses in several currencies, namely the Canadian dollar, the US dollar, the euro, the British pound, the Indian rupee and the CNY (Chinese currency). The determination of the functional currency of the company and its subsidiaries may require significant judgment. In determining the functional currency of the company and its subsidiaries, management takes into account primary, secondary and tertiary indicators. When indicators are mixed, and the functional currency is not obvious, management uses its judgment to determine the functional currency.
| (b) | Determination of cash generating units and allocation of goodwill |
For the purpose of impairment testing, goodwill must be allocated to each CGU or group of CGUs that are expected to benefit from the synergies of the business combination. Initial allocation and possible reallocation of goodwill to a CGU or a group of CGUs requires judgment.
Critical estimates and assumptions
The company states its inventories at the lower of cost, determined on an average cost basis, and net realizable value, and provides reserves for excess and obsolete inventories. The company determines its reserves for excess and obsolete inventories based on the quantities on hand at the reporting dates compared to foreseeable needs, taking into account changes in demand, technology or market.
EXFO Inc.
Notes to Consolidated Financial Statements
(tabular amounts in thousands of US dollars, except share and per share data and as otherwise noted)
The company is subject to income tax laws and regulations in several jurisdictions. Under these laws and regulations, uncertainties exist with respect to the interpretation of complex tax laws and regulations and the amount and timing of future taxable income. The company maintains provisions for uncertain tax positions that it believes appropriately reflect its risk based on its interpretation of laws and regulations. In addition, management has made reasonable estimates and assumptions to determine the amount of deferred tax assets that can be recognized in the consolidated financial statements, based upon the likely timing and level of anticipated future taxable income together with tax planning strategies. The ultimate realization of the company'scompany’s deferred income tax assets is dependent upon the generation of sufficient future taxable income during the periods in which those assets are expected to be realized.
| (c) | Tax credits recoverable |
Tax credits are recorded provided thatif there is reasonable assurance that the company has complied and will comply with all the conditions related to the tax credits and that the tax credits will be received. The ultimate recovery of the company'scompany’s non-refundable tax credits is dependent upon the generation of sufficient future taxable income during the tax credits carry-forward periods. Management has made reasonable estimates and assumptions to determine the amount of non-refundable tax credits that can be recognized in the consolidated financial statements, based upon the likely timing and level of anticipated future taxable income together with tax planning strategies (note 19)20).
EXFO Inc.
Notes to Consolidated Financial Statements
(tabular amounts in thousands of US dollars, except share and per share data and as otherwise noted)
| (d) | Impairment of non-financial assets |
Impairment exists when the carrying value of an asset or group of assets (CGU) exceeds its recoverable amount, which is the higher of its fair value less costs of disposal and its value in use. The fair value less costs of disposal calculation for the company'scompany’s CGUs is based on a market approach that relies on unobservable inputs based on valuation multiples and recent transactions for comparable assets or businesses, within the same industry. The company applies judgment in making adjustments to the unobservable inputs for factors such as size, risk profile or profitability. The company also considers the company'scompany’s value derived from its market capitalization, adjusting for a control premium considered appropriate based on other comparable companies with significant controlling interests. Depending on the market evidence available, the company, from time to time, may further supplement this market approach with an income approach that considers discounted cash flows to determine fair value less costs of disposal.disposal, as well as the nature and magnitude of research and development activities carried out by the CGU. The discounted cash flow model involves significant judgment with respect to estimating cash flows (based on market participant assumptions) and the appropriate discount rate.
| (e) | Purchase price allocation in business combinations |
The fair value of the total consideration transferred in business combinations (purchase price) must be allocated based on estimated fair value of acquired net assets at the date of acquisition. Allocating the purchase price requires management to make estimates and judgments to determine assets acquired and liabilities assumed, useful lives of certain long-lived assets and the respective fair value of assets acquired, and liabilities assumed; this may require the use of unobservable inputs, including management'smanagement’s expectations of future revenue growth, operating costs and profit margins as well as discount rates.
New IFRS pronouncements not yet adopted
Financial instruments
The final version of IFRS 9, "Financial Instruments", was issued in July 2014 and will replace IAS 39, "Financial Instruments: Recognition and Measurement". IFRS 9 uses a single approach to determine whether a financial asset is measured at amortized cost or fair value, replacing the multiple rules in IAS 39. The approach in IFRS 9 is based on how an entity manages its financial instruments in the context of its business model and the contractual cash flow characteristics of the financial assets. Most of the requirements in IAS 39 for classification and measurement of financial liabilities were carried forward unchanged to IFRS 9. The new standard also requires a single impairment method to be used, replacing the multiple impairment methods in IAS 39. Requirements relating to hedge accounting representing a new hedge accounting model have also been added to IFRS 9. The new standard is effective for annual periods beginning on or after January 1, 2018, and must be applied retrospectively. The company will adopt this new standard on September 1, 2018. The company is currently assessing the impact that the new standard will have on its consolidated financial statements.
F-18
EXFO Inc.
Notes to Consolidated Financial Statements
(tabular amounts in thousands of US dollars, except share and per share data and as otherwise noted)
Revenue from contracts with customers
IFRS 15, "| (f) | Identification of performance obligations |
Revenue from Contracts with Customers", was issued in May 2014. The objective of this new standard isCustomer contracts may include promises to provide a single, comprehensive revenue recognition model for all contracts with customers to improve comparability. This new standard contains principles that an entity will apply to determine the measurement of revenuetransfer multiple products and timing of when it is recognized. The underlying principle is that an entity will recognize revenue to depict the transfer of goods or services to customers at an amounta customer. Determining whether the products and services are considered distinct performance obligations that the entity expects toshould be entitled to in exchangeaccounted for those goodsseparately or services. This new standard is effective for annual periods beginning on or after January 1, 2018. Early adoption is permitted. as one single performance obligation may require significant judgment. The company has performed an assessment to identify significant areasassesses whether each promised good or service is distinct for the purpose of impact, if any, between the company's current accounting treatment under IAS 18, "Revenue" and the new requirements of IFRS 15. Based on the assessments to date, the company anticipates that the main areas of impact will relate to the allocation of the transaction price toidentifying the various performance obligations underin each contract. Promised goods and services are considered distinct provided that: (i) the contracts,customer can benefit from the timing of revenue recognition for sales arrangementgood or service either on its own or together with other resources that contain customer acceptance clauses,are readily available to the customer; and the sale of licenses that provide customers with the "right to use"(ii) the company's intellectual property. The company will adopt this new standard on September 1, 2018 usingpromise to transfer the modified retrospective method, with the cumulative effect of the initial application of the standard recognized as an adjustmentgood or service to the opening balance of retained earnings as atcustomer is separately identifiable or distinct from other promises in the date of initial application. The company will apply this standard retrospectively only to contracts that are not completed at the date of initial application.contract.
Recently issued IFRS Pronouncements Not Yet Adopted
Leases
IFRS 16, "“Leases"”, was issued in January 2016. IFRS 16 sets out the principles for the recognition, measurement, presentation and disclosure of leases for both parties to a contract, i.e., the customer (lessee) and the supplier (lessor). IFRS 16 will supersede IAS 17, "“Leases"”, and related Interpretations. interpretations. Under IFRS 16, lessees will recognize a right-of-use asset and a lease liability measured at the present value of lease payments for virtually all of their leases. Short-term leases with a term of 12 months or less are not required to be recognized. This new standard is effective for annual periods beginning on or after January 1, 2019, with earlier adoption permitted if IFRS 15, "2019.Revenue from Contracts with Customers", is also applied. The company has not yet assessed the impact that the new standard will have on its consolidated financial statements.
Foreign Currency Transactions and Advance Consideration
IFRIC 22, "Foreign Currency Transactions and Advance Consideration", was issued in December 2016. IFRIC 22 addresses how to determine the date of the transaction for the purpose of determining the exchange rate to use on initial recognition of the related asset, expense or income (or part of it) and on the derecognition of a non-monetary asset or non-monetary liability arising from the payment or receipt of advance consideration in a foreign currency. IFRIC 22 is effective for annual periods beginning on or after January 1, 2018. Early adoption is permitted. The company will adopt this interpretationnew standard on September 1, 20182019, using the modified retrospective method, which does not require adjustments to comparative periods. The company will apply IFRS 16 at the adoption date and recognize right-of-use assets and lease liabilities in the period of adoption. The new standard provides a number of optional practical expedients in transition. Upon implementation of the new standard, the company intends to elect the practical expedients to combine lease and non-lease components, and to not recognize right-of-use assets and lease liabilities for short-term leases. The company is currently assessingin the impactprocess of identifying appropriate changes to its accounting policies, information technology systems, business processes, and related internal controls to support recognition and disclosure requirements under IFRS 16. The company expects that the adoption of IFRS 16 will increase its assets and liabilities by approximately $11 million, as it will recognize a right-of-use asset and a lease liability for all its long-term leases. However, the company does not expect the adoption of this standard to have a significant impact on itsnet earnings. The lease expense, previously recorded under cost of sales, selling and administrative expenses and net research and development expenses line items will be recorded as depreciation expenses for the right-of-use asset and as interest expenses on the lease liability in the consolidated financial statements.statements of earnings. In addition, lease payments for the right-of-use asset, previously reported in cash flow from operating activities will be reported in cash flow from financing activities in the consolidated statements of cash flows.
Uncertainty over Income Tax Treatmentsincome tax treatments
IFRIC 23, "“Uncertainty over Income Tax TreatmentTreatments"”, was issued in June 2017. IFRIC 23 provides guidance on how to value uncertain income tax positions based on the probability of whether the relevant tax authorities will accept the company's tax treatments. A company is to assume that a taxation authority with the right to examine any amounts reported to it will examine those amounts and will have full knowledge of all relevant information when doing so. IFRIC 23 is effective for annual periods beginning on or after January 1, 2019. The company will adopt this interpretation on September 1, 2019 and is currently assessing the impact that itwe do not expect its adoption will have a material impact on its consolidated financial statements.
F-19
EXFO Inc.
Notes to Consolidated Financial Statements
(tabular amounts in thousands of US dollars, except share and per share data and as otherwise noted)
Absolute Analysis Inc.Fiscal 2018
Astellia S.A. (renamed EXFO Solutions S.A.S.) - Business combination achieved in stages
On September 8, 2017, the company acquired a 33.1% interest in Astellia S.A. (EXFO Solutions), a publicly traded company on the NYSE Euronext Paris stock exchange. EXFO Solutions is a provider of network and subscriber intelligence-enabling mobile operators to drive service quality, maximize operational efficiency, reduce churn and increase revenue. Its vendor-independent, real-time monitoring and troubleshooting solution is used to optimize networks end-to-end from radio to core. The purchase price amounted to €10 per share for a total cash consideration of €8,567,500 (US$10,311,100).
On October 31, 2016,10, 2017, the company reached an agreement with EXFO Solutions to acquire EXFO Solutions’ remaining shares, at a share price of €10, for a total consideration of €17,321,380 (US$21,357,500) by way of a public tender offer. The public offering opened on December 15, 2017 and closed on January 26, 2018.
On December 21 and 22, 2017, the company acquired substantiallyadditional interests of 6.0% and 1.2% respectively in EXFO Solutions at a purchase price of €10 per share for a total cash consideration of €1,878,610 (US$2,218,600), which brought the company’s investment in EXFO Solutions to 40.3%.
On January 26, 2018, upon the closing of the public tender offer, the company acquired additional interest of 48.1% in EXFO Solutions at a purchase price of €10 per share for a total cash consideration of €12,452,090 (US$15,476,900), which brought the company’s investment in EXFO Solutions to 88.4% and provided the company with control over EXFO Solutions.
The company re-opened the public tender offer to acquire the remaining shares of EXFO Solutions from February 9, 2018 to February 22, 2018. During that period, the company acquired an additional interest of 8.9% in EXFO Solutions at a purchase price of €10 per share for a total cash consideration of €2,318,530 (US$2,841,400), which brought the company’s investment in EXFO Solutions to 97.3%.
Finally, on February 28, 2018, the company entered into a squeeze-out process to acquire the remaining 2.7% interest in EXFO Solutions at a share price of €10, for a total cash consideration of €672,150 (US$820,600). The binding terms of the squeeze-out process gave the company control over EXFO Solutions’ remaining shares as at February 28, 2018 and consequently, as of that date the company controlled 100% of EXFO Solutions’ shares.
The fair value of the total consideration paid for all shares of EXFO Solutions amounted to €25,888,880 (US$32,137,800) and consisted of €21,102,880 (US$26,241,000) in cash, net of EXFO Solutions’ cash of €4,786,000 (US$5,896,800) at the date of acquisition of control.
From September 8, 2017 to January 25, 2018, the investment in EXFO Solutions provided the company with significant influence over EXFO Solutions, and it was therefore accounted for under the equity method as required by IAS 28, “Investments in Associates and Joint Ventures”. Under this method, on initial recognition this investment was recognized at cost, and the carrying amount decreased to recognize the company’s share of the net loss of EXFO Solutions after the acquisition date. Included in the consolidated statement of earnings for the year ended August 31, 2018 is an equity loss pick-up of $2,079,800.
EXFO Inc.
Notes to Consolidated Financial Statements
(tabular amounts in thousands of US dollars, except share and per share data and as otherwise noted)
Upon the acquisition of an additional 48.1% interest in EXFO Solutions on January 26, 2018 (the “acquisition date”), the acquisition has been considered a business combination, and the acquisition was accounted for by applying the acquisition method as required by IFRS 3, “Business Combinations”, and the requirements of IFRS 10, “Consolidated Financial Statements”. Consequently, the fair value of the total consideration was allocated to the assets acquired and liabilities assumed based on management’s estimate of Absolute Analysistheir fair value as at the acquisition date. The results of operations of the acquired business have been included in the consolidated financial statements of the company since January 26, 2018. The company recognized the non-controlling interest in EXFO Solutions at fair value. At the acquisition date, the carrying value of the 40.3% interest in EXFO Solutions held prior to the business combination was re-measured at fair value, that is, €10 per share, and was deemed to have been disposed of on that date. This acquisition-date re‑measurement and deemed disposal resulted in a gain of $2,079,800 that was accounted for in the consolidated statement of earnings for the year ended August 31, 2018.
In addition, upon the successive acquisitions of the non-controlling interest in February 2018, the company recorded a gain in the amount of $352,000 in shareholders’ equity, representing the excess of the carrying value of the non-controlling interest and the purchase price paid.
The following table summarizes EXFO Solutions’ contributed sales and net loss attributable to the parent interest for the period from January 26, 2018 to August 31, 2018:
Sales (1) | | $ | 16,377 | |
Net loss attributable to the parent interest (1, 2) | | $ | 12,850 | |
If the acquisition had occurred on September 1, 2017, consolidated pro forma sales and net loss attributable to the parent interest of the combined entities for the year ended August 31, 2018 would have been $292,134,000 and $18,768,000 respectively.
| (1) | Includes acquisition-related deferred revenue fair value adjustment of $2,095,000. |
| (2) | Includes amortization of acquired intangible assets of $5,077,000. |
EXFO Inc. (Absolute)
Notes to Consolidated Financial Statements
(tabular amounts in thousands of US dollars, except share and per share data and as otherwise noted)
The fair value of the total consideration was allocated based on an estimate of fair value of acquired net assets at the date of acquisition as follows:
| Assets acquired | | | |
| Accounts receivable | | $ | 16,374 | |
| Income taxes and tax credits recoverable | | | 11,259 | |
| Inventories | | | 3,045 | |
| Prepaid expenses | | | 1,229 | |
| Property, plant and equipment | | | 1,944 | |
| Core technologies | | | 12,869 | |
| Customer relationships | | | 8,381 | |
| Brand name | | | 846 | |
| Other intangible assets | | | 498 | |
| Other assets | | | 1,402 | |
| | | | 57,847 | |
| Liabilities assumed | | | | |
| Accounts payable and accrued liabilities | | | 11,068 | |
| Deferred revenue | | | 4,748 | |
| Long-term debt (note 12) | | | 8,888 | |
| Deferred income tax liabilities | | | 2,692 | |
| Other liabilities | | | 6,715 | |
| Net identifiable assets acquired | | | 23,736 | |
| | | | | |
| Goodwill | | | 2,505 | |
| Fair value of the total consideration, net of cash acquired | | $ | 26,241 | |
The fair value of the total consideration, net of cash acquired, consisted of the following at the acquisition date:
| Cash paid net of cash acquired | | $ | 9,580 | |
| Fair value of shares held | | | 12,967 | |
| Non-controlling interest (purchased in February 2018) | | | 3,694 | |
| | | $ | 26,241 | |
The estimated fair value of acquired accounts receivable amounted to $16,374,000 as at January 26, 2018. The gross contractual amount of accounts receivable amounted to $18,758,000 as at January 26, 2018. The estimate at the acquisition date of the gross contractual cash flows not expected to be collected amounted to $2,384,000.
Acquired intangible assets are amortized on a straight-line basis over their estimated useful lives of four and eight years for core technologies, two to five years for customer relationships, and one year for brand name.
Acquired goodwill mainly represents synergies with the company’s products as well as EXFO Solutions’ acquired workforce. Acquired goodwill is not deductible for tax purposes. Goodwill was allocated to the EXFO Solutions CGU up to August 31, 2018. Since then, it has been allocated to the service assurance, systems and services CGU (note 9).
The functional currency of EXFO Solutions is the euro and as such it is considered a foreign operation. The financial operations of EXFO Solutions are translated into Canadian dollars as follows: assets and liabilities are translated at the exchange rate in effect on the date of the balance sheet; revenue and expenses are translated at the monthly average exchange rate. The foreign currency translation adjustment arising from such translation is included in accumulated other comprehensive loss in shareholders’ equity.
EXFO Inc.
Notes to Consolidated Financial Statements
(tabular amounts in thousands of US dollars, except share and per share data and as otherwise noted)
Yenista Optics S.A.S. (renamed EXFO Optics S.A.S.)
On October 2, 2017, the company acquired all issued and outstanding shares of Yenista Optics S.A.S. (EXFO Optics), a privately held company located in France and a supplier of advanced optical test equipment for the United States, supplying solutions for radio frequency testing of fiber-based radio access networks.research and development and manufacturing markets. The acquisition-date fair value of the total consideration transferred amounted to $8,490,000€9,400,000 (US$11,052,000) and consisted of $5,000,000€8,114,000 (US$9,540,000) in cash, andnet of EXFO Optics’ cash of €1,286,000 (US$1,512,000) at the issuance of 793,070 subordinate voting shares valued at $3,490,000.acquisition date.
This acquisition was accounted for by applying the acquisition method as required by IFRS 3, "“Business Combinations"”, and the requirements of IFRS 10, "“Consolidated Financial Statements"”; consequently, the fair value of the total consideration transferred was allocated to the assets acquired and liabilityliabilities assumed based on management'smanagement’s estimate of their fair value as at the acquisition date. The results of operations of the acquired business have been included in the consolidated financial statements of the company since October 31, 2016,2, 2017, being the date of acquisition.acquisition date.
During the second quarter of fiscal 2017, the company completed the detailed valuation and finalized the allocation of the purchase price.
The fair value of the total consideration transferred was allocated based on a finalan estimate of the fair value of acquired net assets at the date of acquisition as follows:
| Assets acquired | | | | | | |
| Core technology | | $ | 4,130 | | |
| Other assets | | | 236 | | |
| Accounts receivable | | | $ | 1,889 | |
| Inventories | | | 2,384 | |
| Property, plant and equipment | | | 1,424 | |
| Core technologies | | | 3,686 | |
| Customer relationships | | | 811 | |
| In-process research and development | | | 305 | |
| Other intangible assets | | | 132 | |
| Prepaid expenses | | | | 171 | |
| | | | 4,366 | | | 10,802 | |
| Liability assumed | | | | | |
| Liabilities assumed | | | | |
| Accounts payable and accrued liabilities | | | 1,035 | |
| Long-term debt (note 12) | | | 2,143 | |
| Deferred income taxes | | | 279 | | | | 1,510 | |
| Net identifiable assets acquired | | | 4,087 | | | 6,114 | |
| Goodwill | | | 4,403 | | | | 3,426 | |
| Fair value of the total consideration transferred | | $ | 8,490 | | |
| Fair value of the total consideration, net of cash acquired | | | $ | 9,540 | |
IntangibleAcquired intangible assets are amortized on a straight-line basis over their estimated useful liveslife of onetwo to five years.years for core technologies and three months for customer relationships.
Acquired goodwill mainly represents synergies with the company'scompany’s products as well as the AbsoluteEXFO Optics’ acquired workforce. Acquired goodwill is not deductible for tax purposes. Goodwill is allocated to the EXFO cash generating unit.Optics CGU (note 9).
Ontology Partners Limited
On March 2, 2017,The functional currency of EXFO Optics is the company acquired alleuro, and, as such, it is considered a foreign operation. The financial operations of the issuedEXFO Optics are translated into Canadian dollars as follows: assets and outstanding shares of Ontology Partners Limited (Ontology), a privately held company located in the United Kingdom, a supplier of real-time network topology discovery and service-chain mapping. The acquisition-date fair value of the total consideration transferred amounted to $9,180,000 and consisted of $7,780,000 in cash, net of Ontology's cash of $2,156,000liabilities were translated at the acquisition date, plus a cash contingent consideration basedexchange rate in effect on certain sales volumes of Ontology products over the 12-month period following the acquisition, with an estimated fair value of $1,400,000 at the acquisition date.
This acquisition was accounted for by applying the acquisition method as required by IFRS 3, "Business Combinations", and the requirements of IFRS 10, "Consolidated Financial Statements"; consequently, the fair value of the total consideration transferred was allocated to the assets acquired and liabilities assumed based on management's estimate of their fair value as at the acquisition date. The results of operations of the acquired business have been included in the consolidated financial statements of the company since March 2, 2017, being the date of acquisition.the balance sheet; revenue and expenses are translated at the monthly average exchange rate. The foreign currency translation adjustment arising from such translation is included in accumulated other comprehensive loss in shareholders’ equity.
F-20F-23
EXFO Inc.
Notes to Consolidated Financial Statements
(tabular amounts in thousands of US dollars, except share and per share data and as otherwise noted)
During the fourth quarter ofIn connection with business combinations completed in fiscal 2017,2018, the company completed the detailed valuationincurred acquisition-related costs of $2,484,000, of which $2,236,000 were presented in selling and finalized the allocation of the purchase price; this resultedadministrative expenses and $248,000 were presented in an increase of goodwill of $650,000interest and a corresponding decrease in intangible assets.
The fair value of the total consideration transferred was allocated based on a final estimate of fair value of acquired net assets at the date of acquisition as follows:
| Assets acquired | | | |
| Accounts receivable | | $ | 1,701 | |
| Core technology | | | 3,802 | |
| Customer relationships | | | 1,607 | |
| Other assets | | | 37 | |
| | | | 7,147 | |
| Liabilities assumed | | | | |
| Accounts payable and accrued liabilities | | | 3,343 | |
| Deferred revenue | | | 211 | |
| Long-term debt | | | 1,480 | |
| Net identifiable assets acquired | | | 2,113 | |
| Goodwill | | | 7,067 | |
| Fair value of the total consideration transferred, net of cash acquired | | $ | 9,180 | |
Acquired intangible assets are amortized on a straight-line basis over their estimated useful life of five years.
Acquired goodwill mainly represents synergies with the company's products as well as Ontology acquired workforce. Acquired goodwill is not deductible for tax purposes. Goodwill is allocated to the Ontology cash generating unit.
As at August 31, 2017, the fair value of the cash contingent consideration amounted to $1,092,000 with the change in its fair value being accounted for in the consolidated statement of earnings.other expense.
Fiscal 2018
In August 2018, the company implemented a restructuring plan to accelerate the integration of its acquired monitoring and analytics technologies from EXFO Solutions and simplify its cost structure and optimize resources as the company converges toward fewer sites and reduces its workforce.
This plan resulted in expenses mainly comprising severance expenses, costs for remaining non-cancellable operating leases, writeoff of research and development income tax credits and impairment of long-lived assets, net of related income taxes. During the fourth quarter of fiscal 2018, the company recorded severance expenses of $2,072,000, costs for remaining non‑cancelable operating lease of $1,137,000, writeoff of research and development income tax credits of $1,200,000 and impairment of long-lived assets of $150,000, net of related income taxes of $1,150,000, for total after-tax restructuring charges of $3,409,000. The additional restructuring charges of $3,305,000, and related income taxes of $63,000, for total after-tax restructuring charges of $3,242,000 (note 18), was recorded in fiscal 2019. Restructuring charges in fiscal 2019 comprised severance expenses and were part of the fiscal 2018 restructuring plan.
In fiscal 2019, as part of this restructuring plan and the shutdown of its facilities in Toronto, Canada, the company sold one of its buildings for net proceeds of $3,318,000. The transaction resulted in a pre-tax gain of $1,732,000 that was recorded in the consolidated statement of earnings for the year ended August 31, 2019.
In addition, in fiscal 2019, as part of this restructuring plan and the shutdown of some of its facilities in the United States, the company transferred the ownership of certain intellectual properties held in the United States to Canada. This created a deductible tax asset in Canada and resulted in the recognition of a deferred income tax recovery of $2,383,000 in fiscal 2019 as the recovery of this asset is probable. This deferred income tax recovery was recorded in the consolidated statement of earnings for the year ended August 31, 2019.
The following tables summarize changes in restructuring accrual during the years ended August 31, 2018 and 2019:
| | | Years ended August 31, | |
| | | 2019 | | | 2018 | |
| | | | | | | |
| Balance – Beginning of year | | $ | 3,167 | | | $ | 2,477 | |
| Addition | | | 3,305 | | | | 3,209 | |
| Payments | | | (5,339 | ) | | | (2,052 | ) |
| Reversal | | | – | | | | (467 | ) |
| Balance – End of year (note 11) | | $ | 1,133 | | | $ | 3,167 | |
Fiscal 2017
In May 2017, the company implemented a restructuring plan to streamline its passive monitoring solutions portfolio. This plan resulted in severance expenses of $4,049,000 and inventory writeoffs of $1,030,000, for total restructuring charges of $5,079,000 during the year.
As All expenses related to this plan were fully paid as at August 31, 2017, unpaid severance expenses amounted to $2,477,000, which are expected to be paid in fiscal 2018 (note 11).2018.
The company is not subject to any external restrictions on its capital.
The company's objectives when managing capital are:
· | To maintain a flexible capital structure that optimizes the cost of capital at acceptable risk; |
· | To sustain future development of the company, including research and development activities, market development and potential acquisitions of complementary businesses or products; and |
· | To provide the company's shareholders with an appropriate return on their investment. |
F-21F-24
EXFO Inc.
Notes to Consolidated Financial Statements
(tabular amounts in thousands of US dollars, except share and per share data and as otherwise noted)
The company is not subject to any external restrictions on its capital.
The company’s objectives when managing capital are:
To maintain a flexible capital structure that optimizes the cost of capital at acceptable risk;
To sustain future development of the company, including research and development activities, market development and potential acquisitions of complementary businesses or products; and
To provide the company’s shareholders with an appropriate return on their investment.
No changes were made to the objectives and policies during the years ended August 31, 20162018 and 2017.2019.
The company defines its capital as shareholders'shareholders’ equity, excluding accumulated other comprehensive loss. The capital of the company amounted to $229,975,000$225,271,000 and $235,755,000$224,075,000 as at August 31, 20162018 and 20172019 respectively.
The following tables summarize financial instruments by category:
| | | As at August 31, 2017 | |
| | | | | | | | | | | | | | | | | | | |
| | | Loans and
receivable | | | Available
for sale | | | Other
financial
liabilities | | | Financial
liabilities at
fair value
through profit
or loss | | | Derivatives
used for
hedging | | | Total | |
| | | | | | | | | | | | | | | | | | | |
| Financial assets | | | | | | | | | | | | | | | | | | |
| Cash | | $ | 38,435 | | | $ | ‒ | | | $ | ‒ | | | $ | ‒ | | | $ | ‒ | | | $ | 38,435 | |
| Short-term investments | | $ | ‒ | | | $ | 775 | | | $ | ‒ | | | $ | ‒ | | | $ | ‒ | | | $ | 775 | |
| Accounts receivable | | $ | 43,340 | | | $ | ‒ | | | $ | ‒ | | | $ | ‒ | | | $ | ‒ | | | $ | 43,340 | |
| Other assets | | $ | 36 | | | $ | ‒ | | | $ | ‒ | | | $ | ‒ | | | $ | ‒ | | | $ | 36 | |
| Forward exchange contracts | | $ | ‒ | | | $ | ‒ | | | $ | ‒ | | | $ | ‒ | | | $ | 2,258 | | | $ | 2,258 | |
| Financial liabilities | | | | | | | | | | | | | | | | | | | | | | | | |
| Accounts payable and accrued liabilities | | $ | ‒ | | | $ | ‒ | | | $ | 36,776 | | | $ | ‒ | | | $ | ‒ | | | $ | 36,776 | |
| Contingent liability | | $ | ‒ | | | $ | ‒ | | | $ | ‒ | | | $ | 1,092 | | | $ | ‒ | | | $ | 1,092 | |
| | | As at August 31, 2016 | |
| | | | | | | | | | | | | | | | |
| | | Loans and
receivable | | | Available
for sale | | | Other
financial
liabilities | | | Derivatives
used for
hedging | | | Total | |
| | | | | | | | | | | | | | | | |
| Financial assets | | | | | | | | | | | | | | | |
| Cash | | $ | 43,208 | | | $ | ‒ | | | $ | ‒ | | | $ | ‒ | | | $ | 43,208 | |
| Short-term investments | | $ | ‒ | | | $ | 4,087 | | | $ | ‒ | | | $ | ‒ | | | $ | 4,087 | |
| Accounts receivable | | $ | 45,467 | | | $ | ‒ | | | $ | ‒ | | | $ | ‒ | | | $ | 45,467 | |
| Other assets | | $ | 35 | | | $ | ‒ | | | $ | ‒ | | | $ | ‒ | | | $ | 35 | |
| Forward exchange contracts | | $ | ‒ | | | $ | ‒ | | | $ | ‒ | | | $ | 980 | | | $ | 980 | |
| Financial liabilities | | | | | | | | | | | | | | | | | | | | |
| Accounts payable and accrued liabilities | | $ | ‒ | | | $ | ‒ | | | $ | 36,099 | | | $ | ‒ | | | $ | 36,099 | |
| Forward exchange contracts | | $ | ‒ | | | $ | ‒ | | | $ | ‒ | | | $ | 1,120 | | | $ | 1,120 | |
Fair value
| | | As at August 31, 2019 | |
| | | | | | | | | | |
| | | Amortized
cost | | | Fair value
through other
comprehensive
income | | | Total | |
| | | | | | | | | | |
| Financial assets | | | | | | | | | |
| Cash | | $ | 16,518 | | | $ | – | | | $ | 16,518 | |
| Short-term investments | | $ | – | | | $ | 2,918 | | | $ | 2,918 | |
| Accounts receivable | | $ | 54,834 | | | $ | – | | | $ | 54,834 | |
| Forward exchange contracts | | $ | – | | | $ | 79 | | | $ | 79 | |
| Financial liabilities | | | | | | | | | | | | |
| Bank loan | | $ | 5,000 | | | $ | – | | | $ | 5,000 | |
| Accounts payable and accrued liabilities | | $ | 49,945 | | | $ | – | | | $ | 49,945 | |
| Other liabilities | | $ | 1,606 | | | $ | – | | | $ | 1,606 | |
| Long-term debt | | $ | 5,742 | | | $ | – | | | $ | 5,742 | |
| Forward exchange contracts | | $ | – | | | $ | 1,057 | | | $ | 1,057 | |
Cash, accounts receivable and accounts payable and accrued liabilities are financial instruments whose carrying values approximate their fair values due to their short-term maturities. The fair value of other assets approximates their carrying value due to their relatively short-term maturities.
F-22F-25
EXFO Inc.
Notes to Consolidated Financial Statements
(tabular amounts in thousands of US dollars, except share and per share data and as otherwise noted)
| | | As at August 31, 2018 – IAS 39 | |
| | | | | | | | | | | | | | | | |
| | | Loans and
receivables | | | Available
for sale | | | Other
financial
liabilities | | | Derivatives
used for
hedging | | | Total | |
| | | | | | | | | | | | | | | | |
| Financial assets | | | | | | | | | | | | | | | |
| Cash | | $ | 12,758 | | | $ | – | | | $ | – | | | $ | – | | | $ | 12,758 | |
| Short-term investments | | $ | – | | | $ | 2,282 | | | $ | – | | | $ | – | | | $ | 2,282 | |
| Accounts receivable | | $ | 46,955 | | | $ | – | | | $ | – | | | $ | – | | | $ | 46,955 | |
| Other assets | | $ | 352 | | | $ | – | | | $ | – | | | $ | – | | | $ | 352 | |
| Forward exchange contracts | | $ | – | | | $ | – | | | $ | – | | | $ | 318 | | | $ | 318 | |
| Financial liabilities | | | | | | | | | | | | | | | | | | | | |
| Bank loan | | $ | – | | | $ | – | | | $ | 10,692 | | | $ | – | | | $ | 10,692 | |
| Accounts payable and accrued liabilities | | $ | – | | | $ | – | | | $ | 47,308 | | | $ | – | | | $ | 47,308 | |
| Other liabilities | | $ | – | | | $ | – | | | $ | 3,197 | | | $ | – | | | $ | 3,197 | |
| Long-term debt | | $ | – | | | $ | – | | | $ | 8,828 | | | $ | – | | | $ | 8,828 | |
| Forward exchange contracts | | $ | – | | | $ | – | | | $ | – | | | $ | 807 | | | $ | 807 | |
Fair value
Cash, accounts receivable, bank loan, accounts payable and accrued liabilities and other liabilities are financial instruments whose carrying values approximate their fair values due to their short-term maturities. The fair value of the long-term debt amounted to $8,879,000 and $5,644,000 as at August 31, 2018 and 2019.
The fair value of derivative and non-derivative financial assets and financial liabilities measured at fair value by level of hierarchy is as follows:
| | | As at August 31, 2019 | | | As at August 31, 2018 | |
| | | Level 1 | | | Level 2 | | | Level 1 | | | Level 2 | |
| Financial assets | | | | | | | | | | | | |
| Short-term investments | | $ | 2,918 | | | $ | – | | | $ | 2,282 | | | $ | – | |
| Forward exchange contracts | | $ | – | | | $ | 79 | | | $ | – | | | $ | 318 | |
| | | | | | | | | | | | | | | | | |
| Financial liabilities | | | | | | | | | | | | | | | | |
| Forward exchange contracts | | $ | – | | | $ | 1,057 | | | $ | – | | | $ | 807 | |
| | | As at August 31, 2017 | | | As at August 31, 2016 | |
| | | Level 1 | | | Level 2 | | | Level 3 | | | Level 1 | | | Level 2 | |
| Financial assets | | | | | | | | | | | | | | | |
| Short-term investments | | $ | 775 | | | $ | ‒ | | | | ‒ | | | $ | 4,087 | | | $ | ‒ | |
| Forward exchange contracts | | $ | ‒ | | | $ | 2,258 | | | | ‒ | | | $ | ‒ | | | $ | 980 | |
| | | | | | | | | | | | | | | | | | | | | |
| Financial liabilities | | | | | | | | | | | | | | | | | | | | |
| Forward exchange contracts | | $ | ‒ | | | $ | ‒ | | | | ‒ | | | $ | ‒ | | | $ | 1,120 | |
| Contingent liability | | $ | ‒ | | | $ | ‒ | | | | 1,092 | | | $ | ‒ | | | $ | ‒ | |
The fair value of the long-term debt is estimated by discounting expected cash flows at rates currently offered to the company for debts of the same remaining maturities and conditions.
The fair value of forward exchange contracts is based on the amount at which they could be settled based on estimated current market rates.
EXFO Inc.
Notes to Consolidated Financial Statements
(tabular amounts in thousands of US dollars, except share and per share data and as otherwise noted)
Market risk
Currency risk
The functional currency of the company is the Canadian dollar. The company is exposed to currency risk as a result of its export sales of products manufactured in Canada, China, France and Finland, the majority of which are denominated in US dollars and euros. This risk is partially hedged by forward exchange contracts and certain cost of sales and operating expenses (US dollars and euros). In addition, the company is exposed to currency risk as a result of its research and development activities in India (Indian rupees). This risk is partially hedged by forward exchange contracts. Forward exchange contracts, which are designated as cash flow hedging instruments, qualify for hedge accounting.
As at August 31, 20162018 and 2017,2019, the company held contracts to sell US dollars for Canadian dollars and Indian rupees at various forward rates, which are summarized as follows:
US dollars – Canadian dollars
| | Expiry dates | | Contractual
amounts | | | Weighted average
contractual forward rates | |
| | | | | | | | |
| | As at August 31, 2016 | | | | | | |
| | September 2016 to August 2017 | | $ | 22,200 | | | | 1.2784 | |
| | September 2017 to August 2018 | | | 9,900 | | | | 1.3367 | |
| | September 2018 to December 2018 | | | 1,900 | | | | 1.3639 | |
| | Total | | $ | 34,000 | | | | 1.3002 | |
| | | | | | | | | | |
| | As at August 31, 2017 | | | | | | | | |
| | September 2017 to August 2018 | | $ | 18,300 | | | | 1.3407 | |
| | September 2018 to August 2019 | | | 10,900 | | | | 1.3426 | |
| | Total | | $ | 29,200 | | | | 1.3414 | |
| | Expiry dates | | Contractual
amounts | | | Weighted average
contractual forward rates | |
| | | | | | | | |
| | As at August 31, 2018 | | | | | | |
| | September 2018 to August 2019 | | $ | 26,400 | | | | 1.3029 | |
| | September 2019 to August 2020 | | | 15,700 | | | | 1.2756 | |
| | September 2020 to May 2021 | | | 3,700 | | | | 1.2703 | |
| | Total | | $ | 45,800 | | | | 1.2909 | |
| | | | | | | | | | |
| | As at August 31, 2019 | | | | | | | | |
| | September 2019 to August 2020 | | $ | 35,500 | | | | 1.3013 | |
| | September 2020 to August 2021 | | | 19,900 | | | | 1.3107 | |
| | September 2021 to July 2022 | | | 6,000 | | | | 1.3216 | |
| | Total | | $ | 61,400 | | | | 1.3063 | |
EXFO Inc.
Notes to Consolidated Financial Statements
(tabular amounts in thousands of US dollars, except share and per share data and as otherwise noted)
US dollars – Indian rupees
| | Expiry dates | | Contractual
amounts | | | Weighted average
contractual forward rates | |
| | | | | | | | |
| | As at August 31, 2018 | | | | | | |
| | September 2018 to May 2019 | | $ | 4,600 | | | | 67.68 | |
| | | | | | | | | | |
| | As at August 31, 2019 | | | | | | | | |
| | September 2019 to August 2020 | | $ | 3,500 | | | | 71.48 | |
| | Expiry dates | | Contractual
amounts | | | Weighted average
contractual forward rates | |
| | | | | | | | |
| | As at August 31, 2016 | | | | | | |
| | September 2016 to August 2017 | | $ | 3,800 | | | | 70.92 | |
| | | | | | | | | | |
| | As at August 31, 2017 | | | | | | | | |
| | September 2017 to August 2018 | | $ | 3,400 | | | | 69.49 | |
| | September 2018 to February 2019 | | | 1,600 | | | | 67.26 | |
| | Total | | $ | 5,000 | | | | 68.78 | |
The carrying amount of forward exchange contracts is equal to fair value, which is based on the amount at which they could be settled based on estimated current market rates. The fair value
EXFO Inc.
Notes to net lossesConsolidated Financial Statements
(tabular amounts in thousands of $140,000US dollars, except share and net gains of $2,258,000per share data and as at August 31, 2016 and 2017 respectively.otherwise noted)
As at August 31, 2017,2019, forward exchange contracts in the amount of $1,697,000$79,000 are presented as current assets in other accounts receivable, forward exchange contracts in the amount of $845,000 are presented as current liabilities in accounts payable and accrued liabilities, and forward exchange contracts in the amount of $561,000$212,000 are presented as long-term assetsliabilities in other long-term assetsliabilities in the consolidated balance sheet. Forward exchange contracts of $261,000,$167,000, included in other accounts payable and accrued liabilities, for which related hedged sales are recognized, are recorded in the consolidated statement of earnings. Otherwise, other forward exchange contracts are not yet recorded in the consolidated statement of earnings and are recorded in other comprehensive income.
As at August 31, 2018, forward exchange contracts in the amount of $318,000 are presented as current assets in other accounts receivable, forward exchange contracts in the amount of $590,000 are presented as current liabilities in accounts payable and accrued liabilities, and forward exchange contracts in the amount of $217,000 are presented as long-term liabilities in other long-term liabilities in the consolidated balance sheet. Forward exchange contracts of $64,000, included in other accounts receivable, for which related hedged sales are recognized, are recorded in the consolidated statement of earnings. Otherwise, other forward exchange contracts are not yet recorded in the consolidated statement of earnings and are recorded in other comprehensive income.
As at August 31, 2016, forward exchange contracts in the amount of $635,000 were presented as current assets in other accounts receivable; forward exchange contracts in the amount of $345,000 were presented as long-term assets in other long-term assets; forward exchange contracts in the amount of $1,075,000 were presented as current liabilities in accounts payable and accrued liabilities; and forward exchange contracts in the amount of $45,000 were presented as long-term liabilities in other long-term liabilities in the consolidated balance sheet.
Based on the portfolio of forward exchange contracts as at August 31, 2017,2019, the company estimates that the portion of net unrealized gainslosses on these contracts as of that date, which will be realized and reclassified from accumulated other comprehensive income to net earnings over the next 12 months, amounts to $1,436,000.$599,000.
For the years ended August 31, 2015, 20162017, 2018 and 2017,2019, the company recorded within its sales the following foreign exchange lossesgains (losses) on forward exchange contracts:
| | | Years ended August 31, | |
| | | 2019 | | | 2018 | | | 2017 | |
| | | | | | | | | | |
| Gains (losses) on forward exchange contracts | | $ | (591 | ) | | $ | 875 | | | $ | (468 | ) |
| | | Years ended August 31, | |
| | | 2017 | | | 2016 | | | 2015 | |
| | | | | | | | | | |
| Losses on forward exchange contracts | | $ | 468 | | | $ | 2,651 | | | $ | 2,562 | |
The following table summarizes significant derivative and non-derivative financial assets and financial liabilities that are subject to currency risk as at August 31, 2018 and 2019 and for which such risk is charged to earnings:
| | | As at August 31, | |
| | | 2019 | | | 2018 | |
| | | | | | | | | | | | | |
| | | Carrying/nominal amount (in thousands of US dollars) | | | Carrying/nominal amount (in thousands of euros) | | | Carrying/nominal amount (in thousands of US dollars) | | | Carrying/nominal amount (in thousands of euros) | |
| | | | | | | | | | | | | |
| Financial assets | | | | | | | | | | | | |
| Cash | | $ | 5,531 | | | € | 3,129 | | | $ | 2,790 | | | € | 3,352 | |
| Accounts receivable | | | 30,451 | | | | 6,389 | | | | 30,306 | | | | 3,787 | |
| | | | 35,982 | | | | 9,518 | | | | 33,096 | | | | 7,139 | |
| Financial liabilities | | | | | | | | | | | | | | | | |
| Bank loan | | | 5,000 | | | | – | | | | 7,197 | | | | 3,000 | |
| Accounts payable and accrued liabilities | | | 12,563 | | | | 2,218 | | | | 13,017 | | | | 2,107 | |
| Forward exchange contracts (nominal value) | | | 5,800 | | | | – | | | | 5,000 | | | | – | |
| | | | 23,363 | | | | 2,218 | | | | 25,214 | | | | 5,107 | |
| Net exposure | | $ | 12,619 | | | € | 7,300 | | | $ | 7,882 | | | € | 2,032 | |
In addition to these assets and liabilities, the company has derivative financial liabilities for its outstanding forward exchange contracts in the amount (nominal value) of $45,800,000 and $61,400,000 as at August 31, 2018 and 2019 respectively for which the currency risk is charged to other comprehensive income.
F-24F-28
EXFO Inc.
Notes to Consolidated Financial Statements
(tabular amounts in thousands of US dollars, except share and per share data and as otherwise noted)
The following table summarizes significant derivative and non-derivative financial assets and liabilities that are subject to currency risk as at August 31, 2016 and 2017 and for which such risk is charged to earnings:
| | | As at August 31, | |
| | | 2017 | | | 2016 | |
| | | | | | | | | | | | | |
| | | Carrying/nominal amount (in thousands of US dollars) | | | Carrying/nominal amount (in thousands of euros) | | | Carrying/nominal amount (in thousands of US dollars) | | | Carrying/nominal amount (in thousands of euros) | |
| | | | | | | | | | | | | |
| Financial assets | | | | | | | | | | | | |
| Cash | | $ | 20,120 | | | € | 6,235 | | | $ | 13,090 | | | € | 2,927 | |
| Accounts receivable | | | 28,420 | | | | 6,164 | | | | 30,141 | | | | 5,963 | |
| | | | 48,540 | | | | 12,399 | | | | 43,231 | | | | 8,890 | |
| Financial liabilities | | | | | | | | | | | | | | | | |
| Accounts payable and accrued liabilities | | | 12,447 | | | | 2,725 | | | | 14,251 | | | | 1,081 | |
| Forward exchange contracts (nominal value) | | | 3,600 | | | ‒ | | | | 4,000 | | | | – | |
| | | | 16,047 | | | | 2,725 | | | | 18,251 | | | | 1,081 | |
| Net exposure | | $ | 32,493 | | | € | 9,674 | | | $ | 24,980 | | | € | 7,809 | |
In addition to these assets and liabilities, the company has derivative financial liabilities for its outstanding forward exchange contracts in the amount (nominal value) of $33,800,000 and $29,200,000 as at August 31, 2016 and 2017 respectively for which the currency risk is charged to other comprehensive income.
The value of the Canadian dollar compared to the US dollar was CA$1.31161.3055 = US$1.00 and CA$1.25361.3294 = US$1.00 as at August 31, 20162018 and 20172019 respectively.
The value of the Canadian dollar compared to the euro was CA$1.46011.5210 = €1.00 and CA$1.48251.4672 = €1.00 as at August 31, 20162018 and 20172019 respectively.
The following sensitivity analysis summarizes the effect that a change in the value of the Canadian dollar (compared to the US dollar and euro) on derivative and non-derivative financial assets and financial liabilities denominated in US dollars and euros would have on net earnings, net earnings per diluted share and comprehensive income, based on the foreign exchange rates as at August 31, 20162018 and 2017:2019:
· | An increase (decrease) of 10% in the period-end value of the Canadian dollar compared to the US dollar would decrease (increase) net earnings by $2,342,000, or $0.04 per diluted share, and $2,726,000, or $0.05 per diluted share, as at August 31, 2016 and 2017 respectively. |
An increase (decrease) of 10% in the period-end value of the Canadian dollar compared to the US dollar would decrease (increase) net earnings by $844,000, or $0.02 per diluted share, and $1,166,000, or $0.02 per diluted share, as at August 31, 2018 and 2019 respectively.
· | An increase (decrease) of 10% in the period-end value of the Canadian dollar compared to the euro would decrease (increase) net earnings by $830,000, or $0.02 per diluted share, and $1,025,000 or $0.02 per diluted share, as at August 31, 2016 and 2017 respectively. |
An increase (decrease) of 10% in the period-end value of the Canadian dollar compared to the euro would decrease (increase) net earnings by $335,000, or $0.01 per diluted share, and $769,000 or $0.01 per diluted share, as at August 31, 2018 and 2019 respectively.
· | An increase (decrease) of 10% in the period-end value of the Canadian dollar compared to the US dollar would increase (decrease) other comprehensive income by $2,176,000 and $2,744,000 as at August 31, 2016 and 2017An increase (decrease) of 10% in the period-end value of the Canadian dollar compared to the US dollar would increase (decrease) other comprehensive income by $2,956,000 and $4,072,000 as at August 31, 2018 and 2019 respectively. |
EXFO Inc.
Notes to Consolidated Financial Statements
(tabular amounts in thousands of US dollars, except share and per share data and as otherwise noted)
The impact of the change in the value of the Canadian dollar compared to the US dollar and the euro on these derivative and non-derivative financial assets and financial liabilities is recorded in the foreign exchange gain or loss line item in the consolidated statements of earnings, except for outstanding forward contracts, and except for those of foreign operations, whose impact is recorded in other comprehensive income. The change in the value of the Canadian dollar compared to the US dollar and the euro also affects the company'scompany’s balances of income tax recoverable or payable, as well as deferred income tax assets and liabilities denominated in US dollars and euros; this may result in additional and significant foreign exchange gains or losses. However, these tax-related assets and liabilities are not considered financial instruments and are therefore excluded from the sensitivity analysis above. The foreign exchange rate fluctuations also flow through the consolidated statements of earnings line items, as a significant portion of the company'scompany’s cost of sales and operating expenses are denominated in Canadian dollars, euros, British pounds and Indian rupees, and the company reports its results in US dollars; that effect is not reflected in the sensitivity analysis above.
Interest rate risk
The company has limited exposure to interest rate risk. The company is mainly exposed to interest rate risks through its cash, short-term investments, bank loan and short-term investments.long-term debt.
CashThe company analyzes its interest risk exposure on an ongoing basis. A change in interest rate of 1% would have an insignificant impact on net earnings and comprehensive income.
As at August 31, 2016
EXFO Inc.
Notes to Consolidated Financial Statements
(tabular amounts in thousands of US dollars, except share and 2017, the company's cash balances included an amount of $23,277,000per share data and $6,681,000 respectively that bears interest at an annual rate of 1.2%.as otherwise noted)
Short-term investments
Short-term investments consist of the following:
| | | As at August 31, | |
| | | 2019 | | | 2018 | |
| | | | | | | |
| Term deposits denominated in Indian rupees, bearing interest at annual rates of 5.0% to 6.8% in 2018 and 5.1% to 7.0% in 2019, maturing on different dates between October 2018 and August 2019 in 2018 and September 2019 and May 2020 in 2019 | | $ | 2,548 | | | $ | 1,909 | |
| Other | | | 370 | | | | 373 | |
| | | $ | 2,918 | | | $ | 2,282 | |
| | | As at August 31, | |
| | | 2017 | | | 2016 | |
| | | | | | | |
| Term deposits denominated in Indian rupees, bearing interest at annual rates of 4.3% to 6.9% in 2017 and 6.0% to 7.3% in 2016, maturing on different dates between October 2017 and October 2018 in 2017 and November 2016 and October 2018 in 2016 | | $ | 775 | | | $ | 1,419 | |
| Term deposit denominated in Canadian dollars, bearing interest at an annual rate of 1.5%, matured in May 2017 | | ‒ | | | | 2,668 | |
| | | $ | 775 | | | $ | 4,087 | |
Due to their short-term maturity, the company'scompany’s short-term investments are not subject to a significant fair value interest rate risk. Accordingly, changes in fair value have been nominal to the degree that amortized cost approximates the fair value. Any change in the fair value of the company'scompany’s short-term investments, all of which are classified as available for sale,financial assets at fair value through other comprehensive income, is recorded in otherthe consolidated statements of comprehensive income.
Other financial instruments
Short-term other liabilities bear interest at EURIBOR, plus a margin. Accounts receivable other assets,and accounts payable and accrued liabilities and the contingent liability are non-interest-bearing financial assets and financial liabilities.
EXFO Inc.
Notes to Consolidated Financial Statements
(tabular amounts in thousands of US dollars, except share and per share data and as otherwise noted)
Credit risk
Financial instruments that potentially subject the company to credit risk consist of cash, short-term investments, accounts receivable, other assets and forward exchange contracts (with a positive fair value). As at August 31, 2017,2019, the company'scompany’s short-term investments consist of debt instruments issued by high-credit qualityhigh-credit-quality corporations. These debt instruments are not expected to be affected by a significant credit risk. The company'scompany’s cash and forward exchange contracts are held with or issued by high-credit qualityhigh-credit-quality financial institutions; therefore, the company considers the risk of non-performance on these instruments to be limited.
Generally,The company applies the IFRS 9 simplified approach to measuring expected credit losses which uses a lifetime expected loss allowance for all trade accounts receivable and contract assets. To measure the expected credit losses, trade accounts receivable and contract assets have been grouped based on shared credit risk characteristics and the days past due. The contract assets relate to unbilled work in progress and have substantially the same risk characteristics as the trade accounts receivable for the same type of contracts. The company does not require collateral or other security from customershas therefore concluded that the expected loss rates for trade accounts receivable; however, credit is extendedreceivable are a reasonable approximation of the loss rates for the contract assets. The expected loss rates are based on the payment profiles of sales over a period of 60 months. The historical loss rates are adjusted to reflect current and forward-looking information on economic factors affecting the ability of the customers following an evaluation of creditworthiness. In addition,to settle the company performs ongoing credit reviews of all its customers and establishes an allowance for doubtful accounts receivable when accounts are determined to be uncollectible. Allowance for doubtful accounts amounted to $3,752,000 and $2,960,000 as atreceivable.
For the years ended August 31, 20162018 and 2017 respectively.
2019, no customer represented more than 10% of sales. For the year ended August 31, 2017, the company'scompany’s top customer represented 10.1% of sales. For the years ended August 31, 2015 and 2016, no customer represented more than 10% of sales.
The following table summarizes the age of trade accounts receivable:
| | | As at August 31, | |
| | | 2017 | | | 2016 | |
| | | | | | | |
| Current | | $ | 35,100 | | | $ | 38,411 | |
| Past due, 0 to 30 days | | | 3,049 | | | | 1,286 | |
| Past due, 31 to 60 days | | | 1,289 | | | | 868 | |
| Past due, more than 60 days, net of allowance for doubtful accounts of $3,752 and $2,960 as at August 31, 2016 and 2017, respectively | | | 1,692 | | | | 2,428 | |
| | | $ | 41,130 | | | $ | 42,993 | |
Changes in the allowance for doubtful accounts are as follows:
| | | Years ended August 31, | |
| | | 2017 | | | 2016 | |
| | | | | | | |
| Balance – Beginning of year | | $ | 3,752 | | | $ | 2,935 | |
| Addition charged to earnings | | | 654 | | | | 817 | |
| Writeoff of uncollectible accounts | | | (1,446 | ) | | ‒ | |
| Balance – End of year | | $ | 2,960 | | | $ | 3,752 | |
Liquidity risk
Liquidity risk is defined as the potential that the company cannot meet its obligations as they become due.
F-27F-30
EXFO Inc.
Notes to Consolidated Financial Statements
(tabular amounts in thousands of US dollars, except share and per share data and as otherwise noted)
The following table summarizes the age of trade accounts receivable:
| | | As at August 31, | |
| | | 2019 | | | 2018 | |
| | | | | | | |
| Current | | $ | 39,054 | | | $ | 34,344 | |
| Past due, 0 to 30 days | | | 3,529 | | | | 6,011 | |
| Past due, 31 to 60 days | | | 2,006 | | | | 2,556 | |
| Past due, more than 60 days | | | 6,928 | | | | 4,362 | |
| | | $ | 51,517 | | | $ | 47,273 | |
Changes in the allowance for doubtful accounts are as follows:
| | | Years ended August 31, | |
| | | 2019 | | | 2018 | |
| | | | | | | |
| Balance – Beginning of year | | $ | 772 | | | $ | 2,960 | |
| IFRS 9 adoption initial adjustment (note 2) | | | 303 | | | | – | |
| Addition charged to earnings | | | 864 | | | | 834 | |
| Writeoff of uncollectible accounts and reversal | | | (404 | ) | | | (3,022 | ) |
| Balance – End of year | | $ | 1,535 | | | $ | 772 | |
Liquidity risk
Liquidity risk is defined as the potential that the company cannot meet its obligations as they become due.
The following tables summarize the contractual maturity of the company'scompany’s derivative and non-derivative financial liabilities:
| | | As at August 31, 2017 | |
| | | 0-12
months | | | 13-24
months | |
| | | | | | | |
| Accounts payable and accrued liabilities | | $ | 36,776 | | | $ | ‒ | |
| Contingent liability | | | 1,092 | | | | ‒ | |
| Forward exchange contracts | | | | | | | | |
| Outflow | | | 21,700 | | | | 12,500 | |
| Inflow | | | (23,265 | ) | | | (13,357 | ) |
| Total | | $ | 36,303 | | | $ | (857 | ) |
| | | As at August 31, 2016 | |
| | | 0-12
months | | | 13-24
months | | | 25-36
months | |
| | | | | | | | | | |
| Accounts payable and accrued liabilities | | $ | 36,099 | | | $ | ‒ | | | $ | ‒ | |
| Forward exchange contracts | | | | | | | | | | | | |
| Outflow | | | 26,000 | | | | 9,900 | | | | 1,900 | |
| Inflow | | | (25,653 | ) | | | (10,089 | ) | | | (1,976 | ) |
| Total | | $ | 36,446 | | | $ | (189 | ) | | $ | (76 | ) |
As at August 31, 2017, the company had $39,210,000 in cash and short-term investments and $45,037,000 in accounts receivable. In addition to these financial assets, the company has unused available lines of credit totaling $15,424,000 for working capital and other general corporate purposes, including potential acquisitions as well as unused lines of credit totaling $25,676,000 for foreign currency exposure related to its forward exchange contracts (notes 10 and 22).
| | | As at August 31, 2019 | |
| | | No later
than
one year | | | Later than
1 year and
no later than
5 years | | | Later than
5 years | |
| | | | | | | | | | |
| Bank loan | | $ | 5,000 | | | $ | – | | | $ | – | |
| Accounts payable and accrued liabilities | | | 49,945 | | | | – | | | | – | |
| Forward exchange contracts | | | | | | | | | | | | |
| Outflow | | | 39,000 | | | | 25,900 | | | | – | |
| Inflow | | | (38,252 | ) | | | (25,585 | ) | | | – | |
| Long-term debt | | | 2,449 | | | | 3,237 | | | | 56 | |
| Other liabilities | | | 1,606 | | | | – | | | | – | |
| Total | | $ | 59,748 | | | $ | 3,552 | | | $ | 56 | |
| | | As at August 31, | |
| | | 2017 | | | 2016 | |
| | | | | | | |
| Raw materials | | $ | 18,899 | | | $ | 18,692 | |
| Work in progress | | | 886 | | | | 1,067 | |
| Finished goods | | | 14,047 | | | | 13,245 | |
| | | $ | 33,832 | | | $ | 33,004 | |
The cost of sales comprised almost exclusively the amount of inventory recognized as an expense during the reporting years, and amounts to $88,098,000, $89,058,000 and $98,503,000 for the years ended August 31, 2015, 2016 and 2017 respectively, including related depreciation and amortization, which are shown separately in operating expenses (note 17).
Inventory writedown amounted to $4,066,000, $3,678,000 and $3,259,000 for the years ended August 31, 2015, 2016 and 2017 respectively.
F-28F-31
EXFO Inc.
Notes to Consolidated Financial Statements
(tabular amounts in thousands of US dollars, except share and per share data and as otherwise noted)
8 | Property, Plant and Equipment |
| | | Land and land
improvements | | | Buildings | | | Equipment | | | Leasehold
improvements | | | Total | |
| | | | | | | | | | | | | | | | |
| Cost as at September 1, 2015 | | $ | 4,309 | | | $ | 29,472 | | | $ | 31,209 | | | $ | 2,794 | | | $ | 67,784 | |
| Additions | | ‒ | | | | 201 | | | | 3,626 | | | | 226 | | | | 4,053 | |
| Disposals | | ‒ | | | | (11 | ) | | | (4,280 | ) | | | (121 | ) | | | (4,412 | ) |
| Foreign currency translation adjustment | | | 13 | | | | 93 | | | | 162 | | | | 19 | | | | 287 | |
| Cost as at August 31, 2016 | | | 4,322 | | | | 29,755 | | | | 30,717 | | | | 2,918 | | | | 67,712 | |
| Additions | | ‒ | | | | 794 | | | | 5,562 | | | | 319 | | | | 6,675 | |
| Business combinations (note 3) | | ‒ | | | ‒ | | | | 130 | | | ‒ | | | | 130 | |
| Disposals | | ‒ | | | ‒ | | | | (2,568 | ) | | | (339 | ) | | | (2,907 | ) |
| Foreign currency translation adjustment | | | 200 | | | | 1,402 | | | | 1,733 | | | | 150 | | | | 3,485 | |
| Cost as at August 31, 2017 | | $ | 4,522 | | | $ | 31,951 | | | $ | 35,574 | | | $ | 3,048 | | | $ | 75,095 | |
| | | | | | | | | | | | | | | | | | | | | |
| Accumulated depreciation as at September 1, 2015 | | $ | 1,142 | | | $ | 5,943 | | | $ | 24,213 | | | $ | 791 | | | $ | 32,089 | |
| Depreciation for the year | | | 45 | | | | 639 | | | | 2,811 | | | | 319 | | | | 3,814 | |
| Disposals | | ‒ | | | | (11 | ) | | | (4,258 | ) | | | (121 | ) | | | (4,390 | ) |
| Foreign currency translation adjustment | | | 5 | | | | 31 | | | | 136 | | | | 49 | | | | 221 | |
| Accumulated depreciation as at August 31, 2016 | | | 1,192 | | | | 6,602 | | | | 22,902 | | | | 1,038 | | | | 31,734 | |
| Depreciation for the year | | | 45 | | | | 403 | | | | 3,162 | | | | 292 | | | | 3,902 | |
| Disposals | | ‒ | | | ‒ | | | | (2,210 | ) | | | (339 | ) | | | (2,549 | ) |
| Foreign currency translation adjustment | | | 58 | | | | 328 | | | | 1,353 | | | | 137 | | | | 1,876 | |
| Accumulated depreciation as at August 31, 2017 | | $ | 1,295 | | | $ | 7,333 | | | $ | 25,207 | | | $ | 1,128 | | | $ | 34,963 | |
| | | | | | | | | | | | | | | | | | | | | |
| Net carrying value as at: | | | | | | | | | | | | | | | | | | | | |
| August 31, 2016 | | $ | 3,130 | | | $ | 23,153 | | | $ | 7,815 | | | $ | 1,880 | | | $ | 35,978 | |
| August 31, 2017 | | $ | 3,227 | | | $ | 24,618 | | | $ | 10,367 | | | $ | 1,920 | | | $ | 40,132 | |
| | | As at August 31, 2018 | |
| | | No later
than
one year | | | Later than
1 year and
no later than
5 years | | | Later than
5 years | |
| | | | | | | | | | |
| Bank loan | | $ | 10,692 | | | $ | – | | | $ | – | |
| Accounts payable and accrued liabilities | | | 47,308 | | | | – | | | | – | |
| Forward exchange contracts | | | | | | | | | | | | |
| Outflow | | | 31,000 | | | | 19,400 | | | | – | |
| Inflow | | | (30,738 | ) | | | (18,940 | ) | | | – | |
| Long-term debt | | | 2,921 | | | | 5,745 | | | | 162 | |
| Other liabilities | | | 3,197 | | | | – | | | | – | |
| Total | | $ | 64,380 | | | $ | 6,205 | | | $ | 162 | |
As at August 31, 20162019, the company had $19,436,000 in cash and short-term investments and $54,913,000 in accounts receivable. In addition to these financial assets, the company has unused available lines of credit totaling $56,496,000 for working capital and general corporate purposes, including potential acquisitions as well as unused lines of credit totaling $21,948,000 for foreign currency exposure related to its forward exchange contracts (note 10).
| | | As at August 31, | |
| | | 2019 | | | 2018 | |
| | | | | | | |
| Raw materials | | $ | 24,115 | | | $ | 24,561 | |
| Work in progress | | | 1,009 | | | | 869 | |
| Finished goods | | | 12,893 | | | | 13,159 | |
| | | $ | 38,017 | | | $ | 38,589 | |
The cost of sales comprised almost exclusively the amount of inventory recognized as an expense during the reporting years, and amounts to $98,503,000, $116,923,000 and $127,725,000 for the years ended August 31, 2017, unpaid additions to property, plant2018 and equipment2019 respectively, including related depreciation and amortization, which are shown separately in operating expenses (note 18).
Inventory writedown amounted to $499,000$3,259,000, $2,541,000 and $522,000$3,270,000 for the years ended August 31, 2017, 2018 and 2019 respectively.
EXFO Inc.
Notes to Consolidated Financial Statements
(tabular amounts in thousands of US dollars, except share and per share data and as otherwise noted)
| 8 | Property, Plant and Equipment |
| | | Land and land
improvements | | | Buildings | | | Equipment | | | Leasehold
improvements | | | Total | |
| | | | | | | | | | | | | | | | |
| Cost as at September 1, 2017 | | $ | 4,522 | | | $ | 31,951 | | | $ | 35,574 | | | $ | 3,048 | | | $ | 75,095 | |
| Additions | | | 17 | | | | 3,048 | | | | 5,677 | | | | 46 | | | | 8,788 | |
| Business combinations (note 3) | | | – | | | | – | | | | 3,105 | | | | 263 | | | | 3,368 | |
| Disposals | | | – | | | | (1,413 | ) | | | (3,651 | ) | | | (175 | ) | | | (5,239 | ) |
| Foreign currency translation adjustment | | | (180 | ) | | | (1,240 | ) | | | (1,617 | ) | | | (134 | ) | | | (3,171 | ) |
| Cost as at August 31, 2018 | | | 4,359 | | | | 32,346 | | | | 39,088 | | | | 3,048 | | | | 78,841 | |
| Additions | | | – | | | | 1,116 | | | | 3,700 | | | | 164 | | | | 4,980 | |
| Disposals | | | (192 | ) | | | (3,378 | ) | | | (4,623 | ) | | | (164 | ) | | | (8,357 | ) |
| Foreign currency translation adjustment | | | (76 | ) | | | (592 | ) | | | (1,329 | ) | | | (153 | ) | | | (2,150 | ) |
| Cost as at August 31, 2019 | | $ | 4,091 | | | $ | 29,492 | | | $ | 36,836 | | | $ | 2,895 | | | $ | 73,314 | |
| | | | | | | | | | | | | | | | | | | | | |
| Accumulated depreciation as at September 1, 2017 | | $ | 1,295 | | | $ | 7,333 | | | $ | 25,207 | | | $ | 1,128 | | | $ | 34,963 | |
| Depreciation for the year | | | 48 | | | | 604 | | | | 4,420 | | | | 372 | | | | 5,444 | |
| Disposals | | | – | | | | (994 | ) | | | (3,440 | ) | | | (30 | ) | | | (4,464 | ) |
| Foreign currency translation adjustment | | | (53 | ) | | | (282 | ) | | | (1,024 | ) | | | (53 | ) | | | (1,412 | ) |
| Accumulated depreciation as at August 31, 2018 | | | 1,290 | | | | 6,661 | | | | 25,163 | | | | 1,417 | | | | 34,531 | |
| Depreciation for the year | | | 47 | | | | 667 | | | | 4,391 | | | | 364 | | | | 5,469 | |
| Disposals | | | – | | | | (1,452 | ) | | | (3,673 | ) | | | (114 | ) | | | (5,239 | ) |
| Foreign currency translation adjustment | | | (53 | ) | | | (120 | ) | | | (602 | ) | | | (36 | ) | | | (811 | ) |
| Accumulated depreciation as at August 31, 2019 | | $ | 1,284 | | | $ | 5,756 | | | $ | 25,279 | | | $ | 1,631 | | | $ | 33,950 | |
| | | | | | | | | | | | | | | | | | | | | |
| Net carrying value as at: | | | | | | | | | | | | | | | | | | | | |
| August 31, 2018 | | $ | 3,069 | | | $ | 25,685 | | | $ | 13,925 | | | $ | 1,631 | | | $ | 44,310 | |
| August 31, 2019 | | $ | 2,807 | | | $ | 23,736 | | | $ | 11,557 | | | $ | 1,264 | | | $ | 39,364 | |
As at August 31, 2018 and 2019, unpaid additions to property, plant and equipment amounted to $1,788,000 and $894,000 respectively.
EXFO Inc.
Notes to Consolidated Financial Statements
(tabular amounts in thousands of US dollars, except share and per share data and as otherwise noted)
| 9 | Intangible Assets and Goodwill |
Intangible assets
| | | Core
technology | | | Customer
relationships | | | Brand name | | | Software | | | Total | |
| | | | | | | | | | | | | | | | |
| Cost as at September 1, 2015 | | $ | 10,521 | | | $ | 4,935 | | | $ | 492 | | | $ | 10,728 | | | $ | 26,676 | |
| Additions | | | 147 | | | ‒ | | | ‒ | | | | 313 | | | | 460 | |
| Disposals | | | (6,414 | ) | | | (4,935 | ) | | | (492 | ) | | | (310 | ) | | | (12,151 | ) |
| Foreign currency translation adjustment | | | 48 | | | ‒ | | | ‒ | | | | 112 | | | | 160 | |
| Cost as at August 31, 2016 | | | 4,302 | | | ‒ | | | ‒ | | | | 10,843 | | | | 15,145 | |
| Additions | | ‒ | | | ‒ | | | ‒ | | | | 912 | | | | 912 | |
| Business combinations (note 3) | | | 7,932 | | | | 1,607 | | | ‒ | | | ‒ | | | | 9,539 | |
| Disposals | | | (76 | ) | | ‒ | | | ‒ | | | | (407 | ) | | | (483 | ) |
| Foreign currency translation adjustment | | | 735 | | | | 82 | | | ‒ | | | | 553 | | | | 1,370 | |
| Cost as at August 31, 2017 | | $ | 12,893 | | | $ | 1,689 | | | $ | ‒ | | | $ | 11,901 | | | $ | 26,483 | |
| | | | | | | | | | | | | | | | | | | | | |
| Accumulated amortization as at September 1, 2015 | | $ | 7,912 | | | $ | 4,935 | | | $ | 492 | | | $ | 9,241 | | | $ | 22,580 | |
| Amortization for the year | | | 700 | | | ‒ | | | ‒ | | | | 472 | | | | 1,172 | |
| Disposals | | | (6,414 | ) | | | (4,935 | ) | | | (492 | ) | | | (297 | ) | | | (12,138 | ) |
| Foreign currency translation adjustment | | | 109 | | | ‒ | | | ‒ | | | | 31 | | | | 140 | |
| Accumulated amortization as at August 31, 2016 | | | 2,307 | | | ‒ | | | ‒ | | | | 9,447 | | | | 11,754 | |
| Amortization for the year | | | 2,617 | | | | 167 | | | ‒ | | | | 505 | | | | 3,289 | |
| Disposals | | | (54 | ) | | ‒ | | | ‒ | | | | (398 | ) | | | (452 | ) |
| Foreign currency translation adjustment | | | 260 | | | | 2 | | | ‒ | | | | 447 | | | | 709 | |
| Accumulated amortization as at August 31, 2017 | | $ | 5,130 | | | $ | 169 | | | $ | ‒ | | | $ | 10,001 | | | $ | 15,300 | |
| | | | | | | | | | | | | | | | | | | | | |
| Net carrying value as at: | | | | | | | | | | | | | | | | | | | | |
| August 31, 2016 | | $ | 1,995 | | | $ | ‒ | | | $ | ‒ | | | $ | 1,396 | | | $ | 3,391 | |
| August 31, 2017 | | $ | 7,763 | | | $ | 1,520 | | | $ | ‒ | | | $ | 1,900 | | | $ | 11,183 | |
| | | | | | | | | | | | | | | | | | | | | |
| Remaining amortization period as at August 31, 2017 | | 4 years | | | 5 years | | | ‒ | | | 5 years | | | | | |
| | | Core
technology | | | Customer
relationships | | | In-process
research and
development | | | Brand
name | | | Software | | | Total | |
| | | | | | | | | | | | | | | | | | | |
| Cost as at September 1, 2017 | | $ | 12,893 | | | $ | 1,689 | | | $ | – | | | $ | – | | | $ | 11,901 | | | $ | 26,483 | |
| Additions | | | 89 | | | | – | | | | – | | | | – | | | | 3,049 | | | | 3,138 | |
| Business combinations (note 3) | | | 16,555 | | | | 9,192 | | | | 305 | | | | 846 | | | | 630 | | | | 27,528 | |
| Disposal | | | (60 | ) | | | – | | | | – | | | | – | | | | (2,474 | ) | | | (2,534 | ) |
| Foreign currency translation adjustment | | | (1,419 | ) | | | (590 | ) | | | (13 | ) | | | (50 | ) | | | (446 | ) | | | (2,518 | ) |
| Cost as at August 31, 2018 | | | 28,058 | | | | 10,291 | | | | 292 | | | | 796 | | | | 12,660 | | | | 52,097 | |
| Additions | | | 363 | | | | – | | | | – | | | | – | | | | 1,719 | | | | 2,082 | |
| Disposal | | | (27 | ) | | | – | | | | (293 | ) | | | – | | | | (222 | ) | | | (542 | ) |
| Foreign currency translation adjustment | | | (1,955 | ) | | | (618 | ) | | | 1 | | | | (46 | ) | | | (240 | ) | | | (2,858 | ) |
| Cost as at August 31, 2019 | | $ | 26,439 | | | $ | 9,673 | | | $ | – | | | $ | 750 | | | $ | 13,917 | | | $ | 50,779 | |
| | | | | | | | | | | | | | | | | | | | | | | | | |
| Accumulated amortization as at September 1, 2017 | | $ | 5,130 | | | $ | 169 | | | $ | – | | | $ | – | | | $ | 10,001 | | | $ | 15,300 | |
| Amortization for the year | | | 4,878 | | | | 3,949 | | | | – | | | | 519 | | | | 981 | | | | 10,327 | |
| Disposal | | | (45 | ) | | | – | | | | – | | | | – | | | | (2,462 | ) | | | (2,507 | ) |
| Foreign currency translation adjustment | | | (353 | ) | | | (185 | ) | | | – | | | | (7 | ) | | | (344 | ) | | | (889 | ) |
| Accumulated amortization as at August 31, 2018 | | | 9,610 | | | | 3,933 | | | | – | | | | 512 | | | | 8,176 | | | | 22,231 | |
| Amortization for the year | | | 4,926 | | | | 2,372 | | | | – | | | | 284 | | | | 1,430 | | | | 9,012 | |
| Disposal | | | (19 | ) | | | – | | | | – | | | | – | | | | (219 | ) | | | (238 | ) |
| Foreign currency translation adjustment | | | (1,080 | ) | | | (424 | ) | | | – | | | | (46 | ) | | | (330 | ) | | | (1,880 | ) |
| Accumulated amortization as at August 31, 2019 | | $ | 13,437 | | | $ | 5,881 | | | $ | – | | | $ | 750 | | | $ | 9,057 | | | $ | 29,125 | |
| | | | | | | | | | | | | | | | | | | | | | | | | |
| Net carrying value as at: | | | | | | | | | | | | | | | | | | | | | | | | |
| August 31, 2018 | | $ | 18,448 | | | $ | 6,358 | | | $ | 292 | | | $ | 284 | | | $ | 4,484 | | | $ | 29,866 | |
| August 31, 2019 | | $ | 13,002 | | | $ | 3,792 | | | $ | – | | | $ | – | | | $ | 4,860 | | | $ | 21,654 | |
| | | | | | | | | | | | | | | | | | | | | | | | | |
| Remaining amortization period as at August 31, 2019 | | 4 years | | | 2 years | | | | – | | | | – | | | 3 years | | | | | |
Goodwill
| | | Years ended August 31, | |
| | | 2019 | | | 2018 | |
| | | | | | | |
| Balance – Beginning of year | | $ | 39,892 | | | $ | 35,077 | |
| Business combinations (note 3) | | | – | | | | 5,931 | |
| Foreign currency translation adjustment | | | (1,244 | ) | | | (1,116 | ) |
| Balance – End of year | | $ | 38,648 | | | $ | 39,892 | |
| | | Years ended August 31, | |
| | | 2017 | | | 2016 | |
| | | | | | | |
| Balance – Beginning of year | | $ | 21,928 | | | $ | 21,860 | |
| Business combinations (note 3) | | | 11,470 | | | ‒ | |
| Foreign currency translation adjustment | | | 1,679 | | | | 68 | |
| Balance – End of year | | $ | 35,077 | | | $ | 21,928 | |
F-34
EXFO Inc.
Notes to Consolidated Financial Statements
(tabular amounts in thousands of US dollars, except share and per share data and as otherwise noted)
In the fourth quarter of fiscal 20162018 and 2017,2019, the company performed its annual goodwill impairment test for all CGUs.
Goodwill has been allocated to the lowest level within the company at which it is monitored by management to make business decisions, which are the following CGUs:
| | | As at August 31, | |
| | | 2019 | | | 2018 | |
| | | | | | | |
| EXFO CGU | | $ | 12,949 | | | $ | 13,185 | |
| EXFO Optics CGU (note 3) | | | 3,376 | | | | 3,562 | |
| Service assurance, systems and services CGU | | | 22,323 | | | | – | |
| Brix CGU | | | – | | | | 13,327 | |
| Ontology CGU (note 3) | | | – | | | | 7,471 | |
| EXFO Solutions CGU (note 3) | | | – | | | | 2,347 | |
| Total | | $ | 38,648 | | | $ | 39,892 | |
F-30
Prior to fiscal 2019, the Brix, Ontology and EXFO Solutions CGUs have been identified as three separate CGUs for goodwill impairment testing as they represented the lowest level at which the goodwill was monitored for internal management purposes, and the smallest group of assets that generated cash inflows that were largely independent of the cash inflows from other CGUs.
August 2018, management implemented a restructuring plan to fast-track the integration of newly acquired EXFO Inc.
NotesSolutions’ and Ontology’s technologies with those of the company’s service assurance on a common monitoring and analytics platform to Consolidated Financial Statementsbetter position the company’s offering and reduce its costs (note 4).
(tabular amounts in thousandsConsequently, starting September 1, 2018, following the announcement of US dollars, except sharethis plan, all future operating and per share datainvesting decisions related to these three CGUs have been aligned with the restructuring plan and as otherwise noted)
related goodwill, previously allocated to each of these three CGUs, has been monitored for internal management purposes on a combined basis under the Service assurance, systems and services (SASS) CGU, which represented the smallest group of assets that would generate future cash inflows that would largely be independent of the cash inflows from the other CGUs.
| | | As at August 31, | |
| | | 2017 | | | 2016 | |
| | | | | | | |
| EXFO CGU | | $ | 13,772 | | | $ | 8,663 | |
| Brix CGU | | | 13,878 | | | | 13,265 | |
| Ontology CGU (note 3) | | | 7,427 | | | ‒ | |
| Total | | $ | 35,077 | | | $ | 21,928 | |
In performing the fiscal 2019 goodwill impairment review of its CGUs, the company determined the recoverable amount of goodwill based on fair value less costs of disposal. In estimating the recoverable amount of its CGUs, the company used a market approach, which is based on sales multiples within the range of 0.61.0 to 2.97.6 times sales for comparable businesses with similar operations within the same industry over the past year. The company applied judgment in making certain adjustments for factors such as size, risk profile or profitability of the comparable businesses, when compared to the company's CGU.
Furthermore, ascompany’s CGUs. In addition, for the sales and operations of the EXFOSASS CGU, constitutes the significant majority of the company's sales and operations, the company also comparedused a liquidation approach based on the carrying amountlevel of research and development expenses incurred over the EXFO CGU to the company's overall market capitalization, after adjustment for a control premium and the adjustment to deduct the recoverable amount of the Brix and Ontology CGUs. Based on this calculation, management calculated a recoverable amount which resulted in an implied sales multiple that was within the 0.6 to 2.9 times range, as used in the company's market approach described above.
As the valuation techniques used by the company require the use of unobservable inputs, the recoverable amount of the company's CGUs is classified within Level 3 of the fair value hierarchy.last two years.
As at August 31, 2017,2019, the recoverable amount for all CGUs exceeded their carrying value. The recoverable amount of EXFO CGU, Brix CGU and Ontology CGU would equal their carrying value if we assume sales multiples of 0.7, 0.6 and 2.2 times sales respectively.
The company has lines of credit that provide for advances of up to CA$5,800,000 (US$4,627,000) and up to US$6,000,000. The line of credit in Canadian dollars bears interest at the Canadian prime rate and the line of credit in US dollars bears interest at the US prime rate. As at August 31, 2017, an amount of CA$736,000 (US$587,000) was drawn from these lines of credit for letters of guarantee in the normal course of the company's operations for its own selling and purchasing requirements. The company also has a line of credit that provides for advances of up to CA$6,750,000 (US$5,384,000). This line of credit bears interest at the Canadian prime rate (note 22).
In addition, the company has lines of credit totaling $26,731,000 for the foreign currency risk exposure related to its US dollar – Canadian dollar forward exchange contracts (note 6). As at August 31, 2017, an amount of $1,955,000 was reserved from these lines of credit.
Finally, the company has a line of credit of INR 115,385,000 (US$1,800,000) for the foreign currency risk exposure related to its US dollar – Indian rupee forward exchange contracts (note 6). As at August 31, 2017, an amount of INR 57,692,000 (US$900,000) was reserved from this line of credit.
Accounts receivable were pledged as collateral against all these lines of credit, which are also subject to a negative pledge whereby the company has agreed with the banks not to pledge its assets to any other party without its consent.
F-31F-35
EXFO Inc.
Notes to Consolidated Financial Statements
(tabular amounts in thousands of US dollars, except share and per share data and as otherwise noted)
The company has revolving credit facilities of up to CA$70,000,000 (US$52,655,000) and US$9,000,000. These credit facilities are used to finance working capital and for other general corporate purposes. The Canadian dollar revolving credit facility bears interest at the Canadian prime rate or LIBOR, plus a margin, and the US dollar revolving credit facility bears interest at the US prime rate or LIBOR plus a margin. These revolving credit facilities are secured by a movable mortgage over the universality of the company’s Canadian movable assets, present and future, as well as over the universality of movable assets, present and future, of certain US and UK subsidiaries. The company is subject to covenants under this credit facility that were met as at August 31, 2019. As at August 31, 2019, an amount of $5,433,000 was drawn from these credit facilities for the bank loan of $5,000,000 and letters of guarantee of $433,000.
The company also has credit facilities of up to €500,000 (US$552,000) for which an amount of €251,000 (US$277,000) was drawn from these lines of credit for letters of guarantee. These credit facilities are unsecured and bear interest at EURIBOR, plus a margin.
In addition, the company has lines of credit totaling $26,179,000 for the foreign currency risk exposure related to its US dollar – Canadian dollar forward exchange contracts (note 6). As at August 31, 2019, an amount of $5,818,000 was reserved from these lines of credit.
Finally, the company has a line of credit of INR128,571,000 (US$1,800,000) for the foreign currency risk exposure related to its US dollar – Indian rupee forward exchange contracts (note 6). As at August 31, 2019, an amount of INR15,214,000 (US$213,000) was reserved from this line of credit.
| 11 | Accounts Payable and Accrued Liabilities and Provisions |
Accounts payable and accrued liabilities
| | | As at August 31, | | | As at August 31, | |
| | | 2017 | | | 2016 | | | 2019 | | | 2018 | |
| | | | | | | | | | | | | |
| Trade | | $ | 19,002 | | | $ | 16,940 | | | $ | 27,996 | | | $ | 26,052 | |
| Salaries and social benefits | | | 15,176 | | | | 16,188 | | | 19,716 | | | 18,101 | |
| Forward exchange contracts (note 6) | | ‒ | | | | 1,075 | | | 845 | | | 590 | |
| Other | | | 2,598 | | | | 2,971 | | | | 2,233 | | | | 3,155 | |
| | | $ | 36,776 | | | $ | 37,174 | | | $ | 50,790 | | | $ | 47,898 | |
Provisions
| | | As at August 31, | | | As at August 31, | |
| | | 2017 | | | 2016 | | | 2019 | | | 2018 | |
| | | | | | | | | | | | | |
| Warranty | | $ | 320 | | | $ | 299 | | | $ | 356 | | | $ | 417 | |
| Contingent liability (note 3) | | | 1,092 | | | ‒ | | |
| Restructuring charges (note 4) | | | 2,477 | | | ‒ | | | 1,133 | | | 3,167 | |
| Other | | | | 2,313 | | | | 1,717 | |
| | | $ | 3,889 | | | $ | 299 | | | $ | 3,802 | | | $ | 5,301 | |
The company entered into operating leases for certain of its premises and equipment, which expire at various dates through 2023. Minimum rentals payable under operating leases are as follows:
| | | As at August 31, | |
| | | 2017 | | | 2016 | |
| | | | | | | |
| No later than 1 year | | $ | 2,176 | | | $ | 2,213 | |
| Later than 1 year and no later than 5 years | | | 6,238 | | | | 3,050 | |
| Later than 5 years | | | 1,681 | | | | 1,037 | |
| | | $ | 10,095 | | | $ | 6,300 | |
For the years ended August 31, 2015, 2016 and 2017, rental expenses under operating leases amounted to $2,845,000, $2,728,000 and $2,945,000 respectively.
The company also entered into license agreements for certain intellectual property which expire at various dates through 2022:
| | | As at August 31, | |
| | | 2017 | | | 2016 | |
| | | | | | | |
| No later than 1 year | | $ | 1,264 | | | $ | 1,124 | |
| Later than 1 year and no later than 5 years | | | 1,450 | | | | 826 | |
| | | $ | 2,714 | | | $ | 1,950 | |
F-32F-36
EXFO Inc.
Notes to Consolidated Financial Statements
(tabular amounts in thousands of US dollars, except share and per share data and as otherwise noted)
As part of the acquisitions of EXFO Optics and EXFO Solutions, the company assumed long-term debt (note 3).
| | | As at August 31, | |
| | | 2019 | | | 2018 | |
| | | | | | | |
| Unsecured, non-interest-bearing loans, denominated in euros, repayable in quarterly instalments, maturing in March 2024 and March 2025 | | $ | 866 | | | $ | 883 | |
| Unsecured loans, denominated in euros, repayable in monthly, quarterly or bi‑annual instalments, bearing interest at annual rates of nil to 5.0%, maturing at different dates between December 2018 and September 2023 in 2018 and March 2020 and September 2023 in 2019 | | | 3,111 | | | | 4,853 | |
| Loans, secured by the universality of the assets of a subsidiary, denominated in euros, repayable in monthly instalments, bearing interest at annual rates of 0.7% to 2.0%, maturing at different dates between December 2018 and August 2022 in 2018 and April 2020 and August 2022 in 2019 | | | 459 | | | | 828 | |
| Loans, secured by the universality of the assets of a subsidiary, denominated in euros, repayable in monthly or quarterly instalments, bearing interest at annual rates of 1.1% to 2.9%, maturing at different dates between March 2020 and July 2022 | | | 1,306 | | | | 2,264 | |
| | | | | | | | | |
| | | | 5,742 | | | | 8,828 | |
| Current portion of long-term debt | | | 2,449 | | | | 2,921 | |
| | | $ | 3,293 | | | $ | 5,907 | |
The company is subject to certain covenants under its long-term debt that were met as at August 31, 2019.
Principal repayments of long-term debt over the forthcoming years are as follows as at August 31, 2019:
| No later than one year | | $ | 2,449 | |
| Later than one year and no later than five years | | | 3,237 | |
| Later than five years | | | 56 | |
| | | $ | 5,742 | |
The company entered into operating leases for certain of its premises and equipment, which expire at various dates through 2024. Minimum rentals payable under operating leases are as follows:
| | | As at August 31, | |
| | | 2019 | | | 2018 | |
| | | | | | | |
| No later than 1 year | | $ | 2,895 | | | $ | 3,365 | |
| Later than 1 year and no later than 5 years | | | 6,323 | | | | 9,519 | |
| Later than 5 years | | | 23 | | | | 502 | |
| | | $ | 9,241 | | | $ | 13,386 | |
EXFO Inc.
Notes to Consolidated Financial Statements
(tabular amounts in thousands of US dollars, except share and per share data and as otherwise noted)
For the years ended August 31, 2017, 2018 and 2019, rental expenses under operating leases amounted to $2,945,000, $3,884,000 and $4,026,000 respectively.
The company also entered into license agreements for certain intellectual property which expire at various dates through 2022:
| | | As at August 31, | |
| | | 2019 | | | 2018 | |
| | | | | | | |
| No later than 1 year | | $ | 2,289 | | | $ | 1,492 | |
| Later than 1 year and no later than 5 years | | | 2,444 | | | | 1,982 | |
| | | $ | 4,733 | | | $ | 3,474 | |
| Authorized – unlimited as to number, without par value |
| | Subordinate voting and participating, bearing a non-cumulative dividend to be determined by the Board of Directors, ranking pari passu with multiple voting shares |
| | Multiple voting and participating, entitling to 10 votes each, bearing a non-cumulative dividend to be determined by the Board of Directors, convertible at the holder'sholder’s option into subordinate voting shares on a one-for-one basis, ranking pari passu with subordinate voting shares |
The following table summarizes the share capital activity:
| | | Multiple Voting Shares | | | Subordinate Voting Shares | | | | |
| | | | | | | | | | | | | | | | |
| | | Number | | | Amount | | | Number | | | Amount | | | Total amount | |
| | | | | | | | | | | | | | | | |
| Balance as at September 1, 2014 | | | 31,643,000 | | | $ | 1 | | | | 28,703,750 | | | $ | 111,490 | | | $ | 111,491 | |
| | | | | | | | | | | | | | | | | | | | | |
| Redemption of restricted share units (note 15) | | ‒ | | | | – | | | | 229,559 | | | | – | | | | – | |
| Redemption of deferred share units (note 15) | | ‒ | | | | – | | | | 48,697 | | | | – | | | | – | |
| Redemption of share capital | | ‒ | | | | – | | | | (6,889,972 | ) | | | (26,827 | ) | | | (26,827 | ) |
| Reclassification of stock-based compensation costs to share capital upon exercise of stock awards | | | – | | | | – | | | | – | | | | 1,381 | | | | 1,381 | |
| | | | | | | | | | | | | | | | | | | | | |
| Balance as at August 31, 2015 | | | 31,643,000 | | | | 1 | | | | 22,092,034 | | | | 86,044 | | | | 86,045 | |
| | | | | | | | | | | | | | | | | | | | | |
| Redemption of restricted share units (note 15) | | | – | | | | – | | | | 277,805 | | | | – | | | | – | |
| Redemption of deferred share units (note 15) | | | – | | | | – | | | | 653 | | | | – | | | | – | |
| Redemption of share capital | | | – | | | | – | | | | (452,550 | ) | | | (1,768 | ) | | | (1,768 | ) |
| Reclassification of stock-based compensation costs to share capital upon exercise of stock awards | | | – | | | | – | | | | – | | | | 1,239 | | | | 1,239 | |
| | | | | | | | | | | | | | | | | | | | | |
| Balance as at August 31, 2016 | | | 31,643,000 | | | | 1 | | | | 21,917,942 | | | | 85,515 | | | | 85,516 | |
| | | | | | | | | | | | | | | | | | | | | |
| Issuance of share capital (note 3) | | | – | | | | – | | | | 793,070 | | | | 3,490 | | | | 3,490 | |
| Redemption of restricted share units (note 15) | | | – | | | | – | | | | 327,859 | | | | – | | | | – | |
| Redemption of deferred share units (note 15) | | | – | | | | – | | | | 29,906 | | | | – | | | | – | |
| Reclassification of stock-based compensation costs to share capital upon exercise of stock awards | | | – | | | | – | | | | – | | | | 1,405 | | | | 1,405 | |
| | | | | | | | | | | | | | | | | | | | | |
| Balance as at August 31, 2017 | | | 31,643,000 | | | $ | 1 | | | | 23,068,777 | | | $ | 90,410 | | | $ | 90,411 | |
F-33F-38
EXFO Inc.
Notes to Consolidated Financial Statements
(tabular amounts in thousands of US dollars, except share and per share data and as otherwise noted)
The following table summarizes the company’s share capital activity:
| | | Multiple Voting Shares | | | Subordinate Voting Shares | | | | |
| | | | | | | | | | | | | | | | |
| | | Number | | | Amount | | | Number | | | Amount | | | Total amount | |
| | | | | | | | | | | | | | | | |
| Balance as at September 1, 2016 | | | 31,643,000 | | | $ | 1 | | | | 21,917,942 | | | $ | 85,515 | | | $ | 85,516 | |
| | | | | | | | | | | | | | | | | | | | | |
| Issuance of share capital | | | – | | | | – | | | | 793,070 | | | | 3,490 | | | | 3,490 | |
| Redemption of restricted share units (note 16) | | | – | | | | – | | | | 327,859 | | | | – | | | | – | |
| Redemption of deferred share units (note 16) | | | – | | | | – | | | | 29,906 | | | | – | | | | – | |
| Reclassification of stock-based compensation costs to share capital upon exercise of stock awards | | | – | | | | – | | | | – | | | | 1,405 | | | | 1,405 | |
| Balance as at August 31, 2017 | | | 31,643,000 | | | | 1 | | | | 23,068,777 | | | | 90,410 | | | | 90,411 | |
| | | | | | | | | | | | | | | | | | | | | |
| Redemption of restricted share units (note 16) | | | – | | | | – | | | | 345,883 | | | | – | | | | – | |
| Redemption of deferred share units (note 16) | | | – | | | | – | | | | 58,335 | | | | – | | | | – | |
| Reclassification of stock-based compensation costs to share capital upon exercise of stock awards | | | – | | | | – | | | | – | | | | 1,526 | | | | 1,526 | |
| | | | | | | | | | | | | | | | | | | | | |
| Balance as at August 31, 2018 | | | 31,643,000 | | | | 1 | | | | 23,472,995 | | | | 91,936 | | | | 91,937 | |
| | | | | | | | | | | | | | | | | | | | | |
| Redemption of restricted share units (note 16) | | | – | | | | – | | | | 317,072 | | | | – | | | | – | |
| Redemption of share capital | | | – | | | | – | | | | (86,392 | ) | | | (337 | ) | | | (337 | ) |
| Reclassification of stock-based compensation costs to share capital upon exercise of stock awards | | | – | | | | – | | | | – | | | | 1,106 | | | | 1,106 | |
| | | | | | | | | | | | | | | | | | | | | |
| Balance as at August 31, 2019 | | | 31,643,000 | | | $ | 1 | | | | 23,703,675 | | | $ | 92,705 | | | $ | 92,706 | |
| a) | On January 7, 2015, the company announced that its Board of Directors had authorized a substantial issuer bid (the "Offer") to purchase for cancellation up to 7,142,857 subordinate voting shares for an aggregate purchase price not to exceed CA$30,000,000. On February 20, 2015, pursuant to the Offer, the company purchased for cancellation 6,521,739 subordinate voting shares for an aggregate purchase price of CA$30,000,000 (US$24,027,000), plus related fees of $223,000. The company used cash to fund the purchase of shares. |
b) | On March 25, 2015,8, 2019, the company announced that its Board of Directors had approved the renewal of itsa share repurchase program, by way of a normal course issuerissued bid on the open market of up to 10%6.3% of the issued and outstanding subordinate voting shares, representing 1,397,5981,200,000 subordinate voting shares at the prevailing market price. The normal course issuer bid started on March 27, 2015,January 14, 2019 and endedwill end on March 26, 2016.January 13, 2020 or earlier if the company repurchases the maximum number of shares permitted. All shares repurchased under the bid were cancelled. |
c) | On March 29, 2016, the company announced that its Board of Directors had approved the renewal of its share repurchase program, by way of a normal course issuer bid on the open market of up to 6.6% of the issued and outstanding subordinate voting shares, representing 900,000 subordinate voting shares at the prevailing market price. The normal course issuer bid started on April 1, 2016, and ended on March 31, 2017. All share repurchased under that bid werewill be cancelled. |
14 | Accumulated Other Comprehensive Loss |
Changes in accumulated other comprehensive loss are as follows:
| | | Foreign
currency
translation
adjustment | | | Cash-flow
hedge | | | Accumulated
other
comprehensive
loss | |
| | | | | | | | | | |
| Balance as at September 1, 2014 | | $ | (10,668 | ) | | $ | 409 | | | $ | (10,259 | ) |
| Foreign currency translation adjustment | | | (39,175 | ) | | | – | | | | (39,175 | ) |
| Changes in unrealized losses on forward exchange contracts, net of deferred income taxes | | | – | | | | (2,571 | ) | | | (2,571 | ) |
| | | | | | | | | | | | | |
| Balance as at August 31, 2015 | | | (49,843 | ) | | | (2,162 | ) | | | (52,005 | ) |
| Foreign currency translation adjustment | | | 707 | | | ‒ | | | | 707 | |
| Changes in unrealized gains/losses on forward exchange contracts, net of deferred income taxes | | ‒ | | | | 2,724 | | | | 2,724 | |
| | | | | | | | | | | | | |
| Balance as at August 31, 2016 | | | (49,136 | ) | | | 562 | | | | (48,574 | ) |
| Foreign currency translation adjustment | | | 8,262 | | | ‒ | | | | 8,262 | |
| Changes in unrealized gains/losses on forward exchange contracts, net of deferred income taxes | | ‒ | | | | 1,347 | | | | 1,347 | |
| | | | | | | | | | | | | |
| Balance as at August 31, 2017 | | $ | (40,874 | ) | | $ | 1,909 | | | $ | (38,965 | ) |
F-34F-39
EXFO Inc.
Notes to Consolidated Financial Statements
(tabular amounts in thousands of US dollars, except share and per share data and as otherwise noted)
| 15 | Accumulated Other Comprehensive Loss |
Changes in accumulated other comprehensive loss are as follows:
| | | Foreign
currency
translation
adjustment | | | Cash-flow
hedge | | | Accumulated
other
comprehensive
loss | |
| | | | | | | | | | |
| Balance as at September 1, 2016 | | $ | (49,136 | ) | | $ | 562 | | | $ | (48,574 | ) |
| Foreign currency translation adjustment | | | 8,262 | | | | – | | | | 8,262 | |
| Changes in unrealized gains/losses on forward exchange contracts, net of deferred income taxes | | | – | | | | 1,347 | | | | 1,347 | |
| | | | | | | | | | | | | |
| Balance as at August 31, 2017 | | | (40,874 | ) | | | 1,909 | | | | (38,965 | ) |
| Foreign currency translation adjustment | | | (6,491 | ) | | | – | | | | (6,491 | ) |
| Changes in unrealized gains/losses on forward exchange contracts, net of deferred income taxes | | | – | | | | (1,894 | ) | | | (1,894 | ) |
| | | | | | | | | | | | | |
| Balance as at August 31, 2018 | | | (47,365 | ) | | | 15 | | | | (47,350 | ) |
| Foreign currency translation adjustment | | | (4,177 | ) | | | – | | | | (4,177 | ) |
| Changes in unrealized gains/losses on forward exchange contracts, net of deferred income taxes | | | – | | | | 16 | | | | 16 | |
| | | | | | | | | | | | | |
| Balance as at August 31, 2019 | | $ | (51,542 | ) | | $ | 31 | | | $ | (51,511 | ) |
| 16 | Stock-Based Compensation Plans |
The following table summarizes the stock-based compensation costs recognized for employee services received during the years ended August 31, 2015, 20162017, 2018 and 2017:2019:
| | | Years ended August 31, | | | Years ended August 31, | |
| | | 2017 | | | 2016 | | | 2015 | | | 2019 | | | 2018 | | | 2017 | |
| | | | | | | | | | | | | | | | | | | |
Stock-based compensation costs arising from
equity-settled awards | | $ | 1,439 | | | $ | 1,394 | | | $ | 1,323 | | | $ | 1,849 | | | $ | 1,770 | | | $ | 1,439 | |
Stock-based compensation costs arising from
cash-settled awards | | | 38 | | | | (16 | ) | | | (28 | ) | | | (18 | ) | | | (22 | ) | | | 38 | |
| | | $ | 1,477 | | | $ | 1,378 | | | $ | 1,295 | | | $ | 1,831 | | | $ | 1,748 | | | $ | 1,477 | |
The maximum number of additional subordinate voting shares issuable under the Long-Term Incentive Plan and the Deferred Share Unit Plan cannot exceed 6,306,15311,792,893 shares. The maximum number of subordinate voting shares that may be granted to any individual on an annual basis cannot exceed 5% of the number of outstanding subordinate voting shares. The company settles equity-settled awards through the issuance of common shares from treasury.
EXFO Inc.
Notes to Consolidated Financial Statements
(tabular amounts in thousands of US dollars, except share and per share data and as otherwise noted)
Long-Term Incentive Plan
The company established the Long-Term Incentive Plan for its directors, executive officers and employees and those of its subsidiaries, as determined by the Board of Directors. TheUp to January 2019, the plan which includesincluded stock options and restricted share units,units. On January 2019, the plan was amended to include performance share units. The plan was approved by the shareholders of the company.
Stock Optionsoptions
The exercise price of stock options granted under the Long-Term Incentive Plan is the market price of the common shares on the date of grant. Stock options granted under the plan expire 10 years from the date of grant and generally vest over a four-year period, being the required period of service from employees, generally with 25% vesting on an annual basis commencing on the first anniversary of the date of grant. As at August 31, 2017,2018 and 2019, the company had no outstanding or exercisable stock options.
The following table summarizes stock option activity for the years ended August 31, 2015 and 2016 (no activities in 2017):
| | | Years ended August 31, | |
| | | 2016 | | | 2015 | |
| | | Number | | | Weighted
average
exercise
price | | | Number | | | Weighted
average
exercise
price | |
| | | | | | (CA$) | | | | | | (CA$) | |
| Outstanding – Beginning of year | | | 17,099 | | | $ | 6 | | | | 87,454 | | | $ | 6 | |
| Forfeited | | | – | | | | – | | | | (2,000 | ) | | | 6 | |
| Expired | | | (17,099 | ) | | | 6 | | | | (68,355 | ) | | | 6 | |
| Outstanding – End of year | | | – | | | $ | – | | | | 17,099 | | | $ | 6 | |
| Exercisable – End of year | | | – | | | $ | – | | | | 17,099 | | | $ | 6 | |
EXFO Inc.
Notes to Consolidated Financial Statements
(tabular amounts in thousands of US dollars, exceptRestricted share and per share data and as otherwise noted)
Restricted Share Unitsunits (RSUs)
RSUs are stock awards that rise and fall in value based on the market price of the company'scompany’s subordinate voting shares and are redeemable for actual subordinate voting shares. Vesting dates are also established by the Board of Directors on the date of grant. The vesting dates are subject to a minimum term of three years and a maximum term of 10 years from the award date, being the required period of service from employees. Fair value of RSUs equals the market price of the common shares on the date of grant.
The following table summarizes RSU activity for the years ended August 31, 2015, 20162017, 2018 and 2017:2019:
| | | Years ended August 31, | | | Years ended August 31, | |
| | | 2017 | | | 2016 | | | 2015 | | | 2019 | | | 2018 | | | 2017 | |
| | | | | | | | | | | | | | | | | | | |
| Outstanding – Beginning of year | | | 1,551,555 | | | | 1,299,958 | | | | 1,225,135 | | | 1,615,152 | | | 1,611,330 | | | 1,551,555 | |
| Granted | | | 527,143 | | | | 572,008 | | | | 409,521 | | | 632,931 | | | 420,621 | | | 527,143 | |
| Redeemed | | | (327,859 | ) | | | (277,805 | ) | | | (229,559 | ) | | (317,072 | ) | | (345,883 | ) | | (327,859 | ) |
| Forfeited | | | (139,509 | ) | | | (42,606 | ) | | | (105,139 | ) | | | (94,565 | ) | | | (70,916 | ) | | | (139,509 | ) |
| Outstanding – End of year | | | 1,611,330 | | | | 1,551,555 | | | | 1,299,958 | | | | 1,836,446 | | | | 1,615,152 | | | | 1,611,330 | |
None of the RSUs outstanding as at August 31, 20162018 and 20172019 were redeemable. The weighted average grant-date fair value of RSUs granted during the years ended August 31, 2015, 20162017, 2018 and 20172019 amounted to $3.63, $3.23$4.54, $4.22 and $4.54$3.30 respectively.
The weighted-average market price of the shares at the date of redemption of RSUs redeemed during the years ended August 31, 2015, 20162017, 2018 and 2017,2019, was $3.60, $3.03$4.55, $4.19 and $4.55$3.20 respectively.
Performance share units (PSUs)
PSUs are stock awards that rise and fall in value based on the market price of the company’s subordinate voting shares and are redeemable for actual subordinate voting shares. Vesting dates are also established by the Board of Directors on the date of grant. The vesting dates are subject to a minimum term of three years and a maximum term of 10 years from the award date, being the required period of service from employees. Fair value of PSUs equals the market price of the common shares on the date of grant. The ultimate number of PSUs to be granted is subject to the attainment of targets on the vesting date. As at August 31, 2019, the company had no outstanding PSUs.
EXFO Inc.
Notes to Consolidated Financial Statements
(tabular amounts in thousands of US dollars, except share and per share data and as otherwise noted)
Deferred Share Unit Plan
The company established a Deferred Share Unit (DSU) Plan for the members of the Board of Directors as part of their annual retainer fees. Each DSU entitles the Board members to receive one subordinate voting share. DSUs are acquired on the date of grant and are redeemed in subordinate voting shares when the Board member ceases to be Directora director of the company. This plan was approved by the shareholders of the company.
The following table summarizes DSU activity for the years ended August 31, 2015, 20162017, 2018 and 2017:2019:
| | | Years ended August 31, | | | Years ended August 31, | |
| | | 2017 | | | 2016 | | | 2015 | | | 2019 | | | 2018 | | | 2017 | |
| | | | | | | | | | | | | | | | | | | |
| Outstanding – Beginning of year | | | 159,127 | | | | 114,810 | | | | 117,701 | | | 181,689 | | | 174,279 | | | 159,127 | |
| Granted | | | 45,058 | | | | 44,970 | | | | 45,806 | | | 69,818 | | | 65,745 | | | 45,058 | |
| Redeemed | | | (29,906 | ) | | | (653 | ) | | | (48,697 | ) | | | – | | | | (58,335 | ) | | | (29,906 | ) |
| Outstanding – End of year | | | 174,279 | | | | 159,127 | | | | 114,810 | | | | 251,507 | | | | 181,689 | | | | 174,279 | |
As at August 31, 20162017, 2018 and 2017,2019, none of the DSUs outstanding were redeemable. The weighted average grant-date fair value of DSUs granted during the years ended August 31, 2015, 20162017, 2018 and 2017,2019 amounted to $3.38, $3.33$4.53, $4.10 and $4.53$3.64 respectively.
The weighted-average market price of the shares at the date of redemption of DSUs redeemed during the years ended August 31, 2015, 20162017 and 2017,2018 was $3.49, $3.04$5.02 and $5.02$4.29 respectively.
EXFO Inc.
Notes to Consolidated Financial Statements
(tabular amounts in thousands of US dollars, except share and per share data and as otherwise noted)
Stock Appreciation Rights Plan
The company established the Stock Appreciation Rights Plan for certain employees. Under that plan, eligible employees are entitled to receive a cash amount equivalent to the difference between the market price of the common shares on the date of exercise and the exercise price determined on the date of grant. Stock appreciation rights granted under the plan expire 10 years from the date of grant and generally vest over a four-year period, being the required period of service from employees. This plan was approved by the shareholders of the company.
The following table summarizes stock appreciation rights activity for the years ended August 31, 2015, 2016 and 2017:
| | | Years ended August 31, | |
| | | 2017 | | | 2016 | | | 2015 | |
| | | Number | | | Weighted
average
exercise
price | | | Number | | | Weighted
average
exercise
price | | | Number | | | Weighted
average
exercise
price | |
| Outstanding – Beginning of year | | | 33,500 | | | $ | 1 | | | | 42,324 | | | $ | 1 | | | | 39,874 | | | $ | 2 | |
| Granted | | | 7,900 | | | | – | | | | 7,800 | | | | – | | | | 6,150 | | | | – | |
| Exercised | | | (14,104 | ) | | | 2 | | | | (12,927 | ) | | | 5 | | | | (500 | ) | | | 6 | |
| Expired | | | – | | | | – | | | | (1,500 | ) | | | 7 | | | | (2,000 | ) | | | 5 | |
| Forfeited | | | – | | | | – | | | | (2,197 | ) | | | – | | | | (1,200 | ) | | | 6 | |
| Outstanding – End of year | | | 27,296 | | | $ | 1 | | | | 33,500 | | | $ | 1 | | | | 42,324 | | | $ | 1 | |
| Exercisable – End of year | | | 4,721 | | | $ | 3 | | | | 14,000 | | | $ | 3 | | | | 22,924 | | | $ | 3 | |
The liability arising from stock appreciation rights as at August 31, 20162018 and 20172019 amounted to $76,000$93,000 and $115,000$77,000 respectively and is recorded in accounts payable and accrued liabilities in the consolidated balance sheets.
The following table summarizes information about outstanding stock Stock appreciation rights as at August 31, 2017:
| | | | Stock appreciation
rights outstanding | | | Stock appreciation
rights exercisable |
| | | | | | | | | | | |
| Exercise price | | Number | | | Weighted average
remaining contractual life | | | Number | |
| | | | | | | | | | | |
| $ | – | | | | 22,575 | | | 8 years | | | | – | |
| $ | 2.36 | | | | 2,721 | | | 1 year | | | | 2,721 | |
| $ | 3.74 | | | | 1,500 | | | 2 years | | | | 1,500 | |
| $ | 6.28 | | | | 500 | | | | – | | | | 500 | |
| | | | | | 27,296 | | | 7 years | | | | 4,721 | |
1617 | Related-Party Disclosures |
Ultimate controlling shareholder
Mr. Germain Lamonde, the company'scompany’s Executive Chairman, is the company'scompany’s ultimate controlling shareholder.
Compensation of key management personnel
| | | Years ended August 31, | |
| | | 2019 | | | 2018 | | | 2017 | |
| | | | | | | | | | |
| Salaries and short-term employee benefits | | $ | 4,029 | | | $ | 3,985 | | | $ | 3,715 | |
| Stock-based compensation costs | | | 1,175 | | | | 1,047 | | | | 775 | |
| | | $ | 5,204 | | | $ | 5,032 | | | $ | 4,490 | |
Key management personnel includes senior management and directors.
F-37F-42
EXFO Inc.
Notes to Consolidated Financial Statements
(tabular amounts in thousands of US dollars, except share and per share data and as otherwise noted)
Related party transaction
During the year ended August 31, 2015, following the merger of one subsidiary with the parent company, the subsidiary redeemed one share owned by G. Lamonde Investissements financiers, a company controlled by Mr. Germain Lamonde, for a cash consideration of $1, representing its paid-up capital.
Compensation of key management personnel
| | | Years ended August 31, | |
| | | 2017 | | | 2016 | | | 2015 | |
| | | | | | | | | | |
| Salaries and short-term employee benefits | | $ | 3,715 | | | $ | 3,701 | | | $ | 3,025 | |
| Stock-based compensation costs | | | 775 | | | | 826 | | | | 617 | |
| | | $ | 4,490 | | | $ | 4,527 | | | $ | 3,642 | |
Key management personnel includes senior management and directors.
1718 | Statements of Earnings |
Sales
Sales are as follows:
| | | Years ended August 31, | |
| | | 2019 | | | 2018 | | | 2017 | |
| | | | | | | | | | |
| Test and measurement | | $ | 204,693 | | | $ | 197,423 | | | $ | 193,863 | |
| Service assurance, systems and services | | | 82,788 | | | | 71,248 | | | | 49,906 | |
| Foreign exchange gains (losses) on forward exchange contracts | | | (591 | ) | | | 875 | | | | (468 | ) |
| Total sales for the year | | $ | 286,890 | | | $ | 269,546 | | | $ | 243,301 | |
Net research and development
Net research and development expenses comprise the following:
| | | Years ended August 31, | |
| | | 2019 | | | 2018 | | | 2017 | |
| | | | | | | | | | |
| Gross research and development expenses | | $ | 57,972 | | | $ | 65,243 | | | $ | 53,124 | |
| Research and development tax credits and grants | | | (7,419 | ) | | | (8,089 | ) | | | (5,956 | ) |
| Net research and development expenses for the year | | $ | 50,553 | | | $ | 57,154 | | | $ | 47,168 | |
| | | Years ended August 31, | |
| | | 2017 | | | 2016 | | | 2015 | |
| | | | | | | | | | |
| Gross research and development expenses | | $ | 53,124 | | | $ | 47,875 | | | $ | 50,148 | |
| Research and development tax credits and grants | | | (5,956 | ) | | | (5,188 | ) | | | (6,145 | ) |
| Net research and development expenses for the year | | $ | 47,168 | | | $ | 42,687 | | | $ | 44,003 | |
Depreciation and amortization
Depreciation and amortization expenses by functional area are as follows:
| | | Years ended August 31, | |
| | | 2019 | | | 2018 | | | 2017 | |
| | | | | | | | | | |
| Cost of sales | | | | | | | | | |
| Depreciation of property, plant and equipment | | $ | 1,862 | | | $ | 2,077 | | | $ | 1,522 | |
| Amortization of intangible assets | | | 7,186 | | | | 9,212 | | | | 2,652 | |
| | | | 9,048 | | | | 11,289 | | | | 4,174 | |
| | | | | | | | | | | | | |
| Selling and administrative expenses | | | | | | | | | | | | |
| Depreciation of property, plant and equipment | | | 1,354 | | | | 902 | | | | 530 | |
| Amortization of intangible assets | | | 1,043 | | | | 592 | | | | 251 | |
| | | | 2,397 | | | | 1,494 | | | | 781 | |
| | | | | | | | | | | | | |
| Net research and development expenses | | | | | | | | | | | | |
| Depreciation of property, plant and equipment | | | 2,253 | | | | 2,465 | | | | 1,850 | |
| Amortization of intangible assets | | | 783 | | | | 523 | | | | 386 | |
| | | | 3,036 | | | | 2,988 | | | | 2,236 | |
| | | $ | 14,481 | | | $ | 15,771 | | | $ | 7,191 | |
| | | | | | | | | | | | | |
| Depreciation of property, plant and equipment | | $ | 5,469 | | | $ | 5,444 | | | $ | 3,902 | |
| Amortization of intangible assets | | | 9,012 | | | | 10,327 | | | | 3,289 | |
| Total depreciation and amortization expenses for the year | | $ | 14,481 | | | $ | 15,771 | | | $ | 7,191 | |
F-38F-43
EXFO Inc.
Notes to Consolidated Financial Statements
(tabular amounts in thousands of US dollars, except share and per share data and as otherwise noted)
Depreciation and amortization
Depreciation and amortization expenses by functional area are as follows:
| | | Years ended August 31, | |
| | | 2017 | | | 2016 | | | 2015 | |
| | | | | | | | | | |
| Cost of sales | | | | | | | | | |
| Depreciation of property, plant and equipment | | $ | 1,522 | | | $ | 1,290 | | | $ | 1,519 | |
| Amortization of intangible assets | | | 2,652 | | | | 702 | | | | 1,540 | |
| | | | 4,174 | | | | 1,992 | | | | 3,059 | |
| | | | | | | | | | | | | |
| Selling and administrative expenses | | | | | | | | | | | | |
| Depreciation of property, plant and equipment | | | 530 | | | | 501 | | | | 524 | |
| Amortization of intangible assets | | | 251 | | | | 75 | | | | 790 | |
| | | | 781 | | | | 576 | | | | 1,314 | |
| | | | | | | | | | | | | |
| Net research and development expenses | | | | | | | | | | | | |
| Depreciation of property, plant and equipment | | | 1,850 | | | | 2,023 | | | | 2,792 | |
| Amortization of intangible assets | | | 386 | | | | 395 | | | | 553 | |
| | | | 2,236 | | | | 2,418 | | | | 3,345 | |
| | | $ | 7,191 | | | $ | 4,986 | | | $ | 7,718 | |
| | | | | | | | | | | | | |
| Depreciation of property, plant and equipment | | $ | 3,902 | | | $ | 3,814 | | | $ | 4,835 | |
| Amortization of intangible assets | | | 3,289 | | | | 1,172 | | | | 2,883 | |
| Total depreciation and amortization expenses for the year | | $ | 7,191 | | | $ | 4,986 | | | $ | 7,718 | |
Employee compensation
Employee compensation comprises the following:
| | | Years ended August 31, | | | Years ended August 31, | |
| | | 2017 | | | 2016 | | | 2015 | | | 2019 | | | 2018 | | | 2017 | |
| | | | | | | | | | | | | | | | | | | |
| Salaries and benefits | | $ | 115,832 | | | $ | 112,569 | | | $ | 114,868 | | | $ | 136,059 | | | $ | 134,453 | | | $ | 115,832 | |
| Restructuring charges | | | 3,509 | | | ‒ | | | | 1,637 | | | 3,305 | | | 2,072 | | | 3,509 | |
| Stock-based compensation costs | | | 1,414 | | | | 1,378 | | | | 1,295 | | | | 1,831 | | | | 1,748 | | | | 1,414 | |
| Total employee compensation for the year | | $ | 120,755 | | | $ | 113,947 | | | $ | 117,800 | | | $ | 141,195 | | | $ | 138,273 | | | $ | 120,755 | |
Restructuring charges by functional area are as follows:
| | | Years ended August 31, | |
| | | 2019 | | | 2018 | | | 2017 | |
| | | | | | | | | | |
| Cost of sales | | $ | 304 | | | $ | 517 | | | $ | 1,697 | |
| Selling and administrative expenses | | | 495 | | | | 673 | | | | 1,150 | |
| Net research and development costs | | | 2,506 | | | | 3,219 | | | | 2,232 | |
| Interest and other expense | | | – | | | | 150 | | | | – | |
| Income taxes | | | (63 | ) | | | (1,150 | ) | | | – | |
| Total restructuring charges for the year | | $ | 3,242 | | | $ | 3,409 | | | $ | 5,079 | |
| | | Years ended August 31, | |
| | | 2017 | | | 2016 | | | 2015 | |
| | | | | | | | | | |
| Cost of sales | | $ | 1,697 | | | $ | ‒ | | | $ | 290 | |
| Selling and administrative expenses | | | 1,150 | | | ‒ | | | | 586 | |
| Net research and development costs | | | 2,232 | | | ‒ | | | | 761 | |
| Total restructuring charges for the year | | $ | 5,079 | | | $ | ‒ | | | $ | 1,637 | |
| | | Years ended August 31, | |
| | | 2019 | | | 2018 | | | 2017 | |
| | | | | | | | | | |
| Cost of sales | | $ | 136 | | | $ | 143 | | | $ | 121 | |
| Selling and administrative expenses | | | 1,375 | | | | 1,217 | | | | 1,052 | |
| Net research and development expenses | | | 320 | | | | 388 | | | | 304 | |
| Total stock-based compensation costs for the year | | $ | 1,831 | | | $ | 1,748 | | | $ | 1,477 | |
Other assets
As at August 31, 2018 and 2019, the carrying value of contract assets amounted to $2,279,000 and $3,083,000 respectively and were presented in other current assets in the consolidated balance sheets. Contract assets represent unbilled work in progress.
Deferred revenue
As at August 31, 2019, the company had total deferred revenue of $33,478,000, which represents the aggregate total contract price allocated to undelivered performance obligations. The company expects to recognize $24,422,000 of this amount during the next 12 months and expects to recognize the remaining $9,056,000 thereafter.
F-39F-44
EXFO Inc.
Notes to Consolidated Financial Statements
(tabular amounts in thousands of US dollars, except share and per share data and as otherwise noted)
Stock-based compensation costs by functional area are as follows:
| | | Years ended August 31, | |
| | | 2017 | | | 2016 | | | 2015 | |
| | | | | | | | | | |
| Cost of sales | | $ | 121 | | | $ | 107 | | | $ | 159 | |
| Selling and administrative expenses | | | 1,052 | | | | 972 | | | | 791 | |
| Net research and development expenses | | | 304 | | | | 299 | | | | 345 | |
| Total stock-based compensation costs for the year | | $ | 1,477 | | | $ | 1,378 | | | $ | 1,295 | |
Government grants
The company is entitled to receive grants on certain eligible research and development projects conducted in Finland from TEKES, a Finnish technology organization, which funds Finnish companies' high technology research and innovations. The company's eligible research and development projects must be pre-approved by TEKES, andDuring the grant is subject to certain conditions. In the event that a condition is not met, TEKES can require reimbursement of a portion or the entireyear ended August 31, 2019, sales include an amount of the grant received. A liability to repay the funding is recognized$16,556,000 that was included in the period in which conditions arise that will cause the funding to be repayable. Ascarrying value of deferred revenue as at August 31, 2017, the company was in compliance with the conditions of the funding. This funding is accounted for as a reduction of gross research and development expenses in the consolidated statements of earnings. For the years ended August 31, 2015, 2016 and 2017, the company recorded $919,000, $299,000 and $146,000 respectively, under that program in the consolidated statements of earnings.2018.
Defined contribution pension plans
The company maintains separate defined contribution pension plans for certain eligible employees. These plans, which are accounted for on an accrual basis, are summarized as follows:
· | Canadian defined contribution pension plan |
Canadian defined contribution pension plan
The company maintains a plan for certain eligible employees residing in Canada, under which the company may elect to match the employees'employees’ contributions up to a maximum of 4% of an employee'semployee’s gross salary. Cash contributions to this plan and expenses for the years ended August 31, 2015, 20162017, 2018 and 2017,2019, amounted to $1,492,000, $1,374,000$1,571,000, $1,610,000 and $1,571,000$1,592,000 respectively.
· | US defined contribution pension plan (401K plan) |
US defined contribution pension plan (401K plan)
The company maintains a 401K plan for eligible employees residing in the U.S. Under this plan, the company must contribute an amount equal to 3% of an employee'semployee’s current compensation. In addition, eligible employees may contribute up to the lesser of 1% of eligible compensation or the statutorily prescribed annual limit to the 401K plan. The 401K plan permits but does not require the company to make additional matching contributions to the 401K plan on behalf of the eligible participants, subject to a maximum of 50% of the first 6% of the participant'sparticipant’s current compensation subject to certain legislated maximum contribution limits. During the years ended August 31, 2015, 20162017, 2018 and 2017,2019, the company recorded cash contributions and expenses totaling $628,000, $622,000$630,000, $591,000 and $630,000$460,000 respectively.
F-40F-45
EXFO Inc.
Notes to Consolidated Financial Statements
(tabular amounts in thousands of US dollars, except share and per share data and as otherwise noted)
The reconciliation of the income tax provision (recovery) calculated using the combined Canadian federal and provincial statutory income tax rate with the income tax provision in the consolidated financial statements is as follows:
| | | Years ended August 31, | |
| | | 2019 | | | 2018 | | | 2017 | |
| | | | | | | | | | |
Income tax provision (recovery) at combined Canadian federal and provincial statutory tax rate (27%) | | $ | 774 | | | $ | (1,775 | ) | | $ | 2,014 | |
| | | | | | | | | | | | | |
| Increase (decrease) due to: | | | | | | | | | | | | |
| Foreign income/loss taxed at different rates | | | 13 | | | | 452 | | | | (900 | ) |
| Non-deductible loss (non-taxable income) | | | 10 | | | | (69 | ) | | | (245 | ) |
| Non-deductible expenses | | | 594 | | | | 1,285 | | | | 981 | |
| Change in tax rates | | | – | | | | 167 | | | | (10 | ) |
Effect of the US tax reform (1) | | | – | | | | 1,528 | | | | – | |
| Foreign exchange effect of translation of foreign subsidiaries in the functional currency | | | 63 | | | | (16 | ) | | | 176 | |
| Recognition of previously unrecognized deferred income tax assets (note 4) | | | (2,383 | ) | | | (560 | ) | | | – | |
| Utilization of previously unrecognized deferred income tax assets | | | (964 | ) | | | (627 | ) | | | (46 | ) |
| Unrecognized deferred income tax assets on temporary deductible differences and unused tax losses | | | 5,761 | | | | 6,100 | | | | 4,659 | |
| Other | | | 1,478 | | | | (807 | ) | | | (21 | ) |
| Income tax provision for the year | | $ | 5,346 | | | $ | 5,678 | | | $ | 6,608 | |
| | | Years ended August 31, | |
| | | 2017 | | | 2016 | | | 2015 | |
| | | | | | | | | | |
Income tax provision at combined Canadian federal and provincial statutory tax rate (27%) | | $ | 2,014 | | | $ | 4,499 | | | $ | 2,671 | |
| | | | | | | | | | | | | |
| Increase (decrease) due to: | | | | | | | | | | | | |
| Foreign income/loss taxed at different rates | | | (900 | ) | | | (1,025 | ) | | | 482 | |
| Non-deductible loss (non-taxable income) | | | (245 | ) | | | 5 | | | | 2,540 | |
| Non-deductible expenses | | | 981 | | | | 411 | | | | 664 | |
| Change in tax rates | | | (10 | ) | | ‒ | | | ‒ | |
| Foreign exchange effect of translation of foreign subsidiaries in the functional currency | | | 176 | | | | 566 | | | | (3,641 | ) |
| Utilization of previously unrecognized deferred income tax assets | | | (46 | ) | | ‒ | | | ‒ | |
| Unrecognized deferred income tax assets on temporary deductible differences and unused tax losses | | | 4,659 | | | | 3,702 | | | | 2,556 | |
| Other | | | (21 | ) | | | (394 | ) | | | (236 | ) |
| Income tax provision for the year | | $ | 6,608 | | | $ | 7,764 | | | $ | 5,036 | |
| (1) | On December 22, 2017, the US tax reform (“Tax Cuts and Jobs Act”) was substantively enacted and reduces the maximum corporate income tax rate from 35% to 21%, effective January 1, 2018. Based on management’s estimate of deferred tax assets expected to be used in fiscal 2018 and beyond against taxable income in the United States, the company recorded a deferred income tax expense of $1,528,000 in the consolidated statement of earnings for the year ended August 31, 2018 to account for the effect of this substantively enacted tax rate. |
| | | Years ended August 31, | |
| | | 2017 | | | 2016 | | | 2015 | |
| | | | | | | | | | |
| The income tax provision consists of the following: | | | | | | | | | |
| | | | | | | | | | |
| Current | | | | | | | | | |
| Current income taxes | | $ | 5,554 | | | $ | 6,186 | | | $ | 4,633 | |
| | | | | | | | | | | | | |
| Deferred | | | | | | | | | | | | |
| Deferred income taxes relating to the origination and reversal of temporary differences | | | (3,605 | ) | | | (2,124 | ) | | | (2,153 | ) |
| | | | | | | | | | | | | |
| Unrecognized deferred income tax assets on temporary deductible differences and unused tax losses | | | 4,659 | | | | 3,702 | | | | 2,556 | |
| | | | 1,054 | | | | 1,578 | | | | 403 | |
| Income tax provision for the year | | $ | 6,608 | | | $ | 7,764 | | | $ | 5,036 | |
EXFO Inc.
Notes to Consolidated Financial Statements
(tabular amounts in thousands of US dollars, except share and per share data and as otherwise noted)
Deferred taxes
| | | As at August 31, | |
| | | 2017 | | | 2016 | |
| | | | | | | |
| Deferred income tax assets | | | | | | |
| Deferred income tax assets recoverable within 12 months | | $ | 3,361 | | | $ | 4,224 | |
| Deferred income tax assets recoverable after 12 months | | | 3,194 | | | | 4,016 | |
| | | | 6,555 | | | | 8,240 | |
| | | | | | | | | |
| Deferred income tax liabilities | | | | | | | | |
| Deferred income tax liabilities payable within 12 months | | | 499 | | | | 645 | |
| Deferred income tax liabilities payable after 12 months | | | 2,617 | | | | 2,212 | |
| | | | 3,116 | | | | 2,857 | |
| Deferred income tax assets net | | $ | 3,439 | | | $ | 5,383 | |
The changes in deferred income tax assets and liabilities for the year ended August 31, 2016 are as follows:
| | | Balance as at
September 1,
2015 | | | Credited
(charged) to the
statement of
earnings | | | Credited
(charged) to
shareholders'
equity | | | Foreign
currency
translation
adjustment | | | Balance as at
August 31,
2016 | |
| | | | | | | | | | | | | | | | |
| Deferred income tax assets | | | | | | | | | | | | | | | |
| Long-lived assets | | $ | 2,849 | | | $ | (595 | ) | | $ | ‒ | | | $ | 1 | | | $ | 2,255 | |
| Provisions and accruals | | | 5,024 | | | | 177 | | | | (935 | ) | | | (20 | ) | | | 4,246 | |
| Deferred revenue | | | 1,308 | | | | 1,015 | | | ‒ | | | | 7 | | | | 2,330 | |
| Research and development expenses | | | 2,240 | | | | 112 | | | ‒ | | | | 9 | | | | 2,361 | |
| Losses carried forward | | | 6,551 | | | | (1,951 | ) | | ‒ | | | | (2 | ) | | | 4,598 | |
| | | | | | | | | | | | | | | | | | | | | |
| Deferred income tax liabilities | | | | | | | | | | | | | | | | | | | | |
| Research and development tax credits | | | (10,037 | ) | | | (336 | ) | | ‒ | | | | (34 | ) | | | (10,407 | ) |
| Total | | $ | 7,935 | | | $ | (1,578 | ) | | $ | (935 | ) | | $ | (39 | ) | | $ | 5,383 | |
| | | | | | | | | | | | | | | | | | | | | |
| Classified as follows: | | | | | | | | | | | | | | | | | | | | |
| Deferred income tax assets | | $ | 9,459 | | | | | | | | | | | | | | | $ | 8,240 | |
| Deferred income tax liabilities | | | (1,524 | ) | | | | | | | | | | | | | | | (2,857 | ) |
| | | $ | 7,935 | | | | | | | | | | | | | | | $ | 5,383 | |
EXFO Inc.
Notes to Consolidated Financial Statements
(tabular amounts in thousands of US dollars, except share and per share data and as otherwise noted)
The changes in deferred income tax assets and liabilities for the year ended August 31, 2017 are as follows:
| | | Balance
as at
September 1,
2016 | | | Credited
(charged)
to the
statement
of earnings | | | Credited
(charged) to
shareholders'
equity | | | Business
combinations | | | Foreign
currency
translation
adjustment | | | Balance
as at
August 31,
2017 | |
| | | | | | | | | | | | | | | | | | | |
| Deferred income tax assets | | | | | | | | | | | | | | | | | | |
| Long-lived assets | | $ | 2,255 | | | $ | (240 | ) | | $ | ‒ | | | $ | (279 | ) | | $ | 66 | | | $ | 1,802 | |
| Provisions and accruals | | | 4,246 | | | | (89 | ) | | | (479 | ) | | ‒ | | | | 94 | | | | 3,772 | |
| Deferred revenue | | | 2,330 | | | | 486 | | | ‒ | | | ‒ | | | | 74 | | | | 2,890 | |
| Research and development expenses | | | 2,361 | | | | 248 | | | ‒ | | | ‒ | | | | 122 | | | | 2,731 | |
| Losses carried forward | | | 4,598 | | | | (1,470 | ) | | ‒ | | | | 1,059 | | | | 54 | | | | 4,241 | |
| | | | | | | | | | | | | | | | | | | | | | | | | |
| Deferred income tax liabilities | | | | | | | | | | | | | | | | | | | | | | | | |
| Long-lived assets | | ‒ | | | | 111 | | | ‒ | | | | (1,059 | ) | | | (54 | ) | | | (1,002 | ) |
| Research and development tax credits | | | (10,407 | ) | | | (100 | ) | | ‒ | | | ‒ | | | | (488 | ) | | | (10,995 | ) |
| Total | | $ | 5,383 | | | $ | (1,054 | ) | | $ | (479 | ) | | $ | (279 | ) | | $ | (132 | ) | | $ | 3,439 | |
| | | | | | | | | | | | | | | | | | | | | | | | | |
| Classified as follows: | | | | | | | | | | | | | | | | | | | | | | | | |
| Deferred income tax assets | | $ | 8,240 | | | | | | | | | | | | | | | | | | | $ | 6,555 | |
| Deferred income tax liabilities | | | (2,857 | ) | | | | | | | | | | | | | | | | | | | (3,116 | ) |
| | | $ | 5,383 | | | | | | | | | | | | | | | | | | | $ | 3,439 | |
Unrecognized deferred income tax assets on temporary deductible differences and unused tax losses are as follows:
| | | As at August 31, | |
| | | 2017 | | | 2016 | |
| | | | | | | |
| Temporary deductible differences | | $ | 2,271 | | | $ | 1,676 | |
| Losses carried forward | | | 43,670 | | | | 38,287 | |
| | | $ | 45,941 | | | $ | 39,963 | |
EXFO Inc.
Notes to Consolidated Financial Statements
(tabular amounts in thousands of US dollars, except share and per share data and as otherwise noted)
| | | Years ended August 31, | |
| | | 2019 | | | 2018 | | | 2017 | |
| | | | | | | | | | |
| The income tax provision consists of the following: | | | | | | | | | |
| | | | | | | | | | |
| Current | | | | | | | | | |
| Current income taxes | | $ | 7,449 | | | $ | 4,310 | | | $ | 5,554 | |
| | | | | | | | | | | | | |
| Deferred | | | | | | | | | | | | |
| Deferred income taxes relating to the origination and reversal of temporary differences | | | (4,517 | ) | | | (3,545 | ) | | | (3,559 | ) |
| Benefit arising from previously unrecognized tax losses and deductible temporary differences | | | (2,383 | ) | | | (560 | ) | | | – | |
| Utilization of previously unrecognized deferred income tax assets | | | (964 | ) | | | (627 | ) | | | (46 | ) |
| | | | (7,864 | ) | | | (4,732 | ) | | | (3,605 | ) |
| | | | | | | | | | | | | |
| Unrecognized deferred income tax assets on temporary deductible differences and unused tax losses | | | 5,761 | | | | 6,100 | | | | 4,659 | |
| | | | (2,103 | ) | | | 1,368 | | | | 1,054 | |
| Income tax provision for the year | | $ | 5,346 | | | $ | 5,678 | | | $ | 6,608 | |
The changes in deferred income tax assets and liabilities for the year ended August 31, 2018 are as follows:
| | | Balance
as at
September 1,
2017 | | | Credited
(charged)
to the
statement
of earnings | | | Credited
(charged) to
shareholders’
equity | | | Business
combinations | | | Foreign
currency
translation
adjustment | | | Balance
as at
August 31,
2018 | |
| | | | | | | | | | | | | | | | | | | |
| Deferred income tax assets | | | | | | | | | | | | | | | | | | |
| Long-lived assets | | $ | 1,802 | | | $ | 200 | | | $ | – | | | $ | – | | | $ | (77 | ) | | $ | 1,925 | |
| Provisions and accruals | | | 3,772 | | | | (250 | ) | | | 554 | | | | – | | | | (113 | ) | | | 3,963 | |
| Deferred revenue | | | 2,890 | | | | (101 | ) | | | – | | | | – | | | | (73 | ) | | | 2,716 | |
| Research and development expenses | | | 2,731 | | | | (101 | ) | | | – | | | | – | | | | (106 | ) | | | 2,524 | |
| Losses carried forward | | | 4,241 | | | | (2,633 | ) | | | – | | | | 3,687 | | | | (222 | ) | | | 5,073 | |
| | | | | | | | | | | | | | | | | | | | | | | | | |
| Deferred income tax liabilities | | | | | | | | | | | | | | | | | | | | | | | | |
| Long-lived assets | | | (1,002 | ) | | | 1,903 | | | | – | | | | (7,889 | ) | | | 527 | | | | (6,461 | ) |
| Research and development tax credits | | | (10,995 | ) | | | (386 | ) | | | – | | | | – | | | | 445 | | | | (10,936 | ) |
| Total | | $ | 3,439 | | | $ | (1,368 | ) | | $ | 554 | | | $ | (4,202 | ) | | $ | 381 | | | $ | (1,196 | ) |
| | | | | | | | | | | | | | | | | | | | | | | | | |
| Classified as follows: | | | | | | | | | | | | | | | | | | | | | | | | |
| Deferred income tax assets | | $ | 6,555 | | | | | | | | | | | | | | | | | | | $ | 4,714 | |
| Deferred income tax liabilities | | | (3,116 | ) | | | | | | | | | | | | | | | | | | | (5,910 | ) |
| | | $ | 3,439 | | | | | | | | | | | | | | | | | | | $ | (1,196 | ) |
EXFO Inc.
Notes to Consolidated Financial Statements
(tabular amounts in thousands of US dollars, except share and per share data and as otherwise noted)
The changes in deferred income tax assets and liabilities for the year ended August 31, 2019 are as follows:
| | | Balance
as at
September 1,
2018 | | | Credited
(charged)
to the
statement
of earnings | | | Credited
(charged) to
shareholders’
equity | | | Foreign
currency
translation
adjustment | | | Balance
as at
August 31,
2019 | |
| | | | | | | | | | | | | | | | |
| Deferred income tax assets | | | | | | | | | | | | | | | |
| Long-lived assets | | $ | 1,925 | | | $ | 2,695 | | | $ | – | | | $ | (52 | ) | | $ | 4,568 | |
| Provisions and accruals | | | 3,963 | | | | 446 | | | | 67 | | | | 15 | | | | 4,491 | |
| Deferred revenue | | | 2,716 | | | | 490 | | | | – | | | | (36 | ) | | | 3,170 | |
| Research and development expenses | | | 2,524 | | | | (149 | ) | | | – | | | | (45 | ) | | | 2,330 | |
| Losses carried forward | | | 5,073 | | | | (2,751 | ) | | | – | | | | (176 | ) | | | 2,146 | |
| | | | | | | | | | | | | | | | | | | | |
| Deferred income tax liabilities | | | | | | | | | | | | | | | | | | | | |
| Long-lived assets | | | (6,461 | ) | | | 1,710 | | | | – | | | | 345 | | | | (4,406 | ) |
| Research and development tax credits | | | (10,936 | ) | | | (338 | ) | | | – | | | | 198 | | | | (11,076 | ) |
| Total | | $ | (1,196 | ) | | $ | 2,103 | | | $ | 67 | | | $ | 249 | | | $ | 1,223 | |
| | | | | | | | | | | | | | | | | | | | | |
| Classified as follows: | | | | | | | | | | | | | | | | | | | | |
| Deferred income tax assets | | $ | 4,714 | | | | | | | | | | | | | | | $ | 4,821 | |
| Deferred income tax liabilities | | | (5,910 | ) | | | | | | | | | | | | | | | (3,598 | ) |
| | | $ | (1,196 | ) | | | | | | | | | | | | | | $ | 1,223 | |
Unrecognized deferred income tax assets on temporary deductible differences and unused tax losses are as follows:
| | | As at August 31, | |
| | | 2019 | | | 2018 | |
| | | | | | | |
| Temporary deductible differences | | $ | 241 | | | $ | 1,435 | |
| Losses carried forward | | | 39,721 | | | | 42,361 | |
| | | $ | 39,962 | | | $ | 43,796 | |
EXFO Inc.
Notes to Consolidated Financial Statements
(tabular amounts in thousands of US dollars, except share and per share data and as otherwise noted)
As at August 31, 2017,2019, the year of expiry of operating losses for which no deferred income tax assets were recognized in the consolidated balance sheet are as follows, presented by tax jurisdiction:
| Year of expiry | | Finland | | | United States | | | United Kingdom | | | Finland | | | France | | | Spain | | | United States | | | United Kingdom | |
| | | | | | | | | | | | | | | | | | | | | | | | | |
| 2018 | | $ | 444 | | | $ | 741 | | | $ | ‒ | | |
| 2019 | | ‒ | | | | 3,470 | | | ‒ | | |
| 2020 | | | 7,848 | | | | 7,991 | | | ‒ | | | $ | 3,397 | | | $ | – | | | $ | – | | | $ | – | | | $ | – | |
| 2021 | | | 6,799 | | | | 2,211 | | | ‒ | | | 6,345 | | | – | | | – | | | 1,958 | | | – | |
| 2022 | | | 11,788 | | | | 7,435 | | | ‒ | | | 11,001 | | | – | | | – | | | 7,435 | | | – | |
| 2023 | | | 7,637 | | | | 1,972 | | | ‒ | | | 7,127 | | | – | | | – | | | 1,972 | | | – | |
| 2024 | | | 5,896 | | | | 1,351 | | | ‒ | | | 5,502 | | | – | | | – | | | 1,351 | | | – | |
| 2025 | | | 7,350 | | | | 1,351 | | | ‒ | | | 6,859 | | | – | | | – | | | 1,351 | | | – | |
| 2026 | | | 251 | | | | 1,351 | | | ‒ | | | 235 | | | – | | | – | | | 1,351 | | | – | |
| 2027 | | | 2,035 | | | | 1,351 | | | ‒ | | | 1,425 | | | – | | | – | | | 1,351 | | | – | |
| 2028 | | ‒ | | | | 2,447 | | | ‒ | | | – | | | – | | | – | | | 2,447 | | | – | |
| 2030 | | ‒ | | | | 2,713 | | | ‒ | | | – | | | – | | | – | | | 2,713 | | | – | |
| 2031 | | ‒ | | | | 109 | | | ‒ | | | – | | | – | | | – | | | 109 | | | – | |
| 2033 | | ‒ | | | | 4,681 | | | ‒ | | | – | | | – | | | – | | | 4,681 | | | – | |
| 2034 | | ‒ | | | | 4,851 | | | ‒ | | | – | | | – | | | – | | | 4,851 | | | – | |
| 2035 | | ‒ | | | | 2,616 | | | ‒ | | | – | | | – | | | – | | | 2,616 | | | – | |
| 2036 | | ‒ | | | | 8,501 | | | ‒ | | | – | | | – | | | – | | | 8,501 | | | – | |
| 2037 | | ‒ | | | | 8,988 | | | ‒ | | | – | | | – | | | – | | | 9,660 | | | – | |
| 2038 | | | – | | | – | | | – | | | 7,997 | | | – | |
| Indefinite | | ‒ | | | ‒ | | | | 3,737 | | | | – | | | | 35,839 | | | | 6,100 | | | | – | | | | 4,461 | |
| | | $ | 50,048 | | | $ | 64,130 | | | $ | 3,737 | | | $ | 41,891 | | | $ | 35,839 | | | $ | 6,100 | | | $ | 60,344 | | | $ | 4,461 | |
Furthermore, as at August 31, 2017,2019, the company had available capital losses in Canada amounting to $53,396,000$49,363,000 (CA$66,937,000)65,622,000) at the federal level and $56,696,000$52,545,000 (CA$71,074,000)69,853,000) at the provincial level for which no deferred income tax assets were recognized. These losses can be carried forward indefinitely against capital gains.
As at August 31, 2017,2019, non-refundable research and development tax credits recognized in the consolidated balance sheet amounted to $40,50138,947,000. In order to recover these non-refundable research and development tax credits, the company needs to generate approximately $262260,000,000 (CA$328345,000,000) in pre-tax earnings at the Canadian federal level and approximately $12,000,000 at the Canadian provincial level. In order to generate $262260,000,000 in pre-tax earnings at the Canadian Federalfederal level over the estimated recovery period of 1516 years, the company must generate a pre-tax earnings compound annual growth rate (CAGR) of 21%, which the company believes is probable. The company'scompany’s non-refundable research and development tax credits can be carried forward over a twenty-year period.
In addition, as at August 31, 2017, the company had deferred income tax assets in the consolidated balance sheet in the amount of $3,239,000 for operating losses in the United States. In order to recover these deferred income tax assets, the company needs to generate approximately $9,500,000 in pre-tax earnings at the United States level, and in order to do so over the estimated recovery period of three years, the company must generate a pre-tax earnings CAGR of 2%, which the company believes is probable. The company's operating losses in the United States can be carried forward over a twenty-year20-year period.
As at August 31, 2017,2019, no income taxes were recognized on taxable temporary differences of $17,006$23,111,,000;000; such taxes would be payable on the unremitted earnings of certain of the company'scompany’s subsidiaries, as the company has determined that:
| (1) | Undistributed profits of its foreign subsidiaries will not be distributed in the foreseeable future; and |
| (2) | Undistributed profits of its domestic subsidiaries will not be taxable when distributed. |
F-44F-49
EXFO Inc.
Notes to Consolidated Financial Statements
(tabular amounts in thousands of US dollars, except share and per share data and as otherwise noted)
The following table summarizes the reconciliation of the basic weighted average number of shares outstanding and the diluted weighted average number of shares outstanding:
| | | Years ended August 31, | |
| | | 2019 | | | 2018 | | | 2017 | |
| | | | | | | | | | |
| Basic weighted average number of shares outstanding (000’s) | | | 55,325 | | | | 54,998 | | | | 54,423 | |
| Plus dilutive effect of (000’s): | | | | | | | | | | | | |
| Restricted share units | | | – | | | | – | | | | 979 | |
| Deferred share units | | | – | | | | – | | | | 153 | |
| Diluted weighted average number of shares outstanding (000’s) | | | 55,325 | | | | 54,998 | | | | 55,555 | |
| | | | | | | | | | | | | |
| Stock awards excluded from the calculation of the diluted weighted average number of shares outstanding because their exercise price was greater than the average market price of the common shares, or their inclusion would be antidilutive (000’s) | | | 1,701 | | | | 1,799 | | | | – | |
| | | Years ended August 31, | |
| | | 2017 | | | 2016 | | | 2015 | |
| | | | | | | | | | |
| Basic weighted average number of shares outstanding (000's) | | | 54,423 | | | | 53,863 | | | | 56,804 | |
| Plus dilutive effect of (000's): | | | | | | | | | | | | |
| Restricted share units | | | 979 | | | | 675 | | | | 549 | |
| Deferred share units | | | 153 | | | | 131 | | | | 104 | |
| Diluted weighted average number of shares outstanding (000's) | | | 55,555 | | | | 54,669 | | | | 57,457 | |
| | | | | | | | | | | | | |
| Stock awards excluded from the calculation of the diluted weighted average number of shares outstanding because their exercise price was greater than the average market price of the common shares (000's) | | ‒ | | | | 75 | | | | 57 | |
For the years ended August 31, 2018 and 2019, the diluted amount per share was the same amount as the basic amount per share since the dilutive effect of restricted share units and deferred share units was not included in the calculation; otherwise, the effect would have been antidilutive. Accordingly, the diluted amount per share for these periods was calculated using the basic weighted average number of shares outstanding.
Sales for products and services are detailed as follows:
| | | Years ended August 31, | |
| | | 2017 | | | 2016 | | | 2015 | |
| | | | | | | | | | |
| Products | | $ | 213,653 | | | $ | 205,371 | | | $ | 193,427 | |
| Services | | | 29,648 | | | | 27,212 | | | | 28,662 | |
| | | $ | 243,301 | | | $ | 232,583 | | | $ | 222,089 | |
Sales to external customers by geographic region are detailed as follows:
| | | Years ended August 31, | |
| | | 2019 | | | 2018 | | | 2017 | |
| | | | | | | | | | |
| United States | | $ | 106,607 | | | $ | 100,225 | | | $ | 97,186 | |
| Canada | | | 15,913 | | | | 18,425 | | | | 22,586 | |
| Other | | | 21,391 | | | | 16,743 | | | | 14,951 | |
| Americas | | | 143,911 | | | | 135,393 | | | | 134,723 | |
| | | | | | | | | | | | | |
| United Kingdom | | | 16,438 | | | | 17,508 | | | | 11,799 | |
| Other | | | 76,285 | | | | 67,169 | | | | 50,302 | |
| Europe, Middle East and Africa | | | 92,723 | | | | 84,677 | | | | 62,101 | |
| | | | | | | | | | | | | |
| China | | | 27,620 | | | | 20,724 | | | | 22,312 | |
| Other | | | 22,636 | | | | 28,752 | | | | 24,165 | |
| Asia-Pacific | | | 50,256 | | | | 49,476 | | | | 46,477 | |
| | | $ | 286,890 | | | $ | 269,546 | | | $ | 243,301 | |
| | | Years ended August 31, | |
| | | 2017 | | | 2016 | | | 2015 | |
| | | | | | | | | | |
| United States | | $ | 97,186 | | | $ | 95,388 | | | $ | 82,227 | |
| Canada | | | 22,586 | | | | 18,027 | | | | 19,722 | |
| Other | | | 14,951 | | | | 14,129 | | | | 17,547 | |
| Americas | | | 134,723 | | | | 127,544 | | | | 119,496 | |
| | | | | | | | | | | | | |
| Europe, Middle-East and Africa | | | 62,101 | | | | 57,172 | | | | 57,274 | |
| | | | | | | | | | | | | |
| China | | | 22,312 | | | | 25,281 | | | | 21,526 | |
| Other | | | 24,165 | | | | 22,586 | | | | 23,793 | |
| Asia-Pacific | | | 46,477 | | | | 47,867 | | | | 45,319 | |
| | | $ | 243,301 | | | $ | 232,583 | | | $ | 222,089 | |
F-45F-50
EXFO Inc.
Notes to Consolidated Financial Statements
(tabular amounts in thousands of US dollars, except share and per share data and as otherwise noted)
Sales were allocated to geographic regions based on the country of residence of the related customers.
Long-lived assets by geographic region are detailed as follows:
| | | As at August 31, 2019 | | | As at August 31, 2018 | |
| | | | | | | | | | | | | | | | | | | |
| | | Property,
plant and
equipment | | | Intangible
assets | | | Goodwill | | | Property,
plant and
equipment | | | Intangible
assets | | | Goodwill | |
| | | | | | | | | | | | | | | | | | | |
| Canada | | $ | 29,517 | | | $ | 5,675 | | | $ | 17,487 | | | $ | 32,107 | | | $ | 5,668 | | | $ | 4,481 | |
| United States | | | 7 | | | | – | | | | – | | | | 1,677 | | | | 435 | | | | 13,327 | |
| Finland | | | 331 | | | | 446 | | | | 8,547 | | | | 473 | | | | 380 | | | | 8,704 | |
| France | | | 1,896 | | | | 12,788 | | | | 5,600 | | | | 2,401 | | | | 19,330 | | | | 5,909 | |
| United Kingdom | | | 640 | | | | 2,706 | | | | 7,014 | | | | 755 | | | | 4,005 | | | | 7,471 | |
| India | | | 4,249 | | | | 23 | | | | – | | | | 4,021 | | | | 28 | | | | – | |
| China | | | 2,667 | | | | 16 | | | | – | | | | 2,822 | | | | 20 | | | | – | |
| Other | | | 57 | | | | – | | | | – | | | | 54 | | | | – | | | | – | |
| | | $ | 39,364 | | | $ | 21,654 | | | $ | 38,648 | | | $ | 44,310 | | | $ | 29,866 | | | $ | 39,892 | |
| | | As at August 31, 2017 | | | As at August 31, 2016 | |
| | | | | | | | | | | | | | | | | | | |
| | | Property,
plant and
equipment | | | Intangible
assets | | | Goodwill | | | Property,
plant and
equipment | | | Intangible
assets | | | Goodwill | |
| | | | | | | | | | | | | | | | | | | |
| Canada | | $ | 29,417 | | | $ | 4,643 | | | $ | 3,890 | | | $ | 27,048 | | | $ | 1,330 | | | $ | – | |
| United States | | | 2,031 | | | | 1,072 | | | | 14,696 | | | | 1,174 | | | | 1,637 | | | | 13,265 | |
| Finland | | | 441 | | | | 316 | | | | 9,064 | | | | 572 | | | | 354 | | | | 8,663 | |
| United Kingdom | | | 915 | | | | 5,093 | | | | 7,427 | | | | 797 | | | | – | | | | – | |
| India | | | 4,000 | | | | 27 | | | | – | | | | 3,602 | | | | 37 | | | | – | |
| China | | | 3,227 | | | | 32 | | | | – | | | | 2,657 | | | | 33 | | | | – | |
| Other | | | 101 | | | | – | | | | – | | | | 128 | | | | – | | | | – | |
| | | $ | 40,132 | | | $ | 11,183 | | | $ | 35,077 | | | $ | 35,978 | | | $ | 3,391 | | | $ | 21,928 | |
Business combinations
Astellia SA
On September 8, 2017, the company acquired a 33.1% interest in Astellia SA ("Astellia"), a publicly traded company on the NYSE Euronext Paris stock exchange. Astellia is a provider of network and subscriber intelligence enabling mobile operators to drive service quality, maximize operational efficiency, reduce churn and develop revenue. Its vendor-independent, real-time monitoring and troubleshooting solution is used to optimize networks end-to-end from radio to core. The cost of this investment amounted to €8,568,000 (US$10,311,000), which was settled in cash on September 8, 2017.
On October 10, 2017, the company reached an agreement with Astellia to acquire Astellia's remaining shares at a share price of €10, for total consideration of €17,312,010 (approximately US$20,000,000) by way of a public tender offer. The public offering will open in late calendar 2017 or early 2018, subject to the approval of French foreign investment authorities and permission from l'Autorité des marchés financiers. If the public tender offering is successful, the settlement of the acquisition is expected to take place early in calendar 2018.
Yenista Optics S.A.S.
On October 2, 2017, the company acquired all issued and outstanding shares of Yenista Optics S.A.S. (Yenista), a privately held company located in France, a supplier of advanced optical test equipment for the research and development and manufacturing markets. The acquisition-date fair value of the total consideration amounted to €9,400,000 (US$11,100,000) and consisted of €8,300,000 (US$9,700,000) in cash, net of Yenista's cash of €1,100,000 (US$1,400,000) at the acquisition date. This acquisition will be accounted for by applying the acquisition method as required by IFRS 3, "Business Combinations", and the requirements of IFRS 10, "Consolidated Financial Statements"; consequently, the fair value of the total consideration transferred will be allocated to the assets acquired and liabilities assumed based on management's estimate of their fair value as at the acquisition date. The results of operations of the acquired business will be included in the consolidated financial statements of the company starting October 2, 2017, being the acquisition date.
EXFO Inc.
Notes to Consolidated Financial Statements
(tabular amounts in thousands of US dollars, except share and per share data and as otherwise noted)
F-51Other
Credit facilities
On October 25, 2017, the company modified certain credit facilities whereby existing lines of credits, that provided advances up to CA$4,800,000 (US$3,829,000) and up to US$6,000,000 for operating purposes, were cancelled and replaced by a credit facility of CA$28,929,000 (US$23,077,000) mainly for the acquisition of the remaining shares of Astellia under the public tender offer. This credit facility bears interest at the Canadian prime rate and is secured by a movable mortgage of CA$65,000,000 (US$51,851,000) over the universality of the company's Canadian movable assets, present and future (note 10).
F-47