2
| Table of Contents | |||
| 5 | |||
| 5 | |||
| 7 | |||
| 7 | |||
| 7 | |||
| 7 | |||
| 7 | |||
7 | |||
| 15 | |||
| 16 | |||
| 20 | |||
| 21 | |||
| 21 | |||
| 30 | |||
| 52 | |||
| 57 | |||
| 58 | |||
| 59 | |||
| 59 | |||
| 59 | |||
| 59 | |||
| 59 | |||
| 60 | |||
| 60 | |||
| 60 | |||
| 62 | |||
| 62 | |||
| 63 | |||
| 63 | |||
| 63 | |||
| 63 | |||
3
| 63 | |||
| 63 | |||
| 63 | |||
| 64 | |||
| 64 | |||
| 64 | |||
| 64 | |||
| 64 | |||
| 65 | |||
| 68 | |||
| 68 | |||
| 68 | |||
| 69 | |||
| 69 | |||
| 74 | |||
| 74 | |||
| 74 | |||
| 74 | |||
| 74 | |||
| 75 | |||
| 75 | |||
| 75 | |||
| 76 | |||
| 76 | |||
| 76 | |||
| 77 | |||
| 79 | |||
| 80 | |||
| 80 | |||
| 80 | |||
| 80 | |||
| 81 | |||
| 81 | |||
| 81 | |||
| 81 | |||
| 83 | |||
| 83 | |||
| 84 | |||
| 84 | |||
| 84 | |||
Introduction
Audited financial information presented in this Annual Report on Form 20-F is for the 12-month periodyear ended October 31, 20192021 and the comparative 18-month periodyears ended October 31, 20182020 and the 12-month period ended April 30, 2017.2019.
The Securities and Exchange Commission, or the SEC, encourages companies to disclose forward-looking information so that investors can better understand a company’s future prospects and make informed investment decisions. Except for the historical information contained in this Annual Report on Form 20-F, the statements contained in this annual reportAnnual Report on Form 20-F are “forward-looking statements”, which reflect our current view with respect to future events and financial results.
These risks include, but are not limited to, risks and uncertainties regarding:
our ability to develop products and services that satisfy the needs of our customers;
the effectiveness of our sales force and distribution channels;
competition or changes in growth rates in the markets in which we operate;
our ability to attract and retain sufficiently qualified management and key employees;
the ongoing integration of HPE Software business into the Company, which may impede the ability of the Enlarged Group to obtain the same types and levels of benefits, services and resources that have historically been provided to HPE Software business by HPE, which could lead to a failure to realize the anticipated benefits of the merger;
our ability to identify, manage, complete and integrate acquisitions, divestitures and other significant transactions successfully;
the availability, integrity and security of our IT systems;
our ability to comply with national and regional laws and regulations, including those that relate to ESG matters (such as the Task Force on Climate-related Financial Disclosure (“TCFD”) requirements) across the various jurisdictions in which the Group operates;
our dependence on intellectual property, our ability to protect intellectual property and third-party claims of infringement on intellectual property;
our ability to comply with the covenants under our Credit Facilities (see note 18 “Borrowings” of the Consolidated financial statements in Item 18);
restrictions on our ability to secure additional financing or refinance our existing financing;
our exposure to fluctuations in currency exchange rates and interest rates, which could affect our variable rate indebtedness;
the possibility of being required, in certain circumstances, to make tax indemnification payments to the former owner of the HPE Software business;
the impact of future changes to, or interpretations of, US and non-US tax laws;
Our exposure to prevailing macro-economic trends, including inflation;
Our exposure to prevailing macro economic trends;
our ability to protect the personal information of our customers;
our ability to discover and address any material weaknesses or deficiencies in the Group’s internal controls over financial reporting;
a cybersecurity attack or breach, or cybersecurity vulnerabilities in our products, infrastructure, or services, or economic espionage could result in significant legal and
our ability to manage the risks involved in the foregoing.
In light of these assumptions, risks and uncertainties, the results and events discussed in the forward-looking statements contained in this annual reportAnnual Report on Form 20-F might not occur. Investors are cautioned not to place undue reliance on the forward-looking statements, which speak only as of the date of this annual report.Annual Report on Form 20-F. We are not under any obligation, and we expressly disclaim any obligation, to update or alter any forward- looking statements, whether as a result of new information, future events or otherwise. All subsequent forward-looking statements attributable to us or to any person acting on our behalf are expressly qualified in their entirety by the cautionary statements contained or referred to in this document.
6
PART I
| Not applicable. |
Not applicable.
12 months ended October 31, 2019 | 18 months ended October 31, 20181 | 12 months ended April 30, 2017 | 12 months ended April 30, 2016 | 12 months ended April 30, 2015 | ||||||||||||||||
| $m | $m | $m | $m | $m | ||||||||||||||||
| Revenue | 3,348.4 | 4,754.4 | 1,077.3 | 991.2 | 733.4 | |||||||||||||||
| Cost of sales | (789.9 | ) | (1,302.7 | ) | (216.4 | ) | (202.5 | ) | (83.3 | ) | ||||||||||
| Gross Profit | 2,558.5 | 3,451.7 | 860.9 | 788.7 | 650.1 | |||||||||||||||
| Selling and distribution costs | (1,224.8 | ) | (1,764.2 | ) | (363.1 | ) | (312.6 | ) | (252.4 | ) | ||||||||||
| Research and development expenses | (491.2 | ) | (680.8 | ) | (122.8 | ) | (117.4 | ) | (141.9 | ) | ||||||||||
| Administrative expenses | (620.8 | ) | (629.9 | ) | (147.6 | ) | (111.5 | ) | (119.2 | ) | ||||||||||
| Operating profit | 221.7 | 376.8 | 227.4 | 247.2 | 136.6 | |||||||||||||||
| Finance costs | (282.4 | ) | (350.4 | ) | (96.8 | ) | (98.4 | ) | (56.2 | ) | ||||||||||
| Finance income | (26.6 | ) | 7.7 | 1.0 | 1.0 | 1.2 | ||||||||||||||
| (Loss)/profit before tax | (34.1 | ) | 34.1 | 131.6 | 149.8 | 81.6 | ||||||||||||||
| Taxation | 16.0 | 673.1 | (7.5 | ) | (13.9 | ) | 14.3 | |||||||||||||
| (Loss)/profit from continuing operations | (18.1 | ) | 707.2 | 124.1 | 135.9 | 95.9 | ||||||||||||||
| Profit from discontinued operation (attributable to equity shareholders of the Company) | 1,487.2 | 76.9 | 33.7 | 27.0 | 5.5 | |||||||||||||||
| Profit after tax | 1,469.1 | 784.1 | 157.8 | 162.9 | 101.4 | |||||||||||||||
| Other comprehensive (expense)/income | (306.0 | ) | 29.3 | (5.7 | ) | 0.6 | (11.3 | ) | ||||||||||||
| Total comprehensive income for the period | 1,163.1 | 813.4 | 152.1 | 163.5 | 90.1 | |||||||||||||||
| Attributable to: | ||||||||||||||||||||
| Equity shareholders of the Company | 1,162.8 | 813.3 | 152.2 | 163.4 | 90.4 | |||||||||||||||
| Non-controlling interest | 0.3 | 0.1 | (0.1 | ) | 0.1 | (0.3 | ) | |||||||||||||
| Total comprehensive income for the period | 1,163.1 | 813.4 | 152.1 | 163.5 | 90.1 | |||||||||||||||
| Continuing and Discontinued Operations | ||||||||||||||||||||
| Earnings per share | ||||||||||||||||||||
| Basic (cents) | 388.50 | 201.70 | 68.88 | 74.50 | 58.54 | |||||||||||||||
| Diluted (cents) | 384.35 | 196.17 | 66.51 | 71.61 | 56.71 | |||||||||||||||
| Continuing Operations | ||||||||||||||||||||
| Earnings per share | ||||||||||||||||||||
| Basic (cents) | (4.87 | ) | 181.91 | 54.17 | 62.40 | 55.36 | ||||||||||||||
| Diluted (cents) | (4.87 | ) | 176.92 | 52.31 | 59.97 | 53.64 | ||||||||||||||
October 31, 2019 | October 31, 2018 | April 30, 2017 | April 30, 2016 | April 30, 2015 | ||||||||||||||||
$m | $m | $m | $m | $m | ||||||||||||||||
Non-current assets | 12,846.7 | 13,720.5 | 3,995.5 | 3,482.6 | 3,629.7 | |||||||||||||||
Current assets | 1,448.1 | 1,917.6 | 442.2 | 954.4 | 460.9 | |||||||||||||||
Current assets classified as held for sale | - | 1,142.5 | - | - | - | |||||||||||||||
| Total assets | 14,294.8 | 16,780.6 | 4,437.7 | 4,437.0 | 4,090.6 | |||||||||||||||
Current liabilities | 1,802.0 | 2,010.4 | 944.7 | 1,061.8 | 988.0 | |||||||||||||||
Current liabilities classified as held for sale | - | 437.7 | - | - | - | |||||||||||||||
Non-current liabilities | 6,216.5 | 6,540.5 | 1,879.5 | 1,781.4 | 1,824.6 | |||||||||||||||
| Total liabilities | 8,018.5 | 8,988.6 | 2,824.2 | 2,843.2 | 2,812.6 | |||||||||||||||
| Net Assets/(Liabilities) | 6,276.3 | 7,792.0 | 1,613.5 | 1,593.8 | 1,278.0 | |||||||||||||||
Share Capital | 47.2 | 65.8 | 39.7 | 39.6 | 39.6 | |||||||||||||||
Number of shares | 363,583,328 | 436,800,513 | 229,674,479 | 228,706,210 | 228,587,397 | |||||||||||||||
12 months ended October 31, 2019 | 18 months ended October 31, 2019 | 12 months ended April 30, 2017 | 12 months ended April 30, 2016 | 12 months ended April 30, 2015 | ||||||||||||||||
Interim dividend 1 | 58.33 | 34.60 | 29.73 | 16.94 | 15.40 | |||||||||||||||
Interim dividend 2 | - | 58.33 | - | - | - | |||||||||||||||
Final dividend | 58.33 | 58.33 | 58.33 | 49.74 | 33.00 | |||||||||||||||
Dividend declared per share (cents) | 116.66 | 151.26 | 88.06 | 66.68 | 48.40 | |||||||||||||||
Not applicable.
Not applicable.
There are risks associated with owning Micro Focus ADSs. In addition to the other information included elsewhere in this Annual Report on Form 20-F, including in the section entitled ‘‘Cautionary Statement on Forward-Looking Statements,’’ you should carefully consider the following discussion of what we believe to be the most important risk factors.factors applicable to the Group. The risks and uncertainties described below are not the only risks and uncertainties that the Enlarged Group and holders of Micro Focus ADSs may face. AdditionalIn addition, it is not possible to predict or identify all such factors and additional risks and uncertainties not presently known to the Company, or that the Company currently considers immaterial, which could also negativelymaterially adversely affect the business, results of operation, financial condition and prospects of the Enlarged Group, as well as the value of Micro Focus ADSs.
The order in which the following risk factors are presented does not necessarily reflect the likelihood of their occurrence or the relative magnitude of their potential material adverse effect on the business, financial condition, results of operation or prospects of the Enlarged Group or the market price of the Micro Focus Shares or Micro Focus ADSs.
The information given is as of the date of this information statement/prospectus,Annual Report on Form 20-F, and any forward-looking statements are made subject to the reservations specified under the section entitled ‘‘Cautionary Statement on Forward-Looking Statements”.
Principal risks and uncertainties
In common with all businesses, the Group could be affected by risks and uncertainties that may have a material adverse effect on its business operations and achieving its strategic objectives including its business model, future performance, solvency, liquidity and/or reputation. This includes any new, emerging or continuing direct or indirect risks posed by COVID-19. These risks could cause actual results to differ materially from forecasts or historic results. Accepting that risk is an inherent part of doing business, the Boardboard is mindful of the interdependencies of some risks. Where possible, the Group seeks to mitigate risks through its RMF, (“Risk Management Framework”), internal controls and insurance, but this can only provide reasonable assurance and not absolute assurance against material losses. In particular, insurance policies may not fully cover all of the consequences of any event, including damage to persons or property, business interruptions, failure of counterparties to conform to the terms of an agreement or other liabilities. The following are the principal risks and uncertainties, and potential impacts and mitigations that are relevant to the Group as a provider of software products and associated services at this time. They do not comprise all of the risks associated with the Group and are not set out in priority order. Additional risks not presently known to management, or currently deemed to be less material, may also have an adverse effect on the Group.
Products | ||
Principal To remain successful, the Group must ensure that its products continue to meet the requirements of customers and investment must be effectively balanced between growth and mature products. Investment in research and innovation in product development is essential to meet customer and partner requirements in order to maximize customer value, revenues and corporate performance. The Group has a large number of products, at differing stages of their | ||
Potential If products do not meet the requirements of customers, they will seek alternative solutions, resulting in the loss of existing maintenance and new revenue opportunities and the cancellation of existing contracts. Insufficient focus on key research and development projects may damage the |
Sales / Go-To-Market (“GTM”) | ||
Principal risk description For the Group to succeed in meeting sales revenue and growth targets, it requires successful GTM models across the full | ||
Potential impact Poor design and/or execution of GTM plans may limit the success of the Group by targeting the wrong customers through the wrong channels and positioning the wrong product or solution offerings, reducing the value that customers receive from Micro Focus. |
Competition | ||
Principal risk description Comprehensive information about the markets in which Micro Focus operates is required for the Group to assess competitive risks effectively and to perform successfully. The Group operates in a number of competitive markets and success in those markets depends on a variety of factors. | ||
Potential impact Failure to understand the competitive landscape adequately and thereby identify where competitive threats exist may damage the successful sales of the Group’s products. If the Group is not able to compete effectively against its competitors, it is likely to lose customers and suffer a decrease in sales, which may result in lost market share and weaker financial performance. |
Employees and culture | ||
Principal risk description The | ||
Potential impact Failure to |
IT | ||
Principal risk description The Group’s operations, as with most businesses, are dependent on maintaining and protecting the integrity and security of the IT systems and management of information. | ||
Potential impact Disruption to the IT systems could adversely affect business and Group operations in a variety of ways, which may result in an adverse impact on business operations, revenues, customer relations, supplier relations, and reputational damage. Dependency on IT providers could have an adverse impact on revenue and compliance in the event that they cannot resume business operations. |
Business strategy and change management | |
Principal risk description The Group is engaged in a number of major change projects, including acquisitions and divestments, to shape and grow the business by strengthening the portfolio of products and capabilities and IT projects to standardize systems and processes. The Group is also executing a series of operational transformation initiatives. These projects expose the Group to significant transformation risks. The Group’s strategy may involve the making of further acquisitions or divestments to protect or enhance its competitive position and failure to identify, manage, complete and integrate acquisitions, divestments and other significant transactions successfully could have a material adverse effect on the Group’s business. | |
Potential impact Failure to successfully analyze, execute and coordinate the implementation and delivery of the core systems and associated business processes with the various integration, divestment and transformation programs may result in the disruption of the on-going business without delivering the anticipated strategic and operational benefits of such transactions and/or initiatives. In addition, this may affect the ability to execute strategic plans for growth. |
Legal and | ||
Principal risk description The Group operates across a number of jurisdictions and two regulated exchanges. Compliance with national and regional laws and regulations, including those that relate to ESG matters, such as Task Force on Climate-related Disclosure (“TCFD”) requirements, is essential to successful business operations. The Group may be involved in legal and other proceedings from time to time, and as a result may face damage to its reputation or legal liability. The Group has entered into various acquisitions and | ||
Potential impact Failure to comply could result in civil or criminal sanctions |
Intellectual | ||
Principal risk description The Group is dependent upon its | ||
Potential |
Treasury | ||
Principal risk description The The Group targets a Net The 1 Net Debt is defined as cash and cash equivalents less borrowings and 2 Adjusted EBITDA is defined as net earnings before finance costs, finance income, taxation, share of results of associates, depreciation of property, plant and equipment, depreciation of right-of-use assets, amortization of intangible assets, exceptional items including the gain on disposal of discontinued operation, share-based compensation, product development intangible costs capitalized and foreign exchange (gains)/losses. | ||
Potential | The relative values of currencies can fluctuate and may have a significant impact on business results. |
Tax | ||
Principal risk description The tax treatment of the Group’s operations is subject to the risk of challenge by tax authorities in all territories in which it operates. Cross-border transactions may be challenged under tax rules and initiatives targeting multinationals’ tax International tax rules continue to develop at each of the As a result of the HPE Software business | ||
Potential impact Tax liabilities in |
Principal risk description The Group’s businesses may be subject to inherent risks arising from the general and sector specific economic, public health, pandemics and political conditions, including as a result of any pandemics or natural disasters, in one or more of the markets in which the Group | ||
Potential Impact Adverse economic conditions could affect sales, and other external economic or political matters, such as price controls, could affect the business and revenues. |
COVID-19 | |
Principal risk description The Group, like all businesses continues to navigate through a period of disruption, as it has responded to the practical and macro-economic impacts of COVID-19. COVID-19 still presents fast moving, and in some areas unpredictable, direct and indirect risks to the Group’s businesses. The Group may be subject to inherent risks arising from the continuation of the on-going COVID-19 pandemic, including the emergence of virus variants. | |
Potential impact Adverse economic conditions arising as a result of the continuation of the COVID-19 pandemic could affect sales performance and business operations. |
| Cyber | security | |
Principal risk description There could be a data security breach (Micro Focus data or customer data) involving personal, commercial or product data, either directly from Micro Focus or a third party. This could occur as a result of a malicious or criminal act, or an inadvertent system error. | ||
Potential impact Data loss, which could harm client and customer relationships, compliance and/or perception of the effectiveness of the Group’s products. |
Internal | ||
Principal risk description Internal controls over financial reporting may not prevent or detect an error, fraud, financial misstatement or other financial loss, leading to a material misstatement in the Group’s financial statements. | ||
Potential impact Failure to discover and address any material weaknesses or deficiencies in the Group’s internal controls over financial reporting could result in material misstatement in the Group’s financial statements and impair the Group’s ability to comply with applicable financial reporting requirements and related regulatory filings on a timely basis. Based on the assessment as at October 31, |
Overview
Micro Focus International plc (“Micro Focus”) is a global enterprise software business delivering value to approximately 40,000tens of thousands of customers. Micro Focus helps organizations run and transform their business. Driven by customer-centric innovation, Micro Focus software provides the critical tools customers need to build, operate, secure and analyze the enterprise. Micro Focus delivered revenues of $3,348.4m and profit for the period of $1,469.1m for the 12 months ended October 31, 2019.
The Company is subject to the information requirements of the US Securities Exchange Act of 1934 applicable to foreign private issuers. In accordance with these requirements, the company files its Annual Report on Form 20-F and other documents with the SEC. The Company’s SEC filings are available to the public at the SEC’s website, www.sec.gov.
Access comprehensive information about the Company and download shareholder publications at the corporate website; visit the Investor Relations section for the latest company news, dividend and share price data.
Our website – www.microfocus.com
The Micro Focus Group, headquartered in Newbury, U.K., is a global enterprise software company supporting the technology needs and challenges of the Global 2000.company. The registered office of the Company is The Lawn, 22-30 Old Bath Road, Newbury, Berkshire, RG14 1QN, United Kingdom (Tel: +44 (0) 1635 565200). Its solutions help organizations leverage existing IT investments, enterprise applications and emerging technologies to address complex, rapidly evolving business requirements while protecting corporate information at all times.
Micro Focus was founded in 1976 and in 1981 it became the first company to win the Queen’s Award for Industry purely for developing a software product. The product was CIS COBOL, a standard-compliant COBOL implementation for microcomputers. Micro Focus’ COBOL products remain important components of theThe Micro Focus Product Portfolio which now extends to more thanalmost 300 products.
Micro Focus International plc is listed on the London Stock Exchange and is a member of the FTSE 250 index. The Company’s American Depositary Shares (the “ADSs”) are listed on the New York Stock Exchange.
As of February 19, 202024, 2022 (the latest practicable date prior to the date of this Annual Report on Form 20-F), Micro Focus had a market capitalization of £2.67£1.3 billion ($3.451.7 billion).
Micro Focus has more than 40 years of experience in delivering proven, scalable and robust solutions.
Acquisitions and Investments
This annual reportAnnual Report covers the 12-monthsyear ended October 31, 20192021 with the comparative periods being the 18-monthsyears ended October 31, 2018,2020 and 12-months ended April 30, 2017.2019.
Who we are
We supply sector-agnostic products across multiple markets that are focused on digital transformation. We have tens of thousands of customers, including many of the largest companies in the world.
Our broad set of technology needsfor security, IT operations, application delivery, governance, modernization, and analytics provides the innovative solutions that the world’s largest organizations need to run and transform concurrently.
Helping customers run and transform
To deliver on the promise of digital transformation customers need to balance the often conflicting challenges of 40,000running and transforming their businesses simultaneously.
This requires finding the right balance between cost, risk, and agility. We help them do that by focusing on four key outcomes which customers are striving to achieve: accelerate application delivery, simplify IT transformation, strengthen Cyber reslilence and analyze data in time to act.
Combining decades of technical expertise with a unique approach to innovation we create new and better solutions to help our customers thrive with ever-evolving technologies.
Our portfolio and product groups
Micro Focus has a broad and diverse portfolio of products which are organized into five product groups with each group containing multiple products that operate at the varying stages of the continuum from small and medium size enterprisesstable/declining (0% or less growth) to many in the Forbes Global 2000. The Group’shigh growth (11 to 20% growth).
Application Modernization & Connectivity (“AMC”)
AMC solutions help organizations leverage existingcustomers unlock the value from core business applications through the provision of innovative solution for modernization which enable a transformational journey to deliver ongoing value and greater flexibility from longstanding IT investments, enterpriseon or off the mainframe.
Application Delivery Management (“ADM”)
ADM solutions help customers increase velocity, remove bottlenecks and deliver high-performing applications to better support their digital business. Combined, these solutions increase stakeholder alignment and the delivery of value, while liberating resources to release faster without compromising quality.
IT Operations Management (“ITOM”)
ITOM Solutions simplify the complexity of IT operations. Powered by built-in analytics, they help business users easily engage with IT through Enterprise Service Management, deliver Full-Stack AIOps for service assurance, automate the service fulfilment life cycle, and strengthen IT service governance.
CyberRes (previously Security)
Comprehensive security solutions help enterprises create cyber resilience through detecting threats, securing data and applications, and emerging technologiesprotecting identities – enabling customers to address complex, rapidly evolving business requirements, includingadapt and evolve for the protection of corporate information at all times.future. Artificial Intelligence, machine learning and behavioral analytics capabilities enable this to be done and enterprise scale.
IM&G solutions help customers analyze, understand, and control data – to derive value and manage enterprise risk. Efficient compliance, governance, customer behavior, and IOT analytics are representative use cases.
During the 12-monthsyear ended October 31, 2019. The prior period was 18-month ended October 31, 2018 as a result of moving our year-end from the end of April to the end of October.
Micro Focus Product Portfolio, – The Micro Focus and does not include SUSE.
Product Portfolio segment contains both mature softwaredevelopments
In the year ended October 31, 2021 we have delivered significant new innovation through Licence, SaaS and subscription offerings to enable customers to consume it more effectively and quickly.
Key examples of progress include: the removal of dependencies on third-party products embedded in the core of some of our key solutions, the delivery of comprehensive artificial intelligence, machine learning and high growthanalytics capabilities in every portfolio, and the work to rearchitect many of our products to support new cloud and hybrid deployment options. Within each portfolio we have introduced new SaaS offerings, that are managed on aimproved the existing SaaS offerings and invested significantly in our SaaS delivery infrastructure.
Overall, we exited the year with improved competitive positioning, with highlights by portfolio basis akin to a “fund of funds” investment portfolio. This portfolio is managed within a single Group – with five sub-portfolios based on industrial logic and management of the Micro Focus sub-portfolios: Application Modernization & Connectivity, Application Delivery Management, IT Operations Management, Security and Information Management & Governance. The software is sold and supported through a geographic Go-to-Market organization.including:
| - | IMG: new unified SaaS offering, Vertica Accelerator, delivers high performance and scalable analytics as well as end-to-end, in-database machine learning. |
| - | ITOM: released OPTIC (Operations Platform for Transformation, Intelligence and Cloud), empowering IT operations with built-in, unlimited-use intelligence at the core and the ability to optimize the cloud. Additionally, revitalized roadmaps to focus on the delivery of artificial intelligence and SaaS capabilities. |
| - | ADM: delivered material improvements to our SaaS offerings, launching a number of native cloud solutions; |
| - | AMC: made continued progress with our AWS relationship and are a strategic partner enabling their new AWS Mainframe Modernization service. |
| - | CyberRes: in data security integration with Amazon Macie provides a new and unique solution to allow AWS customers to automate data-centric protection onto data discovery, classification, and remediation processes. New SaaS capabilities in Identity Management enable customers to exploit new use cases and advanced analytics enable threat detection and remediation at scale with ArcSight. |
Item 4.B.2 Principal markets
Details of the principal markets in which the Group operates including a breakdown of revenue by activity and geographic market is disclosed in note 2 “Supplementary Information” of the Consolidated financial statements in Item 18.
Our markets
Today’s technology landscape
Digital transformation has been at the top of virtually every organization’s list of objectives for several years. Often, it represents a foundational program of technology change to underpin a significant business change.
Leveraging enterprise technology to embrace organizational change is not a new phenomenon. However, few will argue that the recent past has been a uniquely difficult period. Significant changes to customer behavior, staff locations, supply chains, technology strategies, and market trends have introduced tremendously diverse, time-critical requirements on the IT organization. Many consider the last two years to be the most dramatic chapter yet in the digital transformation era.
Change often necessitates investment. Rather than tapering off after enterprises reacted to the challenges presented by the pandemic, spending on solutions in the digital transformation space is expected to continue to increase at a solid pace. “From 2021 through 2024, IDC forecasts $7.8 trillion of direct digital transformation (DX) investments across services, hardware, and software; growing at a 16.4% compound annual growth rate (“CAGR”) vs (0.1%) CAGR reduction for non-DX investments over the same timeframe,” according to Shawn Fitzgerald, Research Director, Worldwide Digital Transformation Strategies.
Major investment in change also carries significant business risk. It is difficult to switch from what’s tried-and-true to new technology when it could significantly disrupt the flow of everyday business. Still, organizations need a way to enhance the customer experience, accelerate new business models, and foster rapid growth. They just want certainty before they press the “go” button.
In the end, IT leaders must find a strategy that allows them to continue to invest in digital transformation, while still protect existing operations that are already under significant strain. Enterprises need to be in it for now and for the future. A successful transformation strategy is more imperative than ever before.
This is our customers’ digital dilemma – how to run and transform their business at the same time so they can achieve the critical elements of a successful digital transformation program. Micro Focus helps organizations simultaneously manage both the existing operational landscape, and emerging technology and innovation requirements of the future.
Digital transformation
Digital transformation touches virtually every corner of the organization, and technology priorities often vary among numerous stakeholders. We find there are four key outcomes that our customers demand.
Accelerate Application Delivery
Customers can employ Agile and DevOps practices supported by value stream management capabilities to sustain delivery velocity requirements as operations run.
At the same time, they can create digital value – from strategy through release – as they transform using AI and machine learning to deliver high-quality applications at scale.
Simplify IT Transformation
Customers can simplify the complexity of running a mix of traditional and cloud services by taking a Digital Factory approach to running today.
With a unified platform for IT operations, they can integrate or replace incompatible tools collected over decades – freeing up resources and accelerating transformation.
Strengthen Cyber Resilience
Customers can protect what matters most by detecting threat actors, responding to advanced threats, and recovering from an attack, as their operations run today.
Then they can evolve at the speed of change using security analytics for hybrid environments to help their organization transform.
Analyze Data in Time to Act
Customers can unify their analytics today, without moving their data to one place so they can run their analytics practice more efficiently.
As they transform their organization to grow, they can ensure they’re able to support more users and greater data volumes with the highest performance at scale for accurate and actionable predictive insights.
| Item 4.B.3 | Seasonality |
Micro Focus’ quarterly revenues have historically been affected by a variety of seasonal factors typical of the seasonality of an enterprise software business with a licenselicence fee model and the industry in which it operates.
The operating margins of its businessesthe Group are generally affected by seasonal factors in a similar manner because its base ofthe Group has largely fixed costs remainswhich remain consistent throughout the year. Micro Focus believes that this trend will continue in the future and that its total revenue will continue to peak in the fourth fiscal quarter of each year. In aligning the financial year end of the Enlarged Group to October 31 following Closing in the prior year, Micro Focus the fourth quarter license fee peak moved from April 30, 2018 to October 31, 2018. Maintenance and subscription fee renewals are spread throughout the financial year, however, there is a seasonal peak in the quarter ending January 31 as a result of the calendar year end, which coincides with the financial year-end of a large number of other companies.
Item 4.B.4 |
Not applicable
Item 4.B.5
Go-To-Market
We have restructured our Go-to-Market teams, moving from three distinct geographic organizations to enable better clarity and provide the necessary context, a summary of the key issues, the progress made within this reporting period and the outcome of the review is set out below.
Whilst further improvements are anticipatedrequired to drive operational improvementsachieve the levels of productivity and efficiencies.effectiveness we believe possible, the foundations are now in place to support delivery of this goal.
Our global network of more than 7,500 authorized partners is to ensure customers fully understand our product strategy and are able to deploy our latest technology releases successfully.
When you consider all of the key SaaS offerings were not engineered correctly to create a profitablepeople, processes, and sustainable source of incremental revenue.
Most of all, our partners inspire confidence and trust in Micro Focus products and services. Our partners have the expertise our customers need to solve their digital dilemmas – running their businesses while also protecting the investments they have already madetoday and transforming them for tomorrow’s opportunities.
Product groups
Our product groups operate in our offerings. In addition, the Group delivers solutions that are openhighly competitive markets with often specific challenges and integrated,opportunities. By moving to this product group operating model (see Item 5.D) we aim to enable more agility and help bridge existingeffective execution within each product group in responding to these challenges and emerging technologies. This combination allows customers to build an eco-system that serves their long-term needs and ultimately achieve lasting success in an ever-evolving marketplace.opportunities.
During the year ended October 31, 2021 we made good progress in repositioning our product portfolio and changing our Go-to-Market approach (see above); the next phase is to evolve our business model to be much more product portfolio-centric end-to-end.
The aim over the next two years is to align the Group evaluates its options within eachby product portfolio, against a set of characteristics mapped to each stage of the adoption cycle, as represented in the table below.
Item 4.B.6 |
With nearly 40% of our employee base dedicated to R&D, we were able to integrate the latest technology into more than 1,000 product releases in the year ended October 31, 2021. Details of the Groups key financial contracts are included in Items 5.B and 10.C.
Item 4.B.7
Not applicable
Item 4.B.8
Not applicable
A full list of the Group’s subsidiaries can be found in Exhibit 8.1note 34 “Related undertakings” of the Consolidated financial statements in Item 19.18.
The Group owns or leases various offices under non-cancellable operating lease agreements. Thea large number of properties, owned or leased and operated by the Group’s subsidiaries are maintained in good condition and are believed to be suitable and adequate for the Group’s present needs.over 40 countries worldwide. The Group’s headquarters are located at premises in Newbury, England.England and are owned by the Group. The Group owns or leases properties amounting to over 2.4 million square feet of space, in over 40 countries worldwide. Twohas two individual leased properties which are material to the Group. One is located in Provo, Utah, where the Group currently leases approximately 405,700 square feet of office space. The lease onGroup has recently concluded negotiations with the landlord for this facility for which the lease was set to end in 2024 to extend the lease term with a reduction in floor space in stages. In February 2022 an initial reduction to approximately 239,100 square feet, then from June 2024 to approximately 219,900 square feet with a further reduction in floor space from December 2024 to approximately 142,300 square feet. This new lease agreement expires in 2024,2034, with an option to extend for a further three, 5-yearfive-year periods. The Group’s current annual rent under this lease is $8.2 million.$8.7 million (2020: $8.4 million) and this will reduce as the floor space reduces to $5.3 million per annum in February 2022 and $3.6 million per annum from December 2024. Since March 1, 2019, part of the property has been sublet. Current annual sub-lease income is $1.0 million.$1.1 million (2020: $1.1 million). The othersecond property is located in Santa Clara, California, where the Group currently leases approximately 635,000 square feet of office space. The lease on this facility expires in 2029, with an option to extend for one further 5-yearfive-year period. The Group’s current annual rent under this lease is $4.6 million.$4.9 million (2020: $4.7 million). The Group is currently not utilizing one and a half floors of this facility and the related right-of-use assets has been tested for impairment with a partial impairment recorded.
“Property, plant and equipment” in note 12 of the “Notes to the consolidatedConsolidated financial statements”statements in Item 18;
“Operating lease commitments – minimum lease payments”Leases” in note 3419 of the “Notes to the consolidatedConsolidated financial statements”statements in Item 18.
As a result of the disposal of the Digital Safe business which completed on January 31, 2022 leases with right-of-use assets of $27 million will be sub leased to Smarsh Inc. from January 31, 2022.
There are no unresolved written comments from the SEC staff regarding its periodic reports under the Exchange Act received more than 180 days before October 31, 2019.2021.
The following discussion and analysis is intended to provide investors with an understanding of the historical performance of the Company and its financial condition. This discussion and analysis presents the factors that had a material effect on the results of operations of Micro Focusthe Group for:
the 12 month periodyear ended October 31, 2019,2021, as compared to the 18 month periodyear ended October 31, 2018;2020, and
the 18 month periodyear ended October 31, 2018,2020, as compared to the 12 month periodyear ended April 30, 2017.
The following discussion and analysis contains forward-looking statements. See “Risk Factors” in Item 3D on page 7 and “Cautionary Statement on Forward-Looking Statements”Statements’’ on page 5 in this Annual Report on Form 20-F for a discussion of the uncertainties, risks and assumptions associated with these statements. The following should be read in conjunction with the Group’s consolidatedConsolidated financial statements and the notes thereto included in Item 18.
Business Overview
This Annual Report covers the year ended October 31, 2021 with the comparative periods being the years ended October 31, 2020 and 2019.
The following discussion and analysis contains forward-looking statements. See “Cautionary Statement on Forward-Looking Statements’’ on page 5 and “Risk Factors”discussions for the year ended October 31, 2020 as compared to the year ended October 31, 2019 can be found in Item 3D on pages 10 to 15 in thisItems 5.A of the Group’s Annual Report on Form 20-F for a discussion of the uncertainties, risks and assumptions associated with these statements.
As disclosed in item 4 subsequent to October 31, 2021 on November 3, 2021 the 18 monthsGroup announced the agreement of definitive terms to sell its Archiving and Risk Management portfolio (the “Digital Safe business”) to Smarsh Inc., for a total cash consideration of $375m. During the year ended October 31, 20182021 the Digital Safe business generated revenue of $108m which are reported in the IM&G product group and 12 months ended April 30, 2017.
Results of Operations
The results of operations should be read in conjunction with the consolidatedConsolidated financial statements included under Item 18 in this Annual Report on Form 20-F. The consolidatedConsolidated financial statements have been prepared in accordance with IFRS as issued by the IASB.
All narrative within this report focuses on the continuing operations unless otherwise stated. All narrative is presented based on results using actual exchange rates unless stated. The impact of foreign currency fluctuations is shown on page 29 where revenue is presented at actual and constant currency.
The results of the discontinued operationsoperation relate to the disposal of SUSE, which was disposed in the year ended October 31, 2019, are shown as a single amount on the face of the Consolidated statement of comprehensive income in Item 18 comprising the post-tax profit or loss of the discontinued operations and the post-tax gain or loss recognized either on measurement to fair value less costs to sell or on the disposal of the discontinued operation. The Consolidated statement of cash flows has been presented in Item 18 including the discontinued operations.operation. Results and cash flows of the discontinued operation for the threetwo reported periods are shown in note 3730 “Discontinued operation and assets held for sale” of the Consolidated financial statements in Item 18.
Year ended October 31, 2021 | Year ended October 31, 2020 | Period- on- period change | Year ended October 31, 2019 | Period-on- period change | ||||||||||||||||
| Continuing operations | $m | $m | % | $m | % | |||||||||||||||
| Revenue | 2,899.9 | 3,001.0 | (3.4 | )% | 3,348.4 | (10.4 | )% | |||||||||||||
| Costs of sales | (776.3 | ) | (702.7 | ) | 10.5 | % | (789.9 | ) | (11.0 | )% | ||||||||||
| Gross profit | 2,123.6 | 2,298.3 | (7.6 | )% | 2,558.5 | (10.2 | )% | |||||||||||||
| Selling and distribution expenses | (1,344.6 | ) | (1,112.1 | ) | 20.9 | % | (1,224.8 | ) | (9.2 | )% | ||||||||||
| Research and development expenses | (521.8 | ) | (513.6 | ) | 1.6 | % | (491.2 | ) | (4.6 | )% | ||||||||||
| Administrative expenses | (522.8 | ) | (3,334.0 | ) | (84.3 | )% | (620.8 | ) | 437.0 | % | ||||||||||
| Operating (loss)/profit* | (265.6 | ) | (2,661.4 | ) | 90.0 | % | 221.7 | (1,300.5 | )% | |||||||||||
| Net finance costs | (252.2 | ) | (279.0 | ) | 9.6 | % | (255.8 | ) | (9.1 | )% | ||||||||||
| (Loss) before tax | (517.8 | ) | (2,940.4 | ) | 82.4 | % | (34.1 | ) | (8,522.9 | )% | ||||||||||
| Taxation | 82.7 | (34.2 | ) | 341.8 | % | 16.0 | (313.8 | )% | ||||||||||||
| (Loss) from continuing operations | (435.1 | ) | (2,974.6 | ) | 85.4 | % | (18.1 | ) | (16,334.3 | )% | ||||||||||
| Profit from discontinued operation | 10.7 | 5.1 | 109.8 | % | 1,487.2 | (99.7 | )% | |||||||||||||
| (Loss)/profit for the period | (424.4 | ) | (2,969.5 | ) | 85.7 | % | 1,469.1 | (302.1 | )% | |||||||||||
* Exceptional items of $247.1 million have been recorded with operating (loss)/profit in the reporting periods presented below.
12 months ended October 31, 2019 | 18 months ended October 31, 2018 | |||||||
| Continuing operations | $m | $m | ||||||
| Revenue | 3,348.4 | 4,754.4 | ||||||
Operating profit (before exceptional items) | 515.9 | 915.0 | ||||||
Exceptional items | (294.2 | ) | (538.2 | ) | ||||
| Operating profit | 221.7 | 376.8 | ||||||
Net finance costs (excluding exceptional items) | (255.8 | ) | (336.9 | ) | ||||
Exceptional finance costs | - | (5.8 | ) | |||||
| (Loss)/profit before tax | (34.1 | ) | 34.1 | |||||
Taxation | 16.0 | 673.1 | ||||||
| (Loss)/profit from continuing operations | (18.1 | ) | 707.2 | |||||
Profit from discontinued operation | 1,487.2 | 76.9 | ||||||
| Profit for the period | 1,469.1 | 784.1 | ||||||
Revenue
In the 12 monthsyear ended October 31, 2019,2021, the Group generated revenue of $3,348.4$2,899.9 million, which represents a decrease of $1,406.0$101.1 million (29.6%(3.4%) on the $4,754.4$3,001.0 million in 18 monthsyear ended October 31, 2018.2020.
12 months ended October 31, 2019 | 18 months ended October 31, 2018 | Period-on – period change | Year ended October 31, 2021 | Year ended October 31, 2020 | Period-on- period change | Year ended October 31, 2019 | Period- on – period change | |||||||||||||||||||||||||
| Continuing operations | $m | $m | % | $m | $m | % | $m | % | ||||||||||||||||||||||||
Licence | 800.0 | 1,213.7 | (34.1 | )% | 688.6 | 646.5 | 6.5 | % | 800.0 | (19.2 | )% | |||||||||||||||||||||
Maintenance | 2,057.6 | 2,861.6 | (28.1 | )% | 1,791.7 | 1,921.2 | (6.7 | )% | 2,057.6 | (6.6 | )% | |||||||||||||||||||||
SaaS & other recurring | 279.7 | 373.9 | (25.2 | )% | 239.8 | 245.5 | (2.3 | )% | 279.7 | (12.2 | )% | |||||||||||||||||||||
Consulting | 217.9 | 366.3 | (40.5 | )% | 179.8 | 188.4 | (4.6 | )% | 217.9 | (13.5 | )% | |||||||||||||||||||||
| Revenue before haircut | 3,355.2 | 4,814.5 | (30.3 | )% | 2,899.9 | 3,001.6 | (3.4 | )% | 3,355.2 | (10.5 | )% | |||||||||||||||||||||
Deferred revenue haircut | (6.8 | ) | (61.1 | ) | (88.9 | )% | - | (0.6 | ) | 100.0 | % | (6.8 | ) | 91.2 | % | |||||||||||||||||
| Total Revenue | 3,348.4 | 4,754.4 | (29.6 | )% | 2,899.9 | 3,001.0 | (3.4 | )% | 3,348.4 | (10.4 | )% | |||||||||||||||||||||
Revenue in the table above and the subsequent trends in this section are presented before the impact of the deferred revenue haircut, which represents the unwinding of a fair value adjustment to acquired deferred revenue.
Revenue by stream performance
Licence revenue decreased grew by $413.7$42.1 million (34.1%(6.5%) to $800.0$688.6 million in the 12 monthsyear ended October 31, 20192021 compared with $1,213.7$646.5 million in the 18 monthsyear ended October 31, 2018.2020.
Licence revenue, with growth of 6.5%, is underpinned by improvements in sales execution and the benefit of investments made in our portfolios as outlined in Item 4.B.
In particular (page 24):
Licence revenue in AMC increased by 12.0% in the year ended October 31, 2021. Growth in Licence revenue was underpinned by strong performance in mainframe modernization. No revenue has been recognized from the AWS contract in the year ended October 31, 2021.
Licence revenue in ADM increased by 4.0% in the year ended October 31, 2021. The licence revenue decrease primarily relatedGroup has made good progress in the repositioning of our ADM portfolio, after performance in the year ended October 31, 2021 was below expectations. This has led to the shorter period of account. In addition, underlying performance if considered on a like for like basis, would show a declinesmall increase in licence revenue in the year, continued to be impactedperiod.
Licence revenue in ITOM declined by operational issues impacting sales execution and, as such, performance volatility. In particular1.4% in the third quarteryear ended October 31, 2021. This performance reflects a moderation in the rate of revenue decline compared to the year ended October 31, 2020 but remains below our medium-term expectations for the product group.
Licence revenue in CyberRes increased by 7.3% in the year ended October 31, 2021. Investments made in this product portfolio have resulted in new offerings and significant enhancements to existing offerings yielding growth in Licence for the portfolio and growth in total revenue for two of the financialfour sub-portfolios.
Licence revenue in IM&G increased by 17.3% in the year ended 31 October 31, 2021.This increase is primarily driven by growth in Vertica, the challenging macro environment resulted in a slowdown in customer purchases. This environment improved marginally inGroup’s Big Data offering. In the fourth quarter, but short-term volatility remainsthe Group launched Vertica Accelerator which is delivered in a continued risksubscription form as a managed service. The Group has made encouraging progress with this transition to subscriptions, with both bookings and new business in future trading periods.customers up substantially year-on-year.
Maintenance revenue decreased by $804.0$129.5 million (28.1%(6.7%) to $2,057.6$1,791.7 million in the 12 monthsyear ended October 31, 20192021 compared with $2,861.6$1,921.2 million in the 18 monthsyear ended October 31, 2018.2020.
The maintenance revenue decrease primarily relateddecline in the current year is impacted by a reduction in Licence volume over multiple previous financial periods combined with elevated attrition rates in four sub-portfolios. This is a major area of management focus for, and over the past 18 months the Group has implemented material changes across these product portfolios driven by direct customer feedback and focused on improving the overall user experience. There have also been significant new capabilities introduced to the shorter period of account.expand cloud, artificial intelligence and analytics capabilities. In addition, underlying performance if considered on a like for like basis, would show a declinemultiple leadership changes have been made within underperforming portfolios and the compensation of sales leadership is now linked to customer retention. These actions were embedded in revenue infirst half of the year was impacted by one-off events such as the disposal of Atalla and moving to selling to the US Government through a strategic partner rather than direct.
The main movements at a portfolio level were (page 24):
Maintenance revenue in AMC declined by 1.8% in the year October 31, 2021. The year-on-year decline was impacted by licence performance in the year ended October 31, 2020;
Maintenance revenue in ADM declined by 7.0% in the year ended October 31, 2021. The maintenance performance in the period was driven by a weak licence performance in the year ended October 31, 2020 combined with an element of transitioning some customers to SaaS based solutions within our performance testing portfolio;
Maintenance revenue in ITOM declined by 9.2% in the year ended October 31, 2021. This performance reflects a moderation in the rate of revenue decline compared to the year ended October 31, 2020 but remains below our medium-term expectations for the product group. The improvements made to the product roadmaps and in refocusing resources are key to improving attrition in sub-portfolios which will impact overall performance if successful.
Maintenance revenue in CyberRes declined by 7.9% in the year ended 31 October 2021. This performance is driven by one single product portfolio where we witnessed elevated attrition rates. This product has had significant investment over the last 24 months resulting in material improvements to the underlying architecture and overall capabilities. It is now much better positioned competitively and we expect to drive a significant moderation in the overall rate of maintenance decline in future periods.the medium-term.
The change in product mix combined with corrective actions explained in item 4.B.5 are intended to see renewal rates consistent with historical rates.drive a moderation in the rate of maintenance decline as part of the overall revenue stabilization plans.
SaaS and other recurring revenue decreased by $94.2$5.7 million (25.2%(2.3%) to $279.7$239.8 million in the 12 monthsyear ended October 31, 20192021 compared with $373.9$245.5 million in the 18 monthsyear ended October 31, 2018.2020.
Consulting revenue decreased by $8.6 million (4.6 %) to the shorter period of account. In addition, underlying performance during the year if considered on a like for like basis, would show a decline in revenue$179.8 million in the year reflected deliberate actions taken by the Group to rationalize unprofitable operations and practices and refocus resources and investments to deliver the product enhancements required for long-term success. The resulting underlying recurring revenue decline if considered on a like for like basis was in lineended October 31, 2021 compared with the Group’s expectations during the current financial year, which will allow the Group to deliver a more sustainable expected growth in SaaS revenue at a higher profit margin in the medium-term.
The Group has more thanapproximately 300 products reported under five product groups. These productsInvestment decisions are managedmade at a granular level using applicationby product depending on their growth trajectories and the profile of markets they participate in and are intended to deliver the Micro Focus four-box model.greatest return on investment. The cyclical nature of the software order cycle means that when considering underlying revenue trends, year-on-year growth rates by portfolioproduct group are not always indicative of an underlying trend and will be impacted by the timing of customer projects. As such, revenue trends at the sub-portfolio level should be viewed over the longer term and revenue trends overall viewed in a similar fashion to that of a portfolio of funds.
The table below presents the revenue performance by product group and revenue stream. The main movements in licence and maintenance revenue by product group are discussed in the Licence and Maintenance commentary above.
| Licence | Maintenance | SaaS & other recurring | Consulting | Total | ||||||||||||||||
| Continuing operations | $m | $m | $m | $m | $m | |||||||||||||||
| AMC | 155.3 | 315.9 | - | 10.3 | 481.5 | |||||||||||||||
| ADM | 106.1 | 408.5 | 78.9 | 18.6 | 612.1 | |||||||||||||||
| ITOM | 172.7 | 507.8 | 4.3 | 106.3 | 791.1 | |||||||||||||||
| CyberRes | 174.5 | 383.9 | 36.3 | 29.1 | 623.8 | |||||||||||||||
| IM&G | 80.0 | 175.6 | 120.3 | 15.5 | 391.4 | |||||||||||||||
| Subtotal | 688.6 | 1,791.7 | 239.8 | 179.8 | 2,899.9 | |||||||||||||||
| Deferred revenue haircut | - | - | - | - | - | |||||||||||||||
| Total Revenue | 688.6 | 1,791.7 | 239.8 | 179.8 | 2,899.9 | |||||||||||||||
Licence | Maintenance | SaaS & other recurring | Consulting | Total | ||||||||||||||||
| Continuing operations | $m | $m | $m | $m | $m | |||||||||||||||
Application Modernization & Connectivity (AMC) | 170.9 | 326.1 | - | 11.7 | 508.7 | |||||||||||||||
Application Delivery Management (ADM) | 130.3 | 485.4 | 87.8 | 18.2 | 721.7 | |||||||||||||||
IT Operations Management (ITOM) | 237.5 | 645.8 | 11.0 | 127.5 | 1,021.8 | |||||||||||||||
Security | 185.7 | 416.7 | 35.0 | 43.9 | 681.3 | |||||||||||||||
Information Management & Governance (IM&G) | 75.6 | 183.6 | 145.9 | 16.6 | 421.7 | |||||||||||||||
| Subtotal | 800.0 | 2,057.6 | 279.7 | 217.9 | 3,355.2 | |||||||||||||||
Deferred revenue haircut | - | (6.0 | ) | (0.8 | ) | - | (6.8 | ) | ||||||||||||
| Total Revenue | 800.0 | 2,051.6 | 278.9 | 217.9 | 3,348.4 | |||||||||||||||
| Licence | Maintenance | SaaS & other recurring | Consulting | Total | ||||||||||||||||
| Continuing operations | $m | $m | $m | $m | $m | |||||||||||||||
| AMC | 138.6 | 321.6 | - | 10.1 | 470.3 | |||||||||||||||
| ADM | 102.0 | 439.2 | 73.9 | 15.9 | 631.0 | |||||||||||||||
| ITOM | 175.1 | 559.4 | 4.6 | 113.9 | 853.0 | |||||||||||||||
| CyberRes | 162.6 | 416.8 | 33.6 | 33.1 | 646.1 | |||||||||||||||
| IM&G | 68.2 | 184.2 | 133.4 | 15.4 | 401.2 | |||||||||||||||
| Subtotal | 646.5 | 1,921.2 | 245.5 | 188.4 | 3,001.6 | |||||||||||||||
| Deferred revenue haircut | - | (0.4 | ) | (0.2 | ) | - | (0.6 | ) | ||||||||||||
| Total Revenue | 646.5 | 1,920.8 | 245.3 | 188.4 | 3,001.0 | |||||||||||||||
Percentage change from October 31, 2020 to October 31, 2021:
| Licence | Maintenance | SaaS & other recurring | Consulting | Total | ||||||||||||||||
| Continuing operations | % | % | % | % | % | |||||||||||||||
| AMC | 12.0 | % | (1.8 | )% | - | 2.0 | % | 2.4 | % | |||||||||||
| ADM | 4.0 | % | (7.0 | )% | 6.8 | % | 17.0 | % | (3.0 | )% | ||||||||||
| ITOM | (1.4 | )% | (9.2 | )% | (6.5 | )% | (6.7 | )% | (7.3 | )% | ||||||||||
| CyberRes | 7.3 | % | (7.9 | )% | 8.0 | % | (12.1 | )% | (3.5 | )% | ||||||||||
| IM&G | 17.3 | % | (4.7 | )% | (9.8 | )% | 0.6 | % | (2.4 | )% | ||||||||||
| Subtotal | 6.5 | % | (6.7 | )% | (2.3 | )% | (4.6 | )% | (3.4 | )% | ||||||||||
| Deferred revenue haircut | - | 100 | % | 100 | % | - | 100 | % | ||||||||||||
| Total Revenue | 6.5 | % | (6.7 | )% | (2.2 | )% | (4.6 | )% | (3.4 | )% | ||||||||||
Revenue by geography
The Group is domiciled in the UK. The Group’s total segmental revenue from external customers by geographical location is detailed below:
Year ended October 31, 2021 | Year ended October 31, 2020 | Period-on- period change | Year ended October 31, 2019 | Period- on – period change | ||||||||||||||||
| $m | $m | % | $m | % | ||||||||||||||||
| UK | 160.0 | 173.0 | (7.5 | )% | 206.9 | (16.4 | )% | |||||||||||||
| USA | 1,263.0 | 1,289.8 | (2.1 | )% | 1,523.0 | (15.3 | )% | |||||||||||||
| Germany | 223.0 | 218.7 | 2.0 | % | 220.7 | (0.9 | )% | |||||||||||||
| Canada | 110.3 | 108.0 | 2.1 | % | 115.9 | (6.8 | )% | |||||||||||||
| France | 100.7 | 101.4 | (0.7 | )% | 123.3 | (17.8 | )% | |||||||||||||
| Japan | 95.6 | 96.9 | (1.3 | )% | 108.6 | (10.8 | )% | |||||||||||||
| Other | 947.3 | 1,013.2 | (6.5 | )% | 1,050.0 | (3.5 | )% | |||||||||||||
| Total Revenue | 2,899.9 | 3,001.0 | (3.4 | )% | 3,348.4 | (10.4 | )% | |||||||||||||
Operating costs
12 months ended October 31, 2019 | 18 months ended October 31, 2018 | Period-on- period change % | Year ended October 31, 2021 | Year ended October 31, 2020 | Period- on- period change | Year ended October 31, 2019 | Period- on- period change | |||||||||||||||||||||||||
| Continuing operations | $m | $m | $m | $m | % | $m | % | |||||||||||||||||||||||||
Cost of sales | 789.9 | 1,302.7 | (39.4 | )% | 776.3 | 702.7 | 10.5 | % | 789.9 | (11.0 | )% | |||||||||||||||||||||
Selling and distribution costs | 1,224.8 | 1,764.2 | (30.6 | )% | 1,344.6 | 1,112.1 | 20.9 | % | 1,224.8 | (9.2 | )% | |||||||||||||||||||||
Research and development expenses | 491.2 | 680.8 | (27.8 | )% | 521.8 | 513.6 | 1.6 | % | 491.2 | 4.6 | % | |||||||||||||||||||||
Administrative expenses | 620.8 | 629.9 | (1.4 | )% | 522.8 | 3,334.0 | (84.3 | )% | 620.8 | 437.0 | % | |||||||||||||||||||||
| Total operating costs | 3,126.7 | 4,377.6 | (28.6 | )% | 3,165.5 | 5,662.4 | (44.1 | )% | 3,126.7 | 81.1 | % | |||||||||||||||||||||
Total operating costs.
Total operating costs for the period decreased by $1,250.9$2,496.9 million, or 28.6%44.1% to $3,126.7$3,165.5 million in the 12 monthsyear ended October 31, 20192021 as compared to $4,377.6$5,662.4 million in the 18 monthsyear ended October 31, 2018.2020.
The single largest component of the operating costs relates to employee costs therefore the shorter period of accountdecrease in the current year only 12 months versus 18 monthsended October 31, 2021 compared to the results of the year ended October 31, 2020 is that the year ended October 31, 2020 included a goodwill impairment charge of $2,799.2 million compared to a charge of $nil in the prior period, means that most cost categories are significantly reduced. The narrative below explains the other key movements excluding employee costs. The exception toyear ended October 31, 2021. Excluding this is administrativecharge operating expenses increased by $302.3 million period-on-period which is discussedprimarily driven by an increase in the amortization expense in relation to the Group’s intangibles assets acquired in business combination of $282.3m resulting from a change in the assessed remaining useful economic lives in the year ended October 31, 2021. For further below.details see note 11 “Intangible assets” of the Consolidated financial statements in Item 18.
Impairment of sales. Costgoodwill is tested annually, or more frequently where there is an indication of sales decreased by $512.8 million, or 39.4%impairment. The Group has not recognized an impairment charge in the period compared to $789.9an impairment charge of $2,799.2 million in the 12 monthsyear ended October 31, 2021.
IFRS 16 “Leases”
The Group adopted IFRS 16 “Leases” on November 1, 2019 on a modified retrospective basis. As a result, the year ended October 31, 2019 continue to be reported under the previous accounting standard IAS 17 “Leases”. Under IAS 17 the cost of leasing assets depended on whether a lease was classified as an operating lease or a finance lease. For operating leases, the cost was recorded as a rental expense in operating costs and for finance leases the cost was recognized as depreciation and interest in operating costs. Under IFRS 16 all leases are treated in the manner of IAS 17 finance leases. As a result, the depreciation and interest expense for leases is significantly higher in the year ended October 31, 2021 and 2020 than in the comparative period ended October 31, 2019, with a similar reduction in rental expenses.
Cost of sales
Cost of sales increased by $73.6 million, or 10.5% to $776.3 million in the year ended October 31, 2021 as compared to $1,302.7$702.7 million in the 18 monthsyear ended October 31, 2018.2020.
The costs in this category predominantly relate to our consulting and helpline support operations amortization of product development costs and the amortization of acquired technology intangibles allintangibles.
25
The amortization of intangible purchased technology costs decreasedincreased by $80.4$67.0 million from $280.5$190.2 million in the 18 monthsyear ended October 31, 20182020 to $200.1$257.2 million in the 12 monthsyear ended October 31, 2019,2021 primarily due to the change in periodreassessment of account and the halting of amortization on SUSE related intangibles after the disposal was announced last year.useful economic lives described above.
Selling and distribution costs.
Selling and distribution costs decreased $539.4increased $232.5 million, or 30.6%20.9% to $1,224.8$1,344.6 million in the 12 monthsyear ended October 31, 20192021 as compared to $1,764.2$1,112.1 million in the 18 monthsyear ended October 31, 2018.2020.
The costs in this category predominantly relate to our salesGo-To-Market organization and the amortization of acquired trade names and amortization of acquired customer relationships all of which are directly reduced by the shorter period of account in the current period.relationships.
The amortization of intangible trade names and customer relationships costs decreasedincreased by $127.0$228.3 million from $572.7$413.9 million in the 18 monthsyear ended October 31, 20182020 to $445.7$642.2 million in the 12 monthsyear ended October 31, 2019,2021 primarily due to the change in periodreassessment of account.useful economic lives described above.
Research and development expenses.
Research and development expenses decreasedincreased by $189.6$8.2 million, or 27.8%1.6% to $491.2$521.8 million in the 12 monthsyear ended October 31, 20192021 as compared to $680.8$513.6 million in the 18 monthsyear ended October 31, 2018.2020.
Administrative expenses.
Administrative expenses decreased by $9.1$2,811.2 million, or 1.4%84.3% to $620.8$522.8 million in the 12 monthsyear ended October 31, 20192021 as compared to $629.9$3,334.0 million in the 18 monthsyear ended October 31, 2018.2020.
The amortizationprimary driver of purchased software intangibles increased by $3.4this increase is the goodwill impairment of $2,799.2 million from $30.7 millionrecorded in the 18 monthsyear ended October 31, 2018 to $34.12020 and discussed above. Excluding this, administrative expenses decreased by $12.0 million inyear on year.
Operating (loss)/profit
In the 12 monthsyear ended October 31, 2019 as the useful life of certain purchase software was revised resulting in an increased amortization charge. Share-based compensation costs increased by $4.5 million from $64.3 million in the 18 months ended October 31, 2018 to $68.8 million in the 12 months ended October 31, 2019 as a result of timing of the issue of share options under the Long-term Incentive Plan in the prior year which meant only 1 month charge was included in the prior period versus a full years charge in the current period.
In addition, the amortization of intangible assets decreasedincreased from $903.1$674.1 million in the 18 monthsyear ended October 31, 2018,2020, to $716.5$956.4 million in the 12 monthsyear ended October 31, 2019, related2021. As discussed above this relates primarily to the additional amortization in the period of technology, trade names, customer relationships established on the acquisition of Interset Software Inc and the impacta reassessment of the 18-month period of account. The reductionremaining useful economic lives for intangibles assets acquired in amortization is not just a result of the reduction in the accounting period as the majority of the amortization is on the intangibles resulting from the HPE acquisition which were only included for 14 months of the 18 month period of account compared to 12 months in the period ended October 31, 2019. The main components of this reduction are included in the discussion on cost by category above.business combinations.
Exceptional items (included within operating (loss)/profit)
Year ended October 31, 2021 | Year ended October 31, 2020 | Year ended October 31, 2019 | ||||||||||
| Exceptional items | $m | $m | $m | |||||||||
| MF/ HPE Software business integration related: | ||||||||||||
| System and IT infrastructure costs | 98.0 | 100.6 | 126.3 | |||||||||
| Integration, severance and property costs | 38.4 | 83.9 | 168.0 | |||||||||
| MF/ HPE Software business integration-related costs | 136.4 | 184.5 | 294.3 | |||||||||
| Other restructuring property costs, severance and legal, acquisition and divestiture costs | 35.3 | 27.9 | (0.1 | ) | ||||||||
| Legal settlement and associated costs | 75.4 | - | - | |||||||||
| 247.1 | 212.4 | 294.2 | ||||||||||
| Goodwill impairment | - | 2,799.2 | - | |||||||||
| Total exceptional costs (reported in Operating (loss)/profit) | 247.1 | 3,011.6 | 294.2 | |||||||||
12 months ended October 31, 2019 | 18 months ended October 31, 2018 | |||||||
| Exceptional items | $m | $m | ||||||
MF/ HPE Software business integration related: | ||||||||
System and IT infrastructure costs | 126.3 | 114.4 | ||||||
Integration costs | 119.6 | 147.6 | ||||||
Severance | 32.1 | 129.1 | ||||||
Property costs | 16.3 | 29.9 | ||||||
| MF/ HPE Software business integration related costs | 294.3 | 421.0 | ||||||
HPE Software business acquisition / pre-acquisition costs | (3.9 | ) | 70.1 | |||||
Integration in respect of previous acquisitions | - | 17.0 | ||||||
Other acquisition costs | 5.4 | - | ||||||
Property costs relating to previous acquisitions | - | 8.2 | ||||||
Divestiture gain on Atalla | (3.7 | ) | - | |||||
Severance costs relating to previous acquisitions | - | 0.6 | ||||||
Pre-disposal costs in relation to SUSE | - | 21.3 | ||||||
Other costs | 2.1 | - | ||||||
| Total exceptional costs (reported in Operating profit) | 294.2 | 538.2 | ||||||
In the 12 monthsyear ended October 31, 2019,2021, exceptional costs totaled $247.1 million and can be split into two categories. Firstly, the Group incurred $136.4m (2020: $184.5m) on integration-related costs in respect of the HPE Software business. This figure primarily relates to $294.2 million. Exceptionalthe migration of Micro Focus to one enterprise-wide platform. In total exceptional costs predominantly relateincurred in relation to the integration of the HPE Software business andsince the costsacquisition are $1,036.2m at October 31, 2021 (total cumulative cost at October 31, 2020: $899.8m). In the period, the Group incurred incremental HPE-related exceptional spend in order to accelerate the 12-month period include:
Secondly, other exceptional spend totaled $110.7m of which $715.2m has been incurred to date. The Group initially expected to incur exceptional costs in relation$75.4m relates to the HPE Software business integrationcost of $420.0m insettling the 12 months ended October 31, 2019, which compares to an actual charge of $294.3m in the financial year. This variance is driven by the phasing of integration programs.
On November 30, 2021, the Group announced the objective to remove a further c.$400 million to c.$500 million of gross annualized operating costs which is anticipated to be undertaken during the years ended October 31, 2022 and 2023. As a result of this program, exceptional spend in relation to delivering these plans are expected to total approximately $200 million over the next two financial years.
Net finance costs
Net finance costs (excluding exceptional items) were $255.8$252.2 million in the 12 monthsyear period ended October 31, 2019. The finance costs predominantly relate2021, compared to $279.0 million in the associated interest on the term loans put in place as part of the transaction to acquire the HPE Software business.year period ended October 31, 2020. Included within the $255.8 millionnet finance costs is $46.7$34.0 million in relation to the amortization of facility costs and original issue discounts, which were paid on initiation of the term loans.loan.
The declinedecrease on the prior year related to an acceleration of fees and discounts of $24.0 million resulting from refinancing completed in net finance costs (excluding exceptional items) between the periods of $81.1m, 24.1% from $336.9 million for the 18 months ended October 31, 2018 to $225.7 million for the 12 months ended October 31, 2019 reflects a $61.6 reduction in finance costs and a $19.5m increase in finance income. The reduction in finance costs primarily reflects a decrease in interest on bank borrowings of $51.1 million from $276.5 in the 18 months ended October 31, 2018 to $225.4 million in the 12 months ended October 31, 2019 as a result of the shorter accounting period. The increase in finance income primarily reflects an increase in bank interest earned of $12.7 million as a result of interest income earned on cash deposits held following the completion of the SUSE divestment until the Group returned $1.8 billion of proceeds to shareholders.that period
The Group holdholds interest rate swaps to hedge against the cash flow risk in the LIBOR rate charged on $2,250.0 million of the debt issued by Seattle Spinco, Inc. (the investment company used to acquire the software business of HPE)HPE Software business) from October 19, 2017 to September 30, 2022. Under the terms of the interest rate swaps, the Group pays a fixed rate of 1.94%1.95% and receives 1-month USDone-month US dollar LIBOR.
Taxation
The Group’sGroup reported a tax credit for the 12 monthsyear ended October 31, 2019 was a credit2021 of $16.0$82.7 million (18 months(year ended October 31, 2018:2020: charge of $34.2 million). There is no significant difference between the tax credit of $673.1 million, primarily due toin the one-off impact of USyear and the expected tax reforms).credit at the statutory rate.
(Loss)/profit after tax from continuing operations
The loss after tax from continuing operations was $18.1$435.1 million in the 12 monthsyear ended October 31, 2019,2021, compared to a profitloss after tax from continuing operations of $707.2$2,974.6 million in the 18 monthsyear ended October 31, 2018.2020.
Profit from discontinued operation
Earnings per share
The table below sets out the Earnings per Share (“EPS”). The Group is also required to present EPS for both the continuing and discontinued operations.
12 months ended October 31, 2019 | 18 months ended October 31, 2018 | Year ended October 31, 2021 | Year ended October 31, 2020 | Year ended October 31, 2019 | ||||||||||||||||||||||||||||||||||||
Basic Cents | Diluted 1 Cents | Basic Cents | Diluted Cents | Basic Cents | Diluted1 Cents | Basic Cents | Diluted 1 Cents | Basic Cents | Diluted1 Cents | |||||||||||||||||||||||||||||||
Continuing operations | (4.87 | ) | (4.87 | ) | 181.91 | 176.92 | (129.30 | ) | (129.30 | ) | (886.15 | ) | (886.15 | ) | (4.87 | ) | (4.87 | ) | ||||||||||||||||||||||
Discontinued operation | 393.37 | 389.16 | 19.79 | 19.25 | 3.18 | 3.18 | 1.52 | 1.52 | 393.37 | 389.16 | ||||||||||||||||||||||||||||||
| Total EPS | 388.50 | 384.35 | 201.70 | 196.17 | (126.12 | ) | (126.12 | ) | (884.63 | ) | (884.63 | ) | 388.50 | 384.35 | ||||||||||||||||||||||||||
1 As there is a loss from continuing operations attributable to the ordinary equity shareholders of the Company for the 12 monthsyear ended October 31, 20192021 ($18.4435.1 million) and 2020 ($2,974.6 million), the Diluted EPS is reported as equal to Basic EPS, as no account can be taken of the effect of dilutive securities under IAS 33. There was total earnings attributable to ordinary equity shareholders of
In the Company for the 12 monthsyear ended October 31, 2019 of $1,468.8 million and therefore the effect of dilutive securities can be reflected in the total Diluted EPS above.
18 months ended October 31, 2018 | 12 months ended April 30, 2017 | |||||||
| Continuing operations | $m | $m | ||||||
| Revenue | 4,754.4 | 1,077.3 | ||||||
Operating profit (before exceptional items) | 915.0 | 324.7 | ||||||
Exceptional items | (538.2 | ) | (97.3 | ) | ||||
| Operating profit | 376.8 | 227.4 | ||||||
Net finance costs (excluding exceptional items) | (336.9 | ) | (95.8 | ) | ||||
Exceptional finance costs | (5.8 | ) | - | |||||
| (Loss)/profit before tax | 34.1 | 131.6 | ||||||
Taxation | 673.1 | (7.5 | ) | |||||
| (Loss)/profit from continuing operations | 707.2 | 124.1 | ||||||
Profit from discontinued operation | 76.9 | 33.7 | ||||||
| Profit for the period | 784.1 | 157.8 | ||||||
18 months ended October 31, 2018 | 12 months ended April 30, 2017 | Period-on – period change | ||||||||||
| Continuing operations | $m | $m | % | |||||||||
Licence | 1,213.7 | 308.4 | 293.5 | % | ||||||||
Maintenance | 2,861.6 | 727.6 | 293.3 | % | ||||||||
SaaS & other recurring | 373.9 | - | n/a | |||||||||
Consulting | 366.3 | 48.2 | 660.0 | % | ||||||||
| Revenue before haircut | 4,815.5 | 1,082.2 | 344.2 | % | ||||||||
Deferred revenue haircut | (61.1 | ) | (6.9 | ) | 785.5 | % | ||||||
| Total Revenue | 4,754.4 | 1,077.3 | 341.3 | % | ||||||||
Licence | Maintenance | Consulting | SaaS & other recurring | Total | ||||||||||||||||
| Continuing operations | $m | $m | $m | $m | $m | |||||||||||||||
Application Modernization & Connectivity (AMC) | 256.3 | 497.6 | 17.9 | - | 771.8 | |||||||||||||||
Application Delivery Management (ADM) | 185.4 | 646.7 | 41.6 | 114.1 | 987.8 | |||||||||||||||
IT Operations Management (ITOM) | 363.2 | 869.9 | 192.8 | 15.1 | 1,441.0 | |||||||||||||||
Security | 291.6 | 580.2 | 81.4 | 41.6 | 994.8 | |||||||||||||||
Information Management & Governance (IM&G) | 117.2 | 267.2 | 32.6 | 203.1 | 620.1 | |||||||||||||||
| Subtotal | 1,213.7 | 2,861.6 | 366.3 | 373.9 | 4,815.5 | |||||||||||||||
Deferred revenue haircut | (7.6 | ) | (42.7 | ) | (2.0 | ) | (8.8 | ) | (61.1 | ) | ||||||||||
| Total Revenue | 1,206.1 | 2,818.9 | 364.3 | 365.1 | 4,754.4 | |||||||||||||||
18 months ended October 31, 2018 | 12 months ended April 30, 2017 | |||||||
| Continuing operations | $m | $m | ||||||
Cost of sales | 1,302.7 | 216.5 | ||||||
Selling and distribution costs | 1,764.2 | 363.1 | ||||||
Research and development expenses | 680.8 | 122.8 | ||||||
Administrative expenses | 629.9 | 147.5 | ||||||
| Total operating costs | 4,377.6 | 849.9 | ||||||
18 months ended October 31, 2018 | 12 months ended April 30, 2017 | |||||||
| Exceptional items | $m | $m | ||||||
MF/ HPE Software business integration related: | ||||||||
System and IT infrastructure costs | 114.4 | - | ||||||
Integration costs | 147.6 | - | ||||||
Severance | 129.1 | - | ||||||
Property costs | 29.9 | - | ||||||
| MF/ HPE Software business integration related costs | 421.0 | - | ||||||
SUSE and other divestiture costs | 21.3 | - | ||||||
HPE Software business acquisition / pre-acquisition costs | 70.1 | 58.0 | ||||||
Integration in respect of previous acquisitions | 17.0 | 27.7 | ||||||
Other acquisition costs | - | 2.6 | ||||||
Property costs relating to previous acquisitions | 8.2 | 5.6 | ||||||
Severance costs relating to previous acquisitions | 0.6 | 3.4 | ||||||
| Total exceptional costs (reported in Operating profit) | 538.2 | 97.3 | ||||||
18 months ended October 31, 2018 | 12 months ended April 30,2017 | |||||||||||||||
Basic Cents | Diluted Cents | Basic Cents | Diluted Cents | |||||||||||||
Continuing operations | 181.91 | 176.92 | 54.17 | 52.31 | ||||||||||||
Discontinued operation | 19.79 | 19.25 | 14.71 | 14.20 | ||||||||||||
Total EPS | 201.70 | 196.17 | 68.88 | 66.51 | ||||||||||||
Consolidated statement of financial position as at October 31, 20192021 and October 31, 20182020
Summarized Consolidated statement of financial position
The Group’s Consolidated statements of financial position are presented in the Consolidated financial statements in item 18. Summarized versions are presented below.
| October 31, 2019 | October 31, 2018 | October 31, 2021 | October 31, 2020 | |||||||||||||
| $m | $m | $m | ||||||||||||||
Non-current assets | 12,846.7 | 13,720.5 | 8,439.5 | 9,605.0 | ||||||||||||
Current assets | 1,448.1 | 1,917.6 | 1,907.1 | 1,541.8 | ||||||||||||
Current assets classified as held for sale | - | 1,142.5 | ||||||||||||||
| Total assets | 14,294.8 | 16,780.6 | 10,346.6 | 11,146.8 | ||||||||||||
Current liabilities | 1,802.0 | 2,010.4 | 1,860.9 | 1,788.3 | ||||||||||||
Current liabilities classified as held for sale | - | 437.7 | ||||||||||||||
Non-current liabilities | 6,216.5 | 6,540.5 | 5,664.7 | 6,143.4 | ||||||||||||
| Total liabilities | 8,018.5 | 8.988.6 | 7,525.6 | 7,931.7 | ||||||||||||
| Net assets | 6,276.3 | 7,792.0 | 2,821.0 | 3,215.1 | ||||||||||||
| Capital and reserves | ||||||||||||||||
Total equity attributable to owners of the parent | 6,275.0 | 7,791.0 | 2,821.0 | 3,215.1 | ||||||||||||
Non-controlling interests | 1.3 | 1.0 | ||||||||||||||
| Total equity | 6,276.3 | 7,792.0 | 2,821.0 | 3,215.1 | ||||||||||||
The discussions for the Consolidated statement of financial position as at October 31, 2020 as compared to the October 31, 2019 can be found in Items 5.A of the Group’s Annual Report on Form 20-F for the year ended October 31, 2020 which is available at https://www.microfocus.com/media/investors-report/form-20-f-for-12-months-ending-the-31-october-2020-report.pdf and has been filed with the SEC.
The net assets of the Group have decreased by $1,515.7 million from $7,792.0$3,215.1 million to $6,276.3$2,821.0 million between October 31, 20182020 and October 31, 2019.2021.
In the period,year, the key movements were as follows:
Non-current assets decreased by $873.8 million$1,165.5m to $12,846.7 million$8,439.5m primarily due to amortization ofthe annual amortisation charge on intangible assets of $716.5 million and a decrease in goodwill$956.4m. In addition, $340.9m of $160.5 million following a reviewnon-current assets were reclassified as current assets driven by the recognition of the allocation of goodwill to foreign operations (note 10 of the “Notes to the consolidated financial statements” in Item 18)
Current assets increased by $365.3 million to $1,907.1 million driven by the recognition of the Digital Safe business as held for sale $370.3 million and an increase in trade and other receivables of $154.9 million, which were offset by a reduction in cash and cash equivalents of $178.8 million. Trade and other receivables increased due to the increase in both trade receivables and contract assets resulting from the high level of Licence revenue recognised in October compared to the prior year. The decrease in cash and cash equivalents reflects the debt repayments and dividends paid in the period of $265.2 million, a decrease in trade and other receivables of $239.1 million, offset by an increase in current tax receivables of $15.6$114.1 million and an increase contract-related costs of $19.3$81.1 million.
Current liabilities increased by $72.6 million as a result of transition to IFRS 15. Trade and other receivables decreased$1,860.9 million, primarily due to a reduction of aged receivables of $100.8 million and a reduced current balance of $111.4 million. The reduction in the financial year has been a key focusrecognition of the finance team and an important part of the ongoing stabilization of theDigital Safe business and mitigation of potential risk on the balance sheet.
Total equity attributable to the owners of the parent decreased by $1,516.0$394.1 million from $7,791.0$3,215.1 million to $6,275.0 million, driven primarily by a Return$2,821.0 million.
Foreign currency fluctuations
The Group’s reporting currency is the US dollar however, the Group’s significant international operations give exposure to fluctuations in foreign exchange rates. To neutralize foreign exchange impact and to better illustrate the underlying change in results from one period to the next, the Group has adopted the practice of Value to shareholders of $1,800.0 million, dividends paid to shareholders of $439.2 million , share buy-backs from shareholders of $538.8 million, offset by $1,469.1 million of profit for the period.
analyzing results on an as reported basis and in constant currency.The Group uses US dollar based constant currency models to measure performance. These are calculated by restating the results of the Group for the comparable period at the same average exchange rates as those used in reported results for the current period. This gives a US dollar denominated income statement, which excludes any variances attributable to foreign exchange rate movements.
The table below has been presented on a constant currency basis and is for continuing operations only to show the impact of currency fluctuations on the revenue of the Group:
Year ended October 31, 2021 | Year ended October 31, 2020 | Period-on- period change constant currency | Period-on- period change actual currency | |||||||||||||
| $m | $m | % | % | |||||||||||||
| Constant currency revenue: | ||||||||||||||||
| Licence | 688.6 | 656.7 | 4.9 | % | 6.5 | % | ||||||||||
| Maintenance | 1,791.7 | 1,961.4 | (8.7 | )% | (6.7 | )% | ||||||||||
| SaaS & other recurring | 239.8 | 249.6 | (3.9 | )% | (2.3 | )% | ||||||||||
| Consulting | 179.8 | 196.3 | (8.4 | )% | (4.6 | )% | ||||||||||
| Constant currency revenue before haircut | 2,899.9 | 3,064.0 | (5.4 | )% | (3.4 | )% | ||||||||||
| Deferred revenue haircut | - | (0.6 | ) | 100.0 | % | 100.0 | % | |||||||||
| Constant currency revenue | 2,899.9 | 3,063.4 | (5.3 | )% | (3.4 | )% | ||||||||||
| Currency impact | - | (62.4 | ) | n/a | n/a | |||||||||||
| Total Revenue | 2,899.9 | 3,001.0 | (3.4 | )% | (3.4 | )% | ||||||||||
As shown in the table the impact of currency fluctuations in the year ended October 31, 2021 was limited with trends and movements being consistent on a constant currency and actual reported basis.
The most important foreign currencies, other than the US dollar for the Group are: Pounds Sterling, the Euro, Canadian Dollar and Japanese Yen and in the year period ended October 31, 2021 also the Indian Rupee and Australian Dollar. The exchange rates used and movements in these rates period-on-period are as follows:
Year ended October 31, 2021 | Year ended October 31, 2020 | Period- on- period change | 31 October 2021 | 31 October 2020 | Period- on- period change | |||||||||||||||||||
| Average | Average | % | Closing | Closing | % | |||||||||||||||||||
| £1 = $ | 1.37 | 1.28 | 7.0 | % | 1.37 | 1.30 | 5.4 | % | ||||||||||||||||
| €1 = $ | 1.19 | 1.13 | 5.3 | % | 1.16 | 1.17 | (0.9 | )% | ||||||||||||||||
| C$ = $ | 0.80 | 0.74 | 8.1 | % | 0.81 | 0.75 | 8.0 | % | ||||||||||||||||
| AUD = $ | 0.75 | 0.68 | 10.3 | % | 0.75 | 0.70 | 7.1 | % | ||||||||||||||||
| 100 INR = $ | 1.36 | 1.36 | - | 1.33 | 1.34 | (0.7 | )% | |||||||||||||||||
| 100 JYP = $ | 0.92 | 0.93 | (1.1 | )% | 0.88 | 0.96 | (8.3 | )% | ||||||||||||||||
Sensitivity analysis relating to foreign exchange can be found in note 24 “Financial Instruments” of the Consolidated financial statements in Item 18.
The Group is subject to exposure on the translation of the net assets of foreign currency subsidiaries into its reporting currency, US Dollar. The Group’s primary balance sheet translation exposures are noted in the Exposure analysis below. These exposures are kept under regular review with the Group treasury function providing reporting to the Treasury Risk committee and the Audit committee.
Group borrowings are denominated in US dollars and Euros. The Group seeks to match the currency profile of borrowings to the cash flows arising from the Groups operations used to service those borrowings. The refinancing in the year ended October 31, 2020 included an additional proportion of Euro debt and a reduction in US dollar debt which is intended to better match the currency profile of the Group’s debt with the cash flows used to service that debt.
The Group has certain investments in foreign operations, whose net assets are exposed to foreign currency translation risk. The Group faces currency exposures arising from the translation of profits earned in foreign currency subsidiaries into the Group’s reporting currency of US dollars. As at October 31, 2021 two net investment hedges totaling €1.03 billion have been designated using non-derivative Euro debt instruments to minimize the volatility in shareholder’s equity arising from foreign currency translation (October 31, 2020 two net investment hedges totaling €1.05 billion). As a result of the Group’s net investment hedging foreign exchange gains of $11.3 million have been recognized in equity in the year ended October 31, 2021 (year ended October 31, 2020: loss $58.7 million). Further details on the Group’s net investment hedging is included in note 24 “Financial risk management and financial instruments” of the Consolidated financial statements in Item 18.
| Item 5.B.1 | Information regarding the Group’s liquidity |
Our principal ongoing uses of cash are to meet working capital requirements, to fund debt obligations, to finance our capital expenditures and acquisitions and to pay dividends to shareholders. The board continues toGroup’ medium-term leverage1 target a modest level ofis 3.0x Adjusted EBITDA2. The current leverage for a company with the cash generating qualities of Micro Focus. We are confident that1 remains above this level, ofdue to on-going investments we are making in the business. The Group intends to reduce leverage1 back to this level in the medium-term and will balance debt will not reduce our abilityrepayments and equity returns in the short term to deliver our strategy, invest in products and/or make appropriate acquisitions. As the integration of the businesses continues the board will keep the appropriate level of debt under review.on this.
The Group’s operations are diversified across a number of currencies. Changes in foreign exchange rates are monitored and exposures regularly reviewed and actions taken to review exposures where necessary. The Group has significant committed facilities in place, the earliest of which matures in November 2021June 2024 and sufficient headroom to meet its operational requirements. The Group seeks to maintain strong relationships with its key banking partners and lenders and to proactively monitor the loan markets. The Group also has strong engagement with the providers of equity capital, which represents an alternative source of capital.
On January 17, 2022, the Group announced the refinancing of $1.6 billion of existing term loans. This refinancing comprised a €750 million and a $750 million Senior Secured Term Loan B. The new 5-year Facilities have been used by the Group to fully refinance its existing Senior Secured Term Loan B Euro facility due June 2024 as well as partially refinance the existing Senior Secured Term Loan B USD facilities due June 2024.
The new 5-year Facilities incurs interest at 4.00% above EURIBOR (subject to 0% floor) at an original issue discount of 0.5% on the Euro denominated tranche, and 4.00% above SOFR and CSA (subject to 0.5% floor) at an original issue discount of 1.0% on the US Dollar denominated tranche. This represents an increase in annualized interest costs of approximately $23.0 million.
On January 19, 2022, the Group executed a new 1m USD SOFR swap with a notional value of $750 million and a maturity date of February 28, 2027. The forward swap is effective on September 21, 2022 with a fixed interest rate of 1.656% swapped against the variable 1m SOFR USD rates.
As at October 31, 2021, cash and cash equivalents were $558.4 million. The company also had a $350.0 million Revolving Credit Facility (which was undrawn as at October 31, 2021). This facility has been amended post year end with the facility reduced to $250 million and with maturity extended until December 2026, subject to tests for the term loan maturities in June 2024 and June 2025. The amended facility is subject to a covenant test when more than 40% of the revolving credit facility is outstanding at a fiscal quarter end with a 5.00x net leverage1 covenant being applied.
The directors believe that the Company’s current available working capital is adequate to sustain its operations at current levels through at least the next twelve months.year.
1Leverage is defined as the ratio of Net debt to Adjusted EBITDA. Net debt is defined in Item 3.D.
2Adjusted EBITDA is defined in note 1 “Segmental reporting” of the Consolidated financial statements in Item 18.
Year ended October 31, 2021 compared to the 18 monthsyear ended October 31, 20182020
Cash flows from operating activities
Net cash generated from operating activities decreased by $260.0$477.6 million, or 28.2%70.4%, to $661.8$200.6 million in the 12 monthsyear ended October 31, 20192021 as compared to $921.8$678.2 million in the 18 monthsyear ended October 31, 2018.2020.
This decrease period-on-period is primarily due to a decrease of $368.0$392.3 million in cash generated from operations arisingand an increase of $120.7 million in tax payments. Tax payments included a payment made in respect of EU State Aid (excluding interest) of $44.2 million and another c.$42.0 million of payments relating to payments of prior year tax liabilities following the filing of statutory accounts in certain jurisdictions. These payments are not expected to recur in future accounting periods.
The decrease period-on-period of $392.3 million in cash generated from operations arises primarily from a $230.3$403.4 million decrease in operating profit (attributable to continuing(excluding the non cash impact of the $2,799.2 million goodwill impairment charge from the year ended October 31, 2020, and discontinued operations and discussedthe $282.3 million increase in operating results presentedamortization in Item 5.A)the current year). In addition expenditure to settle amounts included in provisions reduced in the year partly as a result of the shorter accounting period and also as the level of restructuring spend reduced in the period. These were offset by a decreaseperiod-on-period movement in working capital outflowsoutflow of $165.9$222.4 million.
The period-on-period movement in cash flows from working capital of $222.4 million and a $67.9 million increase in tax paid as tax attributes used in the prior year to reduce the cash tax was fully utilized in the prior year, offset by a $74.7 million decrease in interest paid resultingresult from the shorter accounting period and $101.2 million decrease in bank loan costs which related to the new term loans in the 18 month period ended October 31, 2018.
Cash flows fromused in investing activities
Net cash fromused in investing activities increaseddecreased by $1,903.3$13.3 million or 1,064.5%, to $2,082.1an outflow of $75.9 million in the 12 monthsyear ended October 31, 20192021 as compared to net cash used inoutflow from investing activities of $178.8$89.2 million in the 18 monthsyear ended October 31, 2018.2020.
Cash flows used in financing activities
Net cash used in financing activities increased by $2,364.2$103.3 million or 367.6%, to $3,007.3$301.5 million in the 12 monthsyear ended October 31, 20192021 as compared to $643.1$198.2 million in the 18 monthsyear ended October 31, 2018.2020.
This increase in net cash used in financing activities of $2,364.2$103.3 million is primarily due to:
Contractual Commitments
| October 31, 2019 | October 31, 2018 | |||||||
| $m | $m | |||||||
Bank loan secured | 4,775.0 | 4,996.9 | ||||||
Unamortized prepaid facility arrangement fees and original issue discounts | (104.3 | ) | (151.0 | ) | ||||
| 4,670.7 | 4,845.9 | |||||||
Term Loan B-2 | Term Loan B-3 | Seattle Spinco Term Loan B | Euro Term Loan B | Revolving Facility | Total | |||||||||||||||||||
| $m | $m | $m | $m | $m | $m | |||||||||||||||||||
| At May 1, 2017 | 1,515.2 | - | - | - | 80.0 | 1,595.2 | ||||||||||||||||||
Acquisitions | - | - | 2,600.0 | - | - | 2,600.0 | ||||||||||||||||||
Draw downs | - | 385.0 | - | 523.8 | 135.0 | 1,043.8 | ||||||||||||||||||
Repayments | (11.4 | ) | (2.9 | ) | (19.5 | ) | (4.1 | ) | (215.0 | ) | (252.9 | ) | ||||||||||||
Foreign exchange | - | - | - | 10.8 | - | 10.8 | ||||||||||||||||||
| At October 31, 2018 | 1,503.8 | 382.1 | 2,580.5 | 530.5 | - | 4,996.9 | ||||||||||||||||||
| At November 1, 2018 | 1,503.8 | 382.1 | 2,580.5 | 530.5 | - | 4,996.9 | ||||||||||||||||||
Draw downs | - | - | - | - | - | - | ||||||||||||||||||
Repayments | (89.1 | ) | (13.9 | ) | (94.2 | ) | (15.4 | ) | - | (212.6 | ) | |||||||||||||
Foreign exchange | - | - | - | (9.3 | ) | - | (9.3 | ) | ||||||||||||||||
| At October 31, 2019 | 1,414.7 | 368.2 | 2,486.3 | 505.8 | - | 4,775.0 | ||||||||||||||||||
October 31, 2021 | October 31, 2020 | October 31, 2019 | |||||||
| $m | $m | $m | |||||||
| Bank loan secured | 4,608.0 | 4,733.2 | 4,775.0 | ||||||
| Unamortized prepaid facility arrangement fees and original issue discounts | (59.6) | (92.9) | (104.3) | ||||||
| 4,548.4 | 4,640.3 | 4,670.7 |
The carrying value for borrowings are stated after deducting unamortized prepaid facility fees and original issue discounts. Facility arrangement costs and original issue discounts are originally amortized between three and six years. The remaining unamortized fees of $59.6m have a remaining period of amortization of up to two years. Long-term borrowings have a drawn value of $4,608.0m before unamortized prepaid facility fees. The fair value of the proceeds from the saleLong-term borrowings before unamortized prepaid facility fees can be found in note 24 “Financial risk management and financial instruments” of the SUSE business. As a resultConsolidated financial statements included in item 18.
Short-term borrowing of this no further$24.3m represents capital repayments of $42.0m falling due on the Group borrowings within one year less unamortized prepaid facility arrangement fees and original issue discounts of $17.7m.
The Group’s earliest debt maturity is in June 2024, however as described below, annual instalment payments are expected within the next 12 months. The termrequired and additional payments are required dependent on leverage.
31
The following facilities were drawn as at October 31, 2019:2021:
The $1,414.7m€585.0 million (equivalent to $676.0 million) senior secured five-year term loan B-2B-1 issued by MA FinanceCoFinanceCo., LLC, maturing in June 2025, is priced at LIBOREURIBOR plus 2.25%4.5% (subject to a LIBOREURIBOR floor of 0.00%) with an original issue discount of 3.0%;
The $368.2m$359.5 million senior secured seven yearseven-year term loan B-3 issued by MA FinanceCoFinanceCo., LLC, maturing in June 2024, is priced at LIBOR plus 2.50%2.75% (subject to a LIBOR floor of 0.00%) with an original issue discount of 0.25%;
The $2,486.3m$633.7 million senior secured five-year term loan B-4 issued by MA FinanceCo., LLC, maturing in June 2025, is priced at LIBOR plus 4.25% (subject to a LIBOR floor of 1.00%) with an original issue discount of 2.5%;
The $2,427.9 million senior secured seven year term loan B issued by Seattle SpinCo.SpinCo, Inc., maturing in June 2024,is priced at LIBOR plus 2.50%2.75% (subject to a LIBOR floor of 0.00%) with an original issue discount of 0.25%; and
The €452.8m m€442.2 million (equivalent to $505.8m)$510.9m) senior secured seven year term loan B issued by MA FinanceCoFinanceCo., LLC, maturing in June 2024, is priced at EURIBOR plus 2.75%3.00% (subject to a EURIBOR floor of 0.00%) with an original issue discount of 0.25%.
The following facilities were undrawn as at October 31, 2019:2021:
A senior secured revolving credit facility of $500.0m,$350.0 million ($nil drawn), (“Revolving Facility”RCF”), with an interest rate of 3.25% above LIBOR on amounts drawn (and 0.375%0.5% on amounts undrawn) thereunder (subject to a LIBOR floor of 0.00%0.0%).
The Group has additional contractual commitmentsfollowing covenants related to net leverage1 apply to the Group’s term-loan borrowing facilities:
| • | The RCF is subject to a single financial covenant, only in circumstances when more than 35% of the Revolving Facility is outstanding at a fiscal quarter end. Throughout the year the applicable covenant threshold was 3.85x, however no test was applicable at October 31, 2021 or any previous test date, as the facility was not drawn in excess of the 35% threshold. This facility has been amended post year end with the facility reduced to $250 million and with maturity extended until December 2026, subject to tests for the term loan maturities in June 2024 and June 2025. The amended facility is subject to a covenant test when more than 40% of the revolving credit facility is outstanding at a fiscal quarter end with a 5.00x net leverage1 covenant being applied. |
| • | Additional debt repayments when the Group’s net leverage1 at October 31 exceeds 3.00x, when 25% of excess cash flow for the year is required to be paid, and 3.30x, when 50% of excess cash flow for the year is required to be paid; |
| • | Net proceeds from divestitures in excess of $45 million are required to be used to make debt repayments. When the Group’s net leverage1 exceeds 3.00x, 100% of net proceeds must be used for debt repayments. When net leverage1 is below 3.00x, 50% of net proceeds must be used to make a debt repayment, however no further debt repayment is required once repayment reduces net leverage1 below 2.50x on a pro forma basis therefore use of excess disposal proceeds at this point is at the Group’s discretion; and |
| • | An additional 25 basis points of margin is required to be paid on the term loans maturing in June 2024 when net leverage1 exceeds 3.00x. The Group is currently paying this margin. |
These covenants are not expected to inhibit the Group’s future operations or funding plans.
1See Item 5.B.1 for capital expendituredefinition of leverage. The credit facility agreements apply frozen GAAP for IFRS 16 and allows certain expected cost savings to be included in the form of leases which are disclosedmeasurement therefore the calculated value differs from that using net debt2 / Adjusted EBITDA3 as presented in Item 5.F of this Annual Report on Form 20-F, no additional financing20-F.
2 See note 24 “Financial risk management and financial instruments” of the Consolidated financial statements included in item 18.
3 See note 1 “Segmental reporting” of the Consolidated financial statements included in item 18.
The movements on the Group loans in the year were as follows:
term loan B-1 EUR | term loan B-2 USD | term loan B-3 USD | term loan B-4 USD | Seattle Spinco term loan B | Euro term loan B | Revolving Facility | Total | |||||||||||||||||||||||||
| $m | $m | $m | $m | $m | $m | $m | $m | |||||||||||||||||||||||||
At November 1, 2019 | - | 1,414.7 | 368.2 | - | 2,486.3 | 505.8 | - | 4,775.0 | ||||||||||||||||||||||||
| Draw down | 665.8 | - | - | 650.0 | - | - | 175.0 | 1,490.8 | ||||||||||||||||||||||||
| Repayments | - | (1,414.7 | ) | - | - | - | - | (175.0 | ) | (1,589.7 | ) | |||||||||||||||||||||
| Foreign exchange | 34.5 | - | - | - | - | 22.6 | - | 57.1 | ||||||||||||||||||||||||
| At October 31, 2020 | 700.3 | - | 368.2 | 650.0 | 2,486.3 | 528.4 | - | 4,733.2 | ||||||||||||||||||||||||
| At November 1, 2020 | 700.3 | - | 368.2 | 650.0 | 2,486.3 | 528.4 | - | 4,733.2 | ||||||||||||||||||||||||
| Draw downs | - | - | - | - | - | - | - | - | ||||||||||||||||||||||||
| Repayments | (17.9 | ) | - | (8.7 | ) | (16.3 | ) | (58.4 | ) | (12.8 | ) | - | (114.1 | ) | ||||||||||||||||||
| Foreign exchange | (6.4 | ) | - | - | - | - | (4.7 | ) | - | (11.1 | ) | |||||||||||||||||||||
| At October 31, 2021 | 676.0 | - | 359.5 | 633.7 | 2,427.9 | 510.9 | - | 4,608.0 | ||||||||||||||||||||||||
Maturity of debt
The maturity profile of the anticipated future cash flows including interest in relation to the Group’s borrowings and debt in the form of lease obligations, which therefore, differs from both the carrying value and fair value, is anticipatedas follows:
As at October 31, 2021:
| Borrowings | Lease Obligations | Derivatives – interest rate swaps | Total | |||||||||||||
| $m | $m | $m | $m | |||||||||||||
| Within one year | 202.6 | 74.9 | 35.7 | 313.2 | ||||||||||||
| In one to two years | 191.1 | 39.9 | - | 231.0 | ||||||||||||
| In two to three years | 3,453.6 | 29.7 | - | 3,483.3 | ||||||||||||
| In three to four years | 1,235.5 | 28.5 | - | 1,264.0 | ||||||||||||
| In four to five years | - | 49.1 | - | 49.1 | ||||||||||||
| Total | 5,082.8 | 222.1 | 35.7 | 5,340.6 | ||||||||||||
| Impact of discounting | - | (27.6 | ) | - | (27.6 | ) | ||||||||||
| At October 31, 2021 | 5,082.8 | 194.5 | 35.7 | 5,313.0 | ||||||||||||
As at October 31, 2020:
| Borrowings | Lease Obligations | Derivatives – interest rate swaps | Total | |||||||||||||
| $m | $m | $m | $m | |||||||||||||
| Within one year | 203.6 | 82.2 | - | 285.8 | ||||||||||||
| In one to two years | 224.2 | 69.5 | 77.9 | 371.6 | ||||||||||||
| In two to three years | 230.3 | 43.3 | - | 273.6 | ||||||||||||
| In three to four years | 3,487.7 | 49.3 | - | 3,537.0 | ||||||||||||
| In four to five years | 1,242.0 | 36.3 | - | 1,278.3 | ||||||||||||
| Total | 5,387.8 | 280.6 | 77.9 | 5,746.3 | ||||||||||||
| Impact of discounting | - | (30.2 | ) | - | (30.2 | ) | ||||||||||
| At October 31, 2020 | 5,387.8 | 250.4 | 77.9 | 5,716.1 | ||||||||||||
| Item 5.B.2 | Derivative financial instruments. |
Information on the type of financial instruments used and the Group’s treasury policies and objectives in terms of the manner in which treasury activities are controlled are included in Note 24 “Financial risk management and financial instruments” and Note 33 “Post balance sheet events” of the Consolidated financial statements included in Item 18.
Information on the currency and interest rate structure and maturity profile of debt are included in Item 5.B.1 above.
The Group’s cash and cash equivalents was held in the following currencies as at October 31, 2021:
| $m | ||||
| US dollar | 417.6 | |||
| Indian Rupee | 25.0 | |||
| Euro | 24.3 | |||
| Russian Rouble | 23.9 | |||
| Australian Dollar | 17.5 | |||
| Japanese Yen | 13.6 | |||
| South African Rand | 7.8 | |||
| Canadian Dollar | 5.7 | |||
| British Pound | 2.7 | |||
| Other | 20.3 | |||
| Total | 558.4 |
| Item 5.B.3 | Material cash requirements |
The following table summarizes the Group’s contractual obligations and other commercial commitments at October 31, 2021 as well as the effect these obligations and commitments, specifically long-term debt and lease obligations, are expected to have on the Group’s liquidity and cash flow in future periods:
| Payment due by period | ||||||||||||||||||||
Less than 1 year | 1-3 years | 3-5 years | After 5 years | Total | ||||||||||||||||
| $m | $m | $m | $m | $m | ||||||||||||||||
| Debt principal repayment | 42.0 | 3,365.5 | 1,200.5 | - | 4,608.0 | |||||||||||||||
| Interest payments on debt | 160.6 | 279.2 | 35.0 | - | 474.8 | |||||||||||||||
| 202.6 | 3,644.7 | 1,235.5 | - | 5,082.8 | ||||||||||||||||
| Lease obligations | 74.9 | 69.6 | 28.5 | 49.1 | 222.1 | |||||||||||||||
| Purchase obligations | 45.4 | 42.7 | 26.4 | 6.9 | 121.4 | |||||||||||||||
| 322.9 | 3,757.0 | 1,290.4 | 56.0 | 5,426.3 | ||||||||||||||||
The interest payments within the above table are presented based on the prevailing one-month LIBOR and foreign exchange rates as of October 31, 2021.
Purchase obligations primarily include commitments for software licences. Purchase orders for the purchase of other goods and services are not included in the table, as the Group’s operating subsidiaries are not able to determine the aggregate amount of such purchase orders that represent contractual obligations, as purchase orders typically represent authorizations to purchase rather than binding agreements. On 20 December 2021, the Group’s Employee Benefit Trust commenced the purchase of 12 million shares equivalent to $57.4 million at the share price and exchange rate on December 20, 2021. These shares will be purchased on the open market and will be used for the settlement of existing and future employee share schemes awarded to senior leaders and employees who are critical to achieving the strategic initiatives set out in Item 5.D.
The table above does not include any amounts that the Group may pay to fund its retirement benefit plans as the timing and amount of any such future funding are unknown and dependent on, among other things, the future performance of defined benefit pension plan assets, interest rate assumptions and other factors. The net retirement benefit scheme liabilities totaled $147.1 million as of October 31, 2021, which is net of pension assets of $173.5 million. The Group expects to be required to meet these commitments.
contribute approximately $ 7.7 million to its defined benefits plans during 2022. See note 22 “Pensions and other long-term benefit commitments” of the Consolidated financial statements in Item 18.
| October 31, 2019 | October 31, 2018 | |||||||
| $m | $m | |||||||
Carrying amount | (36.5 | ) | 86.4 | |||||
Notional amount (4 x $562.5m) | 2,250.0 | 2,250.0 | ||||||
Maturity date | 30 September 2022 | 30 September 2022 | ||||||
Change in fair value of outstanding hedging instruments (note 31) | (122.9 | ) | 86.4 | |||||
Change in value of hedging instruments adjusted for credit risk | (121.9 | ) | 84.7 | |||||
The Micro Focus Group invests heavilysignificantly in research and development. Through its market knowledge and close contact with customers, Micro Focus has sought to refine products to respond to the changing needs of the Micro Focus Group’s customers.
Research expenditure is recognized as an expense as incurred in the consolidatedConsolidated statement of comprehensive income in research and development expenses. Costs incurred on product development projects relating to the developing of new computer software programs and significant enhancement of existing computer software programs are recognized as intangible assets when it is probable that the project will generate future economic benefits, considering its commercial and technological feasibility, and costs can be measured reliably. Only direct costs are capitalized which are the software development employee costs and third-party contractor costs. Product development costs previously recognized as an expense are not recognized as an asset in a subsequent period.
The assessment as to whether product development expenditure will achieve a complete product for which the technical feasibility is assured is a matter of judgment, as is the forecasting of how the product will generate future economic benefit. Finally, the period of time over which the economic benefit associated with the expenditure occurred will arise is also a matter of judgment. These judgments are made by evaluating the development plan prepared by the research and development department and approved by management, regularly monitoring progress by using an established set of criteria for assessing technical feasibility and benchmarking to other products.
Factors and Trends that affect our Results of Operations
The main trends in the Group revenues and costs in the year ended October 31, 2021 and actions taken in relation to these trends are discussed in the revenue commentary in Item 5.A. Item 5.A also includes details of the disposal of the Digital Safe business and the commercial agreement with AWS both organic and inorganic, we evaluate our options against a set of characteristics enablingwhich will impact reported revenue in future periods. In addition, as explained in Item 5.B.1 the categorizationrefinancing of certain of the Group’s products into oneborrowings in January 2022 will increase the interest cost by approximately $23.0 million on an annualized basis.
Update on our three-year plan
On November 30, 2021, we set out our objectives for the business in a Strategy Update to investors and analysts. In summary, our priorities are to continue and where possible accelerate the:
| - | Transition our business model to be product group-centric end-to-end. |
| - | Delivering the innovation our customers need in the way they want to consume it. |
| - | Capturing cost efficiencies enabled by the enterprise-wide platform. |
We believe successful execution of this as we exit the year ended October 31, 2023 can deliver:
| - | A flat or better year-on-year revenue trajectory. |
| - | The removal of $400 million to $500 million of annual gross costs from the year ended October 31, 2021 cost base to leave between $1.5 billion and $1.6 billion (allowing for cost inflation). |
| - | Adjusted free cash flow1 run rate of $500 million. |
1 Adjusted free cash flow, which is Free cash flow as defined (below), excluding the cash impact of exceptional items. Free cash flow is defined as cash generated from operations less interest payments, bank loan costs, tax payments, purchase of intangible assets, purchase of property, plant and equipment and interest and capital payments in relation to leases. Free cash flow is presented as it is widely used by securities analysts, investors and other interested parties to understand the Group’s Cash flow as it provides an indication of the following:
Transition to a product group operating model
Why we are focused on this
Our product groups operate in highly competitive markets with often specific challenges and opportunities. By moving to this product group operating model we aim to enable more agility and effective execution within each product group in responding to these challenges and opportunities.
As a result, this will improve our ability to deliver innovation into the hands of customers.
How this will impact the way we operate
During the year ended October 31, 2021 we made good progress in repositioning our product portfolio and changing our Go-to-Market approach; the next phase is to evolve our business model to be much more product portfolio-centric end-to-end. We began this transition in CyberRes and Vertica a year ago and we are starting to see signs of progress from improved alignment and engagement.
The Group’s modelaim over the next two years is to align the Company by product portfolio, creating specialist and focused execution capability by Product Group. Better alignment, specialist skills and more focused execution will improve speed and agility in the market and better position our portfolios to succeed. The aim is to support these specialist units through centres of excellence such that we balance focus with delivery of economies of scale.
Continued focus on installed base
Why we are focused on this
The improvement of customer retention rates is critical to the future success of the business.
Whilst executing the integration, the Group has been heavily internally focused and as a result we have lost direct engagement with our customer base. In some portfolios, this combined with poorly aligned product roadmaps led to elevated levels of maintenance attrition. There has been great progress made in revitalizing roadmaps delivering innovative new capabilities which we now need to make sure our customers exploit.
How we are focusing on improving retention
| 1. | Proactive customer engagement – A detailed understanding of customer concerns to enable highly focused response through more skilled and specialized resources earlier in, and at every stage, of the cycle. |
| 2. | Product innovation & adoption – Ensuring customers are using the latest versions of our software to enable adoption of new innovation and increase value from existing investments. |
| 3. | SaaS & subscription – Help customers blend new offerings with existing investments to realize value quickly and further future proof their solutions. |
| 4. | Leadership & alignment – Strengthened and increased leadership, re-aligned compensation and reduced handoffs across the customer journey. |
| 5. | Sweat the details – Active management of renewals pipeline at detailed level by sub-portfolio, tailored to customer size and renewal risk profile across multiple periods. |
Utilize the enterprise-wide platform to create an agile and lean organization
Why we are focused on this
The Company has been operating on multiple systems with significant levels of manual support which was highly inefficient. In July 2021 we went live on our new, single enterprise-wide platform. This gives us the foundation to drive simplification of our business. The priority now is to leverage the platform to deliver efficiencies through the removal of duplication, effectiveness through the provision of better tools for our teams and the insight required to improve customer service.
How simplifying our business will help transform our business
Since go-live in July 2021, we have visibility of our end-to-end processes. This is the first major step for us in being able to identify the root causes of inefficiencies. The next stage is to focus on delivering improvements by:
– Removing duplicative costs and processes from every function within the organization.
– Streamlining processes by reducing the number of systems, people and process interactions.
– Optimizing the balance of work done locally and centrally in low cost locations.
These actions are designed to deliver sustainablesimplify everything we do and consistent returns for our shareholders, customers and employees. The Group’s overarching principles are:
The principal risks in revenue trajectory such thatrelation to these strategic initiatives are discussed in Item 3.D.
Climate change
Why are we focused on this
Micro Focus recognizes the revenue decline, excludingrisks posed by climate change and fully supports the impactaim of the shorter accounting period, moderates and delivers flatTask Force on Climate-related Financial Disclosures (“TCFD”) recommendations. Micro Focus is committed to low single digit growth overworking towards incorporating the medium term. Successful deliveryTCFD recommendations, which we are required to comply with for our Domestic listing, for the first time in our annual report for the year ended October 31, 2022. In the subsequent paragraphs our progress to date is summarized. This has been supported by a readiness assessment report we commissioned during the year related to the four pillars of the TCFD.
How this when combined withwill impact the completion of work to build an effective operational platform, see Item 4.A, should also enable Adjusted EBITDA margins2 to be improved over time.way we operate
Governance
The StrategicBoard assumes overall responsibility and accountability for the management of Climate-related risks and opportunities. In June 2021, a new Environmental, Social & Operational review set outGovernance (ESG) framework was introduced along with a new board level committee to ensure the Board has oversight of climate-related issues. The ESG committee is supported by an ESG working group which is made up of senior leaders across the business to ensure accountability and an environmental sub group with specific responsibilities for our environmental strategy.
Strategy: identifying risks and opportunities
We are continuing to assess how climate-related risks and opportunities impact our business. This includes looking at our products and how these support our customers in Item 4.A highlightedresponsibly achieving their business objectives and our strategy for engaging with suppliers to address environmental related risk. We are conducting cross-functional workshops, initially with our Finance, Risk and Real Estate teams, to better understand the need for a more definitive approachphysical risks (both acute and accelerated transition to Subscriptionchronic) and SaaS based offeringstransitional risks (such as policy, regulatory and market changes) that affect our business.
As part of assessing ESG related risks and opportunities and to support our future portfolio strategy. The transitionESG strategy, we anticipate implementing climate-related scenario analysis. These scenario analyses will be managedused to financially quantify the material impacts of climate change to our business over multiple financial periods with an initial focus on products where this model is emerging or de facto market standards. The Group’s goal isdifferent time horizons and will inform us in planning and prioritizing future business strategies, investments and establishing policies to deliver incremental improvements in revenue trajectory alongside a structured and disciplined transition to SaaS and Subscription for someimprove the resilience of our products. During FY20business and continuity long term.
Risk Management
We have an established risk management framework we use to identify, assess, mitigate and monitor enterprise risk across the Group will begin the transition of Vertica, seek to grow existingorganization and introduce new offerings in Securitywe have broadened our risk management policy and build upon existing initiatives in ADM and ITOM.
Metrics & Targets
As part of operations, liquidity, capital expenditures or capital resources.implementing our environmental strategy over the coming year we will assess which specific targets and metrics we consider to be most relevant for our business in direct response to climate-related risks and opportunities. As part of the readiness assessment a detailed review was conducted of our carbon emissions including assessing the current GHG emissions profile.
Not applicable.
| Payment due by period | ||||||||||||||||||||
Less than 1 year | 1-3 years | 3-5 years | After 5 years | Total | ||||||||||||||||
| $m | $m | $m | $m | $m | ||||||||||||||||
Debt principal repayment | - | 1,431.7 | 3,343.3 | - | 4,775.0 | |||||||||||||||
Interest payments on debt | 209.2 | 360.6 | 235.7 | - | 805.5 | |||||||||||||||
209.2 | 1,792.3 | 3,579.0 | - | 5,580.5 | ||||||||||||||||
Finance Leases | 11.8 | 10.8 | 0.9 | - | 23.5 | |||||||||||||||
Operating Leases | 78.6 | 123.6 | 61.4 | 37.6 | 301.2 | |||||||||||||||
299.6 | 1,926.7 | 3,641.3 | 37.6 | 5,905.2 | ||||||||||||||||
37
During the year ended October 31, 20192021 our directors and senior management comprised the board of directors, detailsand the following members of key management bodies who are not on the board of directors. Details of the membership of the board and the related board committees they were involved in are disclosed below, and the following members of key management bodies who are not on the board of directors:below.
| Name | Role | Committee Membership |
| Greg Lock | Non-Executive Chairman | Nomination committee and Remuneration committee |
| Stephen Murdoch | Chief Executive Officer | Executive committee |
Chief Financial Officer | Executive committee | |
Karen Slatford | ||
Senior Independent Director | Audit committee and Nomination committee | |
| Richard Atkins | Independent non-executive director | Audit committee |
| Amanda Brown | Independent non-executive director | Audit committee, Nomination committee and Remuneration committee |
| Pauline Campbell | Independent non-executive director | Audit committee, Nomination committee and Remuneration committee |
| Lawton Fitt | Independent non-executive director | Audit committee, Nomination committee and Remuneration committee |
Independent non-executive director | ||
| Robert Youngjohns | Independent non-executive director | Audit committee, Nomination committee and Remuneration committee |
1 Kevin Loosemore had the role of Executive Chairman during the 12 months end October 31, 2019 but stepped down from the board on February 14, 2020. Greg Lock joined the board as Non-executive Chairman on February 14, 2020.
2 As announced on February 8, 2022 Karen Slatford has informed the Board of her intention to retire as a director of Micro Focus International Plc, following the conclusion of the 2022 Annual General Meeting and consequently will not be seeking re-election.
Greg Lock took up- Chairman
Chairman since February 2020.
Before embarking on his adventures as a PLC Chairman Greg enjoyed 30 years at the role of non-executiveIBM Corporation. There he served, inter alia, as assistant to the Chairman, on February 14, 2020. Greg has more than 45 years’ experience in the software and computer services industry, including 11 years as Chairman of Computacenter plc, seven years as Chairman of Kofax plc and four years as Chairman of SurfControl plc. In the last five years he has also been a director of Informa plc and UBM plc. From 1998 to 2000, he was General Manager of IBM’s Global Industrial sector. Greg also served as a member of IBM’sthe IBM Worldwide Management Council, and as a governorGovernor of the IBM Academy of Technology.Technology and Global General Manager for Industrial Sector. In that role he had P&L responsibility for a $12 billion unit representing about 15% of the Corporation’s revenues.
Stephen Murdoch – Chief Executive ChairmanOfficer
Stephen is our Chief Executive Officer and a member of the Micro Focus board, untilpositions he stepped downhas held since March 19, 2018. Stephen joined Micro Focus in 2012, first serving as General Manager of the Product Group and Chief Marketing Officer, responsible for all software product and services offerings development, customer services, corporate marketing and strategy. In 2014, he was appointed as Chief Operating Officer and Executive Director, having responsibility for sales and marketing, product strategy, development and management, services and business operations.
Prior to Micro Focus, Stephen spent seven years at Dell, first building Dell’s Global Infrastructure Consulting Services organization, and then leading its business in Europe, Middle East and Africa. Before Dell, Stephen had 17 years’ experience at IBM, latterly serving as Vice President, Communications Sector with responsibility for the entire telco, media, and utilities industry portfolio. During his IBM career, Stephen held a number of Global, EMEA and UK senior management roles with experience spanning software and services, storage, and enterprise systems.
Matt Ashley – Chief Financial Officer
Matt is our Chief Financial Officer and a member of the Micro Focus board, since July 1, 2021.
Matt joined from William Hill plc, a sports betting and gaming business, where he was Chief Financial Officer and member of the board. In December 2021, Matt was appointed as a Non-executive director of Robert Walters plc. Matt previously held several positions at National Express Group plc including Group CFO and President and CEO of its North America business based in Chicago.
He was a director of transport, infrastructure and public company reporting at Deloitte LLP and began his career as an auditor in London. Matt brings considerable public company experience to Micro Focus including business transformation, acquisitions and divestitures, debt and rights issues and public reporting.
He is a graduate of Leeds University and a member of the Institute of Chartered Accountants in England and Wales.
Karen Slatford* - Senior Independent Director
Karen is a non-executive director of Softcat plc, Chair of FTSE 250-listed Molten Ventures plc (formerly AIM listed Draper Esprit plc) and a non- executive director at Accesso Technology Group plc. Prior to her current responsibilities, she held various roles at the board level since 2001 at a range of technology companies. Karen began her career at ICL before spending 20 years in Hewlett-Packard, where she headed up worldwide sales and marketing. Karen holds a BA Joint Honors degree in European Studies, French and Spanish from Bath University.
* As announced on February 14, 2020. He was appointed non-executive Chairman8, 2022, Karen has informed the Board of her intention to retire as a director of Micro Focus, following the conclusion of the 2022 Annual General Meeting.
Richard Atkins - Independent non-executive director
Richard is Chairman of Acora, an IT Services outsourcing company, YSC, an international Leadership Development company and Bedrock Holdco Ltd. He has spent the majority of his career within the IT industry.
Previously, he was a director at Data Sciences where he led its MBO from Thorn EMI in 1991 and then managed its successful sale to IBM in 1996. His final role at IBM was as General Manager for IBM Global Services Northern Europe where he was also a member of the IBM worldwide senior leadership team. Since leaving IBM in 2005 he has acted as a non-executive director for several companies including Aon, Compel, Message Labs, Global Crossing, Morse and Executive ChairmanEasynet. Richard qualified as a Chartered Accountant with EY.
Amanda Brown - Independent non-executive director
Amanda is the Chief Human Resources Officer at Hiscox Ltd, a FTSE 250 business and specialist insurer with offices in April 2011. Kevin14 countries.
Amanda has more than 20 years of international HR experience in a variety of industries, including consumer goods, leisure, hospitality, and financial services. Prior to Hiscox, Amanda held a number of leadership roles with Mars, PepsiCo, and Whitbread plc. She has expertise in human resources, remuneration strategy, and managing organizations through periods of significant change.
Pauline Campbell - Independent non-executive director
Pauline joined the boardMicro Focus Board on October 1, 2021. She is a recently retired PricewaterhouseCoopers Audit Partner who worked with company boards across a number of De La Rueindustries, both private and publicly owned. Pauline has experience of companies going through business cycles of trading, acquisition, disposal and raising finance. She has worked internationally across a broad range of sectors including IT services and support services amongst many others. As an Audit Partner, Pauline has wide experience of risk and quality assessment.
Pauline also served on the Governance Board of the UK firm including the Public Interest Body and the equivalent body at PwC’s Global Network, so brings a wealth of governance experience and has recently been appointed to the Board of Computacenter plc as a non-executive director on September 2, 2019director.
Pauline was a trustee for social business that supports young adults in achieving their potential and became non-executive Chairman, of that company on October 1, 2019. Kevin is alsocurrently a Trustee for Catch 22 Multi Academy Trust and the Latymer Foundation.
Lawton Fitt - Independent non-executive director
Lawton is an investment banker and former Chairmana highly experienced corporate director. She currently serves on the boards of IRIS SoftwareCiena Corporation, The Progressive Corporation and The Carlyle Group, Ltd, a role he relinquished on September 2, 2019.
From 2002 to 2005 Lawton was the Secretary (Chief Executive Officer) of Morse plc,the Royal Academy of Arts in London and has served as a trustee for a number of not-for-profit organizations and foundations, including the Goldman Sachs Foundation and the Thomson Reuters Foundation. She received her undergraduate degree in European History from Brown University and her MBA from the Darden School of the University of Virginia.
Sander van ’t Noordende* - Independent non-executive director
Sander is a non-executive director of Nationwide Building SocietyAECOM and a member of the Executive board of Randstad N.V.
Sander has had a 32-year career in Technology and Professional Services at Accenture, where he was a member of the Global Management Committee from 2006 to 2019. His last role in Accenture was Group Chief Executive of the Products Operating Group which serves clients in the consumer goods, retail, travel, life sciences and industrial & automotive industries. Before that he looked after Management Consulting, the Resources Operating Group and The Netherlands. He also served on the board of Avanade (an Accenture JV with Microsoft).
Sander is passionate about equality and belonging in the workplace, especially the LGBTI agenda. He has been recognized several times by the FT as one of the top 100 global LGBT+ Executives. He currently serves on the Board of Out & Equal (the world’s premier LGBT workplace equality organization).
He holds a Master’s degree in Industrial Engineering and Management Science from the Eindhoven University of Technology.
* As announced on October 21, 2021, Sander has informed the Board of his intention to retire as a director of Micro Focus, following the conclusion of the 2022 Annual General Meeting.
Robert Youngjohns - Independent non-executive director
Robert is a board member at a small number of growth companies in the technology sector and an operating executive at Marlin Equity Partners. Robert previously served as Executive Vice President and General Manager of HP Software at Hewlett Packard Enterprises (“HPE”). During his tenure at Hewlett Packard, Robert was a member of HP’s Executive Council, as well as a Senior Vice President.
Prior to his work at HPE, Robert was a Senior Vice-President of Microsoft and President of Microsoft North America. He has held senior leadership positions at Sun Microsystems and IBM. Robert holds a Master’s degree with honors in physics and philosophy from Oxford University.
Board members’ external commitments
Each of the non-executive directors confirms on appointment that they will devote sufficient time to meet what is expected of them in their role. They have each disclosed their other significant commitments and the time involved in these and advise the board of any changes.
One executive director has an external role
Matt Ashley is a non-executive director of Robert Walters plc.
Senior Management
Senior Management as at October 31, 2021:
| Name | Role |
| Paul Rodgers | Chief Operating Officer |
| Chris Livesey | Senior Vice President, Revenue Growth and Strategy |
| John Delk | Senior Vice President and General Manager of the CyberRes (Security) Product Group |
| Eric Varness | Chief Marketing Officer |
| Jane Smithard | Chief Legal Officer and Group General Counsel |
| Susan Ferguson | Chief Human Resources Officer & Senior Vice President Business Operations |
| Rohit de Souza | Senior Vice President, General Manager of the ITOM Product Group and the ADM Product Group, Leader of the CTO office and Product Security |
| Colin Mahony* | Senior Vice President and General Manager, Vertica |
| Neil Fowler | Vice President and General Manager, AMC Product Group |
| Scott Richards | Vice President and General Manager of the IM&G Product Group |
| Suzanne Chase | Group Company Secretary and Head of Assurance |
| Nick Wilson | Worldwide President of Sales |
* Colin Mahony left Micro Focus on December 15, 2021
Paul Rodgers - Chief Operating Officer
Paul Rodgers is the Big Food Group plc. His most recent executive roles were as Chief Operating Officer for Micro Focus and has a proven track record of Cable & Wireless plc,success with pioneering board-level strategies that facilitate transformations across complex business landscapes. Paul supports the businesses by identifying areas for innovation and guiding strategic changes that improve efficiencies, reduce cost and deliver large-scale growth.
Prior to this role, Paul served as the Business Operations and Integration lead for Micro Focus, where he was responsible for overseeing the successful integrations resulting from the company’s merger and acquisition activity. Paul joined Micro Focus in April 2008 as the Group HR Director, and prior to joining Micro Focus, Paul spent 17 years with IBM and four years as Managing Director of a successful Executive HR consultancy business with clients such as Dell, Unilever, Yahoo and Sainsbury’s.
Chris Livesey - Senior Vice President, Revenue Growth and Strategy
Chris Livesey is the Senior Vice President of Motorola Europe, Middle EastRevenue Growth & Strategy, responsible for how we strengthen and Africainnovate our engagement with customers, to enable their success and maximum return on investment.
Chris has over 25 years of experience in the technology industry, holding a number of executive leadership positions including sales, marketing, product development, and consulting. He holds a BSc (Hons) in Mathematics and Statistics and a Master’s degree in Software Engineering, both from the University of Glasgow.
John Delk - Senior Vice President and General Manager of the CyberRes (Security) Product Group
John Delk is the Senior Vice President and General Manager of the CyberRes (Security) Product Group at Micro Focus. Prior to this role, he served as Chief Marketing Officer and Chief Product Officer. John joined Micro Focus in 2014 as part of the acquisition of the Attachmate Group where he had served as Vice President of Product Management and Marketing for NetIQ. Prior to that, he spent seven years in various leadership positions at Novell in product management, sales, and services.
John has over 35 years of experience in the IT industry working for numerous other companies holding roles including Managing Partner at BearingPoint/KPMG Consulting and a Vice President at EDS. He holds a master’s degree in Computer Science from Georgia Institute of Technology and a bachelor’s degree from Furman University with a double major in Mathematics and Computer Science.
Nick Wilson – Worldwide President of Sales
Nick Wilson is the Worldwide President of Sales for Micro Focus. Nick leads our Sales, Services, Support and Customer Success teams worldwide and is responsible for delivering on our commitment to our customers’ success. Through his leadership the teams at Micro Focus are jointly focused on offering effective solutions that drive value, and delivering a positive, seamless, end-to-end customer experience.
Nick has spent more than 30 years in the IT industry, having held several senior leadership roles, including Managing Director for UK and South Pacific for HP/HPE, President & CEO of EMEA Outsourcing (the UK & Nordics business for CSC), Managing Director at UNISYS UK, and General Manager of IBM’s Global Services business in the UK, Ireland and South Africa. Through this broad experience across sales, services, support, education and software development, Nick understands the complexities and challenges companies face in the ever-changing and evolving business where technology is critical.
In addition to his corporate contributions, Nick is a passionate STEM ambassador and vocational education advocate, and has worked with various institutions to develop programs to support science, engineering and technology careers.
Eric Varness - Chief Marketing Officer
Eric Varness is the Chief Marketing Officer for Micro Focus. Eric joined Micro Focus in 2014 as part of the acquisition of the Attachmate Group where he had served as Vice President of Product Management and Marketing for Novell and Attachmate. Eric joined the Attachmate Group in 2003 and has held a variety of leadership positions across Marketing, Product Management, and Sales.
Eric has over 30 years of experience in the IT industry working for both startups and large companies across a variety of market sectors including Call Center automation, Process Automation, and Collaboration Solutions. Eric holds a bachelor’s degree from the University of Washington.
Jane Smithard - Chief Legal Officer and Group General Counsel
Jane has more than 25 years’ experience as a lawyer in the IT industry and software sector. She has worked with Micro Focus for over 20 years providing a wide range of commercial and corporate legal services, from leading the efforts through the 2005 IPO to driving the legal aspects of the group’s mergers, acquisitions and divestitures strategy including the acquisition of HPE Software business and divestiture of SUSE. Jane leads a team of approximately 60 lawyers and other professionals worldwide, the majority of whom are focused directly on supporting the Company’s commercial teams and business.
Jane qualified as a Barrister and was called to the Bar of England and Wales in 1982. She has a BA (Hons) in Law, a postgraduate diploma in European Law from King’s College, London, and is a Fellow of the Chartered Institute of Arbitrators.
Susan Ferguson - Chief Human Resources Officer and SVP Business Operations
Susan is our Chief Human Resources Officer & SVP Business Operations. She is responsible for leading the HR organization in addition to managing business operations across the organization including driving strategic initiatives.
Susan joined Micro Focus from Hewlett Packard Enterprise (HPE) Software in 2017 where she held the position of Vice President, Worldwide Indirect Sales. Previously Susan held the role of Vice President, Strategy & Planning, Chief of Staff to the EVP of HPE Software business and prior to that was Vice President Worldwide Alliances & Channels, Big Data. Susan was recognized among CRN’s Power 100 Women of the Channel during her tenure.
Before joining HPE, Susan was Vice President at Oracle Corporation and earlier at Sun Microsystems, where she led regional and global services, indirect sales and functional organizations. At Sun, Susan previously led global legal teams with responsibility for sales, marketing, channel, supply chain and anti-trust matters. Susan graduated with a LL.B Honors degree and is a qualified attorney and mediator.
Rohit de Souza - Senior Vice President, General Manager of the ITOM Product Group and the ADM Product Group, Leader of the CTO office and Product Security
Rohit de Souza is the Senior Vice President, General Manager of the ITOM Product Group and the ADM Product Group. Rohit also leads the CTO office and Product Security at Micro Focus. Rohit and his team are responsible for developing and delivering enterprise-scale IT management solutions that integrate with, and work alongside, legacy and cloud tools to simplify the complexity of managing hybrid IT environments, reliably scaling Agile and DevOps across all your environments from mainframe to cloud, and accelerating application delivery at high speed with low risk.
Prior to this role, Rohit served as the President and Chief Executive Officer at Actian Corporation. While there, Rohit oversaw the transformation of this global organization, serving over 3,000 customers, bringing a unified approach to the next generation of hybrid data management. Prior to this, Rohit was President and acting CEO at Beyondcore where he refocused the product and GTM strategy of this analytics and smart data discovery firm and was also VP & GM of HPE Software’s Information Analytics (IDOL) business.
Rohit holds dual master’s degrees in engineering from the University of California at Berkeley and an undergraduate degree in engineering from Madras University in India.
Colin Mahony* - Senior Vice President and General Manager Vertica*
Colin Mahony led the Vertica Product Group for Micro Focus, spanning global GTM, Product Strategy, R&D, Professional Services and Support. Colin had led his team to deliver industry leading in-database machine learning capabilities and advanced analytics with the performance and scale needed to power the world’s most data driven enterprises. Colin is known for his industry thought leadership, technical expertise and business acumen.
In 2011, Colin joined HP through the Vertica acquisition and has since led the business. Prior to Vertica, Colin was a Vice President at Bessemer Venture Partners and before that he worked at Lazard Technology Partners. Earlier in his career, Colin was Chief Executivea Senior Analyst at the Yankee Group, serving as an industry analyst and consultant covering databases, BI, middleware, application servers, and ERP systems. Colin earned an MBA from Harvard Business School and a bachelor’s degree in Economics with a minor in Computer Science from Georgetown University.
* Colin left the business in December 2021.
Neil Fowler - Vice President and General Manager, AMC Product Group
Neil Fowler leads the AMC Product Group for Micro Focus. Neil joined Micro Focus in 1991 and played a key role in R&D as a technical architect in Enterprise Solutions. With significant experience of IBM U.K. Limited.helping hundreds of customers deliver modernization projects he has been at the forefront of product architecture and strategy across COBOL, Mainframe Solutions, CORBA and Host Connectivity.
Over the past 30 years Neil has held a number of different leadership roles responsible for strategy, acquisition integration and product design and delivery. Prior to his current role, Neil was Vice President for Engineering in AMC. He has a degree in politicsPhysics and economicsComputer Science from OxfordBrunel University.
Scott Richards - Vice President and General Manager of the IM&G Product Group
Scott Richards is the Vice President and General Manager of the IM&G product group at Micro Focus. Prior to this role, he served as the Vice President of Worldwide Engineering for the IM&G product group.
Scott joined Micro Focus in 2014 as part of the acquisition of the Attachmate Group where he served as Senior Director of Engineering as well as in several other leadership roles.
Scott has over 25 years of experience in the high-tech industry working for both startups and large corporations including leadership roles at 3Com and VP of Product Development and Marketing at Senforce Technologies. Scott holds a master’s degree in International Management from Thunderbird School of International Management at Arizona State University and a bachelor’s degree from Utah State University with a major in Marketing and a minor in Japanese.
Suzanne Chase – Group Company Secretary and Head of Assurance
Suzanne is Group Company Secretary and Head of Assurance. She is a solicitor with over 30 years expertise in M&A, governance, compliance, risk and assurance. Previous positions held have been Group General Counsel at Wickes plc, Group General Counsel and Company Secretary at The Big Food Group plc, General Counsel and Company Secretary at Morse plc, General Counsel and Company Secretary at Parity Group plc and Compliance Partner at King Sturge LLP (now part of JLL). She is a member of The Law Society of England and Wales. Suzanne is also a Fellow of the Royal Society of Arts, Manufactures and Commerce.
Any arrangement or understanding with major shareholders, customers, suppliers or others, pursuant to which any person referred to above was selected as a director or member of senior management can be found in note 29 “Related party transactions” of the Consolidated financial statements in Item 18.
Aggregate compensation paid to the Group’s directors and members of key management bodies are disclosed below. In addition, further information on the compensation of the Group’s directors is disclosed. This is based upon information extracted from the Remuneration report in the UK Annual Report and Accounts prepared in line with the recommendations of the UK Corporate Governance Code.
Year ended October 31, 2021 | ||||
| Aggregate compensation including fees paid to non-executive directors and key management | $m | |||
| Short-term benefits | 13.5 | |||
| Share based payments | 1.9 | |||
| Total compensation | 15.4 | |||
The figures above include the executive management team, executive directors and non-executive directors. There are no post-employment benefits.
Single figure for total remuneration of executive directors
The table below shows the single figure for total remuneration for executive directors for the financial year ended October 31, 2021, together with their respective figures for the year ended October 31, 2020 as shown in last year’s report.
(a) Base Salary1 | (b) Benefits in kind2 | (c) Annual bonus3 | (d) LTIP4 | (e) Pension5 | (f) Other6 | Total | Total Fixed Remuneration Total of (a), (b) and (e) | Total Variable Remuneration Total of (c) and (d) and (f) | |||||||||||||||||||||||||||||
| Executive Directors | £’000 | £’000 | £’000 | £’000 | £’000 | £’000 | £’000 | £’000 | £’000 | ||||||||||||||||||||||||||||
| Stephen Murdoch | 2021 | 850 | 22 | 733 | - | 127 | - | 1,732 | 1,000 | 733 | |||||||||||||||||||||||||||
| 2020 | 850 | 24 | 283 | - | 127 | - | 1,284 | 1,002 | �� | 283 | |||||||||||||||||||||||||||
Matt Ashley7 | 2021 | 175 | 15 | 151 | - | 9 | 450 | 800 | 200 | 601 | |||||||||||||||||||||||||||
| 2020 | - | - | - | - | - | - | - | - | - | ||||||||||||||||||||||||||||
Brian McArthur-Muscroft 8 | 2021 | 433 | 15 | - | - | 60 | - | 509 | 509 | - | |||||||||||||||||||||||||||
| 2020 | 600 | 25 | 199 | - | 90 | - | 914 | 715 | 199 | ||||||||||||||||||||||||||||
| 1 | Base salary is the amount earned during the period in respect of service as a director. For Brian McArthur-Muscroft, an amount for unused but accrued holiday is also included for year ended October 31, 2021. |
| 2 | Benefits include car allowance, private medical/dental insurance, group income protection and life assurance. There has been no change in the benefits offered to directors in year ended October 31, 2021 versus year ended October 31, 2020. The reduction in the benefits for Stephen Murdoch from the year ended October 31, 2020 to 2021 reflects reductions in employer costs in providing private medical/ dental insurance and group income protection. For Matt Ashley, an amount is included which reflects the grossed up value of travel and accommodation related to time spent in the Newbury office. |
| 3 | Annual bonus reflects payment for performance during the year in respect of service as a director. One-third of the annual bonus amount included in the table above is deferred into an award over shares which vests after three years. Dividend equivalents accrue on the deferred share awards. |
| 4 | The zero amount for LTIP for year ended October 31, 2021 for Stephen Murdoch reflects that the performance conditions for the 2018 and 2019 were not met. The 2018 LTIP award (with performance period ending April 30, 2021) was granted to Stephen Murdoch in September 2018 as a top-up to his September 2017 award to reflect his appointment as CEO. The performance period ending April 30 reflected the company’s previous year-end before this was change to October 31. The 2018 award lapsed on July 1, 2021. The 2019 award was a regular annual LTIP award granted in February 2019 (with performance period ending October 31, 2021). The 2019 award will lapse on February 8, 2022. The zero amount for LTIP for year ended October 31, 2020 reflects the lapse of the 2017 LTIP award on July 7,2020 due to the performance conditions not being met. No discretion was applied by the remuneration committee in determining the LTIP vesting outcomes in year ended October 31, 2021 or in year ended October 31, 2020. |
| 5 | All pension amounts paid by the Company in the year ended October 31, 2021 are cash in lieu of pension allowances. In accordance with the current Remuneration Policy, the incoming CFO’s pension contribution rate of 5% of base salary is in line with the rate applicable to employees generally in the UK. The CEO will transition from his current contribution rate (15% of base salary) to the rate applicable to employees generally in the UK (currently 5%) at the end of 2022. |
| 6 | As part of his recruitment arrangements, Matt Ashley received a cash buy-out payment of £450,000 which reflected a cash bonus which he was due to receive from his prior employer in October 2021 but which was forfeited on leaving to join Micro Focus. This payment was disclosed on June 1, 2021 in the announcement about Matt Ashley’s appointment as Micro Focus CFO and is in accordance with the company’s approved policy on recruitment remuneration (see page 69 - 70 of the 20-F for the year ended October 31, 2019 which is available at form-20f-for-12-months-ending-the-31-october-2019-report.pdf (microfocus.com) and has been filed with the SEC). |
| 7 | Matt Ashley started employment on June 28, 2021 and was appointed to the board as CFO with effect from July 1, 2021. All amounts in the table above reflect the period of service as a director. |
| 8 | Brian McArthur-Muscroft stepped down from the board on June 30, 2021. |
| 9 | Some figures and sub-totals add up to slightly different amounts than the totals due to roundings. |
Annual bonus for the financial year ended October 31, 2021
The target bonus opportunity for executive directors is 75% of base salary (maximum 150% of base salary). Set out below is a summary of performance against each financial measure and the personal achievement component and the resulting payout for the year ended October 31, 2021.
Financial target ($m)1 | Weighted payout% | |||||||||||||||||||||||||||||||||||
Performance measure | Weighting | Threshold2 (0%) | Target (50%) | Maximum (100%) | Achievement | Achievement vs target | Payout% | Stephen Murdoch | Matt Ashley3 | |||||||||||||||||||||||||||
| Adjusted EBITDA | 60 | % | $ | 994 | $ | 1,046 | $ | 1,098 | $ | 1,033 | 98.8 | % | 37.8 | % | 22.7 | % | 22.7 | % | ||||||||||||||||||
| Revenue | 20 | % | $ | 2,801 | $ | 2,858 | $ | 2,887 | $ | 2,878 | 100.7 | % | 84.1 | % | 16.8 | % | 16.8 | % | ||||||||||||||||||
| Key Personal Objectives (KPOs) | 20 | % | A description of the KPOs for the CEO and CFO is set out below. There were no KPOs for the prior Executive Chairman. | 18.0 | % | 18.0 | % | |||||||||||||||||||||||||||||
| Total | 100 | % | Payout % (of maximum bonus) | 57.5 | % | 57.5 | % | |||||||||||||||||||||||||||||
| Payout % (of FY21 salary) | 86.2 | % | 86.2 | % | ||||||||||||||||||||||||||||||||
| £ | 732,794 | £ | 150,869 | |||||||||||||||||||||||||||||||||
| 1 | Financial targets for bonus are based on FX rates which are set at the start of the financial year and the achievement is measured against the targets on a like-for-like basis. Therefore, the Adjusted EBITDA and revenue achievements shown above do not match the disclosed Adjusted EBITDA and revenue figures for the year ended October 31, 2021 in note 1 “Segmental reporting” of the Consolidated financial statements in Item 18 as these are based on actual FX rates. $1,033.3m Adjusted EBITDA achievement disclosed in the table above for bonus purposes equates to $1,040.2 million Adjusted EBITDA at actual FX rates and $2,877.5 million revenue achievement equates to $2,899.9 million at actual rates. |
| 2 | Payouts under the financial measures are 0% for threshold performance, 50% for target performance and 100% for achieving the maximum level of performance. Payouts are on a straight-line basis between threshold and target and between target and maximum. |
| 3 | Amounts disclosed for Matt Ashley reflect time served as a director in FY21, i.e. from July 1, 2021 to October 31, 2021. |
This results in overall bonus payouts of £732,794 for the CEO and £150,869 for the CFO. Two-thirds of the overall amount (£488,529 for the CEO and £100,580 for the CFO) will be paid in cash in March 2022 and the remaining one-third is subject to deferral into an award over shares. Deferred share awards (with a current face value of £244,265 for the CEO and £50,290 for the CFO) will vest after three years, i.e. in second quarter year ended October 31, 2025. The deferred share awards are not subject to any further performance conditions, but they are subject to malus and clawback and they include a right to dividend equivalents over the three-year vesting period.
Set out below are details of achievement against the year ended October 31, 2021 KPOs for the CEO and CFO.
| KPO | Relative weighting | Achievement vs KPO | Weighted payout % | |
| CEO | ||||
Key business objectives Complete the transition to one-single enterprise-wide platform as effectively as possible with minimum disruption to day-to-day operations and agree specific actions for further business simplification. Improve our product positions across the portfolio making us more competitive and delivering the innovation our customers want. Create one single go-to-market organization that can deliver consistent, sustained improvement to our revenue performance through improved sales productivity and the more effective alignment of our resources to opportunity. Continue to improve governance and structures to monitor and respond quickly to ongoing impact of Covid-19. Continue to strengthen the leadership team through rigorous succession planning and talent management. | 10.0% | Business Systems and Infrastructure – Successfully completed the transfer to a single Enterprise Platform by transferring Stack B to Stack C in H1 FY21 and Stack A to Stack C in H2 FY21, enabling the company to unlock further efficiencies. Closed two financial quarters (including peak Q4 trading period) on new systems with no business impacting issues. – Through an Activity Insight Survey, identified and initiated key change initiatives (functional and cross-functional) to improve opportunities, simplify processes and make decisions faster. Examples include moving from six quoting systems to one, reducing SaaS applications from 70 to 20, moving 2,000 business applications to 500 and a 75% reduction in the number of different types of sales compensation plans in operation. Product portfolios – Re-architected key solutions within each portfolio (Vertica, Digital Safe, ArcSight, OpsBridge) to better position the portfolio to focus on growth opportunities, improved product innovation and related market recognition. – Dependencies on third party products embedded in the core of some of our key solutions have been removed, comprehensive artificial intelligence, machine learning and analytics capabilities delivered in every portfolio and rearchitected many products to support new cloud and hybrid deployment options. – In every portfolio, we have introduced new SaaS offerings, improved the existing SaaS offerings and invested significantly in SaaS delivery infrastructure. Go-to-market organization – Successfully created one single go-to-market organization with a consistent global approach. – Aligned resources with greater specialist skillsets and consistency of execution, built deeper levels of specialism and alignment by portfolio. – Implemented a management system aimed at ensuring execution to a common set of standards and levels of accountability, supported by a single set of sales tools and improved data accuracy. – Established a dedicated customer success team supported by increased levels of specialist resources within Maintenance Renewals and Professional Services. Covid-19 – Further enhanced the governance and structures in place to be able to monitor and respond quickly to ensure wellbeing of employees and minimize business disruption through Covid-19, including implementing a package of measures in the Summer of 2021 to address the extreme challenges faced by colleagues in India. – Maintained operational effectiveness, product development cadence, customer support and delivery and transitioned core systems during constraints of global pandemic and local lockdowns. Succession planning and talent management – Completed a global calibration of talent and succession for key talent to include executives and emerging talent across the business and implemented individual development plans for executive potential successors and emerging talent. – Recruited new executive leadership in critical product and support functions. | 9.5% | |
| KPO | Relative weighting | Achievement vs KPO | Weighted payout % | |
CEO ESG Milestones Ensure that we have an appropriate ESG program reflecting focus on our employees, customers, shareholders and partners. This must be part of our corporate governance responsibilities, including continuous improvements in our control/SOX processes. | 10.0% | General – Adopted, aligned and communicated support for five of the United Nations Sustainable Development Goals (no poverty, quality education, gender equality, decent work and economic growth and climate action). Environment – Target of achieving a normalized Greenhouse Gas (“GHG”) reduction of 2-5% by the end of FY21, based on our 2018 baseline data, was achieved. Comparing like-for-like FY20 to FY21 global footprint, we achieved a GHG emissions reduction of -7.8%. Due to the increase in the amount of properties in scope from 64% in FY20 to 67.7% in FY21, there has been an overall increase of +1.5% in GHG emissions. – Met target of increasing the percentage of our energy which comes from renewable sources globally from 40% to over 50% by the end of FY21 (52% achieved). – Established a cross-functional Environmental Working Group, which includes a focus on the Taskforce for Climate-related Financial Disclosures (TCFD). Employees and community – Published and implemented a global inclusion and diversity (I&D) policy, created new I&D strategy through FY25 with oversight by recently formed ESG Committee and agreed a set of internal I&D goals for FY22. – Improved employee engagement scores from the FY19 baseline, maintained “My Voice” employee survey participation levels at over 85% and grew membership of Employee Resource Groups by 34% in FY21 from FY20. – Target of having 25% of our employees taking part in community volunteering by the end of FY21 was not fully achieved. This goal for FY21 was largely based on in person volunteering, which was significantly impacted by COVID-19. Nonetheless, we achieved 11% of employees volunteering in FY21, which is an increase from FY20 and we introduced an option (supported by technology) to enable virtual volunteering with 976 employees taking part in virtual volunteering in FY21. Customers and suppliers – Increased our Customer double-blind Net Promotor Score to 47 for FY21 (from 45% for FY20) and our double-blind Relative Net Promotor Score to +5 compared to the competition for FY21 (from 0 for FY20). – Established and implemented a global diverse supplier program which ensures that we proactively identify and encourage diverse suppliers to compete for our business and build long-term relationships with them. Governance – Implemented an ESG framework and program reflecting focus on our employees, customers, shareholders and partners, including appointment of an ESG Board Committee to provide Board ESG focus and oversight and establishment of an ESG cross functional Working Group to ensure that ESG considerations are part of “business as usual” decision making processes at all levels and to develop the strategy going forward. – The Enterprise Risk Management framework was enhanced to include existing and new ESG risks and was approved by the Audit Committee. | 8.5% | |
| Total | 20.0% | Looking at the complete scorecard of achievement against all objectives for the year, the committee considered that the CEO had performed extremely well, highlighting in particular the completion of the transfer to a single enterprise platform and the significant progress which has been made on the turnaround plan, resulting in a KPO achievement of 90% (i.e. 18% out of a possible 20%). | 18.0% |
| KPO | Relative weighting | Achievement vs KPO | Weighted payout % | |
| CFO | ||||
3-year Plan Build a revised 3-year plan with specific goals for the exit of FY23 that will be the foundations for our execution plan going forward and for communication externally to shareholders and the market more broadly. | 10% | – The 3-year plan has been revised and the core financial objectives for the next two financial years and our longer-term ambitions were laid out in our November 30, 2021 Strategy Update. – The new plan, developed by the CFO in conjunction with the CEO, reflects a reset of expectations with realistic and achievable goals which lays the foundations for the business transformation. A granular operational plan to execute the strategy has been put in place, which includes the appointment of a Chief Transformation Officer to co-ordinate multiple workstreams and the successful sale of the Digital Safe business. – The external financial KPIs were refined to provide greater clarity on the Group’s financial performance and more closely align the metrics to those used by the Group’s debt holder. The CFO has concluded that there will be no more integration costs associated with the HPE Software acquisition classified as exceptional spend going forward. – The CFO has laid foundations for future financial effectiveness, having assessed and made recommendations on how we leverage advisors and formal relationships and our overall use of consultancies to improve effectiveness and value for money in the mid-term. | 9.5% | |
CFO Business Systems and Infrastructure Support the effective transition to a single Enterprise Platform overall and specifically from a core financial perspective. | 10% | – Successfully completed the transfer to a single Enterprise Platform by transferring Stack A to Stack C in H2 FY21, enabling the company to unlock further efficiencies. – FY21 Q3 and Q4 were successfully delivered on the new platform. Business as usual has not been impacted by the transition with minimal disruption to revenue and the payment of employees and suppliers. | 8.5% | |
| Total | 20.0% | The Committee recognized that in 4 months, the CFO has had a significant impact, in particular in revising the 3-year plan, resulting in a KPO achievement of 90% (i.e. 18% out of a possible 20%). | 18.0% |
Share Awards
The Group’s executive directors and members of key management bodies participate in the Group’s Long-term Incentive Plan and the executive directors participate in the Deferred Share Bonus Plan. Descriptions of these plans including the vesting criteria and specific awards under each plan for the Group’s executive directors are included below.
Aggregate information for awards granted in the year ended October 31, 2021 in relation to each plan for the directors and members of key management bodies:
Number of awards | Range of exercise prices (pence) | Expiry Dates | |
| Long-term Incentive Plan | 1,345,515 | nil | March 26, 2031 |
| Deferred Share Bonus Plan | 33,123 | nil | March 26, 2024 |
In addition, the directors and senior management are eligible to participate in the Sharesave or Employee Stock Purchase Plan (“ESPP”) depending on their location. Descriptions of these plans are included in note 28 “Employees and directors” of the Consolidated financial statements in Item 18. Aggregate information in relation to these schemes for the directors and members of key management bodies for the year ended October 31, 2021:
Number of options | Exercise prices (pence) | Expiry Dates | |
| Aggregate Sharesave and ESPP options | 10,000 | 344.8 pence | November 1, 2023 |
Executive Directors
Lapse of LTIP awards
The 2018 LTIP award (with performance period ending April 30, 2021) was granted to Stephen Murdoch in September 2018 as a top-up to his September 2017 award to reflect his appointment as CEO in March 2018. This award lapsed on July 1, 2021 due to the performance condition not being met. The performance condition for the 2019 annual LTIP award (with performance period ending October 31, 2021) granted to Stephen Murdoch in February 2019 has not been met and this award will lapse on February 8, 2022. Both the 2018 and 2019 LTIP awards were granted under the Directors’ Remuneration Policy in effect before the approval of the current Remuneration Policy at the Annual General Meeting in March 2020.
The performance condition for these awards was based on average aggregate EPS growth in excess of RPI over the three years ended April 30, 2021 (2018 award) and October 31, 2021 (2019 award), as set out in the table below:
Average aggregate EPS growth of the Company in excess of RPI over the performance period | Vesting percentage of the shares subject to an award | Achievement against the percentage range | Resulting vesting percentage | Number of awards lapsing |
| Less than 3% p.a. | 0% | Less than 3% p.a. | 0% | 2018 award1: 67,537 (lapsed July 1, 2021) 2019 award2: 101,190 (will lapse February 8, 2022) |
| Equal to 3% p.a. | 25% | |||
| Between 3% and 9% p.a. | Between 25% and 100% on a straight-line basis | |||
| Equal to or above 9% p.a. | 100% |
| 1 | The aggregate Diluted Adjusted EPS3 over the performance period of 542.21 cents was below the minimum threshold aggregate EPS required of 627.55 cents. |
| 2 | The aggregate Diluted Adjusted EPS3 over the performance period of 505.52 cents was below the minimum threshold aggregate EPS required of 687.30 cents. |
| 3 | Adjusted EPS is defined as Basic EPS where the earnings attributable to ordinary shareholders are adjusted by adding back all exceptional items including the profit on the disposal of discontinued operation, share-based compensation charge and the amortisation of intangibles acquired in a business combination |
Scheme interests awarded during the financial year ended October 31, 2021
LTIP – nil cost options
Executive director | Date of grant | Basis on which award is made | Face value of award at grant1 | Percentage of maximum which would be received if threshold performance achieved | End of performance period | ||||||
| Stephen Murdoch | March 26, 2021 | Grant of award over 350,515 shares (200% of salary) | £1,699,998 | 0 | % | October 31, 2023 | |||||
| 1. | The grant face value of the LTIP award granted on March 26, 2021 to the CEO was calculated based on the closing mid-market share price on the business day before grant of £4.850. |
The year ended October 31, 2021 Recruitment LTIP to the new CFO Matt Ashley could not be granted in year ended October 31, 2021 due to dealing restrictions and was therefore granted at the same time and with the same performance measures, targets and period as the year ended October 31, 2022 LTIP awards on December 17, 2021. This award was part of Mr. Ashley’s recruitment terms and was mentioned in the announcement about his appointment on June 1, 2021. Mr. Ashley’s year ended October 31, 2021 LTIP Recruitment award was granted over 312,593 shares with a total face value at grant of £1,050,000 (200% of salary) based on the closing mid-market share price on the business day before grant of £3.359. The performance period for Mr. Ashley’s FY21 LTIP Recruitment award ends on October 31, 2024 and vesting starts at 0% if threshold performance is achieved.
The LTIP award granted to the CEO in the year ended October 31, 2021 has the following performance conditions based on Cumulative Adjusted Free Cash Flow (80% weighting) and Relative Total Shareholder Return (20% weighting) measured over a three-year period (years ended October 31, 2021, 2022 and 2023). The performance measures, targets and payout percentages are set out below:
Cumulative Adjusted Free Cash Flow (80% weighting) | Company TSR relative to FTSE 250 (excluding Investment Trusts) Index (20% weighting) | Payout % for this element | ||||
| Threshold | $100m below Target | In line with Index | 0 | % | ||
| Target | Commercially sensitive | Exceed Index by 20% | 50 | % | ||
| Maximum | $200m above Target | Exceed Index by 40% | 100 | % | ||
Vesting is on a straight-line basis between threshold and target, and between target and maximum.
Adjusted Free Cash Flow means cash generated from operations adjusted for interest payments, bank loan costs, tax payments, capital expenditure and lease payments and excludes the cash impact of exceptional items. This is in line with the definition of Adjusted Free Cash Flow in Item 5.D. For the year ended October 31, 2021 LTIP award granted to the CEO, Adjusted Free Cash Flow will be measured on a cumulative basis over the three financial years ending October 31, 2021, October 31, 2022 and October 31, 2023.
The Adjusted Free Cash Flow Target is considered commercially sensitive and will be disclosed at the end of the performance period. Due rigor was applied by the Remuneration Committee in setting the targets and the approved targets were deemed to be appropriate in the context of the long-term financial plan.
Relative total shareholder return (“TSR”) is measured over the same three financial years. The awards will vest three years from grant, subject to achievement of the performance measures. A two-year holding period will apply post-vesting, during which time executive directors are required to retain any net (after tax) vested shares. Executive Directors are entitled to dividend equivalents in accordance with the rules of the LTIP and the approved Directors’ Remuneration Policy.
Outstanding share-based awards
The tables below set out vested but unexercised nil-cost options, unvested nil-cost options and unvested deferred bonus shares held by executive directors who served on the board during the year ended October 31, 2021, including details of awards granted, nil-cost options exercised and awards vested and lapsed during the year of reporting.
All outstanding unvested nil-cost options are subject to performance conditions. Deferred bonus shares are not subject to performance conditions.
Between October 31, 2021 and the date of this report, there have been the following changes to the LTIP awards held by the executive directors which are not shown in the table below:
– On December 17, 2021, a year ended October 31, 2022 LTIP award was granted to Stephen Murdoch over 506,103 shares.
– On December 17, 2021, a year ended October 31, 2021 Recruitment LTIP and a year ended October 31, 2022 LTIP award were granted to Matt Ashley over 312,593 shares each (625,186 in total).
The year ended October 31, 2021 Recruitment LTIP award was part of Mr. Ashley’s recruitment terms and could not be granted sooner due to dealing restrictions.
All the LTIP awards granted on December 17, 2021 have an exercise period of the date of vesting (which is the later of the date the remuneration committee determines the outcome of the performance measures and the day after the full year ended October 31, 2024 results announcement) to December 16, 2031
Micro Focus International plc Incentive Plan 2005 (“LTIP”) – nil-cost options
| Grant date | Number at November 1, 2020 | Number granted in the financial year | Number exercised in the financial year | Number lapsed in the financial year | Number at October 31, 2021 | Dates for exercise | |
| Stephen Murdoch | September 13, 2016 | 39,640 | - | - | - | 39,640 | July 26, 2019 to July 25, 2026 |
Stephen Murdoch1 | September 20, 2018 | 67,537 | - | - | 67,537 | - | September 20, 2021 to n/a |
Stephen Murdoch2 | February 18, 2019 | 101,190 | - | - | - | 101,190 | n/a will lapse |
Stephen Murdoch3 | April 23, 2020 | 250,000 | - | - | - | 250,000 | April 23, 2023 to April 22, 2030 |
Stephen Murdoch4 | April 23, 2020 | - | 350,515 | - | - | 350,515 | March 26, 2024 to March 25, 2031 |
Brian McArthur-Muscroft5 | November 22, 2018 | 80,482 | - | - | 80,482 | - | n/a |
Brian McArthur-Muscroft5 | November 22, 2018 | 80,482 | - | - | 80,482 | - | n/a |
Brian McArthur-Muscroft5 | April 23, 2020 | 300,000 | - | - | 300,000 | - | n/a |
Kevin Loosemore2 | February 18, 2019 | 52,083 | - | - | - | 52,083 | n/a – will lapse |
| 1 | The performance condition for the 2018 LTIP awards required that cumulative EPS growth over a three-year performance period starting on May 1 preceding the date of grant is at least equal to RPI plus 3% per annum (at which point 25% of awards will vest) and for full vesting the aggregate EPS growth will be required to be RPI plus 9% per annum. Straight-line vesting applied between these points. This award lapsed in full on July 1, 2021 as the minimum performance condition was not met (see page 50 for further details). |
| 2 | The performance condition for the 2019 LTIP awards requires that cumulative EPS growth over a three-year performance period starting on November 1,preceding the date of grant is at least equal to RPI plus 3% per annum (at which point 25% of awards will vest) and for full vesting the aggregate EPS growth will be required to be RPI plus 9% per annum. Straight-line vesting will apply between these points. Kevin Loosemore’s award of 89,285 nil-cost options was pro-rated to 52,083 on leaving the Company to reflect time served to August 13, 2020. The performance measure has been tested and these awards will lapse in full on February 8, 2022 as the minimum performance condition was not met. |
| 3 | The performance condition for the awards granted during the year ended October 31, 2020 LTIP is disclosed on page 50. |
| 4 | The performance condition for the awards granted during the year ended October 31, 2021 LTIP is based on 80% Adjusted free cash flow and 20% TSR. |
| 5 | All of Brian McArthur-Muscroft’s outstanding LTIP awards lapsed on January 8, 2021 following the announcement that he was leaving the Company. |
The aggregate amount of gains made by directors on the exercise of options during the financial year was zero.
Deferred Share Bonus Plan (“DSBP”) – conditional awards
Executive director | Date of grant | Number at November 1, 2020 | Number granted in the financial year | Number vested in the financial year | Number lapsed in the financial year | Number at October 31, 2021 | Date of release |
| Stephen Murdoch | February 28, 2019 | 10,013 | - | - | - | 10,013 | February 28, 2022 |
| Stephen Murdoch | March 26, 2021 | - | 19,416 | - | - | 19,416 | March 26, 2024 |
| Brian McArthur-Muscroft | March 26, 2021 | - | 13,705 | - | - | 13,705 | March 26, 2024 |
Non-executive directors
Aggregate compensation including fees paid to non-executive directors
Year ended October 31, 2021 | ||||
| $m | ||||
| Short-term benefits | 1.3 | |||
| Share based payments | - | |||
| Total compensation | 1.3 | |||
Single figure for total remuneration of non-executive directors
No changes were made to the fee structure for non-executive directors. The following table sets out the single figure for total remuneration of non-executive directors for the year ended October 31, 2021, together with their respective figures for the year ended October 31, 2020 as shown in last year’s report.
| Fees and benefits | ||||||||
Non-executive directors | 2021 (Year) | 2020 (Year) | ||||||
£’000 | £’000 | |||||||
Greg Lock1 | 401 | 285 | ||||||
| Karen Slatford | 120 | 120 | ||||||
| Richard Atkins | 90 | 90 | ||||||
| Amanda Brown | 90 | 90 | ||||||
Lawton Fitt2 | 80 | 80 | ||||||
Pauline Campbell3 | 6 | - | ||||||
| Robert Youngjohns | 70 | 38 | ||||||
Sander van ’t Noordende4 | 70 | 29 | ||||||
| 1 | Greg Lock’s benefits value reflects private medical and dental cover (single person coverage). |
| 2 | Lawton Fitt receives an additional fee of £10,000 per annum due to her SEC and SOX experience. |
| 3 | Pauline Campbell joined the board on October 1, 2021. |
| 4 | Sander van ‘t Noordende’s GBP fee is paid to him in US dollar (converted based on the average monthly FX rate in the month prior to payment). |
Role of the board
The board leads and controls the Company and has collective responsibility for promoting the long-term success of the Group. While the board delegates some responsibilities to its committees or, through the Chief Executive Officer, to management, it has agreed a formal schedule of matters that are specifically reserved for its consideration and are publicly available on the investor relations section of the Company’s website. These include key areas such as:
| - | Strategy and Management – including the Group’s purpose, values and strategy, annual operating and capex budget approval, oversight of operations ensuring maintenance of sound management and internal control systems, reviewing performance in light of the Group’s strategy and objectives, extension of activities into new business or geographical areas and any decisions to cease any material part of the Group’s business; |
| - | Structure and Capital – including changes to the Group’s capital structure such as share issues and buybacks or reduction in capital, major changes to the Group’s corporate structure including material acquisitions and disposals and changes to the Group’s management and control structure; |
| - | Financial reporting and Controls – including results announcements, dividend policy and declarations, significant changes in accounting policies or practices, treasury policies and the Annual Report; |
| - | Internal Controls – including monitoring the effectiveness of the Group’s risk management and internal controls processes; and |
| - | Material Contracts Approvals; Communications with Shareholders; Board membership (following recommendations from the Nomination committee); Approval of Remuneration Policy and Delegations of Authority. |
At each meeting, the board reviews progress of the Group towards its objectives and receives papers on key subjects in advance of each board meeting. These typically cover:
| – | Strategy and budgets; |
| – | Business and financial performance; |
| – | Product plans and development; |
| – | Corporate activities; |
| – | Human resources; |
| – | ESG activities; |
| – | Investor relations; and |
| – | Corporate governance. |
While the board retains overall accountability for and control of the Company, the executive directors are responsible for conducting the day-to-day management of the business. The review of the Group’s principal business activities is the responsibility of the Operating committee. The Operating committee comprises the Chief Executive Officer, the Chief Financial Officer, the Chief Operating Officer, Chief Human Resources Officer and Vice President of Business Operations and the Chief Legal Officer, and is chaired by the Chief Executive Officer, Stephen Murdoch.
Roles of board members
The non-executive Chairman has responsibility for leading the board, including setting the agenda (in conjunction with the Senior Independent Director and the Company Secretary), style and tone of board discussions to promote effective decision making and constructive debate and for shaping the culture of the boardroom. He is also responsible for shareholder and stakeholder engagement, including listening to the views of the workforce, customers and other stakeholders and ensuring that their views are conveyed to the board as a whole. He chairs board meetings, facilitating the effective contribution of non-executive directors by drawing on their skills, experience and knowledge and ensuring that the board is effective in all aspects of its role, and for upholding the highest standards of integrity and probity. He also chairs shareholder meetings and is responsible for ensuring effective communication with shareholders.
The Senior Independent Director meets or speaks with the Chairman regularly, and will work with the Chairman and other directors to resolve any significant issues which may arise, acting as an intermediary for other non-executive directors if necessary; and is also available to shareholders if they have concerns in circumstances where contact through the normal channels of Chairman, CEO or CFO has either failed to resolve or is inappropriate. Each of the non-executive directors has been appointed for a specific term, subject to annual re-election by shareholders. The independent non-executive directors comprise a majority of the board.
In line with the 2018 UK Corporate Governance Code, Karen Slatford (our Senior Independent Director) is appointed to the role of non-executive director responsible for workforce engagement, in light of her in-depth and longstanding knowledge of the Group and its businesses. The board receives regular reports on workforce engagement activities (including feedback on all areas resulting from panel sessions) for its review, consideration and action.
The executive directors are responsible for developing the Group’s strategy and proposing the budget for board approval and are accountable to the board through the Chief Executive Officer. They are also responsible for the financial and operational performance of the Group and, in conjunction with the operating committee, they are collectively responsible for the day-to-day running of the business. There is a clear and documented division of responsibilities between the non-executive Chairman, who is responsible for running the board, shareholder and stakeholder engagement, and the Chief Executive Officer, who is responsible for strategy, investment and financing, risk management and the day-to-day operation of the business. The role of the Senior Independent Director is also documented.
The role of the non-executive directors is to ensure that independent judgement is brought to board deliberations and decisions and to provide constructive challenge as appropriate. They promote the highest standards of integrity, probity and corporate governance throughout the Company. The non-executive directors possess a wide range of skills and experience, relevant to the development of the Company, which complement those of the executive directors.
The non-executive directors, led by the Senior Independent Director, met regularly throughout the year in private session without executive directors in attendance.
The Company Secretary is accountable to the board through the Chief Financial Officer, to whom she reports. It is the responsibility of the Company Secretary to ensure that agreed board procedures are followed and all rules and regulations are complied with. The Company Secretary’s responsibilities include facilitating the induction and professional development of directors and ensuring the smooth flow of information between board members, between the board and its committees and between non-executive directors and senior management. In addition, all directors have direct access to the advice and services of the Company Secretary. Appointment of the Company Secretary is a matter for the whole board.
The responsibilities of the Chairman, Chief Executive Officer, Senior Independent Director, board and committees have been clearly defined and set out in writing and are available to download from the investor relations section of our website.
Executive directors’ service agreements
Executive directors’ service agreements at October 31, 2021:
| Executive director | Date of service contract | Notice period |
| Stephen Murdoch | April 16, 2014 | The agreement is terminable by either party on six months’ notice |
Matt Ashley 1 | May 31, 2021 | The agreement is terminable by either party on six months’ notice |
| 1 | Joined board on July 1, 2021. |
Non-executive directors’ terms of appointment
The non-executive directors’ terms of appointment are recorded in letters of appointment. The required notice from the Company and the non-executive director is three months in all cases except for the non-executive chairman who is required to give six months’ notice. The non-executive directors are not entitled to any compensation for loss of office and stand for election or re-election as appropriate at each AGM.
Details of the letters of appointment of each non- executive director who has served as a director of the Company at any time during the financial year ended October 31, 2021 are set out below:
| Non-executive director | Appointment date | Expiration date |
| Greg Lock | February 14, 2020 | February 14, 2023 |
| Karen Slatford | July 5, 2010 | July 5, 2023 |
| Richard Atkins | April 16, 2014 | April 16, 2023 |
| Amanda Brown | July 1, 2016 | July 1, 2025 |
| Lawton Fitt | October 17, 2017 | October 17, 2023 |
| Sander van ’t Noordende | June 2, 2020 | June 2, 2023 |
| Robert Youngjohns | April 16, 2020 | April 16, 2023 |
| Pauline Campbell | October 1, 2021 | October 1, 2024 |
All appointments of non-executive directors are subject to election by shareholders at the first AGM of the Company after appointment and to re-election on an annual basis thereafter.
Remuneration committee
Remuneration committee membership during the year ended October 31, 2021
During the financial year ended October 31, 2021, the committee comprised only of independent non-executive directors. The committee met six times during the period under review. The number of committee meetings attended by each director in the period was as follows:
| Committee member | Held | Number of meetings attended |
| Amanda Brown (Chair) | 6 | 6 |
| Richard Atkins | 6 | 5 |
| Lawton Fitt | 6 | 6 |
| Greg Lock | 6 | 6 |
| Robert Youngjohns | 6 | 6 |
| Sander van ’t Noordende | 6 | 6 |
Pauline Campbell1 | 1 | 1 |
| 1. | Pauline Campbell served as a director and member of the Remuneration committee from October 1, 2021. |
The committee invited members of management to provide views and give advice on specific topics. Management did not participate in discussions relating to their own remuneration. The Group Company Secretary attended each meeting as secretary to the committee.
Terms of reference
The committee is responsible for the remuneration arrangements for executive directors and members of the executive management team, and for providing general guidance on aspects of remuneration policy throughout the Group. The terms of reference reflect the 2018 UK Corporate Governance Code issued in June 2018. The key aspects of the terms of reference are as follows:
| - | Determine the remuneration policy for the Company’s Non-Executive Chairman and the executive directors and review its on-going appropriateness and relevance; |
| - | Determine the total individual remuneration packages of the executive directors and the executive management team, including salary, bonuses, incentive payments, share awards, pensions and other benefits; |
| - | Review the terms of executive service contracts for executive directors and the executive management team; |
| - | Review any material changes to pension and benefit arrangements for executive directors and the executive management team; |
| - | Agree the expenses policy for the Company’s Non-Executive Chairman and executive directors; |
| - | Develop the formal shareholding requirement policy, including post cessation, encompassing both vested and unvested shares; |
| - | Oversee the operation of the Company’s annual bonus plans, deferred bonus plans and long-term incentives as applied to executive directors and the executive management team, including award levels, performance conditions, payouts, and application of malus and claw-back where appropriate; |
| - | Review the design of all share incentive plans for approval by the board and shareholders; |
| - | Review the remuneration policies and practices across the Group and the alignment of workforce remuneration with culture; and |
| - | Produce the annual Directors’ Remuneration report. |
The committee’s terms of reference are published on the Company’s website, https://www.microfocus.com/en-us/governance-policies/committees-of-the-board
Audit committee
Attendance at committee meetings
During the year ended October 31, 2021, the committee comprised only of independent non-executive directors. The committee met six times during the period under review. The number of committee meetings attended by each non-executive director was relative to their time in office in the period and was as follows:
Director | Held | Attended |
| Richard Atkins | 6 | 6 |
| Amanda Brown | 6 | 6 |
Pauline Campbell1 | 1 | 1 |
| Lawton Fitt | 6 | 6 |
| Karen Slatford | 6 | 6 |
| Robert Youngjohns | 6 | 6 |
| 1 | Pauline Campbell served as a director and member of the audit committee from October 1, 2021. |
Composition of the committee
The Audit committee comprises Richard Atkins (who serves as its chair), Amanda Brown, Pauline Campbell, Lawton Fitt, Karen Slatford and Robert Youngjohns. All members of the committee are independent non- executive directors. The board considers that:
| - | for UK purposes, the committee chair, as a chartered accountant, has recent and relevant financial experience by virtue of previous executive and current non-executive responsibilities (details of which can be found in his biography) and that the audit committee as a whole has competence relative to the sector in which the Company operates; and |
| - | for US purposes, each of the Audit committee members is independent under the SEC and NYSE definitions of that term; that the committee chair is an Audit committee financial expert, is independent of management, and has accounting or related financial management expertise; and that all of the Audit committee members are financially literate. |
Executive directors and senior executives (most often the Director of Finance, Director Group Finance, the Head of Tax, Head of Treasury, Head of Investor Relations and the Group Company Secretary and Head of Assurance) attend meetings by invitation as required, but do not do so as of right. Representatives of KPMG LLP (external auditor), PricewaterhouseCoopers LLP (internal auditor) and external tax advisors (when considered appropriate) also attend the committee meetings and meet privately with committee members, in the absence of executive management, prior to each committee meeting.
The committee normally meets at least four times during each financial year and more frequently as required.
Role and responsibilities of the committee
The committee’s principal responsibilities are to:
| - | monitor the integrity of the financial statements of the Company and any formal announcements relating to the Company’s financial performance, reviewing significant financial reporting judgements contained in them. The committee also reviews the Group’s Annual Report and Accounts and Interim Report prior to submission to the full board for approval; |
| - | monitor the Group’s accounting policies and review the Company’s internal financial controls and financial reporting procedures and, on behalf of the board, the Company’s internal control and risk management systems; |
| - | monitor the adequacy and effectiveness of the Company’s internal financial controls and internal controls, risk management systems and insurance arrangements; |
| - | ensure that a robust assessment of the principal and emerging risks facing the Company, including those that would threaten the business model, future performance, solvency or liquidity and reputation is undertaken at least once a year; |
| - | monitor and review the effectiveness of the Company’s internal audit function, including agreeing and approving the annual internal audit plan; |
| - | make recommendations to the board, for it to put to the shareholders for their approval in general meeting, in relation to the appointment, reappointment and removal of the external auditor and to approve the remuneration and terms of engagement of the external auditor; |
| - | oversee the relationship with the external auditors and review and monitor their independence and objectivity and the effectiveness of the audit process, taking into consideration relevant UK and US professional and regulatory requirements; |
| - | develop and implement policy on the engagement of the external auditor to supply non-audit services, taking into account relevant ethical guidance regarding the provision of non-audit services by the external audit firm; and to report to the board, identifying any matters in respect of which it considers that action or improvement is needed and making recommendations as to the steps to be taken; |
| - | provide a forum through which the Group’s external and internal auditors and external tax advisors report to the board; and |
| - | report to the board on how it has discharged its responsibilities. |
The committee’s terms of reference are published on the Company’s website, https://www.microfocus.com/en-us/governance-policies/committees-of-the-board
The average monthly number of people employed by the Group (including executive directors for the year ended October 31, 2021, the year ended October 31, 2020 and 2019 was as follows:
Year ended October 31, 2021 | Year ended October 31, 2020 | Year ended October 31, 2019 | ||||||||||
| Number | Number | Number | ||||||||||
| Average monthly number of people | ||||||||||||
| (including executive directors) employed by the Group: | ||||||||||||
| Continuing Operations | ||||||||||||
| Sales and distribution | 4,300 | 5,066 | 5,413 | |||||||||
| Research and development | 5,272 | 5,091 | 5,056 | |||||||||
| General and administration | 2,210 | 1,937 | 1,991 | |||||||||
| 11,782 | 12,094 | 12,460 | ||||||||||
| Discontinued Operation | ||||||||||||
| Sales and distribution | - | - | 164 | |||||||||
| Research and development | - | - | 170 | |||||||||
| General and administration | - | - | 3 | |||||||||
| - | - | 337 | ||||||||||
| Total | ||||||||||||
| Sales and distribution | 4,300 | 5,066 | 5,577 | |||||||||
| Research and development | 5,272 | 5,091 | 5,226 | |||||||||
| General and administration | 2,210 | 1,937 | 1,994 | |||||||||
| 11,782 | 12,094 | 12,797 | ||||||||||
Directors’ shareholdings and share interests as at October 31, 2021
| Director | Shares held (owned outright)1 | |||
| Stephen Murdoch | 280,669 | |||
| Matt Ashley | - | |||
| Greg Lock | 535,000 | |||
| Karen Slatford | 14,687 | |||
| Richard Atkins | 13,862 | |||
| Amanda Brown | 3,841 | |||
| Lawton Fitt | - | |||
| Robert Youngjohns | - | |||
| Sander van ’t Noordende | 45,000 | |||
| Pauline Campbell (from October 1, 2021) | - | |||
| 1 | Shares held (owned outright), includes any Micro Focus securities of which the director, their spouse, civil partner or dependent child has beneficial ownership. Each represents less than one per cent of the outstanding shares. |
All other persons listed in Item 6.B. each beneficially owns less than one per cent of the securities issued and, as their share ownerships have not previously been made public, these are not disclosed. Details of options held are disclosed in Item 6.B. Ordinary shares held by the Group’s directors have the same voting rights as all other ordinary shares.
Please note the following changes to the above interests between October 31, 2021 and February 11, 2022:
| - | The number of shares held (owned outright) by Matt Ashley increased from 0 to 43,280 as a result of purchases of Micro Focus shares by Matt Ashley and his spouse on 17 December 2021. |
| - | The number of shares held (owned outright) by Greg Lock increased from 535,000 to 835,000 as a result of a purchase of 300,000 Micro Focus shares by Mr. Lock on December 17, 2021. |
As mentioned in Item 6.B the Group’s directors and members of key management bodies participate in the Group’s Long-term Incentive Plan, Additional Share Grants and Deferred Share Bonus Plan. Aggregate total and information in relation to each plan for the directors and members of key management bodies as at October 31, 2021 is included below:
Number of awards | Range of exercise prices (pence) | Range of expiry dates | |
| Long-term Incentive Plan | 3,653,755 | nil to 10 pence | February 18, 2022 to March 26, 31 |
| Additional Share Grant | 405,917 | nil | November 20, 2024 |
| Deferred Share Bonus Plan | 43,134 | nil | February 28, 2022 to March 26, 2024 |
| Sharesave and ESPP | 36,021 | nil | October 1, 2022 and April 1, 2024 |
The directors remain committed to the principle of employee share ownership throughout the company. Employees globally are able to participate in one of the Group’s all-employee share plans (a Sharesave plan and an Employee Stock Purchase Plan), which are intended to encourage employee share ownership and involvement in the Company’s performance. For more senior employees who are better placed to contribute to the development and performance of the Group, the Group operates a discretionary long-term incentive plan (LTIP). Details of all the Group’s share-based plans, whether operating on an all- employee or discretionary basis, are given in note 28 “Employee and directors” of the Consolidated financial statements in Item 18.
At February 14, 2022, being the most recent practicable date, the following percentage interests in the ordinary share capital of the Company:
As at February 14, 20221 | As at February 12, 2021 | As at January 27, 2020 | ||||||||||||||||||||||
Ordinary shares of 10 pence each | Percentage of issued share capital % | Ordinary shares of 10 pence each | Percentage of issued share capital % | Ordinary shares of 10 pence each | Percentage of issued share capital % | |||||||||||||||||||
| Dodge & Cox | 58,258,495 | 17.40 | % | 57,130,923 | 17.01 | % | 59,948,603 | 17.98 | % | |||||||||||||||
| BlackRock Inc. | 20,112,160 | 6.00 | % | 26,546,176 | 7.93 | % | 25,467,989 | 7.64 | % | |||||||||||||||
| M&G Plc | 16,912,423 | 5.05 | % | 16,912,423 | 5.05 | % | n/a | n/a | ||||||||||||||||
| Causeway Capital Management LLC | n/a | n/a | | 16,322,007 | 4.88 | % | 28,237,993 | 8.47 | % | |||||||||||||||
| 1 | Information reflects shareholdings and percentage of issued share capital at date of last filed SC 13G/A. |
Ordinary shares held by the major shareholders have the same voting rights as all other ordinary shares.
As at February 11, 2022, the proportion of Ordinary Shares represented by ADSs with a registered address in the United States was 27.34% of the total issued share capital of the Company. The proportion of Ordinary shares with a registered address in the United States was 0.03% of the total issued share capital of the Company. As at February 11, 2022, there were 1,036 registered holders of Ordinary Shares, of which 23 were based in the USA and there were 39,215 record holders of the ADSs, of which 33,503 were based in the USA.
This is set out in note 29 “Related party transactions” of the Consolidated financial statements in Item 18.
Not applicable.
The Consolidated financial statements filed as part of this Annual Report on Form 20-F are included in Item 18.
The Group is involved in various lawsuits, claims, investigations, and proceedings including those consisting of IP, commercial, employment, employee benefits, and environmental matters, which arise in the ordinary course of business. The Separation and Distribution Agreement, dated as of September 7, 2016, between Seattle SpinCo, Inc. and HPE (the “SDA”) includes provisions that allocate potential financial responsibility for litigation involving the parties, as well as provide for cross-indemnification of the parties against potential liabilities to one party arising out of potential liabilities allocated to the other party. In addition, as part of the SDA, HPE and Seattle have agreed to cooperate with each other in managing litigation that relates to both parties’ businesses. The Group records a liability when it believes that it is both probable that a liability has been incurred and the amount of loss can be reasonably estimated. Significant judgment is required to determine both the probability of having incurred a liability and the estimated amount of the liability. Litigation is inherently unpredictable. However, the Group believes it has valid defenses with respect to legal matters pending against it. Nevertheless, cash flows or results of operations could be significantly affected in any particular period by the resolution of one or more of these contingencies. The Group believes it has recorded adequate provisions for any such matters and, as of October 31, 2021, it was not reasonably possible that a material loss had been incurred in connection with such matters in excess of the amounts recognized in its financial statements.
Litigation, Proceedings and Investigations
Forsyth, et al. vs. HP Inc. and HPE:
This purported class and collective action was filed on August 18, 2016 and a Fourth Amended (and operative) Complaint was filed on July 9, 2020, in the United States District Court for the Northern District of California, against HP Inc. and Hewlett Packard Enterprise Company (“HPE”) alleging defendants violated the Federal Age Discrimination in Employment Act (“ADEA”), the California Fair Employment and Housing Act, California public policy and the California Business and Professions Code by terminating older workers and replacing them with younger workers. Plaintiffs seek to certify a nationwide collective action under the ADEA comprised of all individuals aged 40 and older who had their employment terminated by Hewlett-Packard Company (“HP Co.”) or HP Inc. pursuant to a work force reduction (“WFR”) plan on or after December 9, 2014 for individuals terminated in deferral states and on or after April 8, 2015 in non-deferral states. Plaintiffs also seek to certify a Rule 23 class under California law comprised of all persons 40 years of age or older employed by defendants in the state of California and terminated by HP Co. or HP Inc. pursuant to a WFR plan on or after August 18, 2012. Plaintiffs seek to certify a similar purported ADEA collective and Rule 23 California state law class against HPE, but the time period for that collective and class begin on November 1, 2015. Excluded from the putative collectives and classes are those who (a) signed a Waiver and General Release Agreement at termination, or (b) signed an Agreement to Arbitration Claims. The court granted conditional certification of the ADEA collectives and notice has been distributed to the potential opt-in plaintiffs.
Ross and Rogus vs HPE:
On November 8, 2018, a putative class action complaint was filed in the Superior Court of California, County of Santa Clara alleging that HPE pays its California-based female employees “systemically lower compensation” than HPE pays male employees performing substantially similar work. The complaint alleges various California state law claims, including California’s Equal Pay Act, Fair Employment and Housing Act, and Unfair Competition Law, and seeks certification of a California-only class of female employees employed in certain “Covered Positions.” The complaint seeks damages, statutory and civil penalties, attorneys’ fees, and costs.
Wapp Tech Limited Partnership et al. v. Micro Focus International plc:
On July 2, 2018, Wapp Tech Limited Partnership and Wapp Tech Corp (collectively “Wapp”) brought a claim against Micro Focus in the Eastern District of Texas, accusing the Company of infringing three patents in connection with Micro Focus’ sale of certain products in the ADM product line, including LoadRunner and Performance Centre.
The case was tried during the second quarter of fiscal year 2021 and, on March 5, 2021, the jury delivered a verdict in favor of Wapp and awarded damages totaling approximately $172.5 million. On April 22, 2021, the Court denied Wapp’s request for enhanced damages and entered final judgment based on the jury award of approximately $172.5 million. On May 5, 2021, Wapp filed a motion for prejudgment and post judgment interest, seeking approximately $18.4 million in prejudgment interest.
On May 20, 2021, Micro Focus filed a motion for judgment of non -infringement as a matter of law and/or a new trial, including on the question of damages. Additionally, on June 3, 2021, Micro Focus filed an opposition to Wapp’s request for approximately $18.4 million in prejudgment interest.
While Micro Focus continues to maintain that it has not and does not infringe Wapp’s patents, that those patents are invalid, and that Micro Focus has strong grounds for appeal, the Company reached a settlement with Wapp for payment of $67.5 million to completely resolve the dispute for itself and its customers without admission of liability. Pursuant to the settlement, the Company has been granted a fully paid-up, worldwide, irrevocable licence for the patents asserted by Wapp for current and future Micro Focus products and services, covering the Company as well as its customers. The Wapp litigation has been dismissed with prejudice, as have two related customer suits. In line with our accounting policy, the cost of recording this provision has been treated as an exceptional cost in the Consolidated Statement of Comprehensive Income for the year ended October 31, 2021.
Securities Litigation:
Micro Focus is involved in two lawsuits in which plaintiffs are seeking damages for alleged violations of the Securities Act of 1933 and the Exchange Act of 1934 based upon purportedly false and misleading statements or omissions in offering documents issued in connection with the HPE software business merger and issuance of Micro Focus American Depository Shares (“ADS”) as merger consideration and based upon other purportedly false and misleading statements. Those matters are as follows:
| • | In re Micro Focus International plc Securities Litigation is a putative class action on behalf of holders of Micro Focus ADS filed on May 23, 2018 in the United States District Court for the Northern District of California against Micro Focus and certain current and former directors and officers, among others. On July 26, 2018, the court transferred the case to the United States District Court for the Southern District of New York. The lawsuit alleges violations of the Securities Act and of the Exchange Act. The parties participated in a mediation during the second quarter of year ended October 31, 2021during which the parties reached an agreement to settle the case for payment of $15 million to the settlement class. The proposed settlement is subject to the court’s approval. The settlement amount will be paid from insurance coverage. The Company and all defendants have denied, and continue to deny, the claims alleged in the case and the settlement does not reflect any admission of fault, wrongdoing, or liability as to any defendant. |
| • | re Micro Focus International plc Securities Litigation is another putative class action on behalf of holders of Micro Focus filed on March 28, 2018, in the Superior Court of California, County of San Mateo against Micro Focus International plc and certain current and former directors and officers, among others. Six additional purported holders of Micro Focus ADS filed putative class actions in the same court, and the court consolidated all cases. The lawsuit alleges violations of the Securities Act. On November 19, 2021, the court certified a class of all persons and entities who purchased Micro Focus ADSs pursuant to SEC filings issued in connection with the merger of Micro Focus and Hewlett Packard Enterprises. The California matter remains pending. |
Dividends
In terms of dividend policy, the Group initially aims to pay a dividend which is approximately 5x covered by the Adjusted profit after tax of the Group in each financial period (defined as profit after tax excluding the effects of share-based compensation, amortization of purchased intangible assets and exceptional items including gain on disposal of discontinued operation). The Group’s aim is then to increase the percentage of profits distributed to shareholders as the Group executes its strategy of stabilizing the business.
An interim dividend of 8.8 cents per share was paid in the year ended October 31, 2021. The directors announced a final dividend of 20.3 cents per share payable on February 8, 2022. The total dividend per share in the year was 29.1 cents.
The dividend will be paid in Sterling and the sterling amount per share will be fixed and announced approximately two weeks prior to the payment date, based on the average spot exchange rate over the five business days preceding the announcement date. The dividend will be paid on April 21, 2022 to shareholders on the register at March 11, 2022.
This total dividend is 29.1cents per share, which is an increase of 87.7% on the year ended October 31, 2020 of 15.50 cents per share.
For further information on dividends please refer to note 8 “Dividends” of the Consolidated financial statements in Item 18.
There has been no significant change to our financial conditions or results of operations since October 31, 2021 other than those items disclosed in note 33 “Post balance sheet events” of the Consolidated financial statements in Item 18.
See “Item 8.A.7. Information on the Company — Legal Proceedings” for information with respect to legal proceedings to which we may be subject from time to time.
The principal trading market for our ordinary shares is the London Stock Exchange. Our ordinary shares also trade in the United States in the form of ADSs evidenced by American Depositary Receipts (“ADR”) under a sponsored ADR facility with Deutsche Bank, as depositary. We established this facility in August 2017. Each ADS represents one ordinary share.
Ordinary shares are traded on the London Stock Exchange under the symbol “MCRO.L”. The ADSs trade on the New York Stock Exchange under the symbol “MFGP”.
Not applicable
Micro Focus International plc is listed on the London Stock Exchange. The Company’s American Depositary Shares (the “ADSs”) are listed on the New York Stock Exchange.
Not applicable.
Not applicable.
Not applicable.
Not applicable.
The Articles of association were included in Item 10 B. in the Annual Report on Form 20-F for the year ended October 31, 2019 on pages 107 to 110. There were no changes in the year to October 31, 2021 and 2020.
Bank borrowings
Changes in the year ended October 31, 2020
Refer to Item 10 C. in the Annual Report on Form 20-F for the year ended October 31, 2020 on page 69.
Changes in the year ended October 31, 2021
On January 17, 2022, the Group announced the refinancing of $1.6 billion of existing term loans. This refinancing comprised a €750 million and a $750 million Senior Secured Term Loan B. The new 5-year Facilities have been used by the Group to fully refinance its existing Senior Secured Term Loan B Euro facility issued by MA FinanceCo., LLC due June 2024 as well as partially refinance the existing Senior Secured Term Loan B USD facilities issued by Seattle SpinCo, Inc., ($750 million refinance, $1,678 million remaining) and MA FinanceCo., LLC, ($359.5 million B-3 fully replaced by additional Euro borrowing) due June 2024.
The new 5-year Facilities incurs interest at 4.00% above EURIBOR (subject to 0% floor) at an original issue discount of 0.5% on the Euro denominated tranche, and 4.00% above SOFR and CSA (subject to 0.5% floor) at an original issue discount of 1.0% on the US Dollar denominated tranche. This represents an increase in annualized interest costs of approximately $23.0 million.
Post year end the Group successfully extended its revolving credit facility and reduced it to $250 million and with maturity extended until December 2026, subject to tests for the term loan maturities in June 2024 and June 2025.
Following these refinancing activities, the Group’s earliest debt maturity continues to be in June 2024.
Please refer to Exhibit 4.1 “Credit Agreement, among Micro Focus International plc, Micro Focus Group Limited, MA FinanceCo., LLC, the Lenders party thereto and JPMorgan Chase Bank, N.A., as Administrative Agent and Collateral Agent.” and Exhibit 4.2 “Credit Agreement, among Micro Focus International plc, Micro Focus Group Limited, Seattle SpinCo, Inc., the Lenders party thereto and JPMorgan Chase Bank, N.A., as Administrative Agent and Collateral Agent.”.
There are currently no UK foreign exchange controls or restrictions on remittance of dividends on the ordinary shares or on the conduct of the Company’s operations, other than restrictions applicable to ‘certain countries and persons subject to sanctions pursuant to the UK Sanctions and Anti-Money Laundering Act 2018or those sanctions adopted by the UK Government which implement resolutions of the Security Council of the United Nations.
The following discussion summarizes certain material US federal income tax consequences and UK taxation consequences to US holders (as defined below) of owning and disposing of Micro Focus ordinary shares or ADSs. This discussion does not address any tax consequences arising under the laws of any state, local or non-US or non-UK jurisdiction, or under any US federal or UK laws other than those pertaining to income taxation.
Material US Federal Income Tax Consequences of Owning and Disposing of Micro Focus Ordinary Shares or ADSs
The following discussion summarizes certain material US federal income tax consequences to US holders (as defined below) of owning and disposing of Micro Focus ordinary shares or ADSs. This discussion is based upon the US Internal Revenue Code of 1986, as amended (the “US Tax Code”), the Treasury regulations promulgated under the US Tax Code and judicial and administrative rulings and decisions, all as in effect on the date hereof. These laws are subject to differing interpretations and may change, possibly retroactively, and any change could affect the accuracy of the statements and conclusions set forth in this discussion. No ruling has been sought from the US Internal Revenue Service (“IRS”) with respect to any US federal income tax consequences described below, and there can be no assurance that the IRS or a court will not take a contrary position.
This discussion does not constitute tax advice or an opinion, is for general information only and does not purport to consider all aspects of US federal income taxation that might be relevant to US holders in light of their personal investment or tax circumstances. This discussion does not apply to US holders who acquired ordinary shares or ADSs pursuant to the exercise of options or warrants or otherwise as compensation, or to US holders subject to special tax rules, including, without limitation, banks, insurance companies, tax-exempt entities, financial institutions, regulated investment companies, partnerships, S-corporations or other pass-through entities, broker-dealers, persons holding ordinary shares or ADSs as part of a hedging, conversion, or constructive sale transaction or as part of a “straddle,” US expatriates, persons subject to the alternative minimum tax, persons holding 10 per cent. or more of the voting power or value of Micro Focus’s stock, persons subject to “mark to market” accounting, persons holding ordinary shares or ADSs through a non-US account or financial institution and entities subject to the anti-inversion rules of Section 7874 of the US Tax Code. This discussion does not discuss US tax consequences to any person that is not a US holder or to any US holder having a functional currency other than the US dollar. Furthermore, this discussion does not discuss the so-called Medicare tax on net investment income, any US federal estate or gift tax laws or tax consequences under the laws of any state, local or non-US jurisdiction. Each holder of Micro Focus ordinary shares or ADSs is urged to consult its own tax advisor regarding the US federal, state, local and non-US income and other tax considerations of an investment in Micro Focus ordinary shares or ADSs.
As used in this discussion, a “US holder” means a beneficial owner of ordinary shares or ADSs that holds such ordinary shares or ADSs as capital assets within the meaning of the US Tax Code (generally, property held for investment) and is for US federal income tax purposes (i) an individual who is a citizen or resident of the United States, (ii) a corporation or other entity taxable as a corporation organized under the laws of the United States, any State thereof or the District of Columbia, (iii) a trust, if (a) a court within the United States is able to exercise primary jurisdiction over administration of the trust and one or more US persons have authority to control all substantial decisions of the trust or (b) a valid election is in place to treat such trust as a domestic trust, or (iv) an estate the income of which is subject to US federal income taxation regardless of its source.
In the case of a beneficial owner of ordinary shares or ADSs that is classified as a partnership for US federal income tax purposes, the tax treatment to a partner in the partnership generally will depend upon the tax status of the partner and the activities of the partner and the partnership. Partnerships and partners of partnerships holding Micro Focus ordinary shares and ADSs are urged to consult their independent professional tax advisors regarding an investment in such ordinary shares and ADSs.
The Company believes, and this discussion assumes, that it is not a passive foreign investment company (a “PFIC”) for US federal income tax purposes, although the inquiry is fact specific and no assurance is being given in that regard. A non-US corporation generally will be considered a PFIC for any taxable year in which (i) 75 per cent. or more of its gross income is passive income (e.g., certain dividends, interest, rents and royalties, and gain from the sale of property producing such income), or (ii) 50 per cent. or more of the average value of its assets are considered “passive assets” (generally, assets that generate passive income). For this purpose, the Company will be treated as owning its proportionate share of the assets and earning its proportionate share of the income of any other non-U.S. corporation in which it owns, directly or indirectly, stock representing more than 25% (by value) of all of the stock of such corporation. The Company’s possible status as a PFIC is based on an annual determinations that cannot be made until the close of a taxable year, involves extensive factual investigation, including ascertaining the fair market value of all of the Company’s assets on a periodic basis and the character of each item of income that the Company earns, and is subject to uncertainty in several respects. Therefore, the Company cannot assure US holders that it will not be treated as a PFIC for its current taxable year or for any future taxable year or that the IRS will not take a contrary position. If the Company were to be classified as a PFIC for any year during which a US holder held its ordinary shares or ADSs, the Company generally would continue to be treated as a PFIC for all succeeding years during which such US holder held ordinary shares or ADSs. In addition, special, possibly materially adverse, consequences would result for US holders and certain reporting requirements might apply to US holders. US holders should consult their own independent professional tax advisers regarding the potential application of the PFIC rules to their ownership and disposition of ordinary shares or ADSs.
Ownership of ADSs in General
For US federal income tax purposes, a US holder of Micro Focus ADSs generally will be treated as the owner of the Micro Focus ordinary shares represented by the ADSs.
The US Treasury Department has expressed concern that depositaries for American Depositary Shares, or other intermediaries between the holders of shares of an issuer and the issuer, may be taking actions that are inconsistent with the claiming of US foreign tax credits by US holders of those receipts or shares. Accordingly, the analysis regarding the availability of a US foreign tax credit for UK taxes and sourcing rules described below could be affected by future actions that may be taken by the US Treasury Department.
Dividends Paid on Ordinary Shares or ADSs
The gross amount of any cash distribution (including the amount of any tax withheld, as discussed below) paid to a US holder by Micro Focus out of its current or accumulated earnings and profits (as determined for US federal income tax purposes) is subject to US federal income taxation as a dividend. For certain non-corporate US holders, including individuals, dividends that constitute “qualified dividend income” will be taxable to such US holder at the preferential rates applicable to long-term capital gains, provided that the US holder holds the ordinary shares or ADSs on which the dividends are paid for more than 60 days during the 121-day period beginning 60 days before the ex-dividend date and meets other holding period requirements. Dividends Micro Focus pays with respect to its ordinary shares or ADSs generally will be qualified dividend income if Micro Focus is eligible for benefits of the United States income tax treaty with the United Kingdom. Although Micro Focus believes that it is currently eligible for such treaty benefits, there can be no assurance that this will be the case for any taxable year or that such position would not be challenged by the IRS or sustained by a court. Dividends received by a corporate US holder generally will not be eligible for the dividends-received deduction that is allowed to US corporations in respect of dividends received from other US corporations. However, a corporate US holder that owns 10 per cent or more of Micro Focus’s stock may, in certain circumstances, be entitled to a deduction in respect of a dividend received from Micro Focus pursuant to Section 245A of the US Tax Code.
A dividend is taxable to a US holder when the US holder receives the dividend, actually or constructively. The amount of the dividend that a US holder must include in its income will be the US dollar value of the payments made (including any withholding tax imposed thereon), determined at the spot Sterling/US dollar rate on the date the dividend is includible in the US holder’s income, regardless of whether the payment is in fact converted into US dollars at such time. Generally, any gain or loss resulting from currency exchange fluctuations during the period from the date a US holder includes the dividend payment in income to the date a US holder converts the payment into US dollars will be treated as ordinary income or loss and will not be eligible for the special tax rate applicable to qualified dividend income. Such foreign exchange gain or loss generally will be income or loss from sources within the United States for foreign tax credit limitation purposes.
The portion of any cash distribution received by a US holder that is in excess of Micro Focus’s current and accumulated earnings and profits, as determined for US federal income tax purposes, will be treated as a non-taxable return of capital to the extent of the US holder’s basis in the ordinary shares or ADSs on which such payment is received, and thereafter as capital gain. However, Micro Focus does not expect to calculate its earnings and profits in accordance with US federal income tax principles. Accordingly, a US holder should expect to generally treat cash distributions paid by Micro Focus as taxable dividends for US federal income tax purposes.
A US holder must include any foreign tax withheld from a cash distribution on its ordinary shares or ADSs in the gross amount included in income, even though the US holder does not in fact receive such withheld amount. Subject to certain limitations, UK tax withheld, if any, in accordance with the United Kingdom-United States Income Tax Convention (1975), as amended (the “Treaty”), and paid over to the United Kingdom will be deductible or creditable against a US holder’s US federal income tax liability. Special rules apply in determining the foreign tax credit limitation with respect to dividends that are subject to the preferential tax rates. To the extent a refund of the tax withheld is available to a US holder under UK law or under the Treaty, the amount of tax withheld that is refundable will not be eligible for credit against a US holder’s US federal income tax liability.
Dividends paid by Micro Focus on its ordinary shares or ADSs generally will be income from sources outside the United States and will, depending on a US holder’s circumstances, be either “passive” or “general” income for purposes of computing the foreign tax credit allowable to the US holder. The rules governing the foreign tax credit are complex and involve the application of rules that depend upon a US holder’s particular circumstances. Accordingly, US holders are urged to consult their own tax advisors regarding the availability of the foreign tax credit under their particular circumstances.
Sale or Disposition of Ordinary Shares or ADSs
If a US holder sells or otherwise disposes of its ordinary shares or ADSs in a taxable sale or other disposition, such US holder will generally recognize capital gain or loss for US federal income tax purposes equal to the difference between the US dollar value of the amount that the US holder realizes in such disposition and the US holder’s tax basis, determined in US dollars, in the US holder’s Micro Focus ordinary shares or ADSs. Capital gain of certain non-corporate US holders, including individuals, is generally taxed at preferential rates where the property disposed of is held for more than one year. Gain or loss recognized by a US holder on the sale or other disposition of ordinary shares or ADSs will generally be income or loss from sources within the United States for foreign tax credit limitation purposes. The deductibility of a capital loss may be subject to limitations under the US Tax Code.
Information with Respect to Foreign Financial Assets
US holders that are owners of “specified foreign financial assets” with an aggregate value in excess of $50,000 (and in some circumstances, a higher threshold) may be required to file an information report with respect to such assets with their tax returns and may be subject to penalties if they fail to file such information report. “Specified foreign financial assets” include financial accounts maintained by foreign financial institutions, as well as the following, but only if they are held for investment and not held in accounts maintained by financial institutions: (i) stocks and securities issued by non-U.S. persons, (ii) financial instruments and contracts that have non-U.S. issuers or counterparties, and (iii) interests in foreign entities. US holders are urged to consult their own tax advisors regarding the application of this reporting requirement to their ownership of ordinary shares or ADSs.
Backup Withholding and Information Reporting
In general, dividend payments with respect to ordinary shares and ADSs and proceeds from the sale or other disposition of ordinary shares or ADSs made (or deemed made) within the United States may be subject to information reporting to the IRS and US backup withholding currently at a rate of 24 per cent. Backup withholding will generally not apply to a US holder who:
• Furnishes a correct taxpayer identification number and certifies, under penalties of perjury, that such US holder is not subject to backup withholding on an IRS Form W-9, and otherwise complies with applicable requirements of the backup withholding rules; or
• Is a corporation or otherwise exempt from backup withholding and, when required, demonstrates this fact in accordance with applicable Treasury regulations.
Backup withholding is not an additional tax. Amounts withheld under the backup withholding rules may be allowed as a credit against a holder’s US federal income tax liability and may entitle the holder to a refund, provided the holder timely furnishes the required information to the IRS.
US holders should consult their own independent professional tax adviser regarding the application of the information reporting and backup withholding rules.
Credits or deductions for UK taxes
As indicated under ‘Material UK Tax Consequences’ below, distributions in respect of, and gains on the disposition of, ordinary shares or ADSs, may be subject to UK taxation in certain circumstances. A US holder may be eligible to claim a credit or deduction in respect of UK taxes attributable to such income or gain for purposes of computing the US holder’s US federal income tax liability, subject to certain limitations. The US foreign tax credit rules are complex, and US holders should consult their own tax advisors regarding the availability of US foreign tax credits and the application of the US foreign tax credit rules to their particular situation.
The summary set forth above is included for general information only. US holders are urged to consult their own tax advisors to determine the particular tax consequences to them of the ownership and disposition of ordinary shares and ADSs, including the applicability and effect of U.S. state, local and non-U.S. tax laws.
Material UK Tax Consequences of Owning and Disposing of Micro Focus Ordinary Shares or ADSs
The following paragraphs set out below summarize material aspects of the UK tax treatment of US holders of ordinary shares or ADSs and do not purport to be either a complete analysis of all tax considerations relating to holding ordinary shares or ADSs or an analysis of the tax position of Micro Focus. They are based on current UK legislation and what is understood to be current HM Revenue & Customs practice, both of which are subject to change, possibly with retrospective effect.
The comments are intended as a general guide and (otherwise than where expressly stated to the contrary) apply only to US holders of ordinary shares or ADSs (other than under a personal equity plan or individual savings account) and who are the absolute beneficial owners of such shares.
These comments do not deal with certain types of shareholders such as charities, dealers in securities, persons holding or acquiring shares in the course of a trade, persons who have or could be treated for tax purposes as having acquired their ordinary shares or ADSs by reason of their employment, collective investment schemes, persons subject to UK tax on the remittance basis and insurance companies. You are encouraged to consult an appropriate independent professional tax advisor with respect to your tax position.
Tax on chargeable gains as a result of disposals of ordinary shares or ADSs
Subject to the below, US holders will not generally be subject to UK tax on chargeable gains on a disposal of ordinary shares or ADSs provided that they do not carry on a trade, profession or vocation in the United Kingdom through a branch, agency or permanent establishment in connection with which the ordinary shares or ADSs are held.
A US holder who is an individual, who has ceased to be resident for tax purposes in the United Kingdom for a period of less than five years and who disposes of ordinary shares or ADSs during that period may be liable for UK tax on capital gains (in the absence of any available exemptions or reliefs). If applicable, the tax charge will arise in the tax year that the individual returns to the United Kingdom.
Tax on dividends
Micro Focus is not required to withhold UK tax at source from dividends paid on ordinary shares or ADSs.
US holders will not generally be subject to UK tax on dividends received from Micro Focus provided that they do not carry on a trade, profession or vocation in the United Kingdom through a branch, agency or permanent establishment in connection with which the ordinary shares or ADSs are held.
Stamp duty and stamp duty reserve tax, referred to as SDRT
Based on current published HM Revenue & Customs practice and recent case law, transfers of ADSs should not be subject to SDRT or stamp duty provided that any instrument of transfer is executed and remains outside the UK and the transfer of an underlying ordinary share to the ADS holder in exchange for the cancellation of an ADS should also not give rise to a stamp duty or SDRT charge.
Transfers of ordinary shares outside of the depositary bank, including the repurchase of ordinary shares by Micro Focus, will generally be subject to stamp duty or SDRT at the rate of 0.5% of the amount or value of the consideration given, except as described above in connection with the cancellation of an ADS. If ordinary shares are redeposited into a clearance service or depositary system, the redeposit will attract stamp duty or SDRT at the higher rate of 1.5%.
The purchaser or the transferee of the ordinary shares or ADSs will generally be responsible for paying any stamp duty or SDRT payable. Where stamp duty or SDRT is payable, it is payable regardless of the residence position of the purchaser.
Inheritance tax
A gift or settlement of ordinary shares or ADSs by, or on the death of, an individual shareholder may give rise to a liability to UK inheritance tax even if the shareholder is not a resident of or domiciled in the United Kingdom.
A charge to inheritance tax may arise in certain circumstances where ordinary shares or ADSs are held by close companies and trustees of settlements.
However, pursuant to the Estate and Gift Tax Treaty 1980, referred to as the Treaty, entered into between the United Kingdom and the United States, a gift or settlement of ordinary shares or ADSs by shareholders who are domiciled in the United States for the purposes of the Treaty may be exempt from any liability to UK inheritance tax.
Not applicable.
Not applicable.
Copies of our Memorandum and Articles of Association can be found as exhibits of the Group’s Annual Report on Form 20-F for the year ended October 31, 2019 which is available at https://microfocus.com/media/investor-reports/form-20-f-for-12-months-ending-the-31-october-2019-report.pdf and has been filed with the SEC. The Memorandum and Articles of Association along with certain other documents referred to in this Annual Report on Form 20-F are available for inspection at our registered office at The Lawn, 22-30 Old Bath Road, Newbury, Berkshire, RG14 1QN, United Kingdom (c/o the Company Secretary) during usual business hours upon reasonable prior request.
Not applicable.
The following discussion and analysis contains forward-looking statements. See “Risk Factors” in Item 3D and “Cautionary Statement on Forward-Looking Statements’’ in this Annual Report on Form 20-F for a discussion of the uncertainties, risks and assumptions associated with these statements.
Financial risk factors
The Group’s treasury function aims to reduce exposures to interest rate, foreign exchange and other financial risks, to ensure liquidity is available as and when required, and to invest cash assets safely and profitably. The Group does not engage in speculative trading in financial instruments so the analysis in this section can be categorized as non-trading. The treasury function’s policies and procedures are reviewed and monitored by the Audit Committee and are subject to internal audit review.
The Group’s multi-national operations expose it to a variety of financial risks that include the effects of changes in credit risk, foreign currency risk, interest rate risk and liquidity/capital risk. Treasury risk management is carried out by a central treasury department under policies approved by the board of directors.
Group treasury identifies and evaluates financial risks alongside business management. The board provides written principles for risk management together with specific policies covering areas such as foreign currency risk, interest rate risk, credit risk and liquidity risk, the use of derivative and non-derivative financial instruments as appropriate, and investment of excess funds.
Financial Instruments sensitive to market risk
The carrying values and fair values for the borrowings and derivative financial instruments are included within the overall financial instruments table. Further information on borrowings showing the maturity profile of the anticipated cash flows in relation to the Group’s borrowing including principal repayments and interest payments can be found in section 5.B.1 along with the contracted interest rates and drawn/undrawn facilities.
Derivative and non-derivative financial instruments used for hedging purposes are further discussed below.
Financial Instruments
The tables below sets out the measurement categories and carrying values of financial assets and liabilities with fair value inputs where relevant.
Measurement category | Carrying value October 31, 2021 | Fair value 2021 | Fair value Hierarchy 2021/2020 | Carrying value October 31, 2020 | |||||||||||||
| $m | $m | ||||||||||||||||
| Financial assets: | |||||||||||||||||
| Non-current | |||||||||||||||||
Long-term pension asset | FV OCI | 17.1 | Fair value insurance based input | Level 3 | 18.2 | ||||||||||||
| Current | |||||||||||||||||
| Cash and cash equivalent | Amortised cost | 558.4 | - | - | 737.2 | ||||||||||||
| Trade and other receivables | Amortised cost | 784.2 | - | - | 648.6 | ||||||||||||
| Contract assets | Amortised cost | 62.0 | - | - | 33.7 | ||||||||||||
| 1,421.7 | 1,437.7 | ||||||||||||||||
| Financial liabilities: | |||||||||||||||||
| Non-current | |||||||||||||||||
Derivative financial instruments – interest rate swaps1 | FV OCI | - | Fair value Bank Institutions | Level 2 | 77.9 | ||||||||||||
Borrowings (gross)2 | Amortised cost | 4,566.0 | 4,556.5 | - | 4,699.0 | ||||||||||||
| Lease obligations | Amortised cost | 119.6 | - | - | 168.2 | ||||||||||||
| Current | |||||||||||||||||
Derivative financial instruments – interest rate swaps1 | FV OCI | 35.7 | Fair value Bank Institutions | Level 2 | - | ||||||||||||
Borrowings (gross)2 | Amortised cost | 42.0 | 41.9 | - | 34.2 | ||||||||||||
| Lease obligations | Amortised cost | 74.9 | - | - | 82.2 | ||||||||||||
| Trade and other payables – accruals | Amortised cost | 440.1 | - | - | 419.2 | ||||||||||||
| 5,278.3 | 5,480.7 | ||||||||||||||||
| 1 | Derivative interest rate swaps are measured at fair value in other comprehensive income (“FVOCI”) as a result of hedge accounting. All interest rate swaps are in designated hedge relationships and there are no other derivative financial instruments held as fair value through profit and loss (“FVTPL”). |
| 2 | Borrowings have a carrying value (net of unamortised prepaid facility arrangement fees and original issue discount) of $4,548.4 million (2020: $4,640.3 million). Total borrowings (gross) are shown in this table as $4,608.0 million (2020: $4,733.2 million) for the fair value comparison. |
For trade and other receivables, cash and cash equivalents, provisions, trade and other payables, fair values approximate to book values due to the short maturity periods of these financial instruments. For trade receivables, allowances are made for credit risk.
Borrowings with a carrying value of $4,548.4 million (2020: $4,640.3million) (note 18 “Borrowings” of the Consolidated financial statements in Item 18) including unamortised prepaid facility fees and discounts, have a fair value estimate of $4,598.4 million (2020: $4,535.1 million) based on trading prices obtained from external banking providers as at October 31, 2021.
Derivative financial instruments measured at fair value are classified as Level 2 in the fair value measurement hierarchy as they have been determined using significant inputs based on observable market data. The fair values of interest rate derivatives are derived from forward interest rates based on yield curves observable at the balance sheet date together with the contractual interest rates. Valuations are updated by the counter-party banks on a monthly basis.
This section will cover the primary market risk exposures regarding interest rates and foreign currencies. The Group’s principal exposures in relation to market risks are the changes in the exchange rates between the US Dollar and transactions made in other currencies as well as changes in interest rates from US and Euro capital markets.
Interest rate risk
The Group’s income and cash generated from operations are substantially independent of changes in market interest rates. The Group’s interest rate risk arises from short-term and long-term borrowings. Borrowings issued at variable rates expose the Group to cash flow interest rate risk. The Group currently uses four interest rate swaps to manage its cash flow interest rate risk arising from potential increases in the LIBOR interest rate.
The objective of the Group’s interest rate risk management policy is to manage the uncertainty and adverse impact on the Group’s net interest charge due to changes in interest rates to an acceptable level. In doing so, the Group seeks to minimize the cost of hedging and the level of associated counterparty risk.
The Group has set a target of approximately half its borrowings being subject to fixed interest rates in order to minimize its exposure to changes in interest rates. This is achieved through four USD interest swaps for a total notional value of $2.25 billion, with a maturity date of September 2022. The hedge accounting is discussed further later in the note.
On January 19, 2022, the Group executed a new 1m USD SOFR swap with a notional value of $750 million and a maturity date of February 28, 2027. The forward swap is effective on September 21, 2022 with a fixed interest rate of 1.656% swapped against the variable 1m SOFR USD rates.
The Group’s borrowing facilities do not contain any covenants with respect to interest cover ratios.
| October 31, 2021 | October 31, 2020 | |||||||
| Interest rate risk | $m | $m | ||||||
| Interest rate swaps (receive variable, pay fixed) | ||||||||
| Fair value of Derivative liability (total of 4 swaps) | (35.7 | ) | (77.9 | ) | ||||
| Notional amount (4 x $562.5 million) | 2,250.0 | 2,250.0 | ||||||
| Maturity date | September 30, 2022 | September 30, 2022 | ||||||
| Change in fair value of outstanding hedging instruments (OCI hedging reserve excluding deferred tax) | 42.2 | (41.3 | ) | |||||
| Change in value of hedging instruments (as above adjusted for impact of credit risk) | 41.9 | (39.9 | ) | |||||
| Hedging ratio | 1.1 | 1.1 | ||||||
The Group has four interest rate swaps, which are designated in a hedge relationship.
The Group’s approved strategy in accordance with our risk management policies is to minimize the risk of cash flow fluctuations due to interest rate changes in relation to the 1M-USD LIBOR rate for up to half of the Group’s external borrowings for the period October 19, 2017 to September 30, 2022.
The specific risk management objective is to hedge the interest rate risk (cash flow risk) due to changes in the 1M-USD LIBOR rate charged on $2,250.0 million of the debt issued by Seattle Spin Co Inc. between October 19, 2017 and September 30, 2022.
Derivatives are only used for economic hedging purposes and not as speculative investments.
The swap contracts require settlement of net interest receivable or payable on a monthly basis. The fixed interest rate for each swap is 1.949% and the Group receives a variable rate in line with LIBOR. The Seattle loan is priced at LIBOR (with a 0% floor) plus a current margin of 2.75% with the swaps aimed at addressing the risk of a rising LIBOR element. As such, the total interest cost of the hedged element of the Seattle loan is 4.699%. For the year to October 31, 2021, net interest (finance cost) paid for the swaps amounted to $41.3 million. For the life of the swap, net interest paid to date amounted to $58.5 million.
Non-Derivative financial instruments – Designated Euro borrowings
| October 31, 2021 | October 31, 2020 | |||||||
| Foreign exchange risk | $m | $m | ||||||
| Notional amounts for Designated Euro borrowing | ||||||||
| Euro B-1 2020 tranche €600 million (Borrowings maturity date: June 2025) | 676.0 | 700.3 | ||||||
Foreign exchange (loss) on revaluation transferred to OCI-CTA - no sources of ineffectiveness observed in review | 6.5 | (34.5 | ) | |||||
| Euro 2017 tranche €453 million (Borrowings maturity date: June 2024) | 510.9 | 528.5 | ||||||
Foreign exchange (loss) on revaluation transferred to OCI-CTA - no sources of ineffectiveness observed in review | 4.8 | (24.2 | ) | |||||
| Hedge ratio for each of the two Net investment hedges | 1:1 | 1:1 | ||||||
The Group has designated two tranches of non-derivative Euro borrowings in two hedge relationships The borrowings in place have a designated initial carrying value of approx. €1.03 billion (note 18 “Borrowings” of the Consolidated financial statements in Item 18.) hedged against Euro designated net investments in foreign operations.
The specific risk management objective is to carry out a net investment hedge in the consolidated financial statements of the Group, to reduce the foreign currency translation exposure arising from the Group’s investments in foreign entities with Euro functional currency through the use of Euro currency borrowings as hedging instruments as permitted by the Group’s Treasury policy.
Foreign exchange risk
The Group operates internationally and is exposed to foreign exchange risk arising from various currency exposures, primarily with respect to the Euro, UK Pound Sterling, Indian Rupee, Israeli Shekel, Japanese Yen, Canadian Dollar, Australian Dollar and the Chinese Yuan. Foreign exchange risk arises from future commercial transactions, recognized assets and liabilities and net investments in foreign operations where the transactions are denominated in a currency that is not the entity’s functional currency.
The Group is subject to exposure on the translation of the net assets of foreign currency subsidiaries into its reporting currency, US Dollar. The Group’s primary balance sheet translation exposures are noted in the Exposure analysis below. These exposures are kept under regular review with the Group treasury function providing reporting to the Treasury Risk committee and the Audit committee.
Group borrowings are denominated in US Dollars and Euros. The Group seeks to match the currency profile of borrowings to the cash flows arising from the Groups operations used to service those borrowings. The May 2020 debt refinancing included an additional proportion of Euro debt and a reduction in US Dollar debt which is intended to better match the currency profile of the Group’s debt with the cash flows used to service that debt (note 18 “Borrowings” of the Consolidated financial statements in Item 18.).
The Group has certain investments in foreign operations, whose net assets are exposed to foreign currency translation risk. The Group faces currency exposures arising from the translation of profits earned in foreign currency subsidiaries into the Group’s reporting currency of US Dollars. As at October 31, 2021 two net investment hedges totaling €1.03 billion have been designated using non-derivative Euro debt instruments to minimize the volatility in shareholder’s equity arising from foreign currency translation (October 31, 2020 two net investment hedges totaling €1.05 billion).
Exposures also arise from foreign currency denominated trading transactions undertaken by subsidiaries and exposures here are not hedged.
The Group’s currency exposures comprise those that give rise to net currency gains and losses to be recognized in the Consolidated statement of comprehensive income as well as gains and losses on consolidation, which go to reserves. Such exposures reflect the monetary assets and liabilities of the Group that are not denominated in the operating or functional currency of the operating unit involved and the Group’s investment in net assets in currencies other than US dollar.
The impact on the Consolidated statement of comprehensive income of foreign exchange losses in the year ended October 31, 2021 of $0.1 million (2020: $29.7 million loss).
Exposure report analysis
The Group’s principal exposures in relation to market risks are the changes in the exchange rates between the US dollar and transactions made in other currencies as well as changes in interest rates from US and Euro capital markets. Foreign exchange exposures for all re-measuring balances are tracked and reported to management
The key drivers for foreign exchange exposure are cash, borrowings and inter-company positions with trade receivables and trade payables having less relative aggregate exposure. The table below represents a key currency extract from the Group exposures to movements in currency presenting exposures in excess of $10 million equivalent. The key exposure relates to the increased Euro debt profile since the May refinancing. The Indian Rupee and Israeli Shekel had key inter-company positions during the year.
Foreign exchange analysis is shown as for reporting to the Treasury Risk committee. Please note that aggregate Foreign exchange exposures for the Euro below do not consider the impact of the net investment hedges. However, the impact can be seen in the hedging table above.
Group exposure | +/- 5 | % | +/- 10 | % | ||||||||
| Key aggregate currency exposures* | $m | $m | $m | |||||||||
| Euro (EUR) | 1,504.6 | 75.2 | 150.4 | |||||||||
| GB Pounds (GBP) | 156.7 | 7.8 | 15.6 | |||||||||
| Indian Rupee (INR) | 64.4 | 3.2 | 6.4 | |||||||||
| Japanese Yen (JPY) | 53.0 | 2.7 | 5.3 | |||||||||
| Australian Dollar (AUD) | 32.5 | 1.6 | 3.3 | |||||||||
| Canadian Dollar (CAD) | 31.9 | 1.6 | 3.2 | |||||||||
| Israeli Shekel (ILS) | 29.5 | 1.5 | 3.0 | |||||||||
| Chinese Yuan (CNY) | 27.3 | 1.4 | 2.7 | |||||||||
| Swedish Krona (SEK) | 24.3 | 1.2 | 2.4 | |||||||||
| United Arab Emirates Dirham (AED) | 24.2 | 1.2 | 2.4 | |||||||||
| Czech Koruna (CZK) | 12.0 | 0.6 | 1.2 | |||||||||
| Mexican Peso (MXN) | 10.4 | 0.5 | 1.0 | |||||||||
| Turkish Lira (TRY) | 10.2 | 0.5 | 1.0 | |||||||||
| Danish Krone (DKK) | 10.1 | 0.5 | 1.0 | |||||||||
* Presenting aggregate foreign exchange exposures in excess of $10 million equivalent.
Interest rate exposure
Borrowings exposures to variable interest rate changes (based on gross debt excluding the effects of hedging) | Group exposure | LIBOR, EURIBOR +1% | ||||||
| $m | $m | |||||||
| Euro | 1,186.9 | 11.9 | ||||||
| US dollar | 3,421.1 | 34.2 | ||||||
| Total Gross Debt | 4,608.0 | 46.1 | ||||||
Not applicable
Not applicable.
Not applicable.
Fees and charges payable by ADS holders
Deutsche Bank Trust Company Americas (Deutsche Bank) was appointed as the depositary bank (the Depositary) for Micro Focus’s ADS program pursuant to the Deposit Agreement dated August 11, 2017 between Micro Focus, the Depositary and the owners and holders of ADSs (the Deposit Agreement).
The Deposit Agreement provides that ADS holders may be required to pay various fees to the Depositary, and the Depositary may refuse to provide any service for which a fee is assessed until the applicable fee has been paid.
The Depositary charges a fee for the operation and maintenance of administering the ADSs. The total fees charged by the Depositary are unchanged at $0.02 per ADS charged twice per year.
| Service | Fees | |
| Issuance of ADSs including issuance from a distribution of shares and distribution of ADSs pursuant to bonus distributions, stock splits or other distributions. | $5.00 (or less) per 100 ADSs (or portion of 100 ADSs). | |
| Distribution of cash dividends. This fee is not currently charged. | $5.00 (or less) per 100 ADSs (or portion of 100 ADSs). | |
| An annual fee for operation and maintenance of administering the ADSs. | $5.00 (or less) per 100 ADSs (or portion of 100 ADSs). The current per ADS fee to be charged for the operation and maintenance of administering pf the ADS is $0.02 per ADS twice per year. | |
| Transfer and registration of shares on share register to or from the name of the depositary or its agent when you deposit or withdraw shares | Registration or transfer fees |
In addition, ADS holders may be required under the Deposit Agreement to pay the Depositary: (a) taxes (including applicable interest and penalties) and other governmental charges; (b) registration fees; (c) certain cable, telex and facsimile transmission and delivery expenses; (d) the expenses and charges incurred by the Depositary in the conversion of foreign currency; (e) such fees and expenses as are incurred by the Depositary in connection with compliance with applicable exchange control regulations and other regulatory requirements; and (f) the fees and expenses incurred by the Depositary, the custodian or any nominee in connection with the servicing or delivery of deposited securities. The Depositary may: (a) withhold dividends or other distributions or sell for the account of any ADS holder any or all of the shares underlying the ADSs in order to satisfy any tax or governmental charge; and (b) deduct from any cash distribution the applicable fees and charges of, and expenses incurred by, the Depositary and any taxes, duties or other governmental charges on account.
Fees and payments made by the Depositary to Micro Focus
Under the terms of the contractual arrangements set out in the separate agreement between Micro Focus and the Depositary referred to above, Micro Focus received a total of approximately US$3.0 million from the Depositary, comprising fees charged in respect of the semi-annual service fee collection for November 2020 and April 2021. In addition to this, following the 2021 AGM the Depository paid $0.3 million to 3rd parties on behalf of Micro Focus.
Not applicable.
Not applicable.
Disclosure controls and procedures (as defined in Rule 13a-15(e) promulgated under the Securities Exchange Act of 1934 (the “Exchange Act”)) are designed to provide reasonable assurance that the information required to be (i) recorded, processed, summarized and reported within the time periods specified in the SEC’s rules and forms and (ii) accumulated and communicated to management, including our Chief Executive Officer and Chief Financial Officer, to allow timely decisions regarding required disclosure. Management recognizes that any controls and procedures, no matter how well designed and operated, can provide only reasonable assurance of achieving their objectives, and management necessarily applies its judgement in evaluating the cost benefit relationship of possible controls and procedures.
Based on their most recent evaluation, our Chief Executive Officer and Chief Financial Officer concluded that, as of October 31, 2021, the Company’s disclosure controls and procedures were not effective as a result of the material weakness in our internal control over financial reporting described below. Notwithstanding the material weakness described below, our management, including our Chief Executive Officer and Chief Financial Officer, believes that the audited consolidated financial statements contained in this Annual Report on Form, 20-F fairly present, in all material respects, our financial condition, results of operations and cash flows for the fiscal years presented in conformity with IFRS. In addition, the material weaknesses described below did not result in a material misstatement to the financial statements.
Please see Exhibits 12.1 and 12.2 for the certifications required by this Item.
As a foreign issuer with American Depositary Shares listed on the New York Stock Exchange (“NYSE”) the Group, as part of its disclosure and reporting obligations in the United States, is required to furnish this Annual Report by its management on its internal controls over financial reporting, including an attestation report issued by its independent registered public accounting firm pursuant to Section 404 of the Sarbanes-Oxley Act of 2002 (“SOX”) as at October 31, 2021.
Management is responsible for establishing and maintaining adequate internal controls over financial reporting for the Group. Internal control over financial reporting is defined in Rules 13a-15(f) and 15d-15(f) promulgated under the Exchange Act. The Group’s internal controls over financial reporting include policies and procedures which:
| - | are designed to give reasonable assurance that the transactions are recorded as necessary to permit the preparation of financial statements in accordance with IFRS as adopted by the EU and IFRS as issued by the IASB, and that receipts and expenditures are being made only in accordance with authorization of management and the directors; |
| - | relate to the maintenance of records that in reasonable detail accurately and fairly reflect the transactions and disposal of assets; and |
| - | give reasonable assurance regarding the prevention or timely detection of unauthorized use, acquisition or disposal of the Group’s assets that could have a material impact on the financial statements. |
Any internal control network will have inherent limitations, such that the possibility of human error and circumvention or overriding of controls and procedures may not prevent or detect misstatements. In addition, the projection of any controls to future periods are subject to the risk that controls may become inadequate due to changes in conditions or because the degree of compliance with policies and procedures may deteriorate.
Management assessed the effectiveness of internal controls over financial reporting as at October 31, 2021 based on the Internal Control – Integrated Framework issued by the Committee of Sponsoring Organizations of the Treadway Commission 2013. Based on the assessment, management concluded that its internal control over financial reporting was not effective due to the following material weakness: In July, the Company completed the migration to its new enterprise-wide application platform (“Enterprise Platform”) which included new business controls and IT general controls (“ITGC’s). There was not sufficient time to allow ITGC’s and related business controls to operate effectively by October 31, 2021. In aggregate, these control deficiencies impact all financial reporting processes and constitute a material weakness. This material weakness did not result in material misstatement to the financial statements.
Our Consolidated financial statements have been audited by KPMG LLP, an independent registered public accounting firm, which has issued an attestation report expressing an adverse opinion on the effectiveness of internal control over financial reporting, with respect to this material weakness in this Annual Report on Form 20-F.
Report of Independent Registered Public Accounting Firm
To the Shareholders and Board of Directors
Micro Focus International plc.:
Opinion on Internal Control Over Financial Reporting
We have audited Micro Focus International plc and subsidiaries’ (the Company) internal control over financial reporting as of October 31, 2021, based on Internal Control – Integrated Framework (2013) issued by the Committee of Sponsoring Organizations of the Treadway Commission”. In our opinion, because of the effect of the material weakness, described below, on the achievement of the objectives of the control criteria, the Company has not maintained effective internal control over financial reporting as of October 31, 2021, based on criteria established in Internal Control – Integrated Framework (2013) issued by the Committee of Sponsoring Organizations of the Treadway Commission.
We also have audited, in accordance with the standards of the Public Company Accounting Oversight Board (United States) (PCAOB), the consolidated statements of financial position of the Company as of October 31, 2021 and 2020, the related consolidated statements of comprehensive income, changes in equity, and cash flows for each of the years in the three-year period ended October 31, 2021, the summary of significant accounting policies and the related notes (collectively, the Consolidated financial statements), and our report dated February 24, 2022 expressed an unqualified opinion on those Consolidated financial statements.
A material weakness is a deficiency, or a combination of deficiencies, in internal control over financial reporting, such that there is a reasonable possibility that a material misstatement of the Company’s annual or interim financial statements will not be prevented or detected on a timely basis. A material weakness has been identified and included in management’s assessment related to ineffective IT general controls and related business controls following the migration to a new enterprise platform in July 2021. In aggregate, these deficiencies impact all financial reporting processes and constitute a material weakness. The material weakness was considered in determining the nature, timing, and extent of audit tests applied in our audit of the October 31, 2021 Consolidated financial statements, and this report does not affect our report on those Consolidated financial statements.
Basis for Opinion
The Company’s management is responsible for maintaining effective internal control over financial reporting and for its assessment of the effectiveness of internal control over financial reporting, included in the accompanying Management’s Annual Report on Internal Control over Financial Reporting. Our responsibility is to express an opinion on the Company’s internal control over financial reporting based on our audit. We are a public accounting firm registered with the PCAOB and are required to be independent with respect to the Company in accordance with the U.S. federal securities laws and the applicable rules and regulations of the Securities and Exchange Commission and the PCAOB.
We conducted our audit in accordance with the standards of the PCAOB. Those standards require that we plan and perform the audit to obtain reasonable assurance about whether effective internal control over financial reporting was maintained in all material respects. Our audit of internal control over financial reporting included obtaining an understanding of internal control over financial reporting, assessing the risk that a material weakness exists, and testing and evaluating the design and operating effectiveness of internal control based on the assessed risk. Our audit also included performing such other procedures as we considered necessary in the circumstances. We believe that our audit provides a reasonable basis for our opinion.
Definition and Limitations of Internal Control Over Financial Reporting
A company’s internal control over financial reporting is a process designed to provide reasonable assurance regarding the reliability of financial reporting and the preparation of financial statements for external purposes in accordance with generally accepted accounting principles. A company’s internal control over financial reporting includes those policies and procedures that (1) pertain to the maintenance of records that, in reasonable detail, accurately and fairly reflect the transactions and dispositions of the assets of the company; (2) provide reasonable assurance that transactions are recorded as necessary to permit preparation of financial statements in accordance with generally accepted accounting principles, and that receipts and expenditures of the company are being made only in accordance with authorizations of management and directors of the company; and (3) provide reasonable assurance regarding prevention or timely detection of unauthorized acquisition, use, or disposition of the company’s assets that could have a material effect on the financial statements.
Because of its inherent limitations, internal control over financial reporting may not prevent or detect misstatements. Also, projections of any evaluation of effectiveness to future periods are subject to the risk that controls may become inadequate because of changes in conditions, or that the degree of compliance with the policies or procedures may deteriorate.
/s/ KPMG LLP
London, United Kingdom
February 24, 2022
In the period, the Group completed the migration from legacy IT applications and infrastructure to the Enterprise Platform. The Enterprise Platform enables further improvement to process and controls. Improvements for the business include refining functional process and organisational simplification as referred to in Item 3.D, Item 5.A and Item 5.D. The migration was successfully completed in two planned phases, the first completed in January 2021 and the second completed in July 2021. The majority of the work was carried out within the requirements of remote working under COVID-19 restrictions. The timing of the phases meant that there was insufficient time prior to the financial year end to allow ITGC’s and related business controls to operate effectively.
During the period the Group continued to monitor and maintain the framework of SOX compliant internal controls under its central SOX Compliance Program (“SCP”) on the legacy systems as well as preparing and implementing controls for the Enterprise Platform. The SCP worked together with a specialist team from its outsourced internal audit partner, PwC. Governance for the SCP included a cross-functional SOX steering group (“SSG”). In addition, the cross functional disclosure committee continued to meet to assist the Chief Executive Officer and Chief Financial Officer in fulfilling their responsibilities in connection with the accuracy of financial reporting. The Group strengthened internal compliance by the appointment of an additional team from PwC to work alongside the business and the Enterprise Platform implementation project team to carry out end-to-end process mapping and support Risk and Control Matrix (“RACM”) development for the new Enterprise Platform controls. A key work stream of the SCP also relates to the adequacy of ITGCs. The work undertaken as part of the SCP identified a number of areas for improvement in the Group’s ITGCs. A remediation plan was agreed, which forms part of the SCP. Work in this area was carried out under an IT SOX Compliance Group chaired by the Chief Information Security Officer (CISO) reporting to the main SSG.
In the year, the Group has also reviewed its entity-level controls including continued supplementary SOX training plan across relevant parts of the Group. As part of the overall governance, the SSG continues to monitor potential adverse impacts of organisational change to the SCP.
In the 2020 Form 20-F the Group reported certain weaknesses in its internal control over financial reporting, which under Public Company Accounting Oversight Board auditing standards were considered to be a material weakness. The material weakness related to the fact that Company did not have adequate controls at that time surrounding existing IT applications, in particular regarding change management and access control. These controls and control deficiencies were then superseded in the year by the controls on the Enterprise Platform.
Remediation
The Group continues its work under the SCP to remediate the material weakness and other control deficiencies, and any other matters, which arise during its progress towards SOX compliance. As the business commenced the new financial year operating on the Enterprise Platform it has also been able to implement an enhanced testing program for year ended October 31, 2022.
To maintain the required control environment the Group relies upon automated, semi-automated and manual controls together with a combination of preventative and detective controls. The material weakness, control deficiencies and other matters may not be able to be remediated by October 31, 2022, and there is a risk that other deficiencies for the purposes of SOX may be identified. Failure to correct the material weakness, or our failure to discover and address any other material weakness or control deficiencies, could result in inaccuracies in our financial statements, and impair our ability to comply with applicable financial reporting requirements and related regulatory filings on a timely basis. It could also result in an adverse reaction in the financial markets due to a loss of confidence in the reliability of the Group’s financial statements and could have a material adverse effect on the Group’s business, financial condition, results of operation and prospects.
The Audit Committee includes Richard Atkins who, in the opinion of the Board, is an ‘audit committee financial expert’ and is independent (as defined for this purpose in 17 CFR 240.10A-3). The board considered that the Committee’s members have broad commercial knowledge and extensive business leadership experience, having held between them various roles in major business, financial management, and finance function supervision and that this constitutes a broad suitable mix of business and financial experience on the committee.
Micro Focus has adopted an updated code of ethics in the year ended October 31, 2021 (the Micro Focus Code of Conduct) which applies to all employees including the Chief Executive Officer and Chief Financial Officer and other senior financial management. This code of ethics is available on our website (https://www.microfocus.com/media/guide/micro_focus_code_of_conduct_guide.pdf). The information on our website is not incorporated by reference into this report.
The Code of Ethics is included as Exhibit 11.1 MF Code of Conduct Guide.
During the years ended October 31, 2021, 2020 and 2019, the Group obtained the following services from the Group’s auditors as detailed below:
Year ended October 31, 2021 | Year ended October 31, 2020 | Year ended October 31, 2019 | ||||||||||
| $m | $m | $m | ||||||||||
| Audit of Company | 8.0 | 7.2 | 12.8 | |||||||||
| ICOFR | 4.7 | 2.7 | 3.0 | |||||||||
| Audit of subsidiaries | 2.8 | 2.9 | 3.9 | |||||||||
| Total audit fees | 15.5 | 12.8 | 19.7 | |||||||||
| Audit-related assurance fees | 0.5 | 0.6 | 0.6 | |||||||||
| Other assurance services | - | - | - | |||||||||
| Total audit related fees | 0.5 | 0.6 | 0.6 | |||||||||
| Tax compliance services | - | - | - | |||||||||
| Tax advisory services | - | - | 0.1 | |||||||||
| Tax fees | - | - | 0.1 | |||||||||
| All other fees | - | - | - | |||||||||
| Total | 16.0 | 13.4 | 20.4 | |||||||||
The fees represent fees paid to KPMG LLP, as the current auditor.
There were no other fees in the years ended October 31, 2021, 2020 and 2019.
Independence and objectivity of the external auditors
The Audit Committee approves all non-audit work commissioned from the external auditors. The committee is responsible for safeguarding the independence and objectivity of the external auditors and has developed a robust policy designed to ensure that this is not compromised. As explained above, the committee manages the risks that the external auditors undertake inappropriate non- audit work, or earn material levels of fees for non-audit services. It also considers the standing and experience of the external audit partner and takes comfort from the fact that KPMG took office relatively recently and from the external auditors’ confirmation that they have complied with relevant UK and US independence standards.
The committee is satisfied that the independence and objectivity of the external auditors has been maintained throughout the year ended October 31, 2021 and to the date of this report.
Not applicable.
The purchase of shares shown in the table below were made on behalf of the Group’s all-employee share plans (a Sharesave plan and an Employee Stock Purchase Plan see Item 6E for further details on these plans) by the Micro Focus Employee benefit trust (“EBT”). The EBT is included in the consolidated financial statements in Item 18 therefore these purchases are treated as Treasury shares; however, they are owned by the EBT and can only be used to settle employee benefits for eligible employees.
| Period | Total Number of Shares purchased | Average price paid per share | Total Number of Shares purchased as part of publicly announced plans or programs | Maximum number of Shares that may yet be purchased under the plans or programs | ||||||||||||
| November 1, 2020 to November 30, 2020 | - | - | - | - | ||||||||||||
| December 1, 2020 to December 31, 2020 | - | - | - | - | ||||||||||||
| January 1, 2021 to January 31, 2021 | - | - | - | - | ||||||||||||
| February 1, 2021 to February 28, 2021 | - | - | - | - | ||||||||||||
| March 1, 2021 to March 31, 2021 | 4,000,000 | 1 | $ | 6.81 | - | - | ||||||||||
| April 1, 2021 to April 30, 2021 | - | - | - | - | ||||||||||||
| May 1, 2021 to May 31, 2021 | - | - | - | - | ||||||||||||
| June 1, 2021 to June 30, 2021 | - | - | - | - | ||||||||||||
| July 1, 2021 to July 31, 2021 | - | - | - | - | ||||||||||||
| August 1, 2021 to August 31, 2021 | - | - | - | - | ||||||||||||
| September 1, 2021 to September 30, 2021 | - | - | - | - | ||||||||||||
| October 1, 2021 to October 31, 2021 | - | - | - | - | ||||||||||||
| Total | 4,000,000 | $ | 6.81 | - | - | |||||||||||
1 During the year ended October 31, 2021 the Micro Focus Employee Benefit Trust (“EBT”) purchased four million of the Group’s shares in open-market transactions. The EBT will hold these shares to satisfy future exercises of share options.
Not applicable.
Principles
Micro Focus International plc (the “Company”) has a primary listing on the London Stock Exchange. As such, it is required to comply with the UK Corporate Governance Code (the “Code”). For the year ended October 31, 2021 this was the edition of the Code published by the UK’s Financial Reporting Council in July 2018.
The Company’s ADSs are listed on the NYSE. As a Foreign Private Issuer, we are required to comply with some, but not all, of the NYSE’s corporate governance rules, and are required to disclose any significant ways in which the UK corporate governance practices employed by the Company differ from those followed by US companies under the NYSE Listed Company Manual.
The directors are committed to ensuring that the Company operates in compliance with the main principles of the Code, as this provides a robust governance framework in support of the delivery of value to shareholders.
Compliance with the Code
UK listed companies are required to include in their Annual Report a narrative statement of (i) how they have applied the principles of the Code and (ii) whether or not they have complied with each of the provisions of the Code.
Throughout the year ended October 31, 2021 and to the date of this report, the Board considers that the Company has been in compliance with the principles of the Code, and with each of its provisions, save for one element of Provision 38 in relation to the alignment of pension contribution rates. Under Provision 38 the Company is partially compliant with this provision and will be fully compliant in the alignment of pension contribution rates for the executive directors with the wider workforce at the end of 2022. The pension contribution rate for Stephen Murdoch will be aligned at the end of 2022 as set out in the Directors’ Remuneration Policy which was approved by shareholders at the 2020 Annual General. The rate for Matt Ashley is already aligned, and the rates for any new director on joining would be aligned with the wider workforce.
Non-executive directors’ Independence
Each of the non-executive directors who served during the period November 1, 2020 to October 31, 2021, was considered by the Board to be independent. Karen Slatford1 was appointed to the Board in July 2010 and has now served for more than ten years. The Board has specifically considered whether this was likely to affect, or could appear to affect, her independence and concluded that she continued to demonstrate independence in thought and judgement, noting that there were no other relationships or circumstances that could affect her independence. The independent non-executive directors comprise a majority of the Board. In accordance with the Companies Act 2006, the Company has put in place procedures to deal with conflicts of interest, which have operated effectively. The board is aware of the other commitments of its directors and is satisfied that these do not conflict with their duties as directors of the Company. Any changes to these commitments are reported to the board.
The non-executive directors meet together regularly without the presence of executive directors. In addition, the Senior Independent Director meets with the non-executive and executive directors at least once a year to review the performance of the Non-Executive Chairman and to consider whether to recommend his re-election, providing feedback directly to the Chairman.
1 As announced on February 8, 2022, Karen Slatford has informed the Board of her intention to retire as a director of Micro Focus International Plc, following the conclusion of the 2022 Annual General Meeting and consequently will not be seeking re-election.
Committees of the board of directors
The Company has three principal Board committees that are broadly comparable in purpose and composition to those required by NYSE rules for domestic US companies. For instance, the Company has a Nomination (rather than nominating/corporate governance) Committee and a Remuneration (rather than compensation) Committee. The Company also has an Audit Committee, which NYSE rules require for both US companies and foreign private issuers. All the committees are comprised of non-executive directors only and none of the functions of these committees has been delegated to another committee.
Each Board Committee has clearly defined terms of reference approved by the Board setting out their respective authority and duties. The terms of reference for each committee can be found on the Company’s website at https://www.microfocus.com/en-us/governance-policies/committees-of-the-board
Under the US Securities Exchange Act of 1934 and the NYSE Listed Company Manual, the Company is required to have an audit committee that is comprised of at least three members from the independent non-executive directors of the Company’s Board. Our Audit Committee complies, and during the year ended October 31, 2021 has complied, with these requirements. As stated in Item 16.A. above, the Board has determined that Richard Atkins possesses ‘accounting or related financial management expertise’, as required by section 303A.07 (a) of the NYSE Listed Company Manual. Richard Atkins also possesses the financial and audit committee experience set forth in the Code.
The Company’s Audit Committee does not have direct responsibility for the appointment, reappointment or removal of the independent auditors. Instead, it follows the UK Companies Act 2006 by making recommendations to the Board on these matters for it to put forward for shareholder approval at the AGM.
Shareholder approval of equity compensation plans
Under NYSE listing rules, shareholders must be given the opportunity to vote on all equity-compensation plans and material revisions thereto, except for employment inducement awards, certain grants, plans and amendments in the context of mergers and acquisitions, and certain specific types of plans. The Company complies with corresponding UK requirements in the Listing Rules, requiring the Company to seek shareholder approval for employee share schemes and significant changes to existing schemes, save in circumstances permitted by the Listing Rules (Listing Rule 9.4.1). The Board, however, does not explicitly take into consideration the NYSE’s detailed definition of what are considered ‘material revisions’.
Corporate Governance Guidelines
Section 303A.09 of the NYSE Listed Company Manual requires listed companies to adopt and disclose corporate governance guidelines. As noted above, in line with its obligations under the UK’s Listing Rules the Company applies the UK Corporate Governance Code and, as required by the Listing Rules, the UK Annual Report contains an explanation of (i) how it has applied the principles of the Code, and (ii) whether it complies in full with the Code’s provisions, or, where it does not, providing an explanation of any non-compliance and the reasons for this (LR 9.8.6).
In addition, the Company is required to make certain mandatory corporate governance statements in accordance with the UK Listing Authority’s Disclosure Guidance and Transparency Rules, DTR 7, which are also included in the Group’s UK Annual Report and Accounts available on the Group’s website https://www.microfocus.com/en-us/investors/investor-download-centre.
Code of Business Conduct and Ethics
The Micro Focus Code of Conduct is available on the Company’s website at www.microfocus.com.
Not applicable.
Not applicable.
Not applicable.
The financial statements filed as part of this Annual Report on Form 20-F are included in Item 18 on pages F-1 through F-92 hereof.
The following exhibits are filed as part of this report:
| Description of the rights of each class of securities registered under Section 12 of the Exchange Act | ||
| Credit Agreement amendments, among Micro Focus International plc, Micro Focus Group Limited, MA FinanceCo., LLC, the Lenders party thereto and JPMorgan Chase Bank, N.A., as Administrative Agent and Collateral Agent. | ||
| Credit Agreement amendments, among Micro Focus International plc, Micro Focus Group Limited, Seattle Spinco, Inc., the Lenders party thereto and JPMorgan Chase Bank, N.A., as Administrative Agent and Collateral Agent. | ||
| Code of conduct | ||
| Certification pursuant to Section 302 of the Sarbanes-Oxley Act of 2002 | ||
| Certification pursuant to Section 302 of the Sarbanes-Oxley Act of 2002 | ||
| Certification of Stephen Murdoch under Section 906 of the Sarbanes-Oxley Act of 2002 | ||
| Certification of Matt Ashley under Section 906 of the Sarbanes-Oxley Act of 2002 | ||
| Consent of KPMG LLP. |
| 101.INS | Inline XBRL Instance Document (the instance document does not appear in the Interactive Date File because its XBRL tags are embedded with the Inline XBRL document) |
| 101.SCH | Inline XBRL Taxonomy Extension Schema Document |
| 101.CAL | Inline XBRL Taxonomy Extension Calculation Linkbase Document |
| 101.DEF | Inline XBRL Taxonomy Extension Definition Linkbase Document |
| 101.LAB | Inline XBRL Taxonomy Extension Label Linkbase Document |
| 101.PRE | Inline XBRL Taxonomy Extension Presentation Linkbase Document |
| 104 | Cover Page Interactive Data File (formatted as Inline XBRL and contained in Exhibit 101) |
Signature
The registrant hereby certifies that it meets all of the requirements for filing on Form 20-F and that it has duly caused and authorized the undersigned to sign this annual report on its behalf.
Micro Focus International plc
/s/ Stephen Murdoch
For US federal income tax purposes, a US holder of Micro Focus ADSs generally will be treated as the owner of the Micro Focus ordinary shares represented by the ADSs.
The US Treasury Department has expressed concern that depositaries for American Depositary Shares, or other intermediaries between the holders of shares of an issuer and the issuer, may be taking actions that are inconsistent with the claiming of US foreign tax credits by US holders of those receipts or shares. Accordingly, the analysis regarding the availability of a US foreign tax credit for UK taxes and sourcing rules described below could be affected by future actions that may be taken by the US Treasury Department.
Dividends Paid on Ordinary Shares or ADSs
The gross amount of any cash distribution (including the amount of any tax withheld, as discussed below) paid to a US holder by Micro Focus out of its current or accumulated earnings and profits (as determined for US federal income tax purposes) is subject to US federal income taxation as a dividend. For certain non-corporate US holders, including individuals, dividends that constitute “qualified dividend income” will be taxable to such US holder at the preferential rates applicable to long-term capital gains, provided that the US holder holds the ordinary shares or ADSs on which the dividends are paid for more than 60 days during the 121-day period beginning 60 days before the ex-dividend date and meets other holding period requirements. Dividends Micro Focus pays with respect to its ordinary shares or ADSs generally will be qualified dividend income if Micro Focus is eligible for benefits of the United States income tax treaty with the United Kingdom. Although Micro Focus believes that it is currently eligible for such treaty benefits, there can be no assurance that this will be the case for any taxable year or that such position would not be challenged by the IRS or sustained by a court. Dividends received by a corporate US holder generally will not be eligible for the dividends-received deduction that is allowed to US corporations in respect of dividends received from other US corporations. However, a corporate US holder that owns 10 per cent or more of Micro Focus’s stock may, in certain circumstances, be entitled to a deduction in respect of a dividend received from Micro Focus pursuant to Section 245A of the US Tax Code.
A dividend is taxable to a US holder when the US holder receives the dividend, actually or constructively. The amount of the dividend that a US holder must include in its income will be the US dollar value of the payments made (including any withholding tax imposed thereon), determined at the spot Sterling/US dollar rate on the date the dividend is includible in the US holder’s income, regardless of whether the payment is in fact converted into US dollars at such time. Generally, any gain or loss resulting from currency exchange fluctuations during the period from the date a US holder includes the dividend payment in income to the date a US holder converts the payment into US dollars will be treated as ordinary income or loss and will not be eligible for the special tax rate applicable to qualified dividend income. Such foreign exchange gain or loss generally will be income or loss from sources within the United States for foreign tax credit limitation purposes.
The portion of any cash distribution received by a US holder that is in excess of Micro Focus’s current and accumulated earnings and profits, as determined for US federal income tax purposes, will be treated as a non-taxable return of capital to the extent of the US holder’s basis in the ordinary shares or ADSs on which such payment is received, and thereafter as capital gain. However, Micro Focus does not expect to calculate its earnings and profits in accordance with US federal income tax principles. Accordingly, a US holder should expect to generally treat cash distributions paid by Micro Focus as taxable dividends for US federal income tax purposes.
A US holder must include any foreign tax withheld from a cash distribution on its ordinary shares or ADSs in the gross amount included in income, even though the US holder does not in fact receive such withheld amount. Subject to certain limitations, UK tax withheld, if any, in accordance with the United Kingdom-United States Income Tax Convention (1975), as amended (the “Treaty”), and paid over to the United Kingdom will be deductible or creditable against a US holder’s US federal income tax liability. Special rules apply in determining the foreign tax credit limitation with respect to dividends that are subject to the preferential tax rates. To the extent a refund of the tax withheld is available to a US holder under UK law or under the Treaty, the amount of tax withheld that is refundable will not be eligible for credit against a US holder’s US federal income tax liability.
Dividends paid by Micro Focus on its ordinary shares or ADSs generally will be income from sources outside the United States and will, depending on a US holder’s circumstances, be either “passive” or “general” income for purposes of computing the foreign tax credit allowable to the US holder. The rules governing the foreign tax credit are complex and involve the application of rules that depend upon a US holder’s particular circumstances. Accordingly, US holders are urged to consult their own tax advisors regarding the availability of the foreign tax credit under their particular circumstances.
Sale or Disposition of Ordinary Shares or ADSs
If a US holder sells or otherwise disposes of its ordinary shares or ADSs in a taxable sale or other disposition, such US holder will generally recognize capital gain or loss for US federal income tax purposes equal to the difference between the US dollar value of the amount that the US holder realizes in such disposition and the US holder’s tax basis, determined in US dollars, in the US holder’s Micro Focus ordinary shares or ADSs. Capital gain of certain non-corporate US holders, including individuals, is generally taxed at preferential rates where the property disposed of is held for more than one year. Gain or loss recognized by a US holder on the sale or other disposition of ordinary shares or ADSs will generally be income or loss from sources within the United States for foreign tax credit limitation purposes. The deductibility of a capital loss may be subject to limitations under the US Tax Code.
Information with Respect to Foreign Financial Assets
US holders that are owners of “specified foreign financial assets” with an aggregate value in excess of $50,000 (and in some circumstances, a higher threshold) may be required to file an information report with respect to such assets with their tax returns and may be subject to penalties if they fail to file such information report. “Specified foreign financial assets” include financial accounts maintained by foreign financial institutions, as well as the following, but only if they are held for investment and not held in accounts maintained by financial institutions: (i) stocks and securities issued by non-U.S. persons, (ii) financial instruments and contracts that have non-U.S. issuers or counterparties, and (iii) interests in foreign entities. US holders are urged to consult their own tax advisors regarding the application of this reporting requirement to their ownership of ordinary shares or ADSs.
Backup Withholding and Information Reporting
In general, dividend payments with respect to ordinary shares and ADSs and proceeds from the sale or other disposition of ordinary shares or ADSs made (or deemed made) within the United States may be subject to information reporting to the IRS and US backup withholding currently at a rate of 24 per cent. Backup withholding will generally not apply to a US holder who:
• Furnishes a correct taxpayer identification number and certifies, under penalties of perjury, that such US holder is not subject to backup withholding on an IRS Form W-9, and otherwise complies with applicable requirements of the backup withholding rules; or
• Is a corporation or otherwise exempt from backup withholding and, when required, demonstrates this fact in accordance with applicable Treasury regulations.
Backup withholding is not an additional tax. Amounts withheld under the backup withholding rules may be allowed as a credit against a holder’s US federal income tax liability and may entitle the holder to a refund, provided the holder timely furnishes the required information to the IRS.
US holders should consult their own independent professional tax adviser regarding the application of the information reporting and backup withholding rules.
Credits or deductions for UK taxes
As indicated under ‘Material UK Tax Consequences’ below, distributions in respect of, and gains on the disposition of, ordinary shares or ADSs, may be subject to UK taxation in certain circumstances. A US holder may be eligible to claim a credit or deduction in respect of UK taxes attributable to such income or gain for purposes of computing the US holder’s US federal income tax liability, subject to certain limitations. The US foreign tax credit rules are complex, and US holders should consult their own tax advisors regarding the availability of US foreign tax credits and the application of the US foreign tax credit rules to their particular situation.
The summary set forth above is included for general information only. US holders are urged to consult their own tax advisors to determine the particular tax consequences to them of the ownership and disposition of ordinary shares and ADSs, including the applicability and effect of U.S. state, local and non-U.S. tax laws.
Material UK Tax Consequences of Owning and Disposing of Micro Focus Ordinary Shares or ADSs
The following paragraphs set out below summarize material aspects of the UK tax treatment of US holders of ordinary shares or ADSs and do not purport to be either a complete analysis of all tax considerations relating to holding ordinary shares or ADSs or an analysis of the tax position of Micro Focus. They are based on current UK legislation and what is understood to be current HM Revenue & Customs practice, both of which are subject to change, possibly with retrospective effect.
The comments are intended as a general guide and (otherwise than where expressly stated to the contrary) apply only to US holders of ordinary shares or ADSs (other than under a personal equity plan or individual savings account) and who are the absolute beneficial owners of such shares.
These comments do not deal with certain types of shareholders such as charities, dealers in securities, persons holding or acquiring shares in the course of a trade, persons who have or could be treated for tax purposes as having acquired their ordinary shares or ADSs by reason of their employment, collective investment schemes, persons subject to UK tax on the remittance basis and insurance companies. You are encouraged to consult an appropriate independent professional tax advisor with respect to your tax position.
Tax on chargeable gains as a result of disposals of ordinary shares or ADSs
Subject to the below, US holders will not generally be subject to UK tax on chargeable gains on a disposal of ordinary shares or ADSs provided that they do not carry on a trade, profession or vocation in the United Kingdom through a branch, agency or permanent establishment in connection with which the ordinary shares or ADSs are held.
A US holder who is an individual, who has ceased to be resident for tax purposes in the United Kingdom for a period of less than five years and who disposes of ordinary shares or ADSs during that period may be liable for UK tax on capital gains (in the absence of any available exemptions or reliefs). If applicable, the tax charge will arise in the tax year that the individual returns to the United Kingdom.
Tax on dividends
Micro Focus is not required to withhold UK tax at source from dividends paid on ordinary shares or ADSs.
US holders will not generally be subject to UK tax on dividends received from Micro Focus provided that they do not carry on a trade, profession or vocation in the United Kingdom through a branch, agency or permanent establishment in connection with which the ordinary shares or ADSs are held.
Stamp duty and stamp duty reserve tax, referred to as SDRT
Based on current published HM Revenue & Customs practice and recent case law, transfers of ADSs should not be subject to SDRT or stamp duty provided that any instrument of transfer is executed and remains outside the UK and the transfer of an underlying ordinary share to the ADS holder in exchange for the cancellation of an ADS should also not give rise to a stamp duty or SDRT charge.
Transfers of ordinary shares outside of the depositary bank, including the repurchase of ordinary shares by Micro Focus, will generally be subject to stamp duty or SDRT at the rate of 0.5% of the amount or value of the consideration given, except as described above in connection with the cancellation of an ADS. If ordinary shares are redeposited into a clearance service or depositary system, the redeposit will attract stamp duty or SDRT at the higher rate of 1.5%.
The purchaser or the transferee of the ordinary shares or ADSs will generally be responsible for paying any stamp duty or SDRT payable. Where stamp duty or SDRT is payable, it is payable regardless of the residence position of the purchaser.
Inheritance tax
A gift or settlement of ordinary shares or ADSs by, or on the death of, an individual shareholder may give rise to a liability to UK inheritance tax even if the shareholder is not a resident of or domiciled in the United Kingdom.
A charge to inheritance tax may arise in certain circumstances where ordinary shares or ADSs are held by close companies and trustees of settlements.
However, pursuant to the Estate and Gift Tax Treaty 1980, referred to as the Treaty, entered into between the United Kingdom and the United States, a gift or settlement of ordinary shares or ADSs by shareholders who are domiciled in the United States for the purposes of the Treaty may be exempt from any liability to UK inheritance tax.
Not applicable.
Not applicable.
Copies of our Memorandum and Articles of Association can be found as exhibits of the Group’s Annual Report on Form 20-F for the year ended October 31, 2019 which is available at https://microfocus.com/media/investor-reports/form-20-f-for-12-months-ending-the-31-october-2019-report.pdf and has been filed with the SEC. The Memorandum and Articles of Association along with certain other documents referred to in this Annual Report on Form 20-F are available for inspection at our registered office at The Lawn, 22-30 Old Bath Road, Newbury, Berkshire, RG14 1QN, United Kingdom (c/o the Company Secretary) during usual business hours upon reasonable prior request.
Not applicable.
The following discussion and analysis contains forward-looking statements. See “Risk Factors” in Item 3D and “Cautionary Statement on Forward-Looking Statements’’ in this Annual Report on Form 20-F for a discussion of the uncertainties, risks and assumptions associated with these statements.
Financial risk factors
The Group’s treasury function aims to reduce exposures to interest rate, foreign exchange and other financial risks, to ensure liquidity is available as and when required, and to invest cash assets safely and profitably. The Group does not engage in speculative trading in financial instruments so the analysis in this section can be categorized as non-trading. The treasury function’s policies and procedures are reviewed and monitored by the Audit Committee and are subject to internal audit review.
The Group’s multi-national operations expose it to a variety of financial risks that include the effects of changes in credit risk, foreign currency risk, interest rate risk and liquidity/capital risk. Treasury risk management is carried out by a central treasury department under policies approved by the board of directors.
Group treasury identifies and evaluates financial risks alongside business management. The board provides written principles for risk management together with specific policies covering areas such as foreign currency risk, interest rate risk, credit risk and liquidity risk, the use of derivative and non-derivative financial instruments as appropriate, and investment of excess funds.
Financial Instruments sensitive to market risk
The carrying values and fair values for the borrowings and derivative financial instruments are included within the overall financial instruments table. Further information on borrowings showing the maturity profile of the anticipated cash flows in relation to the Group’s borrowing including principal repayments and interest payments can be found in section 5.B.1 along with the contracted interest rates and drawn/undrawn facilities.
Derivative and non-derivative financial instruments used for hedging purposes are further discussed below.
Financial Instruments
The tables below sets out the measurement categories and carrying values of financial assets and liabilities with fair value inputs where relevant.
Measurement category | Carrying value October 31, 2021 | Fair value 2021 | Fair value Hierarchy 2021/2020 | Carrying value October 31, 2020 | |||||||||||||
| $m | $m | ||||||||||||||||
| Financial assets: | |||||||||||||||||
| Non-current | |||||||||||||||||
Long-term pension asset | FV OCI | 17.1 | Fair value insurance based input | Level 3 | 18.2 | ||||||||||||
| Current | |||||||||||||||||
| Cash and cash equivalent | Amortised cost | 558.4 | - | - | 737.2 | ||||||||||||
| Trade and other receivables | Amortised cost | 784.2 | - | - | 648.6 | ||||||||||||
| Contract assets | Amortised cost | 62.0 | - | - | 33.7 | ||||||||||||
| 1,421.7 | 1,437.7 | ||||||||||||||||
| Financial liabilities: | |||||||||||||||||
| Non-current | |||||||||||||||||
Derivative financial instruments – interest rate swaps1 | FV OCI | - | Fair value Bank Institutions | Level 2 | 77.9 | ||||||||||||
Borrowings (gross)2 | Amortised cost | 4,566.0 | 4,556.5 | - | 4,699.0 | ||||||||||||
| Lease obligations | Amortised cost | 119.6 | - | - | 168.2 | ||||||||||||
| Current | |||||||||||||||||
Derivative financial instruments – interest rate swaps1 | FV OCI | 35.7 | Fair value Bank Institutions | Level 2 | - | ||||||||||||
Borrowings (gross)2 | Amortised cost | 42.0 | 41.9 | - | 34.2 | ||||||||||||
| Lease obligations | Amortised cost | 74.9 | - | - | 82.2 | ||||||||||||
| Trade and other payables – accruals | Amortised cost | 440.1 | - | - | 419.2 | ||||||||||||
| 5,278.3 | 5,480.7 | ||||||||||||||||
| 1 | Derivative interest rate swaps are measured at fair value in other comprehensive income (“FVOCI”) as a result of hedge accounting. All interest rate swaps are in designated hedge relationships and there are no other derivative financial instruments held as fair value through profit and loss (“FVTPL”). |
| 2 | Borrowings have a carrying value (net of unamortised prepaid facility arrangement fees and original issue discount) of $4,548.4 million (2020: $4,640.3 million). Total borrowings (gross) are shown in this table as $4,608.0 million (2020: $4,733.2 million) for the fair value comparison. |
For trade and other receivables, cash and cash equivalents, provisions, trade and other payables, fair values approximate to book values due to the short maturity periods of these financial instruments. For trade receivables, allowances are made for credit risk.
Borrowings with a carrying value of $4,548.4 million (2020: $4,640.3million) (note 18 “Borrowings” of the Consolidated financial statements in Item 18) including unamortised prepaid facility fees and discounts, have a fair value estimate of $4,598.4 million (2020: $4,535.1 million) based on trading prices obtained from external banking providers as at October 31, 2021.
Derivative financial instruments measured at fair value are classified as Level 2 in the fair value measurement hierarchy as they have been determined using significant inputs based on observable market data. The fair values of interest rate derivatives are derived from forward interest rates based on yield curves observable at the balance sheet date together with the contractual interest rates. Valuations are updated by the counter-party banks on a monthly basis.
This section will cover the primary market risk exposures regarding interest rates and foreign currencies. The Group’s principal exposures in relation to market risks are the changes in the exchange rates between the US Dollar and transactions made in other currencies as well as changes in interest rates from US and Euro capital markets.
Interest rate risk
The Group’s income and cash generated from operations are substantially independent of changes in market interest rates. The Group’s interest rate risk arises from short-term and long-term borrowings. Borrowings issued at variable rates expose the Group to cash flow interest rate risk. The Group currently uses four interest rate swaps to manage its cash flow interest rate risk arising from potential increases in the LIBOR interest rate.
The objective of the Group’s interest rate risk management policy is to manage the uncertainty and adverse impact on the Group’s net interest charge due to changes in interest rates to an acceptable level. In doing so, the Group seeks to minimize the cost of hedging and the level of associated counterparty risk.
The Group has set a target of approximately half its borrowings being subject to fixed interest rates in order to minimize its exposure to changes in interest rates. This is achieved through four USD interest swaps for a total notional value of $2.25 billion, with a maturity date of September 2022. The hedge accounting is discussed further later in the note.
On January 19, 2022, the Group executed a new 1m USD SOFR swap with a notional value of $750 million and a maturity date of February 28, 2027. The forward swap is effective on September 21, 2022 with a fixed interest rate of 1.656% swapped against the variable 1m SOFR USD rates.
The Group’s borrowing facilities do not contain any covenants with respect to interest cover ratios.
| October 31, 2021 | October 31, 2020 | |||||||
| Interest rate risk | $m | $m | ||||||
| Interest rate swaps (receive variable, pay fixed) | ||||||||
| Fair value of Derivative liability (total of 4 swaps) | (35.7 | ) | (77.9 | ) | ||||
| Notional amount (4 x $562.5 million) | 2,250.0 | 2,250.0 | ||||||
| Maturity date | September 30, 2022 | September 30, 2022 | ||||||
| Change in fair value of outstanding hedging instruments (OCI hedging reserve excluding deferred tax) | 42.2 | (41.3 | ) | |||||
| Change in value of hedging instruments (as above adjusted for impact of credit risk) | 41.9 | (39.9 | ) | |||||
| Hedging ratio | 1.1 | 1.1 | ||||||
The Group has four interest rate swaps, which are designated in a hedge relationship.
The Group’s approved strategy in accordance with our risk management policies is to minimize the risk of cash flow fluctuations due to interest rate changes in relation to the 1M-USD LIBOR rate for up to half of the Group’s external borrowings for the period October 19, 2017 to September 30, 2022.
The specific risk management objective is to hedge the interest rate risk (cash flow risk) due to changes in the 1M-USD LIBOR rate charged on $2,250.0 million of the debt issued by Seattle Spin Co Inc. between October 19, 2017 and September 30, 2022.
Derivatives are only used for economic hedging purposes and not as speculative investments.
The swap contracts require settlement of net interest receivable or payable on a monthly basis. The fixed interest rate for each swap is 1.949% and the Group receives a variable rate in line with LIBOR. The Seattle loan is priced at LIBOR (with a 0% floor) plus a current margin of 2.75% with the swaps aimed at addressing the risk of a rising LIBOR element. As such, the total interest cost of the hedged element of the Seattle loan is 4.699%. For the year to October 31, 2021, net interest (finance cost) paid for the swaps amounted to $41.3 million. For the life of the swap, net interest paid to date amounted to $58.5 million.
Non-Derivative financial instruments – Designated Euro borrowings
| October 31, 2021 | October 31, 2020 | |||||||
| Foreign exchange risk | $m | $m | ||||||
| Notional amounts for Designated Euro borrowing | ||||||||
| Euro B-1 2020 tranche €600 million (Borrowings maturity date: June 2025) | 676.0 | 700.3 | ||||||
Foreign exchange (loss) on revaluation transferred to OCI-CTA - no sources of ineffectiveness observed in review | 6.5 | (34.5 | ) | |||||
| Euro 2017 tranche €453 million (Borrowings maturity date: June 2024) | 510.9 | 528.5 | ||||||
Foreign exchange (loss) on revaluation transferred to OCI-CTA - no sources of ineffectiveness observed in review | 4.8 | (24.2 | ) | |||||
| Hedge ratio for each of the two Net investment hedges | 1:1 | 1:1 | ||||||
The Group has designated two tranches of non-derivative Euro borrowings in two hedge relationships The borrowings in place have a designated initial carrying value of approx. €1.03 billion (note 18 “Borrowings” of the Consolidated financial statements in Item 18.) hedged against Euro designated net investments in foreign operations.
The specific risk management objective is to carry out a net investment hedge in the consolidated financial statements of the Group, to reduce the foreign currency translation exposure arising from the Group’s investments in foreign entities with Euro functional currency through the use of Euro currency borrowings as hedging instruments as permitted by the Group’s Treasury policy.
Foreign exchange risk
The Group operates internationally and is exposed to foreign exchange risk arising from various currency exposures, primarily with respect to the Euro, UK Pound Sterling, Indian Rupee, Israeli Shekel, Japanese Yen, Canadian Dollar, Australian Dollar and the Chinese Yuan. Foreign exchange risk arises from future commercial transactions, recognized assets and liabilities and net investments in foreign operations where the transactions are denominated in a currency that is not the entity’s functional currency.
The Group is subject to exposure on the translation of the net assets of foreign currency subsidiaries into its reporting currency, US Dollar. The Group’s primary balance sheet translation exposures are noted in the Exposure analysis below. These exposures are kept under regular review with the Group treasury function providing reporting to the Treasury Risk committee and the Audit committee.
Group borrowings are denominated in US Dollars and Euros. The Group seeks to match the currency profile of borrowings to the cash flows arising from the Groups operations used to service those borrowings. The May 2020 debt refinancing included an additional proportion of Euro debt and a reduction in US Dollar debt which is intended to better match the currency profile of the Group’s debt with the cash flows used to service that debt (note 18 “Borrowings” of the Consolidated financial statements in Item 18.).
The Group has certain investments in foreign operations, whose net assets are exposed to foreign currency translation risk. The Group faces currency exposures arising from the translation of profits earned in foreign currency subsidiaries into the Group’s reporting currency of US Dollars. As at October 31, 2021 two net investment hedges totaling €1.03 billion have been designated using non-derivative Euro debt instruments to minimize the volatility in shareholder’s equity arising from foreign currency translation (October 31, 2020 two net investment hedges totaling €1.05 billion).
Exposures also arise from foreign currency denominated trading transactions undertaken by subsidiaries and exposures here are not hedged.
The Group’s currency exposures comprise those that give rise to net currency gains and losses to be recognized in the Consolidated statement of comprehensive income as well as gains and losses on consolidation, which go to reserves. Such exposures reflect the monetary assets and liabilities of the Group that are not denominated in the operating or functional currency of the operating unit involved and the Group’s investment in net assets in currencies other than US dollar.
The impact on the Consolidated statement of comprehensive income of foreign exchange losses in the year ended October 31, 2021 of $0.1 million (2020: $29.7 million loss).
Exposure report analysis
The Group’s principal exposures in relation to market risks are the changes in the exchange rates between the US dollar and transactions made in other currencies as well as changes in interest rates from US and Euro capital markets. Foreign exchange exposures for all re-measuring balances are tracked and reported to management
The key drivers for foreign exchange exposure are cash, borrowings and inter-company positions with trade receivables and trade payables having less relative aggregate exposure. The table below represents a key currency extract from the Group exposures to movements in currency presenting exposures in excess of $10 million equivalent. The key exposure relates to the increased Euro debt profile since the May refinancing. The Indian Rupee and Israeli Shekel had key inter-company positions during the year.
Foreign exchange analysis is shown as for reporting to the Treasury Risk committee. Please note that aggregate Foreign exchange exposures for the Euro below do not consider the impact of the net investment hedges. However, the impact can be seen in the hedging table above.
Group exposure | +/- 5 | % | +/- 10 | % | ||||||||
| Key aggregate currency exposures* | $m | $m | $m | |||||||||
| Euro (EUR) | 1,504.6 | 75.2 | 150.4 | |||||||||
| GB Pounds (GBP) | 156.7 | 7.8 | 15.6 | |||||||||
| Indian Rupee (INR) | 64.4 | 3.2 | 6.4 | |||||||||
| Japanese Yen (JPY) | 53.0 | 2.7 | 5.3 | |||||||||
| Australian Dollar (AUD) | 32.5 | 1.6 | 3.3 | |||||||||
| Canadian Dollar (CAD) | 31.9 | 1.6 | 3.2 | |||||||||
| Israeli Shekel (ILS) | 29.5 | 1.5 | 3.0 | |||||||||
| Chinese Yuan (CNY) | 27.3 | 1.4 | 2.7 | |||||||||
| Swedish Krona (SEK) | 24.3 | 1.2 | 2.4 | |||||||||
| United Arab Emirates Dirham (AED) | 24.2 | 1.2 | 2.4 | |||||||||
| Czech Koruna (CZK) | 12.0 | 0.6 | 1.2 | |||||||||
| Mexican Peso (MXN) | 10.4 | 0.5 | 1.0 | |||||||||
| Turkish Lira (TRY) | 10.2 | 0.5 | 1.0 | |||||||||
| Danish Krone (DKK) | 10.1 | 0.5 | 1.0 | |||||||||
* Presenting aggregate foreign exchange exposures in excess of $10 million equivalent.
Interest rate exposure
Borrowings exposures to variable interest rate changes (based on gross debt excluding the effects of hedging) | Group exposure | LIBOR, EURIBOR +1% | ||||||
| $m | $m | |||||||
| Euro | 1,186.9 | 11.9 | ||||||
| US dollar | 3,421.1 | 34.2 | ||||||
| Total Gross Debt | 4,608.0 | 46.1 | ||||||
Not applicable
Not applicable.
Not applicable.
Fees and charges payable by ADS holders
Deutsche Bank Trust Company Americas (Deutsche Bank) was appointed as the depositary bank (the Depositary) for Micro Focus’s ADS program pursuant to the Deposit Agreement dated August 11, 2017 between Micro Focus, the Depositary and the owners and holders of ADSs (the Deposit Agreement).
The Deposit Agreement provides that ADS holders may be required to pay various fees to the Depositary, and the Depositary may refuse to provide any service for which a fee is assessed until the applicable fee has been paid.
The Depositary charges a fee for the operation and maintenance of administering the ADSs. The total fees charged by the Depositary are unchanged at $0.02 per ADS charged twice per year.
| Service | Fees | |
| Issuance of ADSs including issuance from a distribution of shares and distribution of ADSs pursuant to bonus distributions, stock splits or other distributions. | $5.00 (or less) per 100 ADSs (or portion of 100 ADSs). | |
| Distribution of cash dividends. This fee is not currently charged. | $5.00 (or less) per 100 ADSs (or portion of 100 ADSs). | |
| An annual fee for operation and maintenance of administering the ADSs. | $5.00 (or less) per 100 ADSs (or portion of 100 ADSs). The current per ADS fee to be charged for the operation and maintenance of administering pf the ADS is $0.02 per ADS twice per year. | |
| Transfer and registration of shares on share register to or from the name of the depositary or its agent when you deposit or withdraw shares | Registration or transfer fees |
In addition, ADS holders may be required under the Deposit Agreement to pay the Depositary: (a) taxes (including applicable interest and penalties) and other governmental charges; (b) registration fees; (c) certain cable, telex and facsimile transmission and delivery expenses; (d) the expenses and charges incurred by the Depositary in the conversion of foreign currency; (e) such fees and expenses as are incurred by the Depositary in connection with compliance with applicable exchange control regulations and other regulatory requirements; and (f) the fees and expenses incurred by the Depositary, the custodian or any nominee in connection with the servicing or delivery of deposited securities. The Depositary may: (a) withhold dividends or other distributions or sell for the account of any ADS holder any or all of the shares underlying the ADSs in order to satisfy any tax or governmental charge; and (b) deduct from any cash distribution the applicable fees and charges of, and expenses incurred by, the Depositary and any taxes, duties or other governmental charges on account.
Fees and payments made by the Depositary to Micro Focus
Under the terms of the contractual arrangements set out in the separate agreement between Micro Focus and the Depositary referred to above, Micro Focus received a total of approximately US$3.0 million from the Depositary, comprising fees charged in respect of the semi-annual service fee collection for November 2020 and April 2021. In addition to this, following the 2021 AGM the Depository paid $0.3 million to 3rd parties on behalf of Micro Focus.
Not applicable.
Not applicable.
Disclosure controls and procedures (as defined in Rule 13a-15(e) promulgated under the Securities Exchange Act of 1934 (the “Exchange Act”)) are designed to provide reasonable assurance that the information required to be (i) recorded, processed, summarized and reported within the time periods specified in the SEC’s rules and forms and (ii) accumulated and communicated to management, including our Chief Executive Officer and Chief Financial Officer, to allow timely decisions regarding required disclosure. Management recognizes that any controls and procedures, no matter how well designed and operated, can provide only reasonable assurance of achieving their objectives, and management necessarily applies its judgement in evaluating the cost benefit relationship of possible controls and procedures.
Based on their most recent evaluation, our Chief Executive Officer and Chief Financial Officer concluded that, as of October 31, 2021, the Company’s disclosure controls and procedures were not effective as a memberresult of the material weakness in our internal control over financial reporting described below. Notwithstanding the material weakness described below, our management, including our Chief Executive Officer and Chief Financial Officer, believes that the audited consolidated financial statements contained in this Annual Report on Form, 20-F fairly present, in all material respects, our financial condition, results of operations and cash flows for the fiscal years presented in conformity with IFRS. In addition, the material weaknesses described below did not result in a material misstatement to the financial statements.
Please see Exhibits 12.1 and 12.2 for the certifications required by this Item.
As a foreign issuer with American Depositary Shares listed on the New York Stock Exchange (“NYSE”) the Group, as part of its disclosure and reporting obligations in the United States, is required to furnish this Annual Report by its management on its internal controls over financial reporting, including an attestation report issued by its independent registered public accounting firm pursuant to Section 404 of the Sarbanes-Oxley Act of 2002 (“SOX”) as at October 31, 2021.
Management is responsible for establishing and maintaining adequate internal controls over financial reporting for the Group. Internal control over financial reporting is defined in Rules 13a-15(f) and 15d-15(f) promulgated under the Exchange Act. The Group’s internal controls over financial reporting include policies and procedures which:
| - | are designed to give reasonable assurance that the transactions are recorded as necessary to permit the preparation of financial statements in accordance with IFRS as adopted by the EU and IFRS as issued by the IASB, and that receipts and expenditures are being made only in accordance with authorization of management and the directors; |
| - | relate to the maintenance of records that in reasonable detail accurately and fairly reflect the transactions and disposal of assets; and |
| - | give reasonable assurance regarding the prevention or timely detection of unauthorized use, acquisition or disposal of the Group’s assets that could have a material impact on the financial statements. |
Any internal control network will have inherent limitations, such that the possibility of human error and circumvention or overriding of controls and procedures may not prevent or detect misstatements. In addition, the projection of any controls to future periods are subject to the risk that controls may become inadequate due to changes in conditions or because the degree of compliance with policies and procedures may deteriorate.
Management assessed the effectiveness of internal controls over financial reporting as at October 31, 2021 based on the Internal Control – Integrated Framework issued by the Committee of Sponsoring Organizations of the Treadway Commission 2013. Based on the assessment, management concluded that its internal control over financial reporting was not effective due to the following material weakness: In July, the Company completed the migration to its new enterprise-wide application platform (“Enterprise Platform”) which included new business controls and IT general controls (“ITGC’s). There was not sufficient time to allow ITGC’s and related business controls to operate effectively by October 31, 2021. In aggregate, these control deficiencies impact all financial reporting processes and constitute a material weakness. This material weakness did not result in material misstatement to the financial statements.
Our Consolidated financial statements have been audited by KPMG LLP, an independent registered public accounting firm, which has issued an attestation report expressing an adverse opinion on the effectiveness of internal control over financial reporting, with respect to this material weakness in this Annual Report on Form 20-F.
Report of Independent Registered Public Accounting Firm
To the Shareholders and Board of Directors
Micro Focus board, positions he has held since 19 March 2018. Stephen joinedInternational plc.:
Opinion on Internal Control Over Financial Reporting
We have audited Micro Focus in 2012, first servingInternational plc and subsidiaries’ (the Company) internal control over financial reporting as General Managerof October 31, 2021, based on Internal Control – Integrated Framework (2013) issued by the Committee of Sponsoring Organizations of the ProductTreadway Commission”. In our opinion, because of the effect of the material weakness, described below, on the achievement of the objectives of the control criteria, the Company has not maintained effective internal control over financial reporting as of October 31, 2021, based on criteria established in Internal Control – Integrated Framework (2013) issued by the Committee of Sponsoring Organizations of the Treadway Commission.
We also have audited, in accordance with the standards of the Public Company Accounting Oversight Board (United States) (PCAOB), the consolidated statements of financial position of the Company as of October 31, 2021 and 2020, the related consolidated statements of comprehensive income, changes in equity, and cash flows for each of the years in the three-year period ended October 31, 2021, the summary of significant accounting policies and the related notes (collectively, the Consolidated financial statements), and our report dated February 24, 2022 expressed an unqualified opinion on those Consolidated financial statements.
A material weakness is a deficiency, or a combination of deficiencies, in internal control over financial reporting, such that there is a reasonable possibility that a material misstatement of the Company’s annual or interim financial statements will not be prevented or detected on a timely basis. A material weakness has been identified and included in management’s assessment related to ineffective IT general controls and related business controls following the migration to a new enterprise platform in July 2021. In aggregate, these deficiencies impact all financial reporting processes and constitute a material weakness. The material weakness was considered in determining the nature, timing, and extent of audit tests applied in our audit of the October 31, 2021 Consolidated financial statements, and this report does not affect our report on those Consolidated financial statements.
Basis for Opinion
The Company’s management is responsible for maintaining effective internal control over financial reporting and for its assessment of the effectiveness of internal control over financial reporting, included in the accompanying Management’s Annual Report on Internal Control over Financial Reporting. Our responsibility is to express an opinion on the Company’s internal control over financial reporting based on our audit. We are a public accounting firm registered with the PCAOB and are required to be independent with respect to the Company in accordance with the U.S. federal securities laws and the applicable rules and regulations of the Securities and Exchange Commission and the PCAOB.
We conducted our audit in accordance with the standards of the PCAOB. Those standards require that we plan and perform the audit to obtain reasonable assurance about whether effective internal control over financial reporting was maintained in all material respects. Our audit of internal control over financial reporting included obtaining an understanding of internal control over financial reporting, assessing the risk that a material weakness exists, and testing and evaluating the design and operating effectiveness of internal control based on the assessed risk. Our audit also included performing such other procedures as we considered necessary in the circumstances. We believe that our audit provides a reasonable basis for our opinion.
Definition and Limitations of Internal Control Over Financial Reporting
A company’s internal control over financial reporting is a process designed to provide reasonable assurance regarding the reliability of financial reporting and the preparation of financial statements for external purposes in accordance with generally accepted accounting principles. A company’s internal control over financial reporting includes those policies and procedures that (1) pertain to the maintenance of records that, in reasonable detail, accurately and fairly reflect the transactions and dispositions of the assets of the company; (2) provide reasonable assurance that transactions are recorded as necessary to permit preparation of financial statements in accordance with generally accepted accounting principles, and that receipts and expenditures of the company are being made only in accordance with authorizations of management and directors of the company; and (3) provide reasonable assurance regarding prevention or timely detection of unauthorized acquisition, use, or disposition of the company’s assets that could have a material effect on the financial statements.
Because of its inherent limitations, internal control over financial reporting may not prevent or detect misstatements. Also, projections of any evaluation of effectiveness to future periods are subject to the risk that controls may become inadequate because of changes in conditions, or that the degree of compliance with the policies or procedures may deteriorate.
/s/ KPMG LLP
London, United Kingdom
February 24, 2022
In the period, the Group completed the migration from legacy IT applications and infrastructure to the Enterprise Platform. The Enterprise Platform enables further improvement to process and controls. Improvements for the business include refining functional process and organisational simplification as referred to in Item 3.D, Item 5.A and Item 5.D. The migration was successfully completed in two planned phases, the first completed in January 2021 and the second completed in July 2021. The majority of the work was carried out within the requirements of remote working under COVID-19 restrictions. The timing of the phases meant that there was insufficient time prior to the financial year end to allow ITGC’s and related business controls to operate effectively.
During the period the Group continued to monitor and maintain the framework of SOX compliant internal controls under its central SOX Compliance Program (“SCP”) on the legacy systems as well as preparing and implementing controls for the Enterprise Platform. The SCP worked together with a specialist team from its outsourced internal audit partner, PwC. Governance for the SCP included a cross-functional SOX steering group (“SSG”). In addition, the cross functional disclosure committee continued to meet to assist the Chief Executive Officer and Chief MarketingFinancial Officer responsible for all software productin fulfilling their responsibilities in connection with the accuracy of financial reporting. The Group strengthened internal compliance by the appointment of an additional team from PwC to work alongside the business and services offeringsthe Enterprise Platform implementation project team to carry out end-to-end process mapping and support Risk and Control Matrix (“RACM”) development customer services, corporate marketing and strategy. In 2014, he was appointed as Chief Operating Officer and Executive Director, having responsibility for sales and marketing, product strategy, development and management, services and business operations.
In the year, the Group has held since 21 February 2019. Prioralso reviewed its entity-level controls including continued supplementary SOX training plan across relevant parts of the Group. As part of the overall governance, the SSG continues to joining Micro Focus Brian heldmonitor potential adverse impacts of organisational change to the SCP.
In the 2020 Form 20-F the Group reported certain weaknesses in its internal control over financial reporting, which under Public Company Accounting Oversight Board auditing standards were considered to be a variety of seniormaterial weakness. The material weakness related to the fact that Company did not have adequate controls at that time surrounding existing IT applications, in particular regarding change management positions, includingand access control. These controls and control deficiencies were then superseded in the role of Chief Financial Officer at TeleCity Group plc and most recently as Chief Financial Officer of Paysafe Group plc. Also a restructuring specialist, Brian wasyear by the Interim CFOcontrols on the successful turnaroundEnterprise Platform.
Remediation
The Group continues its work under the SCP to remediate the material weakness and other control deficiencies, and any other matters, which arise during its progress towards SOX compliance. As the business commenced the new financial year operating on the Enterprise Platform it has also been able to implement an enhanced testing program for year ended October 31, 2022.
To maintain the required control environment the Group relies upon automated, semi-automated and manual controls together with a combination of MCI Worldcom EMEA. Hepreventative and detective controls. The material weakness, control deficiencies and other matters may not be able to be remediated by October 31, 2022, and there is a non-executive directorrisk that other deficiencies for the purposes of SOX may be identified. Failure to correct the material weakness, or our failure to discover and address any other material weakness or control deficiencies, could result in inaccuracies in our financial statements, and impair our ability to comply with applicable financial reporting requirements and related regulatory filings on a timely basis. It could also result in an adverse reaction in the senior independent director at Robert Walters plc, where he has been chairfinancial markets due to a loss of confidence in the reliability of the audit committee since 2013. In addition, Brian serves asGroup’s financial statements and could have a material adverse effect on the Responsible Officer for Hockerill Anglo-European College, a leading international secondary school in Hertfordshire.Group’s business, financial condition, results of operation and prospects.
| Item 16.A | Audit committee audit report expert |
The Audit Committee includes Richard Atkins
The Code of Ethics is included as Exhibit 11.1 MF Code of Conduct Guide.
During the years ended October 31, 2021, 2020 and 2019, the Group obtained the following services from the Group’s auditors as detailed below:
Year ended October 31, 2021 | Year ended October 31, 2020 | Year ended October 31, 2019 | ||||||||||
| $m | $m | $m | ||||||||||
| Audit of Company | 8.0 | 7.2 | 12.8 | |||||||||
| ICOFR | 4.7 | 2.7 | 3.0 | |||||||||
| Audit of subsidiaries | 2.8 | 2.9 | 3.9 | |||||||||
| Total audit fees | 15.5 | 12.8 | 19.7 | |||||||||
| Audit-related assurance fees | 0.5 | 0.6 | 0.6 | |||||||||
| Other assurance services | - | - | - | |||||||||
| Total audit related fees | 0.5 | 0.6 | 0.6 | |||||||||
| Tax compliance services | - | - | - | |||||||||
| Tax advisory services | - | - | 0.1 | |||||||||
| Tax fees | - | - | 0.1 | |||||||||
| All other fees | - | - | - | |||||||||
| Total | 16.0 | 13.4 | 20.4 | |||||||||
The fees represent fees paid to KPMG LLP, as the current auditor.
There were no other fees in the years ended October 31, 2021, 2020 and 2019. These payments are governed
Independence and objectivity of the external auditors
The Audit Committee approves all non-audit work commissioned from the external auditors. The committee is responsible for safeguarding the independence and objectivity of the external auditors and has developed a robust policy designed to ensure that this is not compromised. As explained above, the committee manages the risks that the external auditors undertake inappropriate non- audit work, or earn material levels of fees for non-audit services. It also considers the standing and experience of the external audit partner and takes comfort from the fact that KPMG took office relatively recently and from the external auditors’ confirmation that they have complied with relevant UK and US independence standards.
The committee is satisfied that the independence and objectivity of the external auditors has been maintained throughout the year ended October 31, 2021 and to the date of this report.
Not applicable.
The purchase of shares shown in the table below were made on behalf of the Group’s all-employee share plans (a Sharesave plan and an Employee Stock Purchase Plan see Item 6E for further details on these plans) by the current remuneration policyMicro Focus Employee benefit trust (“EBT”). The EBT is included in the consolidated financial statements in Item 18 therefore these purchases are treated as Treasury shares; however, they are owned by the EBT and can only be used to settle employee benefits for eligible employees.
| Period | Total Number of Shares purchased | Average price paid per share | Total Number of Shares purchased as part of publicly announced plans or programs | Maximum number of Shares that may yet be purchased under the plans or programs | ||||||||||||
| November 1, 2020 to November 30, 2020 | - | - | - | - | ||||||||||||
| December 1, 2020 to December 31, 2020 | - | - | - | - | ||||||||||||
| January 1, 2021 to January 31, 2021 | - | - | - | - | ||||||||||||
| February 1, 2021 to February 28, 2021 | - | - | - | - | ||||||||||||
| March 1, 2021 to March 31, 2021 | 4,000,000 | 1 | $ | 6.81 | - | - | ||||||||||
| April 1, 2021 to April 30, 2021 | - | - | - | - | ||||||||||||
| May 1, 2021 to May 31, 2021 | - | - | - | - | ||||||||||||
| June 1, 2021 to June 30, 2021 | - | - | - | - | ||||||||||||
| July 1, 2021 to July 31, 2021 | - | - | - | - | ||||||||||||
| August 1, 2021 to August 31, 2021 | - | - | - | - | ||||||||||||
| September 1, 2021 to September 30, 2021 | - | - | - | - | ||||||||||||
| October 1, 2021 to October 31, 2021 | - | - | - | - | ||||||||||||
| Total | 4,000,000 | $ | 6.81 | - | - | |||||||||||
1 During the year ended October 31, 2021 the Micro Focus Employee Benefit Trust (“EBT”) purchased four million of the Group’s shares in open-market transactions. The EBT will hold these shares to satisfy future exercises of share options.
Not applicable.
Principles
Micro Focus International plc (the “Company”) has a primary listing on the London Stock Exchange. As such, it is required to comply with the UK Corporate Governance Code (the “Code”). For the year ended October 31, 2021 this was the edition of the Code published by the UK’s Financial Reporting Council in July 2018.
The Company’s ADSs are listed on the NYSE. As a Foreign Private Issuer, we are required to comply with some, but not all, of the NYSE’s corporate governance rules, and are required to disclose any significant ways in which the UK corporate governance practices employed by the Company differ from those followed by US companies under the NYSE Listed Company Manual.
The directors are committed to ensuring that the Company operates in compliance with the main principles of the Code, as this provides a robust governance framework in support of the delivery of value to shareholders.
Compliance with the Code
UK listed companies are required to include in their Annual Report a narrative statement of (i) how they have applied the principles of the Code and (ii) whether or not they have complied with each of the provisions of the Code.
Throughout the year ended October 31, 2021 and to the date of this report, the Board considers that the Company has been in compliance with the principles of the Code, and with each of its provisions, save for one element of Provision 38 in relation to the alignment of pension contribution rates. Under Provision 38 the Company is partially compliant with this provision and will be fully compliant in the alignment of pension contribution rates for the executive directors with the wider workforce at the end of 2022. The pension contribution rate for Stephen Murdoch will be aligned at the end of 2022 as set out in the Directors’ Remuneration Policy which was approved by shareholders at the 20172020 Annual General Meeting and can be found at www.investors.microfocus.com.
General. The Annual Report on Remuneration also describes how the new remuneration policy will be implementedrate for the year ending October 31, 2020 (subject to shareholders approving the new remuneration policy) and will be subject to a non-binding advisory vote at the 2020 AGM.
Non-executive directors’ terms of appointment, approach to recruitment remuneration and notice periodsIndependence
| LTIPs and ASGs | |||||||||||||||||||||||||||||||||
Base Salary1 | Benefits in kind 2 | Annual bonus 3 | LTIPs 4 | ASGs 5 | Total | Pension 6 | Total | ||||||||||||||||||||||||||
| Executive Directors | £’000 | £’000 | £’000 | £’000 | £’000 | £’000 | £’000 | £’000 | |||||||||||||||||||||||||
Kevin Loosemore | 2019 (12 months) | 750 | 35 | - | 1,205 | - | 1,205 | 150 | 2,140 | ||||||||||||||||||||||||
2018 (18 months) | 1,125 | 47 | 855 | 1,407 | 25,232 | 26,639 | 225 | 28,891 | |||||||||||||||||||||||||
Stephen Murdoch 7 | 2019 (12 months) | 850 | 20 | - | 565 | - | 565 | 128 | 1,563 | ||||||||||||||||||||||||
2018 (18 months) | 668 | 17 | 569 | 607 | 8 | 5,809 | 6,416 | 100 | 7,770 | ||||||||||||||||||||||||
Brian McArthur-Muscroft 9 | 2019 (12 months) | 600 | 20 | - | - | - | - | 90 | 710 | ||||||||||||||||||||||||
2018 (18 months) | - | - | - | - | - | - | - | - | |||||||||||||||||||||||||
Chris Kennedy 10 | 2019 (12 months) | 233 | 7 | - | - | - | - | 47 | 287 | ||||||||||||||||||||||||
2018 (18 months) | 487 | 12 | - | - | - | - | 97 | 596 | |||||||||||||||||||||||||
Executive director | Interest held | % vesting | Interest vesting | Vesting date | |||||||||
Kevin Loosemore | 69,156 | 100 | % | 69,156 | July 26, 2019 | ||||||||
Stephen Murdoch | 39,640 | 100 | % | 39,640 | July 26, 2019 | ||||||||
| Fees | |||||||||
Non-executive directors | 2019 (12 months) | 2018 (18 months) | |||||||
| £ | ’000 | £ | ’000 | ||||||
| Karen Slatford | 120 | 180 | |||||||
| Richard Atkins | 90 | 135 | |||||||
Amanda Brown 1 | 90 | 135 | |||||||
Silke Scheiber 2 | 70 | 103 | |||||||
Darren Roos 3 | 59 | 103 | |||||||
Lawton Fitt 4 | 80 | 83 | |||||||
| Committee member | Held | Number of meetings attended |
Amanda Brown (Chair) | 7 | 7 |
Karen Slatford 1 | 7 | 7 |
Silke Scheiber2 | 7 | 7 |
Darren Roos 3 | 5 | 4 |
Richard Atkins 4 | - | - |
Lawton Fitt 5 | - | - |
Executive director | Date of grant | Awards made during the period | Share price at grant 1 | Face value at grant | |||||||||
Stephen Murdoch | February 28, 2019 | 10,013 | £ | 18.945 | £ | 189,696 | |||||||
| Executive director | Date of grant | Performance period | Awards made during the period | Share price at grant 1 | Face value at grant | Grant basis | |||||||||
Kevin Loosemore | February 18,2019 | 3 years from November 1, 2018 | 89,285 | £ | 16.80 | £ | 1,499,988 | 200% of salary | |||||||
Stephen Murdoch | February 18, 2019 | 3 years from November 1, 2018 | 101,190 | £ | 16.80 | £ | 1,699,992 | 200% of salary | |||||||
Brian McArthur- Muscroft 2 | November 22, 2018 | 3 years from November 1, 2018 | 80,482 | £ | 14.91 | £ | 1,199,987 | 200% of salary | |||||||
Brian McArthur-Muscroft 3 | November 22, 2018 | 3 years from November 1, 2018 | 80,482 | £ | 14.91 | £ | 1,199,987 | 200% of salary | |||||||
Executive director | Date of grant | Performance period | Awards made during the period | Share price at grant 1 | Face value at grant | Grant basis | |||||||||
Brian McArthur-Muscroft | November 22, 2018 | 3 years from September 1, 2017 | 338,000 | £ | 14.91 | £ | 5,039,580 | ½ of the award granted to his predecessor | |||||||
| Award | Date of grant | Shares granted | Shares lost through time pro-ration 1 | Performance condition outcome | Shares vesting | Exercise/release date | ||||||||||||
| LTIPs | ||||||||||||||||||
Nil cost option | March 23, 2016 | 26,024 | - | Already vested 100% 2 | 26,024 | March 15, 2019 to September 14, 2019 | ||||||||||||
Nil cost option | September 13, 2016 | 33,476 | 1,860 | 100 | %3 | 31,616 | March 15, 2019 to September 14, 2019 | |||||||||||
Conditional award | September 16, 2017 | 33,633 | 13,079 | 100 | %4 | 20,554 | March 15, 2019 | |||||||||||
| Deferred Share Bonus Plan | ||||||||||||||||||
Conditional award | July 25, 2017 | 4,519 | 2,134 | n/a | 2,385 | 5 | March 15, 2019 | |||||||||||
Conditional award | February 28, 2019 | 6,565 | 6,565 | n/a | - | n/a | ||||||||||||
| Award | Date of grant | Date of vesting | Shares granted | Shares lost through time pro- ration 1 | Shares outstanding | Performance condition outcome | Exercise/release date | ||||||||||||
| LTIPs | |||||||||||||||||||
Nil cost option | September 13, 2016 | July 26, 2019 | 37,262 | - | 37,262 | Already vested 100% 2 | July 26, 2019 to July 25, 2026 | ||||||||||||
Nil cost option | September 6, 2017 | July 17, 2020 | 34,464 | 8,616 | 25,848 | To be tested at vesting 3 | July 17, 2020 to January 16, 2021 | ||||||||||||
| Deferred Share Bonus Plan | |||||||||||||||||||
Conditional award | July 25, 2017 | July 25, 2020 | 4,758 | 1,583 | 3,165 | n/a | July 25, 2020 | ||||||||||||
Conditional award | February 28, 2019 | February 28, 2022 | 2,415 | 2,080 | 335 | n/a | February 28, 2022 | ||||||||||||
| HPE Software Additional Share Grant | |||||||||||||||||||
Nil cost option | September 20, 2018 | September 1, 2020 | 676,000 | 245,482 | 430,518 | To be tested at vesting 4 | September 1, 2020 to February 28, 2021 | ||||||||||||
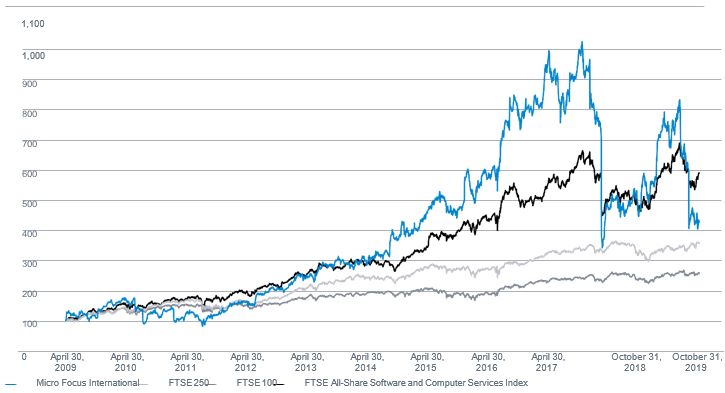
| Year ended April 30, | 18 months ended October 31, | 12 months ended October 31, | ||||||||||||||||||||||||||||||||||||||
| 2010 | 2011 | 2012 | 2013 | 2014 | 2015 | 2016 | 2017 | 2018 | 2019 | |||||||||||||||||||||||||||||||
£ | ’000 | £ | ’000 | £ | ’000 | £ | ’000 | £ | ’000 | £ | ’000 | £ | ’000 | £ | ’000 | £ | ’000 | £ | ’000 | |||||||||||||||||||||
Stephen Murdoch 1 | ||||||||||||||||||||||||||||||||||||||||
| Single total figure of remuneration | 2,739 | 1,333 | ||||||||||||||||||||||||||||||||||||||
| Annual bonus outcome (% of maximum) | 57 | % | Nil | |||||||||||||||||||||||||||||||||||||
| LTIP vesting (% of maximum) | 100 | % | 100 | % | ||||||||||||||||||||||||||||||||||||
Chris Hsu 2 | ||||||||||||||||||||||||||||||||||||||||
| Single total figure of remuneration | 4,963 | |||||||||||||||||||||||||||||||||||||||
| Annual bonus outcome (% of maximum) | 12 | % | ||||||||||||||||||||||||||||||||||||||
| LTIP vesting (% of maximum) | n/a | |||||||||||||||||||||||||||||||||||||||
| Kevin Loosemore | ||||||||||||||||||||||||||||||||||||||||
| Single total figure of remuneration | 23 | 1,291 | 1,304 | 12,468 | 4,315 | 4,231 | 4,226 | |||||||||||||||||||||||||||||||||
| Annual bonus outcome (% of maximum) | Nil | 90 | % | 92 | % | 100 | % | 100 | % | 100 | % | 45 | % | |||||||||||||||||||||||||||
| LTIP vesting (% of maximum) | Nil | Nil | Nil | 199 | % | 100 | % | 100 | % | 100 | % | |||||||||||||||||||||||||||||
| Nigel Clifford | ||||||||||||||||||||||||||||||||||||||||
| Single total figure of remuneration | 628 | |||||||||||||||||||||||||||||||||||||||
| Annual bonus outcome (% of maximum) | Nil | |||||||||||||||||||||||||||||||||||||||
| LTIP vesting (% of maximum) | Nil | |||||||||||||||||||||||||||||||||||||||
| Stephen Kelly | ||||||||||||||||||||||||||||||||||||||||
| Single total figure of remuneration | 3,696 | |||||||||||||||||||||||||||||||||||||||
| Annual bonus outcome (% of maximum) | Nil | |||||||||||||||||||||||||||||||||||||||
| LTIP vesting (% of maximum) | 100 | % | ||||||||||||||||||||||||||||||||||||||
| Chief Executive Officer | Other employees | |||||||||||||||||||
| Base package | 2019 12 month period | 2018 18 month period | 2018 Annualized | Annualized % change | Annualized % change | |||||||||||||||
£ | ’000 | £ | ’000 | £ | ’000 | |||||||||||||||
| Salary | 850 | 1,081 | 721 | 18 | % | 5 | % | |||||||||||||
| Taxable benefits | 20 | 4,493 | 2,995 | (99 | )% | 4 | % | |||||||||||||
| Annual performance bonus | - | 642 | 428 | (100 | )% | (58 | )% | |||||||||||||
| Total | 870 | 6,216 | 4,144 | (79 | )% | No change | ||||||||||||||
| Year | Method | 25th percentile pay ratio | Median pay ratio | 75Th percentile pay ratio | |||||||||
2019 | Option B | 35:1 | 24:1 | 14:1 | |||||||||
Total remuneration | £ | 45,000 | £ | 66,000 | £ | 111,000 | |||||||
Salary | £ | 40,000 | £ | 59,000 | £ | 83,000 | |||||||
| 2019 | 2018 | % change from 2018 | ||||||||||||||||||
12 months ended October 31 | 18 months ended October 31, | 12 months ended October 31, | 18 months | 12 months | ||||||||||||||||
| $ | m | $ | m | $ | m | % | % | |||||||||||||
Distribution to shareholders | ||||||||||||||||||||
| - Dividends paid | 439.2 | 542.2 | 408.3 | (19.0 | )% | 7.6 | % | |||||||||||||
| - Share buy-backs | 538.8 | 171.2 | 171.2 | 214.7 | % | 214.7 | % | |||||||||||||
| - Return of Value | 1,800.0 | 500.0 | - | 260.0 | % | n/a | ||||||||||||||
| Total | 2,778.0 | 1,213.4 | 579.5 | 128.9 | % | 379.4 | % | |||||||||||||
Employee remuneration | 1,340.2 | 2,030.7 | n/a | (34.0 | )% | n/a | ||||||||||||||
| Nil-cost options and conditional awards held | ||||||||||||||||||||||||||||
Director | Shares held (owned outright) | Vested but not exercised | Unvested and not subject to performance | Unvested and subject to performance | Shareholding requirement (% of salary) | Current shareholding (% of salary)1 | Requirement met? | |||||||||||||||||||||
| Kevin Loosemore | 631,983 | 69,156 | - | 1,257,250 | 200 | % | 945 | % | Yes | |||||||||||||||||||
Stephen Murdoch 2 | 276,151 | 39,640 | 15,064 | 1,152,391 | 200 | % | 371 | % | Yes | |||||||||||||||||||
Brian McArthur Muscroft 3 | - | - | - | 498,964 | 200 | % | - | Not yet due | ||||||||||||||||||||
| Karen Slatford | 14,687 | - | - | - | - | - | n/a | |||||||||||||||||||||
| Richard Atkins | 13,862 | - | - | - | - | - | n/a | |||||||||||||||||||||
| Amanda Brown | 3,841 | - | - | - | - | - | n/a | |||||||||||||||||||||
| Silke Scheiber | - | - | - | - | - | - | n/a | |||||||||||||||||||||
| Lawton Fitt | - | - | - | - | - | - | n/a | |||||||||||||||||||||
Number at November 1, 2018 | Number granted in the period | Number exercised in the period | Number lapsed in the period | Number at October 31, 2019 | Date for exercise | ||||||||||||||||
Kevin Loosemore 1 | 192,157 | - | 192,157 | - | - | June 27, 2015 to June 26, 2022 | |||||||||||||||
Kevin Loosemore 1 | 142,132 | - | 142,132 | - | - | June 26, 2016 to June 25, 2023 | |||||||||||||||
Kevin Loosemore 1 | 115,192 | - | 115,192 | - | - | June 27, 2017 to June 26, 2024 | |||||||||||||||
Kevin Loosemore 1 | 111,275 | - | 111,275 | - | - | July 17, 2018 to July 16, 2025 | |||||||||||||||
Kevin Loosemore 1 | 69,156 | - | - | - | 69,156 | July 26, 2019 to July 25, 2026 | |||||||||||||||
Kevin Loosemore 2 | 67,965 | - | - | - | 67,965 | July 17, 2020 to July 16, 2027 | |||||||||||||||
Kevin Loosemore 3 | - | 89,285 | - | - | 89,285 | February 18, 2022 to February 17, 2029 | |||||||||||||||
Stephen Murdoch 1 | 46,237 | - | 46,237 | - | - | December 27, 2015 to December 26, 2022 | |||||||||||||||
Stephen Murdoch 1 | 39,884 | - | 39,884 | - | - | June 26, 2016 to June 25, 2023 | |||||||||||||||
Stephen Murdoch 1 | 56,421 | - | 56,421 | - | - | June 27, 2017 to June 26, 2024 | |||||||||||||||
Stephen Murdoch 1 | 44,510 | - | 44,510 | - | - | July 17, 2018 to July 16, 2025 | |||||||||||||||
Stephen Murdoch 1 | 26,024 | - | 26,024 | - | - | March 23, 2019 to March 22, 2026 | |||||||||||||||
Stephen Murdoch 1 | 39,640 | - | - | - | 39,640 | July 26, 2019 to July 25, 2026 | |||||||||||||||
Stephen Murdoch 2 | 36,664 | - | - | - | 36,664 | July 17, 2020 to July 16, 2027 | |||||||||||||||
Stephen Murdoch 2 | 67,537 | - | - | - | 67,537 | September 20, 2021 to September 19, 2028 | |||||||||||||||
Stephen Murdoch 3 | - | 101,190 | - | - | 101,190 | February 18, 2022 to February 17, 2029 | |||||||||||||||
Brian McArthur-Muscroft 3 | - | 80,482 | - | - | 80,482 | November 22, 2021 to November 21, 2028 | |||||||||||||||
Brian McArthur-Muscroft 4 | - | 80,482 | - | - | 80,482 | November 22, 2022 to November 21, 2028 | |||||||||||||||
| Executive director | Date of exercise | Number of options exercised | Share price at exercise 1 | Gain on exercise | |||||||||
Kevin Loosemore | April 5, 2019 | 560,756 | £ | 19.545 | £ | 10,959,976 | |||||||
Stephen Murdoch | April 1, 2019 | 213,076 | £ | 20.010 | £ | 4,263,651 | |||||||
Number at November 1, 2018 | Number granted in the period | Number exercised in the period | Number lapsed in the period | Number at October 31, 2019 | Date of release | ||||||||||||||||
Stephen Murdoch | 5,051 | - | - | - | 5,051 | July 25, 2020 | |||||||||||||||
Stephen Murdoch | - | 10,013 | - | - | 10,031 | February 28, 2022 | |||||||||||||||
Number at November 1, 2018 | Number granted in the period | Number Exercised in the period | Number lapsed in the period | Number at October 31, 2019 | Date of exercise | ||||||||||||||||
Kevin Loosemore 1 | 947,140 | - | 947,140 | - | - | November 1, 2017 to October 31, 2024 | |||||||||||||||
Kevin Loosemore 2 | 1,100,000 | - | - | - | 1,100,000 | September 1, 2020 to August 31, 2027 | |||||||||||||||
Stephen Murdoch 1 | 405,917 | - | 405,917 | - | - | November 1, 2017 to October 31, 2024 | |||||||||||||||
Stephen Murdoch 2 | 947,000 | - | - | - | 947,000 | September 1, 2020 to August 31, 2027 | |||||||||||||||
Brian McArthur-Muscroft 2 | - | 338,000 | - | - | 338,000 | September 1, 2020 to August 31, 2027 | |||||||||||||||
Executive director | Date of exercise | Number of Options exercised | Share price at exercise 1 | Gain on exercise | |||||||||
Kevin Loosemore | April 1, 2019 | 947,140 | £ | 20.010 | £ | 18,952,271 | |||||||
Stephen Murdoch | April 1,2019 | 405,917 | £ | 20.010 | £ | 8,122,399 | |||||||
| Votes for | Votes against | |||||||||||||||||||||||
| Number | Percentage | Number | Percentage | Votes cast | Votes withheld | |||||||||||||||||||
2018 Director’s Remuneration report | 154,276,600 | 49.67 | % | 156,329,073 | 50.33 | % | 322,087,153 | 11,481,480 | ||||||||||||||||
2017 Director’s Remuneration Policy | 162,259,404 | 86.46 | % | 25,408,333 | 13.54 | % | 188,129,640 | 461,903 | ||||||||||||||||
Each of the non-executive directors who served during the period November 1, 2020 to October 31, 2021, was considered by the boardBoard to be independent. Karen Slatford1 was appointed to the boardBoard in July 2010 and has now served for more than nineten years. The boardBoard has specifically considered whether this was likely to affect, or could appear to affect, her independence and concluded that she continued to demonstrate independence in thought and judgement, noting that there were no other relationships or circumstances that could affect her independence.
The board also decided on October 17, 2019 that, in furtherance of good governance, all theindependent non-executive directors would join each committee of which they were not alreadycomprise a member, save that Karen Slatford would no longer serve on the remuneration committee as she had completed the maximum term permitted under the committee’s terms of reference.
Board. In accordance with the Companies Act 2006, the Company has put in place procedures to deal with conflicts of interest, which have operated effectively. The board is aware of the other commitments of its directors and is satisfied that these do not conflict with their duties as directors of the Company. Any changes to these commitments are reported to the board.
The majority of recommendations fell broadly into three areas:
executive directors. In addition, the senior independent non-executive directorSenior Independent Director meets with the non-executive and executive directors at least once a year to review the performance and continuing commitment of the ExecutiveNon-Executive Chairman and to consider whether to recommend his re-election, providing feedback directly to the Chairman.
1 As announced on February 8, 2022, Karen Slatford has informed the Board of her intention to retire as a director of Micro Focus International Plc, following the conclusion of the 2022 Annual General Meeting and consequently will not be seeking re-election.
Committees of the board of directors
The Company has three principal Board committees that are broadly comparable in purpose and composition to those required by NYSE rules for domestic US companies. For instance, the Company has a Nomination (rather than nominating/corporate governance) Committee and a Remuneration (rather than compensation) Committee. The Company also has an Audit Committee, which NYSE rules require for both US companies and foreign private issuers. All the individuals proposed for re-appointment at the 2020 AGM have been subject to an evaluation procedure in the last 12 months. The board also believes that the skillscommittees are comprised of non-executive directors only and experience of eachnone of the non-executive directors enables themfunctions of these committees has been delegated to continue to provide valuable contributions to the board, and is satisfied that eachanother committee.
Each Board Committee has clearly defined terms of them continues to exercise rigorous and objective judgment.
Board committees
The Nomination committee comprises Karen Slatford (who serves as its Chair), Richard Atkins and Lawton Fitt and, from October 17, 2019, Amanda Brown and Silke Scheiber. Darren Roos also served as a member until September 2, 2019, on which date he ceased to serve as a director. All membersCompany’s Audit Committee does not have direct responsibility for the appointment, reappointment or removal of the committee are independent non-executive directors. Executive directors and senior executives are invited to attendauditors. Instead, it follows the meetingsUK Companies Act 2006 by invitation, as required, but do not do so as of right.
Shareholder approval of equity compensation plans
Under NYSE listing rules, shareholders must be given the opportunity to vote on all equity-compensation plans and structurematerial revisions thereto, except for employment inducement awards, certain grants, plans and amendments in the context of mergers and acquisitions, and certain specific types of plans. The Company complies with corresponding UK requirements in the boardListing Rules, requiring the Company to seek shareholder approval for employee share schemes and takingsignificant changes to existing schemes, save in circumstances permitted by the Listing Rules (Listing Rule 9.4.1). The Board, however, does not explicitly take into consideration the benefitsNYSE’s detailed definition of diversity in all its forms, including gender, ethnicity, religion, disability, age and sexual orientation. The terms of referencewhat are considered ‘material revisions’.
Corporate Governance Guidelines
Section 303A.09 of the committee include, among other matters,NYSE Listed Company Manual requires listed companies to adopt and disclose corporate governance guidelines. As noted above, in line with its obligations under the following responsibilities:UK’s Listing Rules the Company applies the UK Corporate Governance Code and, as required by the Listing Rules, the UK Annual Report contains an explanation of (i) how it has applied the principles of the Code, and (ii) whether it complies in full with the Code’s provisions, or, where it does not, providing an explanation of any non-compliance and the reasons for this (LR 9.8.6).
In addition, the Company is required to make certain mandatory corporate governance statements in accordance with the UK Listing Authority’s Disclosure Guidance and Transparency Rules, DTR 7, which are also included in the Group’s UK Annual Report and Accounts available on the Group’s website https://www.microfocus.com/en-us/investors/investor-download-centre.
The committee’s termsMicro Focus Code of reference are publishedConduct is available on the Company’s website at www.microfocus.com.
Not applicable.
Item 16.I |
Not applicable.
Item 17 |
12 months ended October 31, 2019 | 18 months ended October 31, 2018 | 12 months ended April 30, 2017 | ||||||||||
| Number | Number | Number | ||||||||||
| Average monthly number of people | ||||||||||||
| (including executive directors) employed by the Group: | ||||||||||||
| Continuing Operations | ||||||||||||
| Sales and distribution | 5,413 | 5,860 | 1,818 | |||||||||
| Research and development | 5,056 | 4,323 | 1,400 | |||||||||
| General and administration | 1,991 | 1,378 | 642 | |||||||||
| 12,460 | 11,561 | 3,860 | ||||||||||
| Discontinued Operation | ||||||||||||
| Sales and distribution | 164 | 515 | 323 | |||||||||
| Research and development | 170 | 629 | 476 | |||||||||
| General and administration | 3 | 8 | 4 | |||||||||
| 337 | 1,152 | 803 | ||||||||||
| Total | ||||||||||||
| Sales and distribution | 5,577 | 6,375 | 2,141 | |||||||||
| Research and development | 5,226 | 4,952 | 1,876 | |||||||||
| General and administration | 1,994 | 1,386 | 646 | |||||||||
| 12,797 | 12,713 | 4,663 | ||||||||||
| Nil-cost options and conditional awards held | ||||||||||||||||||||||||
Director | Shares held (owned outright) | % of Group Ordinary shares | Vested but not exercised | Unvested and not subject to performance | Unvested and subject to performance | Other Share Save Options | ||||||||||||||||||
| Kevin Loosemore | 631,983 | 0.2 | 69,156 | - | 1,257,250 | - | ||||||||||||||||||
Stephen Murdoch 2 | 276,151 | 0.1 | 39,640 | 15,064 | 1,152,391 | - | ||||||||||||||||||
Brian McArthur-Muscroft 3 | - | - | - | - | 498,964 | - | ||||||||||||||||||
| Karen Slatford | 14,687 | 0.0 | - | - | - | - | ||||||||||||||||||
| Richard Atkins | 13,862 | 0.0 | - | - | - | - | ||||||||||||||||||
| Amanda Brown | 3,841 | 0.0 | - | - | - | - | ||||||||||||||||||
| Silke Scheiber | - | - | - | - | - | - | ||||||||||||||||||
| Lawton Fitt | - | - | - | - | - | - | ||||||||||||||||||
Ordinary shares of 10 pence each | Percentage of issued share capital % | |||||||
| Dodge & Cox | 58,978,116 | 17.70 | % | |||||
| Causeway Capital Management LLC | 29,945,679 | 8.98 | % | |||||
| BlackRock Inc. | 25,103,914 | 7.50 | % | |||||
Not applicable.
The Consolidated financial statements filed as part of this Annual Report on Form 20-F are included in Item 18.18 on pages F-1 through F-92 hereof.
The Group is involved in various lawsuits, claims, investigations and proceedings including those consisting of IP, commercial, employment, employee benefits and environmental matters, which arise in the ordinary course of business. The Separation and Distribution Agreement, dated as of September 7, 2016, between Seattle SpinCo, Inc. and HPE (the “SDA”) includes provisions that allocate potential financial responsibility for litigation involving the parties, as well as provide for cross-indemnification of the parties against potential liabilities to one party arising out of potential liabilities allocated to the other party. In addition,following exhibits are filed as part of the SDA, HPE and Seattle have agreed to cooperate with each other in managing litigation that relates to both parties’ businesses. The Group records a liability when it believes that it is both probable that a liability has been incurred and the amount of loss can be reasonably estimated. Significant judgment is required to determine both the probability of having incurred a liability and the estimated amount of the liability. Litigation is inherently unpredictable. However, the Group believes it has valid defenses with respect to legal matters pending against it. Nevertheless, cash flows or results of operations could be significantly affected in any particular period by the resolution of one or more of these contingencies. The Group believes it has recorded adequate provisions for any such matters and, as of October 31, 2019, it was not reasonably possible that a material loss had been incurred in connection with such matters in excess of the amounts recognized in its financial statements.this report:
| Description of the rights of each class of securities registered under Section 12 of the Exchange Act | ||
| Credit Agreement amendments, among Micro Focus International plc, Micro Focus Group Limited, MA FinanceCo., LLC, the Lenders party thereto and JPMorgan Chase Bank, N.A., as Administrative Agent and Collateral Agent. | ||
| Credit Agreement amendments, among Micro Focus International plc, Micro Focus Group Limited, Seattle Spinco, Inc., the Lenders party thereto and JPMorgan Chase Bank, N.A., as Administrative Agent and Collateral Agent. | ||
| Code of conduct | ||
| Certification pursuant to Section 302 of the Sarbanes-Oxley Act of 2002 | ||
| Certification pursuant to Section 302 of the Sarbanes-Oxley Act of 2002 | ||
| Certification of Stephen Murdoch under Section 906 of the Sarbanes-Oxley Act of 2002 | ||
| Certification of Matt Ashley under Section 906 of the Sarbanes-Oxley Act of 2002 | ||
| Consent of KPMG LLP. |
| 101.INS | Inline XBRL Instance Document (the instance document does not appear in the Interactive Date File because its XBRL tags are embedded with the Inline XBRL document) |
| 101.SCH | Inline XBRL Taxonomy Extension Schema Document |
| 101.CAL | Inline XBRL Taxonomy Extension Calculation Linkbase Document |
| 101.DEF | Inline XBRL Taxonomy Extension Definition Linkbase Document |
| 101.LAB | Inline XBRL Taxonomy Extension Label Linkbase Document |
| 101.PRE | Inline XBRL Taxonomy Extension Presentation Linkbase Document |
| 104 | Cover Page Interactive Data File (formatted as Inline XBRL and contained in Exhibit 101) |
Micro Focus International plc is listed on the London Stock Exchange. The Company’s American Depositary Shares (the “ADSs”) are listed on the New York Stock Exchange.
/s/ Stephen Murdoch
Ownership of ADSs in General
For US federal income tax purposes, a US holder of Micro Focus ADSs generally will be treated as the owner of the Micro Focus ordinary shares represented by the ADSs.
The US Treasury Department has expressed concern that depositaries for American Depositary Shares, or other intermediaries between the holders of shares of an issuer and the issuer, may be taking actions that are inconsistent with the claiming of US foreign tax credits by US holders of those receipts or shares. Accordingly, the analysis regarding the availability of a US foreign tax credit for UK taxes and sourcing rules described below could be affected by future actions that may be taken by the US Treasury Department.
Dividends Paid on Ordinary Shares or ADSs
The gross amount of any cash distribution (including the amount of any tax withheld, as discussed below) paid to a US holder by Micro Focus out of its current or accumulated earnings and profits (as determined for US federal income tax purposes) is subject to US federal income taxation as a dividend. For certain non-corporate US holders, including individuals, dividends that constitute “qualified dividend income” will be taxable to such US holder at the preferential rates applicable to long-term capital gains, provided that the US holder holds the ordinary shares or ADSs on which the dividends are paid for more than 60 days during the 121-day period beginning 60 days before the ex-dividend date and meets other holding period requirements. Dividends Micro Focus pays with respect to its ordinary shares or ADSs generally will be qualified dividend income if Micro Focus is eligible for benefits of the United States income tax treaty with the United Kingdom. Although Micro Focus believes that it is currently eligible for such treaty benefits, there can be no assurance that this will be the case for any taxable year or that such position would not be challenged by the IRS or sustained by a court. Dividends received by a corporate US holder generally will not be eligible for the dividends-received deduction that is allowed to US corporations in respect of dividends received from other US corporations. However, a corporate US holder that owns 10 per cent or more of Micro Focus’s stock may, in certain circumstances, be entitled to a deduction in respect of a dividend received from Micro Focus pursuant to Section 245A of the US Tax Code.
A dividend is taxable to a US holder when the US holder receives the dividend, actually or constructively. The amount of the dividend that a US holder must include in its income will be the US dollar value of the payments made (including any withholding tax imposed thereon), determined at the spot Sterling/US dollar rate on the date the dividend is includible in the US holder’s income, regardless of whether the payment is in fact converted into US dollars at such time. Generally, any gain or loss resulting from currency exchange fluctuations during the period from the date a US holder includes the dividend payment in income to the date a US holder converts the payment into US dollars will be treated as ordinary income or loss and will not be eligible for the special tax rate applicable to qualified dividend income. Such foreign exchange gain or loss generally will be income or loss from sources within the United States for foreign tax credit limitation purposes.
The portion of any cash distribution received by a US holder that is in excess of Micro Focus’s current and accumulated earnings and profits, as determined for US federal income tax purposes, will be treated as a non-taxable return of capital to the extent of the US holder’s basis in the ordinary shares or ADSs on which such payment is received, and thereafter as capital gain. However, Micro Focus does not expect to calculate its earnings and profits in accordance with US federal income tax principles. Accordingly, a US holder should expect to generally treat cash distributions paid by Micro Focus as taxable dividends for US federal income tax purposes.
A US holder must include any foreign tax withheld from a cash distribution on its ordinary shares or ADSs in the gross amount included in income, even though the US holder does not in fact receive such withheld amount. Subject to certain limitations, UK tax withheld, if any, in accordance with the United Kingdom-United States Income Tax Convention (1975), as amended (the “Treaty”), and paid over to the United Kingdom will be deductible or creditable against a US holder’s US federal income tax liability. Special rules apply in determining the foreign tax credit limitation with respect to dividends that are subject to the preferential tax rates. To the extent a refund of the tax withheld is available to a US holder under UK law or under the Treaty, the amount of tax withheld that is refundable will not be eligible for credit against a US holder’s US federal income tax liability.
Dividends paid by Micro Focus on its ordinary shares or ADSs generally will be income from sources outside the United States and will, depending on a US holder’s circumstances, be either “passive” or “general” income for purposes of computing the foreign tax credit allowable to the US holder. The rules governing the foreign tax credit are complex and involve the application of rules that depend upon a US holder’s particular circumstances. Accordingly, US holders are urged to consult their own tax advisors regarding the availability of the foreign tax credit under their particular circumstances.
Sale or Disposition of Ordinary Shares or ADSs
If a US holder sells or otherwise disposes of its ordinary shares or ADSs in a taxable sale or other disposition, such US holder will generally recognize capital gain or loss for US federal income tax purposes equal to the difference between the US dollar value of the amount that the US holder realizes in such disposition and the US holder’s tax basis, determined in US dollars, in the US holder’s Micro Focus ordinary shares or ADSs. Capital gain of certain non-corporate US holders, including individuals, is generally taxed at preferential rates where the property disposed of is held for more than one year. Gain or loss recognized by a US holder on the sale or other disposition of ordinary shares or ADSs will generally be income or loss from sources within the United States for foreign tax credit limitation purposes. The deductibility of a capital loss may be subject to limitations under the US Tax Code.
Information with Respect to Foreign Financial Assets
US holders that are owners of “specified foreign financial assets” with an aggregate value in excess of $50,000 (and in some circumstances, a higher threshold) may be required to file an information report with respect to such assets with their tax returns and may be subject to penalties if they fail to file such information report. “Specified foreign financial assets” include financial accounts maintained by foreign financial institutions, as well as the following, but only if they are held for investment and not held in accounts maintained by financial institutions: (i) stocks and securities issued by non-U.S. persons, (ii) financial instruments and contracts that have non-U.S. issuers or counterparties, and (iii) interests in foreign entities. US holders are urged to consult their own tax advisors regarding the application of this reporting requirement to their ownership of ordinary shares or ADSs.
Backup Withholding and Information Reporting
In general, dividend payments with respect to ordinary shares and ADSs and proceeds from the sale or other disposition of ordinary shares or ADSs made (or deemed made) within the United States may be subject to information reporting to the IRS and US backup withholding currently at a rate of 24 per cent. Backup withholding will generally not apply to a US holder who:
• Furnishes a correct taxpayer identification number and certifies, under penalties of perjury, that such US holder is not subject to backup withholding on an IRS Form W-9, and otherwise complies with applicable requirements of the backup withholding rules; or
• Is a corporation or otherwise exempt from backup withholding and, when required, demonstrates this fact in accordance with applicable Treasury regulations.
Backup withholding is not an additional tax. Amounts withheld under the backup withholding rules may be allowed as a credit against a holder’s US federal income tax liability and may entitle the holder to a refund, provided the holder timely furnishes the required information to the IRS.
US holders should consult their own independent professional tax adviser regarding the application of the information reporting and backup withholding rules.
Credits or deductions for UK taxes
As indicated under ‘Material UK Tax Consequences’ below, distributions in respect of, and gains on the disposition of, ordinary shares or ADSs, may be subject to UK taxation in certain circumstances. A US holder may be eligible to claim a credit or deduction in respect of UK taxes attributable to such income or gain for purposes of computing the US holder’s US federal income tax liability, subject to certain limitations. The US foreign tax credit rules are complex, and US holders should consult their own tax advisors regarding the availability of US foreign tax credits and the application of the US foreign tax credit rules to their particular situation.
The summary set forth above is included for general information only. US holders are urged to consult their own tax advisors to determine the particular tax consequences to them of the ownership and disposition of ordinary shares and ADSs, including the applicability and effect of U.S. state, local and non-U.S. tax laws.
Material UK Tax Consequences of Owning and Disposing of Micro Focus Ordinary Shares or ADSs
The following paragraphs set out below summarize material aspects of the UK tax treatment of US holders of ordinary shares or ADSs and do not purport to be either a complete analysis of all tax considerations relating to holding ordinary shares or ADSs or an analysis of the tax position of Micro Focus. They are based on current UK legislation and what is understood to be current HM Revenue & Customs practice, both of which are subject to change, possibly with retrospective effect.
The comments are intended as a general guide and (otherwise than where expressly stated to the contrary) apply only to US holders of ordinary shares or ADSs (other than under a personal equity plan or individual savings account) and who are the absolute beneficial owners of such shares.
These comments do not deal with certain types of shareholders such as charities, dealers in securities, persons holding or acquiring shares in the course of a trade, persons who have or could be treated for tax purposes as having acquired their ordinary shares or ADSs by reason of their employment, collective investment schemes, persons subject to UK tax on the remittance basis and insurance companies. You are encouraged to consult an appropriate independent professional tax advisor with respect to your tax position.
Tax on chargeable gains as a result of disposals of ordinary shares or ADSs
Subject to the below, US holders will not generally be subject to UK tax on chargeable gains on a disposal of ordinary shares or ADSs provided that they do not carry on a trade, profession or vocation in the United Kingdom through a branch, agency or permanent establishment in connection with which the ordinary shares or ADSs are held.
A US holder who is an individual, who has ceased to be resident for tax purposes in the United Kingdom for a period of less than five years and who disposes of ordinary shares or ADSs during that period may be liable for UK tax on capital gains (in the absence of any available exemptions or reliefs). If applicable, the tax charge will arise in the tax year that the individual returns to the United Kingdom.
Tax on dividends
Micro Focus is not required to withhold UK tax at source from dividends paid on ordinary shares or ADSs.
US holders will not generally be subject to UK tax on dividends received from Micro Focus provided that they do not carry on a trade, profession or vocation in the United Kingdom through a branch, agency or permanent establishment in connection with which the ordinary shares or ADSs are held.
Stamp duty and stamp duty reserve tax, referred to as SDRT
Based on current published HM Revenue & Customs practice and recent case law, transfers of ADSs should not be subject to SDRT or stamp duty provided that any instrument of transfer is executed and remains outside the UK and the transfer of an underlying ordinary share to the ADS holder in exchange for the cancellation of an ADS should also not give rise to a stamp duty or SDRT charge.
Transfers of ordinary shares outside of the depositary bank, including the repurchase of ordinary shares by Micro Focus, will generally be subject to stamp duty or SDRT at the rate of 0.5% of the amount or value of the consideration given, except as described above in connection with the cancellation of an ADS. If ordinary shares are redeposited into a clearance service or depositary system, the redeposit will attract stamp duty or SDRT at the higher rate of 1.5%.
The purchaser or the transferee of the ordinary shares or ADSs will generally be responsible for paying any stamp duty or SDRT payable. Where stamp duty or SDRT is payable, it is payable regardless of the residence position of the purchaser.
Inheritance tax
A gift or settlement of ordinary shares or ADSs by, or on the death of, an individual shareholder may give rise to a liability to UK inheritance tax even if the shareholder is not a resident of or domiciled in the United Kingdom.
A charge to inheritance tax may arise in certain circumstances where ordinary shares or ADSs are held by close companies and trustees of settlements.
However, pursuant to the Estate and Gift Tax Treaty 1980, referred to as the Treaty, entered into between the United Kingdom and the United States, a gift or settlement of ordinary shares or ADSs by shareholders who are domiciled in the United States for the purposes of the Treaty may be exempt from any liability to UK inheritance tax.
Not applicable.
Not applicable.
Copies of our Memorandum and Articles of Association are filedcan be found as exhibits to thisof the Group’s Annual Report on Form 20-F for the year ended October 31, 2019 which is available at https://microfocus.com/media/investor-reports/form-20-f-for-12-months-ending-the-31-october-2019-report.pdfand has been filed with the SEC. The Memorandum and Articles of Association along with certain other documents referred to in this Annual Report on Form 20-F are available for inspection at our registered office at The Lawn, 22-30 Old Bath Road, Newbury, Berkshire, RG14 1QN, United Kingdom (c/o the Company Secretary) during usual business hours upon reasonable prior request.
Not applicable.
Financial risk factors
The Group’s multi-national operations expose it to a variety of financial risks that include the effects of changes in credit risk, foreign currency risk, interest rate risk and liquidityliquidity/capital risk. RiskTreasury risk management is carried out by a central treasury department under policies approved by the board of directors.
Group treasury identifies and evaluates financial risks alongside the Group’s operating units.business management. The board provides written principles for risk management together with specific policies covering areas such as foreign currency risk, interest rate risk, credit risk and liquidity risk, the use of derivative financial instruments and non-derivative financial instruments as appropriate, and investment of excess funds.
Financial Instruments sensitive to market risk
The tablecarrying values and fair values for the borrowings and derivative financial instruments are included within the overall financial instruments table. Further information on borrowings showing the maturity profile of the anticipated cash flows in relation to the Group’s borrowing including principal repayments and interest payments can be found in section 5.B.1 along with the contracted interest rates and drawn/undrawn facilities.
Derivative and non-derivative financial instruments used for hedging purposes are further discussed below.
Financial Instruments
The tables below sets out the measurement categories and carrying values of financial assets and liabilities.liabilities with fair value inputs where relevant.
Financial October 31, 2019 | Non- financial October 31, 2019 | Total October 31, 2019 | Financial October 31, 2018 | Non- financial October 31, 2018 | Total October 31, 2018 | |||||||||||||||||||
| $m | $m | $m | $m | $m | $m | |||||||||||||||||||
| Financial and non-financial assets | ||||||||||||||||||||||||
| Non-current | ||||||||||||||||||||||||
| Long-term pension assets | 17.1 | - | 17.1 | 16.7 | - | 16.7 | ||||||||||||||||||
| Derivative financial instruments – Interest rate swaps | - | - | - | - | 86.4 | 86.4 | ||||||||||||||||||
| Current | ||||||||||||||||||||||||
| Cash and cash equivalents | 355.7 | - | 355.7 | 620.9 | - | 620.9 | ||||||||||||||||||
| Trade and other receivables | 922.7 | 110.2 | 1,032.9 | 1,212.0 | 60.0 | 1,272.0 | ||||||||||||||||||
| 1,295.5 | 110.2 | 1,405.7 | 1,849.6 | 146.4 | 1,996.0 | |||||||||||||||||||
Measurement category | Carrying value October 31, 2021 | Fair value 2021 | Fair value Hierarchy 2021/2020 | Carrying value October 31, 2020 | |||||||||||||
| $m | $m | ||||||||||||||||
| Financial assets: | |||||||||||||||||
| Non-current | |||||||||||||||||
Long-term pension asset | FV OCI | 17.1 | Fair value insurance based input | Level 3 | 18.2 | ||||||||||||
| Current | |||||||||||||||||
| Cash and cash equivalent | Amortised cost | 558.4 | - | - | 737.2 | ||||||||||||
| Trade and other receivables | Amortised cost | 784.2 | - | - | 648.6 | ||||||||||||
| Contract assets | Amortised cost | 62.0 | - | - | 33.7 | ||||||||||||
| 1,421.7 | 1,437.7 | ||||||||||||||||
| Financial liabilities: | |||||||||||||||||
| Non-current | |||||||||||||||||
Derivative financial instruments – interest rate swaps1 | FV OCI | - | Fair value Bank Institutions | Level 2 | 77.9 | ||||||||||||
Borrowings (gross)2 | Amortised cost | 4,566.0 | 4,556.5 | - | 4,699.0 | ||||||||||||
| Lease obligations | Amortised cost | 119.6 | - | - | 168.2 | ||||||||||||
| Current | |||||||||||||||||
Derivative financial instruments – interest rate swaps1 | FV OCI | 35.7 | Fair value Bank Institutions | Level 2 | - | ||||||||||||
Borrowings (gross)2 | Amortised cost | 42.0 | 41.9 | - | 34.2 | ||||||||||||
| Lease obligations | Amortised cost | 74.9 | - | - | 82.2 | ||||||||||||
| Trade and other payables – accruals | Amortised cost | 440.1 | - | - | 419.2 | ||||||||||||
| 5,278.3 | 5,480.7 | ||||||||||||||||
| 1 | Derivative interest rate swaps are measured at fair value in other comprehensive income (“FVOCI”) as a result of hedge accounting. All interest rate swaps are in designated hedge relationships and there are no other derivative financial instruments held as fair value through profit and loss (“FVTPL”). |
| 2 | Borrowings have a carrying value (net of unamortised prepaid facility arrangement fees and original issue discount) of $4,548.4 million (2020: $4,640.3 million). Total borrowings (gross) are shown in this table as $4,608.0 million (2020: $4,733.2 million) for the fair value comparison. |
Financial October 31, 2019 | Non- financial October 31, 2019 | Total October 31, 2019 | Financial October 31, 2018 | Non- financial October 31, 2018 | Total October 31, 2018 | |||||||||||||||||||
| $m | $m | $m | $m | $m | $m | |||||||||||||||||||
| Financial and non-financial liabilities – financial liabilities at amortised cost | ||||||||||||||||||||||||
| Non-current | ||||||||||||||||||||||||
| Derivative financial instruments – interest rate swaps | 36.5 | - | 36.5 | - | - | - | ||||||||||||||||||
| Borrowings (gross) | 4,775.0 | - | 4,775.0 | 4,946.6 | - | 4,946.6 | ||||||||||||||||||
| Finance leases | 11.7 | - | 11.7 | 14.9 | - | 14.9 | ||||||||||||||||||
| Provisions | 49.1 | - | 49.1 | 35.4 | - | 35.4 | ||||||||||||||||||
| Current | ||||||||||||||||||||||||
| Borrowings (gross) | - | - | - | 50.3 | - | 50.3 | ||||||||||||||||||
| Finance leases | 11.8 | - | 11.8 | 13.6 | - | 13.6 | ||||||||||||||||||
| Trade and other payables | 530.3 | 80.7 | 611.0 | 676.9 | - | 676.9 | ||||||||||||||||||
| Provisions | 29.3 | - | 29.3 | 57.4 | - | 57.4 | ||||||||||||||||||
| 5,443.7 | 80.7 | 5,524.4 | 5,795.1 | - | 5,795.1 | |||||||||||||||||||
For trade and other receivables, cash and cash equivalents, provisions, trade and other payables, obligations under finance leases and provisions, fair values approximate to book values due to the short maturity periods of these financial instruments. For trade and other receivables, allowances are made for credit risk.
Derivative financial instruments measured at fair value are classified as levelLevel 2 in the fair value measurement hierarchy as they have been determined using significant inputs based on observable market data. The fair values of interest rate derivatives are derived from forward interest rates based on yield curves observable at the balance sheet date together with the contractual interest rates. Valuations are updated by the counter-party banks on a monthly basis.
Interest rate risk
The Group’s income and cash generated from operations are substantially independent of assets or liabilities between levelschanges in market interest rates. The Group’s interest rate risk arises from short-term and long-term borrowings. Borrowings issued at variable rates expose the Group to cash flow interest rate risk. The Group currently uses four interest rate swaps to manage its cash flow interest rate risk arising from potential increases in the LIBOR interest rate.
The objective of the fairGroup’s interest rate risk management policy is to manage the uncertainty and adverse impact on the Group’s net interest charge due to changes in interest rates to an acceptable level. In doing so, the Group seeks to minimize the cost of hedging and the level of associated counterparty risk.
The Group has set a target of approximately half its borrowings being subject to fixed interest rates in order to minimize its exposure to changes in interest rates. This is achieved through four USD interest swaps for a total notional value hierarchy duringof $2.25 billion, with a maturity date of September 2022. The hedge accounting is discussed further later in the period.note.
On January 19, 2022, the Group executed a new 1m USD SOFR swap with a notional value of $750 million and a maturity date of February 28, 2027. The forward swap is effective on September 21, 2022 with a fixed interest rate of 1.656% swapped against the variable 1m SOFR USD rates.
The Group’s borrowing facilities do not contain any covenants with respect to interest cover ratios.
| October 31, 2021 | October 31, 2020 | |||||||
| Interest rate risk | $m | $m | ||||||
| Interest rate swaps (receive variable, pay fixed) | ||||||||
| Fair value of Derivative liability (total of 4 swaps) | (35.7 | ) | (77.9 | ) | ||||
| Notional amount (4 x $562.5 million) | 2,250.0 | 2,250.0 | ||||||
| Maturity date | September 30, 2022 | September 30, 2022 | ||||||
| Change in fair value of outstanding hedging instruments (OCI hedging reserve excluding deferred tax) | 42.2 | (41.3 | ) | |||||
| Change in value of hedging instruments (as above adjusted for impact of credit risk) | 41.9 | (39.9 | ) | |||||
| Hedging ratio | 1.1 | 1.1 | ||||||
The Group has four interest rate swaps, which are designated in a hedge relationship and also utilized forward exchange contractsrelationship.
The Group’s approved strategy in accordance with our risk management policies is to fix Sterling equivalentminimize the risk of cash flow fluctuations due to interest rate changes in relation to the 1M-USD LIBOR rate for up to half of the Group’s external borrowings for the period October 19, 2017 to September 30, 2022.
The specific risk management objective is to hedge the interest rate risk (cash flow risk) due to changes in the 1M-USD LIBOR rate charged on $2,250.0 million of the April 2019 Return of Value to shareholders and the April 2019debt issued by Seattle Spin Co Inc. between October 19, 2017 and September 2019 dividend payments. The forward contracts were not designated for formal hedge accounting and matured for delivery within the reporting period.30, 2022.
| October 31, 2019 | October 31, 2018 | |||||||
| $m | $m | |||||||
| Derivative financial instruments- non-current asset – interest rate swaps | - | 86.4 | ||||||
| Derivative financial instruments- non-current liabilities – interest rate swaps | (36.5 | ) | - | |||||
| (36.5 | ) | 86.4 | ||||||
Derivatives are only used for economic hedging purposes and not as speculative investments. Four interest rate swaps are in place with a total notional value of $2.25bn to hedge against the impact of potential rises in interest rates until September 30, 2022. The swaps are designated against the $2,486.3m loan issued by Seattle SpinCo. Inc. and the notional value covers 52.7% of the overall dollar loan principal outstanding for the Group. Details of the Group’s borrowings including maturities and interest rates are included in Item 10.C.
The swap contracts require settlement of net interest receivable or payable on a monthly basis. The fixed interest rate for each swap is 1.949 %1.949% and the Group receives a variable rate in line with LIBOR. The Seattle loan is priced at LIBOR (with a 0% floor) plus a current margin of 2.50%2.75% with the swaps aimed at addressing the risk of a rising LIBOR element. As such, the total interest cost of the hedged element of the Seattle loan is 4.44%4.699%. For the periodyear to October 31, 2019,2021, net interest received(finance cost) paid for the swaps amounted to $9.9m.$41.3 million. For the life of the swap, net interest receivedpaid to date amounted to $6.5m.$58.5 million.
| October 31, 2021 | October 31, 2020 | |||||||
| Foreign exchange risk | $m | $m | ||||||
| Notional amounts for Designated Euro borrowing | ||||||||
| Euro B-1 2020 tranche €600 million (Borrowings maturity date: June 2025) | 676.0 | 700.3 | ||||||
Foreign exchange (loss) on revaluation transferred to OCI-CTA - no sources of ineffectiveness observed in review | 6.5 | (34.5 | ) | |||||
| Euro 2017 tranche €453 million (Borrowings maturity date: June 2024) | 510.9 | 528.5 | ||||||
Foreign exchange (loss) on revaluation transferred to OCI-CTA - no sources of ineffectiveness observed in review | 4.8 | (24.2 | ) | |||||
| Hedge ratio for each of the two Net investment hedges | 1:1 | 1:1 | ||||||
The Group has designated two tranches of non-derivative Euro borrowings in two hedge relationships The borrowings in place have a designated initial carrying value of approx. €1.03 billion (note 18 “Borrowings” of the hedge relationship, and through periodic effectiveness assessments (adjusted for credit risk) to ensure that an economic relationship exists between theConsolidated financial statements in Item 18.) hedged item and the hedging instrument. The testing determined that the hedge was highly effective throughout the financial reporting period for which the hedge was designated.against Euro designated net investments in foreign operations.
The impact of changesspecific risk management objective is to carry out a net investment hedge in the fair value of interest rate swaps in the year ended October 31, 2019 is shown in the Consolidated statement of comprehensive income. Note 31 of the “notes to the consolidated financial statements” in Item 18 shows the derivative financial instruments relating to hedging transactions entered into in the period ended 31 October 2019 (other reserves).
| October 31, 2019 | October 31, 2018 | |||||||
| $m | $m | |||||||
| Carrying amount | (36.5 | ) | 86.4 | |||||
| Notional amount (4 x $562.5m) | 2,250.0 | 2,250.0 | ||||||
| Maturity date | September 30, 2022 | September 30, 2022 | ||||||
| Change in fair value of outstanding hedging instruments (note 31) | (122.9 | ) | 86.4 | |||||
| Change in value of hedging instruments adjusted for credit risk | (121.9 | ) | 84.7 | |||||
| October 31, 2019 | October 31, 2018 | |||||||
| $m | $m | |||||||
| Trade receivables (gross) | 877.9 | 1,089.6 | ||||||
| Cash and cash equivalents | 355.7 | 620.9 | ||||||
| Total | 1,233.6 | 1,710.5 | ||||||
October 31, 2019 | October 31, 2018 | |||||||
| $’m | $’m | |||||||
| At November, 1 / May, 1 – calculated under IAS 39 | 41.9 | 2.6 | ||||||
| Accounting policy change – IFRS 9 (recognised against retained earnings on November 1, 2018) | 20.0 | - | ||||||
| 61.9 | 2.6 | |||||||
| Loss allowance provided in the period | 16.0 | 40.0 | ||||||
| Receivables written off as uncollectable | (35.5 | ) | (0.7 | ) | ||||
| At October ,31 | 42.4 | 41.9 | ||||||
Foreign exchange risk
The Group operates internationally and is exposed to foreign exchange risk arising from various currency exposures, primarily with respect to the Euro, UK Pound Sterling, Indian Rupee, Israeli Shekel, Japanese Yen, Canadian Dollar, Australian Dollar and the Canadian Dollar.Chinese Yuan. Foreign exchange risk arises from future commercial transactions, recognisedrecognized assets and liabilities and net investments in foreign operations. Foreign exchange risk arises when future commercialoperations where the transactions recognised assets and liabilities are denominated in a currency that is not the entity’s functional currency.
Group borrowings are denominated in US Dollars and Euros. The Group seeks to match the currency profile of borrowings to the cash flows arising from the Groups operations used to service those borrowings. The May 2020 debt refinancing included an additional proportion of Euro debt and a reduction in US Dollar debt which is intended to better match the currency profile of the Group’s debt with the cash flows used to service that debt (note 18 “Borrowings” of the Consolidated financial statements in Item 18.).
The Group has certain investments in foreign operations, whose net assets are exposed to foreign currency translation risk. The Group faces currency exposures arising from the translation of profits earned in foreign currency subsidiaries into the Group’s reporting currency of US Dollars. As at October 31, 2021 two net investment hedges totaling €1.03 billion have been designated using non-derivative Euro debt instruments to minimize the volatility in shareholder’s equity arising from foreign currency translation (October 31, 2020 two net investment hedges totaling €1.05 billion).
Exposures also arise from foreign currency denominated trading transactions undertaken by subsidiaries and exposures here are not hedged.
The Group’s currency exposures comprise those that give rise to net currency gains and losses to be recognisedrecognized in the Consolidated statement of comprehensive income as well as gains and losses on consolidation, which go to reserves. Such exposures reflect the monetary assets and liabilities of the Group that are not denominated in the operating or functional currency of the operating unit involved and the Group’s investment in net assets in currencies other than US dollar.
The Group’s principal exposures in relation to market risks are the changes in the exchange rates between the US Dollardollar and transactions made in other currencies as well as changes in interest rates from US Dollar LIBOR interest rates.and Euro capital markets. Foreign exchange exposures for all re-measuring balances are tracked and reported to management.management
The key drivers for foreign exchange exposure are cash, borrowings and inter-company positions with trade receivables and trade payables having less relative aggregate exposure. As at October 31, 2019, the key aggregate exposures involved the Euro, British Sterling, Japanese Yen, Israeli Shekel and Canadian Dollar. The table below illustrates the equity sensitivity analysis ofrepresents a key currency extract from the Group exposures to movements in currency and interest rates.
Group exposure | +/- 5 | % | +/- 10 | % | +/- 1% interest | |||||||||||
| Key aggregate currency exposures | $m | $m | $m | $m | ||||||||||||
| Euro | 512.6 | 25.6 | 51.2 | |||||||||||||
| GBP | 137.2 | 6.8 | 13.7 | |||||||||||||
| JPY | 69.6 | 3.5 | 6.9 | |||||||||||||
| ILS | 36.7 | 1.8 | 3.7 | |||||||||||||
| CAN$ | 26.1 | 1.3 | 2.6 | |||||||||||||
Borrowings -Interest rate LIBOR +1% (based on gross debt excluding the effects of hedging) | n/a | n/a | n/a | 47.75 | ||||||||||||
presenting exposures in excess of $10 million equivalent. The Group’s objective when managing its capital structures is to minimize the cost of capital while maintaining adequate capital to protect against volatility in earnings and net asset values. The strategy is designed to maximize shareholder return over the long-term.
Foreign exchange analysis is subjectshown as for reporting to anthe Treasury Risk committee. Please note that aggregate net leverage covenant only in circumstances where more than 35%Foreign exchange exposures for the Euro below do not consider the impact of the Revolving Facility is outstanding at a fiscal quarter end. The facility was not utilized as at October 31, 2019 and therefore no covenant test is applicable.net investment hedges. However, the impact can be seen in the hedging table above.
October 31, 2019 | October 31, 2018 | |||||||
| $m | $m | |||||||
| Bank and other borrowings (net of arrangement fees) | 4,670.7 | 4,845.9 | ||||||
| Finance lease obligations | 23.5 | 28.5 | ||||||
| Less cash and cash equivalents | (355.7 | ) | (620.9 | ) | ||||
| Total net debt | 4,338.5 | 4,253.5 | ||||||
| Total equity | 6,276.3 | 7,792.0 | ||||||
| Debt/equity % | 69.1 | % | 54.6 | % | ||||
Group exposure | +/- 5 | % | +/- 10 | % | ||||||||
| Key aggregate currency exposures* | $m | $m | $m | |||||||||
| Euro (EUR) | 1,504.6 | 75.2 | 150.4 | |||||||||
| GB Pounds (GBP) | 156.7 | 7.8 | 15.6 | |||||||||
| Indian Rupee (INR) | 64.4 | 3.2 | 6.4 | |||||||||
| Japanese Yen (JPY) | 53.0 | 2.7 | 5.3 | |||||||||
| Australian Dollar (AUD) | 32.5 | 1.6 | 3.3 | |||||||||
| Canadian Dollar (CAD) | 31.9 | 1.6 | 3.2 | |||||||||
| Israeli Shekel (ILS) | 29.5 | 1.5 | 3.0 | |||||||||
| Chinese Yuan (CNY) | 27.3 | 1.4 | 2.7 | |||||||||
| Swedish Krona (SEK) | 24.3 | 1.2 | 2.4 | |||||||||
| United Arab Emirates Dirham (AED) | 24.2 | 1.2 | 2.4 | |||||||||
| Czech Koruna (CZK) | 12.0 | 0.6 | 1.2 | |||||||||
| Mexican Peso (MXN) | 10.4 | 0.5 | 1.0 | |||||||||
| Turkish Lira (TRY) | 10.2 | 0.5 | 1.0 | |||||||||
| Danish Krone (DKK) | 10.1 | 0.5 | 1.0 | |||||||||
* Presenting aggregate foreign exchange exposures in liabilities arising from financing activities for interest bearing loans and finance leases were as follows:excess of $10 million equivalent.
Interest bearing loans | Finance Leases | Total | ||||||||||
| $m | $m | $m | ||||||||||
At November 1, 2018 | 4,996.9 | 28.5 | 5,025.4 | |||||||||
Draw down/New leases | - | 9.0 | 9.0 | |||||||||
Repayments | (212.6 | ) | (14.9 | ) | (227.5 | ) | ||||||
Foreign exchange | (9.3 | ) | 0.6 | (8.7 | ) | |||||||
At October 31, 2019 | 4,775.0 | 23.5 | 4,798.2 | |||||||||
Interest rate exposure
Borrowings exposures to variable interest rate changes (based on gross debt excluding the effects of hedging) | Group exposure | LIBOR, EURIBOR +1% | ||||||
| $m | $m | |||||||
| Euro | 1,186.9 | 11.9 | ||||||
| US dollar | 3,421.1 | 34.2 | ||||||
| Total Gross Debt | 4,608.0 | 46.1 | ||||||
Not applicable
Not applicableapplicable.
Not applicable.
Fees and charges payable by ADS holders
Deutsche Bank Trust Company Americas (Deutsche Bank) was appointed as the depositary bank (the Depositary) for Micro Focus’s ADS program pursuant to the Deposit Agreement dated August 11, 2017 between Micro Focus, the Depositary and the owners and holders of ADSs (the Deposit Agreement).
The Deposit Agreement provides that ADS holders may be required to pay various fees to the Depositary, and the Depositary may refuse to provide any service for which a fee is assessed until the applicable fee has been paid.
The Depositary charges a fee for the operation and maintenance of administering the ADSs. The total fees charged by the Depositary are unchanged at $0.02 per ADS charged twice per year.
| Service | Fees | |
| Issuance of ADSs including issuance from a distribution of shares and distribution of ADSs pursuant to bonus distributions, stock splits or other distributions. | $5.00 (or less) per 100 ADSs (or portion of 100 ADSs). | |
| Distribution of cash dividends. This fee is not currently charged. | $5.00 (or less) per 100 ADSs (or portion of 100 ADSs). | |
| An annual fee for operation and maintenance of administering the ADSs. | $5.00 (or less) per 100 ADSs (or portion of 100 ADSs). The current per ADS fee to be charged for | |
| Transfer and registration of shares on share register to or from the name of the depositary or its agent when you deposit or withdraw shares | Registration or transfer fees |
In addition, ADS holders may be required under the Deposit Agreement to pay the Depositary: (a) taxes (including applicable interest and penalties) and other governmental charges; (b) registration fees; (c) certain cable, telex and facsimile transmission and delivery expenses; (d) the expenses and charges incurred by the Depositary in the conversion of foreign currency; (e) such fees and expenses as are incurred by the Depositary in connection with compliance with applicable exchange control regulations and other regulatory requirements; and (f) the fees and expenses incurred by the Depositary, the custodian or any nominee in connection with the servicing or delivery of deposited securities. The Depositary may: (a) withhold dividends or other distributions or sell for the account of any ADS holder any or all of the shares underlying the ADSs in order to satisfy any tax or governmental charge; and (b) deduct from any cash distribution the applicable fees and charges of, and expenses incurred by, the Depositary and any taxes, duties or other governmental charges on account.
Fees and payments made by the Depositary to Micro Focus
Under the terms of the contractual arrangements set out in the separate agreement between Micro Focus and the Depositary referred to above, Micro Focus received a total of approximately US$6.63.0 million from the Depositary, comprising fees charged in respect of dividendsthe semi-annual service fee collection for November 2020 and issuance and cancellationApril 2021. In addition to this, following the 2021 AGM the Depository paid $0.3 million to 3rd parties on behalf of ADSs during the year ended October 31, 2019.Micro Focus.
Not applicable.
Not applicable.
Disclosure controls and procedures (as defined in Rule 13a-15(e) promulgated under the Securities Exchange Act of 1934 (the “Exchange Act”)) are designed to provide reasonable assurance that the information required to be (i) recorded, processed, summarized and reported within the time periods specified in the SEC’s rules and forms and (ii) accumulated and communicated to management, including our Chief Executive Officer and Chief Financial Officer, to allow timely decisions regarding required disclosure. Management recognizes that any controls and procedures, no matter how well designed and operated, can provide only reasonable assurance of achieving their objectives, and management necessarily applies its judgmentjudgement in evaluating the cost benefit relationship of possible controls and procedures.
Based on their most recent evaluation, our Chief Executive Officer and Chief Financial Officer concluded that, as of October 31, 2019,2021, the Company’s disclosure controls and procedures were not effective as a result of the material weakness in our internal control over financial reporting described below. Notwithstanding the material weakness described below, our management, including our Chief Executive Officer and Chief Financial Officer, believes that the audited consolidated financial statements contained in this Annual Report on Form, 20-F fairly present, in all material respects, our financial condition, results of operations and cash flows for the fiscal years presented in conformity with IFRS. In addition, the material weaknessweaknesses described below did not result in a material misstatement to the financial statements.
Please see Exhibits 12.1 and 12.2 for the certifications required by this Item.
As a foreign issuer with American Depositary Shares listed on the New York Stock Exchange (“NYSE”) the Group, as part of its disclosure and reporting obligations in the United States, is required to furnish this annual reportAnnual Report by its management on its internal controls over financial reporting, including an attestation report issued by its independent registered public accounting firm pursuant to Section 404 of the Sarbanes-Oxley Act of 2002 (“SOX”) as at October 31, 2019.2021.
Management is responsible for establishing and maintaining adequate internal controls over financial reporting for the Group. Internal control over financial reporting is defined in Rules13a-15(f)Rules 13a-15(f) and 15d-15(f) promulgated under the Exchange Act. The Group’s internal controls over financial reporting include policies and procedures which:
| - | are designed to give reasonable assurance that the transactions are recorded as necessary to permit the preparation of financial statements in accordance with IFRS as adopted by the EU and IFRS as issued by the IASB, and that receipts and expenditures are being made only in accordance with authorization of management and the directors; |
| - | relate to the maintenance of records that in reasonable detail accurately and fairly reflect the transactions and disposal of assets; and |
| - | give reasonable assurance regarding the prevention or timely detection of unauthorized use, acquisition or disposal of the Group’s assets that could have a material impact on the financial statements. |
Any internal control network will have inherent limitations, such that the possibility of human error and circumvention or overriding of controls and procedures may not prevent or detect misstatements. In addition, the projection of any controls to future periods are subject to the risk that controls may become inadequate due to changes in conditions or because the degree of compliance with policies and procedures may deteriorate.
Management assessed the effectiveness of internal controls over financial reporting as at October 31, 20192021 based on the Internal Control – Integrated Framework issued by the Committee of Sponsoring Organizations of the Treadway Commission 2013. Based on the assessment, management concluded that its internal control over financial reporting was not effective due to the following material weakness. Theweakness: In July, the Company did not have adequate controls surrounding existing IT applications, in particular regarding change management and access controls. As a result of those deficiencies, automatedcompleted the migration to its new enterprise-wide application platform (“Enterprise Platform”) which included new business controls and IT general controls over information produced(“ITGC’s). There was not sufficient time to allow ITGC’s and related business controls to operate effectively by the entity could not be relied upon. TheseOctober 31, 2021. In aggregate, these control deficiencies in aggregateimpact all financial reporting processes and constitute a material weakness. This material weakness did not result in material misstatement to the financial statements.
Our consolidatedConsolidated financial statements have been audited by KPMG LLP, an independent registered public accounting firm, which has issued an attestation report expressing an adverse opinion on the Company’seffectiveness of internal control over financial reporting, as at October 31, 2019with respect to this material weakness in this Annual Report on Form 20-F.
Report of Independent Registered Public Accounting Firm
To the Shareholders and Board of Directors
Micro Focus International plc:plc.:
Opinion on Internal Control Over Financial Reporting
We have audited Micro Focus International plc and subsidiaries (thesubsidiaries’ (the Company) internal control over financial reporting as of October 31, 2019,2021, based on criteria established in Internal Control – Integrated Framework (2013) issued by the Committee of Sponsoring Organizations of the Treadway Commission.Commission”. In our opinion, because of the effect of the material weakness, described below, on the achievement of the objectives of the control criteria, the Company has not maintained effective internal control over financial reporting as of October 31, 2019,2021, based on criteria established in Internal Control – Integrated Framework (2013) issued by the Committee of Sponsoring Organizations of the Treadway Commission.
We also have audited, in accordance with the standards of the Public Company Accounting Oversight Board (United States) (PCAOB), the consolidated balance sheetsstatements of financial position of the Company as of October 31, 20192021 and 2018,2020, the related consolidated statements of income, comprehensive income, stockholders’changes in equity, and cash flows for each of the twelve monthyears in the three-year period ended October 31, 2019 and eighteen month period ended October 31, 2018,2021, the summary of significant accounting policies and the related notes (collectively, the consolidatedConsolidated financial statements), and our report dated February 20, 202024, 2022 expressed an unqualified opinion on those consolidatedConsolidated financial statements.
A material weakness is a deficiency, or a combination of deficiencies, in internal control over financial reporting, such that there is a reasonable possibility that a material misstatement of the company’sCompany’s annual or interim financial statements will not be prevented or detected on a timely basis. A material weakness related to deficient controls surrounding IT Applications in the areas of change management and access controls has been identified and included in management’s assessment. As a result of those deficiencies, automatedassessment related to ineffective IT general controls and related business controls over information produced byfollowing the entity could not be relied upon.migration to a new enterprise platform in July 2021. In aggregate, these deficiencies impact all financial reporting processes and constitute a material weakness. The material weakness was considered in determining the nature, timing, and extent of audit tests applied in our audit of the 2019 consolidatedOctober 31, 2021 Consolidated financial statements, and this report does not affect our report on those consolidatedConsolidated financial statements.
Basis for Opinion
The Company’s management is responsible for maintaining effective internal control over financial reporting and for its assessment of the effectiveness of internal control over financial reporting, included in the accompanying Management’s Annual Report on Internal ControlsControl over Financial Reporting. Our responsibility is to express an opinion on the Company’s internal control over financial reporting based on our audit. We are a public accounting firm registered with the PCAOB and are required to be independent with respect to the Company in accordance with the U.S. federal securities laws and the applicable rules and regulations of the Securities and Exchange Commission and the PCAOB.
We conducted our audit in accordance with the standards of the PCAOB. Those standards require that we plan and perform the audit to obtain reasonable assurance about whether effective internal control over financial reporting was maintained in all material respects. Our audit of internal control over financial reporting included obtaining an understanding of internal control over financial reporting, assessing the risk that a material weakness exists, and testing and evaluating the design and operating effectiveness of internal control based on the assessed risk. Our audit also included performing such other procedures as we considered necessary in the circumstances. We believe that our audit provides a reasonable basis for our opinion.
Definition and Limitations of Internal Control Over Financial Reporting
A company’s internal control over financial reporting is a process designed to provide reasonable assurance regarding the reliability of financial reporting and the preparation of financial statements for external purposes in accordance with generally accepted accounting principles. A company’s internal control over financial reporting includes those policies and procedures that (1) pertain to the maintenance of records that, in reasonable detail, accurately and fairly reflect the transactions and dispositions of the assets of the company;company; (2) provide reasonable assurance that transactions are recorded as necessary to permit preparation of financial statements in accordance with generally accepted accounting principles, and that receipts and expenditures of the company are being made only in accordance with authorizations of management and directors of the company;company; and (3) provide reasonable assurance regarding prevention or timely detection of unauthorized acquisition, use, or disposition of the company’s assets that could have a material effect on the financial statements.
Because of its inherent limitations, internal control over financial reporting may not prevent or detect misstatements. Also, projections of any evaluation of effectiveness to future periods are subject to the risk that controls may become inadequate because of changes in conditions, or that the degree of compliance with the policies or procedures may deteriorate.
/s/ KPMG LLP
London, United Kingdom
February 20, 202024, 2022
In the period, the Group completed the migration from legacy IT applications and infrastructure to the Enterprise Platform. The Enterprise Platform enables further improvement to process and controls. Improvements for the business include refining functional process and organisational simplification as referred to in Item 3.D, Item 5.A and Item 5.D. The migration was successfully completed in two planned phases, the first completed in January 2021 and the second completed in July 2021. The majority of the work was carried out within the requirements of remote working under COVID-19 restrictions. The timing of the phases meant that there was insufficient time prior to the financial year end to allow ITGC’s and related business controls to operate effectively.
During the period the Group continued to implement amonitor and maintain the framework of SOX compliant internal controls under its central SOX Implementation Programme (SIP),Compliance Program (“SCP”) on the legacy systems as well as preparing and implementing controls for the Enterprise Platform. The SCP worked together with a specialist team from its outsourced Internal Audit Partner.internal audit partner, PwC. Governance for the SIPSCP included a cross functionalcross-functional SOX Steering Groupsteering group (“SSG”) chaired by the Group’s Chief Financial Officer reporting to the Audit Committee.. In addition, the Disclosure Committee, also chaired by the Chief Financial Officer,cross functional disclosure committee continued to meet to assist the Chief Executive Officer and Chief Financial Officer in fulfilling their responsibilities in connection with the accuracy of financial reporting. The Group strengthened internal compliance by putting in place new Finance Compliancethe appointment of an additional team from PwC to work alongside the business and Revenue Assurance teams. In addition, the Finance function established a Finance Processes and Compliance Committee. The SIP was implemented during a period of significant change across the organization. Change activities include a phased Finance Transformation Programme and work on the new simplified system architecture as setEnterprise Platform implementation project team to carry out in Item 4.B. Business Overview. As part of the governance, the SSG monitors potential adverse impacts of organizational change to the SIP.
In the Annual Report and Accounts 2018 andyear, the 2018Group has also reviewed its entity-level controls including continued supplementary SOX training plan across relevant parts of the Group. As part of the overall governance, the SSG continues to monitor potential adverse impacts of organisational change to the SCP.
In the 2020 Form 20-F the Group reported certain weaknesses in its internal control over financial reporting, which under Public Company Accounting Oversight Board auditing standards were considered to be a material weaknesses.weakness. The material weaknessesweakness related to the fact that the GroupCompany did not have sufficient formally documentedadequate controls at that time surrounding existing IT applications, in particular regarding change management and implemented processesaccess control. These controls and review procedures, nor did it have sufficient formality and evidence of controls over key reports and spreadsheets. Duringcontrol deficiencies were then superseded in the year underby the SIP, management, where possible, put in place a number of actions to remediate these weaknesses and strengthen internal controls. The actions included, but were not limited to, implementing new controls both preventative and detective in nature, increasing the precision with which controls operate, ensuring clear ownership of every control, and implementing checks on the completeness and accuracy of reports that are relied upon as part of key control operation. Within the IT environment, and where technical limitations allowed, improvements included updated change management controls as well as increased access control and monitoring to IT applications.Enterprise Platform.
Remediation
The Group continues its work under the SIPSCP to remediate the material weakness and other control deficiencies, and any other matters, which arise during its progress towards SOX compliance. As set out in Item 4.B. Business Overview, the Groupbusiness commenced the new financial year operating on the Enterprise Platform it has a project underwayalso been able to move to a simplified systems architecture enabling further automation of improved processes and controls. implement an enhanced testing program for year ended October 31, 2022.
To maintain the required control environment the Group relies upon automated, semi- automatedsemi-automated and manual controls together with a combination of preventative and detective controls. The material weakness, control deficiencies and other matters may not be able to be remediated by October 31, 2020,2022, and there is a risk that other deficiencies for the purposes of SOX may be identified. Failure to correct the material weakness, or our failure to discover and address any other material weakness or control deficiencies, could result in inaccuracies in our financial statements, and impair our ability to comply with applicable financial reporting requirements and related regulatory filings on a timely basis. It could also result in an adverse reaction in the financial markets due to a loss of confidence in the reliability of the Group’s financial statements and could have a material adverse effect on the Group’s business, financial condition, results of operation and prospects.
The Audit Committee includes Richard Atkins who, in the opinion of the Board, is an ‘audit committee financial expert’ and is independent (as defined for this purpose in 17 CFR 240.10A-3). The board considered that the Committee’s members have broad commercial knowledge and extensive business leadership experience, having held between them various roles in major business, financial management, and finance function supervision and that this constitutes a broad suitable mix of business and financial experience on the committee.
Micro Focus has adopted aan updated code of ethics in the year ended October 31, 2021 (the Micro Focus Code of Conduct) which applies to all employees including the chief executive officerChief Executive Officer and chief financial officerChief Financial Officer and other senior financial management. This code of ethics is available on our website (https://www.microfocus.com/media/guide/micro_focus_code_of_conduct_guide.pdf). The information on our website is not incorporated by reference into this report.
The Code of Ethics is included as Exhibit 11.1 MF Code of Conduct Guide.
During the 12 monthsyears ended October 31, 2021, 2020 and 2019, the 18 months ended October 31, 2018, the 12 months ended April 30, 2017, the Group obtained the following services from the Group’s auditors as detailed below:
12 months ended October 31, 2019 | 18 months ended October 31, 2018 | 12 months ended April 30, 2017 | Year ended October 31, 2021 | Year ended October 31, 2020 | Year ended October 31, 2019 | |||||||||||||||||||
| $m | $m | $m | $m | $m | $m | |||||||||||||||||||
Audit fees | 19.7 | 15.1 | 6.1 | |||||||||||||||||||||
Audit-related fees | 0.6 | 0.1 | 0.1 | |||||||||||||||||||||
| Audit of Company | 8.0 | 7.2 | 12.8 | |||||||||||||||||||||
| ICOFR | 4.7 | 2.7 | 3.0 | |||||||||||||||||||||
| Audit of subsidiaries | 2.8 | 2.9 | 3.9 | |||||||||||||||||||||
| Total audit fees | 15.5 | 12.8 | 19.7 | |||||||||||||||||||||
| Audit-related assurance fees | 0.5 | 0.6 | 0.6 | |||||||||||||||||||||
| Other assurance services | - | - | - | |||||||||||||||||||||
| Total audit related fees | 0.5 | 0.6 | 0.6 | |||||||||||||||||||||
| Tax compliance services | - | - | - | |||||||||||||||||||||
| Tax advisory services | - | - | 0.1 | |||||||||||||||||||||
Tax fees | 0.1 | 0.4 | 0.1 | - | - | 0.1 | ||||||||||||||||||
All other fees | - | 0.6 | 7.5 | - | - | - | ||||||||||||||||||
| Total | 20.4 | 16.2 | 13.8 | 16.0 | 13.4 | 20.4 | ||||||||||||||||||
The 12 months ended October 31, 2019 and the 18 months ended October 31, 2018 fees represent fees paid to KPMG LLP, as the current auditor. Fees for the year ended April 30, 2017 represent amounts paid to the previous auditor, PricewaterhouseCoopers LLP.
There were no other fees in the 12 monthsyears ended October 31, 2019. Other fees in the 18 months ended October 31, 2018 relate primarily to the auditor’s assurance work in relation to the SUSE divestiture2021, 2020 and license verification compliance work. Other fees in the 12 months ended April 30, 2017 relate primarily to the auditor’s work as reporting accountants and due diligence in respect of the acquisition of the HPE Software business.2019.
Independence and objectivity of the external auditors
The Audit Committee approves all non-audit work commissioned from the external auditors. The committee is responsible for safeguarding the independence and objectivity of the external auditors and has developed a robust policy designed to ensure that this is not compromised. As explained above, the committee manages the risks that the external auditors undertake inappropriate non- audit work, or earn material levels of fees for non-audit services. It also considers the standing and experience of the external audit partner and takes comfort from the fact that KPMG took office relatively recently and from the external auditors’ confirmation that they have complied with relevant UK and US independence standards.
The committee is satisfied that the independence and objectivity of the external auditors has been maintained throughout the year ended October 31, October 20192021 and to the date of this report.
Not applicable.
12 months ended 31 October 2019 | 18 months ended 31 October 2018 | Total | ||||||||||
| Treasury shares | Number | Number | Number | |||||||||
| Share buy-backs | 29,160,054 | 9,858,205 | 39,018,259 | |||||||||
| Shares issued to satisfy option awards | (4,804,817 | ) | - | (4,804,817 | ) | |||||||
| Share reorganization | (4,012,537 | ) | - | (4,012,537 | ) | |||||||
| 20,342,700 | 9,858,205 | 30,200,905 | ||||||||||
| Share buy-backs numbers: | ||||||||||||
| Ordinary shares bought on the London Stock Exchange | 25,766,919 | 8,567,659 | 34,334,578 | |||||||||
| ADRs purchased on the New York Stock Exchange | 3,393,135 | 1,290,546 | 4,683,681 | |||||||||
| 29,160,054 | 9,858,205 | 39,018,259 | ||||||||||
| Share buy-back cost: | $ | m | $ | m | $ | m | ||||||
| Share buy-back cost | 538.8 | 171.2 | 710.0 | |||||||||
| Expenses | 5.9 | 0.5 | 6.4 | |||||||||
| 544.7 | 171.7 | 716.4 | ||||||||||
| Period | Total Number of Shares purchased | Average price paid per share | Total Number of Shares purchased as part of publicly announced plans or programs | Maximum number of Shares that may yet be purchased under the plans or programs | ||||||||||||
| November 1, 2020 to November 30, 2020 | - | - | - | - | ||||||||||||
| December 1, 2020 to December 31, 2020 | - | - | - | - | ||||||||||||
| January 1, 2021 to January 31, 2021 | - | - | - | - | ||||||||||||
| February 1, 2021 to February 28, 2021 | - | - | - | - | ||||||||||||
| March 1, 2021 to March 31, 2021 | 4,000,000 | 1 | $ | 6.81 | - | - | ||||||||||
| April 1, 2021 to April 30, 2021 | - | - | - | - | ||||||||||||
| May 1, 2021 to May 31, 2021 | - | - | - | - | ||||||||||||
| June 1, 2021 to June 30, 2021 | - | - | - | - | ||||||||||||
| July 1, 2021 to July 31, 2021 | - | - | - | - | ||||||||||||
| August 1, 2021 to August 31, 2021 | - | - | - | - | ||||||||||||
| September 1, 2021 to September 30, 2021 | - | - | - | - | ||||||||||||
| October 1, 2021 to October 31, 2021 | - | - | - | - | ||||||||||||
| Total | 4,000,000 | $ | 6.81 | - | - | |||||||||||
1 During the year ended October 31, 2019 was £14.61 per2021 the Micro Focus Employee Benefit Trust (“EBT”) purchased four million of the Group’s shares in open-market transactions. The EBT will hold these shares to satisfy future exercises of share (18 months ended October 31, 2018 was £13.82 per share).options.
(a) Total Number of Shares Purchased | (b) Average Price Paid per Share | (c) Total Number of Shares (or Units) Purchased as Part of Publicly Announced Plans or Programs | (d) Maximum Number (or Approximate Dollar Value) of Shares ( or Units) that May Yet Be Purchased Under the Plans or Programs | |||||||||||||
| Period | Number | $ | Number | $m | ||||||||||||
| Brought forward November 1, 2018 | - | - | 9,858,205 | 29.9 | ||||||||||||
Month 1 Beginning November 1 2018; Ending November 30, 2018 | 3,578,352 | 18.19 | 13,436,557 | 164.8 | ||||||||||||
Month 2 Beginning December 1 2018; Ending December 31, 2018 | 5,169,819 | 17.93 | 18,606,376 | 72.1 | ||||||||||||
Month 3 Beginning January 1 2019; Ending January 31, 2019 | 3,072,744 | 18.45 | 21,679,120 | 15.4 | ||||||||||||
Month 4 Beginning February 1 2019; Ending February 28, 2019 | 2,501,024 | 22.34 | 24,180,144 | 69.5 | ||||||||||||
Month 5 Beginning March 1 2019; Ending March 31, 2019 | 2,761,993 | 25.08 | 26,942,137 | - | ||||||||||||
Month 6 Beginning April 1 2019; Ending April 30, 2019 | - | 26,942,137 | - | |||||||||||||
Month 7 Beginning May 1 2019; Ending May 31, 2019 | - | 26,942,137 | - | |||||||||||||
Month 8 Beginning June 1 2019; Ending June 30, 2019 | - | 26,942,137 | - | |||||||||||||
Month 9 Beginning July 1 2019; Ending July 31, 2019 | 1,638,503 | 21.22 | 28,580,640 | 165.2 | ||||||||||||
Month 10 Beginning August 1 2019; Ending August 31, 2019 | 4,149,814 | 18.88 | 32,730,454 | 86.9 | ||||||||||||
Month 11 Beginning September 1 2019; Ending September 30, 2019 | 5,983,282 | 13.87 | 38,713,736 | 3.9 | ||||||||||||
Month 10 Beginning October 1 2019; Ending October 31, 2019 | 304,523 | 14.24 | 39,018,259 | - | ||||||||||||
| Total | 29,160,054 | 18.61 | 39,018,259 | - | ||||||||||||
Principles
Micro Focus International plc (the “Company”) has a primary listing on the London Stock Exchange. As such, it is required to comply with the UK Corporate Governance Code (the “Code”). For the year ended October 31, 20192021 this was the edition of the Code published by the UK’s Financial Reporting Council in April 2016.July 2018.
The Company’s ADSs are listed on the NYSE. As a Foreign Private Issuer, we are required to comply with some, but not all, of the NYSE’s corporate governance rules, and are required to disclose any significant ways in which the UK corporate governance practices employed by the Company differ from those followed by US companies under the NYSE listing standards.Listed Company Manual.
The directors are committed to ensuring that the Company operates in compliance with the main principles of the Code, as this provides a robust governance framework in support of the delivery of value to shareholders.
Compliance with the Code
UK listed companies are required to include in their Annual Report a narrative statement of (i) how they have applied the principles of the Code and (ii) whether or not they have complied with each of the provisions of the Code.
Throughout the year ended October 31, 20192021 and to the date of this report, the Board considers that the Company has been in full compliance with the principles of the Code, and with each of its provisions, other thansave for one element of Provision 38 in relation to the alignment of pension contribution rates. Under Provision 38 the Company is partially compliant with this provision A.2.1. This single instanceand will be fully compliant in the alignment of non-compliancepension contribution rates for the executive directors with the wider workforce at the end of 2022. The pension contribution rate for Stephen Murdoch will be aligned at the end of 2022 as set out in the Directors’ Remuneration Policy which was approved by shareholders at the 2020 Annual General. The rate for Matt Ashley is as a resultalready aligned, and the rates for any new director on joining would be aligned with the wider workforce.
Non-executive directors’ Independence
Each of Kevin Loosemore’s role as Executive Chairman. A separate Chief Executive Officer has been in place at all timesthe non-executive directors who served during the financial period butNovember 1, 2020 to October 31, 2021, was considered by the Executive Chairman still retains executive responsibility for strategy, M&A activities, investor relations and executive director development. Stephen Murdoch, as Chief Executive Officer, is responsible for the evolution and delivery of the strategy and the day-to-day operation of the business. Kevin Loosemore continuesBoard to work to ensure an orderly transition of executive responsibilitiesbe independent. Karen Slatford1 was appointed to the Chief Executive Officer.
The non-executive directors have metmeet together regularly without the Executive Chairman presentpresence of executive directors. In addition, the Senior Independent Director meets with the non-executive and executive directors at least once a year to appraisereview the Executive Chairman’s performance. The meeting was chaired by the senior independent non-executive director, Karen Slatford. A majorityperformance of the board is made up of independent non-executive directors.Non-Executive Chairman and to consider whether to recommend his re-election, providing feedback directly to the Chairman.
Committees of the board of directors
The Company has three principal Board committees that are broadly comparable in purpose and composition to those required by NYSE rules for domestic US companies. For instance, the Company has a Nomination (rather than nominating/corporate governance) Committee and a Remuneration (rather than compensation) Committee. The Company also has an Audit Committee, which NYSE rules require for both US companies and foreign private issuers. All the committees are comprised of Non-Executive Directorsnon-executive directors only and none of the functions of these committees has been delegated to another committee.
Each Board Committee has clearly defined terms of reference approved by the Board setting out their respective authority and duties. The terms of reference for each committee can be found on the Company’s website at www.microfocus.com.https://www.microfocus.com/en-us/governance-policies/committees-of-the-board
Under the US Securities Exchange Act of 1934 and the listing standards of the NYSE Listed Company Manual, the Company is required to have an audit committee that is comprised of at least three members from the independent non-executive directors of the Company’s Board. Our Audit Committee complies, and during the year ended October 31, 20192021 has complied, with these requirements. As stated in Item 16.A. above, the Board has determined that Richard Atkins possesses ‘accounting or related financial management expertise’, as required by rulesection 303A.07 (a) of the NYSE listing rules.Listed Company Manual. Richard Atkins also possesses the financial and audit committee experience set forth in the Code.
The Company’s Audit Committee does not have direct responsibility for the appointment, reappointment or removal of the independent auditors. Instead, it follows the UK Companies Act 2006 by making recommendations to the Board on these matters for it to put forward for shareholder approval at the AGM.
Shareholder approval of equity compensation plans
Under NYSE listing rules, shareholders must be given the opportunity to vote on all equity-compensation plans and material revisions thereto, except for employment inducement awards, certain grants, plans and amendments in the context of mergers and acquisitions, and certain specific types of plans. The Company complies with corresponding UK requirements in the Listing Rules, requiring the Company to seek shareholder approval for employee share schemes and significant changes to existing schemes, save in circumstances permitted by the Listing Rules (Listing Rule 9.4.1). The Board, however, does not explicitly take into consideration the NYSE’s detailed definition of what are considered ‘material revisions’.
Corporate Governance Guidelines
In addition, the Company is required to make certain mandatory corporate governance statements in accordance with the UK Listing Authority’s Disclosure Guidance and Transparency Rules, DTR 7, which are also included in the Group’s UK Annual Report.Report and Accounts available on the Group’s website https://www.microfocus.com/en-us/investors/investor-download-centre.
Code of Business Conduct and Ethics
The Micro Focus Code of Conduct is available on the Company’s website at www.microfocus.com.
Not applicable.
Not applicable.
Not applicable.
The financial statements filed as part of this Annual Report on Form 20-F are included in Item 18 on pages F-1 through F-121F-92 hereof.
The following exhibits are filed as part of this report:
| Description of the rights of each class of securities registered under Section 12 of the Exchange Act | ||
| Credit Agreement amendments, among Micro Focus International plc, Micro Focus Group Limited, MA FinanceCo., LLC, the Lenders party thereto and JPMorgan Chase Bank, N.A., as Administrative Agent and Collateral Agent. | ||
Code of conduct | ||
Certification pursuant to Section 302 of the Sarbanes-Oxley Act of 2002 | ||
Certification pursuant to Section 302 of the Sarbanes-Oxley Act of 2002 | ||
Certification of Stephen Murdoch under Section 906 of the Sarbanes-Oxley Act of 2002 | ||
Certification of | ||
Consent of KPMG LLP. | ||
| 101.INS | Inline XBRL Instance Document (the instance document does not appear in the Interactive Date File because its XBRL tags are embedded with the Inline XBRL document) |
| 101.SCH | Inline XBRL Taxonomy Extension Schema Document |
| 101.CAL | Inline XBRL Taxonomy Extension Calculation Linkbase Document |
| 101.DEF | Inline XBRL Taxonomy Extension Definition Linkbase Document |
| 101.LAB | Inline XBRL Taxonomy Extension Label Linkbase Document |
| 101.PRE | Inline XBRL Taxonomy Extension Presentation Linkbase Document |
| 104 | Cover Page Interactive Data File (formatted as Inline XBRL and contained in Exhibit 101) |
Signature
Micro Focus International plc
/s/ Stephen Murdoch
To the Shareholders and Board of Directors
Micro Focus International plc:plc.:
Opinion on the ConsolidatedInternal Control Over Financial StatementsReporting
We have audited the accompanying consolidated statements of financial position of Micro Focus International plc and subsidiariessubsidiaries’ (the Company) internal control over financial reporting as of October 31, 2019 and 2018,2021, based on Internal Control – Integrated Framework (2013) issued by the related consolidated statementsCommittee of comprehensive income, changes in equity, and cash flows forSponsoring Organizations of the twelve month period ended October 31, 2019 and the eighteen month period ended October 31, 2018, and the related notes (collectively, the consolidated financial statements)Treadway Commission”. In our opinion, the consolidated financial statements present fairly, in all material respects, the financial positionbecause of the effect of the material weakness, described below, on the achievement of the objectives of the control criteria, the Company has not maintained effective internal control over financial reporting as of October 31, 2019 and 2018, and the results of its operations and its cash flows for each of the periods then ended,2021, based on criteria established in conformity with International Financial Reporting Standards (“IFRS”) asInternal Control – Integrated Framework (2013) issued by the International Accounting Standards Board (“IASB”).
We also have audited, in accordance with the standards of the Public Company Accounting Oversight Board (United States) (PCAOB), the Company’sconsolidated statements of financial position of the Company as of October 31, 2021 and 2020, the related consolidated statements of comprehensive income, changes in equity, and cash flows for each of the years in the three-year period ended October 31, 2021, the summary of significant accounting policies and the related notes (collectively, the Consolidated financial statements), and our report dated February 24, 2022 expressed an unqualified opinion on those Consolidated financial statements.
A material weakness is a deficiency, or a combination of deficiencies, in internal control over financial reporting, assuch that there is a reasonable possibility that a material misstatement of the Company’s annual or interim financial statements will not be prevented or detected on a timely basis. A material weakness has been identified and included in management’s assessment related to ineffective IT general controls and related business controls following the migration to a new enterprise platform in July 2021. In aggregate, these deficiencies impact all financial reporting processes and constitute a material weakness. The material weakness was considered in determining the nature, timing, and extent of audit tests applied in our audit of the October 31, 2019, based on criteria established in Internal Control – Integrated Framework (2013) issued by the Committee of Sponsoring Organizations of the Treadway Commission,2021 Consolidated financial statements, and this report does not affect our report dated February 20, 2020 expressed an adverse opinion on the effectiveness of thethose Consolidated financial statements.
Basis for Opinion
The Company’s management is responsible for maintaining effective internal control over financial reporting.
We conducted our auditsaudit in accordance with the standards of the PCAOB. Those standards require that we plan and perform the audit to obtain reasonable assurance about whether effective internal control over financial reporting was maintained in all material respects. Our audit of internal control over financial reporting included obtaining an understanding of internal control over financial reporting, assessing the consolidated financial statements are freerisk that a material weakness exists, and testing and evaluating the design and operating effectiveness of material misstatement, whether due to error or fraud.internal control based on the assessed risk. Our auditsaudit also included performing such other procedures to assess the risks of material misstatement of the consolidated financial statements, whether due to error or fraud, and performing procedures that respond to those risks. Such procedures included examining, on a test basis, evidence regarding the amounts and disclosuresas we considered necessary in the consolidated financial statements. Our audits also included evaluating the accounting principles used and significant estimates made by management, as well as evaluating the overall presentation of the consolidated financial statements.circumstances. We believe that our audits provideaudit provides a reasonable basis for our opinion.
A company’s internal control over financial reporting is a process designed to provide reasonable assurance regarding the reliability of financial reporting and the preparation of financial statements for external purposes in accordance with generally accepted accounting principles. A company’s internal control over financial reporting includes those policies and procedures that (1) pertain to the maintenance of records that, in reasonable detail, accurately and fairly reflect the transactions and dispositions of the assets of the company; (2) provide reasonable assurance that transactions are recorded as necessary to permit preparation of financial statements in accordance with generally accepted accounting principles, and that receipts and expenditures of the company are being made only in accordance with authorizations of management and directors of the company; and (3) provide reasonable assurance regarding prevention or timely detection of unauthorized acquisition, use, or disposition of the company’s assets that could have a material effect on the financial statements.
Because of its inherent limitations, internal control over financial reporting may not prevent or detect misstatements. Also, projections of any evaluation of effectiveness to future periods are subject to the risk that controls may become inadequate because of changes in conditions, or that the degree of compliance with the policies or procedures may deteriorate.
/s/ KPMG LLP
London, United Kingdom
February 24, 2022
In the period, the Group completed the migration from legacy IT applications and infrastructure to the Enterprise Platform. The Enterprise Platform enables further improvement to process and controls. Improvements for the business include refining functional process and organisational simplification as referred to in Item 3.D, Item 5.A and Item 5.D. The migration was successfully completed in two planned phases, the first completed in January 2021 and the second completed in July 2021. The majority of the work was carried out within the requirements of remote working under COVID-19 restrictions. The timing of the phases meant that there was insufficient time prior to the financial year end to allow ITGC’s and related business controls to operate effectively.
During the period the Group continued to monitor and maintain the framework of SOX compliant internal controls under its central SOX Compliance Program (“SCP”) on the legacy systems as well as preparing and implementing controls for the Enterprise Platform. The SCP worked together with a specialist team from its outsourced internal audit partner, PwC. Governance for the SCP included a cross-functional SOX steering group (“SSG”). In addition, the cross functional disclosure committee continued to meet to assist the Chief Executive Officer and Chief Financial Officer in fulfilling their responsibilities in connection with the accuracy of financial reporting. The Group strengthened internal compliance by the appointment of an additional team from PwC to work alongside the business and the Enterprise Platform implementation project team to carry out end-to-end process mapping and support Risk and Control Matrix (“RACM”) development for the new Enterprise Platform controls. A key work stream of the SCP also relates to the adequacy of ITGCs. The work undertaken as part of the SCP identified a number of areas for improvement in the Group’s ITGCs. A remediation plan was agreed, which forms part of the SCP. Work in this area was carried out under an IT SOX Compliance Group chaired by the Chief Information Security Officer (CISO) reporting to the main SSG.
In the year, the Group has also reviewed its entity-level controls including continued supplementary SOX training plan across relevant parts of the Group. As part of the overall governance, the SSG continues to monitor potential adverse impacts of organisational change to the SCP.
In the 2020 Form 20-F the Group reported certain weaknesses in its internal control over financial reporting, which under Public Company Accounting Oversight Board auditing standards were considered to be a material weakness. The material weakness related to the fact that Company did not have adequate controls at that time surrounding existing IT applications, in particular regarding change management and access control. These controls and control deficiencies were then superseded in the year by the controls on the Enterprise Platform.
Remediation
The critical auditGroup continues its work under the SCP to remediate the material weakness and other control deficiencies, and any other matters, communicated below arewhich arise during its progress towards SOX compliance. As the business commenced the new financial year operating on the Enterprise Platform it has also been able to implement an enhanced testing program for year ended October 31, 2022.
To maintain the required control environment the Group relies upon automated, semi-automated and manual controls together with a combination of preventative and detective controls. The material weakness, control deficiencies and other matters arising from the current period audit of the consolidated financial statements that were communicated or requiredmay not be able to be communicatedremediated by October 31, 2022, and there is a risk that other deficiencies for the purposes of SOX may be identified. Failure to correct the audit committeematerial weakness, or our failure to discover and that: (1) relate to accountsaddress any other material weakness or disclosures that are material to the consolidatedcontrol deficiencies, could result in inaccuracies in our financial statements, and (2) involvedimpair our especially challenging, subjective, or complex judgments. The communicationability to comply with applicable financial reporting requirements and related regulatory filings on a timely basis. It could also result in an adverse reaction in the financial markets due to a loss of critical audit matters does not alterconfidence in any way our opinionthe reliability of the Group’s financial statements and could have a material adverse effect on the consolidatedGroup’s business, financial statements, taken ascondition, results of operation and prospects.
The Audit Committee includes Richard Atkins who, in the opinion of the Board, is an ‘audit committee financial expert’ and is independent (as defined for this purpose in 17 CFR 240.10A-3). The board considered that the Committee’s members have broad commercial knowledge and extensive business leadership experience, having held between them various roles in major business, financial management, and finance function supervision and that this constitutes a whole,broad suitable mix of business and we are not, by communicating the critical audit matters below, providing separate opinionsfinancial experience on the critical audit matters or on the accounts or disclosures to which they relate.committee.
Micro Focus has adopted an updated code of performance obligations in certain non-standard bundled customer contracts containing licences
The primary procedure we performedCode of Ethics is included as Exhibit 11.1 MF Code of Conduct Guide.
During the years ended October 31, 2021, 2020 and 2019, the Group obtained the following services from the Group’s auditors as detailed below:
Year ended October 31, 2021 | Year ended October 31, 2020 | Year ended October 31, 2019 | ||||||||||
| $m | $m | $m | ||||||||||
| Audit of Company | 8.0 | 7.2 | 12.8 | |||||||||
| ICOFR | 4.7 | 2.7 | 3.0 | |||||||||
| Audit of subsidiaries | 2.8 | 2.9 | 3.9 | |||||||||
| Total audit fees | 15.5 | 12.8 | 19.7 | |||||||||
| Audit-related assurance fees | 0.5 | 0.6 | 0.6 | |||||||||
| Other assurance services | - | - | - | |||||||||
| Total audit related fees | 0.5 | 0.6 | 0.6 | |||||||||
| Tax compliance services | - | - | - | |||||||||
| Tax advisory services | - | - | 0.1 | |||||||||
| Tax fees | - | - | 0.1 | |||||||||
| All other fees | - | - | - | |||||||||
| Total | 16.0 | 13.4 | 20.4 | |||||||||
The fees represent fees paid to address this critical audit matter includedKPMG LLP, as the following. We selected certain non-standard bundled customer contracts containing licencescurrent auditor.
There were no other fees in the years ended October 31, 2021, 2020 and performed an independent analysis2019.
Independence and objectivity of the performance obligationsexternal auditors
The Audit Committee approves all non-audit work commissioned from the external auditors. The committee is responsible for safeguarding the independence and compared our judgementsobjectivity of the external auditors and conclusionshas developed a robust policy designed to those made byensure that this is not compromised. As explained above, the Company.committee manages the risks that the external auditors undertake inappropriate non- audit work, or earn material levels of fees for non-audit services. It also considers the standing and experience of the external audit partner and takes comfort from the fact that KPMG took office relatively recently and from the external auditors’ confirmation that they have complied with relevant UK and US independence standards.
The committee is satisfied that the independence and objectivity of the external auditors has been maintained throughout the year ended October 31, 2021 and to the date of this report.
Not applicable.
The purchase of goodwill impairment analysis
| Period | Total Number of Shares purchased | Average price paid per share | Total Number of Shares purchased as part of publicly announced plans or programs | Maximum number of Shares that may yet be purchased under the plans or programs | ||||||||||||
| November 1, 2020 to November 30, 2020 | - | - | - | - | ||||||||||||
| December 1, 2020 to December 31, 2020 | - | - | - | - | ||||||||||||
| January 1, 2021 to January 31, 2021 | - | - | - | - | ||||||||||||
| February 1, 2021 to February 28, 2021 | - | - | - | - | ||||||||||||
| March 1, 2021 to March 31, 2021 | 4,000,000 | 1 | $ | 6.81 | - | - | ||||||||||
| April 1, 2021 to April 30, 2021 | - | - | - | - | ||||||||||||
| May 1, 2021 to May 31, 2021 | - | - | - | - | ||||||||||||
| June 1, 2021 to June 30, 2021 | - | - | - | - | ||||||||||||
| July 1, 2021 to July 31, 2021 | - | - | - | - | ||||||||||||
| August 1, 2021 to August 31, 2021 | - | - | - | - | ||||||||||||
| September 1, 2021 to September 30, 2021 | - | - | - | - | ||||||||||||
| October 1, 2021 to October 31, 2021 | - | - | - | - | ||||||||||||
| Total | 4,000,000 | $ | 6.81 | - | - | |||||||||||
1 During the year ended October 31, 20192021 the Micro Focus Employee Benefit Trust (“EBT”) purchased four million of the Group’s shares in open-market transactions. The EBT will hold these shares to satisfy future exercises of share options.
Not applicable.
Principles
Micro Focus International plc (the “Company”) has a primary listing on the London Stock Exchange. As such, it is required to comply with the UK Corporate Governance Code (the “Code”). For the year ended October 31, 2021 this was $6,671.3 million,the edition of the Code published by the UK’s Financial Reporting Council in July 2018.
The Company’s ADSs are listed on the NYSE. As a Foreign Private Issuer, we are required to comply with some, but not all, of the NYSE’s corporate governance rules, and are required to disclose any significant ways in which relatedthe UK corporate governance practices employed by the Company differ from those followed by US companies under the NYSE Listed Company Manual.
The directors are committed to ensuring that the Company operates in compliance with the main principles of the Code, as this provides a robust governance framework in support of the delivery of value to shareholders.
Compliance with the Code
UK listed companies are required to include in their Annual Report a narrative statement of (i) how they have applied the principles of the Code and (ii) whether or not they have complied with each of the provisions of the Code.
Throughout the year ended October 31, 2021 and to the Company’s single cash generating unit (“CGU”). date of this report, the Board considers that the Company has been in compliance with the principles of the Code, and with each of its provisions, save for one element of Provision 38 in relation to the alignment of pension contribution rates. Under Provision 38 the Company is partially compliant with this provision and will be fully compliant in the alignment of pension contribution rates for the executive directors with the wider workforce at the end of 2022. The pension contribution rate for Stephen Murdoch will be aligned at the end of 2022 as set out in the Directors’ Remuneration Policy which was approved by shareholders at the 2020 Annual General. The rate for Matt Ashley is already aligned, and the rates for any new director on joining would be aligned with the wider workforce.
Non-executive directors’ Independence
Each of the non-executive directors who served during the period November 1, 2020 to October 31, 2021, was considered by the Board to be independent. Karen Slatford1 was appointed to the Board in July 2010 and has now served for more than ten years. The Board has specifically considered whether this was likely to affect, or could appear to affect, her independence and concluded that she continued to demonstrate independence in thought and judgement, noting that there were no other relationships or circumstances that could affect her independence. The independent non-executive directors comprise a majority of the Board. In accordance with the Companies Act 2006, the Company has put in place procedures to deal with conflicts of interest, which have operated effectively. The board is aware of the other commitments of its directors and is satisfied that these do not conflict with their duties as directors of the Company. Any changes to these commitments are reported to the board.
The non-executive directors meet together regularly without the presence of executive directors. In addition, the Senior Independent Director meets with the non-executive and executive directors at least once a year to review the performance of the Non-Executive Chairman and to consider whether to recommend his re-election, providing feedback directly to the Chairman.
1 As announced on February 8, 2022, Karen Slatford has informed the Board of her intention to retire as a director of Micro Focus International Plc, following the conclusion of the 2022 Annual General Meeting and consequently will not be seeking re-election.
Committees of the board of directors
The Company performs goodwill impairment testing onhas three principal Board committees that are broadly comparable in purpose and composition to those required by NYSE rules for domestic US companies. For instance, the Company has a Nomination (rather than nominating/corporate governance) Committee and a Remuneration (rather than compensation) Committee. The Company also has an annual basis, or whenever events or changes in circumstances indicate possible impairment.
Each Board Committee has clearly defined terms of reference approved by the key assumptionsBoard setting out their respective authority and duties. The terms of discount rate applied and medium term annual revenue growth rate by product group were challenging to test as reasonably possible changes to those assumptions had a significant effectreference for each committee can be found on the Company’s assessmentwebsite at https://www.microfocus.com/en-us/governance-policies/committees-of-the-board
Under the US Securities Exchange Act of 1934 and the NYSE Listed Company Manual, the Company is required to have an audit committee that is comprised of at least three members from the independent non-executive directors of the recoverable amountCompany’s Board. Our Audit Committee complies, and during the year ended October 31, 2021 has complied, with these requirements. As stated in Item 16.A. above, the Board has determined that Richard Atkins possesses ‘accounting or related financial management expertise’, as required by section 303A.07 (a) of the CGU.NYSE Listed Company Manual. Richard Atkins also possesses the financial and audit committee experience set forth in the Code.
The primary procedures we performedCompany’s Audit Committee does not have direct responsibility for the appointment, reappointment or removal of the independent auditors. Instead, it follows the UK Companies Act 2006 by making recommendations to address this critical audit matter included the following:Board on these matters for it to put forward for shareholder approval at the AGM.
82
Shareholder approval of equity compensation plans
Corporate Governance Guidelines
Section 303A.09 of the NYSE Listed Company Manual requires listed companies to adopt and disclose corporate governance guidelines. As noted above, in line with its obligations under the UK’s Listing Rules the Company applies the UK Corporate Governance Code and, as required by the Listing Rules, the UK Annual Report contains an explanation of (i) how it has applied the principles of the Code, and (ii) whether it complies in full with the Code’s provisions, or, where it does not, providing an explanation of any non-compliance and the reasons for this (LR 9.8.6).
In addition, the Company is required to make certain mandatory corporate governance statements in accordance with the UK Listing Authority’s Disclosure Guidance and Transparency Rules, DTR 7, which are also included in the Group’s UK Annual Report and Accounts available market data for comparable entities.
The Micro Focus Code of Conduct is available on the Company’s determination that the recoverable amount of the CGU exceeded its carrying value.
| Item 16.I | Disclosure Regarding Foreign Jurisdictions that Prevent Inspections |
Not applicable.
Not applicable.
The financial statements filed as part of this Annual Report on Form 20-F are included in Item 18 on pages F-1 through F-92 hereof.
The following exhibits are filed as part of this report:
| Description of the rights of each class of securities registered under Section 12 of the Exchange Act | ||
| Credit Agreement amendments, among Micro Focus International plc, Micro Focus Group Limited, MA FinanceCo., LLC, the Lenders party thereto and JPMorgan Chase Bank, N.A., as Administrative Agent and Collateral Agent. | ||
| Credit Agreement amendments, among Micro Focus International plc, Micro Focus Group Limited, Seattle Spinco, Inc., the Lenders party thereto and JPMorgan Chase Bank, N.A., as Administrative Agent and Collateral Agent. | ||
| Code of conduct | ||
| Certification pursuant to Section 302 of the Sarbanes-Oxley Act of 2002 | ||
| Certification pursuant to Section 302 of the Sarbanes-Oxley Act of 2002 | ||
| Certification of Stephen Murdoch under Section 906 of the Sarbanes-Oxley Act of 2002 | ||
| Certification of Matt Ashley under Section 906 of the Sarbanes-Oxley Act of 2002 | ||
| Consent of KPMG LLP. |
| 101.INS | Inline XBRL Instance Document (the instance document does not appear in the Interactive Date File because its XBRL tags are embedded with the Inline XBRL document) |
| 101.SCH | Inline XBRL Taxonomy Extension Schema Document |
| 101.CAL | Inline XBRL Taxonomy Extension Calculation Linkbase Document |
| 101.DEF | Inline XBRL Taxonomy Extension Definition Linkbase Document |
| 101.LAB | Inline XBRL Taxonomy Extension Label Linkbase Document |
| 101.PRE | Inline XBRL Taxonomy Extension Presentation Linkbase Document |
| 104 | Cover Page Interactive Data File (formatted as Inline XBRL and contained in Exhibit 101) |
Signature
The registrant hereby certifies that it meets all of the requirements for filing on Form 20-F and that it has duly caused and authorized the undersigned to sign this annual report on its behalf.
Micro Focus International plc
/s/ Stephen Murdoch
Report of Independent Registered Public Accounting Firm
To the boardShareholders and Board of directors and shareholders of Directors
Micro Focus International plc.:
Opinion on Internal Control Over Financial Reporting
We have audited Micro Focus International plc and subsidiaries’ (the Company) internal control over financial reporting as of October 31, 2021, based on Internal Control – Integrated Framework (2013) issued by the Committee of Sponsoring Organizations of the Treadway Commission”. In our opinion, because of the accompanyingeffect of the material weakness, described below, on the achievement of the objectives of the control criteria, the Company has not maintained effective internal control over financial reporting as of October 31, 2021, based on criteria established in Internal Control – Integrated Framework (2013) issued by the Committee of Sponsoring Organizations of the Treadway Commission.
We also have audited, in accordance with the standards of the Public Company Accounting Oversight Board (United States) (PCAOB), the consolidated statements of financial position of the Company as of October 31, 2021 and 2020, the related consolidated statements of comprehensive income, of changes in equity, and of cash flows for each of the years in the three-year period ended October 31, 2021, the summary of significant accounting policies and the related notes (collectively, the Consolidated financial statements), and our report dated February 24, 2022 expressed an unqualified opinion on those Consolidated financial statements.
A material weakness is a deficiency, or a combination of deficiencies, in internal control over financial reporting, such that there is a reasonable possibility that a material misstatement of the Company’s annual or interim financial statements will not be prevented or detected on a timely basis. A material weakness has been identified and included in management’s assessment related to ineffective IT general controls and related business controls following the migration to a new enterprise platform in July 2021. In aggregate, these deficiencies impact all financial reporting processes and constitute a material weakness. The material weakness was considered in determining the nature, timing, and extent of audit tests applied in our audit of the October 31, 2021 Consolidated financial statements, and this report does not affect our report on those Consolidated financial statements.
Basis for Opinion
The Company’s management is responsible for maintaining effective internal control over financial reporting and for its assessment of the effectiveness of internal control over financial reporting, included in the accompanying Management’s Annual Report on Internal Control over Financial Reporting. Our responsibility is to express an opinion on the Company’s internal control over financial reporting based on our audit. We are a public accounting firm registered with the PCAOB and are required to be independent with respect to the Company in accordance with the U.S. federal securities laws and the applicable rules and regulations of the Securities and Exchange Commission and the PCAOB.
We conducted our audit in accordance with the standards of the PCAOB. Those standards require that we plan and perform the audit to obtain reasonable assurance about whether effective internal control over financial reporting was maintained in all material respects. Our audit of internal control over financial reporting included obtaining an understanding of internal control over financial reporting, assessing the risk that a material weakness exists, and testing and evaluating the design and operating effectiveness of internal control based on the assessed risk. Our audit also included performing such other procedures as we considered necessary in the circumstances. We believe that our audit provides a reasonable basis for our opinion.
Definition and Limitations of Internal Control Over Financial Reporting
A company’s internal control over financial reporting is a process designed to provide reasonable assurance regarding the reliability of financial reporting and the preparation of financial statements for external purposes in accordance with generally accepted accounting principles. A company’s internal control over financial reporting includes those policies and procedures that (1) pertain to the maintenance of records that, in reasonable detail, accurately and fairly reflect the transactions and dispositions of the assets of the company; (2) provide reasonable assurance that transactions are recorded as necessary to permit preparation of financial statements in accordance with generally accepted accounting principles, and that receipts and expenditures of the company are being made only in accordance with authorizations of management and directors of the company; and (3) provide reasonable assurance regarding prevention or timely detection of unauthorized acquisition, use, or disposition of the company’s assets that could have a material effect on the financial statements.
Because of its inherent limitations, internal control over financial reporting may not prevent or detect misstatements. Also, projections of any evaluation of effectiveness to future periods are subject to the risk that controls may become inadequate because of changes in conditions, or that the degree of compliance with the policies or procedures may deteriorate.
/s/ KPMG LLP
London, United Kingdom
February 24, 2022
In the period, the Group completed the migration from legacy IT applications and infrastructure to the Enterprise Platform. The Enterprise Platform enables further improvement to process and controls. Improvements for the business include refining functional process and organisational simplification as referred to in Item 3.D, Item 5.A and Item 5.D. The migration was successfully completed in two planned phases, the first completed in January 2021 and the second completed in July 2021. The majority of the work was carried out within the requirements of remote working under COVID-19 restrictions. The timing of the phases meant that there was insufficient time prior to the financial year end to allow ITGC’s and related business controls to operate effectively.
During the period the Group continued to monitor and maintain the framework of SOX compliant internal controls under its central SOX Compliance Program (“SCP”) on the legacy systems as well as preparing and implementing controls for the Enterprise Platform. The SCP worked together with a specialist team from its outsourced internal audit partner, PwC. Governance for the SCP included a cross-functional SOX steering group (“SSG”). In addition, the cross functional disclosure committee continued to meet to assist the Chief Executive Officer and Chief Financial Officer in fulfilling their responsibilities in connection with the accuracy of financial reporting. The Group strengthened internal compliance by the appointment of an additional team from PwC to work alongside the business and the Enterprise Platform implementation project team to carry out end-to-end process mapping and support Risk and Control Matrix (“RACM”) development for the new Enterprise Platform controls. A key work stream of the SCP also relates to the adequacy of ITGCs. The work undertaken as part of the SCP identified a number of areas for improvement in the Group’s ITGCs. A remediation plan was agreed, which forms part of the SCP. Work in this area was carried out under an IT SOX Compliance Group chaired by the Chief Information Security Officer (CISO) reporting to the main SSG.
In the year, the Group has also reviewed its entity-level controls including continued supplementary SOX training plan across relevant parts of the Group. As part of the overall governance, the SSG continues to monitor potential adverse impacts of organisational change to the SCP.
In the 2020 Form 20-F the Group reported certain weaknesses in its internal control over financial reporting, which under Public Company Accounting Oversight Board auditing standards were considered to be a material weakness. The material weakness related to the fact that Company did not have adequate controls at that time surrounding existing IT applications, in particular regarding change management and access control. These controls and control deficiencies were then superseded in the year by the controls on the Enterprise Platform.
Remediation
The Group continues its work under the SCP to remediate the material weakness and other control deficiencies, and any other matters, which arise during its progress towards SOX compliance. As the business commenced the new financial year operating on the Enterprise Platform it has also been able to implement an enhanced testing program for year ended October 31, 2022.
To maintain the required control environment the Group relies upon automated, semi-automated and manual controls together with a combination of preventative and detective controls. The material weakness, control deficiencies and other matters may not be able to be remediated by October 31, 2022, and there is a risk that other deficiencies for the purposes of SOX may be identified. Failure to correct the material weakness, or our failure to discover and address any other material weakness or control deficiencies, could result in inaccuracies in our financial statements, and impair our ability to comply with applicable financial reporting requirements and related regulatory filings on a timely basis. It could also result in an adverse reaction in the financial markets due to a loss of confidence in the reliability of the Group’s financial statements and could have a material adverse effect on the Group’s business, financial condition, results of operation and prospects.
The Audit Committee includes Richard Atkins who, in the opinion of the Board, is an ‘audit committee financial expert’ and is independent (as defined for this purpose in 17 CFR 240.10A-3). The board considered that the Committee’s members have broad commercial knowledge and extensive business leadership experience, having held between them various roles in major business, financial management, and finance function supervision and that this constitutes a broad suitable mix of business and financial experience on the committee.
Micro Focus has adopted an updated code of ethics in the year ended April 30, 2017, beforeOctober 31, 2021 (the Micro Focus Code of Conduct) which applies to all employees including the effectsChief Executive Officer and Chief Financial Officer and other senior financial management. This code of ethics is available on our website (https://www.microfocus.com/media/guide/micro_focus_code_of_conduct_guide.pdf). The information on our website is not incorporated by reference into this report.
The Code of Ethics is included as Exhibit 11.1 MF Code of Conduct Guide.
During the years ended October 31, 2021, 2020 and 2019, the Group obtained the following services from the Group’s auditors as detailed below:
Year ended October 31, 2021 | Year ended October 31, 2020 | Year ended October 31, 2019 | ||||||||||
| $m | $m | $m | ||||||||||
| Audit of Company | 8.0 | 7.2 | 12.8 | |||||||||
| ICOFR | 4.7 | 2.7 | 3.0 | |||||||||
| Audit of subsidiaries | 2.8 | 2.9 | 3.9 | |||||||||
| Total audit fees | 15.5 | 12.8 | 19.7 | |||||||||
| Audit-related assurance fees | 0.5 | 0.6 | 0.6 | |||||||||
| Other assurance services | - | - | - | |||||||||
| Total audit related fees | 0.5 | 0.6 | 0.6 | |||||||||
| Tax compliance services | - | - | - | |||||||||
| Tax advisory services | - | - | 0.1 | |||||||||
| Tax fees | - | - | 0.1 | |||||||||
| All other fees | - | - | - | |||||||||
| Total | 16.0 | 13.4 | 20.4 | |||||||||
The fees represent fees paid to KPMG LLP, as the current auditor.
There were no other fees in the years ended October 31, 2021, 2020 and 2019.
Independence and objectivity of the adjustments to retrospectively reflect discontinued operations as described in Note 37external auditors
The Audit Committee approves all non-audit work commissioned from the external auditors. The committee is responsible for safeguarding the independence and before the effectsobjectivity of the adjustmentsexternal auditors and has developed a robust policy designed to retrospectively reflectensure that this is not compromised. As explained above, the committee manages the risks that the external auditors undertake inappropriate non- audit work, or earn material levels of fees for non-audit services. It also considers the standing and experience of the external audit partner and takes comfort from the fact that KPMG took office relatively recently and from the external auditors’ confirmation that they have complied with relevant UK and US independence standards.
The committee is satisfied that the independence and objectivity of the external auditors has been maintained throughout the year ended October 31, 2021 and to the date of this report.
Not applicable.
The purchase of shares shown in the table below were made on behalf of the Group’s all-employee share plans (a Sharesave plan and an Employee Stock Purchase Plan see Item 6E for further details on these plans) by the Micro Focus Employee benefit trust (“EBT”). The EBT is included in the consolidated financial statements in Item 18 therefore these purchases are treated as Treasury shares; however, they are owned by the EBT and can only be used to settle employee benefits for eligible employees.
| Period | Total Number of Shares purchased | Average price paid per share | Total Number of Shares purchased as part of publicly announced plans or programs | Maximum number of Shares that may yet be purchased under the plans or programs | ||||||||||||
| November 1, 2020 to November 30, 2020 | - | - | - | - | ||||||||||||
| December 1, 2020 to December 31, 2020 | - | - | - | - | ||||||||||||
| January 1, 2021 to January 31, 2021 | - | - | - | - | ||||||||||||
| February 1, 2021 to February 28, 2021 | - | - | - | - | ||||||||||||
| March 1, 2021 to March 31, 2021 | 4,000,000 | 1 | $ | 6.81 | - | - | ||||||||||
| April 1, 2021 to April 30, 2021 | - | - | - | - | ||||||||||||
| May 1, 2021 to May 31, 2021 | - | - | - | - | ||||||||||||
| June 1, 2021 to June 30, 2021 | - | - | - | - | ||||||||||||
| July 1, 2021 to July 31, 2021 | - | - | - | - | ||||||||||||
| August 1, 2021 to August 31, 2021 | - | - | - | - | ||||||||||||
| September 1, 2021 to September 30, 2021 | - | - | - | - | ||||||||||||
| October 1, 2021 to October 31, 2021 | - | - | - | - | ||||||||||||
| Total | 4,000,000 | $ | 6.81 | - | - | |||||||||||
1 During the year ended October 31, 2021 the Micro Focus Employee Benefit Trust (“EBT”) purchased four million of the Group’s shares in open-market transactions. The EBT will hold these shares to satisfy future exercises of share options.
Not applicable.
Principles
Micro Focus International plc (the “Company”) has a primary listing on the London Stock Exchange. As such, it is required to comply with the UK Corporate Governance Code (the “Code”). For the year ended October 31, 2021 this was the edition of the Code published by the UK’s Financial Reporting Council in July 2018.
The Company’s ADSs are listed on the NYSE. As a Foreign Private Issuer, we are required to comply with some, but not all, of the NYSE’s corporate governance rules, and are required to disclose any significant ways in which the UK corporate governance practices employed by the Company differ from those followed by US companies under the NYSE Listed Company Manual.
The directors are committed to ensuring that the Company operates in compliance with the main principles of the Code, as this provides a robust governance framework in support of the delivery of value to shareholders.
Compliance with the Code
UK listed companies are required to include in their Annual Report a narrative statement of (i) how they have applied the principles of the Code and (ii) whether or not they have complied with each of the provisions of the Code.
Throughout the year ended October 31, 2021 and to the date of this report, the Board considers that the Company has been in compliance with the principles of the Code, and with each of its provisions, save for one element of Provision 38 in relation to the alignment of pension contribution rates. Under Provision 38 the Company is partially compliant with this provision and will be fully compliant in the alignment of pension contribution rates for the executive directors with the wider workforce at the end of 2022. The pension contribution rate for Stephen Murdoch will be aligned at the end of 2022 as set out in the Directors’ Remuneration Policy which was approved by shareholders at the 2020 Annual General. The rate for Matt Ashley is already aligned, and the rates for any new director on joining would be aligned with the wider workforce.
Non-executive directors’ Independence
Each of the non-executive directors who served during the period November 1, 2020 to October 31, 2021, was considered by the Board to be independent. Karen Slatford1 was appointed to the Board in July 2010 and has now served for more than ten years. The Board has specifically considered whether this was likely to affect, or could appear to affect, her independence and concluded that she continued to demonstrate independence in thought and judgement, noting that there were no other relationships or circumstances that could affect her independence. The independent non-executive directors comprise a majority of the Board. In accordance with the Companies Act 2006, the Company has put in place procedures to deal with conflicts of interest, which have operated effectively. The board is aware of the other commitments of its directors and is satisfied that these do not conflict with their duties as directors of the Company. Any changes to these commitments are reported to the board.
The non-executive directors meet together regularly without the presence of executive directors. In addition, the Senior Independent Director meets with the non-executive and executive directors at least once a year to review the performance of the Non-Executive Chairman and to consider whether to recommend his re-election, providing feedback directly to the Chairman.
1 As announced on February 8, 2022, Karen Slatford has informed the Board of her intention to retire as a director of Micro Focus International Plc, following the conclusion of the 2022 Annual General Meeting and consequently will not be seeking re-election.
Committees of the board of directors
The Company has three principal Board committees that are broadly comparable in purpose and composition to those required by NYSE rules for domestic US companies. For instance, the Company has a Nomination (rather than nominating/corporate governance) Committee and a Remuneration (rather than compensation) Committee. The Company also has an Audit Committee, which NYSE rules require for both US companies and foreign private issuers. All the committees are comprised of non-executive directors only and none of the functions of these committees has been delegated to another committee.
Each Board Committee has clearly defined terms of reference approved by the Board setting out their respective authority and duties. The terms of reference for each committee can be found on the Company’s website at https://www.microfocus.com/en-us/governance-policies/committees-of-the-board
Under the US Securities Exchange Act of 1934 and the NYSE Listed Company Manual, the Company is required to have an audit committee that is comprised of at least three members from the independent non-executive directors of the Company’s Board. Our Audit Committee complies, and during the year ended October 31, 2021 has complied, with these requirements. As stated in Item 16.A. above, the Board has determined that Richard Atkins possesses ‘accounting or related financial management expertise’, as required by section 303A.07 (a) of the NYSE Listed Company Manual. Richard Atkins also possesses the financial and audit committee experience set forth in the Code.
The Company’s Audit Committee does not have direct responsibility for the appointment, reappointment or removal of the independent auditors. Instead, it follows the UK Companies Act 2006 by making recommendations to the Board on these matters for it to put forward for shareholder approval at the AGM.
Shareholder approval of equity compensation plans
Under NYSE listing rules, shareholders must be given the opportunity to vote on all equity-compensation plans and material revisions thereto, except for employment inducement awards, certain grants, plans and amendments in the context of mergers and acquisitions, and certain specific types of plans. The Company complies with corresponding UK requirements in the Listing Rules, requiring the Company to seek shareholder approval for employee share schemes and significant changes to existing schemes, save in circumstances permitted by the Listing Rules (Listing Rule 9.4.1). The Board, however, does not explicitly take into consideration the NYSE’s detailed definition of what are considered ‘material revisions’.
Corporate Governance Guidelines
Section 303A.09 of the NYSE Listed Company Manual requires listed companies to adopt and disclose corporate governance guidelines. As noted above, in line with its obligations under the UK’s Listing Rules the Company applies the UK Corporate Governance Code and, as required by the Listing Rules, the UK Annual Report contains an explanation of (i) how it has applied the principles of the Code, and (ii) whether it complies in full with the Code’s provisions, or, where it does not, providing an explanation of any non-compliance and the reasons for this (LR 9.8.6).
In addition, the Company is required to make certain mandatory corporate governance statements in accordance with the UK Listing Authority’s Disclosure Guidance and Transparency Rules, DTR 7, which are also included in the Group’s UK Annual Report and Accounts available on the Group’s website https://www.microfocus.com/en-us/investors/investor-download-centre.
Code of Business Conduct and Ethics
The Micro Focus Code of Conduct is available on the Company’s website at www.microfocus.com.
Not applicable.
Not applicable.
Not applicable.
The financial statements filed as part of this Annual Report on Form 20-F are included in Item 18 on pages F-1 through F-92 hereof.
The following exhibits are filed as part of this report:
| Description of the rights of each class of securities registered under Section 12 of the Exchange Act | ||
| Credit Agreement amendments, among Micro Focus International plc, Micro Focus Group Limited, MA FinanceCo., LLC, the Lenders party thereto and JPMorgan Chase Bank, N.A., as Administrative Agent and Collateral Agent. | ||
| Credit Agreement amendments, among Micro Focus International plc, Micro Focus Group Limited, Seattle Spinco, Inc., the Lenders party thereto and JPMorgan Chase Bank, N.A., as Administrative Agent and Collateral Agent. | ||
| Code of conduct | ||
| Certification pursuant to Section 302 of the Sarbanes-Oxley Act of 2002 | ||
| Certification pursuant to Section 302 of the Sarbanes-Oxley Act of 2002 | ||
| Certification of Stephen Murdoch under Section 906 of the Sarbanes-Oxley Act of 2002 | ||
| Certification of Matt Ashley under Section 906 of the Sarbanes-Oxley Act of 2002 | ||
| Consent of KPMG LLP. |
| 101.INS | Inline XBRL Instance Document (the instance document does not appear in the Interactive Date File because its XBRL tags are embedded with the Inline XBRL document) |
| 101.SCH | Inline XBRL Taxonomy Extension Schema Document |
| 101.CAL | Inline XBRL Taxonomy Extension Calculation Linkbase Document |
| 101.DEF | Inline XBRL Taxonomy Extension Definition Linkbase Document |
| 101.LAB | Inline XBRL Taxonomy Extension Label Linkbase Document |
| 101.PRE | Inline XBRL Taxonomy Extension Presentation Linkbase Document |
| 104 | Cover Page Interactive Data File (formatted as Inline XBRL and contained in Exhibit 101) |
Signature
The registrant hereby certifies that it meets all of the requirements for filing on Form 20-F and that it has duly caused and authorized the undersigned to sign this annual report on its behalf.
Micro Focus International plc
/s/ Stephen Murdoch
Stephen Murdoch
Chief Executive Officer
Date: February 24, 2022
Consolidated financial statements and notes
| F-2 | |
| F-4 | |
| F-6 | |
| F-8 | |
| F-11 | |
| F-12 | |
| F-26 |
To the Shareholders and Board of Directors
Micro Focus International plc.:
Opinion on the Consolidated Financial Statements
We have audited the accompanying Consolidated statements of financial position of Micro Focus International plc and subsidiaries (the Company) as of October 31, 2021 and 2020, the related Consolidated statements of comprehensive income, changes in segment reporting as describedequity, and cash flows for each of the years in Note 1,the three‑year period ended October 31, 2021, the summary of significant accounting policies, and the related notes (collectively, the Consolidated financial statements). In our opinion, the Consolidated financial statements present fairly, in all material respects, the financial position of the Company as of October 31, 2021 and 2020, and the results of its operations and its cash flows for each of Micro Focus International plc for the yearyears in the three-year period ended April 30, 2017October 31, 2021 in conformity with International Financial Reporting Standards (“IFRS”) as issued by the International Accounting Standards Board (the 2017 financial statements before(“IASB”).
We also have audited, in accordance with the effectsstandards of the adjustmentsPublic Company Accounting Oversight Board (United States) (PCAOB), the Company’s internal control over financial reporting as of October 31, 2021, based on criteria established in Internal Control – Integrated Framework (2013) issued by the Committee of Sponsoring Organizations of the Treadway Commission, and our report dated February 24, 2022 expressed an adverse opinion on the effectiveness of the Company’s internal control over financial reporting.
Change in Accounting Principle
As discussed in Note 37 and Notenote I.Q, the Company changed its method of accounting for leases as of November 1, are not presented herein). 2019 due to the adoption of IFRS 16, Leases.
Basis for Opinion
These Consolidated financial statements are the responsibility of the Company’s management. Our responsibility is to express an opinion on these Consolidated financial statements based on our audit. audits. We are a public accounting firm registered with the PCAOB and are required to be independent with respect to the Company in accordance with the U.S. federal securities laws and the applicable rules and regulations of the Securities and Exchange Commission and the PCAOB.
We conducted our audit, before the effects of the adjustments described above, of these statementsaudits in accordance with the standards of the Public Company Accounting Oversight Board (United States).PCAOB. Those standards require that we plan and perform the audit to obtain reasonable assurance about whether the Consolidated financial statements are free of material misstatement. An audit includesmisstatement, whether due to error or fraud. Our audits included performing procedures to assess the risks of material misstatement of the Consolidated financial statements, whether due to error or fraud, and performing procedures that respond to those risks. Such procedures included examining, on a test basis, evidence supportingregarding the amounts and disclosures in the Consolidated financial statements, assessingstatements. Our audits also included evaluating the accounting principles used and significant estimates made by management, andas well as evaluating the overall presentation of the Consolidated financial statement presentation.statements. We believe that our audit providesaudits provide a reasonable basis for our opinion.
The critical audit matters communicated below are matters arising from the current period audit of the Consolidated financial statements that were not engagedcommunicated or required to audit, review, or apply any proceduresbe communicated to the adjustmentsaudit committee and that: (1) relate to retrospectively reflect discontinued operationsaccounts or disclosures that are material to theConsolidated financial statements and (2) involved our especially challenging, subjective, or complex judgments. The communication of critical audit matters does not alter in any way our opinion on the Consolidated financial statements, taken as describeda whole, and we are not, by communicating the critical audit matters below, providing separate opinions on the critical audit matters or on the accounts or disclosures to which they relate.
Identification of performance obligations in certain multi-element customer contracts containing licences
As discussed in Note 37 or the adjustments to retrospectively reflect changes in segment reporting as described in Note 1 and accordingly, we do not express an opinion or any other form of assurance about whether such adjustments are appropriate and have been properly applied. Those adjustments were audited by other auditors.
We determined the identification of performance obligations in certain multi-element customer contracts containing licences to be a critical audit matter. Subjective and complex auditor judgement was required to evaluate the Company’s identification of each performance obligation within these contracts.
The following is the primary procedure we performed to address this critical audit matter. We selected certain multi-element customer contracts containing licences and performed an independent analysis of the performance obligations and compared our judgements and conclusions to those made by the Company.
Evaluation of Goodwill Impairment Analysis
As discussed in Note 10 to the Consolidated financial statements, the goodwill balance as at October 31, 2021 was $3,725.5 million, which related to the Company’s single cash generating unit (“CGU”). No impairment was recognized in the period. The Company performs goodwill impairment testing on an annual basis and whenever events or changes in circumstances indicate that the carrying amounts may not be recoverable.
We identified the evaluation of goodwill impairment analysis as a critical audit matter. The estimated recoverable amount of the CGU uses forward-looking estimates that involve a high degree of subjective auditor judgement, in addition to specialized skills and knowledge to evaluate. Specifically, the key assumptions of the discount rate and annual revenue growth rate by product group in the initial five-year forecast (revenue growth rates) were challenging to test as reasonably possible changes to those assumptions had a significant effect on the Company’s assessment of the recoverable amount of the CGU.
The following are the primary procedures we performed to address this critical audit matter.
We compared the Company’s historical annual revenue growth rates to actual results to assess the Company’s ability to accurately forecast future revenue growth.
We evaluated the reasonableness of the Company’s forecasted revenue growth rates by comparing them to previous projections, relevant industry trends and current market indices.
We involved valuation professionals with specialized skills and knowledge, who assisted in evaluating the discount rate used in the valuation against a discount rate range that was independently developed using publicly available market data for comparable companies
/s/ KPMG LLP
We have served as the Company’s auditor since 2017.
London, United Kingdom
February 24, 2022
February 24, 2022
for the 12 monthsYear ended October 31, 20192021
Before exceptional items | Exceptional items (note 4) | Total | ||||||||||||||||||||||||||||||
| Continuing operations | Note | $m | $m | $m | Note | Year ended October 31, 2021 $m | Year ended October 31, 2020 $m | Year ended October 31, 2019 $m | ||||||||||||||||||||||||
| Revenue | 1,2 | 3,348.4 | - | 3,348.4 | 2 | 2,899.9 | 3,001.0 | 3,348.4 | ||||||||||||||||||||||||
| Cost of sales | (777.3 | ) | (12.6 | ) | (789.9 | ) | (776.3 | ) | (702.7 | ) | (789.9 | ) | ||||||||||||||||||||
| Gross profit | 2,571.1 | (12.6 | ) | 2,558.5 | 2,123.6 | 2,298.3 | 2,558.5 | |||||||||||||||||||||||||
| Selling and distribution expenses | (1,216.4 | ) | (8.4 | ) | (1,224.8 | ) | (1,344.6 | ) | (1,112.1 | ) | (1,224.8 | ) | ||||||||||||||||||||
| Research and development expenses | (491.7 | ) | 0.5 | (491.2 | ) | (521.8 | ) | (513.6 | ) | (491.2 | ) | |||||||||||||||||||||
| Administrative expenses | (347.1 | ) | (273.7 | ) | (620.8 | ) | (522.8 | ) | (3,334.0 | ) | (620.8 | ) | ||||||||||||||||||||
| Operating profit | 515.9 | (294.2 | ) | 221.7 | ||||||||||||||||||||||||||||
| Operating loss | (265.6 | ) | (2,661.4 | ) | 221.7 | |||||||||||||||||||||||||||
| Finance costs | 6 | (282.4 | ) | - | (282.4 | ) | 6 | (253.9 | ) | (281.6 | ) | (282.4 | ) | |||||||||||||||||||
| Finance income | 6 | 26.6 | - | 26.6 | 6 | 1.7 | 2.6 | 26.6 | ||||||||||||||||||||||||
| Net finance costs | 6 | (255.8 | ) | - | (255.8 | ) | 6 | (252.2 | ) | (279.0 | ) | (255.8 | ) | |||||||||||||||||||
| Profit/(loss) before tax | 260.1 | (294.2 | ) | (34.1 | ) | |||||||||||||||||||||||||||
| Loss before tax | (517.8 | ) | (2,940.4 | ) | (34.1 | ) | ||||||||||||||||||||||||||
| Taxation | 7 | (38.3 | ) | 54.3 | 16.0 | 7 | 82.7 | (34.2 | ) | 16.0 | ||||||||||||||||||||||
| Profit/(loss) from continuing operations | 221.8 | (239.9 | ) | (18.1 | ) | |||||||||||||||||||||||||||
| Loss from continuing operations | (435.1 | ) | (2,974.6 | ) | (18.1 | ) | ||||||||||||||||||||||||||
| Profit from discontinued operation (attributable to equity shareholders of the Company) | 37 | 28.7 | 1,458.5 | 1,487.2 | 30 | 10.7 | 5.1 | 1,487.2 | ||||||||||||||||||||||||
| Profit for the period | 250.5 | 1,218.6 | 1,469.1 | |||||||||||||||||||||||||||||
| Loss for the year | (424.4 | ) | (2,969.5 | ) | 1,469.1 | |||||||||||||||||||||||||||
| Attributable to: | ||||||||||||||||||||||||||||||||
| Equity shareholders of the Company | 250.2 | 1,218.6 | 1,468.8 | (424.4 | ) | (2,969.5 | ) | 1,468.8 | ||||||||||||||||||||||||
| Non-controlling interests | 0.3 | - | 0.3 | 0 | 0 | 0.3 | ||||||||||||||||||||||||||
| Profit for the period | 250.5 | 1,218.6 | 1,469.1 | |||||||||||||||||||||||||||||
| Loss for the year | (424.4 | ) | (2,969.5 | ) | 1,469.1 | |||||||||||||||||||||||||||
The accompanying notes form part of the financial statements.
Consolidated statement of comprehensive income
for the Year ended October 31, 2021
| Note | Year ended October 31, 2021 | Year ended October 31, 2020 | Year ended October 31, 2019 | |||||||||||||
| (Loss)/profit for the year | (424.4 | ) | (2,969.5 | ) | 1,469.1 | |||||||||||
| Other comprehensive income/(expense) for the year: | ||||||||||||||||
| Items that will not be reclassified to profit or loss | ||||||||||||||||
| Continuing operations: | ||||||||||||||||
| Actuarial gain/(loss) on pension schemes liabilities | 22 | 33.4 | (0.4 | ) | (26.2 | ) | ||||||||||
| Actuarial gain on non-plan pension assets | 22 | 0.2 | 0.4 | 0.3 | ||||||||||||
| Deferred tax movement on pension schemes | 0 | (5.0 | ) | 13.0 | ||||||||||||
| Discontinued operation: | ||||||||||||||||
| Actuarial gain on pension schemes liabilities | 22 | 0 | 0 | 0.1 | ||||||||||||
| Actuarial gain on non-plan pension assets | 22 | 0 | 0 | 0.1 | ||||||||||||
| Currency translation differences - discontinued operation | 0 | 0 | (1.5 | ) | ||||||||||||
| Continuing operations: Items that may be subsequently reclassified to profit or loss | ||||||||||||||||
| Cash flow hedge movements | 27 | 42.2 | (41.3 | ) | (122.9 | ) | ||||||||||
| Current tax movement on cash flow hedge movements | 27 | (8.0 | ) | 7.8 | 23.3 | |||||||||||
| Deferred tax movement on currency translation differences | (7.8 | ) | (8.7 | ) | 14.0 | |||||||||||
| Current tax movement on Euro loan foreign exchange hedging | 6.0 | 0 | 0 | |||||||||||||
| Deferred tax movement on Euro loan foreign exchange hedging | (8.1 | ) | 11.1 | 0 | ||||||||||||
| Currency translation differences | 68.6 | (67.0 | ) | (206.2 | ) | |||||||||||
| Other comprehensive income/(expense) for the year | 126.5 | (103.1 | ) | (306.0 | ) | |||||||||||
| Total comprehensive expense for the year | (297.9 | ) | (3,072.6 | ) | 1,163.1 | |||||||||||
| Attributable to: | ||||||||||||||||
| Equity shareholders of the Company | (297.9 | ) | (3,072.6 | ) | 1,162.8 | |||||||||||
| Non-controlling interests | 0 | 0 | 0.3 | |||||||||||||
| Total comprehensive expense for the year | (297.9 | ) | (3,072.6 | ) | 1,163.1 | |||||||||||
| Total comprehensive (expense)/income attributable to the equity shareholders of the Company arises from: | ||||||||||||||||
| Continuing operations | (308.6 | ) | (3,077.7 | ) | (322.8 | ) | ||||||||||
| Discontinued operation | 10.7 | 5.1 | 1,485.9 | |||||||||||||
| Total comprehensive expense for the year | (297.9 | ) | (3,072.6 | ) | 1,163.1 | |||||||||||
| Earnings per share (cents) | ||||||||||||||||
| From continuing and discontinued operations | cents | cents | cents | |||||||||||||
| - basic | 9 | (126.12 | ) | (884.63 | ) | 388.50 | ||||||||||
| - - diluted | (126.12 | ) | (884.63 | ) | 384.35 | |||||||||||
| From continuing operations | ||||||||||||||||
| - basic | 9 | (129.30 | ) | (886.15 | ) | (4.87 | ) | |||||||||
| - - diluted | (129.30 | ) | (886.15 | ) | (4.87 | ) | ||||||||||
| Earnings per share (pence) | ||||||||||||||||
| From continuing and discontinued operations | Pence | |||||||||||||||
| - basic | 9 | (91.78 | ) | (692.26 | ) | 305.07 | ||||||||||
| - - diluted | (91.78 | ) | (692.26 | ) | 301.81 | |||||||||||
| From continuing operations | ||||||||||||||||
| - basic | 9 | (94.09 | ) | (693.45 | ) | (3.82 | ) | |||||||||
| - - diluted | (94.09 | ) | (693.45 | ) | (3.82 | ) | ||||||||||
The accompanying notes form part of the financial statements.
Consolidated statement of comprehensive income continuedfinancial position
Before exceptional items | Exceptional items (note 4) | Total | ||||||||||||||
| Continuing operations | Note | $m | $m | $ | $m | |||||||||||
| Profit for the period | 250.5 | 1,218.6 | 1,469.1 | |||||||||||||
| Other comprehensive (expense)/income: | ||||||||||||||||
| Items that will not be reclassified to profit or loss | ||||||||||||||||
| Continuing operations: | ||||||||||||||||
| Actuarial loss on pension schemes liabilities | 25 | (26.2 | ) | - | (26.2 | ) | ||||||||||
| Actuarial gain on non-plan pension assets | 25 | 0.3 | - | 0.3 | ||||||||||||
| Deferred tax movement | 13.0 | - | 13.0 | |||||||||||||
| Discontinued operation: | ||||||||||||||||
| Actuarial gain on pension schemes liabilities | 25 | 0.1 | - | 0.1 | ||||||||||||
| Actuarial gain on non-plan pension assets | 25 | 0.1 | - | 0.1 | ||||||||||||
| Deferred tax movement | - | - | - | |||||||||||||
| Currency translation differences - discontinued operation | - | (1.5 | ) | (1.5 | ) | |||||||||||
| Items that may be subsequently reclassified to profit or loss | ||||||||||||||||
| Cash flow hedge movements | 31 | (122.9 | ) | - | (122.9 | ) | ||||||||||
| Current tax movement | 31 | 23.3 | - | 23.3 | ||||||||||||
| Deferred tax movement | 14.0 | - | 14.0 | |||||||||||||
| Currency translation differences - continuing operations | 10, 11 | (206.2 | ) | - | (206.2 | ) | ||||||||||
| Other comprehensive expense for the period | (304.5 | ) | (1.5 | ) | (306.0 | ) | ||||||||||
| Total comprehensive (expense)/income for the period | (54.0 | ) | 1,217.1 | 1,163.1 | ||||||||||||
| Attributable to: | ||||||||||||||||
| Equity shareholders of the Company | (54.3 | ) | 1,217.1 | 1,162.8 | ||||||||||||
| Non-controlling interests | 0.3 | - | 0.3 | |||||||||||||
| Total comprehensive (expense)/income for the period | (54.0 | ) | 1,217.1 | 1,163.1 | ||||||||||||
| Total comprehensive income attributable to the equity shareholders of the Company arises from: | ||||||||||||||||
| Continuing operations | (82.9 | ) | (239.9 | ) | (322.8 | ) | ||||||||||
| Discontinued operations | 28.9 | 1,457.0 | 1,485.9 | |||||||||||||
| (54.0 | ) | 1,217.1 | 1,163.1 | |||||||||||||
| Earnings per share (cents) | ||||||||||||||||
| From continuing and discontinued operations | cents | |||||||||||||||
| - basic | 9 | 388.50 | ||||||||||||||
| - diluted | 9 | 384.35 | ||||||||||||||
| From continuing operations | ||||||||||||||||
| - basic | 9 | (4.87 | ) | |||||||||||||
| - diluted | 9 | (4.87 | ) | |||||||||||||
| Earnings per share (pence) | ||||||||||||||||
| From continuing and discontinued operations | pence | |||||||||||||||
| - basic | 9 | 305.07 | ||||||||||||||
| - diluted | 9 | 301.81 | ||||||||||||||
| From continuing operations | ||||||||||||||||
| - basic | 9 | (3.82 | ) | |||||||||||||
| - diluted | 9 | (3.82 | ) | |||||||||||||
| Note | October 31, 2021 $m | October 31, 2020 $m | ||||||||||
| Non-current assets | ||||||||||||
Goodwill | 10 | 3,725.5 | 3,835.4 | |||||||||
Other intangible assets | 11 | 4,331.2 | 5,383.0 | |||||||||
Property, plant and equipment | 12 | 75.4 | 93.7 | |||||||||
Right-of-use assets | 19 | 153.2 | 207.2 | |||||||||
Long-term pension assets | 22 | 17.1 | 18.2 | |||||||||
Contract-related costs | 15 | 31.9 | 35.7 | |||||||||
Non-current tax receivable | 7 | 48.0 | 0 | |||||||||
Deferred tax asset | 7 | 15.0 | 0 | |||||||||
Other non-current assets | 13 | 42.2 | 31.8 | |||||||||
| 8,439.5 | 9,605.0 | |||||||||||
| Current assets | ||||||||||||
Trade and other receivables | 14 | 886.3 | 731.4 | |||||||||
Contract-related costs | 15 | 33.0 | 27.9 | |||||||||
Current tax receivables | 7 | 59.1 | 45.3 | |||||||||
Cash and cash equivalents | 16 | 558.4 | 737.2 | |||||||||
| 1,536.8 | 1,541.8 | |||||||||||
Current assets classified as held for sale | 30 | 370.3 | 0 | |||||||||
| 1,907.1 | 1,541.8 | |||||||||||
| Total assets | 10,346.6 | 11,146.8 | ||||||||||
| Current liabilities | ||||||||||||
Trade and other payables | 17 | 513.0 | 503.5 | |||||||||
Borrowings | 18 | 24.3 | 21.4 | |||||||||
Lease obligations | 19 | 74.9 | 82.2 | |||||||||
Provisions | 21 | 65.7 | 49.7 | |||||||||
Current tax liabilities | 7 | 94.1 | 150.1 | |||||||||
Derivative liability | 24 | 35.7 | 0 | |||||||||
Contract liabilities | 20 | 984.6 | 981.4 | |||||||||
Other current liabilities | 0.2 | 0 | ||||||||||
| 1,792.5 | 1,788.3 | |||||||||||
Current liabilities classified as held for sale | 30 | 68.4 | 0 | |||||||||
| 1,860.9 | 1,788.3 | |||||||||||
The accompanying notes form part of the financial statements.
Consolidated statement of financial position continued
| October 31, 2021 | October 31, 2020 | ||||||||||
| Note | $m | $m | |||||||||
| Non-current liabilities | |||||||||||
Contract liabilities | 20 | 131.8 | 117.2 | ||||||||
Borrowings | 18 | 4,524.1 | 4,618.9 | ||||||||
Lease obligations | 19 | 119.6 | 168.2 | ||||||||
Derivative liability | 24 | 0 | 77.9 | ||||||||
Retirement benefit obligations | 22 | 147.1 | 155.0 | ||||||||
Provisions | 21 | 19.8 | 22.5 | ||||||||
Other non-current liabilities | 23 | 31.3 | 39.9 | ||||||||
Non-current tax liabilities | 7 | 91.9 | 102.7 | ||||||||
Deferred tax liabilities | 7 | 599.1 | 841.1 | ||||||||
| 5,664.7 | 6,143.4 | ||||||||||
| Total liabilities | 7,525.6 | 7,931.7 | |||||||||
| Net assets | 2,821.0 | 3,215.1 | |||||||||
| Capital and reserves | |||||||||||
Share capital | 25 | 47.4 | 47.3 | ||||||||
Share premium account | 26 | 46.8 | 46.5 | ||||||||
Merger reserve | 27 | 1,659.1 | 1,767.4 | ||||||||
Capital redemption reserve | 27 | 2,485.0 | 2,485.0 | ||||||||
Hedging reserve | 27 | (28.9) | (63.1) | ||||||||
Retained earnings | (1,120.4) | (741.3) | |||||||||
Foreign currency translation reserve | (268.0) | (326.7) | |||||||||
| Total equity attributable to owners of the parent | 2,821.0 | 3,215.1 | |||||||||
| Total equity | 2,821.0 | 3,215.1 | |||||||||
The accompanying notes form part of the financial statements.
For the Year ended October 31, 2021
| Share capital | Share premium account | Retained earnings | Foreign currency translation reserve | Capital redemption reserves | Hedging reserve | Merger reserve | Total equity attributable to owners of the parent | Total equity | ||||||||||||||||||||||||||||||||
| Note | $m | $m | $m | $m | $m | $m | $m | $m | $m | |||||||||||||||||||||||||||||||
| Balance as at November 1, 2020 | 47.3 | 46.5 | (741.3 | ) | (326.7 | ) | 2,485.0 | (63.1 | ) | 1,767.4 | 3,215.1 | 3,215.1 | ||||||||||||||||||||||||||||
| Loss for the financial year | 0 | 0 | (424.4 | ) | 0 | 0 | 0 | 0 | (424.4 | ) | (424.4 | ) | ||||||||||||||||||||||||||||
| Other comprehensive income for the year | 0 | 0 | 33.6 | 58.7 | 0 | 34.2 | 0 | 126.5 | 126.5 | |||||||||||||||||||||||||||||||
| Total comprehensive expense for the year | 0 | 0 | (390.8 | ) | 58.7 | 0 | 34.2 | 0 | (297.9 | ) | (297.9 | ) | ||||||||||||||||||||||||||||
| Transactions with owners | ||||||||||||||||||||||||||||||||||||||||
| Dividends | 8 | 0 | 0 | (81.1 | ) | 0 | 0 | 0 | 0 | (81.1 | ) | (81.1 | ) | |||||||||||||||||||||||||||
| Share options: | ||||||||||||||||||||||||||||||||||||||||
| Issue of share capital – share options | 25,26 | 0.1 | 0.3 | (0.1 | ) | 0 | 0 | 0 | 0 | 0.3 | 0.3 | |||||||||||||||||||||||||||||
| Share-based payment charge | 28 | 0 | 0 | 12.0 | 0 | 0 | 0 | 0 | 12.0 | 12.0 | ||||||||||||||||||||||||||||||
| Deferred tax on share options | 7 | 0 | 0 | (0.2 | ) | 0 | 0 | 0 | 0 | (0.2 | ) | (0.2 | ) | |||||||||||||||||||||||||||
Purchase of Treasury Shares1 | 0 | 0 | (27.2 | ) | 0 | 0 | 0 | 0 | (27.2 | ) | (27.2 | ) | ||||||||||||||||||||||||||||
| Transfer from merger reserve | 27 | 0 | 0 | 108.3 | 0 | 0 | 0 | (108.3 | ) | 0 | 0 | |||||||||||||||||||||||||||||
| Total movements for the year | 0.1 | 0.3 | (379.1 | ) | 58.7 | 0 | 34.2 | (108.3 | ) | (394.1 | ) | (394.1 | ) | |||||||||||||||||||||||||||
| Balance as at October 31, 2021 | 47.4 | 46.8 | (1,120.4 | ) | (268.0 | ) | 2,485.0 | (28.9 | ) | 1,659.1 | 2,821.0 | 2,821.0 | ||||||||||||||||||||||||||||
1 | During the 12 months ended October 31, 2021 the Micro Focus Employee Benefit Trust (“EBT”) purchased 4 million of the Group’s shares from the market. The EBT will hold these shares to satisfy future exercises of share options. In accordance with the requirement of IFRS 10 the EBT is treated as if it is a subsidiary of the Group. As a result, the purchase of shares held by the EBT is reported as a purchase of Treasury shares by the Group. |
The accompanying notes form part of the financial statements.
Consolidated statement of changes in equity
For the Year ended October 31, 2020
Share capital | Share premium account | Retained earnings | Foreign currency translation reserve | Capital redemption reserves | Hedging reserve | Merger reserve | Total equity attributable to owners of the parent | Non- controlling interests | Total equity | |||||||||||||||||||||||||||||||||||
| Note | $m | $m | $m | $m | $m | $m | $m | $m | $m | $m | ||||||||||||||||||||||||||||||||||
| Balance as at November 1, 2019 | 47.2 | 44.0 | 2,250.7 | (262.1 | ) | 2,485.0 | (29.6 | ) | 1,739.8 | 6,275.0 | 1.3 | 6,276.3 | ||||||||||||||||||||||||||||||||
| Impact of adoption of IFRS 16 | 0 | 0 | (8.4 | ) | 0 | 0 | 0 | 0 | (8.4 | ) | 0 | (8.4 | ) | |||||||||||||||||||||||||||||||
| Revised balance at November 1, 2019 | 47.2 | 44.0 | 2,242.3 | (262.1 | ) | 2,485.0 | (29.6 | ) | 1,739.8 | 6,266.6 | 1.3 | 6,267.9 | ||||||||||||||||||||||||||||||||
| Loss for the financial year | 0 | 0 | (2,969.5 | ) | 0 | 0 | 0 | 0 | (2,969.5 | ) | 0 | (2,969.5 | ) | |||||||||||||||||||||||||||||||
| Other comprehensive expense for the year | 0 | 0 | (5.0 | ) | (64.6 | ) | 0 | (33.5 | ) | 0 | (103.1 | ) | 0 | (103.1 | ) | |||||||||||||||||||||||||||||
| Total comprehensive expense for the year | 0 | 0 | (2,974.5 | ) | (64.6 | ) | 0 | (33.5 | ) | 0 | (3,072.6 | ) | 0 | (3,072.6 | ) | |||||||||||||||||||||||||||||
| Share options: | ||||||||||||||||||||||||||||||||||||||||||||
| Issue of share capital – share options | 25,26 | 0.1 | 2.5 | 0.3 | 0 | 0 | 0 | 0 | 2.9 | 0 | 2.9 | |||||||||||||||||||||||||||||||||
| Share-based payment charge | 28 | 0 | 0 | 18.3 | 0 | 0 | 0 | 0 | 18.3 | 0 | 18.3 | |||||||||||||||||||||||||||||||||
| Current tax on share options | 7 | 0 | 0 | 0.1 | 0 | 0 | 0 | 0 | 0.1 | 0 | 0.1 | |||||||||||||||||||||||||||||||||
| Deferred tax on share options | 7 | 0 | 0 | (1.5 | ) | 0 | 0 | 0 | 0 | (1.5 | ) | 0 | (1.5 | ) | ||||||||||||||||||||||||||||||
| Purchase of remaining non-controlling interest | 0 | 0 | 1.3 | 0 | 0 | 0 | 0 | 1.3 | (1.3 | ) | 0 | |||||||||||||||||||||||||||||||||
| Transfer to merger reserve | 27 | 0 | 0 | (27.6 | ) | 0 | 0 | 0 | 27.6 | 0 | 0 | 0 | ||||||||||||||||||||||||||||||||
| Total movements for the year | 0.1 | 2.5 | (2,983.6 | ) | (64.6 | ) | 0 | (33.5 | ) | 27.6 | (3,051.5 | ) | (1.3 | ) | (3,052.8 | ) | ||||||||||||||||||||||||||||
| Balance as at October 31, 2020 | 47.3 | 46.5 | (741.3 | ) | (326.7 | ) | 2,485.0 | (63.1 | ) | 1,767.4 | 3,215.1 | 0 | 3,215.1 | |||||||||||||||||||||||||||||||
Consolidated statement of comprehensive incomechanges in equity
For the 18 monthsYear ended October 31, 201820191
Before exceptional items | Exceptional items (note 4) | Total | ||||||||||||||
| Continuing operations | Note | $m | $m | $m | ||||||||||||
| Revenue | 1,2 | 4,754.4 | - | 4,754.4 | ||||||||||||
| Cost of sales | (1,237.3 | ) | (65.4 | ) | (1,302.7 | ) | ||||||||||
| Gross profit | 3,517.1 | (65.4 | ) | 3,451.7 | ||||||||||||
| Selling and distribution costs | (1,725.0 | ) | (39.2 | ) | (1,764.2 | ) | ||||||||||
| Research and development expenses | (663.4 | ) | (17.4 | ) | (680.8 | ) | ||||||||||
| Administrative expenses | (213.7 | ) | (416.2 | ) | (629.9 | ) | ||||||||||
| Operating profit | 915.0 | (538.2 | ) | 376.8 | ||||||||||||
| Finance costs | 6 | (344.0 | ) | (6.4 | ) | (350.4 | ) | |||||||||
| Finance income | 6 | 7.1 | 0.6 | 7.7 | ||||||||||||
| Net finance costs | 6 | (336.9 | ) | (5.8 | ) | (342.7 | ) | |||||||||
| Profit/(loss) before tax | 578.1 | (544.0 | ) | 34.1 | ||||||||||||
| Taxation | 7 | (125.1 | ) | 798.2 | 673.1 | |||||||||||
| Profit from continuing operations | 453.0 | 254.2 | 707.2 | |||||||||||||
| Profit from discontinued operation (attributable to equity shareholders of the Company) | 37 | 76.9 | - | 76.9 | ||||||||||||
| Profit for the period | 529.9 | 254.2 | 784.1 | |||||||||||||
| Attributable to: | ||||||||||||||||
| Equity shareholders of the Company | 529.8 | 254.2 | 784.0 | |||||||||||||
| Non-controlling interests | 0.1 | - | 0.1 | |||||||||||||
| Profit for the period | 529.9 | 254.2 | 784.1 | |||||||||||||
Share capital | Share premium account | Retained earnings | Foreign currency translation reserve | Capital redemption reserves | Hedging reserve | Merger reserve | Total equity attributable to owners of the parent | Non- controlling interests | Total equity | |||||||||||||||||||||||||||||||||||
| Note | $m | $m | $m | $m | $m | $m | $m | $m | $m | $m | ||||||||||||||||||||||||||||||||||
| Balance as at November 1, 2018 | 65.8 | 41.0 | 3,275.2 | (51.7 | ) | 666.3 | 70.0 | 3,724.4 | 7,791.0 | 1.0 | 7,792.0 | |||||||||||||||||||||||||||||||||
| Impact of adoption of IFRS 15 | 0 | 0 | 52.4 | 0 | 0 | 0 | 0 | 52.4 | 0 | 52.4 | ||||||||||||||||||||||||||||||||||
| Impact of adoption of IFRS 9 | 0 | 0 | (15.6 | ) | 0 | 0 | 0 | 0 | (15.6 | ) | 0 | (15.6 | ) | |||||||||||||||||||||||||||||||
| Revised balance at November 1, 2018 | 65.8 | 41.0 | 3,312.0 | (51.7 | ) | 666.3 | 70.0 | 3,724.4 | 7,827.8 | 1.0 | 7,828.8 | |||||||||||||||||||||||||||||||||
| Profit for the year | 0 | 0 | 1,468.8 | 0 | 0 | 0 | 0 | 1,468.8 | 0.3 | 1,469.1 | ||||||||||||||||||||||||||||||||||
| Other comprehensive income/(expense) for the year | 0 | 0 | 4.0 | (210.4 | ) | 0 | (99.6 | ) | 0 | (306.0 | ) | 0 | (306.0 | ) | ||||||||||||||||||||||||||||||
| Total comprehensive income/(expense) for the year | 0 | 0 | 1,472.8 | (210.4 | ) | 0 | (99.6 | ) | 0 | 1,162.8 | 0.3 | 1,163.1 | ||||||||||||||||||||||||||||||||
| Transactions with owners: | ||||||||||||||||||||||||||||||||||||||||||||
| Dividends | 8 | 0 | 0 | (439.2 | ) | 0 | 0 | 0 | 0 | (439.2 | ) | 0 | (439.2 | ) | ||||||||||||||||||||||||||||||
| Share options: | ||||||||||||||||||||||||||||||||||||||||||||
| Issue of share capital – share options | 25,26 | 0.1 | 3.0 | (3.8 | ) | 0 | 0 | 0 | 0 | (0.7 | ) | 0 | (0.7 | ) | ||||||||||||||||||||||||||||||
| Share-based payment charge | 28 | 0 | 0 | �� | 64.5 | 0 | 0 | 0 | 0 | 64.5 | 0 | 64.5 | ||||||||||||||||||||||||||||||||
| Current tax on share options | 7 | 0 | 0 | 13.1 | 0 | 0 | 0 | 0 | 13.1 | 0 | 13.1 | |||||||||||||||||||||||||||||||||
| Deferred tax on share options | 7 | 0 | 0 | (7.6 | ) | 0 | 0 | 0 | 0 | (7.6 | ) | 0 | (7.6 | ) | ||||||||||||||||||||||||||||||
| Share reorganization and buy-back: | ||||||||||||||||||||||||||||||||||||||||||||
| Return of Value – share consolidation | (18.7 | ) | 0 | 0 | 0 | 18.7 | 0 | 0 | 0 | 0 | 0 | |||||||||||||||||||||||||||||||||
| Expenses relating to Return of Value | 27 | 0 | 0 | (1.0 | ) | 0 | 0 | 0 | 0 | (1.0 | ) | 0 | (1.0 | ) | ||||||||||||||||||||||||||||||
| Issue and redemption of B shares | 25 | 0 | 0 | (1,800.0 | ) | 0 | 1,800.0 | 0 | (1,800.0 | ) | (1,800.0 | ) | 0 | (1,800.0 | ) | |||||||||||||||||||||||||||||
| Share buy-back | 25 | 0 | 0 | (544.7 | ) | 0 | 0 | 0 | 0 | (544.7 | ) | 0 | (544.7 | ) | ||||||||||||||||||||||||||||||
| Transfer from merger reserve | 27 | 0 | 0 | 184.6 | 0 | 0 | 0 | (184.6 | ) | 0 | 0 | 0 | ||||||||||||||||||||||||||||||||
| Total movements for the year | (18.6 | ) | 3.0 | (1,061.3 | ) | (210.4 | ) | 1,818.7 | (99.6 | ) | (1,984.6 | ) | (1,552.8 | ) | 0.3 | (1,552.5 | ) | |||||||||||||||||||||||||||
| Balance as at October 31, 2019 | 47.2 | 44.0 | 2,250.7 | (262.1 | ) | 2,485.0 | (29.6 | ) | 1,739.8 | 6,275.0 | 1.3 | 6,276.3 | ||||||||||||||||||||||||||||||||
1 | In accordance with the requirements of IFRS 16 “Leases” the results for the Year ended October 31, 2019 have not been restated. |
The accompanying notes form part of these financial statements.
Year ended October 31, 2021 | Year ended October 31, 2020 | Year ended October 31, 20191 | ||||||||||||||
| Note | $m | $m | $m | |||||||||||||
| Cash flows from operating activities | ||||||||||||||||
| Cash generated from operations | 32 | 690.5 | 1,082.8 | 1,056.3 | ||||||||||||
| Interest paid | (218.1 | ) | (207.1 | ) | (227.1 | ) | ||||||||||
| Bank loan costs | (1.5 | ) | (47.9 | ) | 0 | |||||||||||
| Tax paid | (270.3 | ) | (149.6 | ) | (167.4 | ) | ||||||||||
| Net cash generated from operating activities | 200.6 | 678.2 | 661.8 | |||||||||||||
| Cash flows from investing activities | ||||||||||||||||
| Payments for intangible assets | 11 | (47.5 | ) | (60.6 | ) | (29.3 | ) | |||||||||
| Purchase of property, plant and equipment | 12 | (17.7 | ) | (26.3 | ) | (56.3 | ) | |||||||||
| Interest received | 1.7 | 2.4 | 26.6 | |||||||||||||
| Payment for acquisition of business and net cash acquired with acquisitions | 31 | (12.4 | ) | (6.0 | ) | (89.0 | ) | |||||||||
| Net cash acquired with acquisitions | 0 | 0 | 1.2 | |||||||||||||
| Investing cash flows generated from disposals | 30 | 0 | 1.3 | 20.0 | ||||||||||||
| Investing cash flows generated from discontinued operation, net of cash disposed | 30 | 0 | 0 | 2,473.5 | ||||||||||||
| Tax paid on divestiture gain | 0 | 0 | (264.6 | ) | ||||||||||||
| Net cash (used in)/from investing activities | (75.9 | ) | (89.2 | ) | 2,082.1 | |||||||||||
| Cash flows used in financing activities | ||||||||||||||||
| Proceeds from issue of ordinary share capital | 25,26 | 0.4 | 2.6 | 3.1 | ||||||||||||
| Purchase of treasury shares and related expenses | 25 | (27.2 | ) | 0 | (544.7 | ) | ||||||||||
| Return of Value paid to shareholders | 0 | 0 | (1,800.0 | ) | ||||||||||||
| Expenses relating to Return of Value | 0 | 0 | (1.0 | ) | ||||||||||||
| Payment for lease liabilities | 19 | (79.5 | ) | (80.1 | ) | (12.9 | ) | |||||||||
| Settlement of foreign exchange derivative | 24 | 0 | (21.8 | ) | 0 | |||||||||||
| Repayment of bank borrowings | 18 | (114.1 | ) | (1,589.7 | ) | (212.6 | ) | |||||||||
| Proceeds from bank borrowings | 18 | 0 | 1,490.8 | 0 | ||||||||||||
| Dividends paid to owners | 8 | (81.1 | ) | 0 | (439.2 | ) | ||||||||||
| Net cash used in financing activities | (301.5 | ) | (198.2 | ) | (3,007.3 | ) | ||||||||||
| Effects of exchange rate changes | (2.0 | ) | (9.3 | ) | (1.8 | ) | ||||||||||
| Net (decrease)/increase in cash and cash equivalents | (178.8 | ) | 381.5 | (265.2 | ) | |||||||||||
| Cash and cash equivalents at beginning of year | 737.2 | 355.7 | 620.9 | |||||||||||||
| Cash and cash equivalents at end of year | 16 | 558.4 | 737.2 | 355.7 | ||||||||||||
1 | In accordance with the requirements of IFRS 16 “Leases” the results for the Year ended October 31, 2019 have not been restated. |
Before exceptional items | Exceptional items (note 4) | Total | ||||||||||||||
| Note | $m | $m | $m | |||||||||||||
| Profit for the period | 529.9 | 254.2 | 784.1 | |||||||||||||
| Other comprehensive (expense)/income: | ||||||||||||||||
| Items that will not be reclassified to profit or loss | ||||||||||||||||
| Continuing operations: | ||||||||||||||||
| Actuarial loss on pension schemes liabilities | 25 | (8.9 | ) | - | (8.9 | ) | ||||||||||
| Actuarial loss on non-plan pension assets | 25 | (5.3 | ) | - | (5.3 | ) | ||||||||||
| Deferred tax movement | 3.8 | - | 3.8 | |||||||||||||
| Discontinued operation: | ||||||||||||||||
| Actuarial loss on pension schemes liabilities | 25 | (1.5 | ) | - | (1.5 | ) | ||||||||||
| Actuarial loss on non-plan pension assets | 25 | (0.5 | ) | - | (0.5 | ) | ||||||||||
| Deferred tax movement | 0.5 | - | 0.5 | |||||||||||||
| Items that may be subsequently reclassified to profit or loss | ||||||||||||||||
| Cash flow hedge movements | 31 | 86.4 | - | 86.4 | ||||||||||||
| Current tax movement | 31 | (16.4 | ) | - | (16.4 | ) | ||||||||||
| Currency translation differences - continuing operations | 10 | (29.5 | ) | - | (29.5 | ) | ||||||||||
| Currency translation differences - discontinued operation | 0.7 | - | 0.7 | |||||||||||||
| Other comprehensive income for the period | 29.3 | - | 29.3 | |||||||||||||
| Total comprehensive income for the period | 559.2 | 254.2 | 813.4 | |||||||||||||
| Attributable to: | ||||||||||||||||
| Equity shareholders of the Company | 559.1 | 254.2 | 813.3 | |||||||||||||
| Non-controlling interests | 0.1 | - | 0.1 | |||||||||||||
| Total comprehensive income for the period | 559.2 | 254.2 | 813.4 | |||||||||||||
| Total comprehensive income attributable to the equity shareholders of the Company arises from: | ||||||||||||||||
| Continuing operations | 483.1 | 254.2 | 737.3 | |||||||||||||
| Discontinued operations | 76.1 | - | 76.1 | |||||||||||||
559.2 | 254.2 | 813.4 | ||||||||||||||
| Earnings per share (cents) | ||||||||||||||||
| From continuing and discontinued operations | cents | |||||||||||||||
| - basic | 9 | 201.70 | ||||||||||||||
| - diluted | 9 | 196.17 | ||||||||||||||
| From continuing operations | ||||||||||||||||
| - basic | 9 | 181.91 | ||||||||||||||
| - diluted | 9 | 176.92 | ||||||||||||||
| Earnings per share (pence) | ||||||||||||||||
| From continuing and discontinued operations | pence | |||||||||||||||
| - basic | 9 | 151.61 | ||||||||||||||
| - diluted | 9 | 147.45 | ||||||||||||||
| From continuing operations | ||||||||||||||||
| - basic | 9 | 136.73 | ||||||||||||||
| - diluted | 9 | 132.98 | ||||||||||||||
The accompanying notes form part of these financial statements.
Before exceptional items | Exceptional items (note 4) | Total | ||||||||||||||
| Continuing operations | Note | $m | $m | $m | ||||||||||||
| Revenue | 1,2 | 1,077.3 | - | 1,077.3 | ||||||||||||
| Cost of sales | (213.5 | ) | (2.9 | ) | (216.4 | ) | ||||||||||
| Gross profit | 863.8 | (2.9 | ) | 860.9 | ||||||||||||
| Selling and distribution costs | (357.7 | ) | (5.5 | ) | (363.2 | ) | ||||||||||
| Research and development expenses | (116.0 | ) | (6.8 | ) | (122.8 | ) | ||||||||||
| Administrative expenses | (65.5 | ) | (82.0 | ) | (147.5 | ) | ||||||||||
| Operating profit | 324.6 | (97.2 | ) | 227.4 | ||||||||||||
| Finance costs | 6 | (96.8 | ) | - | (96.8 | ) | ||||||||||
| Finance income | 6 | 1.0 | - | 1.0 | ||||||||||||
| Net finance costs | 6 | (95.8 | ) | - | (95.8 | ) | ||||||||||
| Profit/(loss) before tax | 228.8 | (97.2 | ) | 131.6 | ||||||||||||
| Taxation | 7 | (19.1 | ) | 11.6 | (7.5 | ) | ||||||||||
| Profit/(loss) from continuing operations | 209.7 | (85.6 | ) | 124.1 | ||||||||||||
| Profit from discontinued operation (attributable to equity shareholders of the Company) | 37 | 33.7 | - | 33.7 | ||||||||||||
| Profit/(loss) for the period | 243.4 | (85.6 | ) | 157.8 | ||||||||||||
| Attributable to: | ||||||||||||||||
| Equity shareholders of the Company | 243.5 | (85.6 | ) | 157.9 | ||||||||||||
| Non-controlling interests | (0.1 | ) | - | (0.1 | ) | |||||||||||
| Profit/(loss) for the period | 243.4 | (85.6 | ) | 157.8 | ||||||||||||
Before exceptional items | Exceptional items (note 4) | Total | ||||||||||||||
| Note | $m | $m | $m | |||||||||||||
| Profit for the period | 243.4 | (85.6 | ) | 157.8 | ||||||||||||
| Other comprehensive (expense)/income: | ||||||||||||||||
| Items that will not be reclassified to profit or loss | ||||||||||||||||
| Continuing operations: | ||||||||||||||||
| Actuarial loss on pension schemes liabilities | 25 | (0.2 | ) | - | (0.2 | ) | ||||||||||
| Actuarial gain on non-plan pension assets | 25 | 0.3 | - | 0.3 | ||||||||||||
| Deferred tax movement | (0.1 | ) | - | (0.1 | ) | |||||||||||
| Discontinued operation: | ||||||||||||||||
| Actuarial gain on pension schemes liabilities | 25 | 0.6 | - | 0.6 | ||||||||||||
| Actuarial loss on non-plan pension assets | 25 | (0.2 | ) | - | (0.2 | ) | ||||||||||
| Deferred tax movement | (0.2 | ) | - | (0.2 | ) | |||||||||||
| Items that may be subsequently reclassified to profit or loss | ||||||||||||||||
| Currency translation differences – continuing operations | (4.9 | ) | - | (4.9 | ) | |||||||||||
| Currency translation differences - discontinued operation | (1.0 | ) | - | (1.0 | ) | |||||||||||
| Other comprehensive expense for the period | (5.7 | ) | - | (5.7 | ) | |||||||||||
| Total comprehensive income/(expense) for the period | 237.7 | (85.6 | ) | 152.1 | ||||||||||||
| Attributable to: | ||||||||||||||||
| Equity shareholders of the Company | 237.8 | (85.6 | ) | 152.2 | ||||||||||||
| Non-controlling interests | (0.1 | ) | - | (0.1 | ) | |||||||||||
| Total comprehensive income/(expense) for the period | 237.7 | (85.6 | ) | 152.1 | ||||||||||||
| Total comprehensive income attributable to the equity shareholders of the Company arises from: | ||||||||||||||||
| Continuing operations | 204.8 | (85.6 | ) | 119.2 | ||||||||||||
| Discontinued operations | 32.9 | - | 32.9 | |||||||||||||
237.7 | (85.6 | ) | 152.1 | |||||||||||||
| Earnings per share | ||||||||||||||||
| Earnings per share (cents) | ||||||||||||||||
| From continuing and discontinued operations | cents | |||||||||||||||
| - basic | 9 | 68.88 | ||||||||||||||
| - diluted | 9 | 66.51 | ||||||||||||||
| From continuing operations | ||||||||||||||||
| - basic | 9 | 54.17 | ||||||||||||||
| - diluted | 9 | 52.31 | ||||||||||||||
| Earnings per share (pence) | ||||||||||||||||
| From continuing and discontinued operations | pence | |||||||||||||||
| - basic | 9 | 53.25 | ||||||||||||||
| - diluted | 9 | 51.42 | ||||||||||||||
| From continuing operations | ||||||||||||||||
| - basic | 9 | 41.88 | ||||||||||||||
| - diluted | 9 | 40.44 | ||||||||||||||
| Note | October 31, 2019 $m | October 31, 2018 $m | ||||||||||
| Non-current assets | ||||||||||||
| Goodwill | 10 | 6,671.3 | 6,805.0 | |||||||||
| Other intangible assets | 11 | 5,942.3 | 6,629.3 | |||||||||
| Property, plant and equipment | 12 | 140.5 | 144.3 | |||||||||
| Derivative asset | 27 | - | 86.4 | |||||||||
| Long-term pension assets | 25 | 17.1 | 16.7 | |||||||||
| Contract-related costs | 17 | 31.5 | - | |||||||||
| Other non-current assets | 14 | 44.0 | 38.8 | |||||||||
| 12,846.7 | 13,720.5 | |||||||||||
| Current assets | ||||||||||||
| Inventories | 15 | 0.1 | 0.2 | |||||||||
| Trade and other receivables | 16 | 1,032.9 | 1,272.0 | |||||||||
| Contract-related costs | 17 | 19.3 | - | |||||||||
| Current tax receivables | 22 | 40.1 | 24.5 | |||||||||
| Cash and cash equivalents | 18 | 355.7 | 620.9 | |||||||||
| 1,448.1 | 1,917.6 | |||||||||||
| Current assets classified as held for sale | 37 | - | 1,142.5 | |||||||||
| Total current assets | 1,448.1 | 3,060.1 | ||||||||||
| Total assets | 14,294.8 | 16,780.6 | ||||||||||
| Current liabilities | ||||||||||||
| Trade and other payables | 19 | 611.0 | 676.9 | |||||||||
| Borrowings | 20 | - | 3.7 | |||||||||
| Finance leases | 21 | 11.8 | 13.6 | |||||||||
| Provisions | 24 | 29.3 | 57.4 | |||||||||
| Current tax liabilities | 22 | 104.0 | 124.1 | |||||||||
| Contract liabilities | 23 | 1,045.9 | 1,134.7 | |||||||||
| 1,802.0 | 2,010.4 | |||||||||||
| Current liabilities classified as held for sale | 37 | - | 437.7 | |||||||||
| 1,802.0 | 2,448.1 | |||||||||||
| Non-current liabilities | ||||||||||||
| Contract liabilities | 23 | 149.9 | 178.1 | |||||||||
| Borrowings | 20 | 4,670.7 | 4,842.2 | |||||||||
| Finance leases | 21 | 11.7 | 14.9 | |||||||||
| Derivative liability | 27 | 36.5 | - | |||||||||
| Retirement benefit obligations | 25 | 141.4 | 110.4 | |||||||||
| Provisions | 24 | 49.1 | 35.4 | |||||||||
| Other non-current liabilities | 26 | 50.4 | 58.0 | |||||||||
| Current tax liabilities | 22 | 119.7 | 131.0 | |||||||||
| Deferred tax liabilities | 28 | 987.1 | 1,170.5 | |||||||||
| 6,216.5 | 6,540.5 | |||||||||||
| Total liabilities | 8,018.5 | 8,988.6 | ||||||||||
| Net assets | 6,276.3 | 7,792.0 | ||||||||||
| Note | October 31, 2019 $m | October 31, 2018 $m | ||||||||||
| Capital and reserves | ||||||||||||
| Share capital | 29 | 47.2 | 65.8 | |||||||||
| Share premium account | 30 | 44.0 | 41.0 | |||||||||
| Merger reserve | 31 | 1,739.8 | 3,724.4 | |||||||||
| Capital redemption reserve | 31 | 2,485.0 | 666.3 | |||||||||
| Hedging reserve | 31 | (29.6 | ) | 70.0 | ||||||||
| Retained earnings | 2,250.7 | 3,275.2 | ||||||||||
| Foreign currency translation reserve | (262.1 | ) | (51.7 | ) | ||||||||
| Total equity attributable to owners of the parent | 6,275.0 | 7,791.0 | ||||||||||
| Non-controlling interests | 32 | 1.3 | 1.0 | |||||||||
| Total equity | 6,276.3 | 7,792.0 | ||||||||||
Share capital | Share premium account | Retained earnings | Foreign currency translation reserve | Capital redemption reserves | Hedging reserve | Merger reserve | Total equity attributable to owners of the parent | Non- controlling interests | Total equity | |||||||||||||||||||||||||||||||||||
| Note | $m | $m | $m | $m | $m | $m | $m | $m | $m | $m | ||||||||||||||||||||||||||||||||||
| Balance as at May 1, 2016 | 39.6 | 190.3 | 228.3 | (17.0 | ) | 163.4 | - | 988.1 | 1,592.7 | 1.0 | 1,593.7 | |||||||||||||||||||||||||||||||||
| Profit for the financial period | - | - | 157.9 | - | - | - | - | 157.9 | (0.1 | ) | 157.8 | |||||||||||||||||||||||||||||||||
| Other comprehensive income/(expense) for the period | - | - | 0.2 | (5.9 | ) | - | - | - | (5.7 | ) | - | (5.7 | ) | |||||||||||||||||||||||||||||||
| Total comprehensive income/(expense) for the period | - | - | 158.1 | (5.9 | ) | - | - | - | 152.2 | (0.1 | ) | 152.1 | ||||||||||||||||||||||||||||||||
| Transactions with owners: | ||||||||||||||||||||||||||||||||||||||||||||
| Dividends | 8 | - | - | (177.5 | ) | - | - | - | - | (177.5 | ) | - | (177.5 | ) | ||||||||||||||||||||||||||||||
| Treasury shares purchased | - | - | (7.7 | ) | - | - | - | - | (7.7 | ) | - | (7.7 | ) | |||||||||||||||||||||||||||||||
| Share options: | ||||||||||||||||||||||||||||||||||||||||||||
| Issue of share capital – share options | 29,30 | 0.1 | 1.8 | (0.1 | ) | - | - | - | - | 1.8 | - | 1.8 | ||||||||||||||||||||||||||||||||
| Share-based payment charge | - | - | 24.0 | - | - | - | - | 24.0 | - | 24.0 | ||||||||||||||||||||||||||||||||||
| Current tax on share options | - | - | 4.1 | - | - | - | - | 4.1 | - | 4.1 | ||||||||||||||||||||||||||||||||||
| Deferred tax on share options | - | - | 23.0 | - | - | - | - | 23.0 | - | 23.0 | ||||||||||||||||||||||||||||||||||
| Reallocation of merger reserve | 31 | - | - | 650.0 | - | - | - | (650.0 | ) | - | - | - | ||||||||||||||||||||||||||||||||
| Total movements for the period | 0.1 | 1.8 | 673.9 | (5.9 | ) | - | - | (650.0 | ) | 19.9 | (0.1 | ) | 19.8 | |||||||||||||||||||||||||||||||
| Balance as at April 30, 2017 | 39.7 | 192.1 | 902.2 | (22.9 | ) | 163.4 | - | 338.1 | 1,612.6 | 0.9 | 1,613.5 | |||||||||||||||||||||||||||||||||
Share capital | Share premium account | Retained earnings | Foreign currency translation reserve | Capital redemption reserves | Hedging reserve | Merger reserve | Total equity attributable to owners of the parent | Non- controlling interests | Total equity | |||||||||||||||||||||||||||||||||||
| Note | $m | $m | $m | $m | $m | $m | $m | $m | $m | $m | ||||||||||||||||||||||||||||||||||
| Balance as at May 1, 2017 | 39.7 | 192.1 | 902.2 | (22.9 | ) | 163.4 | - | 338.1 | 1,612.6 | 0.9 | 1,613.5 | |||||||||||||||||||||||||||||||||
| Profit for the financial period | - | - | 784.0 | - | - | - | - | 784.0 | 0.1 | 784.1 | ||||||||||||||||||||||||||||||||||
| Other comprehensive income for the period | - | - | (11.9 | ) | (28.8 | ) | - | 70.0 | - | 29.3 | - | 29.3 | ||||||||||||||||||||||||||||||||
| Total comprehensive income/(expense) for the period | - | - | 772.1 | (28.8 | ) | - | 70.0 | - | 813.3 | 0.1 | 813.4 | |||||||||||||||||||||||||||||||||
| Transactions with owners: | ||||||||||||||||||||||||||||||||||||||||||||
| Dividends | 8 | - | - | (542.2 | ) | - | - | - | - | (542.2 | ) | - | (542.2 | ) | ||||||||||||||||||||||||||||||
| Share options: | ||||||||||||||||||||||||||||||||||||||||||||
| Issue of share capital – share options | 29,30 | 0.2 | 5.6 | - | - | - | - | - | 5.8 | - | 5.8 | |||||||||||||||||||||||||||||||||
| Share-based payment charge | - | - | 78.6 | - | - | - | - | 78.6 | - | 78.6 | ||||||||||||||||||||||||||||||||||
| Current tax on share options | 7 | - | - | 4.1 | - | - | - | - | 4.1 | - | 4.1 | |||||||||||||||||||||||||||||||||
| Deferred tax on share options | 7 | - | - | (23.7 | ) | - | - | - | - | (23.7 | ) | - | (23.7 | ) | ||||||||||||||||||||||||||||||
| Acquisitions: | ||||||||||||||||||||||||||||||||||||||||||||
| Shares issued to acquire the HPE Software business | 29 | 28.8 | - | - | - | - | - | 6,485.4 | 6,514.2 | - | 6,514.2 | |||||||||||||||||||||||||||||||||
| Share reorganization and buy-back: | ||||||||||||||||||||||||||||||||||||||||||||
| Return of Value – share consolidation | 29,31 | (2.9 | ) | - | - | - | 2.9 | - | - | - | - | - | ||||||||||||||||||||||||||||||||
| Issue and redemption of B shares | 30,31 | - | (156.7 | ) | (500.0 | ) | - | 500.0 | - | (343.3 | ) | (500.0 | ) | - | (500.0 | ) | ||||||||||||||||||||||||||||
| Share buy-back | 29 | - | - | (171.7 | ) | - | - | - | - | (171.7 | ) | - | (171.7 | ) | ||||||||||||||||||||||||||||||
| Reallocation of merger reserve | 31 | - | - | 2,755.8 | - | - | - | (2,755.8 | ) | - | - | - | ||||||||||||||||||||||||||||||||
| Total movements for the period | 26.1 | (151.1 | ) | 2,373.0 | (28.8 | ) | 502.9 | 70.0 | 3,386.3 | 6,178.4 | 0.1 | 6,178.5 | ||||||||||||||||||||||||||||||||
| Balance as at October 31, 2018 | 65.8 | 41.0 | 3,275.2 | (51.7 | ) | 666.3 | 70.0 | 3,724.4 | 7,791.0 | 1.0 | 7,792.0 | |||||||||||||||||||||||||||||||||
Share capital | Share premium account | Retained earnings | Foreign currency translation reserve | Capital redemption reserves | Hedging reserve | Merger reserve | Total equity attributable to owners of the parent | Non- controlling interests | Total equity | |||||||||||||||||||||||||||||||||||
| Note | $m | $m | $m | $m | $m | $m | $m | $m | $m | $m | ||||||||||||||||||||||||||||||||||
| Balance as at November 1, 2018 | 65.8 | 41.0 | 3,275.2 | (51.7 | ) | 666.3 | 70.0 | 3,724.4 | 7,791.0 | 1.0 | 7,792.0 | |||||||||||||||||||||||||||||||||
| Impact of adoption of IFRS 15 | - | - | 52.4 | - | - | - | - | 52.4 | - | 52.4 | ||||||||||||||||||||||||||||||||||
| Impact of adoption of IFRS 9 | - | - | (15.6 | ) | - | - | - | - | (15.6 | ) | - | (15.6 | ) | |||||||||||||||||||||||||||||||
| Revised balance at November 1, 2018 | 65.8 | 41.0 | 3,312.0 | (51.7 | ) | 666.3 | 70.0 | 3,724.4 | 7,827.8 | 1.0 | 7,828.8 | |||||||||||||||||||||||||||||||||
| Profit for the financial period | - | - | 1,468.8 | - | - | - | - | 1,468.8 | 0.3 | 1,469.1 | ||||||||||||||||||||||||||||||||||
Other comprehensive income/(expense) for the period1 | - | - | 4.0 | (210.4 | ) | - | (99.6 | ) | - | (306.0 | ) | - | (306.0 | ) | ||||||||||||||||||||||||||||||
| Total comprehensive income/(expense) for the period | - | - | 1,472.8 | (210.4 | ) | - | (99.6 | ) | - | 1,162.8 | 0.3 | 1,163.1 | ||||||||||||||||||||||||||||||||
| Transactions with owners: | ||||||||||||||||||||||||||||||||||||||||||||
| Dividends | 8 | - | - | (439.2 | ) | - | - | - | - | (439.2 | ) | - | (439.2 | ) | ||||||||||||||||||||||||||||||
| Share options: | ||||||||||||||||||||||||||||||||||||||||||||
| Issue of share capital – share options | 29,30 | 0.1 | 3.0 | (3.8 | ) | - | - | - | - | (0.7 | ) | - | (0.7 | ) | ||||||||||||||||||||||||||||||
| Share-based payment charge | - | - | 64.5 | - | - | - | - | 64.5 | - | 64.5 | ||||||||||||||||||||||||||||||||||
| Current tax on share options | 7 | - | - | 13.1 | - | - | - | - | 13.1 | - | 13.1 | |||||||||||||||||||||||||||||||||
| Deferred tax on share options | 7 | - | - | (7.6 | ) | - | - | - | - | (7.6 | ) | - | (7.6 | ) | ||||||||||||||||||||||||||||||
| Share reorganization and buy-back: | ||||||||||||||||||||||||||||||||||||||||||||
| Return of Value – share consolidation | 29,31 | (18.7 | ) | - | - | - | 18.7 | - | - | - | - | - | ||||||||||||||||||||||||||||||||
| Expenses relating to Return of Value | 29 | - | - | (1.0 | ) | - | - | - | - | (1.0 | ) | - | (1.0 | ) | ||||||||||||||||||||||||||||||
| Issue and redemption of B shares | 31 | - | - | (1,800.0 | ) | - | 1,800.0 | - | (1,800.0 | ) | (1,800.0 | ) | - | (1,800.0 | ) | |||||||||||||||||||||||||||||
| Share buy-back | 29 | - | - | (544.7 | ) | - | - | - | - | (544.7 | ) | - | (544.7 | ) | ||||||||||||||||||||||||||||||
| Reallocation of merger reserve | 31 | - | - | 184.6 | - | - | - | (184.6 | ) | - | - | - | ||||||||||||||||||||||||||||||||
| Total movements for the period | (18.6 | ) | 3.0 | (1,061.3 | ) | (210.4 | ) | 1,818.7 | (99.6 | ) | (1,984.6 | ) | (1,552.8 | ) | 0.3 | (1,552.5 | ) | |||||||||||||||||||||||||||
| Balance as at October 31, 2019 | 47.2 | 44.0 | 2,250.7 | (262.1 | ) | 2,485.0 | (29.6 | ) | 1,739.8 | 6,275.0 | 1.3 | 6,276.3 | ||||||||||||||||||||||||||||||||
12 months ended October 31, 2019 | 18 months ended October 31, 2018 | 12 months ended April 30, 2017 | ||||||||||||||
| Note | $m | $m | m | $m | ||||||||||||
| Cash flows from operating activities | ||||||||||||||||
| Cash generated from operations | 39 | 1,056.3 | 1,424.3 | 564.8 | ||||||||||||
| Interest paid | (227.1 | ) | (301.8 | ) | (81.1 | ) | ||||||||||
| Bank loan costs | - | (101.2 | ) | (6.7 | ) | |||||||||||
| Tax paid | (167.4 | ) | (99.5 | ) | (24.6 | ) | ||||||||||
| Net cash generated from operating activities | 661.8 | 921.8 | 452.4 | |||||||||||||
| Cash flows from/(used in) investing activities | ||||||||||||||||
Payments for intangible assets1 | 11 | (29.3 | ) | (92.1 | ) | (31.4 | ) | |||||||||
Purchase of property, plant and equipment1 | 12 | (56.3 | ) | (40.1 | ) | (11.7 | ) | |||||||||
Finance leases2 | 21 | - | (0.7 | ) | - | |||||||||||
| Interest received | 26.6 | 9.2 | 1.0 | |||||||||||||
| Payment for acquisition of business | 38 | (89.0 | ) | (19.2 | ) | (299.1 | ) | |||||||||
| Repayment of bank borrowings on acquisition of businesses | - | - | (316.6 | ) | ||||||||||||
| Net cash acquired with acquisitions | 38 | 1.2 | 321.7 | 68.1 | ||||||||||||
| Investing cash flows generated from disposals | 37 | 20.0 | - | - | ||||||||||||
| Investing cash flows generated from discontinued operation, net of cash disposed | 37 | 2,473.5 | - | - | ||||||||||||
| Tax paid on divestiture gain | (264.6 | ) | - | - | ||||||||||||
| Net cash from/(used in) investing activities | 2,082.1 | 178.8 | (589.7 | ) | ||||||||||||
| Cash flows used in financing activities | ||||||||||||||||
| Investment in non-controlling interest | 32 | - | (0.1 | ) | (0.1 | ) | ||||||||||
| Proceeds from issue of ordinary share capital | 29,30 | 3.1 | 5.8 | 2.0 | ||||||||||||
| Purchase of treasury shares and related expenses | 29 | (544.7 | ) | (171.7 | ) | (7.7 | ) | |||||||||
| Return of Value paid to shareholders | 29,31 | (1,800.0 | ) | (500.0 | ) | - | ||||||||||
| Expenses relating to Return of Value | 29 | (1.0 | ) | - | - | |||||||||||
| Repayment of working capital in respect of the HPE Software business acquisition | 38 | - | (225.8 | ) | - | |||||||||||
Finance leases2 | 21 | (12.9 | ) | - | - | |||||||||||
| Repayment of bank borrowings | 20 | (212.6 | ) | (252.9 | ) | (372.1 | ) | |||||||||
| Proceeds from bank borrowings | 20 | - | 1,043.8 | 180.0 | ||||||||||||
| Dividends paid to owners | 8 | (439.2 | ) | (542.2 | ) | (177.5 | ) | |||||||||
| Net cash used in financing activities | (3,007.3 | ) | (643.1 | ) | (375.4 | ) | ||||||||||
| Effects of exchange rate changes | (1.8 | ) | 15.3 | (3.5 | ) | |||||||||||
| Net (decrease)/increase in cash and cash equivalents | (265.2 | ) | 472.8 | (516.2 | ) | |||||||||||
| Cash and cash equivalents at beginning of period | 620.9 | 151.0 | 667.2 | |||||||||||||
| 18 | 355.7 | 623.8 | 151.0 | |||||||||||||
| Reclassification to current assets classified as held for sale | 37 | - | (2.9 | ) | - | |||||||||||
| Cash and cash equivalents at end of period | 18 | 355.7 | 620.9 | 151.0 | ||||||||||||
Consolidated financial statements and notes
For the year ended October 31, 2021
General information
Micro Focus International plc (“Company”) is a public limited company incorporated and domiciled in the UK.England and Wales. The address of its registered office is,is: The Lawn, 22-30 Old Bath Road, Newbury, RG14 1QN, UK.
Micro Focus International plc and its subsidiaries (together “Group”) provide innovative software to clients around the world enabling them to dramatically improve the business value of their enterprise applications. As at October 31, 2019,2021, the Group had a presence in 48 countries (October 31, 2018: 49; April 30, 2017: 40)2020: 48; October 31, 2019: 48) worldwide and employed approximately 12,10011,355 people (October 31, 2018: 14,800 including 1,200 SUSE employees; April 30, 2017: 4,800)2020; 11,900; October 31, 2019: 12,100).
The Company is listed on the London Stock Exchange and its American Depositary Shares are listed on the New York Stock Exchange.
I Significant Accountingaccounting policies
A Basis of preparation
The consolidatedConsolidated financial statements of the Company have been prepared in accordance with International Financial Reporting Standards as issued by the International Accounting Standards Board (“IASB”) and, in accordance with international accounting standards in conformity with IFRSthe requirements of the Companies Act 2006 and in accordance with international financial reporting standards adopted pursuant to Regulation (EC) No 1606/2002 as it applies in the European Union (“IFRSs as adopted by the European Union (collectively “IFRS”EU”).
The consolidated financial statements have beenare prepared on a going concern basis under the historical cost convention. These financial statements have been prepared for a 12-month period as compared with a prior 18-month and 12-month reporting periods and therefore are not entirely comparable. The use of an 18 month reporting period is permitted under the UK Companies Act 2006.
The preparation of financial statements in conformity with IFRS requires the use of certain critical accounting estimates. It also requires management to exercise its judgmentjudgement in the process of applying the Group’s accounting policies. The areas involving a higher degree of judgmentjudgement or complexity, or areas where assumptions and estimates are significant to the consolidated financial statements are disclosed below in II, ‘Critical“Critical accounting estimates, assumptions and judgments’judgements”.
The principal accounting policies adopted by the Group in the preparation of the consolidated financial statements are set out below.
The accounting policies adopted are consistent with those of the Annual Report on Form 20-F for the 18 monthsyear ended October 31, 20182020 apart from standards, amendments to or interpretations of published standards adopted during the period and the revision in the period to allocate goodwill and purchased intangible assets into functional currencies of the underlying foreign operations and then retranslate goodwill and purchased intangible assets at closing rates,year, as set out in Accounting Policy J(b) “Foreign currency translation - transactionsW “Adoption of new and balances”, and which has been recorded in the 12 months ended October 31, 2019 (note 11)revised IFRS”.
Consolidated statement of comprehensive income – Prior Period Revision
Going concern
In line with IAS 1 ‘Presentation of financial statements’, and the FRC guidance on ‘risk management, internal control and related financial and business reporting’, management has taken into account available information about the future for a period of at least, but not limited to, 12 months from the date of approval of the consolidated financial statements when assessing the Group’s ability to continue as a going concern.
Item 5.A and Item 5.B includes information on the Group’s market, structure, strategy and business model, Group financial results, cash flow and net debt, and the balance sheet position. This report also covers the agreed disposal of the Group’s Digital Safe business for net consideration of $335 million. The transaction completed on January 31, 2022 therefore this going concern assessment is prepared for the 18 months ended October 31, 2018. Group excluding the Digital Safe business.
The impactGroup manages solvency and liquidity as part of its budgeting and performance management. The Group’s forecasting and planning cycle consists of a budget and a long-range plan which are used to generate income statement and cash flow projections. The cash flow projections also forecast the revision is to reduce administrative expenses by $159.0m, increase cost of sales by $43.4m, increase selling and distribution expenses by $94.2m and increase research and development expenses by $21.4m as compared with previously reported amounts. The revision has no impactheadroom on the operating profit, profit forGroup’s undrawn Revolving Credit Facility (“RCF”) and expected net leverage. Actual and forecast liquidity are reviewed at least weekly by the period, assets and liabilities or cash flows forGroup’s working capital management group which reports to the 18 months ended October 31, 2018. This revision has also been reflected in the unaudited financial information for the 12-month period ended October 31, 2018 and the 6-month period ended October 31, 2017 presented in Exhibit 15.4.Chief Financial Officer.
Consolidated financial statements and notes
Summary of significant accounting policies continued
In making this assessment, the directors considered the Group’s liquidity and solvency position. Since year end the Group has refinanced $1.6 billion of the 2024 term loans extending the maturity until 2027 and extended its RCF by 18 months to December 2026, reducing the facility to $250 million and increasing the Group’s ability to utilise the facility. See note 18 for further details of the Groups borrowings, including the RCF, and the refinancing. Whilst the Group has quarterly instalment payments due and, dependent on leverage, may be subject to an excess cash sweep against its external borrowing in the period to February 2023, the Group has no term loans maturing until June 2024. Under the amended RCF agreement the net leverage covenant applies when the RCF is more than 40% drawn at the quarter end. Under the Group’s forecast the RCF is not forecast to be drawn in the period to February 2023 and therefore no tests of this covenant are expected to apply.
Also, in assessing liquidity, the board considered the reported net current liability position of $255.7 million at October 31, 2021. This is the result of $984.6 million of advance billing for services which is required to be recognised as a contract liability. The cost of delivering these services is fully included in the Group’s forecasting and sensitivities.
Sensitivity
In assessing going concern the Group has estimated the financial impact of the severe but plausible scenarios considered in assessing viability on the going concern assessment period. This stress testing confirmed that existing projected cash flows and cash management activities provide us with significant headroom over the going concern assessment period. In addition, under the severe but plausible scenarios, there is no point at which the Group would likely need to draw upon the RCF in the period to February 2023 and therefore the covenant test on the RCF would not be expected to apply.
Conclusion
Having performed the assessments discussed above, the directors considered it appropriate to adopt the going concern basis of accounting when preparing the Consolidated financial statements. This assessment covers the period through February 2023, which is consistent with the FRC guidance.
B Consolidation
The financial statements of the Group comprise the financial statements of the Company and entities controlled by the Company and its subsidiaries and the Group’s share of its interests in associates prepared at the consolidated statement of financial position date.
Subsidiaries
Subsidiaries are entities controlled by the Group. The Group has control over an entity where the Group is exposed to, or has rights to, variable returns from its involvement within the entity and it has the power over the entity to effect those returns. The existence and effect of potential voting rights that are currently exercisable or convertible are considered when assessing control. Control is presumed to exist when the Group owns more than half of the voting rights (which does not always equal percentage ownership) unless it can be demonstrated that ownership does not constitute control. The results of subsidiaries are consolidated from the date on which control passes to the Group. The results of disposed subsidiaries are consolidated up to the date on which control passes from the Group.
The purchase method of accounting is used to account for the acquisition of subsidiaries by the Group. The cost of acquisition is measured as the fair value of the assets given, equity instruments issued and liabilities incurred or assumed at the date of exchange, with costs directly attributable to the acquisition being expensed. Identifiable assets acquired and liabilities and contingent liabilities assumed in a business combination are measured initially at their fair values at the acquisition date, irrespective of the extent of any non-controlling interest. The excess of the cost of acquisition over the fair value of the Group’s share of the identifiable net assets acquired is recorded as goodwill.
Where new information is obtained within the ‘measurement period’“measurement period” (defined as the earlier of the period until which the Group receives the information it was seeking about facts and circumstances that existed as of the acquisition date or learns that more information is not obtainable, or one year from the acquisition date) about facts and circumstances that existed as at the acquisition date and, if known, would have affected the measurement of the amounts recognized as of that date, the Group recognizes these adjustments to the acquisition balance sheet with an equivalent offsetting adjustment to goodwill. Where new information is obtained after this measurement period has closed, this is reflected in the post-acquisition period.
Consolidated financial statements and net earnings to outside shareholders is shown in the line ‘Attributable to non-controlling interests’ on the facenotes
Summary of the Consolidated statement of comprehensive income and the Consolidated statement of financial position.significant accounting policies continued
B Consolidation continued
Inter-company transactions, balances and unrealized gains on transactions between Group companies are eliminated. Accounting policies of subsidiaries have been changed where necessary to ensure consistency with the policies adopted by the Group.
C Assets held for sale and discontinued operations
A currentnon-current asset (or disposal group) is classified as held for sale if the Group will recover the carrying amount principally through a sale transaction rather than through continuing use. A currentnon-current asset (or disposal group) classified as held for sale is measured at the lower of its carrying amount and fair value less costs to sell. If the asset (or disposal group) is acquired as part of a business combination it is initially measured at fair value less costs to sell.
Assets and liabilities of disposal groups classified as held for sale are shownpresented separately onas current items in the faceconsolidated statement of financial position and are measured at the balance sheet.lower of their carrying amount and fair value less costs to sell. Property, plant and equipment, right-of-use assets and intangible assets are not depreciated or amortized once classified as held for sale.
The results of discontinued operations are shown as a single amount on the face of the Consolidated statement of comprehensive income comprising the post-tax profit or loss of discontinued operations and the post-tax gain or loss recognized either on measurement to fair value less costs to sell or on the disposal of the discontinued operation. The Consolidated statement of cash flows has been presented including the discontinued operations.
D Revenue recognition
The Group follows the principle-based five-step model in IFRS 15 and recognizes revenue on transfer of control of promised goods or services to customers incustomer when or as the performance obligation is satisfied at an amount that reflects the consideration, which the Group expects to be entitled in exchange for those goods, or services. Customer contracts can include combinations of goods and services, which are generally capable of being distinct and accounted for as separate performance obligations. Typically, a licence deal includes support, a separate performance obligation consisting of: call in assistance and when-and-if available updates. The right to get assistance and updates is not mandatory to use the licence. Contracts may also include professional services, which primarily comprise installation, implementation, configuration, advisory services and staff augmentation; these services are available both from the Group and other external service providers. All software is considered off-the-shelf and most services make use of existing configuration functionality and do not modify or customize the source code within the products, nor do they create custom software. The professional service personalize the software to the customer’s requirements and preferences. Customers can benefit from both the software on its own and the subsequent services, individually and together. On this basis, the Group concludes that services are typically distinct from licences and constitute a separate performance obligation, although this is also assessed on an individual contract basis.
Revenue is allocated to the various performance obligations on a relative stand-alone selling price (“SSP”) basis.
On an on-going basis, the Group utilizes available data points based on relevant historical transactions, to establish the observable stand-alone selling prices to be used in allocating transaction consideration. For observable stand-alone sales a reasonable range of prices will be determined to represent the stand-alone selling priceSSP of that performance obligation. Given the highly variable selling price of licences, the Group has not established SSP for licences. When SSP is established for the undelivered performance obligations (typically maintenance and professional services), the residual approach is used to allocate the transaction price to the delivered licences.
For performance obligations where observable stand-alone sales are not available, SSP will be estimated using the following methods in the order set out below:
Market price
Expected cost plus a margin
Residual approach
The Group recognizes revenues from sales of software licences (including Intellectual Property and Patent rights) to end-users, resellers and Independent Software Vendors (“ISV”), software maintenance, subscription, Software as a Service (“SaaS”), technical support, training and professional services. ISV revenue includes fees based on end usage of ISV applications that have our software embedded in their applications.
Consolidated financial statements and notes
Summary of significant accounting policies continued
D Revenue recognition continued
Software licence revenue is the sale of right to use the software on customer premises and is recognized at a point in time when the software is made available to the customer and/or reseller (i.e. when control of the asset is transferred)transferred and the performance obligation is satisfied).Software licence revenue includes revenue resulting from term/time extensions to existing agreements and the sale of additional use rights associated to existing licences including granting third party access, virtualization or novation rights. Typically term extensions and these additional rights do not require incremental support as they do not result in an additional licence, only a different use of the existing licences. The Group enters into licence verification arrangements, for customers who are not in compliance with their contractual licence and/or maintenance terms, by agreeing a one-off settlement fee. If themore than one performance obligation can be identified in the contract, revenue is allocated to each performance obligation, otherwise the Group policy is to recognize it as licence revenue. The allocation of revenue does not impact the timing of revenue recognition in these deals, given the performance obligation(s) have already been fulfilled, but will impact the presentation of revenue recognized during the period, (as licence or licence and maintenance).
For Subscriptions and SaaS arrangements, which include cloud arrangements, where customers access the functionality of a hosted software over the contract period without taking possession of the software, and performance obligations are provided evenly over a defined term, the Group recognizes revenue over the period in which the subscriptions are provided as the service is delivered, generally on a straight-line basis.
In SaaS arrangements, which include cloud arrangements, where the customer has the contractual right to take possession of the software at any time during the contractual period without significant penalty and the customer can operate, or contract with another vendor to operate the software, the Group evaluates whether the arrangement includes the sale of a software licence. In SaaS arrangements where software licences are sold, licence revenue is generally recognized at a point in time when control of the software is transferred to the customer.
Maintenance revenue is recognized on a straight-line basis over the term of the contract, which in most cases is one year.
For time and material-based professional services contracts, the Group recognizes revenue as services are rendered. The Group recognizes revenue from fixed-price professional services contracts as work progresses over the contract period on a percentage of completion basis, as determined by the percentage of laborlabour costs incurred to date compared to the total estimated laborlabour costs of a contract. Estimates of total project costs for fixed-price contracts are regularly reassessed during the life of a contract. Service costs are expensed as incurred; amounts collected prior to satisfying the above conditions are shown as contract liabilityliabilities.
Where consideration is received in advance of satisfying the performance obligation and includedthe performance obligation will be satisfied within one year of receipt of the consideration no significant financing component is recognized. The majority of the Group’s SaaS and maintenance contracts are for periods of one year. In addition, for multi-year contracts where consideration is received in deferred income.advance, the purpose of the upfront billing is not for the Group to obtain financing, rather to avoid the administrative tasks of subsequent invoicing, cash collection and risk of cancellation.
Rebates paid to resellers as part of a contracted programprogramme are accounted for as a reduction of the transaction price and netted against revenue where the rebate paid is based on the achievement of sales targets made by the partner. If the Group receives an identifiable good or service from the reseller that is separable from the sales transaction and for which fair value can be reasonably estimated, the Group accounts for the purchase of the good or service in the same way that it accounts for other purchases from suppliers.
E Contract-related costs
The Group capitalizes the costs of obtaining a customer contract when they are incremental and, if expected to be recovered, they are amortized over the customer life or pattern of revenue for the related contract.
Normally sales commissions paid for customer contract renewals are not commensurate with the commissions paid for new contracts. It follows that the commissions paid for new contracts also relate to expected future renewals of these contracts. Accordingly, the Group amortizes sales commissions paid for new customer contracts on a straight-line basis over the expected customer life, based on expected renewal frequency. The current average customer life is five years. If the expected amortization period is one year or less the costs are expensed when incurred.
Amortization of the capitalized costs of obtaining customer contracts is classified as sales and marketing expense. Capitalized costs from customer contracts are classified as non-financial assets in our statement of financial position.
Consolidated financial statements and notes
Summary of significant accounting policies continued
F Cost of sales
Cost of sales includes costs related to the amortization of product development costs, amortization of acquired technology intangibles, costs of the consulting business and helpline support and royalties payable to third parties.
G Segment reporting
In accordance with IFRS 8, ‘Operating Segments’“Operating Segments”, the Group has derived the information for its segmental reporting using the information used by the Chief Operating Decision Maker (“CODM”), defined as the Operating Committee. The segmental reporting is consistent with those used in internal management reporting and the measure used by the Operating Committee is the Adjusted EBITDA as set out in note 1.1, “Segmental reporting”.
H Exceptional items
Exceptional items are those significant items, which are separately disclosed by virtue of their size, nature or incidence to enable a full understanding of the Group’s financial performance. In setting the policy for exceptional items, judgmentjudgement is required to determine what the Group defines as ‘exceptional’“exceptional”. The Group considers whether an item to beis exceptional in nature ifby considering its materiality or the frequency of the transaction occurring or whether it is material, non-recurring or does not reflectreflects the underlying performance of the business. Exceptional items are allocated to the financial statement lines (for example: cost of sales) in the Consolidated statement of comprehensive income based on the nature and function of the costs, for example restructuring costs related to employees are classified where their original employment costs are recorded.
Management of the Group first evaluates Group strategic projects such as acquisitions, divestitures and integration activities and significant Group restructuring and other one-off events such as restructuring programs.or similar activities. In determining whether an event or transaction is exceptional, management of the Group considers quantitative and qualitative factors such as its expected size, precedent for similar items and the commercial context for the particular transaction, while ensuring consistent treatment between favorablefavourable and unfavorableunfavourable transactions impacting revenue, income and expense. Examples of transactions which may be considered of an exceptional nature include major restructuring programs,programmes, cost of acquisitions, the cost of integrating acquired businesses, or gains on the disposal of discontinued operations.operations or impairment charges recognized against goodwill.
I Employee benefit costs
a) Pension and other defined benefit obligations and long-term pension assets
The Group operates various pension schemes and long-term employee benefit plans, including both defined contribution and defined benefit pension plans. A defined contribution plan is a pension plan under which the Group pays fixed contributions into a separate entity. The Group has no legal or constructive obligations to pay further contributions if the fund does not hold sufficient assets to pay all employees the benefits relating to employee service in the current and prior periods. A defined benefit plan is a pension plan or other long-term employee benefit that is not a defined contribution plan.
For defined contribution plans, the Group pays contributions to publicly or privately administered pension insurance plans on a mandatory, contractual or voluntary basis. The Group has no further payment obligations once the contributions have been paid. The contributions are recognized as an employee benefit expense when they are due. Prepaid contributions are recognized as an asset to the extent that a cash refund or a reduction in the future payments is available.
Typically, the Group’s defined benefit pension plans define an amount of pension benefit that an employee will receive on retirement or termination. This is usually dependent on one or more factors such as age, years of service and compensation.Additionally, the Group sponsors vacation and other types of leave plans which qualify under IAS 19 as other long-term benefits as these liabilities are not expected to be settled within the next fiscal year. As such, these plans are defined benefit in nature. These plans are typically unfunded.
The liability recognized in the Consolidatedconsolidated statement of financial position in respect of defined benefit pension and other long-term employee benefit plans is the present value of the defined benefit obligation at the end of the reporting period less the fair value of plan assets. Certain long-term pension assets do not meet the definition of plan assets as they have not been pledged to the plan and are subject to the creditors of the Group. Such assets are recorded separately in the Consolidatedconsolidated statement of financial position as long-term pension assets. The defined benefit obligation is calculated annually by independent actuaries using the projected unit credit method. The present value of the defined benefit obligation is determined by discounting the estimated future cash outflows using interest rates of high-quality corporate bonds that have terms to mature approximating to the terms of the related pension obligation.
Consolidated financial statements and notes
Summary of significant accounting policies continued
I Employee benefit costs continued
For defined benefit pension plans, actuarial gains and losses arising from experience adjustments and changes in actuarial assumptions are charged or credited to equity in other comprehensive income in the period in which they arise. Past-service costsFor other long-term benefit plans actuarial gains and losses are recognized immediately in income.profit or loss in the period in which they arise.
The current service cost of the defined benefit plan,plans, recognized in the Consolidated statement of comprehensive income in employee benefit expense except where included in the cost of an asset, reflects the increase in the defined benefit obligation resulting from employee service in the current year, benefit changes, curtailments and settlements.Past-service costs are recognized immediately in the Consolidated statement of comprehensive income.
The net interest cost is calculated by applying the discount rate to the net balance of the defined benefit obligation and the fair value of plan assets. This cost is included in finance costs in the Consolidated statement of comprehensive income.
Long-term pension assets relate to the reimbursement right under insurance policies held in the Group with guaranteed interest rates that do not meet the definition of a qualifying insurance policy as they have not been pledged to the plan and are subject to the creditors of the Group. Such reimbursement rights assets are recorded in the Consolidated statement of financial position as long-term pension assets. These contractual arrangements are treated as financial assets measured at fair value through other comprehensive income. Gains and losses on long-term pension assets are charged or credited to equity in other comprehensive income in the period in which they arise.
b) Share basedShare-based compensation
The Group operated various equity-settled, share basedshare-based compensation plans during the period.
The fair value of the employee services received in exchange for the grant of the shares or options is recognized as an expense. The total amount to be expensed over the vesting period is determined by reference to the fair value of the shares or options granted. Non-market vesting conditions are included in assumptions about the number of options that are expected to become exercisable. Market vesting conditions are taken into account when determining the fair value of the options at grant date. At each Consolidated statement of financial position date, the Group revises its estimates of the number of options that are expected to become exercisable.exercisable for non-market vesting conditions. It recognizes the impact of the revision of original estimates, if any, in the Consolidated statement of comprehensive income, and a corresponding adjustment to equity over the current reporting period.
The shares are recognized when the options are exercised and the proceeds received allocated between ordinary sharesshare capital and share premium account. Fair value is usually measured using the Black-Scholes pricing model. The expected life used in the model has been adjusted, based on management’s best estimate for the effects of non-transferability, exercise restrictions and behavioralbehavioural considerations. The Additional Share GrantsWhere appropriate, some LTIP options have been valueda fair value measured using the share price or the Monte-Carlo simulation pricing model.
When the terms of an equity-settled award are modified, the minimum expense recognized is the grant date fair-valuefair value of the unmodified award, provided the original terms of the award are met. An additional expense, measured as at the date of modification, is recognized for any modification that increases the total fair value of the share-based payment transaction, or is otherwise beneficial to the employee.
The social security contributions payable in connection with the grant of the share options is considered an integral part of the grant itself, and the charge is treated as a cash-settled transaction.
J Foreign currency translation
a) Functional and presentation currency
The presentation currency of the Group is US dollars. Items included in the financial statements of each of the Group’s entities are measured in the functional currency of each entity.
b) Transactions and balances
Foreign currency transactions are translated into the functional currency using the exchange rates prevailing at the dates of the transactions. Foreign exchange gains and losses resulting from the settlement of such transactions and from the translation at year endyear-end exchange rates of monetary assets and liabilities denominated in foreign currencies are recognized in the Consolidated statement of comprehensive income within administrative expenses.
Consolidated financial statements and notes
Summary of significant accounting policies continued
J Foreign currency translation continued
Non-monetary items that are measured in terms of historical costs in a foreign currency are translated using the exchange rates as at the dates of the initial transactions. Any goodwill arising on the acquisition of a foreign operation and any fair value adjustments (including purchased intangible assets) to the carrying amounts of assets and liabilities arising on the acquisition are treated as assets and liabilities of the foreign operation and translated at the closing rate.
On consolidation, the results and financial position of all the Group entities that have a functional currency different from the presentation currency are translated into the presentation currency as follows:
| i) | Assets and liabilities for each Consolidated statement of financial position presented are translated at the closing rate at the date of that Consolidated statement of financial position; |
| ii) | Income and expenses for each Consolidated statement of comprehensive income item are translated at average exchange rates (unless this average is not a reasonable approximation of the cumulative effect of the rates prevailing on the transaction dates, in which case income and expenses are translated at the dates of the transactions); and |
| iii) | All resulting exchange differences are recognized as a separate component of equity. |
On consolidation, exchange differences arising from the translation of the net investment in foreign entities are taken to other comprehensive income.
Goodwill arising before May 1, 2004 is treated as an asset of the Company and expressed in the Company’s functional currency.
c) Exchange rates
The most important foreign currencies for the Group areare: Pounds Sterling, the Euro, Canadian Dollar, Israeli ShekelJapanese Yen, Indian Rupee and Japanese Yen.the Australian Dollar. The exchange rates used are as follows:
Year ended October 31, 2021 | Year ended October 31, 2020 | Year ended October 31, 2019 | ||||||||||||||||||||||||||||||||||||||||||||||
12 months ended October 31, 2019 | 18 months ended October 31, 2018 | 12 months ended April 30, 2017 | ||||||||||||||||||||||||||||||||||||||||||||||
| Average | Closing | Average | Closing | Average | Closing | Average | Closing | Average | Closing | Average | Closing | |||||||||||||||||||||||||||||||||||||
| £1 = $ | 1.27 | 1.29 | 1.33 | 1.27 | 1.29 | 1.29 | 1.37 | 1.37 | 1.28 | 1.30 | 1.27 | 1.29 | ||||||||||||||||||||||||||||||||||||
| €1 = $ | 1.12 | 1.12 | 1.18 | 1.14 | 1.09 | 1.09 | 1.19 | 1.16 | 1.13 | 1.17 | 1.12 | 1.12 | ||||||||||||||||||||||||||||||||||||
| C$ = $ | 0.75 | 0.76 | 0.78 | 0.76 | 0.76 | 0.73 | 0.80 | 0.81 | 0.74 | 0.75 | 0.75 | 0.76 | ||||||||||||||||||||||||||||||||||||
| ILS = $ | 0.28 | 0.28 | 0.28 | 0.27 | 0.26 | 0.28 | ||||||||||||||||||||||||||||||||||||||||||
| 100 JYP = $ | 1.10 | 1.08 | 0.90 | 0.92 | 0.91 | 0.90 | ||||||||||||||||||||||||||||||||||||||||||
| AUD = $ | 0.75 | 0.75 | 0.68 | 0.70 | n/a | n/a | ||||||||||||||||||||||||||||||||||||||||||
| 100 INR = $ | 1.36 | 1.33 | 1.36 | 1.34 | n/a | n/a | ||||||||||||||||||||||||||||||||||||||||||
| 100 JPY = $ | 0.92 | 0.88 | 0.93 | 0.96 | 1.10 | 1.08 | ||||||||||||||||||||||||||||||||||||||||||
K Intangible assets
a) Goodwill
Goodwill represents the excess of the cost of an acquisition over the fair value of the net identifiable assets of the acquired subsidiary at the date of acquisition. Goodwill on acquisitions of subsidiaries is included in intangible assets. Goodwill is tested annually for impairment andor whenever there is an indication that the asset may be impaired. Goodwill is carried at cost less accumulated impairment losses. Gains and losses on the disposal of an entity include the carrying amount of goodwill relating to the entity sold. Goodwill is allocated to cash-generating units for the purpose of impairment testing. Each of those cash-generating units represents the Group’s investment in each area of operation by each primary reporting segment.
Where goodwill has been allocated to a cash-generating unit (CGU) and part of the operation within that unit is classified as held for sale, the goodwill associated with the held-for-sale operation is measured based on the relative values of the held-for-sale operation and the portion of the cash-generating unit retained.
Consolidated financial statements and notes
Summary of significant accounting policies continued
K Intangible assets continued
b) Computer software
Computer software licences are capitalized on the basis of the costs incurred to acquire and bring into use the specific software. These costs are amortized using the straight-line method over their estimated useful lives of three to seven years.years for perpetual licence or based on the agreement for term licence.
c) Research and development
Research expenditure is recognized as an expense as incurred in the Consolidated statement of comprehensive income in research and development expenses. Costs incurred on product development projects relating to the developing of new computer software programsprogrammes and significant enhancement of existing computer software programsprogrammes are recognized as intangible assets when it is probable that the project will be a success, considering its commercial and technological feasibility, and costs can be measured reliably. Only direct costs are capitalized which are the software development employee costs and third-party contractor costs. Product development costs previously recognized as an expense are not recognized as an asset in a subsequent period.
Product development costs are amortized from the commencement of the commercial production of the product on a straight-line basis over the period of its expected benefit, typically being three years, and are included in costs of sales in the Consolidatedconsolidated statement of comprehensive income.
d) Intangible assets – arising on business combinations
Other intangible assets that are acquired by the Group as part of a business combination are recognized at their fair value at the date of acquisition, and are subsequently amortized. Amortization is charged to the Consolidated statement of Comprehensivecomprehensive income on a straight-line basis over the estimated useful life of each intangible asset. Intangible assets are amortized from the date they are available for use. The estimated useful lives will vary for each category of asset acquired and to date are as follows:
Purchased software | ||
Technology | Three to 12 years | |
Trade names | Three to 20 years | |
Customer relationships | Two to 15 years | |
Amortization of purchased software intangibles is included in administrative expenses, amortization of purchased technology intangibles is included in cost of sales and amortization of acquired purchased trade names and customer relationships and lease contracts intangibles are included in selling and distribution costs in the Consolidated statement of comprehensive income.
L Property, plant and equipment
All property, plant and equipment is stated at historical cost less accumulated depreciation and impairment. Historical cost includes expenditure that is directly attributable to the acquisition of the items. Subsequent costs are included in the asset’s carrying amount or recognized as a separate asset, as appropriate, only when it is probable that future economic benefits associated with the item will flow to the Group and the cost of the item can be measured reliably. All other repairs and maintenance expenditures are charged to the Consolidatedconsolidated statement of comprehensive income during the financial year in which they are incurred. Depreciation is calculated using the straight-line method to write off the cost of each asset to its residual value over its estimated useful life as follows:
Buildings | 30 years | |
Leasehold improvements | Three to 10 years (not exceeding the remaining lease period) | |
Fixtures and fittings | Two to seven years | |
Computer equipment | One to five years |
Freehold land is not depreciated. The assets’ residual values and useful lives are reviewed, and adjusted if appropriate, at each Consolidated statement of financial position date. An asset’s carrying amount is written down immediately to its recoverable amount if the asset’s carrying amount is greater than its estimated recoverable amount. Gains and losses on disposals are determined by comparing the disposal proceeds with the carrying amount and are included in the Consolidated statement of comprehensive income.
Property held for sale is measured at the lower of its carrying amount or estimated fair value less costs to sell.
Consolidated financial statements and notes
Summary of significant accounting policies continued
M Impairment of non-financial assets
Assets that have an indefinite useful life are not subject to amortization and are tested annually for impairment.impairment or whenever there is an indication that the asset may be impaired. Assets that are subject to amortization are reviewed for impairment whenever events or changes in circumstances indicate that the carrying amount may not be recoverable. An impairment loss is recognized for the amount by which the asset’s carrying amount exceeds its recoverable amount. The recoverable amount is the higher of an asset’s fair value less costs of disposal and value in use. For the purposes of assessing impairment, assets are grouped at the lowest levels for which there are separately identifiable cash flows being cash-generating units. Any non-financial assets other than goodwill which have suffered impairment are reviewed for possible reversal of the impairment at each reporting date. Assets that are subject to amortization and depreciation are also reviewed for any possible impairment at each reporting date.
N Inventories
Trade receivables are initially recognized at fair value and subsequently measured at amortized cost less provisions for impairment based upon an expected credit loss methodology. The Group applies the IFRS 9 simplified approach to measuring expected credit losses which uses a lifetime expected loss allowance for all trade receivables. A provision of the lifetime expected credit loss is established upon initial recognition of the underlying asset and are calculated using historical account payment profiles along with historical credit losses experienced. The loss allowance is adjusted for forward lookingforward-looking factors specific to the debtor and the economic environment. The amount of the provision is the difference between the asset’s carrying amount and the present value of the probability weighted estimated future cash flows, discounted at the effective interest rate. The amount of the provision is recognized in the Consolidated statement of comprehensive income.
Cash and cash equivalents includes cash in hand, deposits held at call with banks, other short-term highly liquid investments with original maturities of three months or less, and bank overdrafts. Bank overdrafts are shown within borrowings in current liabilities on the Consolidated statement of financial position.
Borrowings are recognized initially at fair value, net of transaction costs incurred. Subsequent to initial recognition, interest bearing borrowings are stated at amortized cost with any difference between cost and redemption value being recognized in the Consolidated statement of comprehensive income over the periodexpected life of the of borrowing on an effective interest basis.
As a lessee
When the Group leases an asset a ‘right-of-use asset’ is recognized for the leased item and a lease liability is recognized for any lease payments due over the lease term at the lease commencement date. The right-of-use asset is initially measured at cost, being the present value of the lease payments paid or payable, plus any initial direct costs incurred in entering the lease and less any lease incentives received.
Right-of-use assets are depreciated on a straight-line basis from the commencement date to the earlier of the end of the asset’s useful life or the end of the lease term. The lease term is the non-cancellable period of the lease plus any periods for which the Group is ‘reasonably certain’ to exercise any extension options (note 19, “Leases”). The useful life of the asset is determined in a manner consistent to that for owned property, plant and equipment described in L above. If right-of-use assets are considered to be impaired, the carrying value is reduced accordingly.
Lease liabilities are initially measured at the value of the lease payments that are not paid at the commencement date and are usually discounted using the incremental borrowing rates of the Group for the relevant portfolio (the rate implicit in the lease is used if it is readily determinable). Lease payments included in the lease liability include both fixed payments and in-substance fixed payments during the term of the lease.
After initial recognition, the lease liability is recorded at amortized cost using the effective interest method. It is re-measured when there is a change in future lease payments arising from a change in an index or rate (e.g. an inflation related increase) or if the Group’s assessment of the lease term changes; any change in the lease liability as a result of these changes also results in a corresponding change in the recorded right-of-use asset.
Consolidated financial statements and notes
Summary of significant accounting policies continued
Q Leases continued
As a lessor
Where the Group is a lessor, it determines at inception whether the lease is a finance or an operating lease. When a lease transfers substantially all the risks and rewards of ownership of the underlying asset then the lease is a finance lease; otherwise, the lease is an operating lease.
Where the Group is an intermediate lessor, the interest in the head lease and the sub-lease is accounted for separately and the lease classification of a sub-lease is determined by reference to the right-of-use asset arising from the head lease.
Income from operating leases is recognized on a straight-line basis over the lease term. Income from finance leases is recognized in full at lease commencement.
Lease policy in the year ended October 31, 2019 under IAS 17 and IFRIC 4
A lease is classified at the inception date as a finance lease or an operating lease. A lease that transfers substantially all the risks and rewards incidental to ownership to the Group is classified as a finance lease.
Finance leases are capitalized at the commencement of the lease at the inception date fair value of the leased property or, if lower, at the present value of the minimum lease payments. Lease payments are apportioned between finance charges and reduction of the lease liability so as to achieve a constant rate of interest on the remaining balance of the liability. Finance charges are recognized in finance costs in the Consolidated statement of comprehensive income.
A leased asset is depreciated over the useful life of the asset. However, if there is no reasonable certainty that the Group will obtain ownership by the end of the lease term, the asset is depreciated over the shorter of the estimated useful life of the asset and the lease term.
An operating lease is a lease other than a finance lease. Operating lease payments are recognized as an operating expense in the statement of profit or loss on a straight-line basis over the lease term.
Operating sub-lease income is recorded as operating income on a straight-line basis over the sub-lease term.
Current and deferred tax are recognized in the Consolidated statement of comprehensive income, except when the tax relates to items charged or credited directly to equity, in which case the tax is also dealt with directly in equity.
Deferred income tax is provided in full, using the liability method, on temporary differences arising between the tax bases of assets and liabilities and their carrying amounts in the consolidated financial statements. However, if the deferred income tax arises from initial recognition of an asset or liability in a transaction other than a business combination that at the time of the transaction affects neither accounting nor taxable profit nor loss, it is not accounted for. Deferred tax liabilities are not recognized if they arise from the initial recognition of goodwill. Deferred income tax is determined using tax rates (and laws) that have been enacted or substantially enacted by the Consolidated statement of financial position date and are expected to apply when the related deferred income tax asset is realized, or the deferred income tax liability is settled. Deferred income tax assets are recognized to the extent that it is probable that future taxable profit will be available against which the temporary differences can be utilized.
Deferred income tax is provided on temporary differences arising on investments in subsidiaries, except where the timing of the reversal of the temporary difference is controlled by the Group and it is probable that the temporary difference will not reverse in the foreseeable future.
Deferred tax assets and liabilities are offset where there is a legally enforceable right to set off current tax assets against current tax liabilities and when they relate to income taxes levied by the same taxation authority and the Group intends to settle its current tax assets and liabilities on a net basis.
Current tax is recognized based on the amounts expected to be paid or recovered under the tax rates and laws that have been enacted or substantively enacted at the Consolidated statement of financial position date.
Consolidated financial statements and notes
Summary of significant accounting policies continued
S Ordinary shares, share premium and dividend distribution
Incremental costs directly attributable to the issue of new shares or options are shown in equity as a deduction, net of tax, from the proceeds. Dividend distributions to the Company’s shareholders are recognized as a liability in the Group’s financial statements in the period in which the dividends are approved by the Company’s shareholders. Interim dividends are recognized when they are paid.
Financial assets and liabilities are recognized in the Group’s Consolidated statement of financial position when the Group becomes a party to the contractual provision of the instrument. Trade receivables are non-interest bearing and are initially recognized at fair value and subsequently measured at amortized cost less provisions for impairment based upon an expected credit loss methodology. Trade payables are non-interest bearing and are stated at their fair value. Derivative financial instruments are only used for economic hedging purposes and not as speculative investments.
The Group uses derivative financial instruments, such as interest rate swaps, to hedge its interest rate risks. Such derivative financial instruments are initially recognized at fair value on the date on which the contract is entered into and are subsequently re-measured at fair value. Derivatives are carried as financial assets when the fair value is positive and as financial liabilities when the fair value is negative.
T Derivative financial instruments impairment of financial assets and hedge accounting. IFRS 9 also amends certain other standards coveringaccounting continued
Non-derivative financial instruments, such as IAS 1 “PresentationEuro borrowings, have also been designated as hedges for net investments in foreign operations. Hedges of Financial Statements”.a net investment in a foreign operation are accounted for similarly to cash flow hedges.
Hedge accounting is permitted under certain circumstances provided the following criteria are met:
At inception of the hedge, the documentation must include the risk management objective and strategy for undertaking the hedge, identification of the hedging instrument, the hedged item, the nature of the risk being hedged and how the entity will assess the hedging instrument’s effectiveness. Such hedges are expected to be effective in achieving offsetting changes in cash flows and are assessed on an on-going basis to determine the level of effectiveness.
The measurement of effectiveness determines the accounting treatment. For effective results, changes in the fair value of the hedging instrument should be recognized in other comprehensive income, in the hedging reserve, while any material ineffectiveness should be recognized in the statement of comprehensive income. If prospectiveeffectiveness testing is not satisfactorily completed, all fair value movements on the hedging instrument should be recorded in the Consolidated statement of comprehensive income. The IFRS 9 hedge accounting requirements are applicable to the interest swaps and net investment hedges that have been designated for hedge accounting.
Hedge accounting is ceased prospectively if the instrument expires or is sold, terminated or exercised; the hedge criteria are no longer met;met or the forecast transaction is no longer expected to occur.
Provisions for onerous leases,contracts, property restoration costs, restructuring costs and legal claims are recognized when the Group has a present legal or constructive obligation as a result of past events; it is probable that an outflow of resources will be required to settle the obligation; and the amount has been reliably estimated. Provisions are not recognized for future operating losses.
Where there are a number of similar obligations, the likelihood that an outflow will be required in settlement is determined by considering the class of obligations as a whole. A provision is recognized even if the likelihood of an outflow with respect to any one item included in the same class of obligations may be small.
Provisions are measured at the present value of the expenditures expected to be required to settle the obligation using a pre-tax rate that reflects current market assessments of the time value of money and the risks specific to the obligation.obligation where the impact is material. The increase in the provision due to the passage of time is recognized as an interest expense.
Contingent liabilities are possible obligations that arise from past events and whose existence will be confirmed only by uncertain future events or present obligations that arise from past events where the transfer of economic resources is uncertain or cannot be reliability estimated. Contingent liabilities are not recognizedrecognised in the consolidated financial statements, except if they arise from a business combination; they are disclosed in the notes to the consolidated financial statements unless the likelihood of an outflow of economic resources is remote.
Consolidated financial statements and notes
Summary of significant accounting policiescontinued
The following standards, interpretations and amendments to existing standards are now effective and have been adopted duringby the period:Group.
The impacts of applying these policies are not considered material:
| - |
| Measurement category | Carrying amount | ||||||||||||||||||
Note | IAS 39 | IFRS 9 | October 31, 2018 | IFRS 9 Adjustments1 | November 1, 2018 | ||||||||||||||
| $m | $m | $m | |||||||||||||||||
| Financial assets | |||||||||||||||||||
| Non-current | |||||||||||||||||||
Long-term pension assets | 25 | Available-for-sale financial assets | Fair value through other comprehensive income | 16.7 | - | 16.7 | |||||||||||||
Derivative financial instruments | 31 | Fair value through profit and loss | Fair value through profit and loss | 86.4 | - | 86.4 | |||||||||||||
| Current | |||||||||||||||||||
| Cash and cash | 18 | Amortized cost | Amortized cost | 620.9 | - | 620.9 | |||||||||||||
| Trade and other receivables | 16 | Amortized cost | Amortized cost | 1,212.0 | (20.0 | ) | 1,192.0 | ||||||||||||
| Financial liabilities – financial liabilities at amortized cost | |||||||||||||||||||
| Non-current | |||||||||||||||||||
| Borrowings (gross) | 20 | Amortized cost | Amortized cost | 4,946.6 | - | 4,946.6 | |||||||||||||
| Finance leases | 21 | Amortized cost | Amortized cost | 14.9 | - | 14.9 | |||||||||||||
| Provisions | 24 | Amortized cost | Amortized cost | 35.4 | - | 35.4 | |||||||||||||
| Current | |||||||||||||||||||
| Borrowings (gross) | 20 | Amortized cost | Amortized cost | 50.3 | - | 50.3 | |||||||||||||
| Finance leases | 21 | Amortized cost | Amortized cost | 13.6 | - | 13.6 | |||||||||||||
| Trade and other payables | 19 | Amortized cost | Amortized cost | 676.9 | - | 676.9 | |||||||||||||
| Provisions | 24 | Amortized cost | Amortized cost | 57.4 | - | 57.4 | |||||||||||||
12 months ended October 31, 2019 | 18 months ended October 31, 2018 | |||||||||||||||||||
Post IFRS 15 | IFRS 15 Adjustments | Pre IFRS 15 | ||||||||||||||||||
| Note | $m | $m | $m | $m | ||||||||||||||||
| Revenue | 1,2 | 3,348.4 | (16.1 | ) | 3,332.3 | 4,754.4 | ||||||||||||||
| Operating profit | 221.7 | (22.1 | ) | 199.6 | 376.8 | |||||||||||||||
| Finance costs | 6 | (282.4 | ) | - | (282.4 | ) | (350.4 | ) | ||||||||||||
| Finance income | 6 | 26.6 | - | 26.6 | 7.7 | |||||||||||||||
| (Loss)/ profit before tax | (34.1 | ) | (22.1 | ) | (56.2 | ) | 34.1 | |||||||||||||
| Taxation | 7 | 16.0 | 1.6 | 17.6 | 673.1 | |||||||||||||||
| (Loss)/profit from continuing operations | (18.1 | ) | (20.5 | ) | (38.6 | ) | 707.2 | |||||||||||||
| Profit from discontinued operation (attributable to equity shareholders of the Company) | 37 | 1,487.2 | 30.6 | 1,517.8 | 76.9 | |||||||||||||||
| Profit for the period | 1,469.1 | 10.1 | 1,479.2 | 784.1 | ||||||||||||||||
| Attributable to: | ||||||||||||||||||||
| Equity shareholders of the parent | 1,468.8 | 10.1 | 1,478.9 | 784.0 | ||||||||||||||||
| Non-controlling interests | 0.3 | - | 0.3 | 0.1 | ||||||||||||||||
| Profit for the period | 1,469.1 | 10.1 | 1,479.2 | 784.1 | ||||||||||||||||
| Earnings per share (cents) | ||||||||||||||||||||
| From continuing and discontinued operations | cents | cents | cents | cents | ||||||||||||||||
| - Basic | 9 | 388.50 | 2.67 | 391.17 | 201.70 | |||||||||||||||
| - Diluted | 9 | 384.35 | 2.64 | 386.99 | 196.17 | |||||||||||||||
| From continuing operations | ||||||||||||||||||||
| - Basic | 9 | (4.87 | ) | (5.42 | ) | (10.29 | ) | 181.91 | ||||||||||||
| - Diluted | 9 | (4.87 | ) | (5.42 | ) | (10.29 | ) | 176.92 | ||||||||||||
| Earnings per share (pence) | ||||||||||||||||||||
| From continuing and discontinued operations | pence | pence | pence | pence | ||||||||||||||||
| - Basic | 9 | 305.07 | 2.10 | 307.17 | 151.61 | |||||||||||||||
| - Diluted | 9 | 301.81 | 2.08 | 303.89 | 147.45 | |||||||||||||||
| From continuing operations | ||||||||||||||||||||
| - Basic | 9 | (3.82 | ) | (4.26 | ) | (8.08 | ) | 136.73 | ||||||||||||
| - Diluted | 9 | (3.82 | ) | (4.26 | ) | (8.08 | ) | 132.98 | ||||||||||||
12 months ended October 31, 2019 | 18 months ended October 31, 2018 | |||||||||||||||||||
Post IFRS 15 | IFRS 15 Adjustments | Pre IFRS 15 | ||||||||||||||||||
| Note | $m | $m | $m | $m | ||||||||||||||||
| ASSETS | ||||||||||||||||||||
| Non-current assets | ||||||||||||||||||||
| Contract-related costs | 17 | 31.5 | (31.5 | ) | - | - | ||||||||||||||
| Current assets | ||||||||||||||||||||
| Trade and other receivables | 16 | 1,032.9 | (0.9 | ) | 1,032.0 | 1,272.0 | ||||||||||||||
| Contract-related costs | 17 | 19.3 | (19.3 | ) | - | - | ||||||||||||||
| LIABILITIES | ||||||||||||||||||||
| Current liabilities | ||||||||||||||||||||
| Trade and other payables | 19 | (611.0 | ) | - | (611.0 | ) | (676.9 | ) | ||||||||||||
| Contract liabilities | 23 | (1,045.9 | ) | - | (1,045.9 | ) | (1,134.7 | ) | ||||||||||||
| Non-current liabilities | ||||||||||||||||||||
| Contract liabilities | 23 | (149.9 | ) | - | (149.9 | ) | (178.1 | ) | ||||||||||||
| Deferred tax liabilities | 28 | (987.1 | ) | 9.0 | (978.1 | ) | (1,170.5 | ) | ||||||||||||
| Continuing operations | Discontinued operation | |||||||||||||||||||
Increase / (decrease) in opening retained earnings on November 1, 2018 | Increase / (decrease) in Revenue in the 12 months ended October 31, 2019 | Increase / (decrease) in Operating expenses in the 12 months ended October 31, 2019 | Increase / (decrease) in Profit before tax in the 12 months ended October 31, 2019 | Profit/(loss) from discontinued operation (attributable to equity shareholders of the Company) in the 12 months ended October 31, 2019 | ||||||||||||||||
| $m | $m | $m | $m | $m | ||||||||||||||||
| Cost of obtaining customer contracts | 64.7 | - | (21.2 | ) | 21.2 | (35.4 | ) | |||||||||||||
| Rebillable expenses | - | 2.4 | 2.4 | - | - | |||||||||||||||
| Consideration payable to a customer | 5.0 | 13.7 | 12.8 | 0.9 | (5.0 | ) | ||||||||||||||
| Deferred tax | (17.3 | ) | - | - | - | 9.8 | ||||||||||||||
52.4 | 16.1 | (6.0 | ) | 22.1 | (30.6 | ) | ||||||||||||||
Retained earnings at October 31, 2018 | IFRS 15 Adjustment | IFRS 9 Adjustment | Retained earnings at November 1, 2018 | |||||||||||||
| $m | $m | $m | $m | |||||||||||||
| Retained earnings | 3,275.2 | 52.4 | (15.6 | ) | 3,312.0 | |||||||||||
Amendments to References to the Conceptual Framework in IFRS Standards |
| - | Amendments to IFRS 3 |
| - | Amendments to IAS1 and IAS 8: guidance on the definition of material. |
| - | Amendments to IFRS9, IAS 39, IFRS 7, IFRS 16 and IFRS 4: Interest rate benchmark reforms. Phase 1 |
Interpretations and amendments
The following interpretations and amendments to existing standards are not yet effective and have not been adopted early by the Group. These interpretations and amendments were not endorsed by the EU as at December 31, 2020 and have not yet been endorsed by the UK Endorsement Board (“UK EB”) except where stated below:
Effective for periods commencing after January 1, 2021 (applicable to the Group from November 1, 2021):
| - | Amendments to |
Effective for periods commencing after January 1, 2022 (applicable to the Group from November 1, 2022):
| - | Annual Improvements cycle 2018-2020 includes relevant amendments clarifying capitalisation of transaction fees/inclusion of specific fees in modification/extinguishment test within IFRS 9 Financial Instruments. Other included improvement in IFRS 1 (First time adoption) and IAS 41 (agriculture) are not applicable to the Group. |
| - | Amendments to IFRS 3 “Business combinations”, IAS 16 “Property, plant and equipment” and IAS 37 “Provisions, Contingent assets and Contingent liabilities”. |
Effective for periods commencing after January 1, 2023, (applicable to the Group from November 1, 2023) subject to UK endorsement except as noted below:
| - | Amendments to IAS 1 “Presentation of financial statements”. Amendment is presentational and relates to the classification of liabilities as current and non-current. |
| - | Amendments to IAS 1 “Presentation of financial statements” aims to provide guidance on the application of materiality judgements to policy disclosures. |
| - | Amendments to IAS 8 “Accounting policies, changes in accounting estimates and errors” provides clarifications around the definition of accounting estimates and further clarification around the difference between policy changes and estimates. |
| - | Amendments to IAS 12 “Income taxes” covering temporary timing differences for deferred tax on the recognition of asset and liabilities from a single transaction. |
| - | IFRS 17 “Insurance contracts” and Amendments to IFRS 17 “Insurance contracts”. |
The impact of the amendments and interpretations listed above willare not expected to have a material impact on the consolidated financial statements.
Consolidated financial statements and notes
Summary of significant accounting policiescontinued
II Critical accounting estimates, assumptions and judgments
judgements
In preparing these consolidated financial statements, the Group has made its best estimates and judgmentsjudgements of certain amounts included in the financial statements, giving due consideration to materiality. The Group regularly reviews these estimates and judgements and updates them as required. The Group has reviewed its critical accounting estimates, assumptions and judgements and a new critical accounting estimate has been identified in relation to the useful economic lives of the Group’s purchased intangible assets. The critical judgement identified in the prior year in relation to the assessment of lease term is no longer considered critical as IFRS 16 has been applied for two years and the level of remaining judgement has reduced following changes to the Group’s largest leases over the last two years.
Actual results could differ from these estimates. Unless otherwise indicated, the Group does not believe that there is a significant risk of a material change to the carrying value of assets and liabilities within the next financial year related to the accounting estimates and assumptions described below. The Group considers the following to be a description of the most significant estimates and judgments,judgements which require the Group to make subjective and complex judgments,judgements and matters that are inherently uncertain.
Critical accounting estimates and assumptions
A Potential impairment of goodwill and other intangible assets
Each period,year, or whenever there are changes in circumstances indicating that the carrying amounts may not be recoverable, the Group carries out impairment tests of goodwill and other intangible assets which require estimates to be made of the value in use of its CGUs. These value in use calculations are dependent on estimates of future cash flows including long-term growth rates, the medium-termaverage annual revenue growth rate by product group and an appropriate discount rate to be applied to future cash flows. Further details on these estimates and sensitivity of the carrying value of goodwill to the discount rate, and the medium-termaverage annual revenue growth rate by product group in particularand the long-term growth rate are provided in note 10.10, “Goodwill”.
B Retirement benefit obligations
The valuation of retirement benefit obligations is dependent upon a number of assumptions that are estimated at the year-endyear end date, including estimates of mortality rates, inflation, salary growth rates and the rate at which scheme liabilities are discounted. Further detail on these estimates and the sensitivity of the carrying value of the defined benefit obligation to these is provided in note 25.22, “Pension and other long-term benefit commitments”.
The economic lives of the Group’s purchased intangible assets are determined on initial acquisition and reassessed annually or whenever there are changes in circumstances indicating that the economic lives may not be appropriate. In reassessing the lives factors such as changes in actual and expected trading performance of the Group and how these compare to the initial acquisition assessment are considered. Using this information an estimate of the remaining useful economic lives is determined and if different to the currently applied life the remaining life is adjusted prospectively.
Following the goodwill impairment in the year ended October 31, 2020, management reviewed the estimated lives of Contentspurchased intangible assets. The assessment performed in the current year resulted in a reduction in the economic lives of certain purchased intangible assets, see note 11, “Other intangible assets”, for details on the impacts in the current period, expected impact in future periods and sensitivity.
Revenue recognition under IFRS 15 is significantly more complex than under previous reporting requirements and necessitates the increasedrequires significant use of management judgments and estimatesjudgement to produce financial information. IFRS 15 also introduces management judgment in relation to the timing of recognition of certain categories of cost. The most significant accounting judgmentsjudgement in applying IFRS 15 are disclosed below.
Judgement is required to (i) identify each distinct performance obligation requiring separate recognition in a multi-elementmulti element contract (e.g. licence, maintenance, material rights for option to acquire additional products or services at discounted prices)., and (ii) allocate the transaction price to the various performance obligations. This judgment impacts the timing of revenue recognition, as certain performance obligations are recognized at a point in time and others are recognized over the life of the contract, as explained in Accounting Policy D “Revenue recognition”, and therefore the judgement impacts the quantum of revenue and profit recognized in eacha period.
Consolidated financial statements and notes
Summary of significant accounting policies continued
II Critical accounting estimates, assumptions and judgements continued
E Exceptional item classification
The Group classifies items as exceptional in line with Accounting Policy H.H “Exceptional items”. The classification of these items as an exceptional is a matter of judgment.judgement. This judgmentjudgement is made by management after evaluating each item deemed to be exceptional against the criteria set out within the defined accounting policy.
F Provision for income taxes
The Group is subject to income taxes in numerous jurisdictions. Significant judgmentjudgement is required in determining the worldwide provision for income taxes including structuring activities undertaken by the Group and the application of complex transfer pricing rules. The Group recognizes liabilities for anticipated settlement of tax issues based on judgmentsjudgements of whether additional taxes will be due. Significant issues may take several periods to resolve. In making judgmentsjudgements on the probability and amount of any tax charge, management takes into account:
Status of the unresolved matter;
Strength of technical argument and clarity of legislation;
External advice;
Resolution process, past experience and precedents set with the particular taxing authority;
Agreements previously reached in other jurisdictions on comparable issues; and
Statute of limitations.
Key judgmentsjudgements in the periodyear were related to the structuring activities undertakenEU state aid and UK tax authority challenge in relationrespect of prior periods. Specifically, these judgements covered (i) the probability of success of either the appeal by the UK Government or the appeal by the Group itself in respect of the EU state aid, (ii) the probability of success of UK tax authority challenge, and therefore recovery of the $48 million current tax receivable, and (iii) the interaction of the two matters in the context of the maximum liability, which we consider to be $60 million, associated with both the disposal of SUSEUK State Aid and whether these activities would create an additionalUK tax charge through US and other overseas tax legislation.authority challenge. Based on their assessment (and supported by advice received by the Group’s tax advisors), the directors have concluded that no additional material tax provisions are required with regards to these matters. See note 7, “Taxation”, for additional details.
The ultimate tax liability may differ from the amount provided depending on interpretations of tax law, settlement negotiations or changes in legislation. Where the final tax outcome of these matters is different from the amounts that were initially recorded, such differences will impact the income tax and deferred tax provisions in the periodyear in which such determination is made. There is no estimate associated with the provision for income taxes that could be expected to result in a material change within the next 12 months.
1 Segmental reporting
In accordance with IFRS 8 “Operating Segments”, the Group has derived the information for its segmental reporting using the information used by the Chief Operating Decision Maker for the purposes of resource allocation and assessment of segment performance. The Chief Operating Decision Maker (“CODM”) is defined as the Operating Committee.
For the 12 monthsyear ended April 30, 2017 the Chief Operating Decision Marker (“CODM”) was defined as the Executive Committee.
For the year ended October 31, 2020, the Operating Committee consisted of the Chief Executive Officer, the Chief Financial Officer, Chief Operating Officer, Chief HR Officer and Vice President Business Operations and the Chief Legal Officer. The Group is organized into a single reporting segment.
For the year ended October 31, 2021, the Operating Committee consisted of the Chief Executive Officer, the Chief Financial Officer, Chief Operating Officer, Chief HR Officer and Senior Vice President Business Operations and the Chief Legal Officer (To August 7, 2021). The Group is organized into a single reporting segment.
The Group’s segment under IFRS 8 is:
is the Micro Focus Product Portfolio –. The Micro Focus Product Portfolio segment contains mature infrastructure software products that are managed on a portfolio basis akin to a “fund of funds” investment portfolio. This portfolio is managed with a single product group that makes and maintains the software, whilst the software is sold and supported through a geographicone single Go-to-Market organization. organisation with specialist skills targeted by sub-portfolio.
1 Segmental reporting continued
The products within the existing Micro Focus Product Portfolio are grouped together into five5 sub-portfolios based on industrial logic and management of the Micro Focus sub-portfolios: Application ModernizationModernisation & Connectivity (“AMC”), Application Delivery Management (“ADM”), IT Operations Management Security(“ITOM”), CyberRes and Information Management & Governance.Governance (“IM&G”).
The segmental reporting is consistent with that used in internal management reporting and the profit measure used by the Operating Committee is Adjusted EBITDA.
Year ended October 31, 2021 | Year ended October 31, 2020 | Year ended October 31, 2019 | ||||||||||||||
| Note | $m | $m | $m | |||||||||||||
| Reconciliation to Adjusted EBITDA: | ||||||||||||||||
| Loss before tax | (517.8 | ) | (2,940.4 | ) | (34.1 | ) | ||||||||||
| Finance costs | 6 | 253.9 | 281.6 | 282.4 | ||||||||||||
| Finance income | 6 | (1.7 | ) | (2.6 | ) | (26.6 | ) | |||||||||
| Depreciation of property, plant and equipment | 12 | 33.7 | 42.0 | 66.5 | ||||||||||||
| Right-of-use asset depreciation | 19 | 73.3 | 76.9 | 0 | ||||||||||||
| Amortization of intangible assets | 11 | 956.4 | 674.1 | 716.5 | ||||||||||||
| Exceptional items (reported in Operating loss) | 4 | 247.1 | 3,011.6 | 294.2 | ||||||||||||
| Share-based compensation charge | 28 | 14.3 | 17.0 | 68.8 | ||||||||||||
| Product development intangible costs capitalized | 11 | (19.1 | ) | (16.2 | ) | (16.5 | ) | |||||||||
| Foreign exchange credit | 3 | 0.1 | 29.7 | 11.3 | ||||||||||||
| Adjusted EBITDA | 1,040.2 | 1,173.7 | 1,362.5 | |||||||||||||
12 months ended October 31, 2019 | 18 months ended October 31, 2018 | 12 months ended April 30, 20171 | ||||||||||||||
| Note | $m | $m | $m | |||||||||||||
| Reconciliation to Adjusted EBITDA: | ||||||||||||||||
| (Loss)/profit before tax | (34.1 | ) | 34.1 | 131.6 | ||||||||||||
| Finance costs | 6 | 282.4 | 350.4 | 96.8 | ||||||||||||
| Finance income | 6 | (26.6 | ) | (7.7 | ) | (1.0 | ) | |||||||||
| Depreciation of property, plant and equipment | 12 | 66.5 | 88.6 | 9.7 | ||||||||||||
| Amortization of intangible assets | 11 | 716.5 | 903.1 | 206.7 | ||||||||||||
| Exceptional items (reported in Operating profit) | 4 | 294.2 | 538.2 | 97.2 | ||||||||||||
| Share-based compensation charge | 33 | 68.8 | 64.3 | 31.5 | ||||||||||||
| Product development intangible costs capitalized | 11 | (16.5 | ) | (44.4 | ) | (27.6 | ) | |||||||||
| Foreign exchange loss/(credit) | 3 | 11.3 | (37.4 | ) | (2.9 | ) | ||||||||||
| Adjusted EBITDA | 1,362.5 | 1,889.2 | 542.0 | |||||||||||||
For the reportable segment, the total assets were $14,294.8m$10,346.6 million (2020: $11,146.8 million; 2019: $14,294.8 million) and the total liabilities were $8,018.5m$7,525.6 million (2020: $7,931.7 million; 2019: $8,018.5 million) as at October 31, 2019. No measure of total assets and total liabilities has been reported for the 18 months ended October 31, 2018 and the 12 months ended April 30, 2017 as these were not regularly provided to the CODM.2021.
2 Supplementary information
Analysis by geography
The Group is domiciled in the UK. The Group’s total segmental revenue from external customers by geographical location is detailed below:
12 months ended October 31, 2019 | 18 months ended October 31, 2018 | 12 months ended April 30, 2017 | Year ended October 31, 2021 | Year ended October 31, 2020 | Year ended October 31, 2019 | |||||||||||||||||||
| $m | $m | $m | $m | $m | $m | |||||||||||||||||||
| UK | 206.9 | 299.6 | 52.2 | 160.0 | 173.0 | 206.9 | ||||||||||||||||||
| USA | 1,523.0 | 2,279.8 | 551.5 | 1,263.0 | 1,289.8 | 1,523.0 | ||||||||||||||||||
| Germany | 220.7 | 309.5 | 86.8 | 223.0 | 218.7 | 220.7 | ||||||||||||||||||
| Canada | 110.3 | 108.0 | 115.9 | |||||||||||||||||||||
| France | 123.3 | 195.5 | 43.2 | 100.7 | 101.4 | 123.3 | ||||||||||||||||||
| Japan | 108.6 | 145.8 | 42.4 | 95.6 | 96.9 | 108.6 | ||||||||||||||||||
| Other | 1,165.9 | 1,524.2 | 301.2 | 947.3 | 1,013.2 | 1,050.0 | ||||||||||||||||||
| Total | 3,348.4 | 4,754.4 | 1,077.3 | 2,899.9 | 3,001.0 | 3,348.4 | ||||||||||||||||||
The total of non-current assets other than financial instruments and deferred tax assets as at October 31, 20192021 located in the USA is $4,623.0m$2,798.3 million (October 31, 2018: $5,145.8m),2020: $3,301.0 million; October 31, 2019: $4,623.0 million) the total in the non-USArest of the world is $8,192.2m$5,641.2 million (October 31, 2018: $8,488.3m)2020: $6,304.0 million; October 31, 2019: $8,192.2 million). They exclude trade and other receivables, derivative financial instruments and deferred tax.
12 months ended October 31, 2019 | 18 months ended October 31, 2018 | 12 months ended April 30, 2017 | ||||||||||
| $m | $ | $m | $m | |||||||||
| Revenue from contracts with customers | 3,348.4 | 4,754.4 | 1,077.3 | |||||||||
| Being: | ||||||||||||
| Recognized over time: | ||||||||||||
| Maintenance revenue | 2,051.6 | 2,818.9 | 720.7 | |||||||||
| SaaS & other recurring revenue | 278.9 | 365.1 | - | |||||||||
| 2,330.5 | 3,184.0 | 720.7 | ||||||||||
| Recognized at point in time: | ||||||||||||
| Licence revenue | 800.0 | 1,206.1 | 308.4 | |||||||||
| Consulting revenue | 217.9 | 364.3 | 48.2 | |||||||||
| 1,017.9 | 1,570.4 | 356.6 | ||||||||||
| Total revenue | 3,348.4 | 4,754.4 | 1,077.3 | |||||||||
Consolidated financial statements and notes
Notes to the consolidated financial statements
2 Supplementary information continued
Analysis of revenue from contracts with customers
Year ended October 31, 2021 | Year ended October 31, 2020 | Year ended October 31, 2019 | ||||||||||
| $m | $m | $m | ||||||||||
| Revenue from contracts with customers | 2,899.9 | 3,001.0 | 3,348.4 | |||||||||
| Being: | ||||||||||||
| Recognized over time: | ||||||||||||
| Maintenance revenue | 1,791.7 | 1,920.8 | 2,051.6 | |||||||||
| SaaS & other recurring revenue | 239.8 | 245.3 | 278.9 | |||||||||
| 2,031.5 | 2,166.1 | 2,330.5 | ||||||||||
| Recognized at point in time: | ||||||||||||
| Licence revenue | 688.6 | 646.5 | 800.0 | |||||||||
| Consulting revenue | 179.8 | 188.4 | 217.9 | |||||||||
| 868.4 | 834.9 | 1,017.9 | ||||||||||
| Total Revenue | 2,899.9 | 3,001.0 | 3,348.4 | |||||||||
Analysis of revenue by product
Set out below is an analysis of revenue from continuing operations recognized between the principal product portfoliosProduct Portfolios for the 12 monthsYear ended October 31, 2019, 18 months2021 with comparatives:
Year ended October 31, 2018 and 12 months ended April 30, 2017. As a result of the acquisition of HPE Software business the Group’s product portfolios have been redefined. The comparatives for the 12 months ended April 30, 2017 have not been represented into the new product portfolios.2021:
| Licence | Maintenance | SaaS & other recurring | Consulting | Total | ||||||||||||||||
| $m | $m | $m | $m | $m | ||||||||||||||||
| AMC | 155.3 | 315.9 | 0 | 10.3 | 481.5 | |||||||||||||||
| ADM | 106.1 | 408.5 | 78.9 | 18.6 | 612.1 | |||||||||||||||
| ITOM | 172.7 | 507.8 | 4.3 | 106.3 | 791.1 | |||||||||||||||
| CyberRes | 174.5 | 383.9 | 36.3 | 29.1 | 623.8 | |||||||||||||||
| IM&G | 80.0 | 175.6 | 120.3 | 15.5 | 391.4 | |||||||||||||||
| Total Revenue | 688.6 | 1,791.7 | 239.8 | 179.8 | 2,899.9 | |||||||||||||||
Licence | Maintenance | Consulting | SaaS & other recurring | Total | ||||||||||||||||
| $m | $m | $m | $m | $m | ||||||||||||||||
| Application Modernization & Connectivity | 170.9 | 326.1 | 11.7 | - | 508.7 | |||||||||||||||
| Application Delivery Management | 130.3 | 485.4 | 18.2 | 87.8 | 721.7 | |||||||||||||||
| IT Operations Management | 237.5 | 645.8 | 127.5 | 11.0 | 1,021.8 | |||||||||||||||
| Security | 185.7 | 416.7 | 43.9 | 35.0 | 681.3 | |||||||||||||||
| Information Management & Governance | 75.6 | 183.6 | 16.6 | 145.9 | 421.7 | |||||||||||||||
| Subtotal | 800.0 | 2,057.6 | 217.9 | 279.7 | 3,355.2 | |||||||||||||||
| Deferred revenue haircut | - | (6.0 | ) | - | (0.8 | ) | (6.8 | ) | ||||||||||||
| Total Revenue | 800.0 | 2,051.6 | 217.9 | 278.9 | 3,348.4 | |||||||||||||||
2020:
Licence | Maintenance | Consulting | SaaS & other recurring | Total | ||||||||||||||||
| $m | $m | $m | $m | $m | ||||||||||||||||
| Application Modernization & Connectivity | 256.3 | 497.6 | 17.9 | - | 771.8 | |||||||||||||||
| Application Delivery Management | 185.5 | 646.7 | 41.6 | 114.1 | 987.9 | |||||||||||||||
| IT Operations Management | 363.1 | 869.9 | 192.8 | 15.1 | 1,440.9 | |||||||||||||||
| Security | 291.6 | 580.2 | 81.4 | 41.6 | 994.8 | |||||||||||||||
| Information Management & Governance | 117.2 | 267.2 | 32.6 | 203.1 | 620.1 | |||||||||||||||
| Subtotal | 1,213.7 | 2,861.6 | 366.3 | 373.9 | 4,815.5 | |||||||||||||||
| Deferred revenue haircut | (7.6 | ) | (42.7 | ) | (2.0 | ) | (8.8 | ) | (61.1 | ) | ||||||||||
| Total Revenue | 1,206.1 | 2,818.9 | 364.3 | 365.1 | 4,754.4 | |||||||||||||||
| Licence | Maintenance | SaaS & other recurring | Consulting | Total | ||||||||||||||||
| $m | $m | $m | $m | $m | ||||||||||||||||
| AMC | 138.6 | 321.6 | 0 | 10.1 | 470.3 | |||||||||||||||
| ADM | 102.0 | 439.2 | 73.9 | 15.9 | 631.0 | |||||||||||||||
| ITOM | 175.1 | 559.4 | 4.6 | 113.9 | 853.0 | |||||||||||||||
| CyberRes | 162.6 | 416.8 | 33.6 | 33.1 | 646.1 | |||||||||||||||
| IM&G | 68.2 | 184.2 | 133.4 | 15.4 | 401.2 | |||||||||||||||
| Subtotal | 646.5 | 1,921.2 | 245.5 | 188.4 | 3,001.6 | |||||||||||||||
| Deferred revenue haircut | 0 | (0.4 | ) | (0.2 | ) | 0 | (0.6 | ) | ||||||||||||
| Total Revenue | 646.5 | 1,920.8 | 245.3 | 188.4 | 3,001.0 | |||||||||||||||
Licence | Maintenance | Consulting | SaaS & other recurring | Total | ||||||||||||||||
| $m | $m | $m | $m | $m | ||||||||||||||||
| Application Modernization & Connectivity | 106.0 | 149.7 | 9.5 | - | 265.2 | |||||||||||||||
| Application Delivery Management | 69.1 | 104.9 | 1.9 | - | 175.9 | |||||||||||||||
| IT Operations Management | 48.6 | 141.3 | 18.4 | - | 208.3 | |||||||||||||||
| Security | 55.5 | 219.6 | 13.8 | - | 288.9 | |||||||||||||||
| Information Management & Governance | 29.2 | 112.1 | 4.6 | - | 145.9 | |||||||||||||||
| Subtotal | 308.4 | 727.6 | 48.2 | - | 1,084.2 | |||||||||||||||
| Deferred revenue haircut | - | (6.9 | ) | - | - | (6.9 | ) | |||||||||||||
| Total Revenue | 308.4 | 720.7 | 48.2 | - | 1,077.3 | |||||||||||||||
Consolidated financial statements and notes
Notes to the consolidated financial statements
2 Supplementary information continued
Year ended October 31, 2019:
Licence | Maintenance | SaaS & other recurring | Consulting | Total | ||||||||||||||||
| $m | $m | $m | $m | $m | ||||||||||||||||
| AMC | 170.9 | 326.1 | 0 | 11.7 | 508.7 | |||||||||||||||
| ADM | 130.3 | 485.4 | 87.8 | 18.2 | 721.7 | |||||||||||||||
| ITOM | 237.5 | 645.8 | 11.0 | 127.5 | 1,021.8 | |||||||||||||||
| CyberRes | 185.7 | 416.7 | 35.0 | 43.9 | 681.3 | |||||||||||||||
| IM&G | 75.6 | 183.6 | 145.9 | 16.6 | 421.7 | |||||||||||||||
| Subtotal | 800.0 | 2,057.6 | 279.7 | 217.9 | 3,355.2 | |||||||||||||||
| Deferred revenue haircut | 0 | (6.0 | ) | (0.8 | ) | 0 | (6.8 | ) | ||||||||||||
| Total Revenue | 800.0 | 2,051.6 | 278.9 | 217.9 | 3,348.4 | |||||||||||||||
3 ProfitLoss before tax
The (loss)/profitloss before tax is stated after charging/(crediting) the following operating costs/(gains) classified by the nature of the costs/(gains):
12 months ended October 31, 2019 | 18 months ended October 31, 2018 | 12 months ended April 30, 2017 | ||||||||||||||
| Note | $m | $m | $m | |||||||||||||
| Staff costs | 33 | 1,409.0 | 2,095.0 | 480.7 | ||||||||||||
| Depreciation of property, plant and equipment: | ||||||||||||||||
| - owned assets | 12 | 52.6 | 71.2 | 9.7 | ||||||||||||
| - leased assets | 12 | 13.9 | 17.4 | - | ||||||||||||
| Loss on disposal of property, plant and equipment | 12 | 3.6 | 4.7 | 0.5 | ||||||||||||
| Amortization of intangibles | 11 | 716.5 | 903.1 | 206.7 | ||||||||||||
| Inventories | ||||||||||||||||
| – cost of inventories recognized as a debit (included in cost of sales) | 15 | 0.1 | 0.3 | - | ||||||||||||
| Operating lease rentals payable: | ||||||||||||||||
| - plant and machinery | 7.0 | 8.8 | 2.9 | |||||||||||||
| - property | 58.9 | 85.3 | 18.4 | |||||||||||||
| Provision for receivables impairment | 16 | 16.0 | 40.0 | 2.0 | ||||||||||||
| Foreign exchange gain on derivative financial instruments | (6.9 | ) | - | - | ||||||||||||
| Foreign exchange loss/(gain) | 18.2 | (37.4 | ) | (2.9 | ) | |||||||||||
Year ended October 31, 2021 | Year ended October 31, 2020 | Year ended October 31, 2019 | ||||||||||||||
| Note | $m | $m | $m | |||||||||||||
| Staff costs | 28 | 1,396.0 | 1,344.4 | 1,409.0 | ||||||||||||
| Depreciation of property, plant and equipment: | 12 | 33.7 | 42.0 | 52.6 | ||||||||||||
Depreciation of right-of-use asset (2019: finance lease depreciation)1 | 19 | 73.3 | 76.9 | 13.9 | ||||||||||||
| Loss on disposal of property, plant and equipment | 12 | 1.2 | 5.6 | 3.6 | ||||||||||||
| Amortization of intangible assets | 11 | 956.4 | 674.1 | 716.5 | ||||||||||||
| Operating lease rentals payable: | ||||||||||||||||
| - plant and machinery | 0 | 0 | 7.0 | |||||||||||||
| - property | 0 | 0 | 58.9 | |||||||||||||
| Provision for receivables impairment charge/(release) | 14 | 0.6 | (4.8 | ) | 16.0 | |||||||||||
| Foreign exchange loss/(gain) on derivative financial instruments | 0 | 21.8 | (6.9 | ) | ||||||||||||
| Foreign exchange loss | 0.1 | 7.9 | 18.2 | |||||||||||||
1 | $13.9 million of depreciation on leased assets was included in depreciation of property, plant and equipment in the Year ended October 31, 2019. No depreciation in relation to leased assets is included in depreciation of property, plant and equipment in the periods ended October 31, 2020 and 2021 as all leased assets are classified as right-of-use assets following the adoption of IFRS 16. |
12 months ended October 31, 2019 | 18 months ended October 31, 2018 | 12 months ended April 30, 2017 | ||||||||||||||
| Reported within Operating profit: | Note | $m | $m | $m | ||||||||||||
| Integration costs | 245.9 | 279.0 | 27.6 | |||||||||||||
| Pre-acquisition costs | - | 43.0 | 58.0 | |||||||||||||
| Acquisition costs | 1.5 | 27.1 | 2.6 | |||||||||||||
| Property related costs | 16.3 | 38.1 | 5.6 | |||||||||||||
| Severance and legal costs | 32.1 | 129.7 | 3.4 | |||||||||||||
| Divestiture | 2.1 | 21.3 | - | |||||||||||||
| Gain on disposal of Atalla | (3.7 | ) | - | - | ||||||||||||
| 294.2 | 538.2 | 97.2 | ||||||||||||||
| Reported within finance costs: | ||||||||||||||||
| Finance costs incurred in escrow period | 6 | - | 6.4 | - | ||||||||||||
| Reported within finance income: | ||||||||||||||||
| Finance income earned in escrow period | 6 | - | (0.6 | ) | - | |||||||||||
| - | 5.8 | - | ||||||||||||||
| Exceptional costs before tax | 294.2 | 544.0 | 97.2 | |||||||||||||
| Tax: | ||||||||||||||||
| Tax effect of exceptional items | (54.3 | ) | (105.9 | ) | (11.6 | ) | ||||||||||
| Tax exceptional item | - | (692.3 | ) | - | ||||||||||||
| (54.3 | ) | (798.2 | ) | (11.6 | ) | |||||||||||
| Reported within profit from discontinued operation (attributable to equity shareholders of the Company): | ||||||||||||||||
Gain on disposal of discontinued operation | 37 | (1,458.5 | ) | - | - | |||||||||||
| Exceptional profit after tax | (1,218.6 | ) | (254.2 | ) | 85.6 | |||||||||||
Consolidated financial statements and notes
Notes to the consolidated financial statements
4 Exceptional itemscontinued
Year ended October 31, 2021 | Year ended October 31, 2020 | Year ended October 31, 2019 | |||||||||||
| Reported within Operating loss: | Note | $m | $m | $m | |||||||||
| Integration costs | 98.0 | 152.6 | 245.9 | ||||||||||
| Divestiture and acquisition costs | 3.6 | 0.2 | 3.6 | ||||||||||
| Property-related costs | 11.1 | 15.2 | 16.3 | ||||||||||
| Severance and legal costs | 27.3 | 33.7 | 32.1 | ||||||||||
| Legal settlement and associated costs | 75.4 | 0 | 0 | ||||||||||
| Other restructuring costs | 31.7 | 10.7 | 0 | ||||||||||
| Goodwill impairment | 0 | 2,799.2 | 0 | ||||||||||
| Gain on disposal of Atalla | 0 | 0 | (3.7 | ) | |||||||||
| Exceptional costs before tax | 247.1 | 3,011.6 | 294.2 | ||||||||||
| Tax effect of exceptional items | (76.3 | ) | (38.7 | ) | (54.3 | ) | |||||||
| Reported within profit from discontinued operation (attributable to equity shareholders of the Company): | |||||||||||||
| (Gain)/loss on disposal of discontinued operation | 30 | (10.7 | ) | 2.2 | (1,458.5 | ) | |||||||
| Exceptional costs/(profit) after tax | 160.1 | 2,975.1 | (1,218.6 | ) | |||||||||
Exceptional items are allocated to the financial statement lines (for example: cost of sales) in the Consolidated statement of comprehensive income based on the nature and function of the costs,costs; for example restructuring costs related to employees are classified where their original employment costs are recorded. Exceptional items included in operating profit are reported in the following financial statement lines Cost of sales $2.6 million (2020: $4.0 million; 2019: $12.6 million), Selling and distribution expenses $4.8 million (2020: $12.9 million; 2019: $8.4 million), research and development expense $0.4 million credit (2020: $0.9 million; 2019: $0.5 million credit ) and Administrative expenses $240.1 million (2020: $2,993.8 million; 2019: $273.7 million).
Integration costs
Integration costs of $245.9m$98.0 million for the 12 monthsyear ended October 31, 2019 arose from2021 (2020: $152.6 million; 2019; $245.9 million) reflect the continuing work being donecosts incurred in integrating the HPE SoftwareIT design, build and migration onto a single new transformative IT platform for the entire group and a wide range of projects undertaken to conform, simplify and increase efficiency across the business into Micro Focus as referred to in Item 5.A. Operating results. Other activities include system and processes integration costs. Integrationare exceptional by virtue of size and nature.
Divestiture and acquisition costs
Acquisition costs of $279.0m$1.3 million in the 18 monthsyear ended October 31, 2018 (12 months2021 relate to April 30, 2017: $27.6m) arose mainly from the work done to integrate Serena, GWAVAacquisitions of Streamworx and the HPE Software business into the Micro Focus business.
Property-related costs
Property-related costs of $11.1 million for the year ended October 31, 2018 of $27.1m included external costs in completing the acquisition of the HPE Software business and costs relating to the acquisition of COBOL-IT SAS. The external costs mainly relate to due diligence work, legal work on the acquisition agreements and professional advisors on the transaction. Costs of $2.6m in the 12 months to April 30, 2017 related to the acquisitions of Serena in May 2016 and GWAVA in October 2016.
Severance and legal costs
Severance and legal costs of $32.1m$27.3 million for the 12 monthsyear ended October 31, 2019 (18 months ended October 31, 2018: $129.7m, 12 months to April 30, 2017: $3.4m)2021 (2020: $33.7 million; 2019: $32.1 million) relate mostly to termination costs for employees after acquisition, relatingas the Group continues to remove duplication and simplify the continuing operations as it executes the target operating model resulting from the Strategic & Operational review and are exceptional by virtue of nature.
F-29
Consolidated financial statements and notes
Notes to the integrationconsolidated financial statements
4 Exceptional items continued
Legal settlements and associated costs
Legal settlements and associated costs of the HPE Software business into Micro Focus. The costs$75.4 million for the 12 months ended April 30, 2017 of $3.4m related to termination costs for senior Serena executives after acquisition.
In concluding this matter, the Board considered a range of factors, including the possible time, cost and significant resources required for the appeal process and concluded that it was in the best interests of the Company that a settlement should be reached.
Pursuant to the settlement, the Company has been granted a fully paid-up, worldwide, irrevocable licence for the patents asserted by Wapp for current and future Micro Focus products and services, covering the Company as well as its customers. No consideration was allocated to the licence received.
The agreed settlement amount of $67.5 million was paid in September 2021 therefore 0 remaining balances are held in relation to Wapp at October 31, 2021.
Other restructuring costs
Other restructuring costs of $31.7 million for the year ended October 31, 2018: $21.3m, 12 months2021 (2020: $10.7 million; 2019: $nil) relates to April 30, 2017: $nil) relate mostly to fees paid to professional advisors involvedthe costs of implementing the initiatives included in the disposalStrategic & Operational review and are exceptional by virtue of nature. These include costs of restructuring of the SUSE business completedGroup to deliver the target operating model design and cost base and certain IT expenditure required to support the related simplification of the Group.
Goodwill impairment
NaN goodwill impairment charge was made in 2019.the year ended October 31, 2021 (2020: $2,799.2 million; 2019 $nil), see note 10, “Goodwill”, for additional information.
Tax effect of exceptional items
The tax effect of exceptional items on the income statement is a credit of $76.3 million for the year ended October 31, 2021 (2020: $38.7 million credit; 2019: $54.3 million credit). Exceptional items include a tax credit of $19.1 million (2020 charge: $19.1 million, 2019: $nil) in relation to the transfer of assets between tax jurisdictions as a result of acquisitions by the Group in the year ended October 31, 2019. This is considered exceptional in nature as it has resulted from the integration activities to simplify and increase efficiency across the business.
EU State aid
Whilst no income statement charge has been recognized in the period, payments totaling $46.8 million (2020: nil; 2019: nil) have been made in relation to the EU State Aid case which we consider to be exceptional. Details of this case are set out in note 7 Taxation.
Gain on disposal of Atalla
The non-recurring gain on disposal of $3.7m$3.7 million for the 12 monthsYear ended October 31, 2019 (18 monthsrelated to Atalla business disposal.
Gain on disposal of discontinued operation
The gain on disposal of discontinued operation of $10.7m in the year ended October 31, 2018: $nil)2021 (2020: loss of $2.2 million, 2019: $1,458.5 million) relates to Atalla business disposal (note 37).
Consolidated financial statements and notes
Notes to the consolidated financial statements
5 Services provided by the Group’s auditors and network of firms
During the 12 monthsYear ended October 31, 2019,2021, the Group obtained the following services from the Group’s auditors as detailed below which have been disclosed in line with the ICAEW Technical Release “Tech 14/13 FRF” guidance on the disclosure of auditor remuneration for the audit of accounts and other (non-audit) services, in accordance with the requirements of the Companies (Disclosure of Auditor Remuneration and Liability Agreements) Regulation 2008 (Statutory Instrument 2008/489) as amended:
below:
below:
Year ended October 31, 2021 | Year ended October 31, 2020 | Year ended October 31, 2019 | ||||||||||
| $m | $m | $m | ||||||||||
Audit of Company | 8.0 | 7.2 | 12.8 | |||||||||
ICOFR audit | 4.7 | 2.7 | 3.0 | |||||||||
Audit of subsidiaries | 2.8 | 2.9 | 3.9 | |||||||||
| Total audit | 15.5 | 12.8 | 19.7 | |||||||||
Audit-related assurance services | 0.5 | 0.6 | 0.6 | |||||||||
| Total assurance services | 0.5 | 0.6 | 0.6 | |||||||||
Tax advisory services | 0 | 0 | 0.1 | |||||||||
| Services relating to taxation | 0 | 0 | 0.1 | |||||||||
| Total | 16.0 | 13.4 | 20.4 | |||||||||
12 months ended October 31, 2019 | 18 months ended October 31, 2018 | 12 months ended April 30, 2017 | ||||||||||
| $m | $m | $m | ||||||||||
| Audit of Company | 12.8 | 12.2 | 1.0 | |||||||||
| Audit of subsidiaries | 3.9 | 1.9 | 2.5 | |||||||||
| Total audit | 16.7 | 14.1 | 3.5 | |||||||||
| Audit related assurance services | 3.6 | 0.9 | 2.6 | |||||||||
| Other assurance services | - | 0.7 | - | |||||||||
| Total assurance services | 3.6 | 1.6 | 2.6 | |||||||||
| Tax compliance services | - | 0.2 | - | |||||||||
| Tax advisory services | 0.1 | 0.2 | 0.1 | |||||||||
| Services relating to taxation | 0.1 | 0.4 | 0.1 | |||||||||
| Other non-audit services | - | 0.1 | 7.5 | |||||||||
| Total | 20.4 | 16.2 | 13.7 | |||||||||
Of the audit relatedaudit-related assurance services engagements undertaken in the 12 monthsyear ended October 31, October 20192021 only one (2020: one; 2019: one) was considered to be significant. This related to the controls attestation ofreview procedures over the Group’s implementation of Sarbanes-Oxley Section 404,interim financial statements, for which a fee of $3.0m$0.5 million (2020: $0.6 million, 2019 $0.6 million) was paid.
6 Finance income and finance costs
Year ended October 31, 2021 | Year ended October 31, 2020 | Year ended October 31, 2019 | ||||||||||||||
| Note | $m | $m | $m | |||||||||||||
| Finance costs | ||||||||||||||||
| Interest on bank borrowings | 163.6 | 176.1 | 225.4 | |||||||||||||
| Commitment fees | 1.3 | 1.7 | 1.9 | |||||||||||||
| Amortization of facility costs and original issue discounts | 34.0 | 58.0 | 46.7 | |||||||||||||
| Finance costs on bank borrowings | 198.9 | 235.8 | 274.0 | |||||||||||||
| Net interest expense on retirement obligations | 22 | 1.5 | 1.8 | 2.4 | ||||||||||||
| Interest on lease liabilities | 19 | 10.0 | 13.2 | 2.0 | ||||||||||||
| Interest rate swaps: cash flow hedges | 41.3 | 23.7 | 0 | |||||||||||||
| Other | 2.2 | 7.1 | 4.0 | |||||||||||||
| Total | 253.9 | 281.6 | 282.4 | |||||||||||||
Year ended October 31, 2021 | Year ended October 31, 2020 | Year ended October 31, 2019 | ||||||||||||||
| $m | $m | $m | ||||||||||||||
| Finance income | ||||||||||||||||
| Bank interest | 1.5 | 2.4 | 16.3 | |||||||||||||
| Interest on non-plan pension assets | 22 | 0.2 | 0.2 | 0.3 | ||||||||||||
| Interest rate swaps: cash flow hedges | 0 | 0 | 9.9 | |||||||||||||
| Other | 0 | 0 | 0.1 | |||||||||||||
| Total | 1.7 | 2.6 | 26.6 | |||||||||||||
| Net finance cost | 252.2 | 279.0 | 255.8 | |||||||||||||
F-31
Consolidated financial statements and notes
Notes to the consolidated financial statements
12 months ended October 31, 2019 | 18 months ended October 31, 2018 | 12 months ended April 30, 2017 | ||||||||||||||
| Note | $m | $m | $m | |||||||||||||
| Finance costs | ||||||||||||||||
| Interest on bank borrowings | 225.4 | 276.5 | 81.2 | |||||||||||||
| Commitment fees | 1.9 | 3.3 | 0.8 | |||||||||||||
| Amortization of facility costs and original issue discounts | 46.7 | 60.4 | 14.2 | |||||||||||||
| Finance costs on bank borrowings | 274.0 | 340.2 | 96.2 | |||||||||||||
| Net interest expense on retirement obligations | 25 | 2.4 | 2.8 | 0.6 | ||||||||||||
| Finance lease expense | 2.0 | 2.7 | - | |||||||||||||
| Interest rate swaps: cash flow hedges, transfer from equity | - | 3.4 | - | |||||||||||||
| Other | 4.0 | 1.3 | - | |||||||||||||
| Total | 282.4 | 350.4 | 96.8 | |||||||||||||
12 months ended October 31, 2019 | 18 months ended October 31, 2018 | 12 months ended April 30, 2017 | ||||||||||||||
| $m | $m | $m | ||||||||||||||
| Finance income | ||||||||||||||||
| Bank interest | 16.3 | 3.6 | 0.4 | |||||||||||||
| Interest on non-plan pension assets | 25 | 0.3 | 0.6 | 0.4 | ||||||||||||
| Interest rate swaps: cash flow hedges, transfer to equity | 9.9 | - | - | |||||||||||||
| Other | 0.1 | 3.5 | 0.2 | |||||||||||||
| Total | 26.6 | 7.7 | 1.0 | |||||||||||||
| Net finance cost | 255.8 | 342.7 | 95.8 | |||||||||||||
| Included within exceptional items | ||||||||||||||||
| Finance costs incurred in escrow period | 4 | - | 6.4 | - | ||||||||||||
| Finance income earned in escrow period | 4 | - | (0.6 | ) | - | |||||||||||
| - | 5.8 | - | ||||||||||||||
7 Taxation
12 months ended October 31, 2019 | 18 months ended October 31, 2018 | 12 months ended April 30, 2017 | ||||||||||
| $m | $m | $m | ||||||||||
| Current tax | ||||||||||||
| Current period | 163.9 | 245.8 | 33.9 | |||||||||
| Adjustments to tax in respect of previous periods | (35.3 | ) | (14.7 | ) | 1.7 | |||||||
| 128.6 | 231.1 | 35.6 | ||||||||||
| Deferred tax | ||||||||||||
| Origination and reversal of temporary differences | (139.7 | ) | 26.4 | (22.4 | ) | |||||||
| Adjustments to tax in respect of previous periods | 24.5 | 1.2 | (4.4 | ) | ||||||||
| Previously unrecognized temporary differences | (29.4 | ) | - | - | ||||||||
| Impact of change in tax rates | - | (931.8 | ) | (1.3 | ) | |||||||
| (144.6 | ) | (904.2 | ) | (28.1 | ) | |||||||
| Total tax (credit)/expense | (16.0 | ) | (673.1 | ) | 7.5 | |||||||
Year ended October 31, 2021 | Year ended October 31, 2020 | Year ended October 31, 2019 | ||||||||||
| Continuing operations | $m | $m | $m | |||||||||
| Current tax | ||||||||||||
| Current year | 145.7 | 175.4 | 163.9 | |||||||||
| Adjustments to tax in respect of previous periods | 0.9 | 7.8 | (35.3 | ) | ||||||||
| 146.6 | 183.2 | 128.6 | ||||||||||
| Deferred tax | ||||||||||||
| Origination and reversal of temporary differences | (237.9 | ) | (195.3 | ) | (139.7 | ) | ||||||
| Adjustments to tax in respect of previous periods | (23.3 | ) | 10.7 | 24.5 | ||||||||
| Previously unrecognized temporary differences | 0 | 0 | (29.4 | ) | ||||||||
| Impact of changes in tax rates | 31.9 | 35.6 | 0 | |||||||||
| (229.3 | ) | (149.0 | ) | (144.6 | ) | |||||||
| Total tax (credit)/charge | (82.7 | ) | 34.2 | (16.0 | ) | |||||||
For the 12 monthsyear ended October 31, 2019,2021, a deferred tax debitcharge of $7.6m (18 months ended October 31, 2018: $23.7m debit; 12 months ended April 30, 2017: $23.0m credit)$0.2 million (2020: $1.5 million charge; 2019: $7.6 million charge) and 0 current tax credit of $13.1m (18 months ended October 31, 2018: $4.1m credit, 12 months ended April 30, 2017: $4.1mimpact (2020: $0.1 million credit; 2019: $13.1 million credit) have been recognized in equity in relation to share options.
A current tax creditcharge of $23.3m (18 months ended October 31, 2018: $16.4m debit)$8.0 million (2020: $7.8 million credit; 2019: $23.3 million credit) has been recognized in the hedging reserve (note 31)27, “Other reserves”).
There is also a current tax credit of $6.0 million (2020: 0 tax impact; 2019: 0 impact) and a deferred tax charge of $8.1 million (2020: $11.1 million credit; 2019: 0 impact) in relation to the currency translation differences. In addition, a deferred tax creditcharge of $13.0m (18 months ended October 31, 2018: $4.3m credit, 12 months ended April 30, 2017: $0.3m debit)$7.8 million (2020: $8.7 million; 2019: $14.0 million) has been recognized in the Consolidated statement of comprehensive income in relation to defined benefit pension schemes and a deferred tax credit of $14.0m (18 months ended October 31, 2018: $nil, 12 months ended April 30, 2017: $nil) in relation to foreign exchange movements on intangibles.intangibles and 0 charge (2020: $5.0 million charge; 2019: $13.0 million credit) in relation to defined benefit pension schemes.
There are also profits of $10.7 million in respect of discontinued operations and we do not expect a tax charge to arise on these.
F-32
Consolidated financial statements and notes
Notes to the consolidated financial statements
7 Taxation continued
The tax charge for the 12 monthsyear ended October 31, 20192021 is higher than the standard rate of corporation tax in the UK of 19.00% (18 months(Year ended October 31, 2018:2020: 19.00%; 12 monthsYear ended April 30, 2017: 19.92%October 31, 2019 19.00%). The differences are explained below:
12 months ended October 31, 2019 | 18 months ended October 31, 2018 | 12 months ended April 30, 2017 | Year ended October 31, 2021 | Year ended October 31, 2020 | Year ended October 31, 2019 | |||||||||||||||||||
| $m | $m | $m | $m | $m | $m | |||||||||||||||||||
| (Loss)/profit before taxation | (34.1 | ) | 34.1 | 131.6 | ||||||||||||||||||||
Loss before taxation | (517.8 | ) | (2,940.4 | ) | (34.1 | ) | ||||||||||||||||||
| Tax at UK corporation tax rate 19.00% (2018: 19.00%; 2017: 19.92%) | (6.5 | ) | 6.5 | 26.0 | ||||||||||||||||||||
Tax at UK corporation tax rate 19.00% (2020: 19.00%, 2019: 19.00%) | (98.4 | ) | (558.7 | ) | (6.5 | ) | ||||||||||||||||||
| Effects of: | ||||||||||||||||||||||||
| Tax rates other than the UK standard rate | (4.4 | ) | 17.8 | 0.6 | (8.6 | ) | (78.0 | ) | (4.4 | ) | ||||||||||||||
| Intra-Group financing | (42.8 | ) | (52.5 | ) | (15.7 | ) | 0.3 | (21.0 | ) | (42.8 | ) | |||||||||||||
| Interest restrictions | - | 31.8 | - | |||||||||||||||||||||
| Innovation tax credit benefits | (13.5 | ) | (21.4 | ) | (9.8 | ) | (22.3 | ) | (31.8 | ) | (13.5 | ) | ||||||||||||
| US foreign inclusion income | 43.7 | 39.0 | 0.4 | 15.5 | 20.4 | 43.7 | ||||||||||||||||||
| US transition tax | - | 238.3 | - | |||||||||||||||||||||
| Share options | 7.1 | 10.2 | - | 1.6 | 4.1 | 7.1 | ||||||||||||||||||
| Movement in deferred tax not recognized | 14.4 | 7.3 | 0.2 | 5.3 | 11.1 | 14.4 | ||||||||||||||||||
| Previously unrecognized temporary differences | (29.4 | ) | - | - | 0 | 0 | (29.4 | ) | ||||||||||||||||
| Effect of change in tax rates | - | (931.9 | ) | (1.3 | ) | |||||||||||||||||||
| Impact of rate changes | 31.9 | 35.6 | 0 | |||||||||||||||||||||
| Goodwill impairment | 0 | 592.8 | 0 | |||||||||||||||||||||
| Expenses not deductible and other permanent differences | 26.2 | (4.7 | ) | 9.8 | 14.4 | 41.2 | 26.2 | |||||||||||||||||
| (5.2 | ) | (659.6 | ) | 10.2 | (60.3 | ) | 15.7 | (5.2 | ) | |||||||||||||||
| Adjustments to tax in respect of previous periods: | ||||||||||||||||||||||||
| Current tax | (35.3 | ) | (14.7 | ) | 1.7 | 0.9 | 7.8 | (35.3 | ) | |||||||||||||||
| Deferred tax | 24.5 | 1.2 | (4.4 | ) | (23.3 | ) | 10.7 | 24.5 | ||||||||||||||||
| (10.8 | ) | (13.5 | ) | (2.7 | ) | (22.4 | ) | 18.5 | (10.8 | ) | ||||||||||||||
| Total taxation | (16.0 | ) | (673.1 | ) | 7.5 | (82.7 | ) | 34.2 | (16.0 | ) | ||||||||||||||
The Group continues to benefit from the UK’s Patent Box regime, US R&D tax credits and other innovation-based tax credits offered by certain jurisdictions, the benefit for the 12 monthsyear ended October 31, 20192021 being $13.5m (18 months ended October 31, 2018: $21.4m, 12 months ended April 30, 2017: $9.8m)$22.3 million(2020: $31.8 million; 2019: $13.5 million). The Group realized benefits in relation toFollowing the unwind of the intra-Group financing of $42.8min FY20, the Group does not realize a benefit from this for the 12 months ended October 31, this period onwards (2020: $21.0 million; 2019 ($52.5m for the 18 months ended October 31, 2018; 12 months ended April 30, 2017: $15.7m): $42.8 million). The benefits mostly relate to arrangements put in place to facilitate the acquisitions of the HPE Software business, The Attachmate Group and Serena.
US foreign inclusion income of $43.7m$15.5 million arising in the 12 monthsyear ended October 31, 2019 (18 months ended October 31, 2018: $39.0m; 12 months ended April 30 2017: $0.4m)2021 (2020: $20.4 million; 2019: $43.7 million) is largely driven by new US tax legislation introduced as part of US tax reforms in 2018.
A change to the future main UK corporation tax rate, announced in the 2021 UK Budget, was substantively enacted for IFRS purposes on May 24, 2021. The rate applicable from April 1, 2023 will be increased from 19% to 25%. The Group has remeasured its UK deferred tax assets and liabilities at the end of the reporting period at a blended rate, based on when the UK temporary differences are expected to reverse. The impact of this and other changes in tax rate across the group has resulted in a tax charge of $31.9 million in the income statement.
The Group recognized a net overallexpenses not deductible and other permanent differences charge of $14.4 million (2020: $41.2 million; 2019: $26.2 million) includes $6.4 million in relation to uncertain tax positions, $16.3 million in respect of share options dueUS Base Erosion (“BEAT”) rules and $9.9 million related to deferredirrecoverable withholding tax. Following an election made in the US for an intangible asset previously transferred into the US, tax credits arisingdeductions are now available on options held at the balance sheet date being lower than the current tax charge becauseamortization of the termsasset. There is a tax benefit of $19.1 million in the options.year ended October 31, 2021 which is included in expenses not deductible and other permanent differences.
Consolidated financial statements and notes
Notes to the consolidated financial statements
7 Taxation continued
The Group realized a net credit in relation to the true-up of prior period,periods, current and deferred tax estimates of $10.8m$22.4 million credit for the 12 monthsyear ended October 31, 2019 (18 months ended October 31, 2018: $13.5m; 12 months ended April 30, 2017: $2.7m)2021 (2020: $18.5 million charge; 2019: $10.8 million credit).
The Group’s tax charge is subject to various factors, many of which are outside the control of the Group, including changes in local tax legislation, and specifically additional changes expected to be introduced in the US and global tax reform as governments respond to COVID-19 and the OECD’s Base Erosion and Profit Shifting project and the consequences of Brexit.(“BEPS”).
In April 2019, the European Commission published its final decision on its state aidState Aid investigation into the UK’s “Financing‘Financing Company Partial Exemption”Exemption’ legislation and concluded that part of the legislation is in breach of EU State Aid rules. Similar to other UK basedUK-based international groups that have acted in accordance with the UK legislation in force at the time, the Group may be affected by the finding and is monitoring developments. The UK Governmentgovernment and UK-based international companies, including the Group, have appealed to the General Court of the European Union against the decision. TheIn February 2021 the Group received and settled State Aid charging notices (excluding interest) totaling $44.2 million, issued by HM Revenue and Customs, following the requirement for the UK Government is requiredgovernment to start collection proceedings in advanceproceedings. In May 2021, the Group received and settled State Aid interest charging notices from HM Revenue and Customs totaling $2.6 million. In addition, there has been a challenge from the UK Tax Authorities into the historic financing arrangements of the appeal results and it is possible that the Group will be required to make a payment in the year ending October 31, 2020. If the decision of the European Commission is upheld, the Group have calculated the maximum potential liability to be $60.3m.Group. Based on its current assessment and supported by external professional advice, the Group consider that the maximum liability of both of these items to be $60 million. Based on its current assessment and also supported by external professional advice, the Group believes that no provision is required in respect of this issue. Thethese issues and a long-term current tax receivable has been recognized in respect of the amounts paid (including movements due to FX) at the balance sheet date. No additional liability should accrue in future periods in respect of these matters, following (i) an amendment of the UK legislation affected by thisthe EU Commission finding was amended on January 1, 2019, to be compliant with EU law, and therefore no longer impacts(ii) the Groupunwind of the financing company arrangements in question. A judgement in respect of the appeal that was heard in the General Court in November 2021 is expected in 2022 and so no additionalManagement intend to reassess the above position at that time.
| B | Current tax receivables |
| October 31, 2021 | October 31, 2020 | |||||||
| $m | $m | |||||||
| Corporation tax | 59.1 | 45.3 | ||||||
| C | Non-current tax receivables |
October 31, 2021 | October 31, 2020 | |||||||
| $m | $m | |||||||
| Corporation tax | 48.0 | 0 | ||||||
The non-current tax liabilityreceivable is $48.0 million (2020: nil). This non-current receivable reflects the payment that was made following the final decision published by the European Commission on its State Aid investigation into the UK’s ‘Financing Company Partial Exemption’ legislation. As this amount was paid in GBP, the long-term debtor balance will accrue in future periods that could be subject to the same challenge.vary year on year as a result of foreign exchange movements.
| D | Current tax liabilities |
12 months ended October 31, 2019 | 18 months ended October 31, 2018 | 12 months ended April 30, 2017 | ||||||||||
| Equity - ordinary | $m | $m | $m | |||||||||
| Final paid 58.33 cents (2018: 58.33 cents, 2017: 49.74 cents) per ordinary share | 240.7 | 133.9 | 111.0 | |||||||||
| First Interim paid 58.33 cents (2018: 34.60 cents; 2017: 29.73 cents) per ordinary share | 198.5 | 156.2 | 66.5 | |||||||||
| Second Interim paid nil cents (2018: 58.33 cents; 2017: nil cents) per ordinary share | - | 252.1 | - | |||||||||
| 439.2 | 542.2 | 177.5 | ||||||||||
| October 31, 2021 | October 31, 2020 | |||||||
| $m | $m | |||||||
| Corporation tax | 94.1 | 150.1 | ||||||
The directors announced a final dividend of 58.33 cents per share payable on May 7, 2020 to shareholders who are registered at April 14, 2020. This final dividend, amounting to $194.5m, has not been recognized, as a liability ascurrent tax creditor at October 31, 2019.2021 is $94.1 million (2020: $150.1 million). The current tax creditor includes liabilities in respect of uncertain tax positions, net of overpayments.
F-34
Consolidated financial statements and notes
Notes to the consolidated financial statements
7 Taxation continued
| E | Non-current tax liabilities |
| October 31, 2021 | October 31, 2020 | |||||||
| $m | $m | |||||||
Corporation tax | 91.9 | 102.7 | ||||||
The non-current tax creditor is $91.9 million (2020: $102.7 million). The non-current creditor reflects the US transition tax payable more than 12 months after the balance sheet date.
| F | Deferred tax |
Year ended October 31, 2021 | Year ended October 31, 2020 | |||||||||||
| Net Deferred tax liability | Note | $m | $m | |||||||||
| At November 1 | (841.1 | ) | (987.1 | ) | ||||||||
| Reallocated to deferred tax assets | (15.0 | ) | 0 | |||||||||
| Credited to consolidated statement of comprehensive income: | 229.3 | 147.9 | ||||||||||
| - Continuing operations | 7A | 229.3 | 149.0 | |||||||||
| - Discontinued operation | 0 | (1.1 | ) | |||||||||
Charged directly to equity | (0.2 | ) | (1.5 | ) | ||||||||
Charged to other comprehensive income: | (15.9 | ) | (2.5 | ) | ||||||||
| Acquisitions in the period | (1.9 | ) | 0 | |||||||||
| Reallocated to liabilities held for sale | 45.5 | 0 | ||||||||||
Impact of adoption of IFRS 16 | 0 | 1.8 | ||||||||||
Foreign exchange adjustment | 0.2 | 0.3 | ||||||||||
| At October 31, | (599.1 | ) | (841.1 | ) | ||||||||
Year ended October 31, 2021 | Year ended October 31, 2020 | |||||||
| Net Deferred tax asset | $m | $m | ||||||
At November 1 | 0 | 0 | ||||||
| Reallocated from deferred tax liabilities | 15.0 | 0 | ||||||
At October 31, | 15.0 | 0 | ||||||
Deferred tax assets and liabilities below are presented net where there is a legally enforceable right to offset and the intention to settle on a net basis.
F-35
Consolidated financial statements and notes
Notes to the consolidated financial statements
7 Taxation continued
Deferred tax assets
Tax losses and interest restrictions | Share based payments | Deferred revenue | Tax credits | Intangible assets | Other temporary differences | Research and development | Total | |||||||||||||||||||||||||
| $m | $m | $m | $m | $m | $m | $m | $m | |||||||||||||||||||||||||
At November 1, 2020 | 133.5 | 0.8 | 90.5 | 16.3 | 0 | 69.7 | 86.5 | 397.3 | ||||||||||||||||||||||||
| Credited/(charged) to consolidated statement of comprehensive income – continuing operations | 8.0 | 3.3 | 7.7 | (8.4) | 0 | 11.4 | 36.3 | 58.3 | ||||||||||||||||||||||||
| Credited to consolidated statement of comprehensive income – discontinued operation | 0 | 0 | 0 | 0 | 0 | 0 | 0 | 0 | ||||||||||||||||||||||||
| Charged directly to equity | 0 | (0.2 | ) | 0 | 0 | 0 | 0 | 0 | (0.2 | ) | ||||||||||||||||||||||
Charged to other comprehensive income | 0 | 0 | 0 | 0 | 0 | (8.1) | 0 | (8.1) | ||||||||||||||||||||||||
| Foreign exchange adjustment | 0 | 0.1 | 0 | 0 | 0 | (0.1) | 0 | 0 | ||||||||||||||||||||||||
| Subtotal | 141.5 | 4.0 | 98.2 | 7.9 | 0 | 72.9 | 122.8 | 447.3 | ||||||||||||||||||||||||
| Jurisdictional offsetting | (432.3 | ) | ||||||||||||||||||||||||||||||
At October 31, 2021 | 15.0 | |||||||||||||||||||||||||||||||
Tax losses and interest restrictions | Share based payments | Deferred revenue | Tax credits | Intangible assets | Other temporary differences | Research and development | Total | |||||||||||||||||||||||||
| $m | $m | $m | $m | $m | $m | $m | $m | |||||||||||||||||||||||||
| At November 1, 2019 | 100.5 | 5.0 | 108.6 | 6.8 | 0 | 88.6 | 0 | 309.5 | ||||||||||||||||||||||||
| Transferred from deferred tax liabilities | 0 | 0 | 0 | 0 | 0 | 0 | 13.6 | 13.6 | ||||||||||||||||||||||||
| Credited/(charged) to consolidated statement of comprehensive income – continuing operations | 33.0 | (2.7 | ) | (18.1 | ) | 9.5 | 0.2 | (24.4 | ) | 72.9 | 70.4 | |||||||||||||||||||||
| Credited to consolidated statement of comprehensive income – discontinued operation | 0 | 0 | 0 | 0 | 0 | (1.1 | ) | 0 | (1.1 | ) | ||||||||||||||||||||||
| Credited directly to equity | 0 | (1.5 | ) | 0 | 0 | 0 | 0 | 0 | (1.5 | ) | ||||||||||||||||||||||
| Debited to other comprehensive income | 0 | 0 | 0 | 0 | 0 | 6.2 | 0 | 6.2 | ||||||||||||||||||||||||
| Foreign exchange adjustment | 0 | 0 | 0 | 0 | (0.2 | ) | 0.4 | 0 | 0.2 | |||||||||||||||||||||||
| Subtotal | 133.5 | 0.8 | 90.5 | 16.3 | 0 | 69.7 | 86.5 | 397.3 | ||||||||||||||||||||||||
| Jurisdictional offsetting | (397.3 | ) | ||||||||||||||||||||||||||||||
| At October 31, 2020 | 0 | |||||||||||||||||||||||||||||||
A deferred tax charge to equity of $0.2 million (2020: $1.5 million) arises during the year in relation to share-based payments.
The deferred tax asset relating to other temporary differences of $72.9 million as at October 31, 2021 (2020: $69.7 million) has increased during the year primarily due to the movement of various short term timing differences. Deferred tax assets are recognized in respect of tax losses carried forward to the extent that the realisation of the related tax benefit through the utilization of future taxable profits is probable.
F-36
Consolidated financial statements and notes
Notes to the consolidated financial statements
7 Taxation continued
Deferred tax assets
The Group did not recognize deferred tax assets in relation to the following gross temporary differences, the expiration of which is determined by the tax law of each jurisdiction:
| Expiration: | ||||||||||||||||||||||||||||||||
| 2022 | 2023 | 2024 | 2025 | 2026 | Thereafter | No expiry | Total | |||||||||||||||||||||||||
| $m | $m | $m | $m | $m | $m | $m | $m | |||||||||||||||||||||||||
At October 31, 2021 | ||||||||||||||||||||||||||||||||
| Type of temporary difference: | ||||||||||||||||||||||||||||||||
| Losses | 0.6 | 7.4 | 23.8 | 40.5 | 8.2 | 2,045.1 | 54.1 | 2,179.7 | ||||||||||||||||||||||||
| Credits | 3.2 | 1.8 | 1.4 | 1.4 | 0.9 | 4.7 | 41.1 | 54.5 | ||||||||||||||||||||||||
| Other | 0 | 0 | 0 | 0 | 0 | 35.3 | 23.9 | 59.2 | ||||||||||||||||||||||||
| Total | 3.8 | 9.2 | 25.2 | 41.9 | 9.1 | 2,085.1 | 119.1 | 2,293.4 | ||||||||||||||||||||||||
| Expiration: | ||||||||||||||||||||||||||||||||
| 2021 | 2022 | 2023 | 2024 | 2025 | Thereafter | No expiry | Total | |||||||||||||||||||||||||
| $m | $m | $m | $m | $m | $m | $m | $m | |||||||||||||||||||||||||
At October 31, 2020 | ||||||||||||||||||||||||||||||||
| Type of temporary difference: | ||||||||||||||||||||||||||||||||
| Losses | 5.0 | 11.9 | 23.7 | 43.4 | 13.3 | 2,226.7 | 50.7 | 2,374.7 | ||||||||||||||||||||||||
| Credits | 3.5 | 3.1 | 1.8 | 1.4 | 0.7 | 5.5 | 45.4 | 61.4 | ||||||||||||||||||||||||
| Other | 0 | 0 | 0 | 0 | 0 | 88.4 | 23.9 | 112.3 | ||||||||||||||||||||||||
| Total | 8.5 | 15.0 | 25.5 | 44.8 | 14.0 | 2,320.6 | 120.0 | 2,548.4 | ||||||||||||||||||||||||
Deferred tax liabilities
Intangible assets | Research and development | Other temporary differences | Total | |||||||||||||
| $m | $m | $m | $m | |||||||||||||
At November 1, 2020 | (1,180.5 | ) | 0 | (57.9 | ) | (1,238.4 | ) | |||||||||
| Charged to Consolidated statement of comprehensive income – continuing operations | 176.8 | 0 | (5.8 | ) | 171.0 | |||||||||||
| Credited to other comprehensive income – continuing operations | (7.8 | ) | 0 | 0 | (7.8 | ) | ||||||||||
| Acquisitions | (1.9 | ) | 0 | 0 | (1.9 | ) | ||||||||||
| Deferred tax liabilities reallocated to liabilities held for sale | 45.5 | 0 | 0 | 45.5 | ||||||||||||
| Foreign exchange adjustment | 0.2 | 0 | 0 | 0.2 | ||||||||||||
| Subtotal | (967.7 | ) | 0 | (63.7 | ) | (1,031.4 | ) | |||||||||
| Jurisdictional offsetting | 432.3 | |||||||||||||||
At October 31, 2021 | (599.1 | ) | ||||||||||||||
F-37
Consolidated financial statements and notes
Notes to the consolidated financial statements
7 Taxation continued
EDeferred tax continued
Intangible assets | Research and development | Other temporary differences | Total | |||||||||||||
| $m | $m | $m | $m | |||||||||||||
At November 1, 2019 | (1,257.1 | ) | 13.6 | (53.1 | ) | (1,296.6 | ) | |||||||||
| Transferred to deferred tax assets | 0 | (13.6 | ) | 0 | (13.6 | ) | ||||||||||
| Charged to Consolidated statement of comprehensive income – continuing operations | 85.4 | 0 | (6.8 | ) | 78.6 | |||||||||||
| Credited to other comprehensive income – continuing operations | (8.7 | ) | 0 | 0 | (8.7 | ) | ||||||||||
| Credited to equity – impact of adoption of IFRS 16 | 0 | 0 | 1.8 | 1.8 | ||||||||||||
| Foreign exchange adjustment | (0.1 | ) | 0 | 0.2 | 0.1 | |||||||||||
| Subtotal | (1,180.5 | ) | 0 | (57.9 | ) | (1,238.4 | ) | |||||||||
| Jurisdictional offsetting | 397.3 | |||||||||||||||
At October 31, 2020 | (841.1 | ) | ||||||||||||||
No deferred tax liability is recognized in respect of temporary differences associated with investments in subsidiaries and branches because the Group is in a position to control the timing of the reversal of the temporary differences, and none are expected to reverse in the foreseeable future.
8 Dividends
Year ended October 31, 2021 | Year ended October 31, 2020 | Year ended October 31, 2019 | ||||||||||
| Equity - ordinary | $m | $m | $m | |||||||||
Final paid 15.5 cents (2020: nil cents) per ordinary share | 51.7 | 0 | 240.7 | |||||||||
Interim paid 8.8 cents (2020: nil cents) per ordinary share | 29.4 | 0 | 198.5 | |||||||||
| 81.1 | 0 | 439.2 | ||||||||||
The directors announced a final dividend of 20.3 cents per share payable on April 21, 2022 to shareholders who are registered at March 11, 2022. This final dividend, amounting to $68.2 million, has not been recognized as a liability as at October 31, 2021.
F-38
Consolidated financial statements and notes
Notes to the consolidated financial statements
9 Earnings per share
The calculation of the basic earnings per share has been based on the earnings attributable to owners of the parent and the weighted average number of shares for each period.year.
Reconciliation of the earnings and weighted average number of shares:
12 months ended October 31, 2019 | 18 months ended October 31, 2018 | 12 months ended April 30, 2017 | Year ended October 31, 2021 | Year ended October 31, 2020 | Year ended October 31, 2019 | |||||||||||||||||||
| Earnings ($m) | ||||||||||||||||||||||||
| (Loss)/profit for the period from continuing operations | (18.1 | ) | 707.2 | 124.1 | ||||||||||||||||||||
| Profit for the period from discontinued operation | 1,487.2 | 76.9 | 33.7 | |||||||||||||||||||||
| Loss for the year from continuing operations | (435.1 | ) | (2,974.6 | ) | (18.1 | ) | ||||||||||||||||||
| Profit for the year from discontinued operation | 10.7 | 5.1 | 1,487.2 | |||||||||||||||||||||
| 1,469.1 | 784.1 | 157.8 | (424.4 | ) | (2,969.5 | ) | 1,469.1 | |||||||||||||||||
| Number of shares (m) | ||||||||||||||||||||||||
| Weighted average number of shares | 378.1 | 388.7 | 229.2 | 336.5 | 335.7 | 378.1 | ||||||||||||||||||
| Dilutive effects of shares | 4.1 | 11.0 | 8.2 | 0 | 0 | 4.1 | ||||||||||||||||||
| 382.2 | 399.7 | 237.4 | 336.5 | 335.7 | 382.2 | |||||||||||||||||||
| Earnings per share | ||||||||||||||||||||||||
| Basic earnings per share (cents) | ||||||||||||||||||||||||
| Continuing operations | (4.87 | ) | 181.91 | 54.17 | (129.30 | ) | (886.15 | ) | (4.87 | ) | ||||||||||||||
| Discontinued operation | 393.37 | 19.79 | 14.71 | 3.18 | 1.52 | 393.37 | ||||||||||||||||||
| Total Basic earnings per share | 388.50 | 201.70 | 68.88 | (126.12 | ) | (884.63 | ) | 388.50 | ||||||||||||||||
| Diluted earnings per share (cents) | ||||||||||||||||||||||||
Continuing operations 1 | (4.87 | ) | 176.92 | 52.31 | (129.30 | ) | (886.15 | ) | (4.87 | ) | ||||||||||||||
| Discontinued operation | 389.16 | 19.25 | 14.20 | 3.18 | 1.52 | 389.16 | ||||||||||||||||||
Total Diluted earnings per share 1 | 384.35 | 196.17 | 66.51 | (126.12 | ) | (884.63 | ) | 384.35 | ||||||||||||||||
| Basic earnings per share (pence) | ||||||||||||||||||||||||
| Continuing operations | (3.82 | ) | 136.73 | 41.88 | (94.09 | ) | (693.45 | ) | (3.82 | ) | ||||||||||||||
| Discontinued operation | 308.89 | 14.88 | 11.37 | 2.31 | 1.19 | 308.89 | ||||||||||||||||||
| Total Basic earnings per share | 305.07 | 151.61 | 53.25 | (91.78 | ) | (692.26 | ) | 305.07 | ||||||||||||||||
| Diluted earnings per share (pence) | ||||||||||||||||||||||||
Continuing operations 1 | (3.82 | ) | 132.98 | 40.44 | (94.09 | ) | (693.45 | ) | (3.82 | ) | ||||||||||||||
| Discontinued operation | 305.59 | 14.47 | 10.98 | 2.31 | 1.19 | 305.59 | ||||||||||||||||||
Total Diluted earnings per share 1 | 301.81 | 147.45 | 51.42 | (91.78 | ) | (692.26 | ) | 301.81 | ||||||||||||||||
| Earnings attributable to ordinary shareholders | ||||||||||||||||||||||||
| From continuing operations | (18.1 | ) | 707.2 | 124.1 | (435.1 | ) | (2,974.6 | ) | (18.1 | ) | ||||||||||||||
| Excluding non-controlling interests | (0.3 | ) | (0.1 | ) | 0.1 | 0 | 0 | (0.3 | ) | |||||||||||||||
| (Loss)/profit for the period from continuing operations | (18.4 | ) | 707.1 | 124.2 | ||||||||||||||||||||
| (Loss)/profit for the year from continuing operations | (435.1 | ) | (2,974.6 | ) | (18.4 | ) | ||||||||||||||||||
| From discontinued operation | 1,487.2 | 76.9 | 33.7 | 10.7 | 5.1 | 1,487.2 | ||||||||||||||||||
| 1,468.8 | 784.0 | 157.9 | (424.4 | ) | (2,969.5 | ) | 1,468.8 | |||||||||||||||||
| Average exchange rate | $ | 1.27/£1 | $ | 1.33/£1 | $ | 1.29/£1 | $ | 1.37/£1 | $ | 1.28/£1 | $ | 1.27/£1 | ||||||||||||
1 | The Group reported a loss from continuing operations and a loss for the year attributable to the ordinary equity shareholders of the Company for the year ended October 31, 2021 and October 31, 2020. The Diluted EPS is reported as equal to Basic EPS, as no account can be taken of the effect of dilutive securities under IAS 33. |
The weighted average number of shares excludes treasury shares that do not have dividend rights (note 29)25, “Share capital”).
Consolidated financial statements and notes
Notes to the consolidated financial statements
10 Goodwill
| October 31, 2019 | October 31, 2018 | |||||||||||
| Note | $m | $m | ||||||||||
| Cost and net book amount | ||||||||||||
| At November 1 /May 1 | 6,805.0 | 2,828.6 | ||||||||||
| Acquisitions | 38 | 26.8 | 4,863.9 | |||||||||
| Effects of movements in exchange rates | (160.5 | ) | - | |||||||||
| Reclassification to assets held for sale | 37 | - | (887.5 | ) | ||||||||
| 6,671.3 | 6,805.0 | |||||||||||
| A segment-level summary of the goodwill allocation is presented below: | ||||||||||||
| Micro Focus | 6,671.3 | 6,805.0 | ||||||||||
| October 31, 2021 | October 31, 2020 | |||||||||||
| Note | $m | $m | ||||||||||
| Net book value | ||||||||||||
| At November 1 | 3,835.4 | 6,671.3 | ||||||||||
| Acquisitions | 31 | 7.2 | 1.4 | |||||||||
| Impairment charge | 0 | (2,799.2 | ) | |||||||||
| Effects of movements in exchange rates | 30.1 | (38.1 | ) | |||||||||
| Transferred to assets held for sale | 30 | (147.2 | ) | 0 | ||||||||
| At October 31, | 3,725.5 | 3,835.4 | ||||||||||
| A CGU-level summary of the goodwill allocation is presented below: | ||||||||||||
| Micro Focus | 3,725.5 | 3,835.4 | ||||||||||
Goodwill acquired through business combinations has been allocated to a cash-generating unit (“CGU”) for the purpose of impairment testing.
The goodwill arising in the 12 monthsyear ended October 31, 2019,2021, related to the Streamworx and Full 360 acquisitions of $7.2 million (note 31, “Acquisitions”) 2020: $1.4 million related to the acquisition of Interset Software Inc. of $26.8m (note 38)Atar Labs), has been allocated to the Micro Focus CGU as this is consistent with the segment reporting that is used in internal management reporting. Of the additionsaddition to goodwill, all amounts are expected to be deductible for tax purposes.
Goodwill with a net book value of the HPE Software business of $4,858.3m (note 38) and COBOL-IT, SAS (“COBOL-IT”) $5.6m (note 38), have$147.2 million (Costs $253.4 million, impairment ($106.2) million) has been allocated to the Micro Focus CGUDigital Safe business and been reclassified as this is consistent with the segment reporting that is used in internal management reporting. Of the additions to goodwill, there were no amounts expected to be deductibleheld for tax purposes.
Impairment test
Goodwill is tested annually for impairment, or more frequently where there is an indication of impairment. An impairment test is a comparison of the carrying value of the assets of the CGU with their recoverable amount. Where the recoverable amount is less than the carrying value, an impairment results. The Group performed itsGroup’s annual test foris performed at October 31.
The Group has performed the impairment astest at October 31, 2019 (2018: October 31, 2018),2021 incorporating its knowledge of the business into that testing and noting at that date the market capitalizationcapitalisation was less than the net assets of the Group, which was taken into account during the impairment test. The recoverable amount of the Micro Focus CGU is $9.3 billion and excludes the Digital Safe business which is held for sale (2020: $9.3 billion including the Digital Safe business) based on its value in use (“VIU”) calculation. As of October 31, 2021 the Group’s recoverable amount exceeds the carrying value of the net assets of the CGU by $1.2 billion (October 31, 2020: an impairment charge of $2.8 billion, solely related to goodwill, was recognized in administrative expenses as an exceptional cost in the Consolidated Statement of Comprehensive Income).
The recoverable amount of the Micro Focus CGU is determined based on its Value In Use (“VIU”).VIU. The VIU includes estimates about the future financial performance of the CGU and is based on five-year projections and then a terminal value calculation. It utilizes discounted board approved forecasts for the first four years discounted to present value and the fifth year reflects management’s expectationexpectations of the long-term growth prospects which have been applied based upon the expected operating performance of the CGU and growthGrowth prospects in the CGU’s market. The cash flow projections and inputs combine past performance with adjustments as appropriate where the directors believe that past performance and rates are not indicative of future performance and rates. The VIU calculation excludes the cash outflow and resulting cash inflow assumptions arising from the investment decisions made in the Strategic Review and which are included within the board approved forecasts.
Impairment reviews under IAS 36 are required to exclude the estimated cash inflow and outflows arisingcost savings resulting from improving or enhancing the performance of existing assets, and therefore the impairment test performedrestructuring activities which have not yet commenced. The VIU calculation excludes such cost saving impacts, which are included in the current year considersboard approved forecasts.
F-40
Consolidated financial statements and notes
Notes to the recoverable amount of the CGU based on its current condition without the impact of the approved investment plans.consolidated financial statements
10 Goodwill continued
Key assumptions
Key assumptions in the VIU are considered to be the discount rate, medium termaverage annual revenue growth rate by product group and the long-term cash flow growth rate. These have been assessed taking into consideration the current economic climate and the resulting impact on expected growth and discount rates.
The medium-termaverage annual revenue growth rate by product group, long-term cash flow growth rate and discount rate used in the VIU calculation are:
| 2019 | 2018 | |||||||
| Long-term cash flow growth rate | 1.0 | % | 1.0 | % | ||||
Pre-tax discount rate 1 | 10.3 | % | 9.7 | % | ||||
Medium term annual revenue growth rate by product group2 | (2.0)% to 2.1 | % | - | |||||
| October 31, 2021 | October 31, 2020 | Basis of assumptions | |
Long-term cash flow growth rate for terminal value | 1.0% | 1.0% | Long-term growth rate into perpetuity is based on nominal long term GDP growth forecasts for the main countries in which the CGU operates adjusted where deemed relevant by management to factor in competition and the maturity of the business. |
Pre-tax discount rate1 | 10.6% | 10.9% | The discount rate applied to the cash flows is based on the risk free rate for 30 year US government bonds. This rate is adjusted for a risk premium to reflect the increased risk of investing in equities. This risk premium is derived by observing an equity market risk premium (that is the required return over and above a risk free rate by an investor who is investing in the market as a whole) based on external sources and adjusting this with reference to both a beta and a size premium to reflect the risk of the cash-generating unit relative to the market as a whole to provide a cost of equity. Cost of debt is based on external indices reflecting the Group’s credit rating. Cost of equity and debt are then weighted based on market participant leverage. |
Average annual revenue growth rate by product group | (4.2)% to 4.5% | (8.1)% to 2.2% | Average annual growth rates by product group are based on a combination of management’s past experience, management’s plans and observable trends in the markets in which the Group’s products operate in and updated for the impact of significant new agreements entered into where relevant, for example, the agreement with AWS on the modernization of mainframe applications and workloads signed in FY21. |
| 1 | This equates to a post-tax discount rate of 8.0% (2020: 8.2%). |
Sensitivity analysis
In undertaking this analysis, the directors have considered reasonably possible changes in the key assumptions, that could have an adverse impact, taking into consideration that the Group is insulated from some significant adverse impacts by its geographical spread and that the Group’s cost base is flexible and could quickly respond to market changes. The headroom and breakevensensitivities are prepared on the basis that the reasonably possible change in each key assumption would not have a consequential impact on other key assumptions used in the impairment review. The sensitivities disclosed below are on the VIU calculation, which, as explained above, excludes the cash outflow and resulting cash inflow assumptions arisingcost savings expected from the investment decisions made in the Strategic Review.restructuring which has not commenced as at October 31, 2021.
The directors have assessed that a reasonably possible change in the discount rate is an absolute movement of 2.0% (2018: 2.0%1.0% (2020: 1.0%) and this increase would cause the carrying value of the Micro Focus CGU to exceed its recoverable amount.. An increase in the discount rate of 0.4%1% to 10.7% (2018:11.6% would reduce the headroom at October 31, 2021 by $0.8 billion to $0.4 billion. An increase in the discount rate of 1.3% to 11.0%)1.5% would reduce the amount by which the recoverable amount exceeds its carrying value from $0.5bn$1.2 billion to $nil (2018: from $2.2bn$nil. A decrease in the discount rate of 1% to $nil).9.6% would increase the headroom at October 31, 2021 by $1.0 billion to $2.2 billion.
The directors have assessed that a reasonably possible change in the average of the medium-term annual revenue growth rate by product group is an absolute reduction of 2.0% and this decrease would cause the carrying value of the Micro Focus CGU to exceed its recoverable amount (2018: not a reasonably possible change)(2020: 2.0%). A decrease in the average of the medium-term annual revenue growth rate by product group of 0.7%2.0% would result in an impairment recognized at October 31, 2021 of $0.8 billion. A decrease in the average annual revenue growth rate by product group of 1.2% would reduce the amount by which the recoverable amount exceeds its carrying value from $0.5bn$1.2 billion to $nil.$nil. This sensitivity has been presented exclusivebefore the impact of mitigating actions, such as cost saving that would be taken in such a scenario and which would at least partially offset such a reduction in cash flows.inflows.
The directors have also assessed that there is not a reasonably possible change in the long-term cash flowgrowth rate is an absolute change of 0.5% (2020: 0.5%). An increase of 0.5% would increase the headroom at October 31, 2021 by $0.4 billion to $1.6 billion. A decrease of 0.5% would decrease the headroom at October 31, 2021 by $0.3 billion to $0.9 billion. The directors have assessed that there is not a reasonable possible change in the long-term growth rate that would reduce the recoverable amount to below its carrying value.
Consolidated financial statements and notes
Notes to the consolidated financial statements
11 Other intangible assets
| Purchased intangibles | ||||||||||||||||||||||||||||||||
Purchased software | Product development costs | Technology | Trade names | Customer relationships | Lease contracts | Total | ||||||||||||||||||||||||||
| Note | $m | $m | $m | $m | $m | $m | $m | |||||||||||||||||||||||||
| Cost | ||||||||||||||||||||||||||||||||
| At November 1, 2018 | 141.1 | 259.1 | 2,158.5 | 267.7 | 5,377.2 | 15.0 | 8,218.6 | |||||||||||||||||||||||||
| Acquisitions – Interset Software Inc. | 38 | - | - | 44.5 | 4.2 | 12.5 | - | 61.2 | ||||||||||||||||||||||||
| Additions | 12.3 | 16.5 | - | - | - | - | 28.8 | |||||||||||||||||||||||||
| Additions – external consultants | - | 0.5 | - | - | - | - | 0.5 | |||||||||||||||||||||||||
| Disposals | (7.4 | ) | (19.1 | ) | - | - | - | - | (26.5 | ) | ||||||||||||||||||||||
| Effects of movements in exchange rates | 0.7 | - | (24.4 | ) | (4.6 | ) | (66.4 | ) | (0.1 | ) | (94.8 | ) | ||||||||||||||||||||
| At October 31, 2019 | 146.7 | 257.0 | 2,178.6 | 267.3 | 5,323.3 | 14.9 | 8,187.8 | |||||||||||||||||||||||||
| Accumulated amortization | ||||||||||||||||||||||||||||||||
| At November 1, 2018 | 50.1 | 206.7 | 478.9 | 48.9 | 801.5 | 3.2 | 1,589.3 | |||||||||||||||||||||||||
| Amortization charge for the period | 34.1 | 26.7 | 200.1 | 20.9 | 424.8 | 9.9 | 716.5 | |||||||||||||||||||||||||
| Disposals | (7.4 | ) | (19.1 | ) | - | - | - | - | (26.5 | ) | ||||||||||||||||||||||
| Effects of movements in exchange rates | 0.1 | - | (10.1 | ) | (1.8 | ) | (22.0 | ) | - | (33.8 | ) | |||||||||||||||||||||
| At October 31, 2019 | 76.9 | 214.3 | 668.9 | 68.0 | 1,204.3 | 13.1 | 2,245.5 | |||||||||||||||||||||||||
| Net book amount at October 31, 2019 | 69.8 | 42.7 | 1,509.7 | 199.3 | 4,119.0 | 1.8 | 5,942.3 | |||||||||||||||||||||||||
| Net book amount at October 31, 2018 | 91.0 | 52.4 | 1,679.6 | 218.8 | 4,575.7 | 11.8 | 6,629.3 | |||||||||||||||||||||||||
| Purchased intangibles | ||||||||||||||||||||||||||||
| Note | Purchased software $m | Product development costs $m | Technology $m | Trade names $m | Customer relationships $m | Total $m | ||||||||||||||||||||||
| Cost | ||||||||||||||||||||||||||||
At November 1, 2020 | 191.5 | 274.0 | 2,201.2 | 269.2 | 5,364.0 | 8,299.9 | ||||||||||||||||||||||
| Acquisitions | 31 | 0 | 0 | 7.8 | 0 | 0 | 7.8 | |||||||||||||||||||||
| Additions | 28.4 | 19.1 | 0 | 0 | 0 | 47.5 | ||||||||||||||||||||||
| Disposals | (13.5 | ) | 0 | 0 | 0 | 0 | (13.5 | ) | ||||||||||||||||||||
| Effects of movements in exchange rates | 1.2 | (0.1 | ) | 10.4 | 1.2 | 26.3 | 39.0 | |||||||||||||||||||||
| Transferred to current assets classified as held for sale | 30 | 0 | 0 | (82.0 | ) | (7.0 | ) | (185.5 | ) | (274.5 | ) | |||||||||||||||||
At October 31, 2021 | 207.6 | 293.0 | 2,137.4 | 263.4 | 5,204.8 | 8,106.2 | ||||||||||||||||||||||
| Accumulated amortisation | ||||||||||||||||||||||||||||
At November 1, 2020 | 113.5 | 237.9 | 865.7 | 87.9 | 1,611.9 | 2,916.9 | ||||||||||||||||||||||
| Amortisation charge for the year | 37.4 | 19.6 | 257.2 | 20.7 | 621.5 | 956.4 | ||||||||||||||||||||||
| Disposals | (13.5 | ) | 0 | 0 | 0 | 0 | (13.5 | ) | ||||||||||||||||||||
| Effects of movements in exchange rates | 0.6 | 0 | 2.6 | 0.2 | 4.2 | 7.6 | ||||||||||||||||||||||
| Transferred to current assets classified as held for sale | 30 | 0 | 0 | (37.6 | ) | (1.9 | ) | (52.9 | ) | (92.4 | ) | |||||||||||||||||
At October 31, 2021 | 138.0 | 257.5 | 1,087.9 | 106.9 | 2,184.7 | 3,775.0 | ||||||||||||||||||||||
Net book amount at October 31, 2021 | 69.6 | 35.5 | 1,049.5 | 156.5 | 3,020.1 | 4,331.2 | ||||||||||||||||||||||
Net book amount at October 31, 2020 | 78.0 | 36.1 | 1,335.5 | 181.3 | 3,752.1 | 5,383.0 | ||||||||||||||||||||||
Consolidated financial statements and notes
Notes to the consolidated financial statements
11 Other intangible assets continued
| Purchased intangibles | ||||||||||||||||||||||||||||||||
Purchased software | Product development costs | Technology | Trade names | Customer relationships | Lease contracts | Total | ||||||||||||||||||||||||||
| Note | $m | $m | $m | $m | $m | $m | $m | |||||||||||||||||||||||||
| Cost | ||||||||||||||||||||||||||||||||
At October 31, 2019 | 146.7 | 257.0 | 2,178.6 | 267.3 | 5,323.3 | 14.9 | 8,187.8 | |||||||||||||||||||||||||
Transfers to right-of-use assets1 | 0 | 0 | 0 | 0 | 0 | (14.9 | ) | (14.9 | ) | |||||||||||||||||||||||
At November 1, 2019 | 146.7 | 257.0 | 2,178.6 | 267.3 | 5,323.3 | 0 | 8,172.9 | |||||||||||||||||||||||||
| Acquisitions – Atar Labs | 31 | 0 | 0 | 6.6 | 0 | 0 | 0 | 6.6 | ||||||||||||||||||||||||
| Additions | 55.5 | 16.2 | 0 | 0 | 0 | 0 | 71.7 | |||||||||||||||||||||||||
| Additions – external consultants | 0 | 0.8 | 0 | 0 | 0 | 0 | 0.8 | |||||||||||||||||||||||||
| Disposals | (11.2 | ) | 0 | 0 | 0 | 0 | 0 | (11.2 | ) | |||||||||||||||||||||||
| Effects of movements in exchange rates | 0.5 | 0 | 16.0 | 1.9 | 40.7 | 0 | 59.1 | |||||||||||||||||||||||||
At October 31, 2020 | 191.5 | 274.0 | 2,201.2 | 269.2 | 5,364.0 | 0 | 8,299.9 | |||||||||||||||||||||||||
| Accumulated amortisation | ||||||||||||||||||||||||||||||||
At October 31, 2019 | 76.9 | 214.3 | 668.9 | 68.0 | 1,204.3 | 13.1 | 2,245.5 | |||||||||||||||||||||||||
Transfers to right-of-use assets1 | 0 | 0 | 0 | 0 | 0 | (13.1 | ) | (13.1 | ) | |||||||||||||||||||||||
At November 1, 2019 | 76.9 | 214.3 | 668.9 | 68.0 | 1,204.3 | 0 | 2,232.4 | |||||||||||||||||||||||||
| Amortisation charge for the year | 46.5 | 23.5 | 190.2 | 19.1 | 394.8 | 0 | 674.1 | |||||||||||||||||||||||||
| Disposals | (10.6 | ) | 0 | 0 | 0 | 0 | 0 | (10.6 | ) | |||||||||||||||||||||||
| Effects of movements in exchange rates | 0.7 | 0.1 | 6.6 | 0.8 | 12.8 | 0 | 21.0 | |||||||||||||||||||||||||
At October 31, 2020 | 113.5 | 237.9 | 865.7 | 87.9 | 1,611.9 | 0 | 2,916.9 | |||||||||||||||||||||||||
Net book amount at October 31, 2020 | 78.0 | 36.1 | 1,335.5 | 181.3 | 3,752.1 | 0 | 5,383.0 | |||||||||||||||||||||||||
Net book amount at October 31, 2019 | 69.8 | 42.7 | 1,509.7 | 199.3 | 4,119.0 | 1.8 | 5,942.3 | |||||||||||||||||||||||||
| Purchased intangibles | ||||||||||||||||||||||||||||||||
Purchased software | Product development costs | Technology | Trade names | Customer relationships | Lease contracts | Total | ||||||||||||||||||||||||||
| Note | $m | $m | $m | $m | $m | $m | $m | |||||||||||||||||||||||||
| Cost | ||||||||||||||||||||||||||||||||
| At May 1, 2017 | 24.6 | 213.8 | 398.9 | 239.6 | 972.4 | - | 1,849.3 | |||||||||||||||||||||||||
| Continuing operations: | ||||||||||||||||||||||||||||||||
| Acquisitions - HPE Software business | 38 | 72.8 | - | 1,809.0 | 163.0 | 4,480.0 | 15.0 | 6,539.8 | ||||||||||||||||||||||||
| Acquisitions – COBOL-IT | 38 | - | - | 1.5 | 0.2 | 12.3 | - | 14.0 | ||||||||||||||||||||||||
| Acquisitions – Covertix | 38 | 2.5 | - | - | - | - | - | 2.5 | ||||||||||||||||||||||||
| Additions | 46.8 | 44.4 | - | - | - | - | 91.2 | |||||||||||||||||||||||||
| Additions – external consultants | - | 0.9 | - | - | - | - | 0.9 | |||||||||||||||||||||||||
| Effects of movements in exchange rates | (0.4 | ) | - | - | - | - | - | (0.4 | ) | |||||||||||||||||||||||
| Discontinued operation: | ||||||||||||||||||||||||||||||||
| Reclassification to current assets classified as held for sale | 37 | (5.2 | ) | - | (50.9 | ) | (135.1 | ) | (87.5 | ) | - | (278.7 | ) | |||||||||||||||||||
| At October 31, 2018 | 141.1 | 259.1 | 2,158.5 | 267.7 | 5,377.2 | 15.0 | 8,218.6 | |||||||||||||||||||||||||
| Accumulated amortization | ||||||||||||||||||||||||||||||||
| At May 1, 2017 | 21.0 | 164.7 | 223.0 | 38.8 | 312.5 | - | 760.0 | |||||||||||||||||||||||||
| Continuing operations: | ||||||||||||||||||||||||||||||||
| Amortization charge for the period | 30.7 | 42.0 | 280.5 | 26.7 | 520.0 | 3.2 | 903.1 | |||||||||||||||||||||||||
| Effects of movements in exchange rates | (0.9 | ) | - | - | - | - | - | (0.9 | ) | |||||||||||||||||||||||
| Discontinued operation: | ||||||||||||||||||||||||||||||||
| Amortization charge for the period | 0.8 | - | 13.4 | 9.1 | 16.9 | - | 40.2 | |||||||||||||||||||||||||
| Reclassification to current assets classified as held for sale | 37 | (1.5 | ) | - | (38.0 | ) | (25.7 | ) | (47.9 | ) | - | (113.1 | ) | |||||||||||||||||||
| At October 31, 2018 | 50.1 | 206.7 | 478.9 | 48.9 | 801.5 | 3.2 | 1,589.3 | |||||||||||||||||||||||||
| Net book amount at October 31, 2018 | 91.0 | 52.4 | 1,679.6 | 218.8 | 4,575.7 | 11.8 | 6,629.3 | |||||||||||||||||||||||||
| Net book amount at April 30, 2017 | 3.6 | 49.1 | 175.9 | 200.8 | 659.9 | - | 1,089.3 | |||||||||||||||||||||||||
1 | Lease contracts have been reclassified to right-of-use assets following the adoption of IFRS 16 on November 1, 2019. |
Intangible assets, with the exception of purchased software and internally generated product development costs, relate to identifiable assets purchased as part of the Group’s business combinations. Intangible assets are amortized on a straight-line basis over their expected useful economic life - see Accounting Policy K.
The acquisition dates, a $40.5m decreaseof Streamworx and Full 360 in the carrying value of purchased intangible assets would have been recognized in the 18 monthsyear ended October 31, 2018 and a cumulative decrease2021 gave rise to additions of $20.8m$7.8 million to purchased intangibles. The acquisition of Atar Labs in the carrying value would have been recognized as at May 1, 2017. As this change has no impact on the statementyear ended October 31, 2020 gave rise to an addition of cash flows and as the net prior-period impact of $61.3m and the impact on profit before taxation is not material in the context$6.6 million to purchased intangibles (note 31, “Acquisitions”).
All of the overall value$19.1 million of purchased intangible assets or net assets, it is, in the judgmentadditions to product development costs (2020: $16.2 million of the directors, appropriate$17.0 million) relates to effect the change in allocation in the current period. Movements in Other comprehensive income are not considered a key performance metric.internal product development costs and $nil (2020: $0.8 million) to external consultants’ product development costs.
Consolidated financial statements and notes
Notes to the consolidated financial statements
11 Other intangible assets continued
At October 31, 2019,2021, the unamortized lives of technology assets were in the range of two to 10eight years, customer relationships in the range of one to 1311 years and trade names in the range of 10three to 2015 years. The HPE Software business acquired purchased intangibles, the largest component of the Group,Group’s purchased intangibles, have up to another 10 yearseight years’ life remaining for technology (carrying value $1.0 billion) and 13 yearsup to 11 years’ life remaining for customer relationships purchased intangibles.intangibles (carrying value $3.0 billion), assuming no further investments were made.
Included in the Consolidatedconsolidated statement of comprehensive income forwas:
Year ended October 31, 2021 | Year ended October 31, 2020 | |||||||
| For continuing operations: | $m | $m | ||||||
| Cost of sales: | ||||||||
| - amortization of product development costs | 19.6 | 23.5 | ||||||
| - amortization of acquired purchased technology | 257.2 | 190.2 | ||||||
| Selling and distribution: | ||||||||
| - amortization of acquired purchased trade names and customer relationships | 642.2 | 413.9 | ||||||
| Administrative expenses: | ||||||||
| - amortization of purchased software | 37.4 | 46.5 | ||||||
| Total amortization charge for the year | 956.4 | 674.1 | ||||||
| Research and development: | ||||||||
| - capitalization of product development costs | 19.1 | 16.2 | ||||||
On November 1, 2020, the Group conducted a review on the estimated lives of its intangible assets with specific focus on those recognized as part of the HPE Software acquisition. This review considered the actual and expected trading performance of the Group compared to the original projections produced at the time of HPE Software acquisition as the directors believe these forecasts better reflect the expected future use of the economic benefits in these acquired intangibles. As a result of this review, the expected lives of certain purchased technology and customer relationship intangibles with a carrying value of $3,736.8 million as at November 1, 2020 have been reduced with the shorter lives applied from November 1, 2020.
The intangibles assets impacted by this change are customer relationships in the ITOM and ADM product groups and customer relationships within certain products in IM&G, which had a total carrying value of $2,770.4 million as at November 1, 2020. These have reduced from 12 months ended October 31, 2019years remaining life to between five and 11 years. In addition, purchased technology in the 18 months ended October 31, 2018 was:ITOM and ADM product groups and certain purchased technology in IM&G, which had a carrying value of $966.4 million as at November 1, 2020, have reduced from seven years remaining life to five years.
In line with the requirements of IFRS3, these technology assets were originally recognized at the acquisition date in September 2017 and so the asset life represented the estimated period of time before the technology became obsolete if no future investment into that technology were made. However there has been and continues to be significant R&D activity across these portfolios with the Group releasing c.500 product releases each year to ensure that the technology remains relevant beyond the life assigned under the requirements of IFRS 3.
The effect of these changes on actual and expected amortization expense is as follows:
12 months ended October 31, 2019 | 18 months ended October 31, 2018 | 12 months ended April 30, 2017 | ||||||||||
| For continuing operations: | $m | $m | $m | |||||||||
| Cost of sales: | ||||||||||||
| - amortization of product development costs | 26.7 | 42.0 | 22.4 | |||||||||
| - amortization of acquired purchased technology | 200.1 | 280.5 | 59.0 | |||||||||
| Selling and distribution: | ||||||||||||
| - amortization of acquired purchased trade names, customer relationships and lease contracts | 455.6 | 549.9 | 124.2 | |||||||||
| Administrative expenses: | ||||||||||||
| - amortization of purchased software | 34.1 | 30.7 | 1.1 | |||||||||
| Total amortization charge for the period | 716.5 | 903.1 | 206.7 | |||||||||
| Research and development: | ||||||||||||
| - capitalization of product development costs | 16.5 | 44.4 | 27.7 | |||||||||
| Impact in the year ended October 31, | ||||||||||||||||||||||||||||
| $m | 2021 | 2022 | 2023 | 2024 | 2025 | 2026 | Impact in all later periods | |||||||||||||||||||||
| Increase/(decrease) in amortization expense | 261 | 261 | 261 | 261 | 192 | (145 | ) | (1,091 | ) | |||||||||||||||||||
| Recognized in: | ||||||||||||||||||||||||||||
| Costs of sales (amortization of acquired purchased) | 59 | 59 | 59 | 59 | 25 | (141 | ) | (120 | ) | |||||||||||||||||||
| Selling and distribution expenses (amortization of customer relationships) | 202 | 202 | 202 | 202 | 167 | (4 | ) | (971 | ) | |||||||||||||||||||
| 261 | 261 | 261 | 261 | 192 | (145 | ) | (1,091 | ) | ||||||||||||||||||||
Consolidated financial statements and notes
Notes to the consolidated financial statements
11 Other intangible assets continued
If the remaining economic lives of all purchased intangibles were one year longer than the revised lives, expected amortization would be $158.1 million lower than that shown in the table above in the year ended October 31, 2021, with consequential impacts in subsequent years. If the remaining economic lives of all purchased intangibles were one year shorter than the revised lives, amortization would be $166.4 million higher than that shown in the table above in the year ended October 31, 2021, with consequential impacts in subsequent years.
12 Property, plant and equipment
Freehold land and buildings | Leasehold improvements | Computer equipment | Fixtures and fittings | Total | ||||||||||||||||||||
| Note | $m | $m | $m | $m | $m | |||||||||||||||||||
| Cost | ||||||||||||||||||||||||
| At November 1, 2018 | 14.3 | 79.2 | 103.3 | 29.1 | 225.9 | |||||||||||||||||||
| Acquisition – Interset Software Inc. | 38 | - | - | 0.2 | 0.1 | 0.3 | ||||||||||||||||||
| Additions | - | 37.7 | 24.6 | 3.0 | 65.3 | |||||||||||||||||||
| Disposals | - | (3.6 | ) | (3.0 | ) | - | (6.6 | ) | ||||||||||||||||
| Reclassification | - | - | 19.8 | (19.8 | ) | - | ||||||||||||||||||
| Effects of movements in exchange rates | (0.3 | ) | 0.2 | (0.5 | ) | 0.8 | 0.2 | |||||||||||||||||
| At October 31, 2019 | 14.0 | 113.5 | 144.4 | 13.2 | 285.1 | |||||||||||||||||||
| Accumulated depreciation | ||||||||||||||||||||||||
| At November 1, 2018 | 2.2 | 34.3 | 36.6 | 8.5 | 81.6 | |||||||||||||||||||
| Charge for the period | 0.3 | 18.8 | 46.1 | 1.3 | 66.5 | |||||||||||||||||||
| Disposals | - | (1.7 | ) | (1.3 | ) | - | (3.0 | ) | ||||||||||||||||
| Reclassification | - | - | 4.6 | (4.6 | ) | - | ||||||||||||||||||
| Effects of movements in exchange rates | (0.3 | ) | 0.3 | (0.9 | ) | 0.4 | (0.5 | ) | ||||||||||||||||
| At October 31, 2019 | 2.2 | 51.7 | 85.1 | 5.6 | 144.6 | |||||||||||||||||||
| Net book amount at October 31, 2019 | 11.8 | 61.8 | 59.3 | 7.6 | 140.5 | |||||||||||||||||||
| Net book amount at November 1, 2018 | 12.1 | 44.9 | 66.7 | 20.6 | 144.3 | |||||||||||||||||||
Freehold land and buildings | Leasehold improvements | Computer equipment | Fixtures and fittings | Total | ||||||||||||||||||||
| Note | $m | $m | $m | $m | $m | |||||||||||||||||||
| Cost | ||||||||||||||||||||||||
| At November 1, 2020 | 14.0 | 83.6 | 107.9 | 7.8 | 213.3 | |||||||||||||||||||
| Acquisition | 0 | 0 | 0 | 0.1 | 0.1 | |||||||||||||||||||
| Additions | 0 | 1.2 | 15.6 | 0.9 | 17.7 | |||||||||||||||||||
| Disposals | 0 | (4.5 | ) | (14.0 | ) | (0.8 | ) | (19.3 | ) | |||||||||||||||
| Effects of movements in exchange rates | 0.8 | 0.6 | 1.9 | 0.2 | 3.5 | |||||||||||||||||||
Transferred to current assets classified as held for sale | 30 | 0 | (4.1 | ) | (2.3 | ) | 0 | (6.4 | ) | |||||||||||||||
| At October 31, 2021 | 14.8 | 76.8 | 109.1 | 8.2 | 208.9 | |||||||||||||||||||
| Accumulated depreciation | ||||||||||||||||||||||||
| At November 1, 2020 | 2.5 | 47.3 | 69.5 | 0.3 | 119.6 | |||||||||||||||||||
| Disposals | 0 | (3.6 | ) | (14.0 | ) | (0.5 | ) | (18.1 | ) | |||||||||||||||
| Charge for the year | 0.4 | 10.9 | 20.3 | 2.1 | 33.7 | |||||||||||||||||||
| Effects of movements in exchange rates | 0.1 | 0.2 | 1.6 | 0.2 | 2.1 | |||||||||||||||||||
| Transferred to current assets classified as held for sale | 30 | 0 | (1.8 | ) | (2.0 | ) | 0 | (3.8 | ) | |||||||||||||||
At October 31, 2021 | 3.0 | 53.0 | 75.4 | 2.1 | 133.5 | |||||||||||||||||||
Net book amount at October 31, 2021 | 11.8 | 23.8 | 33.7 | 6.1 | 75.4 | |||||||||||||||||||
| Net book amount at November 1, 2020 | 11.5 | 36.3 | 38.4 | 7.5 | 93.7 | |||||||||||||||||||
Consolidated financial statements and notes
Notes to the consolidated financial statements
12 Property, plant and equipment continued
| | Freehold land and buildings | Leasehold improvements | Computer equipment | Fixtures and fittings | Total | |||||||||||||||
| $m | $m | $m | $m | $m | ||||||||||||||||
| Cost | ||||||||||||||||||||
At October 31, 2019 | 14.0 | 113.5 | 144.4 | 13.2 | 285.1 | |||||||||||||||
Transfers to right-of-use assets1 | 0 | (9.8 | ) | (50.6 | ) | 0 | (60.4 | ) | ||||||||||||
| At November 1, 2019 | 14.0 | 103.7 | 93.8 | 13.2 | 224.7 | |||||||||||||||
| Additions | 0 | 4.8 | 28.4 | 2.9 | 36.1 | |||||||||||||||
Other2 | 0 | (9.8 | ) | 0 | 0 | (9.8 | ) | |||||||||||||
| Disposals | 0 | (15.3 | ) | (14.1 | ) | (8.5 | ) | (37.9 | ) | |||||||||||
| Effects of movements in exchange rates | 0 | 0.2 | (0.2 | ) | 0.2 | 0.2 | ||||||||||||||
At October 31, 2020 | 14.0 | 83.6 | 107.9 | 7.8 | 213.3 | |||||||||||||||
| Accumulated depreciation | ||||||||||||||||||||
At October 31, 2019 | 2.2 | 51.7 | 85.1 | 5.6 | 144.6 | |||||||||||||||
Transfers to right-of-use assets1 | 0 | (5.2 | ) | (29.7 | ) | 0 | (34.9 | ) | ||||||||||||
| At November 1, 2019 | 2.2 | 46.5 | 55.4 | 5.6 | 109.7 | |||||||||||||||
| Disposals | 0 | (11.0 | ) | (13.5 | ) | (7.8 | ) | (32.3 | ) | |||||||||||
| Charge for the year | 0.3 | 11.9 | 27.6 | 2.2 | 42.0 | |||||||||||||||
| Effects of movements in exchange rates | 0 | (0.1 | ) | 0 | 0.3 | 0.2 | ||||||||||||||
At October 31, 2020 | 2.5 | 47.3 | 69.5 | 0.3 | 119.6 | |||||||||||||||
Net book amount at October 31, 2020 | 11.5 | 36.3 | 38.4 | 7.5 | 93.7 | |||||||||||||||
Net book amount at October 31, 2019 | 11.8 | 61.8 | 59.3 | 7.6 | 140.5 | |||||||||||||||
Transfers to right-of-use assets1 | 0 | (4.6 | ) | (20.9 | ) | 0 | (25.5 | ) | ||||||||||||
| Net book amount at November 1, 2019 | 11.8 | 57.2 | 38.4 | 7.6 | 115.0 | |||||||||||||||
Freehold land and buildings | Leasehold improvements | Computer equipment | Fixtures and fittings | Total | ||||||||||||||||||||
| Note | $m | $m | $m | $m | $m | |||||||||||||||||||
| Cost | ||||||||||||||||||||||||
| At May 1, 2017 | 14.3 | 27.3 | 32.6 | 6.0 | 80.2 | |||||||||||||||||||
| Continuing operations: | ||||||||||||||||||||||||
| Acquisition – HPE Software business | 38 | - | 56.5 | 79.5 | 24.1 | 160.1 | ||||||||||||||||||
| Acquisition – COBOL-IT | 38 | - | - | 0.1 | - | 0.1 | ||||||||||||||||||
| Additions | - | 10.4 | 33.3 | 6.4 | 50.1 | |||||||||||||||||||
| Disposals | - | (7.5 | ) | (27.1 | ) | (4.6 | ) | (39.2 | ) | |||||||||||||||
| Effects of movements in exchange rates | - | (3.4 | ) | (8.2 | ) | (2.5 | ) | (14.1 | ) | |||||||||||||||
| Discontinued operation: | ||||||||||||||||||||||||
| Additions | - | - | 2.0 | - | 2.0 | |||||||||||||||||||
| Disposals | - | - | (0.1 | ) | - | (0.1 | ) | |||||||||||||||||
| Effects of movements in exchange rates | - | - | 0.3 | - | 0.3 | |||||||||||||||||||
| Reclassification to current assets classified as held for sale | 37 | - | (4.1 | ) | (9.1 | ) | (0.3 | ) | (13.5 | ) | ||||||||||||||
| At October 31, 2018 | 14.3 | 79.2 | 103.3 | 29.1 | 225.9 | |||||||||||||||||||
| Accumulated depreciation | ||||||||||||||||||||||||
| At May 1, 2017 | 1.8 | 12.7 | 22.1 | 2.7 | 39.3 | |||||||||||||||||||
| Continuing operations: | ||||||||||||||||||||||||
| Charge for the period | 0.4 | 26.3 | 50.7 | 11.2 | 88.6 | |||||||||||||||||||
| Disposals | - | (4.0 | ) | (26.9 | ) | (3.7 | ) | (34.6 | ) | |||||||||||||||
| Effects of movements in exchange rates | - | (1.3 | ) | (6.4 | ) | (2.9 | ) | (10.6 | ) | |||||||||||||||
| Discontinued operation: | ||||||||||||||||||||||||
| Charge for the period | - | 2.7 | 2.6 | 1.3 | 6.6 | |||||||||||||||||||
| Disposals | - | - | - | - | - | |||||||||||||||||||
| Effects of movements in exchange rates | - | - | 0.1 | - | 0.1 | |||||||||||||||||||
| Reclassification to current assets classified as held for sale | 37 | - | (2.1 | ) | (5.6 | ) | (0.1 | ) | (7.8 | ) | ||||||||||||||
| At October 31, 2018 | 2.2 | 34.3 | 36.6 | 8.5 | 81.6 | |||||||||||||||||||
| Net book amount at October 31, 2018 | 12.1 | 44.9 | 66.7 | 20.6 | 144.3 | |||||||||||||||||||
| Net book amount at May 1, 2017 | 12.5 | 14.6 | 10.5 | 3.3 | 40.9 | |||||||||||||||||||
| 1 | Property, plant and equipment held under finance leases and hire purchase contracts under IAS 17 and assets recognized in relation to asset retirement obligations on leased asset have been reclassified to right-of-use assets following the adoption of IFRS 16 on November 1, 2019. |
2 | Other movements of $9.8million relates to amounts received in relation to the reimbursement of leasehold improvement costs. |
Depreciation for the 12 monthsyear ended October 31, 20192021 of $66.5m (18 months ended October 31, 2018: $95.2m)$33.7 million (2020: $42.0 million) is included within administrative expenses and cost of sales in the Consolidated statement of comprehensive income. The carrying value of computer equipment held under finance leases and hire purchase contracts, as at October 31, 2019 was $20.9m (October 31, 2018: $25.9m).
13 Related undertakings
| Company name | Country of incorporation | Class(es) of shares held1,2 | Principal activities | Key to Registered office address | |
| Subsidiaries | |||||
1 | Attachmate Australasia Pty Limited | Australia | Ordinary Shares AU$1.00 | Sale and support of software | 1 |
2 | Attachmate Group Australia Pty Limited | Australia | Ordinary Shares | Sale and support of software | 1 |
3 | Autonomy Australia Pty Limited | Australia | Ordinary Shares AU$1.00 | Sale and support of software | 1 |
4 | Autonomy Systems Australia Pty Limited | Australia | Ordinary Shares AU$1.00 | Sale and support of software | 1 |
5 | Borland Australia Pty Limited | Australia | Ordinary Shares AU$1.00 | Sale and support of software | 1 |
6 | Entco Australia Pty Limited | Australia | Ordinary Shares AU$1.00 | Sale and support of software | 1 |
7 | Micro Focus Australia Pty Ltd (formerly Entcorp Australia Pty Limited) | Australia | Ordinary Shares AU$1.00 | Sale and support of software | 1 |
8 | Micro Focus Pty Limited | Australia | Ordinary Shares AU$1.00 | Sale and support of software | 1 |
9 | Serena Software Pty Limited | Australia | Ordinary Shares AU$1.00 | Sale and support of software | 1 |
10 | Borland Entwicklung GmbH | Austria | Registered capital | Development of software | 2 |
11 | Autonomy Belgium BVBA | Belgium | Ordinary Shares | Sale and support of software | 3 |
12 | Micro Focus Belgium BV (formerly Entco Belgium BVBA) | Belgium | Ordinary Shares | Sale and support of software | 3 |
13 | Micro Focus Srl (formerly Micro Focus SPRL) | Belgium | Ordinary Shares | Sale and support of software | 4 |
14 | Borland Latin America Ltda | Brazil | Quota RS$1.00 | Sale and support of software | 5 |
15 | Cambridge Technology Partners do Brasil s.c. Ltda | Brazil | Quota RS$1.00 | Dormant | 5 |
16 | Micro Focus Brasil Serviços de Tecnologia Ltda (formerly Entco Brasil Serviços de Tecnologia Ltda) | Brazil | Quota RS$1.00 | Sale and support of software | 5 |
17 | Micro Focus Programmeação de Computadores Ltda | Brazil | Quota RS$1.00 | Sale and support of software | 5 |
18 | Peregrinne Systems do Brasil Limitada | Brazil | Quota RS$1.00 | Sale and support of software | 6 |
19 | Serena Software Do Brasil Ltda | Brazil | Quota RS$1.00 | Sale and support of software | 7 |
| Company name | Country of incorporation | Class(es) of shares held1,2 | Principal activities | Key to Registered office address | |
| Subsidiaries | |||||
20 | Verity Worldwide Limited | British Virgin Islands | Ordinary Shares US$50,000.00 | Sale and support of software | 8 |
21 | Micro Focus APM Solutions Limited (EOOD) | Bulgaria | Ordinary Shares BGN1,000.00 | Development of software | 9 |
22 | Micro Focus Bulgaria EOOD (formerly Entco Bulgaria EOOD) | Bulgaria | Ordinary Shares BGN1.00 | Sale and support of software | 10 |
23 | Autonomy Systems (Canada) Limited | Canada | Class A Common Stock | Sale and support of software | 11 |
24 | Borland Canada Software ULC | Canada | Common Shares | Dormant | 12 |
25 | Entcorp Canada, Inc. | Canada | Common Stock | Sale and support of software | 13 |
26 | GWAVA ULC (formerly GWAVA Inc.) | Canada | Common Stock | Holding Company | 12 |
27 | Interset Software Inc. | Canada | Class A Preferred Shares Class B Preferred Shares Class B-1 Preferred Shares Class B-2 Preferred Shares Common Shares | Sale and support of software | 14 |
28 | Micro Focus (Canada) ULC | Canada | Common Shares | Development, sale and support of software | 12 |
29 | Micro Focus Acquisition ULC | Canada | Common Shares | Holding Company | 15 |
30 | Micro Focus Software (Canada), ULC | Canada | Common Shares | Sale and support of software | 16 |
31 | Micro Focus Software Solutions Canada Co. / Solutions Logiciels Micro Focus Canada Cie. (formerly Entco Software Canada Co. Logiciels Entco Canada Cie) | Canada | Common Shares | Sale and support of software | 17 |
32 | NetManage Canada ULC | Canada | Common Shares | Dormant | 12 |
33 | Entco Bellatrix HoldCo | Cayman Islands | Ordinary Shares US$1.00 | Sale and support of software | 18 |
34 | Entco Capital Co | Cayman Islands | Ordinary Shares US$1.00 | Sale and support of software | 18 |
35 | Entco Investment Co | Cayman Islands | Ordinary Shares US$1.00 | Sale and support of software | 18 |
| Company name | Country of incorporation | Class(es) of shares held1,2 | Principal activities | Key to Registered office address | |
| Subsidiaries | |||||
36 | Micro Focus International Limited | Cayman Islands | Class A Ordinary Shares US$0.00001 Class B Ordinary Shares US$0.00001 Class C Ordinary Shares US$0.00001 Class L Ordinary Shares US$0.00001 | Dormant | 18 |
37 | Micro Focus IP Limited | Cayman Islands | Class A Ordinary Shares €0.01 Class B Preferred Redeemable Shares €0.01 | Holding Company | 18 |
38 | Entco Marigalante Limited | Cayman Islands | Ordinary Shares US$1.00 | Sale and support of software | 18 |
39 | Autonomy Systems (Beijing) Limited Company | China | Registered Capital | Sale and support of software | 19 |
40 | Borland Software Corporation Beijing Representative Office | China | Branch | In liquidation | 104 |
41 | Shanghai Entco Software Technology Co., Limited | China | Registered Capital | Sale and support of software | 20 |
42 | Shanghai Entco Software Technology Co., Limited, Beijing Branch | China | Branch | Sale and support of software | 21 |
43 | Shanghai Entco Software Technology Co., Limited, Chongqing Branch | China | Branch | Sale and support of software | 22 |
44 | Shanghai Entco Software Technology Co., Limited, Shenzhen Branch | China | Branch | Sale and support of software | 23 |
45 | Singapore Micro Focus Pte Ltd Shanghai Representative Office | China | Branch | Sale and support of software | 24 |
46 | UK Micro Focus Limited Beijing Representative Office | China | Branch | Sale and support of software | 25 |
47 | Micro Focus CentroAmerica CAC Limiteda (formerly Entco CentroAmerica CAC Limitada) | Costa Rica | Quota CRC1,000.00 | Sale and support of software | 26 |
48 | Micro Focus Costa Rica Limiteda (formerly Entco Costa Rica Limitada) | Costa Rica | Quota CRC1,000.00 | Sale and support of software | 26 |
49 | NetIQ Software International Limited | Cyprus | Ordinary Shares of C£1.00 | Dormant | 103 |
50 | Micro Focus Czechia s.r.o (formerly Entco Czechia, s.r.o.) | Czech Republic | Registered Capital | Sale and support of software | 27 |
51 | NOVL Czech s.r.o. | Czech Republic | Registered Capital | Dormant | 28 |
| Company name | Country of incorporation | Class(es) of shares held1,2 | Principal activities | Key to Registered office address | |
| Subsidiaries | |||||
52 | Micro Focus Denmark, filial af Micro Focus AS, Norge (Branch) | Denmark | Branch | Sale and support of software | 29 |
53 | Micro Focus Software Denmark ApS (formerly Entco Denmark ApS) | Denmark | Ordinary Shares DKK1.00 | Sale and support of software | 29 |
54 | Attachmate Middle East LLC | Egypt | Cash Shares LE100.00 | In liquidation | 105 |
55 | Micro Focus AS, Filial i Finland (Branch) | Finland | Branch | Sale and support of software | 30 |
56 | Attachmate Group France SARL | France | Ordinary Shares €16.00 | Sale and support of software | 31 |
57 | Borland (France) Sarl | France | Ordinary Shares €15.25 | Sale and support of software | 31 |
58 | Cobol-IT, SAS | France | Ordinary Shares €1.00 | Sale and support of software | 31 |
59 | Micro Focus France SAS (formerly Entco France SAS) | France | Ordinary Shares €1.00 | Sale and support of software | 32 |
60 | Micro Focus SAS | France | Ordinary Shares €10.00 | Sale and support of software | 31 |
61 | Attachmate Group Germany GmbH | Germany | Ordinary Shares €191,000.00 | Sale and support of software | 33 |
62 | Borland GmbH | Germany | Ordinary Shares €49,500.00 Ordinary Shares €450,000.00 Ordinary Shares €100,000.00 Ordinary Shares €500.00 | Dormant | 33 |
63 | GWAVA EMEA GmbH | Germany | Registered Capital | Sale and support of software | 34 |
64 | Micro Focus Deutschland GmbH (formerly Entco Deutschland GmbH) | Germany | Registered Capital | Sale and support of software | 35 |
65 | Micro Focus GmbH | Germany | Registered Capital | Sale and support of software | 33 |
66 | Novell Holdings Deutschland GmbH | Germany | Registered Capital | Holding Company | 36 |
67 | Serena Software GmbH | Germany | Registered Capital | Sale and support of software | 37 |
68 | Attachmate (Hong Kong) Limited | Hong Kong | Ordinary Shares HK$1.00 | Dormant | 38 |
69 | Borland (H.K.) Limited | Hong Kong | Ordinary Shares HK$1.00 | Dormant | 38 |
70 | EntCorp Hong Kong Limited | Hong Kong | Ordinary Shares HK$1.00 | Sale and support of software | 39 |
| Company name | Country of incorporation | Class(es) of shares held1,2 | Principal activities | Key to Registered office address | |
| Subsidiaries | |||||
71 | Micro Focus Limited Hong Kong (Branch) | Hong Kong | Branch | Sale and support of software | 38 |
72 | Micro Focus Software HK Limited (formerly Attachmate Group Hong Kong Limited) | Hong Kong | Ordinary Shares HK$10.00 | Sale and support of software | 38 |
73 | NetIQ Asia Ltd. | Hong Kong | Ordinary Shares HK$1.00 | Dormant | 38 |
74 | Autonomy Software Asia Private Limited | India | Equity Shares INR10.00 | Sale and support of software | 40 |
75 | Borland Software India Private Limited | India | Equity Shares INR10.00 | Dormant | 41 |
76 | Entco IT Services Private Limited | India | Equity Shares INR10.00 | Sale and support of software | 42 |
77 | Interwoven, Inc., India Branch | India | Branch | Sale and support of software | 43 |
78 | Micro Focus India Private Limited | India | Equity Shares INR10.00 | Support of software | 41 |
79 | Micro Focus Software India Private Limited | India | Equity Shares INR10.00 | Development, sale and support of software | 41 |
80 | Micro Focus Software Solutions Private Limited (formerly Entco Software India Private Limited) | India | Equity Shares INR10.00 | Sale and support of software | 44 |
81 | Novell India Private Ltd. | India | Equity Shares INR10.00 | Dormant | 45 |
82 | Relativity Technologies Private Limited | India | Equity Shares INR10.00 | Sale and support of software | 41 |
83 | Attachmate Ireland Limited | Ireland | Ordinary Shares €1.27 | Sale and support of software | 46 |
84 | Entsoft Holding Ireland Unlimited Company | Ireland | Ordinary Shares US$1.00 | Holding Company | 46 |
85 | Micro Focus (IP) Ireland Limited | Ireland | Ordinary Shares US$1.00 | Dormant | 47 |
86 | Micro Focus (Ireland 1) Limited (formerly SUSE Linux Holdings Limited) | Ireland | Ordinary Shares US$1.00 | Holding Company | 47 |
87 | Micro Focus (Ireland 2) Limited (formerly SUSE Linux Ireland Limited) | Ireland | Ordinary Shares US$1.00 | Dormant | 47 |
88 | Micro Focus Finance Ireland Limited | Ireland | Ordinary Shares US$1.00 | Holding Company | 48 |
89 | Micro Focus Galway Limited (formerly Entsoft Galway Limited | Ireland | Ordinary Shares €1.00 | Sale and support of software | 46 |
90 | Micro Focus Group Holdings Unlimited Company | Ireland | Ordinary Shares €1.00 | Holding Company | 47 |
91 | Micro Focus International Holdings Limited | Ireland | Ordinary Shares €1.00 | Holding Company | 47 |
| Company name | Country of incorporation | Class(es) of shares held1,2 | Principal activities | Key to Registered office address | |
| Subsidiaries | |||||
92 | Micro Focus Ireland Limited | Ireland | Ordinary Shares €1.00 | Development, sale and support of software | 47 |
93 | Micro Focus Software (Ireland) Limited | Ireland | Ordinary Shares €1.25 Ordinary Shares US$1.00 | Development, sale and support of software | 48 |
94 | Micro Focus Software Solutions Ireland Limited (formerly Entsoft Ireland Limited) | Ireland | Ordinary Shares €1.00 | Sale and support of software | 46 |
95 | NetIQ Europe Limited | Ireland | Ordinary Shares €1.00 | Sale and support of software | 46 |
96 | NetIQ Ireland Limited | Ireland | Ordinary Shares €1.00 | Holding Company | 47 |
97 | Novell Cayman Software International Unlimited Company | Ireland | Ordinary Shares US$1.00 | Holding Company | 47 |
98 | Novell Cayman Software Unlimited Company | Ireland | Ordinary Shares US$1.00 | Holding Company | 47 |
99 | Novell Ireland Real Estate Unlimited Company | Ireland | Ordinary Shares €1.25 A Ordinary Shares €1.25 | Holding Company | 47 |
100 | Novell Software International Limited | Ireland | Ordinary Shares US$1.00 | Holding Company | 47 |
101 | Micro Focus Interactive Israel Ltd (formerly Entco Interactive (Israel) Limited) | Israel | Ordinary Shares of NIS1.00 | Sale and support of software | 49 |
102 | Micro Focus Israel Limited | Israel | Ordinary Shares NIS1.00 | Development and support of software | 50 |
103 | Micro Focus Software Israel Ltd (formerly Entcorp Software Israel Limited) | Israel | Ordinary Shares NIS1.00 | Sale and support of software | 49 |
104 | N.Y. NetManage (Yerushalayim) Ltd | Israel | Ordinary Shares NIS1.00 | Dormant | 51 |
105 | Novell Israel Software International Limited | Israel | Ordinary Shares NIS1.00 | In liquidation | 106 |
106 | Enterprise Corp Italiana S.r.l. | Italy | Registered Capital | Sale and support of software | 52 |
107 | Micro Focus Italiana S.r.l. (formerly Entco Italiana Srl | Italy | Registered Capital | Sale and support of software | 53 |
108 | Micro Focus Srl | Italy | Registered Capital | Sale and support of software | 53 |
109 | Serena Software Europe Limited - Italy Branch | Italy | Branch | Sale and support of software | 53 |
110 | Verity Italia S.r.l. | Italy | Registered Capital | Sale and support of software | 54 |
111 | Entcorp Japan K.K. | Japan | Ordinary Shares | Sale and support of software | 55 |
112 | Micro Focus Enterprise Ltd | Japan | Ordinary Shares | Sale and support of software | 56 |
113 | Micro Focus LLC (formerly Micro Focus KK) | Japan | Interest in capital | Sale and support of software | 56 |
| Company name | Country of incorporation | Class(es) of shares held1,2 | Principal activities | Key to Registered office address | |
| Subsidiaries | |||||
114 | Novell Japan, Ltd | Japan | Common Stock | Sale and support of software | 56 |
115 | Serena Software Japan LLC (formerly Serena Software Japan KK) | Japan | Interest in Capital | Sale and support of software | 56 |
116 | Micro Focus Korea Limited | South Korea | Units KRW5000 | Sale and support of software | 57 |
117 | Serena Software Europe Limited - Korea Branch | South Korea | Branch | Sale and support of software | 58 |
118 | Micro Focus Finance S.à r.l. | Luxembourg | Ordinary Shares US$1.00 | In liquidation | 59 |
119 | Micro Focus Luxembourg S.à r.l. (formerly Entco Luxembourg Sarl) | Luxembourg | Ordinary Shares | Sale and support of software | 59 |
120 | Minerva Finance S.à r.l. | Luxembourg | Ordinary Shares US$1.00 | In liquidation | 59 |
121 | Verity Luxembourg S.à r.l. | Luxembourg | Ordinary Shares €25.00 | Sale and support of software | 60 |
122 | Micro Focus Malaysia Sdn. Bhd. (formerly Entco Software Malaysia Sdn. Bhd.) | Malaysia | Ordinary Shares RM1,000.00 | Sale and support of software | 61 |
123 | Novell Corporation (Malaysia) Sdn. Bhd. | Malaysia | Ordinary Shares RM1.00 | Sale and support of software | 62 |
124 | Micro Focus International Mexico, S. de R.L. de C.V. (formerly Entco México, S. de R.L. de C.V. ) | Mexico | Equity Interest Quota MXN1.00 | Sale and support of software | 63 |
125 | Micro Focus Limited Mexico (Branch) | Mexico | Branch | Sale and support of software | 64 |
126 | Micro Focus Software Mexico, S. De R.L. De C.V. (formerly Entco Software México, S. de R.L. de C.V.) | Mexico | Equity Interest Quota MXN1.00 | Sale and support of software | 63 |
127 | Micro Focus Software Solutions Mexico, S. de R.L. de C.V. (formerly Entcorp Software México, S. de R.L. de C.V.) | Mexico | Equity Interest Quota MXN1.00 | Sale and support of software | 63 |
128 | Attachmate Group Netherlands B.V. | Netherlands | Ordinary Shares €100.00 | Sale and support of software | 65 |
129 | Authasas Advanced Authentication B.V. | Netherlands | Ordinary Shares €1.00 | Dormant | 65 |
130 | Authasas B.V | Netherlands | Ordinary Shares A €1.00 Ordinary Shares B €1.00 | Sale and support of software | 65 |
131 | Autonomy HoldCo B.V. | Netherlands | Ordinary Shares US$100.00 | Sale and support of software | 65 |
132 | Autonomy Netherlands BV | Netherlands | Common Shares €100.00 | Sale and support of software | 65 |
133 | Borland BV | Netherlands | Ordinary Shares €5.00 | Sale and support of software | 65 |
134 | Entco Eastern Holding B.V. | Netherlands | Ordinary Shares US$100.00 | Holding Company | 65 |
135 | Entco Gatriam Holding B.V. | Netherlands | Ordinary Shares US$100.00 | Holding Company | 65 |
| Company name | Country of incorporation | Class(es) of shares held1,2 | Principal activities | Key to Registered office address | |
| Subsidiaries | |||||
136 | Entco HoldCo I B.V. | Netherlands | Ordinary Shares US$100.00 | Holding Company | 65 |
137 | Entco HoldCo II B.V. | Netherlands | Ordinary Shares US$100.00 | Holding Company | 65 |
138 | Entco HoldCo III B.V. | Netherlands | Ordinary Shares US$100.00 | Holding Company | 65 |
139 | Entco HoldCo IV B.V. | Netherlands | Ordinary Shares US$100.00 | Holding Company | 65 |
140 | Entco Holding Berlin B.V. | Netherlands | Ordinary Shares US$100.00 | Holding Company | 65 |
141 | Entco Holding Hague II B.V. | Netherlands | Ordinary Shares US$100.00 | Holding Company | 65 |
142 | Entco Sinope Holding B.V. | Netherlands | Ordinary Shares US$100.00 | Holding Company | 65 |
143 | Entcorp Nederland B.V. | Netherlands | Ordinary Shares €100.00 | Sale and support of software | 65 |
144 | Micro Focus B.V. | Netherlands | Common Shares €100.00 | Sale and support of software | 65 |
145 | Micro Focus Caribe Holding B.V. (formerly Entco Caribe B.V.) | Netherlands | Ordinary Shares US$100.00 | Sale and support of software | 65 |
146 | Micro Focus Eastern Holding II B.V. (formerly Entco Eastern Holding II B.V.) | Netherlands | Ordinary Shares US$100.00 | Holding Company | 65 |
147 | Micro Focus Enterprise B.V. (formerly Entco Enterprise B.V.) | Netherlands | Ordinary Shares US$100.00 | Sale and support of software | 65 |
148 | Micro Focus HoldCo B.V. (formerly Entco HoldCo B.V.) | Netherlands | Ordinary Shares US$100.00 | Holding Company | 65 |
149 | Micro Focus Holding Finance B.V. (formerly Entco Holding Finance B.V.) | Netherlands | Ordinary Shares US$100.00 | Holding Company | 65 |
150 | Micro Focus Holding Hague B.V. (formerly Entco Holding Hague B.V.) | Netherlands | Ordinary Shares US$100.00 | Holding Company | 65 |
151 | Micro Focus Holding PR B.V. (formerly Entco Puerto Rico B.V.) | Netherlands | Ordinary Shares US$100.00 | Sale and support of software | 65 |
152 | Micro Focus International Trade B.V. (formerly Entco International Trade B.V.) | Netherlands | Ordinary Shares US$100.00 | Sale and support of software | 65 |
153 | Micro Focus Nederland B.V. (formerly Entco Nederland B.V.) | Netherlands | Ordinary Shares US$100.00 | Sale and support of software | 65 |
154 | Verity Benelux B.V. | Netherlands | Common Shares of €500.00 | Sale and support of software | 65 |
155 | Micro Focus Software (New Zealand) Unlimited | New Zealand | Ordinary Shares | Sale and support of software | 66 |
156 | Micro Focus AS | Norway | Ordinary Shares NOK1,602.00 | Sale and support of software | 67 |
| Company name | Country of incorporation | Class(es) of shares held1,2 | Principal activities | Key to Registered office address | |
| Subsidiaries | |||||
157 | Entcorp Philippines, Inc. | Philippines | Common Stock PHP1.00 | Sale and support of software | 68 |
158 | Micro Focus Polska sp. z o.o. (formerly Entco Polska sp. z.o.o.) | Poland | Ordinary Shares PLN500.00 | Sale and support of software | 69 |
159 | Micro Focus S.L. - Sucursal Em Portugal (Branch) | Portugal | Branch | Sale and support of software | 70 |
160 | Novell Portugal - Informática Lda | Portugal | Ordinary Shares €14,864.18 Ordinary Shares €99.76 | Sale and support of software | 71 |
161 | Micro Focus Caribe Holding B.V. LLC Branch (formerly Entco Caribe B.V. LLC ) | Puerto Rico | Branch | Sale and support of software | 72 |
162 | Micro Focus Holding PR B.V. LLC Branch (formerly Entco Puerto Rico B.V. LLC ) | Puerto Rico | Branch | Sale and support of software | 73 |
163 | Micro Focus Software Romania SRL (formerly Entco Software Romania SRL) | Romania | Ordinary Shares RON10.00 | Sale and support of software | 74 |
164 | Limited Liability Company Micro Focus (formerly Limited Liability Company Entco) | Russian Federation | Interest in Capital | Sale and support of software | 75 |
165 | Micro Focus LLC | Saudi Arabia | Ordinary Shares SAR50 | Sale and support of software | 76 |
166 | Autonomy Systems Singapore Pte. Ltd. | Singapore | Ordinary Shares | Sale and support of software | 77 |
167 | Borland (Singapore) Pte. Ltd. | Singapore | Ordinary Shares | Sale and support of software | 78 |
168 | Entco Software Pte. Ltd. | Singapore | Ordinary Shares | Sale and support of software | 77 |
169 | Mercury Interactive (Singapore) Pte Ltd | Singapore | Ordinary Shares | In liquidation | 107 |
170 | Micro Focus Pte. Ltd. | Singapore | Ordinary Shares | Sale and support of software | 78 |
171 | Micro Focus Software Pte. Ltd. | Singapore | Ordinary Shares | Sale and support of software | 77 |
172 | Autonomy Systems Software South Africa Pty Ltd | South Africa | Ordinary Shares ZAR1.00 | Sale and support of software | 79 |
173 | Micro Focus Software South Africa (Pty) Ltd (formerly Attachmate Group South Africa (Pty) Limited | South Africa | Ordinary Shares ZAR1.00 | Sale and support of software | 80 |
174 | Micro Focus South Africa (Pty) Ltd | South Africa | Ordinary Shares ZAR1.00 | Sale and support of software | 80 |
175 | Micro Focus Field Delivery Spain, S.L.U. (formerly Entco Field Delivery Spain, S.L.U.) | Spain | Ordinary Shares €1.00 | Sale and support of software | 81 |
176 | Micro Focus S.L.U. | Spain | Registered Shares €9.00 | Sale and support of software | 82 |
177 | Micro Focus Software Spain S.L.U. (formerly Entco Software Spain S.L.U.) | Spain | Ordinary Shares €1.00 | Sale and support of software | 81 |
| Company name | Country of incorporation | Class(es) of shares held1,2 | Principal activities | Key to Registered office address | |
| Subsidiaries | |||||
178 | Serena Software SA | Spain | Ordinary Shares €546.92 | Sale and support of software | 83 |
179 | Micro Focus AS, Norge, filial i Sverige (Branch) | Sweden | Branch | Sale and support of software | 84 |
180 | Micro Focus Sverige AB (formerly Entco Sverige AB) | Sweden | Quota SEK1.00 | Sale and support of software | 84 |
181 | Micro Focus Enterprise B.V., Amstelveen, Versoix Branch | Switzerland | Branch | Sale and support of software | 85 |
182 | Micro Focus GmbH | Switzerland | Quotas CHF100.00 | Sale and support of software | 86 |
183 | Micro Focus International Suisse Sàrl (formerly Entco International Sàrl ) | Switzerland | Ordinary Shares CHF1,000.00 | Sale and support of software | 85 |
184 | Micro Focus Schweiz GmbH (formerly Entco Schweiz GmbH ) | Switzerland | Ordinary Shares CHF100.00 | Sale and support of software | 86 |
185 | Serena Software GmbH- Swiss Branch | Switzerland | Branch | Sale and support of software | 87 |
186 | Trilead GmbH | Switzerland | Ordinary Shares CHF100.00 | Sale and support of software | 88 |
187 | Interwoven, Inc., Taiwan Branch | Taiwan | Branch | Sale and support of software | 89 |
188 | Novell (Taiwan) Co., Ltd. | Taiwan | Ordinary Shares NT$10.00 | Sale and support of software | 90 |
189 | Micro Focus Enterprise Tunisia SARL | Tunisia | Ordinary Shares TND10.00 | Sale and support of software | 91 |
190 | Micro Focus Teknoloji Çözümleri Limited Şirketi (formerly Entco Turkey Teknoloji Çözümleri Limited Şirketi) | Turkey | Ordinary Shares TRY25.00 | Sale and support of software | 92 |
191 | Serena Software Ukraine LLC | Ukraine | Interest in Capital | Sale and support of software | 93 |
192 | Entco International SARL-Abu Dhabi - Branch | United Arab Emirates | Branch | Sale and support of software | 94 |
193 | Entco International SARL-Jebel Ali Free Zone - Branch | United Arab Emirates | Branch | Sale and support of software | 95 |
194 | Entco Software Services Middle East FZ-LLC | United Arab Emirates | Ordinary Shares AED1,000.00 | Sale and support of software | 96 |
195 | Attachmate Sales UK Limited | United Kingdom | Ordinary Shares £1.00 | Sale and support of software | 97 |
196 | Autonomy Digital Limited | United Kingdom | Ordinary Shares £1.00 | In liquidation | 108 |
197 | Autonomy Systems Limited | United Kingdom | Ordinary Shares £1.00 | Sale and support of software | 98 |
198 | Borland (Holding) UK Ltd | United Kingdom | Ordinary Shares £1.00 | Dormant | 97 |
| Company name | Country of incorporation | Class(es) of shares held1,2 | Principal activities | Key to Registered office address | |
| Subsidiaries | |||||
199 | Borland (UK) Limited | United Kingdom | Ordinary Shares £1.00 | Dormant | 97 |
200 | Entcorp Marigalante UK Limited | United Kingdom | Ordinary Shares £1.00 | Sale and support of software | 98 |
201 | Interwoven UK Limited | United Kingdom | Ordinary Shares £1.00 | In liquidation | 108 |
202 | Longsand Limited | United Kingdom | Ordinary Shares £1.00 | Sale and support of software | 98 |
203 | Merant Holdings | United Kingdom | Ordinary Shares £1.00 | Holding Company | 97 |
204 | Meridio Limited | United Kingdom | Ordinary Shares £1.00 | In liquidation | 109 |
205 | Micro Focus (IP) Holdings Limited | United Kingdom | Ordinary Shares US$1.00 | Dormant | 97 |
206 | Micro Focus (IP) Ltd | United Kingdom | Ordinary Shares £1.00 | Holding Company | 97 |
207 | Micro Focus (US) Holdings | United Kingdom | Ordinary Shares US$1.00 | Holding Company | 97 |
208 | Micro Focus APM Solutions Limited | United Kingdom | Ordinary Shares £1.00 | In liquidation | 97 |
209 | Micro Focus CHC Limited | United Kingdom | Ordinary Shares US$0.01 Redeemable Preference Shares US$1.00 C Preference Shares US$1.00 | Holding Company | 97 |
210 | Micro Focus Foreign HoldCo Ltd (formerly Entco Foreign HoldCo Ltd) | United Kingdom | Ordinary Shares £1.00 | Holding Company | 98 |
211 | Micro Focus Global Limited (formerly Novell U.K. Limited | United Kingdom | Ordinary Shares £1.00 | Sale and support of software | 97 |
212 | Micro Focus Group Limited | United Kingdom | Ordinary Shares £1.00 | Holding Company | 97 |
213 | Micro Focus Holdings Unlimited | United Kingdom | Ordinary Shares £0.01 | Holding Company | 97 |
214 | Micro Focus Integration Holdings Limited | United Kingdom | Ordinary Shares US$1.00 | Holding Company | 97 |
215 | Micro Focus Integration Limited | United Kingdom | Ordinary Shares US$1.00 | Sale and support of software | 97 |
216 | Micro Focus IP Development Limited | United Kingdom | Ordinary Shares US$1.00 | Development and support of software | 97 |
| Company name | Country of incorporation | Class(es) of shares held1,2 | Principal activities | Key to Registered office address | |
| Subsidiaries | |||||
217 | Micro Focus Limited | United Kingdom | Ordinary Shares £1.00 | Sale and support of software | 97 |
218 | Micro Focus MHC Limited | United Kingdom | A Ordinary Shares £0.00001 B Ordinary Shares £0.00001 | Holding Company | 97 |
219 | Micro Focus Midco Holdings Limited | United Kingdom | Ordinary Shares US$0.01 | Holding Company | 97 |
220 | Micro Focus Midco Limited | United Kingdom | Ordinary Shares US$0.0001 | Holding Company | 97 |
221 | Micro Focus Situla Holding Ltd (formerly Entco Situla Holding Ltd) | United Kingdom | Ordinary Shares £1.00 | Holding Company | 98 |
222 | Micro Focus Software (IP) Holdings Limited | United Kingdom | Ordinary Shares US$0.01 Preferred Shares US$1.00 | Holding Company | 97 |
223 | Micro Focus Software Holdings Ltd (formerly Novell UK Software Limited) | United Kingdom | Ordinary Shares £1.00 | Sale and support of software | 97 |
224 | Micro Focus Software UK Ltd (formerly Entcorp UK Ltd ) | United Kingdom | Ordinary Shares £1.00 | Sale and support of software | 98 |
225 | Micro Focus UK Limited | United Kingdom | Ordinary Shares £1.00 | Dormant | 97 |
226 | NetIQ Limited | United Kingdom | Ordinary Shares £1.00 | Dormant | 97 |
227 | Ryan McFarland Limited | United Kingdom | Ordinary Shares £1.00 | In liquidation | 97 |
228 | Serena Holdings | United Kingdom | Ordinary Shares US$1.00 | Holding Company | 97 |
229 | Serena Software Europe Limited | United Kingdom | Ordinary Shares £1.00 | Sale and support of software | 97 |
230 | XDB (UK) Limited | United Kingdom | Ordinary Shares £1.00 | In liquidation | 97 |
231 | ZANTAZ UK Limited | United Kingdom | Ordinary Shares £1.00 | In liquidation | 108 |
232 | Attachmate Corporation | United States | Common Stock US$0.01 | Development and support of software | 99 |
233 | Borland Corporation | United States | Common Stock US$0.01 | Holding Company | 100 |
234 | Borland Software Corporation | United States | Common Stock US$0.01 | Development and support of software | 100 |
235 | Borland Technology Corporation | United States | Common Stock US$0.01 | Dormant | 100 |
| Company name | Country of incorporation | Class(es) of shares held1,2 | Principal activities | Key to Registered office address | |
| Subsidiaries | |||||
236 | Entco Delaware LLC | United States | Interest in Capital | Sale and support of software | 100 |
237 | Entco Holdings, Inc. | United States | Common Stock US$0.01 | Holding Company | 100 |
238 | Entco Technologies, Inc. | United States | Common Stock US$0.001 | Sale and support of software | 100 |
239 | Entco, LLC | United States | Interest in Capital | Sale and support of software | 100 |
240 | GWAVA Technologies Inc | United States | Common Stock of US$1.00 | Sale and support of software | 100 |
241 | Interset Software - US, Inc. | United States | Common Stock US$0.0001 | Sale and support of software | 100 |
242 | MA FinanceCo., LLC | United States | Units | Holding Company | 100 |
243 | Marcel Holdings LLC | United States | Limited Liability Company Interest US$1.00 | Sale and support of software | 101 |
244 | Micro Focus (US) Group, Inc | United States | Common Stock US$0.01 | Holding Company | 100 |
245 | Micro Focus (US) International Holdings, Inc. | United States | Common Stock US$0.01 | Holding Company | 100 |
246 | Micro Focus (US), Inc. | United States | Common Stock US$0.01 | Development and support of software | 100 |
247 | Micro Focus Brazil Holdings LLC (formerly Entco Brazil Holdings LLC) | United States | Interest in Capital | Holding Company | 100 |
248 | Micro Focus Government Solutions LLC (formerly Entco Government Solutions LLC) | United States | Interest in Capital | Sale and support of software | 100 |
249 | Micro Focus LLC (formerly EntIT Software LLC) | United States | Limited Liability Company Interests | Sale and support of software | 100 |
250 | Micro Focus Software Inc. | United States | Voting Common Stock US$0.01 Non-voting Common Stock US$0.01 | Development and support of software | 100 |
251 | MicroLink LLC | United States | Limited Liability Company Interests | Sale and support of software | 102 |
252 | NetIQ Corporation | United States | Common Stock US$0.001 | Development and support of software | 100 |
253 | Novell Holdings, Inc. | United States | Common Stock US$0.01 | Holding Company | 100 |
| Company name | Country of incorporation | Class(es) of shares held1,2 | Principal activities | Key to Registered office address | |
| Subsidiaries | |||||
254 | Novell International Holdings, Inc. | United States | Common Stock US$0.01 | Holding Company | 100 |
255 | Seattle SpinCo, Inc. | United States | Class A Common Stock US$0.01 Class B Common Stock US$0.01 | Holding Company | 100 |
256 | Serena Software, Inc. | United States | Common Stock US$0.01 | Holding Company | 100 |
257 | Spartacus Acquisition Holdings Corp | United States | Common Stock US$0.001 | Holding Company | 100 |
258 | Stratify, Inc. | United States | Common Stock US$0.001 | Sale and support of software | 100 |
259 | The Attachmate Group, Inc. | United States | Common Stock US$0.001 | Holding Company | 100 |
260 | Vertica Systems, LLC | United States | Limited Liability Company Interests | Sale and support of software | 100 |
| October 31, 2019 | October 31, 2018 | October 31, 2021 | October 31, 2020 | |||||||||||||
| $m | $m | $m | $m | |||||||||||||
| Employee benefit deposit | 33.4 | 31.1 | 22.6 | 17.9 | ||||||||||||
| Long-term rent deposits | 4.9 | 4.1 | 8.3 | 5.3 | ||||||||||||
| Long-term prepaid expenses | 4.5 | 2.9 | 4.0 | 2.3 | ||||||||||||
| Net investment in finance sub-leases | 6.0 | 5.5 | ||||||||||||||
| Other | 1.2 | 0.7 | 1.3 | 0.8 | ||||||||||||
| 44.0 | 38.8 | 42.2 | 31.8 | |||||||||||||
Employee benefit deposits are held in Germany ($16.4m), Israel ($11.9m)17.3 million), Italy ($2.4m)2.5 million) and the Netherlands ($2.7m) (October 31, 2018: Germany $15.4m,2.8 million) (2020: Israel $10.2m,$12.8 million, Italy $2.7m$2.4 million and the Netherlands $2.8m)$2.7 million). Employers in Germany, Italy and Israel are required by law to maintain funds to satisfy certain employee benefit liabilities, including free time off and compensation for involuntary termination of employment. These investment-based deposits are managed by third parties and the carrying values are marked-to-market based on third-partythird party investment reports. In addition, a cash deposit was held in the Netherlands on behalf of certain employees to cover legacy employment subsistence benefits.
| October 31, 2019 | October 31, 2018 | |||||||
| $m | $m | |||||||
| Work in progress | - | - | ||||||
| Finished goods | 0.1 | 0.2 | ||||||
| 0.1 | 0.2 | |||||||
Consolidated financial statements and notes
Notes to the consolidated financial statements
14 Trade and other receivables
| October 31, 2019 | October 31, 2018 | October 31, 2021 | October 31, 2020 | |||||||||||||
| $m | $m | $m | $m | |||||||||||||
| Trade receivables | 877.9 | 1,089.6 | 738.8 | 628.4 | ||||||||||||
| Loss allowance | (42.4 | ) | (41.9 | ) | (14.0 | ) | (17.9 | ) | ||||||||
| Trade receivables net | 835.5 | 1,047.7 | 724.8 | 610.5 | ||||||||||||
| Prepayments | 53.9 | 60.0 | 40.1 | 49.1 | ||||||||||||
| Other receivables | 87.2 | 79.0 | 59.4 | 38.1 | ||||||||||||
| Contract assets | 56.3 | 85.3 | 62.0 | 33.7 | ||||||||||||
| 1,032.9 | 1,272.0 | 886.3 | 731.4 | |||||||||||||
Concentrations of credit risk with respect to trade receivables are limited due to the Group’s customer base being large and unrelated. The Group considers the credit quality of trade and other receivables on a customer-by-customer basis. The Group considers that the carrying value of the trade and other receivables that is disclosed below gives a fair presentation of the credit quality of the assets. This is considered to be the case as there is a low risk of default due to the high number of recurring customers and credit control policies. In determining the recoverability of a trade receivable, the Group considers the ageing of each debtor and any change in the circumstances of the individual receivable. Other than ageing (included below), no other credit rating grades are assessed. Due to this, management believes there is no further credit risk provision required in excess of the normal provision determined by the expected credit loss methodology applied.
At October 31, 20192021 and October 31, 2018,2020, the carrying amount approximates the fair value of the instrument due to the short-term nature of the instrument. The trade receivables of $877.9m at October 31, 2019 (October 31, 2018: $1,089.6m) are net of the $nil (October 31, 2018: $21.5m) loss allowance in the opening balance sheet for the HPE Software business (note 38) as amounts provided in the prior period have been utilized in the current period.
As at October 31, 2019,2021, a loss allowance of $42.4m (October 31, 2018: $41.9m)$14.0 million (2020: $17.9 million) was recognized for trade receivables.
The ageing of these receivables is as follows:
Current $m | Up to three months $m | Three to four months $m | Over four months $m | Total $m | Current | Up to three months | Three to four months | Over four months | Total | |||||||||||||||||||||||||||||||
| October 31, 2019 | ||||||||||||||||||||||||||||||||||||||||
| $m | $m | $m | $m | $m | ||||||||||||||||||||||||||||||||||||
October 31, 2021: | ||||||||||||||||||||||||||||||||||||||||
| Gross trade receivables | 696.0 | 110.1 | 8.9 | 62.9 | 877.9 | 655.3 | 61.3 | 6.6 | 15.6 | 738.8 | ||||||||||||||||||||||||||||||
| Loss allowance | (8.9 | ) | (3.8 | ) | (1.5 | ) | (28.2 | ) | (42.4 | ) | (2.6 | ) | (1.1 | ) | (0.5 | ) | (9.8 | ) | (14.0 | ) | ||||||||||||||||||||
| Net trade receivables | 687.1 | 106.3 | 7.4 | 34.7 | 835.5 | 652.7 | 60.2 | 6.1 | 5.8 | 724.8 | ||||||||||||||||||||||||||||||
| October 31, 2018 | ||||||||||||||||||||||||||||||||||||||||
October 31, 2020: | ||||||||||||||||||||||||||||||||||||||||
| Gross trade receivables | 798.5 | 153.4 | 13.6 | 124.1 | 1,089.6 | 561.4 | 42.3 | 4.3 | 20.4 | 628.4 | ||||||||||||||||||||||||||||||
| Loss allowance | - | - | (3.6 | ) | (38.3 | ) | (41.9 | ) | (6.1 | ) | (0.9 | ) | (0.4 | ) | (10.5 | ) | (17.9 | ) | ||||||||||||||||||||||
| Net trade receivables | 798.5 | 153.4 | 10.0 | 85.8 | 1,047.7 | 555.3 | 41.4 | 3.9 | 9.9 | 610.5 | ||||||||||||||||||||||||||||||
Movements in the Group provision for impairment of trade receivables were as follows:
| October 31, 2019 | October 31, 2018 | |||||||
| $m | $m | |||||||
| At November 1 / May 1 (calculated under IAS 39) | 41.9 | 2.6 | ||||||
| Accounting policy change (IFRS 9 - recognized against retained earnings on November 1, 2018) | 20.0 | - | ||||||
| Revised November 1 / May 1 | 61.9 | 2.6 | ||||||
| Loss allowance provided in the period | 16.0 | 40.0 | ||||||
| Receivables written off as uncollectable | (35.5 | ) | (0.7 | ) | ||||
| At October 31 | 42.4 | 41.9 | ||||||
| October 31, 2021 | October 31, 2020 | |||||||
| $m | $m | |||||||
At November 1 | 17.9 | 42.4 | ||||||
Loss allowance provided/(released)in the year | 0.6 | (4.8) | ||||||
| Receivables written off as uncollectable | (4.5 | ) | (19.7 | ) | ||||
| At October 31, | 14.0 | 17.9 | ||||||
The creation and release of the loss allowance for receivables have been included in selling and distribution costs in the Consolidated statement of comprehensive income. Amounts charged in the allowance account are generally written off when there is no expectation of recovering additional cash. The Group does not hold any collateral as security.
The loss allowance for trade receivables is measured at an amount equal to the life-timelifetime expected credit losses as allowed for byunder IFRS 9. Prior
F-47
Consolidated financial statements and notes
Notes to the adoption of IFRS 9 on November 1, 2018, trade receivables were stated net of allowances for estimated irrecoverable amounts due to the identification of a loss event (the incurred loss method).consolidated financial statements
| 14 | Trade and other receivables continued |
Contract assets relate to amounts not yet billed and so not yet due from customers and contain no amounts past due.which are expected to be invoiced to customers. The movement in contract assets in the year is primarily the result of a number of multi-year billing contracts, totalling circa $14 million, entered into shortly before the period end where the licences were delivered in October. Excluding these contracts, the level of new contract assets that have arisen during the year is consistent with the level of billings on existing contract assets. The Group considers the credit quality of contract assets on a customer-by-customer basis. As with trade receivables, which contract assets convert to upon invoicing, there is considered to be a low risk of default due to the high number of recurring customers. In determining the recoverability of a contract asset, the Group considers the specific circumstances of each contract asset and any change in the circumstances of the balance. Due to this management believes significant provision is not required.
15 Contract-related costs
| October 31, 2021 | October 31, 2020 | |||||||
| $m | $m | |||||||
| Current | 33.0 | 27.9 | ||||||
| Non-current | 31.9 | 35.7 | ||||||
| 64.9 | 63.6 | |||||||
The Group capitalizecapitalizes the costs of obtaining a customer contract when they are incremental and, if expected to be recovered, they are amortized over the customer life or pattern of revenue for the related contract. All amounts capitalized relate to commission costs.
Normally sales commissions paid for customer contract renewals are not commensurate with the commissions paid for new contracts. It follows that the commissions paid for new contracts also relate to expected future renewals of these contracts. Accordingly, we amortize sales commissions paid for new customer contracts on a straight-line basis over the expected customer life, based on expected renewal frequency. The current average customer life is five years.years. If the expected amortization period is one year or less the Group expenses the costs when incurred.
The amortization expenses in the periodyear for the costs of obtaining customer contracts were $10.2m.$22.6 million(2020: $16.1 million).
Amortization of the capitalized costs of obtaining customer contracts is classified as sales and marketing expense. Capitalized costs from customer contracts are classified as non-financial assets in our statement of financial position.
| ||||||||||||||||||||||||||||||||||||||||||||
16 Cash and cash equivalents
| October 31, 2021 | October 31, 2020 | |||||||
| $m | $m | |||||||
Cash at bank and in hand | 355.9 | 374.3 | ||||||
Short-term bank deposits | 202.5 | 362.9 | ||||||
| Cash and cash equivalents | 558.4 | 737.2 | ||||||
F-48
Consolidated financial statements and notes
Notes to the consolidated financial statements
16 Cash and cash equivalentscontinued
| October 31, 2019 | October 31, 2018 | |||||||||||
| Note | $m | $m | ||||||||||
| Cash at bank and in hand | 292.2 | 387.1 | ||||||||||
| Short-term bank deposits | 63.5 | 236.7 | ||||||||||
| 355.7 | 623.8 | |||||||||||
| Reclassification to current assets classified as held for sale | 37 | - | (2.9 | ) | ||||||||
| Cash and cash equivalents | 355.7 | 620.9 | ||||||||||
At October 31, 20192021 and October 31, 2018,2020, the carrying amount approximates to the fair value. The Group’s credit risk on cash and cash equivalents is limited as the counterparties are well established banks with generally high credit ratings. The credit quality of cash and cash equivalents is as follows:
| October 31, 2019 | October 31, 2018 | ||||||||
| $m | $m | ||||||||
S&P/Moody’s/Fitch rating: | |||||||||
AAA | 69.8 | 231.5 | |||||||
AA- | 87.6 | 81.0 | |||||||
| A+ | 144.4 | 260.4 | |||||||
| A | 23.4 | 20.1 | |||||||
| A- | 14.4 | 3.8 | |||||||
BBB+ | 1.7 | 4.5 | |||||||
BBB | 4.5 | 1.0 | |||||||
BBB- | 0.8 | 0.6 | |||||||
BB+ | 0.8 | 2.0 | |||||||
BB | 0.3 | - | |||||||
BB- | 6.3 | 15.2 | |||||||
| B+ | 0.2 | - | |||||||
CCC+ | - | 0.2 | |||||||
| C- | - | 0.3 | |||||||
Not rated | 1.5 | 0.3 | |||||||
| 355.7 | 620.9 | ||||||||
| October 31, 2021 | October 31, 2020 | |||||||
| $m | $m | |||||||
S&P/Moody’s/Fitch rating: | ||||||||
AAA | 184.8 | 358.4 | ||||||
AA- | 2.8 | 27.2 | ||||||
A+ | 348.6 | 318.6 | ||||||
A | 11.6 | 9.9 | ||||||
A- | 2.6 | 9.1 | ||||||
BBB+ to C- | 8.0 | 14.0 | ||||||
| 558.4 | 737.2 | |||||||
Where the opinions of the rating agencies differ, the lowest applicable rating has been assigned to the counterparty.
17 Trade and other payables – current
| October 31, 2019 | October 31, 2018 | |||||||
| $m | $m | |||||||
Trade payables | 105.0 | 46.1 | ||||||
Tax and social security | 80.7 | 46.5 | ||||||
Accruals | 425.3 | 584.3 | ||||||
| 611.0 | 676.9 | |||||||
| October 31, 2021 | October 31, 2020 | |||||||
| $m | $m | |||||||
Trade payables | 80.9 | 71.5 | ||||||
Tax and social security | 72.9 | 84.3 | ||||||
Accruals | 359.2 | 347.7 | ||||||
| 513.0 | 503.5 | |||||||
At October 31, 20192021 and at October 31, 2018,2020, the carrying amount approximates to the fair value. At October 31, 20192021 accruals include vacation and payroll – $88.4m (October 31, 2018: $147.0m)$79.7 million (2020: $82.8 million), commission and employee bonuses - $74.9m (October 31, 2018: $162.7m)$133.1 million (2020: $90.5 million), integration and divestiture expenses - $26.4m (October 31, 2018: $44.5m)$6.6 million (2020: $30.1 million) and consulting and audit fees - $36.9m (October 31, 2018: $30.3m)$26.8 million (2020: $23.8 million).
18 Borrowings
| October 31, 2021 | October 31, 2020 | |||||||
| $m | $m | |||||||
| Bank loan secured | 4,608.0 | 4,733.2 | ||||||
| Unamortized prepaid facility arrangement fees and original issue discounts | (59.6 | ) | (92.9 | ) | ||||
| Carrying value | 4,548.4 | 4,640.3 | ||||||
| October 31, 2021 | October 31, 2020 | |||||||||||||||||||||||
Bank loan secured | Unamortized prepaid facility arrangement fees and original issue discounts | Total | Bank loan secured | Unamortized prepaid facility arrangement fees and original issue discounts | Total | |||||||||||||||||||
| Reported within: | $m | $m | $m | $m | $m | $m | ||||||||||||||||||
| Current liabilities | 42.0 | (17.7 | ) | 24.3 | 34.2 | (12.8) | 21.4 | |||||||||||||||||
| Non-current liabilities | 4,566.0 | (41.9 | ) | 4,524.1 | 4,699.0 | (80.1 | ) | 4,618.9 | ||||||||||||||||
| 4,608.0 | (59.6 | ) | 4,548.4 | 4,733.2 | (92.9 | ) | 4,640.3 | |||||||||||||||||
F-49
Consolidated financial statements and notes
Notes to the consolidated financial statements
| October 31, 2019 | October 31, 2018 | |||||||
| $m | $m | |||||||
| Bank loan secured | 4,775.0 | 4,996.9 | ||||||
| Unamortized prepaid facility arrangement fees and original issue discounts | (104.3 | ) | (151.0 | ) | ||||
| 4,670.7 | 4,845.9 | |||||||
| October 31, 2019 | October 31, 2018 | |||||||||||||||||||||||
Bank loan secured | Unamortized prepaid facility arrangement fees and original issue discounts | Total | Bank loan secured | Unamortized prepaid facility arrangement fees and original issue discounts | Total | |||||||||||||||||||
| Reported within: | $m | $m | $m | $m | $m | $m | ||||||||||||||||||
| Current liabilities | - | - | - | 50.3 | (46.6 | ) | 3.7 | |||||||||||||||||
| Non-current liabilities | 4,775.0 | (104.3 | ) | 4,670.7 | 4,946.6 | (104.4 | ) | 4,842.2 | ||||||||||||||||
| 4,775.0 | (104.3 | ) | 4,670.7 | 4,996.9 | (151.0 | ) | 4,845.9 | |||||||||||||||||
The following facilities were undrawn as at October 31, 2019:
Term Loan B-2 | Term Loan B-3 | Seattle Spinco Term Loan B | Euro Term Loan B | Revolving Facility | Total | |||||||||||||||||||
| $m | $m | $m | $m | $m | $m | |||||||||||||||||||
| At May 1, 2017 | 1,515.2 | - | - | - | 80.0 | 1,595.2 | ||||||||||||||||||
| Acquisitions | - | - | 2,600.0 | - | - | 2,600.0 | ||||||||||||||||||
| Draw downs | - | 385.0 | - | 523.8 | 135.0 | 1,043.8 | ||||||||||||||||||
| Repayments | (11.4 | ) | (2.9 | ) | (19.5 | ) | (4.1 | ) | (215.0 | ) | (252.9 | ) | ||||||||||||
| Foreign exchange | - | - | - | 10.8 | - | 10.8 | ||||||||||||||||||
| At October 31, 2018 | 1,503.8 | 382.1 | 2,580.5 | 530.5 | - | 4,996.9 | ||||||||||||||||||
| At November 1, 2018 | 1,503.8 | 382.1 | 2,580.5 | 530.5 | - | 4,996.9 | ||||||||||||||||||
| Draw downs | - | - | - | - | - | - | ||||||||||||||||||
| Repayments | (89.1 | ) | (13.9 | ) | (94.2 | ) | (15.4 | ) | - | (212.6 | ) | |||||||||||||
| Foreign exchange | - | - | - | (9.3 | ) | - | (9.3 | ) | ||||||||||||||||
| At October 31, 2019 | 1,414.7 | 368.2 | 2,486.3 | 505.8 | - | 4,775.0 | ||||||||||||||||||
Short-term borrowing of $4,686.0m based$24.3 million represents capital repayments of $42.0 million falling due on trading pricesthe Group borrowings within one year less unamortized prepaid facility arrangement fees and original issue discounts of $17.7 million.
The Group’s earliest debt maturity is in June 2024, however as described below, annual instalment payments are required.
The following facilities were drawn as at October 31, 2019.2021:
| • | The €585.0 million (equivalent to $676.0 million) senior secured five-year term loan B-1 issued by MA FinanceCo., LLC, maturing in June 2025, is priced at EURIBOR plus 4.5% (subject to a EURIBOR floor of 0.00%) with an original issue discount of 3.0%; |
| • | The $359.5 million senior secured seven-year term loan B-3 issued by MA FinanceCo., LLC, maturing in June 2024, is priced at LIBOR plus 2.75% (subject to a LIBOR floor of 0.00%) with an original issue discount of 0.25%; |
| • | The $633.7 million senior secured five-year term loan B-4 issued by MA FinanceCo., LLC, maturing in June 2025, is priced at LIBOR plus 4.25% (subject to a LIBOR floor of 1.00%) with an original issue discount of 2.5%; |
| • | The $2,427.9 million senior secured seven-year term loan B issued by Seattle SpinCo, Inc., maturing in June 2024, is priced at LIBOR plus 2.75% (subject to a LIBOR floor of 0.00%) with an original issue discount of 0.25%; and |
| • | The €442.2 million (equivalent to $510.9 million) senior secured seven-year term loan B issued by MA FinanceCo., LLC, maturing in June 2024, is priced at EURIBOR plus 3.00% (subject to a EURIBOR floor of 0.00%) with an original issue discount of 0.25%. |
The maturity profilefollowing facilities were undrawn as at October 31, 2021:
A senior secured revolving credit facility of $350.0 million (“Revolving Facility”), with an interest rate of 3.25% above LIBOR on amounts drawn (and 0.5% on amounts undrawn) thereunder (subject to a LIBOR floor of 0.00%).
At October 31, 2021, NaN of the anticipated future cash flows includingRevolving Facility was drawn (October 31, 2020: $nil), together with $4,608.0 million of term loans giving gross debt of $4,608.0 million drawn.
On January 17, 2022, the Group announced the refinancing of $1.6 billion of existing term loans. This refinancing comprised a €750 million and a $750 million Senior Secured Term Loan B. The new 5-year Facilities have been used by the Group to fully refinance its existing Senior Secured Term Loan B Euro facility issued by MA FinanceCo., LLC due June 2024 as well as partially refinance the existing Senior Secured Term Loan B USD facilities issued by Seattle SpinCo, Inc., ($750 million refinanced, $1,678 million remaining) and MA FinanceCo., LLC, ($359.5 million B-3 fully replaced by additional Euro borrowing) due June 2024.
The new 5-year Facilities incurs interest at 4.00% above EURIBOR (subject to 0% floor) at an original issue discount of 0.5% on the Euro denominated tranche, and 4.00% above SOFR and CSA (subject to 0.5% floor) at an original issue discount of 1.0% on the US dollar denominated tranche. This represents an increase in relationannualised interest costs of approximately $23.0 million.
The following covenants related to net leverage apply to the Group’s borrowings on an undiscounted basis, which therefore, differs from bothterm-loan borrowing facilities:
| • | The Revolving Facility is subject to a single financial covenant, only in circumstances when more than 35% of the Revolving Facility is outstanding at a fiscal quarter end. Throughout the year the applicable covenant threshold was 3.85x, however no test was applicable at October 31, 2021 or any previous test date, as the facility was not drawn in excess of the 35% threshold. This facility has been amended post year end with the facility reduced to $250 million and with maturity extended until December 2026, subject to tests for the term loan maturities in June 2024 and June 2025. The amended facility is subject to a covenant test when more than 40% of the revolving credit facility is outstanding at a fiscal quarter end with a 5.00x net leverage covenant being applied. |
Additional debt repayments when the carrying value and fair value, is as follows:
Term Loan B-2 | Term Loan B-3 | Seattle Spinco Term Loan B | Euro Term Loan B | Revolving Facility | Total | |||||||||||||||||||
| $m | $m | $m | $m | $m | $m | |||||||||||||||||||
| Within one year | 61.6 | 17.0 | 114.6 | 14.1 | 1.9 | 209.2 | ||||||||||||||||||
| In one to two years | 61.5 | 16.9 | 114.3 | 14.6 | 1.9 | 209.2 | ||||||||||||||||||
| In two to three years | 1,419.8 | 18.5 | 124.1 | 19.3 | 1.6 | 1,583.3 | ||||||||||||||||||
| In three to four years | - | 20.6 | 139.4 | 19.1 | - | 179.1 | ||||||||||||||||||
| In four to five years | - | 373.5 | 2,522.6 | 503.6 | - | 3,399.7 | ||||||||||||||||||
| In more than five years | - | - | - | - | - | - | ||||||||||||||||||
| At October 31, 2019 | 1,542.9 | 446.5 | 3,015.0 | 570.7 | 5.4 | 5,580.5 | ||||||||||||||||||
F-50
Consolidated financial statements and notes
Notes to the consolidated financial statements
18 | Borrowings continued |
| • | An additional 25 basis points of margin is required to be paid on the term loans maturing in June 2024 when net leverage exceeds 3.00x. The Group is currently paying this margin. |
Net leverage is defined as net debt (see note 24)/Adjusted EBITDA (see note 1). The credit facility agreements apply frozen GAAP for IFRS 16 and allows certain expected cost savings to be included in the measurement therefore the calculated value differs from that using net debt/Adjusted EBITDA as presented in this annual report. The difference has not exceeded 0.20x during the current period.
In addition to the net leverage related payments the Group’s borrowing arrangements include annual repayments of 1% of the initial par value for the B-3, Seattle Spinco and Euro term B loans and 2.5% of the initial par value for the B-1 and B4 loans with the amount paid in 4 equal quarterly instalments and then a final balloon payment on maturity.
The movements on the Group loans in the year were as follows:
term loan B-1 EUR | term loan B-2 USD | term loan B-3 USD | term loan B-4 USD | Seattle Spinco term loan B | Euro term loan B | Revolving Facility | Total | |||||||||||||||||||||||||
| $m | $m | $m | $m | $m | $m | $m | $m | |||||||||||||||||||||||||
| At November 1, 2020 | 700.3 | 0 | 368.2 | 650.0 | 2,486.3 | 528.4 | 0 | 4,733.2 | ||||||||||||||||||||||||
| Draw downs | 0 | 0 | 0 | 0 | 0 | 0 | 0 | 0 | ||||||||||||||||||||||||
| Repayments | (17.9 | ) | 0 | (8.7 | ) | (16.3 | ) | (58.4 | ) | (12.8 | ) | 0 | (114.1 | ) | ||||||||||||||||||
| Foreign exchange | (6.4 | ) | 0 | 0 | 0 | 0 | (4.7 | ) | 0 | (11.1 | ) | |||||||||||||||||||||
At October 31, 2021 | 676.0 | 0 | 359.5 | 633.7 | 2,427.9 | 510.9 | 0 | 4,608.0 | ||||||||||||||||||||||||
| At November 1, 2019 | 0 | 1,414.7 | 368.2 | 0 | 2,486.3 | 505.8 | 0 | 4,775.0 | ||||||||||||||||||||||||
| Draw downs | 665.8 | 0 | 0 | 650.0 | 0 | 0 | 175.0 | 1,490.8 | ||||||||||||||||||||||||
| Repayments | 0 | (1,414.7 | ) | 0 | 0 | 0 | 0 | (175.0 | ) | (1,589.7 | ) | |||||||||||||||||||||
| Foreign exchange | 34.5 | 0 | 0 | 0 | 0 | 22.6 | 0 | 57.1 | ||||||||||||||||||||||||
At October 31, 2020 | 700.3 | 0 | 368.2 | 650.0 | 2,486.3 | 528.4 | 0 | 4,733.2 | ||||||||||||||||||||||||
The maturity of borrowings continuedcan be seen in note 24, “Financial risk management and financial instruments”.
Less than 1 year | 1-3 years | 3-5 years | After 5 years | Total | ||||||||||||||||
| $m | $m | $m | $m | $m | ||||||||||||||||
| Debt principal repayment | - | 1,431.7 | 3,343.3 | - | 4,775.0 | |||||||||||||||
| Interest payment on debt | 209.2 | 360.6 | 235.7 | - | 805.5 | |||||||||||||||
| At October 31, 2019 | 209.2 | 1,792.3 | 3,579.0 | - | 5,580.5 | |||||||||||||||
Term Loan B-2 | Term Loan B-3 | Seattle Spinco Term Loan B | Euro Term Loan B | Revolving Facility | Total | |||||||||||||||||||
| $m | $m | $m | $m | $m | $m | |||||||||||||||||||
| Within one year | 84.3 | 22.4 | 151.2 | 20.1 | 1.9 | 279.9 | ||||||||||||||||||
| In one to two years | 83.8 | 22.2 | 150.2 | 20.0 | 1.9 | 278.1 | ||||||||||||||||||
| In two to three years | 82.9 | 22.0 | 148.6 | 19.8 | 1.9 | 275.2 | ||||||||||||||||||
| In three to four years | 1,462.1 | 21.8 | 147.4 | 19.6 | 1.6 | 1,652.5 | ||||||||||||||||||
| In four to five years | - | 21.6 | 146.1 | 19.5 | - | 187.2 | ||||||||||||||||||
| In more than five years | - | 374.2 | 2,526.8 | 512.7 | - | 3,413.7 | ||||||||||||||||||
| At October 31, 2018 | 1,713.1 | 484.2 | 3,270.3 | 611.7 | 7.3 | 6,086.6 | ||||||||||||||||||
Less than 1 year | 1-3 years | 3-5 years | After 5 years | Total | ||||||||||||||||
| $m | $m | $m | $m | $m | ||||||||||||||||
| Debt principal repayment | 50.3 | 100.7 | 1,528.8 | 3,317.1 | 4,996.9 | |||||||||||||||
| Interest payment on debt | 229.6 | 452.6 | 310.9 | 96.6 | 1,089.7 | |||||||||||||||
| At October 31, 2018 | 279.9 | 553.3 | 1,839.7 | 3,413.7 | 6,086.6 | |||||||||||||||
Assets pledged as collateral
An all assets security has been granted in the US and England & Wales by certain members of the Micro Focus Group organized in such jurisdictions, including security over intellectual property rights and shareholdings of such members of the Micro Focus Group.
Consolidated financial statements and notes
Notes to the consolidated financial statements
19 Leases
| October 31, 2019 | October 31, 2018 | |||||||
| $m | $m | |||||||
| Current | 11.8 | 13.6 | ||||||
| Non-current | 11.7 | 14.9 | ||||||
| 23.5 | 28.5 | |||||||
| October 31, 2019 | October 31, 2018 | |||||||
| $m | $m | |||||||
| Within one year | 13.1 | 15.1 | ||||||
| Between one and five years | 12.5 | 16.0 | ||||||
| 25.6 | 31.1 | |||||||
| Future lease charges | (2.1 | ) | (2.6 | ) | ||||
| 23.5 | 28.5 | |||||||
The carrying valueGroup enters into leasing arrangements in the normal course of computer equipment held under finance leases and hire purchase contracts as at October 31, 2019 was $20.9m (October 31, 2018: $25.9m) (note 12).its business including:
| - | Office space (included in “Leasehold land and buildings”); |
| - | Data centers (included in “Leasehold land and buildings”); |
| - | Vehicles (included in “Other”); and |
| October 31, 2019 | October 31, 2018 | |||||||
| $m | $m | |||||||
| Within one year | 11.8 | 13.6 | ||||||
| Between one and three years | 10.8 | 13.3 | ||||||
| Between three and five years | 0.9 | 1.6 | ||||||
| 23.5 | 28.5 | |||||||
| - | Computer equipment. |
The Group’s obligationslease arrangements can contain a number of features including some or all of:
| - | Extension and break options; |
| - | Variable lease payments; |
| - | Annual or periodic set rental increases; and |
| - | Indexed or market-based rental increases. |
Consistent with the requirements of IFRS 16, extension options are only included in the lease liability where they are considered reasonably certain, see below, and only fixed rental increases are included in the lease liability. Indexed or market-based rental increases are only included in the lease liability once the indexation or rent review date has passed. Variable lease payments are expensed as incurred. The Group makes no material payments for variable payments not included in the lease liability.
NaN individual leased properties are material to the Group. One is located in Provo, Utah, where the Group currently leases approximately 405,700 square feet of office space. The Group has recently concluded negotiations with the landlord for this facility for which the lease was set to end in 2024 to extend the lease term with a reduction in floor space in stages. In February 2022, an initial reduction to approximately 239,100 square feet, then from June 2024 to approximately 219,900 square feet with a further reduction in floor space from December 2024 to approximately 142,300 square feet. This new lease agreement expires in 2034, with an option to extend for a further 3, five-year periods. The Group’s current annual rent under financethis lease is $8.7 million (2020: $8.4 million) and this will reduce as the floor space reduces to $5.3 million per annum in February 2022 and $3.6 million per annum from December 2024. Since March 1, 2019, part of the property has been sublet. Current annual sub-lease income is $1.1 million (2020: $1.1 million). The second property is located in Santa Clara, California, where the Group currently leases are secured by charges overapproximately 635,000 square feet of office space. The lease on this facility expires in 2029, with an option to extend for 1 further five-year period. The Group’s current annual rent under this lease is $4.9 million (2020: $4.7 million). The Group is currently not utilizing one and a half floors of this facility and the related leased assets. The weighted average fixed interest rate onright-of-use assets has been tested for impairment with a partial impairment recorded.
Right-of-use assets
During the outstanding finance lease liabilities is 7.5% (October 31, 2018: 8.5%)year the Group entered into new leasing arrangements, extended existing leasing agreements and was party to rent reviews and therefore recognized additions to right-of-use assets of $38.8 million (2020: $42.0 million). Right-of-use assets of $8.9 million were transferred to held for sale during the period, see note 30, “Discontinued operations and Assets held for sale.”
Leasehold land and buildings | Computer equipment | Other | Total | |||||||||||||
| $m | $m | $m | $m | |||||||||||||
Net book value at October 31, 2021 | 128.5 | 16.0 | 8.7 | 153.2 | ||||||||||||
Net book value at October 31, 2020 | 180.1 | 20.4 | 6.7 | 207.2 | ||||||||||||
Depreciation charge for the year ended October 31, 2021 | 56.9 | 9.6 | 6.8 | 73.3 | ||||||||||||
Consolidated financial statements and notes
Notes to the consolidated financial statements
| 19 | Leases continued |
Amounts recognized in the statement of comprehensive income:
Year ended October 31, 2021 | Year ended October 31, 2020 | Year ended October 31, 2019 Under IAS 17 | ||||||||||||||
| Note | $m | $m | $m | |||||||||||||
| Interest on lease liabilities | 6 | 10.0 | 13.2 | - | ||||||||||||
| Depreciation of right-of-use assets | 73.3 | 76.9 | - | |||||||||||||
| Impairment of right-of-use assets* | 5.6 | 5.9 | - | |||||||||||||
| Income from sub-leasing right-of-use assets | 0.2 | 0.4 | - | |||||||||||||
| Under IAS 17: | ||||||||||||||||
| Interest on lease liabilities | 6 | - | - | 2.0 | ||||||||||||
| Depreciation of lease assets | - | - | 13.9 | |||||||||||||
| Lease expense | - | - | 65.9 | |||||||||||||
| Income from sub-leasing right-of-use assets | - | - | 1.0 | |||||||||||||
| * | The Group assessed right-of-use assets for indicators of impairment during the year in particular leases, which have become vacant or part vacant or changes in sub-lease expectations on existing vacant properties. As a result, an additional impairment of $5.6 million was recognized in the year (2020: $5.9 million). The impairment against the right-of-use asset carrying value reflects any expected sub lease-income over the remainder of the lease. |
Amounts recognized in statement of cash flows:
Year ended October 31, 2021 | Year ended October 31, 2020 | |||||||
| $m | $m | |||||||
| Interest payments on lease liabilities | 10.0 | 13.2 | ||||||
| Payment for lease liabilities | 79.5 | 80.1 | ||||||
| Total cash outflow for leases | 89.5 | 93.3 | ||||||
Extension options
Some property leases contain extension options exercisable by the Group before the end of the non-cancellable contract period. Where practicable, the Group seeks to include extension options in new leases to provide operational flexibility. The extension options held are exercisable only by the Group and non-current tax liabilitiesnot by the lessors. As a lessee, optional periods are included in the lease term if the Group is reasonably certain it will exercise an extension option or will not exercise a termination option; this depends on an analysis by management of all relevant facts and circumstances including the leased asset’s nature and purpose, the economic and practical potential for replacing the asset and any plans that the Group has in place for the future use of the asset. Where it is impractical or uneconomic to replace then the Group is more likely to judge that lease extension options are reasonably certain to be exercised.
The normal approach adopted for lease term by asset class is described below.
| October 31, 2019 | October 31, 2018 | |||||||
| $m | $m | |||||||
Corporation tax | 40.1 | 24.5 | ||||||
The current tax receivablelease terms can vary significantly by type and use of asset and geography. In addition, the exact lease term is subject to the non-cancellable period and rights and options in each contract. Generally, lease terms are judged to be the longer of the minimum lease term and:
Up to five years for offices, unless the non-cancellable period exceeds this, with optional extension periods only included in leases expiring in the earlier part of this period and where clear plans to extend the leases are already in place; and
Up to three years for data centres with optional extensions periods, where they exist, only included for leases expiring in the next year and for which relocation of the assets located in the data centre is considered uneconomic.
For vehicle leases the minimum lease term, typically three to four years, is judged to be the lease term. Extension options for vehicles are not considered reasonably certain as the assets are not highly customized or difficult to replace.
The Group reassesses whether it is reasonably certain to exercise the options if there is a significant event or significant changes in circumstances within its control. Significant changes in assumptions or activities e.g. such as an acquisition or disposal, would impact the expected future cash outflows related to leasing activities. Where a significant event or change in circumstances does not occur, the lease term and therefore the lease liability and right-of-use asset, will decline over time. The Group’s cash outflow for leases in the year ended October 31, 2021 was $89.5 million (2020: $93.3 million). Leases with annual cash outflows during the year ended October 31, 2021 of $3.0 million (2020: $8.9 million) ended and were not renewed or replaced. Considering the impact of these terminations and
F-53
Consolidated financial statements and notes
Notes to the consolidated financial statements
19 | Leases continued |
absent significant future changes in the volume of the Group’s activities or strategic changes to lease fewer assets the Group’s cash outflow would be expected to continue for future periods at a consistent level, subject to any contractual price increases.
The maturity analysis of the Group’s lease liability, in note 24 “Financial risk management and financial instruments”, only includes the reasonably certain payments to be made; cash outflows in these future periods will likely exceed these amounts as payments will be made on optional periods not considered reasonably certain at present and on new leases entered into in future periods.
Lease obligations:
Under IFRS 16 “Leases”, the Group recognizes the discounted future lease payments over the reasonably certain lease term as a liability along with an associated right-of-use asset, see above.
The movement on the Group lease obligations in the year were as follows:
| Note | October 31, 2021 $m | October 31, 2020 $m | ||||||||||
| IFRS 16 adoption | 0 | 269.8 | ||||||||||
| Transfer from Finance lease liability | 0 | 23.5 | ||||||||||
| Balance at November 1 | 250.4 | 293.3 | ||||||||||
| Additions | 35.1 | 41.6 | ||||||||||
| Disposals | 0 | (0.2 | ) | |||||||||
| Payments | (89.5 | ) | (93.3 | ) | ||||||||
| Interest | 6 | 10.0 | 13.2 | |||||||||
| Transferred to held for sale | 30 | (11.4 | ) | 0 | ||||||||
| Foreign exchange | (0.1 | ) | (4.2 | ) | ||||||||
| Balance at October 31, | 194.5 | 250.4 | ||||||||||
| Included within: | ||||||||||||
| Current liabilities | 74.9 | 82.2 | ||||||||||
| Non-current liabilities | 119.6 | 168.2 | ||||||||||
| Total | 194.5 | 250.4 | ||||||||||
Leases as lessor
The Group acts as a lessor where it is able to sub-lease vacant property space. Sub-leases are classified as either finance leases or operating leases dependent upon the transfers of substantially all of the risk and rewards associated with the head lease to the lessee in the sub-lease agreement.
Finance leases
The Group has 6 lease arrangements classified as finance leases. The long-term element of net investment in leases of $6.0 million as at October 31, 20192021 (2020: $5.5 million) is $40.1m (October 31, 2018: $24.5m)included in note 13 “Other non-current assets”.
| October 31, 2019 | October 31, 2018 | |||||||
| $m | $m | |||||||
Corporation tax | 104.0 | 124.1 | ||||||
The current tax creditorshort-term element of net investments in leases of $1.9 million as at October 31, 20192021 (2020: $2.1 million) is $104.0m (October 31, 2018: $124.1m)included in other receivables in note 14 “Trade and other receivables”. The current tax creditor includes
20 Contract liabilities
| October 31, 2021 | October 31, 2020 | |||||||
| $m | $m | |||||||
| Current | 984.6 | 981.4 | ||||||
| Non-current | 131.8 | 117.2 | ||||||
| 1,116.4 | 1,098.6 | |||||||
Revenue billed but not recognized in the Consolidated statement of comprehensive income under the Group’s accounting policy for revenue recognition is classified as contract liabilities in respectthe Consolidated statement of uncertain tax positions, net of overpayments.
| October 31, 2019 | October 31, 2018 | |||||||
| $m | $m | |||||||
Corporation tax | 119.7 | 131.0 | ||||||
| October 31, 2019 | October 31, 2018 | |||||||
| $m | $m | |||||||
Current | 1,045.9 | 1,134.7 | ||||||
Non-current | 149.9 | 178.1 | ||||||
| 1,195.8 | 1,312.8 | |||||||
Contract liabilities as at October 31, 20192021 were $1,195.8m (October 31, 2018: $1,312.8m)$1,116.4 million (2020: $1,098.6 million). The movement in contract liabilities in the periodyear mainly results from new amounts being deferred, where the billing is in advance of satisfaction of the related performance obligation, and amounts being recognized as revenue, where performance obligations have been satisfied. The amount of revenue recognized in the reporting periodyear that was included in the contract liability balance as at November 1, 20182020 was $1,134.7m.$981.4 million (2020: $1,045.9 million).
F-54
Consolidated statement of comprehensive income under the Group’s accounting policy for revenue recognition is classified as contract liabilities infinancial statements and notes
Notes to the consolidated statement of financial position to be recognized in future periods. Contract liabilities primarily relates to undelivered maintenance and subscription services on billed contracts.statements
| 20 | Contract liabilities continued |
Remaining Performance Obligationsperformance obligations
Revenue allocated to remaining performance obligations represents contracted revenue that has not yet been recognized which includes unearned revenue and amounts that will be invoiced and recognized as revenue in future periods.years. The remaining revenue allocated to future performance obligations was $1,468.9m$1,563.9 million as at October 31, 2019,2021 (2020: $1,598.1 million), of which approximately 80%76% (2020: 77%) of the revenue is expected to be recognized over the next 12 months and the remainder thereafter.
This amount mostly comprises obligations to provide maintenance and SaaS subscriptions as the contracts have durations of one or multiple years.
21 Provisions and contingent liabilities
| October 31, 2021 | October 31, 2020 | |||||||
| $m | $m | |||||||
| Onerous leases and dilapidations | 25.4 | 16.9 | ||||||
| Restructuring | 23.0 | 30.8 | ||||||
| Legal | 25.0 | 9.7 | ||||||
| Other | 12.1 | 14.8 | ||||||
| Total | 85.5 | 72.2 | ||||||
| Current | 65.7 | 49.7 | ||||||
| Non-current | 19.8 | 22.5 | ||||||
| Total | 85.5 | 72.2 | ||||||
Onerous contracts and dilapidations | Restructuring | Legal | Other | Total | |||||||||||||||
| Note | $m | $m | $m | $m | $m | ||||||||||||||
| At November 1, 2020 | 16.9 | 30.8 | 9.7 | 14.8 | 72.2 | ||||||||||||||
| Acquisitions | 31 | 0 | 0 | 0 | 0.1 | 0.1 | |||||||||||||
| Additional provision in the year | 17.9 | 32.6 | 93.3 | 3.1 | 146.9 | ||||||||||||||
| Released | (2.5 | ) | (7.6 | ) | (2.5 | ) | (2.8 | ) | (15.4 | ) | |||||||||
| Utilization of provision | (5.9 | ) | (32.8 | ) | (75.6 | ) | (3.1 | ) | (117.4 | ) | |||||||||
| Effects of movements in exchange rates | 0.2 | 0 | 0.1 | 0 | 0.3 | ||||||||||||||
| Transferred to current liabilities classified as held for sale | (1.2 | ) | 0 | 0 | 0 | (1.2 | ) | ||||||||||||
At October 31, 2021 | 25.4 | 23.0 | 25.0 | 12.1 | 85.5 | ||||||||||||||
| Current | 11.6 | 19.0 | 25.0 | 10.1 | 65.7 | ||||||||||||||
| Non-current | 13.8 | 4.0 | 0 | 2.0 | 19.8 | ||||||||||||||
| Total | 25.4 | 23.0 | 25.0 | 12.1 | 85.5 | ||||||||||||||
| October 31, 2019 | October 31, 2018 | |||||||
| $m | $m | |||||||
| Onerous leases and dilapidations | 34.2 | 35.1 | ||||||
| Restructuring | 36.4 | 50.7 | ||||||
| Legal | 5.7 | 7.0 | ||||||
| Other | 2.1 | - | ||||||
| Total | 78.4 | 92.8 | ||||||
| Current | 29.3 | 57.4 | ||||||
| Non-current | 49.1 | 35.4 | ||||||
| Total | 78.4 | 92.8 | ||||||
Onerous leases and dilapidations | Restructuring | Legal | Other | Total | ||||||||||||||||||||
| Note | $m | $m | $m | $m | $m | |||||||||||||||||||
| At November 1, 2018 | 35.1 | 50.7 | 7.0 | - | 92.8 | |||||||||||||||||||
| Acquisitions – Interset Software Inc. | 38 | - | - | - | 0.7 | 0.7 | ||||||||||||||||||
| Additional provision in the period | 19.2 | 49.4 | 5.4 | 2.1 | 76.1 | |||||||||||||||||||
| Released | (7.4 | ) | (19.8 | ) | (6.2 | ) | - | (33.4 | ) | |||||||||||||||
| Utilization of provision | (13.9 | ) | (43.5 | ) | (0.5 | ) | (0.7 | ) | (58.6 | ) | ||||||||||||||
| Unwinding of discount | 1.1 | - | - | - | 1.1 | |||||||||||||||||||
| Effects of movements in exchange rates | 0.1 | (0.4 | ) | - | - | (0.3 | ) | |||||||||||||||||
| At October 31, 2019 | 34.2 | 36.4 | 5.7 | 2.1 | 78.4 | |||||||||||||||||||
| Current | 9.5 | 12.0 | 5.7 | 2.1 | 29.3 | |||||||||||||||||||
| Non-current | 24.7 | 24.4 | - | - | 49.1 | |||||||||||||||||||
| Total | 34.2 | 36.4 | 5.7 | 2.1 | 78.4 | |||||||||||||||||||
Onerous leases and dilapidations | Restructuring | Legal | Other | Total | ||||||||||||||||||||
| Note | $m | $m | $m | $m | $m | |||||||||||||||||||
| At May 1, 2017 | 16.3 | 12.1 | 3.2 | 0.5 | 32.1 | |||||||||||||||||||
| Continuing operations: | ||||||||||||||||||||||||
| Acquisitions – HPE Software business | 38 | 11.3 | 21.4 | 36.5 | - | 69.2 | ||||||||||||||||||
| Additional provision in the period | 17.7 | 133.4 | 1.4 | - | 152.5 | |||||||||||||||||||
| Released | (3.9 | ) | (3.7 | ) | (4.7 | ) | (0.4 | ) | (12.7 | ) | ||||||||||||||
| Utilization of provision | (5.6 | ) | (110.0 | ) | (29.3 | ) | (0.1 | ) | (145.0 | ) | ||||||||||||||
| Effects of movements in exchange rates | (0.7 | ) | (2.5 | ) | (0.1 | ) | - | (3.3 | ) | |||||||||||||||
| Discontinued operation: | ||||||||||||||||||||||||
| Additional provision in the period | 2.8 | 0.2 | - | - | 3.0 | |||||||||||||||||||
| Reclassification of current assets classified as held for sale | 37 | (2.8 | ) | (0.2 | ) | - | - | (3.0 | ) | |||||||||||||||
| At October 31, 2018 | 35.1 | 50.7 | 7.0 | - | 92.8 | |||||||||||||||||||
| Current | 11.2 | 39.2 | 7.0 | - | 57.4 | |||||||||||||||||||
| Non-current | 23.9 | 11.5 | - | - | 35.4 | |||||||||||||||||||
| Total | 35.1 | 50.7 | 7.0 | - | 92.8 | |||||||||||||||||||
Onerous leasescontracts and dilapidations provisions
The onerous leasecontracts include onerous non-rental related property costs and dilapidations provision relatesother onerous contracts. Additional onerous contracts in relation to leased Group properties and this position is expected to be fully utilized within eight years. An additional provisionproperty of $19.2m$4.8 million was recorded in the 12 monthsyear ended October 31, 2019,2021 (2020: $3.2 million), mainly across European and US sites, as the property portfolio was reassessed, including planned site vacations andvacations. Additional provisions of $10.4 million were also recorded for other onerous contracts principally related to IT contracts in relation to the Group’s former enterprise platforms.
The dilapidations provision relates to obligations to restore leased Group properties. The positions regarding the non-rental related property costs are expected to be fully utilized within 13 years. An additional provision of $2.7 million was recorded in the year ended October 31, 2021 (2020: $3.2 million) following a review of obligations to restore leased property at the end of the lease period.
F-55
Consolidated financial statements and notes
Notes to the acquisition of the HPE Software business ($11.3m) and relating to legal obligations to restore leased properties at the end of the lease period and a reassessment of sites across North America, United Kingdom, Israel and Australia ($17.7m). Provisions of $3.9m were released following the renegotiation/exit of leases of two North American properties.consolidated financial statements
Restructuring provisions
Restructuring provisions relate to severance resulting from headcount reductions. The majority of provisions are expected to be fully utilized within 2412 months. Restructuring costs are reported within exceptional costs (note 4)4, “Exceptional items”).
Legal provisions and Contingent liabilities
Legal provisions include the directors’ best estimate of the likely outflow of economic benefits associated with on-going legal matters. Further information on legal mattersThis includes the following two matters:
Patent litigation
On the matter of litigation with Wapp the Company reached a settlement with Wapp for payment of $67.5 million to completely resolve the dispute for itself and its customers without admission of liability during the year. The matter was previously disclosed as a contingent liability. The provision movement in the period includes this settlement and associated costs. In line with our accounting policy, the cost of recording this provision has been treated as an exceptional cost in the Consolidated Statement of Comprehensive Income for the year ended October 31, 2021 and further details can be found in note 35,4, “Exceptional items.”
Shareholder litigation
The shareholder litigation complaint in the United States District Court for the Southern District of New York, previously disclosed as a contingent liabilities.liability, has been followed by a mediation during the period where the parties have reached an agreement to settle the case on terms including a payment of $15.0 million to a settlement class. The proposed settlement is subject to the court’s approval. The Group has recognized a legal provision of $15.0 million and an insurance receivable, within other receivables, of $15.0 million. Therefore, the charge to establish the provision nets to zero in the Consolidated Statement of Comprehensive Income for the shareholder litigation. The settlement amount will be paid from insurance coverage. The Company and all defendants have denied, and continue to deny, the claims alleged in the case and the settlement does not reflect any admission of fault, wrongdoing or liability as to any defendant.
In the Superior Court of California, the matter is ongoing. No liability has been recognized in this case as it is too soon to estimate whether there will be any financial impact.
California employee claim
In 2018, a putative class action complaint was filed alleging that HPE pays California-based female employees “systemically lower compensation” than male employees performing substantially similar work. This action remains on-going. As part of the Group’s acquisition of the HPE Software business, terms were agreed that allocate potential financial responsibility for litigation between both parties. The Group has recognised no liability in this case as we are unable to estimate whether there will be any financial impact.
Other provisions
Other provisions during the 12 months endedat October 31, 20192021 predominantly relate to interest on uncertain tax provisions of $2.1m. Releases$5.6 million (2020: $7.6 million) and a provision for estimated unclaimed property exposure pertaining to accounts payable of other provisions during$4.2 million (2020: $4.4 million). Discussion on the 18 months ended October 31, 2018 relate to future fees no longer considered likely to be incurred.
22 Pension and other long-term benefit commitments
| a) Defined contribution |
The Group has established a number of pension schemes around the world covering many of its employees. The principal funds are those in the US, UK and Germany. These were funded schemes of the defined contribution type.
Pension costs for defined contributionscontribution schemes are as follows:
12 months ended October 31, 2019 | 18 months ended October 31, 2018 | 12 months ended April 30, 2017 | Year ended October 31, 2021 | Year ended October 31, 2020 | Year ended October 31, 2019 | |||||||||||||||||||||||||||
| Continuing operations | Note | $m | $m | $m | Note | $m | $m | $m | ||||||||||||||||||||||||
| Defined contribution schemes | 33 | 32.7 | 43.3 | 10.9 | 28 | 34.2 | 31.2 | 32.7 | ||||||||||||||||||||||||
| October 31, 2021 | October 31, 2020 | |||||||
| $m | $m | |||||||
| Within non-current assets: | ||||||||
Long-term pension assets | 17.1 | 18.2 | ||||||
| Within non-current liabilities: | ||||||||
Retirement and other benefit obligations | (147.1 | ) | (155.0 | ) | ||||
| October 31, 2019 | October 31, 2018 | |||||||
| $m | $m | |||||||
| Within non-current assets: | ||||||||
| Long-term pension assets | 17.1 | 16.7 | ||||||
| Within non-current liabilities: | ||||||||
| Retirement benefit obligations | (141.4 | ) | (110.4 | ) | ||||
F-56
Consolidated financial statements and subsequent integration ofnotes
Notes to the software segment of Hewlett Packard Enterprise Company (“HPE Software”) on September 1, 2017 added 27 definedconsolidated financial statements
22 Pension and other long-term benefit plans primarily in France, Germany and Switzerland.commitments continued
As of October 31, 20192021, there are a total of 3036 defined benefit plans in 1012 countries around the world (October 31, 2018: 30)(2020: 33). The highest concentration of the pension schemesdefined benefit plans are in Germany, where the Group sponsor 11sponsors 12 (2020: 12) separate schemes that comprise over 85%73% (2020: 83%) of the total net retirement benefit obligation recorded on our Consolidatedin the Group’s consolidated statement of financial position. OurThe Group’s German schemes are primarily final salary pension plans, which provide benefits to members either in the form of a lump sum payment or a guaranteed level of pension payable for life in the case of retirement, disability and death. The level of benefits provided depends not only on the final salary but also on members’member’s length of service, social security ceiling and other factors. Although most of these schemes in Germany are funded at some level, there are typically no funding requirements in Germany. There are no requirements for the appointment of independent trustees in Germany, and all of these schemes are administered locally with the assistance of German pension experts. Final pension entitlements, including benefits for death in service and disability amounts, are calculated by these experts. Plan assets for three3 of our German schemes include re-insurance contracts with guaranteed interest rates, while the majority of the schemes invest in a funds focusing on equities and debt instruments. Most of ourthe Group’s German schemes are closed to new entrants, however, two3 of the schemes are open to new members.
The remainder of the Group’s defined benefit schemes are comprised of a mix of final salary plans, termination or retirement indemnity plans, and other types of statutory plans that provide a one-time benefit at termination.termination and leave plans which allow the participants to carry over leave time earned for a period of time exceeding one year. Final pension entitlements are calculated by local administrators in the applicable country. They also complete calculations for cases of death in service and disability. Where required by local or statutory requirements, some of the schemes are governed by an independent Board of Trustees that is responsible for the investment strategies with regard to the assets of the funds,funds; however, other schemes are administered locally with the assistance of local pension experts. Many of the Group’s plans outside of Germany are funded and the Group makes at least the minimum contributions required by local government, funding and taxing authorities. Plan assets for these schemes include a range of assets including investment funds or re-insurance contracts. Not all of these plans are closed forto new membership.members. The Group sponsors 1024 plans outside of Germany that(2020: 12). Of these, 17 plans are open to new members, most of which are termination or retirement indemnity plans, or statutory plans providing a one-time benefit at termination, retirement, death or disability. As a result of the acquisition of HPE Software, thedisability and leave plans. The Group participates in multi-employer plans in Switzerland and Japan. These plans are accounted for as defined benefit plans and the Group’s obligations are limited to the liabilities of our employees.
There were 7 leave plans reclassified to the net retirement and other defined benefit obligation during the year ended October 31, 2021 and 3 plans reclassified to the net retirement obligation during the year ended October 31, 2020. None of the plans are final salary plans and none are material.
Long-term pension assets
Long-term pension assets relate to the contractual arrangement under insurance policies held by the Group with guaranteed interest rates that do not meet the definition of a qualifying insurance policy, as they have not been pledged to the plan or beneficiaries and are subject to the creditors of the Group. Such arrangements are recorded in the Consolidatedconsolidated statement of financial position as long-term pension assets. During the years ended October 31, 2021 and 2020, some of the insurance policies previously unpledged were pledged to the pension plans and transferred to plan assets. These contractual arrangements are treated as financial assets measured at fair value through Otherother comprehensive income. Movement in the fair value of long-term pension assets is included in Otherother comprehensive income. All non-plan assets are held in Germany.
The movement on the long-term pension assets is as follows:
| October 31, 2021 | October 31, 2020 | |||||||||||
| Note | $m | $m | ||||||||||
| As at November 1 | 18.2 | 17.1 | ||||||||||
| Transfer to plan assets | (1.2 | ) | (0.4 | ) | ||||||||
| Interest on non-plan assets | 6 | 0.2 | 0.2 | |||||||||
| Benefits paid | (0.2 | ) | (0.1 | ) | ||||||||
| Contributions | 0.1 | 0.3 | ||||||||||
| Included within other comprehensive income: | ||||||||||||
| - Change in fair value assessment | 0.2 | 0.4 | ||||||||||
| 0.2 | 0.4 | |||||||||||
| Effects of movements in exchange rates | (0.2 | ) | 0.7 | |||||||||
| At October 31 | 17.1 | 18.2 | ||||||||||
| Included within other comprehensive income: | ||||||||||||
| Continuing operations | 0.2 | 0.4 | ||||||||||
| 0.2 | 0.4 | |||||||||||
Consolidated financial statements and notes
Notes to the consolidated financial statements
Long-term pension assetscontinued
| October 31, 2019 | October 31, 2018 | |||||||||||
| Note | $m | $m | ||||||||||
| As at November 1 / May 1 | 16.7 | 22.0 | ||||||||||
| Reclassification to assets held for sale | 0.1 | (1.5 | ) | |||||||||
| Interest on non-plan assets | 6 | 0.3 | 0.6 | |||||||||
| Benefits paid | (0.1 | ) | (0.2 | ) | ||||||||
| Contributions | 0.3 | 0.5 | ||||||||||
| Included within other comprehensive income: | ||||||||||||
| - Change in fair value assessment | 0.4 | (6.1 | ) | |||||||||
| - Actuarial gain on non-plan assets | - | 0.3 | ||||||||||
| 0.4 | (5.8 | ) | ||||||||||
| Effects of movements in exchange rates | (0.6 | ) | 1.1 | |||||||||
| As at October 31, | 17.1 | 16.7 | ||||||||||
| Included within other comprehensive income: | ||||||||||||
| Continuing operations | 0.3 | (5.3 | ) | |||||||||
| Discontinued operation | 0.1 | (0.5 | ) | |||||||||
| 0.4 | (5.8 | ) | ||||||||||
The non-plan assets are considered to be Level 3 asset under the fair value hierarchy as of October 31, 2019.2021. These assets have been valued by an external insurance expert by applying a discount rate to the future cash flows and taking into account the fixed interest rate, mortality rates and term of the insurance contract. There have been no transfers between levels for the periodyear ended October 31, 2019 (October 31, 2018:2021 (2020: none).
Retirement benefit obligations
The following amounts have been included in the Consolidatedconsolidated statement of comprehensive income for defined benefit pension arrangements:
12 months ended October 31, 2019 | 18 months ended October 31, 2018 | 12 months ended April 30, 2017 | ||||||||||||||
| Note | $m | $m | $m | |||||||||||||
| Current service charge | 9.0 | 12.6 | 0.5 | |||||||||||||
| Past service credit | - | (5.5 | ) | - | ||||||||||||
| Charge to operating profit | 33 | 9.0 | 7.1 | 0.5 | ||||||||||||
| Current service charge – discontinued operations | 0.1 | 0.3 | 0.1 | |||||||||||||
| Interest on pension scheme liabilities | 4.2 | 5.2 | 0.7 | |||||||||||||
| Interest on pension scheme assets | (1.8 | ) | (2.4 | ) | (0.1 | ) | ||||||||||
| Charge to finance costs | 6 | 2.4 | 2.8 | 0.6 | ||||||||||||
| Total continuing charge to profit for the period | 11.5 | 10.2 | 1.2 | |||||||||||||
Year ended October 31, 2021 | Year ended October 31, 2020 | Year ended October 31, 2019 | ||||||||||||||
| Note | $m | $m | $m | |||||||||||||
| Current service charge | 28 | 11.3 | 10.4 | 9.0 | ||||||||||||
| Changes in other long-term benefits | 1.4 | 0 | 0 | |||||||||||||
| Charge to operating loss | 12.7 | 10.4 | 9.0 | |||||||||||||
| Current service charge – discontinued operations | 0 | 0 | 0.1 | |||||||||||||
| Interest on defined benefit liabilities | 2.6 | 3.1 | 4.2 | |||||||||||||
| Interest on defined benefit assets | (1.1 | ) | (1.3 | ) | (1.8 | ) | ||||||||||
| Charge to finance costs | 6 | 1.5 | 1.8 | 2.4 | ||||||||||||
| Total continuing charge to loss for the year | 14.2 | 12.2 | 11.5 | |||||||||||||
The contributions for the year ended October 31, 20202022 are expected to be broadly in line with the 12 months toyear ended October 31, 2019. 2021.
The Group funds the schemes so that it makes at least the minimum contributions required by local government, funding and taxing authorities. There are no funding requirements in Germany.
The following amounts have been recognized as movements in the statement of other comprehensive income:
Year ended October 31, 2021 | Year ended October 31, 2020 | Year ended October 31, 2019 | ||||||||||
| $m | $m | $m | ||||||||||
| Actuarial return on assets excluding amounts included in interest income | 20.7 | 1.8 | 5.9 | |||||||||
| Re-measurements – actuarial gains/(losses): | ||||||||||||
| - Demographic | 1.3 | 0 | (1.6 | ) | ||||||||
| - Financial | 9.8 | (0.6 | ) | (38.8 | ) | |||||||
| - Experience | 1.6 | 3.0 | 8.4 | |||||||||
| 12.7 | 2.4 | (32.0 | ) | |||||||||
| Reclassification from defined contribution scheme or other assets and liabilities to defined benefit scheme | 0 | (4.6 | ) | 0 | ||||||||
| Movement in the year | 33.4 | (0.4 | ) | (26.1 | ) | |||||||
| Continuing operations | 33.4 | (0.4 | ) | (26.2 | ) | |||||||
| Discontinued operation | 0 | 0 | 0.1 | |||||||||
| 33.4 | (0.4 | ) | (26.1 | ) | ||||||||
Consolidated financial statements and notes
Notes to the consolidated financial statements
22 Pension commitments commitmentscontinued
12 months ended October 31, 2019 | 18 months ended October 31, 2018 | 12 months ended April 30, 2017 | ||||||||||
| $m | $m | $m | ||||||||||
| Actuarial return on assets excluding amounts included in interest income | 5.9 | 0.6 | - | |||||||||
| Re-measurements – actuarial gains/(losses): | ||||||||||||
| - Demographic | (1.6 | ) | 0.3 | - | ||||||||
| - Financial | (38.8 | ) | (11.1 | ) | 2.8 | |||||||
| - Experience | 8.4 | 1.9 | 0.6 | |||||||||
| (32.0 | ) | (8.9 | ) | 3.4 | ||||||||
| Reclassification from defined contribution scheme to defined benefit scheme | - | (2.1 | ) | (3.0 | ) | |||||||
| Movement in the period | (26.1 | ) | (10.4 | ) | 0.4 | |||||||
| Continuing operations | (26.2 | ) | (8.9 | ) | (0.2 | ) | ||||||
| Discontinued operation | 0.1 | (1.5 | ) | 0.6 | ||||||||
| (26.1 | ) | (10.4 | ) | 0.4 | ||||||||
The weighted average key assumptions used for the valuation of the schemes were:
| October 31, 2019 | October 31, 2018 | October 31, 2021 | October 31, 2020 | |||||||||||||||||||||||||||||||||||||||||||||
| Germany | Rest of World | Total | Germany | Rest of World | Total | Germany | Rest of World | Total | Germany | Rest of World | Total | |||||||||||||||||||||||||||||||||||||
| Rate of increase in final pensionable salary | 2.50 | % | 3.09 | % | 2.65 | % | 2.50 | % | 2.75 | % | 2.61 | % | 2.50 | % | 3.10 | % | 2.69 | % | 2.50 | % | 3.09 | % | 2.64 | % | ||||||||||||||||||||||||
| Rate of increase in pension payments | 1.75 | % | 1.50 | % | 1.75 | % | 2.00 | % | 1.50 | % | 1.99 | % | 1.75 | % | 1.50 | % | 1.75 | % | 1.50 | % | 1.50 | % | 1.50 | % | ||||||||||||||||||||||||
| Discount rate | 1.09 | % | 1.71 | % | 1.20 | % | 1.83 | % | 2.14 | % | 1.92 | % | 1.07 | % | 1.87 | % | 1.25 | % | 0.79 | % | 1.41 | % | 0.90 | % | ||||||||||||||||||||||||
| Inflation | 1.75 | % | 1.16 | % | 1.69 | % | 2.00 | % | 1.26 | % | 1.89 | % | 1.75 | % | 1.36 | % | 1.69 | % | 1.50 | % | 1.25 | % | 1.47 | % | ||||||||||||||||||||||||
The mortality assumptions for the German schemes are set based on the ‘Richttafeln 2018 G’ by Prof. Dr. Klaus Heubeck. The mortality assumptions for the remaining schemes are set based on actuarial advice in accordance with published statistics and experience in each territory.
These assumptions translate into a weighted average life expectancy in years for a pensioner retiring at age 65:
| October 31, 2019 | October 31, 2018 | October 31, 2021 | October 31, 2020 | |||||||||||||||||||||||||||||||||||||||||||||
| Germany | Rest of World | Total | Germany | Rest of World | Total | Germany | Rest of World | Total | Germany | Rest of World | Total | |||||||||||||||||||||||||||||||||||||
| Retiring at age 65 at the end of the reporting period: | ||||||||||||||||||||||||||||||||||||||||||||||||
| Retiring at age 65 at the end of the reporting year: | ||||||||||||||||||||||||||||||||||||||||||||||||
| Male | 20 | 20 | 20 | 20 | 20 | 20 | 20 | 21 | 21 | 20 | 22 | 20 | ||||||||||||||||||||||||||||||||||||
| Female | 23 | 23 | 23 | 23 | 23 | 23 | 24 | 24 | 24 | 24 | 25 | 24 | ||||||||||||||||||||||||||||||||||||
| Retiring 15 years after the end of the reporting period: | ||||||||||||||||||||||||||||||||||||||||||||||||
| Retiring 15 years after the end of the reporting year: | ||||||||||||||||||||||||||||||||||||||||||||||||
| Male | 22 | 23 | 22 | 22 | 22 | 22 | 23 | 22 | 23 | 22 | 23 | 22 | ||||||||||||||||||||||||||||||||||||
| Female | 25 | 26 | 25 | 25 | 25 | 25 | 26 | 25 | 26 | 26 | 26 | 25 | ||||||||||||||||||||||||||||||||||||
The net liability included in the Consolidatedconsolidated statement of financial position arising from obligations in respect of defined benefit schemes is as follows:
| October 31, 2019 | October 31, 2018 | October 31, 2021 | October 31, 2020 | |||||||||||||||||||||||||||||||||||||||||||||
| Germany | Rest of World | Total | Germany | Rest of World | Total | Germany | Rest of World | Total | Germany | Rest of World | Total | |||||||||||||||||||||||||||||||||||||
| Present value of defined benefit obligations | 213.5 | 48.0 | 261.5 | 173.8 | 47.4 | 221.2 | 246.1 | 74.5 | 320.6 | 248.4 | 54.9 | 303.3 | ||||||||||||||||||||||||||||||||||||
| Fair values of plan assets | (92.0 | ) | (28.1 | ) | (120.1 | ) | (82.1 | ) | (28.7 | ) | (110.8 | ) | (138.8 | ) | (34.7 | ) | (173.5 | ) | (119.1 | ) | (29.2 | ) | (148.3 | ) | ||||||||||||||||||||||||
| 121.5 | 19.9 | 141.4 | 91.7 | 18.7 | 110.4 | 107.3 | 39.8 | 147.1 | 129.3 | 25.7 | 155.0 | |||||||||||||||||||||||||||||||||||||
| October 31, 2019 | ||||||||||||||||||||||||||||||||||||
| Germany | Rest of World | Total | ||||||||||||||||||||||||||||||||||
| Defined benefit obligations | Defined benefit obligations | Scheme assets | Retirement benefit obligations | Defined benefit obligations | Scheme assets | Retirement benefit obligations | Defined benefit obligations | Scheme assets | Retirement benefit obligations | |||||||||||||||||||||||||||
| $m | $m | $m | $m | $m | $m | $m | $m | $m | ||||||||||||||||||||||||||||
| At November 1, 2018 | 173.8 | (82.1 | ) | 91.7 | 47.4 | (28.7 | ) | 18.7 | 221.2 | (110.8 | ) | 110.4 | ||||||||||||||||||||||||
| Reclassification to assets held for sale | 0.3 | - | 0.3 | 0.2 | (0.2 | ) | - | 0.5 | (0.2 | ) | 0.3 | |||||||||||||||||||||||||
| Current service cost | 6.0 | - | 6.0 | 3.1 | - | 3.1 | 9.1 | - | 9.1 | |||||||||||||||||||||||||||
| Past service credit | - | - | - | - | - | - | - | - | - | |||||||||||||||||||||||||||
| Benefits paid | (0.4 | ) | 0.3 | (0.1 | ) | (4.2 | ) | 4.1 | (0.1 | ) | (4.6 | ) | 4.4 | (0.2 | ) | |||||||||||||||||||||
| Contributions by plan participants | 1.5 | (1.5 | ) | - | 0.3 | (0.3 | ) | - | 1.8 | (1.8 | ) | - | ||||||||||||||||||||||||
| Contribution by employer | - | (0.3 | ) | (0.3 | ) | - | (4.2 | ) | (4.2 | ) | - | (4.5 | ) | (4.5 | ) | |||||||||||||||||||||
Interest cost/(income) (note 6) | 3.1 | (1.5 | ) | 1.6 | 1.1 | (0.3 | ) | 0.8 | 4.2 | (1.8 | ) | 2.4 | ||||||||||||||||||||||||
| Included within Other comprehensive income: | ||||||||||||||||||||||||||||||||||||
| Re-measurements - actuarial (gains) and losses: | ||||||||||||||||||||||||||||||||||||
| - Demographic | 1.6 | - | 1.6 | - | - | - | 1.6 | - | 1.6 | |||||||||||||||||||||||||||
| - Financial | 34.0 | - | 34.0 | 4.8 | - | 4.8 | 38.8 | - | 38.8 | |||||||||||||||||||||||||||
| - Experience | (3.2 | ) | - | (3.2 | ) | (5.2 | ) | - | (5.2 | ) | (8.4 | ) | - | (8.4 | ) | |||||||||||||||||||||
| Actuarial return on assets excluding amounts included in interest income | - | (8.0 | ) | (8.0 | ) | - | 2.1 | 2.1 | - | (5.9 | ) | (5.9 | ) | |||||||||||||||||||||||
| 32.4 | (8.0 | ) | 24.4 | (0.4 | ) | 2.1 | 1.7 | 32.0 | (5.9 | ) | 26.1 | |||||||||||||||||||||||||
| Effects of movements in exchange rates | (3.2 | ) | 1.1 | (2.1 | ) | 0.5 | (0.6 | ) | (0.1 | ) | (2.7 | ) | 0.5 | (2.2 | ) | |||||||||||||||||||||
| At October 31, 2019 | 213.5 | (92.0 | ) | 121.5 | 48.0 | (28.1 | ) | 19.9 | 261.5 | (120.1 | ) | 141.4 | ||||||||||||||||||||||||
Consolidated financial statements and notes
Notes to the consolidated financial statements
The defined benefit obligation has moved as follows:
| October 31, 2018 | ||||||||||||||||||||||||||||||||||||
| Germany | Rest of World | Total | ||||||||||||||||||||||||||||||||||
| Defined benefit obligations | Defined benefit obligations | Scheme assets | Retirement benefit obligations | Defined benefit obligations | Scheme assets | Retirement benefit obligations | Defined benefit obligations | Scheme assets | Retirement benefit obligations | |||||||||||||||||||||||||||
| $m | $m | $m | $m | $m | $m | $m | $m | $m | ||||||||||||||||||||||||||||
| At May 1, 2017 | 36.5 | (5.7 | ) | 30.8 | - | - | - | 36.5 | (5.7 | ) | 30.8 | |||||||||||||||||||||||||
| HPE Software business acquisition | 121.1 | (77.0 | ) | 44.1 | 60.4 | (33.0 | ) | 27.4 | 181.5 | (110.0 | ) | 71.5 | ||||||||||||||||||||||||
| Reclassification to assets held for sale | (4.8 | ) | 0.7 | (4.1 | ) | (4.3 | ) | 2.9 | (1.4 | ) | (9.1 | ) | 3.6 | (5.5 | ) | |||||||||||||||||||||
| Current service cost | 7.7 | - | 7.7 | 5.2 | - | 5.2 | 12.9 | - | 12.9 | |||||||||||||||||||||||||||
| Past service credit | (0.8 | ) | - | (0.8 | ) | (4.7 | ) | - | (4.7 | ) | (5.5 | ) | - | (5.5 | ) | |||||||||||||||||||||
| Benefits paid | (0.3 | ) | 0.1 | (0.2 | ) | (9.3 | ) | 9.3 | - | (9.6 | ) | 9.4 | (0.2 | ) | ||||||||||||||||||||||
| Contributions by plan participants | 1.5 | (1.5 | ) | - | 1.0 | (0.8 | ) | 0.2 | 2.5 | (2.3 | ) | 0.2 | ||||||||||||||||||||||||
| Contribution by employer | - | (0.1 | ) | (0.1 | ) | - | (3.9 | ) | (3.9 | ) | - | (4.0 | ) | (4.0 | ) | |||||||||||||||||||||
Interest cost/(income) (note 6) | 4.0 | (2.0 | ) | 2.0 | 1.2 | (0.4 | ) | 0.8 | 5.2 | (2.4 | ) | 2.8 | ||||||||||||||||||||||||
| Included within Other comprehensive income: | ||||||||||||||||||||||||||||||||||||
| Re-measurements - actuarial (gains) and losses: | ||||||||||||||||||||||||||||||||||||
| - Demographic | (0.1 | ) | - | (0.1 | ) | (0.2 | ) | - | (0.2 | ) | (0.3 | ) | - | (0.3 | ) | |||||||||||||||||||||
| - Financial | 13.8 | - | 13.8 | (2.7 | ) | - | (2.7 | ) | 11.1 | - | 11.1 | |||||||||||||||||||||||||
| - Experience | 0.5 | - | 0.5 | (2.4 | ) | - | (2.4 | ) | (1.9 | ) | - | (1.9 | ) | |||||||||||||||||||||||
| Actuarial return on assets excluding amounts included in interest income | - | (0.2 | ) | (0.2 | ) | - | (0.4 | ) | (0.4 | ) | - | (0.6 | ) | (0.6 | ) | |||||||||||||||||||||
| Reclassification from defined contribution scheme to defined benefit scheme | - | - | - | 5.5 | (3.4 | ) | 2.1 | 5.5 | (3.4 | ) | 2.1 | |||||||||||||||||||||||||
14.2 | (0.2 | ) | 14.0 | 0.2 | (3.8 | ) | (3.6 | ) | 14.4 | (4.0 | ) | 10.4 | ||||||||||||||||||||||||
| Effects of movements in exchange rates | (5.3 | ) | 3.6 | (1.7 | ) | (2.3 | ) | 1.0 | (1.3 | ) | (7.6 | ) | 4.6 | (3.0 | ) | |||||||||||||||||||||
| At October 31, 2018 | 173.8 | (82.1 | ) | 91.7 | 47.4 | (28.7 | ) | 18.7 | 221.2 | (110.8 | ) | 110.4 | ||||||||||||||||||||||||
| October 31, 2021 | ||||||||||||||||||||||||||||||||||||
| Germany | Rest of World | Total | ||||||||||||||||||||||||||||||||||
| Defined benefit obligations | Defined benefit obligations | Scheme assets | Net defined benefit obligations | Defined benefit obligations | Scheme assets | Net defined benefit obligations | Defined benefit obligations | Scheme assets | Net defined benefit obligations | |||||||||||||||||||||||||||
| $m | $m | $m | $m | $m | $m | $m | $m | $m | ||||||||||||||||||||||||||||
At November 1, 2020 | 248.4 | (119.1 | ) | 129.3 | 54.9 | (29.2 | ) | 25.7 | 303.3 | (148.3 | ) | 155.0 | ||||||||||||||||||||||||
| Current service cost | 6.1 | - | 6.1 | 5.2 | - | 5.2 | 11.3 | - | 11.3 | |||||||||||||||||||||||||||
| Changes in other long-term benefits | 1.4 | 0 | 1.4 | 0 | 0 | 0 | 1.4 | 0 | 1.4 | |||||||||||||||||||||||||||
| Reclassification from other liabilities/assets | 0 | 0 | 0 | 20.2 | 0 | 20.2 | 20.2 | 0 | 20.2 | |||||||||||||||||||||||||||
| Transferred to current assets classified as held for sale | 0 | 0 | 0 | (0.2 | ) | 0 | (0.2 | ) | (0.2 | ) | 0 | (0.2 | ) | |||||||||||||||||||||||
| Transfer from long-term pension assets | 0 | (1.2 | ) | (1.2 | ) | 0 | 0 | 0 | 0 | (1.2 | ) | (1.2 | ) | |||||||||||||||||||||||
| Benefits paid | (1.9 | ) | 1.9 | 0 | (1.9 | ) | 1.9 | 0 | (3.8 | ) | 3.8 | 0 | ||||||||||||||||||||||||
| Contributions by plan participants | 1.2 | (1.2 | ) | 0 | 0.6 | (0.6 | ) | 0 | 1.8 | (1.8 | ) | 0 | ||||||||||||||||||||||||
| Contribution by employer | 0 | (1.7 | ) | (1.7 | ) | 0 | (6.0 | ) | (6.0 | ) | 0 | (7.7 | ) | (7.7 | ) | |||||||||||||||||||||
| Interest cost/(income) (note 6) | 1.9 | (0.8 | ) | 1.1 | 0.7 | (0.3 | ) | 0.4 | 2.6 | (1.1 | ) | 1.5 | ||||||||||||||||||||||||
| Included within other comprehensive income: | ||||||||||||||||||||||||||||||||||||
| Re-measurements - actuarial (gains) and losses: | ||||||||||||||||||||||||||||||||||||
| - Demographic | 0 | - | 0 | (1.3 | ) | - | (1.3 | ) | (1.3 | ) | - | (1.3 | ) | |||||||||||||||||||||||
| - Financial | (6.7 | ) | - | (6.7 | ) | (3.1 | ) | - | (3.1 | ) | (9.8 | ) | - | (9.8 | ) | |||||||||||||||||||||
| - Experience | (2.1 | ) | - | (2.1 | ) | 0.5 | - | 0.5 | (1.6 | ) | - | (1.6 | ) | |||||||||||||||||||||||
| Actuarial return on assets excluding amounts included in interest income | 0 | (18.8 | ) | (18.8 | ) | 0 | (1.9 | ) | (1.9 | ) | 0 | (20.7 | ) | (20.7 | ) | |||||||||||||||||||||
| (8.8 | ) | (18.8 | ) | (27.6 | ) | (3.9 | ) | (1.9 | ) | (5.8 | ) | (12.7 | ) | (20.7 | ) | (33.4 | ) | |||||||||||||||||||
| Effects of movements in exchange rates | (2.2 | ) | 2.1 | (0.1 | ) | (1.1 | ) | 1.4 | 0.3 | (3.3 | ) | 3.5 | 0.2 | |||||||||||||||||||||||
At October 31, 2021 | 246.1 | (138.8 | ) | 107.3 | 74.5 | (34.7 | ) | 39.8 | 320.6 | (173.5 | ) | 147.1 | ||||||||||||||||||||||||
Consolidated financial statements and notes
Notes to the consolidated financial statements
October 31, 2020 | ||||||||||||||||||||||||||||||||||||
| Germany | Rest of World | Total | ||||||||||||||||||||||||||||||||||
Defined benefit obligations | Defined benefit obligations | Scheme assets | Net defined benefit obligations | Defined benefit obligations | Scheme assets | Net defined benefit obligations | Defined benefit obligations | Scheme assets | Net defined benefit obligations | |||||||||||||||||||||||||||
| $m | $m | $m | $m | $m | $m | $m | $m | $m | ||||||||||||||||||||||||||||
At November 1, 2019 | 213.5 | (92.0 | ) | 121.5 | 48.0 | (28.1 | ) | 19.9 | 261.5 | (120.1 | ) | 141.4 | ||||||||||||||||||||||||
| Current service cost | 6.9 | - | 6.9 | 3.5 | - | 3.5 | 10.4 | - | 10.4 | |||||||||||||||||||||||||||
| Reclassification from other liabilities/assets | 14.7 | (17.8 | ) | (3.1 | ) | 1.5 | 0 | 1.5 | 16.2 | (17.8 | ) | (1.6 | ) | |||||||||||||||||||||||
| Transfer from long-term pension assets | 0 | (0.4 | ) | (0.4 | ) | 0 | 0 | 0 | 0 | (0.4 | ) | (0.4 | ) | |||||||||||||||||||||||
| Benefits paid | (0.6 | ) | 0.6 | 0 | (2.9 | ) | 2.9 | 0 | (3.5 | ) | 3.5 | 0 | ||||||||||||||||||||||||
| Contributions by plan participants | 1.1 | (1.1 | ) | 0 | 0.6 | (0.6 | ) | 0 | 1.7 | (1.7 | ) | 0 | ||||||||||||||||||||||||
| Contribution by employer | 0 | (0.7 | ) | (0.7 | ) | 0 | (2.3 | ) | (2.3 | ) | 0 | (3.0 | ) | (3.0 | ) | |||||||||||||||||||||
| Interest cost/(income) (note 6) | 2.3 | (1.0 | ) | 1.3 | 0.8 | (0.3 | ) | 0.5 | 3.1 | (1.3 | ) | 1.8 | ||||||||||||||||||||||||
| Included within other comprehensive income: | ||||||||||||||||||||||||||||||||||||
| Re-measurements - actuarial (gains) and losses: | ||||||||||||||||||||||||||||||||||||
| - Demographic | 0 | - | 0 | 0 | - | 0 | 0 | - | 0 | |||||||||||||||||||||||||||
| - Financial | (0.4 | ) | - | (0.4 | ) | 1.0 | - | 1.0 | 0.6 | - | 0.6 | |||||||||||||||||||||||||
| - Experience | (2.0 | ) | - | (2.0 | ) | (1.0 | ) | - | (1.0 | ) | (3.0 | ) | - | (3.0 | ) | |||||||||||||||||||||
| Actuarial return on assets excluding amounts included in interest income | 0 | (2.4 | ) | (2.4 | ) | 0 | 0.6 | 0.6 | 0 | (1.8 | ) | (1.8 | ) | |||||||||||||||||||||||
| Reclassification to defined benefit scheme | 3.1 | 0 | 3.1 | 1.5 | 0 | 1.5 | 4.6 | 0 | 4.6 | |||||||||||||||||||||||||||
| 0.7 | (2.4 | ) | (1.7 | ) | 1.5 | 0.6 | 2.1 | 2.2 | (1.8 | ) | 0.4 | |||||||||||||||||||||||||
| Effects of movements in exchange rates | 9.8 | (4.3 | ) | 5.5 | 1.9 | (1.4 | ) | 0.5 | 11.7 | (5.7 | ) | 6.0 | ||||||||||||||||||||||||
At October 31, 2020 | 248.4 | (119.1 | ) | 129.3 | 54.9 | (29.2 | ) | 25.7 | 303.3 | (148.3 | ) | 155.0 | ||||||||||||||||||||||||
None of the plan assets are represented by financial instruments of the Group. None of the plan assets are occupied or used by the Group. The major categories of the plan assets are as follows:
| October 31, 2019 | October 31, 2021 | |||||||||||||||||||||||||||||||||||||||||||||||||||||||||||||||||||||||
| Germany | Rest of World | Total | Germany | Rest of World | Total | |||||||||||||||||||||||||||||||||||||||||||||||||||||||||||||||||||
| Quoted | Unquoted | Total | Quoted | Unquoted | Total | Quoted | Unquoted | Total | Quoted | Unquoted | Total | Quoted | Unquoted | Total | Quoted | Unquoted | Total | |||||||||||||||||||||||||||||||||||||||||||||||||||||||
| $m | $m | $m | $m | $m | $m | $m | $m | $m | $m | $m | $m | $m | $m | $m | $m | $m | $m | |||||||||||||||||||||||||||||||||||||||||||||||||||||||
| Funds that invest in: | ||||||||||||||||||||||||||||||||||||||||||||||||||||||||||||||||||||||||
| - Equity instruments | 39.8 | - | 39.8 | - | 5.5 | 5.5 | 39.8 | 5.5 | 45.3 | 69.0 | 0 | 69.0 | 4.9 | 3.0 | 7.9 | 73.9 | 3.0 | 76.9 | ||||||||||||||||||||||||||||||||||||||||||||||||||||||
| - Debt instruments | 46.6 | - | 46.6 | 3.0 | 6.0 | 9.0 | 49.6 | 6.0 | 55.6 | 61.7 | 0 | 61.7 | 4.1 | 5.4 | 9.5 | 65.8 | 5.4 | 71.2 | ||||||||||||||||||||||||||||||||||||||||||||||||||||||
| - Real estate | - | - | - | - | 3.1 | 3.1 | - | 3.1 | 3.1 | 0 | 0 | 0 | 3.5 | 0.1 | 3.6 | 3.5 | 0.1 | 3.6 | ||||||||||||||||||||||||||||||||||||||||||||||||||||||
| Cash and cash equivalents | - | - | - | - | 1.7 | 1.7 | - | 1.7 | 1.7 | 0 | 0 | 0 | 0 | 1.6 | 1.6 | 0 | 1.6 | 1.6 | ||||||||||||||||||||||||||||||||||||||||||||||||||||||
| Re-insurance contracts with guaranteed interest rates * | - | 5.6 | 5.6 | - | - | - | - | 5.6 | 5.6 | 0 | 8.1 | 8.1 | 0 | 0 | 0 | 0 | 8.1 | 8.1 | ||||||||||||||||||||||||||||||||||||||||||||||||||||||
| Other | - | - | - | - | 8.8 | 8.8 | - | 8.8 | 8.8 | 0 | 0 | 0 | 0 | 12.1 | 12.1 | 0 | 12.1 | 12.1 | ||||||||||||||||||||||||||||||||||||||||||||||||||||||
| Total | 86.4 | 5.6 | 92.0 | 3.0 | 25.1 | 28.1 | 89.4 | 30.7 | 120.1 | 130.7 | 8.1 | 138.8 | 12.5 | 22.2 | 34.7 | 143.2 | 30.3 | 173.5 | ||||||||||||||||||||||||||||||||||||||||||||||||||||||
| October 31, 2018 | ||||||||||||||||||||||||||||||||||||
| Germany | Rest of World | Total | ||||||||||||||||||||||||||||||||||
| Quoted | Unquoted | Total | Quoted | Unquoted | Total | Quoted | Unquoted | Total | ||||||||||||||||||||||||||||
| $m | $m | $m | $m | $m | $m | $m | $m | $m | ||||||||||||||||||||||||||||
| Funds that invest in: | ||||||||||||||||||||||||||||||||||||
| - Equity instruments | 42.3 | - | 42.3 | 7.6 | 1.6 | 9.2 | 49.9 | 1.6 | 51.5 | |||||||||||||||||||||||||||
| - Debt instruments | 34.3 | - | 34.3 | 3.1 | 5.1 | 8.2 | 37.4 | 5.1 | 42.5 | |||||||||||||||||||||||||||
| - Real estate | - | - | - | 2.0 | 0.1 | 2.1 | 2.0 | 0.1 | 2.1 | |||||||||||||||||||||||||||
| Cash and cash equivalents | - | - | - | - | 2.3 | 2.3 | - | 2.3 | 2.3 | |||||||||||||||||||||||||||
| Re-insurance contracts with guaranteed interest rates * | - | 5.5 | 5.5 | - | - | - | - | 5.5 | 5.5 | |||||||||||||||||||||||||||
| Other | - | - | - | - | 6.9 | 6.9 | - | 6.9 | 6.9 | |||||||||||||||||||||||||||
| Total | 76.6 | 5.5 | 82.1 | 12.7 | 16.0 | 28.7 | 89.3 | 21.5 | 110.8 | |||||||||||||||||||||||||||
| * | The majority of the re-insurance contracts have guaranteed interest rates of 4.0%, with the remaining at 3.25% or 2.75%. |
F-61
Consolidated financial statements and notes
Notes to the re-insurance contracts have guaranteed interest rates of 4.0%, with the remaining at 3.25% or 2.75%.consolidated financial statements
22 Pension commitmentscontinued
| October 31, 2020 | ||||||||||||||||||||||||||||||||||||
| Germany | Rest of World | Total | ||||||||||||||||||||||||||||||||||
| Quoted | Unquoted | Total | Quoted | Unquoted | Total | Quoted | Unquoted | Total | ||||||||||||||||||||||||||||
| $m | $m | $m | $m | $m | $m | $m | $m | $m | ||||||||||||||||||||||||||||
| Funds that invest in: | ||||||||||||||||||||||||||||||||||||
| - Equity instruments | 49.3 | 0 | 49.3 | 0 | 6.4 | 6.4 | 49.3 | 6.4 | 55.7 | |||||||||||||||||||||||||||
| - Debt instruments | 63.3 | 0 | 63.3 | 2.6 | 4.9 | 7.5 | 65.9 | 4.9 | 70.8 | |||||||||||||||||||||||||||
| - Real estate | 0 | 0 | 0 | 0 | 2.9 | 2.9 | 0 | 2.9 | 2.9 | |||||||||||||||||||||||||||
| Cash and cash equivalents | 0 | 0 | 0 | 0 | 2.6 | 2.6 | 0 | 2.6 | 2.6 | |||||||||||||||||||||||||||
| Re-insurance contracts with guaranteed interest rates * | 0 | 6.5 | 6.5 | 0 | 0 | 0 | 0 | 6.5 | 6.5 | |||||||||||||||||||||||||||
| Other | 0 | 0 | 0 | 0 | 9.8 | 9.8 | 0 | 9.8 | 9.8 | |||||||||||||||||||||||||||
| Total | 112.6 | 6.5 | 119.1 | 2.6 | 26.6 | 29.2 | 115.2 | 33.1 | 148.3 | |||||||||||||||||||||||||||
| * | The majority of the re-insurance contracts have guaranteed interest rates of 4.0%, with the remaining at 3.25% or 2.75%. |
Risk Management
Through its defined benefit schemes the Group is exposed to a number of risks, the most significant of which are detailed below:
Changes in bond yields – A decrease in corporate bond yields will increase the Group’s IAS 19 plan liabilities, although this will be partially offset by increases in the value of scheme assets.
Inflation – Some of the Group pension obligations are linked to inflation, and higher inflation will lead to higher liabilities.
Life expectancy – The majority of the plan obligations are to provide benefits over the life of the member, so increases in life expectancy will result in an increase in the plan liabilities as benefits would be paid over a longer period.
Sensitivities
The table below provides information on the sensitivity of the defined benefit obligation to changes to the most significant actuarial assumptions. The table shows the impact of changes to each assumption in isolation, although, in practice, changes to assumptions may occur at the same time and can either offset or compound the overall impact on the defined benefit obligation.
These sensitivities have been calculated using the same methodology as used for the main calculations. The weighted average duration of the defined benefit obligation is 2522 years for Germany and 1412 years for all other schemes.
| Germany | Rest of World | Germany | Rest of World | |||||||||||||||||||||||||||||||||||||||||||||
Change in assumption | Change in defined benefit obligation | Change in assumption | Change in defined benefit obligation | Increase in assumption | Change in defined benefit obligation | Decrease in assumption | Change in defined benefit obligation | Increase in assumption | Change in defined benefit obligation | Decrease in assumption | Change in defined benefit obligation | |||||||||||||||||||||||||||||||||||||
| Discount rate for scheme liabilities | 0.50 | % | (11.5 | %) | 0.50 | % | (6.7 | %) | 0.50 | % | (10.1 | %) | 0.50 | % | 11.8 | % | 0.50 | % | (5.5 | %) | 0.50 | % | 6.1 | % | ||||||||||||||||||||||||
| Price inflation | 0.25 | % | 3.8 | % | 0.25 | % | 0.9 | % | ||||||||||||||||||||||||||||||||||||||||
| Price inflation/rate of increase in pension payments* | 0.25 | % | 3.67 | % | 0.25 | % | (3.49 | %) | 0.25 | % | 1.0 | % | 0.25 | % | (1.0 | %) | ||||||||||||||||||||||||||||||||
| Salary growth rate | 0.50 | % | 1.0 | % | 0.50 | % | 3.6 | % | 0.50 | % | 1.1 | % | 0.50 | % | (1.0 | %) | 0.50 | % | 3.0 | % | 0.50 | % | (3.0 | %) | ||||||||||||||||||||||||
| Life expectancy | 1 year | 3.7 | % | 1 year | 1.3 | % | 1 year | | 4.0 | % | -- | -- | 1 year | 2.0 | % | -- | -- | |||||||||||||||||||||||||||||||
| October 31, 2019 | October 31, 2018 | |||||||
| $m | $m | |||||||
| Accruals | 50.4 | 58.0 | ||||||
| 50.4 | 58.0 | |||||||
| * | For the German schemes the same values are used for both the inflation assumption and the rate of increase in pension payments. |
F-62
Consolidated financial statements and notes
Notes to the consolidated financial statements
Financial October 31, 2019 | Non- financial October 31, 2019 | Total October 31, 2019 | Financial October 31, 2018 | Non- financial October 31, 2018 | Total October 31, 2018 | |||||||||||||||||||||||
| Note | $m | $m | $m | $m | $m | $m | ||||||||||||||||||||||
| Financial and non-financial assets | ||||||||||||||||||||||||||||
| Non-current | ||||||||||||||||||||||||||||
| Long-term pension assets | 25 | 17.1 | - | 17.1 | 16.7 | - | 16.7 | |||||||||||||||||||||
| Derivative financial instruments – Interest rate swaps | 31 | - | - | - | - | 86.4 | 86.4 | |||||||||||||||||||||
| Current | ||||||||||||||||||||||||||||
| Cash and cash equivalents | 18 | 355.7 | - | 355.7 | 620.9 | - | 620.9 | |||||||||||||||||||||
| Trade and other receivables | 16 | 922.7 | 110.2 | 1,032.9 | 1,212.0 | 60.0 | 1,272.0 | |||||||||||||||||||||
| 1,295.5 | 110.2 | 1,405.7 | 1,849.6 | 146.4 | 1,996.0 | |||||||||||||||||||||||
Financial October 31, 2019 | Non- financial October 31, 2019 | Total October 31, 2019 | Financial October 31, 2018 | Non- financial October 31, 2018 | Total October 31, 2018 | |||||||||||||||||||||||
| Note | $m | $m | $m | $m | $m | $m | ||||||||||||||||||||||
| Financial and non-financial liabilities – financial liabilities at amortized cost | ||||||||||||||||||||||||||||
| Non-current | ||||||||||||||||||||||||||||
| Derivative financial instruments – Interest rate swaps | 36.5 | - | 36.5 | - | - | - | ||||||||||||||||||||||
| Borrowings (gross) | 20 | 4,775.0 | - | 4,775.0 | 4,946.6 | - | 4,946.6 | |||||||||||||||||||||
| Finance leases | 21 | 11.7 | - | 11.7 | 14.9 | - | 14.9 | |||||||||||||||||||||
| Provisions | 24 | 49.1 | - | 49.1 | 35.4 | - | 35.4 | |||||||||||||||||||||
| Current | ||||||||||||||||||||||||||||
| Borrowings (gross) | 20 | - | - | - | 50.3 | - | 50.3 | |||||||||||||||||||||
| Finance leases | 21 | 11.8 | - | 11.8 | 13.6 | - | 13.6 | |||||||||||||||||||||
| Trade and other payables | 19 | 530.3 | 80.7 | 611.0 | 676.9 | - | 676.9 | |||||||||||||||||||||
| Provisions | 24 | 29.3 | - | 29.3 | 57.4 | - | 57.4 | |||||||||||||||||||||
| 5,443.7 | 80.7 | 5,524.4 | 5,795.1 | - | 5,795.1 | |||||||||||||||||||||||
23 Other non-current liabilities
| October 31, 2021 | October 31, 2020 | |||||||
| $m | $m | |||||||
| Accruals | 31.3 | 39.9 | ||||||
| 31.3 | 39.9 | |||||||
24 Financial risk management and notes
| October 31, 2019 | October 31, 2018 | |||||||
| $m | $m | |||||||
| Derivative financial instruments- non-current asset – interest rate swaps | - | 86.4 | ||||||
| Derivative financial instruments- non-current liabilities – interest rate swaps | (36.5 | ) | - | |||||
| (36.5 | ) | 86.4 | ||||||
Risk factors and not as speculative investments. Four interest rate swaps are in place with a total notional value of $2.25bn to hedge against the impact of potential rises in interest rates until September 30, 2022. The swaps are designated against the $2,486.3m (note 20) loan issued by Seattle SpinCo. Inc. and the notional value covers 52.7% of the overall dollar loan principal outstanding for the Group.
| October 31, 2019 | October 31, 2018 | |||||||
| $m | $m | |||||||
| Carrying amount | (36.5 | ) | 86.4 | |||||
| Notional amount (4 x $562.5m) | 2,250.0 | 2,250.0 | ||||||
| Maturity date | September 30, 2022 | September 30, 2022 | ||||||
| Change in fair value of outstanding hedging instruments (note 31) | (122.9 | ) | 86.4 | |||||
| Change in value of hedging instruments adjusted for credit risk | (121.9 | ) | 84.7 | |||||
| October 31, 2019 | October 31, 2018 | |||||||||||
| Note | $m | $m | ||||||||||
| Trade receivables (gross) | 16 | 877.9 | 1,089.6 | |||||||||
| Cash and cash equivalents | 18 | 355.7 | 620.9 | |||||||||
| Total | 1,233.6 | 1,710.5 | ||||||||||
| October 31, 2019 | October 31, 2018 | |||||||
| $’m | $’m | |||||||
| At November 1 / May 1 – calculated under IAS 39 | 41.9 | 2.6 | ||||||
| Accounting policy change – IFRS 9 (recognized against retained earnings on November 1, 2018) | 20.0 | - | ||||||
| 61.9 | 2.6 | |||||||
| Loss allowance provided in the period | 16.0 | 40.0 | ||||||
| Receivables written off as uncollectable | (35.5 | ) | (0.7 | ) | ||||
| At October 31 | 42.4 | 41.9 | ||||||
The Group’s treasury function aims to reduce exposures to interest rate, foreign exchange and other financial risks, to ensure liquidity is available as and when required, and to invest cash assets safely and profitably. The Group does not engage in speculative trading in financial instruments. The treasury function’s policies and procedures are reviewed and monitored by the Audit committee and are subject to internal audit review.
The Group’s multi-national operations expose it to a variety of financial risks that include the effects of changes in credit risk, foreign currency risk, interest rate risk and liquidity/capital risk. Treasury risk management is carried out by a central treasury department under policies approved by the board of directors.
Group treasury identifies and evaluates financial risks alongside business management. The board provides written principles for risk management together with specific policies covering areas such as foreign currency risk, interest rate risk, credit risk and liquidity risk, the use of derivative and non-derivative financial instruments as appropriate, and investment of excess funds.
Liquidity and capital risk
Central treasury carries out cash flow forecasting for the Group to ensure that it has sufficient cash to meet operational requirements and to allow the repayment of the bank facilities. Surplus cash in the operating units over and above what is required for working capital needs is transferred to Group treasury. These funds are used to repay bank borrowings or are invested in interest bearing current accounts, time deposits, earning credit programmes or money market deposits of the appropriate maturity period determined by consolidated cash forecasts.
The Group seeks to maximize financial flexibility and minimize refinancing risk by issuing debt from a variety of sources and with a range of maturities. The level of facilities required are determined through the preparation of cash flow forecasts which consider a range of business performance scenarios. Borrowings are refinanced substantially prior to falling current to minimize refinancing risk.
The Group’s objective when managing its capital structures is to minimize the cost of capital while maintaining adequate capital to protect against volatility in earnings and net asset values. The strategy is designed to maximize shareholder return over the long-term.
In the current year, a conservative dividend policy has been reinstated and the Company announced an interim dividend of 8.80 cents per share. Final dividends for the current year are set out in note 8, “Dividends”
On January 17, 2022, the Group announced the refinancing of $1.6 billion of existing term loans and the RCF was refinanced in December 2021, see note 18, “Borrowings”.
The financial covenants related to the RCF and term loans are disclosed in note 18, “Borrowings”.
The Group uses cash pooling structures and intercompany loans to mobilize cash efficiently within the Group. The key objectives of the treasury function with respect to cash and cash equivalents are to protect their principal value, concentrate cash centrally, minimize the requirements for external borrowing and optimize yield.
As part of its short-term cash management the Group invests in a range of cash and cash equivalents, including money market funds, which are considered to be highly liquid and not exposed to significant changes in fair value.
Subsidiary companies are funded through share capital, retained earnings and loans from central finance companies on commercial terms. Subsidiary companies do not enter into local borrowings with external counterparties.
F-63
Consolidated financial statements and notes
Notes to the consolidated financial statements
24 Financial risk management and financial instruments continued
Interest rate risk
The Group’s income and cash generated from operations are substantially independent of changes in market interest rates. The Group’s interest rate risk arises from short-term and long-term borrowings. Borrowings issued at variable rates expose the Group to cash flow interest rate risk. The Group currently uses 4 interest rate swaps to manage its cash flow interest rate risk arising from potential increases in the LIBOR interest rate.
The objective of the Group’s interest rate risk management policy is to manage the uncertainty and adverse impact on the Group’s net interest charge due to changes in interest rates to an acceptable level. In doing so, the Group seeks to minimize the cost of hedging and the level of associated counterparty risk.
The Group has set a target of approximately half its borrowings being subject to fixed interest rates in order to minimize its exposure to changes in interest rates. This is achieved through 4 US dollar interest swaps for a total notional value of $2.25 billion, with a maturity date of September 2022. The hedge accounting is discussed further later in the note.
The Group’s borrowing facilities do not contain any covenants with respect to interest cover ratios.
Foreign exchange risk
The Group operates internationally and is exposed to foreign exchange risk arising from various currency exposures, primarily with respect to the Euro, UK Pound Sterling, Indian Rupee, Israeli Shekel, Japanese Yen, Australian Dollar and the Canadian Dollar. Foreign exchange risk arises from future commercial transactions, recognized assets and liabilities and net investments in foreign operations where the transactions are denominated in a currency that is not the entity’s functional currency.
The Group is subject to exposure on the translation of the net assets of foreign currency subsidiaries into its reporting currency, US dollar. The Group’s primary balance sheet translation exposures are noted in the exposure analysis below. These exposures are kept under regular review with the Group treasury function providing reporting to the Treasury Risk committee and the Audit committee.
Group borrowings are denominated in US dollars and Euros. The Group seeks to match the currency profile of borrowings to the cash flows arising from the Group’s operations used to service those borrowings. The May 2020 and January 2022 debt refinancings both included an additional proportion of Euro debt and a reduction in US dollar debt which is intended to better match the currency profile of the Group’s debt with the cash flows used to service that debt (note 18 “Borrowings”). Group Treasury will continually review the currency profile of the business and to take actions to align the group’s debt profile with the cash flow arising from the Group’s operations.
The Group has certain investments in foreign operations, whose net assets are exposed to foreign currency translation risk. The Group faces currency exposures arising from the translation of profits earned in foreign currency subsidiaries into the Group’s reporting currency of US dollars. As at October 31, 2021 2 net investment hedges totaling €1.03billion have been designated using non-derivative Euro debt instruments to minimize the volatility in shareholders’ equity arising from foreign currency translation (2020: 2 net investment hedges totaling €1.05 billion).
Exposures also arise from foreign currency denominated trading transactions undertaken by subsidiaries and exposures here are not hedged. The Group utilizes constant currency reporting to enable management and investors to understand the underlying performance of the Group excluding exchange rate impacts.
Credit risk
The Group provides credit to customers in the normal course of business. Collateral is not required for those receivables but the Group has policies in place requiring appropriate credit checks on potential customers before sales commence and a monitoring process for assessing overdue receivables and customer payment behaviour post sale. These policies and procedures include assessing customer credit limits and the use of third party financial and risk reporting to control our exposure and credit risk.
Financial instruments which potentially expose the Group to a concentration of credit risk consist primarily of cash and cash equivalents and accounts receivable.
The Group maintains a provision for impairment based upon the measurement of lifetime expected credit losses for all trade receivables using the IFRS 9 simplified approach.
The risk management practices noted above provide the historical customer payment profiles and a view on customer behaviour with any historical credit losses experienced. The loss allowance is adjusted for forward-looking factors specific to the debtor and the economic environment resulting in an overall assessment of any provision required.
F-64
Consolidated financial statements and notes
Notes to the consolidated financial statements
24 Financial risk management and financial instruments continued
The Group sells products and services to a wide range of customers around the world and therefore believes there is no significant concentration of customer credit risk.
The Group’s credit risk on cash and cash equivalents is limited as the counterparties are generally well established financial institutions with generally high credit ratings.
Cash deposits and other financial instruments give rise to credit risk on the amounts due from the related counterparties. Generally, the Group aims to transact with counterparties with strong investment grade credit ratings. However, the Group recognizes that due to the need to operate over a large geographic footprint, this will not always be possible. Counterparty credit risk is managed on a global basis by limiting the aggregate amount of exposure to any one counterparty, taking into account its credit rating. The credit ratings of all counterparties are reviewed regularly. All derivatives are subject to ISDA (International Swaps and Derivatives Association) agreements or equivalent documentation.
The maximum exposure to the credit risk of financial assets at the balance sheet date is reflected by the carrying values included in the Group’s balance sheet. Please refer to the credit risk table further below. The credit quality of cash and cash equivalents is listed in note 16 “Cash and cash equivalents” with 96% rated from A+ to AAA.
Financial instruments
The tables below sets out the measurement categories and carrying values of financial assets and liabilities with fair value inputs where relevant.
Measurement category | Carrying value October 31, 2021 | Fair value 2021 | Fair value hierarchy 2021/2020 | Carrying value October 31, 2020 | |||||||||||||||||
| Note | $m | $m | |||||||||||||||||||
| Financial assets: | |||||||||||||||||||||
| Non-current | |||||||||||||||||||||
Long-term pension assets | 22 | FV OCI | 17.1 | Fair value insurance–based input | Level 3 | 18.2 | |||||||||||||||
| Current | |||||||||||||||||||||
| Cash and cash equivalent | 16 | Amortized cost | 558.4 | - | - | 737.2 | |||||||||||||||
| Trade and other receivables | 14 | Amortized cost | 784.2 | - | - | 648.6 | |||||||||||||||
| Contract assets | 14 | Amortized cost | 62.0 | - | - | 33.7 | |||||||||||||||
| 1,421.7 | 1,437.7 | ||||||||||||||||||||
| Financial liabilities: | |||||||||||||||||||||
| Non-current | |||||||||||||||||||||
Derivative financial instruments – interest rate swaps1 | 24 | FV OCI | 0 | Fair value Bank institutions | Level 2 | 77.9 | |||||||||||||||
Borrowings (gross)2 | 18 | Amortized cost | 4,566.0 | 4,556.5 | - | 4,699.0 | |||||||||||||||
| Lease obligations | 19 | Amortized cost | 119.6 | - | - | 168.2 | |||||||||||||||
| Current | |||||||||||||||||||||
Derivative financial instruments - interest rate swaps1 | 24 | FV OCI | 35.7 | Fair value Bank Institutions | Level 2 | 0 | |||||||||||||||
Borrowings (gross)2 | 18 | Amortized cost | 42.0 | 41.9 | - | 34.2 | |||||||||||||||
| Lease obligations | 19 | Amortized cost | 74.9 | - | - | 82.2 | |||||||||||||||
| Trade payables and accruals | 17 | Amortized cost | 440.1 | - | - | 419.2 | |||||||||||||||
| 5,278.3 | 5,480.7 | ||||||||||||||||||||
1 | Derivative interest rate swaps are measured at Fair Value through Other Comprehensive Income (“FV OCI”) as a result of hedge accounting. All interest rate swaps are in designated hedge relationships and there are no other derivative financial instruments held as Fair Value through Profit or Loss (“FVTPL”). |
2 | Borrowings have a carrying value (net of unamortised prepaid facility arrangement fees and original issue discount) of $4,548.4 million (2020: $4,640.3 million). Total borrowings (gross) are shown in this table as $4,608.0 million (2020: $4,733.2 million) for the fair value comparison. |
Fair value measurement
For trade and other receivables, cash and cash equivalents, trade and other payables, fair values approximate to book values due to the short maturity periods of these financial instruments. For trade receivables, allowances are made for credit risk.
F-65
Consolidated financial statements and notes
Notes to the consolidated financial statements
24 Financial risk management and financial instruments continued
Long-term borrowings with a carrying value of $4,548.4 million (2020: $4,640.3 million) (note 18 “Borrowings”) including unamortized prepaid facility fees and discounts, have a fair value estimate of $4,598.4 million (2020: $4,535.1 million) based on trading prices obtained from external banking providers as at October 31, 2021.
Derivative financial instruments measured at fair value are classified as Level 2 in the fair value measurement hierarchy as they have been determined using significant inputs based on observable market data. The fair values of interest rate derivatives are derived from forward interest rates based on yield curves observable at the balance sheet date together with the contractual interest rates. Valuations are updated by the counter-party banks on a monthly basis.
The long-term pension assets are considered to be Level 3 assets under the fair value hierarchy as of October 31, 2021. These assets have been valued by an external insurance expert, by applying a discount rate to the future cash flows and taking into account the fixed interest rate, mortality rates and term of the insurance contract. The movement in the long-term pension assets is disclosed in note 22 “Pension commitments”.
For derivatives and long-term pension assets there were no transfers of assets or liabilities between levels of the fair value hierarchy during the year.
| October 31, 2021 | October 31, 2020 | |||||||
| Interest rate risk | $m | $m | ||||||
| Interest rate swaps (receive variable, pay fixed) | ||||||||
| Fair value of Derivative liability (total of 4 swaps) | (35.7 | ) | (77.9 | ) | ||||
| Notional amount (4 x $562.5 million) | 2,250.0 | 2,250.0 | ||||||
| Maturity date | September 30, 2022 | September 30, 2022 | ||||||
| Change in fair value of outstanding hedging instruments (OCI hedging reserve excluding deferred tax) (note 27) | 42.2 | (41.3 | ) | |||||
| Change in value of hedging instruments (as above adjusted for impact of credit risk) | 41.9 | (39.9 | ) | |||||
| Hedging ratio | 1:1 | 1:1 | ||||||
The Group has 4 interest rate swaps, which are designated in a hedge relationship.
The Group’s approved strategy in accordance with our risk management policies is to minimize the risk of cash flow fluctuations due to interest rate changes in relation to the 1M-USD LIBOR rate for up to half of the Group’s external borrowings for the period October 19, 2017 to September 30, 2022.
The specific risk management objective of the 4 interest rate swaps is to hedge the interest rate risk (cash flow risk) due to changes in the 1M-USD LIBOR rate charged on $2,250.0 million of the debt issued by Seattle Spin Co Inc. between October 19, 2017 and September 30, 2022.
Derivatives are only used for economic hedging purposes and not as speculative investments.
The swap contracts require settlement of net interest receivable or payable on a monthly basis. The fixed interest rate for each swap is 1.949% and the Group receives a variable rate in line with LIBOR. The Seattle loan is priced at LIBOR (with a 0% floor) plus a current margin of 2.75% with the swaps aimed at addressing the risk of a rising LIBOR element. As such, the total interest cost of the hedged element of the Seattle loan is 4.699%. For the year to October 31, 2021, net interest (finance cost) paid for the swaps amounted to $41.3 million. For the life of the swap, net interest paid to date amounted to $58.5 million.
F-66
Consolidated financial statements and notes
Notes to the consolidated financial statements
24 Financial risk management and financial instruments continued
Non-Derivative financial instruments – Designated Euro borrowings
| October 31, 2021 | October 31, 2020 | |||||||
| Foreign exchange risk | $m | $m | ||||||
Debt designated in hedge relationships | ||||||||
Euro B-1 2020 tranche €600 million (Borrowing maturity date: June 2025), €585 million designated | 676.0 | 700.3 | ||||||
| Foreign exchange gain/(loss) on revaluation transferred to OCI-CTA - no sources of ineffectiveness observed in review | 6.5 | (34.5 | ) | |||||
Euro 2017 tranche €453 million (Borrowing maturity date: June 2024), €442 million designated | 510.9 | 528.5 | ||||||
| Foreign exchange gain/(loss) on revaluation transferred to OCI-CTA - no sources of ineffectiveness observed in review | 4.8 | (24.2 | ) | |||||
Hedge ratio for each of the 2 Net investment hedges | 1:1 | 1:1 | ||||||
The Group has designated 2 tranches of non-derivative Euro borrowings in 2 hedge relationships The borrowings in place have a designated carrying value of approximately €1.03 billion (note 18 “Borrowings”) hedged against Euro designated net investments in foreign operations.
The specific risk management objective is to carry out a net investment hedge in the consolidated financial statements of the Group, to reduce the foreign currency translation exposure arising from the Group’s investments in foreign entities with Euro functional currency through the use of Euro currency borrowings as hedging instruments as permitted by the Group’s Treasury policy.
Hedge effectiveness
Hedge effectiveness is determined at the inception of the hedge relationship, and through periodic effectiveness assessments to ensure that an economic relationship exists between the hedged item and the hedging instrument. The testing determined that the hedges met the IFRS 9 requirements for the financial reporting year. The IFRS 9 hedging requirements apply to both the interest swaps and the net investment hedges.
The impact of changes in the fair value of interest rate swaps in the year ended October 31, 2021 is shown in the Consolidated statement of comprehensive income. The foreign exchange gains/losses for the revaluation of the net investment hedging instruments are compared against the translation of goodwill and intangibles affecting the cumulative translation reserve on consolidation. No amounts have been reclassified from the hedging reserve to the loss for the year.
Hedge effectiveness may be affected by credit risk (in the case of the interest rate swaps) and the net investment hedged items may be affected by events impacting the carrying value of goodwill and intangible assets such as asset disposals or impairment reviews.
IBOR transition
Managing interest rate benchmark reform
A fundamental reform of major interest rate benchmarks is being undertaken globally, including the replacement of some interbank offered rates (IBORs) with alternative nearly risk-free rates (referred to as “IBOR reform”).
The Group has exposures to IBORs on its financial instruments that may be replaced or reformed as part of these market-wide initiatives. The Group holds 4 interest rate swaps for risk management purposes which are designated in cash flow hedging relationships. The interest rate swaps have floating legs that are indexed to US LIBOR. The Group’s exposure to LIBOR designated in hedging relationships is $2,250 million nominal amount at October 31, 2021, representing the nominal amount of the 4 interest rate swaps.
The Treasury risk management committee monitors and manages the Group’s transition to alternative rates. The committee evaluates the extent to which contracts reference IBOR cash flows, whether such contracts will need to be amended as a result of IBOR reform and how to manage communication about IBOR reform with counterparties. The committee reports to the Company’s board of directors quarterly and collaborates with other business functions as needed. It provides periodic reports to management of interest rate risk and risks arising from IBOR reform.
Possible (phase 1) reliefs available for hedging exposures have not been applied as the benchmark quotes will continue to be available through to the maturity of the swaps in September 2022. The interest rate cashflows for the hedged debt have not been and will not be impacted by any IBOR related matters in the period as referenced benchmarks were still available in the reporting period.
F-67
Consolidated financial statements and notes
Notes to the consolidated financial statements
24 Financial risk management and financial instruments continued
The Group has evaluated the extent to which its cash flow hedging relationships are subject to uncertainty driven by IBOR reform as at October 31, 2021. The Group’s hedged items and hedging instruments continue to be referenced to US LIBOR. These benchmark rates are quoted each day and the IBOR cash flows are exchanged with counterparties as usual. This allows market participants to continue to use LIBOR for existing contracts and the Group expects that LIBOR will continue to exist as a benchmark rate until June 2023. The Group is actively working to refinance the near term debt of the group into SOFR based debt instruments to address the cessation of LIBOR. The Group plans to have all LIBOR denominated debt repaid or refinanced prior to the planned LIBOR cessation date of June 2023.
The Group has measured its hedging instruments indexed to LIBOR using available quoted market rates for LIBOR-based instruments of the same tenor and similar maturity and has measured the cumulative change in the present value of hedged cash flows attributable to changes in LIBOR on a similar basis.
The carrying amount of financial assets represents the maximum credit exposure. The maximum exposure to credit risk at October 31, 2021 was:
| October 31, 2021 | October 31, 2020 | |||||||||||
| Note | $m | $m | ||||||||||
| Trade receivables (gross) | 14 | 738.8 | 628.4 | |||||||||
| Cash and cash equivalents | 16 | 558.4 | 737.2 | |||||||||
| 1,297.2 | 1,365.6 | |||||||||||
The Group applies the IFRS 9 expedited approach to measuring expected credit losses, which uses a lifetime expected credit loss allowance for all trade receivables.
A provision of the lifetime expected credit loss is established upon initial recognition of the underlying asset by predicting the future cash flows based upon the days past due status of an invoice and other relevant information. The model uses historical collection data along with historical credit losses experienced. The loss allowance is adjusted for forward-looking factors specific to the receivable and the economic environment.
Trade receivables are written off when there is no reasonable expectation of recovery. Impairment losses on trade receivables are presented as net impairment losses within operating profit. Subsequent recoveries of amounts previously written off are credited against the same line item.
Ageing is the main internal rating assessment around credit quality for trade receivables. The ageing of gross trade receivables and associated loss allowances can be found in note 14, “Trade and other receivables”. Contract assets relate to amounts not yet due from customers and contain no amounts past due.
On that basis, the loss allowance as at October 31, 2021 and 2020 and movements in the loss allowance during each year were as disclosed in note 14 “Trade and other receivables”.
Foreign exchange risk
The Group’s currency exposures comprise those that give rise to net currency gains and losses to be recognized in the Consolidated statement of comprehensive income as well as gains and losses on consolidation, which go to reserves. Such exposures reflect the monetary assets and liabilities of the Group that are not denominated in the operating or functional currency of the operating unit involved and the Group’s investment in net assets in currencies other than US Dollar.dollar.
Note 3 “Loss before tax” shows the impact on the Consolidated statement of comprehensive income of foreign exchange losses in the 12 monthsyear ended October 31, 20192021 of $11.3m (18 months ended October 31, 2018: $37.4m gain)$0.1 million (2020: $29.7 million loss; 2019: $11.3 million).
The Group’s principal exposures in relation to market risks are the changes in the exchange rates between the US Dollardollar and transactions made in other currencies as well as changes in interest rates from US Dollar LIBOR interest rates.and Euro capital markets. Foreign exchange exposures for all re-measuring balances are tracked and reported to management.
F-68
Consolidated financial statements and notes
Notes to the consolidated financial statements
24 Financial risk management and financial instruments continued
The key drivers for foreign exchange exposure are cash, borrowings and inter-company positions with trade receivables and trade payables having less relative aggregate exposure. As at October 31, 2019, the key aggregate exposures involved the Euro, British Sterling, Japanese Yen, Israeli Shekel and Canadian Dollar. The table below illustrates the equity sensitivity analysis ofrepresents a key currency extract from the Group exposures to movements in currency and interest rates.
Group exposure | +/- 5% | +/- 10% | +/- 1% interest | |||||||||||||
| Key aggregate currency exposures | $m | $m | $m | $m | ||||||||||||
| Euro | 512.6 | 25.6 | 51.2 | |||||||||||||
| GBP | 137.2 | 6.8 | 13.7 | |||||||||||||
| JPY | 69.6 | 3.5 | 6.9 | |||||||||||||
| ILS | 36.7 | 1.8 | 3.7 | |||||||||||||
| CAN$ | 26.1 | 1.3 | 2.6 | |||||||||||||
Borrowings -Interest rate LIBOR +1% (based on gross debt excluding the effects of hedging) | n/a | n/a | n/a | 47.75 | ||||||||||||
presenting exposures in excess of $10 million equivalent. The Group’s objective when managing its capital structures is to minimize the cost of capital while maintaining adequate capital to protect against volatility in earnings and net asset values. The strategy is designed to maximize shareholder return over the long-term.
Foreign exchange analysis is shown as for reporting to anthe Treasury Risk committee. Please note that aggregate net leverage covenant only in circumstances where more than 35%foreign exchange exposures for the Euro below do not consider the impact of the Revolving Facility is outstanding at a fiscal quarter end. The facility was not utilized as at October 31, 2019 and therefore no covenant test is applicable.net investment hedges. However, the impact can be seen in the hedging table above.
| Group exposure | +/- 5% | +/- 10% | ||||||||||
| Key aggregate currency exposures* | $m | $m | $m | |||||||||
| Euro (EUR) | 1,504.6 | 75.2 | 150.4 | |||||||||
| GB Pounds (GBP) | 156.7 | 7.8 | 15.6 | |||||||||
| Indian Rupee (INR) | 64.4 | 3.2 | 6.4 | |||||||||
| Japanese Yen (JPY) | 53.0 | 2.7 | 5.3 | |||||||||
| Australian Dollar (AUD) | 32.5 | 1.6 | 3.3 | |||||||||
| Canadian Dollar (CAD) | 31.9 | 1.6 | 3.2 | |||||||||
| Israeli Shekel (ILS) | 29.5 | 1.5 | 3.0 | |||||||||
| Chinese Yuan (CNY) | 27.3 | 1.4 | 2.7 | |||||||||
| Swedish Krona (SEK) | 24.3 | 1.2 | 2.4 | |||||||||
| United Arab Emirates Dirham (AED) | 24.2 | 1.2 | 2.4 | |||||||||
| Czech Koruna (CZK) | 12.0 | 0.6 | 1.2 | |||||||||
| Mexican Peso (MXN) | 10.4 | 0.5 | 1.0 | |||||||||
| Turkish Lira (TRY) | 10.2 | 0.5 | 1.0 | |||||||||
| Danish Krone (DKK) | 10.1 | 0.5 | 1.0 | |||||||||
| * | Presenting aggregate foreign exchange exposures in excess of $10 million equivalent. |
Interest rate exposure
Borrowings exposures to variable interest rate changes (based on gross debt excluding the effects of hedging) | Note | Group exposure | LIBOR, EURIBOR +1% | ||||||||
| | $m | $m | |||||||||
| Euro | 1,186.9 | 11.9 | |||||||||
| US dollar | 3,421.1 | 34.2 | |||||||||
| Total gross debt | 18 | 4,608.0 | 46.1 | ||||||||
Net debt
The capital structurenet debt of the Group at the Consolidated statement of financial position date is as follows:
| October 31, 2019 | October 31, 2018 | |||||||||||
| Note | $m | $m | ||||||||||
| Bank and other borrowings (net of arrangement fees) | 20 | 4,670.7 | 4,845.9 | |||||||||
| Finance lease obligations | 21 | 23.5 | 28.5 | |||||||||
| Less cash and cash equivalents | 18 | (355.7 | ) | (620.9 | ) | |||||||
| Total net debt | 4,338.5 | 4,253.5 | ||||||||||
| Total equity | 6,276.3 | 7,792.0 | ||||||||||
| Debt/equity % | 69.1 | % | 54.6 | % | ||||||||
| October 31, 2021 | October 31, 2020 | |||||||||||
| Note | $m | $m | ||||||||||
| Borrowings | 18 | (4,548.4 | ) | (4,640.3 | ) | |||||||
| Cash and cash equivalents | 16 | 558.4 | 737.2 | |||||||||
| Lease obligations | 19 | (194.5 | ) | (250.4 | ) | |||||||
| Net debt | (4,184.5 | ) | (4,153.5 | ) | ||||||||
Borrowings are shown here net of unamortized prepaid facility arrangement fees of $104.3m. (October 31, 2018: $151.0m)$59.6 million (2020: $92.9 million). Gross borrowings are $4,775.0m (October 31, 2018: $4,996.9m)$4,608.0 million (2020: $4,733.2 million).
F-69
Consolidated financial statements and notes
Notes to the consolidated financial statements
24 Financial risk management and financial instruments continued
Change in liabilities arising from financing activities for interest bearing loans (note 20)18 “Borrowings”) and finance leaseslease obligations (note 21)19 “Leases”) were as follows:
Interest bearing loans | Finance leases | Total | ||||||||||
| $m | $m | $m | ||||||||||
| At November 1, 2018 | 4,996.9 | 28.5 | 5,025.4 | |||||||||
Draw down/New leases | - | 9.0 | 9.0 | |||||||||
Repayments | (212.6 | ) | (14.9 | ) | (227.5 | ) | ||||||
Foreign exchange | (9.3 | ) | 0.9 | (8.4 | ) | |||||||
| At October 31, 2019 | 4,775.0 | 23.5 | 4,798.5 | |||||||||
Interest bearing loans | Lease obligations | Total | ||||||||||
| $m | $m | $m | ||||||||||
| At November 1, 2020 | 4,733.2 | 250.4 | 4,983.6 | |||||||||
| Movements arising from financing cash flows | ||||||||||||
| Repayments | (114.1 | ) | (89.5 | ) | (203.6 | ) | ||||||
| Other changes | 0 | 0 | 0 | |||||||||
| New leases | 0 | 35.1 | 35.1 | |||||||||
| Interest | 0 | 10.0 | 10.0 | |||||||||
| Transfer to held for sale | 0 | (11.4 | ) | (11.4 | ) | |||||||
| The effect of change in foreign exchange rates | (11.1 | ) | (0.1 | ) | (11.2 | ) | ||||||
At October 31, 2021 | 4,608.0 | 194.5 | 4,802.5 | |||||||||
Maturity analysis of non-derivative and derivative financial liabilities
The following table summarises the contractual maturities of the Group’s financial liabilities as at October 31, 2021. The amounts are reported gross and un-discounted and include contractual interest payments where applicable. As a result, these amounts can differ from both the reported carrying value and fair value.
As at October 31, 2021
| Borrowings $m | Lease obligations $m | Derivatives – interest rate swaps $m | Trade payables & accruals $m | Total $m | ||||||||||||||||
| Within one year | 202.6 | 74.9 | 35.7 | 440.1 | 753.3 | |||||||||||||||
| In one to two years | 191.1 | 39.9 | 0 | 0 | 231.0 | |||||||||||||||
| In two to three years | 3,453.6 | 29.7 | 0 | 0 | 3,483.3 | |||||||||||||||
| In three to five years | 1,235.5 | 28.5 | 0 | 0 | 1,264.0 | |||||||||||||||
| In more than five years | 0 | 49.1 | 0 | 0 | 49.1 | |||||||||||||||
| Total | 5,082.8 | 222.1 | 35.7 | 440.1 | 5,780.7 | |||||||||||||||
| Impact of discount/ financing rates | 0 | (27.6 | ) | 0 | 0 | (27.6 | ) | |||||||||||||
| Total | 5,082.8 | 194.5 | 35.7 | 440.1 | 5,753.1 | |||||||||||||||
As at October 31, 2020
| Borrowings $m | Lease obligations $m | Derivatives – interest rate swaps $m | Trade payables & accruals $m | Total $m | ||||||||||||||||
| Within one year | 203.6 | 82.2 | 0 | 419.2 | 705.0 | |||||||||||||||
| In one to two years | 224.2 | 69.5 | 77.9 | 0 | 371.6 | |||||||||||||||
| In two to three years | 230.3 | 43.3 | 0 | 0 | 273.6 | |||||||||||||||
| In three to five years | 3,487.7 | 49.3 | 0 | 0 | 3,537.0 | |||||||||||||||
| In more than five years | 1,242.0 | 36.3 | 0 | 0 | 1,278.3 | |||||||||||||||
| Total | 5,387.8 | 280.6 | 77.9 | 419.2 | 6,165.5 | |||||||||||||||
| Impact of discount/ financing rates | 0 | (30.2 | ) | 0 | 0 | (30.2 | ) | |||||||||||||
| Total | 5,387.8 | 250.4 | 77.9 | 419.2 | 6,135.3 | |||||||||||||||
Consolidated financial statements and notes
Notes to the consolidated financial statements
12 months ended October 31, 2019 | 18 months ended October 31, 2018 | |||||||||||
| Net Deferred tax liability | Note | $m | $m | |||||||||
| At November 1 / May 1 | (1,170.5 | ) | (118.5 | ) | ||||||||
| Credited/(debited) to consolidated statement of comprehensive income: | 188.7 | (17.1 | ) | |||||||||
| - Continuing operations | 7 | 156.4 | (27.6 | ) | ||||||||
| - Discontinued operation | 32.3 | 10.5 | ||||||||||
| Credited directly to equity in relation to share options | (7.6 | ) | (23.7 | ) | ||||||||
| Credited to other comprehensive income: | 27.0 | 4.3 | ||||||||||
| - Continuing operations | 27.0 | 3.8 | ||||||||||
| - Discontinued operation | - | 0.5 | ||||||||||
| Acquisition of subsidiaries: | - | (1,957.4 | ) | |||||||||
| Acquisition of subsidiaries – HPE Software business | 38 | - | (1,953.5 | ) | ||||||||
| Acquisition of subsidiaries – COBOL-IT | 38 | - | (3.9 | ) | ||||||||
| Impact of adoption of IFRS 9 | 4.4 | - | ||||||||||
| Impact of adoption of IFRS15 | (17.3 | ) | - | |||||||||
| Foreign exchange adjustment | (11.8 | ) | 11.6 | |||||||||
| Reclassification to current assets held for sale | 37 | - | (1.6 | ) | ||||||||
| Effect of change in tax rates – charged to Consolidated statement of comprehensive income | - | 931.9 | ||||||||||
| At October 31 | (987.1 | ) | (1,170.5 | ) | ||||||||
Tax losses and interest restrictions | Share- based payments | Deferred revenue | Prepaid royalty | Tax credits | Intangible fixed assets | Other temporary differences | Total | |||||||||||||||||||||||||
| $m | $m | $m | $m | $m | $m | $m | $m | |||||||||||||||||||||||||
| At May 1, 2017 | 56.7 | 43.7 | 44.5 | - | 33.8 | 5.9 | 23.6 | 208.2 | ||||||||||||||||||||||||
| Acquisition of subsidiaries - HPE Software business | 4.5 | - | (36.5 | ) | 332.0 | 39.0 | - | 43.7 | 382.7 | |||||||||||||||||||||||
| (Charged)/credited to Consolidated statement of comprehensive income – continuing operations | (13.5 | ) | 0.1 | 45.2 | (201.4 | ) | (46.1 | ) | (0.8 | ) | 14.1 | (202.4 | ) | |||||||||||||||||||
| Credited directly to equity | - | (23.7 | ) | - | - | - | - | - | (23.7 | ) | ||||||||||||||||||||||
| Debited to Other comprehensive income | - | - | - | - | - | - | 4.3 | 4.3 | ||||||||||||||||||||||||
| Foreign exchange adjustment | - | (0.3 | ) | - | - | - | - | - | (0.3 | ) | ||||||||||||||||||||||
| Reclassification to current assets held for sale | - | - | - | - | - | - | (1.6 | ) | (1.6 | ) | ||||||||||||||||||||||
| Effect of change in tax rates – credited to Consolidated statement of comprehensive income | (21.1 | ) | (2.4 | ) | 66.7 | (88.7 | ) | 3.0 | (2.1 | ) | (13.3 | ) | (57.9 | ) | ||||||||||||||||||
| Subtotal | 26.6 | 17.4 | 119.9 | 41.9 | 29.7 | 3.0 | 70.8 | 309.3 | ||||||||||||||||||||||||
| Jurisdictional offsetting | (309.3 | ) | ||||||||||||||||||||||||||||||
| At October 31, 2018 | - | |||||||||||||||||||||||||||||||
Tax losses and interest restrictions | Share- based payments | Deferred revenue | Prepaid royalty | Tax credits | Intangible fixed assets | Other temporary differences | Total | |||||||||||||||||||||||||
| $m | $m | $m | $m | $m | $m | $m | $m | |||||||||||||||||||||||||
| At November 1, 2018 | 26.6 | 17.4 | 119.9 | 41.9 | 29.7 | 3.0 | 70.8 | 309.3 | ||||||||||||||||||||||||
| (Charged)/credited to Consolidated statement of comprehensive income – continuing operations | 73.9 | (5.1 | ) | (12.0 | ) | (41.9 | ) | (22.9 | ) | (3.0 | ) | 12.7 | 1.7 | |||||||||||||||||||
| Credited/(charged) to Consolidated statement of comprehensive income – discontinued operation | - | - | 0.7 | - | - | - | (12.3 | ) | (11.6 | ) | ||||||||||||||||||||||
| Credited directly to equity | - | (7.6 | ) | - | - | - | - | - | (7.6 | ) | ||||||||||||||||||||||
| Debited to Other comprehensive income | - | - | - | - | - | - | 13.0 | 13.0 | ||||||||||||||||||||||||
| Foreign exchange adjustment | - | 0.3 | - | - | - | - | - | 0.3 | ||||||||||||||||||||||||
| Impact of adoption of IFRS 9 | - | - | - | - | - | - | 4.4 | 4.4 | ||||||||||||||||||||||||
| Subtotal | 100.5 | 5.0 | 108.6 | - | 6.8 | - | 88.6 | 309.5 | ||||||||||||||||||||||||
| Jurisdictional offsetting | (309.5 | ) | ||||||||||||||||||||||||||||||
| At October 31, 2019 | - | |||||||||||||||||||||||||||||||
| Expiration: | ||||||||||||||||||||||||||||||||
| 2020 | 2021 | 2022 | 2023 | 2024 | Thereafter | No expiry | Total | |||||||||||||||||||||||||
| $m | $m | $m | $m | $m | $m | $m | $m | |||||||||||||||||||||||||
| At October 31, 2019 | ||||||||||||||||||||||||||||||||
| Type of temporary difference: | ||||||||||||||||||||||||||||||||
| Losses | 56.3 | 99.2 | 40.1 | 33.6 | 41.8 | 2,191.6 | 50.7 | 2,513.3 | ||||||||||||||||||||||||
| Credits | 3.5 | 3.6 | 2.1 | 1.3 | 0.7 | 1.7 | 28.9 | 41.8 | ||||||||||||||||||||||||
| Other | - | - | - | - | - | - | 23.9 | 23.9 | ||||||||||||||||||||||||
| Total | 59.8 | 102.8 | 42.2 | 34.9 | 42.5 | 2,193.3 | 103.5 | 2,579.0 | ||||||||||||||||||||||||
Expiration: | ||||||||||||||||||||||||||||||||
| 2019 | 2020 | 2021 | 2022 | 2023 | Thereafter | No expiry | Total | |||||||||||||||||||||||||
| $m | $m | $m | $m | $m | $m | $m | $m | |||||||||||||||||||||||||
| At October 31, 2018 | ||||||||||||||||||||||||||||||||
| Type of temporary difference: | ||||||||||||||||||||||||||||||||
| Losses | 35.2 | 66.1 | 99.2 | 37.5 | 33.6 | 2,117.7 | 95.6 | 2,484.9 | ||||||||||||||||||||||||
| Credits | 2.2 | 4.4 | 4.0 | 2.4 | 1.3 | 5.2 | 196.4 | 215.9 | ||||||||||||||||||||||||
| Other | 1.9 | - | - | - | - | - | 47.7 | 49.6 | ||||||||||||||||||||||||
| Total | 39.3 | 70.5 | 103.2 | 39.9 | 34.9 | 2,122.9 | 339.7 | 2,750.4 | ||||||||||||||||||||||||
Intangible fixed assets | Other temporary differences | Total | ||||||||||
| $m | $m | $m | ||||||||||
| At May 1, 2017 | (311.7 | ) | (15.0 | ) | (326.7 | ) | ||||||
| Acquisition of subsidiaries – HPE Software business | (2,324.1 | ) | (12.1 | ) | (2,336.2 | ) | ||||||
| Acquisition of subsidiaries – COBOL-IT | (3.9 | ) | - | (3.9 | ) | |||||||
| Charged/(credited) to Consolidated statement of comprehensive income – continuing operations | 186.8 | (12.0 | ) | 174.8 | ||||||||
| Charged to Consolidated statement of comprehensive income – discontinued operations | 10.5 | - | 10.5 | |||||||||
| Foreign exchange adjustment | 11.9 | - | 11.9 | |||||||||
| Effect of change in tax rates – charged to consolidated statement of comprehensive income | 982.0 | 7.8 | 989.8 | |||||||||
| Subtotal | (1,448.5 | ) | (31.3 | ) | (1,479.8 | ) | ||||||
| Jurisdictional offsetting | 309.3 | |||||||||||
| At October 31, 2018 | (1,170.5 | ) | ||||||||||
Intangible fixed assets | Other temporary differences | Total | ||||||||||
| $m | $m | $m | ||||||||||
| At November 1, 2018 | (1,448.5 | ) | (31.3 | ) | (1,479.8 | ) | ||||||
| Charged to Consolidated statement of comprehensive income – continuing operations | 155.5 | (0.8 | ) | 154.7 | ||||||||
| Charged to Consolidated statement of comprehensive income – discontinued operation | 34.0 | 9.9 | 43.9 | |||||||||
| Credited to other comprehensive income – continuing operations | 14.0 | - | 14.0 | |||||||||
| Impact of adoption of IFRS15 | - | (17.3 | ) | (17.3 | ) | |||||||
| Foreign exchange adjustment | (12.1 | ) | - | (12.1 | ) | |||||||
| Subtotal | (1,257.1 | ) | (39.5 | ) | (1,296.6 | ) | ||||||
| Jurisdictional offsetting | 309.5 | |||||||||||
| At October 31, 2019 | (987.1 | ) | ||||||||||
Ordinary shares at 10 pence each as at October 31, 2019 (October 31, 2018:2021 (2020: 10 pence each).
| October 31, 2019 | October 31, 2018 | April 30, 2017 | ||||||||||||||||||||||||||
| Note | Shares | $m | Shares | $m | Shares | $m | ||||||||||||||||||||||
| Issued and fully paid | ||||||||||||||||||||||||||||
| At November 1 /May 1 | 436,800,513 | 65.8 | 229,674,479 | 39.7 | 228,706,210 | 39.6 | ||||||||||||||||||||||
| Shares issued to satisfy option awards | 6,109,091 | 0.1 | 1,894,673 | 0.2 | 968,269 | 0.1 | ||||||||||||||||||||||
| Shares utilized to satisfy option awards | (4,804,817 | ) | - | - | - | - | - | |||||||||||||||||||||
| Share reorganisation | (74,521,459 | ) | (18.7 | ) | (16,935,536 | ) | (2.9 | ) | - | - | ||||||||||||||||||
| Shares issued relating to acquisition of the HPE Software business | 38 | - | - | 222,166,897 | 28.8 | - | - | |||||||||||||||||||||
| At October 31 | 363,583,328 | 47.2 | 436,800,513 | 65.8 | 229,674,479 | 39.7 | ||||||||||||||||||||||
| October 31, 2021 | October 31, 2020 | October 31, 2019 | ||||||||||||||||||||||
| Shares | $m | Shares | $m | Shares | $m | |||||||||||||||||||
| Issued and fully paid | ||||||||||||||||||||||||
| At November 1 | 364,545,377 | 47.3 | 363,583,328 | 47.2 | 436,800,513 | 65.8 | ||||||||||||||||||
| Shares required to satisfy option awards | 745,910 | 0.1 | 1,518,327 | 0.1 | 6,109,091 | 0.1 | ||||||||||||||||||
| Shares utilized to satisfy option awards | (441,549 | ) | 0 | (556,278 | ) | 0 | (4,804,817) | 0 | ||||||||||||||||
| Share reorganisation | 0 | 0 | 0 | 0 | (74,521,459 | ) | (18.7 | ) | ||||||||||||||||
| At October 31 | 364,849,738 | 47.4 | 364,545,377 | 47.3 | 363,583,328 | 47.2 | ||||||||||||||||||
“B” shares at 335.859391335.85939 pence each (October 31, 2018: 168(2019: 335.85939 pence each)
| October 31, 2019 | October 31, 2018 | April 30, 2017 | October 31, 2021 | October 31, 2020 | October 31, 2019 | |||||||||||||||||||||||||||||||||||||||||||
| Shares | $m | Shares | $m | Shares | $m | Shares | $m | Shares | $m | Shares | $m | |||||||||||||||||||||||||||||||||||||
| Issued and fully paid | ||||||||||||||||||||||||||||||||||||||||||||||||
| At November 1 / May 1 | - | - | - | - | - | - | ||||||||||||||||||||||||||||||||||||||||||
| At November 1 | 0 | 0 | 0 | 0 | 0 | 0 | ||||||||||||||||||||||||||||||||||||||||||
| Issue of B shares | 413,784,754 | 1,800.0 | 229,799,802 | 500.0 | - | - | 0 | 0 | 0 | 0 | 413,784,754 | 1,800.0 | ||||||||||||||||||||||||||||||||||||
| Redemption of B shares | (413,784,754 | ) | (1,800.0 | ) | (229,799,802 | ) | (500.0 | ) | - | - | 0 | 0 | 0 | 0 | (413,784,754 | ) | (1,800.0 | ) | ||||||||||||||||||||||||||||||
| At October 31 | - | - | - | - | - | - | 0 | 0 | 0 | 0 | 0 | 0 | ||||||||||||||||||||||||||||||||||||
Deferred D Sharesshares at 10 pence each
| October 31, 2021 | October 31, 2020 | October 31, 2019 | ||||||||||||||||||||||
| Shares | $m | Shares | $m | Shares | $m | |||||||||||||||||||
| Issued and fully paid | ||||||||||||||||||||||||
| At November 1 | 0 | 0 | 0 | 0 | 0 | 0 | ||||||||||||||||||
| Issue of Deferred shares | 0 | 0 | 0 | 0 | 74,521,459 | 0 | ||||||||||||||||||
| Redemption of Deferred shares | 0 | 0 | 0 | 0 | (74,521,459 | ) | 0 | |||||||||||||||||
| At October 31 | 0 | 0 | 0 | 0 | 0 | 0 | ||||||||||||||||||
Share issuances during the 12 monthsyear ended to October 31, 20192021
In the 12 months toyear ended October 31, 2019, 6,109,0912021, 745,910 ordinary shares of 10 pence each (18 months to October 31, 2018: 1,894,673 ordinary shares(2020: 1,518,327; 2019: 6,109,091) were required, of 10 pence; 12 months to April 2017: 968,269)which 441,549 (2020: 556,278; 2019: 4,804,817) were issued and 4,804,817transferred from treasury shares were utilized by the Company, to settle exercised share options. The gross consideration received in the 12 monthsyear ended to October 31, 20192021 was $3.1m (18 months to October 31, 2018: $5.8m; 12 months to April 30, 2017: $2.0m). 222,166,897 ordinary shares of 10pence each were issued by the Company as consideration for the acquisition of the HPE Software business in the 18 months ended October 31, 2018 (note 38)$0.1 million (2020: $2.6 million, 2019: $3.1 million).
At October 31, 2019, 30,200,9052021, 29,203,078 treasury shares were held (October 31, 2018: 9,858,205; April 30, 2017: nil)(2020: 29,644,627; 2019: 30,200,905) such that the number of ordinary shares with voting rights was 333,382,423 (October 31, 2018: 426,942,308; April 30, 2017: 229,674,479)335,646,660 (2020: 334,900,750) and the number of listed shares at October 31, 20192021 was 363,583,328 (October 31, 2018: 436,800,513; April 30, 2017: 229,674,479)364,849,738 (2020: 364,545,377; 2019: 363,583,328). In addition 4,002,289 shares are held by the Micro Focus Employee Benefit Trust (2020: 2,089; 2019: 2,089).
Potential issues of shares
Certain employees hold options to subscribe for shares in the Company at prices ranging from nil pence to 1,963.001,411 pence under the following share option schemes approved by shareholders in 2005 and 2006: The Long-Term Incentive Plan 2005, the Additional Share Grants, the Sharesave Plan 2006 and the Employee Stock Purchase Plan 2006.
The number of shares subject to options at October 31, 20192021 was 14,533,973 (October 31, 2018: 18,156,060; April 30, 2017: 8,607,889)18,877,264 (2020: 18,856,680; 2019: 14,533,973).
Share buy-back
On August 29, 2018, the Company announced the start of a share buy-back program for an initial tranche of up to $200m, which was extended on November 5, 2018 to a total value of $400m$400 million (including the initial tranche). On February14,February 14, 2019, the buy-back program was extended into a third tranche of up to $110m$110 million up until the day before the AGM which took place on March 29, 2019 when the current buy-back authority approved by shareholders at the 2017 AGM to make market purchases of up to 65,211,171 ordinary shares expired.
F-71
Consolidated financial statements and notes
Notes to the consolidated financial statements
On July 17, 2019, the Company announced a new share buy-back program with an initial tranche of up to $200m.$200 million. The Programprogram was effectedaffected in accordance with the terms of the authority granted by shareholders at the 2019 AGM and the Listing Rules. On October 3, 2019, the Company completed the $200m$200 million share buy-back program. The total amount bought back under share buy-back programs was $710.0m,$710.0 million, excluding expenses.
In addition to purchasing ordinary shares on the London Stock Exchange, Citi acquired American Depository Receipts representing ordinary shares (“ADRs”) listed on the New York Stock Exchange which it cancelled for the underlying shares and then sold such shares to the Company.
Shares bought back under these programsprogrammes are held as treasury shares. Treasury share movements and share buy-back costs are shown below:
12 months ended October 31, 2019 | 18 months ended October 31, 2018 | Total | Year ended October 31, 2021 | Year ended October 31, 2020 | Year ended October 31, 2019 | |||||||||||||||||||
| Treasury shares | Number | Number | Number | Number | Number | Number | ||||||||||||||||||
| Share buy-backs | 29,160,054 | 9,858,205 | 39,018,259 | 0 | 0 | 29,160,054 | ||||||||||||||||||
| Shares issued to satisfy option awards | (4,804,817 | ) | - | (4,804,817 | ) | 0 | 0 | (4,804,817) | ||||||||||||||||
| Share reorganisation | (4,012,537 | ) | - | (4,012,537 | ) | 0 | 0 | (4,012,537) | ||||||||||||||||
| 20,342,700 | 9,858,205 | 30,200,905 | 0 | 0 | 20,342,700 | |||||||||||||||||||
| Share buy-back numbers: | ||||||||||||||||||||||||
| Share buy-backs numbers: | ||||||||||||||||||||||||
| Ordinary shares bought on the London Stock Exchange | 25,766,919 | 8,567,659 | 34,334,578 | 0 | 0 | 25,766,919 | ||||||||||||||||||
| ADRs purchased on the New York Stock Exchange | 3,393,135 | 1,290,546 | 4,683,681 | 0 | 0 | 3,393,135 | ||||||||||||||||||
| 29,160,054 | 9,858,205 | 39,018,259 | 0 | 0 | 29,160,054 | |||||||||||||||||||
| Share buy-back cost: | $m | $m | $m | $m | $m | $m | ||||||||||||||||||
| Share buy-back cost | 538.8 | 171.2 | 710.0 | 0 | 0 | 538.8 | ||||||||||||||||||
| Expenses | 5.9 | 0.5 | 6.4 | 0 | 0 | 5.9 | ||||||||||||||||||
| 544.7 | 171.7 | 716.4 | 0 | 0 | 544.7 | |||||||||||||||||||
The weighted average price of shares bought back in the 12 months ended October 31, 2019 was £14.61 per share (18 months ended October 31, 2018 was £13.82 per share).share.
Return of Value
On April 29, 2019, a Return of Value was made to shareholders amounting to $1,800.0m$1,800.0 million (£1,389.7m)1,389.7 million) in cash (335.89(336 pence per existing Ordinary Share and American Depositary Shares (“ADS”) held at the Record Time of 6.00 pm on April 29, 2019). The Return of Value was approved by shareholders on 29 April 2019. The Return of Value was effected through an issue and redemption of B shares and resulted in a $1,800.0m$1,800.0 million increase in capital redemption reserve and a $1,800.0m$1,800.0 million reduction in the merger reserve. 413,784,754 “B” shares were issued at 335.859391335.85939 pence each, resulting in a total $1,800.0m$1,800.0 million being credited to the “B” share liability account. Subsequently and on the same date, 413,784,754 “B” shares were redeemed at 335.859391pence335.85939 pence each and an amount of $1,800.0m$1,800.0 million was debited from the “B share liability account. The Group entered into a forward exchange contract to protect the Company from any foreign exchange movement and the resulting payment to shareholders of $1,800.0m$1,800.0 million incurred net transaction costs of $1.0m.$1.0 million. The Return of Value was accompanied by a 0.8296 share consolidation and the share consolidation resulted in the issue of D deferred shares which were subsequently bought back for 1 pence, resulting in a transfer of $18.7m$18.7 million to the capital redemption reserve. The settlement date was May 13, 2019 for the Ordinary Shares.
On March 2, 2021, the Group entered into a commercial agreement with Amazon Web Services (“AWS”), which grants AWS the right to deploy the Group’s technology to migrate customers to the AWS’ cloud. The launch was announced on December 1, 2021. Warrants have been issued to Amazon NV Investment Holdings LLC to subscribe for ordinary shares (the “warrants”) at 446.60 pence per share, with 398,110 vesting on signing on March 2, 2021 and a further 1,194,329 vesting on launch on December 1, 2021.
As at October 31, 2021, AWS have not exercised any of the warrants earned on signing.
26 Share premium account
| October 31, 2021 | October 31, 2020 | October 31, 2019 | ||||||||||||||
| Note | $m | $m | $m | |||||||||||||
| At November 1 | 46.5 | 44.0 | 41.0 | |||||||||||||
| Movement in relation to share options exercised | 28 | 0.3 | 2.5 | 3.0 | ||||||||||||
| At October 31 | 46.8 | 46.5 | 44.0 | |||||||||||||
F-72
Consolidated financial statements and notes
Notes to the consolidated financial statements
27 Other reserves
Capital redemption reserve 1 | Merger reserve 2 | Hedging reserve 3 | Total | |||||||||||||||||
| Note | $m | $m | $m | $m | ||||||||||||||||
| As at November 1, 2020 | 2,485.0 | 1,767.4 | (63.1 | ) | 4,189.3 | |||||||||||||||
| Hedge accounting | 24 | 0 | 0 | 42.2 | 42.2 | |||||||||||||||
| Current tax movement on hedging | 0 | 0 | (8.0 | ) | (8.0 | ) | ||||||||||||||
| Transfer from merger reserve to retained earnings | 0 | (108.3 | ) | 0 | (108.3 | ) | ||||||||||
| As at October 31, 2021 | 2,485.0 | 1,659.1 | (28.9 | ) | 4,115.2 |
| As at November 1, 2019 | 2,485.0 | 1,739.8 | (29.6 | ) | 4,195.2 | |||||||||||||||
| Hedge accounting | 24 | 0 | 0 | (41.3 | ) | (41.3 | ) | |||||||||||||
| Current tax movement on hedging | 0 | 0 | 7.8 | 7.8 | ||||||||||||||||
| Transfer to merger reserve from retained earnings | 0 | 27.6 | 0 | 27.6 | ||||||||||||||||
| As at October 31, 2020 | 2,485.0 | 1,767.4 | (63.1 | ) | 4,189.3 | |||||||||||||||
1 Capital redemption of B shares and resulted in a $500.0m increase in thereserve
The capital redemption reserve, a $343.3m reduction in the mergernon-distributable reserve, and a $156.7m reduction in share premium. 229,799,802 “B” shares were issued at 168 pence each, resulting in a total $500.0m being credited to the “B” share liability account. Subsequently and on the same date, 229,799,802 “B” shares were redeemed at 168 pence each and an amount of $500.0m was debited from the “B share liability account. The Return of Value was accompanied by a 0.9263 share consolidation and the share consolidation resulted in the issue of D deferred shares which were subsequently bought back for 1 penny, resulting in a transfer of $2.9m (note 31) to the capital redemption reserve.
| October 31, 2019 | October 31, 2018 | April 30, 2017 | ||||||||||||||
| Note | $m | $m | $m | |||||||||||||
| At November 1/ May 1 | 41.0 | 192.1 | 190.3 | |||||||||||||
| Issue and redemption of B shares | 29 | - | (156.7 | ) | - | |||||||||||
| Movement in relation to share options exercised | 33 | 3.0 | 5.6 | 1.8 | ||||||||||||
| At October 31 | 44.0 | 41.0 | 192.1 | |||||||||||||
Capital redemption reserve | Merger reserve | Hedging reserve | Total | |||||||||||||||||
| Note | $m | $m | $m | $m | ||||||||||||||||
| As at May 1, 2016 | 163.4 | 988.1 | - | 1,151.5 | ||||||||||||||||
| Reallocation of merger reserve | - | (650.0 | ) | - | (650.0 | ) | ||||||||||||||
| As at April 30, 2017 | 163.4 | 338.1 | - | 501.5 | ||||||||||||||||
| Return of Value - share consolidation | 29 | 2.9 | - | - | 2.9 | |||||||||||||||
| Return of Value - issue and redemption of B shares | 29 | 500.0 | (343.3 | ) | - | 156.7 | ||||||||||||||
Hedge accounting1 | 27 | - | - | 86.4 | 86.4 | |||||||||||||||
Current tax movement on hedging1 | - | - | (16.4 | ) | (16.4 | ) | ||||||||||||||
Acquisition of the HPE Software business2 | 38 | - | 6,485.4 | - | 6,485.4 | |||||||||||||||
Reallocation of merger reserve 3 | - | (2,755.8 | ) | - | (2,755.8 | ) | ||||||||||||||
| As at October 31, 2018 | 666.3 | 3,724.4 | 70.0 | 4,460.7 | ||||||||||||||||
| As at November 1, 2018 | 666.3 | 3,724.4 | 70.0 | 4,460.7 | ||||||||||||||||
| Return of Value - share consolidation | 29 | 18.7 | - | - | 18.7 | |||||||||||||||
| Return of Value - issue and redemption of B shares | 29 | 1,800.0 | (1,800.0 | ) | - | - | ||||||||||||||
Hedge accounting1 | 27 | - | - | (122.9 | ) | (122.9 | ) | |||||||||||||
Current tax movement on hedging1 | - | - | 23.3 | 23.3 | ||||||||||||||||
Reallocation of merger reserve 3 | - | (184.6 | ) | - | (184.6 | ) | ||||||||||||||
| As at October 31, 2019 | 2,485.0 | 1,739.8 | (29.6 | ) | 4,195.2 | |||||||||||||||
2 Transfer to and from merger reserve was created of $6,485.4m. The acquisition was structured by way of equity consideration; this transaction fell within the provisions of section 612 of the Companies Act 2006 (merger relief) such that no share premium was recorded in respect of the shares issued. The Parent Company chose to record its investment in the HPE Software business at fair value and therefore recorded a merger reserve equal to the value of the share premium which would have been recorded had section 612 of the Companies Act 2006 not been applicable (i.e. equal to the difference between the fair value of the HPE Software business and the aggregate nominal value of the shares issued).
In the 18 monthsyear ended October 31, 2018,2020, it was disclosed that $2,755.8m$337.0 million of the merger reserve would be settled in the period.following year. However, as at October 31, 2019,2021, only $2,540.4m$123.3 million of the balance was settled asand the balance of $215.4m$213.7 million was not required for any Returns of Valuetransferred back to shareholders.the merger reserve. However, the remaining $215.4m and an additional $184.6m$322.0 million is expected to be settled in qualifying consideration during the year ended October 31, 2020 (18 months ended October 31, 2018: $2,540.4m)2022 and as such an equivalent proportion of the merger reserve of $332.0 million is considered realized, in accordance with section 3.11(d) of Tech 02/17 and therefore has been transferred to retained earnings. An amountAs a result a net transfer of $650.0m was transferred$108.3 million from the merger reserve to retained earnings has occurred.
3 Hedging reserve
A credit of $34.2 million was recognized in the 12 monthshedging reserve in relation to hedging transactions entered into in the year ended April 30, 2017.October 31, 2021 (2020: $33.5 million debit).
| October 31, 2019 | October 31, 2018 | April 30, 2017 | ||||||||||
| $m | $m | $m | ||||||||||
| At November 1 / May 1 | 1.0 | 0.9 | 1.0 | |||||||||
| Share of profit after tax | 0.3 | 0.1 | (0.1 | ) | ||||||||
| At October 31 | 1.3 | 1.0 | 0.9 | |||||||||
Company name | Country of incorporation and principal place of business | October 31, 2019 Proportion held | October 31, 2018 Proportion held | April 30, 2017 Proportion held | |||||||||
| Novell Japan Ltd | Japan | 84.24 | % | 81.05 | % | 74.70 | % | ||||||
28 Employees and directors
Staff costs
12 months ended October 31, 2019 | 18 months ended October 31, 2018 | 12 months ended April 30, 2017 | Year ended October 31, 2021 | Year ended October 31, 2020 | Year ended October 31, 2019 | |||||||||||||||||||
| $m | $m | $m | $m | $m | $m | |||||||||||||||||||
| Staff costs | ||||||||||||||||||||||||
| Wages and salaries | 1,204.4 | 1,819.2 | 382.5 | 1,231.5 | 1,187.3 | 1,204.4 | ||||||||||||||||||
| Redundancy and termination costs (non-exceptional) | 0.5 | 2.1 | 2.1 | 1.2 | 1.0 | 0.5 | ||||||||||||||||||
| Social security costs | 93.6 | 159.0 | 53.2 | 103.5 | 97.5 | 93.6 | ||||||||||||||||||
| Other pension costs | 41.7 | 50.4 | 11.4 | 45.5 | 41.6 | 41.7 | ||||||||||||||||||
| 1,340.2 | 2,030.7 | 449.2 | 1,381.7 | 1,327.4 | 1,340.2 | |||||||||||||||||||
| Cost of employee share schemes (Share-based payments section) | 68.8 | 64.3 | 31.5 | |||||||||||||||||||||
| Cost of employee share schemes (Share-based payments section below) | 14.3 | 17.0 | 68.8 | |||||||||||||||||||||
| Total | 1,409.0 | 2,095.0 | 480.7 | 1,396.0 | 1,344.4 | 1,409.0 | ||||||||||||||||||
12 months ended October 31, 2019 | 18 months ended October 31, 2018 | 12 months ended April 30, 2017 | Year ended October 31, 2021 | Year ended October 31, 2020 | Year ended October 31, 2019 | |||||||||||||||||||||||||||
| Note | $m | $m | $m | Note | $m | $m | $m | |||||||||||||||||||||||||
| Pension costs comprise: | ||||||||||||||||||||||||||||||||
| Defined benefit schemes | 25 | 9.0 | 7.1 | 0.5 | 22 | 11.3 | 10.4 | 9.0 | ||||||||||||||||||||||||
| Defined contribution schemes | 25 | 32.7 | 43.3 | 10.9 | 22 | 34.2 | 31.2 | 32.7 | ||||||||||||||||||||||||
| Total | 41.7 | 50.4 | 11.4 | 45.5 | 41.6 | 41.7 | ||||||||||||||||||||||||||
Consolidated financial statements and notes
Notes to the consolidated financial statements
28 Employees and directorscontinued
Staff Numbers
numbers
numbers
12 months ended October 31, 2019 | 18 months ended October 31, 2018 | 12 months ended April 30, 2017 | ||||||||||
| Number | Number | Number | ||||||||||
| Average monthly number of people | ||||||||||||
| (including executive directors) employed by the Group: | ||||||||||||
| Continuing Operations | ||||||||||||
| Sales and distribution | 5,413 | 5,860 | 1,818 | |||||||||
| Research and development | 5.056 | 4,323 | 1,400 | |||||||||
| General and administration | 1,991 | 1,378 | 642 | |||||||||
| 12,460 | 11,561 | 3,860 | ||||||||||
| Discontinued Operation | ||||||||||||
| Sales and distribution | 164 | 515 | 323 | |||||||||
| Research and development | 170 | 629 | 476 | |||||||||
| General and administration | 3 | 8 | 4 | |||||||||
| 337 | 1,152 | 803 | ||||||||||
| Total | ||||||||||||
| Sales and distribution | 5,577 | 6,375 | 2,141 | |||||||||
| Research and development | 5,226 | 4,952 | 1,876 | |||||||||
| General and administration | 1,994 | 1,386 | 646 | |||||||||
| Total | 12,797 | 12,713 | 4,663 | |||||||||
Year ended October 31, 2021 | Year ended October 31, 2020 | Year ended October 31, 2019 | ||||||||||
| Number | Number | Number | ||||||||||
| Average monthly number of people | ||||||||||||
| (including executive directors) employed by the Group: | ||||||||||||
| Continuing operations | ||||||||||||
| Sales and distribution | 4,300 | 5,066 | 5,413 | |||||||||
| Research and development | 5,272 | 5,091 | 5,056 | |||||||||
| General and administration | 2,210 | 1,937 | 1,991 | |||||||||
| 11,782 | 12,094 | 12,460 | ||||||||||
| Discontinued operation | ||||||||||||
| Sales and distribution | 0 | 0 | 164 | |||||||||
| Research and development | 0 | 0 | 170 | |||||||||
| General and administration | 0 | 0 | 3 | |||||||||
| 0 | 0 | 337 | ||||||||||
| Total | ||||||||||||
| Sales and distribution | 4,300 | 5,066 | 5,577 | |||||||||
| Research and development | 5,272 | 5,091 | 5,226 | |||||||||
| General and administration | 2,210 | 1,937 | 1,994 | |||||||||
| Total | 11,782 | 12,094 | 12,797 | |||||||||
Directors and Key Managementkey management
12 months ended October 31, 2019 | 18 months ended October 31, 2018 | 12 months ended April 30, 2017 | Year ended October 31, 2021 | Year ended October 31, 2020 | Year ended October 31, 2019 | |||||||||||||||||||
| $m | $m | $m | $m | $m | $m | |||||||||||||||||||
| Directors | ||||||||||||||||||||||||
| Aggregate emoluments | 3.7 | 14.6 | 5.2 | 5.4 | 4.1 | 3.7 | ||||||||||||||||||
| Aggregate gains made on the exercise of share options | 79.7 | 77.7 | 8.2 | 0 | 0.3 | 79.7 | ||||||||||||||||||
| Company contributions to money purchase pension scheme | - | 0.7 | 0.5 | |||||||||||||||||||||
| Total | 83.4 | 93.0 | 13.9 | 5.4 | 4.4 | 83.4 | ||||||||||||||||||
12 months ended October 31, 2019 | 18 months ended October 31, 2018 | 12 months ended April 30, 2017 | ||||||||||
| $m | $m | $m | ||||||||||
| Key management compensation | ||||||||||||
| Short-term employee benefits | 9.5 | 25.9 | 8.0 | |||||||||
| Share-based payments | 25.3 | 44.5 | 9.4 | |||||||||
| Total | 34.8 | 70.4 | 17.4 | |||||||||
For further information on the directors of the Company, refer to the Item 6.B.
Year ended October 31, 2021 | Year ended October 31, 2020 | Year ended October 31, 2019 | ||||||||||
| $m | $m | $m | ||||||||||
| Key management compensation | ||||||||||||
| Short-term employee benefits | 13.5 | 12.4 | 9.5 | |||||||||
| Share based payments | 1.9 | 2.2 | 25.3 | |||||||||
| Total | 15.4 | 14.6 | 34.8 | |||||||||
The key management figures above include the executive management team and directors. There are no0 post-employment benefits.
F-74
Consolidated financial statements and notes
Notes to the consolidated financial statements
28 Employees and directorscontinued
Share-based payments
The amount charged to the Consolidated statement of comprehensive income in respect of share-based payments was $71.3m$14.3 million for the 12 monthsyear ended October 31, 2019 (18 months ended October 31, 2018: $72.2m)2021 (2020: $17.0 million). The Consolidated statement of comprehensive income has been presented split between continuing and discontinued operations. The table below provides information of the share-based payments on a continuing operations basis. The tables below for each type of share option are presented on a combined continuing and discontinued operations basis.
12 months ended October 31, 2019 | 18 months ended October 31, 2018 | 12 months ended April 30, 2017 | Year ended October 31, 2021 | Year ended October 31, 2020 | Year ended October 31, 2019 | |||||||||||||||||||
| Continuing operations | $m | $m | $m | |||||||||||||||||||||
| $m | $m | $m | ||||||||||||||||||||||
| Share-based compensation – IFRS 2 charge | 62.0 | 70.9 | 20.8 | 12.0 | 18.3 | 62.0 | ||||||||||||||||||
| Employer taxes | 6.8 | (6.6 | ) | 10.7 | 2.3 | (1.3 | ) | 6.8 | ||||||||||||||||
| 68.8 | 64.3 | 31.5 | ||||||||||||||||||||||
| Continuing operations | 14.3 | 17.0 | 68.8 | |||||||||||||||||||||
| Discontinued operation | 0 | 0 | 2.5 | |||||||||||||||||||||
| Total | 14.3 | 17.0 | 71.3 | |||||||||||||||||||||
As at October 31, 2019,2021, accumulated employer taxes of $1.9m (October 31, 2018: $20.6m; April 30, 2017: $17.0m)$1.3 million (2020: $0.6 million) are included in trade and other payables and $nil (October 31, 2018: $0.5m; April 30, 2017: $1.2m)$nil (2020: $nil) is included in other non-current liabilities.
The Group has various equity-settled share-based compensation plans details of which are provided below.
| a) | Incentive Plan 2005 |
Year ended October 31, 2021 | Year ended October 31, 2020 | |||||||||||||||
Number of awards | Weighted average exercise price of awards | Number of awards | Weighted average exercise price of awards | |||||||||||||
| ‘000 | pence | ‘000 | pence | |||||||||||||
| Outstanding at November 1 | 14,222 | 0 | 9,227 | 6 | ||||||||||||
| Exercised | (576 | ) | 1 | (734 | ) | 1 | ||||||||||
| Forfeited/lapsed | (5,496 | ) | 0 | (2,100 | ) | 22 | ||||||||||
| Granted | 4,566 | 0 | 7,829 | 0 | ||||||||||||
| Outstanding at October 31, | 12,716 | 0 | 14,222 | 0 | ||||||||||||
| Exercisable at October 31, | 732 | 5 | 938 | 4 | ||||||||||||
12 months ended October 31, 2019 | 18 months ended October 31, 2018 | |||||||||||||||
Number of Options | Weighted average exercise price | Number of Options | Weighted average exercise price | |||||||||||||
| ‘000 | pence | ‘000 | pence | |||||||||||||
| Outstanding at November 1 / May 1 | 5,620 | 14 | 4,662 | 29 | ||||||||||||
| Exercised | (3,410 | ) | 17 | (1,283 | ) | 12 | ||||||||||
| Forfeited | (545 | ) | 27 | (582 | ) | 3 | ||||||||||
| Granted | 7,562 | - | 2,823 | - | ||||||||||||
| Outstanding at October 31 | 9,227 | 6 | 5,620 | 14 | ||||||||||||
| Exercisable at October 31 | 1,416 | 34 | 2,270 | 51 | ||||||||||||
The weighted average share price in the period for optionsawards on the date of exercise was 1,707469 pence for the 12 monthsyear ended October 31, 2019 (18 months ended October 31, 2018: 1,7812021 (2020: 526 pence).
The amount charged to the Consolidated statement of comprehensive income in respect of the LTIP scheme was $31.1m$6.7 million for the 12 monthsyear ended October 31, 2019 (18 months ended October 31, 2018: $30.3m)2021 (2020: $9.3 million,
2019: $31.1 million). In addition to this $8.5m (18 months ended October 31, 2018: $4.1m$2.3 million (2020: $1.3 million credit, 2019: $8.5 million charge) was charged to the Consolidatedconsolidated statement of comprehensive income in respect of National Insurance on these share options.awards.
| October 31, 2019 | October 31, 2018 | ||||||||||||||||||||||||
| Range of exercise prices | Weighted average exercise price pence | Number of options ‘000 | Weighted average remaining contractual life (years) | Weighted average exercise price pence | Number of options ‘000 | Weighted average remaining contractual life (years) | |||||||||||||||||||
£0.10 or less | 1 | 8,982 | 3.4 | 1 | 5,127 | 6.7 | |||||||||||||||||||
£0.11 – £1.00 | 13 | 137 | 3.7 | 13 | 205 | 4.9 | |||||||||||||||||||
£1.01 – £2.00 | - | - | - | - | - | - | |||||||||||||||||||
£2.01 – £3.00 | - | - | - | - | - | - | |||||||||||||||||||
£3.01 - £4.00 | - | - | - | 358 | 146 | 0.7 | |||||||||||||||||||
More than £4.00 | 402 | 108 | 0.7 | 402 | 142 | 1.7 | |||||||||||||||||||
| 6 | 9,227 | 3.4 | 14 | 5,620 | 4.0 | ||||||||||||||||||||
| October 31, 2021 | October 31, 2020 | ||||||||||||||||||||||||
| Range of exercise prices | Weighted average exercise price pence | Number of awards ‘000 | Weighted average remaining contractual life years | Weighted average exercise price pence | Number of awards ‘000 | Weighted average remaining contractual life years | |||||||||||||||||||
| £0.10 or less | 0 | 12,607 | 5.0 | 0 | 14,104 | 17.2 | |||||||||||||||||||
| £0.11 – £1.00 | 13 | 109 | 1.8 | 13 | 118 | 2.8 | |||||||||||||||||||
| 0 | 12,716 | 4.9 | 0 | 14,222 | 17.1 | ||||||||||||||||||||
F-75
Consolidated financial statements and notes
Notes to the consolidated financial statements
28 Employees and directorscontinued
Share-based payments continued
Unvested awards granted are subject to the following vesting conditions of either:
| Performance criteria | Unvested options Number ‘000 | Description |
| Free cash flow/ Relative TSR growth | 4,267 | Awards made with a free cash flow target and relative TSR target over a three-year period. |
| Continued employment | 6,277 | Awards under a continuing employment criteria over a two or three-year period. |
| Cumulative Earnings per share (“EPS”) growth | 1,309 | EPS for these awards is defined as Diluted Adjusted EPS*. Where the cumulative EPS growth over a three- or four-year period is at least equal to RPI plus 3% per annum 25% of awards will vest, with full vesting achieved when the cumulative EPS growth is RPI plus 9% per annum. Straight-line vesting will apply between these points. |
| Other | 131 | Various other vesting conditions |
| 11,984 |
* Earnings per share adjusted by adding back all exceptional items including the profit on the disposal of discontinued operation, share-based compensation charge and the amortisation of intangibles acquired in a business combination because they are individually or collectively material items that are not considered to be representative of the trading performance of the Group.
Further details regarding awards to executive directors are provided in the Item 6.B.
The weighted average fair value of optionsawards granted during the 12 monthsyear ended October 31, 20192021 determined using the Black-Scholes valuation model was £14.54 (18 months ended October 31, 2018: £15.25)£4.51 (2020: £2.01).
The significant inputs into the model for the 12 monthsyear ended October 31, 20192021 were:
October 31, | October 31, | |||||
| Weighted average share price at the grant date | £ | 5.25 | £ | 2.50 | ||
| Expected volatility | between | 72.85% | ||||
| Expected dividend yield | between | 23.76% | ||||
| Expected option life | ||||||
| Annual risk-free interest rate | between | 0.17% |
The volatility measured at the standard deviation of continuously compounded share returns is based on statistical daily share prices over the last three years.
The fair value of awards granted in the year ended October 31, 2021, as determined using the Monte Carlo simulation was $2.80 (2020: $2.67) and the fair value of awards granted using the share price at the date of grant was $7.32 (2020: $4.65).
Year ended October 31, 2021 | Year ended October 31, 2020 | |||||||||||||||||||||||||||||||
| Number of Options | Number of Options | |||||||||||||||||||||||||||||||
TAG ASGs | HPE Software ASGs | Total | Weighted average exercise price | TAG ASGs | HPE Software ASGs | Total | Weighted average exercise price | |||||||||||||||||||||||||
| ‘000 | ‘000 | ‘000 | pence | ‘000 | ‘000 | ‘000 | pence | |||||||||||||||||||||||||
| Outstanding at November 1 | 446 | 0 | 446 | 0 | 461 | 3,215 | 3,676 | 0 | ||||||||||||||||||||||||
| Granted | 0 | 0 | 0 | 0 | 0 | 0 | 0 | 0 | ||||||||||||||||||||||||
| Exercised | (40 | ) | 0 | (40 | ) | 0 | (15 | ) | 0 | (15 | ) | 0 | ||||||||||||||||||||
| Surrendered | 0 | 0 | 0 | 0 | 0 | (2,385 | ) | (2,385 | ) | 0 | ||||||||||||||||||||||
| Lapsed | 0 | 0 | 0 | 0 | 0 | (830 | ) | (830 | ) | 0 | ||||||||||||||||||||||
| Outstanding at October 31, | 406 | 0 | 406 | 0 | 446 | 0 | 446 | 0 | ||||||||||||||||||||||||
| Exercisable at October 31, | 406 | 0 | 406 | 0 | 446 | 0 | 446 | 0 | ||||||||||||||||||||||||
Consolidated financial statements and notes
Notes to the consolidated financial statements
28 Employees and directorscontinued
Share-based payments continued
12 months ended October 31, 2019 | 18 months ended October 31, 2018 | |||||||||||||||||||||||||||||||
| Number of Options | Number of Options | |||||||||||||||||||||||||||||||
TAG ASGs | HPE Software ASGs | Total | Weighted average exercise price | TAG ASGs | HPE Software ASGs | Total | Weighted average exercise price | |||||||||||||||||||||||||
| ‘000 | ‘000 | ‘000 | pence | ‘000 | ‘000 | ‘000 | pence | |||||||||||||||||||||||||
| Outstanding at November 1 / May 1 | 3,062 | 7,427 | 10,489 | - | 3,262 | - | 3,262 | - | ||||||||||||||||||||||||
| Granted | - | 458 | 458 | - | - | 13,115 | 13,115 | - | ||||||||||||||||||||||||
| Exercised | (2,601 | ) | - | (2,601 | ) | - | (200 | ) | - | (200 | ) | - | ||||||||||||||||||||
| Lapsed | - | (4,670 | ) | (4,670 | ) | - | - | (2,412 | ) | (2,412 | ) | - | ||||||||||||||||||||
| Cancelled | - | - | - | - | - | (3,276 | ) | (3,276 | ) | - | ||||||||||||||||||||||
| Outstanding at October 31 | 461 | 3,215 | 3,676 | - | 3,062 | 7,427 | 10,489 | - | ||||||||||||||||||||||||
| Exercisable at October 31 | 461 | - | 461 | - | 3,062 | - | 3,062 | - | ||||||||||||||||||||||||
Additional Share Grants – The HPE Software business acquisition
The Remuneration Committee awarded a number of Additional Share Grants (“ASGs”) to a number of senior managers and executives, critical to delivering the anticipated results of the acquisition of the HPE Software business, which completed on September 1, 2017.
Number of granted and cancelled nil cost share options over Ordinary Shares | Number of replacement nil cost options over Ordinary Shares | |||||||
| Director | ‘000 | ‘000 | ||||||
| Kevin Loosemore | 1,100 | 1,100 | ||||||
| Stephen Murdoch | 500 | 947 | ||||||
Chris Kennedy1 | 500 | 676 | ||||||
Mike Phillips1 | 676 | 676 | ||||||
Nils Brauckmann1 | 500 | 500 | ||||||
| 3,276 | 3,899 | |||||||
The amount charged to the Consolidated statement of comprehensive income in respect of the ASGs was $30.6m$nil for the 12 monthsyear ended October 31, 2019 (18 months ended2021 (2020: $3.9 million).
Additional Share Grants – The Attachmate Group (“TAG”) acquisition
The Remuneration Committee awarded ASGs to a number of senior managers and executives, critical to delivering the anticipated results of the acquisition of The Attachmate Group, which completed on November 20, 2014. These TAG ASG options vested in full.
As at October 31, 2018: $45.6m. In addition to this $1.7m (18 months ended October 31, 2018: $2.5m charge) was credited to the Consolidated statement2021, 405,917 (2020: 445,917) of comprehensive income in respect of National Insurance on these share options in the 12 months ended October 31, 2019.were vested but not yet exercised.
| October 31, 2019 | October 31, 2018 | ||||||||||||||||||||||||
| Range of exercise prices | Weighted average exercise price pence | Number of options ‘000 | Weighted average remaining contractual life (years) | Weighted average exercise price pence | Number of options ‘000 | Weighted average remaining contractual life (years) | |||||||||||||||||||
£0.00 | - | 3,676 | 7.3 | - | 10,489 | 5.5 | |||||||||||||||||||
| - | 3,676 | 7.3 | - | 10,489 | 5.5 | ||||||||||||||||||||
| October 31, 2021 | October 31, 2020 | ||||||||||||||||||||||||
| Range of exercise prices | Weighted average exercise price pence | Number of options ‘000 | Weighted average remaining contractual life (years) | Weighted average exercise price pence | Number of options ‘000 | Weighted average remaining contractual life (years) | |||||||||||||||||||
| ₤0.00 | 0 | 406 | 3.1 | 0 | 446 | 4.1 | |||||||||||||||||||
| 0 | 406 | 3.1 | 0 | 446 | 4.1 | ||||||||||||||||||||
| b) | Sharesave and Employee Stock Purchase Plan 2006 |
In August 2006, the Company introduced the Micro Focus Employee Stock Purchase Plan 2006 and the Micro Focus Sharesave Plan 2006, approved by members on July 25, 2006. The Group operates several plans throughout2 all-employee plans; the world, but the two main plans are theMicro Focus Sharesave Plan 2006 (“Sharesave”) primarily for UK and Ireland based employees and the Micro Focus Employee Stock Purchase Plan 2006 (“ESPP”) for employees in the USA and Canada.all other locations. The Sharesave and ESPP provide for an annual award of options at a discount to the market price and are open to all eligible Group employees. Under these plans employees make monthly savings over a period (Sharesave three years , ESPP two years) linked to the grant of an option with an option price which can be at a discount (Sharesave(for Sharesave this can be up to 20%, ESPP 15%) of the market value of the shares on grant.grant and for ESPP, this can be up to 15% of the market value of the shares on grant or maturity, whichever is lower). The option grants are subject to employment conditions and continuous savings.
Further Sharesave and ESPP grants were made during the 12 months to October 31, 2019.2021.
Sharesave
12 months ended October 31, 2019 | 18 months ended October 31, 2018 | Year ended October 31, 2021 | Year ended October 31, 2020 | |||||||||||||||||||||||||||||
Number of options ‘000 | Weighted average exercise price pence | Number of options ‘000 | Weighted average exercise price pence | Number of options ‘000 | Weighted average exercise price pence | Number of options ‘000 | Weighted average exercise price pence | |||||||||||||||||||||||||
| Outstanding at November 1 / May 1 | 496 | 1,185 | 559 | 1,039 | ||||||||||||||||||||||||||||
| Outstanding at November 1 | 1,935 | 293 | 438 | 1,221 | ||||||||||||||||||||||||||||
| Exercised | (81 | ) | 1,171 | (294 | ) | 829 | (2 | ) | 241 | 0 | 1,023 | |||||||||||||||||||||
| Forfeited | (102 | ) | 1,297 | (223 | ) | 1,508 | (316 | ) | 408 | (912 | ) | 855 | ||||||||||||||||||||
| Granted | 125 | 1,374 | 454 | 1,293 | 355 | 203 | 2,409 | 338 | ||||||||||||||||||||||||
| Outstanding at October 31 | 438 | 1,221 | 496 | 1,185 | 1,972 | 259 | 1,935 | 293 | ||||||||||||||||||||||||
| Exercisable at October 31 | 62 | 1,461 | 47 | 1,116 | 14 | 1,023 | 0 | 0 | ||||||||||||||||||||||||
Number of options | Exercise price per share | |||||||
| ‘000 | Date of grant | pence | Exercise period | |||||
| 61 | August 12, 2016 | 1,465.6 | October 1, 2019 – February 1, 2020 | |||||
| 21 | February 23, 2018 | 1,720.0 | April 1, 2021 – September 30, 2021 | |||||
| 2 | February 23, 2018 | 1,963.0 | April 1, 2021 – September 30, 2021 | |||||
| 221 | August 3, 2018 | 1,023.0 | October 1, 2021 – March 31, 2022 | |||||
| 19 | August 3, 2018 | 1,159.0 | October 1, 2021 – March 31, 2022 | |||||
| 67 | March 7, 2019 | 1,344.0 | April 1, 2022 – September 30, 2022 | |||||
| 4 | March 7, 2019 | 1,533.0 | April 1, 2022 – September 30, 2022 | |||||
| 40 | August 5, 2019 | 1,411.0 | October 1, 2021 – August 4, 2022 | |||||
| 3 | August 5, 2019 | 1,574.3 | October 1, 2021 – August 4, 2022 | |||||
| 438 | ||||||||
Consolidated financial statements and notes
Notes to the consolidated financial statements
28 Employees and directorscontinued
Number of options ‘000 | Date of grant | Exercise price per share pence | Exercise period | |||
| 13 | August 3, 2018 | 1,023.0 | October 1, 2021 – March 31, 2022 | |||
| 1 | August 3, 2018 | 1,159.0 | October 1, 2021 – March 31, 2022 | |||
| 8 | March 7, 2019 | 1,344.0 | April 1, 2022 – September 30, 2022 | |||
| 1 | March 7, 2019 | 1,533.0 | April 1, 2022 – September 30, 2022 | |||
| 6 | August 5, 2019 | 1,411.0 | October 1, 2021 – March 31, 2023 | |||
| 1 | August 5, 2019 | 1,574.3 | October 1, 2021 – March 31, 2023 | |||
| 54 | March 5, 2020 | 617.7 | April 1, 2023 – September 30, 2023 | |||
| 3 | March 5, 2020 | 728.2 | April 1, 2023 – September 30, 2023 | |||
| 1,494 | August 21, 2020 | 241.3 | October 1, 2023 – March 31, 2024 | |||
| 86 | August 21, 2020 | 241.1 | October 1, 2023 – March 31, 2024 | |||
| 135 | March 5, 2021 | 373.2 | April 1, 2024 – September 30, 2024 | |||
| 10 | March 5, 2021 | 373.2 | April 1, 2024 – September 30, 2024 | |||
| 160 | August 6, 2021 | 321.8 | October 1, 2024 – March 31, 2025 | |||
| 1,972 |
ESPP
Year ended October 31, 2021 | Year ended October 31, 2020 | |||||||||||||||
Number of options ‘000 | Weighted average exercise price ‘000 | Number of options ‘000 | Weighted average exercise price pence | |||||||||||||
| Outstanding at November 1 | 2,255 | 617 | 1,192 | 1,182 | ||||||||||||
| Exercised | (1,022 | ) | 1,430 | (1,472 | ) | 1,027 | ||||||||||
| Forfeited | (238 | ) | 1,341 | (423 | ) | 1,082 | ||||||||||
| Granted | 2,789 | 360 | 2,958 | 660 | ||||||||||||
| Outstanding at October 31, | 3,784 | 384 | 2,255 | 617 | ||||||||||||
| Exercisable at October 31, | 0 | 0 | 0 | 0 | ||||||||||||
12 months ended October 31, 2019 | 18 months ended October 31, 2018 | |||||||||||||||
Number of options | Weighted average exercise price | Number of options | Weighted average exercise price | |||||||||||||
| ‘000 | pence | ‘000 | pence | |||||||||||||
| Outstanding at November 1 / May 1 | 800 | 1,047 | 124 | 1,510 | ||||||||||||
| Exercised | (17 | ) | 1,114 | (110 | ) | 1,598 | ||||||||||
| Forfeited | (44 | ) | 1,440 | (31 | ) | 1,236 | ||||||||||
| Granted | 453 | 1,444 | 817 | 1,057 | ||||||||||||
| Outstanding at October 31 | 1,192 | 1,182 | 800 | 1,047 | ||||||||||||
| Exercisable at October 31 | - | - | - | - | ||||||||||||
Number of options ‘000 | Date of grant | Exercise price per share pence | Exercise period | |||
| 684 | March 1, 2020 | 635.9 | March 1, 2022 – May 31, 2022 | |||
| 1,085 | September 1, 2020 | 270.2 | September 1, 2022 – October 1, 2022 | |||
| 1,258 | April 1, 2021 | 369.2 | March 1, 2023 – May 31, 2023 | |||
| 757 | October 1, 2021 | 344.8 | October 1, 2023 – November 1, 2023 | |||
| 3,784 |
Number of Options | Exercise price per share | |||||||
| ‘000 | Date of grant | pence | Exercise period | |||||
| 309 | March 1, 2018 | 1,235.6 | March 1, 2020 – May 31, 2020 | |||||
| 430 | July 1, 2018 | 868.5 | July 1, 2020 – September 30, 2020 | |||||
| 244 | March 1, 2019 | 1,428.0 | March 1, 2021 – May 31, 2021 | |||||
| 209 | October 1, 2019 | 1,462.8 | October 1, 2021 – December 31, 2021 | |||||
| 1,192 | ||||||||
The amount charged to the Consolidated statement of comprehensive income in respect of the Sharesave and ESPP schemes was $2.8m$5.3 million for the 12 monthsyear ended October 31, 2019 (18 months ended October 31, 2018: $2.9m)2021 (2020: $5.1 million).
The weighted average fair value of options granted in theunder Sharesave and ESPP schemes during the 12 monthsyear ended October 31, 20192021 determined using the Black-Scholes valuation model was £5.93 (18 months ended October 31, 2018: £6.28)£1.61 (2020: £1.27).
The significant inputs into the model for the 12 monthsyear ended October 31, 20192021 were:
October 31, | October 31, | |||||||
| Weighted average share price at the grant date | £ | £ | 4.38 | |||||
| Expected volatility | between | 77.52% | between | 57.72% and 72.37% | ||||
| Expected dividend yield | between | 5.78% | between | 8.22% and 16.11% | ||||
| Expected option life | ||||||||
| Annual risk-free interest rate | between | 0.76% | between | 0.20% and 0.52% | ||||
The volatility measured at the standard deviation of continuously compounded share returns is based on statistical daily share prices over the last three years.
Consolidated financial statements and notes
Notes to the consolidated financial statements
| October 31, 2019 | October 31, 2018 | |||||||
| $m | $m | |||||||
| Future minimum lease payments under non-cancellable operating leases falling due: | ||||||||
| No later than one year | 78.6 | 65.8 | ||||||
| Later than one year and no later than three years | 123.6 | 86.4 | ||||||
| Later than three years and no later than five years | 61.4 | 53.3 | ||||||
| Later than five years | 37.6 | 22.5 | ||||||
| Total | 301.2 | 228.0 | ||||||
The Group’s related parties are its subsidiary undertakings, key management personnel and post-employment benefit plans.
Subsidiaries
Transactions between the Company and its subsidiaries have been eliminated on consolidation.
Remuneration of key management personnel
The remuneration of key management personnel of the Group (which is defined as members of the executive management team andcommittee including executive directors) is set out in note 33.28, “Employees and directors”. There are no loans between the Group and the key management personnel.
Transactions with other related parties.parties
The following transactions occurred with other related parties:
Contributions made to pension plans by the Group on behalf of employees are set out in note 25.
22, “Pension and other long-term benefit commitments”.
Sales and purchases of goods and services between related parties are not considered material.
30 Discontinued operation assets classified asand Assets held for sale and disposals
| October 31, 2019 | October 31, 2018 | |||||||||||||||||||||||
Current Assets | Current liabilities | Total | Current assets | Current liabilities | Total | |||||||||||||||||||
| Reported in: | $m | $m | $m | $m | $m | $m | ||||||||||||||||||
| SUSE | - | - | - | 1,114.5 | (427.4 | ) | 687.1 | |||||||||||||||||
| Atalla | - | - | - | 28.0 | (10.3 | ) | 17.7 | |||||||||||||||||
| - | - | - | 1,142.5 | (437.7 | ) | 704.8 | ||||||||||||||||||
| A. | SUSE |
Discontinued operation – Financial performance
12 months ended October 31, 2019 | 18 months ended October 31, 2018 | 12 months ended April 30, 2017 | Year ended October 31, 2021 | Year ended October 31, 2020 | Year ended October 31, 2019 | |||||||||||||||||||||||||||
Before Exceptional Items | Exceptional Items | Total | Total | Total | Total | Total | Total | |||||||||||||||||||||||||
| $m | $m | $m | $m | $m | $m | $m | $m | |||||||||||||||||||||||||
| Revenue | 127.0 | - | 127.0 | 538.2 | 303.4 | 0 | 0 | 127.0 | ||||||||||||||||||||||||
| Operating costs | (89.3 | ) | - | (89.3 | ) | (425.3 | ) | (238.6 | ) | 0 | 0 | (89.3 | ) | |||||||||||||||||||
| Operating profit | 37.7 | - | 37.7 | 112.9 | 64.8 | 0 | 0 | 37.7 | ||||||||||||||||||||||||
| Share of results of associate | (0.3 | ) | - | (0.3 | ) | (1.8 | ) | - | 0 | 0 | (0.3 | ) | ||||||||||||||||||||
| Profit on disposal of the SUSE business | - | 1,767.9 | 1,767.9 | - | - | |||||||||||||||||||||||||||
| Profit before taxation | 37.4 | 1,767.9 | 1,805.3 | 111.1 | 64.8 | |||||||||||||||||||||||||||
| (Loss)/profit on disposal of the SUSE business | 10.7 | (3.0 | ) | 1,767.9 | ||||||||||||||||||||||||||||
| (Loss)/profit before taxation | 10.7 | (3.0 | ) | 1,805.3 | ||||||||||||||||||||||||||||
| Taxation | (8.7 | ) | (309.4 | ) | (318.1 | ) | (34.2 | ) | (31.1 | ) | 0 | 8.1 | (318.1 | ) | ||||||||||||||||||
| Profit for the period from discontinued operation | 28.7 | 1,458.5 | 1,487.2 | 76.9 | 33.7 | |||||||||||||||||||||||||||
| Profit for the year from discontinued operation | 10.7 | 5.1 | 1,487.2 | |||||||||||||||||||||||||||||
The cash flow statement shows amounts related to the discontinued operations:
12 months ended October 31, 2019 | 18 months ended October 31, 2018 | 12 months ended April 30, 2017 | Year ended October 31, 2021 | Year ended October 31, 2020 | Year ended October 31, 2019 | |||||||||||||||||||
| $m | $m | $m | $m | $m | $m | |||||||||||||||||||
Net cash inflows from operating activities | 18.6 | 136.1 | 70.4 | 0 | 0 | 18.6 | ||||||||||||||||||
Net cash outflows from investing activities | - | (2.5 | ) | (7.4 | ) | 0 | 1.3 | 0 | ||||||||||||||||
Net cash flows from financing activities | - | - | - | 0 | 0 | 0 | ||||||||||||||||||
Consolidated financial statements and notes
Notes to the consolidated financial statements
30 Discontinued operation assets classified as held for sale and disposals continued
| A. | SUSE Business continued |
| October 31, 2019 | October 31, 2018 | |||||||||||
| Note | $m | $m | ||||||||||
| Non-current assets | ||||||||||||
| Goodwill | 10 | - | 859.6 | |||||||||
| Other Intangible assets | 11 | - | 165.6 | |||||||||
| Property, plant and equipment | 12 | - | 5.7 | |||||||||
| Investment in associates | - | 9.6 | ||||||||||
| Deferred tax assets | - | 1.6 | ||||||||||
| Long-term pension assets | 25 | - | 1.5 | |||||||||
| Other non-current assets | - | 2.2 | ||||||||||
| - | 1,045.8 | |||||||||||
| Current assets | ||||||||||||
| Trade and other receivables | - | 65.8 | ||||||||||
| Cash and cash equivalents | - | 2.9 | ||||||||||
| - | 68.7 | |||||||||||
| Total assets held for sale | - | 1,114.5 | ||||||||||
| Current liabilities | ||||||||||||
| Trade and other payables | - | (38.0 | ) | |||||||||
| Provisions | 24 | - | (0.7 | ) | ||||||||
| Current tax liabilities | - | (1.2 | ) | |||||||||
| Deferred income | - | (218.3 | ) | |||||||||
| - | (258.2 | ) | ||||||||||
| Non-current liabilities | ||||||||||||
| Deferred income | - | (160.8 | ) | |||||||||
| Retirement benefit obligations | 25 | - | (5.5 | ) | ||||||||
| Long-term provisions | 24 | - | (2.3 | ) | ||||||||
| Other non-current liabilities | - | (0.6 | ) | |||||||||
| - | (169.2 | ) | ||||||||||
| Total liabilities held for sale | - | (427.4 | ) | |||||||||
| Net assets classified as held for sale | - | 687.1 | ||||||||||
On March 15, 2019, the Group disposed of the SUSE business for $2,540.3m.$2,540.3 million. Details of net assets disposed of and the profit on disposal are as follows:
| Carrying value pre-disposal | ||||
| $m | ||||
| Non-current assets classified as held for sale | 989.8 | |||
| Current assets classified as held for sale | 127.3 | |||
| Current liabilities classified as held for sale | (288.5 | ) | ||
| Non-current liabilities classified as held for sale | (177.3 | ) | ||
| Net assets disposed | 651.3 | |||
The profit on disposal iswas calculated as follows:
| $m | ||||
| Disposal proceeds | 2,540.3 | |||
| Costs to sell recognized in the | (45.3 | ) | ||
| Disposal proceeds, less costs to sell recognized in the | 2,495.0 | |||
| Net assets disposed | (651.3 | ) | ||
| Profit on disposal | 1,843.7 | |||
| Cumulative exchange gain in respect of the net assets of the subsidiaries, reclassified from equity on disposal | (75.8 | ) | ||
| Profit on disposal | 1,767.9 |
The profit on disposal is reflected in the prior year in profit for the periodyear from discontinued operations in the Consolidated statement of comprehensive income. All cash flows occurred in the current period.prior year.
The inflow of cash and cash equivalents on the disposal of the SUSE business is calculated as follows:
| $m | ||||
| Disposal proceeds, less total costs to sell | 2,495.0 | |||
| Cash disposed | (21.5 | ) | ||
| Investing cash flows generated from discontinued operations, net of cash disposed | 2,473.5 |
| B. |
On May 18, 2018November 3, 2021, the Company entered into anGroup announced the agreement with Utimacoof definitive terms to sell its Archiving and Risk Management portfolio (the “Digital Safe business”) to Smarsh Inc. (“Utimaco”), underfor a total cash consideration of $375 million (subject to customary completion accounts adjustments based on net debt and working capital) which Utimaco would acquire Atalla for $20mis payable in cash. The dealfull on completion of the transaction. On January 31,2022 the sale was subject to regulatory approval bycompleted.
As a consequence, the Committee on Foreign Investment in the United States (“CFUIS”). CFIUS placed the deal into investigation in September and final approval was received October 10, 2018. The deal closed on November 5, 2018 and Utimaco acquired the Atalla HSM product line, the Enterprise Security Manger (“ESKM”) product line, and related supporting assets, including applicable patents and other IP.
The Digital Safe business forms part of the Financial Statements at October 31, 2018 amount to $17.7m.IM&G Product Group and includes the Digital Safe products and the complementary offerings of Social Media Governance, Supervisor and eDiscovery.
| October 31, 2019 | October 31, 2018 | |||||||||||
| Note | $m | $m | ||||||||||
| Goodwill | 10 | - | 27.9 | |||||||||
| Property, plant and equipment | 12 | - | 0.1 | |||||||||
| Non-current assets | - | 28.0 | ||||||||||
| Deferred income | - | (10.3 | ) | |||||||||
| Current liabilities | - | (10.3 | ) | |||||||||
| Net assets classified as held for sale | - | 17.7 | ||||||||||
Net assets classified as held for sale
| Year ended October 31, 2021 | ||||||||||||
Reported in: | Current Assets | Current liabilities | Total | |||||||||
| $m | $m | $m | ||||||||||
| Digital Safe | 370.3 | 68.4 | 301.9 | |||||||||
F-80
Consolidated financial statements and notes
Notes to the consolidated financial statements
30 Discontinued operation and Assets held for sale continued
The net asset assets classified as held for sale relating to the disposal of Digital Safe are detailed in the tables below. These include non-current assets and disposals continuednon-current liabilities that are shown as current assets and liabilities in the Consolidated statement of financial position.
| Note | Year ended October 31, 2021 $m | |||||||
| Non-current assets | ||||||||
| Goodwill | 10 | 147.2 | ||||||
| Other Intangible assets (including purchased software) | 11 | 182.1 | ||||||
| Property, plant and equipment (including right-of-use assets) | 12,19 | 11.5 | ||||||
| Other non-current assets | 0.1 | |||||||
| 340.9 | ||||||||
| Current assets | ||||||||
| Trade and other receivables | 24.6 | |||||||
| Other current assets | 4.8 | |||||||
| 29.4 | ||||||||
| Total assets held for sale | 370.3 | |||||||
| Current liabilities | ||||||||
| Trade and other payables | 1.8 | |||||||
| Lease obligations | 19 | 3.1 | ||||||
| Contract liabilities | 4.8 | |||||||
| Other current liabilities | 3.0 | |||||||
| 12.7 | ||||||||
| Non-current liabilities | ||||||||
| Deferred tax liabilities | 7 | 45.5 | ||||||
| Lease obligations | 19 | 8.3 | ||||||
| Contract liabilities | 0.5 | |||||||
| Other non-current liabilities | 1.4 | |||||||
| 55.7 | ||||||||
| Total liabilities held for sale | 68.4 | |||||||
Allocation of assets and liabilities to the Group disposedDigital Safe business and held for sale
Assets and liabilities related to the Digital Safe business are included as held for sale where they can be allocated directly, or allocated on a reasonable and consistent basis to the Digital Safe business.
Goodwill and intangible assets allocated to the Digital Safe business.
Trade names and acquired technology related intangibles were separately valued as part of the AtallaHPE software business foracquisition and are included based on their current carrying values.
Customer relationships were valued at an IM&G level as part of the HPE software business therefore an allocation to the Digital Safe business based on a net cash considerationrelative value of $20.0m. Detailsthe Digital Safe business versus the total value of net assets disposed of and the profit on disposal are as follows:
IM&G has been performed.
IM&G has been performed.
The profit on disposal whichgoodwill allocated to the Digital Safe business has been recorded as exceptional (note 4) is calculated as follows:
| Consideration | ||||||||||||||||||||||||
Carrying value at acquisition | Fair value adjustments | Goodwill | Shares | Cash | Total | |||||||||||||||||||
| $m | $m | $m | $m | $m | $m | |||||||||||||||||||
Acquisitions in the 12 months ended October 31, 2019: | ||||||||||||||||||||||||
| Interset Software Inc. | 0.9 | 61.3 | 26.8 | - | 89.0 | 89.0 | ||||||||||||||||||
| 0.9 | 61.3 | 26.8 | - | 89.0 | 89.0 | |||||||||||||||||||
Acquisitions in the 18 months ended October 31, 2018: | ||||||||||||||||||||||||
| HPE Software business | (2,487.8 | ) | 4,143.7 | 4,858.3 | 6,514.2 | - | 6,514.2 | |||||||||||||||||
| COBOL-IT | (3.0 | ) | 14.0 | 5.6 | - | 16.7 | 16.7 | |||||||||||||||||
(2,490.8 | ) | 4,157.7 | 4,863.9 | 6,514.2 | 16.7 | 6,530.9 | ||||||||||||||||||
| (2,489.8 | ) | 4,219.0 | 4,890.7 | 6,514.2 | 105.7 | 6,619.9 | ||||||||||||||||||
F-81
Consolidated financial statements and notes
Notes to the consolidated financial statements
31 Acquisitionscontinued
Summary of acquisitions
| Consideration | ||||||||||||||||||||||||
Carrying value at acquisition | Intangible assets | Goodwill | Shares | Cash | Total | |||||||||||||||||||
| $m | $m | $m | $m | $m | $m | |||||||||||||||||||
| Acquisitions in the year ended October 31, 2021: | ||||||||||||||||||||||||
| Full 360 | (0.3 | ) | 3.4 | 1.0 | 0 | 3.3 | 3.3 | |||||||||||||||||
| Streamworx | 0.2 | 4.4 | 6.2 | 0 | 9.7 | 9.7 | ||||||||||||||||||
| (0.1 | ) | 7.8 | 7.2 | 0 | 13.0 | 13.0 | ||||||||||||||||||
| Acquisitions in the year ended October 31, 2020: | ||||||||||||||||||||||||
| ATAR Labs | 0.9 | 6.6 | 1.4 | 0 | 7.3 | 7.3 | ||||||||||||||||||
| 0.9 | 6.6 | 1.4 | 0 | 7.3 | 7.3 | |||||||||||||||||||
| Acquisitions in the year ended October 31, 2019: | ||||||||||||||||||||||||
| Interset Software Inc. | 0.9 | 61.3 | 26.8 | 0 | 89.0 | 89.0 | ||||||||||||||||||
| 0.9 | 61.3 | 26.8 | 0 | 89.0 | 89.0 | |||||||||||||||||||
The Group has not presented the full IFRS 3 “Business Combinations” disclosures as these acquisitions are not material to the Group.
Acquisitions in the year ended October 31, 2021: Full 360
On June 11, 2021, the Group completed the acquisition of Full 360 inc. Full 360 inc will integrate into the Vertica portfolio to create proven unified analytics platform in public clouds and in enterprise data centres. Total consideration of $3.3 million was paid in cash at the point of acquisition, when the business had a carrying value comprising $0.3 million of assets and $0.6 million of liabilities. A fair value review was carried out on the assets and liabilities of the acquired business, resulting in the identification of purchased intangible assets of $3.4 million.
Streamworx
On August 19, 2021, the Group completed the acquisition of Streamworx.ai. Streamworx.ai will integrate into the CyberRes product group to create proven unified analytics platform in public clouds and in enterprise data centres. Total consideration of $9.7 million was paid in cash at the point of acquisition, when the business had a carrying value comprising $0.8 million of assets and $0.6 million of liabilities. A fair value review was carried out on the assets and liabilities of the acquired business, resulting in the identification of purchased intangible assets of $4.4 million.
Acquisitions in the year ended October 31, 2020: ATAR Labs
On July 1, 2020, the Group completed the acquisition of ATAR Labs. ATAR Labs integrates into the ArcSight portfolio to create a fast-acting environment against threats with top-of-the-line capabilities. Total consideration of $7.3 million consists of initial consideration of $6 million with a further deferred consideration payment of $1.3 million to be paid in 2 yearly instalments. At acquisition the business had a carrying value of $1.7 million of assets and $0.8 million of liabilities. A fair value review was carried out on the assets and liabilities of the acquired business, resulting in the identification of intangible assets of $6.6 million.
Acquisitions in the 12 months ended October 31, 2019:
On February 15, 2019, the Group completed the acquisition of Interset Software Inc. (“Interset”), a worldwide leader in security analytics software that provides highly intelligent and accurate cyber-threat protection. The addition of this predictive analytics technology adds depth to Micro Focus’ Security, Risk & Governance portfolio, and aligns with the Company’s strategy to help customers quickly and accurately validate and assess risk as they digitally transform their businesses.
Consideration of $89.0m consists of a completion payment of $85.0m,$85.0 million, working capital adjustments and net cash adjustments. The Group hasdid not presented the full IFRS 3 “Business Combinations” disclosures as this acquisition is not material to the Group, given that it was an acquisition of a business with a carrying value of $5.5m$5.5 million of assets and $4.6m$4.6 million of liabilities.
A provisional fair value review was carried out on the assets and liabilities of the acquired business, resulting in the identification of intangible assets. Adjustments to the provisional fair values have been recorded in the period which has reduced the amount of Goodwill recognized by $7.4m. At the time these consolidated financial statements were authorised for issue, the Group had not yet fully completed its assessment of the Interset Software Inc. acquisition.
The fair value review will bewas finalised in the 12-month period following completion.completion, which ended on February 15, 2020. No adjustments were identified.
Carrying value at acquisition | Fair value adjustments | Fair value | ||||||||||||||
| Note | $m | $m | $m | |||||||||||||
Intangible assets – purchased 1 | 11 | - | 61.2 | 61.2 | ||||||||||||
| Property, plant and equipment | 12 | 0.3 | - | 0.3 | ||||||||||||
| Other non-current assets | 0.2 | - | 0.2 | |||||||||||||
| Trade and other receivables | 3.8 | - | 3.8 | |||||||||||||
| Cash and cash equivalent | 1.2 | - | 1.2 | |||||||||||||
| Trade and other payables | (1.5 | ) | - | (1.5 | ) | |||||||||||
| Finance leases obligations – short-term | (0.1 | ) | - | (0.1 | ) | |||||||||||
| Provisions – short-term | 24 | (0.7 | ) | - | (0.7 | ) | ||||||||||
Deferred income – short-term 2 | (2.1 | ) | 0.1 | (2.0 | ) | |||||||||||
Deferred income – long-term 2 | (0.2 | ) | - | (0.2 | ) | |||||||||||
| Net assets | 0.9 | 61.3 | 62.2 | |||||||||||||
| Goodwill (note 10) | 26.8 | |||||||||||||||
| Consideration | 89.0 | |||||||||||||||
| Consideration satisfied by: | ||||||||||||||||
| Cash | 89.0 | |||||||||||||||
F-82
Consolidated financial statements and notes
Notes to the consolidated financial statements
31 Acquisitions continued
| Carrying value at acquisition | Fair value adjustments | Fair value | ||||||||||||||
| Note | $m | $m | $m | |||||||||||||
Intangible assets – purchased 1 | 11 | 0 | 61.2 | 61.2 | ||||||||||||
| Property, plant and equipment | 12 | 0.3 | 0 | 0.3 | ||||||||||||
| Other non-current assets | 0.2 | 0 | 0.2 | |||||||||||||
| Trade and other receivables | 3.8 | 0 | 3.8 | |||||||||||||
| Cash and cash equivalent | 1.2 | 0 | 1.2 | |||||||||||||
| Trade and other payables | (1.5 | ) | 0 | (1.5 | ) | |||||||||||
| Finance leases obligations – short term | (0.1 | ) | 0 | (0.1 | ) | |||||||||||
| Provisions – short-term | 21 | (0.7 | ) | 0 | (0.7 | ) | ||||||||||
Deferred income – short-term 2 | (2.1 | ) | 0.1 | (2.0 | ) | |||||||||||
Deferred income – long-term 2 | (0.2 | ) | 0 | (0.2 | ) | |||||||||||
| Net assets | 0.9 | 61.3 | 62.2 | |||||||||||||
| Goodwill (note 10) | 26.8 | |||||||||||||||
| Consideration | 89.0 | |||||||||||||||
| Consideration satisfied by: | ||||||||||||||||
| Cash | 89.0 | |||||||||||||||
The fair value adjustments relate to:
| 1 | Purchased intangible assets of |
| 2 | Deferred income has been valued taking account of the remaining performance obligations. |
The value of the goodwill represents the value of the assembled workforce at the time of the acquisition with specific knowledge and technical skills. It also represents the prospective future economic benefits that are expected to accrue from enhancing the portfolio of products available to the Company’s existing customer base with those of the acquired business.customer.
Consolidated financial statements and notes
Notes to the consolidated financial statements
32. Cash flow statement
Year ended October 31, 2021 | Year ended October 31, 2020 | Year ended October 31, 2019 | ||||||||||||||
| Note | $m | $m | $m | |||||||||||||
| Cash flows from operating activities | ||||||||||||||||
| Loss from continuing operations | (435.1 | ) | (2,974.6 | ) | (18.1 | ) | ||||||||||
| Profit from discontinued operation | 10.7 | 5.1 | 1,487.2 | |||||||||||||
| Loss for the year | (424.4 | ) | (2,969.5 | ) | 1,469.1 | |||||||||||
| Adjustments for: | ||||||||||||||||
| (Gain)/Loss on disposal of discontinued operation | 31 | (10.7 | ) | 3.0 | (1,767.9 | ) | ||||||||||
| Net finance costs | 6 | 252.2 | 279.0 | 255.8 | ||||||||||||
| Taxation – continuing operations | 7 | (82.7 | ) | 34.2 | (16.0 | ) | ||||||||||
| Taxation – discontinued operation | 31 | 0 | (8.1 | ) | 318.1 | |||||||||||
| Share of results of associates | 0 | 0 | 0.3 | |||||||||||||
| Operating (loss)/profit (attributable to continuing and discontinued operations) | (265.6 | ) | (2,661.4 | ) | 259.4 | |||||||||||
| Goodwill impairment charge | 10 | 0 | 2,799.2 | 0 | ||||||||||||
| Research and development tax credits | (1.1 | ) | (1.8 | ) | (1.2 | ) | ||||||||||
Property, plant and equipment depreciation | 12 | 33.7 | 42.0 | 52.6 | ||||||||||||
Right-of-use asset depreciation (2019 : finance lease depreciation) | 19 | 73.3 | 76.9 | 13.9 | ||||||||||||
| Loss on disposal of property, plant and equipment | 12 | 1.2 | 5.6 | 3.6 | ||||||||||||
| Loss on disposal of intangible assets | 11 | 0 | 0.6 | 0 | ||||||||||||
| Gain on disposal of Atalla | 0 | 0 | (3.7 | ) | ||||||||||||
| Amortization of intangible assets | 11 | 956.4 | 674.1 | 716.5 | ||||||||||||
| Leases impairment | 19 | 5.6 | 5.9 | 0 | ||||||||||||
| Share-based compensation charge | 28 | 14.3 | 17.0 | 71.3 | ||||||||||||
| Foreign exchange movements | 3 | 0.1 | 29.7 | 11.1 | ||||||||||||
Changes in working capital : | ||||||||||||||||
| Inventories | 0 | 0.1 | 0 | |||||||||||||
Trade and other receivables and contract related costs1 | (195.2 | ) | 251.6 | 156.5 | ||||||||||||
| Payables and other liabilities | 36.9 | (62.4 | ) | (110.4 | ) | |||||||||||
Provisions2 | 21 | 14.1 | 8.8 | (14.8 | ) | |||||||||||
| Contract liabilities - deferred income | 16.8 | (103.1 | ) | (98.5 | ) | |||||||||||
| Cash generated from operations | 690.5 | 1,082.8 | 1,056.3 | |||||||||||||
1 | Change in trade and other receivables and contract-related costs is adjusted for non-cash movements of ($19.0 million) (2020: ($51.7 million); (2019 $50.9 million) |
| 2 | In the year ended October 31, 2021 provisions movements have been presented net, in the year ended October 31, 2020 they were presented gross as provision movements $46.3 million (2019; $43.8 million) and provision utilisation ($37.5 million) (2019: ($58.6 million)). |
33 Post balance sheet events
Subsequent to the end of the reporting period for the year ended October 31, 2018:2021 the following events have taken place:
On September 1, 2017,December 20, 2021, the Company completedGroup’s employee benefit trust (“EBT”) commenced the acquisitionpurchase of HPE’s software business (“HPE Software”) by way12 million shares, equivalent to £43.4 million at the share price on December 20, 2021. These shares will be purchased on the open market and will be used for the settlement of merger with a wholly owned subsidiary of HPE incorporatedexisting and future employee share schemes awarded to holdsenior leaders and employees who are critical to achieving the business of HPE Softwarestrategic initiatives set out in the Chief Executive Officer’s report. In accordance with the termsrequirement of IFRS 10 the EBT is treated as if it is a subsidiary of the previously announced merger agreement (“Completion”). Accordingly, on Admission, American Depositary Shares representing 222,166,897 Consideration Shares were issued to HPE Shareholders, representing 50.1%Group. As a result, the purchase of shares held by the fully diluted share capital of the Company. The fair value of the ordinary shares issued was based on the listed share price of the Company as of August 31, 2017 of $6.5 billion. The costs of acquiring the HPE Software business of $70.1m are included in exceptional items (note 4) and include costs relating to due diligence work, legal work on the acquisition agreement and professional advisors on the transaction.
Archiving and Risk management portfolio: Completion of Digital Safe disposal
On November 3, 2021, the Group announced the agreement of definitive terms to sell its Archiving and Risk Management portfolio (the “Digital Safe business”) to Smarsh Inc., for a total cash consideration of $375m. On January 31, 2022, this disposal was completed.
Re-financing of long-term debt and revolving credit facility
On January 17, 2022, the Group announced the refinancing of $1.6 billion of existing term loans and updates to the revolving credit facility were not definitive to identify the entity, which obtains controlannounced in the transaction. The Group considered the other factors laid downDecember. Further details can be found in IFRS, such as the composition of the governing body of the combined entity, composition of senior management of the combined entity, the entity that issued equity interest, terms of exchange of equity interests, the entity which initiated the combination, relative size of each entity, the existence of a large minority voting interest in the combined entity and other factors (e.g. location of headquarters of the combined entity and entity name)Note 18, “Borrowings”. The conclusion of this assessment is that the Company is the accounting acquirer of the HPE Software business, and the acquisition accounting, as set out below, has been performed on this basis.
Carrying value at acquisition | Fair value adjustments | Fair value | ||||||||||||||
| Note | $m | $m | $m | |||||||||||||
| Intangible assets | 11 | 72.8 | 6,467.0 | 6,539.8 | ||||||||||||
| Property, plant and equipment | 12 | 160.1 | - | 160.1 | ||||||||||||
| Other non-current assets | 41.9 | - | 41.9 | |||||||||||||
| Inventories | 0.2 | - | 0.2 | |||||||||||||
| Trade and other receivables | 721.2 | - | 721.2 | |||||||||||||
| Current tax recoverable | 0.5 | - | 0.5 | |||||||||||||
| Cash and cash equivalents | 320.7 | - | 320.7 | |||||||||||||
| Trade and other payables | (686.8 | ) | 1.6 | (685.2 | ) | |||||||||||
| Current tax liabilities | (9.9 | ) | - | (9.9 | ) | |||||||||||
| Borrowings | (2,547.6 | ) | - | (2,547.6 | ) | |||||||||||
| Short-term provisions | 24 | (30.2 | ) | - | (30.2 | ) | ||||||||||
Short-term deferred income 2 | (701.2 | ) | 58.0 | (643.2 | ) | |||||||||||
Long-term deferred income 2 | (116.9 | ) | 8.7 | (108.2 | ) | |||||||||||
| Long-term provisions | 24 | (39.0 | ) | - | (39.0 | ) | ||||||||||
| Retirement benefit obligations | 25 | (71.5 | ) | - | (71.5 | ) | ||||||||||
| Other non-current liabilities | (52.3 | ) | 12.1 | (40.2 | ) | |||||||||||
Deferred tax assets/(liabilities) 3 | 450.2 | (2,403.7 | ) | (1,953.5 | ) | |||||||||||
| Net (liabilities)/assets | (2,487.8 | ) | 4,143.7 | 1,655.9 | ||||||||||||
| Goodwill | 10 | - | 4,858.3 | |||||||||||||
| Consideration | 6,514.2 | |||||||||||||||
| Consideration satisfied by: | ||||||||||||||||
| Shares | 6,514.2 | |||||||||||||||
Consolidated financial statements and notes
Notes to the consolidated financial statements
On January 19, 2022, the 12 months ended October 31, 2018 continued:Group executed a new 1m USD SOFR swap with a notional value of $750 million and a maturity date of February 28, 2027. The forward swap is effective on September 21, 2022 with a fixed interest rate of 1.656% swapped against the variable 1m SOFR USD rates.
34 Related undertakings
The definition of a subsidiary undertaking in the Act is different from the definition of that could limitterm under IFRS. As a result, related undertakings included within this list may not be the Group’s ability to undertake certain corporate actions (suchsame as the issuance of Micro Focus shares or Micro Focus ADSs orrelated undertakings consolidated in the undertaking of a merger or consolidation) that otherwise could be advantageous to the Group.Group IFRS financial statements. The Group is obliged to indemnify HPE for tax liabilities relating to the separationowns 100% of the HPE Software business from HPE if such liabilities are triggered by actions taken by the Group. The Group has robust procedures in place, including on-going consultation with its tax advisors, to ensure no such triggering actions are taken.all subsidiary undertakings.
| Company name | Country of incorporation | Principal activities | Key to Registered office address | |
| 1 | Attachmate Australasia Pty. Ltd. | Australia | In Liquidation | 1 |
| 2 | Attachmate Group Australia Pty Ltd | Australia | Sale and support of software | 1 |
| 3 | Autonomy Australia Pty Ltd | Australia | In Liquidation | 1 |
| 4 | Autonomy Systems Australia Pty Ltd | Australia | In Liquidation | 1 |
| 5 | Borland Australia Pty Ltd | Australia | In Liquidation | 1 |
| 6 | Entcorp Australia Pty Limited | Australia | In Liquidation | 1 |
| 7 | Full 360 Pty Ltd | Australia | Sale and support of software | 2 |
| 8 | Micro Focus Australia Pty Ltd | Australia | Sale and support of software | 1 |
| 9 | Micro Focus Pty Limited | Australia | Sale and support of software | 1 |
| 10 | Serena Software Pty Limited | Australia | In Liquidation | 1 |
| 11 | Micro Focus Austria GmbH | Austria | Development of software | 3 |
| 12 | Autonomy Belgium BV | Belgium | Sale and support of software | 4 |
| 13 | Micro Focus Belgium BV | Belgium | Sale and support of software | 4 |
| 14 | Micro Focus S.r.l | Belgium | Sale and support of software | 5 |
| 15 | Borland Latin America Ltda | Brazil | Sale and support of software | 6 |
| 16 | Cambridge Technology Partners do Brasil Ltda | Brazil | Dormant | 6 |
| 17 | Micro Focus Brasil Serviços de Tecnologia Ltda | Brazil | Sale and support of software | 6 |
| 18 | Micro Focus Programação de Computadores Ltda | Brazil | Sale and support of software | 6 |
| 19 | Peregrine Systems do Brasil Ltda. | Brazil | Sale and support of software | 7 |
| 20 | Serena Software Do Brasil Ltda | Brazil | Sale and support of software | 6 |
| 21 | Micro Focus APM Solutions EOOD | Bulgaria | Development of software | 8 |
| 22 | Micro Focus Bulgaria EOOD | Bulgaria | Sale and support of software | 8 |
| 23 | Autonomy Systems (Canada) Ltd. | Canada | Sale and support of software | 9 |
| 24 | GWAVA ULC | Canada | Holding Company | 10 |
| 25 | Interset Software ULC | Canada | Holding Company | 10 |
| 26 | Micro Focus (Canada) ULC | Canada | Development, sale and support of software | 10 |
Consolidated financial statements and notes
Notes to the consolidated financial statements
| Company name | Country of incorporation | Principal activities | Key to Registered office address | |
| 27 | Micro Focus Acquisition Canada ULC | Canada | Sale and support of software | 11 |
| 28 | Micro Focus Software (Canada) ULC | Canada | Sale and support of software | 12 |
| 29 | Micro Focus Software Solutions Canada Co. / Solutions Logiciels Micro Focus Canada Cie. | Canada | Sale and support of software | 13 |
| 30 | NetManage Canada ULC | Canada | Dormant | 10 |
| 31 | Entco Capital Co | Cayman Islands | In Liquidation | 14 |
| 32 | Entco Investment Co | Cayman Islands | In Liquidation | 14 |
| 33 | Micro Focus International Limited | Cayman Islands | In Liquidation | 14 |
| 34 | Micro Focus IP Ltd. | Cayman Islands | In Liquidation | 14 |
| 35 | Micro Focus Marigalante Ltd. | Cayman Islands | Sale and support of software | 15 |
| 36 | Autonomy Systems (Beijing) Limited Company | China | Sale and support of software | 16 |
| 37 | Micro Focus Limited Beijing Representative Office | China | Sale and support of software | 17 |
| 38 | Shanghai Micro Focus Software Technology Co., Ltd | China | Sale and support of software | 18 |
| 39 | Shanghai Micro Focus Software Technology Co., Ltd, Beijing Branch | China | Sale and support of software | 19 |
| 40 | Shanghai Micro Focus Software Technology Co., Ltd. Shandong Branch | China | Sale and support of software | 20 |
| 41 | Shanghai Micro Focus Software Technology Co., Ltd., Chongqing Branch | China | Sale and support of software | 41 |
| 42 | Shanghai Micro Focus Software Technology Co., Ltd., Shenzhen Branch | China | Sale and support of software | 42 |
| 43 | Singapore Micro Focus Pte. Ltd Shanghai Representative Office | China | Sale and support of software | 43 |
| 44 | Micro Focus Software LATAM S.A.S | Colombia | Sale and support of software | 44 |
| 45 | Micro Focus Centroamerica CAC Limitada | Costa Rica | Sale and support of software | 45 |
| 46 | Micro Focus Costa Rica Limitada | Costa Rica | Sale and support of software | 46 |
| 47 | NetIQ Software International Limited | Cyprus | In Liquidation | 47 |
| 48 | Micro Focus Czechia s.r.o. | Czech Republic | Sale and support of software | 48 |
| 49 | Micro Focus Denmark, filial af Micro Focus AS, Norge Branch | Denmark | Sale and support of software | 49 |
| 50 | Micro Focus Software Denmark ApS | Denmark | Sale and support of software | 50 |
| 51 | Micro Focus AS, Filial i Finland | Finland | Sale and support of software | 51 |
| 52 | Borland (France) Sarl | France | Sale and support of software | 52 |
| 53 | Cobol-IT, SAS | France | Sale and support of software | 53 |
| 54 | Micro Focus France SAS | France | Sale and support of software | 54 |
| 55 | Micro Focus SAS | France | Sale and support of software | 55 |
| 56 | Attachmate Group Germany GmbH | Germany | Sale and support of software | 56 |
| 57 | Borland GmbH | Germany | Dormant | 57 |
| 58 | GWAVA EMEA GmbH | Germany | Sale and support of software | 58 |
| 59 | Micro Focus Deutschland GmbH | Germany | Sale and support of software | 59 |
| 60 | Micro Focus GmbH | Germany | Sale and support of software | 32 |
| 61 | Novell Holding Deutschland GmbH | Germany | Holding Company | 32 |
| 62 | Serena Software GmbH | Germany | Sale and support of software | 34 |
| 63 | EntCorp Hong Kong Limited | Hong Kong | Sale and support of software | 35 |
| 64 | Micro Focus Limited Hong Kong Branch | Hong Kong | Sale and support of software | 36 |
| 65 | Micro Focus Software HK Limited | Hong Kong | Sale and support of software | 36 |
| 66 | Autonomy Software Asia Private Limited | India | Sale and support of software | 37 |
| 67 | Entco IT Services Private Limited | India | Sale and support of software | 38 |
| 68 | Interwoven, Inc., India Branch | India | Sale and support of software | 39 |
Consolidated financial statements and notes
Notes to the consolidated financial statements
| Company name | Country of incorporation | Principal activities | Key to Registered office address | |
| 69 | Micro Focus Software India Private Limited | India | Development, sale and support of software | 40 |
| 70 | Micro Focus Software Solutions India Private Limited | India | Sale and support of software | 41 |
| 71 | Micro Focus Software Pte. Ltd. – Representative Office | Indonesia | Sale and support of software | 42 |
| 72 | Attachmate Ireland Limited | Ireland | Sale and support of software | 43 |
| 73 | Entsoft Holding Ireland Unlimited Company | Ireland | In Liquidation | 43 |
| 74 | Micro Focus (IP) Ireland Limited | Ireland | Dormant | 44 |
| 75 | Micro Focus Galway Limited | Ireland | Sale and support of software | 43 |
| 76 | Micro Focus Group Holdings Unlimited | Ireland | Holding Company | 44 |
| 77 | Micro Focus International Holdings Limited | Ireland | Holding Company | 44 |
| 78 | Micro Focus Ireland Limited | Ireland | Development, sale and support of software | 44 |
| 79 | Micro Focus Software (Ireland) Limited | Ireland | Development, sale and support of software | 43 |
| 80 | Micro Focus Software Solutions Ireland Limited | Ireland | Sale and support of software | 43 |
| 81 | NetIQ Europe Limited | Ireland | Sale and support of software | 43 |
| 82 | NetIQ Ireland Limited | Ireland | Holding Company | 44 |
| 83 | Novell Cayman Software International Unlimited Company | Ireland | Holding Company | 44 |
| 84 | Novell Cayman Software Unlimited Company | Ireland | Holding Company | 44 |
| 85 | Novell Software International Limited | Ireland | Holding Company | 44 |
| 86 | Micro Focus Interactive Israel Ltd | Israel | Sale and support of software | 45 |
| 87 | Micro Focus Israel Limited | Israel | Development and support of software | 46 |
| 88 | Micro Focus Software Israel Ltd | Israel | Sale and support of software | 45 |
| 89 | N.Y. NetManage (Yerushalayim) Ltd | Israel | Dormant | 47 |
| 90 | Novell Israel Software Limited | Israel | Dormant | 48 |
| 91 | Micro Focus Italiana S.r.l. | Italy | Sale and support of software | 49 |
| 92 | Micro Focus S.r.l. | Italy | Sale and support of software | 49 |
| 93 | Verity Italia S.r.l. | Italy | In Liquidation | 50 |
| 94 | Entcorp Japan K.K. | Japan | Sale and support of software | 51 |
| 95 | Micro Focus Enterprise Ltd | Japan | Sale and support of software | 52 |
| 96 | Micro Focus LLC | Japan | Sale and support of software | 52 |
| 97 | Novell Japan, Ltd | Japan | Sale and support of software | 52 |
| 98 | Serena Software Japan LLC | Japan | Sale and support of software | 52 |
| 99 | Micro Focus Luxembourg S.à r.l. | Luxembourg | Sale and support of software | 53 |
| 100 | Verity Luxembourg S.à r.l. | Luxembourg | Sale and support of software | 54 |
| 101 | Micro Focus Malaysia Sdn. Bhd. | Malaysia | Sale and support of software | 55 |
| 102 | Novell Corporation (Malaysia) Sdn. Bhd. | Malaysia | Sale and support of software | 56 |
| 103 | Micro Focus International Mexico, S. de R.L. de C.V. | Mexico | Sale and support of software | 57 |
| 104 | Micro Focus Limited Mexico Branch | Mexico | Sale and support of software | 57 |
| 105 | Micro Focus Software Mexico, S. De R.L. De C.V. | Mexico | Sale and support of software | 57 |
| 106 | Micro Focus Software Solutions Mexico, S. de R.L. de C.V. | Mexico | Sale and support of software | 57 |
| 107 | Authasas B.V. | Netherlands | Sale and support of software | 58 |
| 108 | Autonomy HoldCo B.V. | Netherlands | Sale and support of software | 58 |
| 109 | Autonomy Netherlands B.V. | Netherlands | Sale and support of software | 58 |
Carrying value at acquisition | Fair value adjustments | Fair value | ||||||||||
| $m | $m | $m | ||||||||||
| Goodwill | 462.4 | (462.4 | ) | - | ||||||||
| Intangible assets - purchased | - | 317.7 | 317.7 | |||||||||
Intangible assets1 - other | 0.1 | - | 0.1 | |||||||||
| Property, plant and equipment | 1.9 | - | 1.9 | |||||||||
| Other non-current assets | 0.2 | - | 0.2 | |||||||||
| Deferred tax asset | 15.3 | - | 15.3 | |||||||||
| Trade and other receivables | 27.4 | - | 27.4 | |||||||||
| Cash and cash equivalents | 65.8 | - | 65.8 | |||||||||
| Trade and other payables | (27.7 | ) | - | (27.7 | ) | |||||||
| Current tax liabilities | (11.8 | ) | - | (11.8 | ) | |||||||
| Borrowings – short term | (4.0 | ) | - | (4.0 | ) | |||||||
| Short-term provisions | (3.2 | ) | - | (3.2 | ) | |||||||
Short-term deferred income 2 | (72.3 | ) | 3.8 | (68.5 | ) | |||||||
Long-term deferred income 2 | (14.9 | ) | 0.8 | (14.1 | ) | |||||||
| Borrowings – long term | (288.9 | ) | - | (288.9 | ) | |||||||
| Other non-current liabilities | (0.7 | ) | - | (0.7 | ) | |||||||
Deferred tax liabilities 3 | (2.4 | ) | (109.2 | ) | (111.6 | ) | ||||||
| Net assets/(liabilities) | 147.2 | (249.3 | ) | (102.1 | ) | |||||||
| Goodwill | - | - | 379.7 | |||||||||
| Consideration | - | - | 277.6 | |||||||||
| Consideration satisfied by: | 277.6 | |||||||||||
| Cash | 277.6 | |||||||||||
Consolidated financial statements and notes
Notes to the consolidated financial statements
| Company name | Country of incorporation | Principal activities | Key to Registered office address | |
| 110 | Borland B.V. | Netherlands | Sale and support of software | 58 |
| 111 | Entco Eastern Holding B.V. | Netherlands | In Liquidation | 58 |
| 112 | Entco Gatriam Holding B.V. | Netherlands | Holding company | 58 |
| 113 | Entco Holding Berlin B.V. | Netherlands | Holding company | 58 |
| 114 | Entco Holding Hague II B.V. | Netherlands | Holding company | 58 |
| 115 | Entco Sinope Holding B.V. | Netherlands | Holding company | 58 |
| 116 | Entcorp Nederland B.V. | Netherlands | Sale and support of software | 58 |
| 117 | Micro Focus B.V. | Netherlands | Sale and support of software | 58 |
| 118 | Micro Focus Caribe Holding B.V. | Netherlands | Sale and support of software | 58 |
| 119 | Micro Focus Eastern Holding II B.V. | Netherlands | Holding Company | 58 |
| 120 | Micro Focus Enterprise B.V. | Netherlands | Sale and support of software | 58 |
| 121 | Micro Focus HoldCo B.V. | Netherlands | Holding Company | 58 |
| 122 | Micro Focus Holding Finance B.V. | Netherlands | Holding Company | 58 |
| 123 | Micro Focus Holding Hague B.V. | Netherlands | Holding Company | 58 |
| 124 | Micro Focus Holding PR B.V. | Netherlands | Sale and support of software | 58 |
| 125 | Micro Focus International Trade B.V. | Netherlands | Sale and support of software | 58 |
| 126 | Micro Focus Nederland B.V. | Netherlands | Sale and support of software | 58 |
| 127 | Verity Benelux B.V. | Netherlands | Sale and support of software | 58 |
| 128 | Micro Focus Software (New Zealand) Unlimited | New Zealand | Sale and support of software | 59 |
| 129 | Micro Focus AS | Norway | Sale and support of software | 60 |
| 130 | Micro Focus Software, Inc. | Philippines | Sale and support of software | 61 |
| 131 | Micro Focus Polska sp. z o.o. | Poland | Sale and support of software | 62 |
| 132 | Micro Focus Portugal Informática, Lda | Portugal | Sale and support of software | 63 |
| 133 | Micro Focus, S.L.- Sucursal em Portugal Branch | Portugal | Sale and support of software | 63 |
| 134 | Micro Focus Caribe Holding B.V. LLC Branch | Puerto Rico | Sale and support of software | 64 |
| 135 | Micro Focus Holding PR B.V. LLC Branch | Puerto Rico | Sale and support of software | 64 |
| 136 | Micro Focus Software Romania SRL | Romania | Sale and support of software | 65 |
| 137 | Limited Liability Company Micro Focus | Russian Federation | Sale and support of software | 66 |
| 138 | Micro Focus LLC | Saudi Arabia | Sale and support of software | 67 |
| 139 | Autonomy Systems Singapore Pte. Ltd. | Singapore | In Liquidation | 68 |
| 140 | Borland (Singapore) Pte. Ltd. | Singapore | In Liquidation | 68 |
| 141 | Entco Software Pte. Ltd. | Singapore | Sale and support of software | 68 |
| 142 | Mercury Interactive (Singapore) Pte Ltd | Singapore | In Liquidation | 68 |
| 143 | Micro Focus Pte. Ltd. | Singapore | Sale and support of software | 68 |
| 144 | Micro Focus Software Pte. Ltd. | Singapore | Sale and support of software | 68 |
| 145 | Autonomy Systems Software South Africa Pty Ltd | South Africa | Sale and support of software | 69 |
| 146 | Micro Focus Software South Africa (Pty) Ltd | South Africa | Sale and support of software | 70 |
| 147 | Micro Focus South Africa (Pty) Ltd | South Africa | Sale and support of software | 71 |
| 148 | Micro Focus Korea Ltd | South Korea | Sale and support of software | 72 |
| 149 | Micro Focus Field Delivery Spain S.L.U. | Spain | Sale and support of software | 73 |
| 150 | Micro Focus S.L.U. | Spain | Sale and support of software | 73 |
| 151 | Micro Focus Software Spain S.L.U. | Spain | Sale and support of software | 73 |
Carrying value at acquisition | Fair value adjustments | Fair value | ||||||||||
| $m | $m | $m | ||||||||||
Intangible assets – purchased1 | - | 5.3 | 5.3 | |||||||||
Intangible assets – other 2 | 1.2 | (1.2 | ) | - | ||||||||
| Property, plant and equipment | 0.2 | - | 0.2 | |||||||||
| Trade and other receivables | 3.0 | - | 3.0 | |||||||||
| Cash and cash equivalents | 2.4 | - | 2.4 | |||||||||
| Trade and other payables | (1.4 | ) | - | (1.4 | ) | |||||||
Short-term deferred income 3 | (4.0 | ) | 0.3 | (3.7 | ) | |||||||
Long-term deferred income 3 | (0.8 | ) | - | (0.8 | ) | |||||||
Deferred tax liabilities 4 | - | (1.4 | ) | (1.4 | ) | |||||||
| Net assets | 0.6 | 3.0 | 3.6 | |||||||||
| Goodwill | 12.8 | |||||||||||
| Consideration | 16.4 | |||||||||||
| Consideration satisfied by: | ||||||||||||
| Cash | 16.4 | |||||||||||
Consolidated financial statements and notes
Notes to the consolidated financial statements
| Company name | Country of incorporation | Principal activities | Key to Registered office address | |
| 152 | Micro Focus AS, Norge, filial i Sverige Branch | Sweden | Sale and support of software | 74 |
| 153 | Micro Focus Sverige AB | Sweden | Sale and support of software | 74 |
| 154 | Micro Focus Enterprise B.V., Amstelveen, Wallisellen Branch | Switzerland | Sale and support of software | 75 |
| 155 | Micro Focus GmbH | Switzerland | Sale and support of software | 76 |
| 156 | Micro Focus International Suisse Sàrl | Switzerland | Sale and support of software | 77 |
| 157 | Micro Focus Schweiz GmbH | Switzerland | Sale and support of software | 76 |
| 158 | Entco, LLC Taiwan Branch | Taiwan | Sale and support of software | 78 |
| 159 | Micro Focus Taiwan Co., Ltd | Taiwan | Sale and support of software | 79 |
| 160 | Micro Focus Enterprise Tunisia SARL | Tunisia | Sale and support of software | 80 |
| 161 | Atarlabs Bilişim Anonim Şirketi | Turkey | Development and support of software | 81 |
| 162 | Micro Focus Teknoloji Çözümleri Limited Şirketi | Turkey | Sale and support of software | 82 |
| 163 | Micro Focus Ukraine, LLC. | Ukraine | Sale and support of software | 83 |
| 164 | Entco International SARL - Jebel Ali Free Zone Branch | United Arab Emirates | Sale and support of software | 84 |
| 165 | Entco International SARL-Abu Dhabi Branch | United Arab Emirates | Sale and support of software | 85 |
| 166 | Micro Focus Software Middle East FZ-LLC | United Arab Emirates | Sale and support of software | 86 |
| 167 | Attachmate Sales UK Limited | United Kingdom | Sale and support of software | 87 |
| 168 | Autonomy Systems Limited | United Kingdom | Sale and support of software | 87 |
| 169 | Borland (Holding) UK Limited | United Kingdom | In Liquidation | 87 |
| 170 | Borland (UK) Limited | United Kingdom | In Liquidation | 87 |
| 171 | Dart UK Newco Limited | United Kingdom | Divestiture company | 87 |
| 172 | Entco Holding Berlin B.V. - UK Branch | United Kingdom | Holding Company | 87 |
| 173 | Longsand Limited | United Kingdom | Sale and support of software | 87 |
| 174 | Merant Holdings | United Kingdom | Holding Company | 87 |
| 175 | Micro Focus (IP) Holdings Limited | United Kingdom | Dormant | 87 |
| 176 | Micro Focus (IP) Ltd | United Kingdom | Holding Company | 87 |
| 177 | Micro Focus (US) Holdings | United Kingdom | Holding Company | 87 |
| 178 | Micro Focus CHC Limited | United Kingdom | Holding Company | 87 |
| 179 | Micro Focus Foreign HoldCo Ltd | United Kingdom | Holding Company | 87 |
| 180 | Micro Focus Global Limited | United Kingdom | Sale and support of software | 87 |
| 181 | Micro Focus Group Limited | United Kingdom | Holding Company | 87 |
| 182 | Micro Focus Holdings Unlimited | United Kingdom | Holding Company | 87 |
| 183 | Micro Focus Integration Limited | United Kingdom | Sale and support of software | 87 |
| 184 | Micro Focus IP Development Limited | United Kingdom | Development and support of software | 87 |
| 185 | Micro Focus Limited | United Kingdom | Sale and support of software | 87 |
| 186 | Micro Focus Marigalante Ltd. - UK Branch | United Kingdom | Sale and support of software | 87 |
| 187 | Micro Focus MHC Limited | United Kingdom | Holding Company | 87 |
| 188 | Micro Focus Midco Holdings Limited | United Kingdom | Holding Company | 87 |
| 189 | Micro Focus Midco Limited | United Kingdom | Holding Company | 87 |
| 190 | Micro Focus Situla Holding Ltd | United Kingdom | Holding Company | 87 |
| 191 | Micro Focus Software (IP) Holdings Limited | United Kingdom | Holding Company | 87 |
| 192 | Micro Focus Software Holdings Ltd | United Kingdom | Sale and support of software | 87 |
Carrying value at acquisition | Fair value adjustments | Fair value | ||||||||||
| $m | $m | $m | ||||||||||
| Intangible assets – purchased technology | - | 5.0 | 5.0 | |||||||||
| Net assets | - | 5.0 | 5.0 | |||||||||
| Goodwill | - | |||||||||||
| Consideration | - | - | 5.0 | |||||||||
| Consideration satisfied by: | ||||||||||||
| Cash | 5.0 | |||||||||||
Consolidated financial statements and notes
Notes to the consolidated financial statements
| Company name | Country of incorporation | Principal activities | Key to Registered office address | |
| 193 | Micro Focus Software UK Ltd | United Kingdom | Sale and support of software | 87 |
| 194 | Micro Focus UK Limited | United Kingdom | Dormant | 87 |
| 195 | Serena Holdings | United Kingdom | Holding Company | 87 |
| 196 | Serena Software Europe Limited | United Kingdom | Sale and support of software | 87 |
| 197 | Attachmate Corporation | United States | Development and support of software | 88 |
| 198 | Borland Corporation | United States | Holding Company | 89 |
| 199 | Borland Software Corporation | United States | Development and support of software | 89 |
| 200 | Borland Technology Corporation | United States | Dormant | 89 |
| 201 | Dart US Newco LLC | United States | Divestiture company | 89 |
| 202 | Entco Delaware LLC | United States | Sale and support of software | 89 |
| 203 | Entco, LLC | United States | Sale and support of software | 89 |
| 204 | Full 360 Group Inc. | United States | Holding Company | 89 |
| 205 | Full 360 Inc | United States | Sale and support of software | 90 |
| 206 | GWAVA Technologies, Inc. | United States | Sale and support of software | 89 |
| 207 | MA FinanceCo., LLC | United States | Holding Company | 89 |
| 208 | Marcel Holdings LLC | United States | Sale and support of software | 89 |
| 209 | Micro Focus (US) Group, Inc. | United States | Holding Company | 89 |
| 210 | Micro Focus (US) International Holdings, Inc. | United States | Holding Company | 89 |
| 211 | Micro Focus (US), Inc. | United States | Development and support of software | 89 |
| 212 | Micro Focus Brazil Holdings LLC | United States | Holding Company | 89 |
| 213 | Micro Focus Government Solutions LLC | United States | Sale and support of software | 89 |
| 214 | Micro Focus LLC | United States | Sale and support of software | 89 |
| 215 | Micro Focus Software Inc. | United States | Development and support of software | 89 |
| 216 | NetIQ Corporation | United States | Development and support of software | 89 |
| 217 | Novell Holdings, Inc. | United States | Holding Company | 89 |
| 218 | Novell International Holdings, Inc. | United States | Holding Company | 89 |
| 219 | Seattle SpinCo, Inc. | United States | Holding Company | 89 |
| 220 | Serena Software, Inc. | United States | Holding Company | 89 |
| 221 | Stratify, Inc. | United States | Sale and support of software | 89 |
| 222 | The Attachmate Group, Inc. | United States | Holding Company | 89 |
| 223 | Vertica Systems, LLC | United States | Sale and support of software | 89 |
12 months ended October 31, 2019 | 18 months ended October 31, 2018 | 12 months ended April 30, 20171 | ||||||||||||||
| Note | $m | $m | $m | |||||||||||||
| Cash flows from operating activities | ||||||||||||||||
| (Loss) / Profit from continuing operations | (18.1 | ) | 707.2 | 124.1 | ||||||||||||
| Profit from discontinued operation | 1,487.2 | 76.9 | 33.7 | |||||||||||||
| Profit for the period | 1,469.1 | 784.1 | 157.8 | |||||||||||||
| Adjustments for: | ||||||||||||||||
| Gain on disposal of discontinued operation | 37 | (1,767.9 | ) | - | - | |||||||||||
| Net finance costs | 6 | 255.8 | 342.7 | 95.8 | ||||||||||||
| Taxation – continuing operations | 7 | (16.0 | ) | (673.1 | ) | 38.5 | ||||||||||
| Taxation – discontinued operation | 37 | 318.1 | 34.2 | - | ||||||||||||
| Share of results of associates | 0.3 | 1.8 | 1.3 | |||||||||||||
| Operating profit (attributable to continuing and discontinued operations) | 259.4 | 489.7 | 293.4 | |||||||||||||
| - continuing operations | 221.7 | 376.8 | 293.4 | |||||||||||||
| - discontinued operation | 37 | 37.7 | 112.9 | - | ||||||||||||
| 259.4 | 489.7 | 293.4 | ||||||||||||||
| Research and development tax credits | (1.2 | ) | (2.0 | ) | (3.0 | ) | ||||||||||
| Depreciation | 12 | 66.5 | 95.2 | 11.8 | ||||||||||||
| Loss on disposal of property, plant and equipment | 3.6 | 4.7 | 0.5 | |||||||||||||
| Gain on disposal of Atalla | 37, 4 | (3.7 | ) | - | - | |||||||||||
| Amortization of intangible assets | 11 | 716.5 | 943.3 | 236.4 | ||||||||||||
| Amortization of contract-related costs | 10.2 | - | - | |||||||||||||
| Share-based compensation charge | 33 | 71.3 | 72.2 | 34.5 | ||||||||||||
| Foreign exchange movements | 11.1 | (34.6 | ) | (4.9 | ) | |||||||||||
| Provisions movements | 24 | 43.8 | 142.8 | 47.3 | ||||||||||||
| Changes in working capital: | ||||||||||||||||
| Inventories | - | 0.1 | - | |||||||||||||
| Trade and other receivables | 183.0 | (408.8 | ) | 10.3 | ||||||||||||
| Increase in contract-related costs | (36.7 | ) | - | - | ||||||||||||
| Payables and other liabilities | (114.8 | ) | 131.3 | (33.3 | ) | |||||||||||
| Provision utilization | 24 | (58.6 | ) | (145.0 | ) | (43.5 | ) | |||||||||
| Contract liabilities - deferred income | (98.5 | ) | 131.4 | 15.5 | ||||||||||||
| Pension funding in excess of charge to operating profit | 4.4 | 4.0 | (0.2 | ) | ||||||||||||
| Cash generated from operations | 1,056.3 | 1,424.3 | 564.8 | |||||||||||||
The ultimate parent Company is Micro Focus International plc (the “Company”). The Company has a direct interest in Micro Focus Midco Holdings Limited and an indirect interest in all of the other related undertakings. The Company has an effective interest of 100% in all of the related undertakings listed in the table.
The financial results of all of the related undertakings listed above are included in the Group’s consolidated financial statements. None of the related undertakings holds any shares in the Company.
F-90
Consolidated financial statements and notes
Notes to the consolidated financial statements
For each of the subsidiaries listed above, the registered office or, in the case of undertakings other than subsidiaries, the principal place of business is as follows:
Registered office addresses:
| Number | Address |
| 1 | Level 8, 76 Berry Street, North Sydney NSW 2060, Australia |
| 2 | Suite 9, 191 Victoria Road, Gladesville NSW 2111, Australia |
| 3 | Donau-City-Straße 7, 40. OG, 1220 Wien, Austria |
| 4 | Officenter, Luchthavenlaan 27, 1800 Vilvoorde, Belgium |
| 5 | EU Parliament, 4th Floor, 37 De Meeussquare, 1000 Brussels, Belgium |
| 6 | Rua Joaquim Floriano, 466 - 12 Andar, Ed. Corporate, Itaim Bibi, São Paulo, SP, 04534-002, Brazil |
| 7 | Avenida das Nações Unidas, 1201, conj. 2302. sala 72, São Paulo, SP, 04578-000, Brazil |
| 8 | 76A James Boucher Blvd., Hill Tower 3rd floor, Lozenets District, Sofia, 1407, Bulgaria |
| 9 | 200-204 Lambert Street, Whitehorse Y1A 3T2, Canada |
| 10 | 250, Howe Street, Suite 1400-C, Vancouver BC V6C 3S7, Canada |
| 11 | 1300-1969 Upper Water Street, McInnes Cooper Tower - Purdy's Wharf Halifax, NS, B3J 3R7, Canada |
| 12 | 4300 Bankers Hall West, 888 - 3rd Street S.W., Calgary T2P 5C5, Canada |
| 13 | Cogswell Tower, 2000 Barrington Street, Suite 1101-C. , Halifax NS B3J 3K1 , Canada |
| 14 | PwC Corporate Finance & Recovery (Cayman) Limited., P.O. Box 258, 18 Forum Lane, Camana Bay, Grand Cayman , KY1-1104, Cayman Islands |
| 15 | Ocorian Trust (Cayman) Limited, Windward 3, Regatta Office Park, PO Box 1350, West Bay Road, Grand Cayman , KY1-1108, Cayman Islands |
| 16 | Unit 601, Block A, Yuanyang International Center, No. 56 Dong Si Huan Zhong Road, Beijing, Chaoyang District, China |
| 17 | Unit 04, B01, 3rd Floor, 101, 1st Floor, No.1 building, No.8 Yard Guangshun South Avenue , Chaoyang District, Beijing, China |
| 18 | Floor 2, Building 1, No. 799 Naxian Road, Pilot Free Trade Zone, Shanghai, China |
| 19 | 8 Guangshun Avenue South, B01, 3F Building 1, Chaoyang District , China |
| 20 | 1807-1811, 18th Floor, Kechuang Building, interchange of Yingxiong Mountain Road and 2nd Ring South Rd, Shizhong District, Jinan, Shangdong, China |
| 21 | No. 209, Chuangxin Plaza, No. 5 Keyuanyi Road, Jiulongpo District, Chongqing, China |
| 22 | 14/F, Office 1436, Times Financial Center, 4001 Shennan Avenue, Futian District, Shenzhen, Guangdong, 518046, China |
| 23 | Unit B011, 3rd Floor, No. 1 building, No.799 Naxian Road, Free Trade Zone, Shanghai, China |
| 24 | Calle 111 # 47A-96, Bogotá D.C., Colombia |
| 25 | San José, Cantón Montes de Oca, Distrito San Pedro, cincuenta metros al sur del Restaurante Le Chandelier, Edificio Blanco, Costa Rica |
| 26 | Digeni Akrita, 54, Akritas, Floor 2, Flat 201-202, 1061, Nicosia, Cyprus |
| 27 | Za Brumlovkou 1559/5, Michle, Prague, 140 00, Czech Republic |
| 28 | Borupvang 3, 2750, Ballerup, Denmark |
| 29 | Accountor Turku Oy, Yliopistonkatu 34,5 krs, Turku, FI-20100, Finland |
| 30 | 5 place de la Pyramide, Tour Ariane, La Défense 9 , 92088 , Paris , France |
| 31 | Tour Carpe Diem, 31 Place des Corolles, 92400, Courbevoie, France |
| 32 | Herrenberger Strasse 140, 71034, Böblingen, Germany |
| 33 | Von-Braun-Strabe 38a, 48683, Ahaus, Germany |
| 34 | Nördlicher Zubringer 9-11, 40470, Düsseldorf, Germany |
| 35 | 19th Floor, Cityplaza One, 1111 King's Road, Taikoo Shing, Hong Kong |
| 36 | 21st Floor, Henley Building, 5 Queens Road Central, Hong Kong |
| 37 | 4th Floor, Laurel Building ‘A' Block, Bagmane Tech Park, Survey no.65/2, C.V.Raman Nagar, Byrasandra Village, KR Pura Hobli, Bangalore South Taluk, Bengaluru-560093, India |
| 38 | 4th Floor, Bagmane Tech Park, Olympia Building Survey Nos. 66/1, 66/66-1 & 66/1-3, CV Raman Nagar , Bangalore, 560093, India |
| 39 | 7th Floor, Unit 705 Leela Business Park, Andheri – Kurla Road, Andheri East, Mumbai , 400059, India |
| 40 | Laurel Block D 65/2, Bagmane Tech Park, C.V. Raman Nagar Byrasandra Post, Bangalore, India |
F-91
Consolidated financial statements and notes
Notes to the consolidated financial statements
| Number | Address |
| 41 | 66/1, 6th Floor, Olympia Building, Bagmane Tech Park, Byrasandra, C V Raman Nagar, Bangalore, Karnataka, 560093, India |
| 42 | WTC 3, Unit no. 207, Jalan Jenderal Sudirman Kav 29-31, Kel. Karet Semanggi, Kec. Setiabudi, Kota Adm, Jakarta Selatan, DKI Jakarta, Indonesia |
| 43 | Block A, Ballybrit Business Park, Ballybane Road, Galway, H91 WP08, Ireland |
| 44 | One Spencer Dock, North Wall Quay, Dublin 1, D01 X9R7, Ireland |
| 45 | 5 Altalef St., Yahud, Israel |
| 46 | Matam Advanced Tech Center, Building 5/1, Haifa, 31 905, Israel |
| 47 | Scientific Industries Center, Haifa, 33263, Israel |
| 48 | 17 Hatidhar St, Raannana, 43665, Israel |
| 49 | Viale Sarca 235, 20126, Milan, Italy |
| 50 | Via Santa Maria alla Porta 9, 20123, Milan, Italy |
| 51 | No. 8 Center Plaza Bldg, 5F, 1-10-16 Horidomecho Nihonbashi, Chuo-ku, Tokyo 103-0012, Japan |
| 52 | Midtown Tower 19F, 9-7-1 Akasaka, Minato-ku, Tokyo, 107-6219, Japan |
| 53 | 12 rue Jean Engling, L-1466, Luxembourg |
| 54 | 15, Boulevard F.W. Raiffeisen, L - 2411, Luxembourg |
| 55 | Level 11 , 1 Sentral, Jalan Rakyat, Kuala Lumpur Sentral, 50470 59200 Kuala Lumpur, Malaysia |
| 56 | Unit 501, Level 5, Uptown 1, 1 Jalan SS21/58, Damansara Uptown, 47400 Selangor Darul Ehsan, Malaysia |
| 57 | Av. Periférico Sur 6751, Col. Toluquilla, Municipio Tlaquepaque, Jalisco, CP 45610, Mexico |
| 58 | Van Deventerlaan 31, 3528 AG, Utrecht, Netherlands |
| 59 | Level 26, PWC Tower, 15 Customs Street West, Auckland, 1010, New Zealand |
| 60 | C/O House of Business AS, 7th Floor Dronning Eufemias gate 16, Oslo, 0191, Norway |
| 61 | 2/F Three World Square, Upper Mckinley Road, Taguig City, Philippines |
| 62 | ul. Sucha 2/3, 50-086 Wrocław, Poland |
| 63 | Centro Empresarial Torres de Lisboa, Rua Tomás da Fonseca, Torre G, 1.º, Sala 111, Freguesia de São Domingos de Benfica, 1600 203, Lisboa, Portugal |
| 64 | Metro Office Park, Metro Parque 7, Street # 1, Suite 204 , Guaynabo, PR 00968, Puerto Rico |
| 65 | 2nd District, 3 George Constantinescu Street, BOC Office Building, 4th floor, entrance B, 2nd District, Bucharest, PC 020339, Romania |
| 66 | Leningradskoye shosse 16 A, building 3, floor 10, premise XV, room 16, 125171, Moscow, Russian Federation |
| 67 | Nimr Al Nakheel Centre, Building A, 1st floor, Imam Saud Bin Abdulaziz Bin Muhammad Road, Riyadh, 11564, Saudi Arabia |
| 68 | #12-04/06, 1 Harbourfront Place, Harbourfront Tower 1, Singapore, 098633, Singapore |
| 69 | 78 Sophia Street, Fairland, 2195, South Africa |
| 70 | Novell House, MorningWedge Office, 255 Rivonia Road, Morningside, 2196, South Africa |
| 71 | Morningside Wedge Office Park , 255 Rivonia Road, Morningside, Sandton, Gauteng, 2057, South Africa |
| 72 | Yeoidodong, SK Building, 15F, 31 Gukjegeumyung-ro 8-gil, Yeongdeungpo-gu, Seoul, Korea, Republic of |
| 73 | Torre Espacio, Planta 16, Paseo de la Castellana, 259D, 28046 Madrid, Spain |
| 74 | Kronborgsgränd 1, 164 46 Kista, Stockholm, Sweden |
| 75 | Richtistrasse 7, 8304 Wallisellen, Switzerland |
| 76 | Wallisellen Business Park, Offices 201-204, Richtistrasse 7, 8304, Wallisellen, Switzerland |
| 77 | Chemin Jean-Baptiste Vandelle 3A, 1290 Versoix, Switzerland |
| 79 | 9F., No. 200, Sec. 1, Keelung Rd., Xinyi Dist., Taipei City, 110, Taiwan |
| 80 | ZI Chotrana, Technopole El Ghazala, Lot No 45, Ariana, 2088, Tunisia |
| 81 | Üniversiteler Mahallesi 1605 Cad. No: 3A, Çankaya , Ankara, Turkey |
| 82 | AND Plaza Kozyatağa İçerenköy Mahallesi Umut Sk. 10/12, Kat: 16 34752 Ataşehir/İstanbul, Turkey |
| 83 | 13 Pimonenko Str., building 6, Office 6A/61, Kiev, 04050, Ukraine |
F-92
Consolidated financial statements and notes
Notes to the consolidated financial statements
| Number | Address |
| 84 | JAFZA One building, Unit No. AB 1005, Jebel Ali Free Zone, Dubai, United Arab Emirates |
| 85 | Al Hilal Building, Al Falah Road, Office 318, Abu Dhabi, United Arab Emirates |
| 86 | 1204 - 1205, Floor 12 Al Shatha Tower, Dubai, United Arab Emirates |
| 87 | The Lawn, 22-30 Old Bath Road, Newbury, Berkshire, RG14 1QN, United Kingdom |
| 88 | Corporation Service Company, MC-CSC1, 300 Deschutes Way SW, Suite 208, Tumwater, WA98501, United States |
| 89 | Corporation Service Company, 251 Little Falls Drive, Wilmington, Delaware 19808, United States |
| 90 | Corporation Service Company, 80 State Street, Albany, NY 12207-2543, United States |
F-92