2016 Annual Report on Form 20-F |
|
UNITED STATES |
SECURITIES AND EXCHANGE COMMISSION |
WASHINGTON, DC 20549 |
|
Form FORM 20-F
(Mark one)One)
☐ REGISTRATION STATEMENT PURSUANT TO SECTION 12(b) OR 12(g) OF THE SECURITIES EXCHANGE ACT OF 1934 |
OR |
xX ANNUAL REPORT PURSUANT TO SECTION 13 OR 15(d) OF THE SECURITIES EXCHANGE ACT OF 1934
|
For the fiscal year ended December 31, 20142016 |
OR |
☐ TRANSITION REPORT PURSUANT TO SECTION 13 OR 15(d) OF THE SECURITIES EXCHANGE ACT OF 1934 |
For the transition period from _________ to _________ |
OR |
☐ SHELL COMPANY REPORT PURSUANT TO SECTION 13 OR 15(d) OF THE SECURITIES EXCHANGE ACT OF 1934 |
Date of event requiring this shell company report _________ |
Commission file number 1-15200 |
Statoil ASA |
(Exact Name of Registrant as Specified in Its Charter) |
N/A |
(Translation of Registrant’s Name Into English) |
Norway |
(Jurisdiction of Incorporation or Organization) |
Forusbeen 50, N-4035, Stavanger, Norway |
(Address of Principal Executive Offices) Torgrim ReitanHans Jakob Hegge
Chief Financial Officer Statoil ASA Forusbeen 50, N-4035 Stavanger, Norway Telephone No.: 011-47-5199-0000 Fax No.: 011-47-5199-0050 |
(Name, Telephone, E-mail and/or Facsimile number and Address of Company Contact Person) |
|
Securities registered or to be registered pursuant to Section 12(b) of the Act: |
Title of Each Class | Name of Each Exchange On Which Registered |
American Depositary Shares | New York Stock Exchange |
Ordinary shares, nominal value of NOK 2.50 each | New York Stock Exchange* |
| *Listed, not for trading, but only in connection with the registration of American Depositary Shares, pursuant to the requirements of the Securities and Exchange Commission | |
Securities registered or to be registered pursuant to Section 12(g) of the Act: None |
Securities for which there is a reporting obligation pursuant to Section 15(d) of the Act: None |
Indicate the number of outstanding shares of each of the issuer’s classes of capital or common stock as of the close of the period covered by the annual report. |
| Ordinary shares of NOK 2.50 each 3,182,914,686 | 3,188,647,1033,245,049,411
| |
|
Indicate by check mark if the registrant is a well-known seasoned issuer, as defined in Rule 405 of the Securities Act. |
| xX Yes ☐ No
|
|
If this report is an annual or transition report, indicate by check mark if the registrant is not required to file reports pursuant to Section 13 or 15(d) of the Securities Exchange Act of 1934. |
| ☐ Yes xX No |
Note – Checking the box above will not relieve any registrant required to file reports pursuant to Section 13 or 15(d) of the Securities Exchange Act of 1934 from their obligations under those Sections. |
| |
Indicate by check mark whether the registrant: (1) has filed all reports required to be filed by Section 13 or 15(d) of the Securities Exchange Act of 1934 during the preceding 12 months (or for such shorter period that the registrant was required to file such reports), and (2) has been subject to such filing requirements for the past 90 days. |
| xX Yes ☐ No
|
| |
Indicate by check mark whether the registrant has submitted electronically and posted on its corporate Web site, if any, every Interactive Data File required to be submitted and posted pursuant to Rule 405 of Regulation S-T (§232.405 of this chapter) during the preceding 12 months (or for such shorter period that the registrant was required to submit and post such files).** |
| ☐ Yes ☐ Yes ☐ No |
**This requirement does not apply to the registrant in respect of this filing. |
|
Indicate by check mark whether the registrant is a large accelerated filer, an accelerated filer, or a non-accelerated filer. See definition of “accelerated filer and large accelerated filer” in Rule 12b-2 of the Exchange Act. (Check one): |
Large accelerated filer x X | Accelerated filer ☐ | Non-accelerated filer ☐ |
| | |
Indicate by check mark which basis of accounting the registrant has used to prepare the financial statements included in this filing: |
U.S. GAAP ☐ | International Financial Reporting Standards as issued
by the International Accounting Standards Board x X | Other ☐ |
|
If “Other” has been checked in response to the previous question, indicate by check mark which financial statement item the registrant has elected to follow. |
| Item 17 ☐ | | |
| Item 18 ☐ | | |
If this is an annual report, indicate by check mark whether the registrant is a shell company (as defined in Rule 12b-2 of the Exchange Act). |
| ☐ Yes xX No |
| |
| | | | | | | | | | | | | | |
Statoil, Annual Report on Form 20-F 20142016 1
2 Statoil, Annual Report on Form 20-F 20142016
| INTRODUCTION | |
| Message from Chair of the board | 3 |
| Chief executive letter | 5 |
Statoil at a glance | 6 |
| About the report | 8 |
| |
STRATEGIC REPORT | |
| 2.1 Strategy and market overview | 9 |
2.2 Business overview | 14 |
2.3 DPN - Development and Production Norway | 19 |
2.4 DPI - Development and Production International | 27 |
2.5 MMP - Marketing, Midstream and Processing | 33 |
2.6 Other group | 36 |
2.7 Corporate | 39 |
2.8 Operating and financial performance | 44 |
2.9 Liquidity and capital resources | 69 |
2.10 Risk review | 74 |
2.11 Safety, security and sustainability | 85 |
| 2.12 Our people | 90 |
| |
CORPORATE GOVERNANCE | |
3.1 Introduction | 93 |
3.2 General meeting of shareholders | 96 |
3.3 Nomination committee | 97 |
3.4 Corporate assembly | 98 |
3.5 Board of directors | 101 |
3.6 Management | 111 |
3.7 Compensation to governing bodies | 116 |
3.8 Share ownership | 124 |
3.9 External auditor | 125 |
3.10 Controls and procedures | 127 |
| |
FINANCIAL STATEMENTS AND SUPPLEMENTS | |
| 4.1 Statoil Consolidated financial statements | 129 |
| |
ADDITIONAL INFORMATION | |
5.1 Shareholder information | 203 |
5.2 Accounting standards (IFRS) and Non-GAAP measures | 216 |
5.3 Legal proceedings | 220 |
| 5.6 Terms and abbreviations | 221 |
| 5.7 Forward-looking statements | 224 |
5.8 Signature page | 225 |
5.9 Exhibits | 226 |
5.10 Cross reference to Form 20-F | 227 |
1 Introduction
Dear shareholder,
| |
2016 was a challenging year for the oil and gas industry. Across the industry, the financial results were impacted by the continued low price environment and Statoil ended up with a negative net income of USD 2.9 billion. In this situation, it is encouraging to see how well the company has delivered on its improvement programme and that the operational performance has continued to be strong. Statoil is now well positioned to for the future. The board of directors has in its work focused both on short term measurements to secure the company’s position in a challenging environment, and more long term through the work of sharpening our strategy. Protecting and enhancing shareholder value guides the board of directors in its work and priorities – short and long term. Strong safety performance is essential for the company’s operations. Last year we experienced the worst imaginable, with a fatality on a yard in South Korea and a helicopter crash outside Bergen that took 13 lives. Further, the serious incident frequency, measured as incidents per million hours worked for both Statoil employees and contractors, increased from 0.6 in 2015 to 0.8 in 2016. Together with the administration, the board of directors has focused on new steps to reinforce safety measures and get back to a positive trend to improve our safety performance. The response to the market challenge through our improvement programme delivered annualised efficiency gains of USD 3.2 billion measured against a 2013 baseline, USD 700 million above the USD 2.5 billion target. As the company moves from an improvement programme to an improvement culture, new targets are set. The board of directors have during the year worked closely with the administration to review and confirm Statoil’s sharpened strategy. Statoil has set clear principles for the development of a distinct and competitive portfolio. Statoil will develop long-term value on the | Norwegian continental shelf, deepen in core areas and develop new growth options internationally, and grow value creation in its marketing and midstream business. The company is making progress in creating a material industrial position in new energy solutions, primarily focused on offshore wind. Responding to the climate challenge and preparing Statoil for a low carbon future is an integrated part of our strategy. Concrete actions to reduce greenhouse gas emissions in the operations have been implemented, and steps have been taken to build a more resilient portfolio. The updated climate roadmap captures the new set of measurements to be implemented. Statoil remains committed to shareholder value creation and maintained the dividend during the year. A resolution is proposed to the annual general meeting to maintain the dividend at USD 0.2201 per share in the fourth quarter, and to continue the scrip dividend programme through to the third quarter of 2017. The board of directors believes the company is well prepared to deal with the current market situation and has the competence, capacity and leadership necessary to create new opportunities and long-term value for our shareholders. I would like to thank our shareholders for their continued investment, as well as the many employees of Statoil for all the dedication and commitment they show every day. Øystein Løseth Chair of the board |
1.1 About the report
Statoil's Annual Report on Form 20-F for the year ended 31 December 2014 ("Annual Report on Form
20-F") is available online at www.statoil.com.
Statoil is subject to the information requirements of the US Securities Exchange Act of 1934 applicable to foreign private issuers. In accordance with these
requirements, Statoil files its Annual Report on Form 20-F and other related documents with the Securities and Exchange Commission (the SEC). It is also
possible to read and copy documents that have been filed with the SEC at the SEC's public reference room located at 100 F Street, N.E., Washington, D.C.
20549, USA. You can also call the SEC at 1-800-SEC-0330 for further information about the public reference rooms and their copy charges, or you can
log on to www.sec.gov. The report can also be downloaded from the SEC website at www.sec.gov.
Statoil discloses on its website at www.statoil.com/en/about/corporategovernance/statementofcorporategovernance/pages/default.aspx, and in its
Annual Report on Form 20-F (Item 16G) significant ways (if any) in which its corporate governance practices differ from those mandated for US companies
under the New York Stock Exchange (the "NYSE") listing standards.
Statoil, Annual Report on Form 20-F 20142016 3
1.2 Key figures and highlights
Statoil publishes financial data in accordance with International Financial Reporting Standards (IFRS) as issued by the International Accounting Standards Board (IASB) and as adopted by the European Union (EU).
(in NOK billion, unless stated otherwise) | For the year ended 31 December |
2014 | 2013 | 2012 | 2011 | 2010 |
| | | | | | |
Financial information | | | | | |
Total revenues and other income3) | 622.7 | 634.5 | 718.2 | 670.0 | 529.9 |
Net operating income | 109.5 | 155.5 | 206.6 | 211.8 | 137.3 |
Net income | 22.0 | 39.2 | 69.5 | 78.4 | 37.6 |
Non-current finance debt | 205.1 | 165.5 | 101.0 | 111.6 | 99.8 |
Net interest-bearing debt before adjustments | 89.2 | 58.0 | 39.3 | 71.0 | 69.5 |
Total assets | 986.4 | 885.6 | 784.4 | 768.6 | 643.3 |
Share capital | 8.0 | 8.0 | 8.0 | 8.0 | 8.0 |
Non-controlling interest | 0.4 | 0.5 | 0.7 | 6.2 | 6.9 |
Total equity | 381.2 | 356.0 | 319.9 | 285.2 | 226.4 |
Net debt to capital employed ratio before adjustments | 19.0% | 14.0% | 10.9% | 19.9% | 23.5% |
Net debt to capital employed ratio adjusted | 20.0% | 15.2% | 12.4% | 21.1% | 25.5% |
Calculated ROACE based on Average Capital Employed before adjustments | 2.7% | 11.3% | 18.7% | 22.1% | 12.6% |
| | | | | | |
Operational information | | | | | |
Equity oil and gas production (mboe/day) | 1,927 | 1,940 | 2,004 | 1,850 | 1,888 |
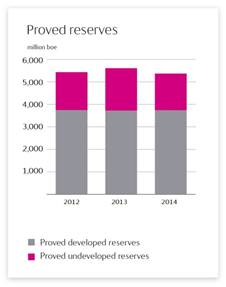
Proved oil and gas reserves (mmboe) | 5,359 | 5,600 | 5,422 | 5,426 | 5,325 |
Reserve replacement ratio (three-year average) | 0.97 | 1.15 | 1.01 | 0.90 | 0.60 |
Production cost equity volumes (NOK/boe, last 12 months) | 49 | 44 | 42 | 42 | 38 |
| | | | | | |
Share information | | | | | |
Diluted earnings per share NOK | 6.87 | 12.50 | 21.60 | 24.70 | 11.94 |
Share price at Oslo Stock Exchange on 31 December in NOK | 131.20 | 147.00 | 139.00 | 153.50 | 138.60 |
Dividend paid per share NOK 1) | 7.20 | 7.00 | 6.75 | 6.50 | 6.25 |
Dividend paid per share USD 2) | 0.97 | 1.15 | 1.21 | 1.08 | 1.07 |
Weighted average number of ordinary shares outstanding (in thousands) | 3,179,959 | 3,180,684 | 3,181,546 | 3,182,113 | 3,182,575 |
| | | | | | |
(1) | See Shareholder information section for a description of how dividends are determined and information on share repurchases. The board of directors will propose the 2014 dividend for approval at the Annual General Meeting scheduled for 19 May 2015. |
(2) | USD figure presented using the Central Bank of Norway 2014 year-end rate for Norwegian kroner, which was USD 1.00 = 7.43 NOK. The board of directors will propose the 2014 dividend for approval at the Annual General Meeting scheduled for 19 May 2015. |
(3) | Total revenues and other income for 2013 and 2012 are restated. See note 2 Significant accounting policies to the Consolidated financial statements for further details. |
4 Statoil, Annual Report on Form 20-F 20142016

Dear fellow shareholder, |
Safety and security is our top priority in Statoil. And while 2016 was a year of many achievements, we also experienced the worst thinkable. We had a contractor fatality during construction work in South Korea, and on 29 April we lost 13 colleagues when a helicopter crashed on its way from Gullfaks B to Bergen. For the year as a whole, our serious incident frequency came in at 0.8, an increase from the two previous years. We are not satisfied with this development and have taken several steps to reinforce safety measures throughout the company. In 2016, we saw oil prices below USD 30 per barrel and while prices increased towards the end of the year, our average realised liquids price was still below USD 40 per barrel for the year as a whole. We delivered our cost improvement programme above target. The next step will be to go from project mode to a culture of continuous improvement, and we have set a target of achieving USD 1 billion in additional cost improvements in 2017. By reworking solutions from reservoir to market, we have transformed our opportunity set. The break-even price for our “Next generation” portfolio of projects (those sanctioned since 2015 or planned for sanction with start up by 2022), is now at USD 27 per barrel of oil equivalent (boe). Organic capex for 2016 was USD 10.1 billion, a USD 3 billion reduction from the original guiding. Production for the full year was 1,978 mboe per day, a slight increase from 2015 due to continued high production efficiency and despite high turnaround activity. Our reserve-replacement ratio (RRR) was 93%. “High value, low carbon” is at the core of our sharpened strategy. We believe the winners in the energy transition will be the producers which can deliver at low cost and with low carbon emissions. | Statoil is pursuing a distinct and value-driven strategy: ·On the Norwegian continental shelf (NCS) we have a unique position which we will leverage further to build our future business and maximise value ·In our international upstream business, we will focus, deepen and explore further. Brazil is a core area for us, together with our position in the highly flexible US onshore business ·For the Marketing, Midstream and Processing (MMP) business area, the job is to secure flow assurance by accessing premium markets and strengthening asset-backed trading, based on a ‘capex light’ approach ·In the New Energy Solutions (NES) business area, we are building a profitable business with the long-term potential to account for 15-20% of our capex in 2030, provided that we can access and mature attractive opportunities Our commitment to long-term sustainable value creation, is in line with the principles of the UN Global Compact. We believe a low carbon footprint will make us more competitive in the future. We also believe there are attractive business opportunities in the transition to a low-carbon economy. Statoil intends to be part of this transformation in order to fulfil our purpose of turning natural resources into energy for people and progress for society. Our Climate roadmap explains how we plan to achieve this and how we will develop our business, supporting the ambitions of the Paris climate agreement. I look forward to further strengthening Statoil in 2017, pursuing the priorities set out at our Capital markets update: resetting our cost base, transforming our opportunity set and continuing to chase improvements. We have sharpened our strategy as an energy company towards 2030, and are ready to capitalise on high-value opportunities. Eldar Sætre President and Chief Executive Officer Statoil ASA |
Statoil, Annual Report on Form 20-F 20165
STATOIL AT A GLANCE
Our history
The company was founded as The Norwegian State Oil company (Statoil) in 1972, and became listed on the Oslo Børs (Norway) and New York Stock Exchange (US) in June 2001. Statoil merged with Hydro`s oil and gas division in October 2007.
Statoil is an international energy company with operations in over 30 countries. We are headquartered in Stavanger, Norway with approximately 20,500 employees worldwide. We create value through safe and efficient operations, innovative solutions and technology. Statoil’s competitiveness is founded on our values-based performance culture, with a strong commitment to transparency, cooperation and continuous operational improvement.
Our shareholders
The Norwegian State is the largest shareholder in Statoil, with a direct ownership interest of 67%. Its ownership interest is managed by the Norwegian Ministry of Petroleum and Energy. US investors hold 9.6%, Norwegian Private owners hold 8.9%, other European investors hold 7.1%, UK investors hold 5.1% and others hold 1.5%.
Our business areas
We have eight business areas:
·Development and Production Norway
·Development and Production International
·Development and Production USA
·Marketing, Midstream and Processing
·Technology, Projects and Drilling
·Exploration
·Global Strategy and Business Development
·New Energy Solutions
Our strategy
Statoil is an energy company committed to long-term value creation in a low carbon future. Statoil will develop and maximise the value of its unique Norwegian continental shelf position, its international oil and gas business and its growing new energy business; focusing on safety, cost and carbon efficiency. Statoil is a values based company where empowered people collaborate to shape the future of energy.
Our values
Open, Collaborative, Courageous and Caring.
Our dividend policy
It is Statoil's ambition to grow the annual cash dividend, measured in USD per share, in line with long term underlying earnings. Statoil announces dividends on a quarterly basis. In May 2016, the annual general meeting approved the introduction of a two-year scrip dividend programme commencing from the fourth quarter of 2015.
6Statoil, Annual Report on Form 20-F 2016
Key figures and highlights
(in USD million, unless stated otherwise) | For the year ended 31 December |
2016 | 2015 | 2014 | 2013 | 2012 |
| | | | | | |
Financial information4) | | | | | |
Total revenues and other income3) | 45,873 | 59,642 | 99,264 | 108,318 | 123,660 |
Net operating income | 80 | 1,366 | 17,878 | 26,572 | 35,808 |
Operating expenses | (9,025) | (10,512) | (11,657) | (12,669) | (10,467) |
Net income | (2,902) | (5,169) | 3,887 | 6,713 | 12,234 |
Non-current finance debt | 27,999 | 29,965 | 27,593 | 27,197 | 18,137 |
Net interest-bearing debt before adjustments | 18,372 | 13,852 | 12,004 | 9,542 | 7,057 |
Total assets | 104,530 | 109,742 | 132,702 | 145,572 | 140,921 |
Share capital | 1,156 | 1,139 | 1,139 | 1,139 | 961 |
Non-controlling interest | 27 | 36 | 57 | 81 | 121 |
Total equity | 35,099 | 40,307 | 51,282 | 58,513 | 57,468 |
Net debt to capital employed ratio before adjustments | 34.4% | 25.6% | 19.0% | 14.0% | 10.9% |
Net debt to capital employed ratio adjusted | 35.6% | 26.8% | 20.0% | 15.2% | 12.4% |
Calculated ROACE based on Average Capital Employed before adjustments | (4.7%) | (8.9%) | 3.4% | 11.3% | 18.7% |
| | | | | | |
Operational information | | | | | |
Equity oil and gas production (mboe/day) | 1,978 | 1,971 | 1,927 | 1,940 | 2,004 |
Proved oil and gas reserves (mmboe) | 5,013 | 5,060 | 5,359 | 5,600 | 5,422 |
Reserve replacement ratio (annual) | 0.93 | 0.55 | 0.62 | 1.28 | 0.99 |
Reserve replacement ratio (three-year average) | 0.70 | 0.81 | 0.97 | 1.15 | 1.01 |
Production cost equity volumes (USD/boe) | 5.0 | 5.9 | 7.6 | 7.5 | 7.2 |
| | | | | | |
Share information1) | | | | | |
Diluted earnings per share USD | (0.91) | (1.63) | 1.21 | 2.14 | 3.80 |
Share price at Oslo Børs (Norway) on 31 December in NOK | 158.40 | 123.70 | 131.20 | 147.00 | 139.00 |
Dividend per share USD 2) | 0.88 | 1.07 | 0.97 | 1.15 | 1.21 |
Weighted average number of ordinary shares outstanding (in thousands) | 3,194,880 | 3,179,443 | 3,179,959 | 3,180,684 | 3,181,546 |
| | | | | | |
1) | See section 5.1 Shareholder information for a description of how dividends are determined and information on share repurchases. |
2) | Proposed cash dividend for the second quarter of 2016. From and including the third quarter of 2015, dividends were declared in USD. Dividends in previous periods were declared in NOK. Figures for 2015 and earlier periods are presented using the Central Bank of Norway year end rates for Norwegian kroner. |
3) | Total revenues and other income for 2013 and 2012 are restated. |
4) | On 1 January 2016 Statoil changed its presentation currency from Norwegian kroner (NOK) to US dollar (USD), mainly in order to better reflect the underlying USD exposure of Statoil’s business activities and to align with industry practice. Comparative figures have been represented in USD to reflect the change. For further details, reference is made to Note 26 Change of presentation currency to the Consolidated Financial Statements. |
Statoil, Annual Report on Form 20-F 20167
2About the report
This document constitutes the Annual report on Form 20-F in accordance with the US Securities and Exchange Act of 1934 applicable to foreign private issuers. A cross reference to the Form 20-F requirements are set out in section 5.10 in this report. The Annual report on Form 20-F and other related documents are filed with the US Securities and Exchange Commission (the SEC).
Financial reporting terms used in this report are in accordance with International Financial Reporting Standards (IFRS) as adopted by the European union (EU) and also comply with IFRS as issued by the International Accounting Standards Board (IASB), effective at 31 December 2016. This document should be read in conjunction with the cautionary statement in section 5.7 Forward-looking statement.
The Statoil Annual report and Form 20-F may be downloaded from Statoil’s website at [Statoil.com/annualreport2016]. No other material on Statoil’s website forms any part of such document. References to this document or other documents on Statoil’s website are included as an aid to their location and are not incorporated by reference into this document. All of the SEC filings made available electronically by Statoil may be obtained from the SEC at 100 F Street, N.E., Washington D.CC. 20549, United States or on the SEC’s website at www.sec.gov.
8Statoil, Annual Report on Form 20-F 2016
2.1 Strategy and market overview
Our strategy for value creation and long-term growth remains firm. However, the profitability of the oil and gas industry continues to be challenged and Statoil’s financial results in 2014 were influenced by the fall in oil prices. Stricter project prioritisation and a comprehensive efficiency programme are showing progress and will improve cash flow and profitability. Our strong financial position provides a firm basis on which to balance capital investment and dividends to shareholders, which we expect to grow in line with our long term earnings.
Last year we outlined the plan to strengthen Statoil’s competitiveness, and we now reinforce our efforts and commitment to deliver on our priorities of high value growth, increased efficiency and competitive shareholder returns. Through our significant flexibility in our investment programme we believe we are well prepared for potential sustained market volatility and uncertainty.
Statoil’s ambition to reduce costs and improve efficiency was presented at the capital markets update (CMU) on 7 February 2014, targeting annual savings of USD 1.3 billion from 2016. At the CMU on 6 February 2015, Statoil announced that it will step up its efficiency programme by 30% with a
goal to realise USD 1.7 billion in annual savings from 2016.
Improvement programmes are Statoil’s response to the industrial challenges characterised by escalating cost and declining returns. More specifically, the ambition is to realise positive production effects and cost savings to improve Statoil’s financial results and cash-flows.
These forward-looking statements reflect current views about future events and are, by their nature, subject to significant risks and uncertainties because they relate to events and depend on circumstances that will occur in the future. See the section Forward-Looking Statements for more information.
2.1 OurStatoil’s business environment
2.1.1 Market overview
Global2016 was another year of sub-par growth, with global economic GDP growth picked up only marginallyeasing from 2.6% to 2.3%. This was largely driven by the slowdown in 2014, to 2.7%OECD economies, with non-OECD economies gaining momentum over the year. In the United States, consumer spending remained healthy, but investment contracted and resulted in GDP growth decelerating from 2.6% in 2013. Growth2015 to 1.6%. Economic expansion continued at a moderate pace in OECD has been gaining momentum, driventhe Euro-zone at 1.7%, supported by the United States. Non-OECD activity slowed in 2014, but remains decentprivate consumption and supportive of overall economic growth and energy demand.
While growthhigher employment. The economy in the United States andKingdom held up well despite the United Kingdom has strengthened as laborEU Leave vote, while in contrast Japan logged relatively modest growth. Emerging markets heal and monetary policy remains very expansive,maintained their growth rate from 2015, partly due to Russia heading towards economic recovery during the recovery has been hesitant inyear. 2016 saw China's growth stabilise due to intensified stimulus efforts amidst the Eurozone and Japan. Growth in emerging countries slippedcontinued slowdown since 2012, caused by economic rebalancing. India’s GDP growth rate eased to 4.2% in 2014, reflecting both weak external demand and domestic challenges. China is still growing at a healthy pace, but continues6.6% on an intended paththe sudden demonetarisation of gradual deceleration.
large currency notes that hampered consumption. Several major forces are at play in the global economy and will continue to affect demand: softdemand, including relatively low commodity prices; persistentlyprices, low interest rates, alongside increasingly divergent monetary policies across major economies,increased policy uncertainty and weak world trade. In particular, the sharp decline in oil prices since mid-2014 has supported global economic activity and will continue to do so in 2015.
Continued recovery in the United States, a gradual acceleration of activity in the Eurozone, and receding headwinds to growth among slower-growing emerging economies are expected to lift global growth in 2015 to 3%, according to Statoil’s own research. This rate, which is in line with historic trend growth, is likely to be sustained over the next 10 years, comprising 2% annual growth in the OECD economies and 5% annual growth in non-OECD economies. This means that the globally weighted, geographical point of economic gravity continues to move gradually eastwards and southwards relative to the OECD economies in Europe and North America.
The growing populations in emerging economies represent a strong long-term driver of economic development and energy demand. Global oil demand grew by 0.7a healthy 1.5 mmbbl per day in 2014. A slowdown2016. Production from non-Opec countries reacted to lower prices and declined by 0.9 mmbbl, with most of the decline taking place in Chinese oil demand growthNorth America and weaker fundamentals in Europe and Japan were the main reasons behind the five-year low result. Statoil's research suggests that the annual growth in oil demand will averageChina. However, Opec added 1.1 mmbbl per day over the medium-term. Positive growthto production. This resulted in non-OPEC supply, in particular from North America, tight oil and other liquids, will continue to putan oversupplied market throughout 2016, with storage levels moderately increasing.
The first half of 2016 saw a downward pressure ontrend in gas prices, while OPEC maintains its production of 30 mmbbl per day. The weakening of the fundamentals in global oil marketswhich reflected both market balance and the slow recovery of the OECD economies and emerging markets are expected to continue to affect markets in 2015.surrounding competitive fuels. However, prices below USD 50/bbl are expected to lead to a significant reduction in shale oil production growth and the building of global commercial oil stocks will turn to stock draws in the second half of 2015.
Due2016, markets have strengthened due to a general increase in energyrebounding commodity market and demand and the competitiveness ofresponding to weak gas in terms of cost and environmental effects, global gas demand is expected to grow. However, the increase in demand will be impacted by energy and climate policies in key regions and countries. Statoil's research suggests that gas demand will increase by 1% and 2% in Europe and in North America, respectively, during the rest of the current decade, whereas Asia will see a growth of 5%prices in the same period. Both Europe and Asia will have to depend on importsfirst half of LNG, which will help sustain a robust price level. In North America, where
a revolution in the shale industry has led to increase in proved reserves and production rates have led to historically low prices, prices are expected to gradually increase as the market situation normalises, though the level will remain below that of European and Asian gas prices.
Statoil, Annual Report on Form 20-F 20145
The global economic situation continues to be fragile, with development partly driven by uncertain political environments in key countries and regions, in addition to normal supply and demand factors. Consequently, energy prices could continue to fluctuate considerably in the short to medium-term.
Production to reserve growth continues to remain a key challenge for international oil companies. Balancing the need for short-term production growth with long-term reserve growth is key for long-term success. We believe Statoil's production development is competitive, but industry challenges exist. Increasing competition, tighter fiscal conditions, and high costs pose challenges to accessing new profitable resources. It is anticipated that international oil companies, including Statoil, will pursue a number of measures as a response. Some examples include seeking to diversify portfolios across multiple resource types (onshore and offshore, conventional and unconventional), increasing exploration activities, engaging in active portfolio management, and seeking to improve the profitability of projects and existing assets through cost efficiency programmes.
Going forward, upward pressure on capital and operational expenditures is still expected as companies combat the decline of legacy fields and tackle increasing technical challenges when developing new fields, even if adjustments in the industry undertaken as a response to lower prices could modify this pressure somewhat over the medium-term. Companies that are at the forefront of efficient resource management, as well as the effective development and utilisation of new technology, will be best equipped to meet these challenges.2016.
2.1.2 Oil prices and refining margins
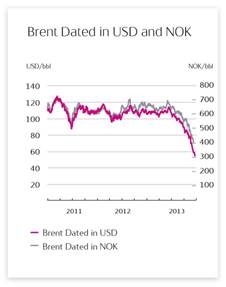
After moreHigher than three years of relatively stable prices, 2014 sawusual volatility characterised the oil market in 2016 as it did in the previous year, with the price of dated Brent crude climb tomoving in a range between USD 11526 per barrel in June before dropping to USD 55 per barrel at the end of December. Refinery margins increased due to declining crude prices during the second half of the year.barrel.
Oil prices
The oil market is generally volatile and has been highly volatile since June 2014. The average price for dated Brent crude in 20142016 was USD 98.95/bbl,43.7 per barrel, down almost USD 10/bbl10 per barrel from 2013. Prices fluctuated between approximately USD 106/bbl and approximately USD 110/bbl from January to June, when they increased to an annual high of USD 115.31/bbl in mid-June. From here2015. The dated Brent oil price started the prices fell steadily down to USD 100/bbl in mid-August. Here the price hovered for a couple of weeks before breaking through the temporary floor of USD 100/bbl early September and falling steadily to approximately USD 77/bbl in late November. The 166th annual OPEC meeting was held on 27 November and gained a lot of attention. The decision not to cut OPEC production immediately sent the prices downwards, the Brent price endedyear on a 5 yeardownward trajectory and hit a low of USD 54.98/bbl on 31 December.26 per barrel in the second half of January. Positive market sentiment driven by healthy demand growth and significant supply disruptions pushed the price of dated Brent up to around USD 50 per barrel by the end of second quarter. The return of disrupted volumes during the summer and signs of weakening demand growth sent prices down again towards USD 40 per barrel early in August. The price of dated Brent recovered somewhat again in the third quarter after Opec and Russia agreed to come up with a plan to freeze or cut their production. The Opec meeting in late November concluded with an agreement among the members to cut joint output by 1.2 mmbbl per day effective 1 January 2017, alongside a non-Opec cut of around 0.6 mmbbl per day. The immediate effect of this announcement was an increase in the dated Brent price towards USD 53 per barrel. The futures market for Brent at the Intercontinental Exchange (ICE) was generally in backwardation up until early July when the situation shifted into contango where it remained for the rest for the year. See the section Terms and definitions for further details.throughout 2016.
The priceOver the course of 2016, North American tight oil has provided the largest share of non-Opec declines that offset continued growth in Opec production. While US WTI crude, as quoted atshale production has been in decline over much of the Cushing tank farmpast two years, productivity gains and cost reductions have accelerated, planting the seeds of future growth. Specifically, enhanced completions and extended-reach laterals have allowed producers to do more with less. Nowhere is this more evident than in Oklahoma, averaged USD 93.28/bbl in 2014, down approximately USD 3/bbl from 2013. The pricethe Permian basin of West Texas. As oil prices have increased from USD 95.57/bbl atduring the beginningcourse of the year, the Permian has recorded the largest rebound in drilling rigs. At current levels, the Permian basin is home to USD 103.72/bbl in mid-February. The price fluctuated around USD 100/bbl through May before following the increasing Brent in June when rising sharply to USD 107.53/bbl. From here the pricealmost 50% of WTI fell, and while following the Brent price downwards the decrease was periodically slower, closing the differential between WTI and Brent. The WTI price halted at a temporary floor in mid-August at a level around USD 95/bbl, before breaking through and falling rapidly with the Brent towards year-end. On 31 December the WTI price was at USD 53.05/bbl, with approximately USD 2/bbl differential to Brent
Geopolitically, the unrest in Libya continued to play a part in 2014. Political instability and frequent attacks onall oil installations by local militia led to production outages during the first half of the year. Political tension in the Ukraine in March and April led to an upward pressure on oil prices due to uncertainty. The EU and the US later imposed sanctions on Russia for their invasion of the Ukraine. In mid-June the jihadist rebel group ISIS bombed the Kirkuk-Ceyhan pipeline in Northern Iraq, marking the start of a campaign that would last throughout 2014. This fuelled concerns for supply disruptions from Iraq. As these fears receded the prices fell during late summer.
The growth in shale oil productionrigs in the US, came asup from 30% in early 2013. From a surprise to the market and during the third quarter it became clear that there was a growing supplypricing perspective, declining production, an abundance of oil. The paper market of crude oil saw investors leaving in an attempt to secure profit,infrastructure, and the pressure subsequently transferred to the physical market. Refinery maintenance in most regionslifting of the world coincided incrude export ban have caused most North American grades to price close to their technical refining values, reflective of the ongoing de-bottlenecking of US onshore crude pipeline infrastructure. These narrow differentials relative to global waterborne crudes have caused rail loadings to fall precipitously with all indications being that quarter, reducing demand for crude. The concerns over China’s new policies affecting demand growth materialized. The growth in Europe was still slow and with some countries on the borderline of recession there was not much support for the oil price. Oil producing and exporting countries were lookingthis trend is set to OPEC to intervene and cut their production in order to stabilize the price, but at the meeting in November, OPEC decided to maintain their current production and the prices continued their free fall. OPEC’s decision to let the market set the price of crude oil marked the change of a 30-year old price regime that may lead to higher volatility in crude pricescontinue in the years to come.
The US market was not immune to global oil market dynamics during 2014. Just as Brent crude declined significantly since peaking in June, WTI suffered similar declines. However, due to increased pipeline capacity between Cushing, OK and the US Gulf Coast, Cushing crude stocks declined significantly over 2014, leading to a narrower differential between WTI and Brent. Additional pipeline capacity entering the market in 2014 continued to ease the pipeline logistics constraints between northern US and West Texas producing areas and coastal demand regions. While there were no fundamental change in the US government’s stance regarding crude exports, crude and condensate exports, primarily to Canada, increased to levels not seen since the 1980s. These exports provided a welcome relief for producers seeking access to higher value waterborne crude markets.ahead.
Refinery margins
Refinery margins in Northwest Europe, as calculated against dated Brent2016 was a solid year for European refinery margins. Through 2015, a surplus of crude were rather weak during the first quarter. This was due in partoil had been converted to a mild winter. There was also specific strengthsurplus of products, incentivised by strong margins. By early 2016, diesel stocks were building fast and diesel margins were low. Refineries then shifted to maximise gasoline output, in the Brent market caused by trade in Forties crude,expectation of a component in the Brent, Forties, Oseberg, Ekofisk (BFOE) system that sets dated Brent. Refineries saw better margins from Russian Urals crude. Margins stayed rather weakstrong summer gasoline market. However, summer gasoline demand disappointed, leading to stocks building and sharply falling gasoline margins. Weak product prices through the secondsummer led to constrained refinery throughput and supported demand. By the fourth quarter, due to anthe gasoline market rebalanced and diesel stocks fell
6Statoil, Annual Report on Form 20-F 20142016 9
overflow of diesel imports from Russia and the US Gulf. On the other hand, naphthaagain. This caused refinery margins were quite strong on export opportunities into Asia. In the third quarter, margins improved significantly, mainly driven by gasoline. This wasto improve again in particular caused by a lack of octane components, some of which had been exported separately to China. Also, the physical Brent market started to weaken, and price differentials for other crudes came off vs. Brent. These factors continued into the fourth quarter, resultingquarter. The average margin for an upgraded refinery in margins above normalNorth West Europe was solid and in November. A major reason for this strength was that China ran its vast refining capacity at low utilization rates. They seemed to run only to cover domestic diesel demand, which was stalling. That allowed for exports from Europe for lighter products like gasoline, naphtha and LPG, for which there was demand growth. Europe saw two new refinery closures, one in Italy and one in the UK. European diesel demand was strong, partly due to an upcoming shift from heavy fuel oil to diesel as shipping fuel in the North Sea and Baltics from
1 January 2015. Stationary fuels like heating oil and heavy fuel oil experienced further declines.line with 2014, but well below 2015 margins.
2.1.3 Natural gas prices
Natural gas prices declined throughout 2015 but stabilised in Europe have fallen in 2014 asthe second quarter of 2016. The fourth quarter of 2016 experienced a result of weak demand and a healthy supply picture boosted by increased LNG availability,robust price recovery due to consumption growth in Asia and Europe. Henry Hub experienced its lowest annual price in over a weakened Asian Spot LNG market. In North America prices in 2014 averaged 17% higher than in 2013.decade through 2016.
Gas prices -– Europe
The European natural gas price level was 20% lowerNBP prices fell from an average of USD 7.5/MMBtu in 2014 as prices averaged USD 8.2/mmbtu comparedfirst quarter 2015 to USD 10.3/mmbtu5.4/MMBtu in 2013. Gas consumptionfourth quarter 2015. The decline continued in EU28 declined by 12%. Domestic European production excluding Norway fell from 152 bcmfirst quarter 2016, averaging USD 4.3/MMBtu, before falling to 137 bcm.a decade low of USD 3/MMBtu in August 2016. Since August’s low point, average monthly prices have strengthened, closing 2016 at USD 6.2/MMBtu and resulting in an annual 2016 average of USD 5/MMBtu.
Norwegian pipeline exportsEU gas consumption continued to grow in 2016 as power generation responded to higher priced coal and outages of nuclear reactors in France. Furthermore, heating demand has responded to a more normal European weather pattern. EU indigenous gas production held at a record low of 125 bcm as the Dutch government revised the production limit at the Groningen field down to 24 bcm. European imports from Russia were at 102a record high of 179 bcm roughly the same as last year. Total European LNGand imports (Turkey and Israel excluded)from Norway were with 53 bcm at the same record level as last year's imports. The levelin 2015, 108 bcm. Record levels of re-exports increasedpipeline imports have been encouraged by 63%. Total liquefaction was at 329 bcma small downturn in line the production seen in the past 3 previous years. The demand growth in Asian countries, which only resulted in a marginal increase in import of LNG is no longer strong enoughdeliveries to offset the declining consumption trend in Europe. A possible restart of some Japanese nuclear power plants this year could further weaken Asian demand growth.LNG supplies into North Western Europe have diminished, whilst imports into Southern Europe remain constant.
Further increase in renewable power generation capacity impacted the power markets and gas-to-power demand fell. However, the gas-to-power segment is now close to a floor minimum level.
Gas prices - North America
Supply growth has been a regular feature of the natural gas market in recent years, but in 2014 demand was able to absorb that supply, keeping storage below normal levels. Average cashGas prices were boosted to overvolatile in 2016, falling below USD 4/mmbtu for the first time since 2010.
The race between demand and supply growth favored demand2/MMBtu early in 2014, but shifted toward supply for the remainderyear, before rising above USD 3/MMBtu at the end of the year. Production growthThe Henry Hub average of USD 2.4/MMBtu was the fastestlowest annual price in years,over a decade, down from USD 2.6/MMBtu in 2015 largely as 34 bcm was added ata result of oversupply. US gas producers responded to the wellhead. South Marcellus became the fastest growing supply basin. Cold weather in the first quarter started the year on a bullish note, driving Henry Hubfalling prices above USD 5/mmbtu and lowering inventoriesby withdrawing rigs to the lowest level in decades. Gas production fell throughout the year as a decade. Once the winterresult. Demand for gas was over, supply growth and rebuilding stocks were the main story for 2014.
The trends of 2014 continued into 2015,strong in 2016, with a weak start, with strong supply and inventories close to normal at the start of the year. By 2016 and later this decade a number of factors are expected to be more bullish: LNG export projects are expected to start up,natural gas should make gains at coal's expensereplacing coal in the power sector industrial demand is expectedand LNG exports starting from the Gulf Coast.
Global LNG prices
LNG prices fell throughout 2015 from an average of USD 7.3/MMBtu in first quarter 2015 to riseUSD 4.5/MMBtu in first quarter 2016, but stabilised in second quarter of 2016 at an average of USD 4.9/MMBtu. The second half of 2016 experienced robust price recovery to average USD 8/MMBtu in fourth quarter 2016, largely due to consumption growth in Asia and the supply side will need to turn to incrementally higher cost reserves. North American gas prices are expected to appreciateMiddle East, further intensified by lower-than-expected ramp-up of new LNG facilities as a result, though remaining below Asian and European levels.well as unplanned outages.
2.2 OurStatoil’s corporate strategy
Statoil aimsis an energy company committed to growlong-term value creation in a low carbon future. Statoil creates value by turning natural resources into energy for people and enhanceprogress for society. Statoil will develop and maximise the value throughof its technology-focused upstream strategy, supplemented by selective positions inunique NCS position, its international oil and gas business and its growing new energy business, focusing on safety, cost and carbon efficiency. Statoil is a values-based company where empowered people collaborate to shape the midstream and in low-carbon technologies.future of energy.
Statoil's top priorities remain to conduct safe and reliable operations with zero harm to people and the environment, and to deliver profitable production growth through disciplined investments and prudent financial management with competitive redistribution of capital to shareholders. To succeed going forward we continue to focus strategically on the following:in turning Statoil’s vision into reality, Statoil pursues a strategy to:
· Sustaining leading exploration company performanceDeepen and prolong the NCS position
· Taking out the full value potential of the Norwegian continental shelf (NCS)
·Strengthening our global offshoreGrow material and profitable international positions
· Maximising the value of our onshore positionsProvide energy for a low-carbon future through growth in New Energy Solutions (NES)
· Creating enhanced value from midstream solutions
·Continuing portfolio management to enhance value creation
·Utilising oilFocused and gas expertisevalue-adding mid- and technology to open up new renewable energy opportunities
Statoil, Annual Report on Form 20-F 20147
Sustaining leading exploration company performance
Results from the 2014 exploration programme are a product of our focus on three exploration strategy pillars:
·Early access at scale: We focused on accessing frontier acreage over the last few years and have been an early mover in several areas. In 2014, we accessed significant acreage positions in Algeria, Australia, Colombia, New Zealand and Norway; access to new acreage in Myanmar and New Zealand are pending final approval from the respective host governments.
·Deepen core positions: We secured more acreage in potential clusters such as Brazil, the US Gulf of Mexico, and the UK continental shelf, where Statoil was awarded 12 licences. On the NCS, we continue to deepen our position by acreage Award in the Predefined Areas (APA) and to test new opportunities and maintain high focus on growth and infrastructure lead exploration (ILX) wells with significant potential.
·Drill significant targets: We continued to focus on drilling large targets, leading to the Piri-1 discovery, the fifth high-impact discovery and seventh overall in Tanzania’s Block 2.
The exploration collaboration with Rosneft in Russia has continued. Sanctions have affected the progress of our projects, however we are in continuous dialogue with authorities to ensure that we remain sanctions compliant. See section Risk review – Risk factors – Risk related to our business for further details.
To sustain leading exploration performance long-term, we aim to deepen positions in prolific basins, actively pursue play-opening opportunities, and balance a continued high activity level with selective access and focus on efficiency and capital discipline.
Taking out the full value potential of the Norwegian continental shelf (NCS)
The NCS remains a prolific and productive oil and gas province where only half of the resources have been produced.
In 2014 Statoil began production from the Gudrun field and three fast track projects (Svalin, Fram H-Nord and Vilje Sør). Valemon came on stream in the North Sea on 3 January 2015. We submitted the Plan for Development and Operations (PDO) of the Gullfaks Rimfaksdalen project in December 2014 and of the Johan Sverdrup project in February 2015. Over the next ten years, Statoil aims to bring on stream new production from a combination of:
·Developments of larger discoveries, including the Aasta Hansteen, Gina Krog, Gullfaks Rimfaksdalen, Johan Castberg and Johan Sverdrup projects, which are expected to contribute considerably to Statoil's future production.
·Developments of a number of smaller discoveries close to established infrastructure.
·Development of high value oil recovery (IOR) projects, delivering towards Statoil’s ambition of 60% average oil recovery on Statoil-operated NCS oil fields.downstream
In addition, Statoil will research, develop, and deploy technology to IOR, improving operational performancecreate opportunities and continued high production efficiency are measures to increaseenhance the value potential of Statoil’s operatedcurrent and future assets.
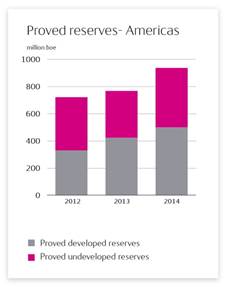
Strengthening our global offshore positionsDeepen and prolong the NCS position
Statoil's internationalFor more than 40 years, Statoil has explored, developed and produced oil and gas from the NCS. Statoil aims to deepen and prolong its position by accessing and maturing opportunities into valuable production. At the same time, Statoil plans to improve the reliability, efficiency and lifespan of fields already in production. The NCS represents approximately two thirds of Statoil’s equity production has increased from around 100,000 boe to around 740,000 boeat 1,235 mboe per day since the year 2000. Statoil has established a presence in a number of countries and built a strong portfolio of assets outside Norway. To further enhance the materiality of our international portfolio, we are focusing on potential offshore clusters. Clusters are areas that make a material contribution to total production and value creation, where Statoil holds operatorships and has a mix of assets in different stages of development, and where we possess considerable expertise, both below and above ground. Through the cluster focus, our goal is to achieve greater economies of scale, capture synergies and thereby increase profitability.
Our potential clusters are located in some of the most attractive basins in the industry, including:
·Brazil; where Peregrino is already operational. In the future, we will focus on further developing the Peregrino area and maturing our exploration portfolio. The PDO for the Peregrino Phase II project was submitted to Brazilian authorities in January 2015.
·Angola; where exploration potential remains and where we already have non-operated production. Statoil has taken a time-out in the Kwanza exploration drilling programme, as a consequence a rig contract was cancelled. Regarding non-operated production, the CLOV project (Block 17) was commissioned.
·Tanzania; which emerged as a new potential cluster in 2012, and where we made two additional discoveries in 2014. Planning of an LNG plant is being progressed with our partners.
·East Coast Canada; emerged as a new potential cluster in 2013 with two discoveries including the significant discovery Bay du Nord; further prospects will be tested in the Flemish Pass and adjacent areas. Statoil already has non-operated production in East Coast Canada.
·US Gulf of Mexico; where exploration potential remains and where we already have non-operated production. Investment decision was taken for the Stampede project located in the “Grand Canyon” region while oil and natural gas production started from the partner-operated Jack/St-Malo project.
Maximising the value of our onshore positions
Our onshore positions are dominated by our diverse unconventional resources portfolio in North America. It includes operated and non-operated leases in the shale gas and tight oil basins of Marcellus, Eagle Ford and Bakken in the US. In addition, we became the 100% owner and operator for two Kai Kos Dehseh (KKD) lease areas, Leismer and Corner, in the Athabasca region in Alberta, Canada after agreeing to swap oil sands assets with PTTEP in 2014. We postponed making an investment decision on the Corner expansion project.
2016.
810 Statoil, Annual Report on Form 20-F 20142016
Our priorities·Exploration: Statoil continues to be a committed NCS explorer across mature, growth and frontier areas. In 2016, Statoil participated in 14 exploration wells on the unconventional resources space include:NCS, resulting in 11 discoveries. Statoil was awarded 29 licenses in mature areas in Norway’s Awards for Predefined Areas (APA) 2016 round (result announced January 2017), 16 as operator and 13 as non-operating partner, and five licenses in frontier areas in Norway’s 23rd concession round, four as operator and one as partner
· Delivering a safeDevelopment: The Johan Sverdrup Phase 1 project is progressing in line with schedule. Production drilling started in the first quarter of 2016. Pre-sanction for Johan Sverdrup Phase 2 is scheduled for the first quarter of 2017. Statoil increased its equity interest in the UK part of the Utgard license and profitable production ramp-upsubmitted the Utgard Plan for Development and Operation (PDO) in the second quarter of 2016. The PDOs for Byrding and Trestakk were delivered and the PDO for Oseberg Vestflanken 2 was approved during 2016
· Taking careProduction: Gullfaks Rimfaksdalen came on-stream. Production started at Fram C, tied into existing infrastructure in the Fram and Troll area
Statoil has completed two share transactions resulting in a 20.1 per cent equity ownership in Lundin Petroleum AB. Lundin is our partner in several fields, including a 22.6% interest in the unitised Johan Sverdrup field development. Statoil also acquired 25% of Byrding.
By the communities we are entrustedend of 2016, Statoil had achieved CO2 emission reductions in excess of 1 million tonnes per year compared to a 2008 baseline on the NCS, primarily through better energy management and improved energy efficiency. Our 2020 target is to deliver 1.2 million tonnes of CO2 emission reductions compared to 2008. In August 2016, the Norwegian petroleum industry announced its ambition to implement CO2 reduction measures corresponding to 2.5 million tonnes on the NCS by 2030 compared to 2020. Statoil’s commitment is to deliver 2.0 million tonnes of this CO2 reduction target.
Grow material and profitable international positions
International oil and gas production represented approximately one third of Statoil’s equity production at 744 mboe per day in 2016. Statoil will continue to explore, develop, and produce oil and gas opportunities outside Norway to enhance Statoil’s upstream portfolio.
·Exploration: Statoil continues to explore internationally for oil and gas. Statoil participated in nine exploration wells internationally, of which three were discoveries, including the Baccalieu discovery in Canada. Statoil added exploration acreage in Brazil, Canada, New Zealand, Russia, the UK and the US Gulf of Mexico, accessed exploration acreage in Ireland and Turkey and entered two new countries, Mexico and Uruguay. A joint venture comprising Statoil, BP and Total was awarded Blocks 1 and 3 in the Saline Basin in Mexico, with Statoil as the operator.
·Development: Statoil strengthened its strategic partnership with Petrobras in Brazil. Construction progress continued as planned on Peregrino Phase II
· Leveraging rapid applicationProduction: Heidelberg and Julia production came on-stream in the US Gulf of Mexico and, along with operator BP and other partners, significant advances have been made towards the award of a licence extension for Azeri-Chirag Guneshli (ACG) in Azerbaijan. The In Salah southern fields in Algeria and the Corrib field in Ireland both had major ramp-ups in 2016
In Brazil, Statoil acquired a 66% interest in and became the operator license of BM-S-8, which contains a substantial part of the Carcará field. Operatorship was assumed and appraisal activities began on BM-C-33. In the US, Statoil increased its stake in the Eagle Ford field and assumed full operatorship. Statoil continued to focus its portfolio with a partial divestment of non-core Marcellus acreage and agreeing the sale of its oil sands business in Canada.
Provide energy for a low-carbon future
Statoil recognises that opportunities are increasingly available in producing low carbon energy.
In 2016 Statoil launched Statoil Energy Ventures, a USD 200 million venture capital fund dedicated to investing in attractive and ambitious growth companies in renewable energy. This fund made its first investments in United Wind Inc. and later in ChargePoint Inc., Convergent Energy and Power Inc. and Oxford Photovoltaics Ltd., and is continuing to evaluate market opportunities. Statoil has also continued to explore new technologybusiness opportunities in carbon capture and storage as well as other potential new energy markets.
·Development: The 402 MW Dudgeon Offshore Wind Park development started installation in the first quarter of 2016 and is expected to maximisebe fully commissioned by the fourth quarter of 2017
·Production: In 2016, Statoil signed a letter of intent to become operator of the Sheringham Shoal Offshore Wind Farm in January 2017; it currently produces from an installed capacity of 317 MW. Statoil has a 40% ownership stake of the Scira consortium which produces electricity from the Sheringham Shoal wind park
Statoil partnered with E.ON to develop the 385 MW Arkona wind farm offshore Germany, with start-up planned for 2019. In the US, Statoil was declared the provisional winner of the US government’s wind lease sale offshore New York, with a potential generation capacity of more than 1.8 GW.
Statoil will also start production from the world's first floating windfarm, Hywind Scotland, in the fourth quarter of 2017. Statoil's partner in the 30 MW project is Masdar, which acquired 25% of the project in January 2017. The project will also include an innovative battery storage solution, Batwind, which represents the company's first wind development with integrated energy storage.
Statoil, Annual Report on Form 20-F 201611
Statoil has delivered a feasibility study to the Norwegian government for part of a Norwegian carbon capture and storage (CCS) value chain. The scope has been to find commercial methods to inject CO2 volumes arriving via ship into an underground reservoir on the NCS. Statoil’s long experience with CO2 storage from Sleipner and Snøhvit has been valuable, finding commercial and technical means to store large volumes of third party CO2 in order to accommodate the world’s need for CCS solutions.
Focused and value-adding mid- and downstream
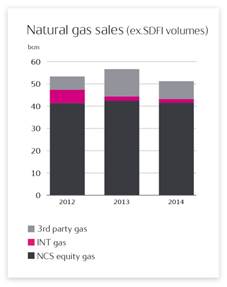
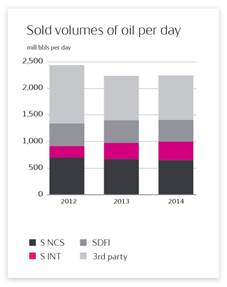
The prime objective for Statoil’s mid- and downstream activities is to process and transport its oil and gas production (including the Norwegian State’s petroleum) competitively to premium markets, securing maximum value realisation. The main focus is on:
·Safe and efficient operations
·Continuous improvement in operational regularity, HSE and costs
·Flow assurance and marketing of Statoil’s equity production (crude oil, natural gas, related products) and the State’s Direct Financial Interest (SDFI) volumes for maximum value creation
· High grading acreage holdingsUtilisation of the Asset Backed Trading model across commodities to strengthen current upstream positionscapture margin opportunities
· Demonstrating operational excellence and world class stakeholder managementMaintaining Statoil’s position as a leading European gas supplier
· Striving for seamless value chain integration and superior price realisationA capital lean asset structure
Creating enhanced value from midstream solutions
The dynamics of the gas markets in Europe are changing. There is a development towards a more liberalised market with new players and increased competition. Our European gas reserves are located close to the European markets, we have flexible production capabilities and transportation systems, and our commercial experience in gas sales and trading has a proved track record. This puts us in a unique position to take advantage of the evolving European gas markets.
·In the short-term, we are making considerable efforts to maximiseStrategic focus is directed at optimising the value of ourStatoil’s flexible Norwegian gas in this market.
·In the medium to long-term, we will continue to promote gas as an important part of meeting European objectives for energy securityproduction assets that supply Europe and emission reductions. We strongly believe that natural gas is the most cost-effective bridge to a low-carbon economy.
Beyond Europe, our plannedat Statoil’s midstream gas and liquids activities in North America, are progressing in step with the building of our upstream unconventional resources business. These activities encompass a mix of capacity commitments, ownership and/or operation of gathering, transportation and storage facilities,where Statoil’s onshore portfolio is developing. Statoil achieved strong marketing alliances and trading operations. They are considered important to meet our goals for flow assurance and margin capture.
Continuing portfolio management to enhance value creation
By being proactive, we intend to further enhance our portfolio in the years ahead, so that it will ultimately be more valuable, more robust and more sustainable towards 2050. The strategic focus in these endeavours will be to provide financial flexibility, access exploration acreage and unconventional resources, secure operatorships, build cluster positions, manage asset maturity, de-risk positions and demonstrate the intrinsic value of the portfolio.
Announced transactions in 2014 include the sale of interests in licences on the NCS to Wintershall, farming down a portion of our non-operated US southern Marcellus acreage to Southwestern, sale of a 10% interest in the Shah Deniz project and the South Caucasus Pipeline to BP and SOCAR and sale of the remaining interests in the Shah Deniz field and South Caucasus Pipeline to PETRONAS. These transactions further underpin our ability to release capital for profitable redeployment.
Utilising oil and gas expertise and technology to open new renewable energy opportunities
Growing demand for clean energy is creating new renewable and low-carbon technology business opportunities. Our core capabilities and expertise put us in a position to seize these opportunities in two specific areas: offshore wind and carbon value chains.
In 2014, we sanctioned the Dudgeon Offshore Windfarm off the coast of Norfolk, UK. In addition, we continued developing the proprietary Hywind floating offshore wind concept. Our ambition is to play an active role in reducing costs and making offshore wind profitable, ultimately without government subsidies or support.results across all commodities.
Developing competences within carbonResearch, development, and deployment of technology to unlock opportunities and enhance value chains represents a key opportunity for reducing carbon emissions and building new business models in the transition to a low carbon world. Statoil continues to build competence and experience in carbon capture, transportation, storage and utilisation by our engagements in the world-class Technology Centre Mongstad CO2 test site.
2.3 Our technology
We continuously develop and deploy innovative technologies to ensure safe and efficient operations and to deliver on our strategic objectives.
We believeStatoil believes that technology is a critical success factor in the business environment where we operate. In addition to requiring capital efficiency, this environment is characterised by a broad and complex opportunity set, stricter demands on our licence to operate and tougher competition. In this context, technology is increasingly important for resource access and value creation. OurStatoil’s technology development activities aim to increase access to new oil and gas resources at competitive cost, reduce field development, drilling and operating costs.
We utilise a range of tools forcosts, and CO2 and other greenhouse gas emissions. Statoil’s technology efforts focus on the development of new technologies where choice of tool is dependent on strategic importance of technology for us and our position related to Intellectual property. Our toolbox includes:
·In-house research and development (R&D)following priority areas:
· Collaborative development projects with our major suppliers
·Project related development as part of our field development activities
·Direct investment in technology start-up companies through our Statoil technology invest venture activities
·Invitation to open innovation challenges as part of Statoil Innovate
Statoil, Annual Report on Form 20-F 20149
Our track record demonstrates our ability to overcome significant technical challenges through the development and deployment of innovative technologies. Our technology strategy, "Putting technology to work", supports our business strategy and strengthens our position as a technology-driven upstream company. It is based on three main principles:
·Prioritising business-critical technologies
·Strengthening our licence to operate
·Expanding our capabilities
Prioritising business-critical technologiesBusiness-critical technologies: - in order to deliver on our strategic objectives we have increased our focus on upstreamUpstream technologies are prioritised, primarily in the areas of Exploration, Reservoir, and Drilling and Well.Well, and Subsea Production Systems. Statoil’s main focus has been on cost reduction, for example Statoil’s simplified subsea production concept Cap-XTM has been developed to enable possible future development projects in the Barents Sea
·Strengthening ourStatoil’s licence to operateoperate: -Statoil has strengthened its commitment to sustainability. For the oil & gas and new energy value chains, technology development is concentrated on increased energy efficiency for power generation and reduced CO2 emissions. For renewables, technological improvements to reduce cost in the areas of construction and maintenance for both fixed and floating offshore wind applications is a priority
·Expanding Statoil’s capabilities: Statoil continues its broader research efforts for both the oil and gas value chain and new value chains. Work is conducted both in-house and in collaboration with academia, research institutes and suppliers and through venture activities
·Capturing the value of digitalisation: Statoil is exploring the opportunities of digitalisation in the energy industry. In 2016, the focus has been determining the optimal approach to accelerate digitalisation to capture a greater value potential
At the capital markets update (CMU) on 7 February 2017, Statoil shared its sharpened strategy to respond to the changing business context. Geopolitical shifts, challenges in accessing new oil and gas resources, changing market dynamics, digitalisation and a global transition towards a low carbon economy are increasing uncertainty and volatility. This change in outlook drives the need to build a more resilient, diverse and option-rich portfolio, delivered by an agile organisation that embraces change and empowers its people. To deliver on the sharpened strategy and fulfill the strategic intent of “high value, low carbon”, Statoil will continue to build opportunities to optimise its portfolio around the following pillars:
·Norwegian continental shelf – Build on unique position to maximise and develop long-term value
·International Oil & Gas – Focus geographically to deepen core areas and develop growth options
·New Energy Solutions – Create a new material industrial position
·Midstream and Marketing – Secure market access and grow value creation through cycles
The following strategic principles guide Statoil in shaping a robust, balanced and distinct portfolio:
12Statoil, Annual Report on Form 20-F 2016
1.Cash generation capacity
Generating positive cash flows from operations, even at low oil and gas prices, in order to maintain our licencesustain dividend and investment capacity through the cycle.
2.Capex flexibility
Having sufficient flexibility in organic capital expenditure to operate we continuously focus on technologies for safe, reliablebe able to respond to market downturns and efficient operations. As part of our focus on sustainability issues we are committed to developing and implementing energy-efficient and environmentally sustainable solutions.avoid value destructive decisions.
3.Capture value from cycles
Expanding our capabilities - success in a highly competitive environment requiresEnsuring the ability and capacity to build on ouract counter-cyclically to capture value through the cycles.
4.Low-carbon advantage
Maintaining competitive advantages, stimulate innovationadvantage as a leading company in carbon efficient oil and takegas production, while building a long-term view on selected potentially high-impact technology ventures. Of particular importance is our collaborative way of working with partners and suppliers on a global basis.low carbon business to capture new opportunities in the energy transition.
In 2014 we qualified a record number of new technologies for internal use and implementation on our operating assets. In addition we met our target for implementation of proved technologies with high value creation impact across multiple assets.
2.4 Group outlook
OurStatoil’s plans address the current environment while continuing to invest in high-quality projects. We reinforce ourStatoil continues to reiterate its efforts and commitment to deliver on ourits priorities of high value growth,creation, increased efficiency and competitive shareholder return.
· Organic capital expenditures for 20152017 (i.e. excluding acquisitions, capital leases and other investments with significant different cash flow pattern), are estimated at around USD 1811 billion compared to USD 19.6 billion in 2014.
· Statoil willintends to continue to mature theits large portfolio of exploration assets and estimates a total exploration activity level atof around USD 3.21.5 billion for 2015,2017, excluding signature bonuses.bonuses
· Statoil expects to deliver achieve an additional USD 1 billion in efficiency improvements with pre-tax cash flow effects in 2017 for a total of around USD 1.74.2 billion from 2016.
· OurStatoil’s ambition is to maintain ROACE (Return on Average Capital Employed) at 2013 level adjusted for price and currency level, and to keep our the unit of production cost in the top quartile of ourits peer group.group
· For the period 2014 - 2016 – 2020, organic production growth is expected to come from new projects resulting in around 2%3% CAGR (Compound Annual Growth Rate) from a 2014 level rebased for divestments.
· The equity production development for 20152017 is estimated to be around 2% CAGR from a 20144-5% above the 2016 level rebased for divestments.
· Scheduled maintenanceactivity is estimated to reduce quarterly production by approximately 10 mboe per day in the first quarter of 2017. In total, maintenance is estimated to reduce equity production by around 4530 mboe per day for the full fiscal year 2015, of2017, which is lower than the majority is liquids.2016 impact
· Indicative PSA (Production Sharing Agreement) effecteffects from Production sharing agreements (PSA-effect) and US royalties are estimated to be around 160150 mboe per day in 20152017 based on an oil price of USD 6040 per barrel and 190165 mboe per day based on an oil price of USD 10070 per barrel.barrel
· Deferral of gas production to create future value, gas off-take, timing of new capacity coming on stream and operational regularity represent the most significant risks related to the foregoing production guidance.guidance
These forward-looking statements reflect current views about future events and are, by their nature, subject to significant risks and uncertainties because they relate to events and depend on circumstances that will occur in the future. See theFor further information, see section 5.7 Forward-Looking Statements for more information. Statements.
10Statoil, Annual Report on Form 20-F 20142016 13
3Business overview2.2 BUSINESS OVERVIEW
3.1 Our historyHistory
O
n 18 September 1972, Statoil was formed in 1972 by a decision of the Norwegian parliament and listed on the stock exchanges in Oslo and New York in 2001.
Statoil was incorporated as a limited liability company under the name Den norske stats oljeselskap AS on 18 September 1972. AsAS. Being a company wholly owned 100% by the Norwegian State, Statoil's initial role was to be the government's commercial instrument in the development of the oil and gas industry in Norway.
In 2001, the company became a public limited company listed on the Oslo and New York stock exchanges, and it changed its name to Statoil ASA.
Statoil has grown Growing in parallel with the Norwegian oil and gas industry, which dates back to the late 1960s. Initially, ourStatoil’s operations werehave primarily been focused on exploration, development and production of oil and gas on the Norwegian continental shelf (NCS), as a partner..
InDuring the 1970s,1980s, Statoil commenced its own operations, made important discoveries and began oil refining operations, which have been of great importance togrew substantially through the further development of the NCS.
Statoil grew substantially in the 1980s through the development of large fields on the NCS (Statfjord, Gullfaks, Oseberg, Troll and others). Statoil also became a major player in the European gas market by securingentering into large sales contracts for the development and operation of gas transport systems and terminals. During the same decade, we wereStatoil was involved in manufacturing and marketing in Scandinavia and established a comprehensive network of service stations. This line of business was fully divested in 2012.
In 2001, Statoil was listed on the Oslo and New York stock exchanges and became a public limited company under the name Statoil ASA, 67% majority owned by the Norwegian State. Since 2000, our business has grown as a result ofthen, substantial investments both on the NCS and internationally. Our ability to fully realise the potential of the
NCS was strengthened through theinternationally, have grown our business. The merger with Hydro's oil and gas division on 1 October 2007.
In recent years, we have utilised our2007 further strengthened Statoil’s ability to fully realise the potential of the NCS. Enhanced utilisation of expertise to design and manage operations in various environments in order to growhave expanded our upstream activities outside our traditional area of offshore production. This includes the development of heavy oil and shale gas projects.
In 2010, we carried out an initial public offering of Statoil Fuel & Retail ASA on the Oslo stock exchange (Oslo Børs), partially divesting projects and reducing our interest in the business relating to service stations. In 2012, all of the remaining shares in Statoil Fuel & Retail ASA were divested.
Statoil is also participating in projects that focus on other forms of energy, such as offshore wind and carbon capture and storage, in anticipation of the need to expand energy production, strengthen energy security and combat adverse climate change.storage.
3.2 Our businessActivities
Statoil is a technology-drivenan international energy company primarily engaged in oil and gas exploration and production activities.
Statoil ASA is a public limited liability companyactivities, organised under the laws of Norway and subject to the provisions of the Norwegian Public Limited Liability Companies Act. The Norwegian State is the largest shareholder in Statoil ASA, with a direct ownership interest of 67%.
Statoil's head office is located in Stavanger, Norway. We have business operations in more than 30 countries and have more than 22,500 employees worldwide.
Statoil isIn addition to being the leading operator on the Norwegian continental shelf (NCS), Statoil has also substantial international activities and is also expanding its international activities. Statoil is present in several of the most important oil and gas provinces in the world. In 2014, 39% of Statoil's equity production came from internationalOur activities span operations in more than 30 countries and the company also holds operatorships internationally.employs approximately 20,500 employees worldwide.
Our access to crude oil in the form of equity, governmental and third party volumes makes Statoil a large netseller of crude oil, seller, and Statoil is the second-largest supplier of natural gas to the European market. Processing and refining are also part of our operations. Statoil is also participating in projects that focus on other forms of energy, such as offshore wind and carbon capture and storage, in anticipation of the need to expand energy production, strengthen energy security and combat adverse climate change.
Statoil's business addressStatoil’s registered office is at Forusbeen 50, N-403535, 4035 Stavanger, Norway. ItsNorway and the telephone number of its registered office is +47 51 99 00 00.
Statoil, Annual Report on Form 20-F 201411
3.3 Our competitive position
There is intense competition in the oil and gas industry for customers, production licences, operatorships, capital and experienced human resources.
Statoil competes with large integrated oil and gas companies, as well as with independent and state-owned companies, for the acquisition of assets and licences for the exploration, development and production of oil and gas, and for the refining, marketing and trading of crude oil, natural gas and related products. Key factors affecting competition in the oil and gas industry are oil and gas supply and demand, exploration and production costs, global production levels, alternative fuels, and environmental and governmental regulations. When acquiring assets and licences for exploration, development and production and in refining, marketing and trading of crude oil, natural gas and related products, Statoil competes with other integrated oil and gas companies.
Statoil's ability to remain competitive will depend, among other things, on the company's management continuing tocontinuous focus on reducing unit costs and improving efficiency, and maintainingefficiency. It will also depend on technological innovation to maintain long-term growth in reserves and production through continuing technological innovation. It will also depend on ourand the ability to seize international opportunities in areas where our competitors may also be actively pursuing exploration and development opportunities. We believe that we are in a position to compete effectively in each of our business segments.new areas.
The information about Statoil's competitive position in the business overview and strategy, and operational review sections,strategic report is based on a number of sources. They includesources; e.g. investment analyst reports, independent market studies, and our internal assessments of our market share based on publicly available information about the financial results and performance of market players.
We have endeavoured to be accurate in our presentation of information based on other sources, but have not independently verified such information.
Improvement programmes
Statoil’s ambition to reduce cost and improve efficiency was presented at the capital markets update (CMU) on 7 February 2014, targeting annual savings of USD 1.3 billion annual per year from 2016. At the CMU on 6 February 2015, we announced that we will step up our efficiency programme by 30% with a target to realise USD 1.7 billion in annual savings from 2016.
Improvement programmes are Statoil’s response to the industrial challenge that has emerged over the recent years characterised by escalating costreducing prices for our products and declining returns. More specifically, the ambition is to realise positive production effects and capex and operating cost savings to improve financial results and cash-flows. For 2017 Statoil targets additional annual efficiency improvements of USD 1 billion on top of the already achieved USD 3.2 billon.
3.4 Corporate structure
14Statoil, Annual Report on Form 20-F 2016
CORPORATE STRUCTURE
Business areas
Statoil's operations are managed through the following business areas:
Development and Production Norway (DPN)
DPN comprises ourmanages Statoil’s upstream activities on the Norwegian continental shelf (NCS). DPN aims and explores for and extracts crude oil, natural gas and natural gas liquids. The business area’s ambition is to continue itsStatoil’s leading roleposition on the NCS and ensure maximum value creation on the NCS. Through excellentthrough continuously improved HSE and improved operational performance and cost, DPN strives to maintain and strengthen Statoil's position as a world- leading operator of producing offshore fields. DPN seeks to open new acreage and to mature improved oil recovery and exploration prospects. New and existing fields are primarily developed using an industrial approach, in which speed of delivery and cost improvements through standardisation and repeated use of proved solutions are key elements.performance.
Development and Production International (DPI)
DPI comprises ourmanages Statoil’s worldwide upstream activities that are not included in the DPN and Development and Production North America (DPNA)USA (DPUSA) business areas. It explores for and extracts crude oil, natural gas and natural gas liquids. DPI's ambition is to build a large and profitable international production portfolio comprising activities ranging from accessing new opportunities to delivering on existing projects and managing a production portfolio. DPI endeavours to ensure the delivery of profitable projects in a range of complex technical and stakeholder environments, and it manages a broad non-operated production portfolio that will be complemented with operated positions.environments.
Development and Production North America (DPNA)United States (DPUSA)
DPNA comprises ourDPUSA manages Statoil’s upstream activities in North America. DPNA'sthe USA and Mexico. DPUSA's ambition is to develop a material and profitable position in North America,the US and Mexico, including the deepwaterdeep water regions of the Gulf of Mexico unconventional oil and gas, and oil sands in the US and Canada. In this connection, we aim to further strengthen our capabilities in deepwater and unconventional oil and gas operations.in the US.
Marketing, Midstream and Processing and Renewable Energy (MPR)(MMP)
MPR comprises ourMMP manages Statoil’s marketing and trading ofactivities related to oil products and natural gas, transportation, processing and manufacturing, and the development of oil and gas value chains, and renewable energy. MPR's ambition isgas. MMP seeks to maximise value creation in Statoil's midstream marketing and renewable energymarketing business.
Technology, Projects and Drilling (TPD)
TPD's ambitionTPD is accountable for the global project portfolio, well deliveries, new technologies and sourcing across Statoil. TPD seeks to provide safe and secure, efficient and cost-competitive global well and project delivery, technological excellence, and research and development. Cost-competitive procurement is an important contributory factor although group-wide procurement services are also expected to help to drive down costs in the group. for maximising value for Statoil.
12Statoil, Annual Report on Form 20-F 2014
Exploration (EXP)
EXP's ambition is to positionEXP manages Statoil’s worldwide exploration activities with the aim of positioning Statoil as one of the leading global exploration companies. Thiscompanies and this is achieved through accessing high potential new acreage in priority basins, globally prioritising and drilling more significant wells in growth and frontier basins, delivering near-field exploration on the NCS and other select areas, and achieving step-change improvements in performance.
New Energy Solutions (NES)
NES reflects Statoil’s long-term goal to complement our oil and gas portfolio with profitable renewable energy and other low-carbon energy solutions. NES is responsible for wind farms, carbon capture and storage as well as other renewable energy and low-carbon energy solutions.
Global Strategy and Business Development (GSB)
GSB sets the corporate strategy, business development and merger and acquisition (M&A) activities for Statoil. The ambition of the GSB business area is to closely link corporate strategy, business development and M&Amerger and acquisition activities to actively drive Statoil's corporate development.
Reporting segments
Statoil reports its business in the following reporting segments:
·DPN reporting segment - Development and Production Norway (DPN);– the DPN business area
·DPI reporting segment - Development and Production International,
(DPI), which combines the DPI and DPNAthe DPUSA business areas;areas
·MMP reporting segment - Marketing, Midstream and Processing and Renewable Energy (MPR); and Other.– the MMP business area
The ·Other reporting segment– which includes activities in Technology, Projects and Drilling (TPD), Global Strategy and Business Development (GSB)NES, TPD, GSB and Corporate staffs and support functions. functions
Activities relating to the Exploration (EXP)EXP business area are fully allocated to - and presented in - the respectiverelevant development and production segments.
On 19 June 2012, Statoil ASA sold its 54% shareholdingreporting segment. Activities relating to the TPD and GSB business areas are partly allocated to - and presented in Statoil Fuel & Retail ASA (SFR). Up until this transaction SFR was fully consolidated in- the Statoil group with a 46% non-controlling interestrelevant development and reported as a separateproduction reporting segment (FR). The FR segment marketed fuel and related products principally to retail consumers. Following the sale of Statoil Fuel & Retail ASA (SFR), the FR segment ceased to exist.
segments.
Presentation
In the following sections in the report, the operations of eachare reported according to the reporting segment are presented.segment. Underlying activities or business clusters are presented according to how the reporting segment organises its operations. The Exploration business area's activities, which include group discoveries and
Statoil, Annual Report on Form 20-F 201615
See note 3 Segments to the appraisal of new exploration resources, are presented as part of the various development and production reporting segments (Development and Production Norway, and Development and Production International).Consolidated financial statements for further details.
As required by the SEC, Statoil prepares its disclosures about oil and gas reserves and certain other supplementary oil and gas disclosures based on geographicalgeographic areas. TheStatoil’s geographical areas are defined by country and continent. Theycontinent and consist of Norway, Eurasia excluding Norway, Africa, and the Americas.
Statoil, Annual Report on Form 20-F 201413
3.5 Development and Production Norway (DPN)
3.5.1 DPN overview
SEGMENT REPORTING
DevelopmentInternal transactions in oil and Production Norway (DPN) consists ofgas volumes occur between our exploration, field development and operational activities on the Norwegian continental shelf (NCS).
In 2014 we had Statoil-operated assetsreporting segments before being sold in the North Sea,market. The pricing policy for internal transfers is based on estimated market prices. See Production volumes and prices in section 2.8 Operating and financial performance for further information.
We eliminate intercompany sales when combining the Norwegian Sea and the Barents Sea, and we also operate a significant numberresults of exploration licences.
Statoil's equity and entitlement production on the NCS was 1,184 mboe per dayreporting segments. Intercompany sales include transactions recorded in 2014. That was about 68% of Statoil's total entitlement production and 61% of Statoil's equity production. In 2014,connection with our daily production of oil and natural gas liquids (NGL) onproduction in the NCS was 588 mboe,DPN or the DPI business areas and also in connection with the sale, transportation or refining of our average dailyoil and natural gas production onin the NCS was 95 mmcm (3.3 bcf). Acting as operator, StatoilMMP business area. Certain types of transportation costs are reported in both the MMP and the DPUSA business areas.
The DPN business area produces oil and natural gas which is responsible for approximately 70%sold internally to the MMP business area. A large share of allthe oil produced by the DPI and DPUSA business areas is also sold through the MMP business area. The remaining oil and gas production onfrom the NCS.DPI and the DPUSA business areas is sold directly in the market. For intercompany sales and purchases, Statoil has established a market-based transfer pricing methodology for the oil and natural gas that meets the requirements as to applicable laws and regulations.

| DPN has organised the production operations into four business clusters: Operations North (Barents Sea) located in Harstad, Operations Mid-Norway (Norwegian Sea) located in Stjørdal near Trondheim, Operations West (North Sea) located in Bergen and Operation South (North Sea) located in Stavanger. Partner-operated fields cover the entire NCS and are internally included in the Operations South business cluster.
On 1 July 2014, DPN merged the former business clusters: Operations North Sea West and Operations North Sea East into Operations West.
When possible, the fields in each cluster use common infrastructure, such as production installations and oil and gas transport facilities. This reduces the investments required to develop new fields. Our efforts in these core areas will also focus on finding and developing smaller fields through the use of existing infrastructure and on increasing production by improving the recovery factor.
We are working to extend production from our existing fields through improved reservoir management and the application of new technology.
Statoil takes an active approach to portfolio management on the NCS. By continuously managing our portfolio, we create value by optimising our positions in core areas and new growth areas in accordance with our strategies and targets.
|
14Statoil, Annual Report on Form 20-F 2014
Key eventsIn 2016, the average transfer price for natural gas was USD 3.42 per mmbtu. The average transfer price was USD 5.17 per mmbtu in 2015 and portfolio developmentsUSD 6.55 in 2014:
·Statoil was awarded interests in 11 production licences in2014. For oil sold from DPN to MMP, the Awards in Predefined Areas 2014 (APA 2014) ontransfer price is the NCS and will be the operator in seven of the licences.
·In April 2014, Statoil announced the start-up of production at the Gudrun oil and gas field in the North Sea.
·Statoil announced production start-up on fast track projects Svalin M in March and Svalin C in September, Vilje Sør in April and Fram H Nord in September 2014.
·17 turnarounds were carried out according to plan during 2014.
·Huldra production was permanently shut down 3 September. The field will be fully decommissioned prior to 2021.
·In November 2014, Statoil, together with the licence partners, decided to adjust the project plan of the Snorre 2040- project by delaying the planned date for the decision making point DG2 from March 2015 to October 2015.
·Plan for Development and Operations (PDO) for the Gullfaks Rimfaksdalen Fast track project was submitted to the Ministry of Petroleum and Energy (MPE) on 16 December 2014.
·An extensive exploration drilling program in 2014 resulted in 29 completed wells, of which 20 Statoil acted as operator with 14 discoveries.
·The Johan Sverdrup partners have agreed to recommend Statoil as operator for all phases of the field. The PDO for phase 1 of the project was submitted to the MPE in February 2015.
·The 2014 sales transaction with Wintershall for farm down in Aasta Hansteen, Asterix and Polarled and the sale of the non-core Vega and Gjøapplicable market-reflective price minus a fields on NCS was closed in December. Through this transaction Statoil was able to monetise a portion of its investment in the Aasta Hansteen field development project, while retaining the operatorship and a 51% equity share.cost recovery rate.
The profitability of our industry continues to be challenged. Statoil’s response to the industrial challenge characterised by escalating cost and declining returns is addressed in the section Strategy and market overview.
3.5.2 Fields in production on the NCS
In 2014, our total production of entitlement liquids and gas was 1,184 mboe per day, compared to 1,217 mboe per day in 2013.
The following table shows DPN's average daily entitlement production of oil, including NGL and condensates, and natural gascertain financial information for the four reporting segments, including intercompany eliminations for each of the years in the three-year period ending 31 December 2014, 2013 and 2012. Field areas are groups of fields operated as a single entity.
| For the year ended December 31, |
| 2014 | | 2013 | | 2012 |
| Oil and NGL | Natural gas | | | Oil and NGL | Natural gas | | | Oil and NGL | Natural gas | |
Area production | mbbl | mmcm | mboe/day | | mbbl | mmcm | mboe/day | | mbbl | mmcm | mboe/day |
| | | | | | | | | | | |
Operations North | 36 | 7 | 80 | | 24 | 5 | 56 | | 22 | 6 | 60 |
Operations Mid | 126 | 17 | 235 | | 126 | 15 | 222 | | 158 | 17 | 266 |
Operations West | 264 | 43 | 535 | | 290 | 48 | 589 | | 303 | 55 | 651 |
Operations South | 107 | 11 | 177 | | 94 | 12 | 167 | | 93 | 13 | 177 |
Partner Operated Fields | 55 | 16 | 157 | | 58 | 20 | 182 | | 49 | 21 | 181 |
| | | | | | | | | | | |
Total | 588 | 95 | 1,184 | | 591 | 99 | 1,217 | | 624 | 113 | 1,335 |
Statoil, Annual Report on Form 20-F 20142016. For additional information please refer to note 3 15Segments to the Consolidated financial statements.
The following table shows the NCS production by fields and field areas in which we were participating as of 31 December 2014. Field areas are groups of fields operated as a single entity.
Business cluster | Geographical area | Statoil's equity interest in % (1) | Operator | On stream | Licence expiry date | | Average daily production in 2014 mboe/day |
|
|
| | | | | | | |
Operations West | | | | | | | |
Kvitebjørn | The North Sea | 39.55 | Statoil | 2004 | 2031 | | 65.5 |
Visund | The North Sea | 53.20 | Statoil | 1999 | 2034 | | 34.8 |
Gullfaks | The North Sea | 51.00 | Statoil | 1986 | 2036 | | 75.2 |
Gimle | The North Sea | 65.13 | Statoil | 2006 | 2034 | (2) | 0.7 |
Grane | The North Sea | 36.66 | Statoil | 2003 | 2030 | | 36.0 |
Veslefrikk | The North Sea | 18.00 | Statoil | 1989 | 2020 | (3) | 2.9 |
Huldra | The North Sea | 19.88 | Statoil | 2001 | 2015 | (4) | 0.9 |
Volve | The North Sea | 59.60 | Statoil | 2008 | 2028 | | 8.3 |
Troll Phase 1 (Gas) | The North Sea | 30.58 | Statoil | 1996 | 2030 | | 152.8 |
Troll Phase 2 (Oil) | The North Sea | 30.58 | Statoil | 1995 | 2030 | | 39.3 |
Fram | The North Sea | 45.00 | Statoil | 2003 | 2024 | | 21.1 |
Fram H Nord | The North Sea | 49.20 | Statoil | 2014 | 2024 | | 1.3 |
Vega Unit | The North Sea | 0.00 | Statoil | 2010 | 2035 | (5) | 13.9 |
Oseberg | The North Sea | 49.30 | Statoil | 1988 | 2031 | | 77.8 |
Tune | The North Sea | 50.00 | Statoil | 2002 | 2032 | (6) | 3.9 |
| | | | | | | |
Total Operation West | | | | | | | 534.6 |
| | | | | | | |
Operations North | | | | | | | |
Alve | The Norwegian Sea | 85.00 | Statoil | 2009 | 2029 | | 13.1 |
Norne | The Norwegian Sea | 39.10 | Statoil | 1997 | 2026 | | 5.9 |
Urd | The Norwegian Sea | 63.95 | Statoil | 2005 | 2026 | | 19.5 |
Snøhvit | The Barents Sea | 36.79 | Statoil | 2007 | 2035 | | 41.7 |
| | | | | | | |
Total Operations North | | | | | | | 80.2 |
| | | | | | | |
Operations South | | | | | | | |
Statfjord Unit | The North Sea | 44.34 | Statoil | 1979 | 2026 | | 35.9 |
Statfjord Nord | The North Sea | 21.88 | Statoil | 1995 | 2026 | | 1.1 |
Statfjord Øst | The North Sea | 31.69 | Statoil | 1994 | 2026 | (7) | 1.4 |
Sygna | The North Sea | 30.71 | Statoil | 2000 | 2026 | (7) | 0.2 |
Snorre | The North Sea | 33.32 | Statoil | 1992 | 2015 | (8) | 31.1 |
Tordis area | The North Sea | 41.50 | Statoil | 1994 | 2024 | | 5.6 |
Vigdis area | The North Sea | 41.50 | Statoil | 1997 | 2024 | | 16.6 |
Sleipner Øst | The North Sea | 59.60 | Statoil | 1993 | 2028 | | 10.4 |
Sleipner Vest | The North Sea | 58.35 | Statoil | 1996 | 2028 | | 50.8 |
Gungne | The North Sea | 62.00 | Statoil | 1996 | 2028 | | 6.6 |
Gudrun | The North Sea | 51.00 | Statoil | 2014 | 2028 | | 17.5 |
| | | | | | | |
Total Operations South | | | | | | | 177.1 |
| | | | | | | |
| | | | | | | |
| | | | | | | |
| | | | | | | |
| | | | | | | |
| | | | | | | |
| | | | | | | |
| | | | | | | |
| | | | | | | |
| | | | | | | |
| | | | | | | |
16 Statoil, Annual Report on Form 20-F 20142016
Segment performance | For the year ended 31 December |
(in USD million) | 2016 | 2015 | 2014 |
| | | | |
Development & Production Norway | | | |
Total revenues and other income | 13,077 | 17,339 | 28,926 |
Net operating income | 4,451 | 7,161 | 17,753 |
Non-current segment assets1) | 27,816 | 27,706 | 35,243 |
| | | | |
Development & Production International | | | |
Total revenues and other income | 6,657 | 8,200 | 13,661 |
Net operating income | (4,352) | (8,729) | (2,703) |
Non-current segment assets1) | 36,181 | 37,475 | 44,912 |
| | | | |
Marketing, Midstream and Processing | | | |
Total revenues and other income | 44,979 | 58,106 | 95,171 |
Net operating income | 623 | 2,931 | 2,608 |
Non-current segment assets1) | 4,450 | 5,588 | 6,234 |
| | | | |
Other | | | |
Total revenues and other income | 39 | 354 | 118 |
Net operating income | (423) | (129) | (199) |
Non-current segment assets1) | 352 | 690 | 688 |
| | | | |
Eliminations2) | | | |
Total revenues and other income | (18,880) | (24,357) | (38,612) |
Net operating income | (219) | 133 | 420 |
Non-current segment assets1) | - | - | - |
| | | | |
Statoil group | | | |
Total revenues and other income | 45,873 | 59,642 | 99,264 |
Net operating income | 80 | 1,366 | 17,878 |
Non-current segment assets1) | 68,799 | 71,458 | 87,077 |
| | | | |
1) | Deferred tax assets, pension assets, equity accounted investments and non-current financial assets are not allocated to segments. |
2) | Includes elimination of inter-segment sales and related unrealised profits, mainly from the sale of crude oil and products. Inter-segment revenues are based upon estimated market prices. |
| |
Statoil, Annual Report on Form 20-F 201617
The following tables show total revenues by country.
2016 Total revenues and other income by country | Crude oil | Natural gas | Natural gal liquids | Refined products | Other | Total sales |
(in USD million) |
| | | | | | |
Norway | 20,544 | 7,973 | 3,580 | 4,135 | (497) | 35,735 |
USA | 3,073 | 957 | 455 | 1,110 | 867 | 6,463 |
Sweden | 0 | 0 | 0 | 1,379 | (53) | 1,326 |
Denmark | 0 | 0 | 0 | 1,518 | 14 | 1,532 |
Other | 690 | 272 | 1 | 0 | (27) | 936 |
| | | | | | |
Total revenues (excluding net income (loss) from equity accounted investments and other income | 24,307 | 9,202 | 4,036 | 8,142 | 305 | 45,993 |
2015 Total revenues and other income by country | Crude oil | Natural gas | Natural gas liquids | Refined products | Other | Total sales |
(in USD million) |
| | | | | | |
Norway | 22,741 | 10,811 | 4,932 | 5,644 | 1,454 | 45,582 |
US | 3,718 | 1,133 | 532 | 1,605 | 933 | 7,922 |
Sweden | 0 | 0 | 0 | 1,762 | 115 | 1,877 |
Denmark | 0 | 0 | 0 | 1,750 | 8 | 1,759 |
Other | 1,347 | 446 | 17 | 0 | 722 | 2,532 |
| | | | | | |
Total revenues (excluding net income (loss) from equity accounted investments and other income | 27,806 | 12,390 | 5,482 | 10,761 | 3,232 | 59,671 |
2014 Total revenues and other income by country | Crude oil | Natural gas | Natural gas liquids | Refined products | Other | Total sales |
(in USD million) |
| | | | | | |
Norway | 40,899 | 12,817 | 8,799 | 8,718 | 2,864 | 74,096 |
US | 7,933 | 2,212 | 643 | 2,379 | 1,351 | 14,518 |
Sweden | 0 | 0 | 0 | 2,636 | 260 | 2,896 |
Denmark | 0 | 0 | 0 | 3,050 | 37 | 3,087 |
Other | 2,970 | 704 | 65 | 0 | 963 | 4,702 |
| | | | | | |
Total revenues (excluding net income (loss) from equity accounted investments and other income | 51,803 | 15,732 | 9,506 | 16,782 | 5,475 | 99,299 |
| | | | | | |
| | | | | | |
RESEARCH AND DEVELOPMENT
Statoil is a technology-intensive company and research and development is an integral part of our strategy. Our technology strategy is about prioritising technology for value creation that enables us to achieve growth and access, and sets the direction for technology development and implementation for the future. Our focus is on low cost, low carbon solutions and re-using standardised technologies.
We continuously research, develop and deploy innovative technologies to create opportunities and enhance the value of Statoil’s current and future assets. Statoil’s technology development activities aim to reduce field development, drilling and operating costs, and CO2 and other greenhouse gas emissions. We utilise a range of tools for the development of new technologies:
·In-house research and development (R&D)
·Cooperation with academia and research institutes
·Collaborative development projects with our major suppliers
·Project related development as part of our field development activities
·Direct investment in technology start-up companies through our Statoil Technology Invest venture activities
·Invitation to open innovation challenges as part of Statoil Innovate
Research and development expenditures were USD 298 million, USD 344 million and USD 476 million in 2016, 2015 and 2014, respectively.
18Statoil, Annual Report on Form 20-F 2016
2.3 DPN - DEVELOPMENT AND PRODUCTION NORWAY
OVERVIEW
The Development and Production Norway (DPN) reporting segment is responsible for field development and operations on the Norwegian continental shelf (NCS) which includes the North Sea, the Norwegian Sea and the Barents Sea. DPN aims to ensure safe and efficient operations and to maximise the value potential from the NCS. For proved reserves development see Development of reserves in Proved oil and gas reserves in section 2.8 Operating and financial performance.
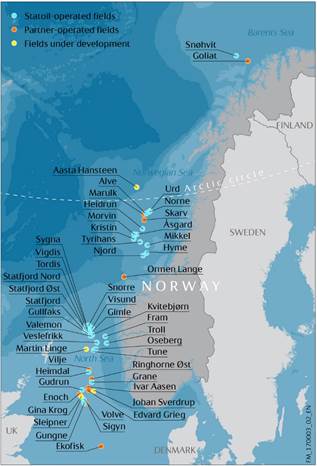
Key events and portfolio developments in 2016:
Statoil, Annual Report on Form 20-F 201619
·In January, Statoil announced the acquisition of 11.93% of the shares and votes in Lundin Petroleum AB (Lundin) for a total cash purchase price of SEK 4.6 billion (USD 0.5 billion), and in May, Statoil announced divestment of its entire 15% interest in Edvard Grieg for an increased shareholding in Lundin. The transaction also included divestment of a 9% interest in the Edvard Grieg oil pipeline and a 6% interest in the Utsira High gas pipeline, and in addition payment of cash consideration of USD 64 million to Lundin. Statoil now owns 20.1% of the shares in Lundin.
·On 1 March, the drilling of the first well of the Johan Sverdrup field development commenced.
·On 12 March, the Goliat field came on stream with Eni Norge as operator.
·In June, the plan for development and operation for Oseberg Vestflanken 2 was approved by the Ministry of Petroleum and Energy.
·In June, the Njord Future project was established to secure long-term production for both the Njord and Hyme fields. The Njord field was temporarily shut in, and both the Njord A and Njord B platforms were towed to shore.
·On 9 August, Statoil and its partners submitted the plan for development and operation for the Utgard gas and condensate discovery to the Norwegian and UK authorities. The plan for development and operation was approved on 17 January 2017.
·On 19 August, Statoil and its partners submitted the plan for development and operation of the Byrding oil and gas discovery. On 30 December, Statoil completed the acquisition of Wintershall’s 25% interest in Byrding, increasing Statoil’s interest to 70%. The plan for development and operation of the Byrding discovery was approved on 17 January 2017.
·Gullfaks Rimfaksdalen started production ahead of schedule on 24 August.
·Volve ceased production on 17 September.
·The plan for development and operation of the Trestakk discovery was submitted on 1 November.
·On 24 December, the Ivar Aasen field came on stream with Aker BP as operator.
Fields in production on the NCS
The following table shows DPN's average daily entitlement for the years ending 31 December 2016, 2015 and 2014.
Production level maintained by new fields and new wells from existing fields. See chapter "Fields under development on the NCS" for future production replacement.
| For the year ended 31 December |
| 2016 | | 2015 | | 2014 |
| Oil and NGL | Natural gas | | | Oil and NGL | Natural gas | | | Oil and NGL | Natural gas | |
Area production | mbbl/day | mmcm/day | mboe/day | | mbbl/day | mmcm/day | mboe/day | | mbbl/day | mmcm/day | mboe/day |
| | | | | | | | | | | |
Statoil operated fields | 511 | 86 | 1,049 | | 545 | 88 | 1,100 | | 533 | 78 | 1,027 |
Partner operated fields | 70 | 17 | 177 | | 50 | 13 | 132 | | 55 | 16 | 157 |
Equity accounted production | 8 | - | 8 | | - | - | - | | - | - | - |
| | | | | | | | | | | |
Total | 589 | 103 | 1,235 | | 595 | 101 | 1,232 | | 588 | 95 | 1,184 |
20Statoil, Annual Report on Form 20-F 2016
The following tables show the NCS production by fields in which Statoil was participating during the year ended 31 December 2016.
Field | Geographical area | Statoil's equity interest in % | | On stream | Licence expiry date | | Average daily production in 2016 mboe/day |
|
|
| | | | | | | |
Statoil operated fields | | | | | | | |
Troll Phase 1 (Gas) | The North Sea | 30.58 | | 1996 | 2030 | | 159.4 |
Åsgard | The Norwegian Sea | 34.57 | | 1999 | 2027 | | 93.1 |
Gullfaks | The North Sea | 51.00 | | 1986 | 2036 | | 83.8 |
Oseberg | The North Sea | 49.30 | | 1988 | 2031 | | 76.2 |
Kvitebjørn | The North Sea | 39.55 | | 2004 | 2031 | | 63.3 |
Visund | The North Sea | 53.20 | | 1999 | 2034 | | 59.8 |
Snøhvit | The Barents Sea | 36.79 | | 2007 | 2035 | | 47.4 |
Statfjord Unit | The North Sea | 44.34 | | 1979 | 2026 | | 44.8 |
Tyrihans | The Norwegian Sea | 58.84 | | 2009 | 2029 | | 44.6 |
Sleipner Vest | The North Sea | 58.35 | | 1996 | 2028 | | 42.5 |
Grane | The North Sea | 36.61 | | 2003 | 2030 | | 41.5 |
Troll Phase 2 (Oil) | The North Sea | 30.58 | | 1995 | 2030 | | 39.8 |
Gudrun | The North Sea | 36.00 | | 2014 | 2028 | | 35.0 |
Snorre | The North Sea | 33.28 | | 1992 | 2018 | 1) | 32.8 |
Valemon | The North Sea | 53.78 | | 2015 | 2031 | | 29.0 |
Kristin | The Norwegian Sea | 55.30 | | 2005 | 2033 | 2) | 19.1 |
Mikkel | The Norwegian Sea | 43.97 | | 2003 | 2020 | 3) | 17.4 |
Fram | The North Sea | 45.00 | | 2003 | 2024 | | 16.8 |
Vigdis area | The North Sea | 41.50 | | 1997 | 2024 | | 13.8 |
Morvin | The Norwegian Sea | 64.00 | | 2010 | 2027 | | 11.6 |
Alve | The Norwegian Sea | 85.00 | | 2009 | 2029 | | 10.5 |
Tordis area | The North Sea | 41.50 | | 1994 | 2024 | | 10.3 |
Urd | The Norwegian Sea | 63.95 | | 2005 | 2026 | | 10.1 |
Heidrun | The Norwegian Sea | 13.04 | | 1995 | 2024 | 4) | 9.5 |
Sleipner Øst | The North Sea | 59.60 | | 1993 | 2028 | | 9.4 |
Gungne | The North Sea | 62.00 | | 1996 | 2028 | | 5.2 |
Norne | The Norwegian Sea | 39.10 | | 1997 | 2026 | | 4.0 |
Volve | The North Sea | 59.60 | | 2008 | 2028 | | 3.5 |
Veslefrikk | The North Sea | 18.00 | | 1989 | 2020 | 5) | 2.7 |
Statfjord Nord | The North Sea | 21.88 | | 1995 | 2026 | | 2.4 |
Hyme | The Norwegian Sea | 35.00 | | 2013 | 2014 | 6) | 2.0 |
Njord | The Norwegian Sea | 20.00 | | 1997 | 2021 | 7) | 1.4 |
Fram H Nord | The North Sea | 49.20 | | 2014 | 2024 | | 1.4 |
Statfjord Øst | The North Sea | 31.69 | | 1994 | 2026 | 8) | 1.3 |
Gimle | The North Sea | 65.13 | | 2006 | 2034 | 9) | 1.2 |
Tune | The North Sea | 50.00 | | 2002 | 2032 | 10) | 1.1 |
Sygna | The North Sea | 30.71 | | 2000 | 2026 | 11) | 0.9 |
Heimdal | The North Sea | 29.44 | | 1985 | 2021 | | 0.7 |
| | | | | | | |
Total Statoil operated fields | | | | | | | 1,049.4 |
| | | | | | | |
| | | | | | | |
| | | | | | | |
| | | | | | | |
| | | | | | | |
| | | | | | | |
| | | | | | | |
| | | | | | | |
| | | | | | | |
Statoil, Annual Report on Form 20-F 201621
Business cluster | Geographical area | Statoil's equity interest in % (1) | Operator | On stream | Licence expiry date | | Average daily production in 2014 mboe/day |
|
|
| | | | | | | |
Operations Mid-Norway | | | | | | | |
Njord | The Norwegian Sea | 20.00 | Statoil | 1997 | 2021 | (9) | 4.3 |
Hyme | The Norwegian Sea | 35.00 | Statoil | 2013 | 2014 | (10) | 3.0 |
Tyrihans | The Norwegian Sea | 58.84 | Statoil | 2009 | 2029 | | 52.2 |
Heidrun | The Norwegian Sea | 13.04 | Statoil | 1995 | 2024 | (11) | 9.6 |
Åsgard | The Norwegian Sea | 34.57 | Statoil | 1999 | 2027 | | 95.6 |
Mikkel | The Norwegian Sea | 43.97 | Statoil | 2003 | 2020 | (12) | 15.7 |
Kristin | The Norwegian Sea | 55.30 | Statoil | 2005 | 2033 | (13) | 23.7 |
Morvin | The Norwegian Sea | 64.00 | Statoil | 2010 | 2027 | | 25.3 |
Yttergryta | The Norwegian Sea | 45.75 | Statoil | 2009 | 2027 | (14) | 5.5 |
| | | | | | | |
Total Operations Mid-Norway | | | | | | | 234.9 |
| | | | | | | |
Partner Operated Fields | | | | | | | |
Skarv | The Norwegian Sea | 36.17 | BP Norge AS | 2013 | 2033 | (15) | 46.3 |
Ormen Lange | The Norwegian Sea | 25.35 | Shell | 2007 | 2041 | (16) | 68.5 |
Vilje | The North Sea | 28.85 | Marathon Oil | 2008 | 2021 | | 5.3 |
Gjøa | The North Sea | 0.00 | GDFSuez | 2010 | 2028 | (6) | 5.2 |
Ekofisk area | The North Sea | 7.60 | ConocoPhillips | 1971 | 2028 | | 14.2 |
Ringhorne Øst | The North Sea | 14.82 | ExxonMobil | 2006 | 2030 | | 1.8 |
Sigyn | The North Sea | 60.00 | ExxonMobil | 2002 | 2022 | | 3.3 |
Marulk | The North Sea | 50.00 | Eni Norge AS | 2012 | 2025 | | 12.2 |
| | | | | | | |
Total Partner Operated Fields | | | | | | | 156.9 |
| | | | | | | |
Total | | | | | | | 1,183.6 |
Field | Geographical area | Statoil's equity interest in % | Operator | On stream | Licence expiry date | | Average daily production in 2016 mboe/day |
|
|
| | | | | | | |
Partner Operated Fields | | | | | | | |
Ormen Lange | The Norwegian Sea | 25.35 | Shell | 2007 | 2041 | 12) | 73.9 |
Skarv | The Norwegian Sea | 36.16 | Aker BP ASA | 2013 | 2033 | 13) | 43.9 |
Goliat | The Barents Sea | 35.00 | Eni Norge AS | 2016 | 2042 | | 17.9 |
Ekofisk area | The North Sea | 7.60 | ConocoPhillips | 1971 | 2028 | | 13.6 |
Marulk | The North Sea | 50.00 | Eni Norge AS | 2012 | 2025 | | 11.6 |
Sigyn | The North Sea | 60.00 | ExxonMobil | 2002 | 2022 | | 5.9 |
Edvard Grieg | The North Sea | 0.00 | Lundin Norway AS | 2015 | 2035 | 14) | 4.8 |
Vilje | The North Sea | 28.85 | Aker BP ASA | 2008 | 2021 | | 4.1 |
Ringhorne Øst | The North Sea | 14.82 | ExxonMobil | 2006 | 2030 | | 1.4 |
Ivar Aasen | The North Sea | 41.47 | Aker BP ASA | 2016 | 2029 | 15) | 0.2 |
Enoch | The North Sea | 11.78 | Repsol Sinopec | 2007 | 2018 | | 0.1 |
| | | | | | | |
Total Partner Operated Fields | | | | | | | 177.3 |
| | | | | | | |
Equity accounted production | | | | | | | |
Lundin Petroleum AB | | 20.10 | Lundin Petroleum AB | | | | 8.1 |
| | | | | | | |
Total Development and Production Norway (DPN) including share of equity accounted production | | | 1,234.8 |
1) PL089 expires in 2024 and PL057 expires in 2018 (prolonged from 2016 to 2018).
2) PL134D expires in 2027 and PL199 expires in 2033.
3) PL092 expires in 2020 and PL121 expires in 2022.
4) PL095 expires in 2024 and PL124 expires in 2025.
5) PL052 expires in 2020 and PL053 in 2031.
6) PL348 expires in 2029.
7) PL107 expires in 2021 and PL132 expires in 2023.
8) PL037 expires in 2026 and PL089 expires in 2024.
9) PL120B expires in 2034 and PL050DS expires in 2023.
10) PL034 expires in 2020. PL053 expires in 2031 and PL190 in 2032.
11) PL037 expires in 2026 and PL089 expires in 2024.
12) PL209/250 expires in 2041 and PL208 expires in 2040.
13) PL212/262 expires in 2033 and PL159 expires in 2029.
(14) From 1)Equity January to 30 June 2016 Statoil owned a 15% interest asin the Edvard Grieg field. On 30 June 2016 this interest was sold to Lundin. The Edvard Grieg swap agreement was a part of 31 December 2014.Statoil increasing the ownership in Lundin.
(2)PL120B expires15) PL001B, PL452BS and PL242 expire in 2034 and PL050DS expires in 2023.
(3)PL052 expires in 2020 and PL053 in 2031.
(4)Production shut down September 3, 2014.
(5 )The 2014 Statoil farm out transaction with Wintershall completed
1 December 2014. (Full exit Gjøa PL153 and 153B and Vega PL248, 248B and 090C). Transfer of Vega operatorship from Statoil to Wintershall. Subject to government approval.
(6)PL034 expires in 2020. PL053 expires in 2031 and PL190 in 2032.
(7) PL037 expires in 2026 and PL089 expires in 2024.
| (8)PL089 expires in 2024 and PL057 expires in 2015.
(9)PL107 expires in 2021 and PL132 expires in 2023.
(10)Application for license extension for PL348 to 2033 is under preparation.
(11)PL095 expires in 2024 and PL124 expires in 2025.
(12)PL092 expires in 2020 and PL121 expires in 2022.
(13) PL134B expires in 2027 and PL199 expires in 2033.
(14) PL062 expires in 2027 and PL159 expires in 2029, however,
Yttergryta has shut down and volumes in 2014 are redelivery of
commercial volumes from Smørbukk CO2 blending.
(15) PL212/262 expires in 2033 and PL159 expires2036. PL 338BS expire in 2029.
(16) PL209/250 expires in 2041 and PL208 expires in 2040.
|
|
|
The following sections provide information about the main producing assets. See the section Financial review - Operating and financial review - DPN profit and loss analysis for a discussion of results of operations for 2014, 2013, and 2012.
Statoil, Annual Report on Form 20-F 201417
3.5.2.1 Operations North
The main producing field in the Operations North area is the Snøhvit field.
The region spans from 66 degrees north in
Main producing fields on
the Norwegian Sea to 70 degrees north in the Barents Sea, the latter at the same latitude as the frozen seas in Alaska.The Norwegian Sea region is characterised by petroleum reserves located at water depths between 340 and 380 metres.
In the Barents Sea the petroleum reserves are located at water depths between 310 and 340 meters. The Gulf Stream keeps the sea free of ice all year round, but winter storms can make surface installations difficult to operate.
NCS
Statoil operated fields
SnøhvitTroll (Statoil interest 36.79%) wasis both the firstlargest gas field developed inon the Barents Sea. It is one of the firstNCS and a major developments using onshore production facilities. All offshore installationsoil field. The Troll field regions are subsea. The natural gas is transported to shore through a 143 km long pipeline and then processed at our Liquefied Natural Gas (LNG) plant on Melkøya. The LNG was shipped to customers in Europe, Asia, North and South America in tankers. The CO2 in the feed-gas from Snøhvit and Albatross is removed due to freezing constraints in the process system. To reduce carbon dioxide emissions to the air the removed CO2 is liquefied, transported through a pipeline, and then injected into a storage reservoir in Snøhvit.
The LNG plant produced according to plan in 2014. A turnaround was performed according to plan in the period of May 2nd to June 13th. The Snøhvit licence has implemented the improvement project "Closing the Gap." The main objectives for the project are focus on increased production efficiency and plant integrity, improved HSE results, enhanced cost efficiency and intensified expertise throughout the Snøhvit organisation.
Norne (Statoil interest 39.10%) is an oil field located about 80 kilometres north of Heidrun in the Norwegian Sea. The field has been developed using a floating production, storage and offloading vessel (FPSO) connected to subsea templates. Gas is exported through a dedicated pipeline to the Åsgard Transport System (ÅTS) and further to Kårstø. Alve, Marulk, Urd and Skuld are tie-in fields connected to the Norne FPSO.Troll A, B and C platforms. Troll gas is mainly exported and produced at Troll A, while oil is mainly produced at Troll B and C. Fram and Fram H Nord are tie-ins to Troll C.
Skuld (Statoil interest 63.95%) is a Statoil operatedThe Åsgard field located outside the Norne FPSO and consists of the Fossekall and Dompap reservoirs. Skuld is one of the largest fast-track developments, and production start-up was March 2013. The field is currently producing from the Fossekall and Dompap reservoirs.
3.5.2.2 Operations Mid-Norway
The main producing fields in the Operations Mid-Norway area are Åsgard, Morvin, Kristin and Tyrihans.
The region is characterised by petroleum reserves located at water depths of between 250 and 500 metres. The reserves are partly under high pressure and at high temperatures. These conditions have made development and production more difficult, challenging the participants to develop new types of platforms and new technology, such as floating processing systems with subsea production templates.
The Åsgard field development (Statoil interest 34.57%) includes the Åsgard A production and storage ship for oil, the Åsgard B semi-submersible floating production platform for gas, and the Åsgard C storage vessel for condensate. Gas fromIn 2015 Statoil started the field is piped through the ÅTS to the processing plant at Kårstø. Oil produced at the Åsgard A vessel and condensate from the Åsgard C storage vessel are shipped from the field in shuttle tankers.
Mikkel (Statoil interest 43.97%) is aworld first subsea gas and condensate field developed with two subsea templates tied back to Åsgard B.
Morvin (Statoil interest 64.00%) is developed with two subsea templates. The well stream of oil and gas is tied back to Åsgard B for processing.
Heidrun (Statoil interest 13.04%) is developed with a floating concrete tension leg platform. The oil is transferred to shuttle tankers at the field and shipped to Mongstad in Norway and Tetney in the UK. Gas from Heidrun transported in an own pipe line provides the feedstock for the methanol plant at Tjeldbergodden in Norway. Additional gas volumes are exported through the ÅTS to the gas processing facility at Kårstø.
Kristin (Statoil interest 55.30%) is a gas and condensate field. The Kristin development is the first high-temperature/high-pressure (HTHP) field developed with subsea installations. The pressure and temperature in the reservoir are among the highest of all developed fields on the NCS. The stabilised condensate is exported to Åsgard C storage vessel, and the rich gas is transported via the ÅTS to the gas processing facility at Kårstø.
Tyrihans (Statoil interest 58.84%) is a subsea development with five templates. The well stream of oil and gas is tied back to Kristin for processing. Tyrihans receives seawater injection from Kristin and gas injection from Åsgard B.
The Njord field (Statoil interest 20.00%) has been developed with a floating steel platform, Njord A, which has an integrated deck with drilling and processing facilities, as well as living quarters. The oil is transported from a storage vessel, Njord B, with shuttle tankers. The gas is transported through the ÅTS to Kårstø. The Njord A platform was kept shut down after a planned turnaround in September 2013 due to structural integrity issues. Designing the necessary reinforcements and planning of prefabrication as well as installation started in November 2013. Extensive reinforcement work was carried outcompressor train
1822 Statoil, Annual Report on Form 20-F 20142016
during first half of 2014, and production was temporary resumed in July 2014. The temporary production period is expected to last until medio 2016, there will not be any drilling activity in this period. The project “Njord Future” has been established to secure long term production from Njord and Hyme.
Hyme (Statoil interest 35.00%) was developed as a fast track project with a standard subsea template with four well slots. Hyme has one production well and one water injection well, both tied to the Njord facilities, and started production in the first quarter of 2013.
3.5.2.3 Operations West
The main producing fields in the Operations West area are Troll, Oseberg, Gullfaks, Kvitebjørn, Visund and Grane
Operation West produces approximately half of Statoil’s equity production in Norway. Our main focus is on increasing and prolonging production in the area, giving priority to increased oil recovery, exploration and new field developments.
Troll (Statoil interest 30.58%) is the largest gas field on the NCS and a major oil field. The Troll field is split into three hydrocarbon-bearing regions connected to three platforms: Troll A, B and C. The Troll gas is mainly exported and produced at the Troll A platform, while oil is mainly produced at Troll B and C. Oil is transported in pipelines to Mongstad. The condensate is separated from the gas, and transported by pipeline to the Sture and Mongstad terminals. The gas is transported to the gas treatment plant at KollsnesÅsgard, and the dry gas is then transportedsecond train was started in Zeepipe pipelinesFebruary 2016. Mikkel and Morvin are tie-ins to Germany.
In February 2014, Troll replaced two inoperative electric motors driving the TrollÅsgard. The Trestakk development will be a tie-in to Åsgard A export compressors with an interim motor. The permanent replacement for the motor was installed and became operational early October 2014.
The Oseberg area (Statoil interest 49.30%) includes the Oseberg Field Centre, Oseberg C, Oseberg East and Oseberg South production platforms. Oil and gas from the satellites are piped to the Oseberg Field Centre for processing and transportation. Oil is exported to shore through the Oseberg transportation system to the Sture Terminal, and gas is exported through the Oseberg gas transportation system to Heimdal and from there to the market.
The drilling upgrade project at Oseberg Field Center was completedstart planned in 2014 after a long drilling stop. Drilling operations recommenced in the summer of 2014. All platforms in the Oseberg area had a turnaround in the spring with startup in May 2014. The Tender Support Vessel (TSV) project at Oseberg Øst was sanctioned and is expected to arrive in the summer of 2015.2019.
Gullfaks (Statoil interest 51.00%) has been developed with three large concrete production platforms. Oil is stored at the Gullfaks A and C platforms before being loaded onto custom-built shuttle tankers on the field. Associated gas is piped to the Kårstø gas processing plant and then on to continental Europe. Since production started on Gullfaks in 1986, fiveseveral satellite fields have been developed with subsea wells that are remotely controlled from the Gullfaks A and C platforms.
OThe ilOseberg area includes the Oseberg Field Centre, Oseberg C, Oseberg East and Oseberg South production platforms. Oil and gas production was as expected in 2014. Currently, drilling of the new Gullfaks South Increased Oil Recovery (GSO IOR) project wells is ongoing. Operations onfrom the satellites will continue with two mobile rigs until August 2015.
Replacing of the offshore loading buoys was finalized in 2014. The Gullfaks Rimfaksdalen Planare transported to Oseberg Field Centre for developmentprocessing and operation (PDO) was submitted in 2014. The projects Gullfaks C Subsea compressor, Gullfaks B Drilling Upgrade and Gullfaks South IOR are all planned to be finalized in 2015.
Turnarounds at Gullfaks A and B in May/June 2014 where conducted on time and cost. A turnaround on Gullfaks C is planned in 2015.transportation.
Kvitebjørn(Statoil interest 39.55%) is a gas and condensate field where gasdeveloped with an integrated accommodation, drilling and condensate from the Kvitebjørn platform are transported through pipelines to Kollsnes and Mongstad, respectively. The Kvitebjørn platform processing has been expanded byfacility with a compressor module, and re-compression of the gas is expected to increase the expected production of gas and condensate, thereby increasing the recovery rate from the reservoir. Start-up of the modulewas in September 2014.steel jacket.
Visund(Statoil interest 53.20%) is an oil and gas field development that includes a floating drilling, production and living quarter unitsunit and two subsea templates, in the northern and southern parts of the field. Production from the Visund South template started in the fourth quarter of 2012 and production from the Visund North template started in the fourth quarter of 2013.templates.
Grane (Statoil interest 36.66%) is Statoil's largest producing heavy oil field. Oil from Grane is piped to the Sture terminal, where it is stored and shipped. In January 2014 gas import was re-opened for injection in the reservoir with the aim of reducing pressure decline.
The Svalin field development (Statoil interest 57.0 %) is one of Statoil’s fast track projects, with production start-up in 2014. Statoil is operator, while Petoro and ExxonMobil are patners. The field has a tie back to the Grane platform. Svalin M is a well drilled from the Grane platform, while Svalin C is a sub-sea solution with a six kilometer long flowline to the Grane platform.
The Heimdal platforms (Statoil interest 29.44%) where preparing for the reception of rich gas from the Valemon field during the fourth quarter of 2014 and are therefore being upgraded for lifetime extension. Valemon conceded production in January 2015. In parallel, a modular drilling rig has been successfully installed in order to plug and abandon all 12 wells at the Heimdal main reservoir.
Statoil, Annual Report on Form 20-F 201419
Volve (Statoil interest 59.60%) has successfully increased the proven reserve via a drilling program in 2014. This tail end field managed to plan and approve a well within six weeks, and production is now expected to run to the first quarter in 2016. Rich gas is transported to Sleipner A for further export and the oil is exported by tankers.
The Veslefrikk field (Statoil interest 18.00%) has future challenges mainly related to mature new economic drilling targets, secure time-right gas blow down in Veslefrikk late life, run safe and efficient operations and keep continuous focus on cost control. As there are a limited number of prospects with limited volume potential, smart exploration drilling is required. Oil is transported through the Oseberg Transport system to the Sture Terminal and gas export is transported through the Gassled system to Kårstø.
Huldra(Statoil interest 19.88 %) production was ceased on 3 September 2014. The platform has produced gas and condensate for six extra years compared to the original plan. Since the field came on stream on 21 November 2001 it has produced a total of 17,5 GSm³ of wet gas and has a recovery rate of 80%. The Huldrapipe has been handed over to the Valemon Project for tie-in of the Valemon pipe to Heimdal.
Fram (Statoil interest 45.00%) is an oilfield with two deposits; Fram Vest and Fram Øst both with two subsea templates tie-backed to Troll C. A PDO exemption for development of Fram H-Nord was approved by the authorities in 2013. However, production start-up of the fast track project Fram H-Nord (statoil interest 49.20%), a separate 4 –slot template tied into existing A2 Fram Vest template started 6 September 2014.
As part of the transaction with Wintershall, a farm-down in Vega has been completed. Statoil's interest in Vega (PL090C, PL248 and PL248B) has decreased from 24% to 0%.
3.5.2.4 Operations South
The main producing fields in Operations South are Sleipner, Gudrun, Snorre and Statfjord.
Operations South produces from the satellite fields Tordis and Vigdis, which are tied into Gullfaks C and Snorre A, as well as the Statfjord satellites, which are tied into the Statfjord C platform.
Sleipner consists of the Sleipner East (Statoil interest 59.60%), Gungne (Statoil interest 62.00%) and Sleipner West (Statoil interest 58.35%) gas and condensate fields. The gas from Sleipner has a high level of carbon dioxide. It is extracted on the field and re-injected into a sand layer beneath the seabed to reduce carbon dioxide emissions to the air. Sleipner also process gas, condensate and oil from Gudrun, Volve and Sigyn. The Gina Krog field, which is under development, will also be tied back to Sleipner. Unstable condensate is mixed with other liquids on Sleipner A and sent to Kårstø for processing. Dry gas is exported to UK of to the continent via Gasled gas export system.
The Gudrun(Statoil interest 51.00%) oil and gas field is located in the North Sea. During 2013, Statoil sold 24% of its interest share in the field to OMV, effective from 1 Nov 2013, thus reducing the interest share from 75% to 51%. Production was started on the 7th of April 2014. The total investments are NOK 20 billion. The field development includes a separate steel jacket-based process platform for separation of the oil and gas. Gas and partly stabilised oil are transported in separate pipelines from Gudrun to Sleipner.
The Snorre field development (Statoil interest 33.32%) involves two floating platforms and one subsea production system connected to the Snorre A platform. Oil and gas from the Snorre field are exported to Statfjord for final processing, storage and loading.
Statfjord(Statoil interest 44.34%) has been developed using three fully integrated platforms supported by gravity-based structures with concrete storage cells and an offshore loading system. The Statfjord A lifetime is 2020, while Statfjord B and Statfjord C will continue production to 2025. The Statfjord Late Life Project was completed in 2012 to enable a drainage strategy that will produce remaining gas reserves through water production/pressure depletion.
The Statfjord satellites consist of Statfjord North (Statoil interest 21.88%), Statfjord East (Statoil interest 31.69%) and Sygna (Statoil interest 30.71%). These satellites, which have all been developed using subsea templates tied back to Statfjord C, are expected to produce to 2025.
3.5.2.5 Partner-operated fields
Partner-operated fields account for approximately 13% of our total oil and gas production on the NCS. The main producing fields are Ormen Lange, Skarv and Ekofisk.
Statoil's partner operated fields NCS portfolio is organised under Operations South.
Ormen Lange (Statoil interest 25.35%), operated by Shell, is a deepwater gas field in the Norwegian Sea. The well stream is transported to an onshore processing and export plant at Nyhamna. The gas is then transported through a dry gas pipeline, Langeled, via Sleipner to Easington in the UK.
20Statoil, Annual Report on Form 20-F 2014
Skarv (Statoil interest 36.17%) is an oil and gas field located in the Norwegian Sea, with BP as operator. The field development includes a floating production, storage and offloading vessel (FPSO) and five subsea multi-well installations. Oil
Goliatis exported by offshore loading, and gas is exported via the ÅTS.first oil field to be developed in the Barents Sea. The field was put intois being developed by means of 22 subsea wells tied back to a circular floating production, 31 December 2012. All wells were drilledstorage and had come on streamoffloading vessel (FPSO). The oil is offloaded to shuttle tankers. The Goliat field is operated by November 2013.Eni and started production 12 March 2016.
Ekofisk is operated by ConocoPhillips. It consists of the Ekofisk, Tor, Eldfisk and Embla fields (Statoil interest 7.60%), and Tor (Statoil interest 6.64%). Production started in October 2013 for the new Ekofisk South projects consisting offields. The Eldfisk II project delivered a new drillingPDQ platform early 2015 that will serve as Eldfisk field center.
Marulk is operated by Eni. It is a gas- and condensate field developed as a tie-back to the Norne FPSO.
Ivar Aasenis an oil and gas field located in the North Sea. The development includes a fixed steel jacket with subsea water injection facilitiespartial processing and the redevelopment of Eldfisk.living quarters tied in as a satellite to Edvard Grieg for further processing and export. The projects are progressing according to planIvar Aasen development is operated by Aker BP ASA and are expected to extend the field life considerably beyond the current licence period, which ends in 2028.started production 24 December 2016.
3.5.3 Exploration on the NCS
TheStatoil holds exploration activity was highacreage and actively explores for new resources in all three regions on the NCS, in 2014.the Norwegian Sea, the North Sea and the Barents Sea.
An extensive drilling program in 2014 resulted in 29 completed exploration wells, of which Statoil acted as operator for 20, with 15 discoveries. In 2014 Statoil was the operator of the industry project for joint 3D seismic acquisition in the south-east Barents Sea. The south-east Barents Sea is the first new area to be opened on the NCS since 1994, and is one of Statoil’s focus areas in the upcoming 23rd licensing round.
In addition,2016 Statoil was awarded interestsfive licences (four as operator) in 11 production licenses (seventhe 23rd concession round for frontier areas, 29 licences (16 as operator) in the Awards infor Predefined Areas (APA) round 2016 for mature areas and completed several farm-in transactions with other companies, notably in the Barents Sea.
Throughout 2016, as part of whichthe industry initiative Barents Sea Exploration Collaboration (BaSEC), Statoil have been preparing for a drilling campaign of five to seven licenseswells in the Barents Sea that will be Statoil operated.
commence in 2017,
In general,2016 Statoil completed a six well appraisal campaign of the Krafla discovery in the North Sea and made five new discoveries. The campaign set a record in drilling efficiency, with the Beerenberg well taking only nine days from spud to reaching total depth of 2,694 meters below the seabed.
In 2016 Statoil and its partners completed 14 exploratory wells and made 11 discoveries in Norway. In 2017 Statoil expects to complete 16 to18 exploration program reflects the diversified exploration portfoliowells on the NCS, which includes targeting growth prospects, new opportunities in frontier areas, as well as selected prospects in mature areas that can be tied into existing infrastructure.
The table below showswith the exploration and development wells drilled onBarents Sea campaign being at the NCS incore of the last three years.activity plan.
| 2014 | 2013 | 2012 |
| | | |
North Sea | | | |
Statoil operated exploratory | 11 | 11 | 7 |
Statoil operated development | 96 | 85 | 59 |
| | | |
Partner operated exploratory | 7 | 10 | 7 |
Partner operated development | 11 | 20 | 12 |
| | | |
Norwegian Sea | | | |
Statoil operated exploratory | 0 | 7 | 1 |
Statoil operated development | 14 | 19 | 18 |
| | | |
Partner operated exploratory | 1 | 1 | 2 |
Partner operated development | 0 | 3 | 7 |
| | | |
Barents Sea | | | |
Statoil operated exploratory | 9 | 2 | 2 |
Partner operated exploratory | 1 | 4 | 0 |
Partner operated development | 4 | 3 | 0 |
| | | |
Totals | | | |
Exploratory | 29 | 35 | 19 |
Exploration extension wells | 2 | 7 | 1 |
Development wells | 125 | 130 | 96 |
Statoil, Annual Report on Form 20-F 201421
Potential producing areas
In addition to producing areas, Statoil operates a significant number of exploration licences. Exploration takes place in undeveloped frontier areas as well as near existing infrastructure and producing fields.
Area | Square km (NCS Total) | Square km (Statoil) | Change vs 2013 | Number of licenses (NCS Total) | Number of licenses (Statoil equity) | Number of licenses (Statoil operated) | New licenses (Statoil equity) | New licenses (Statoil operated) | |
| |
| |
| | | | | | | | | |
North Sea | 51,452 | 14,890 | (210) | 315 | 127 | 97 | 8 | 4 | |
Norwegian Sea | 46,790 | 14,262 | (2,084) | 144 | 71 | 49 | 3 | 2 | |
Barents Sea | 37,901 | 13,937 | (2,676) | 70 | 33 | 21 | 1 | 1 | |
NCS total | 136,143 | 43,089 | (4,970) | 529 | 231 | 167 | 12 | 7 | |
North Sea
In the North Sea, Statoil participated in 17 completed exploration wells and two exploration extension wells. Statoil operated 10 of the exploration wells with nine discoveries. Key discovery wells are Askja East, Valemon North and D-Structure.
In 2015 Statoil plans to further drill in the King Lear area in order to clarify the remaining potential and to pursue exploration efforts around existing infrastructure.
| Exploratory wells drilled1) |
2016 | 2015 | 2014 |
| | | |
North Sea | | | |
Statoil operated | 9 | 11 | 11 |
Partner operated | 2 | 3 | 7 |
Norwegian Sea In the Norwegian Sea, Statoil participated in two exploration wells, which was partner operated. Further deepwater exploration drilling is expected around the Aasta Hansteen area.
| | | |
Statoil operated | 2 | 5 | 0 |
Partner operated | 0 | 1 | 1 |
Barents Sea | Ten wells were
| | |
Statoil operated | 0 | 0 | 9 |
Partner operated | 1 | 1 | 1 |
Total (gross) | 14 | 21 | 29 |
|
1) Wells completed in the Barents Sea in 2014, with Statoil operating nine of which six were announced as discoveries (Kramsnø, Atlantis, Mercury, Pingvin, Isfjell, and Drivis). The Drivis well is contributing with new volumes to the Johan Castberg field development. In addition, the drilling campaign in the Hoop area has contributed with valuable information of the area and tested different plays. Statoil has been the operator of the industry project for joint 3D seismic acquisition in the south-east Barents Sea.
An important priority in 2015 will be preparations for the 23rd licensing round. Statoil delivered its nomination for the 23rd round to the Norwegian authorities at the beginning of January 2014 and is preparing for the upcoming application round.
3.5.4 Fields under development on the NCS
A number of fields are currently under development on the NCS, including traditional, fast-track and redevelopment projects.
The table below shows some key figures as of 31 December 2014 for our major development projects on the NCS.
Project | Operator | Statoil's share at 31 December 2014 | Production start | Statoil equity capacity (mboe per day) | | | | | | | | | | Aasta Hansteen | Statoil | 51.00% | 2017 | 67 | | Valemon | Statoil | 53.78% | 2015 | 50 | | Gina Krog | Statoil | 58.70% | 2017 | 50 | | Ivar Aasen | Det Norske | 41.47% | 2016 | 30 | | Goliat | Eni | 35.00% | 2015 | 30 | | Martin Linge | Total | 19.00% | 2016 | 18 | | Edvard Grieg | Lundin | 15.00% | 2015 | 14 | |
Aasta Hansteen(Statoil interest 51.00%) is a deep water gas discovery in the Norwegian Sea. The development concept includes three subsea templates tied in to a floating processing unit with gas export through a new pipeline, Polarled, to Nyhamna and further exportation through the Langeled pipeline. The Aasta Hansteen processing unit can also serve as a hub for other potential discoveries in the area. Expected production start-up is in 2017.
Valemon (Statoil interest 53.78%), which is located in the North Sea, is being developed using a steel jacket platform with gas, condensate and water separation. Production drilling started in the third quarter of 2012, and it is being performed using the jack-up rig West Elara. The production started on 3 January 2015.
Gina Krog(Statoil interest 58.7%) is an oil and gas discovery in the North Sea approximately 30 kilometres north of the Sleipner field. The field development concept includes a steel-jacket platform. Oil will be exported via offshore loading from a floating storage unit. Due to the high condensate
22Statoil, Annual Report on Form 20-F 2014
content, the rich gas will be exported via Sleipner, where it will be further processed. The development concept also includes gas injection in order to maximise the recovery factor for the field. The development concept includes a total of 15 wells. Expected production start-up is in 2017.
Ivar Aasen (Statoil interest 41.47%) is an oil and gas field located in the Utsira High Area. Its development includes a fixed steel jacket with partial processing and living quarters tied in as a satellite to Edvard Grieg for further processing and export. The Ivar Aasen development is operated by Det norske, The operator expects production start-up in the fourth quarter of 2016.
Goliat (Statoil interest 35.00%) is the first oil field to be developed in the Barents Sea. The field is being developed by means of subsea wells tied back to a circular floating production, storage and offloading vessel (FPSO). The oil will be offloaded to shuttle tankers. The Goliat development is operated by Eni who expects production start-up in the second half of 2015.
Martin Linge (Statoil interest 19.00%) is an oil and gas field, operated by Total, near the British sector in the North Sea. The reservoir is complex with gas under high pressure and high temperatures. The development includes a platform as a fixed steel jacket with processing and export facilities. Electrical power will be supplied from Kollsnes. The operator expects production start up in 2016.
Edvard Grieg(Statoil interest 15.00%) is an oil field located in the Utsira High Area. Its development will include a fixed steel jacket with processing and export facilities. Edvard Grieg is operated by Lundin. The operator expects production start-up in the fourth quarter of 2015. Statoil entered into an agreement with Wintershall, including acquisition of shares in the Edvard Grieg licence. The transaction was closed 31 July 2013.
Fast-track projectsare all relatively small projects, yielding high returns. This initiative was taken in order to address time criticality and cost challenge issues relating to Statoil's portfolio of smaller discoveries and prospects close to existing infrastructure. By rationalising the time and resources used, improving collaboration and deploying standard equipment, the goal is to shorten the normal period between discovery and production to only 2.5 years and to reduce costs by 30%. In Statoil's opinion, the initiative has led to cost-efficient development solutions for this kind of discoveries. The main challenge experienced in the execution phase has been the timely availability of rigs for production drilling.
Statoil's fast-track project development initiative is progressing well. As of 31 December 2014, twelve projects have been sanctioned, of which six started production in 2012 and 2013, and three during 2014. In addition, several other smaller discovery candidates are being considered for future fast-track development.
Redevelopment on the NCS - Improved oil recovery (IOR)
Statoil has delivered substantial additional value creation on the NCS through world leading recovery rates and the company’s ambition of 60% oil recovery from its operated oilfields on the NCS represents a stretch target well above international benchmarks. IOR projects are important in terms of infrastructure utilization and lifetime, additional value creation and as a source to competence and experience to be used in new business opportunities.
In order to deliver on this target we are actively working on maturing IOR projects on the NCS, and the following projects are some of the largest currently being developed:
The Gullfaks B water injection upgrade project includes the replacement of the pipeline from Gullfaks A to Gullfaks B, an upgrade of the existing water injection system, and increased water injection capacity on Gullfaks B. The project was completed in January 2014.
The main purpose of the Kvitebjørn pre-compression project is to increase and accelerate gas and condensate recovery by facilitating low-pressure production. Start-up was achieved in June 2014.
Kristin low-pressure productionis an IOR project that aims to increase production from the Kristin and Tyrihans fields on Haltenbanken by installing a new low-pressure compressor on the Kristin platform. The low-pressure production started in July 2014. The Heidrun low-pressure production is a similar project on the Heidrun field. This project was completed in September 2014.
The Troll A third and fourth pre-compressor project is described in the original PDO for the Troll field. The purpose of the project is to increase gas production by installing two extra pre-compressors on the Troll A platform. The expected completion date is the fourth quarter of 2015.
Subsea compression innovation and technology development are essential to improved oil and gas recovery and to extend the life of the fields on the NCS. The development of subsea compression and processing is a central part of Statoil's technology strategy for long-term production growth. Subsea gas compression is an important step towards our ambition of installing the elements for a "subsea factory". Subsea processing is a key in gaining access to resources in Arctic areas and deep water assets.
Åsgard subsea compressionis one of Statoil's most demanding technology projects aimed at improved recovery. The project will install compact subsea compressors in the Midgard part of the Åsgard fields. The purpose of the project is to increase the recoverable reserves significantly by introducing innovative subsea compression of the well stream. The completion of the development is currently expected to take place in 2015.
Gullfaks subsea compression is the second largest subsea gas compression project planned by Statoil on the NCS. Subsea gas compression will have a significant impact on the Gullfaks field as this technology, combined with conventional low-pressure production, will help increase the recovery rate from the Gullfaks South Brent reservoir from 62% to 74%. This project is scheduled for completion in 2015.
The Ormen Lange onshore compression project was being executed as part of the overall expansion of the Nyhamna facility to handle third-party gas entering the plant through the new Polarled pipeline. The two 37 MW onshore compressors are scheduled for start-up in July 2017.
Statoil, Annual Report on Form 20-F 201423
The Ormen Lange infield Compression project was in April 2014 terminated ahead of DG2 due to negative economics.The recovery ambition will remain in the Long Range Plan of the License with 2025 as new start-up date.
3.5.5 Decommissioning on the NCS
Under the Petroleum Act, the Norwegian government has imposed strict procedures for removal and disposal of offshore oil and gas installations. The Convention for the Protection of the Marine Environment of the Northeast Atlantic (OSPAR) stipulates similar procedures.
Glitne ceased production in February 2013 and decommissioning of the field has been ongoing during 2013 and 2014. Permanent plugging and abandonment of the seven wells was completed in October 2014. Glitne commenced production in 2001 as a marginal field and achieved a production that was double the original reserve estimate.
Huldra ceased production in September 2014, after 13 years in production. Permanent plugging and abandonment of six wells is planned for 2016 and the plan is that the Huldra topside facilities will be removed in 2018.
Yttergryta is a subsea field with one production well that ceased production in 2013. Permanent plugging of the well is ongoing at year end 2014 and is planned to be completed early in 2015.
On Heimdal a modular drilling rig has beensuccessfully installed in order to plug and abandon all 12 wells at the Heimdal main reservoir. The plug and abandonment project started in the fourth quarter 2014, and is scheduled to be carried out by second quarter 2016,
For further information about decommissioning, see note 2 Significant accounting policies to the consolidated financial statements.
24Statoil, Annual Report on Form 20-F 2014
3.6 Development and Production International (DPI)
3.6.1 DPI overview
Statoil is present in several of the most important oil and gas provinces in the world.
Development and Production International (DPI) is responsible for all development and production of oil and gas outside the Norwegian continental shelf (NCS).
In 2014, DPI was engaged in production in 11 countries: Algeria, Angola, Azerbaijan, Brazil, Canada, Libya, Nigeria, Russia, the UK, the US, and Venezuela. DPI produced 39% of Statoil's total equity production of oil and gas in 2014.
As of 31 December 2014, Statoil has exploration licences in North America (Alaska, Canada, and the Gulf of Mexico), South America and sub-Saharan Africa (Angola, Brazil, Colombia, Suriname, and Tanzania), the Middle East and North Africa (Azerbaijan, Algeria and Libya), Europe and Asia (the Faroe Islands, Greenland, Indonesia, Russia and the UK) as well as Oceania (Australia and New Zealand).
Statoil also has representative offices in Kazakhstan, Mexico and United Arab Emirates.
Statoil closed its office in Iran in 2013 but has residual payment obligations for tax and social security under legacy contracts in Iran. These will be dealt with in accordance with all applicable sanctions. See Risks - Risks related to our business for information regarding sanctions towards Iran.
The main development projects in which DPI is involved are in Angola, Azerbaijan, Brazil, Canada, Ireland, the UK, and the US.
The map shows Statoil's international exploration and production areas.
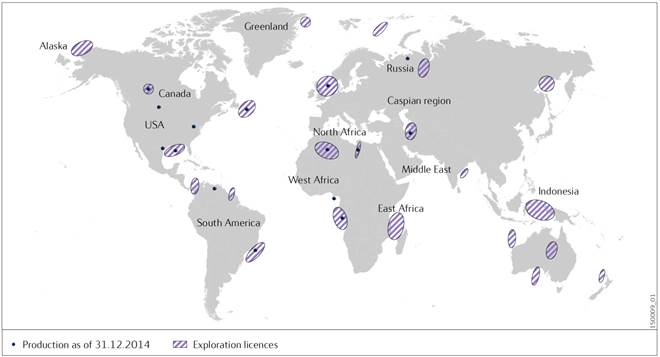
Statoil, Annual Report on Form 20-F 201425
Key events and portfolio developments in 2014:
·In February, BHP Billiton notified the Stampede partners of their election to withdraw from the project. Statoil now has an additional 5% interest in the project so Statoil’s interest increased from 20% to 25%. Statoil together with co-owners announced it has sanctioned the Stampede project in October 2014.
·Over the course of 2014, Statoil has reduced its ownership interest from 25.5% to 15.5% in Shah Deniz in Azerbaijan and South Caucasus Pipeline (SCP). In March 2014 Statoil closed the sale of 3.33% to BP, and in May 2014 Statoil closed the sale of 6.67% to SOCAR thereby completing the 10% farm down in Shah Deniz and SCP.The effective date was 1 January 2014.
·Statoil and its partner, PTTEP in the Kai Kos Dehseh (KKD) oil sands project in Alberta, Canada, completed the agreement in May to divide their respective interests in the KKD oil sands project in northeast Alberta, Canada with an effective date 1 January 2013.
·The CLOV oil project in Block 17, Angola, started production in June 2014.
·In September 2014, Statoil closed the sale of its 5% interest in Block 15/06 offshore Angola to the concessionaire Sonangol E.P. The effective date was 1 January 2013.
·In September, Statoil announced a postponement of the Corner field development at the KKD oil sands project in Alberta, Canada.
·In October 2014, Statoil signed an agreement with the Malaysian oil and gas company PETRONAS to divest its remaining 15.5% interest in Shah Deniz and the SCP. The effective date of the transaction is 1 January 2014. Statoil expects that the transaction will be closed in the first half of 2015, pending government approval and other conditions.
·The oil fieldsJack and St. Maloin the U.S. started production in December.
·In December, Statoil announced an agreement to reduce its working interest in the non-operated US southern Marcellus onshore asset from 29% to 23%, following a USD 394 million transaction with Southwestern Energy. The transaction was closed in the first quarter of 2015.
·Eleven wells (exploration and appraisal) were announced as discoveries in 2014, including the Seat 2 discovery in Brazil and the Piri and Giligiliani (Statoil-operated) discoveries in Tanzania, totalling five Statoil high-impact discoveries offshore in Tanzania over the last two years.
·Time-out in the Kwanza exploration drilling programme, as a consequence a rig contract was cancelled.
·In 2014 Statoil, accessed five new basins in Algeria, Colombia, Myanmar, Australia and New Zealand and has also secured new acreage through 12 new exploration licences awarded in the UK 28th licensing round (9 as operator) and 10 leases in the Central US Gulf of Mexico lease sales.
·Significant impairment losses on assets and oil and gas prospects and signature bonuses were recognised in 2014, see section Financial review – Operational and financial review – DPI profit and loss analysis for further details.
The profitability of our industry continues to be challenged. Statoil’s response to the industrial challenge characterised by escalating cost and declining returns is addressed in the section Strategy and market overview.
3.6.2 International production
Statoil's entitlement production outside Norway was about 32% of Statoil's total entitlement production in 2014.
The following table shows DPI's average daily entitlement production of liquids and natural gas for the years ending 31 December 2014, 2013 and 2012. Entitlement production figures are after deductions for royalties paid in kind, production sharing and profit sharing. As of fourth quarter 2013, entitlement production from the upstream segment in the US is presented net of royalties.
| For the year ended 31 December | Entitlement production | 2014 | 2013 | 2012 | | | | | Oil and NGL (mboe per day) | 403 | 373 | 342 | Natural gas (mmcm per day) | 29 | 26 | 20 | Total (mboe per day) | 586 | 539 | 470 | | | | | Total - net of US royalties (mboe per day) | 546 | 502 | 443 |
26Statoil, Annual Report on Form 20-F 2014
The table below provides information about the fields that contributed to production in 2014
Producing fields during calendar year 2014
Field | Statoil's equity interest in % | Operator | On stream | Licence expiry date | Average daily equity production mboe/day | Average daily entitlement production mboe/day (1) | | | | | | | | | | | | | | | North America | | | | | 268.1 | 227.1 | | Canada: Hibernia/Hibernia tie-in (2) | Varies | HMDC | 1997 | 2027 | 5.9 | 5.9 | | Canada: Leismer Demo | 60.00 | Statoil | 2010 | HBP (3) | 13.7 | 13.7 | | Canada: Terra Nova | 15.00 | Suncor | 2002 | 2022 | 6.9 | 6.9 | | USA: Bakken (4) | Varies | Statoil/others | 2011 | HBP | 53.6 | 42.8 | | USA: Caesar Tonga | 23.55 | Anadarko | 2012 | HBP | 6.8 | 6.6 | | USA: Eagle Ford (4) | Varies | Talisman/Statoil | 2010 | HBP | 34.5 | 25.9 | | USA: Jack | 25.00 | Chevron | 2014 | HBP | 0.2 | 0.2 | | USA: Marcellus (4) | Varies | Chesapeake/Statoil | 2008 | HBP | 128.8 | 110.7 | | USA: St. Malo | 21.50 | Chevron | 2014 | HBP | 0.2 | 0.2 | | USA: Tahiti | 25.00 | Chevron | 2009 | HBP | 17.4 | 14.2 | | | | | | | | | | | South America | | | | | 56.4 | 56.4 | | Brazil: Peregrino | 60.00 | Statoil | 2011 | 2034 | 44.7 | 44.7 | | Venezuela: Petrocedeño (5) | 9.68 | Petrocedeño | 2008 | 2033 | 11.7 | 11.7 | | | | | | | | | | | Sub-Saharan Africa | | | | | 254.7 | 166.6 | | Angola: Block 4/05 | 20.00 | Sonangol P&P | 2009 | 2026 | 1.5 | 1.3 | | Angola, Block 15 | 13.33 | ExxonMobil | 2004 | 2026-32 (6) | 43.6 | 19.3 | | Angola, Block 17 | 23.33 | Total | 2001 | 2022-34 (6) | 139.1 | 85.8 | | Angola, Block 31 | 13.33 | BP | 2012 | 2031 | 22.2 | 20.2 | | Nigeria: Agbami | 20.21 | Chevron | 2008 | 2024 | 48.3 | 40.0 | | | | | | | | | | | North Africa | | | | | 57.5 | 31.0 | | Algeria: In Amenas | 45.90 | Sonatrach/BP/Statoil | 2006 | 2022 | 17.7 | 10.4 | | Algeria: In Salah | 31.85 | Sonatrach/BP/Statoil | 2004 | 2027 | 36.3 | 18.5 | | Libya: Mabruk | 12.50 | Total | 1995 | 2033 | 0.9 | 0.7 | | Libya: Murzuq | 10.00 | Repsol | 2003 | 2033 | 2.6 | 1.5 | | | | | | | | | | | Europe and Asia | | | | | 106.9 | 64.4 | | UK: Alba | 17.00 | Chevron | 1994 | 2018 | 2.6 | 2.6 | | UK: Jupiter | 30.00 | ConocoPhillips | 1995 | HBP | | | | Azerbaijan: ACG | 8.56 | BP | 1997 | 2024 | 54.6 | 19.7 | | Azerbaijan: Shah Deniz | 18.51 (7) | BP | 2006 | 2041 | 40.4 | 36.1 | | Russia: Kharyaga | 30.00 | Total | 1999 | 2032 | 9.2 | 6.0 | | | | | | | | | | | Total Development and Production International (DPI) | | | 743.6 | 545.5 | | | | | | | | | | | (1) | In 2013, Statoil changed its policy for reporting U.S. entitlement volumes from including royalty volumes to excluding royalty volumes. | | (2) | Hibernia and Hibernia tie-in (Statoil working interest 5% and 10.5% respectively) | | (3) | Held by Production (HBP): A company’s right to own and operate an oil and gas lease is perpetuated beyond its original primary term, as long thereafter as oil and gas is produced in paying quantities. In the case of Canada, besides continue being in production status, other regulatory requirements must be met. | | (4) | Statoil’s actual working interest can vary depending on wells and area. | | (5) | Petrocedeño is a non-consolidated company and accounted for pursuant to the equity accounting method. | | (6) | Varies by field. | | | | | | | | (7) | Time weighted average. Statoil reduced its holding from 25.5% to 15.5% in 2014, and has signed an agreement to divest its remaining stake. | | | | |
Statoil, Annual Report on Form 20-F 201427
The table below provides information about production per country in 2014.
Country | Average daily equity production mboe/day (1) | Average daily entitlement production mboe/day (2) | | | | | | | | | | | North America | 268.1 | 227.1 | | Canada | 26.6 | 26.6 | | USA | 241.5 | 200.5 | | | | | | | South America | 44.7 | 44.7 | | Brazil | 44.7 | 44.7 | | | | | | | Sub-Saharan Africa | 254.7 | 166.6 | | Angola | 206.4 | 126.6 | | Nigeria | 48.3 | 40.0 | | | | | | | North Africa | 57.5 | 31.0 | | Algeria | 54.0 | 28.8 | | Libya | 3.5 | 2.2 | | | | | | | Europe and Asia | 106.9 | 64.4 | | Azerbaijan | 95.0 | 55.9 | | Russia | 9.2 | 6.0 | | UK | 2.6 | 2.6 | | | | | | | Total Development and Production International (DPI) | 732 | 534 | | | | | | | Equity accounted production | | | | Venezuela: Petrocedeño (3) | 11.7 | 11.7 | | | | | | | Total Development and Production International (DPI) including share of equity accounted production | 744 | 546 | | | | | | | (1) | In PSA countries our share of capital expenditures and operational expenses are computed on the basis of equity production. | | (2) | In 2013, Statoil changed its policy for reporting U.S. entitlement volumes from including royalty volumes to excluding royalty volumes. | | (3) | Petrocedeño is accounted for pursuant to the equity accounting method. | | | | | | | The following sections provide information about the main producing assets internationally. See section Financial review - Operating and financial review - DPI profit and loss analysis for a discussion of the results of operations for year end 2014. | |
3.6.2.1 North America
Production in North America comprises Canada and the USA.
Canada
Statoil entered the Alberta oil sands in 2007 through a corporate acquisition of North American Oil Sands Corporation, and subsequently farmed down 40% of our interest in the Kai Kos Dehseh (KKD) oil sands project to PTTEP in January 2011. In January 2014, Statoil and PTTEP agreed to divide their respective interests in the KKD oil sands project with an effective date of 1 January 2013. The completion of the transaction was subject to customary regulatory approvals in Canada and was closed in May, 2014.
Following the transaction with PTTEP, Statoil continues as operator and 100% working interest owner for the Leismer and Corner projects (see section Development and Production International – Fields under development – North America) which together comprise 123,200 net acres of oil sands leases in Alberta. The Leismer Demonstration Plant (LDP) is the first phase of the KKD development and has been in production since 2011.
In addition, we have interests in the Jeanne d'Arc Basin offshore the province of Newfoundland and Labrador in the partner operated producing fields Hibernia and Hibernia tie-in (Statoil interest 5% and 10.5% respectively), Terra Nova (Statoil interest 15%) and in the Hebron development project (Statoil interest 9.7%).
28Statoil, Annual Report on Form 20-F 2014
USA
Statoil has had a strong growth in production within US shale since entering the first play in 2008, up to its current level of 242 mboe per day in 2014.
Statoil entered the Marcellusshale gas play (located in the Appalachian region in north east USA) in 2008 through a partnership with Chesapeake Energy Corporation, acquiring 32.5% of Chesapeake's 1.8 million acres in Marcellus. Statoil has continued to acquire acreage within the play, with a net acreage position of 519,000 acres, including 91,000 net acres acquired in December 2012 where it is now operating. Divestments of non-core acreage have also taken place during 2014 to high-grade our portfolio. The most recent high grading occurred in a transaction with Southwestern. The divested share represents approximately 30,000 acres and 4,000 barrels of oil equivalent per day. Southwestern has taken over operatorship in this US southern Marcellus onshore area through a transaction with Chesapeake in December 2014.
Marcellus provides Statoil with a long-life gas asset and considerable optionality in relation to the timing of drilling and production from these leases. Price development and continued improvement in operational efficiency are important variables in determining development plans.
Statoil entered the Eagle Ford shale formation (located in southwest Texas) in 2010. Through agreements with Enduring Resources LLC and Talisman Energy Inc., Statoil acquired 67,000 net acres. In 2013, Statoil became operator for 50% of the Eagle Ford acreage, in line with the agreement with Talisman Energy Inc. from 2010. The transfer to operatorship was conducted as a phased process in order to maintain high HSE standards, and operational and business continuity. Statoil gradually took over operatorship, starting from the first quarter 2013, to obtain full operatorship of the Statoil operated acreage by the start of the third quarter of 2013. As a result of a few minor transactions, Statoil's net acreage position at the end of 2014 was 59,000 acres.
Statoil entered the Bakken and Three Forkstight oil plays through the acquisition of Brigham Exploration Company in December 2011. Statoil is positioning as a leading player in the fast-growing US onshore oil and gas industry, which is in line with the strategic direction it has set out. Statoil has developed industrial capabilities step-by-step through early entrance into Marcellus and Eagle Ford. Taking on first operatorship through Bakken represented a new significant step for Statoil. Statoil's net acreage position in Bakken at the end of 2014 was 265,000 acres.
In deepwater Gulf of Mexico, the Tahiti oil field (Statoil interest 25%) is operated by Chevron. The field is located in the Green Canyon area. There are currently eight producing wells and two water injectors connected to a floating facility, and the field development plan includes additional production and injection wells which will be phased in over time.
The Caesar Tonga oil field (Statoil interest 23.55%) is operated by the Anadarko Petroleum Company. The field is located in the Green Canyon area. There are currently four producing wells tied back to the Anadarko-operated Constitution spar host. At the end of 2014, a fifth well had been drilled and completed in the first quarter of 2015.
The oil fields for Jack (Statoil interest 25%) and St. Malo (Statoil interest 21.5%) (JSM) are located in Walker Ridge. The fields are tiebacks to the JSM floating production unit and both are operated by Chevron. First production was achieved in December 2014. Currently there is one well producing on Jack and a second production well for St. Malo came online in the first quarter of 2015.
3.6.2.2 South America
Statoil's production activities in South America comprise the Peregrino operatorship in Brazil and the
Petrocedeño project in Venezuela.
Brazil
The Peregrino field is a heavy oil field located in the Campos Basin, about 85 kilometres off the coast of Rio de Janeiro. The field came on stream in 2011.The oil is produced from two wellhead platforms with drilling capability and it is processed on the Peregrino FPSO. Statoil holds a 60% ownership interest in the field and is operator.
Venezuela
Venezuela Statoil has a 9.7% interest in Petrocedeño, one of the largest extra-heavy crude oil projects in Venezuela. The field is located onshore in the Orinoco Belt area. Petrocedeño S.A, which is owned by project partners PDVSA, Total and Statoil, operates the field with related facilities and markets the products.
3.6.2.3 Sub-Saharan Africa
Statoil's production activities in Sub-Saharan Africa comprise the Agbami project in Nigeria and four Angolan offshore blocks.
Angola
The Angolan continental shelf is the largest contributor to Statoil's oil production outside Norway. The production comes from Block 4/05, Block 15, Block 17 and Block 31.
Statoil, Annual Report on Form 20-F 201429
Block 17 comprises production from four FPSOs; CLOV, Dalia, Girassol and Pazflor. The CLOV project, consisting of the Cravo, Lirio, Orchidea and Violeta fields, came on stream in June 2014 and production was ramped up to design capacity of 160 mboe/d in 2014 ahead of schedule. Block 17 is operated by Total, and Statoil holds a 23.3% interest.
Block 15 has production from four FPSOs: Kizomba A, Kizomba B, Kizomba C-Mondo, and Kizomba C-Saxi Batuque. Block 15 is operated by Esso Angola, a subsidiary of ExxonMobil, and Statoil holds a 13.3% interest.
Block 4/05 has production from the Gimboa FPSO. Sonangol P&P is the operator for block 4/05 and Statoil holds a 20% interest.
Block 31 has production from the PSVM FPSO. BP is the operator for Block 31 and Statoil holds a 13.3% interest.
Nigeria
In Nigeria, Statoil has a 20.2% interest in the country's largest deepwater producing field, Agbami, where Chevron is the operator.
The National Assembly of Nigeria is still debating the Petroleum Industry Bill (PIB), which will most likely increase the government take if passed. The timing and outcome of the bill are uncertain.
Together with our partner Chevron, we have initiated arbitration against the national oil company NNPC concerning the interpretation of certain clauses in Oil Mining Licence (OML) 128 production sharing contract which covers Statoil's part of the Agbami field. (see note 23 Other commitments and contingencies in the Consolidated financial statements).
Through our ownership in OML 128 in Nigeria, Statoil is party to an ownership interest redetermination process for the Agbami field, for which the outcome is uncertain (see note 23 Other commitments and contingencies in the Consolidated financial statements).
3.6.2.4 North Africa
Statoil had in 2014 production in North Africa from Algeria and Libya.
Algeria
The In Amenas onshore development is the fourth-largest gas development in Algeria. It contains significant liquid volumes. The facilities are operated through a joint operatorship between Sonatrach, BP and Statoil, where Statoil's share of the investments (working interest) is 45.9%. A contract of association, including mechanisms for revenue sharing, governs the rights and obligations of the joint operatorship between Sonatrach, BP and Statoil.
The In Amenas plant has since April 2013 produced from two out of three trains. The production has been stable. The third train, which was damaged in the January 2013 terror attack, is expected to restart in 2015.
The In Salah onshore gas development in which Statoil has a working interest of 31.9% is Algeria's third-largest gas development. A contract of association, including mechanisms for revenue sharing, governs the rights and obligations of the joint operatorship between Sonatrach, BP and Statoil.
In late August 2014 Statoil and its partners in Algeria completed the return of personnel to ordinary operations at In Salah and In Amenas. This was a stepwise and thorough process with implementation of new security measures and validation of their effectiveness. When all requirements for a return were in place, Statoil made the decision to return to the In Amenas facility. Statoil will continue to monitor the threat picture in Algeria and take appropriate action if necessary.
Libya
Statoil is a partner in two licences, Murzuq and Mabruk. Statoil has a 10% share of investments (working interest) in the NC 186 licence in the Murzuq field, which is operated by Akakus Oil Operations, with Repsol as the lead partner for the international oil companies. Statoil has a 12.5% share of investments (working interest) in the C-17 licence in the Mabruk field, which is operated by Mabruk Oil Operations. Total is the lead partner for the international oil companies in the C-17 licence Mabruk.
The unrest in Libya has continued in 2014. The fields Mabruk and Murzuq have been affected with outage in production at various points in time. Statoil expects that this can continue to be the situation. (The production from Libya is not a significant part of total international production).
Statoil continues to be represented in Tripoli through a small office manned by local staff.
30Statoil, Annual Report on Form 20-F 2014
3.6.2.5 Europe and Asia
Statoil's production in Europe and Asia encompasses Azerbaijan, Russia and the United Kingdom.
Azerbaijan
Statoil has an 8.6% stake in the Azeri-Chirag-Gunashli (ACG) oil field and a 15.5% share in the Shah Deniz gas and condensate field. BP is the operator for both fields.
The Chirag Oil Project, the sixth platform on the ACG oil field, came on stream in late January 2014. It has a design capacity of 185 mboe per day.
Statoil has an 8.7% stake in the 1,760 km Baku-Tbilisi-Ceyhan (BTC) oil pipeline that is used to transport most of the ACG oil and Shah Deniz condensate to the southern Turkish port of Ceyhan, enabling liquids to be shipped to the world's markets.
Statoil has a 15.5% share in the South Caucasus Pipeline (SCP) , which transports the Shah Deniz gas from Azerbaijan through Georgia to the eastern Turkish border. Statoil is the commercial operator of the SCP Company, responsible for commercial operations relating to SCP. Statoil also runs the Azerbaijan Gas Sales Company, which was established to manage gas allocation and sales to customers in Azerbaijan, Georgia and Turkey.
Statoil has in 2014 reduced its ownership interest from 25.5% to 15.5% in Shah Deniz and SCP. In March 2014 Statoil closed the sale of 3.33% to BP, and in May 2014 Statoil closed sale of 6.67% to SOCAR thereby completing the 10% farm down in Shah Deniz and SCP. The effective date was 1 January 2014. In October 2014 Statoil signed an agreement with the Malaysian oil and gas company PETRONAS to divest its remaining 15.5% interest in Shah Deniz and SCP. The effective date of the transaction is 1 January 2014. Statoil expects that the transaction will be closed in the first half of 2015, pending government approval and other conditions.
Russia
Statoil has a 30% share in the Kharyaga oil field onshore in the Timan Pechora basin in north-west Russia. The field is being developed in phases under a production sharing agreement (PSA), and it is operated by Total.
United Kingdom
In the UK, Statoil is a partner in two production licences. The Alba oil field (Statoil interest 17%) is located in the central part of the UK North Sea and is operated by Chevron. Jupiter (Statoil interest 30%) is a gas field located in the southern part of the UK North Sea, operated by ConocoPhillips.
3.6.3 International exploration
Statoil continues with high international exploration activity in 2014.
In 2014 Statoil carried out significant international exploration activity, as is shown by the company's involvement in 23 completed wells (including both Statoil-operated and partner-operated activities). 11 wells (exploration and appraisal) were announced as discoveries in the period, including the Piri and Giligiliani (Statoil-operated) discoveries in Tanzania, which adds up to five Statoil discoveries offshore in Tanzania the last two years. A total of five wells were reported dry, while seventeen wells were under evaluation at the year, end.including appraisals of earlier discoveries.
| The table below shows the exploratory wells drilled internationally in the last three years.
| | 2014 | 2013 | 2012 | | | | | | North America | - Statoil operated | 3 | 7 | 3 | | - Partner operated | 0 | 4 | 6 | South America/sub-Saharan Africa | - Statoil operated | 8 | 6 | 5 | | - Partner operated | 9 | 4 | 7 | | - Partner operated | 0 | 1 | 1 | Europe and Asia | - Statoil operated | 2 | 0 | 3 | | - Partner operated | 1 | 2 | 2 | | | | | | | Totals | 23 | 24 | 27 |
Statoil, Annual Report on Form 20-F 201431
The regions where Statoil had exploration activity in 2014 are presented below.
North America
USA
Statoil operated two wells in the Gulf of Mexico (Martin and Perseus exploration wells). Martin was a technical discovery, but not commercial, while Perseus did not encounter any hydrocarbons. Statoil still has a number of promising prospects in its Gulf of Mexico portfolio and is aiming to continue its drilling activities in 2015, with the Maersk Developer, which is on contract through November 2015. Statoil is currently drilling the Yeti prospect.
Canada
The West Hercules arrived in Canada in November 2014, for a 550 days drilling campaign. The rig has drilled a well and a sidetrack on the Bay de Verde structure adjacent to Bay du Nord. At year end, data acquisition was ongoing in the side track. The rig will continue the appraisal programme throughout most of 2015, and drill some new prospects in the Flemish Pass Basin. The drilling programme is an important investment to support our goal in becoming a producing operator offshore Newfoundland.
South America and sub-Saharan Africa
Angola
Statoil acquired a solid acreage position in the pre-salt play of the Kwanza Basin in 2011 with the operatorship in Block 38 and 39 and partner position in Blocks 22, 25 and 40. Seismic 3D surveys were acquired in 2012 and the first well Dilolo-1 was spudded in Block 39 in the second quarter of 2014. After completion of Dilolo-1 the drillship Stena Carron moved to Block 38 to drill Jacare-1 in the third quarter of 2014. Both of these wells were dry. Based on disappointing well results and the need for further evaluation, Statoil decided to terminate the rig contract with Stena Carron. Drilling activities were also carried out in partner operated blocks, with Puma-1 in Block 25. Repsol spudded the Locosso-1 well in Block 22 in the second quarter of 2014 and the well was completed in November.
Brazil
In December 2014 acquisition of 10000km2 of 3D seismic over the 11th bid round blocks was concluded, Statoil operated this campaign on behalf of all the partners. Acquisition was initiated in May 2014, and the final data are expected to be delivered in the second quarter of 2016. The exploration appraisal activities in BM-ES-22A and BM-C-33 continued, comprising the conclusion of the São Bernardo DST and Montanhês well in the former, and the completion of SEAT-2, SEAT-2 DST (temporarily suspended) and drilling of Pao-A1 appraisal wells in the latter. The decision on the way forward on these appraisals is pending further appraisal well drilling and analysis. After drilling the Juxia well in block C-M-530, licence BM-C-47, the decision was made to relinquish the block. The well was P&A as dry. In the BM-C-7 licence, part of the C-M-529 block will be unitised to Peregrino Phase II which developed as a result of the 2011 Peregrino South well discovery. In J-3, the Lua Nova appraisal remains suspended. The environmental licencing process for this license is expected to last another 1-2 years.
Mozambique
The Rovuma area 2 & 5 was relinquished with effect from June 2014. The 5th licence round started in October 2014. The outcome of the licence round is expected to be announced during the second quarter of 2015. Statoil will keep the office in Mozambique until we know the outcome of the licence round.
Tanzania
Four exploration wells have been drilled so far in 2014. The discoveries of natural gas in Piri-1 and Giligiliani-1 have significantly increased the total in-place volumes in Block 2. Binzari -1 and Kungumanga-1 resulted in a technical discovery and a dry well. Relating to the Zafarani-1 discovery made in 2012 two successful production tests have been conducted in the Zafarani-2 appraisal well followed by the second and last appraisal well, Zafarani-3. Also Piri-2 will be drilled in 2014 (ongoing operation at year end).
In May 2013, Statoil acquired a 12% working interest in Block 6 from operator Petrobras Tanzania Ltd. This block has now been relinquished.
Middle East and North Africa
Azerbaijan
The Joint Study Agreement (JSA) with SOCAR for the 170 thousand square kilometer North Absheron area was completed in 2014. A new JSA with SOCAR was signed in November 2014, covering the Karabakh- Ashrafi -Dan Ulduzu areas with an approximate duration of 2 years.
Exploration screening and prospect evaluation is being carried out on an ongoing basis for Azerbaijan offshore areas in order to identify new access opportunities.
Algeria
Statoil and Shell were awarded the 2730 km2 Timissit Permit Licence in the Illizi-Ghadames Basin onshore Algeria in September 2014. Statoil will be the operator with 30% equity, Shell will hold 19% equity and the remaining 51% will be held by Sonatrach. The award represents an opportunity to test a potentially large shale resource play.
32Statoil, Annual Report on Form 20-F 2014
Europe (excluding Norway), Asia and Australia
UK
In 2014 Statoil was awarded interests in 12 exploration licences in the UK 28th licensing round, 9 as operator. Significant positions have been taken both in mature parts of the Central North Sea, such as in the vicinity of the Mariner and Bressay projects, and in relation to play largely untested in UK waters. 11 of the licences are in the North Sea and the remaining one is west of the Hebrides. In terms of size, this additional acreage constitutes almost 8000 Km² and thus represents access at scale.
Statoil also participated in the drilling of North Sea exploration well Kookaburra in block 28/15 in the first quarter of 2014. The well was dry.
Statoil is planning to drill two exploration wells in 2015 in acreage acquired in the previous UK licensing round, and sees the potential for maturing several additional drilling candidates also on the 28th round acreage.
Greenland
Statoil, along with partners ConocoPhillips and Nunaoil, was awarded block 6 in the East Greenland licence round in December 2013. Statoil will be operator of the block. The licence has a 16-year exploration period. The first work to be carried out will be seismic acquisition, after which a decision on further work will be made. Statoil previously carried out both shallow core drilling and scientific work in the area to understand the operating environment.
In West Greenland (Baffin Bay), Statoil has decided to withdraw from its positions in the Shell-operated Anu and Napu licences as well as the Cairn-operated Pitu licence. The decision to exit is based on a review of the value potential in the licences and gaged against other options in the portfolio.
Faroe Islands
In 2014, Statoil drilled the Brugdan II well in licence 006 and the Sula Stelkur well in licence 008. Both wells were dry. Due to disappointing well results Statoil have now made the decision to relinquish three licences, whilst retaining license 008.
Russia
In June 2013, Statoil and Rosneft signed agreements that complete the contractual framework of their joint venture to explore offshore frontier areas in the Sea of Okhotsk and in the Barents Sea. An acquisition of 2D seismic data in the Sea of Okhotsk was completed in September 2013. The requirements for the four offshore licences operated by the Rosneft-Statoil joint-venture include the drilling of six exploration wells in the period from 2016 to 2021.
In December 2013, Statoil and Rosneft signed the shareholders and operating agreement for a joint venture to assess the feasibility of commercial production from the Domanik limestone formation. The pilot programme will include data acquisition, and the drilling and hydraulic fracturing of pilot wells in twelve licence blocks in the Samara region. See the section Risks – Risks related to our business for information regarding sanctions towards Russia imposed in 2014.
Indonesia
The Cikar-1 well in the West Papua IV licence was temporarily suspended by the operator Niko in March 2013. Statoil is currently evaluating several follow-up opportunities in this licence and the neighbouring Aru licence. 2D seismic data acquisition in the Statoil-operated Halmahera II PSC was completed in July 2013 and data processing is ongoing. Statoil is constantly working on optimizing its portfolio in Indonesia and has therefore withdrawn from the Obi and the North Makassar Strait PSC. All firm well commitments were fulfilled in North Makassar Strait, the West Papua IV, the Kuma, and Karama PSCs.
Australia
In the Ceduna sub-basin in the Great Australian Bight, Statoil holds 30% in four exploration permits with BP as Operator. Currently the partnership is preparing for a drilling campaign starting in 2016. Ongoing licence activities includes maturation of further drilling candidates in the 24 000 Km² permit area.
Statoil drilled five wells onshore South Georgina in 2014. Hydrocarbons were encountered, but testing of two wells gave no hydrocarbon flow to surface. Based on the data collected Statoil has concluded that there is no remaining prospectivity within the four permits and decided to exit the licences.
In October 2014, Statoil obtained 100% equity share in an exploration permit in the Exmouth Plateau in North Carnarvon basin. The permit covers an area of 13700 Km² and water depth is around 1500 m. Statoil has committed to collect 2000 line kilometres of 2D seismic and 3,500 Km² of 3D seismic data within three years. Based on analysis of this information, Statoil will decide on further steps.
New Zealand
Statoil is operator with 100% equity share in petroleum exploration permits 55781 and 57057 in the Reinga Basin offshore Northland’s west coast. The licences were awarded in the New Zealand Block Offer 2013 and 2014 respectively. The permits cover 11670 Km² and are located approximately 100 km from shore to the west of New Zealand's North Island, in water depths ranging from 1000m to 2000m.
The work programme is designed to fully evaluate the prospectivity of the licences in a step-wise manner within the 15-year permit timeframe. Statoil is committed to collect new 2D seismic data and to undertake seafloor surveys within the first three years. Following an analysis and interpretation of this data, Statoil will decide on further steps.
In the New Zealand Block Offer 2014 Statoil was also awarded 50% working interest in blocks 57083, 57085 and 57087 with Chevron as operator. The permits are located in the East Coast and Pegasus basins, southeast off New Zealand’s North Island. The permits cover more than 25000 Km² and sit in water depths between 800m and 3000m. The initial phase of the project will consist of data collection.
Statoil, Annual Report on Form 20-F 201433
3.6.4 Fields under development internationally
The main sanctioned development projects in which DPI is involved are in Angola, Azerbaijan, Brazil, Canada, Ireland, the UK and the USA.
This section covers selected projects under development and significant pre-sanctioned projects.
Sanctioned projects* | Operator | Statoil's share at 31 December 2014 | Time of sanctioning | Production start | | | | | | | | | | | USA: Big Foot | Chevron | 27.50% | 2010 | 2015 | | USA: Heidelberg | Anadarko | 12.00% | 2013 | 2016 | | USA: Julia | Exxon Mobil | 50.00% | 2013 | 2016 | | USA: Stampede | Hess | 25.00% | 2014 | 2018 | | Canada: Hebron | Exxon Mobil | 9.70% | 2012 | 2017 | | Ireland: Corrib | Shell | 36.50% | 2001 | 2015 | | Algeria: In Salah Southern Fields | Sonatrach/BP/Statoil | 31.85% | 2010 | 2015 | | Angola: Block 15, Kizomba Satellites phase 2 | Esso Angola | 13.33% | 2013 | 2015 | | Algeria: In Amenas Compression project | Sonatrach/BP/Statoil | 45.90% | 2010 | 2016 | | UK, Mariner | Statoil | 65.10% | 2012 | 2017 | | Azerbaijan: Shah Deniz phase 2 ** | BP | 15.50% | 2013 | 2018 | | Brazil, Peregrino Phase II *** | Statoil | 60.00% | 2015 | 2019 | | | | | | | | | * ** *** | Not exhaustive Statoil has signed an agreement to divest its remaining 15.5% in Shah Deniz. Transaction expected to be closed in the first half of 2015. Statoil made the investment decision on Peregrino phase 2 project in December 2014 and submitted the Plan of Development to Brazilian authorities in Jan. 2015. | |
3.6.4.1 North America
Statoil has a number of significant ongoing development projects in North America.
USA Gulf of Mexico
Statoil has a 27.5% interest in Big Foot located in Walker Ridge block 29. Big Foot is operated by Chevron and will be developed with a dry tree tension leg platform with a drilling rig. First oil from Big Foot is currently scheduled for 2015, delayed from the fourth quarter of 2014. The project made the necessary progress in 2014 but the start-up is delayed as a result of delayed installation due to loop currents offshore.
Discovered in 2007, Statoil has a 50% working interest in the Julia field located in Walker Ridge area of the Gulf of Mexico, which comprises five blocks. Julia is one of the major discoveries in the Paleogene. Exxon Mobil is the operator and the field will be developed with subsea wells tied back to the Jack-St. Malo production platform. First oil is expected for mid-2016.
Statoil has a 12% interest in Heidelberg located in Green Canyon block 859. Heidelberg is operated by Anadarko Petroleum Corp. and was sanctioned in April 2013. Project development includes a SPAR and subsea trees. First oil from Heidelberg is scheduled for mid-2016.
USA Onshore
In addition to offshore development projects, North America production growth is also boosted significantly by the continued ramp-up from the shale plays Bakken, Eagle Ford and Marcellus (see section Business overview – Development and Production International (DPI) – International Production – North America for further information).
Canada
Statoil is the operator of the KKD Oil Sands Partnership. The first phase, the Leismer Demonstration Project, came
|
Statoil, Annual Report on Form 20-F 201623
Fields under development on the NCS
Statoil’s major development projects on the NCS as of 31 December 2016:
Johan Sverdrup (Statoil 40.03%, operator, with additional 4.54% indirect interest held through Lundin)is an oil discovery in the North Sea. A plan for development and operation was submitted in February 2015 and approved by the Norwegian authorities in August 2015. Phase 1 of the development will consist of 35 production and water injection wells and a field centre with four platforms: A living quarter platform, a wellhead platform with permanent drilling facility, a processing platform and a riser and utility platform. Crude oil will be exported to Mongstad through a 274 km long dedicated pipeline, and gas will be exported to the gas processing facility at Kårstø through a 156 km long pipeline via a subsea connection to the Statpipe pipeline. On 1 March 2016, the drilling of the first well of the Johan Sverdrup field development commenced. Production is expected to start in 2019.
Aasta Hansteen(Statoil 51%, operator) is a deep water gas discovery in the Norwegian Sea. The field development concept includes three subsea templates tied in to a floating processing unit with gas export through a new pipeline, Polarled, to Nyhamna and further exportation through the Langeled pipeline. The Aasta Hansteen processing unit can also serve as a hub for other potential discoveries in the area. On 9 January 2016, the living quarter was lifted onto the topside, which is under construction in South Korea. On 27 July 2016, the final megablock was lifted onto the substructure in South Korea. Production is expected to start in 2018.
Gina Krog(Statoil 58.7%, operator) is an oil and gas discovery in the North Sea. The field development concept includes a steel-jacket platform and a total of 15 wells. Oil will be exported via offshore loading from a floating storage unit. Due to the high condensate content, the rich gas will be exported via Sleipner, where it will be further processed. The development concept also includes gas injection in order to maximise the recovery factor for the field. On 20 July 2015, the drilling of the first well of the Gina Krog field development commenced, and the drilling operations continued in 2016. On 23 August 2016, all the topside modules had been lifted in place, and the Gina Krog platform was complete in the field. Production is expected to start in 2017.
The Utgard development (Statoil 38.44% interest in the Norwegian and 38% in the UK sector, operator) will include two wells in a standard subsea concept, with one drilling target on each side of the UK-Norwegian maritime border. Gas and condensate will be piped through a new pipeline to the Sleipner field for processing and further transportation to market. On 17 January 2017, the plan for development and operation and the field development plan were approved by Norwegian and UK authorities. Production is expected to start in 2019.
The Trestakk discovery (Statoil 59.1%, operator) will be developed with five wells, three producers and two injectors, to be tied in to the Åsgard A installation for processing, measurement and gas injection. On 1 November, 2016, Statoil, on behalf of the licensees, submitted the plan for development and operation. Production is expected to start in 2019.
Oseberg Vestflanken 2 (Statoil 49.3%, operator) is the development of the oil and gas structures Alfa, Gamma and Kappa. The well stream will be routed to the Oseberg field centre through a new pipeline. The plan for development and operation was approved by the Ministry of Petroleum and Energy in June, 2016. The discoveries will be developed using an unmanned wellhead platform. Production is expected to start in 2018.
Gullfaks C subsea compression (Statoil 51%, operator), an increased gas recovery project for the Gullfaks Sør Brent reservoir, includes the installation of a subsea compressor solution in the vicinity of the L/M template in order to prolong the gas production plateau at Gullfaks C and increase the recoverable reserves from the Gullfaks Sør Brent reservoir. The compressor is expected to come on stream in 2017.
Byrding (Statoil 70%, operator)will be developed as a subsea installation with one well drilled from an existing template on Fram H-Nord. On 17 January 2017, the Norwegian Ministry of Petroleum and Energy approved the plan for development and operation. Production is expected to start in 2017.
Troll B gas module (Statoil 30.58%, operator), a new gas module being installed to increase the processing capacity at Troll B, was sanctioned in September 2016, and is expected to be brought on stream in early 2011. In 2014, Statoil decided to postpone the Corner project at the KKD oil sands project in Alberta, Canada. As a consequence, an impairment loss related to the KKD asset has been recognised. See section Financial review – Operational and financial review – DPI profit and loss analysis for further details.
Offshore Newfoundland, Statoil has a 9.7% interest in the Exxon-operated Hebron field located in the Jeanne d'Arc basin near the other partner-operated fields Terra Nova and Hibernia. First oil is expected in 2017. The Hebron field will be developed using a fixed gravity base structure (GBS).
34Statoil, Annual Report on Form 20-F 2014
3.6.4.2 South America
In January 2015 Statoil submitted the Plan of Development (PoD) for Peregrino Phase II project in Brazil.
In December 2014, Statoil approved the investment decision for the development of the second phase of the Peregrino oil field. In January 2015 the PoD was submitted to the Brazilian National Agency of Petroleum, Natural Gas and Biofuels (ANP) for approval. Peregrino Phase II project includes the Peregrino South and South West discoveries. The development consists of one wellhead platform tied back to the existing FPSO.
3.6.4.3 Sub-Saharan Africa
In Sub-Saharan Africa, Statoil is participating in the planning and development of projects in Angola and Tanzania.
Angola
In Block 15, the Kizomba Satellites phase 2 project, which consists of the fields Bavuka, Kakocha, and Mondo South, is expected to start production in 2015. The project includes subsea tiebacks to existing Kizomba B and Mondo FPSO vessels. Block 15 is operated by Esso Angola, a subsidiary of ExxonMobil, with Statoil holding a 13.3% interest in this block.
Tanzania
Statoil has made several large gas discoveries offshore Tanzania in Block 2. Work is on-going to assess options for developing the discoveries, including the construction of an onshore LNG plant jointly with the co-venturers in Block’s 1, 3 and 4. Statoil is the operator of Block 2 and holds a 65% working interest.
3.6.4.4 North Africa
In 2014, Statoil's field development in the North Africa was focused on Algeria.
The In Salah Southern Field DevelopmentProject in Algeria was sanctioned in late 2010. This project, which is led by Statoil on behalf of the Joint Venture, will mature the remaining four discoveries into production and it is currently scheduled to come on stream in 2015. The southern fields will tie in to existing facilities in the northern fields.
A contract of association, including mechanisms for revenue sharing, governs the rights and obligations of the joint operatorship between Sonatrach, BP and Statoil. Statoil's working interest is 31.9%.
The InAmenas Gas Compression Project in Algeria, which is led by BP, was sanctioned in late 2010. The compressors are expected to come on stream in 2016. This will make it possible to reduce wellhead pressure and increase production from the reservoir.
The In Amenas facilities are operated through a joint operatorship between Sonatrach, BP and Statoil. Statoil has a 45.9% working interest in In Amenas.
The Hassi Mouinaexploration licence expired in 2012. The licence is not declared commercial and the process of relinquishment therefore started in 2014.
3.6.4.5 Europe and Asia
In Europe and Asia, Statoil is participating in the planning and development of projects in Azerbaijan, the UK, Russia, and Ireland
Azerbaijan
In December 2013, Statoil and its partners in the Shah Deniz consortium made the final investment decision for the development of the Stage 2 development of the Shah Deniz gas field in Azerbaijan and expansion of the South Caucasus Pipeline (SCP) through Azerbaijan and Georgia. The stage 2 project includes offshore drilling and completion of 26 subsea wells, and the construction of two bridge-linked platforms. First gas from stage 2 is targeted for late 2018. Statoil has a 15.5% interest in Shah Deniz.
The South Caucasus Pipeline (SCP) through Azerbaijan and Georgia, the Trans Anatolian Gas Pipeline (TANAP) across Turkey, and the Trans Adriatic Pipeline (TAP) across Greece, Albania and into Italy will together create a new Southern Gas Corridor to Europe. Statoil holds a 15.5% share in SCP and a 20% share in TAP AG, the owner of the Trans Adriatic Pipeline (TAP). Statoil will not participate as an investor in TANAP.
Statoil has in 2014 reduced its ownership interest from 25.5% to 15.5% in Shah Deniz and SCP. In March 2014 Statoil closed the sale of 3.33% to BP, and in May 2014 Statoil closed sale of 6.67% to SOCAR thereby completing the 10% farm down in Shah Deniz and SCP. The effective date is 1 January 2014.
Statoil, Annual Report on Form 20-F 201435
In October 2014 Statoil signed an agreement with the Malaysian oil and gas company PETRONAS to divest its remaining 15.5% interest in Shah Deniz and the South Caucasus Pipeline (SCP). The effective date of the transaction is 1 January 2014. Statoil expects that the transaction will be closed in the first half of 2015, pending government approval and other conditions.
United Kingdom
Statoil is the operator for the Mariner heavy oil project and holds a 65.1% interest. In December 2012, Statoil made the investment decision to develop the Mariner oil field. The field development plan was approved by the UK authorities in February 2013. The concept selected includes a production, drilling and quarters platform based on a steel jacket, with a floating storage unit. Statoil expects first oil in 2017.
The field development plan for Mariner includes a possibility of a future subsea tie-in of Mariner East, a small heavy oil discovery. Statoil is the operator and holds an 86% interest.
Statoil is the operator for, and holds an 81.6% interest in Bressay. Bressay is also a heavy oil discovery. Investment decision on Bressay has been postponed and alternative development solutions are currently under evaluation. Postponement of Bressay will not affect or delay the Mariner project.
Ireland
Statoil has a 36.5% interest in the Corrib gas field operated by Shell, which is being developed as a subsea tie back to an onshore processing facility. The onshore processing terminal is located approximately 9 km inland. The field is expected to start production in 2015.
.
36Statoil, Annual Report on Form 20-F 2014
3.7 Marketing, Processing and Renewable Energy (MPR)
3.7.1 MPR overview
Marketing, Processing and Renewable Energy (MPR) is responsible for the marketing and trading of crude oil, natural gas, power, emissions, liquids and refined products, for transportation and processing, and for developing business opportunities in renewables.
MPR markets Statoil's own volumes and the Norwegian state's direct financial interest (SDFI) equity production of crude oil, in addition to third-party volumes, approximately 50 % of all Norwegian liquids exports. MPR is also responsible for marketing SDFI’s gas. See section 3.12.5 The Norwegian State’s participation and 3.12.6 SDFI oil and gas marketing and sale for further details regarding the Norwegian state’s direct financial interest. In total, Statoil is responsible for marketing approximately 70% of all Norwegian gas exports.
MPR operates two refineries, two gas processing plants, one methanol plant and three crude oil terminals. In addition, MPR is responsible for developing transportation solutions for natural gas, liquids and crude oil from the Statoil assets including pipelines, shipping and rail. Furthermore, Statoil is responsible for developing a profitable renewable energy position.
In 2014, we sold 34.5 billion cubic metres (bcm) of natural equity gas from the Norwegian continental shelf (NCS) on our own behalf, in addition to approximately 33.4 bcm of NCS gas on behalf of the Norwegian state. That makes Statoil the second-largest gas supplier to Europe after Gazprom. Statoil's total US gas sales, including third-party gas, amounted to 12.6 bcm in 2014. In 2014, we also sold 642 million barrels of crude oil and condensate, approximately 14 million tonnes of natural gas liquids (NGL), and approximately 1.2 million tonnes of methanol. Our access to crude oil in the form of equity, governmental and third party volumes makes Statoil a large net crude oil seller. Of the total 642 million barrels sold in 2014, approximately 46% represented Statoil equity volumes, while approximately 39% of the total 14 million tonnes of NGL sold in 2014 were Statoil equity volumes.
In 2014 the European gas market was characterised by decreasing demand and falling prices resulting in lower sales volumes compared to 2013. In the U.S. the cold winter in North East US and Canada created large regional arbitrage margins. The LNG market showed continued regional price differences and geographical arbitrage margins.
Refinery margins were higher than in 2013. The operation of facilities has been stable. HSE results show an improvement from 2013 for most parameters, but there has been a slight increase in the Serious Incident Frequency compared to 2013. With effect from 1 May 2014, the MPR business activities were organised in the following business clusters: Marketing and Trading; Asset Management; Processing and Manufacturing; and Renewable Energy. This structure is followed in the discussion of MPR's business activities below.
Key events in 2014:
·Statoil completed the sale of a 10% share of its 25.5% holdings in the Shah Deniz project and the SCP Company with effect from 1 January 2014. The 3.33% transaction with BP was closed in March 2014 and the 6.67% transaction with SOCAR was closed in May 2014.
·Statoil signed an agreement with Malaysian company PETRONAS to divest its remaining 15.5% share in Shah Deniz and the SCP Company with effect from 1 January 2014. The transaction will be closed in the first half of 2015, pending governmental approval and other conditions.
·Statoil divested a 35% stake in the Dudgeon Offshore Wind Project in U.K to Masdar Abu Dhabi Future Energy Co. Statoil retains a 35% stake and remains operator of the project.
·Statoil and Statkraft have agreed with UK Green Investment Bank to divest 20 % of the shares in Scira, each with 10 % reduced equity.
·Statoil farmed down 13.255% ownership share in Polarled to Wintershall effective 1 January 2014. The project is aligned with the Aasta Hansteen field development.
The profitability of our industry continues to be challenged. Statoil’s response to the industrial challenge characterised by escalating cost and declining returns is addressed in the section Strategy and market overview.
Statoil, Annual Report on Form 20-F 201437
3.7.2 Marketing and Trading
The Marketing and Trading business cluster (MT) is responsible for the marketing and trading of all the products from Statoil’s upstream, processing and refining business and represents one of the larger players in the European oil and gas market.
3.7.2.1 Marketing and trading of gas
MT Gas is responsible for Statoil's marketing and trading of natural gas worldwide, for power and emissions trading and for overall gas supply planning and optimisation.
In addition, Marketing and Trading of Gas (MT Gas) is responsible for marketing gas related to the Norwegian state's direct financial interest (SDFI).
MT Gas business is conducted from Norway (Stavanger) and from offices in Belgium, the UK, Germany, Azerbaijan and the US.
Statoil transports and markets approximately 70% of all NCS gas and has a growing US gas position.
A significant proportion of Statoil's gas sales contracts are sold under long-term contracts that typically run for 10 to 20 years or more. These sales are carried out with large industrial customers, power producers and local distribution companies. In addition gas is sold through short-term contracts and trading on European liquid marketplaces both in the UK and on the European Continent. In the USA, gas is sold through a mix of contracts and trading on liquid marketplaces.
Most of the long-term gas contracts contain contractual price review mechanisms that can be triggered by the buyer or seller at regular intervals, or under certain given circumstances. Statoil is currently in price reviews with some of our customers.
Statoil expects to continue to optimise the market value of the gas delivered to Europe through a mix of long-term contracts and short-term marketing and trading opportunities. This is done both as a response to customer needs and in order to capture new business opportunities as the markets become more liberalised and liquid. Statoil has flexibility in the production and transportation system. Combined with downstream assets this is used to optimise the value of the gas.
Europe
The major export markets for gas from the NCS are Germany, France, the UK, Belgium, Italy, the Netherlands and Spain. Our main customers are large national or regional gas companies such as GdF Suez, ENI Gas & Power, British Gas Trading (a subsidiary of Centrica), RWE and GasTerra. We are also expanding our marketing of gas to large industrial customers, power producers and local distribution companies, in addition to making spot-market sales.
Our European gas trading business conducts activities on almost all trading hubs within Europe, mainly focused on the UK gas market National Balancing Point (NBP), and on the Title Transfer Facility (TTF) in the Netherlands, which have become significant markets in terms of size and are the most liquid market places in Europe.
USA
USA is the world's largest and most liquid gas market. Statoil Natural Gas LLC (SNG), a wholly owned subsidiary, has a gas marketing and trading organization in Stamford, Connecticut, that markets natural gas to local distribution companies, industrial customers and power generators.
SNG also markets the gas equity production from Statoil's assets in the US Gulf of Mexico.
Statoil's entry into the Marcellus and the Eagle Ford shale gas plays has resulted in a significant increase in the volume of gas marketed and traded by Statoil in the USA over the last few years.
SNG has entered into gas transportation agreements with Tennessee Gas Pipeline (a subsidiary of Kinder Morgan Inc), and Texas Eastern Transmission (a subsidiary of Spectra Energy Corp), for a total capacity of approx. 2 bcm per year, approx. 205,000 MMBtu/day, enabling Statoil to transport gas from the Northern Marcellus production area to Manhattan, NY. This commenced service on 1 November 2013 for a term of 20 years.
SNG has also entered into a gas transportation agreement with the National Fuel Gas Supply Corporation for a total capacity of 3.2 bcm per year, approx. 320,000 MMBtu/day, enabling Statoil to transport gas from the Northern Marcellus production area to the US/Canadian border at Niagara, providing access to the greater Toronto area in Canada. The National Fuel pipeline commenced service on 1st November 2012 for a term of 20 years.
In addition SNG has long-term capacity contracts with Dominion Resources Inc., which owns the Cove Point LNG re-gasification terminal in Maryland, with a total capacity of 10.4 bcm per year.
38Statoil, Annual Report on Form 20-F 2014
LNG is sourced from the Snøhvit LNG facility in Norway. Due to continuing low gas prices in the USA, most of Statoil's LNG cargoes have been diverted away from the US and delivered into higher-priced markets in Europe, South-America and Asia.
Azerbaijan
Statoil has completed farm down transactions with BP and SOCAR for the sale of 3.33% and 6.67% respectively in the Shah Deniz Gas Value Chain in first half of 2014. In October 2014 Statoil signed an agreement with Petronas for the divestment of its remaining 15.5% shares. The transaction will be closed in first half of 2015, but effective as from 1 January 2014, pending governmental approval and other conditions. Until closing, Statoil will continue as the commercial operator for gas transportation as well as the operator of marketing and sales of gas from stage 1 of the Shah Deniz gas/condensate field. In addition to the operatorships, Statoil has led the Gas Commercial Committee and has played a key role in the gas export negotiation committee selling the gas from stage 2. Azerbaijan, Georgia and Turkey constitute the market outlets for the stage 1 gas, with Turkey as the main market. Statoil’s operatorships will be transferred to a successor operator in first half of 2015.
The project will commence production in 2018 and deliver 16 bcm of gas annually at plateau to customers in Turkey, Bulgaria, Greece and Italy.
Algeria
Statoil has ownership interests in the In Salah gas field, Algeria's third-largest gas development. The field is operated by a joint venture constituted by Statoil, BP and Sonatrach. Statoil receives its income from gas which is sold under long-term contracts to Europe.
3.7.2.2 Marketing and trading of liquids
MPR is responsible for the sale of the group's and the Norwegian state's direct financial interest (SDFI) production of crude oil and natural gas liquids.
Statoil is one of the world's major net sellers of crude oil. The company operates from sales offices in Stavanger, Oslo, London, Singapore, Stamford and Calgary and markets and trades crude oils, condensates, NGLs as well as refined products.
The main crude oil market for Statoil is north-west Europe. In addition, volumes are sold to North America and Asia. Most of the crude oil volumes are sold in the spot market, based on publicly quoted market prices.
MT Liquids is responsible for optimising commercial utilisation of the crude terminal located at Mongstad and the South Riding Point crude oil terminal in the Bahamas. We are also responsible for Statoil's crude and liquefied petroleum gas (LPG) liftings at the Sture terminal, as well as Statoil's naphtha lifting from Kårstø and Braefoot Bay, liftings of LPG from Kårstø, Mongstad, Braefoot Bay and Teeside terminals in addition to condensate and LPG from the In Amenas field In Algeria. We lift waterborne ethane from Kårstø and Teesside, condensate from Nyhamna, and condensate and LPG volumes from Melkøya.
In addition, we market equity crude oil, condensate and NGL production from Statoil's unconventional assets in North America. They include the Alberta oil sands, Bakken, Eagle Ford, and Marcellus. Unconventional volumes were mostly sold in the spot market based on publicly quoted prices. Production from Eagle Ford is primarily transported by pipeline while the most part of crude oil from Bakken is transported to the best paying markets by rail.
MT Liquids also markets equity volumes from DPI assets located in Canada, USA, Brazil, Angola, Nigeria, Algeria, Russia, Azerbaijan and UK.
Marketing activities are also optimised through the use of lease contracts and long-term agreements for the utilisation of third-party assets such as terminals, storages, pipelines, railcars and vessels.
3.7.3 Asset Management
The Asset Management business cluster (AM) is the owner of all mid- and downstream assets in Statoil, ranging from refineries to pipelines, storage terminals, shipping activities and other infrastructure lease commitments. AM is responsible for securing flow assurance for gas and oil in order to bring production to the markets. This includes management and development of existing assets and contracts as well as being responsible for Statoil’s mid and downstream investment projects. Furthermore AM ensures that the Marketing and Trading business cluster (MT) has efficient access to assets for trading purposes.
Statoil, Annual Report on Form 20-F 201439
3.7.3.1 Production plants
AM is the owner of Statoil`s two refineries in Norway and Denmark and a combined heat and power plant in Norway. AM manages Statoil`s majority ownership share of a methanol production plant, as well as Statoil`s minority share in a NGL and condensate processing facility.
Mongstad
Statoil holds 100% ownership and is operator of the Mongstad refinery in Norway. The refinery was built in 1975, and significantly expanded and upgraded in the late 1980s. In addition it has been subject to considerable investments over the last 15 years in order to meet new product specifications and to improve energy efficiency. The refinery is a medium-sized, modern refinery, with a crude oil and condensate distillation capacity of 226,000 barrels per day.
The refinery is directly linked to offshore fields through two crude oil pipelines, through a natural gas liquids (NGL)/condensate pipeline to the crude oil terminal at Sture and the gas processing plant at Kollsnes, and by a gas pipeline to Kollsnes, making it an attractive site for landing and processing of hydrocarbons.
In addition to the refinery, the main facilities at Mongstad consist of a crude oil terminal (Mongstad terminal), an NGL process unit and terminal (Vestprosess), and a combined heat and power plant (Mongstad Heat and Power Plant).
Statoil owns 34% of Vestprosess, which transports and processes NGL and condensate. The Vestprosess pipeline connects the Kollsnes and Sture plants to Mongstad. The NGL is fractionated in the Vestprosess NGL unit to produce naphtha, propane and butane.
Statoil is the owner of Mongstad Heat and Power Plant, which produces electrical heat and power from gas received from Kollsnes and from the refinery. The combined heat and power plan started commercial operation in 2010 and improved the Mongstad refinery's energy efficiency. It has a capacity of approximately 280 megawatts of electric power and 350 megawatts of process heat.
Kalundborg
Statoil holds 100% ownership and is operator of the Kalundborg refinery in Denmark, which has a crude oil and condensate distillation capacity of 108,000 barrels per day. The Kalundborg refinery is a small, CO2 efficient and flexible oil refinery. While this enables it to produce a variety of products, its main products are low-sulphur gasoline and diesel for markets in Denmark and Sweden. The refinery is connected via one gasoline and one gas oil pipeline to the terminal at Hedehusene near Copenhagen, and most of its products are sold locally.
Tjeldbergodden
The methanol plant at Tjeldbergodden, the largest in Europe, receives natural gas from the Heidrun field in the Norwegian Sea through the Haltenpipe pipeline. Statoil has an ownership interest of 81.7% in Statoil Metanol ANS at Tjeldbergodden. In addition, Statoil holds a 50.9% ownership interest in Tjeldbergodden Luftgassfabrikk DA, which is one of the largest air separation units (ASU) in Scandinavia.
3.7.3.2 Terminals and storage
AM has ownership in two crude oil terminals in Norway. AM also operates the South Riding Point crude oil terminal in the Bahamas
Mongstad terminal
Statoil has 65% ownership interest in Mongstad crude oil terminal, while the State holds 35%. Crude oil is landed at Mongstad via two pipelines from Troll, by dedicated vessels from Heidrun, and by crude vessels from the market. The Mongstad terminal has a storage capacity of 9.4 million barrels of crude oil. The terminal supports Statoil's global trading, blending and trans-shipment of crude. It is an important tool in the marketing of North Sea crude.
Sture terminal
The Sture crude oil terminal receives crude oil in two pipelines from the Oseberg area and the Grane field in the North Sea. The terminal is part of the Oseberg Transportation System (Statoil interest 36.2%). The processing facilities at Sture stabilise Oseberg crude oil and recover LPG mix (propane and butane) and naphtha. Oseberg Blend and Grane crude qualities and LPG mix are exported. LPG and naphtha are also transported through the Vestprosess pipeline to Mongstad.
South Riding Point terminal
AM operates the South Riding Point Terminal, which is located on Grand Bahamas Island, and consists of two shipping berths and ten storage tanks of crude oil, with a storage capacity of 6.75 million barrels of crude oil. The terminal has been upgraded to also enable the blending of crude oils, including heavy oils. The blending is carried out onshore and from ship to ship at the jetty. The terminal is intended to both support our global trading activity and improve our handling capacity for heavy oils. The terminal is an integral part of our marketing of equity volumes of heavy oil.
40Statoil, Annual Report on Form 20-F 2014
Aldbrough Gas Storage
Statoil UK holds one third share of the interests in the Aldbrough Gas Storage in UK, operated by SSE Hornsea Ltd. At the end of 2014 seven out of nine caverns were operational.
Etzel Gas Lager
Statoil Deutschland Storage GmbH holds a 23.7% stake in the Etzel Gas Lager.
3.7.3.3 Pipelines
AM is responsible for Statoil’s ownership in pipelines globally as well as gathering and initial processing in the US.
Pipelines in operations
Statoil is a significant shipper in the NCS gas pipeline system. This network links gas fields on the Norwegian continental shelf (NCS) with processing plants on the Norwegian mainland and with terminals at six landing points located in France, Germany, Belgium and the UK.
The total length of Norway's gas pipelines is currently 8,100 kilometres, and all gas pipelines on the NCS that are accessed by third-party customers are owned by a single joint venture, Gassled, with regulated third-party access. The Gassled system is operated by the independent system operator Gassco AS, which is wholly owned by the Norwegian state. When new gas infrastructure facilities are merged into Gassled, the ownership interests are adjusted to reflect each owner's relative interest. Hence, Statoil's future ownership interest in Gassled may change. AM is managing Statoil’s current 5 % ownership share in Gassled.
In addition AM manage Statoil’s ownership in the following pipelines outside the Norwegian gas transportation system: Oseberg oil transportation system, Grane oil pipeline, Kvitebjørn oil pipeline, Troll oil pipeline I and II, Valemon rich gas pipeline, and Mongstad gas pipeline.
Statoil Deutschland GmbH indirect holdsa 30.8% stake in the Norddeutche Erdgas Transversale (NETRA) overland gas transmission pipeline.
Pipelines under construction
Statoil is the operator and holds a 37.1% ownership share in the Polarled Project which will secure a gas export solution for fields in the Norwegian Sea. Statoil farmed down 13.255% ownership share to Wintershall effective 1 January 2014. The project is aligned with the Aasta Hansteen field development.
Statoil is the operator and holds a 30.9% ownership share in the Utsira High Gas Pipeline. The pipeline will provide gas export for the Edvard Grieg and Ivar Aasen fields and is scheduled for start-up in 2015.
Statoil is the operator and holds a 25.6% ownership share in the Edvard Grieg Oil Pipeline. The pipeline will provide oil export for the Edvard Grieg and Ivar Aasen fields and is scheduled for start-up in 2015.
Statoil is the operator and holds a 40% ownership share in the Johan Sverdrup Oil and Gas Pipeline. The pipelines will provide oil and gas export for the Johan Sverdrup field and is scheduled to start-up in 2019.
Statoil holds a 20% ownership share in the Trans Adriatic Pipeline (TAP) which will transport Caspian natural gas to Europe. Connecting with the Trans Anatolian Pipeline (TANAP) at the Greek-Turkish border, TAP will cross Northern Greece, Albania and the Adriatic Sea before coming ashore in Southern Italy to connect to the Italian natural gas network. The project is currently in its implementation phase and is preparing for construction of the pipeline, which is planned to begin in 2016.
US gathering system
AM is responsible for Statoil’s participation in gathering and facilities for initial processing of oil and gas in the Bakken, Eagle Ford and Marcellus assets in the USA.This includes crude and natural gas gathering systems, fresh water supply systems, salt water disposal wells, oil and gas treatment and processing facilities to provide flow assurance for Statoil’s upstream production. Midstream assets in Bakken are owned and operated 100% by Statoil. In Eagle Ford, Statoil is operator of approximately 50% of midstream assets. For Marcellus Statoil has operated assets in Marcellus South while in the Marcellus non-operated areas both in the North and South, Statoil’s working interest ranges from 16.25% to 32.5% depending on gathering system and number of JV partners.
Statoil, Annual Report on Form 20-F 201441
3.7.4 Processing and Manufacturing
The Processing and Manufacturing business cluster (PM) is responsible for the operation of all of Statoil's onshore facilities in Norway and Denmark except for Snøhvit related facilities, and a substantial part of the oil- and gas pipelines on the NCS.
This includes the following Statoil operated plants and pipelines: the refineries at Mongstad and Kalundborg, the methanol production plant at Tjeldbergodden, Oseberg transportation system including the Sture Terminal, Vestprosess, Mongstad Terminal, the Grane, Kvitebjørn and Troll oil pipelines and Mongstad gas pipeline.
The following table shows operating statistics for the plants at Mongstad, Kalundborg and Tjeldbergodden.
| Throughput (1) | Distillation capacity (2) | On stream factor % (3) | Utilisation rate % (4) |
Refinery | 2014 | 2013 | 2012 | 2014 | 2013 | 2012 | 2014 | 2013 | 2012 | 2014 | 2013 | 2012 |
| | | | | | | | | | | | | |
Mongstad | 9.2 | 11.8 | 11.9 | 9.3 | 9.3 | 9.4 | 93.4 | 98.9 | 95.2 | 90.0 | 95.0 | 92.7 |
Kalundborg | 4.5 | 5.0 | 4.9 | 5.4 | 5.4 | 5.4 | 91.8 | 98.2 | 94.4 | 82.0 | 86.5 | 88.9 |
Tjeldbergodden | 0.83 | 0.79 | 0.81 | 0.95 | 0.95 | 0.95 | 88.4 | 94.4 | 86.4 | 97.1 | 96.6 | 97.5 |
| | | | | | | | | | | | | |
(1) | Actual throughput of crude oils, condensates, NGL, feed and blendstock, measured in million tonnes. Higher than distillation capacity for Mongstad due to high volumes of fuel oil and NGL not going through the crude distillation unit. |
(2) | Nominal crude oil and condensate distillation capacity, and methanol production capacity, measured in million tonnes. |
(3) | Composite reliability factor for all processing units, excluding turnarounds. |
(4) | Composite utilisation rate for all processing units, stream day utilisation. |
In addition PM performs the role of technical service provider (TSP) for the Kårstø and Kollsnes gas processing plants in accordance with the technical service agreement between Statoil and the operator Gassco. PM also performs the TSP role for the larger share of the Gassco operated gas pipeline infrastructure.
The processing that takes place at Kollsnes involves separating out the NGL, and compressing the dry gas for export via the Gassled pipeline network to receiving terminals in Europe. The Kollsnes plant was initially developed to receive gas from the Troll field. Kollsnes now also receives gas from the Visund, Kvitebjørn and Fram fields.
Kårstø processes rich gas and condensate from the NCS received via the Statpipe pipeline, the Åsgard Transport pipeline and the Sleipner condensate pipeline. Products produced at Kårstø include ethane, propane, iso-butane, normal butane, naphtha and stabilized condensate. The dry gas is transported to customers through the Gassled pipeline network via receiving terminals in Europe.
For further information about Statoil's operated onshore facilities and pipelines, see the section Business overview - Marketing, Processing and Renewable Energy – Asset Management.
Kalundborg
Statoil is the sole owner and operator of the Kalundborg refinery in Denmark, which has a crude oil and condensate distillation capacity of 118,000 barrels per day. The Kalundborg refinery is a small but flexible oil refinery. While this enables it to produce a variety of products, its main products are low-sulphur gasoline and diesel for markets in Denmark and Sweden. The refinery is connected via two pipelines (one gasoline and one gas oil) to the terminal at Hedehusene near Copenhagen, and most of its products are therefore sold locally. Kalundborg's refined products are also supplied to other markets in north- western Europe, mainly to Scandinavia.
Tjeldbergodden
The methanol plant at Tjeldbergodden, the largest in Europe, receives natural gas from the Heidrun field in the Norwegian Sea through the Haltenpipe pipeline.
Statoil has an ownership interest of 81.7% in Statoil Metanol ANS at Tjeldbergodden. In addition, Statoil holds a 50.9% ownership interest in Tjeldbergodden Luftgassfabrikk DA, which is one of the largest air separation units (ASU) in Scandinavia.
Sture
The Sture terminal receives crude oil in two pipelines from the Oseberg area and the Grane field in the North Sea. The terminal is part of the Oseberg Transportation System (Statoil interest 36.2%). The processing facilities at Sture stabilise Oseberg crude oil and recover LPG mix (propane and butane) and naphtha. Oseberg Blend and Grane crude qualities and LPG mix are exported. LPG and naphtha are also transported through the Vestprosess pipeline to Mongstad.
42Statoil, Annual Report on Form 20-F 2014
3.7.5 Renewable Energy
Our renewable energy business focuses on developing business in areas where we have a competitive edge as a result of our offshore oil and gas expertise. Offshore wind and carbon capture and storage are key areas.
Sheringham Shoal
The Sheringham Shoal wind farm, located off the coast of Norfolk, UK, was formally opened in September 2012. The wind farm is in full production with 88 turbines and an installed capacity of 317 megawatt (MW). Following the divestment in 2014, it is now owned 40% by Statkraft, a Norwegian wholly state-owned company, 40% by Statoil and 20% by the UK Green Investment Bank (GIB). The wind farm's estimated annual production is 1.1 terawatt hours (TWh) and it will provide power for approximately 220,000 households.
Hywind
The Hywind demonstration facility off the coast of Karmøy in Norway - featuring the world's first full-scale floating offshore wind turbine - has been in operation for five years. The overall performance of Hywind has exceeded expectations. A project, investigating the possibility of installing a 30 MW test farm in Scotland is ongoing. According to current plans, the project is scheduled to make a final investment decision in 2015, and be operational in 2017.
Dudgeon offshore wind project
Statoil acquired a 70% shareholding in the Dudgeon offshore wind farm project in October 2012 together with Statkraft (30%). In 2014 Statoil reduced its shareholding to 35%. This project is located in the Greater Wash Area off the English east coast, not far from Sheringham Shoal. A final investment decision was made July 2014 for the 402MW project. All key construction contracts are awarded and construction has started. The wind farm is expected to have a production of 1.7 TWh from 67 turbines providing power for approximately 410,000 households. It is expected fully operational by year end 2017.
Dogger Bank
Statoil was awarded a 25% share in the UK Third Round Dogger Bank concession in 2010 together with partners Rheinisch-Westfalische Elektrizitatswerke (RWE), Scottish and Southern Energy (SSE) and Statkraft. The joint venture (Forewind) is currently undertaking environmental studies and preparing applications for consent to build offshore wind farms. The applications for the first two projects (each 1.2 GW) have been confirmed by the UK authorities to be sufficiently matured, and a final decision is expected in the first half of 2015. Work on the remaining applications continues. Production could start towards the end of the decade.
Carbon capture and Storage (CCS)
CCS is an important technology for Statoil to protect the value of our natural gas resources in case of emission regulations and/or high carbon taxes on use of natural gas. Statoil has since 1996 gained experience in CCS and has continued to develop the competence through its research engagement in the Technical Centre Mongstad (TCM). Statoil will seek to deploy its competence and experience in other CCS projects, continue to evaluate opportunities to reduce own CO2 emissions and explore CO2 for EOR possibilities.
Statoil, Annual Report on Form 20-F 201443
3.8 Other Group
The Other reporting segment includes activities in Global Strategy and Business Development (GSB);
Technology, Projects and Drilling (TPD); and corporate staffs and support functions.
3.8.1 Global Strategy and Business Development (GSB)
The Global Strategy and Business Development (GSB) business area is Statoil’s functional head for strategy and business Development.
GSB sets the strategic direction for Statoil and identifies, develops and delivers business opportunities. This is achieved through close collaboration across geographic locations and business areas. Statoil's strategy plays an important role in guiding Statoil's business development focus.
GSB's business activities are organised in the following areas:
·Corporate strategy and analysis: Managing corporate strategy development processes, competitor intelligence, industry analysis.
·Political Analysis: Monitoring political developments nationally, regionally and globally. The unit assesses geopolitical issues and trends impacting our business, political risk related to specific countries and projects, and changes to the broader security threat picture.
·Corporate Sustainability: Setting out Statoil's strategic response to sustainability issues, the development of relevant policies and reporting on the company's sustainability performance.
·Business Development Origination: Early screening of business development opportunities, sharing on-the-ground context and intelligence across the organization.
·Mergers, Acquisitions and Divestments: Merger/corporate acquisition/divestment options, interfacing with investment bankers, sharing deal activity context and intelligence across the organisation.
·Project Support and Execution: Commercial negotiation support, commercial and technical valuation, business development best practice.
3.8.2 Technology, Projects and Drilling (TPD)
Technology, Projects and Drilling (TPD) business area is responsible for delivering projects and wells and providing global support on standards and procurement. TPD is also responsible for developing Statoil as a technology company.
Key events in 2014:
·Completed 103 offshore wells, including 33 exploration wells
·Delivered the Gudrun and the Valemon projects to DPN
·Delivered three new fast-track projects: Fram H-North, Svalin and Oseberg Delta2 to DPN
·Established country office in South Korea
·Delivered a high number of new technologies in 2014 - a total of 40 high impact and 69 first-use, which is an increase from 2013
·Some overcapacity in the rig fleet due to reduced demand and increased efficiency
·Opened a new increased oil recovery (IOR) research centre at Statoil’s research centre in Trondheim (Norway) in June. It is one of the most advanced in the world and will play a key role in Statoil’s efforts to improve recovery from our fields on the NCS and internationally
The TPD's business activities are organised in the following business clusters:
Research, Development and Innovation
Research, Development and Innovation (RDI) is responsible for carrying out research and technology development to meet Statoil's business needs in a short-and long term perspective.
RDI is organised in four research programmes closely aligned with Statoils technology strategy: Exploration, mature area developments and IOR, Frontier developments and unconventionals. In addition, there are two other units - Innovation and projects. RDI has four research centres in Norway with world leading laboratories and large-scale test facilities. Internationally, RDI is present close to our operations in Rio de Janeiro (Brazil), Houston and Austin (the US), Calgary and St. Johns (Canada) and Beijing (China). Cooperation with external environments plays an important role for R&D in Statoil and RDI has an Academia programme that coordinates cooperation with Norwegian and international universities.
Technology Excellence
Technology Excellence (TEX) is globally responsible for delivering technical expertise to projects, business developments and assets, and for implementing new technology and the corporate technology strategy.
44Statoil, Annual Report on Form 20-F 2014
TEX's technological expertise in areas such as petroleum , subsea and marine, facilities and operations, and safety and sustainability technologies, contributes to enhancing Statoil's operational performance. Technology development and implementation are used to promote and achieve corporate targets for production growth, increased regularity, reserve growth, and reduced costs and improved efficiency. TEX is responsible for increasing the level of standardisation and supports innovators and entrepreneurs with technology development and commercialisation activities.
Projects
Projects (PRO) is responsible for planning and executing all major facilities development, modification and field decommissioning projects in Statoil.
The project portfolio comprises around 50 projects in the early phase and 70 in the execution phase. The project portfolio is diverse, ranging from major new field developments to both small and large development projects on the NCS and internationally. The share of larger projects in the portfolio has increased over the last few years.
Drilling and Well
Drilling and Well (D&W) is responsible for providing cost-efficient well deliveries, ensuring fit-for-purpose drilling facilities and providing expertise and advice to Statoil's global drilling and well operations.
D&W operated 42 rig years in 2014 compared to 44 in 2013, and delivered production and exploration wells offshore on the NCS and Brazil, and exploration wells in Angola, Canada, Gulf of Mexico, Tanzania and Faroe Islands.
Procurement and Supplier Relations
Procurement and Supplier Relations (PSR) is responsible for procurement on a global basis that is aligned with Statoil’s business needs, and for managing Statoil's supply chain. Statoil's procurements originate from approximately 12,000 active suppliers.
The procurement process is based on competition and the principles of openness, non-discrimination and equality. PSR encourage and facilitate collaboration with suppliers through communication and by managing supplier relations. By maintaining strong relations with high-quality suppliers, Statoil aims to ensure lasting long-term competitive advantages. PSR have a strategy for increasing diversity, competition and flexibility in the markets in order to better utilise industry capacity and expertise.
3.8.3 Corporate staffs and support functions
Corporate Staffs and support functions comprise the non-operating activities supporting Statoil.
They include headquarters and central functions that provide business support such as corporate communication, safety, audit, legal services and people and organisation.
Statoil, Annual Report on Form 20-F 201445
3.9 Significant subsidiaries
The following table shows significant subsidiaries and associated companies as of 31 December 2014.
Our voting interest in each company is equivalent to our equity interest.
Ownership in certain subsidiaries and other equity accounted companies |
Name | in % | Country of incorporation | | Name | in % | Country of incorporation |
| | | | | | |
Statholding AS | 100 | Norway | | Statoil Nigeria Deep Water AS | 100 | Norway |
Statoil Angola Block 15 AS | 100 | Norway | | Statoil Nigeria Outer Shelf AS | 100 | Norway |
Statoil Angola Block 15/06 Award AS | 100 | Norway | | Statoil Norsk LNG AS | 100 | Norway |
Statoil Angola Block 17 AS | 100 | Norway | | Statoil North Africa Gas AS | 100 | Norway |
Statoil Angola Block 31 AS | 100 | Norway | | Statoil North Africa Oil AS | 100 | Norway |
Statoil Angola Block 38 AS | 100 | Norway | | Statoil Orient AG | 100 | Switzerland |
Statoil Angola Block 39 AS | 100 | Norway | | Statoil OTS AB | 100 | Sweden |
Statoil Angola Block 40 AS | 100 | Norway | | Statoil Petroleum AS | 100 | Norway |
Statoil Apsheron AS | 100 | Norway | | Statoil Shah Deniz AS | 100 | Norway |
Statoil Azerbaijan AS | 100 | Norway | | Statoil Sincor AS | 100 | Norway |
Statoil BTC Finance AS | 100 | Norway | | Statoil SP Gas AS | 100 | Norway |
Statoil Coordination Centre NV | 100 | Belgium | | Statoil Tanzania AS | 100 | Norway |
Statoil Danmark AS | 100 | Denmark | | Statoil Technology Invest AS | 100 | Norway |
Statoil Deutschland GmbH | 100 | Germany | | Statoil UK Ltd | 100 | United Kingdom |
Statoil do Brasil Ltda | 100 | Brazil | | Statoil Venezuela AS | 100 | Norway |
Statoil Exploration Ireland Ltd. | 100 | Ireland | | Statoil Venture AS | 100 | Norway |
Statoil Forsikring AS | 100 | Norway | | Statoil Metanol ANS | 82 | Norway |
Statoil Færøyene AS | 100 | Norway | | Mongstad Refining DA | 79 | Norway |
Statoil Hassi Mouina AS | 100 | Norway | | Mongstad Terminal DA | 65 | Norway |
Statoil Indonesia Karama AS | 100 | Norway | | Tjeldbergodden Luftgassfabrikk DA | 51 | Norway |
Statoil New Energy AS | 100 | Norway | | Naturkraft AS | 50 | Norway |
Statoil Nigeria AS | 100 | Norway | | Vestprosess DA | 34 | Norway |
3.10 Production volumes and prices
The business overview is in accordance with our segment's operations as of 31 December 2014, whereas certain disclosures on oil and gas reserves are based on geographical areas as required by the Securities and Exchange Commission (SEC).
For further information about extractive activities, see the sections Business overview - Development and Production Norwayand Business overview - Development and Production International, respectively.
Statoil prepares its disclosures for oil and gas reserves and certain other supplemental oil and gas disclosures by geographical area, as required by the SEC. The geographical areas are defined by country and continent. They are Norway, Eurasia excluding Norway, Africa and the Americas.
For further information about disclosures concerning oil and gas reserves and certain other supplemental disclosures based on geographical areas as required by the SEC, see the section Business overview - Proved oil and gas reserves.
3.10.1 Entitlement production
This section describes our oil and gas production and sales volumes.
The following table shows Statoil's Norwegian and international entitlement production of oil and natural gas for the periods indicated. The stated production volumes are the volumes to which Statoil is entitled, pursuant to conditions laid down in licence agreements and production-sharing agreements. The production volumes are net of royalty oil paid in kind, and of gas used for fuel and flaring. Our production is based on our proportionate participation in fields with multiple owners and does not include production of the Norwegian State's oil and natural gas. Production of an immaterial quantity of bitumen is
46Statoil, Annual Report on Form 20-F 2014
included in oil and condensate production. NGL includes both LPG and naphtha. The only field containing more than 15% of total proved reserves based on oil equivalent barrels is the Troll field. For further information on production volumes, please see the section Financial review - Operating and financial review - Definition of reported volumes.
| For the year ended 31 December |
Entitlement production | 2014 | 2013 | 2012 |
| | | |
Norway | | | |
Oil and Condensate (mmbbls) | 173 | 174 | 185 |
NGL (mmbbls) | 42 | 42 | 45 |
Natural gas (bcf) | 1,229 | 1,264 | 1,483 |
Combined oil, condensate, NGL and gas (mmboe) | 434 | 441 | 495 |
| | | |
Eurasia excluding Norway | | | |
Oil and Condensate (mmbbls) | 14 | 15 | 17 |
Natural gas (bcf) | 56 | 72 | 62 |
Combined oil, condensate, NGL and gas (mmboe) | 24 | 28 | 28 |
| | | |
Africa | | | |
Oil and Condensate (mmbbls) | 64 | 58 | 53 |
NGL (mmbbls) | 2 | 1 | 2 |
Natural gas (bcf) | 38 | 40 | 41 |
Combined oil, condensate, NGL and gas (mmboe) | 72 | 66 | 63 |
| | | |
Americas | | | |
Oil and Condensate (mmbbls) | 55 | 50 | 48 |
NGL (mmbbls) | 7 | 4 | 2 |
Natural gas (bcf) | 242 | 196 | 161 |
Combined oil, condensate, NGL and gas (mmboe) | 106 | 89 | 79 |
| | | |
Total | | | |
Oil and Condensate (mmbbls) | 306 | 298 | 303 |
NGL (mmbbls) | 51 | 47 | 50 |
Natural gas (bcf) | 1,565 | 1,571 | 1,748 |
Combined oil, condensate, NGL and gas (mmboe) | 635 | 625 | 665 |
| | | |
Troll field * | | | |
Oil and Condensate (mmbbls) | 14 | 14 | 14 |
NGL (mmbbls) | 2 | 2 | 4 |
Natural gas (bcf) | 317 | 304 | 408 |
Combined oil, condensate, NGL and gas (mmboe) | 73 | 70 | 91 |
| | | |
* Note that Troll is also included in Norway stated above | | | |
Statoil, Annual Report on Form 20-F 201447
3.10.2 Production costs and sales prices
The following tables present the average unit of production cost based on entitlement volumes and realised sales prices.
| Norway | Eurasia excluding Norway | Africa | Americas |
| | | | |
Year ended 31 December 2014 | | | | |
Average sales price oil and condensate in USD per bbl | 98.3 | 101.3 | 95.6 | 78.3 |
Average sales price NGL in USD per bbl | 59.3 | - | 59.7 | 37.3 |
Average sales price natural gas in NOK per Sm3 | 2.3 | 1.3 | 2.2 | 1.0 |
Average production cost in NOK per boe | 53 | 65 | 64 | 52 |
| | | | |
Year ended 31 December 2013 | | | | |
Average sales price oil and condensate in USD per bbl | 109.1 | 110.5 | 107.3 | 89.1 |
Average sales price NGL in USD per bbl | 67.4 | - | 69.7 | 59.2 |
Average sales price natural gas in NOK per Sm3 | 2.4 | 0.9 | 2.1 | 0.8 |
Average production cost in NOK per boe | 50 | 49 | 59 | 46 |
| | | | |
Year ended 31 December 2012 | | | | |
Average sales price oil and condensate in USD per bbl | 111.5 | 113.1 | 110.8 | 90.9 |
Average sales price NGL in USD per bbl | 71.5 | - | 73.6 | 40.9 |
Average sales price natural gas in NOK per Sm3 | 2.4 | 1.0 | 2.3 | 0.5 |
Average production cost in NOK per boe | 45 | 47 | 59 | 58 |
48Statoil, Annual Report on Form 20-F 2014
3.11 Proved oil and gas reserves
Proved oil and gas reserves were estimated to be 5,359 mmboe at year end 2014, compared to 5,600 mmboe at the end of 2013.
Statoil's proved reserves are estimated and presented in accordance with the Securities and Exchange Commission (SEC) Rule 4-10 (a) of Regulation S-X, revised as of January 2009, and relevant Compliance and Disclosure Interpretations (C&DI) and Staff Accounting Bulletins, as issued by the SEC staff. For additional information, see Critical accounting judgments and key sources of estimation uncertainty; Key sources of estimation uncertainty; Proved oil and gas reservesin note 2 Significant accounting policiesto the Consolidated financial statements. For further details on proved reserves, see also note 27 Supplementary oil and gas information (unaudited) to the Consolidated financial statements.
Changes in proved reserves estimates are most commonly the result of revisions of estimates due to observed production performance, extensions of proved areas through drilling activities or the inclusion of proved reserves in new discoveries through the sanctioning of new development projects. These are sources of additions to proved reserves that are the result of continuous business processes and can be expected to continue to add reserves in the future.
Proved reserves can also be added or subtracted through the acquisition or disposal of assets. Changes in proved reserves can also be due to factors outside management control, such as changes in oil and gas prices. While higher oil and gas prices normally allow more oil and gas to be recovered from the accumulations, Statoil will generally receive smaller quantities of oil and gas under production-sharing agreements (PSAs) and similar contracts. These changes are included in the revisions category in the table below.
The principles for booking proved gas reserves are limited to contracted gas sales or gas with access to a robust gas market.
In Norway, Statoil recognises reserves as proved when a development plan is submitted, as there is reasonable certainty that such a plan will be approved by the regulatory authorities. Outside Norway, reserves are generally booked as proved when regulatory approval is received, or when such approval is imminent. Reserves from new discoveries, upward revisions of reserves and purchases of proved reserves are expected to contribute to maintaining proved reserves in future years.
Approximately 85% of our proved reserves are located in OECD countries. Norway is by far the most important contributor in this category, followed by the United States of America (US), Canada, the United Kingdom (UK) and Ireland.

| Of Statoil's total proved reserves, 12% are related to production-sharing agreements (PSAs) in non-OECD countries such as Azerbaijan, Angola, Algeria, Nigeria, Libya and Russia. Other non-OECD reserves are related to concessions in Brazil and Venezuela, representing less than 3% of Statoil's total proved reserves. These are included in proved reserves in the Americas.
Significant additions to our proved reserves in 2014 were:
•24Statoil, Annual Report on Form 20-F 2016 Positive revisions due to better performance of producing fields, maturing of improved recovery projects, and reduced uncertainty due to further drilling and production experience. This added a total of 353 million boe in 2014. •Proved reserves from new discoveries have also been added through the sanctioning of nine new field development projects in 2014 such as the Stampede field in the Gulf of Mexico in US and Gullfaks Rimfaksdalen, Flyndre and Titan in Norway. The new projects added a total of 65 million boe.
•Further drilling in the Bakken, Marcellus and Eagle Ford onshore plays in the US increased the proved reserves in 2014, and some of these additions are presented as extensions. Extension of proved area on existing field added a total of 187 million boe of new proved reserves in 2014.
•The net effect of purchase and sale reduced the reserves by 214mmboe in 2014
The 2014 entitlement production was 635 million boe, an increase of 1.6% compared to 2013. New discoveries with proved reserves booked in 2014 are all expected to start production within a period of five years.
|
Statoil, Annual Report on Form 20-F 201449
Summary of proved reserves as of 31 December 2014
Reserves category | Proved reserves |
Oil and Condensate | NGL | Natural Gas | Total oil and gas |
(mmboe) | (mmboe) | (bcf) | (mmboe) |
| | | | |
Developed | | | | |
Norway | 559 | 258 | 11,227 | 2,818 |
Eurasia excluding Norway | 63 | - | 312 | 119 |
Africa | 243 | 9 | 191 | 287 |
Americas | 291 | 42 | 946 | 501 |
Total Developed proved reserves | 1,156 | 310 | 12,677 | 3,725 |
| | | | |
Undeveloped | | | | |
Norway | 327 | 60 | 2,467 | 826 |
Eurasia excluding Norway | 133 | - | 906 | 295 |
Africa | 52 | 6 | 108 | 78 |
Americas | 273 | 27 | 762 | 436 |
Total Undeveloped proved reserves | 786 | 93 | 4,242 | 1,635 |
| | | | |
Total proved reserves | 1,942 | 403 | 16,919 | 5,359 |
Statoil's proved reserves of bitumen in the Americas are included as oil in the table above since they represent less than 2% of Statoil's proved reserves, which is regarded as immaterial.
The basis for equivalents is presented in the section Terms and definitions.
Reserves replacement
The reserves replacement ratio is defined as the sum of additions and revisions of proved reserves divided by produced volumes in any given period. The following table presents the changes in reserves in each category relating to the reserve replacement ratio for the years 2014, 2013 and 2012.
| For the year ended 31 December |
(million boe) | 2014 | 2013 | 2012 |
| | | |
Revisions and improved recovery | 356 | 395 | 353 |
Extensions and discoveries | 253 | 523 | 378 |
Purchase of petroleum-in-place | 20 | 14 | 4 |
Sales of petroleum-in-place | (233) | (131) | (74) |
| | | |
Total reserve additions | 395 | 802 | 661 |
Production | (635) | (625) | (665) |
| | | |
Net change in proved reserves | (240) | 177 | (4) |
The reserves replacement ratio for 2014 was 0.62 compared to 1.28 in 2013. The 2014 reserves replacement ratio, excluding purchases and sales of petroleum in place, was 0.96. The average replacement ratio for the last three years was 0.97, or 1.17 excluding purchases and sales.
| For the year ended 31 December |
Reserves replacement ratio (including purchases and sales) | 2014 | 2013 | 2012 |
| | | |
Annual | 0.62 | 1.28 | 0.99 |
Three-year-average | 0.97 | 1.15 | 1.01 |
The usefulness of the reserves replacement ratio is limited by the volatility of oil prices, the influence of oil and gas prices on PSA reserve booking, sensitivity related to the timing of project sanctions and the time lag between exploration expenditure and the booking of reserves.
50Statoil, Annual Report on Form 20-F 2014
Proved reserves in Norway
A total of 3,644 million boe is recognised as proved reserves in 58 fields and field development projects on the NCS, representing 68% of Statoil's total proved reserves. Of these, 52 fields and field areas are currently in production, 43 of which are operated by Statoil. Three new field development projects added reserves during 2014, Gullfaks Rimfaksdalen, Flyndre and Titan categorised as extensions and discoveries. Production experience, further drilling and improved recovery on several of Statoil's producing fields in Norway also contributed positively to the revisions of the proved reserves in 2014.
Sales of reserves are related to the agreements with Wintershall to sell interests in certain licences in Norway. This has reduced Statoil's share of proved reserves on Aasta Hansteen and removed Gjøa and Vega from the proved reserves accounts.
Of the proved reserves on the NCS, 2,818 million boe, or 77%, are proved developed reserves. Of the total proved reserves, 67% are gas reserves related to large offshore gas fields such as Troll, Snøhvit, Oseberg, Aasta Hansteen, Ormen Lange, Tyrihans, Åsgard and Visund, and 33% are liquid reserves.
Martin Linge(Statoil 19%) is an oil and gas field operated by Total, near the British sector of the North Sea. The reservoir is complex with gas under high pressure and high temperatures. The development includes a fixed steel jacket platform with processing and export facilities, with electric power to be supplied from Kollsnes. The operator expects production to start in 2018.
Decommissioning on the NCS
Under the Petroleum Act, the Norwegian government has imposed strict procedures for removal and disposal of offshore oil and gas installations. The Convention for the Protection of the Marine Environment of the Northeast Atlantic (OSPAR) stipulates similar procedures.
Huldra ceased production in September 2014, after 13 years in production. The permanent plugging and abandonment of wells has been ongoing in 2016 with removal of topside facilities planned in 2019.
Volve ceased production in September 2016, after more than eight years in production. The permanent plugging of wells was finalised during 2016, and the removal of subsea templates is expected to be completed in 2017.
During 2016, there were permanent plugging and abandonment operations at Statfjord, Visund, Tune, Kristin and Heimdal. The partner-operated field Ekofisk also had ongoing removal and plugging activities.
For further information about decommissioning, see note 2 Significant accounting policies to the Consolidated financial statements.
Statoil, Annual Report on Form 20-F 201625
2.4 DPI - DEVELOPMENT AND PRODUCTION INTERNATIONAL
DPI overview
Statoil is present in several of the most important oil and gas provinces in the world. The Development and Production International (DPI) reporting segment covers all development and production of oil and gas outside the Norwegian continental shelf (NCS).
DPI is present in more than 20 countries and had production in 11 countries in 2016. DPI produced 38% of Statoil's total equity production of oil and gas in 2016. For information about proved reserves development see section 2.8 Proved oil and gas reserves.
The map shows the countries where DPI has activity.
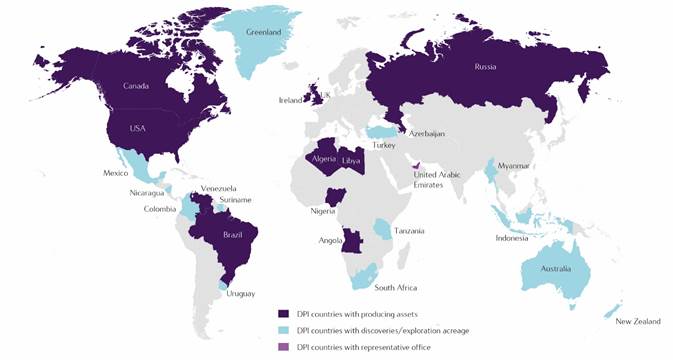
Key events and portfolio developments in 2016 and early 2017:
·In January, the Heidelberg field achieved first oil. The field is located in the Green canyon area of the Gulf of Mexico with Anadarko as the operator. Discovery was made in 2009, and sanctioning took place in 2013
·Operations at the In Salah Southern Fields project in Algeria started in March
·In April, the Julia field achieved first oil, on time and under budget. Julia is located in the Walker Ridge area of the Gulf of Mexico near Jack and St Malo. ExxonMobil is the operator
·In May, Statoil divested its operated acreage in the Marcellus West Virginia to EQT Corporation for USD 407 million in cash. The transaction was completed in July
·In July, Statoil announced acquisition of Petrobras’ 66% operated interest in the offshore licence BM-S-8 in Brazil’s Santos Basin. This licence contains a substantial part of the Carcará pre-salt oil discovery. The transaction was completed in November
·The third processing train on the In Amenas field in Algeria, which was damaged in the January 2013 terrorist attack, restarted in July, and the In Amenas Gas Compression project came into operation in February 2017. The compression project has enabled increased production and thereby capacity to utilize all three trains
·In December, the drilling of the first well of the Mariner field development commenced
·In December, Statoil increased its ownership in the deep-water Vito discovery from 30.0% to 36.89%, after exercising pre-emption rights on the Freeport-McMoran sale to Anadarko. The field is located in the Mississippi Canyon area. A final investment decision is expected in 2018 with first production in 2021
·In December, on request of US authorities, Statoil has become operator of record for blocks MC941 and MC942 in the Gulf of Mexico following the bankruptcy of Bennu Oil & Gas LLC. With the bankruptcy proceedings still ongoing, the full implications for Statoil are still to be determined
·In 2016, Statoil completed transactions to increase its equity interest to 100% in the UK continental shelf licence (P312) of the Utgard field, which spans the UK-Norway maritime border. In March 2016, Statoil’s purchase of a 31% equity interest from Talisman Sinopec North Sea Limited was completed, and in June the purchase of a 45% operated equity share from JX Nippon was completed. In January 2017, the plan for development and operation for the Utgard field was approved by the Norwegian and UK authorities. For more information, see Fields under development on the NCS in section 2.3 DPN – Development and production Norway
·In December, Statoil signed an agreement to divest its 100% owned Kai Kos Dehseh (KKD) oil sands projects in the Canadian province of Alberta to Athabasca Oil Corporation. The transaction covers the producing Leismer demonstration plant and the undeveloped Corner project, along with a number of midstream contracts associated with Leismer’s production. Following this transaction, Statoil will no longer own or operate any oil sands assets. As part of the transaction, Statoil will own just below 20% of Athabasca’s shares, and this will be managed as a financial investment. The transaction was completed 31 January 2017. For more information about the transaction see note 4 Acquisitions and disposals to the Consolidated financial statements.
International production
Statoil's entitlement production outside Norway was about 32% of Statoil's total entitlement production in 2016.
The following table shows DPI's average daily entitlement production of liquids and natural gas for the years ending 31 December 2016, 2015 and 2014. Entitlement production volumes are Statoil’s share of the volumes distributed to the partners according to production sharing agreement (PSA) (see section 5.6Terms and abbreviations). For US assets entitlement production is expressed net of royalty interests. For all other countries royalties paid in-cash are included in entitlement production and royalties payable in-kind are excluded.
Proved reserves in Eurasia, excluding Norway
In this area, Statoil has proved reserves of 413 million boe related to six fields and field developments in Azerbaijan, the UK, Ireland and Russia. Eurasia excluding Norway represents 8% of Statoil's total proved reserves, Azerbaijan being the main contributor with the Shah Deniz and Azeri-Chirag-Gunashli fields. All fields are producing, except for the Corrib field in Ireland, which is still under development and anticipated to start production in 2015, and the Mariner field in the UK, which is expected to start production in 2017. The effect of the farm out of Shah Deniz will be included in 2015, after the closing date of the transaction, and will reduce the proved reserves at year end 2015.
Of the proved reserves in Eurasia, 119 million boe or 29% are proved developed reserves. Of the total proved reserves in this area, 48% are liquid reserves and 52% are gas reserves.
| For the year ended 31 December |
| 2016 | | 2015 | | 2014 |
| Oil and NGL | Natural gas | | | Oil and NGL | Natural gas | | | Oil and NGL | Natural gas | |
Production area | mboe/day | mmcm/day | mboe/day | | mboe/day | mmcm/day | mboe/day | | mboe/day | mmcm/day | mboe/day |
| | | | | | | | | | | |
Americas | 189 | 18 | 299 | | 177 | 17 | 283 | | 155 | 19 | 272 |
Africa | 203 | 5 | 232 | | 211 | 5 | 241 | | 179 | 3 | 198 |
Eurasia | 32 | 3 | 50 | | 36 | 1 | 44 | | 37 | 4 | 64 |
Equity accounted production | 10 | - | 10 | | 12 | - | 12 | | 12 | - | 12 |
Total | 435 | 25 | 592 | | 436 | 23 | 580 | | 383 | 26 | 546 |
Statoil, Annual Report on Form 20-F 201627
The table below provides information about the fields that contributed to production in 2016
Proved reserves in Africa
Statoil recognises proved reserves of 364 million boe related to 31 fields and field developments in several West and North African countries, including Algeria, Angola, Libya and Nigeria. Africa represents 7% of Statoil's total proved reserves. Angola is the primary contributor to the proved reserves in this area, with 26 of the 31 fields.
In Angola, Statoil has proved reserves in four blocks, Block 4, Block 15, Block 17 and Block 31, with production from all blocks. Some of the Kizomba satellites in Block 15 are still under development. During 2014 Statoil farmed out of Block 15/06, Western Hub is therefore removed from proved reserves this year.
All fields are in production in Algeria, Libya and Nigeria.
The disputed equity determination at Agbami will potentially alter Statoil's equity share in this field. The effect on the proved reserves will be included once the redetermination is finalised and the effect is known.
Of the total proved reserves in Africa, 287 million boe, or 79%, are proved developed reserves. Of the total proved reserves in this area, 85% are liquid reserves and 15% are gas reserves.Field | Country | Statoil's equity interest in % | Operator | On stream | Licence expiry date | Average daily equity production in 2016 mboe/day | |
| |
| |
| | | | | | | | |
Americas | | | | | | 341.5 | |
Marcellus 1) | US | Varies | Statoil/others | 2008 | HBP2) | 119.7 | |
Bakken 1) | US | Varies | Statoil/others | 2011 | HBP2) | 51.1 | |
Eagle Ford 1) | US | Varies | Statoil/others | 2010 | HBP2) | 40.8 | |
Peregrino | Brazil | 60.00 | Statoil | 2011 | 2034 | 37.5 | |
Leismer Demo | Canada | 100.00 | Statoil | 2010 | HBP2) | 20.4 | |
Tahiti | US | 25.00 | Chevron | 2009 | HBP2) | 17.3 | |
Caesar Tonga | US | 23.55 | Anadarko | 2012 | HBP2) | 12.6 | |
St. Malo | US | 21.50 | Chevron | 2014 | HBP2) | 12.2 | |
Jack | US | 25.00 | Chevron | 2014 | HBP2) | 9.3 | |
Hibernia/Hibernia Southern Extension3) | Canada | Varies | HMDC | 1997 | 2027 | 8.9 | |
Julia | US | 50.00 | ExxonMobil | 2016 | HBP2) | 5.1 | |
Terra Nova | Canada | 15.00 | Suncor | 2002 | 2022 | 4.9 | |
Heidelberg | US | 12.00 | Anadarko | 2016 | HBP2) | 1.6 | |
| | | | | | | | |
Africa | | | | | | 308.0 | |
Block 17 | Angola | 23.33 | Total | 2001 | 2022-344) | 146.1 | |
Agbami | Nigeria | 20.21 | Chevron | 2008 | 2024 | 46.3 | |
Block 15 | Angola | 13.33 | ExxonMobil | 2004 | 2026-324) | 42.1 | |
In Salah | Algeria | 31.85 | Sonatrach/BP/Statoil | 2004 | 2027 | 38.4 | |
Block 31 | Angola | 13.33 | BP | 2012 | 2031 | 21.7 | |
In Amenas | Algeria | 45.90 | Sonatrach/BP/Statoil | 2006 | 2022 | 13.4 | |
| | | | | | | | |
Eurasia | | | | | | 83.6 | |
ACG | Azerbaijan | 8.56 | BP | 1997 | 2024 | 53.9 | |
Corrib | Ireland | 36.50 | Shell | 2015 | 2031 | 17.6 | |
Kharyaga | Russia | 30.00 | Zarubezhneft | 1999 | 2032 | 9.4 | |
Alba | UK | 17.00 | Chevron | 1994 | HBP2) | 2.6 | |
Jupiter | UK | 30.00 | ConocoPhillips | 1995 | HBP2) | 0.2 | |
| | | | | | | | |
Total Development and Production International (DPI) | | | 733.0 | |
| | | | | | | | |
Equity accounted production | | | | | | | |
Petrocedeño5) | Venezuela | 9.68 | Petrocedeño | 2008 | 2033 | 10.3 | |
| | | | | | | | |
Total Development and Production International (DPI) including share of equity accounted production | | | 743.4 | |
| | | | | | | | |
1) | Statoil’s actual equity interest can vary depending on wells and area. | |
2) | Held by Production (HBP): A company’s right to own and operate an oil and gas lease is perpetuated beyond its original primary term, as long thereafter as oil and gas is produced in paying quantities. In the case of Canada, in addition to continuing to be in production, other regulatory requirements must be met. | |
3) | Statoil's equity interests are 5.0% in Hibernia and 9.0% in Hibernia Southern Extension. | |
4) | Varies by field. | |
5) | Petrocedeño is a non-consolidated company and accounted for pursuant to the equity accounting method. It produces extra-heavy crude oil from the Junin area in the Orinoco Belt. | |
28Statoil, Annual Report on Form 20-F 2016
Americas
Statoil has had strong growth in production and continues to optimize its portfolio within US shale since entering the first play in 2008. Statoil entered the Marcellus shale gas play, located in the Appalachian region in north east US, in 2008 through a partnership with Chesapeake Energy Corporation; Statoil has continued to optimize its North America onshore portfolio through acreage acquisition and divestments since 2008. In 2012, Statoil became an operator in the Marcellus through the purchase of additional acreage in the State of West Virginia and Ohio. The most recent divestments occurred in 2016 with divestment of West Virginia to EQT and Antero Resources. At the end of 2016, Statoil continues operatorship in the State of Ohio.
Statoil entered the Bakken tight oil play through the acquisition of Brigham Exploration Company in December 2011. Statoil's net acreage position in Bakken and Three Forks shale formation at the end of 2016 was 241,000 acres.
Statoil entered the Eagle Ford shale formation located in southwest Texas in 2010. In 2013, Statoil became operator for 50% of the Eagle Ford acreage. As part of a global transaction in December 2015 with Repsol, which acquired Talisman in May 2015, Statoil increased its working interest and took full operatorship of all of the assets in the Eagle Ford Shale. As a result, Statoil has a total working interest of 63%. Our joint venture partner, Repsol, continues to hold 37% working interest.
US gathering system
Statoil’s participates in gathering and facilities for initial processing of oil and gas in the Bakken, Eagle Ford and Marcellus assets in the US. This includes crude and natural gas gathering systems, fresh water supply systems, salt water disposal wells, oil and gas treatment and processing facilities to provide flow assurance for Statoil’s upstream production. Midstream assets in Bakken are owned and operated 100% by Statoil. In Eagle Ford, Statoil is the operator for 100% of the midstream assets outside of the Oak, Karnes, DeWitt and Bee (KDB) area with a working interest of 63%. In the KDB area of Eagle Ford, Statoil has an ownership interest of 25.2% in Edwards Lime Gathering LLC, which is operated by Energy Transfer Partners L.P. For Marcellus, Statoil has operated assets in Marcellus South in Monroe Country, Ohio while in the Marcellus non-operated areas both in the North and South, Statoil’s working interest ranges from 16.25% to 32.5% depending on gathering system and number of JV partners which include Williams Energy and Anadarko.
As of 1 January 2016 responsibility for the US gathering system has been transferred from MMP to DPI North America.
Statoil is positioned in the Gulf of Mexico for the following offshore developments:
The Tahiti oil field is located in the Green Canyon area and is produced through a floating spar facility. As of 31 December 2016, there were 12 production wells in operation, and additional wells will be phased in over time to fully develop the field.
The Caesar Tonga oil field is located in the Green Canyon area. As of 31 December 2016, there were seven producing wells tied back to the Anadarko-operated Constitution spar host, and additional production wells will be phased in over time.
The Jack and St. Malo oil fields are located in the Walker Ridge area. The fields are subsea tie-backs to the Chevron operated Walker Ridge Regional Host facility. First production was achieved in December 2014. As of 31 December 2016, there were three wells producing on Jack and six wells producing for St. Malo. Additional production wells will be phased in over time.
The Julia oil field is located in the Walker Ridge area of the Gulf of Mexico near Jack and St Malo. First oil was in April 2016 and two wells are currently online. Additional production wells are currently being drilled and completed and will come online in 2017.
The Heidelberg oil field is located in the Green Canyon area. First oil was on January 2016 and four wells are currently online.
Canada
Statoil has interests in the Jeanne d'Arc Basin offshore the province of Newfoundland and Labrador in the partner operated producing oil fields Terra Nova, Hibernia and Hibernia Southern Extension. In January 2017, Statoil completed the transaction to fully divest the 123,200 net acres of oil sands leases in Alberta which form the Kai Kos Dehseh project to Athabasca Oil Corporation.
Brazil
The Peregrino field is a heavy oil field located in the Campos Basin, about 85 kilometres off the coast of Rio de Janeiro. The field came on stream in 2011. The oil is produced from two wellhead platforms with drilling capability and it is processed on the Peregrino FPSO and offloaded to shuttle tankers. Statoil holds a 60% ownership interest in the field and is operator.
Africa
Angola
The deep water blocks 17, 15 and 31 contributed with 38% of Statoil’s equity liquid production outside Norway in 2016. Each block is governed by a PSA which sets out the rights and obligations of the participants, including mechanisms for sharing of the production with the Angolan state oil company Sonangol.
Statoil, Annual Report on Form 20-F 201629
Block 17 has production from four FPSOs; CLOV, Dalia, Girassol and Pazflor.
Block 15 has production from four FPSOs: Kizomba A, Kizomba B, Kizomba C-Mondo, and Kizomba C-Saxi Batuque.
Block 31 has production from the PSVM FPSO.
The FPSOs serve as production hubs and each receives oil from more than one field and a large number of wells. In 2016, new wells were added and set into production on all three blocks.
Nigeria
Statoil has a 20.2% interest in the Agbami deep water field which is located 110 km off the coast of the Central Niger Delta region. The field is developed with subsea wells connected to an FPSO. The Agbami field straddles the two licences OML 127 and OML 128 and is operated by Chevron under a Unit Agreement. Statoil has 53.85% interest in OML 128.
For information related to the Agbami redetermination process and the dispute between the Nigerian National Petroleum Corporation and the partners in Oil Mining Lease (OML) 128 concerning certain terms of the OML 128 Production Sharing Contract (PSC), see note 23 Other commitments and contingencies to the Consolidated financial statements.
Algeria
The In Salah onshore gas development is a joint operatorship between Sonatrach, BP and Statoil. The Northern fields have been operating since 2004, and the Southern fields project started production from two fields (Garet el Befinat and Hassi Moumene) in March 2016. The remaining two fields (Gour Mahmoud and In Salah) will start production in 2017. The Southern fields are tied back into the Northern fields’ existing facilities.
The In Amenas onshore development is a gas development which contains significant liquid volumes. The In Amenas infrastructure includes a gas treatment plant composed of three processing trains. The production facility is connected to the Sonatrach distribution system. The facilities are operated through a joint operatorship between Sonatrach, BP and Statoil. The third processing train, which was damaged in the January 2013 terrorist attack, restarted in July 2016. The In Amenas Gas Compression project, which was led by BP, came into operation in February 2017. The compressors will make it possible to reduce wellhead pressure and thereby increase production.
Separate PSAs including mechanisms for revenue sharing, govern the rights and obligations of the Parties and establish joint operatorships between Sonatrach, BP and Statoil for In Salah and In Amenas.
Eurasia
Production largely consists of the output from the Azeri-Chirag-Gunashli oil field in the Caspian Sea and the Corrib gas field off Ireland’s northwest coast, which has successfully ramped up production since its start up in December 2015. The cessation of production from Jupiter in the UK North Sea has been declared and the decommissioning of the wells started in fourth quarter of 2016.
International exploration
Statoil has reduced exploration drilling activity outside Norway in 2016 and prioritised new access efforts and prospect maturation to support an increased drilling activity in 2017 and onwards.
Brazil is one of Statoil’s core exploration areas, where in 2016 Statoil successfully completed an appraisal program in BM-C-33, which includes the Pao de Acucar, Seat and Gavea discoveries.
In Canada Statoil and its partners completed a 19-month drilling campaign in the Bay du Nord area, making two new oil discoveries, Baccalieu and Bay de Verde.
In 2016 Statoil secured a position in Turkey through a partnership with Valeura Energy Inc. in the Thrace region in the European north-western part of Turkey.
In December 2016, Mexico’s deepwater bidding round, Round 1.4, took place in Mexico City. A joint venture comprised of Statoil, BP and Total was awarded 2 licenses in Block 1 and Block 3 in the Saline Basin, with Statoil as the operator.
In 2016 Statoil and its partners completed nine exploratory wells and made three discoveries internationally. In 2017 Statoil’s international exploration drilling activity will comprise growth opportunities in basins where Statoil already is established with discoveries and producing fields, such as Canada, Brazil and the UK as well as new frontier opportunities like Suriname and Indonesia. Statoil expects to complete 12 to 14 exploration wells internationally in 2017.
30Statoil, Annual Report on Form 20-F 2016
| Exploratory wells drilled1) |
2016 | 2015 | 2014 |
| | | |
Americas | | | |
Statoil operated | 5 | 8 | 4 |
Partner operated | 2 | 2 | 5 |
Africa | | | |
Statoil operated | 0 | 3 | 7 |
Partner operated | 0 | 3 | 4 |
Other regions | | | |
Statoil operated | 0 | 2 | 2 |
Partner operated | 2 | 0 | 1 |
Total (gross) | 9 | 18 | 23 |
| | | |
1) Wells completed during the year, including appraisals of earlier discoveries. |
Fields under development internationally
This section covers all the sanctioned projects and selected pre-sanctioned projects.
Americas
US
The Stampede oil field is located in the Green Canyon area. The development includes a tension-leg platform (TLP) with downhole gas lift and water injection from start of production. Hess is the operator, and Statoil has a 25% working interest. Start of production is expected in 2018.
TVEX is an extension to Tahiti field, targeting shallower reservoirs above the existing main Tahiti reservoir, which is located in Green Canyon in Gulf of Mexico. Chevron is the operator, and Statoil has a 25% working interest. Start of production is expected in fourth quarter of 2018.
The Big Foot oil field is located in Walker Ridge area. The development includes a dry tree TLP with a drilling rig. Chevron is the operator, and Statoil has a 27.5% working interest. Start of production is expected in 2018. Initial plans called for production to start in late 2015, however, installation was halted and the TLP moved to sheltered waters following damage to subsea installation tendons in late May 2015
US Onshore operations use hydraulic fracturing to recover resources. Despite reduction in investment and activity level in recent years in shale plays Bakken, Eagle Ford and Marcellus, production growth continues. The increase in onshore production despite investment reduction is attributed to higher recovery per well due to enhanced completion and improved operational efficiency.
Canada
The Hebron field, operated by Exxon Mobil, is located in the Jeanne d'Arc basin offshore Newfoundland near the partner-operated producing fields Terra Nova, Hibernia and Hibernia Southern Extension. The Hebron field will be developed using a fixed gravity base structure (GBS) and first oil is expected in late 2017. The topside was constructed in Korea and was transported to Newfoundland during 2016, whereas the GBS was constructed in Newfoundland. The topside and GBS were successfully tested and mated in December 2016. Statoil working interest was reduced from 9.7% to 9.01% effective 1 January 2016 due to a redetermination process.
Statoil has made oil discoveries in the Flemish Pass offshore Newfoundland comprising the Bay du Nord project, and work is on-going to assess options for developing Bay du Nord. Statoil is the operator of Bay du Nord and holds a 65% working interest.
Brazil
Peregrino phase II (Statoil 60%, operator) includes the Peregrino South and Southwest discoveries. The development consists of one wellhead platform tied back to the existing floating production, storage and offloading vessel. In December 2014, Statoil approved the investment decision for the development of the second phase of the Peregrino oil field. Following a programme improving project economics, project execution started in April, 2016. In September 2016, the plan for development was formally approved by the Brazilian national agency of petroleum, natural gas and biofuels (ANP). Production is expected to start in late 2020.
Statoil, Annual Report on Form 20-F 201631
In November 2016, Statoil completed the acquisition of 66% operated share from Petrobras in licence BM-S-8 in the Santos basin. This licence contains a substantial part of the pre-salt discovery Carcará. Carcará straddles both BM-S-8 and open acreage to the north. The definition of the development concept and the subsequent development of licence are dependent on ownership of the open acreage. The open acreage is expected to be included in the licencing round in 2017.
In August 2016, Statoil took over the operatorship of licence BM-C-33 from Repsol Sinopec Brasil. Statoil has 35% equity interest in this licence which is located in the Campos basin. Work is on-going to assess options for developing the discoveries in the licence. For information regarding exploration activity in BM-C-33 see International exploration earlier in this section.
Africa
Tanzania
Statoil has made several large gas discoveries in Block 2 offshore Tanzania. Statoil is the operator of Block 2 and holds a 65% working interest. The licence is located in the Indian Ocean 100 km off the southern part of Tanzania. Work is on-going to assess options for developing the discoveries, including the construction of an onshore LNG plant jointly with the co-venturers in Blocks 1 and 4 which are operated by BG Tanzania (100% owned by Shell).
Eurasia
United Kingdom
Mariner (Statoil 65.11%, operator) is a heavy oil development in the UK, where Statoil is the operator. The field development concept includes a production, drilling and living quarter platform based on a steel jacket. Oil will be exported by offshore loading from a floating storage unit. The development concept includes a possible future subsea tie-in of Mariner East, a small heavy oil discovery. The Mariner B storage vessel arrived Scotland on 26 August 2016, after a two-month voyage from South Korea. On 1 December 2016, the drilling of the first well of the Mariner field development commenced. Production from Mariner is expected to start in 2018.
Bressay (Statoil 81.6%, operator) is also a heavy oil discovery. In February 2016, Statoil decided to pause the concept selection work on Bressay. The partnership has agreed an extension of the licence period until end 2019 with the UK Oil and Gas Authority (OGA).
32Statoil, Annual Report on Form 20-F 2016
2.5 MMP - MARKETING, MIDSTREAM AND PROCESSING
MMP overview
The Marketing, Midstream and Processing (MMP) reporting segment is responsible for marketing, trading, processing and transporting of crude oil and condensate, natural gas, NGL and refined products, including operation of Statoil operated refineries, terminals and processing plants. In addition, MMP is responsible for developing transportation solutions for natural gas, liquids and crude oil from Statoil assets including pipelines, shipping, trucking and rail. The business activities are organised in the following business clusters: Marketing and Trading, Asset Management and Processing and Manufacturing.
Key events in 2016:
·Statoil had a strong increase in delivered sales of crude oil into Asia during 2016, based on West African equity production and shipping capability
·The South Riding Point Terminal in Grand Bahamas sustained damage in the hurricane Matthew in October and was closed to traffic for a period
·Major planned turnarounds at both Kalundborg and Mongstad refineries, Tjeldbergodden methanol plant and Gassled facilities
Marketing and Trading
The Marketing and Trading business cluster (MT) is responsible for the marketing, trading and transportation of all products from Statoil’s upstream, processing and refining business and for power and emissions trading.
MMP handles Statoil's own volumes, the Norwegian state's direct financial interest (SDFI) equity production of crude oil and NGL and third-party volumes, representing approximately 50% of all Norwegian liquids exports. MMP is also responsible for marketing SDFI’s gas together with Statoil’s own volumes and third party gas, representing approximately 70% of all Norwegian gas exports. See the Norwegian state’s participation and SDFI oil and gas marketing and sale in Applicable laws and regulations in section 2.7 Corporate.
Marketing and trading of gas and LNG
Statoil’s gas marketing and trading business is conducted from Norway and from offices in Belgium, the UK, Germany, the USA and Singapore.
Europe
The major export markets for gas from the NCS are Germany, France, the UK, Belgium, the Netherlands, Italy and Spain. LNG from the Snøhvit field, combined with third party LNG cargoes, allow Statoil to reach global gas markets. The major part of the gas is sold to counterparties through bi-lateral sales and the remaining volumes over the trading desk through all the main European trading hubs. The bi-lateral sales are mainly carried out with large industrial customers, power producers and local distribution companies. A few of Statoil’s long-term gas contracts contain contractual price review mechanisms that can be triggered by the buyer or seller at regular intervals, or under certain given circumstances.
Statoil is active on both physical and exchange markets such as the Intercontinental Exchange (ICE). Statoil expects to continue to optimise the market value of the gas through a mix of bi-lateral contracts and trading via its production, transportation systems and downstream assets.
USA
Statoil Natural Gas LLC (SNG), a wholly-owned subsidiary, has a gas marketing and trading organization in Stamford, Connecticut that markets natural gas to local distribution companies, industrial customers and power generators. SNG also markets equity production volumes from the Gulf of Mexico, Eagle Ford and Marcellus and transports some of the northern Marcellus production to New York City and to Niagara, providing access to the greater Toronto area.
In addition, SNG has long-term capacity contracts with Dominion Resources Inc., which owns the Cove Point LNG re-gasification terminal in Maryland. LNG is sourced from the Snøhvit LNG facility in Norway. Due to continuing low gas prices in the US, almost all of Statoil's LNG cargoes have been diverted away from the US and delivered into higher-priced markets in Europe, South-America and Asia.
Statoil, Annual Report on Form 20-F 201633
Marketing and trading of liquids
MMP is responsible for the sale of Statoil's and the SDFI’s crude oil and NGL, in addition to commercial optimisation of the refineries and terminals. The liquids marketing and trading business is conducted from Norway, UK, Singapore, US and Canada. The main crude oil market for Statoil is northwest Europe.
MMP also markets equity volumes from DPI assets located in Canada, US, Brazil, Angola, Nigeria, Algeria, Azerbaijan and UK, as well as third party volumes. Value is maximised through marketing, physical and financial trading and through optimisation of own and leased capacity such as refineries, processing, terminals, storages, pipelines, railcars and vessels.
Production plants
Statoil owns and is operator of the Mongstad refinery in Norway including the Mongstad Heat and Power Plant (MHPP). The refinery is a medium-sized refinery built in 1975, with a crude oil and condensate distillation capacity of 226,000 barrels per day. The refinery is directly linked to offshore fields through two crude oil pipelines, to the crude oil terminal at Sture and the gas processing plant at Kollsnes through an NGL/condensate pipeline, and to Kollsnes by a gas pipeline. MHPP produces heat and power from gas received from Kollsnes and from the refinery. It has capacity of approximately 280 megawatts of electric power and 350 megawatts of process heat.
Statoil has an ownership interest of 34% in Vestprosess, which transports and processes NGL and condensate. The Vestprosess pipeline connects the Kollsnes and Sture plants to Mongstad.
Statoil owns and is operator of the Kalundborg refinery in Denmark, which has a crude oil and condensate distillation capacity of 108,000 barrels per day. The refinery is connected via one gasoline and one gas oil pipeline to the terminal at Hedehusene near Copenhagen, and most of its products are sold locally.
Statoil has an ownership interest of 82% in the methanol plant at Tjeldbergodden. It receives natural gas from the Norwegian Sea through the Haltenpipe pipeline. In addition, Statoil holds a 50.9% ownership interest in the air separation unit Tjeldbergodden Luftgassfabrikk DA.
The following table shows operating statistics for the plants at Mongstad, Kalundborg and Tjeldbergodden.
| Throughput1) | Distillation capacity2) | On stream factor %3) | Utilisation rate %4) |
Refinery | 2016 | 2015 | 2014 | 2016 | 2015 | 2014 | 2016 | 2015 | 2014 | 2016 | 2015 | 2014 |
| | | | | | | | | | | | | |
Mongstad | 9.8 | 11.9 | 9.2 | 9.3 | 9.3 | 9.3 | 94.4 | 97.6 | 93.4 | 93.9 | 93.4 | 90.0 |
Kalundborg | 5.0 | 5.2 | 4.5 | 5.4 | 5.4 | 5.4 | 98.0 | 98.5 | 91.8 | 91.0 | 91.0 | 82.0 |
Tjeldbergodden | 0.76 | 0.92 | 0.83 | 0.95 | 0.95 | 0.95 | 94.8 | 98.5 | 88.4 | 94.8 | 98.5 | 97.1 |
| | | | | | | | | | | | | |
1) | Actual throughput of crude oils, condensates, NGL, feed and blendstock, measured in million tonnes. Higher than distillation capacity for Mongstad due to high volumes of fuel oil and NGL not going through the crude distillation unit. Higher than distillation capacity for Kalundborg, due to volumes of kero, naphta, gasoil and biodiesel-additive not going through the crude-/condensate units. |
2) | Nominal crude oil and condensate distillation capacity, and methanol production capacity, measured in million tonnes. |
3) | Composite reliability factor for all processing units, excluding turnarounds. |
4) | Composite utilisation rate for all processing units, stream day utilisation. |
| | | | | | | | | | | | | |
Terminals and storage
Statoil has a 65% ownership interest in Mongstad crude oil terminal. Crude oil is landed at Mongstad through pipelines from the NCS and by crude tankers from the market. The Mongstad terminal has a storage capacity of 9.4 million barrels of crude oil.
The Sture crude oil terminal receives crude oil through pipelines from the North Sea. The terminal is part of the Oseberg Transportation System (Statoil interest 36.2%). The processing facilities at Sture stabilise Oseberg crude oil and recover LPG mix (propane and butane) and naphtha.
Statoil operates the South Riding Point Terminal, which is located on Grand Bahamas Island and consists of two shipping berths and ten storage tanks, with a storage capacity of 6.75 million barrels of crude oil. The terminal has facilities to blend crude oils, including heavy oils. The main damages suffered in the Matthew hurricane in October were related to the loading infrastructure at the Sea Island, and Berth 2 is still out of operation. Statoil is in the process of scoping the reconstruction.
Statoil UK holds one third share of the interests in the Aldbrough Gas Storage in UK, operated by SSE Hornsea Ltd.
34Statoil, Annual Report on Form 20-F 2016
Statoil Deutschland Storage GmbH holds a 23.7% stake in the Etzel Gas Lager in the northern part of Germany which has a total of nineteen caverns and secures regularity for gas deliveries from the NCS.
Statoil UK holds a 27.3% stake in the Teesside terminal, which stabilises unstable oil from the Ekofisk area and several other Norwegian and UK fields and recovers NGL.
Pipelines
Statoil is a significant shipper in the NCS gas pipeline system. Most gas pipelines on the NCS that are accessed by third-party customers are owned by a single joint venture, Gassled, with regulated third-party access. The Gassled system is operated by the independent system operator Gassco AS, which is wholly owned by the Norwegian state. Statoil’s current ownership share in Gassled is 5%. See Gas sales and transportation from the NCS in section 2.7 Corporatefor further information.
MMP is technical service provider (TSP) for the Kårstø and Kollsnes gas processing plants in accordance with the technical service agreement between Statoil and Gassco AS, included as Exhibit 4(a)(i) to Form 20-F. MMP also performs the TSP role for the larger share of the Gassco operated gas pipeline infrastructure.
In addition, MMP manages Statoil’s ownership in the following pipelines in the Norwegian gas transportation system: Oseberg oil transportation system, Grane oil pipeline, Kvitebjørn oil pipeline, Troll oil pipeline I and II, Edvard Grieg oil pipeline, Utsira High gas pipeline, Valemon rich gas pipeline, Haltenpipe, Norpipe and Mongstad gas pipeline.
Statoil Deutschland GmbH held a 30.8% stake in the Norddeutsche Erdgas Transversale (NETRA) overland gas transmission pipeline via Jordgas Transport GmbH, which was sold during 2016 to Open Grid Europe GmbH and Gasuni Deutschland Transport Services GmbH.
Polarled (Statoil 37.1%, operator) will secure a gas export pipeline for fields in the Norwegian Sea. The project is aligned with the Aasta Hansteen field development.
The Johan Sverdrup oil and gas export pipelines (Statoil 40.0%, operator) will provide export from the Johan Sverdrup field.
Statoil, Annual Report on Form 20-F 201635
2.6 OTHER GROUP
The Other reporting segment includes activities in New Energy Solutions (NES), Global Strategy and Business Development (GSB), Technology, Projects and Drilling (TPD) and corporate staffs and support functions.
New Energy Solutions (NES)
The NES business area reflects Statoil’s aspirations to gradually complement its oil and gas portfolio with profitable renewable energy and other low-carbon energy solutions. Offshore wind and carbon capture and storage have been key focus areas in 2016.
Key events in 2016:
·Acquisition of a 50% stake in the Arkona asset in the German part of the Baltic Sea
·Launch of Statoil Energy Venture Fund and 4 subsequent investments
·Agreement to increase UK presence through increasing owner share in the Dogger Bank projects
·Signed a letter of intent to take over as operator of the Sheringham Shoal wind farm in 2017
·Statoil has concluded a 25% farm down in the Hywind Scotland project
·Winner of US Government’s wind lease sale of 79,350 acres offshore New York
The Sheringham Shoal offshore wind farm (Statoil 40%, operator from 2017) located off the coast of Norfolk, UK, was formally opened in September 2012. The wind farm is in full production with 88 turbines and an installed capacity of 317 megawatt (MW). Following divestment in 2014, it is now owned 40% by Statkraft, a Norwegian wholly state-owned company, 40% by Statoil and 20% by the UK Green Investment Bank (GIB). The wind farm's annual production is approximately 1.1 terawatt hours (TWh) and it has the capacity to provide power to approximately 220,000 households. Statkraft and Statoil have signed a letter of intent that Statoil takes over as operator of Sheringham Shoal in 2017.
The Dudgeon offshore wind farm(Statoil 35%, operator) is located in the Greater Wash area off the English east coast, short distance from Sheringham Shoal. A final investment decision for the 402 MW project was made in July 2014. The wind farm is expected to produce 1.7 TWh yearly from 67 turbines, with the capacity to provide power for around 410,000 households. On 7 January 2017, the first turbine was energised. On 7 February 2017, the first turbine was set in production, delivering electric power to the UK national grid. The wind farm is expected to be in full operation in fourth quarter 2017.
The Dogger Bank area has a total consented capacity of 4.8 GW and is potentially the largest offshore wind farm development in the world. Statoil and Statkraft, together with RWE and SSE, are partners in the Forewind consortium, each with a 25% equity stake. In February and August 2015, the consortium received consent from the UK authorities for four projects, each with a capacity of 1200 MW. Statoil has recently signed an agreement to acquire Statkraft’s share in Dogger Bank, the final shareholding is pending, among other things, partner approval.
The Arkona offshore wind farm (Statoil 50%) is being developed in the German part of the Baltic Sea, and the operations and maintenance base will be located in Sassnitz on the island of Rügen. In April 2016, Statoil acquired a 50% share in AWE-Arkona-Windpark Entwicklungs-GmbH from E.ON Climate & Renewables. A final investment decision for the up to 385 MW project was made in April 2016. All main construction contracts have been awarded, and fabrication has started. The wind farm is expected to supply approximately 400,000 German households from 60 turbines, and to be in full operation in 2019.
The Hywind Scotland pilot wind park (Statoil 75%, operator) is a floating wind pilot park using the Hywind concept, developed and owned by Statoil. The project is located at Buchan Deep, approximately 25 km off Peterhead on the east coast of Scotland. Statoil will install 5 Siemens 6MW turbines, a total capacity of 30MW. Production is expected to be 0.14 TWh/year, powering around 20,000 households. The project was sanctioned in October 2015. The planned first deliveries to the grid are in fourth quarter 2017. This is the next step in Statoil’s strategy towards deployment of the first utility scale floating wind farms.
Statoil is the winner of the New York Wind Energy Area lease, following the December 2016 BOEM lease sale, with a winning bid of USD 42.5 million. The lease is 321 km2, large enough to support one or more offshore wind developments with a total capacity of more than 1GW. The lease is located approximately 20 km directly south of Long Island. The project will be further matured during 2017.
Since 1996, Statoil has proven experience in carbon capture and storage (CCS) and has continued to develop competence through research engagement in the Technical Centre Mongstad (TCM) and offshore operations in Sleipner and Snøhvit. Statoil will seek to deploy our competence and experience in other CCS projects, continue to evaluate opportunities to reduce carbon dioxide emissions and explore carbon dioxide for enhanced oil recovery (EOR) possibilities. Statoil has on behalf of the Norwegian Ministry of Petroleum and Energy (MPE) performed a feasibility study for establishing a CO2 storage on the NCS. The MPE intends to issue a tender process at the end of this year for planning, construction and operation of such CO2 storage as a part of a full CCS value chain from three industrial sources in Norway.
36Statoil, Annual Report on Form 20-F 2016
In February 2016, Statoil launched the Statoil Energy Ventures Fund, a new energy investment fund dedicated to investing in attractive and ambitious growth companies in low carbon energy, supporting Statoil’s strategy of growth in new energy solutions. The Statoil Energy Ventures Fund, will invest up to USD 200 million over a period of four to seven years. During 2016, the fund made four investments in four different segments. United Wind is a distributed wind generation company based in New York that offers to install wind turbines on small property owner's land in exchange for a 20-year lease arrangement. ChargePoint is the largest electric vehicle charging infrastructure company in the USA with plans to expand globally in light of the growth in electric vehicles sales. Convergent Energy & Power is a US based energy storage project developer that builds, finances, owns and operates storage projects on behalf of large utilities and commercial and industrial customers. Oxford PV is a third generation solar technology company based in Oxford, UK that is developing a perovskites material that has the potential to make a significant increase in the efficiency of silicon photovoltaic panels.
Global Strategy and Business Development (GSB)
The Global Strategy and Business Development (GSB) business area is Statoil’s functional centre for strategy and business development. GSB is responsible for Statoil’s global strategy processes and identifies and delivers inorganic business development opportunities, including corporate mergers and acquisitions. This is achieved through close collaboration across geographic locations and business areas. Statoil's strategy forms the basis for guiding the company’s business development focus.
GSB also hosts a number of corporate functions including Statoil’s Corporate Sustainability function, which is shaping the company’s strategic response to sustainability issues and reporting on Statoil’s sustainability performance.
Corporate staffs and support functions
Corporate Staffs and support functions comprise the non-operating activities supporting Statoil, and include headquarters and central functions that provide business support such as finance and control, corporate communication, safety, audit, legal services and people and organisation.
Technology, Projects and Drilling (TPD)
The business area Technology, Projects and Drilling (TPD) is responsible for the development and execution of projects, well deliveries, procurement, research and technology in Statoil.
The TPD organisation was restructured 1 January 2016 to reduce cost, increase efficiency and secure high quality execution. All project expertise was integrated in one Project development organisation (PRD), and all expertise within technology, research and innovation was integrated in one Research and technology organisation (R&T).
Research and Technology (R&T) delivers technical expertise to projects, business developments and assets. Further, R&T drives research, innovation and implementation of new technology across Statoil, to secure both short and long term business needs.
Project Development (PRD) develops and executes all major facility developments, modifications and field decommissioning.
Drilling and Well (D&W) provides cost efficient well deliveries and rig management, including expertise and support to drilling and well operations globally in Statoil.
Procurement and Supplier Relations (PSR) manages the supply chain, conducts all procurements and provides management of contracts in accordance with business needs.
Statoil, Annual Report on Form 20-F 201637 51
Proved reserves in the Americas
In North and South America, Statoil has proved reserves equal to 937 million boe in a total of 16 fields and field development projects. This represents 17% of Statoil's total proved reserves. Ten of these fields are located in the US, seven of which are offshore field developments in the Gulf of Mexico and three are onshore tight reservoir assets. Five are located in Canada and two in South America. The sanctioning of Stampede added new reserves in the Gulf of Mexico in 2014.
In the US, four of the seven fields in the Gulf of Mexico are in production. Field development is ongoing on Big Foot, Heidelberg and Stampede. The onshore tight reservoir assets Marcellus, Eagle Ford and Bakken are all in production. Further drilling in these assets has increased the proved reserves in 2014, which are expressed as both extensions and revision of previous estimate.
In Canada, proved reserves are related both to offshore field developments, and to the Leismer field in the KKD oil sands project in Alberta. The effect of the agreement between Statoil and PTTEP increased the reserves on Leismer.
Of the total proved reserves in the Americas, 501 million boe, or 53%, are proved developed reserves. Of the total proved reserves in this area, 68% are liquid reserves and 32% gas reserves.
3.11.1 Development of reserves
In 2014, approximately 465 million boe were converted from undeveloped to developed proved reserves.
The start-up of production from the Fram H-Nord, Gudrun and Svalin in Norway together with CLOV in Angola and St. Malo and Jack in the US increased developed reserves by 137 million boe during 2014. The rest of the converted volume is related to development activities on producing fields.
Net proved reserves in million barrels oil equivalent | Total | Developed | Undeveloped |
| | | |
At 31 December 2013 | 5,600 | 3,711 | 1,888 |
Revisions and improved recovery | 356 | 250 | 106 |
Extensions and discoveries | 253 | - | 253 |
Purchase of reserves-in-place | 20 | 9 | 10 |
Sales of reserves-in-place | (233) | (76) | (158) |
Production | (635) | (635) | - |
Moved from undeveloped to developed | - | 465 | (465) |
| | | |
At 31 December 2014 | 5,359 | 3,725 | 1,635 |
The new development projects in Norway, the US and Angola, added a total of 65 million boe of proved undeveloped reserves in 2014. Further drilling in the Bakken, Marcellus and Eagle Ford onshore plays in the US increased the proved area and added proved undeveloped reserves. The approval of new areas for development on Leismer, by the Alberta Energy Regulator, also added reserves in the undeveloped category. These additions are categorised as extensions and together with extensions on existing fields and new discoveries this added a total of 253 million boe of proved undeveloped reserves.
Revision of estimate on existing fields added 106 million boe proved undeveloped reserves. These revisions are based on new information available either from drilling of new wells or from production experience, resulting in an improved understanding of the fields.
The net effect of the transactions done in 2014, reduced the proved undeveloped reserves by 148 million boe.
52Statoil, Annual Report on Form 20-F 2014
| | Oil and Condensate | NGL | Natural gas | Total |
| | (mmboe) | (mmboe) | (bcf) | (mmboe) |
| | | | | |
2014 | Proved reserves end of year | 1,942 | 403 | 16,919 | 5,359 |
| Developed | 1,156 | 310 | 12,677 | 3,725 |
| Undeveloped | 786 | 93 | 4,242 | 1,635 |
2013 | Proved reserves end of year | 1,877 | 441 | 18,416 | 5,600 |
| Developed | 1,052 | 330 | 13,073 | 3,711 |
| Undeveloped | 826 | 111 | 5,343 | 1,888 |
2012 | Proved reserves end of year | 1,919 | 469 | 17,027 | 5,422 |
| Developed | 1,049 | 334 | 13,210 | 3,737 |
| Undeveloped | 870 | 135 | 3,817 | 1,686 |
Project startups and completions 2016 | Statoil's interest | Operator | Area | Type |
|
|
| | As
|
Heidelberg | 12.00% | Anadarko | Gulf of 31 December 2014, the total proved undeveloped reserves amounted to 1,635 million boe, 51%Mexico | Oil |
Snorre A drilling facilities upgrade | 33.28% | Statoil | North Sea | Improved oil recovery |
Goliat | 35.00% | Eni | Barents Sea | Oil and gas |
In Salah Southern fields | 31.85% | Sonatrach/BP/Statoil | Algeria | Gas |
Julia | 50.00% | ExxonMobil | Gulf of which are related to fields in Norway. The Snøhvit, Grane, Troll, ValemonMexico | Oil |
Gullfaks Rimfaksdalen | 51.00% | Statoil | North Sea | Oil |
B11 removal | 5.00% | Gassco1) | North Sea | Field decommissioning |
Ivar Aasen | 41.47% | Aker BP | North Sea | Oil and Oseberg fields, which have continuous development activities, represent the largest undeveloped assets in Norway togethergas |
- held through Lundin | 0.28% | | | |
1) Statoil is technical operator | |
Ongoing projects with fields not yet in production, such as expected startups and completions 2017-2020 | Statoil's interest | Operator | Area | Type |
| | | | |
Gina Krog | 58.70% | Statoil | North Sea | Oil and gas |
Gullfaks C subsea compression | 51.00% | Statoil | North Sea | Improved gas recovery |
Dudgeon offshore wind farm | 35.00% | Statoil | North Sea, off English coast | Wind |
Hywind Scotland pilot wind park | 75.00% | Statoil | North Sea, off Scottish coast | Wind |
Volve decommissioning | 59.60% | Statoil | North Sea | Field decommissioning |
Byrding | 70.00% | Statoil | North Sea | Oil and associated gas |
Hebron | 9.01% | ExxonMobil | Newfoundland, Canada | Oil |
Tahiti vertical expansion | 25.00% | Chevron | Gulf of Mexico | Oil |
Aasta Hansteen Gina Krog, Goliat | 51.00% | Statoil | Norwegian Sea | Gas |
Polarled | 37.10% | Statoil | Norwegian Sea | Gas export pipeline |
Oseberg Vestflanken 2 | 49.30% | Statoil | North Sea | Oil and Ivar Aasen. The largest assets with respect to undeveloped proved reserves outside Norway are Shah Deniz in Azerbaijan, Leismer in Canada, gas |
Mariner | 65.11% | Statoil | North Sea | Oil |
Troll B gas module | 30.58% | Statoil | North Sea | Increased processing capacity |
Big Foot | 27.50% | Chevron | Gulf of Mexico | Oil |
Martin Linge | 19.00% | Total | North Sea | Oil and Corrib in the UK, the US onshore developments in Marcellusgas |
Stampede | 25.00% | Hess | Gulf of Mexico | Oil |
Arkona offshore wind farm | 50.00% | E.ON | Baltic Sea, off German coast | Wind |
Johan Sverdrup | 40.03% | Statoil | North Sea | Oil and Stampede offshore US.associated gas |
- held through Lundin | 4.54% | In 2014, Statoil incurred NOK 100 billion in development costs relating to assets carrying proved reserves, NOK 76 billion of which was related to proved undeveloped reserves.
| Large fields with continuous development activity may contain reserves that are expected to remain undeveloped for five years or more. Examples are Snorre, Troll, Ekofisk, Heidrun, Snøhvit and Grane in Norway, Leismer and Hebron in Canada, Azeri-Chirag-Gunashli and Shah Deniz Phase in Azerbaijan, Shah Deniz Phase and Mariner in UK and Petrocedeno in Venezuela. These are large field developments with several billion dollars invested in complex infrastructure and with continuous development that will require extensive, sustained drilling of wells for a long period of time. It is highly unlikely that these field development projects will be prematurely terminated, since this would result in a significant loss of capital.
| |
The Corrib gas development in Ireland (operated by Shell), has been under development for more than five years. Most of the offshore and onshore facilities are in place and the field is expected to start production in 2015.Johan Sverdrup export pipelines, JoSEPP
| 40.03% | Additional information about proved oilStatoil
| North Sea | Oil and gas reserves is provided in note 27 Supplementary oilexport pipelines |
- held through Lundin | 4.54% | | | |
Utgard Norwegian sector | 38.44% | Statoil | North Sea | Gas and gas information (unaudited) to the Consolidated financial statements.condensate |
UK sector | 38.00% | 3.11.2 Preparations of reserves estimates
| Statoil's annual reporting process for proved reserves is coordinated by a central team.
| |
The corporate reserves management (CRM) team consists of qualified professionals in geosciences, reservoirTrestakk
| 59.10% | Statoil | North Sea | Oil and production technology and financial evaluation. The team has an average of more than 20 years' experience in the oil andassociated gas industry. CRM reports to the senior vice president of finance and control in the Technology, Drilling and Projects business area and is thus independent of the Development & Production business areas in Norway, |
Huldra decommissioning | 19.87% | Statoil | North America and International. All the reserves estimates have been prepared by Statoil's technical staff.Sea | Field decommissioning |
Although the CRM team reviews the information centrally, each asset team is responsible for ensuring that it is in compliance with the requirements of the SEC and Statoil's corporate standards. Information about proved oil and gas reserves, standardised measures of discounted net cash flows related to proved oil and gas reserves and other information related to proved oil and gas reserves, is collected from the local asset teams and checked by CRM for consistency and conformity with applicable standards. The final numbers for each asset are quality-controlled and approved by the responsible asset manager, before aggregation to the required reporting level by CRM.Peregrino phase II
| 60.00% | The aggregated results are submitted for approval to the relevant business area management teams and the corporate executive committee.Statoil
| Brazil | The person with primary responsibility for overseeing the preparation of the reserves estimates is the chair of the CRM team. The person who presently holds this position has a bachelor's degree in earth sciences from the University of Gothenburg, and a master's degree in petroleum exploration and exploitation from Chalmers University of Technology in Gothenburg, Sweden. She has 29 years' experience in the oil and gas industry, 28 of them with Statoil. She is a member of the Society of Petroleum Engineering (SPE) and vice-chair of the UNECE Expert Group on Resource Classification (EGRC).Oil
|
Statoil, Annual Report on Form 20-F 201453Startups beyond 2020
| | DeGolyer and MacNaughton report
| Petroleum engineering consultants DeGolyer and MacNaughton have carried out
| |
In our world-class portfolio, an independent evaluation of Statoil's proved reserves as of 31 December 2014. The evaluation accounts for 100% of Statoil's proved reserves. The aggregated net proved reserves estimates prepared by DeGolyer and MacNaughton do not differ materially from those prepared by Statoil when compared on the basis of net equivalent barrels. | Oil and Condensate | NGL/LPG | Sales Gas | Oil Equivalent | Net proved reserves at 31 December 2014 | (mmbbls) | (mmbbl) | (bcf) | (mmboe) | | | | | | Estimated by Statoil | 1,942 | 403 | 16,919 | 5,359 | Estimated by DeGolyer and MacNaughton | 1,932 | 373 | 17,609 | 5,443 |
A reserves audit report summarising this evaluation is included as Exhibit 15 (a)(iv).
3.11.3 Operational statistics
Operational statistics include information about acreage and the number of wells drilled.
Developed and undeveloped acreage
The table below shows the total gross and net developed and undeveloped oil and gas acreage, in which Statoil had interests at 31 December 2014.
A gross value reflects wells or acreage in which we have interests (presented as 100%). The net value corresponds to the sum of the fractional working interests owned in gross wells or acres.
| | Norway | Eurasia excluding Norway | Africa | Americas | Oceania | Total | At 31 December 2014 (in thousands of acres) | | | | | | | | | | Developed and undeveloped oil and gas acreage | | | | | | | | Acreage developed | - gross | 855 | 90 | 997 | 535 | - | 2,477 | | - net | 309 | 18 | 304 | 227 | - | 857 | Acreage undeveloped | - gross | 9,792 | 39,112 | 15,996 | 16,914 | 30,870 | 112,685 | | - net | 3,616 | 15,261 | 5,243 | 5,528 | 19,479 | 49,127 |
The largest concentrations of developed acreage in Norwayadditional 35-40 projects are in the Troll, Skarv, Snøhvit, Ormen Lange and Oseberg areas. In Africa, the Algerian gas development projects In Amenas and In Salah represent the largest concentrations of developed acreage (gross and net).
Statoil's largest undeveloped acreage concentration is in Australia, which was acquired in 2013. Russia has the largest undeveloped acreage in Eurasia excluding Norway, with 55% of the total for this geographic area. The largest acreage concentration in Africa is in Angola, representing 58% of the total net acreage in Africa.
Statoil holds acreage in numerous concessions, blocks and leases. The terms and conditions regarding expiration dates vary significantly from property to property. Work programs are designed to ensure that the exploration potential of any property is fully evaluated before expiration.
Acreage related to several of these concessions, blocks and leases are scheduled to expire within the next three years. Any acreage which has already been evaluated to be non-profitable may be relinquished prior to the current expiration date. In other cases, we may decide to apply for an extension if more time is needed in order to fully evaluate the potential of the properties. Historically, Statoil has generally been successful in obtaining such extensions.
Most of the undeveloped acreage that will expire within the next three years is related to early exploration activities where no production is expected in the foreseeable future. The expiration of these leases, blocks and concessions will therefore not have any material impact on our reserves.
54Statoil, Annual Report on Form 20-F 2014
Productive oil and gas wells
The number of gross and net productive oil and gas wells, in which Statoil had interests at 31 December 2014, are shown in the table below.
| | Norway | Eurasia excluding Norway | Africa | Americas | Total | At 31 December 2014 | | | | | | | | | Number of productive oil and gas wells | | | | | | | Oil wells | - gross | 837 | 156 | 307 | 2,724 | 4,024 | | - net | 286.4 | 22.4 | 53.5 | 1,794.8 | 2,157.2 | Gas wells | - gross | 195 | 6 | 81 | 1,699 | 1,981 | | - net | 81.5 | 0.9 | 30.9 | 412.7 | 526.0 |
The total gross number of productive wells as of end 2014 includes 407 oil wells and 12 gas wells with multiple completions or wells with more than one branch.
Net productive and dry oil and gas wells drilled
The following tables show the net productive and dry exploratory and development oil and gas wells completed or abandoned by Statoil in the past three years. Productive wells include exploratory wells in which hydrocarbons were discovered, and where drilling or completion has been suspended pending further evaluation. A dry well is one found to be incapable of producing sufficient quantities to justify completion as an oil or gas well.
| Norway | Eurasia excluding Norway | Africa | Americas | Oceania | Total | | | | | | | | Year 2014 | | | | | | | Net productive and dry exploratory wells drilled | 12.0 | 1.0 | 4.7 | 3.4 | 3.6 | 24.7 | - Net dry exploratory wells drilled | 3.4 | 1.0 | 2.7 | 1.6 | 3.6 | 12.2 | - Net productive exploratory wells drilled | 8.6 | - | 2.0 | 1.9 | - | 12.5 | | | | | | | | Net productive and dry development wells drilled | 26.9 | 2.7 | 8.5 | 386.1 | - | 424.2 | - Net dry development wells drilled | 3.5 | - | 1.1 | 1.2 | - | 5.8 | - Net productive development wells drilled | 23.4 | 2.7 | 7.4 | 384.9 | - | 418.4 | | | | | | | | Year 2013 | | | | | | | Net productive and dry exploratory wells drilled | 19.3 | 0.3 | 2.2 | 2.3 | - | 24.0 | - Net dry exploratory wells drilled | 7.3 | 0.3 | 2.2 | 2.3 | - | 12.0 | - Net productive exploratory wells drilled | 12.0 | - | - | - | - | 12.0 | | | | | | | | Net productive and dry development wells drilled | 26.7 | 2.3 | 5.9 | 321.9 | - | 356.7 | - Net dry development wells drilled | 1.7 | - | 0.7 | 1.3 | - | 3.7 | - Net productive development wells drilled | 24.9 | 2.3 | 5.3 | 320.6 | - | 353.1 | | | | | | | | Year 2012 | | | | | | | Net productive and dry exploratory wells drilled | 8.7 | 2.0 | 3.0 | 3.1 | - | 16.8 | - Net dry exploratory wells drilled | 2.3 | 2.0 | 0.4 | 1.6 | - | 6.3 | - Net productive exploratory wells drilled | 6.4 | - | 2.6 | 1.5 | - | 10.5 | | | | | | | | Net productive and dry development wells drilled | 22.8 | 1.9 | 7.0 | 441.0 | - | 472.6 | - Net dry development wells drilled | 1.3 | - | 0.3 | 0.6 | - | 2.1 | - Net productive development wells drilled | 21.5 | 1.9 | 6.7 | 440.4 | - | 470.5 |
Statoil, Annual Report on Form 20-F 201455
Exploratory and development drilling in process
The following table shows the number of exploratory and development oil and gas wells in the process of being drilled by Statoil at 31 December 2014.
| | Norway | Eurasia excluding Norway | Africa | Americas | Total | At 31 December 2014 | | | | | | | | | Number of wells in progress | | | | | | | Development wells | - gross | 46 | 6 | 19 | 506 | 577 | | - net | 16.0 | 0.9 | 3.9 | 155.9 | 176.7 | Exploratory wells | - gross | 3 | - | 2 | 3 | 8 | | - net | 1.8 | - | 0.9 | 1.5 | 4.2 |
3.11.4 Delivery commitments
This section describes the long-term NCS commitments for the contract years 2014-2017.
On behalf of the Norwegian State's direct financial interest (SDFI), Statoil is responsible for managing, transporting and selling the Norwegian state's oil and gas from the Norwegian continental shelf (NCS). These reserves are sold in conjunction with Statoil's own reserves. As part of this arrangement, Statoil delivers gas to customers under various types of sales contracts. In order to meet the commitments, we utilise a field supply schedule that ensures the highest possible total value for Statoil and SDFI's joint portfolio of oil and gas.
The majority of our gas volumes in Norway are sold under long-term contracts with take-or-pay clauses. Statoil's and SDFI's annual delivery commitments under these agreements are expressed as the sum of the expected off-take under these contracts. As of 31 December 2014, the long-term commitments from NCS for the Statoil/SDFI arrangement totalled approximately 15.19 trillion cubic feet (tcf) (430 bcm).
Statoil and SDFI's delivery commitments, expressed as the sum of expected off-take for the gas years 2014, 2015, 2016 and 2017, are 2.24, 1.97, 1.62 and 1.37 tcf (63.5, 55.8, 46.0 and 38.8 bcm), respectively. The remaining volumes are sold to large industrial end users or on the short-term market.
Statoil's currently developed gas reserves in Norway are more than sufficient to meet our share of these commitments for the next three years.
3.12 Applicable laws and regulations
The principal laws governing our petroleum activities in Norway are the Norwegian Petroleum Act and the Norwegian Petroleum Taxation Act.
The principal laws governing our petroleum activities in Norway and on the NCS are currently the Norwegian Petroleum Act of 29 November 1996
(The "Petroleum Act") and the regulations issued thereunder, and the Norwegian Petroleum Taxation Act of 13 June 1975 (the "Petroleum Taxation Act"). The Petroleum Act sets out the principle that the Norwegian State is the owner of all subsea petroleum on the NCS, that exclusive right to resource management is vested in the Norwegian State and that the Norwegian State alone is authorised to award licences for petroleum activities. We are dependent on the Norwegian State for approval of our NCS exploration and development projects and our applications for production rates for individual fields.
Under the Petroleum Act, the Norwegian Ministry of Petroleum and Energy is responsible for resource management and for administering petroleum activities on the NCS. The main task of the Ministry of Petroleum and Energy is to ensure that petroleum activities are conducted in accordance with the applicable legislation, the policies adopted by the Norwegian parliament (the Storting) and relevant decisions of the Norwegian State. The Ministry of Petroleum and Energy primarily implements petroleum policy through its powers to administer the awarding of licences and to approve operators' field and pipeline development plans. Only plans that comply with the policies and regulations adopted by the Storting are approved. As set out in the Petroleum Act, if a plan involves an important principle or will have a significant economic or social impact, it must also be submitted to the Storting for acceptance before being approved by the Norwegian Ministry of Petroleum and Energy.
56Statoil, Annual Report on Form 20-F 2014
We are not required to submit any decisions relating to our operations to the Storting. However, the Storting's role in relation to major policy issues in the petroleum sector can affect us in two ways: firstly, when the Norwegian State acts in its capacity as majority owner of our shares and, secondly, when the Norwegian State acts in its capacity as regulator:
·The Norwegian State's shareholding in Statoil is managed by the Ministry of Petroleum and Energy. The Ministry of Petroleum and Energy will normally decide how the Norwegian State will vote on proposals submitted to general meetings of the shareholders. However, in certain exceptional cases, it may be necessary for the Norwegian State to seek approval from the Storting before voting on a certain proposal. This will normally be the case if we issue additional shares and such issuance would significantly dilute the Norwegian State's holding, or if such issuance would require a capital contribution from the Norwegian State in excess of government mandates. It is not possible to predict what stance the Norwegian Storting will take on a proposal to issue additional shares that would either significantly dilute its holding of Statoil shares or require a capital contribution from it in excess of government mandates. A decision by the Norwegian State to vote against a proposal on our part to issue additional shares would prevent us from raising additional capital in this manner and could adversely affect our ability to pursue business opportunities. For more information about the Norwegian State's ownership, see the sections Risk review - Risk factors - Risks related to state ownership and Shareholder information - Major shareholders.
·The Norwegian State exercises important regulatory powers over us, as well as over other companies and corporations. As part of our business, we, or the partnerships to which we are a party, frequently need to apply for licences and other approval of various kinds from the Norwegian State. In respect of certain important applications, such as for the approval of major plans for the operation and development of fields, the Ministry of Petroleum and Energy must obtain the consent of the Storting before it can approve our or the relevant partnership's application. This may take additional time and affect the content of the decision. Although Statoil is majority-owned by the Norwegian State, it does not receive preferential treatment with respect to licences granted by or under any other regulatory rules enforced by the Norwegian State.
Although Norway is not a member of the European Union (EU), it is a member of the European Free Trade Association (EFTA). The EU and the EFTA Member States have entered into the Agreement on the European Economic Area, referred to as the EEA Agreement, which provides for the inclusion of EU legislation covering the four freedoms - the free movement of goods, services, persons and capital - in the national law of the EFTA Member States (except Switzerland). An increasing volume of regulations affecting us is adopted in the EU and then applied to Norway under the EEA Agreement. As a Norwegian company operating within both EFTA and the EU, our business activities are subject to both the EFTA Convention governing intra-EFTA trade and EU laws and regulations adopted pursuant to the EEA Agreement.
3.12.1 The Norwegian licensing system
Production licences are the most important type of licence awarded under the Petroleum Act, and the Norwegian Ministry of Petroleum and Energy has executive discretionary powers to award and set the terms for production licences.
As a participant in licences, we are subject to the Norwegian licensing system. For an overview of our activities and shares in our production licences, see Business overview - Development and Production Norway (DPN).
Production licences are the most important type of licence awarded under the Petroleum Act, and the Ministry of Petroleum and Energy has executive discretionary powers to award a production licence and to decide the terms of that licence. The Norwegian Government is not entitled to award us a licence in an area until the Norwegian parliament (Storting) has decided to open the area in question for exploration. The terms of our production licences are decided by the Ministry of Petroleum and Energy.
A production licence grants the holder an exclusive right to explore for and produce petroleum within a specified geographical area. The licensees become the owners of the petroleum produced from the field covered by the licence.
Production licences are normally awarded in licensing rounds. The first licensing round for NCS production licences was announced in 1965. The award of the first licences covered areas in the North Sea. Over the years, the awarding of licences has moved northward to cover areas in both the Norwegian Sea and the Barents Sea.
The Norwegian State accepts licence applications from individual companies and group applications. This allows us to choose our exploration and development partners, however the Ministry of Petroleum and Energy has full discretion with respect to which companies to award a licence and as such disregard a group application.
Production licences are awarded to joint ventures. The members of the joint venture are jointly and severally responsible to the Norwegian State for obligations arising from petroleum operations carried out under the licence. Once a production licence is awarded, the licensees are required to enter into a joint operating agreement and an accounting agreement regulating the relationship between the partners. The Ministry of Petroleum and Energy decides the form of the joint operating agreements and accounting agreements.
The governing body of the joint venture is the management committee. In licences awarded since 1996 where the state's direct financial interest (SDFI) holds an interest, the Norwegian State, acting through Petoro AS, may veto decisions made by the joint venture management committee, which, in the opinion of the Norwegian State, would not be in compliance with the obligations of the licence with respect to the Norwegian State's exploitation policies or financial interests. This power of veto has never been used.
Statoil, Annual Report on Form 20-F 201457
The day-to-day management of a field is the responsibility of an operator appointed by the Ministry of Petroleum and Energy. The operator is in practice always a member of the joint venture holding the production licence, although this is not legally required. The terms of engagement of the operator are set out in the joint operating agreement, under which the operator can normally terminate its engagement by giving six months' notice. The management committee can terminate the operator's engagement by giving six months' notice through an affirmative vote by all members of the management committee other than the operator. A change of operator requires the consent of the Ministry of Petroleum and Energy. In special cases, the Ministry of Petroleum and Energy can order a change of operator.
Licensees are required to submit a plan for development and operation (PDO) to the Ministry of Petroleum and Energy for approval. For fields of a certain size, the Storting has to accept the PDO before it is formally approved by the Ministry of Petroleum and Energy.
Production licences are normally awarded for an initial exploration period, which is typically six years, but which can be shorter. The maximum period is ten years. During this exploration period, the licensees must meet a specified work obligation set out in the licence. If the licensees fulfil the obligations set out in the production licence, they are entitled to require that the licence be prolonged for a period specified at the time when the licence is awarded, typically 30 years. As a rule, the right to prolong a licence does not apply to the whole of the geographical area covered by the initial licence. The size of the area that must be relinquished is determined at the time the licence is awarded. In special cases, the Ministry of Petroleum and Energy may extend the duration of a production licence.
If natural resources other than petroleum are discovered in the area covered by a production licence, the Norwegian State may decide to delay petroleum production in the area. If such a delay is imposed, the licensees are, with certain exceptions, entitled to a corresponding extension of the licence period. To date, such a delay has never been imposed.
If important public interests are at stake, the Norwegian State may instruct us and other licensees on the NCS to reduce the production of petroleum. The last time the Norwegian State instructed a reduction in oil production was in 2002.
Licensees may buy or sell interests in production licences subject to the consent of the Ministry of Petroleum and Energy and the approval of the Ministry of Finance of a corresponding tax treatment position. The Ministry of Petroleum and Energy must also approve indirect transfers of interests in a licence, including changes in the ownership of a licensee, if they result in a third party obtaining a decisive influence over the licensee. In most licences, there are no pre-emption rights in favour of the other licensees. However, the SDFI, or the Norwegian State, as appropriate, still holds pre-emption rights in all licences.
A licence from the Ministry of Petroleum and Energy is also required in order to establish facilities for the transportation and utilisation of petroleum. When applying for such licences a group of companies must prepare a plan for installation and operation. Licences for the establishment of facilities for the transportation and utilisation of petroleum will normally be awarded subject to certain conditions. Typically, these conditions require the facility owners to enter into a participants' agreement. Ownership of most facilities for the transportation and utilisation of petroleum in Norway and on the NCS is organised in the form of joint ventures. The participants' agreements are similar to the joint operating agreements.
Licensees are required to prepare a decommissioning plan before a production licence or a licence to establish and use facilities for the transportation and utilisation of petroleum expires or is relinquished, or the use of a facility ceases. The decommissioning plan must be submitted to the Ministry of Petroleum and Energy no sooner than five years and no later than two years prior to the expiry of the licence or cessation of use of the facility, and it must include a proposal for the disposal of facilities on the field. On the basis of the decommissioning plan, the Ministry of Petroleum and Energy makes a decision as to the disposal of the facilities.
The Norwegian State is entitled to take over the fixed facilities of the licensees when a production licence expires, is relinquished or revoked. In respect of facilities on the NCS, the Norwegian State decides whether any compensation will be payable for facilities thus taken over. If the Norwegian State should choose to take over onshore facilities, the ordinary rules of compensation in connection with the expropriation of private property apply.
Licences for the establishment of facilities for the transportation and utilisation of petroleum typically include a clause whereby the Norwegian State can require that the facilities be transferred to it free of charge on expiry of the licence period.
3.12.2 Gas sales and transportation
We market gas from the NCS on our own behalf and on the Norwegian State's behalf. Gas is transported through the Gassled pipeline network to customers in the UK and mainland Europe.
Most of our and the Norwegian State's gas produced on the NCS is sold under gas contracts to customers in the European Union (EU). The EU internal energy market has been high on the European Commission's agenda, and this market has thus been subject to continuous legislative initiatives. Such changes in EU legislation may affect Statoil's marketing of gas.
The Norwegian gas transport system, consisting of the pipelines and terminals through which licensees on the NCS transport their gas, is owned by a joint venture called Gassled. The Norwegian Petroleum Act of 29 November 1996 and the pertaining Petroleum Regulation establish the basis for non- discriminatory third-party access to the Gassled transport system. The ownership structure in Gassled and the pertaining regulations are intended to ensure the effectiveness of the system and to prevent conflicts of interest.
58Statoil, Annual Report on Form 20-F 2014
To ensure neutrality, the petroleum regulations also stipulate that all booking and allocation of capacity is administrated by Gassco AS, an independent system operator wholly owned by the Norwegian State. Spare capacity is released and allocated to shippers by Gassco based on standard procedures. Capacity that has already been allocated to a shipper may also be transferred bilaterally between shippers.
The tariffs for the use of capacity in the transport system are determined by applying a formula set out in separate tariff regulations stipulated by the Ministry of Petroleum and Energy. The tariffs are paid on the basis of booked capacity, not on the basis of the volumes actually transported. The Ministry's main objective when setting the tariffs is to ensure that the profits are extracted in the production fields on the NCS and not in the transport system.
For further information, see Business overview - Marketing, Processing and Renewable Energy (MPR) - Natural Gas - The Norwegian gas transportation system.
3.12.3 HSE regulation
Our petroleum operations are subject to extensive laws and regulations relating to health, safety and the environment (HSE).
Norway
Under the Petroleum Act of 29 November 1996, our oil and gas operations must be conducted in compliance with a reasonable standard of care, taking into consideration the safety of employees, the environment and the economic values represented by installations and vessels. The Petroleum Act specifically requires that petroleum operations be carried out in such a manner that a high level of safety is maintained and developed in step with technological developments.
On 10 June 2013 the EU adopted a directive on safety of offshore oil and gas operations. All member states will have to abide by the directive. The directive is not considered to be comprised by the European Economic Area (EEA), of which Norway is part and will thus not have implication to our NCS activities.
We are required at all times to have a plan to deal with emergency situations in our petroleum operations. During an emergency, the Norwegian Ministry of Labour/Norwegian Ministry of Fisheries and Coastal Affairs/Norwegian Coastal Administration may decide that other parties should provide the necessary resources, or otherwise adopt measures to obtain the necessary resources, to deal with the emergency for the licensees' account.
See also Risk review - Risk factors - Legal and regulatory risks.
Global operations
With business operations in more than 30 countries, Statoil is subject to a wide variety of HSE laws and regulations concerning its products, operations and activities. As a result of the Macondo incident, in 2011, the US Department of the Interior created two new agencies to administer operations and activities in the Gulf of Mexico - the Bureau of Safety and Environmental Enforcement (BSEE) and the Bureau of Offshore Energy Management (BOEM). The department also issued new regulations to address the respective roles of the new agencies. Application of these regulations has the potential to affect our operations in the USA. Similarly, the effects from implementing the EU offshore Safety Directive in EU-member states' legislation will affect operations in relevant EU member countries.
See also Risk review - Risk factors - Legal and regulatory risks.
3.12.4 Taxation of Statoil
We are subject to ordinary Norwegian corporate income tax and to a special petroleum tax relating to our offshore activities in Norway. Internationally, our activities are mainly subject to tax in the countries where we operate.
Taxation in Norway
Statoil's Norwegian petroleum activities are subject to ordinary corporate income tax and to a special petroleum tax. In addition, there are taxes on both carbon dioxide emissions and emissions of nitrogen oxide. The holders of production licences are also required to pay an area fee. The amount of the area fee is stipulated in regulations issued under the Petroleum Act.
Corporate income tax
Our profits, both from offshore oil and natural gas activities and from onshore activities, are subject to Norwegian corporate income tax. The standard corporate income tax rate is 27%. Our profits are computed in accordance with ordinary Norwegian corporate income tax rules, subject to certain modifications that apply to companies engaged in petroleum operations. Gross revenue from oil production and the value of lifted stocks of oil are determined on the basis of norm prices. Norm prices are decided on a daily basis by the Petroleum Price Board, a body whose members are appointed by the Norwegian Ministry of Petroleum and Energy. Norm prices are published quarterly. The Petroleum Tax Act states that the norm prices shall correspond to the prices that could have been obtained in a sale of petroleum between independent parties in a free market. When stipulating norm prices, the Petroleum Price Board takes a number of factors into consideration, including spot market prices and contract prices in the industry.
Statoil, Annual Report on Form 20-F 201459
The maximum rate of depreciation of development costs relating to offshore production installations and pipelines is 16.67% per year. Depreciation starts when the cost is incurred. Exploration costs may be deducted in the year in which they are incurred. Financial costs related to the offshore activity are calculated directly based on a formula set out in the Petroleum Tax Act. The financial costs deductible under the offshore tax regime are the total interest costs and exchange gains and losses related to interest-bearing debt multiplied by 50% of tax values divided by the average interest-bearing debt. All other financial costs and income are allocated to the onshore tax regime.
Abandonment costs incurred can be deducted as operating expenses. Provisions for future abandonment costs are not tax deductible.
Any tax losses can be carried forward indefinitely against subsequent income earned. 50% of losses relating to activity conducted onshore in Norway can be deducted from NCS income subject to the standard 27% income tax rate. Losses on foreign activities cannot be deducted from NCS income. Losses on offshore activities are fully deductible from onshore income.
By using group contributions between Norwegian companies in which we hold more than 90% of the shares and votes, tax losses and taxable income can be offset to a great extent. Group distributions are not deductible from our offshore income.
Dividends received are subject to tax in Norway. The basis for taxation is 3% of the dividend received, which is subject to the standard 27% income tax rate. Dividends received from Norwegian companies and from similar companies resident in the EEA for tax purposes, in which the recipient holds more than 90% of the shares and votes, are fully exempt from tax. Dividends from companies resident in the EEA that are not similar to Norwegian companies, companies in low-tax countries and portfolio investments outside the EEA will, under certain circumstances, be subject to the standard 27% income tax rate based on the full amounts received.
Capital gains from the realisation of shares are exempt from tax. Exceptions apply to shares held in companies resident in low-tax countries or portfolio investments in companies resident outside the EEA for tax purposes, where, under certain circumstances, capital gains will be subject to the standard 27% income tax rate and capital losses will be deductible.
Special petroleum tax
A special petroleum tax is levied on profits from petroleum production and pipeline transportation on the NCS. The special petroleum tax is currently levied at a rate of 51%. The special tax is applied to relevant income in addition to the standard income tax rate, resulting in a 78% marginal tax rate on income subject to petroleum tax. The basis for computing the special petroleum tax is the same as for income subject to ordinary corporate income tax, except that onshore losses are not deductible from the special petroleum tax basis, and a tax-free allowance, or uplift, is granted at a rate of 7.5% per year for investments made prior to 5 May 2013. For investments made from 5 May 2013 the rate is 5.5% per year. Transitional rules apply to investments covered by among others Plans for development and operation (PDOs) or Plans for installation and operation (PIOs) submitted to the Ministry of Oil and Energy prior to 5 May 2013. The uplift is computed on the basis of the original capitalised cost of offshore production installations. The uplift can be deducted from taxable income for a period of four years, starting in the year in which the capital expenditure is incurred. Unused uplift can be carried forward indefinitely.
Taxation outside Norway
Statoil's international petroleum activities are subject to tax pursuant to local legislation. Fiscal regulation of our upstream operations is generally based on corporate income tax regimes and/or production sharing agreements (PSA). Royalties may apply in either case. Statoil is subject to excess (or "windfall") profit tax in some of the countries in which it produces crude oil or condensate.
Production sharing agreements (PSA)
Under a PSA, the host government typically retains the right to the hydrocarbons in place. The contractor normally receives a share of the oil produced to recover its costs, and is also entitled to an agreed share of the oil as profit ("profit oil"). The state's share of profit oil typically increases based on a success factor, such as surpassing certain specified internal rates of return, production rates or accumulated production. The contractor is usually subject to income tax on its own share of the profit oil. Normally, the contractors carry the exploration costs and risk prior to a commercial discovery and are then entitled to recover those costs during the production phase. Fiscal provisions in a PSA are to a large extent negotiable and are unique to each PSA. Parties to a PSA are generally insulated, via the terms of the PSA, against legislative changes in a country's general tax laws.
Income tax regimes
Under an income tax/royalty regime, companies are granted licences by the government to extract petroleum, and the state may be entitled to royalties, which are generally assessed on gross revenue from production, and a profit tax, which is generally based on the company's net taxable income from production as defined in a country's domestic tax legislation. In some countries, income from petroleum activities is also subject to a special petroleum tax in addition to ordinary corporate tax. In general, the fiscal terms surrounding these licences are non-negotiable and the company is subject to legislative changes in the tax laws.
60Statoil, Annual Report on Form 20-F 2014
3.12.5 The Norwegian State's participation
The Norwegian State's policy as a shareholder in Statoil has been and continues to be to ensure that petroleum activities create the highest possible value for the Norwegian State.
Initially, the Norwegian State's participation in petroleum operations was largely organised through Statoil. In 1985, the Norwegian State established the State's direct financial interest (SDFI) through which the Norwegian State has direct participating interests in licences and petroleum facilities on the NCS. As a result, the Norwegian State holds interests in a number of licences and petroleum facilities in which we also hold interests. Petoro AS, a company wholly owned by the Norwegian State, was formed in 2001 to manage the SDFI assets.
3.12.6 SDFI oil and gas marketing and sale
We market and sell the Norwegian State's oil and gas as part of our own production. The arrangement has been implemented by the Norwegian State.
Accordingly, at an extraordinary general meeting held on 27 February 2001, the Norwegian State, as sole shareholder, revised our articles of association by adding a new article that requires us to continue to market and sell the Norwegian State's oil and gas together with our own oil and gas. This is done in accordance with an instruction established in shareholder resolutions in effect from time to time. At an extraordinary general meeting held on 25 May 2001, the Norwegian State, as sole shareholder, approved a resolution containing the instruction referred to in the new article. This resolution is referred to as the Owner's instruction.
The Norwegian State has a coordinated ownership strategy aimed at maximising the aggregate value of its ownership interests in Statoil and the Norwegian State's oil and gas. This is reflected in the Owner's instruction to Statoil. It contains a general requirement that, in our activities on the NCS, we must take account of these ownership interests in decisions that could affect the execution of this marketing arrangement.
The Owner's instruction sets out specific terms for the marketing and sale of the Norwegian State's oil and gas. The principal provisions of the Owner's instruction are set out below.
Objectives
The overall objective of the marketing arrangement is to obtain the highest possible total value for our oil and gas and the Norwegian State's oil and gas, and to ensure an equitable distribution of the total value creation between the Norwegian State and Statoil. In addition, the following considerations are important:
·to create the basis for long-term and predictable decisions concerning the marketing and sale of the Norwegian State's oil and gas;
·to ensure that results, including costs and revenues related to our oil and gas and the Norwegian State's oil and gas, are transparent and measurable; and
·to ensure efficient and simple administration and execution.
Our tasks
Our main tasks under the owner's instruction are to market and sell the Norwegian State's oil and gas and to carry out all the necessary related activities, other than those carried out jointly with other licensees under production licences. This includes, but is not limited to, responsibility for processing, transport and marketing. In the event that the owner's instruction is terminated in whole or in part by the Norwegian State, the owner's instruction provides for a mechanism under which contracts for the marketing and sale of the Norwegian State's oil and gas to which we are party may be assigned to the Norwegian State or its nominee. Alternatively, the Norwegian State may require that the contracts be continued in our name, but that, in the underlying relationship between the Norwegian State and us, the Norwegian State has all rights and obligations relating to the Norwegian State's oil and gas.
Costs
The Norwegian State does not pay us a specific consideration for performing these tasks, but reimburses us for its proportionate share of certain costs, which, under the owner's instruction, may be our actual costs or an amount specifically agreed.
Price mechanisms
Payment to the Norwegian State for sales of the Norwegian State's natural gas, both to us and to third parties, is based either on the prices achieved, a net back formula or market value. We purchase all of the Norwegian State's oil and NGL. Pricing of the crude oil is based on market-reflective prices. NGL prices are based on either achieved prices, market value or market-reflective prices.
Lifting mechanism
To ensure neutral weighting between the Norwegian State's and our own natural gas volumes, a list has been established for deciding the priority between each individual field. The different fields are ranked in accordance with their assumed total value creation for the Norwegian State and Statoil, assuming that all of the fields meet our profitability requirements if we participate as a licensee and the Norwegian State's profitability requirements if the State is a licensee. Within each individual field in which both the Norwegian State and Statoil are licensees, the Norwegian State and Statoil will deliver volumes and share income in proportion to our respective participating interests.
Statoil, Annual Report on Form 20-F 201461
The Norwegian State's oil and NGL is lifted together with our oil and NGL in accordance with applicable lifting procedures for each individual field and terminal.
Withdrawal or amendment
The Norwegian State may at any time utilise its position as majority shareholder of Statoil to withdraw or amend the owner's instruction.
3.13 Property, plant and equipment
Statoil has interests in real estate in many countries throughout the world. However, no individual property is significant.
Statoil's head office is located at Forusbeen 50, NO-4035, Stavanger, Norway and comprises approximately 135,000 square metres of office space. The office buildings are wholly owned by Statoil.
In October 2012, Statoil moved into a new 65,500-square-metre office building located at Fornebu on the outskirts of Norway's capital Oslo. Statoil as tenant has signed a long-term lease agreement with the owner of the office building, IT-Fornebu AS. The new office building provides an environmentally friendly workplace for up to 2,500 employees.
For a description of our significant reserves and sources of oil and natural gas, see note 27 Supplementary oil and gas information (unaudited) to the Consolidated financial statements.
3.14 Related party transactions
See note 24 Related parties to the consolidated financial statements for information concerning related parties.
3.15 Insurance
Statoil takes out insurance policies for physical loss of or damage to our oil and gas properties, liability to third parties, workers' compensation and employer's liability, general liability, pollution and well control, among other things.
Our insurance policies are subject to:
·Deductibles, excesses and self-insured retentions (SIR) that must be borne prior to recovery.
·Exclusions and limitations.
Our well control policy, which covers costs relating to well control incidents (including pollution and clean-up costs), is subject to a gross limit per incident. The gross limits for our two most significant geographical areas, the NCS and the Gulf of Mexico (GoM), USA, are:
NCS
·NOK 2,500 million plus USD 1,500 million per incident for exploration wells.
·NOK 2,000 million per incident for production wells.
GoM
·USD 1,800 million (approximately NOK 12,300 million) per incident for exploration wells.
·USD 300 million (approximately NOK 2,100 million) per incident for production wells.
The limits assume a 100% ownership interest in a given well and would be scaled to be equivalent to our percentage ownership interest in a given well. Our SIR for well control policies would be NOK 200 million per incident on the NCS assuming 100% ownership. Our SIR in the GoM would be approximately USD 10 million (approximately NOK 69 million) per incident assuming 100% ownership. In addition to the well control insurance programmes, we have in place a third-party liability insurance programme with a gross limit of USD 800 million (approximately NOK 5,500 million) per incident. The SIR is insignificant (maximum NOK 6 million).
We have a variety of other insurance policies related to other projects worldwide for which we have limited SIR.
There is no guarantee that our insurance policies will adequately protect us against liability for all potential consequences or damages.
62Statoil, Annual Report on Form 20-F 2014
3.16 People and the group
3.16.1 Employees in Statoil
The Statoil group employs approximately 22,500 employees. Of these, approximately 19,700 are employed in Norway and approximately 2,800 outside Norway.
| Number of employees | Women | Permanent employees and percentage of women in the Statoil group | 2014 | 2013 | 2012 | 2014 | 2013 | 2012 | | | | | | | | Norway | 19,670 | 20,336 | 20,186 | 30% | 30% | 30% | Rest of Europe | 909 | 935 | 925 | 31% | 30% | 30% | Africa | 117 | 140 | 116 | 34% | 33% | 25% | Asia | 135 | 140 | 157 | 52% | 53% | 56% | North America | 1,375 | 1,559 | 1,378 | 34% | 35% | 34% | South America | 310 | 303 | 266 | 40% | 38% | 38% | | | | | | | | TOTAL | 22,516 | 23,413 | 23,028 | 31% | 31% | 31% | | | | | | | | Non-OECD | 677 | 690 | 653 | 40% | 39% | 39% |
Total workforce by region, employment type and new hires in the Statoil group in 2014 | | | | | | | | | Geographical Region | Permanent employees | Consultants | Total Workforce* | Consultants (%) | Part time (%) | New hires | | | | | | | | | Norway | 19,670 | 1,039 | 20,709 | 5% | 3% | 263 | Rest of Europe | 909 | 119 | 1,028 | 12% | 3% | 101 | Africa | 117 | 21 | 138 | 15% | na | 13 | Asia | 135 | 11 | 146 | 8% | na | 5 | North America | 1,375 | 210 | 1,585 | 13% | na | 92 | South America | 310 | 11 | 321 | 3% | 4% | 27 | | | | | | | | | TOTAL | 22,516 | 1,411 | 23,927 | 6% | 2% | 501 | | | | | | | | | Non-OECD | 677 | 46 | 723 | 6% | na | 59 | | | | | | | | | * | Enterprise personnel are not included. These were roughly estimated to be around 42,000 in 2014. Enterprise personnel is defined as third-party service providers and work on our onshore and offshore operations. |
Statoil works systematically with recruitment and development programmes in order to build a diverse workforce by attracting, recruiting and retaining people of both genders and different nationalities and age groups across all types of positions.
In 2014, 20% of employees and 22% of our managerial staff held nationalities other than Norwegian. Outside Norway, Statoil aims to increase the number of people and managers who are locally recruited and to reduce the long-term use of expats in business operations. In 2014, 60% of new hires in Statoil were non-Norwegians and 33% were women.
In Statoil, the total turnover rate for 2014 increased to 4.5%. On 31 December 2014, the Statoil group employed 22,516 permanent employees and 2% of the workforce worked part-time. In the annual organisational and working environment survey, which continued to have a high response of 86%, our employees reported an overall satisfaction of 4.5. This is a slight decrease from the score of 4.6 in 2013.
Our people performance data relates to permanent employees in our direct employment. Statoil defines consultants as contracted personnel that are mainly based in our offices. Temporary employees and enterprise personnel are not included in the workforce table. Enterprise personnel are defined as third party service providers and work on our on-shore and off-shore operations. These were roughly estimated to be around 42,000 in 2014. The information about people policies applies to Statoil and its subsidiaries.
Statoil, Annual Report on Form 20-F 201463
3.16.2 Equal opportunities
We are committed to building a workplace that promotes diversity and inclusion through its people
processes and practices.
We promote diversity among our employees. We try to create the same opportunities for everyone and do not tolerate discrimination or harassment of any kind in our workplace. In 2014, we continued to focus on strengthening women in leadership and professional positions and on building broad international experience in our workforce. Our commitment to diversity and inclusion was demonstrated in the 2014 Global People Survey, where we maintained our high score of 5.1 (6 being the highest) for the existence of zero tolerance for discrimination and harassment within the workplace.
In 2014, the overall percentage of women in the company was 31% - and 45% of the members of the board of directors were women, as were 11% of the corporate executive committee. We pay close attention to male-dominated positions and discipline areas, and in 2014 the proportion of female engineers remained stable at 27% in Statoil ASA. Among staff engineers with up to 20 years' experience, the proportion of women increased to 31%. We continue to strive to increase the number of female managers through our development programmes, and in 2014 the total proportion of female managers in Statoil increased to 28%.
At Statoil we reward our people on the basis of their performance, giving equal emphasis to delivery and behaviour. Our rewards approach is adapted to local market conditions at the locations in which we operate and is transparent, non-discriminatory and supports equal opportunities. Given the same position, experience and performance, our employees will be at the same remuneration level relative to the local market. This is demonstrated in the salary ratio between women and men at different levels in Statoil ASA. In 2014 this ratio remained very high, with an average of 98%.
The intake of apprentices in Norway is an important part of the company's recruitment of skilled workers and commitment to the education and training of young technicians and operators in the oil and gas industry. In 2014, apprenticeships were given to 135 new students; of these 36 were female. The total number of apprentices in Statoil is 315.
3.16.3 Unions and representatives
Statoil's cooperation with employee representatives and trade unions is based on confidence, trust and continuous dialogue between management and the people in various cooperative bodies.
In Statoil ASA, 68% of the employees in the parent company are members of a trade union. Work councils and working environment committees are established where required by law or agreement. Town hall meetings are also used for information and consultations in accordance with requirements and usage in each country.
In Norway, the formal basis for collaboration with labour unions is established in the Basic Agreements between the Confederation of Norwegian Enterprise (NHO) and the corresponding respective national labour confederations (unions).
Statoil promotes good employee and industrial relations practices through various networks and forums, including IndustriALL Global Union (IndustriAll) and International Labour Organisation (ILO).
In 2014, management and employee representatives collaborated closely, in particular on the two corporate change initiatives Statoil technical efficiency programme (STEP) and Organisational efficiency programme (OE). In addition, the European Works Council continued to be an important channel between the company and employees.
As part of Statoil’s ongoing efforts to reduce costs and improve efficiency, reorganisation and change processes have been initiated, affecting our employees and organisation. The STEP and the OE programmes are initiatives to help us meet the annual savings target of USD 1.7 billion within 2016, announced on the Capital markets day in February 2015.
We collaborate with employee representatives in the change processes, and we strive to find solutions that are satisfactory both for our employees and for the company. To handle redundancies resulting from the ongoing change processes, we use measures such as internal deployment and voluntary severance packages. In 2014, we implemented a new periodic recruitmentprocess to ensure an optimal utilisation of the workforce and facilitate redeployment to areas in need of competence. Following the launch of the periodic recruitment process in February 2014, 1,370 positions were posted on the internal job market throughout 2014.
In the autumn 2014, the Norwegian Petroleum Safety Authority carried out a follow up of Statoil’s ongoing efficiency improvement programmes, with particular focus on employee involvement. The follow up concluded that Statoil’s involvement of employees in STEP was not in compliance with regulatory requirements. To strengthen employee involvement and ensure compliance with regulatory requirements, Statoil and the unions have agreed to establish a new collaboration arena, Central Works Council and Working Environment Committee for OE and STEP, in Statoil ASA. The newly established arena will address most of the deviations that the Norwegian Petroleum Safety Authority remarked in their follow up.
64Statoil, Annual Report on Form 20-F 2014
4 Financial review
4.1 Operating and financial review
4.1.1 Sales volumes
Sales volumes include our lifted entitlement volumes, the sale of SDFI volumes and our marketing of third-party volumes.
In addition to our own volumes, we market and sell oil and gas owned by the Norwegian State through the Norwegian State's share in production licences. This is known as the State's Direct Financial Interest or SDFI. For additional information, see the section Business overview - Applicable laws and regulations - SDFI oil and gas marketing and sale. The following table shows the SDFI and Statoil sales volume information on crude oil and natural gas for the periods indicated. The Statoil natural gas sales volumes include equity volumes sold by the segment MPR, natural gas volumes sold by the segment DPI and ethane volumes.
For more information on the differences between equity and entitlement production, sales volumes and lifted volumes, see the section Financial review - Operating and financial review - Definitions of reported volumes.
Statoil, Annual Report on Form 20-F 201465
| For the year ended 31 December | Sales Volumes | 2014 | 2013 | 2012 | | | | | | Statoil: (1) | | | | Crude oil (mmbbls) (2) | 359 | 350 | 351 | Natural gas (bcf) | 1,521 | 1,561 | 1,670 | | | | | | Combined oil and gas (mmboe) | 630 | 629 | 649 | | | | | | Third party volumes: (3) | | | | Crude oil (mmbbls) (2) | 304 | 303 | 399 | Natural gas (bcf) | 285 | 434 | 210 | | | | | | Combined oil and gas (mmboe) | 355 | 381 | 436 | | | | | | SDFI assets owned by the Norwegian State: | | | | Crude oil (mmbbls) (2) | 148 | 155 | 156 | Natural gas (bcf) | 1,178 | 1,234 | 1,395 | | | | | | Combined oil and gas (mmboe) | 358 | 375 | 404 | | | | | | Total: | | | | Crude oil (mmbbls) (2) | 811 | 809 | 905 | Natural gas (bcf) | 2,984 | 3,229 | 3,275 | | | | | | Combined oil and gas (mmboe) | 1,343 | 1,384 | 1,489 | | | | | | (1) | The Statoil volumes included in the table above are based on the assumption that volumes sold were equal to lifted volumes in the relevant year. Changes in inventory may cause these volumes to differ from the sales volumes reported elsewhere in this report by MPR in that these volumes include volumes still in inventory or transit held by other reporting entities within the group. Excluded from such volumes are volumes lifted by DPI but not sold by the MPR, and volumes lifted by DPN or DPI and still in inventory or in transit. | (2) | Sales volumes of crude oil include NGL and condensate. All sales volumes reported in the table above include internal deliveries to our manufacturing facilities. | (3) | Third party volumes of crude oil include both volumes purchased from partners in our upstream operations and other cargos purchased in the market. The third party volumes are purchased either for sale to third parties or for our own use. Third party volumes of natural gas include third party LNG volumes related to our activities at the Cove Point regasification terminal in the US. |
66Statoil, Annual Report on Form 20-F 2014
4.1.2 Group profit and loss analysis
Net operating income was NOK 109.5 billion in 2014, down from NOK 155.5 billion in 2013, impacted by lower prices, impairment losses and exploration expenses.
| For the year ended 31 December | | | Operational data | 2014 | 2013 | 2012 | 14-13 change | 13-12 change | | | | | | | Prices | | | | | | Average Brent oil price (USD/bbl) | 98.9 | 108.7 | 111.5 | (9%) | (3%) | Development and Production Norway average liquids price (USD/bbl) | 90.6 | 101.0 | 104.5 | (10%) | (3%) | Development and Production International average liquids price (USD/bbl) | 85.6 | 98.4 | 101.4 | (13%) | (3%) | Group average liquids price (USD/bbl) | 88.6 | 100.0 | 103.5 | (11%) | (3%) | Group average liquids price (NOK/bbl) [1] | 558.5 | 587.8 | 602.4 | (5%) | (2%) | Transfer price natural gas (NOK/scm) [9] | 1.57 | 1.92 | 1.84 | (18%) | 4% | Average invoiced gas prices - Europe (NOK/scm) [8] | 2.28 | 2.45 | 2.44 | (7%) | 0% | Average invoiced gas prices - North America (NOK/scm) [8] | 1.04 | 0.83 | 0.49 | 25% | 69% | Refining reference margin (USD/bbl) [2] | 4.7 | 4.1 | 5.5 | 15% | (25%) | | | | | | | Entitlement production (mboe per day) | | | | | | Development and Production Norway entitlement liquids production | 588 | 591 | 624 | (1%) | (5%) | Development and Production International entitlement liquids production | 383 | 354 | 327 | 8% | 8% | Group entitlement liquids production | 971 | 945 | 952 | 3% | (1%) | Development and Production Norway entitlement gas production | 595 | 626 | 711 | (5%) | (12%) | Development and Production International entitlement gas production | 163 | 148 | 116 | 10% | 27% | Group entitlement gas production | 758 | 773 | 827 | (2%) | (6%) | Total entitlement liquids and gas production [3] | 1,729 | 1,719 | 1,778 | 1% | (3%) | | | | | | | Equity production (mboe per day) | | | | | | Development and Production Norway equity liquids production | 588 | 591 | 624 | (1%) | (5%) | Development and Production International equity liquids production | 538 | 524 | 512 | 3% | 2% | Group equity liquids production | 1,127 | 1,115 | 1,137 | 1% | (2%) | Development and Production Norway equity gas production | 595 | 626 | 710 | (5%) | (12%) | Development and Production International equity gas production | 205 | 200 | 157 | 3% | 28% | Group equity gas production | 801 | 825 | 867 | (3%) | (5%) | Total equity liquids and gas production [4] | 1,927 | 1,940 | 2,004 | (1%) | (3%) | | | | | | | Liftings (mboe per day) | | | | | | Liquids liftings | 967 | 950 | 959 | 2% | (1%) | Gas liftings | 779 | 792 | 839 | (2%) | (6%) | Total liquids and gas liftings | 1746 | 1,742 | 1,798 | 0% | (3%) | | | | | | | Marketing, Processing and Renewable Energy sales volumes | | | | | | Crude oil sales volumes (mmbl) | 811 | 809 | 905 | 0% | (11%) | Natural gas sales Statoil entitlement (bcm) | 43.1 | 44.2 | 47.3 | (2%) | (7%) | Natural gas sales third-party volumes (bcm) | 8.1 | 12.3 | 8.6 | (34%) | 43% | | | | | | | Production cost (NOK/boe, last 12 months) | | | | | | Production cost entitlement volumes | 55 | 50 | 48 | 10% | 4% | Production cost equity volumes | 49 | 44 | 42 | 11% | 5% |
Total equity liquids and gas production(see section Financial review - Operating and financial review - Definition of reported volumes) was 1,927 mboe, 1,940 mboe and 2,004 mboe per day in 2014, 2013 and 2012, respectively.
The total equity production in 2014 was slightly lower compared to 2013. Start-up and ramp-up of production on various fields and higher production regularity compared to last year were offset by expected natural decline and reduced ownership shares from divestments.
The 3% decrease in total equity production in 2013 compared to 2012 was primarily due to expected natural decline on mature fields, divestments and redeterminations and decreased gas deliveries from the NCS. The decrease was partly offset by start-up and ramp-up of production on various fields.
Statoil, Annual Report on Form 20-F 201467
Total entitlement liquids and gas production - net of US royalties (see section Financial review - Operating and financial review - Definition of reported volumes) was 1,729 mboe per day in 2014 compared to 1,719 mboe in 2013 and 1,778 mboe per day in 2012.
The total entitlement production in 2014 remained at the same level as the production in 2013, for the same reasons as described above and a relatively lower negative effect from production sharing agreements (PSA effect). The 3% decrease from 2012 to 2013 was impacted by the decrease in equity production as described above, and a relatively lower negative effect from Production Sharing Agreements (PSA effect). The PSA effect was 157 mboe, 182 mboe and 199 mboe per day in 2014, 2013 and 2012, respectively.
Over time, the volumes lifted and sold will equal our entitlement production, but they may be higher or lower in any period due to differences between the capacity and timing of the vessels lifting our volumes and the actual entitlement production during the period, see section Financial review - Operating and financial review - Definition of reported volumes for more information.
Production cost per boeof entitlement volumes was NOK 55, NOK 50 and NOK 48 for the 12 months ended 31 December 2014, 2013 and 2012,
respectively. Based on equity volumes, the production cost per boe was NOK 49, NOK 44 and NOK 42 for the 12 months ended 31 December 2014,
2013 and 2012, respectively. The increase in 2014 from last year is due to increased production costs impacted by new fields coming on stream.
Production cost per boe of entitlement volumes and equity volumes are non-GAAP measures, see section Non-GAAP measures - Financial review - Unit of production cost for further information.
Income statement under IFRS | For the year ended 31 December | | | (in NOK billion) | 2014 | 2013 | 2012 | 14-13 change | 13-12 change | | | (restated) | (restated) | | | | | | | | | Revenues | 606.8 | 616.6 | 700.5 | (2%) | (12%) | Net income from associated companies | (0.3) | 0.1 | 1.7 | >(100%) | (92%) | Other income | 16.1 | 17.8 | 16.0 | (10%) | 11% | | | | | | | Total revenues and other income | 622.7 | 634.5 | 718.2 | (2%) | (12%) | | | | | | | Purchases [net of inventory variation] | (301.3) | (306.9) | (362.2) | (2%) | (15%) | Operating expenses and selling, general and administrative expenses | (80.2) | (81.9) | (70.8) | (2%) | 16% | Depreciation, amortisation and net impairment losses | (101.4) | (72.4) | (60.5) | 40% | 20% | Exploration expenses | (30.3) | (18.0) | (18.1) | 69% | (1%) | | | | | | | Net operating income | 109.5 | 155.5 | 206.6 | (30%) | (25%) | | | | | | | Net financial items | (0.0) | (17.0) | 0.1 | (100%) | >(100%) | | | | | | | Income before tax | 109.4 | 138.4 | 206.7 | (21%) | (33%) | | | | | | | Income tax | (87.4) | (99.2) | (137.2) | (12%) | (28%) | | | | | | | Net income | 22.0 | 39.2 | 69.5 | (44%) | (44%) |
Total revenues and other income amounted to NOK 622.7 billion in 2014 compared to NOK 634.5 billion in 2013 and NOK 718.2 billion in 2012. Revenues are generated from both the sale of lifted crude oil, natural gas and refined products produced and marketed by Statoil, and from the sale of liquids and gas purchased from third parties. In addition, we market and sell the Norwegian State's share of liquids from the NCS. All purchases and sales of the Norwegian State's production of liquids are recorded as purchases [net of inventory variations] and revenues, respectively, while sales of the Norwegian State's share of gas from the NCS are recorded net.
The 2% decrease in revenues from 2013 to 2014 was mainly due to decreased prices for liquids and European gas and reduced volumes of liquids and gas sold, partly offset increased US gas prices and a positive exchange rate development (NOK/USD).Also, revenues in 2014 were positively impacted by gains from derivatives, mainly due to a significant drop in the forward curve in the oil market.
The 12% decrease in revenues from 2012 to 2013 was mainly attributable to reduced volumes of liquids and gas sold. Lower liquids and gas prices measured in NOK, lower unrealised gains on derivatives and the drop in revenues due to the divestment of the Fuel and Retail segment in the second quarter of 2012, added to the decrease. Increased volumes of third party gas sold, partly offset the decrease in revenues.
Other income was NOK 16.1 billion in 2014 compared to NOK 17.8 billion in 2013 and NOK 16.0 billion in 2012. Other income in 2014 consists of the gain from the sale of certain ownership interests on the NCS to Wintershall (NOK 5.9 billion) and the divestment of working interests in the Shah Deniz Project and South Caucasus Pipeline (NOK 5.4 billion.) In addition, an arbitration settlement (NOK 2.8 billion) following an arbitration ruling in Statoil’s favour, impacted Other income in 2014.
68Statoil, Annual Report on Form 20-F 2014
Other income in 2013 was mainly impacted by gains from sale of certain ownership interests on the NCS to OMV (NOK 10.1 billion) and Wintershall (NOK 6.4 billion). Other income in 2012 was mainly impacted by gains from the sale of certain ownership interests on the NCS to Centrica (NOK 7.5 billion) and the sale of Statoil Fuel & Retail ASA to Alimentation Couche-Tard (NOK 5.8 billion).
Purchases [net of inventory variation]include the cost of liquids purchased from the Norwegian State, which is pursuant to the Owner's instruction, and the cost of liquids and gas purchased from third parties. See section Business overview - Applicable laws and regulations - SDFI oil and gas marketing and sale for more details.
Purchases [net of inventory variation] amounted to NOK 301.3 billion in 2014 compared to 306.9 billion in 2013 and NOK 362.2 billion in 2012.
The 2% decrease from 2013 to 2014 was mainly related to lower prices for liquids and gas, including the write-down of inventories from cost to market value of NOK 5.0 billion, and reduced third party volumes. These effects were partly offset by negative currency effects (NOK/USD).
The 15% decrease from 2012 to 2013 was mainly caused by lower SDFI volumes purchased and lower liquids and gas prices. The drop in purchases as a result of the divestment of the Fuel and Retail segment in the second quarter of 2012, added to the decrease. Increased volumes of third party gas purchased, partly offset the decrease.
Operating expenses and selling, general and administrative expensesamounted to NOK 80.2 billion in 2014 compared to NOK 81.9 billion in 2013, down by 2%. In 2014, the expenses were positively impacted by a curtailment gain of NOK 3.5 billion recognised upon the decision to change the company’s pension plan in Norway. In 2013, expenses were negatively impacted by an onerous contract provision of NOK 4.9 billion related to the Cove Point terminal in the US. These effects were offset by increased expenses in 2014 mainly due to new fields coming on stream, onshore production ramp-up and increased transportation costs in the North America. In addition, the exchange rate development (NOK/USD) increased the expenses in 2014 compared to 2013.
The increase of 16% from 2012 to 2013 was mainly due to increased operating plant cost from start-up and ramp-up of production on various fields, higher royalty expenses, and an onerous contract provision of NOK 4.9 billion. In addition, a reclassification of diluent cost from purchases to operating expenses in the first quarter of 2013 added to the increase. The reversal of a provision related to the discontinued part of the early retirement pension, recorded in 2012, also contributed to the increase.
Depreciation, amortisation and net impairment lossesamounted to NOK 101.4 billion in 2014 compared to NOK 72.4 billion in 2013 and NOK 60.5 billion in 2012. Included in these totals were net impairment losses of NOK 26.9 billion for 2014, NOK 7.0 billion for 2013 and NOK 1.2 billion for 2012.
Depreciation, amortisation and net impairment losses increased by 40% compared to 2013, mainly due to impairment losses related to Statoil’s international operations, primarily driven by reduced short-term oil price forecasts. Also, new investments, higher production and increased asset retirement obligation, with a corresponding higher basis for depreciation, partly offset by increased estimate of proved reserves, added to increased depreciation costs in 2014 compared to 2013.
Depreciation, amortisation and net impairment losses increased by 20% in 2013 compared to 2012 mainly due to higher impairment losses related to refineries and certain other assets, start-up on new fields with higher depreciation cost per unit, ramp-up of production from various fields and higher investments on producing fields. The increase was partly offset by reduced depreciation due to the lower production volumes, increased reserve estimates, divestments and redeterminations.
Exploration expenses | For the year ended 31 December | | | (in NOK billion) | 2014 | 2013 | 2012 | 14-13 change | 13-12 change | | | | | | | Exploration expenditures (activity) | 23.9 | 21.8 | 20.9 | 10% | 4% | Expensed, previously capitalised exploration expenditures | 2.4 | 1.9 | 2.7 | 26% | (30%) | Capitalised share of current period's exploration activity | (7.3) | (6.9) | (5.9) | 6% | 16% | Impairments, net of reversals | 11.3 | 1.2 | 0.4 | >100% | >100% | | | | | | | Exploration expenses | 30.3 | 18.0 | 18.1 | 69% | (1%) |
In 2014,exploration expenseswere NOK 30.3 billion, a NOK 12.3 billion increase compared to 2013 when exploration expenses were NOK 18.0 billion.
Exploration expenses were NOK 18.1 billion in 2012.
The increase in exploration expenses from 2013 to 2014 was mainly due to increased impairments of oil and gas prospects and signature bonuses internationally. Also, the cancellation of a rig contract in 2014 impacted exploration expenses negatively in 2014 compared to 2013.
The exploration expenses remain at the same level from 2012 to 2013.
Net financial itemsamounted to NOK 0 billion in 2014, compared to a loss of NOK 17.0 billion in 2013. The improved result was mainly due to a positive change in currency derivatives used for currency and liquidity risk management as a result of changes in underlying currency positions together with a strengthening of USD towards NOK of 22.2% in 2014 compared to a strengthening of USD towards NOK of 9.3% in 2013. In addition a positive fair value change on interest rate swap positions relating to the interest rate management of non-current bonds mainly due to a decrease in long term USD
Statoil, Annual Report on Form 20-F 201469
interest rates by an average of 0.6%-points in 2014 compared to an increase in 2013 by an average of 1.0%-points. This was offset by increased interest and other finance expenses.
Net financial items amounted to a loss of NOK 17.0 billion in 2013, compared to a gain of NOK 0.1 billion in 2012. The decline was mainly due to negative changes in currency derivatives used for currency and liquidity risk management as well as a negative fair value change on interest swap positions relating to the interest management of non-current bonds. The decline was offset by reduced impairment loss related to a financial investment in 2012.
Income taxes were NOK 87.4 billion equivalent to an effective tax rate of 79.9%, compared to NOK 99.2 billion, equivalent to an effective tax rate of 71.7%, in 2013. In 2012, income taxes were NOK 137.2 billion, equivalent to an effective tax rate of 66.4%.
The effective tax rate in 2014 was influenced by impairment losses with lower than average tax rates, partly offset by tax exempted gains on the Norwegian continental shelf (NCS) and sale of interests in the Shah Deniz Project and tax effect of foreign exchange losses in entities that are taxable in other currencies than the functional currency. These losses are tax deductible, but do not impact the Consolidated statement of income. The effective tax rate in 2014 was also impacted by the recognition of a non-cash tax income following a verdict in the Norwegian Supreme Court in February 2014. The Supreme Court voted in favour of Statoil in a tax dispute regarding the tax treatment of foreign exploration expenditures.
The increase in the effective tax rate from 2012 to 2013 was mainly due to higher impairment losses, onerous contract provisions and increased losses on financial items, all with lower than average tax rates. This was partly offset by increased capital gains with lower than average tax rates and relatively lower income from the NCS in 2013. Income from the NCS is subject to a higher than average tax rate.
The effective tax rate is calculated as income taxes divided by income before taxes. Fluctuations in the effective tax rates from year to year are principally the result of non-taxable items (permanent differences) and changes in the relative composition of income between Norwegian oil and gas production, taxed at a marginal rate of 78%, and income from other tax jurisdictions. Other Norwegian income, including the onshore portion of net financial items, is taxed at 28% (27% from 2014), and income in other countries is taxed at the applicable income tax rates in those countries.
In 2014,net incomewas NOK 22.0 billion compared to NOK 39.2 billion in 2013 and NOK 69.5 billion in 2012. The 44% decrease from 2013 to 2014 was mainly due to reduced prices, leading to lower earnings and impairment losses, and increased exploration expenditures.
In 2013,net incomewas NOK 39.2 billion compared to NOK 69.5 billion in 2012 and NOK 78.4 billion in 2011. The 44% decrease from 2012 to 2013 was mainly due to the decrease in net operating income, increased loss on net financial items and the increase in the effective tax rate as described above.
The Statoil board of directors proposes a dividend of NOK 1.80 per share for the fourth quarter of 2014, subject to approval at the Annual General Meeting in line with the authorisation from May 2014. The annual dividends for 2014 amounted to NOK 7.20 per share, an aggregate total of NOK 22.9 billion. For 2013, Statoil paid an ordinary dividend of NOK 7.00 per share, an aggregate total of NOK 22.3 billion.
In 2014, following a regular review process of Statoil’s 2012 Consolidated financial statements, the Financial Supervisory Authority of Norway (the FSA) concluded that it had identified three errors, related to interpretation and application of IFRS accounting principles for determination of cash generating units (CGUs) and impairment evaluations. For two of the matters Statoil accepted the FSA’s interpretations and has applied such interpretations in preparing its Consolidated financial statements for 2014 and 2013. Statoil did not restate prior period financial statements as the impact was immaterial. For the third matter Statoil does not accept the FSA’s conclusion. In accordance with due process for such matters under Norwegian regulation, Statoil has appealed the order to the Norwegian Ministry of Finance and has been granted a stay in carrying out the FSA’s order pending the final outcome of the appeal. See Note 23 Other commitments, contingent liabilities and contingent assets to the Consolidated Financial statements for further details.
4.1.3 Segment performance and analysis
Internal transactions in oil and gas volumes occur between our reporting segments before being sold in the market. The pricing policy for internal transfers is based on estimated market prices.
We eliminate intercompany sales when combining the results of reporting segments. Intercompany sales include transactions recorded in connection with our oil and natural gas production in DPN or DPI and also in connection with the sale, transportation or refining of our oil and natural gas production in MPR and SFR (until 19 June 2012 when SFR was sold). According to the acquisition agreement, sale of refined oil products to SFR will continue for a specific period of time. Sales of fuel from the MPR segment to SFR are presented as external sales in the MPR segment as of 20 June 2012.
DPN produces oil and natural gas which is sold internally to MPR. A large share of the oil produced by DPI is also sold from MPR. The remaining oil and gas from DPI is sold directly in the market. For intercompany sales and purchases, Statoil has established a market-based transfer pricing methodology for the oil and natural gas that meets the requirements as to applicable laws and regulations.
Effective from the fourth quarter of 2013, revenues generated by the upstream segment in the United States is reported net of royalty interest. This change does not result in a change in the net operating income. Historical information has been aligned to the current presentation, reflected in the following tables.
In 2014, the average transfer price for natural gas was NOK 1.57 per scm. The average transfer price was NOK 1.92 per scm in 2013 and NOK 1.84 in
2012. For oil sold from DPN to MPR, the transfer price is the applicable market-reflective price minus a cost recovery rate.
70Statoil, Annual Report on Form 20-F 2014
The following table shows certain financial information for the five segments, including intercompany eliminations for each of the years in the three-year
period ending 31 December 2014. For additional information please refer to note 3 Segments to the Consolidated financial statements.
| For the year ended 31 December | (in NOK billion) | 2014 | 2013 | 2012 | | | | | | Development & Production Norway | | | | Total revenues and other income | 182.2 | 202.2 | 220.8 | Net operating income | 111.7 | 137.1 | 161.7 | Non-current segment assets* | 262.0 | 247.6 | 235.5 | | | | | | Development & Production International | | | | Total revenues and other income | 85.2 | 81.9 | 80.1 | Net operating income | (19.5) | 16.4 | 21.5 | Non-current segment assets* | 333.8 | 286.5 | 248.2 | | | | | | Marketing, Processing and Renewable Energy | | | | Total revenues and other income | 597.3 | 608.6 | 665.6 | Net operating income | 16.2 | 2.6 | 15.5 | Non-current segment assets* | 46.3 | 39.3 | 38.5 | | | | | | Fuel & Retail** | | | | Total revenues and other income | - | - | 41.6 | Net operating income | - | - | 6.9 | | | | | | Other | | | | Total revenues and other income | 0.3 | 1.0 | 1.3 | Net operating income | (1.5) | (1.1) | 2.6 | Non-current segment assets* | 5.1 | 5.6 | 4.5 | | | | | | Eliminations*** | | | | Total revenues and other income | (242.3) | (259.1) | (291.2) | Net operating income | 2.6 | 0.4 | (1.6) | Non-current segment assets* | - | - | - | | | | | | Statoil group | | | | Total revenues and other income | 622.7 | 634.5 | 718.2 | Net operating income | 109.5 | 155.5 | 206.6 | Non-current segment assets* | 647.3 | 578.9 | 526.7 | | | | | | * | Deferred tax assets, pension assets, associated companies and non-current financial instruments are not allocated to segments. | ** | Amounts are for the period until 19 June 2012 and include gains from the sale of the FR segment. | *** | Includes elimination of inter-segment sales and related unrealised profits, mainly from the sale of crude oil and products. Inter-segment revenues are based upon estimated market prices. |
Statoil, Annual Report on Form 20-F 201471
The following tables show total revenues by geographic area.
2014 Total revenues and other income by geographic area | Crude oil | Gas | NGL | Refined products | Other | Total sales | (in NOK billion) | | | | | | | | Norway | 256.2 | 81.0 | 55.0 | 54.4 | 18.7 | 465.3 | USA | 49.9 | 13.8 | 4.0 | 14.8 | 8.6 | 91.2 | Sweden | 0.0 | 0.0 | 0.0 | 16.5 | 1.7 | 18.2 | Denmark | 0.0 | 0.0 | 0.0 | 19.1 | 0.2 | 19.3 | Other | 18.6 | 4.4 | 0.4 | 0.0 | 5.4 | 28.8 | | | | | | | | Total revenues (excluding net income (loss) from associated companies) and other income | 324.6 | 99.3 | 59.5 | 104.8 | 34.7 | 622.9 |
2013 Total revenues and other income by geographic area | Crude oil | Gas | NGL | Refined products | Other | Total sales | (in NOK billion) | | | | | | | | Norway | 238.0 | 92.7 | 61.7 | 69.5 | 14.0 | 475.9 | USA | 62.9 | 13.5 | 2.5 | 10.9 | 4.7 | 94.5 | Sweden | 0.0 | 0.0 | 0.0 | 17.2 | (0.1) | 17.1 | Denmark | 0.0 | 0.0 | 0.0 | 21.3 | 0.1 | 21.4 | Other | 20.6 | 4.2 | 0.3 | 0.0 | 0.4 | 25.5 | | | | | | | | Total revenues (excluding net income (loss) from associated companies) and other income | 321.5 | 110.4 | 64.5 | 118.9 | 19.1 | 634.4 |
2012 Total revenues and other income by geographic area | Crude oil | Gas | NGL | Refined products | Other | Total sales | (in NOK billion) | | | | | | | | Norway | 278.1 | 104.7 | 61.3 | 91.8 | 19.0 | 554.9 | USA | 67.6 | 5.3 | 2.6 | 21.9 | 7.3 | 104.7 | Sweden | 0.0 | 0.0 | 0.0 | 9.1 | (0.3) | 8.8 | Denmark | 0.0 | 0.0 | 0.0 | 18.1 | 0.1 | 18.2 | Other | 21.5 | 4.5 | 1.8 | (0.0) | 2.1 | 29.9 | | | | | | | | Total revenues (excluding net income (loss) from associated companies) and other income | 367.2 | 114.5 | 65.7 | 140.9 | 28.2 | 716.5 |
72Statoil, Annual Report on Form 20-F 2014
4.1.4 DPN profit and loss analysis
DPN generated total revenues of NOK 182.2 billion in 2014 and its net operating income was NOK 111.7 billion. The average daily entitlement production was 588 mboe per day for liquids and 595 mboe per day for gas.
The average daily production of liquids and gas(see the section Financial review - Operating and financial review - Definition of reported volumes) was 1,183 mboe, 1,217 mboe and 1,335 mboe per day in 2014, 2013 and 2012, respectively.
The average daily production of liquids and gas decreased by 3% from 2013 to 2014. mainly due to divestments and expected natural decline, partly offset by new fields in production and higher production regularity in 2014 compared to 2013.
The average daily production of liquids and gas decreased by 9% from 2012 to 2013. Lower gas sales, divestments, Ormen Lange redetermination and expected reductions due to natural decline on mature fields were partly offset by production ramp-up on the Skarv field and new production from fast track developments.
Over time, the volumes lifted and sold will equal our entitlement production, but they may be higher or lower in any period due to differences between the capacity and timing of the vessels lifting our volumes and the actual entitlement production during the period, see section Financial review - Operating and financial review - Definition of reported volumesfor more information.
Income statement under IFRS | For the year ended 31 December | | | (in NOK billion) | 2014 | 2013 | 2012 | 14-13 change | 13-12 change | | | | | | | Total revenues and other income | 182.2 | 202.2 | 220.8 | (10%) | (8%) | | | | | | | Operating expenses and selling, general and administrative expenses | (25.2) | (27.4) | (25.8) | (8%) | 6% | Depreciation, amortisation and net impairment losses | (40.0) | (32.2) | (29.8) | 24% | 8% | Exploration expenses | (5.4) | (5.5) | (3.5) | (2%) | 54% | | | | | | | Net operating income | 111.7 | 137.1 | 161.7 | (19%) | (15%) |
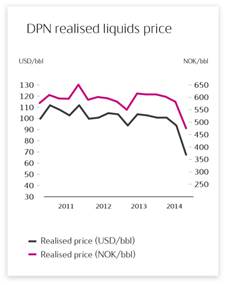
| Total revenues and other income were NOK 182.2 billion in 2014, NOK 202.2 billion in 2013 and NOK 220.8 billion in 2012.
The decrease of 10% from 2013 to 2014 was mainly due to reduced gas and liquids prices and reduced lifted volumes of both liquids and gas, mainly caused by divestments and expected natural decline. This was partly offset by a positive exchange rate development (NOK/USD). In 2013, a re-assessed valuation estimate of earn-out derivatives resulted in an unrealised fair value loss of derivatives and impacted revenues negatively.
The decrease of 8% from 2012 to 2013 was mainly due to a decrease in the lifted volumes of liquids and gas and decreased price for liquids. The effects were partly offset by increased gas prices and a positive exchange rate development.
Other income in 2014 was impacted by gains from the sale of certain ownership interests on the NCS to Wintershall of NOK 5.9 billion, Other income in 2013 was impacted by gains from sale of certain ownership interests on the NCS to OMV and Wintershall (NOK 13.0 billion). In 2012, other income was impacted by gains related to the sale of certain assets on the NCS to Centrica (NOK 7.5 billion.)
|
Operating expenses and selling, general and administrative expenseswere NOK 25.2 billion in 2014, compared to NOK 27.4 billion in 2013 and NOK 25.8 billion in 2012. In 2014, expenses decreased compared to 2013 mainly due to a gain related to changes in pension scheme in 2014, and reduced operating costs at several fields due to divestments. This was partly offset by increased environmental tax expenses caused by increased CO2 tax rates and CO2 volumes, operating preparations for new fields coming on stream and new fields commencing production during 2014. In 2013, expenses increased compared to 2012 mainly due to increased environmental tax expenses and new fields commencing production.
Depreciation, amortisation and net impairment losseswere NOK 40.0 billion in 2014, compared to NOK 32.2 billion in 2013, and NOK 29.8 billion in 2012. The increase of 24% from 2013 to 2014 was mainly due to increased investments, new fields commencing production, increased asset retirement obligation with a corresponding higher basis for depreciations, and an impairment loss of NOK 2.3 billion in 2014 (primarily resulting from the reduced short-term oil price forecast). These effects were partly offset by reduced depreciation due to portfolio changes.
Statoil, Annual Report on Form 20-F 201473
The increase from 2012 to 2013 was mainly due to new fields in production with higher depreciation cost per unit and increased investments on major producing fields. This was partly offset by reduced depreciation due to net decreased production, increased proved reserves, the positive effect of reduced retirement obligations, divestments and a redetermination.
Exploration expenseswere NOK 5.4 billion in 2014, compared to NOK 5.5 billion in 2013 and NOK 3.5 billion in 2012. The reduction from 2013 to 2014 was mainly due to lower drilling activity and less field development work due to sanctioning of Johan Sverdrup, offset by a higher portion of exploration expenditures capitalized in previous periods being expensed in 2014. Exploration expenses increased by NOK 2.0 billion from 2012 to 2013, primarily due to higher drilling activity and field development work within Johan Sverdrup and Johan Castberg areas, partly offset by a higher portion of current exploration expenditures being capitalized and a lower portion of exploration expenditures capitalized in previous periods being expensed in this period.
Net operating income in 2014 was NOK 111.7 billion, compared to NOK 137.1 billion in 2013 and NOK 161.7 billion in 2012. The NOK 25.4 billion decrease from 2013 to 2014 was mainly due to lower prices on liquids and gas and increased depreciation and net impairment losses. The NOK 24.6 billion decrease from 2012 to 2013 was mainly due to decreased volumes of liquids and gas sold.
4.1.5 DPI profit and loss analysis
In 2014, DPI delivered 9% growth in entitlement production net of royalties, averaging 546 mboe per day.
The average daily equity liquids and gas production (see section Financial review - Operating and financial review - Definition of reported volumes)was
744 mboe in 2014, compared to 723 mboe in 2013 and 669 mboe in 2012. The increase of 3% from 2013 to 2014 was driven primarily by the ramp-up of fields, including Marcellus (US), CLOV and PSVM (Angola). The increase was partly offset by natural decline, primarily at mature fields in Angola, and the effect of the farm-down in Shah Deniz (Azerbaijan).
The increase of 8% from 2012 to 2013 was driven primarily by the ramp-up of fields, including Marcellus (US), Eagle Ford (US), PSVM (Angola) and Bakken (US). The increase was partly offset by natural decline, primarily at mature fields in Angola, and the effect of the In Amenas incident.
The average daily entitlement production of liquids and gas - net of US royalties(see section Financial review - Operating and financial review - Definition of reported volumes)was 546 mboe per day in 2014, compared to 502 mboe per day in 2013 and 443 mboe per day in 2012. Both the increases from 2013 to 2014 and from 2012 to 2013 were driven by increased equity production as described above and a relatively lower negative effect from production sharing agreements (PSA effect). The PSA effect was 157 mboe, 182 mboe and 199 mboe per day in 2014, 2013 and 2012, respectively.
Over time, the volumes lifted and sold will equal our entitlement production, but they may be higher or lower in any period due to differences between the capacity and timing of the vessels lifting our volumes and the actual entitlement production during the period, see section Financial review - Operating and financial review - Definition of reported volumes for more information.
Income statement under IFRS | For the year ended 31 December | | | (in NOK billion) | 2014 | 2013 | 2012 | 14-13 change | 13-12 change | | | | | | | Total revenues and other income | 85.2 | 81.9 | 80.1 | 4% | 2% | | | | | | | Purchases [net of inventory] | (0.0) | (0.1) | (1.3) | (85%) | (95%) | Operating expenses and selling, general and administrative expenses | (22.9) | (21.0) | (16.5) | 9% | 28% | Depreciation, amortisation and net impairment losses | (56.8) | (31.9) | (26.2) | 78% | 22% | Exploration expenses | (25.0) | (12.5) | (14.6) | 100% | (14%) | | | | | | | Net operating income | (19.5) | 16.4 | 21.5 | >(100%) | (24%) |
DPI generated total revenues and other incomeof NOK 85.2 billion in 2014 compared to NOK 81.9 billion in 2013 and NOK 80.1 billion in 2012. Other income in 2014 was impacted by gains from sales of assets of NOK 5.8 billion, mainly related to the sale of interests in the Shah Deniz project and the South Caucasus Pipeline, compared to a gain of NOK 3.5 billion in 2013, mainly related to the sale of certain ownership interests in licences on the UK continental shelf to OMV. In addition, lower provisions relating to commercial disputes in 2014 compared to 2013 added to the increase in total revenues and other income.
Total revenues and other income were also impacted by lower realised liquids and gas prices, partly offset by a positive currency effect from the NOK/USD development, in addition to an increase in lifted volumes.
The increase from 2012 to 2013 was mainly caused by an increase in lifted volumes. In addition, increased gains from sales of assets in 2013 positively impacted revenues by NOK 2.7 billion. The increase was partly offset by provisions related to commercial disputes in 2013, which had a negative impact of NOK 4.6 billion, a decrease in realised liquid oil and gas prices and also by lower profit from an associated company in Venezuela.
74Statoil, Annual Report on Form 20-F 2014
Purchases [net of inventory variation]were NOK 0.0 billion in 2014, compared to NOK 0.1 billion in 2013 and NOK 1.3 billion in 2012. The decrease from 2012 to 2013 was mainly related to diluent purchases being presented as operating expenses and not as purchases from 2013.
Operating expenses and selling, general and administrative expenseswere NOK 22.9 billion in 2014, compared to NOK 21.0 billion in 2013 and NOK 16.5 billion in 2012. The 9% increase from 2013 to 2014 was mainly due to higher operating and transportation expenses caused by production growth, primarily in North America. In addition, operating expenses increased due to the start-up of the new field CLOV in Angola in 2014. The 28% increase from 2012 to 2013 was mainly due to higher expenses resulting from production ramp-up on several fields and higher royalty expenses. Further, operating expenses increased by NOK 1.5 billion in 2013 as diluent expenses are presented as operating expenses and not as purchases from 2013.
Depreciation, amortisation and net impairment losseswere NOK 56.8 billion in 2014, compared to NOK 31.9 billion in 2013 and NOK 26.2 billion in 2012. The 78% increase from 2013 to 2014 was primarily caused by net impairment losses of NOK 23.8 billion in 2014, mainly related to the Kai Kos Dehseh oil sands project in Canada, goodwill allocated to US onshore assets, unconventional onshore assets in North America and other conventional assets within the DPI reporting segment. The impairment losses were primarily resulting from reduced short-term oil price forecasts, and the decision to postpone the development for the Corner field development (impacting the Kai Kos Dehseh project). In addition, depreciation increased due to start-up and ramp-up of production from various fields (CLOV, PSVM, Eagle Ford and Bakken). The increases were partly offset by reduced depreciation from increased reserves and divestment of assets.
The 22% increase from 2012 to 2013 was mainly due to ramp-up of production from various fields (PSVM, Marcellus, Bakken, Eagle Ford and Kizomba Satellites). Impairments of NOK 2.1 billion in 2013 also contributed to the increase. The increases were partly offset by reduced depreciation from increased reserves, divestment of assets and the In Amenas incident.
Exploration expenseswere NOK 25 billion in 2014, compared to NOK 12.5 billion in 2013 and NOK 14.6 billion in 2012. The increase from 2013 to 2014 was mainly due to increased impairments of oil and gas prospects and signature bonuses and write-offs of exploration expenditures, mainly in Angola and the Gulf of Mexico. Also, the cancellation of a rig contract in 2014 impacted exploration expenses negatively in 2014.
Exploration expenses decreased by NOK 2.1 billion from 2012 to 2013, primarily due to lower drilling and seismic activities as well as increased drilling success, which resulted in more discoveries in 2013 compared to 2012 and thus increased capitalised exploration expenditures.
Net operating incomein 2014 was NOK 19.5 billion negative, compared to positive NOK 16.4 billion in 2013 and NOK 21.5 billion in 2012. The decrease from 2013 to 2014 was caused primarily by impairment losses, and also by lower realised liquids and gas prices, higher depreciation and higher operating expenses. From 2012 to 2013 increased lifted volumes had a positive impact on net operating income. However, this was more than offset primarily by higher depreciation and operating expenses.
Statoil, Annual Report on Form 20-F 201475
4.1.6 MPR profit and loss analysis
The 2014 results for MPR have been influenced by improved margins on gas sales in Europe including LNG arbitrage, strong contribution from US gas sales and improved refinery margins in addition to received payment related to a commercial dispute and gains from the sale of assets. The results were negatively impacted by losses on operational storages.
Total natural gas sales volumes were 51.2 bcm in 2014 (1.80 tcf), 56.6 bcm (2.00 tcf) in 2013 and 55.9 bcm (1,88 tcf) in 2012. The 9% decrease in total gas volumes sold from 2013 to 2014 was related to lower third party volumes, primarily in the US, in addition to lower entitlement production on the NCS. The 6% increase in gas volumes sold from 2012 to 2013 was mainly related to higher entitlement production in the US and higher third party volumes, mainly in the US, offset by lower entitlement production on the NCS.
Third party natural gas sales volumes do not include volumes sold on behalf of the Norwegian State's direct financial interest (SDFI). MPR sold 33.4 bcm, 35.0 bcm and 39.5 bcm of NCS gas on behalf of SDFI in 2014, 2013 and 2012, respectively.
In 2014, the average invoiced natural gas sales price in Europe was NOK 2.28 per scm, compared to NOK 2.45 per scm in 2013, a decrease of 7% mainly due to general decrease in gas market prices partly offset by improved price premium vs. gas market prices in our gas contract portfolio.The average invoiced natural gas sales price in Europe was almost on the same level in 2013 as in 2012.
In 2014, the average invoiced natural gas sales price in North Americas was NOK 1.04 per scm, compared to NOK 0.83 per scm in 2013, The increase of 25% was mainly due to high market prices in first quarter 2014 as a result of exceptionally cold weather in North East combined with long term pipeline capacity agreements enabling access into premium markets in Toronto and Manhattan. In 2013, the invoiced natural gas sales price in North Americas was NOK 0.83 per scm, an increase of 69% from 2012 to 2013. This increase was due to an increase in market price and higher gas sales price as a direct result of new pipeline capacity to Niagara from November 2012 and new pipeline capacity to Manhattan from November 2013.
All of Statoil's gas produced on the NCS is sold by MPR and purchased from DPN at a market-based internal price. Our average internal purchase price for gas was NOK 1.57 per scm in 2014, down from NOK 1.92 per scm in 2013. The decrease of 18% from 2013 to 2014 was primarily due to in general lower market prices in 2014.
Average crude, condensate and NGL sales were 2.2 mmbbl per day in 2014 of which approximately 0.98 mmbbl were sales of our equity volumes, 0.83 mmbbl sales of third-party volumes and 0.41 mmbbl sales of volumes purchased from SDFI. Our average sales volume was 2.2 mmbbl per day in 2013 and 2.4 mmbbl per day in 2012. The average daily third-party volumes sold were 0.83 mmbbl in 2013 and 1.09 mmbbl in 2012.
The refinery margin improved in the second half of 2014 reflecting lower crude oil prices and less competing capacity available due to large maintenance programmes. However, the margin outlook is still negative due to anticipated surplus refining capacity, global competition and low demand in Europe. Statoil's refining reference margin was 4.7 USD/bbl in 2014, compared to 4.1 USD/bbl in 2013, an increase of 14%. The refining reference margin was 5.5 USD/bbl in 2012.
76Statoil, Annual Report on Form 20-F 2014
| Income statement under IFRS | For the year ended 31 December | | | (in NOK billion) | 2014 | 2013 | 2012 | 14-13 change | 13-12 change | | | (restated) | (restated) | | | | | | | | | Total revenues and other income | 597.3 | 608.6 | 665.6 | (2%) | (9%) | | | | | | | Purchases [net of inventory] | (544.2) | (565.2) | (618.0) | (4%) | (9%) | Operating expenses and selling, general and administrative expenses | (33.2) | (33.7) | (29.1) | (2%) | 16% | Depreciation, amortisation and net impairment losses | (3.6) | (7.0) | (3.0) | (48%) | >100% | | | | | | | Net operating income | 16.2 | 2.6 | 15.5 | >100% | (83%) |
| Total revenues and other incomewere NOK 597.3 billion in 2014, compared to NOK 608.6 billion in 2013 and NOK 665.6 billion in 2012. The decrease in total revenues and other income from 2013 to 2014 was mainly due to the decrease in gas and crude prices plus lower volumes of gas sold. The average crude price in USD declined by approximately 9% in 2014 compared to 2013, partly offset by a weakening USD/NOK average daily exchange rate by approximately 7% in 2014. Revenues in 2014 were positively impacted by gains from derivatives, mainly due to significant drop in the forward curve in the oil market. Total revenues and other income in 2014 were positively impacted by the Sonatrach Arbitration Settlement of NOK 2.8 billion, following an arbitration ruling in Statoil’s favour.
The decrease in revenues from 2012 to 2013 was mainly due to lower gas and crude prices as well as a reduction in crude and other oil products volumes sold. The decrease in gas prices was impacted by increased share of gas sold in the US in 2013 vs. 2012. The decreased gas prices were partly offset by increased volumes of gas sold. The average crude price in USD declined by approximately 3% in 2013 compared to 2012, partly offset by a weakening of the USD/NOK average daily exchange rate by approximately 1% in 2013.
Purchases [net of inventory variation]were NOK 544.2 billion in 2014, compared to NOK 565.2 billion in 2013 and NOK 618.0 billion in 2012. The decrease from 2013 to 2014 was mainly due to the decrease in gas and crude prices, lower volumes of gas sold plus losses on storages due to a significant price reduction. The decrease from 2012 to 2013 was mainly due to lower crude price and lower crude oil prices and other oil product volumes sold partly offset by higher transfer prices for natural gas from DPN.
Operating expenses and selling, general and administration expenseswere NOK 33.2 billion in 2014, compared to NOK 33.7 billion in 2013 and NOK 29.1 billion in 2012. The Cove Point onerous contract provision of NOK 4.1 billion influenced expenses in 2013. Excluding that item, 2014 figures would show an increase in expenses as compared to 2013. The increase was mainly caused by increased activity in the US in addition to negative NOK/USD currency effects.
The increase in expenses from 2012 to 2013 was mainly due to the Cove Point onerous contract provision (NOK 4.1 billion), increased operational activity and business development costs, partly offset by decreased transportation cost resulting from lower volumes of liquids sold in addition to cost reduction due to improvement initiatives.
Depreciation, amortisation and net impairment losseswere NOK 3.6 billion in 2014, compared to NOK 7.0 billion in 2013 and NOK 3.0 billion in 2012.
The decrease in depreciation, amortisation and net impairment losses from 2013 to 2014 was mainly as a result of impairment losses of the refineries made in 2013. The increase in depreciation, amortisation and net impairment losses from 2012 to 2013 was mainly caused by impairment losses related to the refineries and new assets in operation in 2013
Net operating incomewas NOK 16.2 billion, NOK 2.6 billion and NOK 15.5 billion in 2014, 2013 and 2012, respectively. The increase of NOK 13.6 billion from 2013 to 2014 was mainly due to lower impairment losses in 2014 compared to 2013, the Sonatrach Arbitration Settlement of NOK 2.8 billion in 2014 in Statoil’s favour, the onerous contract provision related to Cove Point of NOK 4.1 billion in 2013, and improved margins on gas in Europe including LNG arbitrage and stronger contribution from US gas sales due to an exceptionally cold winter in the North East US. Further, net operating income increased due to improved refinery margins and increased result related to ownership in infrastructure. These increases were partly offset by losses on operational storages in 2014 due to reduced prices.
The decrease of NOK 12.9 billion from 2012 to 2013 was mainly due to an onerous contract provision in 2013 related to the Cove Point terminal (NOK 4.1 billion), reduced margins on gas sales, lower NCS entitlement production and lower contributions from short term sales. Further, net operating income decreased as a result of impairment losses related to the refineries (NOK 4.2 billion), a negative change in fair value effects related to inventory hedging and lower refining margins in 2013 compared to in 2012.
Statoil, Annual Report on Form 20-F 201477
4.1.7 Other operations
The Other reporting segment includes activities within Global Strategy and Business Development; Technology, Projects and Drilling; and Corporate staffs and support functions.
In 2014, the Other reporting segment recorded a net operating loss of NOK 1.5 billion compared to a net operating loss of NOK 1.1 billion in 2013 and a net operating income of NOK 2.6 billion in 2012.
4.1.8 Definitions of reported volumes
This section explains some of the terms used when reporting volumes, such as lifted entitlement volumes, equity volumes, entitlement volumes and proved reserves.
Volumes that explain revenues
In explaining revenues and changes in revenues, we reportlifted entitlement volumes. This is because we only recognise income from volumes to which we have legal title, and such title typically arises upon the lifting (i.e. loading onto a vessel) of the volumes. Under a production sharing agreement (PSA), we are only entitled to receive and sell certain parts of the volumes produced, and we therefore refer to entitlement volumes for revenue recognition purposes. The difference between equity and entitlement volumes is described in more detail below.
Volumes of lifted liquids (crude oil, condensate and natural gas liquids) and natural gas correlate with production over time, but they may be higher or lower than entitlement production for a given period due to operational factors that affect the timing of the lifting of the liquids from the fields by Statoil-chartered vessels. Volumes of natural gas produced on the Norwegian continental shelf (NCS) are deemed to be equal to lifted volumes of natural gas from the NCS.
Volumes of lifted liquids and natural gas may be sold or put into storage. The volumes that give rise to revenues from the sale of liquids and natural gas in the period are therefore equal to lifted volumes plus changes in inventories of liquids and natural gas.
Volumes that explain operating expenses
In explaining operating expenses, in total and in production cost per barrel of oil equivalents, we believe thatproduced (equity) volumesare a better indicator of activity levels than lifted volumes. Moreover, we believe that equity volumes are a better indicator of the activity level under PSAs than entitlement volumes, since our capital expenditure and operating expenses under such contracts are linked to equity volumes produced rather than to entitlement volumes received.
Equity volumesrepresent produced volumes that correspond to Statoil's percentage ownership interest in a particular field.Entitlement volumes, on the other hand, represent Statoil's share of the volumes distributed under a PSA to the partners in the field, which are subject to deductions for, among other things, royalties and the host government's share of profit oil. Under the terms of a PSA, the amount of profit oil deducted from equity volumes will normally increase with the cumulative return on investment to the partners and/or production from the licence. In some production sharing agreements, changes in prices or production rate can affect the contractors' share of production. Normally, a higher return on the project will lead to a higher government take. Consequently, a higher price may lead to lower entitlement production and entitlement reserves and vice versa. The distinction between equity and entitlement is relevant to most PSA regimes. The main countries in which we operate under PSAs are Algeria, Angola, Azerbaijan, Libya, Nigeria and Russia.
From the fourth quarter 2013, entitlement production from the upstream segment in the US is presented net of royalties. Historical information is changed to provide comparable figures.
Volumes of proved reserves
Proved reservesare based on estimated entitlement volumes recognised as reserves in accordance with the definitions of Rules 4-10 (a) of Regulation S-X and relevant guidance from the Securities and Exchange Commission (SEC) of the United States. They represent volumes that with reasonable certainty will be produced and to which we will have entitlement in the future. See the section Business overview - Proved oil and gas reserves and note 27 Supplementary oil and gas information (unaudited) to the Consolidated Financial statements, for details about how we measure and report proved reserves.
78Statoil, Annual Report on Form 20-F 2014
4.2 Liquidity and capital resources
We believe that our established liquidity reserves, credit rating and access to capital markets provide us with sufficient working capital for our foreseeable requirements.
4.2.1 Review of cash flows
Statoil`s cash flows in 2014 reflect a high investment level, continued portfolio optimisation and issuance of new debt resulting in a small decrease in cash and cash equivalents and increase in short-term financial investments.
CONSOLIDATED STATEMENT OF CASH FLOWS | | | | | | | Full year | (in NOK billion) | Note | 2014 | 2013 | 2012 | | | | | | Income before tax | | 109.4 | 138.4 | 206.7 | | | | | | Depreciation, amortisation and net impairment losses | 11, 12 | 101.4 | 72.4 | 60.5 | Exploration expenditures written off | | 13.7 | 3.1 | 3.1 | (Gains) losses on foreign currency transactions and balances | | (3.1) | 4.8 | 3.3 | (Gains) losses from dispositions | 4 | (12.4) | (17.6) | (14.7) | (Increase) decrease in other items related to operating activities | | 3.9 | 6.6 | (14.6) | (Increase) decrease in net derivative financial instruments | 25 | (2.8) | 11.7 | (1.1) | Interest received | | 2.1 | 2.1 | 2.6 | Interest paid | | (3.4) | (2.5) | (2.5) | | | | | | Cash flows provided by operating activities before taxes paid and working capital items | | 208.8 | 218.8 | 243.3 | | | | | | Taxes paid | | (96.6) | (114.2) | (119.9) | | | | | | (Increase) decrease in working capital | | 14.2 | (3.3) | 4.6 | | | | | | Cash flows provided by operating activities | | 126.5 | 101.3 | 128.0 | | | | | | Capital expenditures and investments | | (122.6) | (114.9) | (113.1) | (Increase) decrease in financial investments | | (12.7) | (23.2) | (12.1) | (Increase) decrease in other non-current items | | 0.8 | 0.6 | (1.2) | Proceeds from sale of assets and businesses | 4 | 22.6 | 27.1 | 29.8 | | | | | | Cash flows used in investing activities | | (112.0) | (110.4) | (96.6) | | | | | | New finance debt | | 20.6 | 62.8 | 13.1 | Repayment of finance debt | | (9.7) | (7.3) | (12.2) | Dividend paid | 17 | (33.7) | (21.5) | (20.7) | Net current finance debt and other | | (0.3) | (7.3) | 1.6 | | | | | | Cash flows provided by (used in) financing activities | | (23.1) | 26.6 | (18.2) | | | | | | Net increase (decrease) in cash and cash equivalents | | (8.6) | 17.5 | 13.2 | | | | | | Effect of exchange rate changes on cash and cash equivalents | | 5.7 | 2.9 | (1.9) | Cash and cash equivalents at the beginning of the period (net of overdraft) | 16 | 85.3 | 64.9 | 53.6 | | | | | | Cash and cash equivalents at the end of the period (net of overdraft) | 16 | 82.4 | 85.3 | 64.9 |
Statoil, Annual Report on Form 20-F 201479
Cash flows provided by operations
The most significant drivers of cash flows provided by operations are the level of production and prices for liquids and natural gas that impact revenues, purchases [net of inventory], taxes paid and changes in working capital items.
Cash flows provided by operating activitieswere NOK 126.5 billion in 2014 compared to NOK 101.3 billion in 2013, an increase of NOK 25.2 billion. Cash flows provided by operating activities before taxed paid and working capital items were reduced by NOK 10.0 billion compared to 2013, driven by decreased profitability mainly caused by lower prices for liquids and European gas. The decrease was offset by positive changes in working capital and lower taxes paid in 2014 compared to 2013.
Cash flows provided by operations amounted to NOK 101.3 billion in 2013, a decrease of NOK 26.7 billion compared to 2012. The decrease was largely driven by decreased profitability mainly caused by lower volumes of liquids and gas sold and lower liquids and gas prices in 2013 compared to 2012. Changes in working capital had a negative impact of NOK 7.9 billion, partly offset by lower taxes paid of NOK 5.7 billion.
Cash flows used in investing activities
Cash flows used in investing activitieswere NOK 112.0 billion in 2014 compared to NOK 110.4 billion in 2013, an increase of NOK 1.6 billion mainly due to increased capital expenditures, partly offset by lower investments in deposits with more than three months maturity. The proceeds from sale of assets in 2014 of NOK 22.6 billion mainly relates to the divestment of interests in the Shah Deniz field and the South Caucasus pipeline and the sale of interests in licences on the NCS.
Cash flows used in investing activities increased by NOK 13.8 billion from 2012 to 2013. The increase was mainly due to higher additions to financial investments of NOK 11.1 billion. Proceeds from sales decreased by NOK 2.7 billion, and for the year ended 2013 the proceeds were mainly related to the sale of assets to OMV and Wintershall. For the year ended 2012, the proceeds from sales were mainly related to payments from the sale of interest in Gassled, the sale of NCS assets to Centrica and the sale of the 54% shareholding in Statoil Fuel and Retail ASA.
Cash flows provided by (used in) financing activities
Cash flows used in financing activities were NOK 23.1 billion and are mainly related to payments of dividends and repayments of debt, partly offset by issuance of new debt in November 2014 of NOK 20.6 billion. The amounts reported in 2013 were influenced by debt issuances of NOK 62.8 billion in total.
Net cash flows provided by financing activities amounted to NOK 26.6 billion in 2013, an increase of NOK 44.8 billion compared to 2012. The increase was mainly due to an increase in net finance debt of NOK 54.6 billion, partially offset by an increase in current loans and other of NOK 8.9 billion.
4.2.2 Financial assets and debt
Statoil has a strong balance sheet and considerable financial flexibility. The net debt ratio before adjustments was 19.0% at the end of 2014. Net interest-bearing debt before adjustments increased by NOK 31.2 billion to NOK 89.2 billion at the end of 2014.
Financial position and liquidity
Statoil's financial position is strong although net debt ratio before adjustments at year end increased from 14.0% in 2013 to 19.0% in 2014. Net interest-bearing debt increased from NOK 58.0 billion to NOK 89.2 billion. During 2014 Statoil's total equity increased from NOK 356.0 billion to NOK 381.2 billion. From 2013 to 2014 both cash flows provided by operating activities and cash flows used in investments increased. Statoil paid a dividend of NOK 7.00 per share for 2013, Statoil introduced quarterly dividends in 2014 and has paid out quarterly dividends for the first three quarters. The quarterly dividends for 1Q and 2Q 2014 was paid out in 2014. The board of directors has proposed a dividend of NOK 1.80 per share for 4Q 2014, implying a total dividend of NOK 7.20 per share for 2014. Total dividend payments in 2014 were NOK 33.7 billion.
We believe that, given the current liquidity reserves, including committed credit facilities of USD 3.0 billion and very good access to various capital markets, Statoil will have sufficient capital available.
Funding needs arise as a result of the Group's general business activity. We generally seek to establish financing at the corporate level. Project financing may be used in cases involving joint ventures with other companies. We aim at having access at all times to a variety of funding sources in respect of markets and instruments as well as maintaining relationships with a core group of international banks that provide various kinds of banking services.
Statoil has credit ratings from Moody's and Standard & Poor's (S&P). These ratings ensure necessary predictability when it comes to funding access at attractive terms and conditions. Our current long-term ratings are Aa2 and AA- from Moody's and S&P, respectively, both with stable outlook. The short-term ratings are P-1 from Moody's and A-1+ from S&P. In order to maintain financial flexibility going forward, we intend to keep key financial ratios at levels consistent with our objective of maintaining Statoil's long-term credit rating at least within the single A category on a stand-alone basis.
The management of financial assets and liabilities takes into consideration funding sources, the maturity profile of non-current debt, interest rate risk management, currency risk and the management of liquid assets. Our borrowings are denominated in various currencies and normally swapped into USD. In addition, we use interest rate derivatives, primarily consisting of interest rate swaps, to manage the interest rate risk of our long-term debt portfolio. The group's central treasury unit manages the funding, liability and liquidity activities at group level.
80Statoil, Annual Report on Form 20-F 2014
We have diversified our cash investments across a range of financial instruments and counterparties to avoid concentrating risk in any one type of investment or any single country. As of 31 December 2014, approximately 35% of our liquid assets were held in USD-denominated assets, 21% in NOK, 20% in EUR, 14% in DKK, 9% in SEK, and 2% in GBP, before the effect of currency swaps and forward contracts. Approximately 57% of our liquid assets were held in treasury bills and commercial papers, 37% in time deposits, 3% in liquidity funds and 3% at bank available. As of 31 December 2014, approximately 2.0% of our liquid assets were classified as restricted cash (including collateral deposits).
Our general policy is to keep a liquidity reserve in the form of cash and cash equivalents or other short-term financial investments in our balance sheet, as well as committed, unused credit facilities and credit lines in order to ensure that we have sufficient financial resources to meet our short-term requirements.
Long-term funding is raised when we identify a need for such financing based on our business activities, cash flows and required financial flexibility or when market conditions are considered to be favourable. Recent bond transactions were made at very favourable terms, pre-funding longer-term commitments.
The group's borrowing needs are usually covered through the issuing of short-term and long-term securities, including utilisation of a US Commercial Paper Programme (programme limit USD 4.0 billion) and a Shelf Registration Statement (unlimited) filed with the Securities and Exchange Commission (SEC) in the United States as well as through issues under a Euro Medium-Term Note (EMTN) Programme (programme limit recently updated to USD 16.0 billion) listed on the London Stock Exchange. Committed credit facilities and credit lines may also be utilised. After the effect of currency swaps, the major part of our borrowings is in USD.
Statoil ASA issued new debt securities in 2014 equivalent to NOK 20.5 billion as follows for general corporate purposes.
In February 2015 Statoil issued notes worth another EUR 3.75 billion (NOK 32.1 billion) under the EMTN programme.
In 2014 Statoil issued the following bonds: | Issuance date | Amount in USD billion | Interest rate in % | Maturity date | | | | | 10 November 2014 | 0.75 | 1.25 | November 2017 | 10 November 2014 | 0.50 | floating | November 2017 | 10 November 2014 | 0.75 | 2.25 | November 2019 | 10 November 2014 | 0.50 | 2.75 | November 2021 | 10 November 2014 | 0.50 | 3.25 | November 2024 |
The new debt securities issued in 2014 were mainly issued under the US Shelf Registration Statement. All of the new debt is guaranteed by Statoil Petroleum AS.
Statoil ASA issued new debt securities in 2013 equivalent to NOK 62.8 bn as follows:
Financial indicators
Financial indicators | For the year ended 31 December | (in NOK billion) | 2014 | 2013 | 2012 | | | | | Gross interest-bearing financial liabilities 1) | 231.6 | 182.5 | 119.4 | Net interest-bearing liabilities before adjustments | 89.2 | 58.0 | 39.3 | Net debt to capital employed ratio 2) | 19.0% | 14.0% | 10.9% | Net debt to capital employed ratio adjusted 3) | 20.0% | 15.2% | 12.4% | Cash and cash equivalents | 83.1 | 85.3 | 65.2 | Current financial investments | 59.2 | 39.2 | 14.9 | Calculated ROACE based on Average Capital Employed before Adjustments 4) | 2.7% | 11.3% | 18.7% | Ratio of earnings to fixed charges 5) | 9.4 | 7.5 | 19.6 |
Gross interest-bearing debt
Gross interest-bearing debt was NOK 231.6 billion, NOK 182.5 billion and NOK 119.4 billion at 31 December 2014, 2013 and 2012, respectively. The NOK 49.0 billion increase from 2013 to 2014 was due to an increase in current finance debt of NOK 9.4 billion and an increase in non-current finance debt of NOK 39.6 billion. The NOK 63.1 billion increase from 2012 to 2013 was due to an increase in non-current finance debt of NOK 64.5 billion, offset by a decrease in current financial debt of NOK 1.3 billion. Our weighted average annual interest rate was 3.78%, 4.06% and 4.74% at 31 December 2014, 2013 and 2012, respectively. Our weighted average maturity on Finance debt was 9 years at 31 December 2014, compared to 10 years at 31 December 2013 and 9 years at 2012.
Net interest-bearing debt
Net interest-bearing debt before adjustments were NOK 89.2 billion, NOK 58.0 billion and NOK 39.3 billion at 31 December 2014, 2013 and 2012, respectively. The increase of NOK 31.2 billion from 2013 to 2014 was mainly related to an increase in gross interest-bearing debt of NOK 49.0 billion in addition to an increase in cash and cash equivalents and current financial investments of NOK 17.9 billion, reflecting the level of bond issues and active portfolio management (proceeds from sales of assets).
Statoil, Annual Report on Form 20-F 201481
The net debt to capital employed ratio
The net debt to capital employed ratio before adjustments was 19.0%, 14.0% and 10.9% in 2014, 2013 and 2012, respectively.
The net debt to capital employed ratio adjusted (non-GAAP financial measure, see footnote 3) was 20.0%, 15.2% and 12.4% in 2014, 2013 and 2012, respectively. The 4.8 percentage points increase in net debt to capital employed ratio adjusted from 2013 to 2014 was mainly related to the increase in net interest-bearing debt adjusted of NOK 31.9 billion in combination with an increase in capital employed adjusted of NOK 57.0 billion. The 2.8 percentage points increase in net debt to capital employed ratio adjusted from 2012 to 2013 was mainly related to an increase in net interest-bearing debt adjusted of NOK 18.6 billion in combination with an increase in capital employed adjusted of NOK 54.7 billion.
Cash, cash equivalents and current financial investments
Cash and cash equivalents were NOK 83.1 billion, NOK 85.3 billion and NOK 65.2 billion at 31 December 2014, 2013 and 2012, respectively. The decrease from 2013 to 2014 reflects a reduction in bond issues as well as the liquidity management of cash and cash equivalents and current financial investments and the proceeds from sales of assets,. See note 16 Cash and cash equivalents to the Consolidated financial statements for information concerning restricted cash.
Current financial investments, which are part of our liquidity management, amounted to NOK 59.2 billion, NOK 39.2 billion and NOK 14.9 billion at 31 December 2014, 2013 and 2012, respectively.
(1)Defined as non-current and current finance debt.
(2)As calculated according to GAAP. Net debt to capital employed ratio before adjustments is the net debt divided by capital employed. Net debt is interest-bearing debt less cash and cash equivalents and short-term investments. Capital employed is net debt, shareholders' equity and minority interest
(3)In order to calculate the net debt to capital employed ratio adjusted that our management makes use of internally and which we report to the market, we make adjustments to capital employed as it would be reported under GAAP to adjust for project financing exposure that does not correlate to the underlying exposure and to add into the capital employed measure interest-bearing elements which are classified together with non-interest-bearing elements under GAAP. See report section Financial review - Non-GAAP measures for a reconciliation of capital employed and a description of why we make use of this measure.
(4)Calculated ROACE based on Average Capital Employed before Adjustments is equal to net income adjusted for financial items after tax, divided by average capital employed over the last 12 months. See report section Financial review - Non-GAAP measures for a reconciliation of ROACE and a description of why we make use of this measure.
(5)Based on IFRS. For the purpose of these ratios, earnings consist of the income before (i) tax, (ii) minority interest, (iii) amortisation of capitalised interest and (iv) fixed charges (which have been adjusted for capitalised interest) and after adjustment for unremitted earnings from equity accounted entities. Fixed charges consist of interest (including capitalised interest) and estimated interest within operating leases.
4.2.3 Investments
Organic capital expenditures (excluding acquisitions, capital leases and other investments with significant different cash flow pattern) amounted to USD 19.6 billion, or NOK 121.6 billion, for the year ended 31 December 2014.
Gross investments
Gross investment | For the year ended 31 December | | | (in NOK billion) | 2014 | 2013 | 2012 | 14-13 change | 13-12 change | | | | | | | - Development & Production Norway | 55.1 | 57.3 | 48.6 | (4%) | 18% | - Development & Production International | 61.4 | 52.9 | 54.6 | 16% | (3%) | - Marketing, Processing & Renewable Energy | 7.8 | 5.9 | 6.2 | 31% | (5%) | - Fuel & Retail | 0.0 | 0.0 | 0.9 | 0% | (100%) | - Other | 0.8 | 1.3 | 3.0 | (35%) | (58%) | | | | | | | Gross investments | 125.1 | 117.4 | 113.3 | 7% | 4% |
Gross investments, defined as additions to property, plant and equipment (including capitalised financial leases), capitalised exploration expenditures, intangible assets, long-term share investments and investments in associated companies, amounted to NOK 125.1 billion for the year ended 2014, increase by 7% compared to the year ended 2013. The increase was primarily related to higher activity level in Development and Production International.
In 2013, gross investments were NOK 117.4 billion compared to NOK 113.3 billion in 2012. The increase was mainly due to higher activity level on the NCS.
Organic capital expenditures (excluding acquisitions, capital leases and other investments with significant different cash flow pattern) amounted to NOK 121.6 billion for the year ended 2014, or USD 19.6 billion. Organic capital expenditures are estimated to be around USD 18 billion in 2015. Based on our
82Statoil, Annual Report on Form 20-F 2014
sanctioned portfolio of projects, we expect to deliver high value production growth towards 2018. We maintain flexibility in our broad portfolio of operated assets, and we are prepared to use this flexibility to deliver on our priorities.
This section describes our estimated organic capital expenditure for 2015 relating to potential capital expenditure requirements for the principal investment opportunities available to us and other capital projects currently under consideration. The figure is based on Statoil developing organically, and it excludes possible expenditures relating to acquisitions. The expenditure estimates and descriptions of investments in the segment descriptions below could therefore differ materially from the actual expenditure.
We finance our capital expenditures both internally and externally. For more information, see the section Financial review - Liquidity and capital resources - Financial assets and liabilities.
In Norway a substantial proportion of our 2015 capital expenditures will be spent on ongoing and planned development projects such as Aasta Hansteen, Gina Krog and Johan Sverdrup, in addition to various extensions, modifications and improvements on currently producing fields, like Gullfaks, Oseberg and Troll.
Internationally we currently estimate that a substantial proportion of our 2015 capital expenditure will be spent on the following ongoing and planned development projects: Mariner in UK, Marcellus, Eagle Ford and Bakken onshore US and developments offshore US.
In midstream and downstream we currently estimate that most of the 2015 capital expenditures will be spent on projects related to Polarled in Norway and transport solutions related to Marcellus, Eagle Ford and Bakken in the US.
As illustrated in the section Financial review - Liquidity and capital resources - Principal contractual obligations, we have committed to certain investments in the future. The proportion of estimated investments that we have committed to at year-end 2014 will decline with time. The further into the future, the more flexibility we will have to revise expenditure. This flexibility is partly dependent on the expenditure our partners in joint ventures agree to commit to.
Exploration expenditures
Exploration expenditures (including capitalised exploration expenditures) were up 10% to NOK 23.9 billion in 2014 mainly due to higher activity internationally with more expensive wells compared to previous year and cancellation of a rig contract in 2014.
Exploration expenditures in 2013 amounted to NOK 21.8 billion compared to NOK 20.9 billion in 2012.
Evaluation of the results of drilling will influence the amount of exploration expenditure capitalised and expensed. Refer to note 2 Significant accounting policies to the Consolidated financial statements.
Finally, we may alter the amount, timing or segmental or project allocation of our capital expenditures in anticipation of or as a result of a number of factors outside our control.
4.2.4 Impact of inflation
Our results in recent years have been affected by increases in the price of raw materials and services that are necessary for the development and operation of oil and gas producing assets.
As measured by the general consumer price index, average annual inflation in Norway for the year ending 31 December 2014 was 2%. Cost inflation in the prices of goods, raw materials and services that are necessary for the development and operation of oil and gas producing assets can vary considerably over time and between each market segment. Price pressure in supplier markets has been reduced compared to the period 2003 to 2008 and moderate increases were seen in 2014. In some market segments (e.g. drilling rigs) reduced rates were seen in 2014 compared to the beginning of the decade.
While some of the cost pressure relates to capitalised expenditures and thus only affects our annual profit through increased depreciation, certain elements of operating expenditures have also been affected by this inflation. See our analysis of profit and loss in the section Financial review - Operating and financial review as well as the Group outlook section in the section Strategy and market overview.
Statoil, Annual Report on Form 20-F 201483
4.2.5 Principal contractual obligations
The table summarises our principal contractual obligations and other commercial commitments as of 31
December 2014.
The table includes contractual obligations, but excludes derivatives and other hedging instruments as well as asset retirement obligations, as these obligations for the most part are expected to lead to cash disbursements more than five years in the future. Obligations payable by Statoil to unconsolidated equity affiliates are included gross in the table. Where Statoil includes both an ownership interest and the transport capacity cost for a pipeline in the consolidated accounts, the amounts in the table include the transport commitments that exceed Statoil's ownership share. See the section Risk review – Risk management - Disclosures about market riskfor more information.
| As at 31 December 2014 | Contractual obligations | Payment due by period * | (in NOK billion) | Less than 1 year | 1-3 years | 3-5 years | More than 5 years | Total | | | | | | | | Undiscounted non-current finance debt | 23.1 | 42.4 | 79.9 | 169.9 | 315.2 | Minimum operating lease payments | 27.7 | 34.2 | 17.5 | 28.4 | 107.8 | Nominal minimum other long-term commitments** | 15.3 | 27.3 | 25.4 | 143.3 | 211.3 | | | | | | | | Total contractual obligations | 66.1 | 103.8 | 122.8 | 341.6 | 634.3 | | | | | | | | * | «Less than 1 year» represents 2015; «1-3 years» represents 2016 and 2017, «3-5 years» represents 2018 and 2019, while «More than 5 years» includes amounts for later periods. | ** | For further information, see note 23 Other commitments and contingencies to the Consolidated financial statements. |
Non-current finance debt in the table represents principal payment obligations. For information on interest commitments relating to long-term debt, reference is made to note 18 Finance debt and note 22 Leases to the Consolidated financial statements.
Statoil had contractual commitments of NOK 67.2 billion at 31 December 2014. The contractual commitments reflect Statoil's share and mainly comprise construction and acquisition of property, plant and equipment. The sale of Statoil`s remaining 15.5% ownership interest in Shah Deniz, announced in October 2014, will reduce contractual commitments related to Shah Deniz expansion by NOK 7.3 billion (USD 1.0 billion. )
Statoil’s projected pension benefit obligation was NOK 65 billion, and the fair value of plan assets amounted to NOK 45.1 billion as of 31 December
2014. Company contributions are mainly related to employees in Norway. Statoil ASA decided to change the company’s pension plan in Norway from a defined benefit plan to a defined contribution plan with effect from 2015, reference is made to note 19 Pensions to the Consolidated financial statements.
4.2.6 Off balance sheet arrangements
This section describes various agreements that are not recognised in the balance sheet, such as operational leases and transportation and processing capacity contracts.
We have entered into various agreements, such as operational leases and transportation and processing capacity contracts, that are not recognised in the balance sheet. For more information, see the section Financial review - Liquidity and capital resources - Principal contractual obligations and note 22 Leasesto the Consolidated financial statements.
We are not party to any off-balance sheet arrangements such as the use of variable interest entities, derivative instruments that are indexed to our own shares and classified in shareholder's equity, or contingent assets transferred to an unconsolidated equity.
Statoil is party to certain guarantees, commitments and contingencies that, pursuant to IFRS, are not necessarily recognised in the balance sheet as liabilities. See note 23 Other commitments and contingenciesto the Consolidated financial statements for more information.
84Statoil, Annual Report on Form 20-F 2014
4.3 Accounting Standards (IFRS)
We prepare our consolidated financial statements in accordance with International Financial Reporting Standards (IFRS) as adopted by the EU and as issued by the International Accounting Standards Board.
We prepared our first set of consolidated financial statements pursuant to IFRS for 2007. The IFRS standards have been applied consistently to all periods presented in the consolidated financial statements and when preparing an opening IFRS balance sheet as of 1 January 2006 (subject to certain exemptions allowed by IFRS 1) for the purpose of the transition to IFRS.
See note 2 Significant accounting policies to the Consolidated financial statements for a discussion of key accounting estimates and judgements.
4.4 Non-GAAP measures
This section describes the non-GAAP financial measures that are used in this report.
We are subject to SEC regulations regarding the use of "non-GAAP financial measures" in public disclosures. Non-GAAP financial measures are defined as numerical measures that either exclude or include amounts that are not excluded or included in the comparable measures calculated and presented in accordance with generally accepted accounting principles, which in our case refers to IFRS.
The following financial measures may be considered non-GAAP financial measures:
·Return on average capital employed (ROACE)
·Production cost per barrel of entitlement and equity volumes
·Net debt to capital employed ratio before adjustments
·Net debt to capital employed ratio adjusted
·Organic capital expenditures
4.4.1 Return on average capital employed (ROACE)
We use ROACE to measure the return on capital employed, regardless of whether the financing is through equity or debt.
In the group's view, this measure provides useful information for both the group and investors about performance during the period under evaluation. We make regular use of this measure to evaluate our operations. Our use of ROACE should not be viewed as an alternative to income before financial items, income taxes and minority interest, or to net income, which are measures calculated in accordance with generally accepted accounting principles or ratios based on these figures.
ROACE was 2.7% in 2014 compared to 11.3% in 2013 and 18.7% in 2012. The decrease from last year is due to 73% decrease in net income adjusted for financial items, combined with an increase in average capital employed. The decrease from 2012 to 2013 was due to 35% decrease in net income combined with an increase in average capital employed.
Statoil, Annual Report on Form 20-F 201485
Calculation of numerator and denominator used in ROACE calculation | For the year ended 31 December | | | (in NOK billion, except percentages) | 2014 | 2013 | 2012 | 14-13 change | 13-12 change | | | | | | | | Net Income for the year | 22.0 | 39.2 | 69.5 | | | -Net Financial Items | (0.0) | | | | | -Tax on Financial Items | 9.2 | | | | | +Accretion Expense | (3.7) | | | | | +Tax on Accretion Expense | 2.7 | | | | | +Net Financial Items Adjusted after Tax1) | | 4.6 | (2.4) | | | | | | | | | | Net Income adjusted for Financial Items after Tax (A1) | 11.8 | 43.9 | 67.0 | (73%) | (35%) | | | | | | | | Capital Employed before Adjustments to Net Interest-bearing Debt: 2) | | | | | | Year End 2014 | 470.4 | | 0.0 | | | Year End 2013 | 414.0 | 414.0 | | | | Year End 2012 | 0.0 | 359.2 | 359.2 | | | Year End 2011 | 0.0 | 0.0 | 356.1 | | | | | | | | | | Sum of Capital Employed for two years (B1) | 884.4 | 773.2 | 715.3 | | | | | | | | | | Calculated Average Capital Employed: | | | | | | Average Capital Employed before Adjustments to Net Interest-bearing Debt (B1/2) | 442.2 | 386.6 | 357.7 | 14% | 8% | | | | | | | | Calculated ROACE: | | | | | | Return on Average Capital Employed (A1/(B1/2)) | 2.7 % | 11.3 % | 18.7 % | (77%) | (39%) | | | | | | | | (1) | Calculation of financial items is revised for 2014 ROACE definition. Net Financial Items after tax for 2013 includes financial items adjusted of negative NOK 4.6 billion and tax on financial items of NOK 9.2 billion. | (2) | Capital Employed before Adjustments for each year is reconciled in the table in the section Net debt to capital employed ratio. |
86Statoil, Annual Report on Form 20-F 2014
4.4.2 Unit of production cost
In order to evaluate the underlying development in production costs, unit of production cost is computed on the basis of entitlement volumes and equity volumes.
Significant parts of Statoil's international production are subject to production sharing agreements with countries' authorities. Under these agreements, we cover our share of the operating expenditures relating to the equity volumes produced. Our international production costs are thus affected by the amount of equity barrels produced more than by the entitlement volumes received. In order to exclude the effects that production sharing agreements (PSA effects) and US royalties have on entitlement volumes, we also provide the unit of production cost based on equity volumes.
The following is a reconciliation of our overall operating expenses with production cost per year as used when calculating the unit of production cost per oil equivalent of entitlement and equity volumes.
| For the year ended 31 December | Reconcilliation of overall operating expenses to production cost (in NOK billion) | 2014 | 2013 | 2012 | | | | | | Operating expenses, Statoil Group | 72.9 | 75.0 | 61.2 | | | | | | Deductions of costs not relevant to production cost calculation | | | | Operating expenses in Business Areas non-upstream | 28.1 | 30.4 | 22.2 | | | | | | Total operating expenses upstream | 44.8 | 44.6 | 38.9 | | | | | | 1) Operation over/underlift | -0.9 | 0.4 | (0.2) | 2) Transportation pipeline/vessel upstream | 7.6 | 7.4 | 5.9 | 3) Miscellaneous items | 3.6 | 5.4 | 2.2 | | | | | | Total operating expenses upstream for cost per barrel calculation | 34.5 | 31.4 | 31.0 | | | | | | Entitlement production used in the cost per barrel calculation (mboe/d) | 1,729 | 1,719 | 1,778 | Equity production used in the cost per barrel calculation (mboe/d) | 1,927 | 1,940 | 2,004 | | | | | | 1) | Exclusion of the effect from the over-underlift position in the period. Reference is made to Definitions of reported volumes. | 2) | Transportation costs are excluded from the unit of production cost calculation. | 3) | Consists of royalty payments, removal/abandonment estimates, reversal of provision related to the discontinued part of the early retirement pension |
| | Entitlement production | Equity production | | | For the year ended 31 December | For the year ended 31 December | Production cost (in NOK per boe)* | 2014 | 2013 | 2012 | 2014 | 2013 | 2012 | | | | | | | | | Production cost per boe | 55 | 50 | 48 | 49 | 44 | 42 | | | | | | | | | * | Production cost per boe is calculated as the Total operating expenses upstream for the last four quarters divided by the production volumes (mboe/d multiplied by number of days) for the corresponding period. |
Entitlement volumes are highly affected by the PSA effects. On average, equity volumes exceeded entitlement volumes net of US royalties by 198 mboe per day in 2014, 221 mboe per day in 2013 and 226 mboe per day in 2012. With the same cost basis, but higher volumes, the cost per barrel of equity volumes produced will always be lower than the cost per barrel of entitlement volumes. Based on equity volumes, the average production cost was NOK 49 per boe in 2014 compared to NOK 44 per boe in 2013 and NOK 42 per boe in 2012. Production cost per boe based on entitlement volumes was 55 NOK/boe in 2014 compared to 50 NOK/boe in 2013 and 48 NOK/boe in 2012. The increase in 2014 from last year is due to increased production costs impacted by new fields coming on stream.
Statoil, Annual Report on Form 20-F 201487
4.4.3 Net debt to capital employed ratio
In the Company's view, the calculated net debt to capital employed ratio gives a more complete picture of
the Group's current debt situation than gross interest-bearing financial liabilities.
The calculation uses balance sheet items relating to gross interest bearing financial liabilities and adjusts for cash, cash equivalents and short-term financial investments. Certain adjustments are made, since different legal entities in the group lend to projects and others borrow from banks. Project financing through an external bank or similar institution will not be netted in the balance sheet and will over-report the debt stated in the balance sheet in relation to the underlying exposure in the group. Similarly, certain net interest-bearing debts incurred from activities pursuant to the Owners Instruction from the Norwegian State are set off against receivables on the Norwegian State's direct financial interest (SDFI).
The net interest-bearing debt adjusted for these two items is included in the average capital employed.
The table below reconciles the net interest-bearing liabilities adjusted, capital employed and net debt to capital employed adjusted ratio with the most directly comparable financial measure or measures calculated in accordance with GAAP.
| | For the year ended 31 December | Calculation of capital employed and net debt to capital employed ratio | 2014 | 2013 | 2012 | (in NOK billion, except percentages) | | | (restated) | | | | | | Shareholders' equity | 380.8 | 355.5 | 319.2 | Non-controlling interests (Minority interest) | 0.4 | 0.5 | 0.7 | | | | | | Total equity (A) | 381.2 | 356.0 | 319.9 | | | | | | Current bonds, bank loans, commercial papers and collateral liabilities | 26.5 | 17.1 | 18.4 | Bonds, bank loans and finance lease liabilities | 205.1 | 165.5 | 101.0 | | | | | | Gross interest-bearing financial liabilities (B) | 231.6 | 182.5 | 119.4 | | | | | | Cash and cash equivalents | 83.1 | 85.3 | 65.2 | Financial investments | 59.2 | 39.2 | 14.9 | | | | | | Cash and cash equivalents and financial investments (C) | 142.3 | 124.5 | 80.1 | | | | | | Net interest-bearing liabilities before adjustments (B1) (B-C) | 89.2 | 58.0 | 39.3 | | | | | | Other interest-bearing elements 1) | 8.0 | 7.1 | 7.3 | Marketing instruction adjustment 2) | (1.6) | (1.3) | (1.2) | Adjustment for project loan 3) | (0.1) | (0.2) | (0.3) | | | | | | Net interest-bearing liabilities adjusted (B2) | 95.6 | 63.6 | 45.1 | | | | | | Calculation of capital employed: | | | | Capital employed before adjustments to net interest-bearing liabilities (A+B1) | 470.4 | 414.0 | 359.2 | Capital employed adjusted (A+B2) | 476.7 | 419.6 | 365.0 | | | | | | Calculated net debt to capital employed: | | | | Net debt to capital employed before adjustments (B1/(A+B1) | 19.0% | 14.0% | 10.9% | Net debt to capital employed adjusted (B2/(A+B2) | 20.0% | 15.2% | 12.4% | | | | | | 1) | Other interest-bearing elements are cash and cash equivalents adjustments regarding collateral deposits classified as cash and cash equivalents in the Consolidated balance sheet but considered as non-cash in the non-GAAP calculations as well as financial investments in Statoil Forsikring AS classified as current financial investments. | 2) | Marketing instruction adjustment is an adjustment to gross interest bearing financial debt due to the SDFI part of the financial lease in the Snøhvit vessels that are included in Statoil's Consolidated balance sheet. | 3) | Adjustment for project loan is adjustment to gross interest-bearing debt due to the BTC project loan structure. |
88Statoil, Annual Report on Form 20-F 2014
5 Risk review
Our overall risk management includes identifying, evaluating and managing risk in all our activities to ensure safe operations and to achieve our corporate goals.
5.1 Risk factors
We are exposed to a number of risks that could affect our operational and financial performance. In this section, we address some of the key risk factors.
5.1.1 Risks related to our business
This section describes the most significant potential risks relating to our business:
A prolonged period of low oil or natural gas prices would have a material adverse effect on Statoil.
The prices of oil and natural gas have fluctuated greatly in response to changes in many factors. Currently Statoil is in a situation where oil (and to some extent also natural gas) prices have declined substantially compared to levels seen over the last few years. There are several reasons for this decline but fundamental market forces beyond the control of Statoil or other market participants have impacted and will continue to impact oil and natural gas prices in the future.
Generally, Statoil does not and will not have control over the factors that affect the prices of oil and natural gas. These factors include:
·economic and political developments in resource-producing regions;
·global and regional supply and demand;
·the ability of the Organisation of the Petroleum Exporting Countries (OPEC) and other producing nations to influence global production levels and prices;
·prices of alternative fuels that affect the prices realised under Statoil's long-term gas sales contracts;
·government regulations and actions; including changes in energy and climate policies
·global economic conditions;
·war or other international conflicts;
·changes in population growth and consumer preferences;
·the price and availability of new technology; and
·weather conditions.
It is impossible to predict future price movements for oil and natural gas with certainty. A prolonged period of low oil and natural gas prices will adversely affect Statoil's business, the results of operations, financial condition, liquidity and Statoil's ability to finance planned capital expenditure, including possible reductions in capital expenditures which could offset replacement reserves. In addition to the adverse effect on revenues, margins and profitability from any fall in oil and natural gas prices, a prolonged period of low prices or other indicators could lead to further reviews for impairment of the group's oil and natural gas properties. Such reviews would reflect the management's view of long-term oil and natural gas prices and could result in a charge for impairment that could have a significant effect on the results of Statoil's operations in the period in which it occurs. Rapid material and/or sustained reductions in oil, gas or product prices can have an impact on the validity of the assumptions on which strategic decisions are based and can have an impact on the economic viability of projects that are planned or in development.
Statoil’s crude oil and natural gas reserve data are only estimates and Statoil’s future production, revenues and expenditures with respect to its reserves may differ materially from these estimates.
The reliability of proved reserve estimates depends on:
·the quality and quantity of Statoil’s geological, technical and economic data;
·whether the prevailing tax rules and other government regulations, contracts and oil, gas and other prices will remain the same as on the date estimates are made;
·the production performance of Statoil’s reservoirs; and
·extensive engineering judgments.
Many of the factors, assumptions and variables involved in estimating reserves are beyond Statoil’s control and may prove to be incorrect over time. The results of drilling, testing and production after the date of the estimates may require substantial upward or downward revisions in Statoil’s reserve data. In addition, fluctuations in oil and gas prices will have an impact on Statoil’s proved reserves relating to fields governed by production sharing agreements (PSAs), since part of Statoil's entitlement under PSAs relates to the recovery of development costs. Any downward adjustment could lead to lower future production and thus adversely affect Statoil’s financial condition, future prospects and market value.
Statoil, Annual Report on Form 20-F 201489
Exploratory drilling involves numerous risks, including the risk that Statoil will encounter no commercially productive oil or natural gas reservoirs.
This could materially adversely affect Statoil's results. Statoil's exploration activities include accessing new acreage and maturing resources through high risk exploration drilling activities. These risks include risks associated with the execution of drilling and seismic operations and those associated with maturing, unproven resources.
New acreage is primarily acquired through concessions, bidding rounds and acquisitions. Geological interpretations and successful exploration drilling and appraisal work leads to maturing and increasingly commercially attractive reserves. Additionally, Statoil also needs to be focused on optimising its rig capacity by thoughtful deployment and redeployment. Given these risks and operational requirements, Statoil may not effectively acquire acreage, successfully conduct its drilling and appraisal work or optimise its rig capacity, which could result in a material adverse effect on the results of its operations and financial condition. Exploration activities involve the risk of accidents and environmental incidents. Exploration activities also involve technical challenges related to operating in harsh environments as well as technologically demanding subsurface / geological challenges which Statoil may not effectively manage.
If Statoil fails to acquire or find and develop additional reserves, its reserves and production will decline materially from their current levels.
Successful implementation of Statoil's group strategy is critically dependent on sustaining its long-term reserve replacement. If upstream resources are not progressed to proved reserves in a timely manner, Statoil will be unable to sustain the long-term replacement of reserves.
In a number of resource-rich countries, national oil companies control a significant proportion of oil and gas reserves that remain to be developed. To the extent that national oil companies choose to develop their oil and gas resources without the participation of international oil companies, or if Statoil is unable to develop partnerships with national oil companies, its ability to find and acquire or develop additional reserves will be limited.
Statoil's future production is highly dependent on its success in finding or acquiring and developing additional reserves. If it is unsuccessful, it may not meet its long-term ambitions, and its future total proved reserves and production will decline, adversely affecting its results of operations and financial condition.
Statoil is exposed to a wide range of health, safety, environmental and social risks that could result in significant losses.
Exploration for, and the development, production, processing and transportation of oil and natural gas can be hazardous and technical integrity failures, operational failures, natural disasters or other occurrences can result in: loss of life, oil spills, gas leaks, loss of containment of hazardous materials, water contamination, blowouts, cratering, fires and equipment failure, among other things.
The risks associated with Statoil's activities are heightened in the difficult geographies, climate zones and environmentally sensitive regions in which Statoil operates. All modes of transportation of hydrocarbons - including road, rail, sea or pipeline - are particularly susceptible to a loss of containment of hydrocarbons and other hazardous materials, and, given the high volumes involved, these could represent a significant risk to people and the environment. Offshore operations and transportation are subject to marine perils, including severe storms and other adverse weather conditions and vessel collisions. Onshore operations and transportation are subject to adverse weather conditions and accidents. Both onshore and offshore operations and transportation are subject to interruptions, restrictions or termination by government authorities based on safety, environmental or other considerations.
The effects of climate change could result in less stable weather patterns, which would result in more severe storms and other weather conditions that could interfere with Statoil's operations and damage its facilities. The increased focus on abating climate change may lead to stricter policies and regulations on greenhouse gas (GHG) emissions, causing increased costs relating to emissions and/or cost driving measures to provide electric power to facilities from renewable sources. Climate related policy changes may also reduce access to prospective geographical areas of operations in the future, as well as significantly affecting demand for, and prices, of our products.
Statoil is exposed to security threats that could adversely impact its business.
Acts of terrorism and cyber-attacks against Statoil's production and exploration facilities, offices, pipelines, means of transportation or computer systems; or breaches of Statoil's security system, could result in significant losses. Failure to manage the foregoing risks could result in injury or loss of life, damage to the environment, damage to or the destruction of wells and production facilities, pipelines and other property and could result in regulatory action, legal liability, damage to Statoil's reputation, a significant reduction in revenues, an increase in Statoil's costs, a shutdown of Statoil's operations and a loss of its investments in affected areas, and could have a materially adverse effect on Statoil's results of operations and financial condition.
Statoil's crisis management systems may prove inadequate.
Statoil has crisis management plans and capability to deal with emergencies at every level of its operations. If Statoil does not respond or is perceived not to have responded in an appropriate manner to either an external or internal crisis, its business, operations and reputation could be severely affected. For Statoil's most important activities, it has also developed business continuity plans to carry on or recover operations following a disruption or incident. Inability to restore or replace critical capacity to an agreed level within an agreed time frame could prolong the impact of any disruption and could severely affect Statoil's business and operations.
Statoil encounters competition from other oil and gas companies in all areas of its operations.
Some of Statoil's larger, financially stronger competitors may be able to pay more to gain access to resources, while its smaller competitors may be able to move faster and gain earlier access than Statoil. Gaining access to profitable resources either through the acquisition of licences, exploratory prospects or
90Statoil, Annual Report on Form 20-F 2014
producing properties is key to ensuring the long-term health and sustainability of the business and Statoil's failure to do so could have an adverse impact on its performance.
Technology is a key competitive advantage in Statoil's industry and a larger company may be able to invest more in developing or acquiring intellectual property rights to technology that Statoil may require. Should Statoil's innovation lag behind the industry, its performance could be impeded.
Statoil's development projects and production activities involve many uncertainties and operating risks that can prevent Statoil from realising profits and cause substantial losses.
Statoil's development projects and production activities may be curtailed, delayed or cancelled for many reasons, including equipment shortages or failures, natural hazards, unexpected drilling conditions or reservoir characteristics, pressure or irregularities in geological formations, accidents, mechanical and technical difficulties and industrial action. These projects and activities will also often require the use of new and advanced technologies, which may be expensive to develop, purchase and implement, and may not function as expected. In addition, some of Statoil's developments will be located in deep waters or other harsh environments - such as the Gulf of Mexico, the Barents Sea, and offshore Brazil, Tanzania and Angola - or may be in challenging fields (heavy oil fields such as Grane, Peregrino and Mariner) that can exacerbate such problems. There is a risk that development projects that Statoil undertakes may not yield adequate returns.
Statoil's development projects and production activities on the Norwegian continental shelf (NCS) also face the challenge of remaining profitable. Statoil is increasingly developing smaller satellite fields in mature areas, and its activities are subject to the Norwegian State's relatively high taxes on offshore activities. In addition, its development projects and production activities, particularly those in remote areas, could become less profitable, or unprofitable, if Statoil experiences a prolonged period of low oil or gas prices or cost overruns.
The capital expenditures in the oil and gas industry have increased over the last few years due to a high activity level and more complex and capital intensive development projects. This could reduce the returns and erode the profitability of some of Statoil's projects. As a response to this challenge, Statoil will need at all times to evaluate appropriate measures such as adjusting, postponing or stopping projects, adjusting strategies and targets or withdrawing from certain geographical areas.
Statoil faces challenges in achieving its strategic objective of successfully exploiting profitable growth opportunities.
An important element of Statoil's strategy is to continue to pursue attractive and profitable growth opportunities available to it by both enhancing and repositioning its asset portfolio and expanding into new markets. The opportunities that Statoil is actively pursuing may involve the acquisition of businesses or properties that complement or expand its existing portfolio. The challenges related to the renewal of Statoil's upstream portfolio are growing due to increasing global competition for access to opportunities.
Statoil's ability to successfully implement this strategy will depend on a variety of factors, including its ability to:
·identify acceptable opportunities;
·negotiate favourable terms;
·develop new market opportunities or acquire properties or businesses promptly and profitably;
·integrate acquired properties or businesses into Statoil's operations;
·arrange financing, if necessary; and
·comply with legal regulations.
As Statoil pursues business opportunities in new and existing markets, it anticipates significant investments and costs in connection with the development of such opportunities. Statoil may incur or assume unanticipated liabilities, losses or costs associated with assets or businesses acquired. Any failure by Statoil to successfully pursue and exploit new business opportunities could result in financial losses and inhibit growth. Any such new projects Statoil acquires will require additional capital expenditure and will increase the cost of its discoveries and development. These projects may also have different risk profiles than Statoil's existing portfolio. These and other effects of such acquisitions could result in Statoil having to revise either or both of Statoil's forecasts with respect to unit production costs and production.
In addition, the pursuit of acquisitions or new business opportunities could divert financial and management resources away from Statoil's day-to-day operations to the integration of acquired operations or properties. Statoil may require additional debt or equity financing to undertake or consummate future acquisitions or projects, and such financing may not be available on terms satisfactory to Statoil, if at all, and it may, in the case of equity, be dilutive to Statoil's earnings per share.
The profitability of Statoil’s oil and gas production may be affected by limited transportation infrastructure when a field is in a remote location.
Statoil's ability to exploit economically any discovered petroleum resources beyond its proved reserves will depend, among other factors, on the availability of the infrastructure required to transport oil and gas to potential buyers at a commercially acceptable price. Oil is transported by vessels, rail or pipelines to refineries, and natural gas is usually transported by pipeline or by vessels (for liquid natural gas) to processing plants and end users. Statoil may not be successful in its efforts to secure transportation and markets for all of its potential production.
Statoil is exposed to security threats on its digital infrastructure that could harm its operations.
Statoil’s information security barriers protect its information systems from being compromised by unauthorised parties. Failure to maintain and develop these barriers may affect the confidentiality, integrity and availability of its information systems, including those critical to Statoil’s operations. Threats to
Statoil, Annual Report on Form 20-F 201491
information security are not limited by geography as Statoil’s digital infrastructure is accessible globally, and incidents in recent years have shown that parties who are able to circumvent information security barriers are capable and willing to perform attacks that destroy, disrupt or otherwise compromise information systems. Such attacks could result in significant financial damage to Statoil.
Some of Statoil's international interests are located in regions where political, social and economic instability could adversely impact Statoil’s business.
Statoil has assets and operations located in politically, socially and economically diverse regions around the world where potential developments such as expropriation, nationalisation of property, unilateral change of contracts or regulations, civil strife, strikes, political unrest, war, terrorism, border disputes, guerrilla activities, insurrections, piracy and the imposition of international sanctions or other events could occur. Political risks and security threats require continuous monitoring. Adverse and hostile actions against Statoil's staff, its facilities, its transportation systems and its digital infrastructure (cybersecurity) could cause harm to people and disrupt Statoil's operations and further business opportunities in these or other regions, lead to a decline in production and otherwise adversely affect Statoil's business. This could have a materially adverse effect on Statoil's results of operations and its financial condition.
Statoil's operations are subject to dynamic political and legal factors in the countries in which it operates.
Statoil has assets in a number of countries with emerging or transitioning economies that, in part or in whole, lack well-functioning and reliable legal systems, where the enforcement of contractual rights is uncertain or where the governmental and regulatory framework is subject to unexpected change. Statoil's exploration and production activities in these countries are often undertaken together with national oil companies and are subject to a significant degree of state control. In recent years, governments and national oil companies in some regions have begun to exercise greater authority and impose more stringent conditions on companies engaged in exploration and production activities. Intervention by governments in such countries can take a wide variety of forms, including:
·restrictions on exploration, production, imports and exports;
·the awarding or denial of exploration and production interests;
·the imposition of specific seismic and/or drilling obligations;
·price and exchange controls;
·tax or royalty increases, including retroactive claims;
·nationalisation or expropriation of Statoil's assets;
·unilateral cancellation or modification of Statoil's licence or contractual rights;
·the renegotiation of contracts;
·payment delays; and
·currency exchange restrictions or currency devaluation.
The likelihood of these occurrences and their overall effect on Statoil vary greatly from country to country and are hard to predict. If such risks materialise, they could cause Statoil to incur material costs and/or cause Statoil's production to decrease, potentially having a materially adverse effect on Statoil's operations or financial condition.
The renewable sector will continue to experience increased investment but is dependent on future government support.
Policy initiatives in the European market have led to increased investment in renewable energy, primarily in solar and wind power.
Although investment in renewable energy sources is increasing in both North American and Asian markets, effects on the markets in those regions are expected to be more modest than in Europe.
Statoil's current focus in the renewable energy sector is on developing offshore wind projects in north-western Europe. Government support policies to encourage the development of renewable energy sources play a significant role in fostering growth in the sector. Shifts in government policy toward renewable energy, or offshore wind power in particular, could lead Statoil to modify its strategy for new projects in the renewable energy sector.
Statoil is exposed to potentially adverse changes in the tax regimes of each jurisdiction in which Statoil operates.
Statoil has business operations in many countries around the world, and any of these countries could modify its tax laws in ways that would adversely affect Statoil. Most of Statoil's operations are subject to changes in tax regimes in a similar manner to other companies in Statoil's industry. In addition, in the long term, the marginal tax rate in the oil and gas industry tends to change with the price of crude oil. Significant changes in the tax regimes of countries in which Statoil operates could have a material adverse effect on its liquidity and results of operations.
Statoil faces foreign exchange risks that could adversely affect the results of Statoil’s operations.
Statoil's business faces foreign exchange risks because a large percentage of its revenues and cash receipts are denominated in USD, while sales of gas and refined products can be in a variety of currencies, and Statoil pays dividends and a large part of its taxes in NOK. Fluctuations between the USD and other currencies may adversely affect Statoil's business and can give rise to foreign exchange exposures, with a consequent impact on underlying costs and revenues.
Statoil is exposed to risks relating to trading and supply activities.
Statoil is engaged in substantial trading and commercial activities in the physical markets. Statoil also uses financial instruments such as futures, options, over-the-counter (OTC) forward contracts, market swaps and contracts for differences related to crude oil, petroleum products, natural gas and electricity
92Statoil, Annual Report on Form 20-F 2014
in order to manage price volatility. Statoil also uses financial instruments to manage foreign exchange and interest rate risk. Although Statoil believes it has established appropriate risk management procedures, trading activities involve elements of forecasting, and Statoil bears the risk of market movements, the risk of losses if prices develop contrary to expectations, and the risk of default by counterparties.
Non-compliance with anti-bribery, anti-corruption and other applicable laws, including failure to meet Statoil’s ethical requirements exposes Statoil to legal liability and damage to its reputation, business and shareholder value.
Statoil's code of conduct, which applies to all employees of the Group including, hired personnel and others who work for or act on Statoil's behalf, defines Statoil's commitment to high ethical standards and compliance with applicable legal requirements wherever Statoil operates. Incidents of ethical misconduct or non-compliance with applicable laws and regulations could be damaging to Statoil's reputation, competitiveness and shareholder value. Multiple events of non-compliance could call into question the integrity of Statoil's operations.
Statoil sets itself high standards of corporate citizenship and aspire to contribute to a better quality of life through the products and services the company provides. If it is perceived that Statoil is not respecting or advancing the economic and social progress of the communities in which Statoil operates, Statoil's reputation and shareholder value could be damaged.
Statoil’s insurance coverage may not provide adequate protection.
Statoil maintains insurance coverage that includes coverage for physical damage to its oil and gas properties, third-party liability, workers' compensation and employers' liability, general liability, sudden pollution and other coverage. Statoil's insurance coverage includes deductibles that must be met prior to recovery. In addition, Statoil's insurance is subject to caps, exclusions and limitations, and there is no assurance that such coverage will adequately protect Statoil against liability from all potential consequences and damages.
Statoil's efficiency change agenda may impact the development of Statoil's business and its financial results.
In 2014, Statoil announced an extensive efficiency change agenda in order to improve efficiency across the organisation. Two programmes were launched, the Statoil Technical Efficiency Programme (STEP) and the organisational efficiency programme (OE). There is a risk that Statoil may not be able to define and implement the activities under the efficiency agenda to achieve the level of cost savings or that the achievement of such cost savings can be accomplished without adversely affecting Statoil's other business goals.
In addition, while Statoil has implemented mitigating actions to reduce the risk of uncoordinated and inconsistent timelines and people processes and to ensure leadership competence and confidence in change management, there is a risk when implementing such substantial efficiency proposals over a multi-year period that such implementation may affect motivation, engagement and health among employees and leaders. The failure to successfully implement the efficiency targets may result in an adverse impact on the development of Statoil's business and its financial results.
Statoil may fail to attract and retain senior management and skilled personnel.
Failure to secure the right level of competence and capacity in the organisation through internal deployment/mobility, as well as failing to attract and retain senior leaders and skilled personnel could have a significant adverse impact on Statoil's ability to operate.
Statoil’s activities in certain countries may be affected by international sanctions.
Statoil, like other major international energy companies, has a geographically diverse portfolio of reserves and operational sites, which may expose its business and financial affairs to political and economic risks, including operations in areas subject to international sanctions or with sanctioned entities.
Russia
Statoil holds a 30 per cent non-operating interest in a production sharing agreement related to the Kharyaga field in the Nenets Autonomous Area in the Russian Federation. The Kharyaga field produces conventional oil from the Timan Pechora basin onshore in North West Russia. Oil production commenced in October 1999 with Total as project operator.
Statoil is further engaged in a strategic cooperation with Rosneft Oil Company (Rosneft) including a joint cooperation project aimed at undertaking seismic surveys and geological exploration, appraisal, development and production of potential hydrocarbons in four licences on the Russian continental shelf - the Magadan 1, Lisyansky and Kashevarovsky licences in the Sea of Okhotsk (south of the Arctic Circle), and the Perseevsky licence in the Barents Sea (north of the Arctic Circle). Additionally there are two joint cooperation projects onshore – the onshore heavy oil reservoir layer PK1 in the North Komsomolsky discovery, and the Domanik Sediments Difficult-to-Extract Hydrocarbons Project in the Russian Volga-Urals basin. For each of these projects, Rosneft holds the majority interest, while Statoil holds a minority interest.
Sanctions imposed by Norway, the EU and the US target, among others Russia’s financial and energy sectors, including certain companies such as Rosneft and various affiliates, and certain activities related to oil exploration and production in the Arctic offshore area, and in deepwater or shale formation projects. Certain aspects of those measures affect Statoil’s business activities in Russia. Statoil has received certain authorisations from the Norwegian authorities to continue its participation in the projects described above. However, the continued progress and financing of the joint projects are also, in part, dependent on obtaining further governmental authorisations and clarifications. Statoil continues to pursue the above-described projects within the limitations of current sanctions. However, due to current and possible future sanctions, there is no certainty that the projects can be progressed and concluded as initially planned. Moreover, Statoil is currently also partaking in trading and marketing activity involving certain sanctioned targets, for example, Surgutneftegas and/or Novatek, in each case in a manner which is in compliance with EU and US sanctions laws.
Statoil, Annual Report on Form 20-F 201493
Iran and Cuba
Certain countries, including Iran and Cuba, have been identified by the US government as state sponsors of terrorism.
In October 2002, Statoil signed a participation agreement with Petropars of Iran. Based on this agreement, Statoil assumed the operatorship for the offshore part of phases 6, 7 and 8 of the South Pars gas development project in the Persian Gulf. Statoil's investment in South Pars is fully depreciated and the net book value was zero as of 31 December 2012.
Through a merger in 2007 with Norsk Hydro's oil and gas business, Statoil became owner of a 75 % interest in the Anaran Block in Iran (acquired by Norsk Hydro in 2000). Work on the Anaran project was stopped in 2008, and in September 2011 Statoil signed a settlement agreement to close the exploration service contract and Statoil's rights reverted to the National Iranian Oil Company (NIOC). As a result of the same merger with Norsk Hydro Statoil also became the owner and operator of a 100% interest in the Khorramabad exploration block. In September 2006, Norsk Hydro signed the Khorramabad exploration and development contract with NIOC. The gathering of seismic data in the Khorramabad exploration block was completed in the fourth quarter of 2008 after which the licence expired in November 2010.
Statoil’s cost recovery relating to South Pars phases 6, 7 and 8 and the Anaran Block was completed in 2012, except for the recovery of paid taxes and obligations to the Iranian Social Security Organisation (SSO). Statoil settled its remaining minimum obligations under the Khorramabad exploration and development contract against the cost recovery in respect of the Anaran Block.
In 2009, Statoil voluntarily provided officials from the US State Department with information about its activities and investments in Iran. On 30 October 2010, the US State Department announced that under the Comprehensive Iran Sanctions, Accountability and Divestment Act of 2010 (CISADA), Statoil was eligible to avoid retaliatory measures relating to its activities in Iran, because Statoil had pledged to end its investments in Iran's energy sector.
Since 2010, additional international (including EU and US) sanctions against Iran have been adopted which together form a complex set of restrictions. Over the same period, Statoil has informed the US Department of State and the Norwegian Ministry of Foreign Affairs (MFA) of its efforts to close out Iran-related activities. The Norwegian MFA has also on several occasions approved specific transactions relating to Statoil's cost recovery activity to settle outstanding matters in Iran.
Statoil closed its office in Tehran in July 2013. However, due to local legal requirements, Statoil still has branch offices of Norwegian subsidiaries registered in Tehran.
During 2014, Statoil has continued to make efforts consistent with applicable sanctions to settle the outstanding tax and social security obligations and recovery rights related to the above mentioned projects. It is expected that these efforts will still need to be continued for some time. All social security and tax payments, as well as payments of minor running costs in Iran during 2014, have been made from Statoil's remaining funds in Iran. Statoil is not involved in any other activities in Iran. Statoil will not make any new or additional investments in Iran under the present circumstances.
A company found to have violated US sanctions against Iran could become subject to various types of sanctions, including (but not limited to) denial of US bank loans, restrictions on the importation of goods produced by the sanctioned entity, the prohibition on property transactions by the sanctioned entity in which the property is subject to the jurisdiction of the United States and prohibition of transfers of credit or payments via financial institutions in which the sanctioned entity has any interest.
Statoil has an interest in the Shah Deniz gas field in Azerbaijan in which Naftiran Intertrade Co. Ltd. (NICO) has a 10% interest. The Shah Deniz field is excluded, however, from the core EU sanctions restrictions related to Iran, and it falls within the exemption for certain natural gas projects under section 603 of Iran Threat Reduction and Syria Human Rights Act of 2012 (ITRA).
Statoil also previously held an interest in a deep-water exploration licence in Cuba. However, the licence was relinquished in 2013 and activity in Cuba related to the licence was completed by the end of 2013. Statoil has not been awarded any new licences in Cuba during 2014 and has no current plans to conduct any exploration, development or production activity in Cuba.
General
The legislation and rules governing sanctions are complex, constantly evolving and may not be consistent across jurisdictions. Changes in any of these laws or policies or the implementation thereof can be unpredictable. Statoil's business is dynamic and the above facts accordingly, may change over time. Moreover, the description does not fully reflect all parts of Statoil's business where a particular focus on sanctions compliance might be warranted. Lastly, it should be understood that Statoil in the future could also decide to take part in additional business activity also involving sanctioned targets in various parts of the world whilst still remaining compliant with applicable sanctions laws. Statoil is committed to doing business in compliance with all applicable laws, however there can be no assurance that Statoil or affiliates of Statoil or their respective officers, directors, employees or agents are not in violation of such laws. Any such violation could result in substantial civil and/or criminal penalties and might materially adversely affect Statoil's business and results of operations or financial condition.
Statoil are also aware of initiatives by certain US states and institutional investors, such as pension funds, to adopt or consider adopting laws, regulations or policies requiring, among other things, divestment from, reporting of interests in, or agreements not to make future investments in, companies that do business with countries that, among other things, are designated as state sponsors of terrorism. These policies could have an adverse impact on investments by certain investors in Statoil’s securities.
Disclosure Pursuant to Section 13(r) of the Exchange Act
The Iran Threat Reduction and Syria Human Rights Act of 2012 ("ITRA") created a new subsection (r) in Section 13 of the Exchange Act which requires a reporting issuer to provide disclosure if the issuer or any of its affiliates engaged in certain enumerated activities relating to Iran, including activities involving the Government of Iran. Statoil is providing the following disclosure pursuant to Section 13(r).
94Statoil, Annual Report on Form 20-F 2014
Statoil is a party to agreements with the National Iranian Oil Company (NIOC), namely, a Development Service Contract for South Pars Gas Phases 6, 7 & 8 (offshore part), an Exploration Service Contract for the Anaran Block and an Exploration Service Contract for the Khorramabad Block, which are located in Iran. Statoil's operational obligations under these agreements have terminated and the licenses have been abandoned.
The cost recovery program for these contracts was completed in 2012, except for the recovery of tax and obligations to the Social Security organization (SSO). Statoil's activity in Iran during 2014 was focused on a final settlement with the Iranian tax authorities and the SSO relating to the above mentioned agreements. During 2014 Statoil paid the equivalent of USD 0.34 million in tax and SSO to Iranian authorities in local currency (Iranian Rials), from which USD 0.07 million has been booked as expenses in 2014 and the rest have been reversed from previous years’ accruals. Also during 2014 Statoil paid USD 0.01 million stamp duty to Iran Tax Organization. The funds utilised for these purposes were held by Statoil in EN Bank (Iran).
The Statoil office in Iran was closed down end July 2013 and most of the furniture and other properties were sold during that period. During 2014, upon completion of required local Iranian Notary Public requirements, Statoil sold two motor vehicles and the amount of USD 0.07 million has been booked as revenue.
During 2014 Statoil also received the equivalent of USD 0.26 million as insurance payment related to its legacy South Pars business. Also this insurance payment has been booked as revenue in 2014.
Since 2009 Statoil has transparently and regularly provided information about its Iran related activity to the US State Department as well as to the Norwegian Ministry of Foreign Affairs. In a letter from the US State Department of November 1, 2010, Statoil was informed that the company was not considered to be a company of concern based on its previous Iran-related activities. Statoil is not involved in any other activities in Iran. Statoil will not make any investments in Iran under present circumstances.
Statoil generated no net profit from the aforementioned activity in 2014. Payments of the above mentioned nature are expected to be made also in 2015, in relation to Statoil’s continued winding-down efforts.
5.1.2 Legal and regulatory risks
This section discusses potential legal and regulatory risks related to the legal context of our business operations, such as having to comply with new laws and regulations.
Compliance with health, safety and environmental laws and regulations that apply to Statoil's operations could materially increase its costs. The enactment of such laws and regulations in the future is uncertain.
Statoil incurs, and expects to continue to incur, substantial capital, operating, maintenance and remediation costs relating to compliance with increasingly complex laws and regulations for the protection of the environment and human health and safety, including:
·costs as a result of stricter climate regulations and a higher price on greenhouse gas emissions;
·costs of preventing, controlling, eliminating or reducing certain types of emissions to air and discharges to the sea, including costs incurred in connection with government action to address the risk of spills and concerns about the impacts of climate change;
·remediation of environmental contamination and adverse impacts caused by Statoil's activities or accidents at various facilities owned or previously owned by Statoil and at third-party sites where Statoil's products or waste have been handled or disposed of;
·compensation of persons and/or entities claiming damages as a result of Statoil's activities or accidents; and
·costs in connection with the decommissioning of drilling platforms and other facilities.
For example, under the Norwegian Petroleum Act of 29 November 1996, as a holder of licences on the NCS, Statoil is subject to statutory strict liability in respect of losses or damage suffered as a result of pollution caused by spills or discharges of petroleum from petroleum facilities covered by any of Statoil's licences. This means that anyone who suffers losses or damage as a result of pollution caused by operations in any of Statoil's NCS licence areas can claim compensation from Statoil without having to demonstrate that the damage is due to any fault on Statoil's part.
Furthermore, in countries where Statoil operates or expects to operate in the near future, new laws and regulations, the imposition of stricter requirements on licences, increasingly strict enforcement of or new interpretations of existing laws and regulations, the aftermath of operational catastrophes in which Statoil or members of its industry are involved or the discovery of previously unknown contamination may require future expenditure in order to, among other things:
·modify operations;
·install pollution control equipment;
·implement additional safety measures;
·perform site clean-ups;
·curtail or cease certain operations;
·temporarily shut down Statoil's facilities;
·meet technical requirements;
·increase monitoring, training, record-keeping and contingency planning; and
·establish credentials in order to be permitted to commence drilling.
Statoil, Annual Report on Form 20-F 201495
Statoil continues to monitor and respond to regulatory changes in the USA following the BP Deepwater Horizon oil spill in the US Gulf of Mexico. Statoil has developed and implemented a safety and environmental management system (SEMS programme), and responded to revised federal drilling safety rules and workplace safety rules. In addition, Statoil participates in the Center for Offshore Safety's efforts, which are focused on improving offshore safety and industry standards. Statoil has experienced a lengthier approval process for drilling permits, approvals of exploration plans, and approvals of oil spill response plans compared with the pre-2010 permitting situation. Statoil has adjusted its permitting processes and is comfortable operating in the new regulatory environment. Although significant additional changes in permitting or regulations are not anticipated at this time, any such significant changes could require Statoil to incur significant costs. Any such changes, delays or recertification could have a material adverse effect on Statoil's operations, results or financial condition.
Compliance with laws, regulations and obligations relating to climate change and other environmental regulations could result in substantial capital expenditure, reduced profitability as a result of changes in operating costs, and adverse effects on revenue generation and strategic growth opportunities. Statoil expects emission costs to increase from current levels beyond 2020 and to have a significantly wider geographical range than today. Statoil regularly assesses how the development of (new) technologies and changes in regulations, including introduction of stringent climate policies, may impact the oil price, the costs of developing new oil and gas assets, and the demand for oil and gas.
The risk of “un-burnable carbon” and “stranded assets” has gained the attention of several of Statoil's stakeholders. The amount of hydrocarbons (oil, gas and coal) in place in various deposits throughout the world by far exceeds what is planned for commercial development and production. The debate on ‘“un-burnable carbon” relates to the limits, defined by science, to future emissions of greenhouse gases before we pass a critical threshold value for irrevocable climate change. Regulations and restrictions on greenhouse gases emissions may mean not all fossil fuels resources can be produced and burned. Statoil expects oil, and in particular gas, to be less impacted than coal in a carbon constrained world.
Many of Statoil's mature fields are producing increasing quantities of water with oil and gas. Statoil's ability to dispose of this water in environmentally acceptable ways may have an impact on its oil and gas production. Statoil's investments in North American onshore producing assets will be subject to evolving regulations which are common to all energy companies with investments in this region. This could affect Statoil's operations and profitability with respect to these operations. Statoil incorporates a cost for carbon in the assessment of all new projects. This guides Statoil's strategy and its investment decisions. For investment decisions pertaining to oil and gas projects in Norway, Statoil includes an internal cost of 65 USD per ton of CO2-equivalent (carbon dioxide and methane), based on the cost of the Norwegian CO2 tax. In 2014, Statoil began to apply an internal cost of 50 USD per ton of CO2-equivalent in its investment decisions for all new oil and gas projects outside of Norway.
If Statoil does not apply its resources to overcome the perceived trade-off between global access to energy and the protection or improvement of the natural environment, Statoil could fail to live up to its aspirations of zero or minimal damage to the environment and of contributing to human progress.
Statoil is exposed to risk of supervision, review and sanctions for violations of regulatory laws at the supranational and national level. These include; among others, competition and antitrust laws, financial regulations and technical and Health, Safety and Environment regulations.
Statoil's products are marketed and traded worldwide and therefore subject to competition and antitrust laws at the supranational and national level in multiple jurisdictions. Statoil is exposed to investigations from competition and antitrust authorities, and violations of the applicable laws and regulations may lead to substantial fines. In May 2013, the EFTA Surveillance Authority conducted an unannounced inspection at Statoil's main office in Stavanger, Norway, on behalf of the European Commission. The authorities suspected participation by several companies, including Statoil, in anti-competitive practices and/or market manipulation related to the Platts' Market-On-Close price assessment process. The investigation is not finalised and no conclusions have been made. The products in the scope of the investigation are traded worldwide.
Statoil is also exposed to financial review from financial supervisory authorities such as the Norwegian Financial Supervisory Authority (FSA) and the US Securities and Exchange Commission (the SEC). Reviews performed by these authorities could result in changes to previous accounts and future accounting policies. On 10 March 2014, the FSA concluded a review of Statoil's 2012 financial statements. Statoil has accepted two of the FSA's conclusions following this review but has appealed the third to the Norwegian Ministry of Finance.
Statoil is listed on both the Oslo Stock Exchange and New York Stock Exchange (NYSE), and is registered with the SEC. Statoil is required to comply with the continuing obligations of these regulatory authorities, and violation of these obligations may result in imposition of fines or other sanctions.
The Norwegian Petroleum Supervisor (Ptil) supervises all aspects of Statoil's operations, from exploration drilling through development and operation, to cessation and removal. Its regulatory authority covers the whole NCS as well as petroleum-related plants on land in Norway. Statoil is exposed to supervision from Ptil, and such supervision could result in audit reports, orders and investigations.
The formation of a competitive internal gas market within the European Union (EU) and the general liberalisation of European gas markets could adversely affect Statoil's business.
The continuing liberalisation of EU gas markets following legislative instruments rolled out in 2011 and the implementation of these legislative instruments by member states, could create new business opportunities for Statoil, but could also affect Statoil's market position or result in a reduction in prices in Statoil's gas sales contracts. Statoil's exposure to spot gas market prices has increased, correspondingly increasing its exposure to price volatility. Statoil continually monitors its contractual obligations and makes efforts to negotiate the most competitive pricing and other conditions available in the market.
The EU-wide quantity of carbon allowances issued each year under the Emission Trading Scheme (ETS) for greenhouse gas emission allowances began to decrease in a linear manner in 2013. The ETS can have a positive or negative impact on Statoil, depending on the price of carbon, which will consequently have an impact on the development of gas-fired power generation in the EU. Until now, the carbon price has been too low to replace coal with gas fired generation capacity. This effect has been worsened by heavy subsidising of renewables which has caused gas fired power plants to shut down. Current EU
96Statoil, Annual Report on Form 20-F 2014
climate and energy policies do not address this problem, but there is a tendency towards more market based subsidies in the new guidelines on environment and energy aid.
Political and economic policies of the Norwegian State could affect Statoil’s business
The Norwegian State plays an active role in the management of NCS hydrocarbon resources. In addition to its direct participation in petroleum activities through the State's direct financial interest (SDFI) and its indirect impact through legislation, such as tax and environmental laws and regulations, the Norwegian State, among other things, awards licences for reconnaissance, production and transportation, approves exploration and development projects and applications for production rates for individual fields and may, if important public interests are at stake, also instruct Statoil and other oil companies to reduce petroleum production. Furthermore, in the production licences in which the SDFI holds an interest, the Norwegian State has the power to direct petroleum licences' actions in certain circumstances.
If the Norwegian State were to take additional action under its activities on the NCS or to change laws, regulations, policies or practices relating to the oil and gas industry, Statoil's NCS exploration, development and production activities and the results of its operations could be affected.
5.1.3 Risks related to state ownership
This section discusses some of the potential risks relating to our business that could derive from the Norwegian State's majority ownership and from our involvement in the SDFI.
The interests of our majority shareholder, the Norwegian State, may not always be aligned with the interests of our other shareholders, and this may affect our decisions relating to the Norwegian continental shelf (NCS).
The Norwegian Parliament, known as the Storting, and the Norwegian State have resolved that the Norwegian State's shares in Statoil and the SDFI's interest in NCS licences must be managed in accordance with a coordinated ownership strategy for the Norwegian State's oil and gas interests. Under this strategy, the Norwegian State has required Statoil to continue to market the Norwegian State's oil and gas together with Statoil's own oil and gas as a single economic unit.
Pursuant to this coordinated ownership strategy, the Norwegian State requires Statoil, in its activities on the NCS, to take account of the Norwegian State's interests in all decisions that may affect the development and marketing of Statoil's own and the Norwegian State's oil and gas.
The Norwegian State directly held 67% of Statoil's ordinary shares as of 31 December 2014. Based on the Norwegian Public Limited Companies Act, the Norwegian State effectively has the power to influence the outcome of any vote of shareholders due to the percentage of Statoil's shares it owns, including amending its articles of association and electing all non-employee members of the corporate assembly. The employees are entitled to be represented by up to one-third of the members of the board of directors and one-third of the corporate assembly.
The corporate assembly is responsible for electing Statoil's board of directors. It also makes recommendations to the general meeting concerning the board of directors' proposals relating to the company's annual accounts, balance sheet, allocation of profit and coverage of loss. The interests of the Norwegian State in deciding these and other matters and the factors it considers when casting its votes, especially under the coordinated ownership strategy for the SDFI and Statoil's shares held by the Norwegian State, could be different from the interests of Statoil's other shareholders.
If the Norwegian State's coordinated ownership strategy is not implemented and pursued in the future, then Statoil's mandate to continue to sell the Norwegian State's oil and gas together with its own oil and gas as a single economic unit is likely to be prejudiced. Loss of the mandate to sell the SDFI's oil and gas could have an adverse effect on Statoil's position in the markets in which it operates.
For further information about the mandate to sell the Norwegian State's oil and gas, see the section Business overview - Applicable laws and regulations - SDFI oil and gas marketing and sale.
Statoil, Annual Report on Form 20-F 201497
5.2 Risk management
Our overall risk management approach includes identifying, evaluating and managing risk in all our activities. In order to achieve optimal corporate solutions, we base our risk management on an enterprise-wide risk management approach.
5.2.1 Managing operational risk
We manage risk in order to ensure safe operations and to achieve our corporate goals in compliance with our requirements.
Statoil defines risk as a deviation from a specified reference value and the uncertainty associated with it. A positive deviation is defined as an upside risk, while a negative deviation is a downside risk. The reference value is an expectation - most commonly a forecast, percentile or target. We have an enterprise risk management (ERM) approach, which means that we:
·have a risk and reward focus at all levels of the organisation,
·evaluate significant risk exposure relating to major commitments, and
·manage and coordinate risk at the corporate level.
All risks are related to Statoil's value chain, which denotes the value that is added in each step - from access, maturing, project execution and operation to market. In addition to the economic impact these risks could have on Statoil's cash flows, we also try to avoid HSE and integrity-related incidents (such as accidents, fraud and corruption). Most of the risks are managed by our principal business area line managers. Some operational risks are insurable and insured by our captive insurance company operating in the Norwegian and international insurance markets.
Our corporate risk committee (CRC) is headed by our chief financial officer and its members include representatives of our principal business areas. It is an enterprise risk management advisory body that primarily advises the chief financial officer, but also the business areas' management on specific issues. The CRC assesses and advises on measures aimed at managing the overall risk to the group, and it proposes appropriate measures to adjust risk at the corporate level. The CRC is also responsible for reviewing and developing our risk policies. The committee meets regularly during the year to support our risk management strategies, including hedging and trading strategies, as well as risk management methodologies. It regularly receives risk information that is relevant to the company from our corporate risk department.
We have developed policies aimed at managing the financial volatility inherent in some of our business exposures. In accordance with these policies, we enter into various financial and commodity-based transactions (derivatives). While the policies and mandates are set at the company level, the business areas responsible for marketing and trading commodities are also responsible for managing commodity-based price risks. Interest, liquidity, liability and credit risks are managed by the company's central finance department.
The following section describes in some detail the market risks to which we are exposed and how we manage these risks.
5.2.2 Managing financial risk
The results of our operations depend on a number of factors, most significantly those that affect the price we receive in Norwegian kroner (NOK) for our products.
The factors that influence the results of our operation include: the level of crude oil and natural gas prices, trends in the exchange rate between the US dollar (USD), in which the trading price of crude oil is generally stated and to which natural gas prices are frequently related, and NOK, in which our accounts are reported and a substantial proportion of our costs are incurred; our oil and natural gas production volumes, which in turn depend on entitlement volumes under PSAs and available petroleum reserves, and our own, as well as our partners' expertise and cooperation in recovering oil and natural gas from those reserves; and changes in our portfolio of assets due to acquisitions and disposals.
Our results will also be affected by trends in the international oil industry, including possible actions by governments and other regulatory authorities in the jurisdictions in which we operate, or possible or continued actions by members of the Organization of Petroleum Exporting Countries (Opec) that affect price levels and volumes, refining margins, the cost of oilfield services, supplies and equipment, competition for exploration opportunities and operatorships, and deregulation of the natural gas markets, all of which may cause substantial changes to existing market structures and to the overall level and volatility of prices.
98Statoil, Annual Report on Form 20-F 2014
The following table shows the yearly averages for quoted Brent Blend crude oil prices, natural gas average sales prices, refining reference margins and the USDNOK exchange rates for 2013, 2012 and 2011.
Yearly average | 2014 | 2013 | 2012 | | | | | Crude oil (USD/bbl Brent blend) | 98.9 | 108.7 | 111.5 | Average invoiced gas prices - Europe (NOK/scm) | 2.28 | 2.45 | 2.44 | Refining reference margin (USD/bbl) | 4.7 | 4.1 | 5.5 | USDNOK average daily exchange rate | 6.30 | 5.88 | 5.82 |
The illustration shows the indicative full-year effect on the financial result for 2015 given certain changes in the crude oil price, natural gas contract prices and the USD/NOK exchange rate. The estimated price sensitivity of our financial results to each of the factors has been estimated based on the assumption that all other factors remain unchanged.
Significant downward adjustments of Statoil’s commodity price assumptions will result in impairment losses on certain producing and development assets in the portfolio. Subsequent to year end 2014, commodity prices have continued to be volatile. See Note 11 Property, plant and equipment and note 12 Intangible assets to the Consolidated financial statements for sensitivity analysis related to impairment losses.
Our oil and gas price hedging policy is designed to support our long-term strategic development and our attainment of targets by protecting financial flexibility and cash flows.
Fluctuating foreign exchange rates can have a significant impact on our operating results. Our revenues and cash flows are mainly denominated in or driven by USD, while our operating expenses and income taxes payable largely accrue in NOK. We seek to manage this currency mismatch by issuing or swapping non-current financial debt in USD. This long-term funding policy is an integrated part of our total risk management programme. We also engage in foreign currency management in order to cover our non-USD needs, which are primarily in NOK. In general, an increase in the value of USD in relation to NOK can be expected to increase our reported earnings.
Historically, our revenues have largely been generated by the production of oil and natural gas on the NCS. Norway imposes a 78% marginal tax rate on income from offshore oil and natural gas activities (a symmetrical tax system). See the section Business overview -Applicable laws and regulations - Taxation of Statoil.
Our earnings volatility is moderated as a result of the significant proportion of our Norwegian offshore income that is subject to a 78% tax rate in profitable periods, and the significant tax assets generated by our Norwegian offshore operations in any loss-making periods. Most of the taxes we pay are paid to the Norwegian State. Dividends received in Norway are 97% exempt from tax, with the remaining 3% taxed at the ordinary rate of 27%. For dividends received from companies in a low-tax jurisdiction within the European Economic Area (EEA), the 97% exemption only applies if real business activities are conducted in that jurisdiction. Dividends received from companies in non-EEA countries are 97% exempt if the Norwegian recipient has held at least 10% of the shares for a minimum of two years and the foreign country is not a low-tax jurisdiction.
Government fiscal policy is an issue in several of the countries in which we operate, such as, but not limited to, Algeria, Angola, Nigeria, the USA and Venezuela. For instance, government fiscal policy could require royalties in cash or in kind, increased tax rates, increased government participation and changes in terms and conditions as defined in various production or income-sharing contracts. Our financial statements are based on currently enacted regulations and on any current claims from tax authorities regarding past events. Developments in government fiscal policy may have a negative effect on future net income.
Financial risk management
Statoil's business activities naturally expose the group to financial risk. The group's approach to risk management includes identifying, evaluating and managing risk in all activities using a top-down approach for the purpose of avoiding sub-optimisation and utilising correlations observed from a group perspective. Summing up the different market risks without including the correlations will overestimate our total market risk. For this reason, the company utilises correlations between all of the most important market risks, such as oil and natural gas prices, product prices, currencies and interest rates, to calculate the overall market risk and thereby utilise the natural hedges embedded in our portfolio. This approach also reduces the number of unnecessary transactions, which reduces transaction costs and avoids sub-optimisation.
In order to achieve the above effects, the company has centralised trading mandates (financial positions taken to achieve financial gains, in addition to established policies) so that all major/strategic transactions are coordinated through our corporate risk committee (CRC). Local trading mandates are therefore relatively small.
Statoil's activities expose the company to the following financial risks: market risks (including commodity price risk, interest rate risk and currency risk), liquidity risk and credit risk. See note 5 to the Consolidated financial statements, Financial risk management, for a discussion of financial risk management.
Statoil, Annual Report on Form 20-F 201499
5.2.3 Disclosures about market risk
Statoil uses financial instruments to manage commodity price risks, interest rate risks, currency risks and liquidity risks. Significant amounts of assets and liabilities are accounted for as financial instruments.
See note 25 Financial instruments: fair value measurement and sensitivity analysis of market risk to the Consolidated financial statements, for details of the nature and extent of such positions, and for qualitative and quantitative disclosures of the risks associated with these instruments.
5.3 Legal proceedings
We are involved in a number of judicial, regulatory and arbitration proceedings concerning matters arising in connection with the conduct of our business.
We are currently not aware of any legal proceedings or claims that we believe may have, or have had in the recent past, individually or in the aggregate, significant effects on our financial position or profitability or on the results of our operations or liquidity (see also note 23 Other commitments and
contingencies in Consolidated financial statements).
100Statoil, Annual Report on Form 20-F 2014
6 Shareholder information
Statoil is the largest company listed on the Oslo stock exchange (Oslo Børs), where it trades under the ticker code STL. Statoil is also listed on the New York Stock Exchange under the ticker code STO.
STATOIL SHARE | 2014 | 2013 | 2012 | 2011 | 2010 | | | | | | | | Shareprice STL (low) (NOK) | 120.00 | 147.70 | 162.40 | 160.50 | 149.20 | Shareprice STL (average) (NOK) | 166.41 | 123.00 | 133.80 | 113.70 | 117.60 | Shareprice STL (high) (NOK) | 194.80 | 136.72 | 146.97 | 139.60 | 131.80 | Shareprice STL (year-end) (NOK) | 131.20 | 147.00 | 139.00 | 153.50 | 138.60 | | | | | | | | Market value year-end (NOK billion) | 418 | 468 | 443 | 490 | 442 | Daily turnover (million shares) | 3.7 | 3.0 | 4.3 | 8.9 | 9.7 | | | | | | | | Ordinary earnings per share (EPS) (NOK) | 6.87 | 12.50 | 21.60 | 24.70 | 11.94 | P/E (1) | 19.10 | 11.76 | 6.44 | 6.21 | 11.61 | | | | | | | | Ordinary dividend per share (NOK) (2) | 7.20 | 7.00 | 6.75 | 6.50 | 6.25 | Growth in ordinary dividend per share (3) | 2.9% | 3.7% | 3.8% | 4.0% | 4.2% | Dividend per share (USD) (4) | 0.97 | 1.15 | 1.21 | 1.08 | 1.07 | Pay-out ratio (5) | 105% | 56% | 31% | 26% | 52% | Dividend yield (6) | 5.5% | 4.8% | 4.9% | 4.2% | 4.5% | | | | | | | | Ordinary shares outstanding, weighted average | 3,179,958,780 | 3,180,683,828 | 3,181,546,060 | 3,182,112,843 | 3,182,574,787 | Ordinary shares outstanding, year-end | 3,188,647,103 | 3,188,647,103 | 3,188,647,103 | 3,188,647,103 | 3,188,647,103 | | | | | | | | 1) | Share price at year-end divided by EPS. | 2) | Proposed cash dividend for 2014. | 3) | Excluding special dividend and share buy-back. | 4) | The USD amounts are based on the Norwegian Central Bank’s exchange rate at 31 December. | 5) | Total dividend paid per share divided by EPS. | 6) | Total dividend paid per share divided by year-end share price. |
Statoil, Annual Report on Form 20-F 2014101
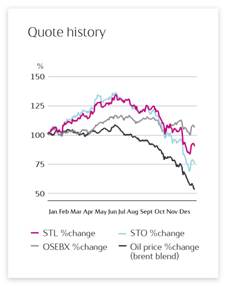
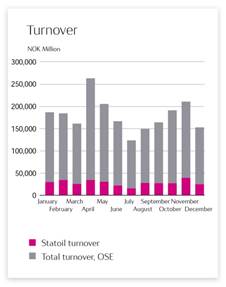
| As of 31 December 2014, Statoil represented 23.3% of the total value of all companies registered on the Oslo stock exchange, with a market value of NOK 418 billion.
Statoil's share price closed at NOK 131.20 at the end of 2014.
Taking into consideration the total dividend paid out in 2014 of NOK 10.6 per share, which includes the annual dividend for 2013 of NOK 7.00 per share and the two quarterly dividends paid for 1Q 2014 and 2Q 2014 of NOK 3.60 per share (NOK 1.80 each), the total return was negative NOK 5.00 per share. The graph above, "Quote history", shows the development of the Statoil share price compared to the oil price and the Oslo Stock Exchange Benchmark Index (OSEBX). The board of directors proposes a dividend of NOK 1.80 per share for 4Q 2014, making the dividend payments for all four quarters in 2014 NOK 7.20 per share, for approval by the annual general meeting on 19 May 2015. The dividend of NOK 7.20 per share is equivalent to a direct yield of approximately 5.5%, and it represents 104% of our net income from 2014. Diluted earnings per share amounted to NOK 6.87, a decrease of 45% compared to 2013.
The turnover of shares is a measure of traded volumes. On average, 3.7 million Statoil shares were traded on the Oslo stock exchange every day in 2014 compared to 3.0 million shares in 2013. In 2014, Statoil shares accounted for 12% of the total market value traded throughout the year (see illustration), compared to 12% in 2013.
Statoil ASA has one class of shares, and each share confers one vote at the general meeting. Statoil ASA had 3,179,958,780ordinary shares outstanding at year end.
As of 31 December 2014, Statoil had 92,692 shareholders registered in the Norwegian Central Securities Depository (VPS), down from 97,373 shareholders at 31 December 2013.
|
102Statoil, Annual Report on Form 20-F 2014
6.1 Dividend policy
It is Statoil's ambition to grow the annual cash dividend measured in NOK per share in line with long-term underlying earnings.
In 2014 Statoil implemented quarterly dividend payments. The board approves 1Q -3Q interim dividends, based on an authorisation from the annual general meeting (AGM), while the AGM approves the 4Q dividend based on a proposal from the board. The shareholders at the AGM may vote to reduce, but may not increase, the 4Q dividend proposed by the board of directors. It is Statoil’s intention to have this authorisation approved at the AGM. Statoil announces dividend payments in connection with quarterly results. Payment of quarterly dividends is expected to take place approximately four months after the announcement of each quarterly dividend. Hence, in 2014 Statoil paid the 2013 annual dividend and two quarterly dividends.
The board of directors updated the dividend policy in 2014 to reflect the quarterly payment frequency, as follows:
It is Statoil's ambition to grow the annual cash dividend, measured in NOK per share, in line with long term underlying earnings. Statoil announces dividends on a quarterly basis. The board approves 1Q -3Q interim dividends based on an authorisation from the general meeting, while the annual general meeting approves the 4Q (and total annual) dividend based on a proposal from the board. When deciding the interim dividends and recommending the total annual dividend level, the board will take into consideration expected cash flow, capital expenditure plans, financing requirements and appropriate financial flexibility. In addition to cash dividend, Statoil might buy back shares as part of total distribution of capital to the shareholders.
6.1.1 Dividends
In 2014 Statoil implemented quarterly dividend payments. In addition, the annual dividend for the fiscal year 2013 was declared at Statoil's annual general meeting in 2014.
Although we currently intend to pay quarterly dividends on our ordinary shares, we cannot give an assurance that dividends will be paid, or predict the amount of any dividends. Future dividends will depend on a number of factors prevailing at the time our board of directors considers any dividend payment. The following table shows the cash dividend amounts to all shareholders since 2010 on a per share basis and in aggregate.
| Ordinary dividend per share NOK | Ordinary dividend per share | Total | Fiscal year | 1Q | 2Q | 3Q | 4Q | NOK | NOK billion | | | | | | | | 2010 | | | | | 6.25 | 19.9 | 2011 | | | | | 6.50 | 20.7 | 2012 | | | | | 6.75 | 21.5 | 2013 | | | | | 7.00 | 22.3 | 2014 | 1.80 | 1.80 | 1.80 | 1.80 * | 7.20 | 22.9 | | | | | | | | * 4Q 2014 dividend is proposed dividend | | | | | | |
Statoil commenced quarterly dividends in 2014 and have distributed quarterly dividends for 1Q and 2Q in 2014. The 3Q dividend was paid on 27 February 2015. Payment date for ADR holders was 5 March 2015. The proposed 4Q 2014 dividend will be considered at the annual general meeting on 19 May 2015. The Statoil share will be traded ex dividend 20 May 2015 and if approved, the dividend will be disbursed 29 May 2015. For US ADR holders, the ex-dividend date will be 19 May 2015 and payment for ADR holders is expected to be 4 June 2015.
Since we will only pay dividends in Norwegian kroner (NOK), exchange rate fluctuations will affect the amounts in US dollars (USD) received by holders of ADRs after the ADR depositary converts cash dividends into USD. The depositary will convert the dividend into USD at the prevailing exchange rate for NOK and pay the US ADR holders the USD equivalent of the dividend in NOK, minus the prevailing bank charges.
Share repurchases
In addition to a cash dividend, Statoil may buy back shares as part of its total distribution of capital to its shareholders. For the period 2013-2014, the board of directors was authorised by the annual general meeting of Statoil to repurchase Statoil shares in the market for subsequent annulment. We have not undertaken any share repurchases based on this authorisation.
It is Statoil’s intention to renew this authorisation at the annual general meeting. Statoil intends to use share buybacks more actively going forward, based on balance sheet strength considerations
Statoil, Annual Report on Form 20-F 2014103
6.2 Shares purchased by issuer
Shares are acquired in the market for transfer to employees under the share savings scheme in accordance with the limits set by the board of directors. No shares were repurchased in the market for the purpose of subsequent annulment in 2014.
6.2.1 Statoil's share savings plan
Since 2004, Statoil has had a share savings plan for employees of the company. The purpose of this plan is to strengthen the business culture and encourage loyalty through employees becoming part-owners of the company.
Through regular salary deductions, employees can invest up to 5% of their base salary in Statoil shares. In addition, the company contributes 20% of the total share investment made by employees in Norway, up to a maximum of NOK 1,500 per year (approximately USD 200). This company contribution is a tax-free employee benefit under current Norwegian tax legislation. After a lock-in period of two calendar years, one extra share will be awarded for each share purchased. Under current Norwegian tax legislation, the share award is a taxable employee benefit, with a value equal to the value of the shares and taxed at the time of the award.
The board of directors is authorised to acquire Statoil shares in the market on behalf of the company. The authorisation may be used to acquire own shares for a total nominal value of up to NOK 27.5 million. Shares acquired under this authorisation may only be used for sale and transfer to employees of the Statoil group as part of the company's share savings plan as approved by the board of directors. The minimum and maximum amount that may be paid per share is NOK 50 and 500, respectively.
The authorisation is valid until the next annual general meeting, but not beyond 30 June 2015. This authorisation replaces the previous authorisation to acquire Statoil's own shares for implementation of the share savings plan granted by the annual general meeting on 14 May 2013.
The nominal value of each share is NOK 2.50. With a maximum overall nominal value of NOK 27.5 million, the authorisation for the repurchase of shares in connection with the group's share savings plan covers the repurchase of no more than 11 million shares.
Period in which shares were repurchased | Number of shares repurchased | Average price per share in NOK | Total number of shares purchased as part of programme | Maximum number of shares that may yet be purchased under the programme authorisation (1) | | | | | | | Jan-14 | 601,685 | 152.9055 | 5,307,275 | 5,692,725 | Feb-14 | 588,350 | 158.0552 | 5,895,625 | 5,104,375 | Mar-14 | 564,243 | 164.8224 | 6,459,868 | 4,540,132 | Apr-14 | 540,000 | 172.2220 | 6,999,868 | 4,000,132 | May-14 | 515,880 | 179.8861 | 7,515,748 | 3,484,252 | Jun-14 | 485,634 | 190.4724 | 485,634 | 10,514,366 | Jul-14 | 493,150 | 187.7686 | 978,784 | 10,021,216 | Aug-14 | 534,089 | 172.6302 | 1,512,873 | 9,487,127 | Sep-14 | 520,133 | 177.0701 | 2,033,006 | 8,966,994 | Oct-14 | 601,692 | 152.4867 | 2,634,698 | 8,365,302 | Nov-14 | 616,339 | 148.9440 | 3,251,037 | 7,748,963 | Dec-14 | 748,450 | 122.5197 | 3,999,487 | 7,000,513 | Jan-15 | 713,771 | 130.6301 | 4,713,258 | 6,286,742 | Feb-15 | 628,251 | 149.5611 | 5,341,509 | 5,658,491 | | | | | | | TOTAL | 8,151,667 (2) | 158.9419 (3) | | | | | | | | | (1) | The authorisation to repurchase a maximum of 11 million shares with a maximum overall nominal value of NOK 27.5 million for repurchase of shares in connection with the share savings plan was given by the annual general meeting on 14 May 2013. The authorisation was maintained by the annual general meeting on 14 May 2014 at a maximum of 11 million shares with a maximum overall nominal value of 27.5 million for repurchase of shares, valid until 30 June 2015. | (2) | All shares repurchased have been purchased in the open market and pursuant to the authorisation mentioned above. | (3) | Weighted average price per share. |
104Statoil, Annual Report on Form 20-F 2014
6.3 Information and communications
Updated information about Statoil's financial performance and future prospects forms the basis for assessing the value of the company.
Information provided to the stock market must be transparent and ensure equal treatment of all shareholders, and it must aim to provide shareholders with correct, clear, relevant and timely information that forms the basis for assessing the value of the company.
Statoil shares are listed on the Oslo stock exchange (Oslo Børs), and its American Depositary Receipts (ADRs) are listed on the New York Stock Exchange. We distribute share price-sensitive information through the international wire services, the Oslo stock exchange in Norway, the Securities and Exchange Commission in the US, and our website Statoil.com.
Our registrar manages our shares listed on the Oslo stock exchange on our behalf and provides the connection to the Norwegian Central Securities Depository (VPS). Important services provided by the registrar are investor services for private shareholders, the disbursement of dividends and assistance at our general meetings. DnB Bank is currently the account registrar for Statoil.
6.3.1 Investor contact
Our investor relations staff function (IR) coordinates the dialogue with our shareholders.
We place great emphasis on ensuring that relevant and timely information is distributed to the capital markets. Given the size and diversity of our shareholder base, the opportunities for direct shareholder interaction are limited. Our "Investor Centre" web pages are therefore specially designed for investors and analysts who wish to follow the company's progress - Statoil.com/IR.
We broadcast our quarterly presentations and other relevant presentations by management directly on the internet, and the related reports are made available together with other relevant information on our website.
Ticker Codes:
Oslo Stock Exchange: STL
New York Stock Exchange: STO
Reuters: STL.OL
Bloomberg: STL NO
Financial calendar for 2015
|
| 06 February
| Fourth quarter results and strategy update
| 19 March
| Publication annual report 2014
| 30 April
| First quarter 2015
| 19 May
| Annual general meeting
| 19 May
| 4Q 2014 ADS trading ex-dividend
| 20 May
| 4Q 2014 ordinary share trading ex-dividend
| 29 May
| 4Q 2014 ordinary share dividend payment
| 4 June
| 4Q 2014 ADS dividend payment
| 28 July
| Second quarter 2015
| 28 October
| Third quarter 2015
|
Statoil, Annual Report on Form 20-F 2014105
6.4 Market and market prices
The principal trading market for our ordinary shares is the Oslo stock exchange. The ordinary shares are also listed on the New York Stock Exchange, trading in the form of American Depositary Shares (ADS).
Statoil's shares have been listed on the Oslo stock exchange since our initial public offering on 18 June 2001. The ADSs traded on the New York Stock Exchange are evidenced by American Depositary Receipts (ADR), and each ADS represents one ordinary share. Statoil has a sponsored ADR facility with Deutsche Bank Trust Company Americas as depositary.
6.4.1 Share prices
These are the reported high and low quotations at market closing for the ordinary shares on the Oslo stock exchange and New York Stock Exchange for the periods indicated.
They are derived from the Oslo Stock Exchange Daily Official List, and the highest and lowest sales prices of the ADSs as reported on the New York Stock Exchange composite tape.
| NOK per ordinary share | | USD per ADS | Share price | High | Low | | High | Low | | | | | | | Year ended 31 December | | | | | | 2010 | 149.20 | 117.60 | | 26.47 | 18.68 | 2011 | 160.50 | 113.70 | | 29.58 | 20.16 | 2012 | 162.40 | 133.80 | | 28.92 | 22.15 | 2013 | 147.70 | 123.00 | | 27.00 | 20.14 | 2014 | 194.80 | 120.00 | | 31.91 | 15.82 | | | | | | | Quarter ended | | | | | | Sunday, March 31, 2013 | 146.90 | 140.50 | | 27.00 | 24.21 | Sunday, June 30, 2013 | 141.40 | 123.00 | | 24.58 | 24.16 | Monday, September 30, 2013 | 137.60 | 125.50 | | 23.09 | 20.43 | Tuesday, December 31, 2013 | 147.70 | 133.30 | | 24.18 | 22.23 | Monday, March 31, 2014 | 171.30 | 146.40 | | 28.51 | 23.37 | Monday, June 30, 2014 | 194.80 | 164.90 | | 31.91 | 27.60 | Tuesday, September 30, 2014 | 191.00 | 171.90 | | 31.01 | 26.93 | Wednesday, December 30, 2014 | 173.70 | 120.00 | | 26.79 | 15.82 | March, up until 12 March 2015 | 149.80 | 125.80 | | 19.62 | 16.33 | | | | | | | Month of | | | | | | September 2014 | 181.90 | 173.00 | | 29.15 | 26.93 | October 2014 | 173.70 | 146.00 | | 26.79 | 22.54 | November 2014 | 154.30 | 132.50 | | 22.61 | 19.11 | December 2014 | 135.00 | 120.00 | | 19.51 | 15.82 | January 2015 | 137.80 | 125.80 | | 18.05 | 16.33 | February 2015 | 149.80 | 135.00 | | 19.62 | 17.96 | March up until 12 March 2015 | 146.00 | 136.90 | | 18.69 | 16.76 |
106Statoil, Annual Report on Form 20-F 2014
6.4.2 Statoil ADR programme fees
Fees and charges payable by a holder of ADSs.
As depositary from 31 January 2013, Deutsche Bank Trust Company Americas collects its fees for the delivery and surrender of ADSs directly from investors depositing shares or surrendering ADSs for the purpose of withdrawal, or from intermediaries acting for them. The depositary collects fees from investors by deducting the fees from the amounts distributed or by selling a portion of distributable property to pay the fees. The depositary may refuse to provide fee-attracting services until its fees for those services are paid.
The charges of the depositary payable by investors are as follows:
Persons depositing or withdrawing shares must pay:
| For:
| | | USD 5.00 (or less) per 100 ADSs (or portion of 100 ADSs)
| ·Issuance of ADSs, including issuances resulting from a distribution of shares or rights or other property
| | ·Cancellation of ADSs for the purpose of withdrawal, including if the deposit agreement terminates
| | | USD 0.02(or less) per ADS, subject to the company's consent
| ·Any cash distribution to ADS registered holders
| | | USD 0.05 (or less) per ADS, subject to the company's consent
| ·For the operation and maintenance costs in administering the ADR program
| | | A fee equivalent to the fee that would be payable if securities distributed to you had been shares and the shares had been deposited for issuance of ADSs
| ·Distribution of securities distributed to holders of deposited securities which are distributed by the Depositary to ADS registered holders
| | | Registration or transfer fees
| ·Transfer and registration of shares on our share register to or from the name of the Depositary or its agent when you deposit or withdraw shares
| | | Expenses of the Depositary
| ·Cable, telex and facsimile transmissions (as provided in the deposit agreement)
| | ·Converting foreign currency to US dollars
| | | Taxes and other governmental charges the Depositary or the custodian have to pay on any ADS or share underlying an ADS, for example, stock transfer taxes, stamp duty or withholding taxes
| ·As necessary
| | | Any charges incurred by the Depositary or its agents for servicing the deposited securities
| ·As necessary
|
Reimbursements and payments made and fee waivers granted by the depositary
The depositary has agreed to reimburse certain company expenses related to the company's ADR programme and incurred by the company in connection with the programme. In the year ended 31 December 2014, the depositary reimbursed approximately USD 3 million to the company.
Category of expenses
| USD amount reimbursed for the year ended 31 December 2014
| |
|
| Total amount reimbursed
| 3,015,000
| | | | *
| In 2014, Statoil received a reimbursement payment from the Depositary of approximately USD 3 million in relation to certain expenses including investor relations expenses, expenses related to the maintenance of the ADR programme, legal counsel fees, printing, ADR certificates, etc.
|
Statoil, Annual Report on Form 20-F 2014107
The depositary has also agreed to waive fees for costs associated with the administration of the ADR programme, and it has paid certain expenses directly to third parties on behalf of the company. The expenses paid to third parties include expenses relating to reporting services and access charges to its online platform, re-registration costs borne by the custodian.
The table below sets forth the expenses that the depositary waived or paid directly to third parties in the year ended 31 December 2014:
| |
38Statoil, Annual Report on Form 20-F 2016
2.7 CORPORATE
APPLICABLE LAWS AND REGULATIONS
Statoil operates in more than 30 countries and is exposed to, and committed to compliance with, a number of laws and regulations globally.
This article focuses primarily on Norwegian laws specific for Statoil`s core activities, taking into account that the majority of Statoil’s production is produced on the NCS, the ownership structure of the company and that Statoil is registered and has its headquarters in Norway.
Norwegian petroleum laws and licensing system
The principal laws governing Statoil’s petroleum activities in Norway are the Norwegian Petroleum Act and the Norwegian Petroleum Taxation Act.
Norway is not a member of the European Union (EU), but Norway is a member of the European Free Trade Association (EFTA). The EU and the EFTA Member States have entered into the Agreement on the European Economic Area, referred to as the EEA Agreement, which provides for the inclusion of EU legislation in the national law of the EFTA Member States (except Switzerland). Statoil’s business activities are subject to both the EFTA Convention and EU laws and regulations adopted pursuant to the EEA Agreement.
For further information about the jurisdictions in which Statoil operates, see sections 2.2 Business overview and 2.10 Risk review.
Under the Petroleum Act, the Norwegian Ministry of Petroleum and Energy (“MPE”) is responsible for resource management and for administering petroleum activities on the NCS. The main task of the MPE is to ensure that petroleum activities are conducted in accordance with the applicable legislation, the policies adopted by the Norwegian Parliament (the Storting) and relevant decisions of the Norwegian State.
The Storting's role in relation to major policy issues in the petroleum sector can affect Statoil in two ways: firstly, when the Norwegian State acts in its capacity as majority owner of Statoil shares and, secondly, when the Norwegian State acts in its capacity as regulator:
·The Norwegian State's shareholding in Statoil is managed by the Ministry of Petroleum and Energy. The Ministry of Petroleum and Energy will normally decide how the Norwegian State will vote on proposals submitted to general meetings of the shareholders. However, in certain exceptional cases, it may be necessary for the Norwegian State to seek approval from the Storting before voting on a certain proposal. This will normally be the case if Statoil issues additional shares and such issuance would significantly dilute the Norwegian State's holding, or if such issuance would require a capital contribution from the Norwegian State in excess of government mandates. A decision by the Norwegian State to vote against a proposal on Statoil’s part to issue additional shares would prevent Statoil from raising additional capital in this manner and could adversely affect Statoil’s ability to pursue business opportunities. For more information about the Norwegian State's ownership, see Risks related to state ownership in section 2.10 Risk review and Major shareholders in section 5.1 Shareholder information
·The Norwegian State exercises important regulatory powers over Statoil, as well as over other companies and corporations on the NCS. As part of its business, Statoil or the partnerships to which Statoil is a party, frequently need to apply for licences and other approval of various kinds from the Norwegian State. Although Statoil is majority-owned by the Norwegian State, it does not receive preferential treatment with respect to licences granted by or under any other regulatory rules enforced by the Norwegian State
The principal laws governing Statoil’s petroleum activities in Norway and on the NCS are the Norwegian Petroleum Act of 29 November 1996 (the "Petroleum Act") and the regulations issued thereunder, and the Norwegian Petroleum Taxation Act of 13 June 1975 (the "Petroleum Taxation Act"). The Petroleum Act sets out the principle that the Norwegian State is the owner of all subsea petroleum on the NCS, that exclusive right to resource management is vested in the Norwegian State and that the Norwegian State alone is authorised to award licences for petroleum activities as well as determine its terms. Licensees are required to submit a plan for development and operation (PDO) to the Ministry of Petroleum and Energy for approval. For fields of a certain size, the Storting has to accept the PDO before it is formally approved by the Ministry of Petroleum and Energy. Statoil is dependent on the Norwegian State for approval of its NCS exploration and development projects and its applications for production rates for individual fields.
Production licences are the most important type of licence awarded under the Petroleum Act and are normally awarded for an initial exploration period, which is typically six years, but which can be shorter. The maximum period is ten years. During this exploration period, the licensees must meet a specified work obligation set out in the licence. If the licensees fulfil the obligations set out in the initial license period, they are entitled to require that the licence be prolonged for a period specified at the time when the licence is awarded, typically 30 years.
Category of expenses
| USD amount waived or paid for the year ended 31 December 2014
|
|
|
Total amount paid directly to third parties
| 265,270
|
Under certain circumstances, including removal of the depositary or termination of the ADR programme
Statoil, Annual Report on Form 20-F 201639
The terms of the production licences are decided by the company, the company is required to repay to the depositary amounts reimbursed and/or expenses paid to or on behalf of the company during the twelve-month period prior to notice of removal or termination.
6.5 Taxation
This section describes the material Norwegian tax consequences that apply to shareholders resident in Norway and to non-resident shareholders in connection with the acquisition, ownership and disposal of shares and ADSs.
Norwegian tax matters
This section does not provide a complete description of all tax regulations that might be relevant (i.e. for investors to whom special regulations may be applicable). This section is based on current law and practice. Shareholders should consult their professional tax adviser for advice about individual tax consequences.
Taxation of dividends
Corporate shareholders (i.e. limited liability companies and similar entities) residing in Norway for tax purposes are generally subject to tax in Norway on dividends received from Norwegian companies. The basis for taxation is 3% of the dividends received, which is subject to the standard 27% income tax rate.
Individual shareholders resident in Norway for tax purposes are subject to the standard 27% income tax rate in Norway for dividend income exceeding a basic tax free allowance. The tax free allowance is computed for each individual share on the basis of the cost price of that share multiplied by a risk-free interest rate. The risk-free interest rate will be calculated every income year. Any part of the calculated allowance for one year that exceeds the dividend distributed for the share ("unused allowance") may be carried forward and set off against future dividends received for (or gains upon the realisation of, see below) the same share. Any unused allowance will also be added to the basis for computation of the allowance for the same share the following year.
Non-resident shareholders are as a rule subject to withholding tax at a rate of 25% on dividends distributed by Norwegian companies. This withholding tax does not apply to corporate shareholders in the EEA area that document that they are genuinely established and carry on genuine economic business activity within the EEA area, provided that Norway is entitled to receive information from the state of residence pursuant to a tax treaty or other international treaty. If no such treaty exists with the state of residence, the shareholder may instead present confirmation issued by the tax authorities of the state of residence verifying the documentation. Individual shareholders resident for tax purposes in the EEA area may apply to the Norwegian tax authorities for a refund if the tax withheld by the distributing company exceeds the tax that would have been levied on individual shareholders resident in Norway.
The withholding rate of 25% is often reduced in tax treaties between Norway and other countries. Generally, the treaty rate does not exceed 15% and, in cases where a corporate shareholder holds a qualifying percentage of the shares of the distributing company, the withholding tax rate on dividends may be further reduced. The reduced withholding rate will generally only apply to dividends paid for shares held directly by holders who are able to properly demonstrate to the company that they are entitled to the benefits of the tax treaty. It is the responsibility of the distributing company to deduct the withholding tax when dividends are paid to non-resident shareholders.
The withholding tax rate in the tax treaty between the United States and Norway is currently 15% in all cases. Dividends paid to the depositary for redistribution to shareholders who hold American Depositary Shares (ADS) will in principle be subject to withholding tax of 25%. The beneficial owners will in this case have to apply to the Central Office - Foreign Tax Affairs (COFTA) for a refund of the excess amount of tax withheld.
108Statoil, Annual Report on Form 20-F 2014
An application for a refund of withholding tax from shareholders and ADS holders must contain the following:
1.Full name, address and tax identification number.
2.IBAN (International Bank Account Number) and SWIFT/BIC code for the bank account to which the refund is to be credited. COFTA also needs to know who the owner of the account is. The account must be able to accept NOK.
3.A specification of the distributing company(ies) involved, the exact number of shares, the date the dividend payments were made, the total dividend payment, the withholding tax deducted in Norway and what amount is being reclaimed. The withholding tax must be calculated in Norwegian currency and all sums specified accordingly (in NOK).
4.A certificate of residence issued by the tax authorities stating that the refund claimant was resident for tax purposes in that state in the income year in question or at the time the dividends were decided. This documentation must be in the original. If the claimant is an investment fund, the confirmation must solely mention the fund's name. A confirmation in the fund manager's name is not sufficient. The confirmation must be in the original.
5.Documentation showing that the refund claimant has received the dividends and the withholding tax rate used in Norway (a credit advice).
6.If the refund application is based on the particular rules applicable to EEA shareholders (i.e., the participation exemption method), the application must also contain the information required to determine whether these rules are applicable.
7.The information required to decide whether the refund claimant is the beneficial owner of the dividend payment(s).
8.If the securities are registered with a foreign custodian/bank/clearing house, the claimant must provide information about which foreign custodian/bank/clearing house the securities are registered with in Norway.
9.The application must be signed by the applicant. If someone else signs the application, a letter of authorisation must be enclosed. The claimant must also specifically confirm that the person signing the application is authorised to apply for a refund of withholding tax levied on those particular dividend payments. The application must therefore also be accompanied by a spreadsheet listing the names of the companies from which the dividends were received, the payment date, dividend payment, withheld tax and which amount is being reclaimed. This spreadsheet must be approved and signed by the claimant. It is not sufficient to only enclose a general letter of authorisation.
Deutsche Bank Trust Company Americas, acting as depositary, has been granted permission by the Norwegian tax authorities to receive dividends from us for redistribution to a beneficial owner of shares or ADSs at the applicable treaty withholding rate, if the beneficial holder has provided Deutsche Bank Trust Company Americas with appropriate documentation establishing such holder's eligibility for the benefits under the tax treaty with Norway.
Corporate shareholders that carry on business activities in Norway, and whose shares are effectively connected with such activities, are not subject to withholding tax. For such shareholders, 3% of the received dividends are subject to the standard 27% income tax rate.
Taxation on the realisation of shares
Corporate shareholders resident in Norway for tax purposes are not subject to tax in Norway on gains derived from the sale, redemption or other disposal of shares in Norwegian companies. Capital losses are not deductible.
Individual shareholders residing in Norway for tax purposes are subject to tax in Norway on the sale, redemption or other disposal of shares. Gains or losses in connection with such realisation are included in or deducted from the individual's ordinary taxable income in the year of disposal, and are subject to the standard 27% income tax rate.
The taxable gain or loss is calculated as the sales price adjusted for transaction expenses minus the taxable basis. A shareholder's tax basis is normally equal to the acquisition cost of the shares. Any unused allowance pertaining to a share may be deducted from a capital gain on the same share, but may not lead to or increase a deductible loss. Furthermore, any unused allowance may not be set off against gains from the realisation of the other shares.
If the shareholder disposes of shares acquired at different times, the shares that were first acquired will be deemed to be first sold (the "FIFO" principle) when calculating the taxable gain or loss.
A corporate shareholder or an individual shareholder who ceases to be tax resident in Norway due to domestic law or tax treaty provisions may, in certain circumstances, become subject to Norwegian exit taxation on capital gains related to shares.
Shareholders not residing in Norway are generally not subject to tax in Norway on capital gains, and losses are not deductible on the sale, redemption or other disposal of shares or ADSs in Norwegian companies, unless the shareholder carries on business activities in Norway and such shares or ADSs are or have been effectively connected with such activities.
Wealth tax
The shares are included in the basis for the computation of wealth tax imposed on individuals resident in Norway for tax purposes. Norwegian limited companies and certain similar entities are not subject to wealth tax. The current marginal wealth tax rate is 0.85% of the value assessed (1% in 2014). The assessment value of listed shares is 100% of the listed value of such shares on 1 January in the assessment year.
Non-resident shareholders are not subject to wealth tax in Norway for shares in Norwegian limited companies unless the shareholder is an individual and the shareholding is effectively connected with the individual's business activities in Norway.
Inheritance tax and gift tax
There is no inheritance tax for gifts given from 1 January 2014, or inheritance received on the basis of a death occurring from 1 January 2014.
Transfer tax
No transfer tax is imposed in Norway in connection with the sale or purchase of shares.
Statoil, Annual Report on Form 20-F 2014109
United States tax matters
This section describes the material United States federal income tax consequences for US holders (as defined below) of owning shares or ADSs. It only applies to you if you hold your shares or ADSs as capital assets for tax purposes. This section does not apply to you if you are a member of a special class of holders subject to special rules, including:
·dealers in securities;
·traders in securities that elect to use a mark-to-market method of accounting for their securities holdings;
·tax-exempt organisations;
·life insurance companies;
·persons liable for alternative minimum tax;
·persons that actually or constructively own 10% or more of the voting stock of Statoil;
·persons that hold shares or ADSs as part of a straddle or a hedging or conversion transaction
·persons that purchase or sell shares or ADSs as part of a wash sale for tax purposes; or
·persons whose functional currency is not USD.
This section is based on the Internal Revenue Code of 1986, as amended, its legislative history, existing and proposed regulations, published rulings and court decisions, and the Convention between the United States of America and the Kingdom of Norway for the Avoidance of Double Taxation and the Prevention of Fiscal Evasion with Respect to Taxes on Income and Property (the ''Treaty''). These laws are subject to change, possibly on a retroactive basis. In addition, this section is based in part upon the representations of the depositary and the assumption that each obligation in the deposit agreement and any related agreement will be performed in accordance with its terms. For United States federal income tax purposes, if you hold ADRs evidencing ADSs, you will generally be treated as the owner of the ordinary shares represented by those ADRs. Exchanges of shares for ADRs and ADRs for shares will not generally be subject to United States federal income tax.
If a partnership holds the shares or ADSs, the United States federal income tax treatment of a partner will generally depend on the status of the partner and the tax treatment of the partnership. A partner in a partnership holding the shares or ADSs should consult its tax advisor with regard to the United States federal income tax treatment of an investment in the shares or ADSs.
You are a ''US holder'' if you are a beneficial owner of shares or ADSs and you are for United States federal income tax purposes:
·a citizen or resident of the United States;
·a United States domestic corporation;
·an estate whose income is subject to United States federal income tax regardless of its source; or
·a trust if a United States court can exercise primary supervision over the trust's administration and one or more United States persons are authorised to control all substantial decisions of the trust.
You should consult your own tax adviser regarding the United States federal, state and local and Norwegian and other tax consequences of owning and disposing of shares and ADSs in your particular circumstances.
Taxation of dividends
If you are a US holder, the gross amount of any dividend paid by Statoil out of its current or accumulated earnings and profits (as determined for United States federal income tax purposes) is subject to United States federal income taxation. If you are a non-corporate US holder, dividends paid to you will be eligible to be taxed at the preferential rates applicable to long-term capital gains as long as, in the year that you receive the dividend, the shares or ADSs are readily tradable on an established securities market in the United States or Statoil is eligible for benefits under the Treaty. To qualify for the preferential rates, you must hold the shares or ADSs for more than 60 days during the 121-day period beginning 60 days before the ex-dividend date and meet certain other requirements. Furthermore, these tax consequences would be different if Statoil were to be treated as a PFIC as discussed below.
You must include any Norwegian tax withheld from the dividend payment in this gross amount even though you do not in fact receive the amount withheld as tax. The dividend is taxable for you when you, in the case of shares, or the depositary, in the case of ADSs, receive the dividend, actually or constructively. The dividend will not be eligible for the dividends-received deduction generally allowed to United States corporations in respect of dividends received from other United States corporations.
The amount of the dividend distribution that you must include in your income as a US holder will be the value in USD of the payments made in NOK determined at the spot NOK/USD rate on the date the dividend distribution is includible in your income, regardless of whether or not the payment is in fact converted into USD. Distributions in excess of current and accumulated earnings and profits, as determined for United States federal income tax purposes, will be treated as a non-taxable return of capital to the extent of your tax basis in the shares or ADSs and, to the extent in excess of your tax basis, will be treated as capital gain.
Subject to certain limitations, the 15% Norwegian tax withheld in accordance with the Treaty and paid to Norway will be creditable or deductible against your United States federal income tax liability. Special rules apply when determining the foreign tax credit limitation with respect to dividends that are subject to the preferential rates. To the extent that a refund of the tax withheld is available to you under Norwegian law, the amount of tax withheld that is refundable will not be eligible for credit against your United States federal income tax liability. Dividends will be income from sources outside the United States and will generally, depending on your circumstances, be either ''passive'' or ''general'' income for purposes of computing the foreign tax credit allowable to you.
Any gain or loss resulting from currency exchange rate fluctuations during the period from the date you include the dividend payment in income until the date you convert the payment into USD will generally be treated as ordinary income or loss and will not be eligible for the special tax rate. Such gain or loss will generally be income or loss from sources within the United States for foreign tax credit limitation purposes.
110Statoil, Annual Report on Form 20-F 2014
Taxation of capital gains
Subject to the PFIC rules discussed below, if you are a US holder and you sell or otherwise dispose of your shares or ADSs, you will generally recognise a capital gain or loss for United States federal income tax purposes equal to the difference between the value in USD of the amount that you realise and your tax basis, determined in USD, in your shares or ADSs. A capital gain of a non-corporate US holder is generally taxed at preferential rates if the property is held for more than one year. The gain or loss will generally be income or loss from sources within the United States for foreign tax credit limitation purposes.
If you receive any foreign currency on the sale of shares or ADSs, you may recognise ordinary income or loss from sources within the United States as a result of currency fluctuations between the date of the sale of the shares or ADSs and the date the sales proceeds are converted into USD.
PFIC rules
We believe that the shares and ADSs should not be treated as stock of a PFIC for United States federal income tax purposes, but this conclusion is a factual determination that is made annually and thus may be subject to change. If we were to be treated as a PFIC, unless a US holder elects to be taxed annually on a mark-to-market basis with respect to the shares or ADSs, a gain realised on the sale or other disposition of the shares or ADSs would in general not be treated as a capital gain. Instead, if you are a US holder, you would be treated as if you had realised such gain and certain "excess distributions" ratably over your holding period for the shares or ADSs and would be taxed at the highest tax rate in effect for each such year to which the gain or distribution was allocated, together with an interest charge in respect of the tax attributable to each such year. With certain exceptions, the shares or ADSs will be treated as stock in a PFIC if we were a PFIC at any time during the period you held the shares or ADSs. Dividends that you receive from us will not be eligible for the preferential tax rates if we are treated as a PFIC with respect to you, either in the taxable year of the distribution or the preceding taxable year, but will instead be taxable at rates applicable to ordinary income.
6.6 Exchange controls and limitations
Under Norwegian foreign exchange controls currently in effect, transfers of capital to and from Norway are not subject to prior government approval.
An exception applies to the physical transfer of payments in currency exceeding certain thresholds, which must be declared to the Norwegian custom authorities.
This means that non-Norwegian resident shareholders may receive dividend payments without Norwegian exchange control consent as long as the payment is made through a licensed bank or other licensed payment institution.
There are no restrictions affecting the rights of non-Norwegian residents or foreign owners to hold or vote for our shares.
Statoil, Annual Report on Form 20-F 2014111
6.7 Exchange rates
The table below shows the high, low, average and end-of-period exchange rates for the Norwegian krone for USD 1.00 as announced by Norges Bank (Norway's central bank).
The average is computed using the monthly average exchange rates announced by Norges Bank during the period indicated.
For the year ended 31 December | Low | High | Average | End of Period |
| | | | |
2010 | 5.6026 | 6.6840 | 6.0437 | 5.8564 |
2011 | 5.2369 | 6.0315 | 5.6059 | 5.9927 |
2012 | 5.5349 | 6.1471 | 5.8172 | 5.5664 |
2013 | 5.4438 | 6.2154 | 5.8753 | 6.0837 |
2014 | 5.8611 | 7.6111 | 6.3011 | 7.4332 |
| Low | High |
| | |
2014 | | |
September | 6.1928 | 6.4530 |
October | 6.4178 | 6.7790 |
November | 6.7357 | 6.9675 |
December | 6.9569 | 7.6111 |
| | |
2015 | | |
January | 7.5081 | 7.8138 |
February | 7.4880 | 7.7176 |
March (up to and including 12 March 2015) | 7.6677 | 8.1840 |
On 12 March 2015, the exchange rate announced by the Norges Bank for the Norwegian krone was USD 1.00 = NOK 8.0948.
Fluctuations in the exchange rate between the Norwegian krone and the US dollar will affect the amounts in US dollars received by holders of American Depositary Shares (ADSs) on the conversion of dividends, if any, paid in Norwegian kroner on the ordinary shares, and they may affect the US dollar price of the ADSs on the New York Stock Exchange.
112Statoil, Annual Report on Form 20-F 2014
6.8 Major shareholders
The Norwegian State is the largest shareholder in Statoil, with a direct ownership interest of 67%. Its ownership interest is managed by the Norwegian Ministry of Petroleum and Energy. A production licence grants the holder an exclusive right to explore for and produce petroleum within a specified geographical area. The licensees become the owners of the petroleum produced from the field covered by the licence. Production licences are awarded to group of companies forming a joint venture at the Ministry’s discretion. The members of the joint venture are jointly and severally responsible to the Norwegian State for obligations arising from petroleum operations carried out under the licence. The Ministry of Petroleum and Energy decides the form of the joint operating agreements and accounting agreements.
The governing body of the joint venture is the management committee. In licences awarded since 1996 where the state's direct financial interest (SDFI) holds an interest, the Norwegian State, acting through Petoro AS, may veto decisions made by the joint venture management committee, which, in the opinion of the Norwegian State, would not be in compliance with the obligations of the licence with respect to the Norwegian State's exploitation policies or financial interests. This power of veto has never been used.
Interests in production licences may be transferred directly or indirectly subject to the consent of the Ministry of Petroleum and Energy and the approval of the Ministry of Finance of a corresponding tax treatment position. In most licences, there are no pre-emption rights in favour of the other licensees. However, the SDFI, or the Norwegian State, as appropriate, still holds pre-emption rights in all licences.
The day-to-day management of a field is the responsibility of an operator appointed by the Ministry of Petroleum and Energy. The operator is in practice always a member of the joint venture holding the production licence, although this is not legally required. The terms of engagement of the operator are set out in the joint operating agreement.
Licensees are required to submit a plan for development and operation (PDO) to the Ministry of Petroleum and Energy for approval. For fields of a certain size, the Storting has to accept the PDO before it is formally approved by the Ministry of Petroleum and Energy.
If important public interests are at stake, the Norwegian State may instruct Statoil and other licensees on the NCS to reduce the production of petroleum. The last time the Norwegian State instructed a reduction in oil production was in 2002.
A licence from the Ministry of Petroleum and Energy is also required in order to establish facilities for the transportation and utilisation of petroleum. Ownership of most facilities for the transportation and utilisation of petroleum in Norway and on the NCS is organised in the form of joint ventures. The participants' agreements are similar to the joint operating agreements.
Licensees are required to prepare a decommissioning plan before a production licence or a licence to establish and use facilities for the transportation and utilisation of petroleum expires or is relinquished, or the use of a facility ceases. On the basis of the decommissioning plan, the Ministry of Petroleum and Energy makes a decision as to the disposal of the facilities.
For an overview of Statoil’s activities and shares in Statoil’s production licences on the NCS, see section 2.5 Development and Production Norway (DPN).
Gas sales and transportation from the NCS
Statoil markets gas from the NCS on its own behalf and on the Norwegian State's behalf. Gas is transported through the Gassled pipeline network to customers in the UK and mainland Europe.
Most of Statoil’s and the Norwegian State's gas produced on the NCS is sold under gas contracts to customers in the European Union (EU), and changes in EU legislation may affect Statoil's marketing of gas.
The Norwegian gas transport system, consisting of the pipelines and terminals through which licensees on the NCS transport their gas, is owned by a joint venture called Gassled. The Norwegian Petroleum Act of 29 November 1996 and the pertaining Petroleum Regulation establish the basis for non- discriminatory third-party access to the Gassled transport system.
The tariffs for the use of capacity in the transport system are determined by applying a formula set out in separate tariff regulations stipulated by the Ministry of Petroleum and Energy. The tariffs are paid on the basis of booked capacity, not on the basis of the volumes actually transported.
For further information, see Pipelines in section 2.5 MMP – Marketing, Midstream and Processing.
The Norwegian State's participation
The Norwegian State's policy as a shareholder in Statoil has been and continues to be to ensure that petroleum activities create the highest possible value for the Norwegian State.
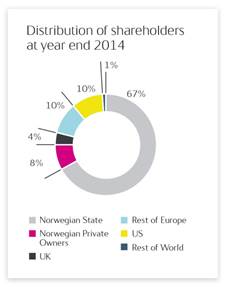
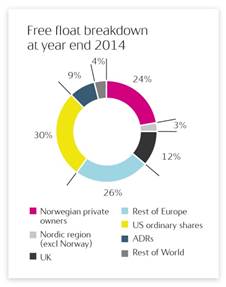
| Pursuant to the exchange ratio agreed in connection with the merger with Hydro's oil and gas activities, the State's ownership interest in the merged company was 62.5%, or 1,992,959,739 shares, on 1 October 2007. In accordance with the Norwegian parliament's decision of 2001 concerning a minimum state shareholding in Statoil of two-thirds, the Government built up the State's ownership interest in Statoil by buying shares in the market during the period from June 2008 to March 2009. In March 2009, the Government announced that the State's direct ownership interest had reached 67%, and the Government's direct purchase of Statoil shares was completed.
As of 31 December 2014, the Norwegian State had a 67% direct ownership interest in Statoil and a 3.1% indirect interest through the National Insurance Fund (Folketrygdfondet), totalling 70.1%.
The Norwegian State is the only person or entity known to us to own beneficially, directly or indirectly, more than 5% of our outstanding shares. We have not been notified of any other beneficial owner of 5% or more of our ordinary shares as of 31 December 2014.
Statoil has one class of shares, and each share confers one vote at the general meeting. The Norwegian State does not have any voting rights that differ from the rights of other ordinary shareholders. Pursuant to the Norwegian Public Limited Liability Companies Act, a majority of more than two-thirds of the votes cast as well as of the votes represented at a general meeting is required to amend our articles of association. As long as the Norwegian State owns more than one-third of our shares, it will be able to prevent any amendments to our articles of association. Since the Norwegian State, acting through the Norwegian Minister of Petroleum and Energy, has in excess of two-thirds of the shares in the company, it has sole power to amend our articles of association. In addition, as majority shareholder, the Norwegian State has the power to control any decision at general meetings of our shareholders that requires a majority vote, including the election of the majority of the corporate assembly, which has the power to elect our board of directors and approve the dividend proposed by the board of directors.
The Norwegian State endorses the principles set out in "The Norwegian Code of Practice for Corporate Governance", and it has stated that it expects companies in which the State has ownership interests to adhere to the code. The principle of ensuring equal treatment of different groups of shareholders is a key element in the State's own guidelines. In companies in which the State is a shareholder together with others, the State wishes to exercise the same rights and obligations as any other shareholder and not act in a manner that has a detrimental effect on the rights or financial interests of other shareholders. In addition to the principle of equal treatment of shareholders, emphasis is also placed on transparency in relation to the State's ownership and on the general meeting being the correct arena for owner decisions and formal resolutions.
|
Statoil, Annual Report on Form 20-F 2014113
Shareholders at 12 March 2015 | Account type | Number of Shares | Ownership in % |
| | | | |
1 | The Norwegian State (Ministry of Petroleum and Energy) | | 2,136,393,559 | 67.00 |
2 | Deutsche Bank Trust CO. Americas | Nominee | 98,960,636 | 3.10 |
3 | Folketrygdfondet (Norwegian national insurance fund) | | 91,720,703 | 2.88 |
4 | Clearstream Banking | Nominee | 83,518,319 | 2.62 |
5 | State Street Bank and Trust CO. | Nominee | 20,883,664 | 0.65 |
6 | State Street Bank and Trust CO. | Nominee | 20,493,720 | 0.64 |
7 | State Street Bank and Trust CO. | Nominee | 16,892,268 | 0.53 |
8 | The Bank of New York Mellon | Nominee | 15,304,048 | 0.48 |
9 | J.P. Morgan Chase Bank N.A. London | Nominee | 13,267,682 | 0.42 |
10 | Blackrock GL Alloc FD | | 12,934,086 | 0.41 |
11 | State Street Bank and Trust CO. | Nominee | 12,620,597 | 0.40 |
12 | Six Sis AG | Nominee | 12,272,762 | 0.38 |
13 | J.P. Morgan Chase Bank N.A. London | Nominee | 11,939,831 | 0.37 |
14 | The Northern Trust CO. | Nominee | 11,512,445 | 0.36 |
15 | The Bank of New York Mellon | Nominee | 11,481,848 | 0.36 |
16 | State Street Bank and Trust CO. | Nominee | 11,477,088 | 0.36 |
17 | UBS AG | Nominee | 10,600,375 | 0.33 |
18 | KLP Aksje Norge | | 9,847,152 | 0.31 |
19 | State Street Bank and Trust CO. | Nominee | 9,173,178 | 0.29 |
20 | Euroclear Bank | Nominee | 7,697,200 | 0.24 |
| | | | |
Source: Norwegian Central Securities Depository (VPS) | | | |
114Statoil, Annual Report on Form 20-F 2014
7 Corporate governance
Statoil's objective is to create long-term value for its shareholders through the exploration for and production, transportation, refining and marketing of petroleum and petroleum-derived products and other forms of energy.
In pursuing our corporate objective, we are committed to the highest standard of governance and to cultivating a values-based performance culture that rewards exemplary ethical practices, respect for the environment and personal and corporate integrity. We believe that there is a link between high-quality governance and the creation of shareholder value.
The work of the board of directors is based on the existence of a clearly defined division of roles and responsibilities between the shareholders, the board of directors and the company's management.
Our governing structures and controls help to ensure that we run our business in a profitable manner for the benefit of our shareholders, employees and other stakeholders in the societies in which we operate.
The following principles underline our approach to corporate governance:
·All shareholders will be treated equally.
·Statoil will ensure that all shareholders have access to up-to-date, reliable and relevant information about the company's activities.
·Statoil will have a board of directors that is independent (as defined by Norwegian Standards) of the group's management. The board focuses on there not being any conflicts of interest between shareholders, the board of directors and the company's management.
·The board of directors will base its work on the principles for good corporate governance applicable at all times.
Corporate governance in Statoil is subject to regular review and discussion by the board of directors.
Statoil's board of directors endorses the "Norwegian Code of Practice for Corporate Governance". The company's compliance with and, if applicable, deviations from, the code's recommendations are commented on in a separate corporate governance statement issued by Statoil’s board of directors. This statement, which contains further details on the corporate governance of Statoil, is available at www.statoil.com/cg.
7.1 Articles of association
The articles of association and the Norwegian Public Limited Liability Companies Act form the legal framework for Statoil's operations.
Statoil's current articles of association were adopted at the annual general meeting of shareholders on 14 May 2013.
Summary of our articles of association:
Name of the company
Our registered name is Statoil ASA. We are a Norwegian public limited company.
Registered office
Our registered office is in Stavanger, Norway, registered with the Norwegian Register of Business Enterprises under number 923 609 016.
Object of the company
The object of our company, as set forth in Article 1, is, either by ourselves or through participation in or together with other companies, to engage in the exploration, production, transportation, refining and marketing of petroleum and petroleum-derived products, and other forms of energy, as well as other business.
Share capital
Our share capital is NOK 7,971,617,757.50 divided into 3,188,647,103 ordinary shares.
Nominal value of shares
The nominal value of each ordinary share is NOK 2.50.
Board of directors
Our articles of association provide that our board of directors shall consist of 9 to 11 directors. The board, including the chair and the deputy chair, shall be elected by the corporate assembly for a period of up to two years.
Statoil, Annual Report on Form 20-F 2014115
Corporate assembly
We have a corporate assembly comprising 18 members who are normally elected for a term of two years. The general meeting elects 12 members with four deputy members, and six members with deputy members are elected by and from among the employees.
General meetings of shareholders
Our annual general meeting is held no later than 30 June each year.
The meeting will consider the annual report and accounts, including the distribution of any dividend, and any other matters required by law or our articles of association.
Documents relating to matters to be dealt with at general meetings do not need to be sent to all shareholders if the documents are accessible
40Statoil, Annual Report on Form 20-F 2016
In 1985, the Norwegian State established the State's direct financial interest (SDFI) through which the Norwegian State has direct participating interests in licences and petroleum facilities on the NCS. As a result, the Norwegian State holds interests in a number of licences and petroleum facilities in which Statoil also hold interests. Petoro AS, a company wholly owned by the Norwegian State, was formed in 2001 to manage the SDFI assets.
SDFI oil and gas marketing and sale
Statoil markets and sells the Norwegian State's oil and gas together with Statoil’s own production. The arrangement has been implemented by the Norwegian State.
At an extraordinary general meeting held on 25 May 2001, the Norwegian State, as sole shareholder, approved an instruction to Statoil setting out specific terms for the marketing and sale of the Norwegian State's oil and gas. This resolution is referred to as the Owner's instruction.
Statoil is obliged under the Owner's instruction to jointly market and sell the Norwegian State's oil and gas as well as Statoil’s own oil and gas. The overall objective of the marketing arrangement is to obtain the highest possible total value for Statoil’s oil and gas and the Norwegian State's oil and gas, and to ensure an equitable distribution of the total value creation between the Norwegian State and Statoil.
Withdrawal or amendment
·The Norwegian State may at any time utilise its position as majority shareholder of Statoil to withdraw or amend the marketing instruction
HSE regulation
Statoil’s petroleum operations are subject to extensive laws and regulations relating to health, safety and the environment (HSE).
With business operations in more than 30 countries, Statoil is subject to a wide variety of HSE laws and regulations concerning its products, operations and activities. Laws and regulations may be jurisdiction specific, but also international regulations, conventions or treaties, as well as EU directives and regulations, are relevant.
As a result of the Macondo incident, in 2011, the US Department of the Interior created two new agencies to administer operations and activities in the Gulf of Mexico - the Bureau of Safety and Environmental Enforcement (BSEE) and the Bureau of Offshore Energy Management (BOEM). The department also issued new regulations to address the respective roles of the new agencies. Application of these regulations has the potential to affect Statoil’s operations in the US. Similarly, the effects from implementing the EU offshore Safety Directive in EU-member states' legislation will affect operations in relevant EU member countries.
See also Risk factors in section 2.10 Risk review.
Taxation of Statoil
Statoil is subject to ordinary Norwegian corporate income tax and to a special petroleum tax relating to its offshore activities in Norway. Statoil’s profits, both from offshore oil and natural gas activities and from onshore activities, are subject to Norwegian corporate income tax. The standard corporate income tax rate has been reduced from 25% in 2016 to 24% in 2017. In addition, a special petroleum tax is levied on profits from petroleum production and pipeline transportation on the NCS. The special petroleum tax rate has been increased from 53% in 2016 to 54% in 2017. The special petroleum tax rate is applied to relevant income in addition to the standard income tax rate, resulting in a 78% marginal tax rate on income subject to the special petroleum tax. For further information, see note 9 Income taxes to the Consolidated financial statements.
Statoil's international petroleum activities are subject to tax pursuant to local legislation. Fiscal regulation of Statoil’s upstream operations is generally based on corporate income tax regimes and/or PSAs.
SUBSIDIARIES AND PROPERTIES
Significant subsidiaries
The following table shows significant subsidiaries and equity accounted companies directly held by Statoil ASA as of 31 December 2016.
Our voting interest in each company is equivalent to our equity interest.
Statoil, Annual Report on Form 20-F 201641
Ownership in certain subsidiaries and other equity accounted companies |
Name | in % | Country of incorporation | | Name | in % | Country of incorporation |
| | | | | | |
Statholding AS | 100 | Norway | | Statoil Nigeria Deep Water AS | 100 | Norway |
Statoil Angola Block 15 AS | 100 | Norway | | Statoil Nigeria Outer Shelf AS | 100 | Norway |
Statoil Angola Block 15/06 Award AS | 100 | Norway | | Statoil Norsk LNG AS | 100 | Norway |
Statoil Angola Block 17 AS | 100 | Norway | | Statoil North Africa Gas AS | 100 | Norway |
Statoil Angola Block 31 AS | 100 | Norway | | Statoil North Africa Oil AS | 100 | Norway |
Statoil Angola Block 38 AS | 100 | Norway | | Statoil Orient AG | 100 | Switzerland |
Statoil Angola Block 39 AS | 100 | Norway | | Statoil OTS AB | 100 | Sweden |
Statoil Angola Block 40 AS | 100 | Norway | | Statoil Petroleum AS | 100 | Norway |
Statoil Apsheron AS | 100 | Norway | | Statoil Refining Norway AS | 100 | Norway |
Statoil Azerbaijan AS | 100 | Norway | | Statoil Shah Deniz AS | 100 | Norway |
Statoil BTC Finance AS | 100 | Norway | | Statoil Sincor AS | 100 | Norway |
Statoil Coordination Centre NV | 100 | Belgium | | Statoil SP Gas AS | 100 | Norway |
Statoil Danmark AS | 100 | Denmark | | Statoil Tanzania AS | 100 | Norway |
Statoil Deutschland GmbH | 100 | Germany | | Statoil Technology Invest AS | 100 | Norway |
Statoil do Brasil Ltda | 100 | Brazil | | Statoil UK Ltd | 100 | United Kingdom |
Statoil Exploration Ireland Ltd. | 100 | Ireland | | Statoil Venezuela AS | 100 | Norway |
Statoil Forsikring AS | 100 | Norway | | Statoil Metanol ANS | 82 | Norway |
Statoil Færøyene AS | 100 | Norway | | Mongstad Terminal DA | 65 | Norway |
Statoil Hassi Mouina AS | 100 | Norway | | Tjeldbergodden Luftgassfabrikk DA | 51 | Norway |
Statoil Indonesia Karama AS | 100 | Norway | | Naturkraft AS | 50 | Norway |
Statoil New Energy AS | 100 | Norway | | Vestprosess DA | 34 | Norway |
Statoil Nigeria AS | 100 | Norway | | Lundin Petroleum AB | 20 | Sweden |
| | | | | | |
42Statoil, Annual Report on Form 20-F 2016
Property, plant and equipment
Statoil has interests in real estate in many countries throughout the world. However, no individual property is significant.The largest office buildings are theStatoil's head office located at Forusbeen 50, NO-4035, Stavanger, Norway which comprises approximately 135,000 square meters of office space, and the 65,500-square-metre office building located at Fornebu on the outskirts of Norway's capital Oslo. Both office buildings are leased.
For a description of our significant reserves and sources of oil and natural gas, see Proved oil and gas reserves in section 2.8 Operating and financialperformance below, and note 27 Supplementary oil and gas information (unaudited) to the Consolidated financial statements. For a description of our operational refineries, terminals and processing plants, see section 2.5 MMP – Marketing, midstream and processing.
Related party transactions
See note 24 Related parties to the Consolidated financial statements for information concerning related parties.
Insurance
Statoil maintains insurance coverage that includes coverage for physical damage to its oil and gas properties, third-party liability, workers' compensation and employers' liability, general liability, sudden pollution and other coverage.
Statoil's insurance coverage includes deductibles that must be met prior to recovery. Statoil's external insurance is subject to caps, exclusions and limitations, and there is no assurance that such coverage will adequately protect Statoil against liability from all potential consequences and damages.
Statoil, Annual Report on Form 20-F 201643
2.8 OPERATING AND FINANCIAL PERFORMANCE
PROVED OIL AND GAS RESERVES
Proved oil and gas reserves were estimated to be 5,013 mmboe at year end 2016, compared to 5,060 mmboe at the end of 2015.

Statoil's proved reserves are estimated and presented in accordance with the Securities and Exchange Commission (SEC) Rule 4-10 (a) of Regulation S-X, revised as of January 2009, and relevant Compliance and Disclosure Interpretations (C&DI) and Staff Accounting Bulletins, as issued by the SEC staff. For additional information, see Proved oil and gas reserves in note 2 Significant accounting policiesto the Consolidated financial statements. For further details on proved reserves, see also note 27Supplementary oil and gas information (unaudited) in the Consolidated financial statements.
Changes in proved reserves estimates are most commonly the result of revisions of estimates due to observed production performance, extensions of proved areas through drilling activities or the inclusion of proved reserves in new discoveries through the sanctioning of new development projects. These are sources of additions to proved reserves that are the result of continuous business processes and can be expected to continue to add reserves in the future.
Proved reserves can also be added or subtracted through the acquisition or disposal of assets. Changes in proved reserves can also be due to factors outside management control, such as changes in oil and gas prices. Lower oil and gas prices normally allow less oil and gas to be recovered from the accumulations. However, for fields with PSAs and similar contracts, a reduced oil price may result in higher entitlement to the produced volume. These changes are included in the revisions category in the table below.
The principles for booking proved gas reserves are limited to contracted gas sales or gas with access to a robust gas market.
In Norway and the UK, Statoil recognises reserves as proved when a development plan is submitted, as there is reasonable certainty that such a plan will be approved by the regulatory authorities. Outside these territories, reserves are generally booked as proved when regulatory approval is received, or when such approval is imminent. Reserves from new discoveries, upward revisions of reserves and purchases of proved reserves are expected to contribute to maintaining proved reserves in future years. Undrilled well locations US onshore are generally booked as proved undeveloped reserves when a development plan has been adopted and the well locations are scheduled to be drilled within five years,
Approximately 91% of our proved reserves are located in OECD countries. Norway is by far the most important contributor in this category, followed by the United States (US), Canada and Ireland.
44Statoil, Annual Report on Form 20-F 2016
Of Statoil's total proved reserves, 7% are related to PSAs in non-OECD countries such as Azerbaijan, Angola, Algeria, Nigeria, Libya and Russia. Other non-OECD reserves are related to concessions in Brazil and Venezuela, representing less than 2% of Statoil's total proved reserves. These are included in proved reserves in the Americas.

Significant changes in our proved reserves in 2016 were:
•Negative revisions due to lower commodity prices compared to last year, resulted in a reduction of approximately 60 million boe
•The negative revisions are more than offset by positive revisions due to better performance of producing fields, maturing of improved recovery projects, and reduced uncertainty due to further drilling and production experience. The net effect of the positive and negative revisions is an increase of 409 million boe in 2016. A significant part of these positive revisions are related to large, producing fields offshore Norway where production is declining less than previously assumed for the proved reserves due to continuous improvement activities
•Proved reserves from new discoveries have also been added through the sanctioning of new field development projects in 2016, Svale Nord, Trestakk and Utgard in Norway and Julia in US. The new projects added a total of 66 million boe. New discoveries with proved reserves booked in 2016 are all expected to start production within a period of five years
•Further drilling in the Bakken, Marcellus and Eagle Ford onshore plays in the US increased the proved reserves in 2016, and some of these additions are presented as extensions. Extension of proved area on existing fields added a total of 112 million boe of new proved reserves in 2016
•The net effect of purchase and sale increased the reserves by 39 million boe in 2016
The 2016 entitlement production was 673 million boe, an increase of 1.6% compared to 2015.
Proved reserves as of 31 December 2016 | Proved reserves |
Oil and Condensate | NGL | Natural Gas | Total oil and gas |
(mmboe) | (mmboe) | (bcf) | (mmboe) |
| | | | |
Developed | | | | |
Norway | 543 | 213 | 9,223 | 2,399 |
Eurasia excluding Norway | 43 | - | 188 | 76 |
Africa | 200 | 10 | 171 | 240 |
Americas | 320 | 53 | 1,002 | 552 |
Total Developed proved reserves | 1,105 | 277 | 10,584 | 3,268 |
| | | | |
Undeveloped | | | | |
Norway | 689 | 76 | 3,628 | 1,411 |
Eurasia excluding Norway | 28 | - | - | 28 |
Africa | 22 | 6 | 110 | 47 |
Americas | 190 | 14 | 316 | 260 |
Total Undeveloped proved reserves | 928 | 95 | 4,054 | 1,746 |
| | | | |
Total proved reserves | 2,033 | 372 | 14,637 | 5,013 |
| | | | |
Statoil, Annual Report on Form 20-F 201645

Proved reserves in Norway
A total of 3,811 million boe is recognised as proved reserves in 61 fields and field development projects on the NCS, representing 76% of Statoil's total proved reserves. Of these, 54 fields and field areas are currently in production, 35 of which are operated by Statoil. Three new field development projects added reserves categorised as extensions and discoveries during 2016, Svale Nord, Trestakk and Utgard. Production experience, further drilling and improved recovery on several of Statoil's producing fields in Norway also contributed positively to the revisions of the proved reserves in 2016.
The net effect of the transaction with Lundin Petroleum AB (Lundin), including sale of Statoil’s equity share in the Edvard Grieg field and acquisition of a 20.1% share in Lundin, results in an increase in Statoil’s proved reserves of 50 million boe. The volume corresponding to our relative share of Lundin’s share in fields carrying proved reserves is included as reserves in an equity accounted company.
Of the proved reserves on the NCS, 2,399 million boe, or 63%, are proved developed reserves. Of the total proved reserves in this area, 60% are gas reserves related to large offshore gas fields such as Troll, Snøhvit, Oseberg, Ormen Lange, Tyrihans, Visund, Aasta Hansteen and Åsgard and 40% are liquid reserves.
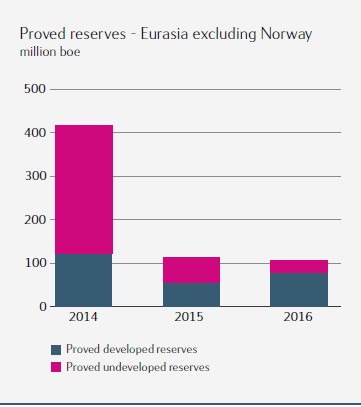
Proved reserves in Eurasia, excluding Norway
In this area, Statoil has proved reserves of 104 million boe related to three fields and field developments in Azerbaijan, Ireland and Russia. Eurasia excluding Norway represents 2% of Statoil's total proved reserves, Azerbaijan being the main contributor with the Azeri-Chirag-Gunashli fields. All fields are producing. Of the proved reserves in Eurasia, 76 million boe or 73% are proved developed reserves.
Of the total proved reserves in this area, 68% are liquid reserves and 32% are gas reserves.
46Statoil, Annual Report on Form 20-F 2016
Proved reserves in Africa
Statoil recognises proved reserves of 287 million boe related to 28 fields and field developments in several West and North African countries, including Algeria, Angola, Libya and Nigeria. Africa represents 6% of Statoil's total proved reserves. Angola is the primary contributor to the proved reserves in this area, with 24 of the 28 fields.
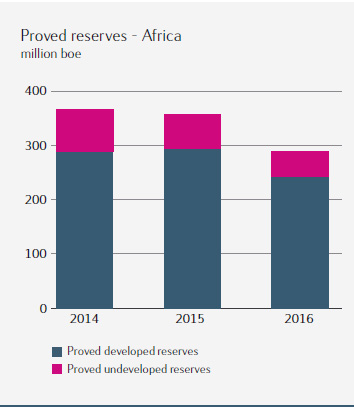
In Angola, Statoil has proved reserves in Block 15, Block 17 and Block 31, with production from all three blocks.
In Algeria and Nigeria, all fields are in production. Murzuq and Mabruk did not have any production in 2016 due to the political unrest in Libya.
The disputed equity determination at Agbami will potentially alter Statoil's equity share in this field. The effect on the proved reserves will be included once the redetermination is finalised and the effect is known.
Statoil, Annual Report on Form 20-F 201647
Of the total proved reserves in Africa, 240 million boe, or 84%, are proved developed reserves. Of the total proved reserves in this area, 83% are liquid reserves and 17% are gas reserves.
Proved reserves in the Americas
In North and South America, Statoil has proved reserves equal to 812 million boe in a total of 18 fields and field development projects. This represents 16% of Statoil's total proved reserves. Eleven of these fields are located in the US, eight of which are offshore field developments in the Gulf of Mexico and three are onshore tight reservoir assets. Five are located in Canada and two in South America.
In the US, six of the eight fields in the Gulf of Mexico are producing. Field development is ongoing on Big Foot and Stampede. The onshore tight reservoir assets Marcellus, Eagle Ford and Bakken are all in production. In Canada, proved reserves are related both to offshore field developments, and to the Leismer field in the Kai Kos Dehseh oil sands project in Alberta. The effect of the divestment of the oil sands projects will be included in 2017.
Of the total proved reserves in the Americas, 552 million boe, or 68%, are proved developed reserves. Of the total proved reserves in this area, 71% are liquid reserves and 29% gas reserves.

48Statoil, Annual Report on Form 20-F 2016
Reserves replacement
The reserves replacement ratio is defined as the sum of additions and revisions of proved reserves divided by produced volumes in any given period. The following table presents the changes in reserves in each category relating to the reserve replacement ratio for the years 2016, 2015 and 2014. For additional information regarding changes in proved reserves, see note 27 Supplemental oil and gas information (unaudited) to the Consolidated financial statements.
The usefulness of the reserves replacement ratio is limited by the volatility of oil prices, the influence of oil and gas prices on PSA reserve booking, sensitivity related to the timing of project sanctions and the time lag between exploration expenditure and the booking of reserves.
| For the year ended 31 December |
Change in proved reseres (million boe) | 2016 | 2015 | 2014 |
| | | |
Revisions and improved recovery | 409 | (42) | 356 |
Extensions and discoveries | 179 | 627 | 253 |
Purchase of petroleum-in-place | 65 | 13 | 20 |
Sales of petroleum-in-place | (27) | (235) | (233) |
| | | |
Total reserve additions | 626 | 363 | 395 |
Production | (673) | (662) | (635) |
| | | |
Net change in proved reserves | (47) | (299) | (240) |
| | | |
| For the year ended 31 December |
Reserves replacement ratio (including purchases and sales) | 2016 | 2015 | 2014 |
| | | |
Annual | 0.93 | 0.55 | 0.62 |
Three-year-average | 0.70 | 0.81 | 0.97 |
| | | |
Development of reserves
In 2016, approximately 299 million boe were converted from undeveloped to developed proved reserves.The start-up of production from Ivar Aasen, Goliat, Gullfaks Rimfaksdalen and Svale Nord in Norway, together with Julia and Heidelberg in the US increased the proved developed reserves by 127 million boe during 2016. The remaining 172 million boe of the converted volume is related to development activities on producing fields. Over the last five years Statoil has converted 1,962 million boe of proved undeveloped reserves to proved developed reserves.
Statoil, Annual Report on Form 20-F 201649
Net proved reserves in million barrels oil equivalent | Total | Developed | Undeveloped |
| | | |
At 31 December 2015 | 5,060 | 3,515 | 1,546 |
Revisions and improved recovery | 409 | 138 | 271 |
Extensions and discoveries | 179 | - | 179 |
Purchase of reserves-in-place | 65 | 2 | 63 |
Sales of reserves-in-place | (27) | (13) | (14) |
Production | (673) | (673) | - |
Moved from undeveloped to developed | - | 299 | (299) |
| | | |
At 31 December 2016 | 5,013 | 3,268 | 1,746 |
| | | |
The new development projects added a total of 66 million boe of proved undeveloped reserves in 2016. Further drilling in the Bakken, Marcellus and Eagle Ford onshore plays in the US increased the proved area and added proved undeveloped reserves. These additions are categorized as extensions and together with extensions on other existing fields, this added a total of 112 million boe of proved undeveloped reserves. In total this adds up to an increase of 179 million boe from Extensions and discoveries.
Lower commodity prices had an effect on both undeveloped and developed reserves resulting in earlier economic cut-off. The negative revisions are more than offset by positive revisions based on new information available either from drilling of new wells or from production experience, resulting in an improved understanding of the fields. The net effect of revision of estimate on existing fields added 138 million boe proved developed reserves and 271 million boe proved undeveloped reserves.
The net effect of the purchase and sale transactions done in 2016, increased the proved undeveloped reserves by 49 million boe.
| | Oil and Condensate | NGL | Natural gas | Total |
| | (mmboe) | (mmboe) | (bcf) | (mmboe) |
| | | | | |
2016 | Proved reserves end of year | 2,033 | 372 | 14,637 | 5,013 |
| Developed | 1,105 | 277 | 10,584 | 3,268 |
| Undeveloped | 928 | 95 | 4,054 | 1,746 |
2015 | Proved reserves end of year | 2,091 | 364 | 14,624 | 5,060 |
| Developed | 1,104 | 290 | 11,901 | 3,515 |
| Undeveloped | 987 | 74 | 2,723 | 1,546 |
2014 | Proved reserves end of year | 1,942 | 403 | 16,919 | 5,359 |
| Developed | 1,156 | 310 | 12,677 | 3,725 |
| Undeveloped | 786 | 93 | 4,242 | 1,635 |
| | | | | |
As of 31 December 2016, the total proved undeveloped reserves amounted to 1,746 million boe, 81% of which are related to fields in Norway. The Troll and Snøhvit fields, which have continuous development activities, represent the largest undeveloped assets in Norway together with fields not yet in production, such as Johan Sverdrup, Aasta Hansteen and Gina Krogh. The largest assets with respect to proved undeveloped reserves outside Norway are Stampede, Marcellus and Bakken in the US.
All these fields are either producing, or will start production within the next five years. For fields with proved reserves where production has not yet started, investment decisions have already been sanctioned and investments in infrastructure and facilities have commenced. Some development activities will take place more than five years from the disclosure date, but these are mainly related to incremental type of spending, such as drilling of additional wells from existing facilities, in order to secure continued production. There are no material development projects, which would require a separate future investment decision by management, included in our proved reserves. For our onshore plays in the USA, Marcellus, Eagle Ford and Bakken, all proved undeveloped reserves are limited to wells that are scheduled to be drilled within five years.
In 2016, Statoil incurred USD 8,115 million in development costs relating to assets carrying proved reserves, USD 6,188 million of which was related to proved undeveloped reserves.
Additional information about proved oil and gas reserves is provided in note 27 Supplementary oil and gas information (unaudited)to the Consolidated financial statements.
Preparations of reserves estimates
Statoil's annual reporting process for proved reserves is coordinated by a central corporate reserves management (CRM) team consisting of qualified professionals in geosciences, reservoir and production technology and financial evaluation. The team has an
50Statoil, Annual Report on Form 20-F 2016
average of more than 21 years' experience in the oil and gas industry. CRM reports to the senior vice president of finance and control in the Technology, Drilling and Projects business area and is thus independent of the Development & Production business areas in Norway, North America and International. All the reserves estimates have been prepared by Statoil's technical staff.
Although the CRM team reviews the information centrally, each asset team is responsible for ensuring that it is in compliance with the requirements of the SEC and Statoil's corporate standards. Information about proved oil and gas reserves, standardised measures of discounted net cash flows related to proved oil and gas reserves and other information related to proved oil and gas reserves, is collected from the local asset teams and checked by CRM for consistency and conformity with applicable standards. The final numbers for each asset are quality-controlled and approved by the responsible asset manager, before aggregation to the required reporting level by CRM.
The aggregated results are submitted for approval to the relevant business area management teams and the corporate executive committee.
The person with primary responsibility for overseeing the preparation of the reserves estimates is the manager of the CRM team. The person who presently holds this position has a bachelor's degree in earth sciences from the University of Gothenburg, and a master's degree in petroleum exploration and exploitation from Chalmers University of Technology in Gothenburg, Sweden. She has 31 years' experience in the oil and gas industry, 30 of them with Statoil. She is a member of the Society of Petroleum Engineering (SPE) and vice-chair of the UNECE Expert Group on Resource Classification (EGRC).
DeGolyer and MacNaughton report
Petroleum engineering consultants DeGolyer and MacNaughton have carried out an independent evaluation of Statoil's proved reserves as of 31 December 2016 using Statoil provided data. The evaluation accounts for 100% of Statoil's proved reserves. The aggregated net proved reserves estimates prepared by DeGolyer and MacNaughton do not differ materially from those prepared by Statoil when compared on the basis of net equivalent barrels.
| Oil and Condensate | NGL/LPG | Sales Gas | Oil Equivalent |
Net proved reserves at 31 December 2016 | (mmbbls) | (mmbbl) | (bcf) | (mmboe) |
| | | | |
Estimated by Statoil | 2,033 | 372 | 14,637 | 5,013 |
Estimated by DeGolyer and MacNaughton | 2,244 | 324 | 13,685 | 5,007 |
| | | | |
A reserves audit report summarising this evaluation is included as Exhibit 15 (a)(iii).
Operational statistics
Developed and undeveloped acreage
The table below shows the total gross and net developed and undeveloped oil and gas acreage, in which Statoil had interests at 31 December 2016.
A gross value reflects wells or acreage in which Statoil has interests (presented as 100%). The net value corresponds to the sum of the fractional working interests owned in gross wells or acreages.
| | Norway | Eurasia excluding Norway | Africa | Americas | Oceania 1) | Total |
At 31 December 2016 (in thousands of acres) | |
| | | | | | | |
Developed and undeveloped oil and gas acreage | | | | | | | |
Acreage developed | - gross | 915 | 90 | 823 | 845 | - | 2,673 |
| - net | 339 | 21 | 267 | 240 | - | 868 |
Acreage undeveloped | - gross | 12,485 | 40,593 | 17,922 | 32,665 | 18,125 | 121,789 |
| - net | 5,127 | 18,275 | 7,420 | 13,425 | 9,052 | 53,299 |
| | | | | | | |
1) Acreage in Australia | | | | | | | |
| | | | | | | |
The largest concentrations of developed acreage in Norway are in the Troll, Skarv, Snøhvit, Oseberg area and Ormen Lange. In Africa, the Algerian gas development projects In Amenas and In Salah represent the largest concentrations of developed acreage (gross and net).
Statoil's largest undeveloped acreage concentration is in Russia with 16% of the total acreage and 48% of the total acreage in Eurasia excluding Norway. A large part of the net acreage in Russia represents Statoil’s share of a joint venture with Rosneft. The largest
Statoil, Annual Report on Form 20-F 201651
concentration of undeveloped acreage in the Americas is Canada, with 33% of the total for this geographic area. In Africa, the largest acreage concentration is in South Africa, representing 38% of the total for this geographic area. In Oceania Statoil holds undeveloped acreage in Australia and New Zealand.
Statoil holds acreage in numerous concessions, blocks and leases. The terms and conditions regarding expiration dates vary significantly from property to property. Work programs are designed to ensure that the exploration potential of any property is fully evaluated before expiration.
Acreage related to several of these concessions, blocks and leases are scheduled to expire within the next three years. Any acreage which has already been evaluated to be non-profitable may be relinquished prior to the current expiration date. In other cases, Statoil may decide to apply for an extension if more time is needed in order to fully evaluate the potential of the properties. Historically, Statoil has generally been successful in obtaining such extensions.
Most of the undeveloped acreage that will expire within the next three years is related to early exploration activities where no production is expected in the foreseeable future. The expiration of these leases, blocks and concessions will therefore not have any material impact on our reserves.
Productive oil and gas wells
The number of gross and net productive oil and gas wells, in which Statoil had interests at 31 December 2016, are shown in the table below.
| | Norway | Eurasia excluding Norway | Africa | Americas | Total |
At 31 December 2016 | |
| | | | | | |
Number of productive oil and gas wells | | | | | | |
Oil wells | - gross | 865 | 175 | 480 | 3,337 | 4,857 |
| - net | 293.5 | 25.4 | 72.4 | 817.2 | 1,208.4 |
Gas wells | - gross | 202 | 6 | 97 | 2,049 | 2,354 |
| - net | 88.6 | 2.2 | 37.5 | 509.8 | 638.1 |
| | | | | | |
The total gross number of productive wells as of end 2016 includes 404 oil wells and 15 gas wells with multiple completions or wells with more than one branch.
Net productive and dry oil and gas wells drilled
The following tables show the net productive and dry exploratory and development oil and gas wells completed or abandoned by Statoil in the past three years. Productive wells include exploratory wells in which hydrocarbons were discovered, and where drilling or completion has been suspended pending further evaluation. A dry well is one found to be incapable of producing sufficient quantities to justify completion as an oil or gas well.
| Norway | Eurasia excluding Norway | Africa | Americas | Oceania | Total |
| | | | | | |
Year 2016 | | | | | | |
Net productive and dry exploratory wells drilled | 5.5 | 0.7 | - | 6.4 | - | 12.6 |
- Net dry exploratory wells drilled | 1.4 | 0.7 | - | 1.9 | - | 3.9 |
- Net productive exploratory wells drilled | 4.1 | - | - | 4.6 | - | 8.7 |
| | | | | | |
Net productive and dry development wells drilled | 47.4 | 1.6 | 5.2 | 133.5 | - | 187.8 |
- Net dry development wells drilled | 4.2 | 0.2 | 0.2 | - | - | 4.6 |
- Net productive development wells drilled | 43.3 | 1.5 | 4.9 | 133.5 | - | 183.2 |
| | | | | | |
Year 2015 | | | | | | |
Net productive and dry exploratory wells drilled | 10.2 | 1.0 | 2.5 | 2.6 | - | 16.3 |
- Net dry exploratory wells drilled | 4.6 | 0.4 | 0.5 | 0.9 | - | 6.4 |
- Net productive exploratory wells drilled | 5.6 | 0.7 | 2.0 | 1.7 | - | 9.9 |
| | | | | | |
Net productive and dry development wells drilled | 32.1 | 4.1 | 10.6 | 228.8 | - | 275.6 |
- Net dry development wells drilled | 3.6 | - | 4.3 | 0.3 | - | 8.2 |
- Net productive development wells drilled | 28.6 | 4.1 | 6.3 | 228.5 | - | 267.4 |
| | | | | | |
Year 2014 | | | | | | |
Net productive and dry exploratory wells drilled | 12.0 | 1.0 | 4.7 | 3.4 | 3.6 | 24.7 |
- Net dry exploratory wells drilled | 3.4 | 1.0 | 2.7 | 1.6 | 3.6 | 12.2 |
- Net productive exploratory wells drilled | 8.6 | - | 2.0 | 1.9 | - | 12.5 |
| | | | | | |
Net productive and dry development wells drilled | 26.9 | 2.7 | 8.5 | 386.1 | - | 424.2 |
- Net dry development wells drilled | 3.5 | - | 1.1 | 1.2 | - | 5.8 |
- Net productive development wells drilled | 23.4 | 2.7 | 7.4 | 384.9 | - | 418.4 |
52Statoil, Annual Report on Form 20-F 2016
Statoil, Annual Report on Form 20-F 201653
Exploratory and development drilling in process
The following table shows the number of exploratory and development oil and gas wells in the process of being drilled by Statoil at 31 December 2016.
| | Norway | Eurasia excluding Norway | Africa | Americas | Total |
At 31 December 2016 | |
| | | | | | |
Number of wells in progress | | | | | | |
Development wells | - gross | 52 | 8 | 16 | 355 | 431 |
| - net | 18.6 | 0.9 | 3.6 | 113.7 | 136.8 |
Exploratory wells | - gross | 3 | - | - | 1 | 4 |
| - net | 1.6 | - | - | 0.2 | 1.8 |
| | | | | | |
Delivery commitments
On behalf of the Norwegian State's direct financial interest (SDFI), Statoil is responsible for managing, transporting and selling the Norwegian state's oil and gas from the Norwegian continental shelf (NCS). These reserves are sold in conjunction with Statoil's own reserves. As part of this arrangement, Statoil delivers gas to customers under various types of sales contracts. In order to meet the commitments, we utilize a field supply schedule that ensures the highest possible total value for Statoil and SDFI's joint portfolio of oil and gas.
The majority of our gas volumes in Norway are sold under long-term contracts with take-or-pay clauses. Statoil's and SDFI's annual delivery commitments under these agreements are expressed as the sum of the expected off-take under these contracts. As of 31 December 2016, the long-term commitments from NCS for the Statoil/SDFI arrangement totaled approximately 329 bcm.
Statoil and SDFI's delivery commitments, expressed as the sum of expected off-take for the calendar years 2017, 2018, 2019 and 2020, are 57.2, 44.6, 39.3 and 37.3 bcm, respectively. Any remaining volumes after covering our bilateral agreements, will be sold by trading activities at the hubs.
Statoil's currently developed gas reserves in Norway are more than sufficient to meet our share of these commitments for the next four years.
PRODUCTION VOLUMES AND PRICES
The business overview is in accordance with our segment's operations as of 31 December 2016, whereas certain disclosures on oil and gas reserves are based on geographical areas as required by the Securities and Exchange Commission (SEC). For further information about extractive activities, see sections 2.3 DPN - Development and Production Norwayand 2.4 DPI - Development and Production International.
Statoil prepares its disclosures for oil and gas reserves and certain other supplemental oil and gas disclosures by geographical area, as required by the SEC. The geographical areas are defined by country and continent. They are Norway, Eurasia excluding Norway, Africa and the Americas.
For further information about disclosures concerning oil and gas reserves and certain other supplemental disclosures based on geographical areas as required by the SEC, see note 27 Supplementary Oil and Gas Information (unaudited) to the Consolidated financial statements.
Entitlement production
The following table shows Statoil's Norwegian and international entitlement production of oil and natural gas for the periods indicated. The stated production volumes are the volumes to which Statoil is entitled, pursuant to conditions laid down in licence agreements and production-sharing agreements. The production volumes are net of royalty oil paid in kind, and of gas used for fuel and flaring. Our production is based on our proportionate participation in fields with multiple owners and does not include production of the Norwegian State's oil and natural gas. Production of an immaterial quantity of bitumen is included as oil production. NGL includes both LPG and naphtha. For further information on production volumes see section 5.6 Terms and abbreviations.
54Statoil, Annual Report on Form 20-F 2016
| Consolidated companies | Equity accounted | |
| Norway | Eurasia excluding Norway | Africa | Americas | Subtotal | Norway | Eurasia excluding Norway | Americas | Subtotal | Total |
| | | | | | | | | | |
Oil and Condensate (mmbbls) | | | | | | | | | |
2014 | 173 | 14 | 64 | 51 | 301 | - | - | 4 | 4 | 306 |
2015 | 174 | 13 | 75 | 57 | 319 | - | - | 4 | 4 | 324 |
2016 | 169 | 12 | 72 | 60 | 313 | 2 | 0 | 4 | 6 | 320 |
| | | | | | | | | | |
NGL (mmbbls) | | | | | | | | | |
2014 | 42 | - | 2 | 7 | 51 | - | - | - | - | 51 |
2015 | 44 | - | 3 | 7 | 54 | - | - | - | - | 54 |
2016 | 46 | - | 2 | 9 | 58 | 0 | - | - | 0 | 58 |
| | | | | | | | | | |
Natural gas (bcf) | | | | | | | | | | |
2014 | 1,229 | 56 | 38 | 242 | 1,565 | - | - | - | - | 1,565 |
2015 | 1,306 | 16 | 63 | 215 | 1,600 | - | - | - | - | 1,600 |
2016 | 1,338 | 34 | 60 | 227 | 1,659 | 1 | 0 | - | 2 | 1,661 |
| | | | | | | | | | |
Combined oil, condensate, NGL and gas (mmboe) | | | | | | | |
2014 | 434 | 24 | 72 | 102 | 631 | - | - | 4 | 4 | 635 |
2015 | 450 | 16 | 88 | 103 | 658 | - | - | 4 | 4 | 662 |
2016 | 454 | 18 | 85 | 110 | 666 | 3 | 0 | 4 | 7 | 673 |
| | | | | | | | | | |
The only field containing more than 15% of total proved reserves based on oil equivalent barrels is the Troll field. |
| | | | | | | | | | |
Entitlement production | | | | | | | | 2016 | 2015 | 2014 |
| | | | | | | | | | |
Troll field 1) | | | | | | | |
Oil and Condensate (mmbbls) | | | | | 15 | 14 | 14 |
NGL (mmbbls) | | | | | 2 | 2 | 2 |
Natural gas (bcf) | | | | | 321 | 386 | 317 |
Combined oil, condensate, NGL and gas (mmboe) | | | | | 74 | 85 | 73 |
| | | | | | | | | | |
1) Note that Troll is also included in Norway stated above. | | | | | | | |
Statoil, Annual Report on Form 20-F 201655
| For the year ended 31 December | | |
Operational data | 2016 | 2015 | 2014 | 16-15 change | 15-14 change |
| | | | | |
Prices | | | | | |
Average Brent oil price (USD/bbl) | 43.7 | 52.4 | 98.9 | (17%) | (47%) |
Development and Production Norway average liquids price (USD/bbl) | 39.4 | 48.2 | 90.6 | (18%) | (47%) |
Development and Production International average liquids price (USD/bbl) | 35.8 | 42.9 | 85.6 | (17%) | (50%) |
Group average liquids price (USD/bbl) | 37.8 | 45.9 | 88.6 | (18%) | (48%) |
Group average liquids price (NOK/bbl) | 317 | 371 | 559 | (14%) | (34%) |
Transfer price natural gas (USD/mmbtu) | 3.42 | 5.17 | 6.55 | (34%) | (21%) |
Average invoiced gas prices - Europe (USD/mmbtu) | 5.17 | 7.08 | 9.54 | (27%) | (26%) |
Average invoiced gas prices - North America (USD/mmbtu) | 2.13 | 2.62 | 4.39 | (19%) | (40%) |
Refining reference margin (USD/bbl) | 4.8 | 8.0 | 4.7 | (40%) | 70% |
| | | | | |
Entitlement production (mboe per day) | | | | | |
Development and Production Norway entitlement liquids production | 589 | 595 | 588 | (1%) | 1% |
Development and Production International entitlement liquids production | 435 | 436 | 383 | (0%) | 14% |
Group entitlement liquids production | 1,024 | 1,032 | 971 | (1%) | 6% |
Development and Production Norway entitlement gas production | 646 | 637 | 595 | 1% | 7% |
Development and Production International entitlement gas production | 157 | 144 | 163 | 9% | (12%) |
Group entitlement gas production | 803 | 781 | 758 | 3% | 3% |
Total entitlement liquids and gas production | 1,827 | 1,812 | 1,729 | 1% | 5% |
| | | | | |
Equity production (mboe per day) | | | | | |
Development and Production Norway equity liquids production | 589 | 595 | 588 | (1%) | 1% |
Development and Production International equity liquids production | 555 | 569 | 538 | (2%) | 6% |
Group equity liquids production | 1,144 | 1,165 | 1,127 | (2%) | 3% |
Development and Production Norway equity gas production | 646 | 637 | 595 | 1% | 7% |
Development and Production International equity gas production | 188 | 170 | 205 | 11% | (17%) |
Group equity gas production | 834 | 806 | 801 | 3% | 1% |
Total equity liquids and gas production | 1,978 | 1,971 | 1,927 | 0% | 2% |
| | | | | |
Liftings (mboe per day) | | | | | |
Liquids liftings | 1017 | 1,035 | 967 | (2%) | 7% |
Gas liftings | 824 | 802 | 779 | 3% | 3% |
Total liquids and gas liftings | 1842 | 1,837 | 1,746 | 0% | 5% |
| | | | | |
Marketing, Midstream and Processing sales volumes | | | | | |
Crude oil sales volumes (mmbl) | 811 | 829 | 811 | (2%) | 2% |
Natural gas sales Statoil entitlement (bcm) | 44.3 | 44.0 | 43.1 | 1% | 2% |
Natural gas sales third-party volumes (bcm) | 8.6 | 8.6 | 8.1 | 0% | 6% |
| | | | | |
Production cost (USD/boe) | | | | | |
Production cost entitlement volumes | 5.4 | 6.5 | 8.5 | (17%) | (24%) |
Production cost equity volumes | 5.0 | 5.9 | 7.6 | (17%) | (22%) |
56Statoil, Annual Report on Form 20-F 2016
Sales prices
The following tables present realised sales prices.
| Norway | Eurasia excluding Norway | Africa | Americas |
| | | | |
Year ended 31 December 2016 | | | | |
Average sales price oil and condensate in USD per bbl | 43.1 | 42.0 | 41.4 | 32.9 |
Average sales price NGL in USD per bbl | 24.4 | - | 21.9 | 13.1 |
Average sales price natural gas in USD per mmbtu | 5.2 | 4.8 | 4.0 | 2.1 |
| | | | |
Year ended 31 December 2015 | | | | |
Average sales price oil and condensate in USD per bbl | 52.2 | 50.7 | 49.4 | 39.4 |
Average sales price NGL in USD per bbl | 30.1 | - | 26.2 | 12.5 |
Average sales price natural gas in USD per mmbtu | 7.1 | 4.6 | 5.6 | 2.6 |
| | | | |
Year ended 31 December 2014 | | | | |
Average sales price oil and condensate in USD per bbl | 98.3 | 101.3 | 95.6 | 78.3 |
Average sales price NGL in USD per bbl | 59.3 | - | 59.7 | 37.3 |
Average sales price natural gas in USD per mmbtu | 9.5 | 5.4 | 9.2 | 4.4 |
| | | | |
Statoil, Annual Report on Form 20-F 201657
Sales volumes
Sales volumes include lifted entitlement volumes, the sale of SDFI volumes and marketing of third-party volumes. In addition to Statoil’s own volumes, we market and sell oil and gas owned by the Norwegian State through the Norwegian State's share in production licences. This is known as the State's Direct Financial Interest or SDFI. For additional information, see section SDFI oil and gas marketing and sale in Applicable laws and regulations in section 2.7 Corporate. The following table shows the SDFI and Statoil sales volume information on crude oil and natural gas for the periods indicated. The Statoil natural gas sales volumes include equity volumes sold by the MMP segment, natural gas volumes sold by the DPI segment and ethane volumes.
| For the year ended 31 December |
Sales Volumes | 2016 | 2015 | 2014 |
| | | | |
Statoil:1) | | | |
Crude oil (mmbbls)2) | 372 | 378 | 353 |
Natural gas (bcm) | 48 | 47 | 45 |
| | | | |
Combined oil and gas (mmboe) | 674 | 671 | 637 |
| | | | |
Third party volumes:3) | | | |
Crude oil (mmbbls)2) | 294 | 290 | 304 |
Natural gas (bcm) | 9 | 9 | 8 |
| | | | |
Combined oil and gas (mmboe) | 348 | 344 | 355 |
| | | | |
SDFI assets owned by the Norwegian State:4) | | | |
Crude oil (mmbbls)2) | 148 | 149 | 148 |
Natural gas (bcm) | 40 | 42 | 37 |
| | | | |
Combined oil and gas (mmboe) | 398 | 412 | 379 |
| | | | |
Total: | | | |
Crude oil (mmbbls)2) | 814 | 816 | 805 |
Natural gas (bcm) | 96 | 97 | 90 |
| | | | |
Combined oil and gas (mmboe) | 1,420 | 1,427 | 1,371 |
| | | | |
1) | The Statoil volumes included in the table above are based on the assumption that volumes sold were equal to lifted volumes in the relevant year. Volumes lifted by DPI but not sold by MMP, and volumes lifted by DPN or DPI and still in inventory or in transit may cause these volumes to differ from the sales volumes reported elsewhere in this report by MMP. |
2) | Sales volumes of crude oil include NGL and condensate. All sales volumes reported in the table above include internal deliveries to our manufacturing facilities. |
3) | Third party volumes of crude oil include both volumes purchased from partners in our upstream operations and other cargos purchased in the market. The third party volumes are purchased either for sale to third parties or for our own use. Third party volumes of natural gas include third party LNG volumes related to our activities at the Cove Point regasification terminal in the US. |
4) | SDFI volumes in columns 2015 and 2014 are updated to reflect total sales volumes natural gas (bcm). Previously third party volumes sold from storage were excluded. |
58Statoil, Annual Report on Form 20-F 2016
FINANCIAL REVIEW – GROUP PROFIT AND LOSS ANALYSIS
Our results over the last years have been heavily influenced by the drop in prices, leading to lower earnings and impairment losses, while at the same time achievements from our improvement programme affected earnings positively.
Total equity liquids and gas production was 1,978 mboe, 1,971 mboe, 1,927 mboe per day in 2016, 2015 and 2014, respectively.
From 2015 to 2016, the average daily total equity production level was maintained. Increased production from new fields coming on stream, ramp-up on various existing fields and high operational performance, was offset by reduced ownership shares as a result of divestments, expected natural decline at mature fields and operational challenges. The 2% increase in total equity production from 2014 to 2015 was primarily due to start-up and ramp-up on various fields and higher gas sales from the NCS, partially offset by expected natural decline and divestments and redeterminations.
Total entitlement liquids and gas production was 1,827 mboe per day in 2016 compared to 1,812 mboe in 2015 and 1,729 mboe per day in 2014. The total entitlement production in 2016 was up 1% and the development was almost flat for the same reasons as described above. The benefit of a lower effect from production sharing agreements (PSA effect) mainly driven by the reduction in prices, added to the slight increase in entitlement production. From 2014 to 2015, entitlement production was up 5% for the same reasons as described above and the benefit from lower PSA effects.
The PSA effect was 109 mboe, 116 mboe and 157 mboe per day in 2016, 2015 and 2014, respectively. Over time, the volumes lifted and sold will equal the entitlement production, but they may be higher or lower in any period due to differences between the capacity and timing of the vessels lifting our volumes and the actual entitlement production during the period.
Income statement under IFRS | For the year ended 31 December | | |
(in USD million) | 2016 | 2015 | 2014 | 16-15 change | 15-14 change |
| | | | | |
Revenues | 45,688 | 57,900 | 96,708 | (21%) | (40%) |
Net income from equity accounted investments | (119) | (29) | (34) | >(100%) | 17% |
Other income | 304 | 1,770 | 2,590 | (83%) | (32%) |
| | | | | |
Total revenues and other income | 45,873 | 59,642 | 99,264 | (23%) | (40%) |
| | | | | |
Purchases [net of inventory variation] | (21,505) | (26,254) | (47,980) | (18%) | (45%) |
Operating expenses and selling, general and administrative expenses | (9,787) | (11,433) | (12,815) | (14%) | (11%) |
Depreciation, amortisation and net impairment losses | (11,550) | (16,715) | (15,925) | (31%) | 5% |
Exploration expenses | (2,952) | (3,872) | (4,666) | (24%) | (17%) |
| | | | | |
Net operating income | 80 | 1,366 | 17,878 | (94%) | (92%) |
| | | | | |
Net financial items | (258) | (1,311) | 20 | 80% | N/A |
| | | | | |
Income before tax | (178) | 55 | 17,898 | N/A | (100%) |
| | | | | |
Income tax | (2,724) | (5,225) | (14,011) | (48%) | (63%) |
| | | | | |
Net income | (2,902) | (5,169) | 3,887 | 44% | N/A |
| | | | | |
| | | | | |
On 1 January 2016 Statoil changed its presentation currency from Norwegian kroner (NOK) to US dollar (USD), mainly in order to better reflect the underlying USD exposure of Statoil’s business activities and to align with industry practice.
Total revenues and other income amounted to USD 45,873 million in 2016 compared to USD 59,642 million in 2015 and USD 99,264 million in 2014.
Revenues are generated from both the sale of lifted crude oil, natural gas and refined products produced and marketed by Statoil, and from the sale of liquids and gas purchased from third parties. In addition, we market and sell the Norwegian State's share of liquids from the NCS. All purchases and sales of the Norwegian State's production of liquids are recorded as purchases [net of inventory variations] and revenues, respectively, while sales of the Norwegian State's share of gas from the NCS are recorded net.
For additional information regarding sales, see the Sales volume table in section 2.8 above.
Statoil, Annual Report on Form 20-F 201659
The 21% decrease in revenues from 2015 to 2016 was mainly due to the drop in liquids and gas prices, lower refinery margins and increased losses from reflecting the changes in fair value of derivatives and market value of storage and physical contracts. The 40% decrease in revenues from 2014 to 2015 was mainly due to the significant reduction in both liquids and gas prices. Stronger refinery margins in 2015 and higher volumes of both liquids and gas sold partially offset the decrease.
Other income was USD 304 million in 2016 compared to USD 1,770 million in 2015 and USD 2,590 million in 2014. Other income in 2016 was mainly related to gain from sale of the Edvard Grieg field on the NCS and proceeds from an insurance settlement. In both 2015 and 2014, other income mainly consisted of gain from the two step divestments of the ownership interest in the Shah Deniz project in Azerbaijan. In addition, a settlement following an arbitration ruling in Statoil’s favour, impacted other income in 2014.
As a result of the factors explained above, total revenue and other income decreased by 23% in 2016. In 2015, the decrease was 40%.
Purchases [net of inventory variation] include the cost of liquids purchased from the Norwegian State, which is pursuant to the Owner's instruction, and the cost of liquids and gas purchased from third parties. See SDFI oil and gas marketing and salein section 2.7 Corporate for more details.
Purchases [net of inventory variation] amounted to USD 21,505 million in 2016 compared to USD 26,254 million in 2015 and USD 47,980 million in 2014. The 18% decrease from 2015 to 2016 was mainly related to the decrease in liquids and gas prices. The 45% decrease from 2014 to 2015 was mainly related to the decrease in prices for liquids and gas and other oil products and lower volumes of crude, other oil products and gas sold.
Operating expenses and selling, general and administrative expenses amounted to USD 9,787 million in 2016 compared to USD 11,433 million in 2015, and USD 12,815 million in 2014.
The 14% decrease from 2015 to 2016 was mainly as a result of the on-going cost improvement initiatives and the NOK/USD exchange rate development. Lower operation and maintenance costs, decreased diluent cost and reduced transportation costs added to the decrease. Higher provisions, ramp-up and start-up of production on new fields partially offset the decrease in operating costs.
The 11% decrease from 2014 to 2015 was mainly due to lower operation and maintenance costs, reduced royalties due to lower liquids prices, decreased transportation costs in addition to positive effects from on-going cost initiatives. A curtailment gain related to the change of pension plan included in 2014, partially offset the decrease.
Depreciation, amortisation and net impairment lossesamounted to USD 11,550 million in 2016 compared to USD 16,715 million in 2015 and USD 15,925 million in 2014. Included in these totals were net impairment losses of USD 1,301 million, USD 5,526 million and USD 4,134 million for 2016, 2015 and 2014 respectively, primarily triggered by the reduced commodity price assumption and commodity forward prices.
The net impairment losses of USD 1,301 million in 2016 were mainly related to impairment of unconventional onshore assets in the USA, including an impairment of the held for sale Kai Kos Dehseh oil sands project in Canada, and conventional offshore assets in the development phase in the DPN segment. Net reversals related to other conventional assets in the DPI segment (USD 19 million) and a refinery in the MMP segment (USD 74 million) had an offsetting effect. See note 10 Property, plant and equipment to the Consolidated financial statements.
Compared to 2015, the 31% decrease was mainly due to lower impairment of assets in 2016 and reduced depreciation on mature fields. Higher proved reserves estimate and the NOK/USD exchange rate development in 2016 added to the decrease, partially offset by start-up and ramp-up of production on several fields.
Compared to 2014, the 5% increase in 2015 was mainly due to increased impairment charges and start-up and ramp-up of production of several fields. Reduced overall depreciation because of net impairments of assets in both 2014 and 2015 with a corresponding lower basis for depreciation partially offset the increase.
Exploration expenses | For the year ended 31 December | | |
(in USD million) | 2016 | 2015 | 2014 | 16-15 change | 15-14 change |
| | | | | |
Exploration expenditures (activity) | 1,437 | 2,860 | 3,730 | (50%) | (23%) |
Expensed, previously capitalised exploration expenditures | 808 | 213 | 369 | >100% | (42%) |
Capitalised share of current period's exploration activity | (285) | (1,151) | (1,161) | (75%) | (1%) |
Impairments, net of reversals | 992 | 1,951 | 1,728 | (49%) | 13% |
| | | | | |
Exploration expenses | 2,952 | 3,872 | 4,666 | (24%) | (17%) |
| | | | | |
60Statoil, Annual Report on Form 20-F 2016
In 2016, exploration expenses were USD 2,952 million, a 24% decrease compared with 2015 when exploration expenses were USD 3,872 million. Exploration expenses were USD 4,666 million in 2014.
The 24% decrease in exploration expenses in 2016 was mainly due to lower net impairment of exploration prospects and signature bonuses, lower drilling activity and less expensive wells being drilled. The decrease was partially offset by a higher portion of expenditures capitalised in previous years being expensed in 2016 and a lower capitalisation rate on exploration expenditures incurred in 2016 compared to 2015.
In 2015, exploration expenses were down 17% compared to 2014 mainly due to a lower level of drilling activity and a lower portion of previously capitalised expenditures being expensed in 2015. Increased impairment of exploration prospects and signature bonuses in 2015 compared to 2014 partially offset the increase.
As a result of the factors explained above, net operating income was USD 80 million in 2016, compared to USD 1,366 million in 2015. In 2014, net operating income was USD 17,878 million. The significant decrease in 2016 was primarily driven by the drop in liquids and gas prices, lower refinery margins and lower gains on sale of assets. The decrease was partially offset by lower net impairment charges in 2016 compared to 2015 and a reduction in operating, depreciation and exploration costs. The decrease in net operating income from 2014 to 2015 was mainly due to the drop in prices in 2015 leading to lower earnings and increased impairment charges.
Net financial items amounted to a loss of USD 258 million in 2016, compared to a loss of USD 1,311 million in 2015 and a gain of USD 20 million in 2014. The reduced loss of USD 1,053 million in 2016 is mainly due to gain on derivatives due to decrease in EUR and GBP interest rates related to our long term debt portfolio of USD 470 million for 2016, compared to a loss of USD 491 million for 2015. The decrease in 2015 was mainly related to loss of USD 491 million on derivatives related to the long term debt portfolio in 2015, compared to a gain of USD 904 million in 2014, mainly due to changes in the interest yield curves.
Income taxes were USD 2,724 million in 2016, equivalent to an effective tax rate of more than 100%, compared to USD 5,225 million, equivalent to an effective tax rate of more than 100% in 2015. In 2014, income taxes were USD 14,011 million, equivalent to an effective tax rate of 78%.
In 2016 and 2015 our group income before tax (a loss of USD 178 million in 2016 and a profit of USD 55 million in 2015) is a combination of large profits in territories with higher statutory tax rates (taking account of Norwegian Petroleum Tax including uplift) and approximately the same amount of losses in territories with lower statutory tax rates and so our effective tax rate is distorted. In addition, the “weighted average statutory tax rate” (which we calculate before taking into account Norwegian Petroleum Tax including uplift for comparability) is also distorted.
In 2016, the effective rate of tax on the profit earned by our DPN business approximated the statutory tax rate (taking account of Norwegian Petroleum Tax including uplift) but the effective tax rate on DPI losses was negative due to the inability to currently recognise tax losses and other deferred tax assets arising from those losses, primarily in the USA. Overall this results in a significant income tax charge on a relatively small group loss before tax.
The effective tax rate in 2015 was primarily influenced by losses, mainly caused by impairments recognised in countries where deferred tax assets could not be recognised, partially offset by tax exempted gains on sale of assets including Statoil’s interest in the Shah Deniz project. The effective tax rate in 2015 was also influenced by the de-recognition of deferred tax assets within the DPI segment due to uncertainty related to future taxable income.
The decrease from 2014 to 2015 was mainly caused by losses, impairments and provisions in entities with higher than average statutory tax rates. Effective tax rate in 2014 was primarily influenced by losses, mainly caused by impairments, recognised in countries where deferred tax assets could not be recognised partially offset by tax exempted gains on sale of assets. The effective tax rate in 2014 was also influenced by the recognition of a non-cash tax income following a verdict in the Norwegian Supreme Court in February 2014.
The effective tax rate is calculated as income taxes divided by income before taxes. Fluctuations in the effective tax rates from year to year are principally the result of non-taxable items (permanent differences) and changes in the relative composition of income between Norwegian oil and gas production, taxed at a marginal rate of 78%, and income from other tax jurisdictions. Other Norwegian income, including the onshore portion of net financial items, is taxed at 25% (27% in 2014 and 2015), and income in other countries is taxed at the applicable income tax rates in the various countries.
In 2016, net incomewas negative USD 2,902 million compared to negative USD 5,169 million in 2015 and positive USD 3,887 million in 2014. The increase was mainly due to lower income taxes and lower loss on net financial items, partially offset by the decrease in net operating income as explained above. The significant decrease from 2014 to 2015 was mainly due to the drop in prices, leading to lower earnings and impairment losses. Increased losses on net financial items related to derivatives added to the decrease, which was partially offset by the reduction in income taxes.
Statoil, Annual Report on Form 20-F 201661
The board of directors proposes to the annual general meeting (AGM) to maintain a dividend of USD 0.2201 per ordinary share for the fourth quarter, and continue the scrip programme giving shareholders the option to receive the dividend for the fourth quarter in cash or newly issued shares in Statoil at a 5% discount. The Annual ordinary dividends for 2016 amounted to an aggregate total of USD 1,934 million. Considering the proposed dividend, USD 4,543 million will be transferred from retained earnings in the parent company. For 2015, annual ordinary dividends amounted to an aggregate total of USD 2,860 million and USD 3,628 million in 2014.
In 2014, following a regular review process of Statoil’s 2012 Consolidated financial statements, the Financial Supervisory Authority of Norway (the FSA), ordered Statoil to change the timing of a Cove Point related onerous contract provision to a financial period prior to the first quarter of 2013, in which Statoil originally reflected the provision. Statoil did not accept the FSA’s conclusion and appealed the order to the Norwegian Ministry of Finance in accordance with due process for such matters under Norwegian regulation. In 2016, the Norwegian Ministry of Finance denied Statoil’s appeal. Statoil has decided not to pursue the matter further, as it does not impact any comparative financial periods presented in the annual Consolidated financial statements of 2016. Further reference is made to Note 23 Other commitments, contingent liabilities and contingent assets of Statoil’s 2015 Financial Statements.
In accordance with §3-3 of the Norwegian Accounting Act, the board of directors confirms that the going concern assumption on which the financial statements have been prepared, is appropriate.
FINANCIAL REVIEW – SEGMENTS PERFORMANCE
DPN profit and loss analysis
Net operating income in 2016 was USD 4,451 million, compared to USD 7,161 million in 2015 and USD 17,753 million in 2014. The USD 2,710 million decrease from 2015 to 2016 was mainly due to lower prices on liquids and gas, partly offset by reduced operating expenses, decreased depreciation and net impairment losses. The USD 10,592 million decrease from 2014 to 2015 was mainly due to lower prices on liquids and increased depreciation and net impairment losses.
The average daily production of liquids and gas was 1,235 mboe, 1,232 mboe and 1,184 mboe per day in 2016, 2015 and 2014, respectively.
The average daily total production level was maintained from 2015 to 2016 by high operational performance, new fields on stream and new wells from existing fields.
The average daily total production of liquids and gas increased by 4% from 2014 to 2015, mainly due to ramp up of new fields, increased sales gas and good operational performance, partly offset by expected natural decline and divestments.
Over time, the volumes lifted and sold will equal entitlement production, but may be higher or lower in any period due to differences between the capacities and timing of the vessels lifting the volumes and the actual entitlement production during the period.
Income statement under IFRS | For the year ended 31 December | | |
(in USD million) | 2016 | 2015 | 2014 | 16-15 change | 15-14 change |
| | | | | |
Revenues | 13,036 | 17,170 | 27,914 | (24%) | (38%) |
Net income from equity accounted investments | (78) | 3 | 11 | N/A | (70%) |
Other income | 119 | 166 | 1,002 | (28%) | (83%) |
| | | | | |
Total revenues and other income | 13,077 | 17,339 | 28,926 | (25%) | (40%) |
| | | | | |
Operating expenses and selling, general and administrative expenses | (2,547) | (3,223) | (4,034) | (21%) | (20%) |
Depreciation, amortisation and net impairment losses | (5,698) | (6,379) | (6,301) | (11%) | 1% |
Exploration expenses | (383) | (576) | (838) | (34%) | (31%) |
| | | | | |
Net operating income | 4,451 | 7,161 | 17,753 | (38%) | (60%) |
| | | | | |
Total revenues and other income were USD 13,077 million in 2016, USD 17,339 million in 2015 and USD 28,926 million in 2014.
The 24% decrease in revenues from 2015 to 2016 was mainly due to reduced liquids and gas prices. The 38% decrease in revenues from 2014 to 2015 was mainly due to reduced liquids prices and exchange rate development (NOK/USD). In addition, in 2015 a re-assessed valuation estimate of earn-out derivatives resulted in an unrealised fair value loss on derivatives and impacted revenues negatively.
62Statoil, Annual Report on Form 20-F 2016
Other income in 2016 was impacted by gain from sale of Edvard Grieg of USD 114 million. Other income in 2015 was impacted by gain from the sale of certain ownership interests on the NCS to Repsol of USD 142 million. Other income in 2014 was impacted by gain from the sale of certain ownership interests on the NCS to Wintershall of USD 861 million.
Operating expenses and selling, general and administrative expenses were USD 2,547 million in 2016, compared to USD 3,223 million in 2015 and USD 4,034 million in 2014. In 2016, expenses decreased compared to 2015 mainly due to cost improvements and exchange rate development (NOK/USD). In 2015, expenses decreased compared to 2014 mainly due to exchange rate development (NOK/USD), cost improvements and reduced turnaround activity. This was partly offset by gain related to changes in pension scheme in 2014 and ramp up of new fields during 2015.
Depreciation, amortisation and net impairment losses were USD 5,698 million in 2016, compared to USD 6,379 million in 2015 and USD 6,301 million in 2014. The decrease of 11% from 2015 to 2016 was mainly due to reduced net impairments, exchange rate development (NOK/USD) and increased reserves, partly offset by ramp up of new fields in 2016. The increase from 2014 to 2015 was mainly due to net impairments of USD 1,074 million in 2015 and ramp-up of new fields in 2015, offset by exchange rate development (NOK/USD).
Exploration expenseswere USD 383 million in 2016, compared to USD 576 million in 2015 and USD 838 million in 2014. The reduction from 2015 to 2016 was mainly due to lower drilling activity and more expensive wells being drilled in 2015, partially offset by a lower portion of current exploration expenditures being capitalised. The reduction in exploration expenses from 2014 to 2015 was mainly due to lower drilling activity, a lower portion of previously capitalised exploration expenditures being expensed in 2015 and idle rig costs in 2014.
DPI profit and loss analysis
Net operating incomein 2016 was negative USD 4,352 million, compared to negative USD 8,729 million in 2015 and negative USD 2,703 million in 2014. The positive development from 2015 to 2016 was caused primarily by less impairment losses, and also by lower operating expenses. The negative development from 2014 to 2015 was caused primarily by lower realised liquids and gas prices and more impairment losses.
The average daily equity liquids and gas production (see section 5.6Terms and abbreviations)was 743 mboe per day in 2016, compared to 739 mboe per day in 2015 and 744 mboe per day in 2014. The increase of 0.5% from 2015 to 2016 was driven primarily by the effect of the ramp-up of fields, mainly in Ireland, Algeria, and the US. The increase was partly offset by the divestment of Shah Deniz (Azerbaijan), natural decline primarily at mature fields in Angola as well as some operational challenges in 2016. The decrease of 0.7% from 2014 to 2015 was driven primarily by the effect of the divestment of Shah Deniz and a portion of Marcellus (US), and natural decline, primarily at mature fields in Angola. The decrease was partly offset by the ramp-up of fields in Angola and the US. Divestment of Shah Deniz occurred in both 2014 and 2015.
The average daily entitlement liquids and gas production (see section 5.6Terms and abbreviations)was 592 mboe per day in 2016, compared to 580 mboe per day in 2015, and 546 mboe per day in 2014. Entitlement production in 2016 was up by 2% due to the increased equity production as described above and a relatively lower effect from production sharing agreements (PSA effect), mainly driven by the decrease in prices. The increase from 2014 to 2015 was driven by lower PSA effect. The PSA effect was 109 mboe, 116 mboe and 157 mboe per day in 2016, 2015 and 2014, respectively.
Over time, the volumes lifted and sold will equal our entitlement production, but they may be higher or lower in any period due to differences between the capacity and timing of the vessels lifting our volumes and the actual entitlement production during the period. See section 5.6Terms and abbreviations for more information.
Income statement under IFRS | For the year ended 31 December | | |
(in USD million) | 2016 | 2015 | 2014 | 16-15 change | 15-14 change |
| | | | | |
Revenues | 6,623 | 7,135 | 12,823 | (7%) | (44%) |
Net income from equity accounted investments | (100) | (91) | (113) | (10%) | 20% |
Other income | 134 | 1,156 | 951 | (88%) | 22% |
| | | | | |
Total revenues and other income | 6,657 | 8,200 | 13,661 | (19%) | (40%) |
| | | | | |
Purchases [net of inventory] | (7) | (10) | (2) | (28%) | >100% |
Operating expenses and selling, general and administrative expenses | (2,923) | (3,391) | (3,654) | (14%) | (7%) |
Depreciation, amortisation and net impairment losses | (5,510) | (10,231) | (8,885) | (46%) | 15% |
Exploration expenses | (2,569) | (3,296) | (3,824) | (22%) | (14%) |
| | | | | |
Net operating income | (4,352) | (8,729) | (2,703) | 50% | >(100%) |
| | | | | |
Statoil, Annual Report on Form 20-F 201663
DPI generated total revenues and other income of USD 6,657 million in 2016 compared to USD 8,200 million in 2015 and USD 13,661 million in 2014.
Revenues in 2016 were negatively impacted by lower realised liquids and gas prices, partly offset by lower provisions relating to commercial disputes in 2016 compared to 2015. The decrease from 2014 to 2015 was mainly caused by lower realised liquids and gas prices, partly offset by an increase in lifted volumes. In addition, higher provisions relating to commercial disputes in 2015 compared to 2014 negatively impacted revenues.For information related to the disputessee note 23 Other commitments and contingenciesto the Consolidated financial statements.
Other income was positively impacted by gains from sales of assets of USD 1,156 million in 2015 and USD 961 million in 2014, related primarily to the sale of ownership interest in the Shah Deniz project and the South Caucasus Pipeline.
As a result of the factors explained above, total revenues and other income decreased by 19% in 2016. In 2015, total revenues and other income decreased by 40%.
Operating expenses and selling, general and administrative expenseswere USD 2,923 million in 2016, compared to USD 3,391 million in 2015 and USD 3,654 million in 2014. The 14% decrease from 2015 to 2016 was mainly due to lower operating and maintenance costs for various fields, in addition to lower diluent expenses. The decreases were partially offset by operating and transportation costs for the new fields coming on stream. The 7% decrease from 2014 to 2015 was mainly due to reduced operations and maintenance costs, lower royalties caused by lower prices, and portfolio changes. Production ramp-up and start-up of new fields partially offset the decrease.
Depreciation, amortisation and net impairment losseswere USD 5,510 million in 2016, compared to USD 10,231 million in 2015 and USD 8,885 million in 2014. The 46% decrease was primarily caused by lower net impairment losses in 2016 compared to 2015. Net impairment losses amounted to USD 541 million in 2016, and resulted mainly from reduced long-term price assumptions with the largest effect being on the unconventional onshore assets in North America. In addition, depreciations decreased due to higher reserves estimates. The decreases were partially offset by start-up and ramp-up of production from new fields.
The 15% increase from 2014 to 2015 was primarily caused by net impairment losses of USD 5,416 million in 2015, mainly related to unconventional onshore assets in North America and certain conventional upstream assets. The impairment losses resulted primarily from reduced short-term forward prices in combination with reduced long-term oil price forecasts. In addition, depreciation increased due to higher production from start-up and ramp-up on various fields. The increases were partly offset by effect on depreciations from net impairments in 2014 and 2015 and reduced depreciations from higher reserves estimates.
Exploration expenseswereUSD 2,569 million in 2016, compared to USD 3,296 million in 2015 and USD 3,824 million in 2014. The 22% reduction from 2015 to 2016 was primarily due to lower impairments, lower drilling activity and lower well costs in 2016. Higher portion of wells capitalised in previous periods being expensed this year and a lower capitalisation rate in 2016 partially offset the decrease. The reduction from 2014 to 2015 was mainly due to lower drilling activity partly offset by increased impairments of oil and gas prospects in the Gulf of Mexico.
MMP profit and loss analysis
Net operating income was USD 623 million, USD 2,931 million and USD 2,608 million in 2016, 2015 and 2014, respectively. 2016 net operating income was positively impacted by solid liquids trading results as in 2015. The decrease of USD 2,308 million from 2015 to 2016 was mainly due to lower fair value of certain derivatives of USD 713 million as a result of increased forward curve. In addition, refining and gas marketing margins were reduced and production from processing plants lower than in 2015.
The increase of USD 324 million from 2014 to 2015 was mainly due to higher refining margins and solid liquids trading results and net reversal of impairment charges of USD 421 million. These increases were partially offset by the impact by Sonatrach Arbitration Settlement of USD 463 million in Statoil’s favour in 2014.
Total natural gas sales volumes were 52.9 bcm in 2016, 52.6 bcm in 2015 and 51.2 bcm in 2014. The 0.5% increase in total gas volumes sold from 2015 to 2016 was related to higher entitlement production on the NCS, partially offset by lower entitlement production internationally. The 3% increase in total gas volumes sold from 2014 to 2015 was related to higher entitlement production on the NCS in addition to higher third party volumes in Europe, partially offset by lower entitlement production internationally and lower third party volumes in the US. The chart does not include any volumes sold on behalf of the Norwegian State's direct financial interest (SDFI).
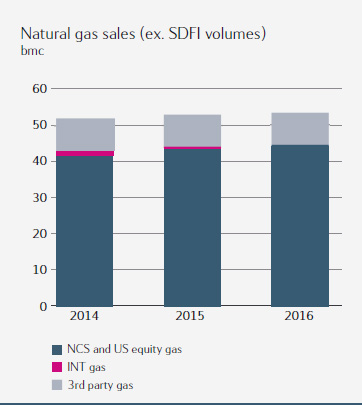
64Statoil, Annual Report on Form 20-F 2016
In 2016, the average invoiced natural gas sales price in Europe was USD 5.17 per MMBtu compared to USD 7.08 per MMBtu in 2015, a decrease of 27%. Abundant gas supply in the first three quarters together with a mild winter had a negative influence on the prices. For the fourth quarter the market situation tightened and prices increased. LNG price has continued its downward trend, and only had a marginal positive effect on the European gas price in 2016. The average invoiced natural gas sales price in Europe was approximately 26% lower in 2015 than in 2014, mainly due to higher share of gas indexation in the gas contract portfolio.
In 2016, the average invoiced natural gas sales price in North Americas was USD 2.12 per MMBtu compared to USD 2.62 per MMBtu in 2015, a decrease of 19% due to significantly warmer weather first quarter 2016 than in 2015, and an abundant gas supply in the second quarter. In the third and fourth quarter prices rose due to cooler weather in New York and Toronto. The average invoiced natural gas sales price in North Americas was approximately 40% lower in 2015 than in 2014, mainly due to high market prices in first quarter 2014 as a result of exceptionally cold weather in North East combined with long term pipeline capacity agreements enabling access to premium markets in Toronto and Manhattan.
All of Statoil's gas produced on the NCS is sold by MMP, purchased from DPN at the fields’ lifting point at a market-based internal price with deduction for the cost of bringing gas from the field to market and a marketing fee element. Our average internal purchase price for gas was USD 3.42 per MMBtu in 2016, a decrease of 34% compared to USD 5.17 per MMBtu in 2015.
Average crude, condensate and NGL sales were 2.2 mmbbl per day in 2016 of which approximately 1.01 mmbbl were sales of our equity volumes, 0.80 mmbbl sales of third-party volumes and 0.40 mmbbl sales of volumes purchased from SDFI. Our average sales volumes were 2.3 and 2.2 mmbbl per day in 2015 and 2014. The average daily third-party volumes sold were 0.79 and 0.83 mmbbl in 2015 and 2014.
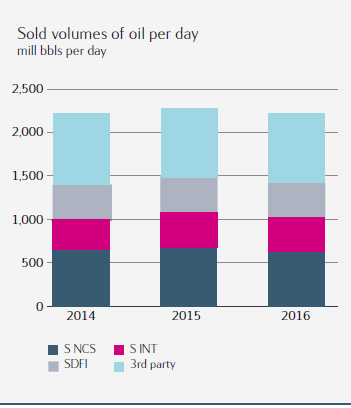
Statoil, Annual Report on Form 20-F 201665
MMPs refining margins were considerably lower the first three quarters 2016 compared to 2015, and results were impacted by lower production from the refineries. The average refining margin was at the same level in fourth quarter 2015 and 2016. Statoil's refining reference margin was 4.8 USD/bbl in 2016, compared to 8.0 USD/bbl in 2015, a decrease of 40%. The refining reference margin was 4.7 USD/bbl in 2014.
Income statement under IFRS | For the year ended 31 December | | |
(in USD million) | 2016 | 2015 | 2014 | 16-15 change | 15-14 change |
| | | | | |
Revenues | 44,847 | 57,873 | 94,483 | (23%) | (39%) |
Net income from equity accounted investments | 61 | 55 | 73 | 12% | (25%) |
Other income | 72 | 178 | 615 | (60%) | (71%) |
| | | | | |
Total revenues and other income | 44,979 | 58,106 | 95,171 | (23%) | (39%) |
| | | | | |
Purchases [net of inventory] | (39,696) | (50,547) | (86,689) | (21%) | (42%) |
Operating expenses and selling, general and administrative expenses | (4,439) | (4,664) | (5,287) | (5%) | (12%) |
Depreciation, amortisation and net impairment losses | (221) | 37 | (583) | >(100%) | >(100%) |
| | | | | |
Net operating income | 623 | 2,931 | 2,608 | (79%) | 12% |
| | | | | |
Total revenues and other income were USD 44,979 million in 2016, compared to USD 58,106 million in 2015 and USD 95,171 million in 2014.
The decrease in revenues from 2015 to 2016 was mainly due to decrease in crude and gas prices. The average crude price in USD declined by approximately 17% in 2016 compared to 2015. Revenues in 2016 were negatively impacted by loss from derivatives mainly related to hedges of physical positions due to significant increase in the forward curve in the oil and gas market.
The decrease in revenues from 2014 to 2015 was mainly due to decrease in crude and gas prices, partially offset by higher volumes for crude, other oil products and gas sold. The average crude price in USD declined by approximately 47% in 2015 compared to 2014. Revenues in 2015 were positively impacted by gains from derivatives, mainly due to significant drop in the forward curve in the oil and gas market.
Other income in 2016 was positively impacted by gain on sale of assets of USD 72 million. In 2015, other income was positively impacted by gain on sale of assets of USD 178 million.
66Statoil, Annual Report on Form 20-F 2016
As a result of the factors explained above, total revenues and other income decreased by 23% and 39% in 2016 and 2015, respectively.
Purchases [net of inventory] were USD 39,696 million in 2016, compared to USD 50,547 million in 2015 and USD 86,689 million in 2014. The decrease from 2015 to 2016 was mainly due to decrease in crude and gas prices. The decrease from 2014 to 2015 was mainly due to decrease in gas and crude prices and lower volumes of crude, other oil products and gas sold.
Operating expenses and selling, general and administrative expenses were USD 4,439 million in 2016, compared to USD 4,664 million in 2015 and USD 5,287 million in 2014. The decrease from 2015 to 2016 was mainly due to lower transportation cost and the ongoing cost reduction initiatives in 2016.
The decrease from 2014 to 2015 was mainly due to the ongoing cost reduction initiatives and a positive USD/NOK currency effect added to the decrease of USD 622 million.
Depreciation, amortisation and net impairment losses amounted to a loss of USD 221 million in 2016, compared to an income of USD 37 million in 2015 and a loss of USD 583 million in 2014. The increase in depreciation, amortisation and net impairment losses from 2015 to 2016 was mainly caused by lower reversal of impairments in 2016 compared to 2015. Net reversal of impairments in 2016 was mainly related to a refinery asset, impacted by expected lower cost base in the future cash flows. The decrease in depreciation, amortisation and net impairment losses from 2014 to 2015 was mainly caused by net reversal of impairment charges of USD 421 million in 2015 triggered by increased refinery margins and operational improvement.
Other operations
The Other reporting segment includes activities within New Energy Solutions; Global Strategy and Business Development; Technology, Projects and Drilling; and Corporate staffs and support functions.
In 2016, the Other reporting segment recorded a net operating loss of USD 423 million compared to a net operating loss of USD 129 million in 2015 and a net operating loss of USD 199 million in 2014.
Statoil, Annual Report on Form 20-F 201667
2.9 LIQUIDITY AND CAPITAL RESOURCES
Review of cash flows
Statoil`s cash flows in 2016 reflect a solid cash flow in a low price environment.
CONSOLIDATED STATEMENT OF CASH FLOWS | | | | |
| | Full year |
(in USD million) | Note | 2016 | 2015 | 2014 |
| | | | |
Income before tax | | (178) | 55 | 17,898 |
| | | | |
Depreciation, amortisation and net impairment losses | 10, 11 | 11,550 | 16,715 | 15,925 |
Exploration expenditures written off | 11 | 1,800 | 2,164 | 2,097 |
(Gains) losses on foreign currency transactions and balances | | (137) | 1,166 | 883 |
(Gains) losses on sales of assets and businesses | 4 | (110) | (1,716) | (1,998) |
(Increase) decrease in other items related to operating activities | | 1,076 | 558 | (1,671) |
(Increase) decrease in net derivative financial instruments | 25 | 1,307 | 1,551 | 254 |
Interest received | | 280 | 363 | 341 |
Interest paid | | (548) | (443) | (551) |
| | | | |
Cash flows provided by operating activities before taxes paid and working capital items | | 15,040 | 20,414 | 33,178 |
| | | | |
Taxes paid | | (4,386) | (8,078) | (15,308) |
| | | | |
(Increase) decrease in working capital | | (1,620) | 1,292 | 2,335 |
| | | | |
Cash flows provided by operating activities | | 9,034 | 13,628 | 20,205 |
| | | | |
Additions through business combinations | 4 | 0 | (398) | 0 |
Capital expenditures and investments | | (12,191) | (15,518) | (19,497) |
(Increase) decrease in financial investments | | 877 | (2,813) | (1,919) |
(Increase) decrease in other non-current items | | 107 | (22) | 128 |
Proceeds from sale of assets and businesses | 4 | 761 | 4,249 | 3,514 |
| | | | |
Cash flows used in investing activities | | (10,446) | (14,501) | (17,775) |
| | | | |
New finance debt | 18 | 1,322 | 4,272 | 3,010 |
Repayment of finance debt | | (1,072) | (1,464) | (1,537) |
Dividend paid | 17 | (1,876) | (2,836) | (5,499) |
Net current finance debt and other | | (333) | (701) | (2) |
| | | | |
Cash flows provided by (used in) financing activities | | (1,959) | (729) | (4,028) |
| | | | |
Net increase (decrease) in cash and cash equivalents | | (3,371) | (1,602) | (1,598) |
| | | | |
Effect of exchange rate changes on cash and cash equivalents | | (152) | (871) | (1,329) |
Cash and cash equivalents at the beginning of the period (net of overdraft) | 16 | 8,613 | 11,085 | 14,013 |
| | | | |
Cash and cash equivalents at the end of the period (net of overdraft) | 16 | 5,090 | 8,613 | 11,085 |
68Statoil, Annual Report on Form 20-F 2016
Cash flows provided by operations
The most significant drivers of cash flows provided by operations were the level of production and prices for liquids and natural gas that impact revenues, purchases [net of inventory], taxes paid and changes in working capital items.
Cash flows provided by operating activities were reduced by USD 4,594 million compared to the full year 2015. The decrease was mainly due to reduced liquids and gas prices, partially offset by lower taxes paid.
Cash flows provided by operating activitieswere USD 13,628 million in 2015 compared to USD 20,205 million in 2014, which is a decrease of USD 6,577 million driven by a significant reduction in both liquids and gas prices. The decrease was partially offset by positive changes in working capital and lower taxes paid in 2015 compared to 2014.
Cash flows used in investing activities
Cash flows used in investing were reduced by USD 4,055 million compared to the full year 2015. The decrease was due to significantly lower capital expenditures, lower financial investments and reduced proceeds from sale of assets.
Cash flows used in investing activitieswere USD 14,501 million in 2015 compared to USD 17,775 million in 2014, a decrease of USD 3,274 million mainly due to reduced capital expenditures. The proceeds from sale of assets in 2015 of USD 4,249 million were mainly related to the divestment of the remaining interests in the Shah Deniz field and the South Caucasus pipeline, sale of office buildings, sale of interest in the Marcellus onshore play, sale of interests in Trans Adriatic pipeline AG and the sale of interests in licenses on the NCS.
Cash flows provided by (used in) financing activities
Cash flows used in financing activities increased by USD 1,230 million compared to the full year 2015. The change is mainly due to reduced cash flow from finance debt, partially offset by reduced cash dividend due to the scrip dividend.
Cash flows used in financing activities were USD 729 million in 2015 and were mainly related to payments of dividends USD 2,836 million and repayments of debt USD 1,464 million, partially offset by issuance of new debt of USD 4,272 million. Cash flows used in financing activities were USD 4,028 million in 2014 and were mainly related to payments of dividends and repayments of debt, partly offset by issuance of new debt in November 2014 of USD 3,010 million.
Financial assets and debt
Statoil's financial position is strong although its net debt to capital employed ratio before adjustments at year end increased from 25.6% in 2015 to 34.4% in 2016. See section 5.2 for non-GAAP measures for net debt ratio. Net interest-bearing debt increased from USD 13.9 billion to USD 18.4 billion. During 2016 Statoil's total equity decreased from USD 40.3 billion to USD 35.1billion, mainly due to impairments recognised in 2016 and dividend paid. Cash flows provided by operating activities were reduced in 2016 mainly due to lower prices. Cash flows used in investing activities reduced in 2016. Statoil has paid out four quarterly dividends in 2016. For the fourth quarter of 2016 the board of directors will propose to the annual general meeting (AGM) to maintain a dividend of USD 0.2201 per share and to maintain the scrip dividend program initiated from the fourth quarter 2015.For details, see note 17 Shareholders equity and dividends to the Consolidated financial statements.
Statoil believes that, given its current liquidity reserves, including committed credit facilities of USD 5.0 billion and its access to various capital markets, Statoil has sufficient funds available to meet its liquidity needs, including working capital.
Funding needs arise as a result of Statoil’s general business activities. Statoil generally seeks to establish financing at the corporate (top company) level. Project financing may also be used in cases involving joint ventures with other companies. Statoil aims to have access at all times to a variety of funding sources in respect of markets and instruments; as well as maintaining relationships with a core group of international banks that provide a wide range of banking services.
Moody's and Standard & Poor's (S&P) provide credit ratings on Statoil. Statoil’s current long-term ratings are A+ and Aa3 from S&P and Moody’s, respectively. The rating from S&P was revised from AA- credit watch negative to A+ with a stable outlook on 22 February 2016 while the rating from Moody’s was revised from Aa2 on review for downgrade to Aa3 with stable outlook on 21 March 2016. Both rating agency revisions were triggered by the low commodity price environment, and similar downgrades were seen across the sector around that time. The short-term ratings are P-1 from Moody's and A-1 from S&P. In order to maintain financial flexibility going forward, Statoil intend to keep key financial ratios at levels consistent with our objective of maintaining Statoil's long-term credit rating at least within the single A category on a stand-alone basis.
The management of financial assets and liabilities takes into consideration funding sources, the maturity profile of non-current debt, interest rate risk, currency risk and available liquid assets. Statoil’s borrowings are denominated in various currencies and normally swapped into USD. In addition, interest rate derivatives, primarily interest rate swaps, are used to manage the interest rate risk of our long-term debt portfolio. The Group's Capital Markets unit manages the funding and liquidity activities at Group level.
Statoil, Annual Report on Form 20-F 201669
Statoil has diversified its cash investments across a range of financial instruments and counterparties to avoid concentrating risk in any one type of investment or any single country. As of 31 December 2016, approximately 7% of Statoil’s liquid assets were held in USD-denominated assets, 21% in NOK, 58% in EUR, 5% in DKK and 9% in SEK, before the effect of currency swaps and forward contracts. Approximately 56% of Statoil’s liquid assets were held in treasury bills and commercial paper, 42% in time deposits, 1% in money market funds and 1% at in bank deposits. As of 31 December 2016, approximately 4.7% of Statoil’s liquid assets were classified as restricted cash (including collateral deposits).
Statoil’s general policy is to keep a liquidity reserve in the form of cash and cash equivalents or other current financial investments in Statoil’s balance sheet, as well as committed, unused credit facilities and credit lines in order to ensure that Statoil has sufficient financial resources to meet short-term requirements.
Long-term funding is raised when a need is identified for such financing based on Statoil’s business activities, cash flows and required financial flexibility or when market conditions are considered to be favourable.
The Group's borrowing needs are usually covered through the issuance of short-, medium- and long-term securities, including utilisation of a US Commercial Paper Programme (programme limit USD 5.0 billion) and a Shelf Registration Statement (unlimited) filed with the Securities and Exchange Commission (SEC) in the USA as well as through issues under a Euro Medium-Term Note (EMTN) Programme (updated 28 October 2016 with a limit of EUR 20.0 billion) listed on the London Stock Exchange. Committed credit facilities and credit lines may also be utilised. After the effect of currency swaps, the major part of Statoil’s borrowings is in USD.
During 2016, Statoil issued bonds with 10 and 20 year maturities for a total amount of EUR 1.2 billion (USD 1.3 billion). All the bonds are unconditionally guaranteed by Statoil Petroleum AS. For more information, see note 18 Finance debt to the Consolidated financial statements.
Statoil issued new debt securities in 2015 equivalent to USD 4.3 billion and in 2014 equivalent to USD 3.0 billion.
Financial indicators | | | |
| | | | |
Financial indicators | For the year ended 31 December |
(in USD million) | 2016 | 2015 | 2014 |
| | | | |
Gross interest-bearing financial liabilities 1) | 31,673 | 32,291 | 31,154 |
Net interest-bearing liabilities before adjustments | 18,372 | 13,852 | 12,004 |
Net debt to capital employed ratio 2) | 34.4% | 25.6% | 19.0% |
Net debt to capital employed ratio adjusted 3) | 35.6% | 26.8% | 20.0% |
Cash and cash equivalents | 5,090 | 8,623 | 11,182 |
Current financial investments | 8,211 | 9,817 | 7,968 |
ROACE 4) | (8.0%) | 2.7% | 11.3% |
Ratio of earnings to fixed charges 5) | 0.9 | 1.0 | 7.0 |
| | | | |
1) | Defined as non-current and current finance debt. |
2) | As calculated according to IFRS. Net debt to capital employed ratio is the net debt divided by capital employed. Net debt is interest-bearing debt less cash and cash equivalents and current financial investments. Capital employed is net debt, shareholders' equity and minority interest. |
3) | In order to calculate the net debt to capital employed ratio adjusted, Statoil makes adjustments to capital employed as it would be reported under IFRS. Restricted funds held as financial investments in Statoil Forsikting AS and Collateral deposits has been added to the net debt whilst the SDFI part of the financial lease in the Snøhvit vessel has been taken out of the net debt. See section 5.2 Net debt to capital employed ratio for a reconciliation of capital employed and a description of why Statoil considers this measure to be useful. |
4) | ROACE is equal to net income adjusted for financial items after tax, divided by average capital employed over the last 12 months. See section 5.2 Return on average capital employed (ROACE) for a reconciliation of ROACE and a description of why Statoil considers this measure to be useful. |
5) | Based on IFRS. For the purpose of these ratios, earnings consist of the income before (i) tax, (ii) minority interest, (iii) amortisation of capitalised interest and (iv) fixed charges (which have been adjusted for capitalised interest) and after adjustment for unremitted earnings from equity accounted entities. Fixed charges consist of interest (including capitalised interest) and estimated interest within operating leases. |
| | | | |
Gross interest-bearing debt
Gross interest-bearing debt was USD 31.7 billion, USD 32.3 billion and USD 31.2 billion at 31 December 2016, 2015 and 2014, respectively. The USD 0.6 billion net decrease from 2015 to 2016 was due to a decrease in non-current finance debt of USD 2.0 billion, offset by an increase in current finance debt of USD 1.4 billion. The USD 1.1 billion increase from 2014 to 2015 was due to an increase in non-current finance debt of USD 2.4 billion offset by a decrease in current finance debt of USD 1.3 billion. Our weighted average annual interest rate was 3.41%, 3.39% and 3.78% at 31 December 2016, 2015 and 2014, respectively. Statoil’s weighted
70Statoil, Annual Report on Form 20-F 2016
average maturity on finance debt was nine years at 31 December 2016, nine years at 31 December 2015 and nine years at 31 December 2014.
Net interest-bearing debt
Net interest-bearing debt before adjustments were USD 18.4 billion, USD 13.9 billion and USD 12.0 billion at 31 December 2016, 2015 and 2014, respectively. The increase of USD 4.5 billion from 2015 to 2016 was mainly related to a decrease in cash and cash equivalents of USD 3.5 billion, a decrease of current financial investments of USD 1.6 billion offset by a USD 0.6 billion decrease in gross interest-bearing debt. Negative cash flow in 2016 is the main reason. The increase of USD1.8 billion from 2014 to 2015 was related to an increase in gross interest-bearing debt of USD 1.1 billion offset and a decrease in cash and cash equivalents and current financial investments of USD 0.7 billion.
The net debt to capital employed ratio
The net debt to capital employed ratio before adjustments was 34.4%, 25.6% and 19.0% in 2016, 2015 and 2014 respectively.
The net debt to capital employed ratio adjusted (non-GAAP financial measure, see footnote three above) was 35.6%, 26.8% and 20.0% in 2016, 2015, and 2014, respectively.
The 8.8 percentage points increase in net debt to capital employed ratio before adjustments from 2015 to 2016 was related to the increase in net interest-bearing debt adjusted of USD 4.5 billion in combination with a decrease in capital employed adjusted of USD 0.7 billion. The 6.6 percentage points increase in net debt to capital employed ratio before adjustments from 2014 to 2015 was related to an increase in net interest-bearing debt adjusted of USD 1.8 billion in combination with a decrease in capital employed adjusted of USD 9.1 billion.
The 8.8 percentage points increase in net debt to capital employed ratio adjusted from 2015 to 2016 was related to the increase in net interest-bearing debt adjusted of USD 4.6 billion in combination with a decrease in capital employed adjusted of USD 0.6 billion. The 6.8 percentage points increase in net debt to capital employed ratio adjusted from 2014 to 2015 was related to an increase in net interest-bearing debt adjusted of USD 1.9 billion in combination with a decrease in capital employed adjusted of USD 9.1 billion.
Cash, cash equivalents and current financial investments
Cash and cash equivalents were USD 5.1 billion, USD 8.6 billion and USD 11.2 billion at 31 December 2016, 2015 and 2014 respectively. See note 16 Cash and cash equivalents to the Consolidated financial statements for information concerning restricted cash. Current financial investments, which are part of Statoil’s liquidity management, amounted to USD 8.2 billion, USD 9.8 billion and USD 8.0 billion at 31 December 2016, 2015 and 2014, respectively.
Investments
In 2016, capital expenditures, defined as additions to property, plant and equipment (including capitalised financial leases), capitalised exploration expenditures, intangible assets, long-term share investments and investments in equity accounted companies, amounted to USD 14.1 billion, of which USD 10.1 billion were organic capital expenditures (excluding acquisitions, capital leases and other investments with significant different cash flow pattern). Among items excluded from the organic capital expenditure in 2016 were investment in ownership in Lundin Petroleum AB, acquisition of a 66% operated interest in the offshore licence BM-S-8 in Brazil and acquisition of a 50% stake in the Arkona offshore wind farm in Germany.
In 2015, capital expenditures were USD 15.5 billion, of which organic capital expenditures amounted to USD 14.7 billion.
In Norway, a substantial proportion of our 2017 capital expenditures will be spent on ongoing development projects such as Johan Sverdrup, Gina Krog and Aasta Hansteen, in addition to various extensions, modifications and improvements on currently producing fields like Gullfaks, Oseberg and Troll.
Internationally, we currently estimate that a substantial proportion of our 2017 capital expenditure will be spent on the following ongoing and planned development projects: Mariner in UK, Peregrino in Brazil, Stampede and onshore activity in the US.
In the area of renewable energy, a substantial proportion of our 2017 capital expenditure is expected to be spent on the following offshore wind projects: Arkona in Germany and Hywind in the UK.
Statoil finances its capital expenditures both internally and externally. For more information, see Financial assets and debt earlier in this section.
As illustrated in Principal contractual obligations later in this section, Statoil have committed to certain investments in the future. The further into the future, the more flexibility we will have to revise expenditure. This flexibility is partly dependent on the expenditure our partners in joint ventures agree to commit to. A large part of the capital expenditure for 2017 is committed.
Statoil, Annual Report on Form 20-F 201671
Statoil may alter the amount, timing or segmental or project allocation of our capital expenditures in anticipation of or as a result of a number of factors outside our control.
Impact of reduced prices
Our results are affected by the development in the price of raw materials and services that are necessary for the development and operation of oil and gas producing assets.
Cost development in the prices of goods, raw materials and services that are necessary for the development and operation of oil and gas producing assets can vary considerably over time and between each market segment.
Prices in supplier markets have been reduced and in several supplier market segments Statoil has achieved reduced rates compared to the 2014/2015 level. Such savings have been achieved both in new and renegotiated contracts.
See the analysis of profit and loss in section 2.8 Operating and financial performance as well section 2.1 Group Outlook.
Principal contractual obligations
The table summarises our principal obligations and includes contractual obligations, but excludes derivatives and other hedging instruments as well as asset retirement obligations, as these obligations for the most part are expected to lead to cash disbursements more than five years in the future. Obligations payable by Statoil to unconsolidated equity affiliates are included gross in the table. Where Statoil includes both an ownership interest and the transport capacity cost for a pipeline in the consolidated accounts, the amounts in the table include the transport commitments that exceed Statoil's ownership share. See Disclosures about market risk in section 2.10 Risk review for more information.
72Statoil, Annual Report on Form 20-F 2016
| As at 31 December 2016 |
Contractual obligations | Payment due by period 1) |
(in USD million) | Less than 1 year | 1-3 years | 3-5 years | More than 5 years | Total |
| | | | | | |
Undiscounted non-current finance debt | 3,554 | 4,641 | 9,133 | 23,822 | 41,151 |
Minimum operating lease payments | 1,993 | 2,693 | 1,657 | 2,306 | 8,649 |
Nominal minimum other long-term commitments2) | 1,483 | 2,657 | 2,200 | 5,513 | 11,853 |
| | | | | | |
Total contractual obligations | 7,030 | 9,992 | 12,990 | 31,642 | 61,653 |
| | | | | | |
1) | "Less than 1 year" represents 2016; "1-3 years" represents 2017 and 2018, "3-5 years" represents 2019 and 2020, while "More than 5 years" includes amounts for later periods. |
2) | For further information see note 23 Other commitments and contingencies to the Consolidated financial statements. |
| | | | | | |
Non-current finance debt in the table represents principal payment obligations. For information on interest commitments relating to long-term debt, reference is made to note 18 Finance debt and note 22 Leases to the Consolidated financial statements.
Statoil had contractual commitments of USD 6,889 million at 31 December 2016. The contractual commitments reflect Statoil's share and mainly comprise construction and acquisition of property, plant and equipment.
Statoil’s projected pension benefit obligation was USD 7,791 million, and the fair value of plan assets amounted to USD 5,250 million as of 31 December 2016. Company contributions are mainly related to employees in Norway. See note 19 Pensions to the Consolidated financial statements for more information.
Off balance sheet arrangements
Statoil is party to various agreements, such as operational leases and transportation and processing capacity contracts, that are not recognised in the balance sheet. For more information, see Principalcontractualobligations in section 2.9 Liquidity and capital resources, and note 22 Leasesto the Consolidated financial statements. Statoil is also party to certain guarantees, commitments and contingencies that, pursuant to IFRS, are not necessarily recognised in the balance sheet as liabilities. See note 23 Other commitments and contingenciesto the Consolidated financial statements for more information.
Statoil, Annual Report on Form 20-F 201673
2.10 RISK REVIEW
Statoil’s overall risk management includes identifying, evaluating and managing risk in all its activities to ensure safe operations and to achieve Statoil’s corporate goals.
RISK FACTORS
Statoil is exposed to a number of risks that could affect its operational and financial performance. In this section, some of the key risk factors are addressed.
Risks related to our business
This section describes the most significant potential risks relating to Statoil’s business:
A prolonged period of low oil and/or natural gas prices would have a material adverse effect on Statoil
The prices of oil and natural gas have fluctuated greatly in response to changes in many factors. We have experienced a situation where oil and natural gas prices declined substantially compared to levels seen over the last few years. There are several reasons for this decline, but fundamental market forces beyond the control of Statoil or other similar market participants have impacted and can continue to impact oil and natural gas prices in the future. Recently, as a consequence of agreements within Opec and also between Opec and some non-Opec countries, oil prices have increased due to expectations of an earlier tightening of market balances. However, the uncertainty about future developments still prevails.
Generally, Statoil does not and will not have control over the factors that affect the prices of oil and natural gas. These factors include:
·economic and political developments in resource-producing regions
·global and regional supply and demand
·the ability of the Organisation of the Petroleum Exporting Countries (Opec) and/or other producing nations to influence global production levels and prices
·prices of alternative fuels that affect the prices realised under Statoil's long-term gas sales contracts
·government regulations and actions; including changes in energy and climate policies
·global economic conditions
·war or other international conflicts
·changes in population growth and consumer preferences
·the price and availability of new technology and
·weather conditions
It is impossible to predict future price movements for oil and/or natural gas with certainty. A prolonged period of low oil and natural gas prices will adversely affect Statoil's business, the results of operations, financial condition, liquidity and Statoil's ability to finance planned capital expenditure, including possible reductions in capital expenditures which could lead to reduced reserve replacement. In addition to the adverse effect on revenues, margins and profitability from any fall in oil and natural gas prices, a prolonged period of low prices or other indicators could, if deemed to have longer term impact, lead to further reviews for impairment of the group's oil and natural gas properties. Such reviews would reflect the management's view of long-term oil and natural gas prices and could result in a charge for impairment that could have a significant effect on the results of Statoil's operations in the period in which it occurs. Changes in management’s view on long-term oil and/or natural gas prices or further material reductions in oil, gas and/or product prices could have an adverse impact on the economic viability of projects that are planned or in development.
Statoil’s crude oil and natural gas reserves are only estimates and Statoil’s future production, revenues and expenditures with respect to its reserves may differ materially from these estimates. The reliability of proved reserve estimates depends on:
·the quality and quantity of Statoil’s geological, technical and economic data
·the production performance of Statoil’s reservoirs
·extensive engineering judgments and
·whether the prevailing tax rules and other government regulations, contracts and oil, gas and other prices will remain the same as on the date estimates are made
Proved reserves are calculated based on the U.S. Securities and Exchange Commission (SEC) requirements and may therefore differ substantially from Statoil’s view on expected reserves.
Many of the factors, assumptions and variables involved in estimating reserves are beyond Statoil’s control and may prove to be incorrect over time. The results of drilling, testing and production after the date of the estimates may require substantial upward or downward revisions in Statoil’s reserve data. The prices used for proved reserves are defined by the SEC and are calculated based on a 12 month un-weighted arithmetic average of the first-day-of-the-month price for each month during the reporting year, leading to a forward price strongly linked to last year’s price environment. Fluctuations in oil and gas prices will have a direct impact on Statoil’s proved reserves. For fields governed by production sharing agreements (PSAs), a lower price may lead to higher entitlement to the
74Statoil, Annual Report on Form 20-F 2016
production and increased reserves for those fields. Adversely, a lower price environment may also lead to lower activity resulting in reduced reserves. For PSAs these two effects may to some degree offset each other. In addition a low price environment may result in earlier shutdown due to uneconomic production. This will affect both PSAs and fields with concession types of agreement.
Statoil is engaged in global exploration activities that involve a number of technical, commercial and country specific risks.
General risks are technical risks related to Statoil’s ability to conduct its seismic and drilling operations in a safe and efficient manner and to encounter commercially productive oil and gas reservoirs and commercial risks related to Statoil’s ability to secure access to new acreage in an uncertain global competitive and political environment and competent personnel to perform exploration activities and mature resources along the value-chain. Country specific risks are related to security threats and compliance with and understanding of local laws or license agreements. These risks may adversely affect Statoil’s current operations and financial results, and its long-term replacement of reserves.
If Statoil fails to acquire or discover and develop additional reserves, its reserves and production will decline materially from their current levels
Successful implementation of Statoil's group strategy for value growth is critically dependent on sustaining its long-term reserve replacement. If upstream resources are not progressed to proved reserves in a timely manner, Statoil’s reserve base and thereby future production will gradually decline and future revenue will be reduced.
Statoil's future production is highly dependent on its success in acquiring or finding and developing additional reserves adding value. If unsuccessful, future total proved reserves and production will decline.
If the low price environment continues for a substantial time, this may result in undeveloped acreage not being considered economically viable and consequently discovered resources not being matured to reserves. This may also lead to exploration areas not being explored for new resources and subsequently not being matured for development resulting in less future proved reserves.
In a number of resource-rich countries, national oil companies control a significant proportion of oil and gas reserves that remain to be developed. To the extent that national oil companies choose to develop their oil and gas resources without the participation of international oil companies, or if Statoil is unable to develop partnerships with national oil companies, its ability to find and acquire or develop additional reserves will be more limited.
Statoil is exposed to a wide range of health, safety and environmental risks that could result in significant losses.
Exploration, development, production, processing and transportation related to oil and natural gas, as well as development and operation of renewable energy production, can be hazardous. Technical integrity failures, operational failures, natural disasters or other occurrences can result in: loss of life, oil spills, gas leaks, loss of containment of hazardous materials, water contamination, blowouts, cratering, fires and equipment failure, among other things.
The risks associated with Statoil's activities are affected by the difficult geographies, climate zones and environmentally sensitive regions in which Statoil operates. All modes of transportation of hydrocarbons - including road, rail, sea or pipeline - are particularly susceptible to a loss of containment of hydrocarbons and other hazardous materials, and, given the high volumes involved, these could represent a significant risk to people and the environment. Offshore operations and transportation are subject to marine perils, including severe storms and other adverse weather conditions and vessel collisions. Onshore operations and transportation are subject to adverse weather conditions and accidents. Both onshore and offshore operations and transportation are subject to interruptions, restrictions or termination by government authorities based on safety, environmental or other considerations.
Policy and regulatory change due to rising climate change concerns, and the physical effects of climate change, could impact Statoil’s business and related costs
The transition to a low-carbon energy future poses fundamental strategic challenges for the oil and gas industry.
Statoil monitors and assesses risks related to climate change, whether political, regulatory, market or physical, including reputation impact.
Statoil expects and is preparing for policy and regulatory changes targeted at reducing greenhouse gas emissions. This could impact Statoil's financial outlook, whether directly through changes in taxation and regulation, or indirectly through changes in consumer behaviour.
There is continuing uncertainty over climate policy developments in various jurisdiction, and hence the long-term implications to costs and constraints. Statoil expects greenhouse gas emission costs to increase from current levels beyond 2020 and to have a wider geographical range than today.
Climate related policy changes may also reduce access to prospective geographical areas for exploration and production in the future.
Regulatory changes encouraging the development of low-carbon energy technologies such as renewable energy or other potentially disruptive technologies, could impact the demand for oil and gas. As an example, development of battery technologies could allow
Statoil, Annual Report on Form 20-F 201675
more intermittent renewables to be used in the power sector. This could impact Statoil's gas sales, particularly if subsidies of renewable energy in Europe were to increase.
Statoil has analysed the sensitivity of its project portfolio (equity production and expected production from accessed exploration acreage) against the assumptions regarding commodity and carbon prices in the International Energy Agency’s (IEA) energy scenarios, as laid out in their “World Economic Outlook 2016” report. The analysis demonstrated that the IEA’s “450 ppm scenario”, which is at large compatible with a global warming of maximum of two degrees Celsius with more than 50% probability, could have a positive impact of approximately 6% on Statoil’s net present value compared to Statoil’s internal planning assumptions as of December 2016. This assessment is based on Statoil’s and the IEA’s assumptions which may not be accurate and which are likely to develop over time as new information becomes available. Accordingly, there can be no assurance that the assessment, which is presented in Statoil ASA’s 2016 Sustainability report, is a reliable indicator of the actual impact of climate change on Statoil.
Changes in physical climate parameters could impact Statoil's operations, for example through restrained water availability, rising sea level, changes in sea currents and increasing frequency of extreme weather events.
Statoil is exposed to risks as a result of its hydraulic fracturing usage
Statoil's US operations use hydraulic fracturing which is subject to a range of applicable federal, state and local laws, including those discussed under the heading "Legal and Regulatory Risks". Fracturing is an important and common practice that is used to stimulate production of crude oil and/or natural gas from dense subsurface rock formations. Statoil's hydraulic fracturing and fluid handling operations are designed and operated to minimise the risk, if any, of subsurface migration of hydraulic fracturing fluids and spillage or mishandling of hydraulic fracturing fluids, however, a proven case of subsurface migration of hydraulic fracturing fluids or a case of spillage or mishandling of hydraulic fracturing fluids during these activities could potentially subject Statoil to civil and/or criminal liability and the possibility of substantial costs, including environmental remediation, depending on the circumstances of the underground migration, spillage, or mishandling, the nature and scope of the underground migration, spillage, or mishandling, and the applicable laws and regulations.
In addition, various states and local governments have implemented, or are considering, increased regulatory oversight of hydraulic fracturing through additional permit requirements, operational restrictions, disclosure requirements and temporary or permanent bans. New or further changes in laws and regulations imposing reporting obligations on, or otherwise banning or limiting, the hydraulic fracturing process could make it more difficult to complete oil and natural gas wells in shale formations, cause operational delays, increase costs of regulatory compliance or in exploration and production, which could adversely affect Statoil's US onshore business and the demand for fracturing services.
Statoil is exposed to security threats that could have a materially adverse effect on Statoil's results of operations and financial condition
Security threats such as acts of terrorism and cyber-attacks against Statoil's production and exploration facilities, offices, pipelines, means of transportation or computer systems or breaches of Statoil's security system, could result in losses. No assurances can be made that such attacks will not occur in the future and adversely impact its operations. Failure to manage the foregoing risks could result in injury or loss of life, damage to the environment, damage to or the destruction of wells and production facilities, pipelines and other property. Statoil could face, among other things, regulatory action, legal liability, damage to its reputation, a significant reduction in revenues, an increase in costs, a shutdown of operations and a loss of its investments in affected areas.
Statoil's crisis management systems may prove inadequate
Statoil has plans and capability to deal with crisis and emergencies at every level of its operations (ie; plant fires, terror, well instability etc). If Statoil does not respond or is perceived not to have responded in an appropriate manner to either an external or internal crisis, or if its plans to carry on or recover operations following a disruption or incident are not effected quickly enough, its business, operations and reputation could be severely affected. Inability to restore or replace critical capacity to an agreed level within an agreed time frame could prolong the impact of any disruption and could severely affect Statoil's business and operations.
Statoil encounters competition from other oil and gas companies in all areas of its operations
Statoil may experience increased competition from larger players with stronger financial resources and smaller ones with increased agility and flexibility. Gaining access to commercial resources via license acquisition, exploration, or development of existing assets is key to ensuring the long-term economic viability of the business and failure to address this could negatively impact future performance.
Technology is a key competitive advantage in Statoil's industry and our competition may be able to invest more in developing or acquiring intellectual property rights to technology that Statoil may require to remain competitive. Should Statoil's innovation and digitalisation lag behind the industry, its performance could be impeded.
Statoil's development projects and production activities involve many uncertainties and operating risks that can prevent Statoil from realising profits and cause substantial losses
Oil and gas projects may be curtailed, delayed or cancelled for many reasons, including equipment shortages or failures, natural hazards, unexpected drilling conditions or reservoir characteristics, irregularities in geological formations, accidents, mechanical and
76Statoil, Annual Report on Form 20-F 2016
technical difficulties or challenges due to new technology. This is particularly relevant because of the physical environments in which some of Statoil’s projects are situated. Many of Statoil's development and production projects are located in deep waters or other harsh environments or have challenging field characteristics. In US onshore, low regional prices may cause certain areas to be unprofitable and the company may curtail production until prices recover. There is therefore a risk that prolonged low oil and gas prices, combined with the relatively high levels of tax and government take in several jurisdictions, could erode the profitability of some of Statoil’s projects.
Statoil faces challenges in achieving its strategic objective of successfully exploiting profitable growth opportunities
Statoil intends to continue to nurture attractive commercial opportunities in order to sustain future growth. This may involve acquisition of new businesses or properties to expand the existing portfolio or to move into new markets. This challenge will grow as global competition for access to new opportunities rises.
Statoil’s ability to increase this optionality depends on several factors; including the ability to:
·maintain and impart Statoil’s zero-harm safety culture
·identify suitable opportunities
·negotiate favourable terms
·develop new market opportunities or acquire properties or businesses in an agile and efficient way
·effectively integrate acquired properties or businesses into Statoil's operations
·arrange financing, if necessary and
·comply with legal regulations
Statoil anticipates significant investments and costs as it cultivates business opportunities in new and existing markets, and this process may incur or assume unanticipated liabilities, losses or costs associated with assets or businesses acquired. Failure by Statoil to successfully pursue and exploit new business opportunities could result in financial losses and inhibit growth. New projects may have different risk profiles than Statoil's existing portfolio. These and other effects of such acquisitions could result in Statoil having to revise its forecasts either or both with respect to unit production costs and production.
In addition, the pursuit of acquisitions or new business opportunities could divert financial and management resources away from Statoil's day-to-day operations to the integration of acquired operations or properties. Statoil may require additional debt or equity financing to undertake or consummate future acquisitions or projects, and such financing may not be available on terms satisfactory to Statoil, if at all, and it may, in the case of equity, be dilutive to Statoil's earnings per share.
The profitability of Statoil’s oil and gas production may be affected by limited transportation infrastructure when a field is in a remote location
Statoil's ability to exploit economically any discovered petroleum resources beyond its proved reserves will depend, among other factors, on the availability of the infrastructure required to transport oil and gas to potential buyers at a commercially acceptable price. Oil is transported by vessels, rail or pipelines to refineries, and natural gas is usually transported by pipeline or by vessels (for liquid natural gas) to processing plants and end users. Statoil may not be successful in its efforts to secure transportation and markets for all of its potential production.
Statoil is exposed to security threats on its information systems and digital infrastructure that could harm its assets and operations
Statoil’s security barriers are intended to protect its information systems and digital infrastructure from being compromised by unauthorised parties. Failure to maintain and develop these barriers may affect the confidentiality, integrity and availability of its information systems and digital infrastructure, including those critical to Statoil’s operations. Threats to Statoil’s information systems could result in significant financial damage to Statoil. Threats to Statoil’s industrial control systems are not limited by geography as Statoil’s digital infrastructure is accessible globally, and incidents in the industry in recent years have shown that parties who are able to circumvent barriers aimed at securing industrial control systems are capable and willing to perform attacks that destroy, disrupt or otherwise compromise operations. Such attacks could result in material losses or loss of life with consequent financial implications.
Some of Statoil's international interests are located in regions where political, social and economic instability could adversely impact Statoil’s business
Statoil has assets and operations located in diverse regions globally where potentially negative economic, social, and political developments could occur. These political risks and security threats require continuous monitoring. Adverse and hostile actions against Statoil's staff, its facilities, its transportation systems and its digital infrastructure (cybersecurity) may cause harm to people and disrupt Statoil's operations and further business opportunities in these or other regions, lead to a decline in production and otherwise adversely affect Statoil's business. This could have a materially adverse effect on Statoil's operations’ results and its financial condition.
Statoil's operations are subject to dynamic political and legal factors in the countries in which it operates
Statoil has assets in a number of countries with emerging or transitioning economies that, in part or in whole, lack well-functioning and reliable legal systems, where the enforcement of contractual rights is uncertain or where the governmental and regulatory framework is subject to unexpected change. Statoil's exploration and production activities in these countries are often undertaken together with national oil companies and are subject to a significant degree of state control. In recent years, governments and national oil
Statoil, Annual Report on Form 20-F 201677
companies in some regions have begun to exercise greater authority and to impose more stringent conditions on companies engaged in exploration and production activities. Intervention by governments in such countries can take a wide variety of forms, including:
·restrictions on exploration, production, imports and exports
·the awarding or denial of exploration and production interests
·the imposition of specific seismic and/or drilling obligations
·price and exchange controls
·tax or royalty increases, including retroactive claims
·nationalisation or expropriation of Statoil's assets
·unilateral cancellation or modification of Statoil's licence or contractual rights
·the renegotiation of contracts
·payment delays and
·currency exchange restrictions or currency devaluation
The likelihood of these occurrences and their overall effect on Statoil vary greatly from country to country and are hard to predict. If such risks materialise, they could cause Statoil to incur material costs and/or cause Statoil's production to decrease, potentially having a materially adverse effect on Statoil's operations or financial condition.
Statoil is exposed to potentially adverse changes in the tax regimes of each jurisdiction in which Statoil operates
Statoil has business operations in many countries around the world. Changes in the tax laws of the countries in which Statoil operates could have a material adverse effect on its liquidity and results of operations.
Statoil faces foreign exchange risks that could adversely affect the results of Statoil’s operations
Statoil's business faces foreign exchange risks and this is managed with USD as the base currency. Statoil has a large percentage of its revenues and cash receipts denominated in USD and sales of gas and refined products are mainly denominated in EUR and GBP. Further, Statoil pays a large portion of its income taxes, and a share of our operating expenses and capital expenditures, in NOK. The majority of Statoil's long term debt has USD exposure.
Statoil is exposed to risks relating to trading and supply activities
Statoil is engaged in substantial trading and commercial activities in the physical markets. Statoil also uses financial instruments such as futures, options, over-the-counter (OTC) forward contracts, market swaps and contracts for differences related to crude oil, petroleum products, natural gas and electricity in order to manage price volatility. Statoil also uses financial instruments to manage foreign exchange and interest rate risk. Trading activities involve elements of forecasting, and Statoil bears the risk of market movements, the risk of losses if prices develop contrary to expectations, and the risk of default by counterparties.
Non-compliance with anti-bribery, anti-corruption and other applicable laws, including failure to meet Statoil’s ethical requirements, exposes Statoil to legal liability and damage to its reputation, business and shareholder value
Statoil has activities in countries which present corruption risks and which may have weak legal institutions, lack of control and transparency. In addition, governments play a significant role in the oil and gas sector, through ownership of resources, participation, licensing and local content which leads to a high level of interaction with public officials. Statoil is, through its international activities, subject to anti-corruption and bribery laws in multiple jurisdictions, including the Norwegian Penal code, the US Foreign Corrupt Practices Act and the UK Bribery Act. A violation of any applicable anti-corruption and bribery laws could expose Statoil to investigations from multiple authorities, and any violations of laws may lead to criminal and/or civil liability with substantial fines. Incidents of non-compliance with applicable anti-corruption and bribery laws and regulations and the Statoil Code of Conduct could be damaging to Statoil's reputation, competitiveness and shareholder value.
Statoil’s insurance coverage may not provide adequate protection
Statoil maintains insurance coverage that includes coverage for physical damage to its oil and gas properties, third-party liability, workers' compensation and employers' liability, general liability, sudden pollution and other coverage. Statoil's insurance coverage includes deductibles that must be met prior to recovery. Statoil's external insurance is subject to caps, exclusions and limitations, and there is no assurance that such coverage will adequately protect Statoil against liability from all potential consequences and damages.
Statoil’s future performance depends on efficient operations and the ability to develop and deploy new technologies and new products
Our ability to remain efficient, to develop and adapt to new technology, to seek profitable renewable energy and other low-carbon energy solutions, are key success factors for future business. There is a possibility of Statoil not being able to define and implement the necessary changes due to the organisation’s capability, external competition or underestimated cost of implementing new technology. Any of these factors may have an adverse effect on Statoil’s future business goals.
Statoil may fail to secure the right level of workforce competence and capacity over the short and medium term
The uncertainty of the future of the oil industry in light of reduced oil and natural gas prices and climate policy changes, creates a risk in ensuring a robust workforce through industry cycles. The oil industry is a long term business and needs to take a long term perspective on workforce capacity and competence. Given the current extensive change agenda there is a risk that Statoil will fail to secure the right level of workforce competence and capacity.
78Statoil, Annual Report on Form 20-F 2016
Statoil’s activities may be affected by international sanctions and trade restrictions
Statoil, like other major international energy companies, has a geographically diverse portfolio of reserves and operational sites, which may expose its business and financial affairs to political and economic risks, including operations in areas subject to international restrictions and sanctions.
Legislation and rules governing sanctions and trade restrictions are complex and constantly evolving. Moreover, changes in these laws and regulations can be unpredictable and happen swiftly. In addition, Statoil's business will constantly be subject to change. Accordingly, it should be understood that the below description does not reflect all parts of Statoil’s business where sanctions and trade restrictions are relevant, and that Statoil in the future could decide to take part in additional business activity where such laws and regulations are particularly relevant. While Statoil remains committed to doing business in compliance with all applicable sanctions and trade restrictions, there can be no assurance that no Statoil entity, officer, director, employee or agent is not in violation of such laws. Any such violation could result in substantial civil and/or criminal penalties and might materially adversely affect Statoil's business and results of operations or financial condition.
Statoil holds an interest in several different oil and gas projects in Russia both onshore and offshore. The majority of these projects result from a strategic cooperation with Rosneft Oil Company (Rosneft) initiated in 2012, some of these projects are located Arctic offshore and/or deepwater. In each of these projects, Rosneft holds the majority interest, while Statoil holds a minority interest. Sanctions imposed by Norway, the EU and the USA target, among others, Russia’s financial and energy sectors, including certain companies such as Rosneft and various affiliates, and specific activities related to oil exploration and production in the Arctic offshore area, and in deepwater or shale formation projects. Accordingly, aspects of the sanctions targeting Russia also affect Statoil’s business activity in the country. The continued progress of Statoil’s projects in Russia is, in part, dependent on various government authorisations and also the future development of sanctions and trade controls. Statoil continues to pursue its Russia business within the limitations of existing sanctions and trade controls. However, due to possible future developments there is no certainty that the projects can be progressed and concluded as initially planned.
Disclosure Pursuant to Section 13 (r) of the Exchange Act
Statoil is providing the following disclosure pursuant to Section 13(r) of the Exchange Act.
Statoil is a party to agreements with the National Iranian Oil Company (NIOC), namely, a Development Service Contract for South Pars Gas Phases 6, 7 & 8 (offshore part), an Exploration Service Contract for the Anaran Block and an Exploration Service Contract for the Khorramabad Block, which are located in Iran. Statoil's operational obligations under these agreements have terminated and the licenses have been abandoned. The cost recovery program for these contracts was completed in 2012, except for the recovery of tax and obligations to the Social Security Organisation (SSO). Since 2013, after closing Statoil’s office in Iran, Statoil's activity was focused on a final settlement with the Iranian tax and SSO authorities relating to the above mentioned agreements.
During 2016 Statoil paid the equivalent of USD 0.13 million in tax to Iranian authorities. Also during 2016 Statoil paid the equivalent of USD 153 in stamp duty to Iran Tax Organisation. All payments were made in local currency (Iranian Rials). The funds utilised for these purposes were held by Statoil in EN Bank (Iran). Additionally, NIOC, on behalf of Statoil, in 2016 paid a tax obligation of USD 2.47 million equivalent in Iranian Rial to the local tax authorities. The amount was settled towards recoverable costs from NIOC to Statoil.
Since 2009 Statoil has transparently and regularly provided information about its Iran related activity to the US State Department as well as to the Norwegian Ministry of Foreign Affairs. In a letter from the US State Department of 1 November 2010, Statoil was informed that the company was not considered to be a company of concern based on its previous Iran-related activities.
Statoil generated no net profit from the aforementioned 2016 activities. Payments of the above mentioned nature are expected to be made also in 2017, in relation to Statoil’s continued efforts to settle all remaining obligations related to its above mentioned historic activity in Iran.
Legal and regulatory risks
Compliance with health, safety and environmental laws and regulations that apply to Statoil's operations could materially increase its costs. The enactment of such laws and regulations in the future is uncertain.
Statoil incurs, and expects to continue to incur, substantial capital, operating, maintenance and remediation costs relating to compliance with increasingly complex laws and regulations for the protection of the environment and human health and safety, including:
Statoil, Annual Report on Form 20-F 201679
·higher price on greenhouse gas emissions
·costs of preventing, controlling, eliminating or reducing certain types of emissions to air and discharges to the sea
·remediaying of environmental contamination and adverse impacts caused by Statoil's activities
·compensation of cost related to persons and/or entities claiming damages as a result of Statoil's activities
Statoil`s activity is increasingly subject to statutory strict liability in respect of losses or damage suffered as a result of pollution caused by spills or discharges of petroleum from petroleum facilities.
Compliance with laws, regulations and obligations relating to climate change and other environmental regulations could result in substantial capital expenditure, reduced profitability as a result of changes in operating costs, and adverse effects on revenue generation and strategic growth opportunities. Statoil regularly assesses how changes in regulations, including introduction of stringent climate policies, may impact the oil price, the costs of developing new oil and gas assets, and the demand for oil and gas.
Statoil's operations in Norway are subject to emissions taxes as well as emissions allowances granted for Statoil's larger European operations under the EU Emissions Trading System. The agreed strengthening of the European Union's emission trading scheme may result in higher costs for installations at the NCS as the price of the EU ETS emissions allowances is expected to increase significantly towards 2030.
The Paris Agreement on climate change entered into force in November 2016. Norway, collectively with the European Union, intends to deliver 40% reductions in greenhouse gas emissions by 2030. The national targets are intended to be strengthened every five years. Additionally, Norway has set an ambition to achieve close to net zero emissions by 2050. The implications for the industry are not clear, however requirements to reduce emissions could result in increased costs.
Statoil's investments in North American onshore producing assets will be subject to evolving regulations that could affect these operations and their profitability (see also the risks related to hydraulic fracturing above). In the United States, the US Environmental Protection Agency (EPA) has taken steps to regulate greenhouse gas emissions under the Clean Air Act, including methane emissions from upstream oil and gas production. In 2016 the EPA finalized new source performance standards for methane emissions and began a process of information collection to inform further methane-related rulemaking. Statoil could incur higher operating costs in order to comply with any such new regulations and data gathering requirements.
Statoil is exposed to risk of supervision, review and sanctions for violations of regulatory laws at the supranational and national level. These include, among others, competition and antitrust laws and financial and trading.
Statoil's products are marketed and traded worldwide and therefore subject to competition and antitrust laws at the supranational and national level in multiple jurisdictions. Statoil is exposed to investigations from competition and antitrust authorities, and violations of the applicable laws and regulations may lead to substantial fines.
Statoil is also exposed to financial review from financial supervisory authorities such as the Norwegian Financial Supervisory Authority (FSA) and the US Securities and Exchange Commission (the SEC). Reviews performed by these authorities could result in changes to previous accounts and future accounting policies.
Statoil is listed on both the Oslo Børs and New York Stock Exchange (NYSE), and is registered with the SEC. Statoil is required to comply with the continuing obligations of these regulatory authorities, and violation of these obligations may result in imposition of fines or other sanctions.
The Norwegian Petroleum Supervisor (PSA) supervises all aspects of Statoil's operations, from exploration drilling through development and operation, to cessation and removal. Its regulatory authority covers the whole NCS as well as petroleum-related plants on land in Norway. Statoil is exposed to supervision from PSA, and as its business grows internationally other regulators, and such supervision could result in audit reports, orders and investigations.
The formation of a competitive internal gas market within the European Union (EU) and the general liberalisation of European gas markets could adversely affect Statoil's business.
The continuing liberalisation of EU gas markets following legislative instruments rolled out in 2011 and the implementation of these legislative instruments by member states, could affect Statoil's market position or result in a reduction in prices in Statoil's gas sales contracts. Statoil's exposure to hub gas prices has increased and correspondingly increased Statoil’s exposure to price volatility. Statoil continually monitors its contractual obligations and makes efforts to negotiate the most competitive pricing and other conditions available in the market.
The EU-wide quantity of carbon allowances issued each year under the Emission Trading Scheme (ETS) for greenhouse gas emission allowances began to decrease in a linear manner in 2013. The ETS can have a positive or negative impact on Statoil, depending on the price of carbon, which will consequently have an impact on the development of gas-fired power generation in the EU. Until now, the carbon price has been too low to replace coal with gas fired generation capacity. This effect has been worsened by heavy subsidising of renewables which has caused gas fired power plants to shut down. Current EU climate and energy policies do
80Statoil, Annual Report on Form 20-F 2016
not address this problem, but there is a tendency towards more market based subsidies in the new guidelines on environment and energy aid.
Political and economic policies of the Norwegian State could affect Statoil’s business.
The Norwegian State plays an active role in the management of NCS hydrocarbon resources. In addition to its direct participation in petroleum activities through the State's direct financial interest (SDFI) and its indirect impact through legislation, such as tax and environmental laws and regulations, the Norwegian State, among other things, awards licences for exploration, production and transportation, approves exploration and development projects and applications for production rates for individual fields and may, if important public interests are at stake, also instruct Statoil and other oil companies to reduce petroleum production. Furthermore, in the production licences in which the SDFI holds an interest, the Norwegian State has the power to direct petroleum licences' actions in certain circumstances.
If the Norwegian State were to take additional action under its activities on the NCS or to change laws, regulations, policies or practices relating to the oil and gas industry, Statoil's NCS exploration, development and production activities and the results of its operations could be affected.
Risks related to state ownership
This section discusses some of the potential risks relating to Statoil’s business that could derive from the Norwegian State's majority ownership and from Statoil’s involvement in the SDFI.
The interests of Statoil’s majority shareholder, the Norwegian State, may not always be aligned with the interests of Statoil’s other shareholders, and this may affect Statoil’s decisions relating to the NCS
The Norwegian Parliament, known as the Storting, and the Norwegian State have resolved that the Norwegian State's shares in Statoil and the SDFI's interest in NCS licences must be managed in accordance with a coordinated ownership strategy for the Norwegian State's oil and gas interests. Under this strategy, the Norwegian State has required Statoil to continue to market the Norwegian State's oil and gas together with Statoil's own oil and gas as a single economic unit.
Pursuant to this coordinated ownership strategy, the Norwegian State requires Statoil, in its activities on the NCS, to take account of the Norwegian State's interests in all decisions that may affect the development and marketing of Statoil's own and the Norwegian State's oil and gas.
The Norwegian State directly held 67% of Statoil's ordinary shares as of 31 December 2016. Based on the Norwegian Public Limited Companies Act, the Norwegian State effectively has the power to influence the outcome of any vote of shareholders due to the percentage of Statoil's shares it owns, including amending its articles of association and electing all non-employee members of the corporate assembly. The employees are entitled to be represented by up to one-third of the members of the board of directors and one third of the corporate assembly.
The corporate assembly is responsible for electing Statoil's board of directors. It also makes recommendations to the general meeting concerning the board of directors' proposals relating to the company's annual accounts, balance sheet, allocation of profit and coverage of loss. The interests of the Norwegian State in deciding these and other matters and the factors it considers when casting its votes, especially under the coordinated ownership strategy for the SDFI and Statoil's shares held by the Norwegian State, could be different from the interests of Statoil's other shareholders.
If the Norwegian State's coordinated ownership strategy is not implemented and pursued in the future, then Statoil's mandate to continue to sell the Norwegian State's oil and gas together with its own oil and gas as a single economic unit is likely to be prejudiced. Loss of the mandate to sell the SDFI's oil and gas could have an adverse effect on Statoil's position in the markets in which it operates.
For further information about the mandate to sell the Norwegian State's oil and gas, see SDFI oil and gas marketing and sale in section 2.7 Corporate.
Risk management
Statoil’s overall risk management approach includes identifying, evaluating and managing risk in all its activities. In order to achieve optimal corporate solutions, Statoil bases its risk management on an enterprise-wide risk management approach. Statoil defines risk as a deviation from a specified reference value and the uncertainty associated with it. A positive deviation is defined as an upside risk, while a negative deviation is a downside risk. The reference value is most commonly a forecast, percentile or target. Statoil has an enterprise risk management (ERM) approach, which means that:
Statoil, Annual Report on Form 20-F 201681
·focus is on the value impact for Statoil
·risk is managed to make sure that Statoil’s operations are safe and in compliance with Statoil’s requirements and
·focus is on risk and reward at all levels in the organisation
Risk is managed in the business line and is an integral part of any manager’s responsibility. However, some risks are managed at corporate level. This includes oil and natural gas price risks, interest and currency risks, risk dimension in the strategy work, prioritisation processes and capital structure discussions.
Statoil’s corporate risk committee (CRC) is headed by the chief financial officer and its members include representatives of the principal business areas. It is an enterprise risk management advisory body that primarily advises the chief financial officer, but also the business areas' management on specific issues. The CRC assesses and advises on measures aimed at managing the overall risk to the group, and it proposes appropriate measures to adjust risk at the corporate level. The CRC is also involved in reviewing and developing Statoil’s risk policies. The committee meets regularly during the year to support Statoil’s risk management strategies, including hedging and trading strategies, as well as risk management methodologies. It regularly receives risk information that is relevant to it from Statoil’s corporate risk department.
·The following section describes how Statoil manages the market risks to which Statoil is exposed
Managing operational risk
Statoil manages risk in order to ensure safe operations and to achieve its corporate goals in compliance with its requirements
·All risks are related to Statoil's value chain, which denotes the value that is added in each step - from access, maturing, project execution and operation to market. In addition to the economic impact these risks could have on Statoil's cash flows, Statoil has a strong focus on avoiding HSE and integrity-related incidents (such as accidents, fraud and corruption). Most of the risks are managed by the principal business area line managers. Some operational risks are insurable and insured by Statoil’s captive insurance company operating in the Norwegian and international insurance markets
·Statoil’s risk management process is based on ISO31000 Risk management – principles and guidelines. The process provides a standardised framework and methodology for assessing and managing risk. A standardisation of the process across Statoil ASA and its subsidiaries allows for comparable risk levels and efficiency in decisions and it enables the organisation to create sustainable value while seeking to avoid incidents. The process seeks to ensure that risks are identified, analysed, evaluated and managed. Risk adjusting actions are subject to a cost benefit evaluation (except certain safety related risks which are subject to specific regulations)
Managing financial risk
The results of Statoil’s operations depend on a number of factors, most significantly those that affect the price it receives for the products
Statoil has developed policies aimed at managing the financial volatility inherent in some of the business exposures. In accordance with these policies, Statoil enters into various financial and commodity-based transactions (derivatives). While the policies and mandates are set at the company level, the business areas are responsible for marketing and trading commodities and for managing commodity-based price risks within mandates. Interest, liquidity, liability and credit risks are managed by the company's central finance department.
The factors that influence the results of Statoil’s operations include: the level of crude oil and natural gas prices, trends in the exchange rate between mainly the USD, EUR, GBP and NOK; Statoil’s oil and natural gas production volumes, which in turn depend on entitlement volumes under PSAs and available petroleum reserves, and Statoil’s own, as well as partners' expertise and cooperation in recovering oil and natural gas from those reserves; and changes in Statoil’s portfolio of assets due to acquisitions and disposals.
Statoil’s results will also be affected by trends in the international oil industry, including possible actions by governments and other regulatory authorities in the jurisdictions in which Statoil operates, or possible or continued actions by members of the Organization of Petroleum Exporting Countries (OPEC) and/or other producing nations that affect price levels and volumes, refining margins, the cost of oilfield services, supplies and equipment, competition for exploration opportunities and operatorships, and deregulation of the natural gas markets, all of which may cause substantial changes to existing market structures and to the overall level and volatility of prices and price differentials.
The following table shows the yearly averages for quoted Brent Blend crude oil prices, natural gas average sales prices, refining reference margins and the USD/NOK exchange rates for 2016, 2015 and 2014.
Yearly average | 2016 | 2015 | 2014 |
| | | |
Average Brent oil price (USD/bbl) | 43.7 | 52.4 | 98.9 |
Average invoiced gas prices - Europe (USD/mmbtu) | 5.2 | 7.1 | 9.5 |
Refining reference margin (USD/bbl) | 4.8 | 8.0 | 4.7 |
USD/NOK average daily exchange rate | 8.4 | 8.1 | 6.3 |
| | | |
82Statoil, Annual Report on Form 20-F 2016

The illustration shows the indicative full-year effect on the financial result for 2017 given certain changes in the crude oil price, natural gas contract prices and the USD/NOK exchange rate. The estimated price sensitivity of Statoil’s financial results to each of the factors has been estimated based on the assumption that all other factors remain unchanged. The estimated indicative effects of the negative changes in these factors are not expected to be materially asymmetric to the effects shown in the illustration.
Significant downward adjustments of Statoil’s commodity price assumptions will result in impairment losses on certain producing and development assets in the portfolio. See note 10 Property, plant and equipment and note 11 Intangible assets to the Consolidated financial statements for sensitivity analysis related to impairment losses.
Statoil assesses oil and gas price hedging opportunities on a regular basis as a tool with regard to financial robustness and flexibility.
Fluctuating foreign exchange rates can have a significant impact on the operating results. Statoil’s revenues and cash flows are mainly denominated in or driven by USD, while a large portion of the operating expenses, capital expenditures and income taxes payable accrue in NOK. Statoil seeks to manage this currency mismatch by issuing or swapping non-current financial debt in USD. This long-term funding policy is an integrated part of our total risk management programme. Statoil also engages in foreign currency management in order to cover the non-USD needs, which are primarily in NOK. In general, an increase in the value of USD in relation to NOK can be expected to increase Statoil’s reported earnings.
Historically, Statoil’s revenues have largely been generated by the production of oil and natural gas on the NCS. Norway imposes a 78% marginal tax rate on income from offshore oil and natural gas activities (a symmetrical tax system). For further information, see Taxation of Statoil in section 2.7 Corporate.
Statoil’s earnings volatility is moderated as a result of the significant proportion of its Norwegian offshore income that is subject to a 78% tax rate in profitable periods, and the significant tax assets generated by its Norwegian offshore operations in any loss-making periods. The basis for taxation is 3% of the dividend received, which is subject to the standard income tax rate (reduced from 25% in 2016 to 24% in 2017). Dividends received from Norwegian companies and from similar companies resident in the EEA for tax purposes, in which the recipient holds more than 90% of the shares and votes, are fully exempt from tax. Dividends from companies resident in the EEA that are not similar to Norwegian companies, companies in low-tax countries and portfolio investments outside the EEA will, under certain circumstances, be subject to the standard income tax rate (reduced from 25% in 2016 to 24% in 2016) based on the full amounts received.
Financial risk management
Statoil's business activities naturally expose the group to financial risk. The group's approach to risk management includes identifying, evaluating and managing risk in all activities using a top-down approach for the purpose of avoiding sub-optimisation and utilising correlations observed from a group perspective. Summing up the different market risks without including the correlations will
Statoil, Annual Report on Form 20-F 201683
overestimate Statoil’s total market risk. For this reason, Statoil utilises correlations between all of the most important market risks, such as oil and natural gas prices, product prices, currencies and interest rates, to assess the overall market risk. This approach also reduces the number of unnecessary transactions, which reduces transaction costs and avoids sub-optimisation.
In order to achieve the above effects, Statoil has centralised trading mandates (financial positions taken to achieve financial gains, in addition to established policies) so that all major/strategic transactions are coordinated through the CRC. Local trading mandates are therefore relatively small.
Statoil's activities expose the company to the following financial risks: market risks (including commodity price risk, interest rate risk and currency risk), liquidity risk and credit risk. For a discussion of financial risk management see note 5 Financial risk management in the Consolidated financial statements.
Disclosures about market risk
Statoil uses financial instruments to manage commodity price risks, interest rate risks, currency risks and liquidity risks. Significant amounts of assets and liabilities are accounted for as financial instruments.
See note 25 Financial instruments: fair value measurement and sensitivity analysis of market risk in the Consolidated financial statements, for details of the nature and extent of such positions, and for qualitative and quantitative disclosures of the risks associated with these instruments.
84Statoil, Annual Report on Form 20-F 2016
2.11 SAFETY, SECURITY AND SUSTAINABILITY
Safety and security
Safety and security risks are particularly relevant for the oil and gas industry, because our core activities involve the risk of accidents and incidents. We work with flammable hydrocarbons at high pressure, often in harsh offshore environments and at height or depths. Oil spills are a major risk we need to handle in both our offshore and onshore oil and gas operations. To this end we have established a global oil spill response system, which includes close collaboration with industry peers and national and local communities.
We focus on identifying safety and security risks and having in place procedures and work processes to control them. Our objective is to be an industry leader in ensuring safe and secure operations that protect our people, the environment, the communities we work with and our assets.
For Statoil, 2016 was marked by two accidents with fatalities. A helicopter accident, in April, at Turøy in Norway in which 13 people were killed while travelling from the Gullfaks B platform in the North Sea. In May, one person was killed in an accident while working on the fabrication of a Statoil rig at the Samsung shipyard in Geoje, South Korea.
We also experienced a number of serious incidents in 2016, two of which had a major accident potential. At the Sture terminal (Norway) five people were exposed to H2S gas (hydrogen sulphide) in October while working at a treatment facility for oily water inside the terminal area. All affected workers have since recovered after this incident. Statoil implemented immediate actions to avert this problem at all Statoil onshore plants where H2S could cause a hazard.
Also in October, complications occurred during work to remove the production string from a well on the drilling rig Songa Endurance in the Troll field (Norway). There were no personal injuries, but drill mud containing gas was released. Procedures for handling well barriers have been strengthened.
All serious incidents are investigated in order to understand the causes and extract lessons learned to improve safety in the future. We use serious incident frequency (SIF) as a key indicator to monitor safety performance.
Our total serious incident frequency (SIF), including both actual and potential incidents, increased in 2016, with 0.8 incidents per million hours worked, compared to 0.6 in 2014 and 2015.
Total recordable injuries per million hours worked (TRIF) was 2.9 in 2016, compared to 2.7 in 2015.
The decline in our safety performance experienced in 2016 follows a decade of solid safety improvement.
Statoil has implemented a safety performance improvement programme to deal with this development. The main elements of the programme address risk management, safety guidance and practice, working safely with suppliers, safety leadership and engagement of the whole organisation.
In 2016, the total number of serious oil and gas leakages (with a leakage rate above 0.1 kg per second) was 18, down from 21 in 2015. Preventing oil and gas leakages is important to avoid of major accidents.

Statoil, Annual Report on Form 20-F 201685
<R> </R>
Our performance over the past five years, related to oil spills, shows a significant reduction in the number of oil spills per year. From 2015 to 2016 there was a reduction in the number of oil spills from 172 to 148 spills. However, the total volume of oil spilt increased from 31 m³ in 2015 to 61 m³ in 2016. The largest oil spills in 2016 were in Norway. They included a 35 m³ oil spill from the Mongstad refinery, due to corrosion in a pipe and a 7 m³ oil spill from a leak in the export pipeline from Troll B.
Security is an important consideration for the energy industry. We assess security threats and risks on a continuous basis in order to achieve effective and proportionate security risk management. The terrorist attack against the Krechba plant in Algeria, in March, highlighted the security situation in North Africa. This was the single incident with the most significant impact for Statoil during 2016. In 2016 we continued our improvement programme in accordance with our road map to further strengthen our security culture and capabilities by 2020, focusing on areas such as competence and awareness, working with our suppliers and improving compliance.
Health and work environment
Statoil is committed to providing a healthy working environment for its employees. Systematic efforts are made to design and improve working conditions in order to prevent occupational injuries, work-related illness and sickness absence, due to both physical and psychosocial risk factors. A proactive psychosocial risk indicator is used to monitor health and work environment risk factors, in addition to the work related illness frequency indicator.
The most significant risk factors related to the work environment are noise, ergonomics, chemical risk as well as psychosocial conditions. In 2016, Statoil continued to fund research into exposure control for noise and chemicals, and research in to stroke treatment during evacuation from offshore facilities.
The sickness absence rate for Statoil ASA employees increased slightly from 4.1% in 2015 to 4.3% in 2016.
Climate change
Statoil supports the ambition set by the Paris Climate Agreement of December 2015 to limit the average global temperature rise to well below two degrees centigrade compared to pre-industrial levels by 2100. Our corporate ambition is to develop our business in support of the Paris Climate Agreement
Statoil’s approach to climate change as outlined in our climate roadmap focuses on:
·building a high value, low carbon oil and gas portfolio
·creating a material industrial position in new energy solutions
·accountability and collaboration.
Climate change is complex and requires global and cross sector cooperation. We are committed to working with our suppliers, customers, governments and peers to find innovative and commercially viable ways to reduce emissions across the oil and gas value chain. To spur technology development, for example, we continued through 2016 with our research and development (R&D) partnership with GE. In November 2016 we launched the USD 1 billion Climate Investments partnership with our global peers through the CEO-led Oil and Gas Climate Initiative (OGCI). And through our participation in the government-led Climate and Clean Air Coalition’s Oil and Gas Methane Partnership (OGMP) we continued our efforts to systematically address methane emissions and report on annual progress.
We work with governments and other organisations to support climate and energy policies that encourage fuel switching from coal to gas, growth in renewables, the deployment of carbon capture usage and storage (CCUS) and other low carbon solutions, and efficient production, distribution and use of energy globally. We have also teamed up with global peers through OGCI to help shape the industry’s climate response. Through the World Bank led Carbon Pricing Leadership Coalition and our membership of the International Emission Trading Association we continued our advocacy for a price on carbon during 2016. And through our membership in the OGCI and World Business Council for Sustainable Development (WBCSD) we expressed our continued support for the ambitions of the Paris climate agreement. Statoil is an endorser of the World Bank Global Gas Flaring Reduction Partnership and we have made a commitment to contribute to stopping routine flaring by 2030 through the World Bank Zero Routine Flaring by 2030 initiative.
The corporate executive committee and board of directors’ review climate change related business risks and opportunities, including market, regulatory and physical risk factors. We use tools such as internal carbon pricing, scenario planning and stress testing of projects against various oil and gas price assumptions. Statoil routinely tracks technology developments and changes in regulations, including the introduction of stringent climate policies, and assesses how these may impact the oil price, the costs of developing new oil and gas assets, and the demand for oil and gas.
Statoil initiated stress testing of our project portfolio against the International Energy Agency (IEA) and our own energy scenarios, in 2015, in response to a shareholder request. The stress test includes a range of price assumptions for oil, gas and carbon. Both Statoil’s and the IEA’s price assumptions may differ from actual and future oil, gas and carbon prices. As such, there can be no assurance that the analysis is a reliable indicator of the actual future impact of climate change on Statoil.
86Statoil, Annual Report on Form 20-F 2016
Statoil’s efforts to reduce direct greenhouse gas emissions include improving energy efficiency; reducing methane emissions; eliminating routine flaring and scaling up carbon capture usage and storage (CCUS).
One of the most significant contributions to our emissions reductions in 2016 has been our efforts to reduce flaring at our Bakken (USA) asset. This contributed around 100 thousand tonnes to the total emission reductions. Energy efficiency improvements at our onshore facilities in Norway and the Kalundborg refinery in Denmark realised an additional 100 thousand tonnes in carbon dioxide (CO2) reductions in 2016.
For our offshore operations in Norway we set a target in 2008 to achieve improved energy efficiency by 2020 equivalent to 800 thousand tonnes of CO2 emissions (the so called Konkraft target). This was already achieved during 2015 through the implementation of energy efficiency projects. So we have raised the target to a total of 1.2 million tonnes of CO2 emissions for the period 2008 to 2020.
The production from Statoil operated assets decreased from 1,073 million boe in 2015 to 1,030 million boe in 20161. The corresponding greenhouse gas emissions (so called Scope 1 emissions) decreased from 16.3 million tonnes CO2 equivalents in 2015 to 15.4 million tonnes in 2016. Greenhouse gas emissions include carbon CO2 and methane (CH4), where CO2 constitutes the largest part (14.8 million tonnes in 2016 compared to 15.4 tonnes in 2015). Methane (CH4) emissions decreased from 36.3 thousand tonnes in 2015 to 24.2 thousand tonnes in 2016.
The decrease in CO2 emissions in 2016, relative to 2015, was the result of emissions reductions efforts, reduced exploration activity and operational disruptions associated with turnarounds at our facilities on the Norwegian continental shelf and our onshore oil refining and gas processing facilities in Norway and Denmark. The 33% decrease in methane emissions in 2016, compared to 2015, was largely due to a change in methodology for the estimation of fugitive emissions for our Norwegian continental shelf assets, and updated fugitive emissions measurements for our oil refining and gas processing facilities.
In 2016, we introduced a 2030 carbon intensity target of 8 kg CO2 per boe for our upstream exploration and production activities. This supplements the 2020 carbon intensity target of 9 kg of CO2 per boe by 2020 established in 2015. These targets are based on production and emission forecasts and emission reduction targets for each business area. Our targets are subject to significant uncertainty because they relate to events and circumstances that will occur in the future. Changes in our asset portfolio and production can also affect the result for a particular year.
Upstream carbon intensity was established as a corporate-wide key performance indicator in 2016. It was included in the assessment of reward for the CEO. Statoil’s upstream carbon intensity in 2016 was 10 kg CO2 per boe, less than 60% of the industry average of 17 kg as measured by the International Association of Oil and Gas Producers (Environmental Performance Indicators, 2015 data).
Statoil’s operations in Europe are subject to emissions allowances according to the EU Emissions Trading System (EU ETS). Statoil’s Norwegian operations are subject to both the Norwegian offshore CO2 tax and EU ETS quotas. In 2016, Statoil paid some USD 496 million in CO2 tax and quotas compared to USD 476 million in 2015.
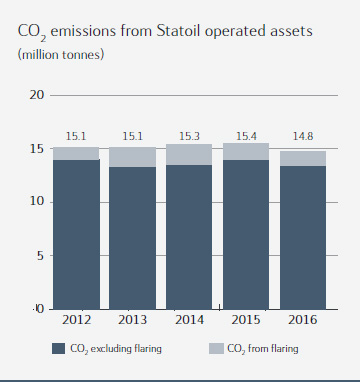
1 Climate and environmental performance data represent the total for Statoil operated assets (i.e. reflecting operational control rather than equity share), except for scope 3 emissions.
Statoil, Annual Report on Form 20-F 201687
Growth opportunities for Statoil within renewables and new energy solutions include both commercial investments and research and development (R&D). To date Statoil has invested USD 2.3 billion in offshore wind projects and is engaged in carbon capture usage and storage. In 2016 approximately 17% (USD 52.4 million) of Statoil’s spend on R&D efforts addressed energy efficiency, carbon capture and renewables.
Environmental impact and resource efficiency
Statoil is committed to using resources efficiently and responsible management of waste, emissions to air and impacts on ecosystems. This reduces the impact on the local environment and can also save costs.
Responsible water management is important for Statoil. Total fresh water consumption decreased from 14.5 million cubic metres in 2015 to 13.5 million cubic metres in 2016. The main contributor to this decrease in water consumption was the lower number of wells fracked, relative to 2015, in our US onshore shale and tight oil assets. We work actively to improve water efficiency in our onshore activities in North America, through means such as water recycling and substituting fresh water with brackish water.
Nitrogen oxide emissions were 39 thousand tonnes in 2016, down from 42 thousand tonnes in 2015. Sulphur oxide emissions were 1.8 thousand tonnes, down from 2.5 thousand tonnes in 2015. Total emissions of non-methane volatile organic compounds were 49 thousand tonnes in 2016, down from 60 thousand tonnes in 2015.
Statoil is concerned with valuing and protecting biodiversity and ecosystems and follows precautionary principles to minimise potential negative effects of the company’s activities. Statoil supports research programmes to increase knowledge about ecosystems and biodiversity and collaborates with industry peers to share knowledge and develop tools for biodiversity management. In addition, Statoil works with our suppliers to minimise invasive aquatic species and reduce risks pertaining to accidental spills related to shipping transportation.
During 2016 we saw a 42% rise in the volume of hazardous waste generated, from 309 thousand tonnes in 2015 to 438 thousand tonnes in 2016. The main contributor to this volume increase was drilling and well start-up activities, on the Norwegian continental shelf, at locations without treatment facilities for oil contaminated water. As such the untreated oil contaminated water was sent to shore for treatment.
A change was made, in 2016, to the definitions we use for reporting of hazardous waste recovery. Previously, treated oil contaminated water was not included in our categorisation of recovered hazardous waste. From 2016, treated oil contaminated water will be included in our hazardous waste recovery calculations. The rationale for this change is alignment with the way both our peers and the contractors handling our waste are reporting. It also serves to highlight the company’s efforts to treat hazardous waste. The impact on our waste recovery rate is significant, with a rise from 16% in 2015 to 84% for 2016.
For our US onshore operations drill cuttings and produced and flow-back water are exempt from hazardous waste regulations. Consequently, these exempt wastes are not included in the hazardous waste generation or recovery figures. For our US onshore operations in 2016 81 thousand tonnes of drill cuttings and solid waste were sent to landfill, and 4.3 million cubic meters of produced and flow back water was directed to deep well disposal.
In 2016 the volume of non-hazardous waste generated for all Statoil operated assets was 50 thousand tonnes, and the recovery rate was 56% in 2016 compared to 63% in 2015. Regular discharges of oil to water were 1.4 thousand tonnes in 2016, the same as for 2015.
Working with suppliers
Statoil is committed to using suppliers who operate in accordance with Statoil’s values and who maintain high standards of safety, security and sustainability. These aspects are incorporated in all phases of the procurement process. Potential suppliers must meet Statoil’s minimum requirements in order to qualify as a supplier, including those related to safety, security and sustainability.
Statoil expect our suppliers to comply with applicable laws, respect internationally recognised human rights and adhere to ethical standards which are consistent with our ethical requirements, when working for Statoil. Potential suppliers for contracts valued at more than USD 800 thousand are, in addition, required to sign Statoil’s Supplier Declaration, which establishes minimum requirements for ethics, anti-corruption, environment, health, safety, respect for human rights, and for further promoting these requirements among their own suppliers. Potential suppliers are also screened for integrity risk, in accordance with our procedures for integrity due diligence.
Human rights
Statoil seeks to conduct its business in a way that is consistent with the UN Guiding Principles on Business and Human Rights (the UN Guiding Principles), the ten UN Global Compact principles and the Voluntary Principles on Security and Human Rights. Statoil is committed to respecting internationally recognised human rights as laid out in the International Bill of Human Rights, the International Labour Organization's 1998 Declaration on Fundamental Rights and Principles at Work, and applicable standards of international humanitarian law.
Labour rights and working conditions for our workforce and suppliers, human rights of individuals in communities and human rights in security arrangements are the three broad focus areas for human rights for Statoil’s activities.
88Statoil, Annual Report on Form 20-F 2016
Human rights aspects are integrated into relevant internal management processes, tools and training. On-going activities, business relationships and new business opportunities are assessed for potential human rights impacts and aspects, following a risk-based approach. In 2016, supplier screening and verification practices were strengthened.
In 2016 Statoil focused on strengthening its processes for managing human rights in our supply chain and on raising awareness through training. We strengthened our human rights risk screening and verification tools and conducted 65 supplier verifications across 21 countries in 2016. Over 800 employees attended classroom training about human rights in the supply chain.
During 2016 Statoil’s Human Rights Steering Committee (HRSC), responsible for overseeing the development and implementation of Statoil’s human rights policy, closely followed the ongoing implementation efforts and provided guidance on human rights related reporting requirements.
Statoil recognises that a company-wide commitment to respect human rights requires continuous training and awareness raising in order to embed good practices throughout the organisation. To this effect additional human rights training materials, including a human rights e-learning programme were developed in 2016. During 2016 over 3,000 staff and hired contractors have registered for the e-learning course.
The context of Statoil’s operations requires that security services are engaged to safeguard Statoil’s people and property. Particular focus is needed to ensure respect for human rights in security arrangements, in jurisdictions where security services are not well regulated or security personnel are not adequately trained. Statoil follows international standards of good practices in security and human rights. Statoil’s commitment
to theVoluntary Principles on Security and Human Rights is reflected in policies and procedures for risk assessment, deployment, training and follow-up of private and public security providers.
Transparency, ethics and anti-corruption
Transparency is a cornerstone of good governance. It is embodied in our corporate values. Transparency allows business to prosper in a predictable and competitive environment and enables society to hold governments and business accountable. Statoil supports and promotes effective, transparent and accountable management of wealth derived from the extractives industries.
Statoil supports and engages in global transparency initiatives through its membership in the Extractive Industries Transparency Initiative (EITI), the United Nations Global Compact Anti-Corruption Working Group and the World Economic Forum’s Partnering Against Corruption Initiative (PACI). Statoil was one of the first major oil and gas companies to voluntarily start disclosing payments to governments on a country-by-country basis. Our 2016 Payments to Governments report discloses payments per project for our extractive activities, in accordance with mandatory requirements in Norway.
Statoil believes that doing business in an ethical and transparent manner is a prerequisite for sustainable business. Statoil’s Code of Conduct (the Code) prohibits all forms of corruption, including facilitation payments. Statoil maintains a robust company-wide anti-corruption compliance programme to implement our zero-tolerance policy. A global network of compliance officers is integrated into our business activities to ensure the appropriate consideration is given to ethics and anti-corruption in Statoil’s business activities, regardless of where they take place.
The Code reflects Statoil’s values and the commitment to high ethical standards in business activities. It describes our requirements in areas such as anti-corruption, fair competition, human rights and a non-discriminatory working environment with equal opportunities. It applies to Statoil employees, board members and hired personnel.
Statoil seeks to work with others who share the company’s commitment to business integrity and who have codes of conduct consistent with Statoil’s Code. Before entering into a new business relationship, or extending an existing one, the relationship has to satisfy Statoil’s integrity due diligence requirements. Statoil have a process to develop in-depth knowledge of our suppliers, partners, and the markets in which we work. Our vetting process is risk-based, allowing us to target resources where we see potential concerns. In joint ventures and business partnerships that are not controlled by Statoil, Statoil encourages the adoption of ethics and anti-corruption policies and procedures that are consistent with the company’s standards.
All employees have to confirm annually that they understand and will comply with the Code. The purpose of this confirmation is to remind the individual about their duty to comply with Statoil’s values and ethical requirements. Disciplinary measures are in place for anyone working for Statoil who does not comply with the code. This may entail termination of their contract.
The Code requires reporting of possible violations of our ethical requirements or other unethical misconduct. Concerns can be reported through internal channels or through the publicly available Ethics Helpline, which allows for anonymous reporting. The number and types of cases from the helpline is reported quarterly to the board of directors. In 2016 we received 51 cases through the Ethics Helpline.
Other relevant reports
More information about Statoil's policies and approach taken to manage safety and sustainability performance is available on our corporate website. Information on our activities, plans and performance in 2016 is available in Statoil ASA’s 2016 Sustainability Report, which has been prepared with reference to the Global Reporting Initiative G4 Guidelines. This report is also available on our corporate website: www.statoil.com.
Statoil, Annual Report on Form 20-F 201689
2.12 OUR PEOPLE
In Statoil we work together to shape the future of energy in a partnership between the organisation and the individual. We all apply our skills and personal commitment to help Statoil towards achieving our vision.
Statoil aims to offer challenging and meaningful job opportunities that attract and retain the right people. Through our engagement, creativity and collaboration, we aim to build a better Statoil for tomorrow. We are committed to creating a caring and inspiring working environment, promoting diversity and equal opportunities for all employees.
At the same time, given the current commercial environment, the company continues to focus on efficiency. We are committed to doing this in a way that is respectful and considerate to those affected. In particular, employees are involved in initiatives to increase efficiency. Employees have demonstrated strong engagement in this process, which is also confirmed by the high employee engagement score of 4.6 (6 being the highest) in the 2016 Global People Survey (GPS).
Learning and development is at the core of Statoil. We encourage our employees to take responsibility for their own learning and development, continuously build new skills and share knowledge. Our corporate university is our platform for learning. It enables the company to build the capabilities needed to deliver on its strategy, continuously improve, and take the lead in developing leadership and technology. People@Statoil is our common process for people development, deployment, performance and reward. It is an integrated part of performance management and applies to all employees.
EMPLOYEES IN STATOIL
The Statoil group employs 20,539 employees. Of these, approximately 18,000 are employed in Norway and approximately 2,500 outside Norway.
| Number of employees | Women |
Permanent employees and percentage of women in the Statoil group | 2016 | 2015 | 2014 | 2016 | 2015 | 2014 |
| | | | | | |
Norway | 18,034 | 18,977 | 19,670 | 30% | 30% | 30% |
Rest of Europe | 838 | 855 | 909 | 28% | 29% | 31% |
Africa | 78 | 98 | 117 | 36% | 35% | 34% |
Asia | 73 | 97 | 135 | 59% | 36% | 52% |
North America | 1,230 | 1,265 | 1,375 | 35% | 35% | 34% |
South America | 286 | 289 | 310 | 37% | 38% | 40% |
| | | | | | |
Total | 20,539 | 21,581 | 22,516 | 31% | 30% | 31% |
| | | | | | |
Non-OECD | 541 | 590 | 677 | 40% | 40% | 40% |
Total workforce by region, employment type and new hires in the Statoil group in 2016 |
| | | | | | | |
Geographical Region | Permanent employees | Consultants | Total Workforce1) | Consultants (%) | Part time (%) | New hires |
| | | | | | | |
Norway | 18,034 | 321 | 18,355 | 2% | 3% | 81 |
Rest of Europe | 838 | 82 | 920 | 9% | 2% | 66 |
Africa | 78 | 3 | 81 | 4% | NA | 6 |
Asia | 73 | 2 | 75 | 3% | NA | 2 |
North America | 1,230 | 94 | 1,324 | 7% | 0% | 89 |
South America | 286 | 2 | 288 | 1% | 2% | 7 |
| | | | | | | |
Total | 20,539 | 504 | 21,043 | 2% | 3% | 251 |
| | | | | | | |
Non-OECD | 541 | 7 | 548 | 1% | NA | 24 |
| | | | | | | |
1) | Contractor personnel, defined as third-party service providers who work at our onshore and offshore operations, are not included. These were roughly estimated to be around 30,000 in 2016. |
90Statoil, Annual Report on Form 20-F 2016
Statoil works systematically to build a diverse workforce by attracting, recruiting, developing and retaining people of both genders and different nationalities and age groups across all types of positions. In 2016, 19% of employees and 23% of our managerial staff held nationalities other than Norwegian. Outside Norway, Statoil aims to increase the number of people and managers who are locally recruited and to reduce the long-term use of expats in business operations. In 2016, 73% of new hires in Statoil were non-Norwegians and 34% were women.
Our annual intake of apprentices reflects our long-term commitment to the education and training of young technicians and operators in our industry. In 2016, we awarded 132 apprenticeships, of which 45 were to women. The total number of apprentices at year end was 271 (including 81 women).
In Statoil, the total turnover rate for 2016 was 3.6%. On 31 December 2016, the Statoil group employed 20,539 permanent employees and 3% of the workforce worked part-time. In the annual organisational and working environment survey, which continued to have a high response rate of 84%, our employees reported an overall satisfaction of 4.6, maintaining the high score from 2015.
Our people performance data relates to permanent employees in our direct employment. Statoil defines consultants as contracted personnel that are mainly based in our offices. Temporary employees and contractor personnel, defined as third party service providers to our onshore and offshore operations, are not included in the table. These were roughly estimated to be around 30,000 in 2016. The information about people policies applies to Statoil ASA and its subsidiaries.
Equal opportunities
We are committed to building a workplace that promotes diversity and inclusion through its people processes and practices. The importance of diversity is stated explicitly in Statoil's values and Code of Conduct. Our goal is to create the same opportunities for everyone and do not tolerate discrimination or harassment of any kind in our workplace. In 2016, we continued to focus on strengthening women in leadership and professional positions and on building broad international experience in our workforce. The results from the Global People Survey for 2016 indicate that employees strongly agree that there is a zero tolerance for discrimination and harassment in Statoil. The scoring for the 2016 GPS was 5.1 (6 being the highest), maintaining the high score from 2015.
In 2016, the overall percentage of women in the company was 31%. The percentage of women in the board of directors is 50% (67% among the employee representatives and 43% among members elected by the shareholders). In the corporate executive committee, the female representation has increased from last year’s 18% to 27% in 2016. We continue to focus on increasing the number of female managers through our development programmes, and in 2016 the share of women in management was 29%, an increase of 1% from 2015. We are committed to maintaining the positive trend in 2017. We pay close attention to male-dominated positions and discipline areas, and in 2016 the proportion of female engineers remained stable at 27% in Statoil ASA.
We reward our people on the basis of their performance, giving equal emphasis to what we deliver and how we deliver. Our approach is transparent, non-discriminatory and supports equal opportunities. Given the same position, experience and performance, our employees will be at the same remuneration level relative to the local market. This is demonstrated in the salary ratio between women and men at different levels, which remained at an average of 98% for Statoil ASA, which represents the 85% of our workforce.
Unions and representatives
We respect our employees’ right to freedom of association and thereby their right to negotiate and cooperate through relevant representative bodies. The specific ways in which we involve our employees and/or their appropriate representatives in business and organisational issues may vary according to local laws and practices in specific geographical locations.
In Statoil ASA, 73% of the employees in the parent company are members of a trade union. Work councils and working environment committees are established where required by law or agreement.
In Norway, the formal basis for collaboration with labour unions is established in the Basic Agreements between the Confederation of Norwegian Enterprise (NHO) and the corresponding respective national labour confederations (unions). We have local collective wage agreements with five trade unions in Statoil ASA.
The European Works Council continues to be an important forum for collaboration between the company and our European employees.
Statoil promotes good employee and industrial relations practices through various networks and forums, including IndustriALL Global Union (IndustriAll) and the International Labour Organisation (ILO).
In 2016 we prolonged the temporary collaboration forum set up in 2015 with trade unions and safety delegates in Norway specifically to engage in the Organisational efficiency programme. Under a common framework, we have relied largely on the internal job market to find new employment opportunities and measures such as severance pay and early retirement.
Statoil, Annual Report on Form 20-F 201691
3 CORPORATE COVERNANCE
92Statoil, Annual Report on Form 20-F 2016
3.1 INTRODUCTION
Statoil’s objective and principles
Statoil's objective is to create long-term value for its shareholders through the exploration for and production, transportation, refining and marketing of petroleum and petroleum-derived products and other forms of energy.
In pursuing its corporate objective, Statoil is committed to the highest standard of governance and to cultivating a values-based performance culture that rewards exemplary ethical practices, respect for the environment and personal and corporate integrity. Statoil believes that there is a link between high-quality governance and the creation of shareholder value.
The work of the board of directors is based on the existence of a clearly defined division of roles and responsibilities between the shareholders, the board of directors and the company's management.
Statoil’s governing structures and controls help to ensure that Statoil runs its business in a profitable manner for the benefit of shareholders, employees and other stakeholders in the societies in which Statoil operates.
The following principles underline Statoil’s approach to corporate governance:
·All shareholders will be treated equally
·Statoil will ensure that all shareholders have access to up-to-date, reliable and relevant information about its activities
·Statoil will have a board of directors that is independent (as defined by Norwegian Standards) of the group's management. The board focuses on preventing conflicts of interest between shareholders, the board of directors and the company's management
·The board of directors will base its work on the principles for good corporate governance applicable at all times
Corporate governance in Statoil is subject to regular review and discussion by the board of directors.
Articles of association
Statoil's current articles of association were adopted at the annual general meeting of shareholders on 14 May 2013, and last changed on 26 October 2016 following a share capital increase in connection to Statoil’s scrip dividend program.
Summary of Statoil’s articles of association:
Name of the company
The registered name is Statoil ASA. Statoil is a Norwegian public limited company.
Registered office
Statoil’s registered office is in Stavanger, Norway, registered with the Norwegian Register of Business Enterprises under number 923 609 016.
Objective of the company
The objective of Statoil is, either by itself or through participation in or together with other companies, to engage in the exploration, production, transportation, refining and marketing of petroleum and petroleum-derived products, and other forms of energy, as well as other business.
Share capital
Statoil’s share capital is NOK 8,112,623,528 divided into 3,245,049,411 ordinary shares.
Nominal value of shares
The nominal value of each ordinary share is NOK 2.50.
Board of directors
Statoil’s articles of association provide that the board of directors shall consist of nine to 11 directors. The board, including the chair and the deputy chair, shall be elected by the corporate assembly for a period of up to two years.
Corporate assembly
Statoil has a corporate assembly comprising 18 members who are normally elected for a term of two years. The general meeting elects 12 members with four deputy members, and six members with deputy members are elected by and from among the employees.
General meetings of shareholders
Statoil, Annual Report on Form 20-F 201693
Statoil’s annual general meeting is held no later than 30 June each year. The meeting will consider the annual report and accounts, including the distribution of any dividend, and any other matters required by law or the articles of association.
Documents relating to matters to be dealt with at general meetings do not need to be sent to all shareholders if the documents are accessible on Statoil’s website. A shareholder may nevertheless request that such documents be sent to him/her.
Shareholders may vote in writing, including through electronic communication, for a period before the general meeting. In order to practise advance voting, the board of directors must stipulate applicable guidelines. Statoil's board of directors adopted guidelines for such advance voting in March 2012, and these guidelines are described in the notices of the annual general meetings.
Marketing of petroleum on behalf of the Norwegian State
OurStatoil’s articles of association provide that we areStatoil is responsible for marketing and selling petroleum produced under the SDFI's shares in production licences on the Norwegian continental shelf (NCS) as well as petroleum received by the Norwegian State paid as royalty together with ourits own production. OurStatoil’s general meeting adopted an instruction in respect of such marketing on 25 May 2001, as most recently amended by authorisation of the annual general meeting on 1911 May 2011.2016.
Nomination committee
The tasks of the nomination committee are to make recommendations to the general meeting regarding the election of and fees for shareholder-elected members and deputy members of the corporate assembly, to make recommendations to the corporate assembly regarding the election of and fees for shareholder-elected members of the board of directors, to make recommendations to the corporate assembly regarding the election of the chair and the deputy chair of the board and to make recommendations to the general meeting regarding the election of and fees for members of the nomination committee.
The general meeting may adopt instructions for the nomination committee.
The full articles of association are enclosed hereto as Exhibit 1, and are also available at Statoil.com/articlesofassociation.www.statoil.com/articlesofassociation.
7.2 Ethics Code of Conduct
Ethics – ourStatoil’s approach
We believeStatoil believes that responsible and ethical behaviorbehaviour is a necessary condition for a sustainable business. Our EthicsStatoil’s Code of Conduct (the Code) is based on ourits values and reflects ourStatoil’s commitment to high ethical standards in all ourits activities.
Our Ethics Code of Conduct
The Ethics Code of Conduct describes ourStatoil’s code of business practice and the requirements to expected behaviorbehaviour in areas such as anti-corruption, fair competition, conflict of interesthuman rights and non-discrimination working environmentenvironments with equal opportunities. Everyone who works for Statoil, including employees, officers,The Code applies to Statoil’s board members, employees and hired personnel.
Statoil seeks to work with others who act on Statoil’s behalf, must follow the Code.
We seekshare its commitment to develop relations withethics and compliance, and Statoil manages its risks through in-depth knowledge of suppliers, business partners who uphold a commitmentand markets. Statoil expects its suppliers and business partners to valuescomply with applicable laws, respect internationally recognised human rights and adhere to ethical standards similar towhich are consistent with Statoil’s and we workethical requirements when working for or together with our suppliers to ensure operational integrity.Statoil. In joint ventures and entities where Statoil does not have control, we makeStatoil makes good faith efforts to encourage the adoption of ethics and anti-corruption policies and procedures that are consistent with Statoil’sits standards.
Anyone working for Statoil who does not comply with ourthe Code faces disciplinary action, up to and including summery dismissal or termination of their contract.
The Statoil Ethics Code of Conduct is available in local languages in countries where we have operations.
Training and Certifying the Code
We carry out codeCode of conductConduct training and other more comprehensive trainings on specific issues, including anti-corruption and anti-trust, is carried out to explain how the codeCode applies and to describe the tools that Statoil has made available to address risk.
All Statoil employees have to annually confirm in writing,electronically that they understand and will comply with our Ethicsthe Code of Conduct.(Code certification). The Code certification reminds the individualindividuals of their duty to comply with Statoil’s values and ethical requirements and creates an environment with open dialog on ethical issues, both internally and externally.
Anti-corruption compliance programme
Statoil is against all forms of corruption including bribery, facilitation payments. We havepayments and trading in influence and has a company-wide anti-corruption compliance programme which implements ourits zero-tolerance policy. The programme includes mandatory procedures designed to comply with applicable laws and regulations and training
116Statoil, Annual Report on Form 20-F 2014
on relevant issues such as gifts, hospitality and conflicts of interest. Compliance officers, who are responsible for ensuring that ethics and anti-corruption considerations are integrated into ourStatoil’s business activities, constitute an important part of the programme.
In 2016, Statoil introduced and rolled out an updated and more user-friendly Code of Conduct, which included new information on international trade restrictions and money laundering. Statoil continued to develop its implementation of the Code including focus on
94Statoil, Annual Report on Form 20-F 2016
supplier monitoring and follow-up and integrating risk assessments more deeply into the business. Statoil also introduced a holistic approach to discussing various compliance and sustainability issues, and the links between the two, through workshops for internal and external stakeholders.
One of the priorities in 2014 was to develop and implement good through developing procedures and tools for the follow up of non-operated joint ventures. During 2015 we plan to focus on the systematic support and follow up from the ethics and compliance function in our business units by continuing to strengthen the compliance officer network in Statoil.
Our company-wide IDD process helps us to understand potential partners and suppliers, how their business is conducted and their values. Before entering into a new business relationship, or extending an existing one, the relationship has to satisfy our requirements for IDD.
Speak Up
Statoil is committed to maintain an open dialog on ethical issues. Anyone that raisesThe Code requires those who have a question or reports a suspectedsuspect misconduct is following our code of conduct.to raise their concern either through internal channels or through Statoil’s external Ethics Helpline. Employees are encouraged to discuss their concerns with their supervisor, legalsupervisor. Statoil recognises that raising a concern is not always easy so there are several internal channels for taking concerns forward, including through human resources or the ethics and compliance networkfunction in Statoil.the legal department. Concerns or reports of suspected misconducts can also be expressed through ourthe externally operated ethics helplineEthics Helpline which is available 24/7, and allows for anonymous reporting.reporting and two-way communication through the use of a pin-code. Statoil has a non-retaliation policy for anyone thatwho reports in good faith.
More information about ourStatoil’s policies and requirements related to ethics and anti-corruption, including the IDD process, the Ethics Code of Conduct and the anti-corruption programme manual, is available on Statoil.com/Ethicsandvalueswww.statoil.com/ethics.
Compliance with NYSE listing rules
Statoil's primary listing is on the Oslo Børs, but Statoil is also registered as a foreign private issuer with the US Securities and Exchange Commission and listed on the New York Stock Exchange.
7.3American Depositary Shares represent the company's ordinary shares listed on the New York Stock Exchange (NYSE). While Statoil's corporate governance practices follow the requirements of Norwegian law, Statoil is also subject to the NYSE's listing rules.
As a foreign private issuer, Statoil is exempted from most of the NYSE corporate governance standards that domestic US companies must comply with. However, Statoil is required to disclose any significant ways in which its corporate governance practices differ from those applicable to domestic US companies under the NYSE rules. A statement of differences is set out below:
Corporate governance guidelines
The NYSE rules require domestic US companies to adopt and disclose corporate governance guidelines. Statoil's corporate governance principles are developed by the management and the board of directors, in accordance with the Norwegian Code of Practice for Corporate Governance and applicable law. Oversight of the board of directors and management is exercised by the corporate assembly.
Director independence
The NYSE rules require domestic US companies to have a majority of "independent directors". The NYSE definition of an "independent director" sets out five specific tests of independence and also requires an affirmative determination by the board of directors that the director has no material relationship with the company.
Pursuant to Norwegian company law, Statoil's board of directors consists of members elected by shareholders and employees. Statoil's board of directors has determined that, in its judgment, all of the shareholder-elected directors, except one, are independent. In making its determinations of independence, the board focuses inter alia on there not being any conflicts of interest between shareholders, the board of directors and the company's management. It does not strictly make its determination based on the NYSE's five specific tests, but take into consideration all relevant circumstances which may in the board’s view affect the directors’ independence. The directors elected from among Statoil's employees would not be considered independent under the NYSE rules because they are employees of Statoil. None of the employee-elected directors are an executive officer of the company.
For further information about the board of directors, see the section Board of directors.
Board committees
Pursuant to Norwegian company law, managing the company is the responsibility of the board of directors. Statoil has an audit committee, a safety, sustainability and ethics committee and a compensation and executive development committee. They are responsible for preparing certain matters for the board of directors. The audit committee and the compensation and executive development committee operate pursuant to charters that are broadly comparable to the form required by the NYSE rules. They report on a regular basis to, and are subject to, continuous oversight by the board of directors. For further information about the board’s sub-committees, see the section Board of directors.
Statoil complies with the NYSE rule regarding the obligation to have an audit committee that meets the requirements of Rule 10A-3 of the US Securities Exchange Act of 1934.
As required by Norwegian company legislation, the members of Statoil's audit committee include an employee-elected director. Statoil relies on the exemption provided for in Rule 10A-3(b)(1)(iv)(C) from the independence requirements of the US Securities Exchange Act of 1934 with respect to the employee-elected director. Statoil does not believe that its reliance on this exemption will materially
Statoil, Annual Report on Form 20-F 201695
adversely affect the ability of the audit committee to act independently or to satisfy the other requirements of Rule 10A-3 relating to audit committees. The other members of the audit committee meet the independence requirements under Rule 10A-3.
Among other things, the audit committee evaluates the qualifications and independence of the company's external auditor.However, in accordance with Norwegian law, the auditor is elected by the annual general meeting of the company's shareholders.
Statoil does not have a nominating/corporate governance sub-committee formed from its board of directors. Instead, the roles prescribed for a nominating/corporate governance committee under the NYSE rules are principally carried out by the corporate assembly and the nomination committee which is elected by the general meeting of shareholders. NYSE rules require the compensation committee of US companies to comprise independent directors under the NYSE rules, recommend senior management remuneration and make a determination on the independence of advisors when engaging them. Statoil, as foreign private issuer, is exempt from complying with these rules and is permitted to follow its home country regulations. Statoil considers all, but one, its compensation committee members to be independent (under Statoil’s framework which, as discussed above, is not identical to that of NYSE). Statoil's compensation committee makes recommendations to the board about management remuneration, including that of the CEO. The compensation committee assesses its own performance and has the authority to hire external advisors. The nomination committee, which is elected by the general meeting of shareholders, recommends to the corporate assembly the candidates and remuneration of the board of directors. Also, the nomination committee recommends to the general meeting of shareholders the candidates and remuneration of the corporate assembly and the nomination committee.
Shareholder approval of equity compensation plans
The NYSE rules require that, with limited exemptions, all equity compensation plans must be subject to a shareholder vote. Under Norwegian company law, although the issuance of shares and authority to buy back company shares must be approved by Statoil's annual general meeting of shareholders, the approval of equity compensation plans is normally reserved for the board of directors.
3.2 General meeting of shareholders
The general meeting of shareholders is ourStatoil’s supreme corporate body. The objectiveIt serves as a democratic and effective forum for interaction between the company’s shareholders, board of the general meeting is to ensure shareholder democracy. We encourage all shareholders to participate in person or by proxy.directors and management.
The general meeting of shareholders is the company's supreme corporate body. The 2015next annual general meeting (AGM) is scheduled for 1911 May 20152017 in Stavanger, Norway, with simultaneous transmission by webcast.webcast through our website. The AGM is conducted in Norwegian, with simultaneous English translation during the webcast. At Statoil's AGM on 11 May 2016, 76.79% of the share capital was represented either by advance voting, in person or by proxy.
The main framework for convening and holding Statoil's AGM is as follows:
Pursuant to the company'sStatoil’s articles of association, the AGM must be held by the end of June each year. Notice of the meeting and documents relating to the AGM are published on Statoil's website and notice is sent to all shareholders with known addresses at least 21 days prior to the meeting. All shareholders who are registered in the Norwegian Central Securities Depository (VPS) will receive an invitation to the AGM. Other documents relating to Statoil's AGMs will be made available on Statoil's website. A shareholder may nevertheless request that documents that relate to matters to be dealt with at the AGM be sent to him/her.
Shareholders are entitled to have their proposals dealt with at the AGM if the proposal has been submitted in writing to the board of directors in sufficient time to enable it to be included in the notice of meeting, i.e. no later than 28 days before the meeting. Shareholders who are prevented from attendingunable to attend may vote by proxy.
As described in the notice of the general meeting, shareholders may vote in writing, including through electronic communication, for a period before the general meeting.
The deadline for registration for the AGM in Statoil is the day before the AGM is due to take place.
The AGM is normally opened and chaired by the chair of the corporate assembly. If there is a dispute concerning individual matters and the chair of the corporate assembly belongs to one of the disputing parties, or is for some other reason not perceived as being impartial, another person will be appointed to chair the AGM. This is in order to ensure impartiality in relation to the matters to be considered. As Statoil has a large number of shareholders with a wide geographicalgeographic distribution, Statoil offers shareholders the opportunity to follow the AGM by webcast.
The following matters are decided at the AGM:
· Approval of the board of directors' report, the financial statements and any dividend proposed by the board of directors and recommended by the corporate assembly
· Election of the shareholders' representatives to the corporate assembly and stipulationapproval of the corporate assembly's fees
· Election of the nomination committee and stipulationapproval of the nomination committee's fees
· Election of the external auditor and stipulationapproval of the auditor's fee
· Any other matters listed in the notice convening the AGM.AGM
96Statoil, Annual Report on Form 20-F 2016
All shares carry an equal right to vote at general meetings. Resolutions at AGMsgeneral meetings are normally passed by simple majority. However, Norwegian company law requires a qualified majority for certain resolutions, including resolutions to waive preferential rights in connection with any share issue, approval of a merger or demerger, amendment of the articles of association or authorisation to increase or reduce the share capital. Such matters require the approval of at least two-thirds of the aggregate number of votes cast as well as two-thirds of the share capital represented at the AGM.general meeting.
If shares are registered by a nominee in the Norwegian Central Securities Depositary (VPS), cf. section 4-10 of the Norwegian Public Limited Liability Companies Act, and the beneficial shareholder wants to vote for their shares, the beneficial shareholder must re-register the shares in a separate VPS
Statoil, Annual Report on Form 20-F 2014117
account in their own name prior to the general meeting. If the holder can prove that such steps have been taken and that the holder has a de facto shareholder interest in the company, the holder may, incompany will allow the company's opinion,shareholder to vote for the shares. Decisions regarding voting rights for shareholders and proxy holders are made by the person opening the meeting, whose decisions may be reversed by the general meeting by simple majority vote.
The minutes of the AGM are made available on ourStatoil’s website immediately after the AGM.
As regards to extraordinary general meetings (EGM), an EGM will be held in order to consider and decide a specific matter if demanded by the corporate assembly, the chair of the corporate assembly, the auditor or shareholders representing at least 5% of the share capital. The board must ensure that an EGM is held within a month of such demand being submitted.
In the following, we outline certain types of resolutions by the general meeting of shareholders:shareholders are outlined:
New share issues
If we issueStatoil issues any new shares, including bonus shares, ourthe articles of association must be amended. This requires the same majority as other amendments to ourthe articles of association. In addition, under Norwegian law, ourthe shareholders have a preferential right to subscribe for new shares issued by us.Statoil. The preferential right to subscribe for an issue may be waived by a resolution of a general meeting passed by the same percentage majority as required to approve amendments to ourthe articles of association. The general meeting may, with a majority as described above, authorise the board of directors to issue new shares, and to waive the preferential rights of shareholders in connection with such share issues. Such authorisation may be effective for a maximum of two years, and the par value of the shares to be issued may not exceed 50% of the nominal share capital when the authorisation was granted.
The issuing of shares through the exercise of preferential rights to holders who are citizens or residents of the USUSA may require usStatoil to file a registration statement in the USUSA under US securities laws. If we decideStatoil decides not to file a registration statement, these holders may not be able to exercise their preferential rights.
Right of redemption and repurchase of shares
OurStatoil’s articles of association do not authorise the redemption of shares. In the absence of authorisation, the redemption of shares may nonetheless be decided upon by a general meeting of shareholders by a two-thirds majority on certain conditions. However, such share redemption would, for all practical purposes, depend on the consent of all shareholders whose shares are redeemed.
A Norwegian company may purchase its own shares if authorisation to do so has been granted by a general meeting with the approval of at least two-thirds of the aggregate number of votes cast as well as two-thirds of the share capital represented at the general meeting. The aggregate par value of such treasury shares held by the company must not exceed 10% of the company's share capital, and treasury shares may only be acquired if, according to the most recently adopted balance sheet, the company's distributable equity exceeds the consideration to be paid for the shares. Pursuant to Norwegian law, authorisation by the general meeting cannot be granted for a period exceeding 18 months.
Distribution of assets on liquidation
Under Norwegian law, a company may be wound up by a resolution of the company's shareholders at a general meeting passed by both a two-thirds majority of the aggregate votes cast and a two-thirds majority of the aggregate share capital represented at the general meeting. The shares are ranked equally in the event of a return on capital by the company upon winding up or otherwise.
7.4
3.3 Nomination committee
Pursuant to Statoil's articles of association, the nomination committee shall consist of four members who are shareholders or representatives of shareholders. The duties of the nomination committee are set forth in the articles of association, and the instructions for the committee are adopted by the general meeting of shareholders.
The committee is independent of both the board of directors and the company's management.
The duties of the nomination committee are to submit recommendations to:
Statoil, Annual Report on Form 20-F 201697
· the annual general meeting for the election of shareholder-elected members and deputy members of the corporate assembly, and the remuneration of members of the corporate assembly;assembly
· the annual general meeting for the election and remuneration of members of the nomination committee;committee
· the corporate assembly for the election of shareholder-elected members of the board of directors and remuneration of the members of the board of directors and
· the corporate assembly for the election of the chair and deputy chair of the corporate assembly.assembly
Using a form onThe nomination committee would like to ensure that the company's website,shareholders’ views are taken into consideration when candidates to the governing bodies of Statoil ASA are proposed. The nomination committee invites in writing Statoil's largest shareholders canto propose shareholder-elected candidates for the board of directors, the corporate assembly and the board of directors, as well as members of the nomination committee. The shareholders are also invited to provide input to the nomination committee in respect of the composition and competence of Statoil's governing bodies in light of Statoil's strategies and challenges going forward. The deadline for providing input is normally set to early January in order to secure that the response is taken into account in the upcoming nominations. In addition, all shareholders have an opportunity to submit proposals through an electronic mailbox as described on Statoil’s website. In the board nomination process, the board shares with the nomination committee the results from the annual, normally externally facilitated board evaluation with input from both management and the board. Separate meetings are held between the nomination committee and each board member, including employee-elected board members. The chair of the board and the chief executive officer are invited, without having the right to vote, to attend at least one meeting of the nomination committee before it makes its final recommendations. The committee regularly utilises external expertise in its work.
The members of the nomination committee are elected by the annual general meeting. The chair of the nomination committee and one other member are elected from among the shareholder-elected members of the corporate assembly. Members of the nomination committee are normally elected for a term of two years.
118Statoil, Annual Report on Form 20-F 2014
Personal deputy members for one or more of the nomination committee's members may be elected in accordance with the same criteria as described above. A deputy member normally only meets for the permanent member if the appointment of that member terminates before the term of office has expired.
The membersStatoil's nomination committee consists of the nomination committee are:following members as per 31 December 2016 and are elected for the period up to the annual general meeting in 2018:
· Olaug SvarvaTone Lunde Bakker (chair), Managing director, FolketrygdfondetGlobal head of cash management at Danske Bank (also chair of Statoil’s corporate assembly)
· Tom Rathke, Group executive vice president Wealth Management at DnB
· Elisabeth Berge, Secretary general, Norwegian Ministry of Petroleum and Energy (personal deputy for Elisabeth Berge is Johan A Alstad, Deputy director general,Bjørn Ståle Haavik, Director at the Norwegian Ministry of Petroleum and Energy).
· Tone Lunde Bakker, Norwegian country managerJarle Roth, CEO of Danske BankArendals Fossekompani ASA (also a member of Statoil’s corporate assembly)
The board considers all members of the nomination committee to be independent of Statoil's management and board of directors. The general meeting decides the remuneration of the nomination committee.
The nomination committee held 1215 ordinary meetingmeetings and twofour telephone meetings in 2014.2016.
The instructions for the nomination committee including the rules of procedure, are available at Statoil.com/nominationcommittee.www.statoil.com/nominationcommittee.
7.53.4 Corporate assembly
Pursuant to the Norwegian Public Limited Liability Companies Act, companies with more than 200 employees must elect a corporate assembly unless otherwise agreed between the company and a majority of its employees.
Statoil, Annual Report on Form 20-F 2014119
Name | Occupation | Place of residence | Year of birth | Position | Family relations to corporate executive committee, board or corporate assembly members | Share ownership for members as of 31.12.2014 | Share ownership for members as of 12.03.2015 | First time elected | Expiration date of current term |
| | | | | | | | | |
Olaug Svarva | Managing director, Folketrygdfondet | Oslo | 1957 | Chair, Shareholder-elected | No | 0 | 0 | 2007 | 2016 |
Idar Kreutzer | CEO, Finance Norway (FNO) | Oslo | 1962 | Deputy chair, Shareholder-elected | No | 0 | 0 | 2007 | 2016 |
Karin Aslaksen | Head of HR department, the National Police Directorate of Norway | Hosle | 1959 | Shareholder-elected | No | 0 | 0 | 2008 | 2016 |
Greger Mannsverk | Managing director, Kimek AS | Kirkenes | 1961 | Shareholder-elected | No | 0 | 0 | 2002 | 2016 |
Steinar Olsen | Self-employed | Stavanger | 1949 | Shareholder-elected | No | 0 | 0 | 2007 | 2016 |
Ingvald Strømmen | Dean at Norwegian University of Science and Technology (NTNU) | Ranheim | 1950 | Shareholder-elected | No | 0 | 0 | 2006 | 2016 |
Rune Bjerke | President and CEO, DNB ASA | Oslo | 1960 | Shareholder-elected | No | 0 | 0 | 2007 | 2016 |
Barbro Hætta | Chief Municipal Medical Officer | Harstad | 1972 | Shareholder-elected | No | 0 | 0 | 2010 | 2016 |
Siri Kalvig | Employee, StormGeo AS | Stavanger | 1970 | Shareholder-elected | No | 0 | 0 | 2010 | 2016 |
Terje Venold | Self-employed | Stabekk | 1950 | Shareholder-elected | No | 250 | 250 | 2014 | 2016 |
Tone Lund Bakker | Norwegian country manager, Danske Bank | Oslo | 1962 | Shareholder-elected | No | 0 | 0 | 2014 | 2016 |
Kjersti Kleven | Active owner of John Kleven AS | Ulsteinvik | 1967 | Shareholder-elected | No | 0 | 0 | 2014 | 2016 |
Eldfrid Irene Hognestad | Union representative Tekna, Advisor Benchmarking | Stavanger | 1966 | Employee-elected | No | 824 | 1,001 | 2009 | 2015 |
Steinar Kåre Dale | Union representative, NITO, SR Analyst | Mongstad | 1961 | Employee-elected | No | 1,958 | 2,205 | 2013 | 2015 |
Per Martin Labråthen | Union representative, Industri Energi. Production technician | Brevik | 1961 | Employee-elected | No | 1,767 | 454 | 2007 | 2015 |
Anne K.S. Horneland | Union representative, Industri Energi | Stavanger | 1956 | Employee-elected | No | 4,041 | 4,333 | 2006 | 2015 |
Jan-Eirik Feste | Union representative, YS | Lindås | 1952 | Employee-elected | No | 506 | 702 | 2008 | 2015 |
Hilde Møllerstad | Union representative, Tekna/NITO | Oslo | 1966 | Employee-elected | No | 1,945 | 2,264 | 2013 | 2015 |
Per Helge Ødegård | Union representative, Lederne. Discipl resp operation process | Skien | 1963 | Employee-elected, observer | No | 475 | 660 | 1994 | 2015 |
Dag-Rune Dale | Union representative, Industri Energi, Safety officer | Kollsnes | 1963 | Employee-elected, observer | No | 2,383 | 2,594 | 2013 | 2015 |
Brit Gunn Ersland | Union representative, Tekna. Specialist Reservoir Tech. | Bergen | 1960 | Employee-elected, observer | No | 1,208 | 1,412 | 2011 | 2015 |
Total | | | | | | 15.357 | 15.875 | | |
120Statoil, Annual Report on Form 20-F 2014
An election of the shareholder representatives in the corporate assembly was held in the Ordinary General meeting 14 May 2014. Terje Venold, Tone Lunde Bakker and Kjersti Kleven were elected as new members, and Nina Kivijervi Jonassen and Birgitte Vartdal as new deputy members of the Corporate assembly. Tore Ulstein and Thor Oscar Bolstad left the Corporate assembly as of the same date.
Pursuant toIn accordance with Statoil's articles of association, the corporate assembly normally consists of 18 members. Twelve members, with12 of whom (with four deputy membersmembers) are nominated by the nomination committee and elected atby the annual general meetingmeeting. They represent a broad cross-section of the company's shareholders and sixstakeholders. Six members, with deputy members, and three observers and deputy members are elected by and from among theour employees. Such employees are non-executive personnel.The corporate assembly elects its own chair and deputy chair from and among its members.
Members of the corporate assembly are normally elected for a term of two years. Members of the board of directors and the general managermanagement cannot be members of the corporate assembly, but they are entitled to attend and to speak at meetings of the corporate assembly unless the corporate assembly decides otherwise in individual cases.All members of the corporate assembly live in Norway. Members of the corporate assembly do not have service contracts with the company or its subsidiaries providing for benefits upon termination of office.
An overview of the members and observers of the corporate assembly as of 31 December 2016 follows below.
98Statoil, Annual Report on Form 20-F 2016
Name | Occupation | Place of residence | Year of birth | Position | Family relations to corporate executive committee, board or corporate assembly members | Share ownership for members as of 31.12.2016 | Share ownership for members as of 08.03.2017 | First time elected | Expiration date of current term |
| | | | | | | | | |
Tone Lunde Bakker | Global head of cash management at Danske Bank | Oslo | 1962 | Chair, Shareholder-elected | No | 0 | 0 | 2014 | 2018 |
Nils Bastiansen | Executive director of equities in Folketrygdfondet | Oslo | 1960 | Deputy chair, Shareholder-elected | No | 0 | 0 | 2016 | 2018 |
Jarle Roth | CEO, Arendals Fossekompani ASA | Bærum | 1960 | Shareholder-elected | No | 43 | 43 | 2016 | 2018 |
Greger Mannsverk | Managing director, Kimek AS | Kirkenes | 1961 | Shareholder-elected | No | 0 | 0 | 2002 | 2018 |
Steinar Olsen | CEO, Jemso A/S | Stavanger | 1949 | Shareholder-elected | No | 0 | 0 | 2007 | 2018 |
Kathrine Næss | Plant manager at the aluminium smelter at Alcoa Mosjøen | Mosjøen | 1979 | Shareholder-elected | No | 0 | 0 | 2016 | 2018 |
Ingvald Strømmen | Dean at Norwegian University of Science and Technology (NTNU) | Ranheim | 1950 | Shareholder-elected | No | 0 | 0 | 2006 | 2018 |
Rune Bjerke | President and CEO, DNB ASA | Oslo | 1960 | Shareholder-elected | No | 0 | 0 | 2007 | 2018 |
Birgitte Ringstad Vartdal | CEO of the dry bulk shipping company Golden Ocean Group Ltd | Oslo | 1977 | Shareholder-elected | No | 0 | 0 | 2016 | 2018 |
Siri Kalvig | Associate professor, University of Stavanger | Stavanger | 1970 | Shareholder-elected | No | 0 | 0 | 2010 | 2018 |
Terje Venold | Independent advisor with various directorships | Bærum | 1950 | Shareholder-elected | No | 519 | 519 | 2014 | 2018 |
Kjersti Kleven | Co-owner of John Kleven AS | Ulsteinvik | 1967 | Shareholder-elected | No | 0 | 0 | 2014 | 2018 |
Brit Gunn Ersland | Union representative, Tekna. Prosj leder Res Tek | Bergen | 1960 | Employee-elected | No | 2072 | 2270 | 2011 | 2017 |
Steinar Kåre Dale | Union representative, NITO, SR Analyst | Mongstad | 1961 | Employee-elected | No | 3033 | 1931 | 2013 | 2017 |
Per Martin Labråten | Union representative, Industri Energi. Production technician | Brevik | 1961 | Employee-elected | No | 983 | 1151 | 2007 | 2017 |
Anne K.S. Horneland | Union representative, Industri Energi | Hafrsfjord | 1956 | Employee-elected | No | 5216 | 5498 | 2006 | 2017 |
Jan-Eirik Feste | Union representative, YS | Lindås | 1952 | Employee-elected | No | 1251 | 1437 | 2008 | 2017 |
Hilde Møllerstad | Union representative, Tekna/NITO | Oslo | 1966 | Employee-elected | No | 3338 | 3642 | 2013 | 2017 |
Per Helge Ødegård | Union representative, Lederne. Discipl resp operation process | Porsgrunn | 1963 | Employee-elected, observer | No | 1181 | 1361 | 1994 | 2017 |
Dag-Rune Dale | Union representative, Industri Energi, Safety officer | Kollsnes | 1963 | Employee-elected, observer | No | 3334 | 3555 | 2013 | 2017 |
Sun Lehmann | Union representative, Tekna. Advisor Data Management | Trondheim | 1972 | Employee-elected, observer | No | 3608 | 3924 | 2015 | 2017 |
Total | | | | | | 24,578 | 25,331 | | |
Statoil, Annual Report on Form 20-F 201699
An election of shareholder-elected members of the corporate assembly was held at Statoil’s annual general meeting 11 May 2016. Effective as of 12 May 2016, Nils Bastiansen, Birgitte Ringstad Vartdal (former deputy member), Jarle Roth and Kathrine Næss were elected as new members of the corporate assembly, while Kjerstin Fyllingen, Håkon Volldal and Kari Skeidsvoll Moe were elected as new deputy members. Olaug Svarva (chair), Idar Kreutzer (deputy chair), Karin Aslaksen (member), Barbro Hætta (member), Arthur Sletteberg (deputy member) and Bassim Haj (deputy member) left the corporate assembly as of the same date. On 7 June 2016 the corporate assembly elected Tone Lunde Bakker as chair, and Nils Bastiansen as deputy chair, of the corporate assembly.
The duties of the corporate assembly are defined in section 6-37 of the Norwegian Public Limited Liability Companies Act. The corporate assembly elects the board of directors and the chair of the board.board and can vote separately on each nominated candidate. Its responsibilities also include overseeing the board and the CEO's management of the company, making decisions on investments of considerable magnitude in relation to the company's resources, and making decisions involving the rationalisation or reorganisation of operations that will entail major changes in or reallocation of the workforce.
Statoil's corporate assembly held four ordinary meetings in 2014.2016, and visited Statoil’s operation center for logistics and emergency response in Bergen in connection with one of the meetings. The chair of the board participated at four meetings, and the CEO at three meetings (with the CFO acting on his behalf at one meeting). Other members of management were also present at the meetings.
All membersThe procedure for the work of the corporate assembly, live in Norway. Membersas well as an updated overview of the corporate assembly do not have service contracts with the company or its subsidiaries providing for benefits upon termination of office.members, is available at www.statoil.com/corporateassembly.
100Statoil, Annual Report on Form 20-F 20142016 121
7.6
3.5 Board of directors
Pursuant to Statoil's articles of association, the board of directors will consistconsists of between nine and 11 members.members elected by the corporate assembly. The management is not represented onchair of the board and all shareholder representatives onthe deputy chair of the board are independent.
also elected by the corporate assembly. At present, Statoil's board of directors consists of 1110 members. As required by Norwegian company law, the company's employees are entitled to be represented by three board members.
The employee-elected board members, but not the shareholder-elected board members, have four deputy members who attend board meetings in the event an employee-elected member of the board is unable to attend. The management is not represented on the board of directors. Members of the board are elected for a term of up to two years, normally for one year at a time. There are no board member service contracts that provide for benefits upon termination of office.
The board considers its composition to be diverse and competent with respect to the expertise, capacity and diversity appropriate to attend to the company's goals, main challenges, and the common interest of all shareholders. The board also deems its composition to be made up of individuals who are willing and able to work as a team, resulting in the board working effectively as a collegiate body. At least one board member qualifies as "audit committee financial expert", as defined in the US Securities and Exchange Commission requirements. Five board members are women and three board members are non-Norwegians resident outside of Norway.
Statoil's board of directors has determined that, in its judgment, all of the shareholder representatives on the board, except for Wenche Agerup, are considered independent. Under the NYSE rules, a director will not be considered independent as defined byif the Norwegian Codedirector is, or was within the past three years, an executive officer of Practice for Corporate Governance.
The board of directors of Statoil ASA is responsible for the overall managementanother company at which any of the listed company's current executive officers are, or were within the past three years, members of the compensation committee. Wenche Agerup was a member of Norsk Hydro ASA’s management team while Irene Rummelhoff, Executive Vice President of New Energy Solutions in Statoil, group, and for supervisingwas member of the group's activitiesboard’s compensation committee in general.
TheNorsk Hydro. Agerup is therefore deemed as a non-independent board of directors handles matters of major importance or of an extraordinary nature. However, it may require the management to refer any matter to it. The board of directors appoints the president and chief executive officer (CEO), and stipulates the job instructions, powers of attorney and terms and conditions of employment for the president and CEO.
The board of directors has three sub-committees - the "audit committee", "the safety, sustainability and ethics committee", and "the compensation and executive development committee".member until 31 December 2017.
The board held eight ordinary board meetings and threetwo extraordinary meetings in 2014.2016. Average attendance at these board meetings was 95.6 %.98,1%.
Further information about the members of the board and its sub-committees, including information about expertise, experience, other directorships, independence, share ownership and loans, is available below as well as on our website at www.statoil.com/board which is regularly updated.
Members of the board of directors as of 31 December 2014:2016:
Øystein Løseth
Born: 1958
Position:Shareholder-elected chair of the board and chair of the board's compensation and executive committee.
Term of office:Member of the board of directors of Statoil ASA since 1 October 2014, and since 1 July 2015, also chair of the board and chair of the board’s compensation and executive development committee. Up for election in 2017.
Independent: Yes
Other directorships:Chair of the board of Eidsiva Energi AS and Hunton Fiber AS.
Number of shares in Statoil ASA as of 31 December 2016:1,040
Loans from Statoil:None
Experience: In the period 2010 - 2014, Løseth was the CEO, and before that First Senior Executive Vice President since 2009, of Vattenfall AB. In the period 2003 – 2009, Løseth worked for NUON, a Dutch energy company, first as Division Managing Director, then as a Managing Director and the CEO, from 2006 and 2008 respectively. From 2002 to 2003, Løseth was the Head of Production,
Statoil, Annual Report on Form 20-F 2016101
Business Development and R&D of Statkraft. In addition, he has other extensive management experience from Statkraft and Statoil, within strategy and business development among others.
Education: Løseth graduated as M.Sc. from the Norwegian University of Science and Technology and has a degree in Economics from BI Norwegian School of Management in Bergen.
Family relations:No family relations to other members of the board, members of the corporate executive committee or the corporate assembly.
Other matters:In 2016, Løseth participated in eight ordinary board meetings, two extraordinary board meetings, five meetings of the compensation and executive development committee and one meeting in the safety, sustainability and ethics committee. Løseth is a Norwegian citizen and resident in Norway.
Svein Rennemo
| Svein Rennemo
Born: 1947
Position: Chair of the board and member of the board's compensation and executive development committee.
Term of office: Chair of the board of Statoil ASA since 1 April 2008. Up for election in 2015.
Independent: Yes
Other directorships: Chair of the board of Tomra Systems ASA.
Number of shares in Statoil ASA as of 31 December 2014: 10,000
Loans from Statoil: None
Experience: Rennemo was CEO of Petroleum Geo-Services ASA from 2002 until 1 April 2008 (when he took up office as chair of the board of Statoil ASA). From 1994 to 2001, Rennemo worked for Borealis, first as deputy CEO and CFO and, from 1997, as CEO. He held various management positions in Statoil from 1982 to 1994, most recently as head of the petrochemical division. During the period 1972 to 1982, he was an analyst and monetary policy and economics adviser at Norges Bank (the Norwegian central bank), the OECD Secretariat in Paris and the Norwegian Ministry of Finance.
|
Education: Economist, University of Oslo.
Family relations: No family relations to other members of the board, members of the corporate executive committee or the corporate assembly.
Other matters: In 2014, Svein Rennemo participated in seven ordinary board meetings, three extraordinary board meetings and seven meetings of the compensation and executive development committee.
Rennemo is a Norwegian citizen and resident in Norway.
|
Roy Franklin
Born: 1953
Position: Shareholder-elected deputy chair of the board, chair of the board’s safety, sustainability and ethics committee and member of the board’s audit committee.
Term of office: Board member and deputy chair of the board of Statoil ASA from 1 July 2015. Franklin was also previously a member of the board of StatoilHydro from October 2007 and Statoil from November 2009 until June 2013. Up for election in 2017.
Independent: Yes
Other directorships: Non-executive chair of the board of Cuadrilla Resources Holdings Limited, a privately held UK company focusing on unconventional energy sources. Board member of the Australian oil and gas company Santos Ltd, the private equity firm Kerogen Capital Ltd and the London-based international engineering company Amec Foster Wheeler.
Number of shares in Statoil ASA as of 31 December 2016: None
Loans from Statoil ASA: None
Experience: Franklin has broad experience from management positions in several countries, including positions with BP, Paladin Resources plc and Clyde Petroleum plc.
Education: Franklin has a Bachelor of Science in Geology from the University of Southampton, UK.
Family relations: No family relations to other members of the board, members of the corporate executive committee or the corporate assembly.
Other matters: In 2016, Franklin participated in eight ordinary board meetings, two extraordinary board meetings, five meetings of the audit committee and six meetings of the safety, sustainability and ethics committee. Franklin is a UK citizen and resident in UK.

Grace Reksten Skaugen
| Grace Reksten Skaugen
Born: 1953
Position: Deputy chair of the board and chair of the board's compensation and executive development committee.
Term of office: Member of the board of Statoil ASA since 2002. Grace Reksten Skaugen has at an early point in time informed Statoil’s nomination committee that she does not wish to stand for re-election to Statoil’s board of directors in 2015. An election of a new candidate will be held at the corporate assembly meeting in March.
Independent: Yes
Other directorships: Chair of the board of the Norwegian Institute of Directors, Deputy chair of the board of Orkla ASA and a board member of the Swedish listed company Investor AB. Chair of the board of NAXS Nordic Access Buyout AS, a Danish subsidiary of the Swedish listed company Nordic Access Buyout Fund AB.
Number of shares in Statoil ASA as of 31 December 2014: 400
Loans from Statoil: None
Experience: Self-employed business consultant. She was a director in corporate finance in SEB Enskilda Securities in Oslo from 1994 to 2002. She has previously worked in the fields of venture capital and shipping in Oslo and London and carried out research in microelectronics at Columbia University in New York.
|
Education: She has a doctorate in laser physics from the Imperial College of Science and Technology at the University of London and an MBA from the Norwegian School of Management (BI).
Family relations: No family relations to other members of the board, members of the corporate executive committee or the corporate assembly.
Other matters: In 2014, Grace Reksten Skaugen participated in seven ordinary board meetings, one extraordinary board meeting and seven meetings of the compensation and executive development committee. Reksten Skaugen is a Norwegian citizen and resident in Norway.
|
Bjørn Tore Godal
Born: 1945
Position: Shareholder-elected member of the board, the board's compensation and executive development committee and the board's safety, sustainability and ethics committee.
122102 Statoil, Annual Report on Form 20-F 20142016
Term of office: Member of the board of Statoil ASA from 1 September 2010. Up for election in 2017.
Independent: Yes
Other directorships: Vice chair of the board of the Fridtjof Nansen Institute (FNI).
Number of shares in Statoil ASA as of 31 December 2016: None
Loans from Statoil ASA: None
Experience: Godal was a member of the Norwegian parliament for 15 years during the period 1986-2001. At various
times, he served as minister for trade and shipping, minister for defense, and minister of foreign affairs for a total of eight years between 1991 and 2001. From 2007-2010, Godal was special adviser for international energy and climate issues at the Norwegian Ministry of Foreign Affairs. From 2003-2007, Godal was Norway's ambassador to Germany and from 2002-2003 he was senior adviser at the department of political science at the University of Oslo. From 2014-2016, Godal lead a government-appointed committee responsible for the evaluation of the civil and military contribution from Norway in Afghanistan in the period 2001 - 2014.
Education: Godal has a bachelor of arts degree in political science, history and sociology from the University of Oslo.
Family relations: No family relations to other members of the board, members of the corporate executive committee or the corporate assembly.
Other matters: In 2016, Godal participated in eight ordinary board meetings, two extraordinary board meetings, five meetings of the compensation and executive development committee and three meetings of the safety, sustainability and ethics committee. Godal is a Norwegian citizen and resident in Norway.
Maria Johanna Oudeman
Born: 1958
Position: Shareholder-elected member of the board and member of the board’s compensation and executive development committee.
Term of office: Member of the board of Statoil ASA since 15 September 2012. Up for election in 2017.
Independent: Yes
Other directorships: Oudeman is a member of the boards of Solvay SA, Het Concertgebouw, Rijksmuseum and SHV Holdings.
Number of shares in Statoil ASA as of 31 December 2016: None
Loans from Statoil: None
Experience: Oudeman is the President of Utrecht University in the Netherlands, one of Europe's leading universities. From 2010 to 2013, Oudeman was a member of the Executive Committee of Akzo Nobel, responsible for HR and Organisational Development. Akzo Nobel is the world's largest paint and coatings company and major producer of specialty chemicals, with operations in more than 80 countries. Before joining Akzo Nobel, she was Executive Director Strip Products Division at Corus Group, now Tata Steel Europe. Oudeman has extensive experience as a line manager in the steel industry and considerable international business experience.
Education: Oudeman has a law degree from Rijksuniversiteit Groningen in the Netherlands and an MBA in business administration from the University of Rochester, New York, USA and Erasmus University, Rotterdam, the Netherlands.
Family relations: No family relations to other members of the board, members of the corporate executive committee or the corporate assembly.
Other matters: In 2016, Oudeman participated in eight ordinary board meetings, two extraordinary board meetings and four meetings of the compensation and executive development committee. Oudeman is a Dutch citizen and resident in the Netherlands.
Statoil, Annual Report on Form 20-F 2016103

Bjørn Tore Godal
| Bjørn Tore Godal
Born: 1945
Position: Member of the board, the board's compensation and executive development committee and the board's safety, sustainability and ethics committee.
Term of office: Member of the board of Statoil ASA from 1 September 2010. Up for election in 2015.
Independent: Yes
Other directorships: Chairman of the Council of the Norwegian Defence University College (NDUC) , and member of the
board of the Fridtjof Nansen Institute (FNI).
Number of shares in Statoil ASA as of 31 December 2014: None
Loans from Statoil ASA: None
Experience: Godal was a member of the Norwegian parliament for 15 years during the period 1986-2001. At various
times, he served as minister for trade and shipping, minister for defence, and minister of foreign affairs for a total of eight
years between 1991 and 2001.
|
From 2007-2010, he was special adviser for international energy and climate issues at the Norwegian Ministry of Foreign Affairs. From 2003-2007, he was Norway's ambassador to Germany and from 2002-2003 he was senior adviser at the department of political science at the University of Oslo.
Education: Godal has a bachelor of arts degree in political science, history and sociology from the University of Oslo.
Family relations: No family relations to other members of the board, members of the corporate executive committee or the corporate assembly.
Other matters: In 2014, Bjørn Tore Godal participated in eight ordinary board meetings, three extraordinary board meetings, seven meetings of the
compensation and executive development committee and five meetings of the safety, sustainability and ethics committee. Godal is a Norwegian citizen and resident in Norway.
|

Jakob Stausholm
| Jakob Stausholm
Born: 1968
Position: Member of the board and chair of the board's audit committee.
Term of office: Member of the board of Statoil ASA since July 2009. Up for election in 2015.
Independent: Yes
Other directorships: No
Number of shares in Statoil ASA as of 31 December 2014:50,000
Loans from Statoil:None
Experience: Chief strategy, finance and transformation officer of Maersk Line, the largest container shipping company in the world and part of A.P. Moller - Maersk Group.
From 2008 to 2011, Stausholm was chief financial officer of the global facility services provider ISS A/S.
Before joining ISS's corporate executive committee, he was employed by the Shell Group for 19 years and held a number of management positions, including vice president finance for the group's exploration and production in Asia and the
|
Pacific, chief internal auditor and CFO of group subsidiaries.
Education: M.Sc. in economics from the University of Copenhagen.
Family relations: No family relations to other members of the board, members of the corporate executive committee or the corporate assembly.
Other matters: In 2014, Jakob Stausholm participated in eight ordinary board meetings, three extraordinary board meetings and seven meetings of the audit committee. Stausholm is a Danish citizen and resident in Denmark.
|
Rebekka Glasser Herlofsen
Born: 1970 Position: Shareholder-elected member of the board and the board's audit committee. Term of office: Member of the board of Statoil ASA since 19 March 2015. Up for election in 2017. Independent: Yes Other directorships: Member of the board of directors of DNV Foundation, DNV Holding, DNV GL, and member of the committee for tax and capital in the Norwegian Shipowners’ Association. Number of shares in Statoil ASA as of 31 December 2016: None Loans from Statoil: None Experience: Since 2012, Herlofsen has been the Chief Financial Officer in the shipping company Torvald Klaveness. She will during the first half of 2017 take on a new position as Chief Financial Officer in WWL ASA, an international shipping company under establishment. She has broad financial and strategic experience from several corporations and board directorships. Herlofsen’s professional career began in the Nordic Investment Bank, Enskilda Securities, where she worked with corporate finance from 1995 to 1999 in Oslo and London. During the next ten years Herlofsen worked in the Norwegian shipping company Bergesen d.y. ASA (later BW Group). During her period with Bergesen d.y. ASA/BW Group Herlofsen held leading positions within M&A, strategy and corporate planning and was part of the group management team. Education: MSc in Economics and Business Administration (Siviløkonom) and Certified Financial Analyst Program (AFA), the Norwegian School of Economics (NHH). Breakthrough Program for Top Executives at IMD business school, Switzerland. Family relations: No family relations to other members of the board, members of the corporate executive committee or the corporate assembly. Other matters: In 2016, Herlofsen participated in eight ordinary board meetings, two extraordinary board meeting and six meetings of the audit committee. Herlofsen is a Norwegian citizen and resident in Norway. 
Maria Johanna Oudeman
| Maria Johanna Oudeman
Born: 1958
Position: Member of the board and member of the board’s compensation and executive development committee.
Term of office: Member of the Board of Statoil ASA from 15 September 2012. Up for election in 2015.
Independent: Yes
Other directorships: Oudeman is a member of the boards of ABN Amro Group, Het Concertgebouw, Rijksmuseum, SHV Holdings and Royal TenCate.
Number of shares in Statoil ASA as of 31 December 2014: None
Loans from Statoil: None
Experience: Marjan Oudeman is the President of Utrecht University in the Netherlands, one of Europe's leading
universities. From 2010 to 2013, Oudeman was a member of the Executive Committee of Akzo Nobel, responsible for HR and Organisational Development. Akzo Nobel is the world's largest paint and coatings company and major producer of specialty chemicals, with operations in more than 80 countries. Before joining Akzo Nobel, Oudeman was Executive
|
Director Strip Products Division at Corus Group, now Tata Steel Europe. Oudeman has extensive experience as a line manager in the steel industry and considerable international business experience.
Education: Oudeman has a law degree from Rijksuniversiteit Groningen in the Netherlands and an MBA in business administration from the University of Rochester, New York, USA and Erasmus University, Rotterdam, the Netherlands.
Family relations: No family relations to other members of the board, members of the corporate executive committee or the corporate assembly.
Other matters: In 2014, Marjan Oudeman participated in seven ordinary board meetings, three extraordinary board meetings, five meetings of the audit committee and three meetings of the compensation and executive development committee. Oudeman is a Dutch citizen and resident in the Netherlands.
|
Statoil, Annual Report on Form 20-F 2014123

James Mulva
| James Mulva
Born: 1946
Position: Member of the board and member of the board's audit committee.
Term of office: Member of the board of directors of Statoil ASA since 1 July 2013. Up for election in 2015.
Independent: Yes
Other directorships: James Mulva is a non-executive director of the American multinational automotive corporation General Motors Corporation and the multinational conglomerate corporation General Electric Company. He is also a director of Green Bay Packaging and Vice Chairman of M.D. Anderson Cancer Centre, Houston.
Number of shares in Statoil ASA as of 31 December 2014: None
Loans from Statoil: None
Experience: James Mulva was president and CEO of Houston-based ConocoPhillips from 2002 until retirement in 2012.
From 2004 to 2012 he also served as chairman of the board. Prior to this he was chairman, president and CEO of Phillips Petroleum from 1999 to 2002. Mulva started his career in the oil and gas industry with Phillips Petroleum Company in
|
1973 and held positions within the finance area, being chief financial officer (CFO) from 1990 -1993. He served as chief operating officer (COO), responsible for all operations including refineries, offshore and onshore activities from 1994 to 1999.
Education: Master of Business Administration from the University of Texas, USA.
Family relations: No family relations to other members of the board, members of the corporate executive committee or the corporate assembly.
Other matters: In 2014, James Mulva participated in eight ordinary board meetings, three extraordinary board meetings, two meetings of the safety, sustainability and ethics committee and two meetings of the audit committee. James Mulva is an American citizen and resident in Houston, Texas, USA.
|
Wenche Agerup

Catherine Hughes
| Catherine Hughes
Position: Member of the board and chair of the board's safety, sustainability and ethics committee .
Born: 1962
Term of office: Member of the board of directors of Statoil ASA since 1 July 2013. Up for election in 2015.
Independent: Yes
Other directorships: Member of the board of directors of the Canadian oilfield services company Precision Drilling
Corporation.
Number of shares in Statoil ASA as of 31 December 2014: 3,850 (American Depository Receipts)
Loans from Statoil: None
Experience: Catherine Hughes has an extensive career within the oil and gas industry. From 2009 to 2013 she worked for Nexen, located in Alberta, Canada, first as vice president (VP) operational services, technology and HR and from 2012 as executive vice president responsible for all activities outside Canada. From 2005 to 2009, she was VP exploration and production services then VP oil sands at Husky Oil. Prior to that Hughes spent 20 years with
|
Schlumberger and held key positions in various countries including Nigeria, Italy, France, UK, Canada and USA.
Education: Hughes holds a Bachelor of Science degree in electrical engineering from Institut National des Sciences Appliquées de Lyon.
Family relations: No family relations to other members of the board, members of the corporate executive committee or the corporate assembly.
Other matters: In 2014, Catherine Hughes participated in eight ordinary board meetings, three extraordinary board meetings, five meetings of the audit committee and two meetings of the safety, sustainability and ethics committee. Catherine Hughes is a Canadian/French citizen resident in Alberta, Canada.
|

Øystein Løseth
| Øystein Løseth
Position: Member of the board and of the board's audit committee .
Born: 1958
Term of office: Member of the board of directors of Statoil ASA since 1 October 2014. Up for election in 2015.
Independent: Yes
Other directorships: Løseth was on 15 December 2014 elected as new chair of the board of Eidsiva Energi. The election will be effective 1 April 2015.
Number of shares in Statoil ASA as of 31 December 2014: None
Loans from Statoil: None
Experience: Since 2010, Løseth has been appointed as the CEO, and before that as a First Senior Executive Vice President since 2009, of Vattenfall AB. In the period 2003 – 2009, Løseth worked for NUON, the Dutch energy company, first as Division Managing Director, then as a Managing Director and the CEO, from 2005 and 2008 respectively. Prior to this, Løseth was the Head of Production, Business Development and R&D of Statkraft from 2002
|
to 2003. In addition, he has other extensive management experience from Statkraft and Statoil, within strategy and business development among others.
Education: Øystein Løseth graduated as M.Sc. from the Norwegian University of Science and Technology and as B.Sc. in Business Management from BI Norwegian School of Management in Bergen.
Family relations: No family relations to other members of the board, members of the corporate executive committee or the corporate assembly.
Other matters: In 2014, Øystein Løseth participated in two ordinary board meetings, two extraordinary board meetings and two meetings of the audit committee. Øystein Løseth is a Norwegian citizen resident in Norway.
|
Born: 1964
Position: Shareholder-elected member of the board, the board’s compensation and executive development committee and the board's safety, sustainability and ethics committee.
Term of office: Member of the board of Statoil ASA since 21 August 2015. Up for election in 2017.
Independent: No.
Under the NYSE rules, a director will not be considered independent under the NYSE rules if the director is, or was within the past three years, an executive officer of another company at which any of the listed company's current executive officers are, or were within the past three years, members of the compensation committee. Agerup was a member of Norsk Hydro ASA’s management
124104 Statoil, Annual Report on Form 20-F 20142016
team while Irene Rummelhoff, Executive Vice President of New Energy Solutions in Statoil, was member of the board’s compensation committee in Norsk Hydro. Agerup is therefore deemed as a non-independent board member in Statoil until 31 December 2017. Other directorships: Agerup is a member of the board of the seismic company TGS ASA and a member of Det Norske Veritas Council. Number of shares in Statoil ASA as of 31 December 2016: 2,522
Loans from Statoil: None Experience: Agerup is an Executive Vice President (Corporate Affairs) and General Counsel in Telenor ASA. Agerup was the Executive Vice President for Corporate Staffs and the General Counsel of Norsk Hydro ASA from 2010 to 31 December 2014. She has held various executive roles in Hydro since 1997, including within the company’s M&A-activities, the business area Alumina, Bauxite and Energy, as a plant manager at Hydro’s metal plant in Årdal and as a project director for a Joint Venture in Australia where Hydro cooperated with the Australian listed company UMC. Education: MA in Law from the University of Oslo, Norway (1989) and a Master of Business Administration from Babson College, USA (1991). Family relations: No family relations to other members of the board, members of the corporate executive committee or the corporate assembly. Other matters: In 2016, Agerup participated in seven ordinary board meetings, two extraordinary board meetings, five meetings of the compensation and executive development committee and five meetings of the safety, sustainability and ethics committee. Agerup is a Norwegian citizen and resident in Norway. 
Lill-Heidi Bakkerud
| Lill-Heidi Bakkerud
Born: 1963.
Position:Employee-elected member of the board and member of the board's safety, sustainability and ethics committee.
Term of office: Member of the board of Statoil ASA from 1998 to 2002, and again since 2004. Up for election in 2015.
Independent: No
Other directorships: Bakkerud is a member of the executive committee of the Industry Energy (IE) trade union and holds a number of offices as a result of this.
Number of shares in Statoil ASA as of 31 December 2014: 330
Loans from Statoil: None
Experience: She has worked as a process technician at the petrochemical plant in Bamble and on the Gullfaks field in the North Sea. She is now a full-time employee representative as the leader of IE Statoil branch.
|
Education:Bakkerud has a craft certificate as a process/chemistry worker.
Family relations: No family relations to other members of the board, members of the corporate executive committee or the corporate assembly.
Other matters: In 2014, Lill-Heidi Bakkerud participated in eight ordinary board meetings, three extraordinary board meetings and five meetings of the safety, sustainability and ethics committee. Bakkerud is a Norwegian citizen and resident in Norway.
|

Ingrid Elisabeth di Valerio
| Ingrid Elisabeth di Valerio
Born: 1964
Position: Employee-elected member of the board and member of the board's audit committee.
Term of office: Member of board of directors of Statoil ASA from 1 July 2013. Up for election in 2015.
Independent: No
Other board directorships: Board member of First Scandinavia, Montanus AS and member of Tekna's central nomination committee.
Number of shares held in Statoil ASA as of 31 December 2014: 2,241
Loans from Statoil: None
Experience: Has been employed by Statoil since 2005. Works within materials discipline for Technology, Projects &
Drilling. Was Tekna's main representative in Statoil from 2008 to 2013. She also sat on Tekna's central committee from 2005 to 2013.
|
Education: Chartered engineer (mathematics and physics) from the Norwegian University of Science and Technology in Trondheim (NTNU).
Familial relationships: No family relationships to other board members, members of the corporate executive committee or the corporate assembly.
Other: In 2014, Ingrid di Valerio participated in eight ordinary board meetings, three extraordinary board meetings and seven meetings of the audit
committee. Ingrid Di Valerio is a Norwegian citizen and resident in Norway.
|
Jeroen van der Veer

Stig Lægreid
| Stig Lægreid
Born: 1963
Position: Employee-elected member of the board and member of the board's safety, sustainability and ethics committee.
Term of office: Member of the board of directors of Statoil ASA from 1 July 2013. Up for election in 2015.
Independent: No
Other board directorships: Member of the executive committee of The Norwegian society for Engineers and Technologists (NITO) and NITO's negotiation committee for private sector
Number of shares held in Statoil ASA as of 31 December 2014: 1,519
Loans from Statoil: None
Experience: Employed in ÅSV and Norsk Hydro since 1985. Mainly occupied as project engineer and constructor for production of primary metals until 2005 and from 2005 as weight estimator for platform design. He is now a full-time employee representative as the leader of NITO, Statoil.
|
Education: Bachelor degree, mechanical construction from OIH.
Familial relationships: No family relationships to other board members, members of the corporate executive committee or the corporate assembly.
Other: In 2014, Stig Lægreid participated in eight ordinary board meetings, three extraordinary board meetings and four meetings of the safety, sustainability and ethics committee. Stig Lægreid is a Norwegian citizen and resident in Norway.Born: 1947 Position: Shareholder-elected member of the board and chair of the board's audit committee. Term of office: Member of the board of Statoil ASA since 18 March 2016. Up for election in 2017. Independent: Yes Other directorships: Van der Veer is the chair of the supervisory boards of ING Bank NV and Royal Philips Electronics, chair of the supervisory council of Technical University of Delft and Platform Betatechniek, chair of the advisory board of the Rotterdam Climate Initiative as well as a board member in Boskalis Westminster Groep NV and Het Concertbebouw. Number of shares in Statoil ASA as of 31 December 2016: None Loans from Statoil: None Experience: Van der Veer was the Chief Executive Officer in the international oil and gas company Royal Dutch Shell Plc (Shell) in the period 2004 to 2009 when he retired. Van der Veer thereafter continued as a non-executive director on the board of Shell until 2013. He started to work for Shell in 1971 and has experience within all sectors of the business and has significant competence within corporate governance. Education: Van der Veer has a degree in Mechanical Engineering (MSc) from Delft University of Technology, Netherlands and a degree in Economics (MSc) from Erasmus University, Rotterdam, Netherlands. Since 2005 he holds an honorary doctorate from the University of Port Harcourt, Nigeria. Family relations: No family relations to other members of the board, members of the corporate executive committee or the corporate assembly. Other matters: In 2016, van der Veer participated in six ordinary board meetings, one extraordinary board meetings and three meetings of the audit committee. Van der Veer is a Dutch citizen and resident in Netherlands. In addition, there are five employee-elected deputy members of the board who attend board meetings in the event an employee-elected member of the board is unable to attend.
|
Statoil, Annual Report on Form 20-F 20142016 125105
7.6.1
Lill-Heidi Bakkerud
Born: 1963
Position: Employee-elected member of the board and member of the board's safety, sustainability and ethics committee.
Term of office: Member of the board of Statoil ASA from 1998 to 2002, and again since 2004. Up for election in 2017.
Independent: No
Other directorships: Bakkerud is a member of the executive committee of the Industry Energy (IE) trade union and holds a number of offices as a result of this.
Number of shares in Statoil ASA as of 31 December 2016: 342
Loans from Statoil: None
Experience: Bakkerud has worked as a process technician at the petrochemical plant in Bamble and on the Gullfaks field in the North Sea. She is now a full-time employee representative as the leader of the union Industri Energi’s Statoil branch.
Education:Bakkerud has a craft certificate as a process/chemistry worker.
Family relations: No family relations to other members of the board, members of the corporate executive committee or the corporate assembly.
Other matters: In 2016, Bakkerud participated in eight ordinary board meetings, two extraordinary board meetings and five meetings of the safety, sustainability and ethics committee. Bakkerud is a Norwegian citizen and resident in Norway.
Ingrid Elisabeth di Valerio
Born:1964
Position:Employee-elected member of the board and member of the board's audit committee.
Term of office:Member of board of directors of Statoil ASA from 1 July 2013. Up for election in 2017.
Independent:No
Other directorships:Board member of Tekna's central nomination committee.
Number of shares held in Statoil ASA as of 31 December 2016:3,670
Loans from Statoil: None
Experience: Di Valerio has been employed by Statoil since 2005, and works within materials discipline for Technology, Projects & Drilling. Di Valerio was the union Tekna's main representative in Statoil from 2008 to 2013. She also sat on Tekna's central committee from 2005 to 2013.
Education: Chartered engineer (mathematics and physics) from the Norwegian University of Science and Technology in Trondheim (NTNU).
Familiy relations: No family relationships to other board members, members of the corporate executive committee or the corporate assembly.
Other matters: In 2016, di Valerio participated in eight ordinary board meetings, two extraordinary board meetings and six meetings of the audit committee. Di Valerio is a Norwegian citizen and resident in Norway.
106Statoil, Annual Report on Form 20-F 2016
Stig Lægreid
Born: 1963
Position: Employee-elected member of the board and member of the board's safety, sustainability and ethics committee.
Term of office: Member of the board of directors of Statoil ASA from 1 July 2013. Up for election in 2017.
Independent: No
Other directorships: Member of The Norwegian society for Engineers and Technologists’ (NITO) negotiation committee for private sector.
Number of shares held in Statoil ASA as of 31 December 2016: 1,881
Loans from Statoil: None
Experience: Employed in ÅSV and Norsk Hydro since 1985. Mainly occupied as project engineer and constructor for production of primary metals until 2005 and from 2005 as weight estimator for platform design. He is now a full-time employee representative as the leader of the union NITO, Statoil.
Education: Bachelor degree, mechanical construction from OIH.
Family relations: No family relationships to other board members, members of the corporate executive committee or the corporate assembly.
Other matters: In 2016, Lægreid participated in eight ordinary board meetings, two extraordinary board meetings and six meetings of the safety, sustainability and ethics committee. Lægreid is a Norwegian citizen and resident in Norway.
The most recent changes to the composition of the board of directors were the election of Jeroen van der Veer as a new shareholder-elected board member effective as of 18 March 2016, as well as the resignation of shareholder-elected board member Jakob Stausholm effective as of 30 September 2016. Van der Veer replaced Stausholm as chair of the board’s audit committee as per 26 October 2016.
The work of the board of directors
The board is responsible for managing the Statoil group and for monitoring day-to-day management and the group's business activities. This means that the board is responsible for establishing control systems and for ensuring that Statoil operates in compliance with laws and regulations, with our values as stated in The Statoil Book, the Code of Conduct, as well as in accordance with the owners' expectations of good corporate governance. The board emphasises the safeguarding of the interests of all shareholders, but also the interests of Statoil's other stakeholders.
The board handles matters of major importance, or of an extraordinary nature, and may in addition require the management to refer any matter to it. An important task for the board is to appoint the chief executive officer (CEO) and stipulate his/her job instructions and terms and conditions of employment.
The board has adopted a generic annual plan for its work which is revised with regular intervals. Recurrent items on the board's annual plan are: security, safety and sustainability, corporate strategy, business plans, quarterly and annual results, annual reporting, ethics, management's monthly performance reporting, management compensation issues, CEO and top management leadership assessment and succession planning, project status review, people and organisation strategy and priorities, an annual enterprise risk management review, two yearly discussions of main risks and risk issues and an annual review of the board's governing documentation. In the beginning of each board meeting, the CEO meets separately with the board to discuss key matters in the company. At the end of all board meetings, the board has a closed session with only board members attending the discussions and evaluating the meeting.
The work of the board is based on rules of procedure that describe the board's responsibilities, duties and administrative procedures, and determines which cases are to be handled by the board. The rules of procedure also determines the handling of matters in which individual board members or a closely related party have a major personal or financial interest. The rules of procedure further describe the duties of the CEO and his/her duties vis-à-vis the board of directors. The board's rules of procedure are available on our website at www.statoil.com/board. In addition to the board of directors, the CEO, the CFO, the COO, the senior vice president for communication, the general counsel and the company secretary attend all board meetings. Other members of the executive committee and senior management attend board meetings by invitation in connection with specific matters.
Statoil, Annual Report on Form 20-F 2016107
New members of the board are offered an induction program where meetings with key members of the management are arranged, an introduction to Statoil’s business is given and relevant information about the company and the board’s work is made available through the company’s web based board portal.
The board carries out an annual board evaluation, with input from various sources and as a main rule with external facilitation. The evaluation report is discussed in a board meeting and is made available to the nomination committee as input to the committee’s work.
The entire board, or part of it, regularly visits several Statoil locations in Norway and globally, and a longer board trip for all board members to an international location is made at least on a biennial basis. When visiting Statoil locations globally, the board emphasises the importance of improving its insight into, and knowledge about, safety and security in Statoil’s operations, Statoil's technical and commercial activities as well as the company's local organisations. In 2016, whole or parts of the board visited Statoil’s operations in Brazil, Tanzania, Russia and the United States.
Statoil's board has established three sub-committees: the audit committee; the compensation and executive development committee; and the safety, sustainability and ethics committee. The committees prepare items for consideration by the board and their authority is limited to making such recommendations. The committees consist entirely of board members and are answerable to the board alone for the performance of their duties. Minutes of the committee meetings are sent to the whole board, and the chair of each committee regularly informs the board at board meetings about the committee's work. The composition and work of the committees are further described below.
Audit committee
The board of directors elects at least three of its members to serve on the board of directors' audit committee and appoints one of them to act as chair. The employee-elected members of the board of directors may nominate one audit committee member.
At year-end 2014,2016, the audit committee members were Jakob StausholmJeroen van der Veer (chair), James Mulva, Øystein LøsethRoy Franklin, Rebekka Glasser Herlofsen and Ingrid di Valerio (employee-elected board member). Jakob Stausholm chaired the audit committee from September 2009 and until his resignation as board member 30 September 2016.
The audit committee is a sub-committee of the board of directors, and its objective is to act as a preparatory body in connection with the board's supervisory roles with respect to financial reporting and the effectiveness of the company's internal control system. It also attends to other tasks assigned to it in accordance with the instructions for the audit committee adopted by the board of directors. The audit committee is instructed to assist the board of directors in its supervising of matters such as:
· Approving the internal audit plan on behalf of the board of directors
·Monitoring the financial reporting process, including oil and gas reserves, fraudulent issues and reviewing the implementation of accounting principles and policies.policies
· Monitoring the effectiveness of the company's internal control, internal audit and risk management systems.systems
· Maintaining continuous contact with the statutoryexternal auditor regarding the annual and consolidated accounts.accounts
· Reviewing and monitoring the independence of the company's internal auditor and the independence of the statutoryexternal auditor, reference is made to the Norwegian Auditors Act chapter 4, and, in particular, whether services other than audits provided by the statutoryexternal auditor or the audit firm are a threat to the statutoryexternal auditor's independence.independence
The audit committee supervises implementation of and compliance with the group's Ethics Code of Conduct in relation to financial reporting.
The internal audit function reports directly to the board of directorsdirectors’ audit committee and to the chief executive officer.
Under Norwegian law, the external auditor is appointed by the shareholders at the annual general meeting based on a proposal from the corporate assembly. The audit committee issues a statement to the annual general meeting relating to the proposal.
The audit committee meets at least five times a year and it meets separatelyboth the board and the board’s audit committee hold meetings with the internal auditor and the external auditor on a regular basis.basis without the company’s management being present.
The audit committee is also charged with reviewing the scope of the audit and the nature of any non-audit services provided by external auditors. The external auditors report directly to the audit committee on a regular basis.
The audit committee is tasked with ensuring that the company has procedures in place for receiving and dealing with complaints received by the company regarding accounting, internal control or auditing matters, and procedures for the confidential and anonymous submission, via the group's ethics helpline, by company employees of concerns regarding accounting or auditing matters, as well as other matters regarded as being in breach of the group's Ethics Code of Conduct, a material violation of an applicable US federal or state securities law, a material breach of fiduciary duties or a similar material violation of any other US or Norwegian statutory provisions.provision. The audit committee is designated as the company's qualified legal compliance committee for the purposes of section 307Part 205 in Title 17 of the Sarbanes-Oxley ActU.S. Code of 2002.Federal Regulations.
108Statoil, Annual Report on Form 20-F 2016
In the execution of its tasks, the audit committee may examine all activities and circumstances relating to the operations of the company. In this regard, the audit committee may request the chief executive officer or any other employee to grant it access to information, facilities and personnel and such assistance as it requests. The audit committee is authorised to carry out or instigate such investigations as it deems necessary in order to carry out its tasks and it may use the company's internal audit or investigation unit, the external auditor or other external advice and assistance. The costs of such work will be covered by the company.
The audit committee is only responsible to the board of directors for the execution of its tasks. The work of the audit committee in no way alters the responsibility of the board of directors and its individual members, and the board of directors retains full responsibility for the audit committee's tasks.
The audit committee held sevensix meetings in 2014.2016. There was 96.55 %96% attendance at the committee's meetings.
The board of directors has decided that a member of the audit committee, Jakob Stausholm,Jeroen van der Veer, qualifies as an "audit committee financial expert", as defined in
Item 16A of Form 20-F. The board of directors has also concluded that Jakob Stausholm, James MulvaJeroen van der Veer, Roy Franklin and Øystein LøsethRebekka Glasser Herlofsen are independent within the meaning of Rule 10A-3 under the Securities Exchange Act.
The committee's mandate is available at Statoil.com/www.statoil.com/auditcommittee.
126Statoil, Annual Report on Form 20-F 2014
7.6.2 Compensation and executive development committee
The compensation and executive development committee is a sub-committee of the board of directors that assists the board in matters relating to management compensation and leadership development.
The main responsibilities of the compensation and executive development committee is a sub-committee of the board of directors and its main responsibilities are:
(1) as a preparatory body for the board, to make recommendations to the board in all matters relating to principles and the framework for executive rewards, remuneration strategies and concepts, the CEO's contract and terms of employment, and leadership development, assessments and succession planning;
(2) to be informed about and advise the company's management in its work on Statoil's remuneration strategy for senior executive and in drawing up appropriate remuneration policies for senior executives; and
(3) to review Statoil's remuneration policies in order to safeguard the owners' long-term interests.
The committee consists of up to four board members. At year-end 2014,2016, the committee members were Grace Reksten SkaugenØystein Løseth (chair), Svein Rennemo, Bjørn Tore Godal, Maria Johanna Oudeman and Marjan Oudeman.Wenche Agerup. All of the committee members are independent, non-executive directors. All members, except for Wenche Agerup, are independent.
The committee held sevenfive meetings in 20142016 and attendance was 100 %.95%.
For a more detailed description of the objective and duties of the compensation and executive development committee, please see the Instructionsinstructions for the compensation committee available at Statoil.com/www.statoil.com/compensationcommittee.
7.6.3 Safety, sustainability and ethics committee
The safety, sustainability and ethics committee is a sub-committee of the board of directors that assists the board in matters relating to safety, sustainability and ethics.
Statoil's board of directors has established a sub-committee dedicated to the areas of safety, sustainability and ethics. The safety, sustainability and ethics committee (the committee) is chaired by Catherine HughesRoy Franklin and the other members are Bjørn Tore Godal, Wenche Agerup, Stig Lægreid (employee-elected board member) and Lill-Heidi Bakkerud (employee-elected board member).
In its business activities, Statoil is committed to comply with applicable laws and regulations and to act in an ethical, environmental, safe and socially responsible manner. The committee has been established to support our commitment in this regard, and it assists the board of directors in its supervision of the company's safety, sustainability and ethics policies, systems and principles with the exception of aspects related to “financial matters”.
Establishing and maintaining a committee dedicated to safety, sustainability and ethics is intended to ensure that the board of directors has a strong focus on and knowledge of these complex, important and constantly evolving areas. The committee acts as a preparatory body for the board of directors and, among other things, monitors and assesses the effectiveness, development and implementation of policies, systems and principles in the areas of safety, sustainability and ethics, with the exception of aspects related to “financial matters”.
The committee held fivesix meetings in 2014,2016, and attendance was 90 %.83%.
Statoil, Annual Report on Form 20-F 2016109
For a more detailed description of the objective, duties and composition of the committee, please see the instructions for the committee available atStatoil.com/hseethicscommitteewww.statoil.com/ssecommittee.
Statoil, Annual Report on Form 20-F 2014127
7.7 Compliance with NYSE listing rules3.6 Management
Statoil's primary listing is on the Oslo stock exchange (Oslo Børs), but the company is also registered as a foreign private issuer with the US Securities and Exchange Commission.
American Depositary Shares represent the company's ordinary shares listed on the New York Stock Exchange (NYSE). While Statoil's corporate governance practices follow the requirements of Norwegian law, Statoil is also subject to the NYSE's listing rules.
As a foreign private issuer, Statoil is exempted from most of the NYSE corporate governance standards that domestic US companies must comply with. However, Statoil is required to disclose any significant ways in which its corporate governance practices differ from those applicable to domestic US companies under the NYSE rules. A statement of differences is set out below:
Corporate governance guidelines
The NYSE rules require domestic US companies to adopt and disclose corporate governance guidelines. Statoil's corporate governance principles are developed by the management and the board of directors. Oversight of the board of directors and management is exercised by the corporate assembly.
Director independence
The NYSE rules require domestic US companies to have a majority of "independent directors". The NYSE definition of an "independent director" sets out five specific tests of independence and also requires an affirmative determination by the board of directors that the director has no material relationship with the company.
Pursuant to Norwegian company law, Statoil's board of directors consists of members elected by shareholders and employees. Statoil's board of directors has determined that, in its judgment, all of the shareholder-elected directors are independent. In making its determinations of independence, the board focuses on there not being any conflicts of interest between shareholders, the board of directors and the company's management, but it does not explicitly take into consideration the NYSE's five specific tests. The directors elected from among Statoil's employees would not be considered independent under the NYSE rules because they are employees of Statoil. None of the employee-elected directors is an executive officer of the company.
Board committees
Pursuant to Norwegian company law, managing the company is the responsibility of the board of directors. Statoil has an audit committee, a safety, sustainability and ethics committee and a compensation and executive development committee. They are responsible for preparing certain matters for the board of directors. The audit committee and the compensation and executive development committee operate pursuant to charters that are broadly comparable to the form required by the NYSE rules. They report on a regular basis to, and are subject to, continuous oversight by the board of directors.
Statoil complies with the NYSE rule regarding the obligation to have an audit committee that meets the requirements of Rule 10A-3 of the US Securities Exchange Act of 1934.
As required by Norwegian company legislation, the members of Statoil's audit committee include an employee-elected director. Statoil relies on the exemption provided for in Rule 10A-3(b)(1)(iv)(C) from the independence requirements of the US Securities Exchange Act of 1934 with respect to the employee-elected director. Statoil does not believe that its reliance on this exemption will materially adversely affect the ability of the audit committee to act independently or to satisfy the other requirements of Rule 10A-3 relating to audit committees. The other members of the audit committee meet the independence requirements under Rule 10A-3.
Among other things, the audit committee evaluates the qualifications and independence of the company's external auditor.However, in accordance with Norwegian law, the auditor is elected by the annual general meeting of the company's shareholders.
Statoil does not have a nominating/corporate governance sub-committee formed from its board of directors. Instead, the roles prescribed for a nominating/corporate governance committee under the NYSE rules are principally carried out by the corporate assembly and the nomination committee which is elected by the general meeting of shareholders. NYSE rules require the compensation committee of US companies to comprise independent directors under the NYSE rules, recommend senior management remuneration and make a determination on the independence of advisors when engaging them. Statoil, as foreign private issuer, is exempt from complying with these rules and is permitted to follow its home country regulations. Statoil considers all its compensation committee members to be independent, cf. the discussion on director independence above. Statoil's compensation committee makes recommendations to the board about management remuneration, including that of the CEO's. The compensation committee assesses its own performance and has the authority to hire external advisors. The nomination committee, which is elected by the general meeting of shareholders, recommends to the corporate assembly the candidates and remuneration of the board of directors. Also, the nomination committee recommends to the general meeting of shareholders the candidates and remuneration of the corporate assembly and the nomination committee.
Shareholder approval of equity compensation plans
The NYSE rules require that, with limited exemptions, all equity compensation plans must be subject to a shareholder vote. Under Norwegian company law, although the issuance of shares and authority to buy back company shares must be approved by Statoil's annual general meeting of shareholders, the approval of equity compensation plans is normally reserved for the board of directors.
128Statoil, Annual Report on Form 20-F 2014
7.8 Management
The president and CEO has overall responsibility for day-to-day operations in Statoil and appoints the corporate executive committee (CEC). Each of the members of the CEC is head of a separate business area or staff function.
The president and CEO has overall responsibility for day-to-day operations in Statoil. The president and CEO is responsible for developing Statoil's business strategy and presenting it to the board of directors for decision, for the development and execution of the business strategy and for cultivating a performance-driven, value-basedvalues-based culture.
The president and CEO appoints the corporate executive committee. Members of the CEC have a collective duty to safeguard and promote Statoil's corporate interests and to provide the president and CEO with the best possible basis for deciding the company's direction, making decisions and executing and following up business activities. In addition, each of the CEC members is head of a separate business area or staff function.
Members of Statoil's corporate executive committee as of 31 December 2014:2016:
|
Eldar Sætre,
President and CEO
|
Eldar Sætre
Born: 1956
Position: President and chief executive officer of Statoil ASA since 15 October 2014.
External offices: Member of the board of Strømberg Gruppen AS and Trucknor AS.
Number of shares in Statoil ASA as of 31 December 2016: 47,882
Loans from Statoil: None
Experience: Sætre joined Statoil in 1980. Executive vice president and CFO from October 2003 until December 2010. Executive vice president for Marketing, Midstream and Processing (MMP) from 2011 until 2014.
Education: MA in business economics from the Norwegian School of Economics and Business Administration (NHH) in Bergen.
Family relations: No family relations to other members of the CEC, members of the board or the corporate assembly.
Other matters: Sætre is a Norwegian citizen and resident in Norway.

Eldar Sætre, President and CEO
| Eldar Sætre
Born: 1956
Position: President and chief executive officer of Statoil ASA since 15 October 2014.
External offices: Member of the board of Strømberg Gruppen AS and Trucknor AS.
Number of shares in Statoil ASA as of 31 December 2014: 29,163
Loans from Statoil: None
Experience: Joined Statoil in 1980. Executive vice president and CFO from October 2003 until December 2010. Executive vice president for Marketing, Processing and Renewables (MPR) from 2011 until 2014.
Education: MA in business economics from the Norwegian School of Economics and Business Administration (NHH) in Bergen.
Family relations:
No family relations to other members of the CEC, members of the board or the corporate assembly.
Other matters: Eldar Sætre is a Norwegian citizen and resident in Norway.Hans Jakob Hegge,
Chief financial
officer (CFO)
|
Hans Jakob Hegge
Born: 1969
Position: Executive vice president and chief financial officer (CFO) of Statoil ASA since 1 August 2015.
External offices: None
Number of shares in Statoil ASA as of 31 December 2016: 28,190
Loans from Statoil: None
Experience: Hegge has held several managerial positions in Statoil, including senior vice president (SVP) for Operations North in Development and Production Norway (DPN) (2013-2015), SVP for Operations East (2011-2013) in DPN, SVP for Operational

Torgrim Reitan, Chief financial officer110Statoil, Annual Report on Form 20-F 2016
Development in DPN (2009-2011) and SVP for Global Business Services in Chief Financial Officer area (CFO) (2005-2009). From 1995 to 2004 he held various positions in DPN, Natural Gas business area and corporate functions in Statoil. Education: Master of Science degree from the Norwegian School of Economics and Business Administration (NHH). Family relations: No family relations to other members of the CEC, members of the board or the corporate assembly.
Other matters: Hegge is a Norwegian citizen and resident in Norway.
| Torgrim Reitan
Born: 1969
Position: Executive vice president and chief financial officer (CFO) of Statoil ASA since 1 January 2011.
External offices: None
Number of shares in Statoil ASA as of 31 December 2014: 24,030
Loans from Statoil: None
Experience: Has held several managerial positions in Statoil, including senior vice president (SVP) in trading and operations in the Natural Gas business area (2009-2010), SVP in performance management and analysis (2007-2009) and SVP in performance management, tax and M&A (2005-2007). From 1995 to 2004, he held various positions in the Natural Gas business area and corporate functions in Statoil.
Education: Master of science degree from the Norwegian School of Economics and Business Administration.
Family relations: No family relations to other members of the CEC, members of the board or the corporate assembly.
Other matters: Torgrim Reitan is a Norwegian citizen and resident in Norway.
|
|
| 
Jannicke Nilsson
Chief Operating Officer (COO)
|
Jannicke Nilsson
Born: 1965
Position: Executive vice president and chief operating officer (COO) of Statoil ASA since 1 December 2016.
External offices: Member of the board of Odfjell SE
Number of shares in Statoil ASA as of 31 December 2016: 35,049
Loans from Statoil: None
Experience: Jannicke Nilsson joined Statoil in 1999 and has held a number of central management positions within upstream operations Norway, including senior vice president for Technical Excellence in Technology, Projects & Drilling, senior vice president for Operations North Sea, vice president for modifications and project portfolio Bergen and platform manager at Oseberg South. In august 2013 she was appointed programme leader for Statoil technical efficiency programme (STEP), responsible for a project portfolio targeting yearly efficiency gains of 2.5 billion USD from 2016.
Education: MSc in cybernetics and process automation and a BSc in automation from the Rogaland Regional College/University of Stavanger.
Family relations: No family relations to other members of the CEC, members of the board or the corporate assembly.
Other matters:Nilsson is a Norwegian citizen and resident in Norway.
|
Lars Christian Bacher,
Executive vice president Development and Production International (DPI)
| Lars Christian Bacher
Born: 1964
Position: Executive vice president since 1 September 2012.
External offices: None
Number of shares in Statoil ASA as of 31 December 2014: 21,422
Loans from Statoil ASA: None
Experience: Lars Christian Bacher joined Statoil in 1991 and has held a number of leading positions in Statoil, including that of platform manager on the Norne and Statfjord fields on the Norwegian continental shelf. He was in charge of the merger process involving the offshore installations of Norsk Hydro and Statoil. Bacher has also been senior vice president for Gullfaks operations and subsequently for the Tampen area. His most recent position, which he held from September 2009, was as senior vice president for Statoil's Canadian operations in Development & Production North America (DPNA).
Education: Graduate engineer in chemical engineering from the Norwegian Institute of Technology (NTH). He also holds a master's degree in finance from the Norwegian School of Economics and Business Administration (NHH).
|
Family relations: No family relations to other members of the corporate executive committee, the board of directors or
the corporate assembly.
Other matters: Lars Christian Bacher is a Norwegian citizen and resident in Norway.
|
|

William Maloney, Executive vice
president Development and Production North America.
| William Maloney
Born: 1955
Position: Executive vice president since 1 January 2011.
External offices: Corporate advisory board (AAPG) & API board member. Member of the National Petroleum Council (NPC) in the US.
Number of shares in Statoil ASA as of 31 December 2014: 43,700 (American Depository Receipts)
Loans from Statoil: None
Experience: Held the position of senior vice president for global exploration in International Operations in Statoil from 2002 to 2008. He had a sabbatical period from Statoil from January 2009 until September 2010. He held managerial positions in Shell, Davis Petroleum Corp and Texaco between 1981 and 2002.
Education: Master of science degree in geology from Syracuse University.
Family relations: No family relations to other members of the CEC, members of the board or the corporate assembly.
Other matters: William Maloney is an American citizen and resident in the United States.
|
| | |
Lars Christian Bacher
Born: 1964
Position: Executive vice president of Statoil ASA since 1 September 2012.
External offices: None
Number of shares in Statoil ASA as of 31 December 2016: 24,896
Loans from Statoil ASA: None
Experience: Bacher joined Statoil in 1991 and has held a number of leading positions in Statoil, including that of platform manager on the Norne and Statfjord fields on the Norwegian continental shelf. He was in charge of the merger process involving the offshore installations of Norsk Hydro and Statoil. Bacher has also been senior vice president for Gullfaks operations and subsequently for the Tampen area. His most recent position, which he held from September 2009, was as senior vice president for Statoil's Canadian operations in Development & Production International (DPI).
Education: Master of science in chemical engineering from the Norwegian Institute of Technology (NTH). He also holds a business degree in Finance from the Norwegian School of Economics and Business Administration (NHH).
Family relations: No family relations to other members of the corporate executive committee, the board of directors or the corporate assembly.
Statoil, Annual Report on Form 20-F 20142016 129111
Other matters: Bacher is a Norwegian citizen and resident in Norway.
| 
John Knight,
Torgrim Reitan,
Executive vice president Development and Production USA (DPUSA)
|
Torgrim Reitan
Born: 1969
Position: Executive vice president of Statoil ASA since 1 January 2011.
External offices: None
Number of shares in Statoil ASA as of 31 December 2016: 32,276
Loans from Statoil: None
Experience: From 1 January 2011 to 1 August 2015 Reitan held the position as executive vice president and chief financial officer of Statoil (CFO). He has held several managerial positions in Statoil, including senior vice president (SVP) in trading and operations in the Natural Gas business area (2009 - 2010), SVP in performance management and analysis (2007 - 2009) and SVP in performance management, tax and M&A (2005 - 2007). From 1995 to 2004, Reitan held various positions in the Natural Gas business area and corporate functions in Statoil.
Education: Master of science degree from the Norwegian School of Economics and Business Administration (Siviløkonom) (NHH).
Family relations: No family relations to other members of the CEC, members of the board or the corporate assembly.
Other matters: Reitan is a Norwegian citizen and resident in the United States.
|
John Knight,
Executive vice president
Global Strategy and Business
Development (GSB) | John Knight
Born: 1958
Position: Executive vice president since 1 January 2011.
External offices: Member of the advisory board of the Columbia University Center on Global Energy Policy in New York.
Numbers of shares in Statoil ASA as of 31 December 2014: 71,046
Loans from Statoil ASA: None
Experience: Has held several central managerial positions in International Operations in Statoil since 2002, mainly in business development. Between 1987 and 2002, he held various positions in energy investment banking. From 1977 to 1987, he qualified and worked as a barrister/lawyer, and was employed by Shell Petroleum in London during the period 1985-1987.
Education: Has first and post-graduate degrees in law from Cambridge University and the Inns of Court School of Law in London.
Family relations: No family relations to other members of the CEC, members of the board or the corporate assembly
|
John Knight
Born: 1958
Position: Executive vice president of Statoil ASA since 1 January 2011.
External offices: Member on the advisory board of the Columbia University Center on Global Energy Policy in New York, and member of the advisory board of Lloyd’s Register. Chair of ONS18 Conference Committee in Stavanger, Norway.
Numbers of shares in Statoil ASA as of 31 December 2016: 103,808
Loans from Statoil ASA: None
Experience: Knight held several central managerial positions in International Operations in Statoil since 2002, mainly in business development. Between 1987 and 2002, Knight held various positions in energy investment banking. From 1977 to 1987, he qualified and worked as a barrister/lawyer, and was employed by Shell Petroleum in London during the period 1985-1987.
Education: Knight has first and post-graduate degrees in law from Cambridge University and the Inns of Court School of Law in London.
Family relations: No family relations to other members of the CEC, members of the board or the corporate assembly.
Other matters:.
Other matters: John Knight is a British citizen and resident in England.
| 
Tim Dodson.
Executive vice president, Exploration (EXP)
| |
112Statoil, Annual Report on Form 20-F 2016
Tim Dodson
Born: 1959
Position: Executive vice president of Statoil ASA since 1 January 2011.
External offices: None
Number of shares in Statoil ASA as of 31 December 2016: 29,418
Loans from Statoil ASA: None
Experience: Dodson has worked in Statoil since 1985 and held central management positions in the company, including the positions of senior vice president for Global Exploration, Exploration & Production Norway and the Technology arena.
Education: Bachelor’s degree of science in geology and geography from the University of Keele.
Family relations: No family relations to other members of the CEC, members of the board or the corporate assembly.
Other matters: Dodson is a British citizen and resident in Norway.
|
Born: 1959
Position: Executive vice president since 1 January 2011.
External offices: None
Number of shares in Statoil ASA as of 31 December 2014: 23,982
Loans from Statoil ASA: None
Experience: Has worked in Statoil since 1985 and held central management positions in the company, including the positions of senior vice president for global exploration, Exploration & Production Norway and the technology arena.
Education: Master of science in geology and geography from the University of Keele.
Family relations: No family relations to other members of the CEC, members of the board or the corporate assembly.
Other matters: Tim Dodson is a British citizen and resident in Norway.
|

Margareth Øvrum.
Executive vice president Technology, Projects and Drilling (TPD) |
Margareth Øvrum
Born: 1958
Position: Executive vice president of Statoil ASA since September 2004.
External offices: Member of the board of Atlas Copco AB (Sweden) (until 26 April 2017), Alfa Laval (Sweden) and FMC Corporation (US).
Number of shares in Statoil ASA as of 31 December 2016: 49,227
Loans from Statoil: None
Experience: Øvrum has worked for Statoil since 1982 and has held central management positions in the company, including the position of executive vice president for health, safety and the environment and executive vice president for Technology & Projects. Øvrum was the company's first female platform manager, on the Gullfaks field. She was senior vice president for operations for Veslefrikk and vice president of operations support for the Norwegian continental shelf.
Education: Master's degree in engineering (sivilingeniør) from the Norwegian Institute of Technology (NTH) in Trondheim, specialising in technical physics.
Family relations: No family relations to other members of the CEC, members of the board or the corporate assembly.
Other matters: Øvrum is a Norwegian citizen and resident in Norway.
| Margareth Øvrum
Born
:
1958
Position:
Arne Sigve Nylund,
Executive vice president since September 2004.
External offices: Member of the board of Atlas Copco AB.
Number of shares in Statoil ASA as of 31 December 2014: 37,284
Loans from Statoil: None
Experience: Øvrum has worked for Statoil since 1982Development and has held central management positions in the company, including the position of executive vice president for health, safety and the environment and executive vice president for Technology & Projects. She was the company's first female platform manager, on the Gullfaks field. She was senior vice
president for operations for Veslefrikk and vice president of operations support for the Norwegian continental shelf.
Education: Master's degree in engineering (sivilingeniør) from the Norwegian Institute of Technology (NTH) in Trondheim, specialising in technical physics.
Family relations: No family relations to other members of the CEC, members of the board or the corporate assembly.
Other matters: Margareth Øvrum is a Norwegian citizen and resident in Norway.production Norway (DPN)
|
Statoil, Annual Report on Form 20-F 2016113
Arne Sigve Nylund
Born: 1960
Position: Executive vice president of Statoil ASA since 1 January 2014.
External offices: Member of the board of directors of The Norwegian Oil & Gas Association (Norsk Olje & Gass).
Number of shares in Statoil ASA as of 31 December 2016: 11,312
Loans from Statoil: None
Experience: Employed by Mobil Exploration Inc. from 1983-1987. Since 1987, Nylund has held several central management positions in Statoil ASA.
Education: Mechanical engineer from Stavanger College of Engineering with further qualifications in operational technology from Rogaland Regional College/University of Stavanger (UiS). Business graduate of the Norwegian School of Business and Management (NHH).
Family relations: No family relations to other members of the CEC, members of the board or the corporate assembly.
Other matters: Nylund is a Norwegian citizen and is resident in Norway.
|
Jens Økland,
executive vice president Marketing, Midstream and Processing (MMP) |
Jens Økland
130Born: 1969
Position: Executive vice president of Statoil ASA since 1 June 2015.
External offices: None
Number of shares in Statoil ASA as of 31 December 2016: 13,937
Loans from Statoil ASA: None
Experience: Økland joined Statoil in 1994 and has mainly worked in the mid and downstream areas. Before becoming executive vice president of MMP, Økland worked as vice president of operations for the Åsgard area in Development and Production Norway. Previously Økland was senior vice president of Statoil’s natural gas portfolio and supply business in North America, marketing and developing infrastructure solutions for equity and non-equity production. Before heading up Statoil’s downstream gas division in North America, he had senior marketing and business development positions within natural gas in Europe mainly focusing on Germany, Statoil’s largest gas market.
Education: MSc in business from BI Norwegian Business School.
Family relations: No family relations to other members of the CEC, members of the board or the corporate assembly.
Other matters: Økland is a Norwegian citizen and resident in Norway.
|
Irene Rummelhoff,
executive vice president New Energy Solutions (NES) |
114 Statoil, Annual Report on Form 20-F 20142016
Irene Rummelhoff
Born: 1967
Position: Executive vice president of Statoil ASA since 1 June 2015.
External offices: Deputy chair of the board of directors of Norsk Hydro ASA.
Number of shares in Statoil ASA as of 31 December 2016: 21,556
Loans from Statoil ASA: None
Experience: Rummelhoff joined Statoil in 1991. She has held a number of management positions within international business development, exploration, and the downstream business in Statoil.
Education: Master’s degree in petroleum geosciences from the Norwegian Institute of Technology (NTH).
Family relations: No family relations to other members of the CEC, members of the board or the corporate assembly.
Other matters: Rummehoff is a Norwegian citizen and resident in Norway.
Statoil has granted loans to the Statoil-employed spouse of certain of the Executive Vice Presidents as part of its general loan arrangement for Statoil employees. Employees in salary grade 12 or higher may take out a car loan from Statoil in accordance with standardised provisions set by the company. The standard maximum car loan is limited to the cost of the car, including registration fees, but not exceeding NOK 300,000. Employees outside the collective labour area are entitled to a car loan up to NOK 575,000 (vice presidents and senior vice presidents) or NOK 475,000 (other positions). The car loan is interest-free, but the tax value, "interest advantage", must be reported as salary. Permanent employees in Statoil ASA may also apply for a consumer loan up to NOK 300.000. The interest rate on consumer loans is corresponding to the standard rate in effect at any time for “reasonable loans” from employer as decided by the Norwegian Ministry of Finance, i.e. the lowest rate an employer may offer without triggering taxation of the advantage for the employee.
Statoil, Annual Report on Form 20-F 2016115
3.7 Compensation to governing bodies
Remuneration to the board of directors
The remuneration of the board and its sub-committees is decided by the corporate assembly, based on a recommendation from the nomination committee. The members have an annual, fixed remuneration, except for deputy members (only elected for employee-elected board members) who receive remuneration per meeting attended. Separate rates are set for the board's chair, deputy chair and other members, respectively. Separate rates are also adopted for the board's sub-committees, with similar differentiation between the chair and the other members of each committee. The employee-elected members of the board receive the same remuneration as the shareholder-elected members.
The board receives its remuneration by cash payment. Board members from outside Scandinavia and outside Europe, respectively, receive separate travel allowances for each meeting attended. The remuneration is not linked to the board members' performance, option programmes or similar. None of the shareholder-elected board members have a pension scheme or agreement concerning pay after termination of their office with the company. If shareholder-elected members of the board and/or companies they are associated with should take on specific assignments for Statoil in addition to their board membership, this will be disclosed to the full board.
In 2016, the total remuneration to the board, including fees for the board's three sub-committees, was NOK 6,524,119 (USD 776,803).
Detailed information about the individual remuneration to the members of the board of directors in 2016 is provided in the table below.
116Statoil, Annual Report on Form 20-F 2016
Members of the board (figures in USD thousand except number of shares) | Total remuneration | Share ownership as of 31 December 2016 |
| | |
Øystein Løseth (chair of the board) | 104 | 1,040 |
Roy Franklin (deputy chair of the board) | 114 | - |
Jakob Stausholm1) | 52 | n.a. |
Wenche Agerup | 65 | 2,522 |
Bjørn Tore Godal | 65 | - |
Rebekka Glasser Herlofsen | 61 | - |
Maria Johanna Oudeman | 81 | - |
Jeroen van der Veer2) | 61 | - |
Lill-Heidi Bakkerud | 55 | 342 |
Stig Lægreid | 55 | 1,881 |
Ingrid Elisabeth di Valerio | 61 | 3,670 |
| | |
Total | 777 | 9,455 |
| | |
1) Member until 30 September 2016 (resigned). | | |
2) Member from 18 March 2016. | | |
| | |
| | |
Remuneration to the corporate assembly
The remuneration of the corporate assembly is decided by the general meeting, based on a recommendation from the nomination committee. The members have an annual, fixed remuneration, except for deputy members who receive remuneration per meeting attended. Separate rates are set for the corporate assembly’s chair, deputy chair and other members, respectively. The employee-elected members of the corporate assembly receive the same remuneration as the shareholder-elected members. The corporate assembly receives its remuneration by cash payment.
In 2016, the total remuneration to the corporate assembly was NOK 1,065,682 (USD 126,875).
Remuneration to the corporate executive committee
In 2016, the aggregate remuneration to the corporate executive committee was NOK 71,414,699 (USD 8,503,083) (rounded figure). The board of directors’ complete declaration on remuneration of executive personnel follows below.
Statoil, Annual Report on Form 20-F 2016117
Tor Martin Anfinnsen, Acting executive vice president Marketing, Processing and renewable energy
| Tor Martin Anfinnsen
Born: 1960
Position: Acting executive vice president since 16 October 2014.
External offices: None.
Number of shares in Statoil ASA as of 31 December 2014: 8,747
Loans from Statoil ASA: None
Experience: Various positions in Mobil Exploration and Forenede Finans. Joined Statoil in 1991. He has subsequently held several central management positions in the downstream operations of Statoil ASA.
Education: Master of science degree from the Heriot Watt University, Edinburgh.
Family relations: No family relations to other members of the CEC, members of the board or the corporate assembly.
Other matters: Tor Martin Anfinnsen is a Norwegian citizen and resident in Norway.
|

Arne Sigve Nylund, Executive vice president Development and production Norway
| Arne Sigve Nylund
Born: 1960
Position: Executive vice president since 1 January 2014.
External offices:Member of the board of directors of The Norwegian Oil & Gas Association (Norsk Olje & Gass).
Number of shares in Statoil ASA as of 31 December 2014: 6,859
Loans from Statoil: None
Experience: Employed by Mobil Exploration Inc. from 1983-1987. Since 1987 he has held several central management positions in Statoil ASA.
Education: Mechanical engineer from Stavanger College of Engineering with further qualifications in operational technology from Rogaland Regional College/University of Stavanger (UiS). Business graduate of the Norwegian School of Business and Management (NHH).
Family relations:No family relations to other members of the CEC, members of the board or the corporate assembly.
Other matters: Arne Sigve Nylund is a Norwegian citizen and is resident in Norway.
|
Statoil, Annual Report on Form 20-F 2014131
7.9 Compensation paid to governing bodies
This section describes the compensation paid to the board of directors, the corporate executive committee and the corporate assembly.
In 2014, aggregate compensation totalling NOK 1,022,623 was paid to the members of the corporate assembly, NOK 5,843,000 to the members of the board of directors and NOK 68,487,000 to the members of the corporate executive committee (all in rounded figures).
Detailed information about the individual compensation paid to the members of the board of directors and members of the corporate executive committee in 2014 is provided in the tables below.
Board of directors remuneration in 2014 | | | | | |
Members of the board (in NOK thousand) | Board remuneration | Audit committee | Compensation committee | HSEE committee | Total remuneration |
| | | | | |
Svein Rennemo | 709 | - | 82 | - | 790 |
Grace Reksten Skaugen | 452 | - | 123 | - | 575 |
Jakob Stausholm | 361 | 200 | - | - | 562 |
Bjørn Tore Godal | 361 | - | 82 | 123 | 566 |
Lill Heidi Bakkerud | 361 | - | - | 82 | 443 |
Maria Johanna Oudeman | 466 | 96 | 46 | - | 609 |
Catherine Hughes | 545 | 96 | - | 21 | 662 |
James Mulva | 482 | 33 | - | 61 | 576 |
Stig Lægreid | 361 | - | - | 82 | 443 |
Øystein Løseth* | 93 | 33 | - | - | 126 |
Ingrid Elisabeth di Valerio | 361 | 130 | - | - | 491 |
| | | | | |
Total | 4,553 | 589 | 333 | 368 | 5,843 |
| | | | | |
* Member from 1 October 2014 | | | | | |
132Statoil, Annual Report on Form 20-F 2014
Management remuneration in 2014 (in NOK thousand) 1) |
| Fixed remuneration | | | | | | |
Members of corporate executive committee | Fixed pay 3) | LTI 4), 6) | Annual variable pay 7) | Taxable benefits in kind | Taxable compensation | Non-taxable benefits in kind | Estimated pension cost 8) | Estimated present value of pension obligation 4), 9), 10) |
| | | | | | | | |
Lund Helge 4), 5), 9) | 5,640 | 2,165 | 0 | 249 | 8,054 | 199 | 6,008 | 73,944 |
Reitan Torgrim 9) | 3,283 | 761 | 1,066 | 126 | 5,237 | 0 | 879 | 16,339 |
Bacher Lars Christian 9) | 3,256 | 739 | 1,034 | 363 | 5,393 | 428 | 685 | 15,879 |
Dodson Timothy | 3,496 | 803 | 1,124 | 175 | 5,597 | 313 | 1,343 | 32,689 |
Øvrum Margareth | 3,779 | 867 | 1,457 | 250 | 6,352 | 98 | 1,349 | 48,701 |
Nylund Arne Sigve 5) | 2,984 | 725 | 1,421 | 108 | 5,239 | 0 | 773 | 26,646 |
Sætre Eldar - CEO 5) | 1,370 | 0 | 689 | 35 | 2,094 | 0 | 989 | 46,769 |
Sætre Eldar - MPR | 2,685 | 858 | 901 | 143 | 4,588 | 0 | 0 | 0 |
Anfinnsen Tor Martin 5) | 817 | 0 | 239 | 90 | 1,147 | 0 | 234 | 22,196 |
Maloney William 2), 8) | 4,333 | 2,167 | 2,167 | 960 | 9,627 | 166 | 713 | 0 |
Knight John 2), 3) | 7,132 | 2,845 | 2,845 | 1,133 | 13,955 | 0 | 0 | 0 |
Helge Lund has received salary and benefits that amounts to NOK 1.8 million in 2014 after his resignation as chief executive officer.
1)All figures in the table for 2014 and 2013 are presented on accrual basis, in compliance with the statement presented by The Financial Supervisory Authority of Norway in December 2014. This is a change in reporting of the remuneration figures from previous years.
2)William Maloney and John Knight's remuneration is in local currency US Dollar and British Pound, respectively. The figures in the table are presented in NOK, using average currency rates in 2014. The change in currency rates during the year, such as strengthening of USD and GBP versus NOK, impacts the development from 2013 to 2014.
3)Fixed pay consist of base salary, holiday allowance and any other administrative benefits. The figures are presented on accrual basis. John Knight's fixed pay also includes a cash supplement that replaces his defined contribution pension plan in 2014.
4)Helge Lund resigned from his position as CEO of Statoil 15 October 2014. The pension liability listed in the table above represents the estimated present value of his pension obligation as of 31 December 2014. The increase to the Estimated present value of pension obligation is mainly due to changes in actuarial assumptions. In line with the company’s LTI policy, resignation during the lock-in period is regarded as a non-fulfilment of the LTI obligations. Following his resignation Helge Lund is obliged to pay back to Statoil a total of NOK 5.1 million, calculated based on the value of the locked shares acquired under the LTI program.
5) Following Helge Lund’s resignation, Eldar Sætre resumed role as acting CEO with immediate effect on 15 October 2014, and Tor Martin Anfinnsen replaced Eldar Sætre as acting executive vice president for MPR. Arne Sigve Nylund replaced Øystein Michelsen from January 2014.
6)The fixed long-term incentive (LTI) element implies an obligation to invest the net amount in Statoil shares. A lock-in period of 3 years applies for the investment. The LTI element is presented the year it is granted for the members of the corporate executive committee employed by Statoil ASA. Members of the corporate executive committee employed by non-Norwegian subsidiaries have an LTI scheme deviating from the model used in the parent company. A net amount equivalent to the annual variable pay is used for purchasing Statoil shares, and the figures are presented on accrual basis.
7)Annual variable pay includes holiday allowance, and is presented on accrual basis.
8) Estimated pension cost is calculated based on actuarial assumptions and pensionable salary (mainly base salary) at 31 December 2013 and is recognised as pension cost in the Statement of income for 2014. Payroll tax is not included. William Maloney is employed by a non-Norwegian entity and his pension cost reflects the payment under the entity's defined contribution plan made in 2014.
9)Torgrim Reitan and Lars Christian Bacher will be transferred to a defined contribution plan from 1 April 2015, and the Estimated present value of pension obligation per 31 December 2014 reflects this change. Estimated present value of pension obligation related to Helge Lund, Torgrim Reitan and Lars Christian Bacher, are based on the estimated value of paid-up policies and rights letters to be issued in 2015, related to Helge Lund's resignation and the termination of Torgrim Reitan and Lars Christian Bacher's defined benefit pension plan. Estimated present value of pension obligation for the rest of the members of the corporate executive committee employed by Statoil ASA, are presented with a defined benefit obligation.
10)The increases in Estimated present value of pension obligation for the CEC members not mentioned in foot note 9), are due to changes to the actuarial assumptions.
Statoil, Annual Report on Form 20-F 2014133
Management remuneration in 2013 (in NOK thousand) 1) |
| Fixed remuneration | | | | | | |
Members of corporate executive committee | Fixed pay 3) | LTI 5) | Annual variable pay 6) | Taxable benefits in kind | Taxable compensation | Non-taxable benefits in kind | Estimated 4), 7) pension cost | Estimated present value of pension obligation 4) |
| | | | | | | | |
Lund Helge 4) | 7,234 | 2,112 | 3,677 | 669 | 13,692 | 503 | 5,413 | 56,362 |
Reitan Torgrim | 3,012 | 689 | 1,255 | 133 | 5,090 | - | 627 | 16,257 |
Sjøblom Tove Stuhr 8) | 194 | - | - | 16 | 210 | 16 | 684 | 18,870 |
Bacher Lars Christian | 3,188 | 671 | 1,015 | 366 | 5,240 | 427 | 711 | 15,425 |
Dodson Timothy | 3,321 | 750 | 1,553 | 139 | 5,763 | 318 | 972 | 24,792 |
Øvrum Margareth | 3,627 | 840 | 1,448 | 194 | 6,110 | 108 | 1,103 | 43,166 |
Michelsen Øystein | 3,419 | 838 | - | 334 | 4,591 | 191 | 834 | 35,993 |
Sætre Eldar | 3,422 | 838 | 1,195 | 367 | 5,823 | - | 1,003 | 42,360 |
Maloney William 2) | 4,101 | 2,352 | 2,352 | 786 | 9,590 | 159 | 627 | - |
Knight John 2) | 5,170 | 3,065 | 3,065 | 753 | 12,053 | - | 1,034 | - |
1)All figures in the table for 2014 and 2013 are presented on accrual basis, in compliance with the statement presented by The Financial Supervisory Authority of Norway in December 2014. This is a change in reporting of the remuneration figures from previous years, and the figures may differ from previous reporting.
2)William Maloney and John Knight's remuneration is based in local currency US Dollar and British Pound, respectively. The figures in the table are presented in NOK value, using average currency rates in 2013.
3)Fixed pay consists of base salary, holiday allowance and any other administrative benefits. The figures are presented on accrual basis and differ from previous reporting.
4)The Estimated pension cost and Estimated present value of pension obligation related to Helge Lund have been adjusted compared to previous year’s estimates, based on an updated accounting assessment related to the profile of his existing pension plan.
5)The fixed long-term incentive (LTI) element implies an obligation to invest the net amount in Statoil shares. A lock-in period of 3 years applies for the investment. The LTI element is presented the year it is granted for the members of the Corporate Executive Committee employed by Statoil ASA. Members of the Corporate Executive Committee employed by non-Norwegian subsidiaries have an LTI scheme deviating from the model used in the parent company. A net amount equivalent to the annual variable pay is used for purchasing Statoil shares, and the figures are presented on accrual basis and differ from previous reporting.
6)The figures related to Annual variable pay for 2013 are presented on accrual basis including holiday allowance and differ from previous reporting.
7)Estimated Pension cost is calculated based on actuarial assumptions and pensionable salary (mainly base salary) at 31 December 2012 and is recognised as pension cost in the Statement of income for 2013. Payroll tax is not included. Members of the corporate executive committee employed by non-Norwegian subsidiaries have a defined contribution plan.
8)Tove Stuhr Sjøblom left Statoil's corporate executive committee 1 February 2013
Statement on remuneration and other employment terms for Statoil's Corporate Executive Committee
Pursuant to the Norwegian Public Limited Liability Companies Act, section 6-16 a, the board will present the following statement regarding remuneration of Statoil’s Corporate Executive Committee to the 2015 Annual General Meeting.
1. Remuneration policy and concept for the accounting year 2015
1.1 Policy and principles
In general the company’s established remuneration principles and concepts will be continued in the accounting year 2015. As described in section 1.2 the general pension scheme in the parent company has been changed. The changes will be implemented in 2015.
The remuneration concept is an integrated part of our values based performance framework. It has been designed to:
·reflect our global competitive market strategy and local market conditions
·strengthen the common interests of employees in the Statoil group and its shareholders
·be in accordance with statutory regulations and good corporate governance
·be fair, transparent and non-discriminatory
·reward and recognise delivery and behaviour equally
·differentiate on the basis of responsibilities and performance
·reward both short- and long-term contributions and results
134Statoil, Annual Report on Form 20-F 2014
1.2 The remuneration concept for the corporate executive committee
Statoil's remuneration concept for the corporate executive committee consists of the following main elements:
·Fixed remuneration (base salary and long-term incentive LTI)
·Variable pay
·Benefits (primarily pension, insurance and share savings plan)
Fixed remuneration consists of base salary and an LTI programme. Statoil will continue the established LTI system in the form of fixed compensation with an obligation to invest in Statoil shares for a limited number of senior executives and key professional positions. The purpose of the LTI scheme is alignment with shareholder interests and retention. Members of the corporate executive committee are included in the scheme.
The only variable pay element for parent company executives is the annual variable pay scheme which has a maximum potential of 50% of the fixed remuneration. The company's performance based variable pay concept will be continued in 2015.
The main benefit programmes applicable to senior executives are the general pension scheme, the insurance scheme and the employee share savings plan. Statoil has decided to implement a defined contribution scheme as the new general pension scheme. With the exception of employees who are 15 years or less from regular retirement age or who have the defined benefit scheme included in their individual agreements, all employees will be transferred to the new scheme. The employees exempted from transfer will retain the defined benefit scheme.
Deviations from the general principles outlined below pertaining to two members of the corporate executive committee, implemented with effect as of 1 January 2011, are described in section 3.1 below. These deviations have also been described in previous Statements on remuneration and other employment terms for Statoil’s corporate executive committee.
Statoil, Annual Report on Form 20-F 2014135
The mainMain elements of Statoil's executive remuneration are described in more detail in the table below.
Main Elements - Statoil Executive Remunerationexecutive remuneration
|
Remuneration Elementelement | Objective | Award level | Performance criteria |
Base Salarysalary | Attract and retain the right high-performing individuals providing competitive but not market-leading terms. | We offer base salary levels which are aligned with and differentiated according to the individual's responsibility and performance at aperformance. The level which is competitive in the markets in which we operate. | The evaluation of performance is based on the fulfilment of pre-defined goals; see “Annual Variable Pay" below. The base salary is normally subject to annual review based on an evaluation of the individual’s performance.; see “Annual Variable Pay" below |
Long-Term IncentiveCash compensation
| The cash compensation is applied as a supplementing fixed remuneration element to be competitive in the market. | Reference is made to the remuneration table. Four of the executive vice presidents receive a cash compensation in lieu of pension accrual with reference to the section on pension and insurance scheme. | No performance criteria are linked to the cash compensation. The cash compensation is not included in the pensionable income. |
Annual variable pay | Encourage a strong performance culture. Reward individuals for annual achievement of business objectives and goals relating to ‘how’ results are delivered. | Members of the corporate executive committee are entitled to annual variable pay ranging from 0 – 50% of their fixed remuneration. Target1 value is 25%. The threshold principles and the company modifier are applied. | Achievement of annual performance goals (how and what to deliver), in order to create long-term and sustainable shareholder value. Assessment of goals defined on the individual’s performance contract including objectives related to selected KPI’s on the balanced scorecard constitute the basis for annual variable pay. |
Long-term incentive (LTI) | Strengthen the align- mentalignment of top manage- mentmanagement and shareholder interests and retentionshareholder’s long term interests. Retention of key employees.executives. | The LTI system is a fixed, monetary compensation calculated as a portion of the participant’s base salary; ranging from 20 – 30 per cent depending on the individual’s position.salary. On behalf of the participant, the company acquires shares equivalent to the net annual grant amount. The grant isshares are subject to a three yearthree-year lock-in period and then released for the participant’s disposal. Deviations applicableThe level of the annual LTI reward is in the range of 25-30%. The threshold principles are applied for executive vice presidents employed outside the parentannual grant The company are described in section 3.1 below.performance modifier is not applied for the LTI.in Statoil ASA | In Statoil ASA, LTI is a fixed remuneration element. Participation in the long-term incentive (LTI) schemeparticipation and the size of the annual LTI elementgrant level are reflective of the level and impact of the position and not directly linked to the incumbent’s performance. |
Annual Variable PayThreshold
| DriveFinancial threshold for payment of variable remuneration and reward individualsaward of LTI grant.
| The threshold is based on Statoil group’s full-year adjusted earnings after tax 2, requiring that a minimum level of earnings must be achieved for annual achievementany payments to be made. This minimum level is USD 2 billion. Earnings between USD 2 and 3.3 will result in bonus payments reduced by 50%. Above USD 3.3 billion the threshold is fully achieved and variable pay payments are not affected. | Adjusted earnings after tax. Application of busi- ness objectivesthe threshold is subject to a discretionary assessment of the company’s overall performance. |
Company performance modifier | Strengthen the alignment between variable remuneration and behaviour goals.the company’s performance. | The chief executive officer is entitled to an annual variable paycompany performance modifier determines the proportion of the bonus that will be paid, ranging from 0 – 50 % of his fixed remuneration. Target value50% to 150% The company performance modifier is 25%.subject to approval by the annual general meeting. Correspondingly, the executive vice presidents have an annual variable pay scheme with a pay-out in the range of 0 – 40%. Target value is 20%.
Deviations applicable for executive vice presidents employed outside the parent company are described in section 3.1 below. The deviations will also apply in 2015.
| AchievementCompany performance is assessed against two equally weighted measures: relative total shareholder return (TSR) and relative return on average capital employed (RoACE).
Application of annual performance goals (delivery and behaviour), in orderthe modifier is subject to create long-term and sustainable shareholder value. A balanced scorecard covering goals related to our five strategic objectives (People and organisation, Health, safety and environment, Operations, Market and Finance) are measured and assessed along with individual behaviour goals.discretionary assessment based on the company’s overall performance. Developments to the performance management system in Statoil will be implemented for the chief executive officer and executive vice presidents in 2015. Further details in section 2.1 below. |
Pension & Insurance Schemesinsurance schemes | Provide competitive postemployment and other benefits. | The newcompany offers a general occupational pension plan is a defined contribution scheme with a contribution level of 7% /22% below/above 7.1 G. The defined benefit scheme will be retained by a grandfathered group of employees. The benefit scheme has a pension level amounting to 66 percent of the pensionable salary conditional on a minimum of 30 years of service. Pension from the nationaland insurance scheme is taken into account when estimating the pension. In order to draw a fullaligned with local markets c.f. section on pension from Statoil’s defined benefitand insurance scheme the employment with the company needs to be maintained until the pensionable age. | N/A |
Employee Share Savings Planshare savings plan | Align and strengthen employee and share- holdershareholder’s interests and remunerate for long term commitment and value creation. | OfferThe share savings plan is offered to all employees in the group, provided no restrictions due to local legislation or business requirements. Participants are offered to purchase Statoil shares in the market limited to 5% of annual base salary.
| If shares are kept for two calendar years of continued employment, the participants will be allocated bonus shares proportionate to their purchase. |
| | | |
[1] Target value reflects fully satisfactory goal achievement
|
1.3 1 Target value reflects fully satisfactory goal achievement
2 See calculation of Adjusted earnings after tax in section 5.2 Accounting standards and non-GAAP measures
118Statoil, Annual Report on Form 20-F 2016
Pension and insurance schemes
TheMembers of the corporate executive committee in Statoil ASA are covered by the company’s general occupational pension schemes forscheme which is a defined contribution scheme with a contribution level of 7% below 7,1 G and 22% above 7,1 G3. A defined benefit scheme is retained by a grandfathered group of employees. For new members of the corporate executive committee includingappointed after 13February 2015, a cap on pension contribution at 12 G is applied. In lieu of pension accrual above 12 G a cash compensation is provided.
Members of the corporate executive committee appointed before 13 February 2015, will maintain their pension contribution above 12 G based on obligations in previously established agreements.
The chief executive officer constitute supplementaryand three executive vice presidents have individual agreements toearly retirement pension agreement with the company’s general pension plans.company.
The chief executive officer and one of the executive vice presidents have individual pension terms according to a previous standard arrangement implemented in October 2006. Subject to specific terms those executives are entitled to a pension amounting to 66 per cent of pensionable salary and a retirement age of 62. When calculating the number of years of membership in Statoil’s general pension plan, these agreements grant the right to an extra contribution time corresponding to half a year of extra membership for each year the individual has served as executive vice president.
In addition, two members of the corporate executive committee have individually agreed retirement age of 65 and an early retirement pension level amounting to 66 %66% of pensionable salary.
The individual pension terms for executive vice presidents outlined above are results of commitments according to previous established agreements.
136Statoil Annual Reporthas implemented a general cap on Form 20-F 2014
Following a board decision 7 February 2012,pensionable income at 12 G for all new hires into the company’s standard pension arrangements for executive vice presidents deviating from Statoil ASA’s general pension plan have been discontinued and have not been applied for new appointments to the corporate executive committee.
Pension accruals for pensionable salary above 12 times the national insurance basic amount (G) are recognisedcompany employed as an unfunded defined benefit pension plan, i.e. not funded in a separate legal entity.of 1 September 2017.
In addition to the pension benefits outlined above, the executive vice presidents in the parent company are offered disability and dependents’ benefits in accordance with Statoil’s general pension plan/defined benefit plan. Members of the corporate executive committee are covered by the general insurance schemes applicable within Statoil.
One of the executive vice presidents employed outside the parent company has a defined contribution scheme with 16 % in contribution in accordance with the framework established in the local employment company. The pension contribution is paid into a separate legal entity.
1.4 Severance pay arrangements
The chief executive officer and the executive vice presidents are entitled to a severance payment equivalent to six months’ salary, commencing at the time of expiry of a six months’ notice period, when the resignation is at the request from the company. The same amount of severance payment is also payable if the parties agree that the employment should be discontinued and the executive vice president gives notice pursuant to a written agreement with the company. Any other payment earned by the executive vice president during the period of severance payment will be fully deducted. This relates to earnings from any employment or business activity where the executive vice president has active ownership.
The entitlement to severance payment is conditional on the chief executive officer or the executive vice president not being guilty of gross misconduct, gross negligence, disloyalty or other material breach of his/her duties.
As a general rule, the chief executive officer’s / officer’s/executive vice president’s own notice will not instigate any severance payment.
1.5 Other benefits
Statoil has a share savings plan available to all employees including members of the corporate executive committee. The share savings plan entails an offer to purchase Statoil shares in the market limited to five per cent of annual gross salary. If the shares are kept for two full calendar years of continued employment the employees will be allocated bonus shares proportionate to their purchase. Shares to be used for sale and transfer to employees are acquired by Statoil in the market, in accordance with the authorisation from the annual general meeting.
The members of the corporate executive committee have benefits in kind such as company car and electronic communication. They are also eligible for participation in the share saving scheme as described above.
1.6 Terms and conditions for new President and Chief Executive Officer Eldar Sætre
Effective 4 February 2015 Statoil’s board of directors appointed Eldar Sætre as new President and Chief Executive Officer of Statoil, following an acting period since October 15 2014. The chief executive officer’s annual base salary compensation is NOK 5,700,000 and an additional fixed remuneration element of NOK 2,000,000. Only the base salary is included in the pensionable income. The chief executive officer will participate in an annual variable pay scheme with a target level of 25%, and participation to the Company’s 2015 LTI scheme with a value of 30% (gross) of base salary. The pension terms remain unchanged according to previously established pension agreement, as described in section 1.3 above.
2. Performance management, assessment and results essential for variable pay for 2014
Individual salary and annual variable pay reviews are based on the performance evaluation in our performance management system.
Performance is evaluated in two dimensions; business delivery“What” we deliver and behaviour. Behaviour goals“How” we deliver. “What” we deliver (business delivery) is defined through the company’s performance framework “Ambition to Action”, which addresses strategic objectives, key performance Indicators (KPIs) and actions across the five perspectives; Safety, Security and Sustainability, People and Leadership, Operations, Market and Results. Generally, Statoil believes in setting ambitious targets to inspire and drive strong performance.
Goals on “How” we deliver are based on our core values and leadership principles and address the behaviour required and expected in order to achieve our delivery goals. Business delivery is defined through the company’s performance framework “Ambition to Action”, which addresses strategic objectives, KPIs and actions across the five perspectives; People and Organisation, HSE, Operations, Market and Finance. Generally, Statoil believes in setting ambitious targets to inspire and drive strong performance.
In 2014,3 G = The basic amount of the main objectives and KPIs for each perspective were as outlined below. Each perspective was in addition supported by comprehensive plans and actions.Norwegian Social security system
Statoil, Annual Report on Form 20-F 20142016 137119
Strategic objectives
| 2014 result assessment
|
People and organisation
| The strategic objectives and actions address global capabilities.
| Statoil’s organisational efficiency programme portfolio delivered efficiency gains in 2014.
|
HSE
| The strategic objectives and actions address safety, security and sustainability.
| The positive trend for the serious incident frequency continued and is at its lowest level ever. There were no serious well incidents, whereas the number of oil and gas leakages is still too high. The Security improvement programme is being implemented according to plan. Total CO2 reduction was better than the set targets.
|
Operations
| The strategic objectives and actions address reliable and cost-efficient operations, and value-driven technology development.
| Production regularity improved significantly and production came in above target. Unit production cost remained in the targeted first quartile set against an industry peer group. Unit finding cost increased and ended above target.
|
Market
| The strategic objectives and actions address stakeholder trust, value chain optimisation and an exploration driven resource strategy.
| Exploration results were lower than in the record year 2013 and below the target. The company added 540 million barrels of oil equivalents from exploration and the organic reserve replacement ratio (RRR) was around 1. Downstream results ended well above targets.
|
Finance
| The strategic objectives address shareholder return, financial robustness and cost & capital discipline.
| Total Shareholder Return (TSR) ended in the fourth quartile, while RoACE was in the second quartile. Both KPI’s are measured against an industry peer group. The efficiency improvement programmes launched to improve performance are on track.
|
| | |
Board assessment of the CEO’s performance. In its assessment of the chief executive officer’s performance, and consequently his merit adjustment and annual variable pay for 2014, the board has put emphasis on the improvements within HSE, a solid delivery on production efficiency and progress on the improvement programmes. However, both the relative TSR and RoAce were below target in 2014 and have affected the board’s evaluation of the performance. Eldar Sætre is assessed for his performance as chief executive officer in the fourth quarter of 2014, whilst as executive vice president Marketing, Processing and Renewable energy (MPR) for the first three quarters of 2014.
|
Before final conclusions of the performance assessmentPerformance evaluation is holistic, involving both measurement and assessment. Since KPIs are drawn,indicators only, sound judgement and hindsight informationinsights are applied. Measured KPI results are reviewed against their strategic contribution, sustainability and significantSignificant changes in assumptions.assumptions are taken into account, as well as target ambition levels, sustainability of delivered results and strategic contribution.
This balanced approach, which involves a broad set of goals defined in relation to both the delivery“What” and behaviour“How” dimensions and an overall performance evaluation, is viewed to significantly reduce the likelihood that remuneration policies may stimulate excessive risk-taking or have other material adverse effects.
2.1 DevelopmentsIn the performance contracts of the chief executive officer and chief financial officer, one of several targets is related to the Performance Management model
To increasecompany’s relative total shareholder return (TSR). The amount of the focusannual variable pay is decided based on key deliveries in Statoil’s performance management system, and further strengthen the link between company results and individual reward, developments to the concept will be implemented for the Corporate Executive Committee in 2015.
The Business Delivery partan overall assessment of the performance management model will be adjusted to give a stronger emphasis on actual end results and output oriented parameters. This adjustment will have direct impact on remuneration for the executives, as achievement on these parameters will be linked directly to their variable reward. However, the principle of weighting delivery and behaviour equally (50/50) is still maintained.
3. Execution of the remuneration policy and principles in 2014
3.1 Deviations from the Statement on Executive remuneration 2014
Two members of the executive committee had variable pay schemes deviating from the description in section 1.2 above. The individuals in question are employed by Statoil Gulf Services LLC in Houston and Statoil Global Employment Company Ltd. in London. These schemes entail a framework for variable pay of 75-100% of the base salary for each of the elements (annual variable pay and LTI) is performance based. The contracts also include a provision for severance payment of 12 months’ base salary.
The board’s overall assessment is that the extended framework implemented with effect from 1 January 2011 for the variable pay schemes for these executives is in alignment with the market,various targets including but not market leading for positions at this level at the respective locations.
3.2 Changeslimited to the Corporate Executive Committeecompany's relative TSR.
Effective 1 January 2014 Arne Sigve Nylund assumed responsibilities as executive vice president for Development and Production Norway, succeeding Øystein Michelsen. Following Statoil president and chief executive officer Helge Lund’s resignation, the board appointed Eldar Sætre as acting chief executive officereffective 15 October 2014. Tor Martin Anfinnsen was appointed acting executive vice president for MPR, succeeding Eldar Sætre.
138120 Statoil, Annual Report on Form 20-F 20142016
3.3 ChangesIn 2016, the main objectives and KPIs for each perspective were as outlined below. Each perspective was in addition supported by comprehensive plans and actions.
Strategic objectives | 2016 assessment |
Safety, security and sustainability | The strategic objectives and actions address safety, security and sustainability | Serious Incident Frequency (actual) of 0.29 was above target. Target on the number of oil and gas leakages was not met. CO2 intensity for the upstream portfolio was in line with target. |
People and organisation | The strategic objectives and actions address high performing leaders and teams, and global and cost-effective capabilities | Employee engagement was above target, increasing from 2015 during a period of extensive organizational efficiency programmes. People development was in line with 2015, with strong focus on building competence and upholding learning activity throughout 2016 yielding positive results. |
Operations | The strategic objectives and actions address reliable and cost-efficient operations, and value-driven technology development | Production exceeded target, despite an extensive maintenance programme. Relative unit production cost remained the lowest among industry peers. Production efficiency was slightly below target. |
Market | The strategic objectives and actions address stakeholder trust, value chain optimisation and portfolio and project management | Capex was below target and external guiding level, due to increased efficiency and stricter prioritization. Cost efficiency for projects under development was above target, exceeding the industry average. Reserve replacement ratio was below the target of >1. Value creation from exploration was below target, mainly due to lower-than-expected discovered volumes. |
Results | The strategic objectives and actions address shareholder return, financial robustness, value creation from exploration and cost & capital discipline | Relative Shareholder Return (TSR) improved and ended 3rd in an industry peer group of 12. Relative ROACE for 2016 ended 9th in an industry peer group of 12, falling as a result of exposure to upstream margins. The cash flow improvement programme delivered above target. |
Board assessment of the chief executive officer’s performance In its assessment of the chief executive officer’s performance, and consequently his annual pay for 2016, the board has put emphasis on the solid delivery on production, efficiency, and prioritization. CAPEX was below target and guiding, and relative TSR is first quartile. The number of oil and gas leakages was above target, while CO2 intensity for the upstream portfolio was in line with target. The actual SIF was above target (0.29 versus target of 0.18). |
| + | | | | | | | | | | | |
| Fixed remuneration | | | | | | | | | | |
Members of corporate executive committee (figures in USD thousand, except no. of shares)1), 2) | Fixed pay3) | Cash allowance4) | LTI 5) | Annual variable pay6) | Taxable benefits | 2016 Taxable compensation | Non-taxable benefits in kind | Estimated pension cost7) | Estimated present value of pension obligation 8) | | 2015 Taxable compensation9) | Share ownership at 31 December 2016 |
| | | | | | | | | | | | |
Eldar Sætre13) | 937 | 0 | 138 | 245 | 37 | 1,356 | 0 | 0 | 11,261 | | 1,754 | 47,882 |
Margareth Øvrum | 453 | 0 | 53 | 106 | 18 | 631 | 20 | 0 | 6,788 | | 751 | 49,227 |
Timothy Dodson | 440 | 0 | 51 | 67 | 15 | 573 | 39 | 141 | 4,746 | | 673 | 29,418 |
Irene Rummelhoff | 349 | 54 | 37 | 61 | 10 | 511 | 0 | 26 | 1,070 | | 294 | 21,556 |
Jens Økland | 347 | 58 | 40 | 53 | 12 | 509 | 0 | 22 | 785 | | 329 | 13,937 |
Arne Sigve Nylund | 398 | 0 | 49 | 80 | 18 | 546 | 0 | 112 | 4,047 | | 690 | 11,312 |
Lars Christian Bacher | 419 | 0 | 45 | 89 | 14 | 567 | 52 | 110 | 2,039 | | 647 | 24,896 |
Hans Jakob Hegge | 372 | 62 | 43 | 71 | 13 | 561 | 0 | 23 | 1,097 | | 251 | 28,190 |
Jannicke Nilsson10) | 32 | 5 | 2 | 0 | 0 | 40 | 0 | 3 | 1,032 | | NA | 35,049 |
Anders Opedal11) | 338 | 57 | 40 | 78 | 2 | 514 | 0 | 23 | 1,030 | | 456 | 15,910 |
Torgrim Reitan12) | 611 | 0 | 49 | 87 | 137 | 884 | 0 | 115 | 1,947 | | 744 | 32,276 |
John Knight13) | 1,679 | 0 | 0 | 0 | 131 | 1,810 | 0 | 0 | 0 | | 2,089 | 103,808 |
| | | | | | | | | | | |
| | | | | | | | | | | | |
Statoil, Annual Report on Form 20-F 2016121
1)All figures in the table are presented in USD based on average currency rates (2016: USD/NOK = 8.3987, USD/GBP = 1.3538. 2015: USD/NOK = 8,0739, USD/GBP = 1,5289). The figures are presented on accrual basis.
2)All CEC members receive their remuneration in Norwegian Kroner except John Knight who receives the remuneration in GBP.
3)Fixed pay consists of base salary, fixed remuneration element, holiday allowance and other administrative benefits.
4)Cash allowance in lieu of pension accrual above 12 G (the base amount in the national insurance scheme).
5)The fixed long-term incentive (LTI) element implies an obligation to invest the individual termsnet amount in 2014
Statoil shares, including a lock-in period. The pension termsLTI element is presented the year it is granted for onethe members of the corporate executive vice presidentscommittee employed outside the parent company was changed effective 1 January 2014. In lieu of participating in the subsidiary’s at any time prevailing defined contribution pension scheme, the executive vice president will be paid a monthly cash supplement. The monthly cash supplement will be calculated on the basis of 20% of the Executive Vice President’s base salary (being the contribution the subsidiary would have made to the defined contribution pension scheme) less the at any time prevailing Employer National Insurance Contribution.by Statoil ASA.
Following president and 6)chief executive officer Helge Lund’s resignation a termination agreement was entered into. Helge Lund’s termination date was 9 February 2015. Helge Lund received base salary and benefits compensation up until this date, and did not receiveAnnual variable pay for the performance year 2014. The LTI scheme and Share Saving Plan was closed in accordance with the company policy. The company issued a paid-up policy and pension right letters for his pension accruals, in accordance with his individual pension agreement.
The individual terms for Eldar Sætre as acting in the position as President and chief executive officer of Statoil ASA (in the period from 15 October 2014 to 3 February 2015), involved an annual base salary compensation of NOK 5,700,000. Furthermore it included participation in an annual variable pay scheme with a target level of 25%, and participation to the company’s 2015 LTI scheme with a value of 30% (gross) of base salary. Other terms and conditions were unchanged.
3.4 Impact of the revised Government Guidelines of 13 February 2015 for executive remuneration
In general, the revisions to the Guidelines will further limit the company’s flexibility in offering competitive executive terms and conditions. In 2015 we will execute an assessment to address the implications of the revised guidelines with due regard to the “comply or explain” principle.
4. The decision-making process
The decision-making process for implementing or changing remuneration policies and concepts, and the determination of salaries and other remunerationincludes holiday allowance for corporate executive committee (CEC) members resident in Norway.
7)Estimated pension cost is calculated based on actuarial assumptions and pensionable salary (mainly base salary) at 31 December 2015 and is recognized as pension cost in the statement of income for 2016.
8)Estimated present value of pension obligation related to Eldar Sætre, Arne Sigve Nylund, Margareth Øvrum og Timothy Dodson are based on the estimated value of paid-up policies and rights letters from the Defined Benefit Pension Scheme. Estimated present value of pension obligation for the rest of the members of the corporate executive committee employed by Statoil ASA, is presented with value of paid-up policies and right letters from the Defined Benefit Pension Scheme and accrued pension assets from the Defined Contribution Pension Scheme.
9)Includes 2015 CEC members who are also CEC members in accordance2016.
10)Jannicke Nilsson was appointed executive vice president and chief operating officer (COO) from 1 December 2016.
11)Anders Opedal left the position as executive vice president and chief operating officer (COO) at 30 November 2016.
12)Compensation and benefit for Torgrim Reitan is according to Statoil’s international assignment terms.
13)Fixed pay for Eldar Sætre includes a fixed remuneration element of USD 238 thousand not included in pensionable salary. John Knight’s fixed pay includes a fixed remuneration element of USD 143 thousand that replaces his defined contribution pension plan and a fixed remuneration element of USD 724 thousand replacing his variable pay arrangements.
There are no loans from the company to members of the corporate executive committee.
122Statoil, Annual Report on Form 20-F 2016
Company performance modifier
Introduction
Based on approval by the annual general meeting in 2016 a company performance modifier has been introduced to be applied in calculation of variable pay. The intention is to continue with the provisionsperformance modifier in 2017. The relative total shareholder return is recommended as one of the Norwegian public limited liability companies act sectionscriteria in the modifier. Thus, the case is submitted to the annual general meeting for approval, pursuant to the provisions in the Public Limited Companies Act § 5-6 andthird paragraph last sentence ref. § 6-16 a, first paragraph third sentence number 3.
Background
Statoil has implemented annual variable pay schemes (AVP) for members of the corporate executive committee. The schemes are described in section on remuneration concept for the corporate executive committee of this declaration. Other executives, managers and employees in defined professional positions are also eligible for individual variable pay according to the board’s rules of procedure. The board’s rules of procedure are available at www.statoil.com/board.company’s guidelines.
The board of directors has appointed a designated compensation and executive development committee. The compensation and executive development committeecompany performance modifier is a preparatory body forimplemented to strengthen the board. The committee’s main objective is to assistlink between the board of directors in its work relating to the terms of employment for Statoil’s chief executive officercompany’s overall financial results and the main principles and strategy forindividual variable pay. The governmental guidelines on executive remuneration also underline that “there shall be a clear connection between the remuneration and leadership development of our senior executives. The board of directors determines the chief executive officer’svariable salary and other termsthe performance of employment.the company.”
Proposal
Based on this, the performance modifier will be continued in 2017. The company performance will be assessed against two equally weighted measures: relative total shareholder return (TSR) and relative return on average capital employed (RoACE). TSR and RoACE are currently also applied as performance indicators in the corporate performance management system.
The compensationresults of these two performance measures are compared to our peers and executive development committee answersour relative position determined. A position of Q1 means that Statoil is amongst the top scoring quartile of peer companies. A position of Q4 means Statoil is in the bottom performing quartile. In years with strong deliveries on relative TSR and RoACE, the matrix will result in the variable pay being modified with a factor higher than one and, correspondingly, lower than one in weak years. The combination of ratings for both measures, will act as a ‘multiplier’ according to the boardguideline in the matrix displayed below.
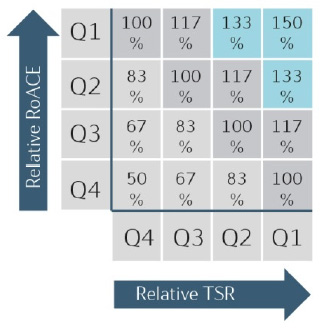
By applying relative numbers, the effect of Statoil ASA forfluctuating oil price will be reduced. Within the performanceframework of its duties. The work50 - 150%, the matrix is a guideline and the multiplier (percentages) may be adjusted if oil or gas price effects or other occurrences outside the control of the committeecompany are deemed to cause disproportionate results in no way alters the responsibilities of the board of directors or the individual board members.a given year.
For further details aboutSubject to approval by the roles and responsibilities2017 general meeting, the company performance modifier will be continued in calculations of annual variable pay for members of the compensationcorporate executive committee in the earning year 2017 with subsequent impact on annual variable pay in 2018. The modifier will also be applied in other variable pay schemes below the corporate executive level. Further application of the company performance modifier will also be assessed and executive development committee, please refer to the committee's instructions available at www.statoil.com/compensationcommittee.decided if deemed appropriate.
A complete statementThe annual variable pay for members of the corporate executive committee will be within a framework of 50% of the fixed remuneration irrespective of the result of the modifier. Any deviations from this framework for members of the corporate executive committee will be explained in the board’s annual declaration on remuneration and other employment terms for Statoil'sStatoil’s corporate executive committee is also available at Statoil.comcommittee.
Statoil, Annual Report on Form 20-F 20142016 139123
7.103.8 Share ownership
This section describes the number of Statoil shares owned by the members of the board of directors, the corporate assembly and the corporate executive committee.
The number of Statoil shares owned by the members of the board of directors and the executive committee and/or owned by their close associates is shown below. Individually, each member of the board of directors and the corporate executive committee owned less than 1% of the outstanding Statoil shares.
124Statoil, Annual Report on Form 20-F 2016
| | As of 31 December | As of 12 March | | As of 31 December | As of 8 March |
Ownership of Statoil shares (including share ownership of «close associates») | Ownership of Statoil shares (including share ownership of «close associates») | 2014 | 2015 | Ownership of Statoil shares (including share ownership of «close associates») | 2016 | 2017 |
| | | | | |
Members of the corporate executive committee | Members of the corporate executive committee | | | Members of the corporate executive committee | |
Eldar Sætre | Eldar Sætre | 29,163 | 29,986 | Eldar Sætre | 47,882 | 48,629 |
Hans Jakob Hegge | | Hans Jakob Hegge | 28,190 | 29,111 |
Jannicke Nilsson | | Jannicke Nilsson | 35,049 | 35,972 |
Lars Christian Bacher | | Lars Christian Bacher | 24,896 | 20,895 |
Torgrim Reitan | Torgrim Reitan | 24,030 | 24,836 | Torgrim Reitan | 32,276 | 33,133 |
John Knight | | John Knight | 103,808 | 105,593 |
Tim Dodson | | Tim Dodson | 29,418 | 30,349 |
Margareth Øvrum | Margareth Øvrum | 37,284 | 38,435 | Margareth Øvrum | 49,227 | 50,499 |
Lars Christian Bacher | 21,422 | 22,417 | |
Tim Dodson | 23,982 | 24,873 | |
William Maloney | 43,700.13* | 44,880.02* | |
John Knight | 71,046 | 72,639 | |
Arne Sigve Nylund | Arne Sigve Nylund | 6,859 | 6,859 | Arne Sigve Nylund | 11,312 |
Tor Martin Anfinnsen** | 8,747 | 9,448 | |
Jens Økland | | Jens Økland | 13,937 | 14,462 |
Irene Rummelhoff | | Irene Rummelhoff | 21,556 | 22,082 |
| | | | | |
Members of the board of directors | Members of the board of directors | | | Members of the board of directors | |
Svein Rennemo | 10,000 | 10,000 | |
Grace Reksten Skaugen | 400 | 400 | |
Øystein Løseth | | Øystein Løseth | 1,040 |
Roy Franklin | | Roy Franklin | 0 |
Bjørn Tore Godal | Bjørn Tore Godal | 0 | 0 | Bjørn Tore Godal | 0 |
Jakob Stausholm | 50,000 | 50,000 | |
Jeroen van der Veer | | Jeroen van der Veer | 0 |
Maria Johanna Oudeman | Maria Johanna Oudeman | 0 | 0 | Maria Johanna Oudeman | 0 |
James Mulva | 0 | 0 | |
Catherine Hughes | 3850* | 8 850* | |
Øystein Løseth*** | 0 | 0 | |
Rebekka Glasser Herlofsen | | Rebekka Glasser Herlofsen | 0 |
Wenche Agerup | | Wenche Agerup | 2,522 |
Lill-Heidi Bakkerud | Lill-Heidi Bakkerud | 330 | 330 | Lill-Heidi Bakkerud | 342 |
Ingrid Elisabeth di Valerio | Ingrid Elisabeth di Valerio | 2,241 | 2,495 | Ingrid Elisabeth di Valerio | 3,670 | 3,949 |
Stig Lægreid | Stig Lægreid | 1,519 | 1,519 | Stig Lægreid | 1,881 |
| | | | | |
* | American Depository Receipts (ADR). | | | |
** | Tor Martin Anfinnsen has been member of the Corporate Excecutive comittee since 16 October 2014. | | | |
*** | Øystein Løseth has been board member since 1 October 2014. | | | |
Individually, each member of the corporate assembly owned less than 1% of the outstanding Statoil shares as of 31 December 20142016 and as of 128 March 2015.2017. In aggregate, members of the corporate assembly owned a total of 15,35724,578 shares as of 31 December 20142016 and a total of 15,87525,331 shares as of 128 March 2015.2017. Information about the individual share ownership of the members of the corporate assembly is presented in the section 3.8 Corporate governance - Corporate assembly.assembly, board of directors and management.
The voting rights of members of the board of directors, the corporate executive committee and the corporate assembly do not differ from those of ordinary shareholders.
7.11 Independent3.9 External auditor
This section provides details about the independent auditor, the remuneration of the auditor and policies and procedures relating to the auditor.
Our independentexternal registered public accounting firm (independent(external auditor) is independent in relation to Statoil and is elected by the general meeting of shareholders. The independentexternal auditor's fee must be approved by the general meeting of shareholders.
Pursuant to the instructions for the board's audit committee approved by the board of directors, the audit committee is responsible for ensuring that the company is subject to an independent and effective external and internal audit.
140Statoil, Annual Report on Form 20-F 2014
Every year, the independentexternal auditor presents a plan to the audit committee for the execution of the independentexternal auditor's work.
The independentexternal auditor attends the meeting of the board of directors that deals with the preparation of the annual accounts.
The independentexternal auditor also participates in meetings of the audit committee. The audit committee considers all reports from the external auditor before they are considered by the board of directors. The audit committee meets at least five times a year and both the board and the board’s audit committee hold meetings with the internal auditor and the external auditor on a regular basis without the company’s management being present.
When evaluating the independentexternal auditor, emphasis is placed on the firm's qualifications, capacity, local and international availability and the size of the fee.
The audit committee evaluates and makes a recommendation to the board of directors, the corporate assembly and the general meeting of shareholders regarding the choice of independentexternal auditor. The committee is responsible for ensuring that the independentexternal auditor
Statoil, Annual Report on Form 20-F 2016125
meets the requirements in Norway and in the countries where Statoil is listed. The independentexternal auditor is subject to the provisions of US securities legislation, which stipulates that a responsible partner may not lead the engagement for more than five consecutive years.
The audit committee considers all reports from the independent auditor before they are considered by the board of directors. The audit committee holds regular meetings with the independent auditor without the company's management being present.
The audit committee's policies and procedures for pre-approval
In its instructions for the audit committee, the board of directors has delegated authority to the audit committee to pre-approve assignments to be performed by the independentexternal auditor. Within this pre-approval, the audit committee has issued further guidelines. The audit committee has issued guidelines for the management's pre-approval of assignments to be performed by the independentexternal auditor.
All audit-related and other services provided by the independentexternal auditor must be pre-approved by the audit committee. Provided that the types of services proposed are permissible under SEC guidelines, pre-approval is usually granted at a regular audit committee meeting. The chair of the audit committee has been authorised to pre-approve services that are in accordance with policies established by the audit committee that specify in detail the types of services that qualify. It is a condition that any services pre-approved in this manner are presented to the full audit committee at its next meeting. Some pre-approvals can therefore be granted by the chair of the audit committee if an urgent reply is deemed necessary.
Remuneration of the independentexternal auditor in 2014 – 2016
In the annual consolidatedConsolidated financial statements and in the parent company's financial statements, the independent auditor's remuneration is split between the audit fee and the fee for audit-related and other services. The chair presents the breakdown between the audit fee and the fee for audit-related and other services to the annual general meeting of shareholders.
The following table sets out the aggregate fees related to professional services rendered by Statoil's principal accountant KPMG AS, for the fiscal year 2014, 20132016, 2015 and 2012 (from 15 May), and Ernst & Young for the fiscal year 2012 (until 15 May 2012.)2014.
126Statoil, Annual Report on Form 20-F 2016
Auditor's remuneration | For the year ended 31 December |
(in NOK million, excluding VAT) | 2014 | 2013 | 2012 |
| | | |
Audit fees KPMG (principal accountant as from 15 May 2012) | 45 | 38 | 22 |
Audit fees Ernst & Young | 0 | 0 | 22 |
Audit-related fees (KPMG) | 8 | 8 | 9 |
Tax fees (KPMG) | 0 | 0 | 2 |
Other service fee (KPMG) | 0 | 0 | 2 |
| | | |
Total | 53 | 46 | 57 |
Auditor's remuneration |
| Full year |
(in USD million, excluding VAT) | 2016 | 2015 | 2014 |
| | | |
Audit fee | 6.5 | 6.1 | 7.1 |
Audit related fee | 1.0 | 1.7 | 1.3 |
Tax fee | 0.1 | 0.0 | 0.0 |
Other service fee | 0.0 | 0.0 | 0.0 |
| | | |
Total | 7.5 | 7.9 | 8.4 |
| | | |
All fees included in the table werehave been approved by the board's audit committee.
Audit fee is defined as the fee for standard audit work that must be performed every year in order to issue an opinion on Statoil's consolidatedConsolidated financial statements, on Statoil's internal control over annual reporting and to issue reports on the statutory financial statements. It also includes other audit services, which are services that only the independent auditor can reasonably provide, such as the auditing of non-recurring transactions and the application of new accounting policies, audits of significant and newly implemented system controls and limited reviews of quarterly financial results.
Audit-related fees include other assurance and related services provided by auditors, but not limited to those that can only reasonably be provided by the external auditor who signs the audit report, that are reasonably related to the performance of the audit or review of the company's financial statements, such as acquisition due diligence, audits of pension and benefit plans, consultations concerning financial accounting and reporting standards.
Other services fees include services provided by the auditors within the framework of the Sarbanes-Oxley Act, i.e. certain agreed procedures.
In addition to the figures in the table above, the audit fees and audit-related fees relating to Statoil lated fees relating to Statoil-141127141127141127141127141127141127141127141127141127141127141127141127141127141127141127141127141127141127141127141127141127141127141127141127141127141127141127141127141127141127141127141127141127141127141127141127141127141127141127141127141127141127141127141127141127141127141127141127141127141127141127141127141127141127141127141127141127141127141127141127141127141127141127141127141127141127141127141127141127141127141127141127141127141127141127141127141127141127141127141127141127141127141127141127141127141127141127141127141127141127141127141127141127141127141127141127operated licences paid to KPMG and Ernst & Young (until 15 May 2012) for the years 2014, 20132016, 2015 and 20122014 amounted to NOK 6USD 0.8 million, NOK 6USD 0.9 million and NOK 7USD 1.0 million, respectively.
Statoil, Annual Report on Form 20-F 2014141
7.123.10 Controls and procedures
This section describes controls and procedures relating to our financial reporting.
Evaluation of disclosure controls and procedures
The management, with the participation of our chief executive officer and chief financial officer, has evaluated the effectiveness of the design and operation of our disclosure controls and procedures pursuant to Exchange Act Rule 13a-15(b) as of the end of the period covered by the Form 20-F. Based on that evaluation, the chief executive officer and chief financial officer have concluded that these disclosure controls and procedures are effective at a reasonable level of assurance.
In order to facilitate the evaluation, the disclosure committee reviews material disclosures made by Statoil for any errors, misstatements and omissions. The disclosure committee is chaired by the chief financial officer. It consists of the heads of investor relations, accounting and financial compliance, performance management and risk, tax and the general counsel and it may be supplemented by other internal and external personnel. The head of the internal audit is an observer at the committee's meetings.
In designing and evaluating our disclosure controls and procedures, our management, with the participation of the chief executive officer and chief financial officer, recognised that any controls and procedures, no matter how well designed and operated, can only provide reasonable assurance that the desired control objectives will be achieved, and that the management must necessarily exercise judgment when evaluating the cost-benefit aspects of possible controls and procedures. Because of the limitations inherent in all control systems, no evaluation of controls can provide absolute assurance that all control issues and any instances of fraud in the company have been detected.
The management's report on internal control over financial reporting
The management of Statoil ASA is responsible for establishing and maintaining adequate internal control over financial reporting. Our internal control over financial reporting is a process designed, under the supervision of the chief executive officer and chief financial officer, to provide reasonable assurance regarding the reliability of financial reporting and the preparation of Statoil's financial statements for external reporting purposes in accordance with International Financial Reporting Standards (IFRS) as adopted by the European Union (EU). The accounting policies applied by the group also comply with IFRS as issued by the International Accounting Standards Board (IASB).
Statoil, Annual Report on Form 20-F 2016127
The management has assessed the effectiveness of internal control over financial reporting based on the Internal Control - Integrated Framework (2013) issued by the Committee of Sponsoring Organizations of the Treadway Commission (COSO). Based on this assessment, the management has concluded that Statoil's internal control over financial reporting as of 31 December 20142016 was effective.
Statoil's internal control over financial reporting includes policies and procedures that pertain to the maintenance of records that, in reasonable detail, accurately and fairly reflect transactions and dispositions of assets, provide reasonable assurance that transactions are recorded in the manner necessary to permit the preparation of financial statements in accordance with IFRS, and that receipts and expenditures are only carried out in accordance with the authorisation of the management and directors of Statoil; and provide reasonable assurance regarding the prevention or timely detection of any unauthorised acquisition, use or disposition of Statoil's assets that could have a material effect on our financial statements.
Because of its inherent limitations, internal control over financial reporting may not prevent or detect all misstatements. Moreover, projections of any evaluation of the effectiveness of internal control to future periods are subject to a risk that controls may become inadequate because of changes in conditions and that the degree of compliance with the policies or procedures may deteriorate.
The effectiveness of internal control over financial reporting as of 31 December 20142016 has been audited by KPMG AS, an independent registered public accounting firm that also audits the consolidatedConsolidated financial statements included in this annual report. Their audit report on the internal control over financial reporting is included in section 8 in the consolidated4.1 Consolidated financial statements in this report.
Changes in internal control over financial reporting
During 2014, Statoil has implemented the COSO 2013 framework. The work done to support compliance included a mapping of the COSO principles and focus points to Statoil control activities and governing documentation.
No changes occurred in our internal control over financial reporting during the period covered by Form 20-F that have materially affected, or are reasonably likely to materially affect, our internal control over financial reporting.
We continuously make improvement to our internal control environment.
142128 Statoil, Annual Report on Form 20-F 20142016
84.1 Statoil Consolidated financial statements Statoil
With effect from 1 January 2016 the financial statements are presented in US dollars (USD). Comparative data has been converted from Norwegian kroner (NOK) to USD accordingly. For more information concerning this see note 26 Change of presentation currency.
CONSOLIDATED STATEMENT OF INCOME | | | | |
| | Full year | | Full year |
| | 2014 | 2013 | 2012 | |
(in NOK billion) | Note | | (restated*) | |
(in USD million) | | Note | 2016 | 2015 | 2014 |
| | | | | | |
Revenues | | 606.8 | 616.6 | 700.5 | | 45,688 | 57,900 | 96,708 |
Net income from associated companies | | (0.3) | 0.1 | 1.7 | |
Net income from equity accounted investments | | | (119) | (29) | (34) |
Other income | 4 | 16.1 | 17.8 | 16.0 | 4 | 304 | 1,770 | 2,590 |
| | | | | | |
Total revenues and other income | 3 | 622.7 | 634.5 | 718.2 | 3 | 45,873 | 59,642 | 99,264 |
| | | | | | |
Purchases [net of inventory variation] | | (301.3) | (306.9) | (362.2) | | (21,505) | (26,254) | (47,980) |
Operating expenses | | (72.9) | (74.1) | (60.8) | | (9,025) | (10,512) | (11,657) |
Selling, general and administrative expenses | | (7.3) | (7.8) | (10.0) | | (762) | (921) | (1,159) |
Depreciation, amortisation and net impairment losses | 11, 12 | (101.4) | (72.4) | (60.5) | 10, 11 | (11,550) | (16,715) | (15,925) |
Exploration expenses | 12 | (30.3) | (18.0) | (18.1) | 11 | (2,952) | (3,872) | (4,666) |
| | | | | | |
Net operating income | 3 | 109.5 | 155.5 | 206.6 | 3 | 80 | 1,366 | 17,878 |
| | | | | | |
Net financial items | 8 | (0.0) | (17.0) | 0.1 | 8 | (258) | (1,311) | 20 |
| | | | | | |
Income before tax | | 109.4 | 138.4 | 206.7 | | (178) | 55 | 17,898 |
| | | | | | |
Income tax | 9 | (87.4) | (99.2) | (137.2) | 9 | (2,724) | (5,225) | (14,011) |
| | | | | | |
Net income | | 22.0 | 39.2 | 69.5 | | (2,902) | (5,169) | 3,887 |
| | | | | | |
Attributable to equity holders of the company | | 21.9 | 39.9 | 68.9 | | (2,922) | (5,192) | 3,871 |
Attributable to non-controlling interests | | 0.1 | (0.6) | 0.6 | | 20 | 22 | 16 |
| | | | | | |
Basic earnings per share (in NOK) | 10 | 6.89 | 12.53 | 21.66 | |
Diluted earnings per share (in NOK) | 10 | 6.87 | 12.50 | 21.60 | |
Basic earnings per share (in USD) | | | (0.91) | (1.63) | 1.22 |
Diluted earnings per share (in USD) | | | (0.91) | (1.63) | 1.21 |
Weighted average number of ordinary shares outstanding (in millions) | | | 3,195 | 3,179 | 3,180 |
Weighted average number of ordinary shares outstanding, diluted (in millions) | | | 3,207 | 3,189 |
* Related to a change in significant accounting policies in 2014, see note 2 Significant accounting policies.
Statoil, Annual Report on Form 20-F 20142016 143129
CONSOLIDATED STATEMENT OF COMPREHENSIVE INCOME | CONSOLIDATED STATEMENT OF COMPREHENSIVE INCOME | CONSOLIDATED STATEMENT OF COMPREHENSIVE INCOME |
| | Full year | | Full year |
(in NOK billion) | Note | 2014 | 2013 | 2012 | |
(in USD million) | | Note | 2016 | 2015 | 2014 |
| | | | | | | |
Net income | | 22.0 | 39.2 | 69.5 | | (2,902) | (5,169) | 3,887 |
| | | | | | | |
Actuarial gains (losses) on defined benefit pension plans | 19 | (0.0) | (5.9) | 5.5 | 19 | (503) | 1,599 | 636 |
Income tax effect on income and expense recognised in OCI | | 0.9 | 1.5 | (1.5) | |
Items that will not be reclassified to statement of income | | 0.9 | (4.4) | 4.0 | |
Income tax effect on income and expenses recognised in OCI | | | 129 | (461) | (56) |
Items that will not be reclassified to the Consolidated statement of income | | | (374) | 1,138 | 580 |
| | | | | | | | |
Foreign currency translation differences | | 41.6 | 22.9 | (11.9) | |
Items that may be subsequently reclassified to statement of income | | 41.6 | 22.9 | (11.9) | |
Currency translation adjustments | | | 17 | (3,976) | (5,167) |
Items that may be subsequently reclassified to the Consolidated statement of income | | | 17 | (3,976) | (5,167) |
| | | | | | | |
Other comprehensive income | | 42.5 | 18.5 | (7.9) | | (357) | (2,838) | (4,587) |
| | | | | | | |
Total comprehensive income | | 64.5 | 57.7 | 61.6 | | (3,259) | (8,007) | (701) |
| | | | | | | |
Attributable to the equity holders of the company | | 64.4 | 58.3 | 61.0 | | (3,279) | (8,030) | (717) |
Attributable to non-controlling interests | | 0.1 | (0.6) | 0.6 | | 20 | 22 | 16 |
144130 Statoil, Annual Report on Form 20-F 20142016
CONSOLIDATED BALANCE SHEET | | | | | |
| | At 31 December | | At 31 December |
(in NOK billion) | Note | 2014 | 2013 | |
(in USD million) | | Note | 2016 | 2015 | 2014 |
| | | | | | | |
ASSETS | | | | | | | |
Property, plant and equipment | 11 | 562.1 | 487.4 | 10 | 59,556 | 62,006 | 75,619 |
Intangible assets | 12 | 85.2 | 91.5 | 11 | 9,243 | 9,452 | 11,458 |
Investments in associated companies | | 8.4 | 7.4 | |
Equity accounted investments | | 12 | 2,245 | 824 | 1,127 |
Deferred tax assets | 9 | 12.9 | 8.2 | 9 | 2,195 | 2,022 | 1,732 |
Pension assets | 19 | 8.0 | 5.3 | 19 | 839 | 1,284 | 1,072 |
Derivative financial instruments | 25 | 29.9 | 22.1 | 25 | 1,819 | 2,697 | 4,023 |
Financial investments | 13 | 19.6 | 16.4 | 13 | 2,344 | 2,336 | 2,634 |
Prepayments and financial receivables | 13 | 5.7 | 8.5 | 13 | 893 | 967 | 766 |
| | | | | | | |
Total non-current assets | | 731.7 | 646.8 | | 79,133 | 81,588 | 98,430 |
| | | | | | | |
Inventories | 14 | 23.7 | 29.6 | 14 | 3,227 | 2,502 | 3,193 |
Trade and other receivables | 15 | 83.3 | 81.8 | 15 | 7,839 | 6,671 | 11,212 |
Derivative financial instruments | 25 | 5.3 | 2.9 | 25 | 492 | 542 | 717 |
Financial investments | 13 | 59.2 | 39.2 | 13 | 8,211 | 9,817 | 7,968 |
Cash and cash equivalents | 16 | 83.1 | 85.3 | 16 | 5,090 | 8,623 | 11,182 |
| | | | | | | |
Total current assets | | 254.8 | 238.8 | | 24,859 | 28,154 | 34,272 |
| | | | | |
Assets classified as held for sale | | 4 | 537 | 0 | 0 |
| | | | | | | |
Total assets | | 986.4 | 885.6 | | 104,530 | 109,742 | 132,702 |
| | | | | | | |
EQUITY AND LIABILITIES | | | | | | | |
Shareholders’ equity | | 380.8 | 355.5 | | 35,072 | 40,271 | 51,225 |
Non-controlling interests | | 0.4 | 0.5 | | 27 | 36 | 57 |
| | | | | | | |
Total equity | 17 | 381.2 | 356.0 | 17 | 35,099 | 40,307 | 51,282 |
| | | | | | | |
Finance debt | 18, 22 | 205.1 | 165.5 | 18, 22 | 27,999 | 29,965 | 27,593 |
Deferred tax liabilities | 9 | 71.5 | 71.0 | 9 | 6,427 | 7,421 | 9,613 |
Pension liabilities | 19 | 27.9 | 22.3 | 19 | 3,380 | 2,979 | 3,752 |
Provisions | 20 | 117.2 | 101.7 | 20 | 13,406 | 12,422 | 15,766 |
Derivative financial instruments | 25 | 4.5 | 2.2 | 25 | 1,420 | 1,285 | 611 |
| | | | | | | |
Total non-current liabilities | | 426.2 | 362.7 | | 52,633 | 54,073 | 57,335 |
| | | | | | | |
Trade and other payables | 21 | 100.7 | 95.6 | |
Trade, other payables and provisions | | 21 | 9,666 | 9,333 | 13,545 |
Current tax payable | | 39.6 | 52.8 | | 2,184 | 2,740 | 5,321 |
Finance debt | 18 | 26.5 | 17.1 | 18 | 3,674 | 2,326 | 3,561 |
Dividends payable | 17 | 5.7 | 0.0 | 17 | 712 | 700 | 770 |
Derivative financial instruments | 25 | 6.6 | 1.5 | 25 | 508 | 264 | 887 |
| | | | | | | |
Total current liabilities | | 179.0 | 166.9 | | 16,744 | 15,363 | 24,085 |
| | | | | | | |
Liabilities directly associated with the assets classified as held for sale | | 4 | 54 | 0 | 0 |
| | | | | |
Total liabilities | | 605.2 | 529.6 | | 69,431 | 69,436 | 81,420 |
| | | | | | | |
Total equity and liabilities | | 986.4 | 885.6 | | 104,530 | 109,743 | 132,702 |
Statoil, Annual Report on Form 20-F 20142016 145131
CONSOLIDATED STATEMENT OF CHANGES IN EQUITY | CONSOLIDATED STATEMENT OF CHANGES IN EQUITY | CONSOLIDATED STATEMENT OF CHANGES IN EQUITY |
(in NOK billion) | Share capital | Additional paid-in capital | Retained earnings | Currency translation adjustments | Shareholders' equity | Non-controlling interests | Total equity | |
(in USD million) | | Share capital | Additional paid-in capital | Retained earnings | Currency translation adjustments | Shareholders' equity | Non-controlling interests | Total equity |
| | | | |
At 31 December 2011 | 8.0 | 40.7 | 218.5 | 11.7 | 278.9 | 6.3 | 285.2 | |
At 31 December 2013 | | 1,139 | 5,741 | 47,690 | 3,863 | 58,432 | 81 | 58,513 |
Net income for the period | | 68.9 | | 68.9 | 0.6 | 69.5 | | 3,871 | | 3,871 | 16 | 3,887 |
Other comprehensive income | | 4.0 | (11.9) | (7.9) | | (7.9) | | 580 | (5,167) | (4,587) | | (4,587) |
Dividends | | (20.7) | | (20.7) | | (20.7) | |
Other equity transactions | | (0.1) | 0.1 | | 0.0 | (6.2) | |
| | | |
At 31 December 2012 | 8.0 | 40.6 | 270.8 | (0.2) | 319.2 | 0.7 | 319.9 | |
| | | |
Net income for the period | | 39.9 | | 39.9 | (0.6) | 39.2 | |
Other comprehensive income | | (4.4) | 22.9 | 18.5 | | 18.5 | |
Dividends | | (21.5) | | (21.5) | | (21.5) | |
Other equity transactions | | (0.3) | | (0.6) | 0.4 | (0.2) | |
| | | |
At 31 December 2013 | 8.0 | 40.3 | 284.5 | 22.7 | 355.5 | 0.5 | 356.0 | |
| | | |
Net income for the period | | 21.9 | | 21.9 | 0.1 | 22.0 | |
Other comprehensive income | | 0.9 | 41.6 | 42.5 | | 42.5 | |
Total comprehensive income | | | | (701) |
Dividends | | (39.4) | | (39.4) | | (39.4) | | (6,517) | | (6,517) | | (6,517) |
Other equity transactions | | (0.1) | 0.4 | | 0.3 | (0.2) | 0.1 | | (26) | 54 | | 27 | (39) | (12) |
| | | | |
At 31 December 2014 | 8.0 | 40.2 | 268.4 | 64.3 | 380.8 | 0.4 | 381.2 | 1,139 | 5,714 | 45,677 | (1,305) | 51,225 | 57 | 51,282 |
| | | |
Net income for the period | | | (5,192) | | (5,192) | 22 | (5,169) |
Other comprehensive income | | | 1,138 | (3,976) | (2,838) | | (2,838) |
Total comprehensive income | | | | (8,007) |
Dividends | | | (2,930) | | (2,930) | | (2,930) |
Other equity transactions | | | 6 | (0) | | 6 | (43) | (38) |
| | | |
At 31 December 2015 | | 1,139 | 5,720 | 38,693 | (5,281) | 40,271 | 36 | 40,307 |
| | | |
Net income for the period | | | (2,922) | | (2,922) | 20 | (2,902) |
Other comprehensive income | | | (374) | 17 | (357) | | (357) |
Total comprehensive income | | | | (3,259) |
Dividends | | 17 | 887 | (2,824) | | (1,920) | | (1,920) |
Other equity transactions | | | 1 | 0 | | 2 | (30) | (28) |
| | | |
At 31 December 2016 | | 1,156 | 6,607 | 32,573 | (5,264)1) | 35,072 | 27 | 35,099 |
1) Balance of currency translation adjustments includes a loss of USD 321 million directly associated with assets classified as held for sale. See note 4 Acquisitions and disposals for information on transaction.
Refer to note 17 Shareholders' equity.Shareholders’ equity and dividends.
146132 Statoil, Annual Report on Form 20-F 20142016
CONSOLIDATED STATEMENT OF CASH FLOWS | | | | | | | | |
| | Full year | | Full year |
(in NOK billion) | Note | 2014 | 2013 | 2012 | |
(in USD million) | | Note | 2016 | 2015 | 2014 |
| | | | | | | | |
Income before tax | | 109.4 | 138.4 | 206.7 | | (178) | 55 | 17,898 |
| | | | | | |
Depreciation, amortisation and net impairment losses | 11, 12 | 101.4 | 72.4 | 60.5 | 10, 11 | 11,550 | 16,715 | 15,925 |
Exploration expenditures written off | | 13.7 | 3.1 | 11 | 1,800 | 2,164 | 2,097 |
(Gains) losses on foreign currency transactions and balances | | (3.1) | 4.8 | 3.3 | | (137) | 1,166 | 883 |
(Gains) losses from dispositions | 4 | (12.4) | (17.6) | (14.7) | |
(Gains) losses on sales of assets and businesses | | 4 | (110) | (1,716) | (1,998) |
(Increase) decrease in other items related to operating activities | | 3.9 | 6.6 | (14.6) | | 1,076 | 558 | (1,671) |
(Increase) decrease in net derivative financial instruments | 25 | (2.8) | 11.7 | (1.1) | 25 | 1,307 | 1,551 | 254 |
Interest received | | 2.1 | 2.1 | 2.6 | | 280 | 363 | 341 |
Interest paid | | (3.4) | (2.5) | | (548) | (443) | (551) |
| | | | | | |
Cash flows provided by operating activities before taxes paid and working capital items | | 208.8 | 218.8 | 243.3 | | 15,040 | 20,414 | 33,178 |
| | | | | | |
Taxes paid | | (96.6) | (114.2) | (119.9) | | (4,386) | (8,078) | (15,308) |
| | | | | | |
(Increase) decrease in working capital | | 14.2 | (3.3) | 4.6 | | (1,620) | 1,292 | 2,335 |
| | | | | | |
Cash flows provided by operating activities | | 126.5 | 101.3 | 128.0 | | 9,034 | 13,628 | 20,205 |
| | | | | | |
Additions through business combinations | | 4 | 0 | (398) | 0 |
Capital expenditures and investments | | (122.6) | (114.9) | (113.1) | | (12,191) | (15,518) | (19,497) |
(Increase) decrease in financial investments | | (12.7) | (23.2) | (12.1) | | 877 | (2,813) | (1,919) |
(Increase) decrease in other non-current items | | 0.8 | 0.6 | (1.2) | | 107 | (22) | 128 |
Proceeds from sale of assets and businesses | 4 | 22.6 | 27.1 | 29.8 | 4 | 761 | 4,249 | 3,514 |
| | | | | | |
Cash flows used in investing activities | | (112.0) | (110.4) | (96.6) | | (10,446) | (14,501) | (17,775) |
| | | | | | |
New finance debt | | 20.6 | 62.8 | 13.1 | 18 | 1,322 | 4,272 | 3,010 |
Repayment of finance debt | | (9.7) | (7.3) | (12.2) | | (1,072) | (1,464) | (1,537) |
Dividend paid | 17 | (33.7) | (21.5) | (20.7) | 17 | (1,876) | (2,836) | (5,499) |
Net current finance debt and other | | (0.3) | (7.3) | 1.6 | | (333) | (701) | (2) |
| | | | | | |
Cash flows provided by (used in) financing activities | | (23.1) | 26.6 | (18.2) | | (1,959) | (729) | (4,028) |
| | | | | | |
Net increase (decrease) in cash and cash equivalents | | (8.6) | 17.5 | 13.2 | | (3,371) | (1,602) | (1,598) |
| | | | | | |
Effect of exchange rate changes on cash and cash equivalents | | 5.7 | 2.9 | (1.9) | | (152) | (871) | (1,329) |
Cash and cash equivalents at the beginning of the period (net of overdraft) | 16 | 85.3 | 64.9 | 53.6 | 16 | 8,613 | 11,085 | 14,013 |
| | | | | | |
Cash and cash equivalents at the end of the period (net of overdraft) | 16 | 82.4 | 85.3 | 64.9 | 16 | 5,090 | 8,613 | 11,085 |
Cash and cash equivalents include bank overdrafts of nil at 31 December 2016 (2015: USD 10 million; 2014: USD 97 million).
Interest paid included a net bank overdraftin cash flows provided by operating activities is excluding capitalised interest of NOK 0.7 billionUSD 355 million at 31 December 2014, a net bank overdraft that wasrounded to zero2016, USD 392 million at
31 December 20132015 and NOK 0.3 billionUSD 250 million at 31 December 20122014. Capitalised interest is included in Capital expenditures and investments in cash flows used in investing activities..
Statoil, Annual Report on Form 20-F 20142016 147133
8.1 Notes to the Consolidated financial statements
1 Organisation
Statoil ASA, originally Den Norske Stats Oljeselskap AS, was founded in 1972 and is incorporated and domiciled in Norway. The address of its registered office is Forusbeen 50, N-4035 Stavanger, Norway.
Statoil ASA is listed on the Oslo Stock ExchangeBørs (Norway) and the New York Stock Exchange (USA).
The Statoil group's business consists principally of the exploration, production, transportation, refining and marketing of petroleum and petroleum-derived products and other forms of energy.
All the Statoil group's oil and gas activities and net assets on the Norwegian continental shelf are owned by Statoil Petroleum AS, a 100% owned operating subsidiary. Statoil Petroleum AS is co-obligor or guarantor of certain debt obligations of Statoil ASA.
The Consolidated financial statements of Statoil for the full year 20142016 were authorised for issue in accordance with a resolution of the board of directors on 109 March 2015.2017.
2 Significant accounting policies
Statement of compliance
The Consolidated financial statements of Statoil ASA and its subsidiaries (Statoil) have been prepared in accordance with International Financial Reporting Standards (IFRSs) as adopted by the European Union (EU) and also comply with IFRSs as issued by the International Accounting Standards Board (IASB)., effective at 31 December 2016.
Basis of preparation
The financial statements are prepared on the historical cost basis with some exceptions, as detailed in the accounting policies set out below. These policies have been applied consistently to all periods presented in these Consolidated financial statements. Certain amounts in the comparable years have been restated to conform to current year presentation. The subtotals and totals in some of the tables may not equal the sum of the amounts shown due to rounding.
Operating related expenses in the Consolidated statement of income are presented as a combination of function and nature in conformity with industry practice. practice. Purchases [net of inventory variation] and Depreciation, amortisation and net impairment losses are presented in separate lines by their nature, while Operating expenses and Selling, general and administrative expenses as well as Exploration expensesare presented on a functional basis. Significant expenses such as salaries, pensions, etc. are presented by their nature in the notes to the Consolidated financial statements.
Standards and amendments to standards, issued but not yet adopted
At the date of these Consolidated financial statements, the following standards and amendments to standards applicable to Statoil have been issued, but were not yet effective:
·IFRS 15 Revenue from Contracts with Customers, issued in May 2014 and
IFRS 15, effective from 1 January 20172018, covers the recognition of such revenue in the financial statements and related disclosure anddisclosure. IFRS 15 will replace IAS 18 Revenue.Revenue. The standard
IFRS 15 requires identification of the performance obligations for the transfer of goods and services in each contract with customers. Revenue will be recognised upon satisfaction of the performance obligations infor the amounts that reflect the consideration to which the companyStatoil expects to be entitled in exchange for those goods and services.
The standardimpact of adopting IFRS 15 will principally impact the Marketing, Midstream and Processing segment (MMP), which accounts for the majority of Statoil’s petroleum sales to customers, and which is responsible for the marketing and sale of the State’s direct financial interest’s (SDFI’s) petroleum volumes.
IFRS 15 requires adoption either on a retrospective basis or on the basis of the cumulative effect on retained earnings. Statoil is in the process of evaluating the potential impact of IFRS 15, and has not yet determined its adoption date or its implementation method for the standard.standard, but at this stage in the evaluations, does not expect either implementation method to affect the Consolidated statement of income, balance sheet or statement of cash flows materially.
·The amendment to IFRS 11 Accounting for Acquisitions of Interests in Joint Operations, issued in May 2014 and effective from 1 January 2016, establishes requirements for the accounting for acquisitions of interests in joint operations in which the activity constitutes a business. The amendment is to be applied prospectively.
Statoil will adopt IFRS 15 on 1 January 2018.
134Statoil, Annual Report on Form 20-F 2016
The most significant accounting matters with regards to the amendmentimplementation of IFRS 15 in Statoil, as well as their expected impact, can be summarised as follows.
Marketing and sale of the Norwegian State’s share of crude oil and natural gas production from the Norwegian continental shelf (NCS) and related agent/principal evaluations; in evaluating these sales, Statoil has considered whether it acts as the principal in the transactions under IFRS 15, i.e. whether it controls the State’s volumes prior to onwards sales to third party customers. Statoil’s sales of the State’s natural gas volumes are performed for the Norwegian State’s account and risk, and although Statoil has been granted the ability to direct the use of the volumes, all the benefits from the sales of these volumes flow to the State. On that basis, Statoil is not considered the principal in the sale of the SDFI’s natural gas volumes. In the sales of the State-originated crude oil, Statoil also directs the use of the volumes. However, although certain benefits from these sales subsequently flow to the State, Statoil purchases the crude oil volumes from the State and obtains substantially all the remaining benefits. Statoil therefore is considered the principal in the crude oil sales. The accounting for Statoil’s sale of the SDFI’s natural gas and crude oil under IFRS 15 will consequently not lead to material changes compared to the current practice under IAS 18, as separately described in this note disclosure.
Transport of goods sold; in certain sales of goods such as crude oil or natural gas, Statoil provides transport services after control of the good has been transferred to the customer. Following implementation of IFRS 15, in most such instances this transport will be considered a service that is completed over time and is distinct from the good sold, and therefore will be recognised separately. The impact on the effective date.Consolidated financial statements from the resulting timing differences in the reflection of revenues from contracts with customers is currently not expected to be material.
·Accounting for taxes paid in kind under the terms of profit sharing agreements (PSAs); in certain countries, taxes are paid in kind and the volumes are subsequently sold according to the terms of the PSA and applicable tax regulations. As the sale of the volumes is not performed directly by Statoil, evaluation is still ongoing as to whether the sales proceeds qualify as revenue from contracts with customers under IFRS 15. Irrespective of the conclusion reached, the in-kind tax payments and related sales of volumes will continue to be accounted for gross in the Statement of income, classified as tax expense in accordance with IAS 12 Income taxes and as a form of revenue, respectively.
IFRS 9 Financial Instruments, issued in its final form in July 2014 and
IFRS 9, effective from 1 January 2018, will replace IAS 39 Financial Instruments: Recognition and Measurement.Measurement. IFRS 9 introduces a new model for classification and measurement of financial assets and financial liabilities, a reformed approach to hedge accounting, and a more forward-looking impairment model.
IFRS 9 will principally impact Statoil’s financing and liquidity management activities, as well as the MMP segment, which reflects the majority of Statoil’s trade receivables and commodity-based financial instruments.
Portions of Statoil’s cash equivalents and current financial investments tied to liquidity management, which under IAS 39 are classified as held for trading and reflected at fair value through profit and loss, will under IFRS 9 be classified and measured at amortised cost, based on an evaluation of the contractual terms and the business model applied. The standard’sinvestment portfolio of Statoil’s captive insurance company will continue to be classified and measured at fair value through profit and loss under IFRS 9.
The impact on the Consolidated statement of income of commodity-based derivative financial instruments, which due to their connection with sales and revenue risk management currently are classified under revenues, is expected to be reflected in an appropriate section within total revenues and other income upon the implementation of IFRS 9. No decisions have yet been made related to whether, and if so, on which elements, hedge accounting will be applied.
IFRS 9’s transition provisions partlypartially require retrospective adoption, and partlypartially prospective adoption. IFRS 9 implementation issues are currently not expected to have a material impact on the Consolidated balance sheet, statement of income and statement of cash flows.
Statoil will adopt IFRS 9 on 1 January, 2018.
IFRS 16 Leases
IFRS 16, effective from 1 January 2019, covers the recognition of leases and related disclosure in the financial statements, and will replace IAS 17 Leases. In the financial statement of lessees, the new standard requires recognition of all contracts that qualify under its definition of a lease as right-of-use assets and lease liabilities in the balance sheet, while lease payments are to be reflected as interest expense and reduction of lease liabilities. The right-of-use assets are to be depreciated in accordance with IAS 16 Property, Plant and Equipment over the shorter of each contract’s term and the assets’ useful life.
The standard consequently implies a significant change in lessees’ accounting for leases currently defined as operating leases under IAS 17, both with regard to impact on the balance sheet and the statement of income. IFRS 16 defines a lease as a contract that conveys the right to control the use of an identified asset for a period of time in exchange for consideration. While this definition is not dissimilar to that of IAS 17, it would have required further evaluation of each contract to determine whether all leases included in Note 22Leases of these financial statements, or contracts currently not defined as leases, would qualify as leases under the new standard.
The standard introduces new requirements both as regards establishing the term of a lease and the related discounted cash flows that determine the amount of a lease liability to be recognised. The standard requires adoption either on a full retrospective basis, or retrospectively with the cumulative effect of initially recognising the standard as an adjustment to retained earnings at the date of initial application, and if so with a number of practical expedients in
Statoil, Annual Report on Form 20-F 2016135
transitioning existing leases at the time of initial application. Statoil is in the process of evaluating the potential impact of IFRS 9,16, and has not yet determined its adoption date forthe expected impact of the standard on the Consolidated financial statements.
Implementation of IFRS 16 will affect all Statoil’s segments.
Statoil will adopt IFRS 16 on 1 January 2019 and currently expects to apply the modified retrospective method in implementing the standard.
·
Other amendments to standards
The amendments to IFRS 10 Consolidated Financial Statements and IAS 28 Investments in Associates and Joint Venture, issued in September 2014 andVentures, effective from 1 January 2016,a future date to be determined by the IASB, establish requirements for the accounting for sales or contributions of assets between an investor and its associate or joint venture. Whether or not the assets are housed in a subsidiary, a full gain or loss will be recognised in the Consolidated statement of income when the transaction involves assets that constitute a business, whereas a partial gain or loss will be recognised when the transaction involves assets that do not constitute a business. The amendments are to be applied prospectively. Statoil will adopthas not determined an adoption date for the amendments.
The disclosure initiative amendments to IAS 7 Statement of Cash Flows, effective from 1 January 2017, establish certain additional requirements for disclosure of changes in financing liabilities. Statoil has implemented the amendments on the effective date.
148Statoil, Annual Report on Form 20-F 2014
Other standards and amendments to standards, issued but not yet effective, are either not expected to impact Statoil’s Consolidated financial statements materially, or are not expected to be relevant to Statoil's Consolidated financial statements upon adoption.
Changes in accounting policiesChange in the current period
Natural gas sales made by Statoil subsidiaries on behalf of the Norwegian Stategroup’s presentation currency
With effect from 2014,On 1 January 2016 Statoil changed its policy forpresentation currency from Norwegian kroner (NOK) to US dollars (USD), mainly in order to better reflect the presentationunderlying USD exposure of natural gas sales,Statoil’s business activities and related expenditure, on behalf of the Norwegian State made by Statoil subsidiaries in their own name. Where the subsidiary is considered the principal in the transaction, such gas sales were previously presented gross in the Consolidated statement of income, while the Norwegian State’s share of profit or loss was reflected in Statoil’s Selling, general and administrative expenses as expenses or reduction of expenses, respectively. With effect from 2014, such natural gas sales by Statoil subsidiaries on behalf of the Norwegian State, are presented net in the Consolidated statement of income. The sales are linked to and in nature no different from, Statoil ASA’s marketing and sale of natural gas in its own name, but for the Norwegian State’s account and risk, which are presented net. Followingalign with industry practice. As the change in presentation currency represents a policy the assessment of the principal in the transactions and the related presentation of sales for the account and risk of the Norwegian State are determined on a consolidated basis. The revised policy more consistently reflects the sales of natural gas for the account and risk of the Statoil group, excluding transactions on behalf of the Norwegian State, and therefore provides more relevant information.
The changeschange, comparative figures have been applied retrospectivelyre-presented in USD to reflect the change. All currency translation adjustments have been set to zero as of 1 January 2006, which was the date of Statoil’s transition to IFRS. Translation adjustments and cumulative translation adjustments have been presented as if Statoil had used USD as the presentation currency from that date. For further details and re-presented consolidated financial information for prior periods, reference is made to Note 26 Change of presentation currency in these Consolidated financial statements including the notes. The change in accounting policy is immaterial to the Consolidated statement of income for the periods covered by these Consolidated financial statements. There is no impact on Net operating income, Net income, the Consolidated balance sheet or the Consolidated statement of cash flows from this policy change.
Recognition of disputed income tax positions
With effect from 2014, Statoil changed its policy for the recognition of income tax positions for which payment has been made despite Statoil disputing the tax claim involved. While previously only amounts virtually certain of being refunded to Statoil were reflected as assets for positions involving such disputed income tax amounts, as of 2014 Statoil reflects as assets any disputed amounts that probably will be refunded. The corresponding impact in the Statement of Income is reflected as a reduction within
Income tax. Disputed income tax positions are now reflected in the Consolidated balance sheet as assets if a refund from the relevant tax authority is probable, and as liabilities if an outflow of cash from Statoil is probable. This ensures that the accounts better and more consistently reflect the underlying facts and evaluations in each case, and consequently provide more relevant information, independently of whether an income tax dispute occurs in a tax regime (such as for instance Norway) that requires up-front payment in disputed matters, or in a tax regime where disputed payments are not due until a dispute has been legally settled in Statoil’s disfavour.
The change in accounting policy is not material to the Consolidated statement of income, the Consolidated balance sheet and the Consolidated statement of cash flows for the periods covered by these Consolidated financial statements, and comparative figures have not been adjusted.
Other accounting policy changes in 2014
Other accounting policy changes in 2014 compared to the annual financial statements for 2013 have not materially impacted Statoil’s Consolidated financial statements upon adoption. Such other accounting policy changes in 2014 include implementation of the amendments to IAS 32 Financial Instruments: Presentation, issued in December 2011, and IFRIC 21 Levies, issued in May 2013.
Basis of consolidation
Subsidiaries
The Consolidated financial statements include the accounts of Statoil ASA and its subsidiaries. subsidiaries and include Statoil’s interest in jointly controlled and equity accounted investments.
Subsidiaries
Entities are determined to be controlled by Statoil, and consolidated in Statoil's financial statements, when Statoil has power over the entity, ability to use that power to affect the entity's returns, and exposure to, or rights to, variable returns from its involvement with the entity.
All intercompany balances and transactions, including unrealised profits and losses arising from Statoil's internal transactions, have been eliminated in full.
Non-controlling interests are presented separately within equity in the balance sheet.
Joint operations and similar arrangements, joint ventures and associates
AnA joint arrangement tois present where Statoil holds a long-term interest which Statoil is party is defined as jointly controlled when the sharing of control is contractually agreed,by Statoil and one or more other venturers under a contractual arrangement in which exists only when decisions about the relevant activities require the unanimous consent of the parties sharing control. Such joint arrangements are classified as either joint operations or joint ventures.
The parties to a joint operation have rights to the assets and obligations for the liabilities, relating to their respective share of the joint arrangement. In determining whether the terms of contractual arrangements and other facts and circumstances lead to a classification as joint operations, Statoil in particular considers the nature of products and markets of the arrangement and whether the substance of their agreements is that the parties involved have rights to substantially all the arrangement's assets. Statoil accounts for the assets, liabilities, revenues and expenses relating to its interests in joint operations in accordance with the principles applicable to those particular assets, liabilities, revenues and expenses. Normally this leads to accounting for the joint operation in a manner similar to the previous proportionate consolidation method.
Those of Statoil's exploration and production licence activities that are within the scope of IFRS 11 Joint Arrangementshave been classified as joint operations. A considerable number of Statoil's unincorporated joint exploration and production activities are conducted through arrangements that are not jointly controlled, either because unanimous consent is not required among all parties involved, or no single group of parties has joint control over the activity. Licence activities where control can be achieved through agreement between more than one combination of involved parties are considered to be outside the scope of IFRS 11, and these activities are accounted for on a pro-rata basis using Statoil's ownership share. In determining whether each separate arrangement related to Statoil's unincorporated joint exploration and production licence activities is within or outside the scope of IFRS 11, Statoil considers the terms of relevant licence agreements, governmental concessions and other legal arrangements impacting how and by whom each arrangement is controlled. Subsequent changes in the ownership shares and number of licence participants, transactions involving licence shares, or changes
Statoil, Annual Report on Form 20-F 2014149
in the terms of relevant agreements may lead to changes in Statoil's evaluation of control and impact a licence arrangement's classification in relation to IFRS 11 in Statoil's Consolidated financial statements. Currently there are no significant differences in Statoil's accounting for unincorporated licence arrangements whether in scope of IFRS 11 or not.
136Statoil, Annual Report on Form 20-F 2016
Joint ventures, in which Statoil has rights to the net assets, are accounted for using the equity method.
Investments in companies in which Statoil has neither control nor joint control, but has the ability to exercise significant influence over operating and financial policies, are classified as associates and are also accounted for using the equity method.
Under the equity method, the investment is carried on the balance sheet at cost plus post-acquisition changes in Statoil’s share of net assets of the entity, less distribution received and less any impairment in value of the investment. Goodwill may arise as the surplus of the cost of investment over Statoil’s share of the net fair value of the identifiable assets and liabilities of the joint venture or associate. Such goodwill is recorded within the corresponding investment.
The Consolidated statement of income reflects Statoil’s share of the results after tax of an equity-accounted entity, adjusted to account for depreciation, amortization and any impairment of the equity-accounted entity’s assets based on their fair values at the date of acquisition. Where material differences in accounting policies arise, adjustments are made to the financial statements of equity-accounted entities in order to bring the accounting policies used into line with Statoil’s. Material unrealised gains on transactions between Statoil and its equity-accounted entities are eliminated to the extent of Statoil’s interest in each equity-accounted entity. Unrealised losses are also eliminated unless the transaction provides evidence of an impairment of the asset transferred. Statoil assesses investments in equity-accounted entities for impairment whenever events or changes in circumstances indicate that the carrying value may not be recoverable.
Statoil as operator of joint operations and similar arrangements
Indirect operating expenses such as personnel expenses are accumulated in cost pools. These costs are allocated on an hours incurred basis to operating segments and Statoil operated joint operations under IFRS 11 and to similar arrangements (licences) outside the scope of IFRS 11. Costs allocated to the other partners' share of operated joint operations and similar arrangements reduce the costs in the Consolidated statement of income. Only Statoil's share of the statement of income and balance sheet items related to Statoil operated joint operations and similar arrangements are reflected in the Consolidated statement of income and the Consolidated balance sheet.
Reportable segments
Statoil identifies its operating segments on the basis of those components of Statoil that are regularly reviewed by the chief operating decision maker, Statoil's corporate executive committee (CEC). Statoil combines operating segments when these satisfy relevant aggregation criteria.
Statoil's accounting policies as described in this note also apply to the specific financial information included in reportable segments related disclosure in these Consolidated financial statements.
Foreign currency translation
In preparing the financial statements of the individual entities, transactions in foreign currencies (those other than functional currency) are translated at the foreign exchange rate at the dates of the transactions. Monetary assets and liabilities denominated in foreign currencies are translated to the functional currency at the foreign exchange rate at the balance sheet date. Foreign exchange differences arising on translation are recognised in the Consolidated statement of income as foreign exchange gains or losses within Netnet financial items.items. Foreign exchange differences arising from the translation of estimate-based provisions, however, generally are accounted for as part of the change in the underlying estimate and as such may be included within the relevant operating expense or income tax sections of the Consolidated statement of income depending on the nature of the provision. Non-monetary assets that are measured at historical cost in a foreign currency are translated using the exchange rate at the date of the transactions.
Presentation currency
For the purpose of the Consolidated financial statements, the statement of income, and the balance sheet and the cash flows of each entity are translated from the functional currency into the presentation currency, Norwegian kroner (NOK).USD. The assets and liabilities of entities whose functional currencies are other than NOK, including Statoil's parent company Statoil ASA whose functional currency is United States dollar (USD),USD, are translated into NOKUSD at the foreign exchange rate at the balance sheet date. The revenues and expenses of such entities are translated using the foreign exchange rates on the dates of the transactions. Foreign exchange differences arising on translation from functional currency to presentation currency are recognised separately in Other comprehensive income (OCI). The cumulative amount of such translation differences relating to an entity and previously recognised in OCI, is reclassified to the Consolidated statement of income and reflected as a part of the gain or loss on disposal of that entity.
Business combinations
Determining whether an acquisition meets the definition of a business combination requires judgement to be applied on a case by case basis. Acquisitions are assessed under the relevant IFRS criteria to establish whether the transaction represents a business combination or an asset purchase. Depending on the specific facts, acquisitions of exploration and evaluation licences for which a development decision has not yet been made, have largely been concluded to represent asset purchases.
Business combinations, except for transactions between entities under common control, are accounted for using the acquisition method of accounting. The acquired identifiable tangible and intangible assets, liabilities and contingent liabilities are measured at their fair values at the date of the acquisition. Acquisition costs incurred are expensed under Selling, general and administrative expenses. expenses.
Revenue recognition
Revenues associated with sale and transportation of crude oil, natural gas, petroleum products and other merchandise are recognised when risk passes to the customer, which is normally when title passes at the point of delivery of the goods, based on the contractual terms of the agreements.
Revenues from the production of oil and gas properties in which Statoil shares an interest with other companies are recognised on the basis of volumes lifted and sold to customers during the period (the sales method). Where Statoil has lifted and sold more than the ownership interest, an accrual is
recognised for the cost of the overlift. Where Statoil has lifted and sold less than the ownership interest, costs are deferred for the underlift.
Statoil, Annual Report on Form 20-F 2016137
Revenue is presented net of customs, excise taxes and royalties paid in-kind on petroleum products. Revenue is presented gross of in-kind payments of amounts representing income tax.
Sales and purchases of physical commodities, which are not settled net, are presented on a gross basis as Revenues revenues and Purchasespurchases [net of inventory variation] in the statement of income. Activities related to trading and commodity-based derivative instruments are reported on a net basis, with the margin included in Revenues. revenues.
150Statoil, Annual Report on Form 20-F 2014
Transactions with the Norwegian State
Statoil markets and sells the Norwegian State's share of oil and gas production from the Norwegian continental shelf (NCS). The Norwegian State's participation in petroleum activities is organised through the State's direct financial interest (SDFI).SDFI. All purchases and sales of the SDFI's oil production are classified as Purchasespurchases [net of inventory variation] and Revenues,revenues, respectively. Statoil sells, in its own name, but for the Norwegian State's account and risk, the State's production of natural gas. This sale,These sales and related expenditures refunded by the Norwegian State are presented net in the Consolidated financial statements.
Employee benefits
Wages, salaries, bonuses, social security contributions, paid annual leave and sick leave are accrued in the period in which the associated services are rendered by employees of Statoil.
Research and development
Statoil undertakes research and development both on a funded basis for licence holders and on an unfunded basis for projects at its own risk. Statoil's own share of the licence holders' funding and the total costs of the unfunded projects are considered for capitalisation under the applicable IFRS requirements. Subsequent to initial recognition, any capitalised development costs are reported at cost less accumulated amortisation and accumulated impairment losses.
Income tax
Income tax in the Consolidated statement of income comprises current and deferred tax expense. Income taxis recognised in the Consolidated statement of income except when it relates to items recognised in OCI.
Current tax consists of the expected tax payable on the taxable income for the year and any adjustment to tax payable for previous years. Uncertain tax positions and potential tax exposures are analysed individually, and the best estimate of the probable amount for liabilities to be paid (unpaid potential tax exposure amounts, including penalties) and for assets to be received (disputed tax positions for which payment has already been made) in each case is recognised within current tax or deferred tax as appropriate. Interest income and interest expenses relating to tax issues are estimated and recognised in the period in which they are earned or incurred, and are presented within Netnet financial itemsin the Consolidated statement of income. Uplift benefit on the NCS is recognised when the deduction is included in the current year tax return and impacts taxes payable.
Deferred tax assets and liabilities are recognised for the future tax consequences attributable to differences between the carrying amounts of existing assets and liabilities and their respective tax bases, subject to the initial recognition exemption. The amount of deferred tax is based on the expected manner of realisation or settlement of the carrying amount of assets and liabilities, using tax rates enacted or substantiallysubstantively enacted at the balance sheet date. A deferred tax asset is recognised only to the extent that it is probable that future taxable income will be available against which the asset can be utilised. In order for a deferred tax asset to be recognised based on future taxable income, convincing evidence is required, taking into account the existence of contracts, production of oil or gas in the near future based on volumes of proved reserves, observable prices in active markets, expected volatility of trading profits, expected currency rate movements and similar facts and circumstances.
A petroleum tax, currently levied at a rate of 51%, is levied on profits derived from petroleum production and pipeline transportation on the NCS. The petroleum tax is applied to relevant income in addition to the standard 27% income tax, resulting in a 78% marginal tax rate on income subject to Norwegian petroleum tax. The basis for computing the petroleum tax is the same as for income subject to ordinary corporate income tax, except that onshore losses are not deductible against the petroleum tax, and a tax-free allowance (uplift) is computed on the basis of the original capitalised cost of offshore production installations at a rate of 5.5% per year. The uplift may be deducted from taxable income for a period of four years, starting in the year in which the capital expenditures are incurred. The uplift benefit is recognised when the deduction is included in the current year tax return and impacts taxes payable. Unused uplift may be carried forward indefinitely.
Oil and gas exploration, evaluation and development expenditures
Statoil uses the successful efforts method of accounting for oil and gas exploration costs. Expenditures to acquire mineral interests in oil and gas properties and to drill and equip exploratory wells are capitalised as exploration and evaluation expenditures within Intangibleintangible assetsuntil the well is complete and the results have been evaluated.evaluated, or there is any other indicator of a potential impairment. Exploration wells that discover potentially economic quantities of oil and natural gas remain capitalised as intangible assets during the evaluation phase of the find. This evaluation is normally finalised within one year after well completion. If, following the evaluation, the exploratory well has not found proved reserves,potentially commercial quantities of hydrocarbons, the previously capitalised
costs are evaluated for derecognition or tested for impairment. Geological and geophysical costs and other exploration and evaluation expenditures are expensed as incurred.
Capitalised exploration and evaluation expenditures, including expenditures to acquire mineral interests in oil and gas properties, related to offshore wells that find proved reserves are transferred from exploration expenditures and acquisition costs - oil and gas prospects (Intangible assets)(intangible assets) to Property,property, plant and equipmentat the time of sanctioning of the development project. For onshore wells where no sanction is required, the transfer of acquisition cost – oil and gas prospects (Intangible assets)(intangible assets) to Property,property, plant and equipment occur occurs at the time when a well is ready for production.
For exploration and evaluation asset acquisitions (farm-in arrangements) in which Statoil has made arrangements to fund a portion of the selling partner's (farmor's) exploration and/or future development expenditures (carried interests), these expenditures are reflected in the Consolidated financial statements as and when the exploration and development work progresses. Statoil reflects exploration and evaluation asset dispositions (farm-out arrangements), when the farmee correspondingly undertakes to fund carried interests as part of the consideration, on a historical cost basis with no gain or loss recognition.
A gain or loss related to a post-tax based disposition of assets on the NCS includes the release of tax liabilities previously computed and recognised related to the assets in question. The resulting gross gain or loss is recognised in full in Otherother incomein the Consolidated statement of income.
138Statoil, Annual Report on Form 20-F 2016
Consideration from the sale of an undeveloped part of an onshore asset reduces the carrying amount of the asset. The part of the consideration that exceeds the carrying amount of the asset, if any, is reflected in the Consolidated statement of income under other income.
Exchanges (swaps) of exploration and evaluation assets are accounted for at the carrying amounts of the assets given up with no gain or loss recognition.
Property, plant and equipment
Property, plant and equipment is reflected at cost, less accumulated depreciation and accumulated impairment losses. The initial cost of an asset comprises its purchase price or construction cost, any costs directly attributable to bringing the asset into operation, the initial estimate of an asset retirement
Statoil, Annual Report on Form 20-F 2014151
obligation, if any, exploration costs transferred from intangible assets and, for qualifying assets, borrowing costs. Property, plant and equipment include assets acquiredcosts relating to expenditures incurred under the terms of profit sharing agreements (PSAs)PSAs in certain countries, and which qualify for recognition as assets of Statoil. State-owned entities in the respective countries, however, normally hold the legal title to such PSA-based property, plant and equipment.
Exchanges of assets are measured at the fair value of the asset given up, unless the fair value of neither the asset received nor the asset given up is reliably measurable.measurable with sufficient reliability.
Expenditure on major maintenance refits or repairs comprises the cost of replacement assets or parts of assets, inspection costs and overhaul costs. Where an asset or part of an asset is replaced and it is probable that future economic benefits associated with the item will flow to Statoil, the expenditure is capitalised. Inspection and overhaul costs, associated with regularly scheduled major maintenance programs planned and carried out at recurring intervals exceeding one year, are capitalised and amortised over the period to the next scheduled inspection and overhaul. All other maintenance costs are expensed as incurred.
Capitalised exploration and evaluation expenditures, development expenditure on the construction, installation or completion of infrastructure facilities such as platforms, pipelines and the drilling of developmentproduction wells, and field-dedicated transport systems for oil and gas are capitalised as producing oil and gas properties within Property,property, plant and equipment. Such capitalised costs, when designed for significantly larger volumes than the reserves from already developed and producing wells, are depreciated using the unit of production method based on proved developed reserves expected to be recovered from the area during the concession or contract period. CapitalisedDepreciation of production wells uses the unit of production method based on proved developed reserves, and capitalised acquisition costs of proved properties are depreciated using the unit of production method based on total proved reserves. In the rare circumstances where the use of proved reserves fails to provide an appropriate basis reflecting the pattern in which the asset’s future economic benefits are expected to be consumed, a more appropriate reserve estimate is used. Depreciation of other assets and transport systems used by several fields is calculated on the basis of their estimated useful lives, normally using the straight-line method. Each part of an item of property, plant and equipment with a cost that is significant in relation to the total cost of the item is depreciated separately. For exploration and production assets, Statoil has established separate depreciation categories which as a minimum distinguish between platforms, pipelines and wells.
The estimated useful lives of property, plant and equipment are reviewed on an annual basis, and changes in useful lives are accounted for prospectively. An item of property, plant and equipment is derecognised upon disposal or when no future economic benefits are expected to arise from the continued use of the asset. Any gain or loss arising on derecognition of the asset (calculated as the difference between the net disposal proceeds and the carrying amount of the item) is included in Otherother income or Operatingoperating expenses,, respectively, in the period the item is derecognised.
Assets classified as held for sale
Non-current assets are classified separately as held for sale in the balance sheet when their carrying amount will be recovered through a sale transaction
rather than through continuing use. This condition is met only when the sale is highly probable, the asset is available for immediate sale in its present
condition, and management is committed to the sale, which should be expected to qualify for recognition as a completed sale within one year from the date
of classification. Liabilities directly associated with the assets classified as held for sale, and expected to be included as part of the sale transaction, are
correspondingly also classified separately. Once classified as held for sale, property, plant and equipment and intangible assets are not subject to
depreciation or amortisation. The net assets and liabilities of a disposal group classified as held for sale are measured at the lower of their carrying amount
and fair value less costs to sell.
Leases
Leases for which Statoil assumes substantially all the risks and rewards of ownership are reflected as finance leases. When an asset leased by a joint operation or similar arrangement to which Statoil is a party qualifies as a finance lease, Statoil reflects its proportionate share of the leased asset and
related obligations. Finance leases are classified in the Consolidated balance sheet within Property,property, plant and equipment and Finance debt.finance debt. All other leases are classified as operating leases, and the costs are charged to the relevant operating expense related caption on a straight line basis over the lease term, unless another basis is more representative of the benefits of the lease to Statoil.
Statoil distinguishes between lease and capacity contracts. Lease contracts provide the right to use a specific asset for a period of time, while capacity contracts confer on Statoil the right to and the obligation to pay for certain volume capacity availability related to transport, terminal use, storage, etc. Such capacity contracts that do not involve specified assets or that do not involve substantially all the capacity of an undivided interest in a specific asset are not considered by Statoil to qualify as leases for accounting purposes. Capacity payments are reflected as Operatingoperating expensesin the Consolidated statement of income in the period for which the capacity contractually is available to Statoil.
Intangible assets including goodwill
Intangible assets are stated at cost, less accumulated amortisation and accumulated impairment losses. Intangible assets include acquisition cost for oil and gas prospects, expenditures on the exploration for and evaluation of oil and natural gas resources, goodwill and other intangible assets.
Expenses related to the drilling of exploration wells are initially capitalised as intangible assets pending determination of whether potentially economic oil and gas reserves have been discovered by the drilling effort. This evaluation is normally finalised within one year after well completion. Exploration wells that discover potentially economic quantities of oil and natural gas remain capitalised as intangible assets during the evaluation phase of the find, see further information under the Oil and gas exploration and development expenditures section above.Statoil, Annual Report on Form 20-F 2016139
Intangible assets relating to expenditures on the exploration for and evaluation of oil and natural gas resources are not amortised. When the decision to develop a particular area is made, its intangible exploration and evaluation assets are reclassified to Property,property, plant and equipment. equipment.
Goodwill is initially measured at the excess of the aggregate of the consideration transferred and the amount recognised for any non-controlling interest over the fair value of the identifiable assets acquired and liabilities assumed in a business combination at the acquisition date. Goodwill acquired is allocated to each cash generating unit, or group of units, expected to benefit from the combination's synergies. Following initial recognition, goodwill is measured at cost less any accumulated impairment losses.
Financial assets
Financial assets are initially recognised at fair value when Statoil becomes a party to the contractual provisions of the asset. For additional information on fair value methods, refer to the Measurement of fair values section below. The subsequent measurement of the financial assets depends on which category they have been classified into at inception.
At initial recognition, Statoil classifies its financial assets into the following three main categories: Financial investments at fair value through profit or loss, loans and receivables, and available-for-sale (AFS) financial assets. The first main category, financial investments at fair value through profit or loss, further consists of two sub-categories: Financial assets held for trading and financial assets that on initial recognition are designated as fair value through profit and loss. The latter approach may also be referred to as the fair value option.
152Statoil, Annual Report on Form 20-F 2014
Cash and cash equivalents include cash in hand, current balances with banks and similar institutions, and short-term highly liquid investments that are readily convertible to known amounts of cash, are subject to an insignificant risk of changes in fair value and have a maturity of three months or less from the acquisition date.
Trade receivables are carried at the original invoice amount less a provision for doubtful receivables which is made when there is objective evidence that Statoil will be unable to recover the balances in full.
A significant part of Statoil's investments in treasury bills, commercial papers, bonds and listed equity securities is managed together as an investment portfolio of Statoil's captive insurance company and is held in order to comply with specific regulations for capital retention. The investment portfolio is managed and evaluated on a fair value basis in accordance with an investment strategy and is accounted for using the fair value option with changes in fair
value recognised through profit or loss.
Financial assets are presented as current if they contractually will expire or otherwise are expected to be recovered within 12 months after the balance sheet date, or if they are held for the purpose of being traded. Financial assets and financial liabilities are shown separately in the Consolidated balance sheet, unless Statoil has both a legal right and a demonstrable intention to net settle certain balances payable to and receivable from the same counterparty, in which case they are shown net in the balance sheet.
Inventories
Inventories are stated at the lower of cost and net realisable value. Cost is determined by the first-in first-out method and comprises direct purchase costs, cost of production, transportation and manufacturing expenses.
Impairment
Impairment of property, plant and equipment and intangible assets other than goodwill
Statoil assesses individual assets or groups of assets for impairment whenever events or changes in circumstances indicate that the carrying value of an asset may not be recoverable. Assets are grouped into cash generating units (CGUs) which are the smallest identifiable groups of assets that generate cash inflows that are largely independent of the cash inflows from other groups of assets. Normally, separate CGUs are individual oil and gas fields or plants. Each unconventional asset play is considered a single CGU when no cash inflows from parts of the play can be reliably identified as being largely independent of the cash inflows from other parts of the play. In impairment evaluations, the carrying amounts of CGUs are determined on a basis consistent with that of the recoverable amount. Impairment of property, plant and equipment and intangible assets. In Statoil's line of business, judgement is involved in determining what constitutes a CGU. Development in production, infrastructure solutions, markets, product pricing, management actions and other factors may over time lead to changes in CGUs such as the division of one original CGU into several.
In assessing whether a write-down of the carrying amount of a potentially impaired asset is required, the asset's carrying amount is compared to the recoverable amount. The recoverable amount of an asset is the higher of its fair value less cost of disposal and its value in use. FrequentlyFair value less cost of disposal is determined based on comparable recent arm’s length market transactions, or based on Statoil’s estimate of the recoverable amount ofprice that would be received for the asset in an asset proves to be Statoil's estimated valueorderly transaction between market participants. Value in use which is determined using a discounted cash flow model. The estimated future cash flows applied are based on reasonable and supportable assumptions and represent management's best estimates of the range of economic conditions that
will exist over the remaining useful life of the assets, as set down in Statoil's most recently approved long-term plans. Statoil'sforecasts. Statoil uses an approach of regular updates of assumptions and economic conditions in establishing the long-term plansforecasts which are reviewed by corporate management and updated at least annually. The plans cover a 10-year period and reflect expected production volumes for oil and natural gas in that period. For assets and CGUs with an expected useful life or timeline for production of expected reserves extending beyond 105 years, the forecasts reflect expected production volumes for oil and natural gas, and the related cash flows include project or asset specific estimates reflecting the relevant period. Such estimates are established on the basis of Statoil's principles and assumptions consistently applied.
In performing a value-in-use-based impairment test, the estimated future cash flows are adjusted for risks specific to the asset and discounted using a real post-tax discount rate which is based on Statoil's post-tax weighted average cost of capital (WACC). The use of post-tax discount rates in determining
140Statoil, Annual Report on Form 20-F 2016
value in use does not result in a materially different determination of the need for, or the amount of, impairment that would be required if pre-tax discount rates had been used.
Unproved oil and gas properties are assessed for impairment when facts and circumstances suggest that the carrying amount of the asset may exceed its recoverable amount, and at least once a year. Exploratory wells that have found reserves, but where classification of those reserves as proved depends on whether major capital expenditure can be justified or where the economic viability of that major capital expenditure depends on the successful completion of further exploration work, will remain capitalised during the evaluation phase for the exploratory finds. Thereafter it will be considered a trigger for impairment evaluation of the well if no development decision is planned for the near future and there are no concretefirm plans for future drilling in the licence.
Impairments are reversed,An assessment is made at each reporting date as applicable, to the extentwhether there is any indication that conditions forpreviously recognised impairment arelosses may no longer present. be relevant or may have decreased. If such an indication exists, the recoverable amount is estimated. A previously recognised impairment loss is reversed only if there has been a change in the estimates used to determine the asset’s recoverable amount since the last impairment loss was recognised. If that is the case, the carrying amount of the asset is increased to its recoverable amount. That increased amount cannot exceed the carrying amount that would have been determined, net of depreciation, had no impairment loss been recognised for the asset in prior years.
Impairment losses and reversals of impairment losses are presented in the Consolidated statement of income as Exploration expenses or Depreciation, amortisation and net impairment losses,, on the basis of their nature as either exploration assets (intangible exploration assets) or development and
producing assets (property, plant and equipment and other intangible assets), respectively.
Impairment of goodwill
Goodwill is reviewed for impairment annually or more frequently if events or changes in circumstances indicate that the carrying value may be impaired. Impairment is determined by assessing the recoverable amount of the CGU, or group of units, to which the goodwill relates. Where the recoverable amount of the CGU, or group of units, is less than the carrying amount, an impairment loss is recognised. Once recognised, impairments of goodwill are not reversed in future periods.
Statoil, Annual Report on Form 20-F 2014153
Financial liabilities
Financial liabilities are initially recognised at fair value when Statoil becomes a party to the contractual provisions of the liability. The subsequent measurement of financial liabilities depends on which category they have been classified into. The categories applicable for Statoil are either financial liabilities at fair value through profit or loss or financial liabilities measured at amortised cost using the effective interest method. The latter applies to Statoil's non-current bank loans and bonds.
Financial liabilities are presented as current if the liability is due to be settled within 12 months after the balance sheet date, or if they are held for the purpose of being traded. Financial liabilities are derecognised when the contractual obligations expire, are discharged or cancelled. Gains and losses arising on the repurchase, settlement or cancellation of liabilities are recognised either in interest income and other financial items or in interest and other finance expenses within Netnet financial items. items.
Derivative financial instruments
Statoil uses derivative financial instruments to manage certain exposures to fluctuations in foreign currency exchange rates, interest rates and commodity prices. Such derivative financial instruments are initially recognised at fair value on the date on which a derivative contract is entered into and are subsequently re-measured at fair value through profit and loss. The impact of commodity-based derivative financial instruments is recognised in the Consolidated statement of income under Revenues,revenues, as such derivative instruments are related to sales contracts or revenue-related risk management for all significant purposes. The impact of other financial instruments is reflected under Netnet financial items. items.
Derivatives are carried as assets when the fair value is positive and as liabilities when the fair value is negative. Derivative assets or liabilities expected to be recovered, or with the legal right to be settled more than 12 months after the balance sheet date are classified as non-current, with the exception of derivative financial instruments held for the purpose of being traded.
Contracts to buy or sell a non-financial item that can be settled net in cash or another financial instrument, or by exchanging financial instruments, as if the contracts were financial instruments, are accounted for as financial instruments. However, contracts that are entered into and continue to be held for the purpose of the receipt or delivery of a non-financial item in accordance with Statoil's expected purchase, sale or usage requirements, also referred to as own-use, are not accounted for as financial instruments. This is applicable to a significant number of contracts for the purchase or sale of crude oil and natural gas, which are recognised upon delivery.
Derivatives embedded in other financial instruments or in non-financial host contracts are recognised as separate derivatives and are reflected at fair value with subsequent changes through profit and loss, when their risks and economic characteristics are not closely related to those of the host contracts, and the host contracts are not carried at fair value. Where there is an active market for a commodity or other non-financial item referenced in a purchase or sale contract, a pricing formula will, for instance, be considered to be closely related to the host purchase or sales contract if the price formula is based on the active market in question. A price formula with indexation to other markets or products will however result in the recognition of a separate derivative. Where there is no active market for the commodity or other non-financial item in question, Statoil assesses the characteristics of such a price related embedded derivative to be closely related to the host contract if the price formula is based on relevant indexations commonly used by other market
participants. This applies to a number of Statoil'scertain long-term natural gas sales agreements.
Statoil, Annual Report on Form 20-F 2016141
Pension liabilities
Statoil has pension plans for employees that either provide a defined pension benefit upon retirement or a pension dependent on defined contributions and related returns. A portion of the contributions are provided for as notional contributions, for which the liability increases with a promised notional return, set equal to the actual return of assets invested through the ordinary defined contribution plan. For defined benefit plans, the benefit to be received by employees generally depends on many factors including length of service, retirement date and future salary levels.
Statoil's proportionate share of multi-employer defined benefitsbenefit plans are recognised as liabilities in the balance sheet to the extent that sufficient information is available and a reliable estimate of the obligation can be made.
Statoil's net obligation in respect of defined benefit pension plans is calculated separately for each plan by estimating the amount of future benefit that employees have earned in return for their services in the current and prior periods. That benefit is discounted to determine its present value, and the fair value of any plan assets is deducted. The discount rate is the yield at the balance sheet date, reflecting the maturity dates approximating the terms of Statoil's obligations. The discount rate for the main part of the pension obligations has been established on the basis of Norwegian mortgage covered bonds, which are considered high quality corporate bonds. The cost of pension benefit plans is expensed over the period that the employees render services and become eligible to receive benefits. The calculation is performed by an external actuary.
The net interest related to defined benefit plans is calculated by applying the discount rate to the net defined benefit liability (asset). The interest cost element is determined by applying the discount rate to the opening present value of the benefit obligation taking into account material changes in the obligation during the year. The interest income on plan assets is determined by applying the discount rate to theand opening present value of the plan assets, adjusted for the effect on the fair value of plan assets of contributions received and benefits paidmaterial changes during the year. The resulting net interest element is presented in the statement of income as part of net pension cost within Netnet operating income.income. The difference between netestimated interest income and actual return is recognised in OCI.the Consolidated statement of comprehensive income.
Periodic pension cost is accumulated in cost pools and allocated to operating segments and Statoil operated joint operations (licences) on an hours incurred basis and recognised in the statement of income based on the function of the cost.
Past service cost is recognised when a plan amendment (the introduction or withdrawal of, or changes to, a defined benefit plan) or curtailment (a significant reduction by the entity in the number of employees covered by a plan) occurs, or when recognising related restructuring costs or termination benefits. The obligation and related plan assets are re-measured using current actuarial assumptions, and the gain or loss is recognised in the statement of income.
Actuarial gains and losses are recognised in full in the Consolidated statement of comprehensive income in the period in which they occur, while
154Statoil, Annual Report on Form 20-F 2014
actuarial gains and losses related to provision for termination benefits are recognised in the Consolidated statement of income in the period in which they occur. Due to the parent company Statoil ASA's functional currency being USD, the significant part of Statoil's pension obligations will be payable in a foreign currency (i.e. NOK). As a consequence, actuarial gains and losses related to the parent company's pension obligation include the impact of exchange rate fluctuations.
Contributions to defined contribution schemes are recognised in the statement of income in the period in which the contribution amounts are earned by the employees.
Notional contribution plans, reported in the parent company Statoil ASA, are recognised as pension liabilities with the actual value of the notional contributions and promised return at reporting date. Notional contributions and changes in fair value of notional assets are recognised in the statement of income as periodic pension cost.
Periodic pension cost is accumulated in cost pools and allocated to operating segments and Statoil operated joint operations (licences) on an hours incurred basis and recognised in the statement of income based on the function of the cost.
Onerous contracts
Statoil recognises as provisions the net obligation under contracts defined as onerous. Contracts are deemed to be onerous if the unavoidable cost of meeting the obligations under the contract exceeds the economic benefits expected to be received in relation to the contract. A contract which forms an integral part of the operations of a CGU whose assets are dedicated to that contract, and for which the economic benefits cannot be reliably separated from those of the CGU, is included in impairment considerations for the applicable CGU.
Asset retirement obligations (ARO)
Provisions for ARO costs are recognised when Statoil has an obligation (legal or constructive) to dismantle and remove a facility or an item of property, plant and equipment and to restore the site on which it is located, and when a reliable estimate of that liability can be made. The amount recognised is the present value of the estimated future expenditures determined in accordance with local conditions and requirements. Cost is estimated based on current regulations and technology, considering relevant risks and uncertainties. The discount rate used in the calculation of the ARO is a risk-free rate based on the applicable currency and time horizon of the underlying cash flows, adjusted for a credit premium which reflects Statoil's own credit risk. Normally an obligation arises for a new facility, such as an oil and natural gas production or transportation facility, upon construction or installation. An obligation may also crystallise during the period of operation of a facility through a change in legislation or through a decision to terminate operations, or be based on
commitments associated with Statoil's ongoing use of pipeline transport systems where removal obligations rest with the volume shippers. The provisions are classified under provisionsProvisions in the Consolidated balance sheet. Some of the refining and process plantsoperations are deemed to have indefinite lives, and in consequence, no ARO has been recognizedrecognised for these assets.their plants.
When a provision for ARO cost is recognised, a corresponding amount is recognised to increase the related property, plant and equipment and is subsequently depreciated as part of the costs of the facility or item of property, plant and equipment. Any change in the present value of the estimated expenditure is reflected as an adjustment to the provision and the corresponding property, plant and equipment. When a decrease in the ARO provision related to a producing asset exceeds the carrying amount of the asset, the excess is recognised as a reduction of depreciation, amortisation and net
142Statoil, Annual Report on Form 20-F 2016
impairment losses in the Consolidated statement of income. When an asset has reached the end of its useful life, all subsequent changes to the ARO provision are recognised as they occur in operating expenses in the Consolidated statement of income. Removal provisions associated with Statoil's role as shipper of volumes through third party transport systems are expensed as incurred.
Measurement of fair values
Quoted prices in active markets represent the best evidence of fair value and are used by Statoil in determining the fair values of assets and liabilities to the extent possible. Financial instruments quoted in active markets will typically include commercial papers, bonds and equity instruments with quoted market prices obtained from the relevant exchanges or clearing houses. The fair values of quoted financial assets, financial liabilities and derivative instruments are determined by reference to mid-market prices, at the close of business on the balance sheet date.
Where there is no active market, fair value is determined using valuation techniques. These include using recent arm's-length market transactions, reference to other instruments that are substantially the same, discounted cash flow analysis, and pricing models and related internal assumptions. In the valuation techniques, Statoil also takes into consideration the counterparty and its own credit risk. This is either reflected in the discount rate used or through direct adjustments to the calculated cash flows. Consequently, where Statoil reflects elements of long-term physical delivery commodity contracts at fair value, such fair value estimates to the extent possible are based on quoted forward prices in the market and underlying indexes in the contracts, as well as assumptions of forward prices and margins where observable market prices are not available. Similarly, the fair values of interest and currency swaps are estimated based on relevant quotes from active markets, quotes of comparable instruments, and other appropriate valuation techniques.
Critical accounting judgements and key sources of estimation uncertainty
Critical judgements in applying accounting policies
The following are the critical judgements, apart from those involving estimations (see below), that Statoil has made in the process of applying the accounting policies and that have the most significant effect on the amounts recognised in the financial statements:
Revenue recognition - gross versus net presentation of traded SDFI volumes of oil and gas production
As described under Transactions with the Norwegian State above, Statoil markets and sells the Norwegian State's share of oil and gas production from the NCS. Statoil includes the costs of purchase and proceeds from the sale of the SDFI oil production in Purchasespurchases [net of inventory variation] and revenues, and Revenues, respectively. In making the judgement, Statoil considered the detailed criteria for the recognition of revenue from the sale of goods and, in particular, concluded that the risk and reward of the ownership of the oil had been transferred from the SDFI to Statoil.
Statoil sells, in its own name, but for the Norwegian State's account and risk, the State's production of natural gas. These gas sales, and related expenditures refunded by the State, are shown net in Statoil's Consolidated financial statements. In making the judgement, Statoil considered the same
criteria as for the oil production and concluded that the risk and reward of the ownership of the gas had not been transferred from the SDFI to Statoil.
Key sources of estimation uncertainty
The preparation of the Consolidated financial statements requires that management make estimates and assumptions that affect reported amounts of assets, liabilities, income and expenses. The estimates and associated assumptions are based on historical experience and various other factors that are believed to be reasonable under the circumstances, the result of which form the basis of making the judgements about carrying values of assets and liabilities that are not readily apparent from other sources. Actual results may differ from these estimates. The estimates and underlying assumptions are reviewed on an ongoingon-going basis considering the current and expected future market conditions.
Statoil, Annual Report on Form 20-F 2014155
Statoil is exposed to a number of underlying economic factors which affect the overall results, such as liquids prices, natural gas prices, refining margins, foreign exchange rates and interest rates as well as financial instruments with fair values derived from changes in these factors. In addition, Statoil's results are influenced by the level of production, which in the short term may be influenced by, for instance, maintenance programmes. In the long term, the results are impacted by the success of exploration and field development activities.
The matters described below are considered to be the most important in understanding the key sources of estimation uncertainty that are involved in preparing these Consolidated financial statements and the uncertainties that could most significantly impact the amounts reported on the results of operations, financial position and cash flows.
Proved oil and gas reserves.
Proved oil and gas reserves may materially impact the Consolidated financial statements, as changes in the proved reserves, for instance as a result of changes in prices, will impact the unit of production rates used for depreciation and amortisation. Proved oil and gas reserves have been estimated by internal qualified professionals on the basis of industry standards and governed by criteria established by regulations of the U.S. Securities Exchange Commission (SEC), which require the use of a price based on a 12-month average for reserve estimation, and which are to be based on existing economic conditions and operating methods and with a high degree of confidence (at least 90% probability) that the quantities will be recovered. The Financial Accounting Standards Board (FASB) requirements for supplemental oil and gas disclosures align with the SEC regulations. Reserves estimates are based on subjective judgements involving geological and engineering assessments of in-place hydrocarbon volumes, the production, historical recovery and processing yield factors and installed plant operating capacity. For future development projects, proved reserves estimates are included only where there is a significant commitment to project funding and execution and when relevant governmental and regulatory approvals have been secured or are reasonably certain to be secured. The reliability of these estimates at any point in time depends on both the quality and quantity of the technical and economic data and the efficiency of extracting and processing the hydrocarbons. An independent third party has evaluated Statoil's proved reserves estimates, and the results of this evaluation do not differ materially from Statoil's estimates. Proved oil and gas reserves are those quantities of oil and gas, which, by analysis
Statoil, Annual Report on Form 20-F 2016143
of geoscience and engineering data, can be estimated with reasonable certainty to be economically producible from a given date forward, from known reservoirs, and under existing economic conditions, operating methods and government regulations. Unless evidence indicates that renewal is reasonably certain, estimates of economically producible reserves only reflect the period before the contracts providing the right to operate expire. The project to extract the hydrocarbons must have commenced, or the operator must be reasonably certain that it will commence within a reasonable time.
Expected oil and gas reserves.
Expected oil and gas reserves may materially impact the Consolidated financial statements, as changes in the expected reserves, for instance as a result of changes in prices, will impact asset retirement obligations and impairment testing of upstream assets, which in turn may lead to changes in impairment charges affecting operating income. Expected oil and gas reserves are the estimated remaining, commercially recoverable quantities, based on Statoil's judgement of future economic conditions, from projects in operation or justified for development. Recoverable oil and gas quantities are always uncertain, and the expected value is the weighted average, or statistical mean, of the possible outcomes. Expected reserves are therefore typically larger than proved
reserves as defined by the SEC rules. Expected oil and gas reserves have been estimated by internal qualified professionals on the basis of industry standards and are used for impairment testing purposes and for calculation of asset retirement obligations. Reserves estimates are based on subjective judgements involving geological and engineering assessments of in-place hydrocarbon volumes, the production, historical recovery and processing yield factors, installed plant operating capacity and operating approval limits. The reliability of these estimates at any point in time depends on both the quality and quantity of the technical and economic data and the efficiency of extracting and processing the hydrocarbons.
Exploration and leasehold acquisition costs.
Statoil capitalises the costs of drilling exploratory wells pending determination of whether the wells have found proved oil and gas reserves. Statoil also capitalises leasehold acquisition costs and signature bonuses paid to obtain access to undeveloped oil and gas acreage. Judgements as to whether these expenditures should remain capitalised or written down due to impairment losses in the period may materially affect the operating income for the period.
Impairment/reversal of impairment.
Statoil has significant investments in property, plant and equipment and intangible assets. Changes in the circumstances or expectations of future performance of an individual asset may be an indicator that the asset is impaired, requiring the carrying amount to be written down to its recoverable amount. Impairments are reversed if conditions for impairment are no longer present. Evaluating whether an asset is impaired or if an impairment should be reversed requires a high degree of judgement and may to a large extent depend upon the selection of key assumptions about the future.
The key assumptions used will bear the risk of change based on the inherent volatile nature of macro-economic factors such as future commodity prices or discount rate and uncertainty in asset specific factors such as reserve estimates and operational decisions impacting the production profile or activity levels for our oil and natural gas properties. When estimating the recoverable amount, the single most likely future cash flows, the point estimate, is the primary method applied to reflect uncertainties in timing and amount inherent in the assumptions used in the estimated future cash flows. For assumptions in which the expected probability distributions or outcome are expected to be significantly skewed the use of decision trees or simulation is applied.
Unproved oil and gas properties are assessed for impairment when facts and circumstances suggest that the carrying amount of the asset may exceed its recoverable amount, and at least annually. If, following evaluation, an exploratory well has not found proved reserves, the previously capitalised costs are tested for impairment. Subsequent to the initial evaluation phase for a well, it will be considered a trigger for impairment testing of a well if no development decision is planned for the near future and there is no concretefirm plan for future drilling in the licence. Impairment of unsuccessful wells is reversed, as applicable, to the extent that conditions for impairment are no longer present.
Estimating recoverable amounts involves complexity in estimating relevant future cash flows, based on assumptions about the future, discounted to their present value. Impairment testing requires long-term assumptions to be made concerning a number of often volatile economic factors such as future market prices, refinery margins, currency exchange rates and future output, discount rates and political and country risk among others, in order to establish relevant future cash flows. Impairment testing frequently also requires judgement regarding probabilities and probability distributions as well as levels of sensitivity inherent in the establishment of recoverable amount estimates. Long-term assumptions for major economic factors are made at a group level, and there is a high degree of reasoned judgement involved in establishing these assumptions, in determining other relevant factors such as forward price curves, in estimating production outputs and in determining the ultimate terminal value of an asset.
Employee retirement plans.
When estimating the present value of defined benefit pension obligations that represent a long-term liability in the Consolidated balance sheet, and indirectly, the period's net pension expense in the Consolidated statement of income, management make a number of critical assumptions affecting these estimates. Most notably, assumptions made about the discount rate to be applied to future benefit payments and plan
156Statoil, Annual Report on Form 20-F 2014
assets, the expected rate of pension increase and the annual rate of compensation increase, have a direct and potentially material impact on the amounts presented. Significant changes in these assumptions between periods can have a material effect on the Consolidated financial statements.
Asset retirement obligations.
Statoil has significant obligations to decommission and remove offshore installations at the end of the production period. It is difficult to estimate theThe costs of these decommissioning and removal activities which are based onrequire revisions due to changes in current regulations and technology and considerwhile considering relevant risks and uncertainties. Most of the removal activities are many years into the future, and the removal technology and costs are constantly changing. The estimates include assumptions of the time required and the day rates for rigs, marine operations and heavy lift vessels that can vary considerably depending on the assumed removal complexity. As a result, the initial recognition of the liability and the capitalised cost associated with decommissioning and removal obligations, and the subsequent adjustment of these balance sheet items, involve the application of significant judgement.
144Statoil, Annual Report on Form 20-F 2016
Derivative financial instruments.
When not directly observable in active markets, the fair value of derivative contracts must be computed internally based on internal assumptions as well as directly observable market information, including forward and yield curves for commodities, currencies and interest rates. Changes in internal assumptions, forward and yield curves could materially impact the internally computed fair value of derivative contracts, particularly long-term contracts, resulting in a
corresponding impact on income or loss in the Consolidated statement of income.
Income tax.
Every year Statoil incurs significant amounts of income taxes payable to various jurisdictions around the world and recognises significant changes to deferred tax assets and deferred tax liabilities, all of which are based on management's interpretations of applicable laws, regulations and relevant court
decisions. The quality of these estimates is highly dependent upon management's ability to properly applyproper application of at times very complex sets of rules, to recognisethe recognition of changes in applicable rules and, in the case of deferred tax assets, management's ability to project future earnings from activities that may apply loss carry forward positions against future income taxes.
3 Segments
Statoil's operations are managed through the following operating segments: Development and Production Norway (DPN), Development and Production North America (DPNA)USA (DPUSA), Development and Production International (DPI), Marketing, Midstream and Processing and Renewable(MMP), New Energy (MPR)Solutions (NES) and Other. The Fuel and Retail segment (FR) was sold on 19 June 2012.
The development and production operating segments which are organised based on a regional model with geographical clusters or units, are responsible for the commercial development of the oil and gas portfolios within their respective geographical areas: DPN on the Norwegian continental shelf, DPNA in North AmericaDPUSA including offshore and onshore activities in the USA and CanadaMexico, and DPI worldwide outside of North AmericaDPN and Norway.DPUSA.
Exploration activities are managed by a separate business unit, which has the global responsibility across the group for discovery and appraisal of new resources. Exploration activities are allocated to and presented in the respective development and production operating segments.
The MPRMMP segment is responsible for marketing and trading of oil and gas commodities (crude, condensate, gas liquids, products, natural gas and liquefied natural gas), electricity and emission rights, as well as transportation, processing and manufacturing of the above mentioned commodities, operations of refineries, terminals, processing and power plants,plants.
The NES segment is responsible for wind parks, carbon capture and storage as well as other activities within renewable energy.energy and low-carbon energy solutions.
Statoil reports its business through reporting segments which correspond to the operating segments, except for the operating segments DPI and DPNADPUSA which have been aggregated into one reporting segment, Development and Production International. This aggregation has its basis in similar economic characteristics, the nature of products, services and production processes, the type and class of customers, and the methods of distribution.distribution and regulatory environment. The operating segment NES is reported in the segment Other due to its immateriality.
The Other reporting segment includes activities within New Energy Solutions, Global Strategy and Business Development, Technology, Projects and Drilling and the Corporate staffsStaffs and services.
In the second quarter 2012, Statoil divested its FR segment through Statoil ASA's sale of its 54% shareholding in Statoil Fuel & Retail ASA (SFR). A gain of NOK 5.8 billion was recognised. In the segment reporting, the gain has been presented in the FR segment as Revenues third party and Other income. The FR segment marketed fuel and related products principally to retail consumers.Services.
The Eliminationseliminations section includes the elimination of inter-segment sales and related unrealised profits, mainly from the sale of crude oil and products. IntersegmentInter-segment revenues are based upon estimated market prices.
Segment data for the years ended 31 December 2014, 20132016, 2015 and 20122014 is presented below. The measurement basis of segment profit is Net operating income. In the tables below, deferred tax assets, pension assets and non-current financial assets are not allocated to the segments. Also, the line Additionsadditions to PP&E, intangibles and associated companies isequity accounted investments are excluding movements due to changes in asset retirement obligations.
Statoil, Annual Report on Form 20-F 20142016 157145
(in NOK billion) | Development and Production Norway | Development and Production International | Marketing, Processing and Renewable Energy | Other | Eliminations | Total |
| | | | | | |
Full year 2014 | | | | | | |
Revenues third party and Other income | 9.0 | 18.6 | 595.0 | 0.4 | - | 622.9 |
Revenues inter-segment | 173.2 | 67.3 | 1.8 | 0.0 | (242.3) | (0.0) |
Net income (loss) from associated companies | 0.1 | (0.8) | 0.5 | (0.0) | - | (0.3) |
| | | | | | |
Total revenues and other income | 182.2 | 85.2 | 597.3 | 0.3 | (242.3) | 622.7 |
| | | | | | |
Net operating income | 111.7 | (19.5) | 16.2 | (1.5) | 2.6 | 109.5 |
| | | | | | |
Significant non-cash items recognised | | | | | | |
- Depreciation and amortisation | 37.7 | 33.0 | 2.8 | 1.0 | - | 74.5 |
- Change in pension plan (gain) | (2.3) | (0.1) | (0.7) | (0.4) | - | (3.5) |
- Net impairment losses (reversals) | 2.3 | 23.8 | 0.8 | 0.0 | - | 26.9 |
- Unrealised (gain) loss on commodity derivatives | 0.6 | 0.0 | (3.1) | 0.0 | - | (2.5) |
- Exploration expenditures written off | 0.8 | 12.9 | 0.0 | 0.0 | - | 13.7 |
| | | | | | |
Investments in associated companies | 0.2 | 4.8 | 3.2 | 0.2 | - | 8.4 |
Non-current segment assets | 262.0 | 333.8 | 46.3 | 5.1 | - | 647.3 |
Non-current assets, not allocated to segments | | | | | | 76.0 |
| | | | | | |
Total non-current assets | | | | | | 731.7 |
| | | | | | |
Additions to PP&E, intangibles and associated companies | 55.1 | 61.4 | 7.8 | 0.8 | - | 125.1 |
(in USD million) | Development and Production Norway | Development and Production International | Marketing, Midstream and Processing | Other | Eliminations | Total |
| | | | | | |
Full year 2016 | | | | | | |
Revenues third party and other income | 184 | 884 | 44,883 | 41 | 0 | 45,993 |
Revenues inter-segment | 12,971 | 5,873 | 35 | 1 | (18,880) | (0) |
Net income (loss) from equity accounted investments | (78) | (100) | 61 | (3) | 0 | (119) |
| | | | | | |
Total revenues and other income | 13,077 | 6,657 | 44,979 | 39 | (18,880) | 45,873 |
| | | | | | |
Purchases [net of inventory variation] | 1 | (7) | (39,696) | (0) | 18,198 | (21,505) |
Operating and SG&A expenses | (2,547) | (2,923) | (4,439) | (340) | 463 | (9,787) |
Depreciation, amortisation and net impairment losses | (5,698) | (5,510) | (221) | (121) | 0 | (11,550) |
Exploration expenses | (383) | (2,569) | 0 | 0 | 0 | (2,952) |
| | | | | | |
Net operating income | 4,451 | (4,352) | 623 | (423) | (219) | 80 |
| | | | | | |
Additions to PP&E, intangibles and equity accounted investments | 6,785 | 6,397 | 492 | 451 | 0 | 14,125 |
| | | | | | |
Balance sheet information | | | | | | |
Equity accounted investments | 1,133 | 365 | 129 | 618 | 0 | 2,245 |
Non-current segment assets | 27,816 | 36,181 | 4,450 | 352 | 0 | 68,799 |
Non-current assets, not allocated to segments | | | | | | 8,090 |
| | | | | | |
Total non-current assets | | | | | | 79,133 |
(in NOK billion) | Development and Production Norway | Development and Production International | Marketing, Processing and Renewable Energy | Other | Eliminations | Total |
| | | | | | |
Full year 2013 (restated) | | | | | | |
Revenues third party and Other income | 9.4 | 16.5 | 607.5 | 1.0 | - | 634.4 |
Revenues inter-segment | 192.7 | 65.4 | 1.0 | 0.1 | (259.1) | 0.0 |
Net income (loss) from associated companies | 0.1 | (0.0) | 0.1 | (0.0) | - | 0.1 |
| | | | | | |
Total revenues and other income | 202.2 | 81.9 | 608.6 | 1.0 | (259.1) | 634.5 |
| | | | | | |
Net operating income | 137.1 | 16.4 | 2.6 | (1.1) | 0.4 | 155.5 |
| | | | | | |
Significant non-cash items recognised | | | | | | |
- Depreciation and amortisation | 31.6 | 29.8 | 2.7 | 1.3 | - | 65.4 |
- Provisions | 0.8 | 4.6 | 4.1 | 0.0 | - | 9.5 |
- Net impairment losses (reversals) | 0.6 | 2.1 | 4.3 | 0.0 | - | 7.0 |
- Unrealised (gain) loss on commodity derivatives | 5.6 | 0.0 | (0.1) | 0.0 | - | 5.5 |
- Exploration expenditures written off | 0.3 | 2.8 | 0.0 | 0.0 | - | 3.1 |
| | | | | | |
Investments in associated companies | 0.2 | 4.8 | 2.3 | 0.2 | - | 7.4 |
Non-current segment assets | 247.6 | 286.5 | 39.3 | 5.6 | - | 578.9 |
Non-current assets, not allocated to segments | | | | | | 60.5 |
| | | | | | |
Total non-current assets | | | | | | 646.8 |
| | | | | | |
Additions to PP&E, intangibles and associated companies | 57.3 | 52.9 | 5.9 | 1.3 | - | 117.4 |
(in USD million) | Development and Production Norway | Development and Production International | Marketing, Midstream and Processing | Other | Eliminations | Total |
| | | | | | |
Full year 2015 | | | | | | |
Revenues third party and other income | (123) | 1,576 | 57,868 | 349 | 0 | 59,671 |
Revenues inter-segment | 17,459 | 6,715 | 183 | 1 | (24,357) | (0) |
Net income (loss) from equity accounted investments | 3 | (91) | 55 | 4 | 0 | (29) |
| | | | | | |
Total revenues and other income | 17,339 | 8,200 | 58,106 | 354 | (24,357) | 59,642 |
| | | | | | |
Purchases [net of inventory variation] | (0) | (10) | (50,547) | (0) | 24,303 | (26,254) |
Operating and SG&A expenses | (3,223) | (3,391) | (4,664) | (342) | 187 | (11,433) |
Depreciation, amortisation and net impairment losses | (6,379) | (10,231) | 37 | (142) | (0) | (16,715) |
Exploration expenses | (576) | (3,296) | (0) | 0 | 0 | (3,872) |
| | | | | | |
Net operating income | 7,161 | (8,729) | 2,931 | (129) | 133 | 1,366 |
| | | | | | |
Additions to PP&E, intangibles and equity accounted investments | 6,293 | 8,119 | 900 | 273 | 0 | 15,584 |
| | | | | | |
Balance sheet information | | | | | | |
Equity accounted investments | 5 | 333 | 214 | 272 | 0 | 824 |
Non-current segment assets | 27,706 | 37,475 | 5,588 | 690 | 0 | 71,458 |
Non-current assets, not allocated to segments | | | | | | 9,305 |
| | | | | | |
Total non-current assets | | | | | | 81,588 |
158146 Statoil, Annual Report on Form 20-F 20142016
(in NOK billion) | Development and Production Norway | Development and Production International | Marketing, Processing and Renewable Energy | Other | Fuel and Retail | Eliminations | Total |
| | | | | | | |
Full year 2012 (restated) | | | | | | | |
Revenues third party and Other income | 7.7 | 24.3 | 643.0 | 1.3 | 40.2 | - | 716.5 |
Revenues inter-segment | 213.0 | 54.5 | 22.2 | 0.0 | 1.5 | (291.2) | 0.0 |
Net income (loss) from associated companies | 0.1 | 1.2 | 0.4 | (0.0) | (0.0) | - | 1.7 |
| | | | | | | |
Total revenues and other income | 220.8 | 80.0 | 665.6 | 1.3 | 41.7 | (291.2) | 718.2 |
| | | | | | | |
Net operating income | 161.7 | 21.5 | 15.5 | 2.6 | 6.9 | (1.6) | 206.6 |
| | | | | | | |
Significant non-cash items recognised | | | | | | | |
- Depreciation and amortisation | 29.2 | 26.2 | 2.3 | 0.9 | 0.6 | - | 59.2 |
- Net impairment losses (reversals) | 0.6 | 0.0 | 0.6 | 0.0 | 0.0 | - | 1.2 |
- Unrealised (gain) loss on commodity derivatives | 1.4 | 0.0 | 1.8 | 0.0 | 0.0 | - | 3.1 |
- Exploration expenditures written off | 0.8 | 2.3 | 0.0 | 0.0 | 0.0 | - | 3.1 |
| | | | | | | |
Investments in associated companies | 0.2 | 4.8 | 3.2 | 0.1 | - | - | 8.3 |
Non-current segment assets | 235.4 | 248.3 | 38.5 | 4.5 | - | - | 526.7 |
Non-current assets, not allocated to segments | | | | | | | 66.4 |
| | | | | | | |
Total non-current assets | | | | | | | 601.4 |
| | | | | | | |
Additions to PP&E, intangibles and associated companies | 48.6 | 54.6 | 6.2 | 3.0 | 0.9 | - | 113.3 |
(in USD million) | Development and Production Norway | Development and Production International | Marketing, Midstream and Processing | Other | Eliminations | Total |
| | | | | | |
Full year 2014 | | | | | | |
Revenues third party and other income | 1,347 | 3,017 | 94,812 | 122 | 0 | 99,299 |
Revenues inter-segment | 27,568 | 10,757 | 286 | 1 | (38,612) | 0 |
Net income (loss) from equity accounted investments | 11 | (113) | 73 | (5) | 0 | (34) |
| | | | | | |
Total revenues and other income | 28,926 | 13,661 | 95,171 | 118 | (38,612) | 99,264 |
| | | | | | |
Purchases [net of inventory variation] | (0) | (2) | (86,689) | 0 | 38,711 | (47,980) |
Operating and SG&A expenses | (4,034) | (3,654) | (5,287) | (161) | 321 | (12,815) |
Depreciation, amortisation and net impairment losses | (6,301) | (8,885) | (583) | (156) | 0 | (15,925) |
Exploration expenses | (838) | (3,824) | (4) | 0 | 0 | (4,666) |
| | | | | | |
Net operating income | 17,753 | (2,703) | 2,608 | (199) | 420 | 17,878 |
| | | | | | |
Additions to PP&E, intangibles and equity accounted investments | 8,817 | 9,750 | 1,225 | 132 | 0 | 19,924 |
| | | | | | |
Balance sheet information | | | | | | |
Equity accounted investments | 32 | 640 | 434 | 20 | 0 | 1,127 |
Non-current segment assets | 35,243 | 44,912 | 6,234 | 688 | 0 | 87,077 |
Non-current assets, not allocated to segments | | | | | | 10,226 |
| | | | | | |
Total non-current assets | | | | | | 98,430 |
See note 4 Acquisitions and dispositionsfor information on transactions that affect the different segments.
See note 1110 Property, plant and equipment for information on impairment losses that affected the different segments.
See note 1211 Intangible assets for information on impairment losses that affected primarily the DPI segment.
See note 19 Pensions for information on financial results from the change in the company’s pension plan in Norway.different segments.
See note 23 Other commitments, contingent liabilities and contingent assetsfor information on contingencies that have influenced the DPI and MPR segments.
Revenues by geographical areas
Statoil has business operations in more than 30 countries. When attributing Revenuesrevenues third party and Otherother income to the country of the legal entity executing the sale, Norway constitutes 75%78% and the USA constitutes 15%14%.
Statoil, Annual Report on Form 20-F 20142016 159147
Non-current assets by country | | |
| At 31 December | At 31 December |
(in NOK billion) | 2014 | 2013 | 2012 | |
(in USD million) | | 2016 | 2015 | 2014 |
| | | | |
Norway | 289.6 | 269.6 | 258.7 | 31,484 | 31,487 | 38,966 |
USA | 182.9 | 159.2 | 134.6 | 18,223 | 20,531 | 24,605 |
Brazil | | 5,308 | 3,474 | 3,974 |
Angola | 51.3 | 45.9 | 42.5 | 3,884 | 5,350 | 6,903 |
Brazil | 29.5 | 24.5 | 23.2 | |
Azerbaijan | 23.6 | 19.0 | 16.7 | |
UK | 19.7 | 13.6 | 11.1 | 3,108 | 2,882 | 2,650 |
Canada | 17.6 | 19.9 | 17.2 | 1,494 | 2,270 | 2,366 |
Algeria | 11.8 | 9.0 | 8.7 | 1,344 | 1,435 | 1,593 |
Azerbaijan | | 1,326 | 1,416 | 3,181 |
Other countries | 29.5 | 25.6 | 22.3 | 4,873 | 3,436 | 3,965 |
| | |
Total non-current assets* | 655.6 | 586.3 | 535.0 | |
Total non-current assets1) | | 71,043 | 72,282 | 88,204 |
*
1)Excluding deferred tax assets, pension assets and non-current financial assets.
Revenues by product type | Revenues by product type | Revenues by product type |
| Full year | |
| 2014 | 2013 | 2012 | |
(in NOK billion) | | (restated) | |
(in USD million) | | 2016 | 2015 | 2014 |
| | | | | | |
Crude oil | 324.6 | 321.5 | 367.2 | 24,307 | 27,806 | 51,803 |
Natural gas | | 9,202 | 12,390 | 15,732 |
Refined products | 104.8 | 118.9 | 140.9 | 8,142 | 10,761 | 16,782 |
Natural gas | 99.3 | 110.4 | 114.5 | |
Natural gas liquids | 59.5 | 64.5 | 65.7 | 4,036 | 5,482 | 9,506 |
Other | 18.6 | 1.3 | 12.2 | 1 | 1,461 | 2,885 |
| | |
Total revenues | 606.8 | 616.6 | 700.5 | 45,688 | 57,900 | 96,708 |
4 Acquisitions and dispositionsdisposals
2016
Acquisition of shares in Lundin Petroleum AB (Lundin) and sale of interests in the Edvard Grieg field
In January 2016 Statoil acquired 11.93% of the issued share capital and votes in Lundin Petroleum AB for a total purchase price of SEK 4.6 billion (USD 541 million). The shares were accounted for as a non-current financial investment at fair value with changes in fair value presented in the line item net gains (losses) from available for sale financial assets in the Consolidated statement of comprehensive income up until the transaction in June 2016.
In June 2016 Statoil closed an agreement with Lundin to divest its entire 15% interest in the Edvard Grieg field, a 9% interest in the Edvard Grieg Oil pipeline and a 6% interest in the Utsira High Gas pipeline for an increased ownership share in Lundin. In addition to the divested interests, a cash consideration of SEK 544 million (USD 64 million) was paid to Lundin. Following the completion of the transaction Statoil owns 68.4 million shares of Lundin, corresponding to 20.1% of the outstanding shares and votes. Statoil recognised a total net gain of USD 120 million related to the divestment presented in the line item other income in the Consolidated statement of income. In the segment reporting, the gain was recognised in the Development and Production Norway (DPN) segment (USD 114 million) and in the Marketing, Midstream and Processing (MMP) segment (USD 5 million). The transaction was tax exempt under the Norwegian petroleum tax legislation.
Following the increase in ownership interest on 30 June 2016, Statoil obtained significant influence over Lundin, and accounted for the investment as an associate under the equity method. Statoil performed a purchase price allocation to determine the net identifiable assets and liabilities of Lundin. Excess values were allocated mainly to Lundin`s exploration and production licences on the Norwegian continental shelf. The investment in Lundin was included in the Consolidated balance sheet within line item equity accounted investments with a book value of USD 1,199 million as per 30 June 2016. The Lundin investment is reported as part of the DPN segment. For summarized financial information relating investment in Lundin Petroleum AB, see note 12 Associated Companies.
Following the change in accounting classification, Statoil recognised a gain of USD 127 million representing the cumulative gain on its initial 11.93% shareholding being reclassified from the line item net gains (losses) from available for sale financial assets in the Consolidated statement of comprehensive income, to the net financial items line item in the Consolidated statement of income.
148Statoil, Annual Report on Form 20-F 2016
Sale of interest in Marcellus operated onshore play
In July 2016 Statoil closed an agreement to divest its operated properties in the US state of West Virginia to EQT Corporation for USD 407 million in cash. The transaction was reported as part of Development and Production International (DPI) segment and had an immaterial effect on the Consolidated statement of income recognized in the third quarter of 2016.
Acquisition of operated interest in Brazil
In November 2016 Statoil closed an agreement with Petróleo Brasileiro S.A. (“Petrobras”) to acquire a 66% operated interest in the Brazilian offshore licence BM-S-8 in the Santos basin for the maximum cash consideration of USD 2,500 million. A cash consideration of USD 1,250 million was paid on the closing date. The payment of the remaining consideration is subject to certain conditions being met, and was reflected at fair value at the transaction date. The value of the acquired exploration assets has been recognised in the DPI segment, resulting in an increase in intangible assets of USD 2,271 million.
Sale of interest Kai Kos Dehseh
In December 2016 Statoil signed an agreement with Athabasca Oil Corporation to divest the 100% owned Kai Kos Dehseh (KKD) oil sands projects covering the producing Leismer plant and the undeveloped Corner project, along with a number of midstream contracts associated with Leismer’s production. The total consideration consists of a cash consideration of CAD 435 million (USD 323 million), 100 million common shares in Athabasca Oil Corporation (slightly under 20% ownership share) and a series of contingent payments, capped at CAD 250 million (USD 186 million), based on development of oil price and production over the next four years. Both the shares and the contingent consideration will be measured at fair value on the closing date. As of 31 December 2016 the KKD related assets and associated liabilities were presented as held for sale in the Consolidated balance sheet. Upon entering into the agreement, Statoil impaired the assets by USD 412 million. This impairment is partly reflected asdepreciation, amortisation and net impairment lossesand partly as exploration expense in the Consolidated statement of income. In addition, as a consequence of the transaction, a separate onerous contract provision of USD 50 million, mainly related to vacant office spaces, has been recognised as selling, general and administration expenses. Accumulated foreign exchange losses, currently recognised in other comprehensive income, will be reflected in the Consolidated Statement of Income at the closing date. The transaction was closed 31 January 2017, and will be reflected in the DPI segment in the first quarter 2017.
2015
Sale of interests in the Marcellus onshore play
In January 2015 Statoil reduced its average working interest in the non-operated southern Marcellus onshore play from 29% to 23% through a divestment to Southwestern Energy. Proceeds from the sale were USD 365 million, recognized in the DPI segment with no gain.
Sale of interests in the Shah Deniz project and the South Caucasus Pipeline
In April 2015 Statoil sold its remaining 15.5% interest in the Shah Deniz project and the South Caucasus Pipeline to Petronas with a total gain of USD 1,182 million, recognised in the DPI and the MMP segments. Total proceeds from the sale were USD 2,688 million.
Sale of buildings
In 2015 Statoil sold the shares in Forusbeen 50 AS, Strandveien 4 AS and Arkitekt Ebbelsvei 10 AS with a gain of USD 211 million, recognised in the Other segment. Proceeds from the sale were USD 486 million. At the same time Statoil entered into 15 year operating lease agreements for the buildings.
Sale of interests in the Trans Adriatic Pipeline AG
In December 2015 Statoil sold its 20% interest in Trans Adriatic Pipeline AG to Snam SpA, with a gain of USD 139 million, recognised in the MMP segment. Total proceeds from the sale were USD 227 million.
Sale of interests in the Gudrun field and acquisition of interests in Eagle Ford
In December 2015 Statoil sold a 15% interest in the Gudrun field on the Norwegian continental shelf (NCS) to Repsol, recognizing a total gain of USD 142 million in the DPN segment. Proceeds from the sale were USD 216 million. Simultaneously Statoil acquired an additional 13% interest in the Eagle Ford formation with the same party. The acquisition was accounted for as a business combination using the acquisition method in the DPI and MMP segments with the fair value of net identifiable assets of USD 277 million and USD 121 million, respectively as of 30 December 2015. No goodwill was recognised.
2014
Sale of interests in the Shah Deniz project and the South Caucasus Pipeline
In March 2014 Statoil closed an agreement with BP and in May 2014 Statoil closed an agreement with SOCAR, both entered into in December 2013, to divestsold a 3.33% working interest and a 6.67% working interest, respectively, in the Shah Deniz project and the South Caucasus Pipeline. Statoil recognised a total gain of NOK 5.4 billion, presented in the line item Other income in the Consolidated statement of income. In the segment reporting, the gain has been presented in the Development and Production International (DPI) segment and the Marketing, Processing and Renewable Energy segment with NOK 5.2 billion and NOK 0.2 billion, respectively. The part of the transaction recognised in the DPI segment was tax exempt under the rules in Norway and Azerbaijan. Proceeds from the sale were NOK 8.2 billion.
In October 2014 Statoil entered into an agreement with Petronas to sell its remaining 15.5% interestinterests, in the Shah Deniz project and the South Caucasus Pipeline, forto BP and SOCAR respectively, with a cash considerationtotal gain of NOK 16.7 billion (USD 2.25 billion) as of the economic date 1 January 2014. The transaction will be recognisedUSD 942 million, presented in the DPI segment and is expected to be closed in the first half of 2015.MMP segments. Proceeds from the sale were USD 1,383 million.
Kai Kos Dehseh oil sands swap agreement
In May 2014 Statoil and its partner PTTEP closed an agreement to swapswapped the two parties' respective interests in the Kai Kos Dehseh oil sands project in Alberta, Canada. Statoil paid a balancing cash consideration of NOK 2.5 billion and assumed a net liability of NOK 0.3 billion. Subsequent to the closing, Statoil continues as 100% owner of the Leismer and Corner projects, while PTTEP owns 100% of the Thornbury, Hangingstone and South Leismer areas.projects. The transaction has been recognised in the DPI segment resulting in an increase in Property,property, plant and equipment of NOK 4.6 billion,USD 769 million, including a transfer from intangibleIntangible assets of NOK 1.8 billion,USD 301 million, and with no impact on the Consolidated statement of income.
Agreement to sell interests in the Marcellus onshore play
In December 2014 Statoil entered into an agreement to sell a working interest in the non-operated southern Marcellus onshore asset to Southwestern Energy for a cash consideration of NOK 2.9 billion (USD 0.4 billion). Through the transaction Statoil will reduce its ownership share from 29% to 23%. Subsequent to year end 2014, the transaction has been closed and it will be recognised in the DPI segment in the first quarter of 2015.
Sale of interests in licences on the Norwegian continental shelf
In December 2014 Statoil closed an agreement with Wintershall to sell certain ownership interests in licences on the Norwegian continental shelf (NCS). A gain of NOK 5.9 billion has been recognised in the Development and Production Norway (DPN) segment. The gain has been presented in the line item
160Statoil, Annual Report on Form 20-F 2014
Other income in the Consolidated statement of income. The transaction was tax exempt under the rules in the Norwegian petroleum tax system and the gain included a release of related deferred tax liabilities. Proceeds from the sale were NOK 8.7 billion (USD 1.25 billion).
2013
Sale of interests in exploration and production licences on the Norwegian continental shelf to Wintershall
In July 2013 a sales transaction with Wintershall, entered into in October 2012, forsold certain ownership interests in licences on the NCS was closed. Statoil recognisedto Wintershall with a gain of NOK 6.4 billion. The gain has been presented in the line item Other incomein the Consolidated statement of income. In the segment reporting, the gain has been presentedUSD 861 million, recognised in the DPN segment in Revenues third party and Other income. The transaction was tax exempt under the rules in the Norwegian petroleum tax system.segment. Proceeds from the sale were NOK 4.7 billion.USD 1,250 million.
Sale of interests in exploration and production licences on the Norwegian continental shelf and the United Kingdom continental shelf to OMV
In October 2013 a sales transaction with OMV, entered into in August 2013, to sell certain ownership interests in licences on the NCS and United Kingdom continental shelf was closed. Statoil recognised a gain of NOK 10.1 billion. The gain has been presented in the line item Other incomein the Consolidated statement of income. In the segment reporting, the gain has been presented in the DPN segment and in the DPI segment in Revenues third party and Other income with NOK 6.6 billion and NOK 3.5 billion, respectively. The part of the transaction covering assets on the NCS was tax exempt under the rules in the Norwegian petroleum tax system. Proceeds from the sale were NOK 15.9 billion.
2012
Sale of interests in exploration and production licences on the Norwegian continental shelf
In April 2012 Statoil closed an agreement with Centrica, entered into in November 2011, to sell interests in certain licences on the NCS for a total consideration of NOK 8.6 billion. The consideration included a cash payment of NOK 7.1 billion and a contingent element relating to production in a four year period, capped at NOK 0.6 billion. A gain of NOK 7.5 billion was recognised in the DPN segment in the second quarter 2012 and presented as Revenues third party and Other income. The net book value of the assets taken over by Centrica was NOK 2.0 billion. The transaction was tax exempt under the rules in the Norwegian petroleum tax system and the gain included a release of deferred tax liabilities of NOK 0.9 billion related to the transaction.
Divestment of shares in Statoil Fuel & Retail ASA
On 19 June 2012 Statoil ASA sold its 54% shareholding in Statoil Fuel & Retail ASA (SFR) to Alimentation Couche-Tard for a cash consideration of NOK 8.3 billion. Until the transaction date SFR was fully consolidated in the Statoil group with a 46% non-controlling interest. Statoil recognised a gain of NOK 5.8 billion on the transaction, presented as Other incomein the Consolidated financial statements. The gain was tax exempt and presented in the Fuel and Retail segment. The net book value of the assets derecognised as part of the divestment was NOK 7.5 billion.
Acquisition of mineral right leases in the Marcellus shale formation in the United States
In December 2012 Statoil closed an agreement to acquire mineral right leases covering 70,000 net acres in the Marcellus shale area in the northeastern part of the United States. Statoil became the operator of the licences and holds a 100% working interest in these mineral right leases. The transaction was accounted for as an asset acquisition within the DPI segment, with a total consideration of NOK 3.3 billion (USD 0.6 billion).
Statoil, Annual Report on Form 20-F 2016149
5 Financial risk management
General information relevant to financial risks
Statoil's business activities naturally expose Statoil to financial risk. Statoil's approach to risk management includes identifying, evaluatingassessing and managing risk
in all activities using a top-downholistic risk approach. Statoil utilises correlations between the most important market risks, such as oil and natural gas prices, refined oil product prices, currencies, and interest rates, to calculate the overall market risk and thereby take into account the natural hedges inherent in Statoil's portfolio. Adding the different market risks without considering these correlations would overestimate Statoil's total market risk. This approach allows Statoil to reduce the number of risk management transactions and thereby reduce transaction costs and avoid sub-optimisation.
An important element in risk management is the use of centralised trading mandates. All major strategic transactions are required to be coordinated
through Statoil's corporate risk committee. Mandates delegated to the trading organisations within crude oil, refined products, natural gas and electricity are
relatively small compared to the total market risk of Statoil.
The corporate risk committee, which is headed by the chief financial officer and includes representatives from the principal business segments, is responsible for defining, developing and reviewing Statoil's risk policies. The chief financial officer, assisted by the committee, is also responsible for overseeing and developing Statoil's Enterprise Risk Management and proposing appropriate measures to adjust risk at the corporate level. The committee meets at least six times per year and regularly reviews risk information relevant to the enterprise Statoil.
Financial risks
Statoil's activities expose Statoil to the following financial risks:
· Market risk (including commodity price risk, currency risk and interest rate risk)
· Liquidity risk
· Credit risk
Market risk
Statoil operates in the worldwide crude oil, refined products, natural gas, and electricity markets and is exposed to market risks including fluctuations in hydrocarbon prices, foreign currency rates, interest rates, and electricity prices that can affect the revenues and costs of operating, investing and financing.
Statoil, Annual Report on Form 20-F 2014161
These risks are managed primarily on a short-term basis with a focus on achieving the highest risk-adjusted returns for Statoil within the given mandate. Long-term exposures are managed at the corporate level, while short-term exposures are managed according to trading strategies and mandates approved by Statoil's corporate risk committee.
In the marketing of commodities Statoil has established guidelines for entering into derivative contracts in order to manage commodity price, foreign currency rate, and interest rate risks. Statoil uses both financial and commodity-based derivatives to manage the risks in revenues, financial items and the present value of future cash flows.
For more information on sensitivity analysis of market risk see note 25 Financial instruments: fair value measurement and sensitivity analysis of market risk. risk.
Commodity price risk
Commodity price risk represents Statoil'sStatoil’s most important short-termlong term commodity risk (oil and natural gas) is related to future market risk.prices asStatoil´s risk policy is to be exposed to both upside and downside price movements. To manage short-term commodity risk, Statoil enters into commodity- based derivative contracts, including futures, options, over-the-counter (OTC) forward contracts, market swaps and contracts for differences related to
crude oil, petroleum products, natural gas and electricity. Statoil’s bilateral gas sales portfolio is exposed to various price indices and uses derivatives to manage the net gas sales exposure towards a diversified combination of long and short dated gas price markers.
Derivatives associated withThe term of crude oil and refined oil products derivatives are usually less than one year, and they are traded mainly on the Inter Continental Exchange (ICE) in London, the New York Mercantile
Exchange (NYMEX), the OTC Brent market, and crude and refined products swap markets. Derivatives associated withThe term of natural gas and electricity derivatives is usually three years or less, and they are mainly OTC physical forwards and options, NASDAQ OMX Oslo forwards and futures traded on the NYMEX and ICE.
The term of crude oil and refined oil products derivatives is usually less than one year, and the term for natural gas and electricity derivatives is usually three years or less. For more detailed information about Statoil's commodity based derivative financial instruments, see note 25 Financial instruments: fair value measurement and sensitivity analysis of market risk.
Currency risk
Statoil's operating results and cash flows are affected by foreign currency fluctuations and the most significant currency is Norwegian Krone (NOK) against United States Dollar (USD). Statoil manages its currency risk from operating activities with USD as the base currency. Foreign exchange risk is managed at corporate level in accordance with established policies and mandates.
Statoil's cash flows from operating activities deriving from oil and gas sales, operating expenses and capital expenditures are mainly in USD, but taxes, and
dividends to shareholders on the Oslo Børs, a share of our operating expenses and capital expenditures are mainly in NOK. Accordingly, Statoil's currency management is primarily linked to mitigate currency risk related to tax and dividend payments in
NOK. This means that Statoil regularly purchases substantial NOK, amountsprimarily spot, but also on a forward basis using conventional derivative instruments.
Interest rate risk
Bonds are normally issued at fixed rates in a variety of local currencies (among others USD, EuroEUR and Great Britain Pound)GBP). Bonds may beare normally converted to floating USD bonds by using interest rate and currency swaps. Statoil manages its interest rates exposure on its bond debt based on risk and reward considerations from an enterprise risk management perspective. This means that the fix/fixed/floating mix on interest rate exposure may vary from time to time. For more detailed information about Statoil's long-term debt portfolio see note 18 Finance debt. debt.
Liquidity risk
Liquidity risk is the risk that Statoil will not be able to meet obligations of financial liabilities when they become due. The purpose of liquidity management is
to make certainensure that Statoil has sufficient funds available at all times to cover its financial obligations.
Statoil manages liquidity and funding at the corporate level, ensuring adequate liquidity to cover Statoil's operational requirements. Statoil has a high focus
and attention on credit and liquidity risk. In order to secure necessary financial flexibility, which includes meeting the financial obligations, Statoil maintains a
conservative liquidity management policy. To identify future long-term financing needs, Statoil carries out three-year cash forecasts at least monthly. Overall the liquidity is very solid.
The main cash outflows are the quarterly dividend payments and Norwegian petroleum tax payments paid six times per year. If the monthly cash flow forecast showsforecasts indicate that the liquid assets one month after tax and dividend payments will fall below the defined policy level,target levels, new long-term funding will be considered.
150Statoil, Annual Report on Form 20-F 2016
Short-term funding needs will normally be covered by the USD 4.05.0 billion US Commercial Papers Programme (CP) which is backed by a revolving credit
facility of USD 3.05.0 billion, supported by 2021 core banks, maturing in 2017. 2021. The facility supports secure access to funding, supported by the best available
short-term rating. ItAs at 31 December 2016 it has not been drawn.
Statoil raises debt in all major capital markets (USA, Europe and Asia) for long-term funding purposes. The policy is to have a smooth maturity profile with
repayments not exceeding five percent of capital employed in any year for the nearest five years. Statoil's non-current financial liability hasliabilities have a weighted
average maturity of approximately nine years.years.
For more information about Statoil's non-current financial liabilities see note 18 Finance debt. debt.
162Statoil, Annual Report on Form 20-F 2014
The table below shows a maturity profile, based on undiscounted contractual cash flows, for Statoil's financial liabilities.
| At 31 December | At 31 December |
(in NOK billion) | 2014 | 2013 | |
(in USD million) | | 2016 | 2015 |
| | | |
Due within 1 year | 131.4 | 103.6 | 12,766 | 11,909 |
Due between 1 and 2 years | 43.3 | 30.5 | 4,913 | 8,361 |
Due between 3 and 4 years | 81.3 | 41.7 | 9,891 | 9,861 |
Due between 5 and 10 years | 90.5 | 71.0 | 10,884 | 10,645 |
Due after 10 years | 84.3 | 94.4 | 13,278 | 13,113 |
| | | |
Total specified | 430.8 | 341.2 | 51,732 | 53,889 |
Credit risk
Credit risk is the risk that Statoil's customerscustomers or counterparties will cause Statoil financial loss by failing to honour their obligations. Credit risk arises from credit exposures with customer accounts receivables as well as from financial investments, derivative financial instruments and deposits with financial institutions.
Key elements of the credit risk management approach include:
·A global credit risk policy
·Credit mandates
·An internal credit rating process
·Credit risk mitigation tools
·A continuous monitoring and managing of credit exposures
Prior to entering into transactions with new counterparties, Statoil's credit policy requires all counterparties to be formally identified and approved. In addition, all sales, trading and financial counterparties are assigned internal credit ratings as well as exposure limits. Once established, all counterparties are re-assessed regularlyThe internal credit ratings reflect Statoil's assessment of the counterparties' credit risk and continuously monitored. Counterparty risk assessments are based on a quantitative and qualitative analysis of recent financial statements and other relevant business information. In addition, Statoil evaluates any past payment performance, the counterparties' size and business diversification, and the inherent industry risk. The internal credit ratings reflect Statoil's assessment of the counterparties' credit risk. Exposure limits are determined based on assigned internal credit ratings combined with other factors, such as expected transactioninformation including general market and industry characteristics. Credit mandates define acceptable credit risk thresholds andinformation. All counterparties are endorsed by management and regularly reviewed with regard to changes in market conditions.re-assessed regularly.
Statoil uses risk mitigation tools to reduce or control credit risk both on a counterparty and portfolio level. The main tools include bank and parental guarantees, prepayments and cash collateral. For bank guarantees, only investment grade international banks are accepted as counterparties.
Statoil has pre-defined limits for the absolute credit risk level allowed at any given time on Statoil's portfolio level as well as maximum credit exposures for individual counterparties. Statoil monitors the portfolio on a regular basis and individual exposures against limits on a daily basis. The total credit exposure portfolio of Statoil is geographically diversified among a number of counterparties within the oil and energy sector, as well as larger oil and gas consumers and financial counterparties. The majority of Statoil's credit exposure is with investment grade counterparties.
Statoil, Annual Report on Form 20-F 2016151
The following table contains the carrying amount of Statoil's financial receivables and derivative financial instruments that are neither past due nor impaired split by Statoil's assessment of the counterparty's credit risk. Trade and other receivables include 4% overdue receivables for 30 days and more. The overdue receivables are mainly joint venture receivables pending the settlement of disputed working interest items payable from Statoil’s working interest partners within its US unconventional activities. Provisions have been made for expected losses.Only non-exchange traded instruments are included in derivative financial instruments.
(in NOK billion) | Non-current financial receivables | Trade and other receivables | Non-current derivative financial instruments | Current derivative financial instruments | |
(in USD million) | | Non-current financial receivables | Trade and other receivables | Non-current derivative financial instruments | Current derivative financial instruments |
| | | | |
At 31 December 2014 | | | |
At 31 December 2016 | | | |
Investment grade, rated A or above | 0.0 | 20.1 | 15.2 | 2.4 | 234 | 1,682 | 754 | 412 |
Other investment grade | 0.0 | 36.5 | 11.8 | 2.7 | 264 | 4,090 | 1,064 | 75 |
Non-investment grade or not rated | 2.7 | 17.2 | 2.9 | 0.2 | 210 | 1,302 | 0 | 4 |
| | | | |
Total financial asset | 2.7 | 73.7 | 29.9 | 5.3 | 707 | 7,074 | 1,819 | 491 |
| | | | |
At 31 December 2013 | | | |
At 31 December 2015 | | | |
Investment grade, rated A or above | 0.0 | 17.2 | 12.5 | 1.2 | 0 | 1,653 | 1,346 | 230 |
Other investment grade | 0.8 | 45.8 | 9.3 | 1.6 | 377 | 3,126 | 1,350 | 278 |
Non-investment grade or not rated | 2.8 | 12.6 | 0.3 | 0.1 | 277 | 1,055 | 0 | 34 |
| | | | |
Total financial asset | 3.5 | 75.5 | 22.1 | 2.9 | 655 | 5,834 | 2,697 | 542 |
At 31 December 2014, NOK 12.9 billion2016, USD 571 million of cash was held as collateral to mitigate a portion of Statoil's credit exposure. At 31 December 2013 NOK 7.4 billion2015, USD 1,161 million was held as collateral. The collateral cash is received as a security to mitigate credit exposure related to positive fair values on interest rate swaps,
Statoil, Annual Report on Form 20-F 2014163
cross currency swaps and foreign exchange swaps. Cash is called as collateral in accordance with the master agreements with the different counterparties when the positive fair values for the different swap agreements are above an agreed threshold.
Under the terms of various master netting agreements for derivative financial instruments as of 31 December 2014, NOK 5.2 billion2016, USD 817 million presented as liabilities do not meet the criteria for offsetting. At 31 December 2013, NOK 2.0 billion2015, USD 794 million was not offset. The collateral received and the amounts not offset from derivative financial instrument liabilities, reducesreduce the credit exposure in the derivative financial instruments presented in the table above as they will offset each other in a potential default situation for the counterparty. Trade and other receivables subject to similar master netting agreements USD 364 million have been offset as of 31 December 2016, and respectively USD 341 million as of 31 December 2015.
6 Remuneration
| Full year | Full year |
(in NOK billion, except average number of employees) | 2014 | 2013 | 2012 | |
(in USD million, except average number of employees) | | 2016 | 2015 | 2014 |
| | |
Salaries* | 23.3 | 23.5 | 22.7 | |
Salaries1) | | 2,576 | 2,791 | 3,698 |
Pension costs | 3.4 | 4.6 | (0.6) | 650 | 846 | 544 |
Payroll tax | 3.5 | 3.4 | 3.3 | 394 | 419 | 548 |
Other compensations and social costs | 2.4 | 2.5 | 2.8 | 276 | 312 | 376 |
| | |
Total payroll costs | 32.5 | 34.0 | 28.2 | 3,895 | 4,369 | 5,166 |
| | |
Average number of employees** | 23,300 | 23,600 | 27,700 | |
Average number of employees2) | | 21,300 | 22,300 | 23,300 |
* 1)Salaries include bonuses, severance packages and expatriate costs in addition to base pay.
** 2)Part time employees amount to 2%3%, 3% and 3%2% for the years 2016, 2015 and 2014 2013 and 2012 respectively.
Total payroll expenses are accumulated in cost-pools and partly charged to partners of Statoil operated licences on an hours incurred basis.
The reduction in pension cost in 2014 was mainly caused by a plan amendment gain recognised152Statoil, Annual Report on the basis of Statoil’s change in the pension plan, partly offset by early retirement benefits offered to a defined group of employees above the age of 58 years. The negative pension cost in 2012 was primarily caused by a curtailment gain recognised on the basis of Statoil's discontinuance of the supplementary (gratuity) part of the early retirement scheme. For further information, see note 19 Form 20-F 2016Pensions.
Compensation to the board of directors (BoD) and the corporate executive committee (CEC)
Remuneration to members of the BoD and the CEC during the year was as follows:
| Full year | Full year |
(in NOK million)* | 2014 | 2013 | 2012 | |
(in USD thousand)1) | | 2016 | 2015 | 2014 |
| | |
Current employee benefits | 73.2 | 74.5 | 74.8 | 9,270 | 11,436 | 11,624 |
Post-employment benefits | 13.0 | 13.6 | 574 | 799 | 2,064 |
Other non-current benefits | 0.0 | 0.1 | 19 | 15 | 0 |
Share based payment benefits | 1.1 | 1.2 | |
Share-based payment benefits | | 102 | 167 | 175 |
| | |
Total | 87.3 | 88.7 | 89.8 | 9,966 | 12,418 | 13,863 |
* 1)All figures in the table are presented on accrual basis, in compliance with the statement presented by The Financial Supervisory Authority of Norway in December 2014. This is a change in reporting of remuneration compared to previous years.basis.
At 31 December 2014, 20132016, 2015 and 20122014 there are no loans to the members of the BoD or the CEC.
Share-based compensation
Statoil's share saving plan provides employees with the opportunity to purchase Statoil shares through monthly salary deductions and a contribution by Statoil. If the shares are kept for two full calendar years of continued employment following the year of purchase, the employees will be allocated one bonus share for each one they have purchased.
Estimated compensation expense including the contribution by Statoil for purchased shares, amounts vested for bonus shares granted and related social security tax was NOK 0.6 billion, NOK 0.6 billionUSD 61 million, USD 77 million and NOK 0.5 billionUSD 94 million related to the 2014, 20132016, 2015 and 20122014 programs, respectively. For the 20152017 program (granted in 2014)2016) the estimated compensation expense is NOK 0.6 billion.USD 62 million. At 31 December 20142016 the amount of compensation cost yet to be expensed throughout the vesting period is NOK 1.2 billion.USD 138 million.
164Statoil, Annual Report on Form 20-F 2014
7 Other expenses
Auditor's remuneration | Auditor's remuneration | Auditor's remuneration |
| Full year | Full year |
(in NOK million, excluding VAT) | 2014 | 2013 | 2012 | |
(in USD million, excluding VAT) | | 2016 | 2015 | 2014 |
| | | | |
Audit fee | 45 | 38 | 44 | 6.5 | 6.1 | 7.1 |
Audit related fee | 8 | 9 | 1.0 | 1.7 | 1.3 |
Tax fee | 0 | 2 | 0.1 | 0.0 |
Other service fee | 0 | 2 | 0.0 |
| | |
Total | 53 | 46 | 57 | 7.5 | 7.9 | 8.4 |
| | |
In addition to the figures in the table above, the audit fees and audit related fees related to Statoil operated licenseslicences amount to NOK 6USD 0.8 million, NOK 6USD 0.9 million and NOK 7USD 1.0 million for 2014, 20132016, 2015 and 2012,2014, respectively.
Research and development expenditures
Research and development (R&D) expenditures were NOK 3.0 billion, NOK 3.2 billionUSD 298 million, USD 344 million and NOK 2.8 billionUSD 476 million in 2014, 20132016, 2015 and 2012,2014, respectively. R&D expenditures are partly financed by partners of Statoil operated licences.licenses. Statoil's share of the expenditures has been recognised as expense in the Consolidated statement of income.
Statoil, Annual Report on Form 20-F 2016153
8 Financial items
| Full year | Full year |
(in NOK billion) | 2014 | 2013 | 2012 | |
(in USD million) | | 2016 | 2015 | 2014 |
| | | | |
Foreign exchange gains (losses) derivative financial instruments | (1.5) | (4.1) | 2.1 | 353 | 548 | (198) |
Other foreign exchange gains (losses) | (0.7) | (4.5) | (1.3) | (473) | (793) | (109) |
| | |
Net foreign exchange gains (losses) | (2.2) | (8.6) | 0.8 | (120) | (245) | (307) |
| | |
Dividends received | 0.3 | 0.1 | 46 | 42 |
Gains (losses) financial investments | 1.1 | 1.9 | 0.6 | (0) | 47 | 176 |
Interest income financial investments | 0.7 | 0.6 | 63 | 76 | 111 |
Interest income non-current financial receivables | 0.1 | 22 | 23 | 19 |
Interest income current financial assets and other financial items | 1.8 | 0.9 | 0.4 | 305 | 208 | 281 |
| | |
Interest income and other financial items | 4.0 | 3.6 | 1.8 | 436 | 396 | 628 |
| | |
Gains (losses) derivative financial instruments | | 470 | (491) | 904 |
| | |
Interest expense bonds and bank loans and net interest on related derivatives | (4.3) | (1.5) | (2.5) | (830) | (707) | (684) |
Interest expense finance lease liabilities | (0.3) | (0.2) | (0.5) | (26) | (27) | (47) |
Capitalised borrowing costs | 1.6 | 1.1 | 1.2 | 355 | 392 | 250 |
Accretion expense asset retirement obligations | (3.7) | (3.2) | (3.0) | (420) | (481) | (597) |
Gains (losses) derivative financial instruments | 5.8 | (7.4) | 3.0 | |
Interest expense current financial liabilities and other finance expense | (0.8) | (0.7) | (122) | (147) | (127) |
| | |
Interest and other finance expenses | (1.8) | (12.0) | (2.5) | (1,043) | (971) | (1,205) |
| | |
Net financial items | (0.0) | (17.0) | 0.1 | (258) | (1,311) | 20 |
Statoil's main financial items relate to assets and liabilities categorised in the held for trading category and the amortised cost category. For more information about financial instruments by category see note 25 Financial instruments: fair value measurement and sensitivity analysis of market risk.
The line item Interestinterest expense bonds and bank loans and net interest on related derivatives primarily includes interest expenses of NOK 6.8 billion, NOK 5.4 billionUSD 1,018 million, USD 1,041 million and NOK 5.0 billionUSD 1,079 million from the financial liabilities at amortised cost category,category. This was partly offset by net interest on related derivatives from the held for trading category, NOK 2.5 billion, NOK 3.9 billionUSD 188 million, USD 334 million and NOK 2.5 billionUSD 395 million for 2016, 2015 and 2014, 2013 and 2012, respectively. respectively.
The line item Gainsgains (losses) derivative financial instruments primarily includes fair value gain from the held for trading category of NOK 5.7 billion,USD 454 million, a loss of NOK 7.6 billionUSD 492 million and a gain of NOK 2.9 billionUSD 897 million for 2014, 20132016, 2015 and 2012,2014, respectively.
Statoil, Annual Report on Form 20-F 2014165
The line item Foreign exchange gains (losses) derivative financial instruments include fair value changes of currency derivatives related to liquidity and currency risk.
The line item foreign exchange gains (losses) includes a net foreign exchange loss of NOK 13.4 billion,USD 205 million, a loss of NOK 4.3 billionUSD 1,208 million and a gainloss of NOK 3,4 billionUSD 2,120 million from the held for trading category for 2016, 2015 and 2014, 2013 and 2012, respectively.
154Statoil, Annual Report on Form 20-F 2016
9 Income taxes
Significant components of income tax expense |
| Full year |
(in NOK billion) | 2014 | 2013 | 2012 |
| | | |
Current income tax expense in respect of current year | 89.6 | 111.6 | 138.1 |
Prior period adjustments | (1.9) | 1.3 | (0.5) |
| | | |
Current income tax expense | 87.6 | 112.9 | 137.6 |
| | | |
Origination and reversal of temporary differences | (0.6) | (13.4) | 0.3 |
Recognition of previously unrecognised deferred tax assets | 0.0 | 0.0 | (3.0) |
Change in tax regulations | 0.1 | 0.1 | 2.3 |
Prior period adjustments | 0.3 | (0.4) | 0.0 |
| | | |
Deferred tax expense | (0.2) | (13.7) | (0.4) |
| | | |
Income tax expense | 87.4 | 99.2 | 137.2 |
Reconciliation of nominal statutory tax rate to effective tax rate |
| Full year |
(in NOK billion) | 2014 | 2013 | 2012 |
| | | |
Income before tax | 109.4 | 138.4 | 206.7 |
| | | |
Calculated income tax at statutory rate * | 31.2 | 42.4 | 62.9 |
Calculated Norwegian Petroleum tax ** | 62.8 | 71.7 | 87.4 |
Tax effect uplift ** | (6.4) | (5.2) | (5.3) |
Tax effect of permanent differences | (9.1) | (16.1) | (6.3) |
Recognition of previously unrecognised deferred tax assets | 0.0 | 0.0 | (3.0) |
Change in valuation allowance | 8.7 | 3.9 | 0.3 |
Change in tax regulations | 0.1 | 0.1 | 2.3 |
Prior period adjustments | (1.7) | 0.9 | (0.5) |
Other items | 1.7 | 1.5 | (0.6) |
| | | |
Income tax expense | 87.4 | 99.2 | 137.2 |
| | | |
Effective tax rate | 79.9 % | 71.7 % | 66.4 % |
Significant components of income tax expense |
| Full year |
(in USD million) | 2016 | 2015 | 2014 |
| | | |
Current income tax expense in respect of current year | (3,869) | (6,488) | (14,299) |
Prior period adjustments | (158) | (91) | 307 |
| | | |
Current income tax expense | (4,027) | (6,579) | (13,993) |
| | | |
Origination and reversal of temporary differences | 1,372 | 1,519 | 29 |
Change in tax regulations | (50) | (90) | (19) |
Prior period adjustments | (20) | (74) | (29) |
| | | |
Deferred tax expense | 1,302 | 1,355 | (19) |
| | | |
Income tax expense | (2,724) | (5,225) | (14,011) |
*During the normal course of its business, Statoil files tax returns in many different tax regimes. There may be differing interpretation of applicable tax laws and regulations regarding some of the matters in the tax returns. In certain cases it may take several years to complete the discussions with the relevant tax authorities or to reach a resolution of the tax positions through litigations. Statoil has provided for probable income tax related assets and liabilities based on best estimates reflecting consistent interpretations of the applicable laws and regulations.
Reconciliation of statutory tax rate to effective tax rate |
| Full year |
(in USD million) | 2016 | 2015 | 2014 |
| | | |
Income before tax | (178) | 55 | 17,898 |
| | | |
Calculated income tax at statutory rate1) | 676 | 1,078 | (5,139) |
Calculated Norwegian Petroleum tax2) | (2,250) | (4,145) | (9,960) |
Tax effect uplift2) | 812 | 847 | 980 |
Tax effect of permanent differences regarding divestments | 153 | 468 | 911 |
Tax effect of permanent differences caused by functional currency different from tax currency | (356) | 719 | 762 |
Tax effect of other permanent differences | (48) | (2) | (298) |
Change in unrecognised deferred tax assets | (1,625) | (3,557) | (1,299) |
Change in tax regulations | (50) | (90) | (19) |
Prior period adjustments | (177) | (165) | 278 |
Other items including currency effects | 141 | (376) | (228) |
| | | |
Income tax expense | (2,724) | (5,225) | (14,011) |
| | | |
Effective tax rate | >(100%) | >100% | 78.3% |
1)The weighted average of statutory tax rates was 28.5 %positive 379.8% in 2014, 30.7 %2016, negative 1,950.2% in 20132015 and 30.4 %positive 28.7% in 2012.2014. The high tax rate in 2016, the negative rate in 2015 and the change in average statutory tax rates from 2015 to 2016 is mainly caused by earnings composition between tax regimes with lower statutory tax rates and tax regimes with higher statutory tax rates. In both years there are positive income in tax regimes with relatively lower tax rates and losses, including impairments and provisions, in tax regimes with relatively higher tax rates. The decrease from 20132014 to 20142015 was principally due to a changemainly caused by losses, impairments and provisions in the geographic mix of income,entities with a lower proportion of income in 2014 arising in jurisdictions subject to relatively higher tax rates, and a decrease in the Norwegianthan average statutory tax rate from 28% to 27%. The increase from 2012 to 2013 was due to changes in the geographic mix of income.rates.
** 2)When computing the petroleum tax of 51%53% (54% from 2017) on income from the Norwegian continental shelf, aan additional tax-free allowance, or uplift, is granted at a rate of 7.5%5.5% per year (5.4% per year from 2017 for new investments) on the basis of the original capitalised cost of offshore production installations. For investments made prior to 5 May 2013. For investments made from 5 May 2013, the rate is 5.5%7.5% per year. Transitional rules apply to investments from 5 May 2013 covered by among others Plans for development and operation (PDOs) or Plans for installation and operation (PIOs) submitted to the Ministry of Oil and Energy prior to 5 May 2013. The uplift is computed on the basis of the original capitalised cost of offshore production installations. The uplift may be deducted from taxable income for a period of four years, starting in the year in which the capital expenditure is incurred. Unused uplift may be carried forward indefinitely. At year end 20142016 and 2013,2015, unrecognised uplift credits amounted to NOK 21.1 billionUSD 2,121 million and NOK 19.2 billion,USD 2,333 million, respectively.
166Statoil, Annual Report on Form 20-F 20142016 155
Deferred tax assets and liabilities comprise | Deferred tax assets and liabilities comprise | Deferred tax assets and liabilities comprise |
(in NOK billion) | Tax losses carried forward | Property, plant and equipment and Intangible assets | ARO | Pensions | Derivatives | Other | Total | |
(in USD million) | | Tax losses carried forward | Property, plant and equipment and Intangible assets | Asset removal obligation | Pensions | Derivatives | Other | Total |
| | | | |
Deferred tax at 31 December 2014 | | | |
Deferred tax at 31 December 2016 | | Deferred tax at 31 December 2016 | | |
Deferred tax assets | 36.7 | 4.6 | 73.3 | 7.0 | 0.2 | 13.4 | 135.3 | 4,283 | 233 | 7,078 | 743 | 138 | 849 | 13,323 |
Deferred tax liabilities | (0.0) | (172.6) | 0.0 | (12.9) | (8.4) | (193.8) | 0 | (16,797) | 0 | (270) | (488) | (17,555) |
| | | | |
Net asset (liability) at 31 December 2014 | 36.7 | (167.9) | 73.3 | 7.0 | (12.7) | 4.9 | (58.6) | |
Net asset (liability) at 31 December 2016 | | 4,283 | (16,564) | 7,078 | 743 | (132) | 361 | (4,231) |
| | | | |
Deferred tax at 31 December 2013 | | | |
Deferred tax at 31 December 2015 | | Deferred tax at 31 December 2015 | | |
Deferred tax assets | 15.5 | 3.8 | 63.8 | 6.4 | 0.0 | 12.2 | 101.7 | 4,743 | 185 | 6,980 | 578 | 7 | 797 | 13,291 |
Deferred tax liabilities | (0.0) | (148.1) | (0.0) | (11.3) | (5.1) | (164.5) | (0) | (16,731) | 0 | (0) | (928) | (1,032) | (18,691) |
| | | | |
Net asset (liability) at 31 December 2013 | 15.5 | (144.3) | 63.8 | 6.4 | (11.3) | 7.1 | (62.8) | |
Net asset (liability) at 31 December 2015 | | 4,743 | (16,545) | 6,980 | 578 | (920) | (235) | (5,399) |
Changes in net deferred tax liability during the year were as follows: | Changes in net deferred tax liability during the year were as follows: | Changes in net deferred tax liability during the year were as follows: |
(in NOK billion) | 2014 | 2013 | 2012 | |
(in USD million) | | 2016 | 2015 | 2014 |
| | |
Net deferred tax liability at 1 January | 62.8 | 77.3 | 76.8 | 5,399 | 7,881 | 10,317 |
Charged (credited) to the Consolidated statement of income | (0.2) | (13.7) | (0.4) | (1,302) | (1,355) | 19 |
Other comprehensive income | (0.9) | (1.5) | 1.7 | (129) | 461 | 56 |
Translation differences and other | (3.0) | 0.7 | (0.8) | 264 | (1,588) | (2,510) |
| | |
Net deferred tax liability at 31 December | 58.6 | 62.8 | 77.3 | 4,231 | 5,399 | 7,881 |
Deferred tax assets and liabilities are offset to the extent that the deferred taxes relate to the same fiscal authority, and there is a legally enforceable right to offset current tax assets against current tax liabilities. After netting deferred tax assets and liabilities by fiscal entity, deferred taxes are presented on the balance sheet as follows:
| At 31 December | At 31 December |
(in NOK billion) | 2014 | 2013 | |
(in USD million) | | 2016 | 2015 |
| | |
Deferred tax assets | 12.9 | 8.2 | 2,195 | 2,022 |
Deferred tax liabilities | 71.5 | 71.0 | 6,427 | 7,421 |
Deferred tax assets are recognised based on the expectation that sufficient taxable income will be available through reversal of taxable temporary differences or future taxable income. At year end 20142016 and 20132015 the deferred tax assets of NOK 12.9 billionUSD 2,195 million and NOK 8.2 billion,USD 2,022 million, respectively, were primarily recognised in Norway, Angola, Brasil and Angola.the UK.
Unrecognised deferred tax assets | Unrecognised deferred tax assets | Unrecognised deferred tax assets |
| At 31 December | At 31 December |
(in NOK billion) | 2014 | 2013 | |
| | 2016 | 2015 |
(in USD million) | | Basis | Tax | Basis | Tax |
| | | | | |
Deductible temporary differences | 3.2 | 0.6 | 3,431 | 1,360 | 2,448 | 1,010 |
Tax losses carried forward | 18.0 | 11.0 | 17,440 | 6,557 | 14,329 | 5,297 |
| | | | | |
Total | | 20,871 | 7,917 | 16,776 | 6,307 |
Approximately 23%9% of the unrecognised carry forward tax losses carry-forwards maycan be carried forward indefinitely. The majority of the remaining part of the unrecognised tax losses expire after 2026.2027. The unrecognised deductible temporary differences do not expire under the current tax legislation. Deferred tax assets have not been recognised in respect of these items because currently there is insufficient evidence to support that future taxable profits will be available to secure utilisation of the benefits.
Statoil, Annual Report on Form 20-F 2014167
10 Earnings per share
The weighted average number of ordinary shares is the basis for computing the basic and diluted earnings per share as disclosed in the Consolidated statement of income. The dilutive effect relates to treasury shares.
| At 31 December |
(in millions) | 2014 | 2013 | 2012 |
| | | |
Weighted average number of ordinary shares | 3,180.0 | 3,180.7 | 3,181.5 |
Weighted average number of ordinary shares, diluted | 3,188.9 | 3,188.9 | 3,190.2 |
| | | |
Earnings per share for income attributable to equity holders of the company: | | | |
Basic (NOK) | 6.89 | 12.53 | 21.66 |
Diluted (NOK) | 6.87 | 12.50 | 21.60 |
11 Property, plant and equipment
(in NOK billion) | Machinery, equipment and transportation equipment, including vessels | Production plants and oil and gas assets | Refining and manufacturing plants | Buildings and land | Assets under development | Total |
| | | | | | |
Cost at 31 December 2013 | 21.1 | 869.9 | 60.2 | 8.4 | 135.5 | 1,095.1 |
Additions and transfers | 1.0 | 108.4 | 2.0 | 0.7 | 23.8 | 135.9 |
Disposals at cost | (0.1) | (8.5) | (1.4) | (0.0) | (8.9) | (18.9) |
Effect of changes in foreign exchange | 4.1 | 67.7 | 3.8 | 1.1 | 14.3 | 91.0 |
| | | | | | |
Cost at 31 December 2014 | 26.1 | 1,037.5 | 64.6 | 10.1 | 164.7 | 1,303.0 |
| | | | | | |
Accumulated depreciation and impairment losses at 31 December 2013 | (15.5) | (540.1) | (44.9) | (3.8) | (3.3) | (607.7) |
Depreciation | (1.2) | (71.0) | (1.8) | (0.3) | (0.0) | (74.4) |
Impairment losses | (0.3) | (16.1) | (1.2) | (0.2) | (7.1) | (24.8) |
Reversal of impairment losses | 0.0 | 0.3 | 1.8 | 0.0 | 0.2 | 2.3 |
Accumulated depreciation and impairment disposed assets | 0.1 | 5.7 | (0.2) | 0.0 | (0.0) | 5.7 |
Effect of changes in foreign exchange | (3.2) | (35.4) | (2.0) | (0.5) | (1.0) | (42.0) |
| | | | | | |
Accumulated depreciation and impairment losses at 31 December 2014 | (20.1) | (656.7) | (48.2) | (4.8) | (11.1) | (740.9) |
| | | | | | |
Carrying amount at 31 December 2014 | 6.0 | 380.8 | 16.4 | 5.3 | 153.6 | 562.1 |
| | | | | | |
Estimated useful lives (years) | 3-20 | * | 15 - 20 | 20 - 33 | | |
168156 Statoil, Annual Report on Form 20-F 20142016
At year end 2016 unrecognised deferred tax assets in the US and Angola represents USD 5,655 million and USD 800 million of the total unrecognised deferred tax assets of USD 7,917 million. Similar amounts for 2015 were USD 4,461 million in the US and USD 643 million in Angola of a total of USD 6,307 million.
10 Property, plant and equipment
(in USD million) | Machinery, equipment and transportation equipment, including vessels | Production plants and oil and gas assets | Refining and manufacturing plants | Buildings and land | Assets under development | Total |
| | | | | | |
Cost at 31 December 2015 | 3,466 | 133,269 | 7,459 | 928 | 20,284 | 165,406 |
Additions and transfers | 62 | 11,960 | 776 | 70 | (2,148) | 10,720 |
Disposals at cost1) | (98) | (1,857) | (48) | (130) | (445) | (2,577) |
Assets reclassified to held for sale (HFS) | (7) | (2,169) | 0 | (12) | (51) | (2,239) |
Effect of changes in foreign exchange | (30) | 1,546 | 75 | 2 | (325) | 1,268 |
| | | | | | |
Cost at 31 December 2016 | 3,394 | 142,750 | 8,262 | 859 | 17,315 | 172,579 |
| | | | | | |
Accumulated depreciation and impairment losses at 31 December 2015 | (2,826) | (90,762) | (5,386) | (468) | (3,958) | (103,400) |
Depreciation | (137) | (9,657) | (411) | (31) | 0 | (10,235) |
Impairment losses | (0) | (1,672) | (240) | (12) | (969) | (2,893) |
Reversal of impairment losses | 0 | 1,186 | 371 | 0 | 35 | 1,592 |
Transfers | 71 | (2,013) | (79) | (0) | 1,789 | (232) |
Accumulated depreciation and impairment disposed assets1) | 91 | 1,231 | 44 | 57 | 14 | 1,437 |
Accumulated depreciation and impairment assets classified as HFS | 6 | 1,757 | 0 | 8 | 22 | 1,794 |
Effect of changes in foreign exchange | 28 | (1,042) | (71) | 1 | (1) | (1,086) |
| | | | | | |
Accumulated depreciation and impairment losses at 31 December 2016 | (2,767) | (100,971) | (5,772) | (446) | (3,068) | (113,023) |
| | | | | | |
Carrying amount at 31 December 2016 | 626 | 41,779 | 2,490 | 413 | 14,247 | 59,556 |
| | | | | | |
Estimated useful lives (years) | 3-20 | UoP2) | 15 - 20 | 20 - 33 | | |
Statoil, Annual Report on Form 20-F 2016157
(in NOK billion) | Machinery, equipment and transportation equipment, including vessels | Production plants and oil and gas assets | Refining and manufacturing plants | Buildings and land | Assets under development | Total | |
(in USD million) | | Machinery, equipment and transportation equipment, including vessels | Production plants and oil and gas assets | Refining and manufacturing plants | Buildings and land | Assets under development | Total |
| | | | | | |
Cost at 31 December 2012 | 18.4 | 816.4 | 56.6 | 7.4 | 99.0 | 997.8 | |
Cost at 31 December 2014 | | 3,508 | 139,578 | 8,691 | 1,358 | 22,162 | 175,297 |
Additions and transfers | 1.6 | 77.0 | 3.0 | 0.8 | 36.7 | 119.0 | 52 | 9,895 | 598 | 78 | 1,292 | 11,914 |
Disposals at cost | (0.5) | (43.7) | (1.1) | (0.1) | (6.0) | (51.4) | (20) | (1,657) | (1,052) | (437) | (1,197) | (4,362) |
Effect of changes in foreign exchange | 1.6 | 20.3 | 1.6 | 0.4 | 5.8 | 29.7 | (74) | (14,547) | (779) | (70) | (1,973) | (17,443) |
| | | | | | | | |
Cost at 31 December 2013 | 21.1 | 869.9 | 60.2 | 8.4 | 135.5 | 1,095.1 | |
Cost at 31 December 2015 | | 3,466 | 133,269 | 7,459 | 928 | 20,284 | 165,406 |
| | | | | | | | |
Accumulated depreciation and impairment losses at 31 December 2012 | (12.7) | (501.2) | (39.9) | (2.9) | (2.0) | (558.7) | |
Accumulated depreciation and impairment losses at 31 December 2014 | | (2,708) | (88,344) | (6,490) | (641) | (1,494) | (99,677) |
Depreciation | (1.3) | (61.6) | (2.1) | (0.3) | (0.0) | (65.3) | (173) | (10,162) | (266) | (48) | 0 | (10,650) |
Impairment losses | (0.9) | (1.1) | (2.7) | (0.5) | (2.0) | (7.2) | |
Impairment losses and transfers | | 0 | (3,419) | (67) | 0 | (2,661) | (6,147) |
Reversal of impairment losses | 0.0 | 0.0 | 0.2 | 0 | 108 | 483 | 6 | 22 | 620 |
Accumulated depreciation and impairment disposed assets | 0.5 | 33.5 | 0.3 | (0.0) | 0.3 | 34.6 | 2 | 830 | 324 | 190 | (0) | 1,347 |
Effect of changes in foreign exchange | (1.1) | (9.7) | (0.5) | (0.1) | 0.2 | (11.3) | 53 | 10,224 | 629 | 25 | 175 | 11,107 |
| | | | | | | | |
Accumulated depreciation and impairment losses at 31 December 2013 | (15.5) | (540.1) | (44.9) | (3.8) | (3.3) | (607.7) | |
Accumulated depreciation and impairment losses at 31 December 2015 | | (2,826) | (90,762) | (5,386) | (468) | (3,958) | (103,400) |
| | | | | | | | |
Carrying amount at 31 December 2013 | 5.6 | 329.8 | 15.2 | 4.6 | 132.2 | 487.4 | |
Carrying amount at 31 December 2015 | | 641 | 42,507 | 2,073 | 460 | 16,326 | 62,006 |
| | | | | | | | |
Estimated useful lives (years) | 3-20 | * | 15 - 20 | 20 - 33 | | 3-20 | UoP 2) | 15 - 20 | 20 - 33 | | |
* 1)Includes USD 445 million related to change in the classification of Statoil’s investment in joint operation (pro-rata line by line consolidation)/full consolidation to joint venture (equity method), mainly related to Dudgeon Offshore Wind Ltd (USD 341 million).
2)Depreciation according to unit of production method (UoP), see note 2 Significant accounting policies.
The carrying amount of assets transferred to Property, plant and equipmentfrom Intangible assetsin 2014 and 2013 amounted to NOK 9.5 billion and NOK 7.0 billion, respectively. In 2013 a redetermination of the Ormen Lange Unit was concluded, the effects of the redetermination on Property, plant and equipment are included in the Additions and transfers line.
Impairments
During 2014, Statoil recognised total net impairment losses of NOK 38.2 billion on Property, plant and equipmentand from Intangible assets.in 2016 and 2015 amounted to USD 692 million and USD 332 million, respectively.
Impairments
(in NOK billion) | Property, plant and equipment | Intangible assets *** | Total |
| | | |
Producing and development assets * | 22.5 | 6.0 | 28.5 |
Goodwill * | 0.0 | 4.2 | 4.2 |
Acquisition costs related to oil and gas prospects ** | 0.0 | 5.5 | 5.5 |
| | | |
Total net impairment losses recognised | 22.5 | 15.7 | 38.2 |
(in USD million) | Property, plant and equipment | Intangible assets3) | Total |
| | | |
At 31 December 2016 | | | |
Producing and development assets1) | 1,301 | 590 | 1,890 |
Acquisition costs related to oil and gas prospects2) | 0 | 403 | 403 |
| | | |
Total net impairment losses recognised | 1,301 | 992 | 2,293 |
| | | |
At 31 December 2015 | | | |
Producing and development assets1) | 5,526 | 1,263 | 6,788 |
Goodwill1) | 0 | 539 | 539 |
Acquisition costs related to oil and gas prospects2) | 0 | 688 | 688 |
| | | |
Total net impairment losses recognised | 5,526 | 2,490 | 8,015 |
* 1)Producing and development assets and goodwill are subject to impairment assessment under IAS 36. The total net impairment losses recognised under IAS 36 in 2016 and 2015 amount to NOK 32.7 billion,USD 1,890 million and USD 7,327 million, respectively, including impairment of acquisition costs - oil and gas prospects (intangible assets).
**2) Acquisition costs related to exploration activities,are subject to impairment assessment under the successful efforts method.method (IFRS 6).
*** 3)See note 1211 Intangible assets.assets.
158Statoil, Annual Report on Form 20-F 2016
In assessing the need for impairment of the carrying amount of a potentially impaired asset, the asset's carrying amount is compared to its recoverable amount. The recoverable amount is the higher of fair value less cost of disposal (FVLCOD) and estimated value in use (VIU).
The base discount rate for VIU calculations is 6.5%6.0% real after tax.tax (2015: 6.5%). The discount rate is derived from Statoil's weighted average cost of capital. A derived pre-tax discount rate would generally be in the range of 8-12%, depending on asset specific characteristics, such as specific tax treatments, cash flow profiles and economic life. For certain assets a pre-tax discount rate could be outside this range, mainly due to special tax elements (for example permanent differences) affecting the pre-tax equivalent. See note 2 Significant accounting policies for further information regarding impairment on property, plant and equipment.
Statoil, Annual Report on Form 20-F 2014169
(in NOK billion) | Impairment method | Carrying amount before impairment | Carrying amount after impairment | Net impairment loss |
| | | | |
Development and Production Norway | VIU | 5.2 | 2.9 | 2.3 |
Development and Production International | VIU | 187.9 | 168.4 | 19.5 |
Marketing, Processing and Renewable Energy | VIU | 8.8 | 7.9 | 0.9 |
| | | | |
Development and Production Norway | FVLCOD | 18.3 | 18.3 | 0.0 |
Development and Production International | FVLCOD | 25.4 | 15.4 | 10.0 |
Marketing, Processing and Renewable Energy | FVLCOD | 0.0 | 0.0 | 0.0 |
| | | | |
Total | | 245.6 | 212.9 | 32.7 |
| | 2016 | 2015 | |
(in USD million) | Impairment method | Carrying amount after impairment 1) | Net impairment loss | Carrying amount after impairment 1) | Net impairment loss | |
| | | | | | |
At 31 December | | | | | | |
Development and Production Norway | VIU | 3,115 | 760 | 1,427 | 454 | |
| FVLCOD | 1,401 | 69 | 2,010 | 620 | |
North America - unconventional | VIU | 3,887 | 945 | 5,733 | 3,119 | |
| FVLCOD | 483 | 412 | 1,240 | 539 | |
North America Conventional offshore Gulf of Mexico | VIU | 4,459 | 141 | 3,699 | 2,210 | |
| FVLCOD | 0 | 0 | 0 | 0 | |
North Africa | VIU | 0 | 104 | 490 | 130 | |
| FVLCOD | 0 | 0 | 0 | 0 | |
Sub - Saharan Africa | VIU | 772 | (137) | 903 | 169 | |
| FVLCOD | 0 | 0 | 0 | 0 | |
Europe and Asia | VIU | 1,124 | (330) | 1,018 | 511 | |
| FVLCOD | 0 | 0 | 0 | 0 | |
Marketing, Midstream and Processing | VIU | 1,046 | (74) | 1,005 | (425) | |
| FVLCOD | 0 | 0 | 0 | 0 | |
| | | | | | |
| | | | | | |
| | | | | | |
Total | | 16,286 | 1,890 | 17,525 | 7,327 | |
| | | | | | |
1) Carrying amount relates to assets impaired/reversed. | |
During 20142016 net impairment losses of NOK32.7 billionUSD 1,890 million were recognised on producing and development assets and goodwill,mainly due to downward revision of long-term commodity price assumptions. For 2015 the net impairment losses recognised were USD 7,327 million primarily due to declining commodity prices.
Development and Production Norway (DPN)
In the DPN segment net impairment losses of USD 829 million were recognised in 2016, which were mainly related to conventional offshore assets in the development phase. The net impairment losses were triggered by reduction in commodity price forecasts (primarily oil). assumptions. In 2015 impairment losses of USD 1,074 million were recognised.
Development and Production International (DPI)
In the DPI segment net impairment losses of USD 1,130 million were recognised in 2016 of which USD 1,357 million, including a reversal of USD 571 million, related to unconventional onshore assets in North America. The loss includes impairment of Kai Kos Dehseh, classified as held for sale as of 31 December 2016. In addition, impairment reversals of USD 780 million and impairment losses of USD 553 million were recognised in relation to conventional assets. Net impairment losses of USD 541 million were recognised as Depreciation, amortisation and net impairment losses and net impairment losses of USD 590 million related to signature bonuses and acquisition costs recognised as Exploration expenses. In 2015 impairment losses of USD 6,678 million were recognised.
The net impairment losses were mainly a result from reduced long term commodity price assumptions partly offset by increased short term prices, operational performance improvements and cost reductions.
Marketing, Midstream and Processing (MMP)
The MMP segment recognised a net impairment reversal of USD 74 million mainly related to a refinery. The reversal of impairment was triggered by increased refinery margins and operational and commercial improvements. In 2015 net reversal of USD 425 million were recognised.
The recoverable amount of assets tested for impairment was mainly based on VIUValue in Use (VIU) estimates on the basis of internal forecasts on costs, production profiles and commodity prices. ForIn fourth quarter, the downward revision of the long term price forecast constituted the most important impairment indicator. Business plan updates including improved production profiles, more efficient operations and lower costs in addition to increased short
Statoil, Annual Report on Form 20-F 2016159
term commodity prices partially offsets the effect of lower long term prices. Short term commodity prices (2017 – 2019) are forecasted by using observable forward prices for 2017 and a linear projection towards the 2020 internal forecast. In 2015 the observable forward prices were used for the first three years.
Recoverable amount for assets measured at Fair Value Less Cost of Disposal (FVLCOD) have been used, long term commodity price forecasts are based on internal price forecasts. The FVLCOD have partlypartially been established through comparisons with observed market transactions and bids, and partlypartially through internally prepared net present value estimates using assumed market participant assumptions.
Development and Production Norway (DPN)
In the DPN segment impairment losses of NOK 2.3 billion related to two cash generating units on the Norwegian continental shelf were recognised, primarily resulting from reduced short-term oil price forecasts. The impairment reviews were carried out on a VIU basis.
Development and Production International (DPI)
In the DPI segment impairment losses of NOK 29.5 billion were recognised, of which NOK 22.8 related to unconventional onshore assets in North America and NOK6.7 billion related to other conventional assets. Impairment losses of NOK 23.9 billion were recognised as Depreciation, amortisation and net impairment losses and NOK 5.6 billion as Exploration expenses, based on the impaired assets’ nature.
An impairment loss of NOK 10.0 billion was recognised related to the Kai Kos Dehseh oil sands project in Alberta, Canada. The impairment losses were triggered by Statoil’s decision to postpone the development of the Corner field, which is part of the Kai Kos Dehseh project, in combination with a general weakening of the market outlook for oil sands projects, including the impact of market factors such as increased cost level and market access for Alberta oil. The recoverable amount was based on the FVLCOD method in which the value was based on specific market parameters which were observed in recent and relevant market transactions.
The otherprice assumptions used for impairment lossescalculations were as follows (prices used in unconventional onshore assets2015 impairment calculations for the respective years are indicated in North America relate to Statoil’s US onshore assets, for a total amount of NOK 12.8 billion, including NOK 3.8 billion of goodwill allocated to these assets, primarily resulting from reduced short-term oil price forecasts. These impairment reviews were carried out on a VIU basis.brackets):
The impairment losses related to other conventional assets in the DPI segment which were not considered significant on an individual cash generating unit level, primarily resulting from reduced short-term oil price forecasts, were carried out on a VIU basis.
Year (Prices in real terms) | 2017 | | 2020 | | 2025 | | 2030 |
| | | | | | | | | | | |
Brent Blend – USD/bbl | 55 | (45) | | 75 | (83) | | 78 | (92) | | 80 | (100) |
NBP - USD/mmbtu | 6.0 | (4.9) | | 6.0 | (8.0) | | 8.0 | (9.0) | | 8.0 | (9.2) |
Henry Hub – USD/mmbtu | 3.4 | (2.7) | | 4.0 | (4.2) | | 4.0 | (4.4) | | 4.0 | (4.6) |
Marketing, Processing and Renewable Energy (MPR)Sensitivities
In the MPR segment net impairment losses of NOK 0.9 billion were recognised related to refineries and midstream assets and allocated goodwill mainly due to changed expectations of future margins. These impairment assessments were carried out on a VIU basis. In 2013 Statoil recognised impairment losses related to refinery assets in the MPR segment of NOK 4.3 billion. The basis for the impairment losses was value in use estimates triggered by lower future expected refining margins.
Sensitivities
Subsequent to year end 2014, commodityCommodity prices have continued to behistorically been volatile. Significant further downward adjustments of Statoil’s commodity price assumptions would result in impairment losses on certain producing and development assets in Statoil’s portfolio, including goodwill related to US onshore activities. The table below presents an estimate of the carrying amount of producing and development assets, including goodwill, that would be subject to impairment assessment ifportfolio. If a further decline in commodity price forecasts over the lifetime of the assets were 15%. The20%, considered to represent a reasonably likely change, the impairment amount to be recognised could illustratively be in the region of USD 8 billion before tax effects. This illustrative impairment sensitivity has been established on the assumption that allassumes no changes to input factors other than prices; however, a price reduction of 20% is likely to result in changes in business plans as well as other factors used when estimating an asset’s recoverable amount. Changes in such input factors would remain unchanged.likely significantly reduce the actual impairment amount compared to the illustrative sensitivity above. Changes that could be expected would include a reduction in the cost level in the oil and gas industry as well as offsetting currency effects, both of which have historically occurred following significant changes in commodity prices. The illustrative sensitivity is therefore not considered to represent a best estimate of an expected impairment impact, nor an estimated impact on revenues or operating income in such a scenario. A significant and prolonged reduction in oil and gas prices would also result in mitigating actions by Statoil and its license partners, as a reduction of oil and gas prices would impact drilling plans and production profiles for new and existing assets. Quantifying such impacts is considered impracticable, as it requires detailed technical, geological and economical evaluations based on hypothetical scenarios and not based on existing business or development plans.
11 Intangible assets
(in USD million) | Exploration expenses | Acquisition costs - oil and gas prospects | Goodwill | Other | Total |
| | | | | |
Cost at 31 December 2015 | 3,701 | 5,207 | 1,565 | 402 | 10,875 |
Additions | 246 | 2,477 | 0 | (8) | 2,715 |
Disposals at cost | (0) | (311) | 0 | (42) | (353) |
Transfers | (298) | (392) | 0 | (2) | (692) |
Assets reclassified to held for sale | (19) | (78) | 0 | 0 | (97) |
Expensed exploration expenditures previously capitalised | (808) | (992) | 0 | 0 | (1,800) |
Effect of changes in foreign exchange | 33 | (3) | 5 | (4) | 31 |
| | | | | |
Cost at 31 December 2016 | 2,856 | 5,907 | 1,570 | 346 | 10,679 |
| | | | | |
Accumulated depreciation and impairment losses at 31 December 2015 | | | (1,242) | (182) | (1,423) |
Amortisation and impairments for the year | | | 0 | (13) | (13) |
Amortisation and impairment losses disposed intangible assets | | | 0 | (2) | (2) |
Effect of changes in foreign exchange | | | 0 | 2 | 2 |
| | | | | |
Accumulated depreciation and impairment losses at 31 December 2016 | | | (1,242) | (195) | (1,437) |
| | | | | |
Carrying amount at 31 December 2016 | 2,856 | 5,907 | 328 | 151 | 9,243 |
170160 Statoil, Annual Report on Form 20-F 20142016
Carrying amount of producing and development assets which would be subject to impairment assessment assuming an additional decline in commodity price forecasts: |
(in NOK billion) | Development and Production Norway | Development and Production International | Marketing, Processing and Renewable Energy | Total |
| | | | |
Carrying amount subject to impairment assessment in 2014 (after impairment) * | 21 | 184 | 8 | 213 |
Sensitivity: commodity price decline by 15% ** | 22 | 237 | 8 | 267 |
* Relates to assets subject to impairment assessment under IAS 36. As a result of these impairment assessments, Statoil recognised a net impairment loss of NOK 32.7 billion in 2014, as described above.
** The sensitivity which is reflected in this line, relates to the carrying amount of assets subject to impairment assessment under IAS 36. Exploration and evaluation assets accounted for under IFRS 6 are not included.
The information in the table above is for indicative purposes only. A significant and prolonged decline in commodity prices would affect other assumptions, e.g. cost level, currency etc. A general decline in commodity price assumptions of 15% would result in mitigating actions by Statoil by optimising the respective business plans in order to reduce the exposure to changes in the macro environment. Considering the substantial uncertainties related to other relevant assumptions that would be triggered by a significant and prolonged decline in commodity price forecasts, Statoil does not disclose the expected impairment amount.
12 Intangible assets
(in NOK billion) | Exploration expenses | Acquisition costs - oil and gas prospects | Goodwill | Other | Total |
| | | | | |
Cost at 31 December 2013 | 20.3 | 58.6 | 10.5 | 3.1 | 92.4 |
Additions | 7.1 | 1.5 | 0.0 | (0.0) | 8.7 |
Disposals at cost | (0.9) | (0.7) | (0.0) | (0.3) | (1.8) |
Transfers | (4.1) | (5.5) | 0.0 | 0.0 | (9.5) |
Expensed exploration expenditures previously capitalised | (2.7) | (11.1) | 0.0 | 0.0 | (13.7) |
Effect of changes in foreign exchange | 3.1 | 10.5 | 1.7 | 0.6 | 15.8 |
| | | | | |
Cost at 31 December 2014 | 22.9 | 53.4 | 12.1 | 3.4 | 91.8 |
| | | | | |
Accumulated depreciation and impairment losses at 31 December 2013 | | | 0.0 | (0.9) | (0.9) |
Amortisation and impairments for the year | | | (4.2) | (0.3) | (4.5) |
Effect of changes in foreign exchange | | | (1.0) | (0.2) | (1.2) |
| | | | | |
Accumulated depreciation and impairment losses at 31 December 2014 | | | (5.2) | (1.4) | (6.6) |
| | | | | |
Carrying amount at 31 December 2014 | 22.9 | 53.4 | 6.9 | 2.0 | 85.2 |
Statoil, Annual Report on Form 20-F 2014171
(in NOK billion) | Exploration expenses | Acquisition costs - oil and gas prospects | Goodwill | Other | Total | |
(in USD million) | | Exploration expenses | Acquisition costs - oil and gas prospects | Goodwill | Other | Total |
| | |
Cost at 31 December 2012 | 18.6 | 57.3 | 9.7 | 2.7 | 88.3 | |
Cost at 31 December 2014 | | 3,075 | 7,183 | 1,632 | 454 | 12,345 |
Additions | 6.3 | 2.0 | 0.0 | 0.3 | 8.7 | 1,188 | 546 | 0 | (18) | 1,716 |
Disposals at cost | (1.1) | (0.5) | 0.0 | (0.0) | (1.6) | (61) | (293) | (9) | (24) | (387) |
Transfers | (2.9) | (4.0) | 0.0 | (0.1) | (7.0) | (82) | (250) | 0 | (0) | (332) |
Expensed exploration expenditures previously capitalised | (1.9) | (1.2) | 0.0 | (3.1) | (213) | (1,951) | 0 | (2,164) |
Effect of changes in foreign exchange | 1.2 | 4.9 | 0.7 | 0.2 | 6.9 | (206) | (29) | (58) | (9) | (303) |
| | |
Cost at 31 December 2013 | 20.3 | 58.6 | 10.5 | 3.1 | 92.4 | |
Cost at 31 December 2015 | | 3,701 | 5,207 | 1,565 | 402 | 10,875 |
| | |
Accumulated depreciation and impairment losses at 31 December 2012 | | 0.0 | (0.7) | |
Accumulated depreciation and impairment losses at 31 December 2014 | | | (702) | (183) | (885) |
Amortisation and impairments for the year | | 0.0 | (0.1) | | (539) | (2) | (541) |
Effect of changes in foreign exchange | | 0.0 | (0.1) | | 0 | 2 |
| | |
Accumulated depreciation and impairment losses at 31 December 2013 | | 0.0 | (0.9) | |
Accumulated depreciation and impairment losses at 31 December 2015 | | | (1,242) | (182) | (1,423) |
| | |
Carrying amount at 31 December 2013 | 20.3 | 58.6 | 10.5 | 2.2 | 91.5 | |
Carrying amount at 31 December 2015 | | 3,701 | 5,207 | 323 | 220 | 9,452 |
The useful lives of intangible assets are assessed to be either finite or indefinite. Intangible assets with finite useful lives are amortised systematically over their estimated economic lives, ranging between 10-20 years.
During 2014,2016, intangible assets were impacted by impairments of acquisition costs related to exploration activities of NOK 5.7 billionUSD 403 million primarily as a result from dry wells and uncommercial discoveries in Angola and the Gulf of Mexico.Mexico, South America and Angola. Additionally, Statoil recognised impairments of NOK 6.0 billion primarily related to unconventional onshore assets in North Americasignature bonuses and goodwill primarily related to US onshore assets of NOK 4.2 billion.acquisition costs totalling USD 590 million.
Impairment losses and reversals of impairment losses are presented as Exploration expensesand Depreciation, amortisation and net impairment losses on the basis of their nature as exploration assets (intangible assets) and other intangible assets, respectively. The impairment losses and reversal of impairment losses are based on recoverable amount estimates triggered by changes in reserve estimates, cost estimates and market conditions. See note 11 10 Property, plant and equipment furtherfor more information on the basis for impairment assessments.
The table below shows the aging of capitalised exploration expenditures. | The table below shows the aging of capitalised exploration expenditures. | The table below shows the aging of capitalised exploration expenditures. |
(in NOK billion) | 2014 | 2013 | |
(in USD million) | | 2016 | 2015 |
| | | | |
Less than one year | 9.2 | 7.3 | 311 | 1,448 |
Between one and five years | 11.4 | 11.6 | 2,216 | 1,923 |
Between five and ten years | 2.3 | 1.4 | |
More than five years | | 329 | 331 |
| | |
Total | 22.9 | 20.3 | 2,856 | 3,701 |
The table below shows the components of the exploration expenses. | The table below shows the components of the exploration expenses. | The table below shows the components of the exploration expenses. |
| Full year | Full year |
(in NOK billion) | 2014 | 2013 | 2012 | |
(in USD million) | | 2016 | 2015 | 2014 |
| | |
Exploration expenditures | 23.9 | 21.8 | 20.9 | 1,437 | 2,860 | 3,730 |
Expensed exploration expenditures previously capitalised | 13.7 | 3.1 | 1,800 | 2,164 | 2,097 |
Capitalised exploration | (7.3) | (6.9) | (5.9) | (285) | (1,151) | (1,161) |
| | |
Exploration expenses | 30.3 | 18.0 | 18.1 | 2,952 | 3,872 | 4,666 |
172Statoil, Annual Report on Form 20-F 2016161
12 Equity accounted investments
| | | (in USD million) |
| | | 2016 | 2015 |
| | Ownership | Book value | Profit share | Book value | Profit share |
| | | | | | |
Lundin Petroleum AB | | 20.1% | 1,121 | (78) | - | - |
Other equity accounted investments | | 1,124 | (41) | 824 | (29) |
| | | | | | |
Total | | | 2,245 | (119) | 824 | (29) |
Voting rights corresponds to ownership.
Summary financial information of equity accounted investments
The following table provides summarised financial information relating to Lundin Petroleum AB. This information is presented on a 20.1% basis and also reflects adjustments made by Statoil to Lundin Petroleum AB’s own results in applying the equity method of accounting. Statoil adjusts Lundin Petroleum AB’s results for depreciation of excess values determined in the purchase price allocation at the date of acquisition. Where there are significant differences in accounting policies, adjustments are made to bring the accounting policies applied in line with Statoil’s. These adjustments have decreased the reported net income for 2016, as shown in the table below, compared with the equivalent amount reported by Lundin Petroleum AB.
|
|
| | | Lundin Petroleum AB |
(in USD million) | | | | | | | 2016 |
| | | | | | | |
At 31 December | | | | | | | |
Current assets | | | | | | | 69 |
Non-Current assets | | | | | | | 3,069 |
Current liabilities | | | | | | | (70) |
Non-Current liabilities | | | | | | | (1,947) |
Net assets | | | | | | | 1,121 |
Year ended 31 December | | | | | | | |
Gross revenues1) | | | | | | | 135 |
Income before tax1) | | | | | | | (83) |
Net income1) | | | | | | | (78) |
| | | | | | | |
Capital expenditures1) | | | | | | | 589 |
| | | | | | | |
1) For the period 30 June to 31 December 2016. |
Statoil has not received dividends from Lundin Petroleum AB for 2016.
Statoil’s quoted market value as per 31.12.2016 was USD 1.496 billion.
162 Statoil, Annual Report on Form 20-F 20142016
13 Financial investments and non-current prepayments
Non-current financial investments | Non-current financial investments | Non-current financial investments |
| At 31 December | At 31 December |
(in NOK billion) | 2014 | 2013 | |
(in USD million) | | 2016 | 2015 |
| | |
Bonds | 11.6 | 10.0 | 1,362 | 1,412 |
Listed equity securities | 6.6 | 5.6 | 731 | 715 |
Non-listed equity securities | 1.4 | 0.9 | 251 | 209 |
| | |
Financial investments | 19.6 | 16.4 | 2,344 | 2,336 |
Bonds and Listedlisted equity securities relate to investment portfolios which are held by Statoil's captive insurance company and accounted for using the fair value option.
Non-current prepayments and financial receivables | Non-current prepayments and financial receivables | Non-current prepayments and financial receivables |
| At 31 December | At 31 December |
(in NOK billion) | 2014 | 2013 | |
(in USD million) | | 2016 | 2015 |
| | | | |
Financial receivables interest bearing | 3.7 | 4.5 | 707 | 764 |
Prepayments and other non-interest bearing receivables | 2.0 | 4.1 | 185 | 203 |
| | | |
Prepayments and financial receivables | 5.7 | 8.5 | 893 | 967 |
Financial receivables interest bearing primarily relate to project financing of equity accounted companies and loans to employees.
Current financial investments | Current financial investments | Current financial investments |
| At 31 December | At 31 December |
(in NOK billion) | 2014 | 2013 | |
(in USD million) | | 2016 | 2015 |
| | | |
Time deposits | 9.8 | 4.5 | 3,242 | 2,166 |
Interest bearing securities | 49.4 | 34.8 | 4,995 | 7,650 |
| | | |
Financial investments | 59.2 | 39.2 | 8,211 | 9,817 |
At 31 December 20142016 current fFinancialinancial investments include NOK 6.0 billionUSD 818.3 million investment portfolios which are held by Statoil's captive insurance company and accounted for using the fair value option. The corresponding balance at 31 December 20132015 was NOK 5.3 billion.USD 677.2 million.
For information about financial instruments by category, see note 25 Financial instruments: fair value measurement and sensitivity analysis of market risk.risk.
14 Inventories
| At 31 December | At 31 December |
(in NOK billion) | 2014 | 2013 | |
(in USD million) | | 2016 | 2015 |
| | | | |
Crude oil | 10.1 | 15.2 | 1,966 | 1,210 |
Petroleum products | 6.0 | 7.4 | 744 | 580 |
Natural gas | | 160 | 294 |
Other | 7.7 | 7.0 | 358 | 419 |
| | | |
Inventories | 23.7 | 29.6 | 3,227 | 2,502 |
Higher inventory level of crude oil at 31 December is mainly related to higher prices and in-transit volumes. Other inventory consists of natural gas, spare parts and operational materials, including drilling and well equipment.
The write-down of inventories from cost to net realisable value amounted to an expense of NOK 5.0 billionUSD 74 million and NOK 0.1 billionUSD 439 million in 20142016 and 2013,2015, respectively.
Statoil, Annual Report on Form 20-F 20142016 173163
15 Trade and other receivables
| At 31 December | At 31 December |
(in NOK billion) | 2014 | 2013 | |
(in USD million) | | 2016 | 2015 |
| | |
Trade receivables | 57.8 | 64.9 | 5,504 | 4,464 |
Current financial receivables | 6.9 | 2.4 | 862 | 736 |
Joint venture receivables | 8.5 | 7.8 | 592 | 574 |
Associated companies and other related party receivables | 0.5 | 0.4 | |
Equity accounted investments and other related party receivables | | 116 | 60 |
| | |
Total financial trade and other receivables | 73.7 | 75.6 | 7,074 | 5,834 |
Non-financial trade and other receivables | 9.6 | 6.2 | 765 | 837 |
| | |
Trade and other receivables | 83.3 | 81.8 | 7,839 | 6,671 |
For more information about the credit quality of Statoil's counterparties, see note 5 Financial risk management.management. For currency sensitivities, see note 25 Financial instruments: fair value measurement and sensitivity analysis of market risk.risk.
16 Cash and cash equivalents
| At 31 December | At 31 December |
(in NOK billion) | 2014 | 2013 | |
(in USD million) | | 2016 | 2015 |
| | | | |
Cash at bank available | 13.5 | 8.5 | 596 | 1,047 |
Time deposits | 32.5 | 37.1 | 1,660 | 1,494 |
Money market funds | 3.6 | 6.1 | 65 | 450 |
Interest bearing securities | 30.6 | 31.4 | 2,234 | 5,091 |
Restricted cash, including collateral deposits | 2.9 | 2.3 | |
Restricted cash, including margin deposits | | 535 | 540 |
| | |
Cash and cash equivalents | 83.1 | 85.3 | 5,090 | 8,623 |
Restricted cash at 31 December 20142016 and 20132015 includes collateral deposits related to trading activities of NOK 2.0 billionUSD 398 million and NOK 1.9 billion,USD 411 million, respectively. Collateral deposits are related to certain requirements set out by exchanges where Statoil is participating. The terms and conditions related to these requirements are determined by the respective exchanges.
17 Shareholders' equity and dividends
At 31 December 2014 and 2013,2016, Statoil's share capital of NOK 8,112,623,527.50 (USD 1,155,993,270) comprised 3,245,049,411 shares at a nominal value of NOK 2.50. Share capital at 31 December 2015 was NOK 7,971,617,757.50 (USD 1,138,981,520) comprised 3,188,647,103 shares at a nominal value of NOK 2.50.
Statoil ASA has only one class of shares and all shares have voting rights. The holders of shares are entitled to receive dividends as and when declared and are entitled to one vote per share at general meetings of the company.
Dividends declared and paid per share were NOK 3.60USD 0.2201 for the first twothree quarters of 2014, NOK 7.00 for 2013 and NOK 6.75 for 2012. Interim dividends2016. The board of NOK 1.80directors will propose to the annual general meeting to maintain a dividend of USD 0.2201 per share for the third quarter of 2014 were declared in the fourth quarter of 2014 and have been recognised as a liability in the Consolidated financial statements. This amount will be paid in the first quarter of 2015. Interim dividends of NOK 1.80 perordinary share for the fourth quarter, and continue the scrip programme giving shareholders the option to receive the dividend for the fourth quarter in cash or newly issued shares in Statoil at 5% discount.
As part of 2014 have been proposed and is subject to approval at the annualStatoil's scrip dividend program, approved by Statoil’s general meetingassembly in May 2015.
Total equity2016, eligible shareholders can elect to receive their dividend in the parent companyform of new ordinary Statoil ASA provides the basis for distribution ofshares or in cash. For ADR (American Depository Receipts) holders, dividend to shareholders. As of 31 December 2014 total equity in Statoil ASA amounted to NOK 358.2 billion, of which NOK 117.0 billion is restricted equity. Total equitycan be received in the parent company asform of 31 December 2013 was NOK 321.3 billion,ADSs (American Depository Shares) or in cash. The subscription price for the dividend shares will have a discount compared to the volume-weighted average price on OSE of which NOK 112.2 billion was restricted equity. Restricted equitythe last two trading days of the subscription period for 2014 is presented in accordance witheach quarter. For the requirements infourth quarter of 2015 and for the Norwegian Limited Liabilities Companies Act effective 1 July 2013.first, second and third quarter of 2016 the discount has been set at 5%.
During 2016 dividend for the third and for the fourth quarter of 2015 and dividend for the first and second quarter of 2016 were settled. Dividend declared but not yet settled, is presented as dividends payable in the Consolidated balance sheet, regardless of whether the dividend is expected to be paid in cash or by issuance of new shares. The Consolidated statement of changes in equity shows declared dividend in the period (retained earnings), offset by
164Statoil, Annual Report on Form 20-F 2016
scrip dividend settled during the period (share capital and additional paid-in-capital). Dividend declared in 2016 relate to the fourth quarter of 2015 and to the first three quarters of 2016.
| At 31 December |
(in USD million) | 2016 | 2015 |
| | |
Dividends declared | 2,824 | 2,930 |
US dollar per share or ADS | 0.8804 | 0.9173 1) |
| | |
Dividends paid in cash | 1,876 | 2,836 |
US dollar per share or ADS | 0.8804 | 0.9034 |
Norwegian kroner per share | 7.3364 | 7.2000 |
| | |
Scrip dividends | 904 | - |
Number of shares issued (millions) | 56.4 | - |
| | |
Sum dividends settled | 2,780 | 2,836 |
1) Dividend for the fourth quarter 2014 and for the first quarter 2015 declared in NOK and translated to USD at currency rate on declaration date.
During 2016 a total of 4,011,8603,381,488 treasury shares were purchased for NOK 0.6 billionUSD 62 million and 2,960,9723,882,153 treasury shares were allocated to employees participating in the share saving plan. In 20132015 a total of 3,937,6414,057,902 treasury shares were purchased for NOK 0.5 billionUSD 69 million and 2,878,2553,203,968 treasury shares were allocated to employees participating in the share saving plan. At 31 December 20142016 Statoil had 11,138,89010,155,249 treasury shares and at 31 December 2013 9,734,7332015 11,009,183 treasury shares, all of which are related to Statoil's share saving plan. For further information, see note 6 Remuneration.Remuneration.
174Statoil, Annual Report on Form 20-F 2014
18 Finance debt
Capital management
The main objectives of Statoil's capital management policy are to maintain a strong financial position and to ensure sufficient financial flexibility. One of the key ratios in the assessment of Statoil's financial robustness is Netnet interest-bearing debt adjusted (ND) to capital employed adjusted (CE).
| At 31 December | At 31 December |
(in NOK billion) | 2014 | 2013 | |
(in USD million) | | 2016 | 2015 |
| | | |
Net interest-bearing debt adjusted (ND) | 95.6 | 63.7 | 19,389 | 14,748 |
Capital employed adjusted (CE) | 476.7 | 419.7 | 54,490 | 55,055 |
| | | |
Net debt to capital employed adjusted (ND/CE) | 20.0 % | 15.2 % | 35.6% | 26.8% |
ND is defined as Statoil's interest bearing financial liabilities less cash and cash equivalents and current financial investments, adjusted for collateral deposits and balances held by Statoil's captive insurance company (an increase of NOK 8.0 billion(amounting to USD 1,216 million and NOK 7.1 billionUSD 1,111 million for 20142016 and 2013,2015, respectively), and balances related to the SDFI (a decrease of NOK 1.6 billion(amounting to USD 199 million and NOK 1.3 billionUSD 214 million for 20142016 and 2013,2015, respectively) and project financing exposure that does not correlate to the underlying exposure (a decrease of NOK 0.1 billion and NOK 0.2 billion for 2014 and 2013, respectively). CE is defined as Statoil's total equity (including non-controlling interests) and ND.
Statoil, Annual Report on Form 20-F 2016165
Non-current finance debt | Non-current finance debt | Non-current finance debt |
Finance debt measures at amortised cost | |
Finance debt measured at amortised cost | | Finance debt measured at amortised cost |
| Weighted average interest rates in % * | Carrying amount in NOK billion at 31 December | Fair value in NOK billion at 31 December ** | Weighted average interest rates in %1) | Carrying amount in USD millions at 31 December | Fair value in USD millions at 31 December2) |
| 2014 | 2013 | 2014 | 2013 | 2014 | 2013 | 2016 | 2015 | 2016 | 2015 | 2016 | 2015 |
| | | | | | |
Unsecured bonds | | | | | | | | |
United States Dollar (USD) | 3.50 | 3.76 | 154.4 | 117.4 | 165.0 | 118.4 | 3.54 | 3.51 | 19,712 | 20,768 | 20,681 | 21,630 |
Euro (EUR) | 3.99 | 4.02 | 37.6 | 33.6 | 43.8 | 37.7 | 2.10 | 2.28 | 8,211 | 7,201 | 8,884 | 7,495 |
Great Britain Pound (GBP) | 6.08 | 6.08 | 15.9 | 13.8 | 22.3 | 17.7 | 6.08 | 6.08 | 1,693 | 2,040 | 2,475 | 2,698 |
Norwegian kroner (NOK) | 4.18 | 4.18 | 3.0 | 3.5 | 3.1 | 4.18 | 4.18 | 348 | 341 | 386 | 378 |
| | | | | | |
Total | | | 210.9 | 167.8 | 234.7 | 176.8 | | | 29,964 | 30,350 | 32,427 | 32,201 |
| | | | | | |
Unsecured loans | | | | | | |
Japanese yen (JPY) | 4.30 | 4.30 | 0.6 | 0.9 | 0.8 | 4.30 | 4.30 | 85 | 83 | 88 | 89 |
Euro (EUR) | - | 3.35 | - | 1.3 | - | 1.3 | |
| | | | | | |
Secured bank loans | | | | | | |
United States Dollar (USD) | 4.20 | 4.52 | 0.1 | 0.2 | 0.1 | 0.2 | |
Norwegian kroner (NOK) | 3.11 | 3.20 | 0.3 | 0.2 | 0.3 | 0.2 | - | 3.11 | - | 52 | - | 52 |
| | | | | | |
Finance lease liabilities | | | 5.4 | 5.0 | 5.6 | 5.0 | | | 507 | 580 | 526 | 575 |
| | | | | | |
Total | | | 6.5 | 7.3 | 6.9 | 7.5 | | | 592 | 715 | 614 | 716 |
| | | | | | |
Total finance debt | | | 217.4 | 175.0 | 241.6 | 184.3 | | | 30,556 | 31,065 | 33,041 | 32,918 |
Less current portion | | | 12.3 | 9.6 | 12.3 | 9.6 | | | 2,557 | 1,100 | 2,584 | 1,100 |
| | | | | | |
Non-current finance debt | | | 205.1 | 165.5 | 229.3 | 174.7 | | | 27,999 | 29,965 | 30,457 | 31,818 |
* 1)Weighted average interest rates are calculated based on the contractual rates on the loans per currency at 31 December and do not include the effect of swap agreements.
** 2)The fair value of the non-current financial liabilities is determined using a discounted cash flow model and is classified at Levellevel 2 in the fair value hierarchy. Interest rates used in the model are derived from the LIBOR and EURIBOR forward curves and will vary based on the time to maturity for the non-current financial liabilities. The credit premium used is based on indicative pricing from external financial institutions.
Unsecured bonds amounting to NOK 154.4 billionUSD 19,712 million are denominated in USD and unsecured bonds amounting to NOK 43.0 billionUSD 7,420 million are swapped into USD. TwoFour bonds denominated in EUR amounting to NOK 13.5 billionUSD 2,832 million are not swapped. The table does not include the effects of agreements entered into to
Statoil, Annual Report on Form 20-F 2014175
swap the various currencies into USD. For further information see note 25 Financial instruments: fair value measurement and sensitivity analysis of market risk.
Substantially all unsecured bond and unsecured bank loan agreements contain provisions restricting future pledging of assets to secure borrowings without granting a similar secured status to the existing bondholders and lenders.
Statoil's secured bank loans in USD have been secured by mortgage of shares in a subsidiary with a book value of NOK 2.1 billion, in addition, security includes Statoil's pro-rata share of income from a project. The secured bank loan in NOK has been secured by real estate and land with a total book value of NOK 0.5 billion.
In 2014 Statoil issued the following bonds: |
Issuance date | Amount in USD billion | Interest rate in % | Maturity date |
| | | |
10 November 2014 | 0.75 | 1.25 | November 2017 |
10 November 2014 | 0.50 | floating | November 2017 |
10 November 2014 | 0.75 | 2.25 | November 2019 |
10 November 2014 | 0.50 | 2.75 | November 2021 |
10 November 2014 | 0.50 | 3.25 | November 2024 |
In 2016 Statoil issued the following bonds: |
Issuance date | Amount in EUR billion | Interest rate in % | Maturity date |
| | | |
9 November 2016 | 0.60 | 0.750 | November 2026 |
9 November 2016 | 0.60 | 1.625 | November 2036 |
| | | |
Out of Statoil's total outstanding unsecured bond portfolio, 4547 bond agreements contain provisions allowing Statoil to call the debt prior to its final redemption at par or at certain specified premiums if there are changes to the Norwegian tax laws. The carrying amount of these agreements is NOK 207.9 billionUSD 29,616 million at the 31 December 20142016 closing exchange rate.
For more information about the revolving credit facility, maturity profile for undiscounted cash flows and interest rate risk management, see note 5 Financial risk management.
Subsequent to the balance sheet date, Statoil issued euro 3.75 billion in new bonds, see note 27 Subsequent events.
Non-current finance debt maturity profile |
| At 31 December |
(in NOK billion) | 2014 | 2013 |
| | |
Year 2 and 3 | 27.3 | 18.2 |
Year 4 and 5 | 44.3 | 30.1 |
After 5 years | 133.5 | 117.1 |
| | |
Total repayment of non-current finance debt | 205.1 | 165.5 |
| | |
Weighted average maturity (years) | 9 | 10 |
Weighted average annual interest rate (%) | 3.78 | 4.06 |
166Statoil, Annual Report on Form 20-F 2016
Non-current finance debt maturity profile |
| At 31 December |
(in USD million) | 2016 | 2015 |
| | |
Year 2 and 3 | 6,478 | 6,234 |
Year 4 and 5 | 3,798 | 4,881 |
After 5 years | 17,723 | 18,850 |
| | |
Total repayment of non-current finance debt | 27,999 | 29,965 |
| | |
Weighted average maturity (years) | 9 | 9 |
Weighted average annual interest rate (%) | 3.41 | 3.39 |
More information regarding finance lease liabilities is provided in note 22 Leases. Leases.
Current finance debt | Current finance debt | Current finance debt |
| At 31 December | At 31 December |
(in NOK billion) | 2014 | 2013 | |
(in USD million) | | 2016 | 2015 |
| | | | |
Collateral liabilities | 12.9 | 7.4 | 571 | 1,161 |
Non-current finance debt due within one year | 12.3 | 9.6 | 2,557 | 1,100 |
Other including bank overdraft | 1.3 | 0.1 | 545 | 66 |
| | | |
Total current finance debt | 26.5 | 17.1 | 3,674 | 2,326 |
| | | |
Weighted average interest rate (%) | 2.12 | 1.61 | 1.90 |
Collateral liabilities and other current liabilities relate mainly to cash received as security for a portion of Statoil's credit exposure.
176Statoil, Annual Reportexposure and outstanding amounts on Form 20-F 2014US Commercial paper (CP) programme. At 31 December USD 500 million were issued on the CP programme. Corresponding at 31 December 2015 there were no outstanding amounts.
19 Pensions
The main pension plans for Statoil ASA and its most significant subsidiaries are defined contribution plans, in which the pension costs are recognised in the Consolidated statement of income in line with payments of annual pension premiums. The pension contribution plans in Statoil ASA also includes certain unfunded elements (notional contribution plans), for which the annual notional contributions are recognised as pension liabilities. These notional pension liabilities are regulated equal to the return on asset within the main contribution plan. See note 2 Significant accounting policies for more information about the accounting treatment of the notional contribution plans reported in Statoil ASA.
In addition, Statoil ASA has a closed defined benefit plan for employees which in 2015 had less than 15 years of future service before their regular retirement age, and for employees in certain subsidiaries. Statoil's defined benefit plans are generally based on a minimum of 30 years of service and 66% of the final salary level, including an assumed benefit from the Norwegian National Insurance Scheme. The Norwegian companies in the group are subject to, and complies with, the requirements of the Norwegian Mandatory Company Pensions Act, and the company's pension scheme follows the requirements of the Act.
The main pension schemesdefined benefit plans in Norway are managed byand financed through Statoil Pensjon (Statoil's pension fund - hereafter "Statoil Pension"). Statoil Pension is an independent pension fund that covers the employees in Statoil's Norwegian companies. The purpose of Statoil Pension is to provide retirement and disability pension to members and survivor's pension to spouses, registered partners, cohabitants and children. The pension fund's assets are kept separate from the company's and group companies' assets. Statoil Pension is supervised by the Financial Supervisory Authority of Norway ("Finanstilsynet") and is licensed to operate as a pension fund.
Statoil ASA and a number of its subsidiaries have defined benefit retirement plans. In 2014 Statoil ASA made a decision to change the company’s main pension plan in Norway from a defined benefit plan to a defined contribution plan. The actual transitioning to the defined contribution plan will take place in 2015. At the same time paid-up policies for the rights vested in the defined benefit plan will be issued. Employees with less than 15 years of future service before their regular retirement age will retain the existing defined benefit plans. For onshore employees between 37 and 51 years of age and offshore employees between 35 and 49 years of age a compensation plan will be established. The plan amendment resulted in the recognition of a gain (net of past service costs related to the compensation plan) of NOK 3.5 billion in the 2014 Consolidated statement of income as the decision to terminate the plan was made in 2014.
The Norwegian National Insurance Scheme ("Folketrygden") provides pension payments (social security) to all retired Norwegian citizens. Such payments are calculated by references to a base amount ("Grunnbeløpet" or "G") annually approved by the Norwegian Parliament. Statoil's plan benefits are generally based on a minimum of 30 years of service and 66% of the final salary level, including an assumed benefit from the Norwegian National Insurance Scheme.
Due to national agreements in Norway, Statoil is a member of both the previousa Norwegian national agreement-based early retirement plan (“AFP”), and the AFP scheme applicable from 1 January 2011. Statoil will pay a premium for both AFP schemes until 31 December 2015. After that date, premiums will only be due on the latest AFP scheme. The premium in the latest scheme is calculated on the basis of the employees' income between 1 and 7.1 G. The premium is payable for all employees until age 62. Pension from the latest AFP scheme will be paid from the AFP plan administrator to employees for their full lifetime. Statoil has determined that its obligations under this multi-employer defined benefit plan can be estimated with sufficient reliability for recognition purposes. Accordingly, the estimated proportionate share of the AFP plan has beenis recognised as a defined benefit obligation.
The present values of the defined benefit obligation, except for the notional contribution plan, and the related current service cost and past service cost are measured using the projected unit credit method. The assumptions for salary increases, increases in pension payments and social security base amount are based on agreed regulation in the plans, historical observations, future expectations of the assumptions and the relationship between these assumptions. At 31 December 20142016 the discount rate for the defined benefit plans in Norway iswas established on the basis of seven years' mortgage covered bonds interest
Statoil, Annual Report on Form 20-F 2016167
rate extrapolated on a yield curve which matches the duration of Statoil's payment portfolio for earned benefits.
benefits, which was calculated to be 17.4 years at the end of 2016.Social security tax is calculated based on a pension plan's net funded status and is included in the defined benefit obligation.
Statoil has more than one defined benefit plan, but the disclosure is made in total since the plans are not subject to materially different risks. Pension plans outside Norway are insignificantnot material and areas such not disclosed separately. The pension costs in Statoil ASA are partly re-charged to license partners.
Some Statoil companies have defined contribution plans. The period's contributions are recognised in the Consolidated statement of income as pension cost
Net pension cost |
| |
(in USD million) | 2016 | 2015 | 2014 |
| | | |
Current service cost | 238 | 378 | 751 |
Interest cost | 192 | 191 | 496 |
Interest (income) on plan asset | (148) | (145) | (409) |
Past service cost | 2 | - | (1) |
Losses (gains) from curtailment, settlement or plan amendment | 109 | 250 | (298) |
Actuarial (gains) losses related to termination benefits | 59 | (1) | (27) |
Notional contributions | 50 | 36 | - |
| | | |
Defined benefit plans | 503 | 709 | 512 |
| | | |
| | | |
Defined contribution plans | 148 | 135 | 32 |
| | | |
Total net pension cost | 650 | 844 | 544 |
New entrants for the period.
Net pension cost |
| Full year |
(in NOK billion) | 2014 | 2013 | 2012 |
| | | |
Current service cost | 4.7 | 4.0 | 3.8 |
Interest cost | 3.1 | 2.5 | 2.2 |
Interest (income) on plan asset | (2.6) | (2.1) | (2.5) |
Losses (gains) from curtailment, settlement or plan amendment * | (1.9) | 0.0 | (4.3) |
Actuarial (gains) losses related to termination benefits | (0.2) | 0.0 | (0.0) |
| | | |
Defined benefit plans | 3.2 | 4.4 | (0.8) |
| | | |
Defined contribution plans | 0.2 | 0.2 | 0.2 |
| | | |
Total net pension cost | 3.4 | 4.6 | (0.6) |
* In 2014 Statoil ASA offered early retirement (termination benefits) to a defined group of employees above the age of 58 years. The expenses of NOK 1.6 billion were recognised in the Consolidated statement of income and partly offset the gain of NOK 3.5 billion related to the plan amendment described above.
Pension cost includes associated social security tax and is partly charged to partners of Statoil operated licences.
Statoil, Annual Report on Form 20-F 2014177
(in NOK billion) | 2014 | 2013 |
| | |
Defined benefit obligations (DBO) | | |
At 1 January | 79.4 | 65.7 |
Current service cost | 4.7 | 4.0 |
Interest cost | 3.1 | 2.5 |
Actuarial (gains) losses - Demographic assumptions | (0.1) | 5.8 |
Actuarial (gains) losses - Financial assumptions | 4.8 | 4.8 |
Actuarial (gains) losses - Experience | (2.1) | (1.1) |
Benefits paid | (2.0) | (2.5) |
Losses (gains) from curtailment, settlement or plan amendment* | (2.9) | 0.0 |
Paid-up policies | (20.4) | 0.0 |
Foreign currency translation | 0.3 | 0.1 |
| | |
At 31 December | 65.0 | 79.4 |
| | |
Fair value of plan assets | | |
At 1 January | 62.3 | 54.5 |
Interest income | 2.6 | 2.1 |
Return on plan assets (excluding interest income) | 0.9 | 4.0 |
Company contributions | 0.1 | 3.1 |
Benefits paid | (0.7) | (1.6) |
Paid-up policies | (20.4) | 0.0 |
Foreign currency translation | 0.3 | 0.2 |
| | |
At 31 December | 45.1 | 62.3 |
| | |
Net benefit liability at 31 December | (19.9) | (17.0) |
| | |
Represented by: | | |
Asset recognised as non-current pension assets (funded plan) | 8.0 | 5.3 |
Liability recognised as non-current pension liabilities (unfunded plans) | (27.9) | (22.3) |
| | |
DBO specified by funded and unfunded pension plans | 65.0 | 79.4 |
| | |
Funded | 37.2 | 57.1 |
Unfunded | 27.9 | 22.3 |
| | |
Actual return on assets | 3.5 | 6.1 |
*An amount of NOK 0.9 billion, related to the plan amendment, has been recognised against Property, plant and equipment.
As part of the change of Statoil ASA’s main pension plan in Norway the estimated assets and liabilities related to paid-up policiesplans have been excluded from the 31 December 2014 amountsincluded as a settlement cost. The total impact in the table above.
Actuarial losses and gains recognised directly in Other comprehensive income (OCI) | | | |
| Full year |
(in NOK billion) | 2014 | 2013 | 2012 |
| | | |
Net actuarial (losses) gains recognised in OCI during the year | 0.2 | (5.5) | 5.3 |
Actuarial (losses) gains related to currency effects on net obligation and foreign exchange translation | (0.2) | (0.4) | 0.2 |
Tax effects of actuarial (losses) gains recognised in OCI | 0.9 | 1.2 | (1.7) |
| | | |
Recognised directly in OCI during the year net of tax | 0.9 | (4.7) | 3.8 |
| | | |
Cumulative actuarial (losses) gains recognised directly in OCI net of tax | (14.5) | (15.4) | (11.6) |
The line item Net actuarial (losses) gains recognised2016 was USD 123 million and USD 173 million in OCI during the year in 2014 includes actuarial loss charged to partners of Statoil operated licences.
2015.
178168 Statoil, Annual Report on Form 20-F 20142016
(in USD million) | 2016 | 2015 |
| | |
Defined benefit obligations (DBO) | | |
Defined benefit obligations at 1 January | 6,822 | 8,745 |
Current service cost | 239 | 378 |
Interest cost | 192 | 191 |
Actuarial (gains) losses - Financial assumptions | 879 | (703) |
Actuarial (gains) losses - Experience | (282) | (369) |
Benefits paid | (235) | (233) |
Losses (gains) from curtailment, settlement or plan amendment1) | 171 | 253 |
Paid-up policies | (131) | (143) |
Foreign currency translation | 87 | (1,332) |
Changes in notional contribution liability | 50 | 34 |
| | |
Defined benefit obligations at 31 December | 7,791 | 6,822 |
| | |
Fair value of plan assets | | |
Fair value of plan assets at 1 January | 5,127 | 6,066 |
Interest income | 148 | 145 |
Return on plan assets (excluding interest income) | 76 | 69 |
Company contributions | 22 | 35 |
Benefits paid | (80) | (70) |
Paid-up policies and personal insurance | (92) | (208) |
Foreign currency translation | 50 | (911) |
| | |
Fair value of plan assets at 31 December | 5,250 | 5,127 |
| | |
Net pension liability at 31 December | (2,541) | (1,695) |
| | |
Represented by: | | |
Asset recognised as non-current pension assets (funded plan) | 839 | 1,284 |
Liability recognised as non-current pension liabilities (unfunded plans) | (3,380) | (2,979) |
| | |
DBO specified by funded and unfunded pension plans | 7,791 | 6,822 |
| | |
Funded | 4,423 | 3,849 |
Unfunded | 3,368 | 2,974 |
| | |
Actual return on assets | 131 | 207 |
The actuarial losses from changes in financial assumptions mainly relate to increased pension liabilities due to reduced interest rates and a higher expected rate of pension increase. For 2015 Statoil recognised a gain from an opposite movement of these assumptions.
Actuarial losses and gains recognised directly in Other comprehensive income (OCI) | | | |
| |
(in USD million) | 2016 | 2015 | 2014 |
| | | |
Net actuarial (losses) gains recognised in OCI during the year | (482) | 1,139 | 24 |
Actuarial (losses) gains related to currency effects on net obligation and foreign exchange translation | (21) | 460 | 611 |
Tax effects of actuarial (losses) gains recognised in OCI | 129 | (461) | (56) |
| | | |
Recognised directly in OCI during the year net of tax | (374) | 1,138 | 580 |
| | | |
Cumulative actuarial (losses) gains recognised directly in OCI net of tax | (1,188) | (814) | (1,952) |
Statoil, Annual Report on Form 20-F 2016169
The line item Actuarial (losses) gains related to currency effects on net obligation and foreign exchange translation includes the translation of the net pension obligation in NOK to the functional currency USD for the parent company, Statoil ASA, and the translation of the net pension obligation from the functional currency USD to Statoil's presentation currency NOK.
Actuarial assumptions | Actuarial assumptions | | Actuarial assumptions |
| Assumptions used to determine benefit costs in % | Assumptions used to determine benefit obligations in % | Assumptions used to determine the effect of new pension plan in % | Assumptions used to determine benefit costs in % | Assumptions used to determine benefit obligations in % |
| Full year | | |
| 2014 | 2013 | 2014 | 2013 | At 14 November 2014 | 2016 | 2015 | 2016 | 2015 |
| | | |
Discount rate | 4.00 | 3.75 | 2.50 | 4.00 | 3.00 | 2.75 | 2.50 | 2.75 |
Rate of compensation increase | 3.50 | 3.25 | 2.25 | 3.50 | 2.75 | 2.25 |
Expected rate of pension increase | 2.50 | 1.75 | 1.50 | 2.50 | 1.75 | 1.00 | 1.50 | 1.75 | 1.00 |
Expected increase of social security base amount (G-amount) | 3.25 | 3.00 | 2.25 | 3.25 | 2.50 | 2.25 |
| | | |
Weighted-average duration of the defined benefit obligation | | 19.1 | 22.2 | | | 17.4 | 17.1 |
The assumptions presented are for the Norwegian companies in Statoil which are members of Statoil's pension fund. The defined benefit plans of other subsidiaries are immaterial to the consolidated pension assets and liabilities.
Expected attrition at 31 December 20142016 and 2015 was 2.1%, 2.2%, 1.3%, 0.5%0.4% and 0.2%0.1% for the employees under 30 years, 30-39 years, 40-49 years,between 50-59 years and 60-67 years, respectively. Expected attrition at 31 December 2013 for the same respective age categories was 2.5%, 3.0%, 1.5%, 0.5% and 0.1%.
For population in Norway, the mortality table K2013, issued by The Financial Supervisory Authority of Norway, is used as the best mortality estimate. Implementation of these tables in 2013 resulted in a gross increase in defined benefit obligation of NOK 7.4 billion.
In 2013 Statoil implemented new disabilityDisability tables for plans in Norway that resulted in a decrease in defined benefit obligation of NOK 1.6 billion. These tables have been developed by the actuary were implemented in 2013 and represent the best estimate to use for plans in Norway.
Sensitivity analysis
The table below presents an estimate of the potential effects of changes in the key assumptions for the defined benefit plans. The following estimates are based on facts and circumstances as of 31 December 2014. Actual results may materially deviate from these estimates.2016.
| Discount rate | Rate of compensation increase | Expected rate of pension increase |
(in NOK billion) | 0.50 % | -0.50 % | 0.50 % | -0.50 % | 0.50 % | -0.50 % |
| | | | | | |
Changes in: | | | | | | |
Defined benefit obligation at 31 December 2014 | (5.0) | 6.1 | 2.7 | (2.4) | 3.6 | (3.3) |
Service cost 2015 | (0.2) | 0.3 | 0.1 | (0.1) | 0.1 | (0.1) |
| Discount rate | Expected rate of compensation increase | Expected rate of pension increase | Mortality assumption |
(in USD million) | 0.50% | -0.50% | 0.50% | -0.50% | 0.50% | -0.50% | + 1 year | - 1 year |
| | | | | | | | |
Changes in: | | | | | | | | |
Defined benefit obligation at 31 December 2016 | (605) | 689 | 129 | (121) | 599 | (542) | 371 | (384) |
Service cost 2017 | (24) | 28 | 6 | (6) | 24 | (22) | 9 | (10) |
One additional year of longevity in the mortality assumptions would have an increase on the defined benefit obligation at 31 December 2014 of NOK 2.7 billion.
The sensitivity of the financial results to each of the key assumptions has been estimated based on the assumption that all other factors would remain unchanged. The estimated effects on the financial result would differ from those that would actually appear in the Consolidated financial statements because the Consolidated financial statements would also reflect the relationship between these assumptions.
170Statoil, Annual Report on Form 20-F 2016
Pension assets
The plan assets related to the defined benefit plans were measured at fair value at 31 December 2014 and 2013.value. Statoil Pension invests in both financial assets and real estate.
Real estate properties owned by Statoil Pension amounted to NOK 3.2 billionUSD 402 million and NOK 3.1 billionUSD 386 million of total pension assets at 31 December 20142016 and 2013,2015, respectively, and are rented to Statoil companies.
Statoil, Annual Report on Form 20-F 2014179
The table below presents the portfolio weighting as approved by the board of the Statoil Pension for 2014.2016. The portfolio weight during a year will depend on the risk capacity.
Pension assets on investments classes | Pension assets on investments classes | | Pension assets on investments classes | Target portfolio weight |
(in %) | 2014 | 2013 | Target portfolio weight* | 2016 | 2015 |
| | |
Equity securities | 40.1 | 39.6 | 31 - 43 | 39.0 | 38.3 | 31 - 43 |
Bonds | 38.7 | 37.6 | 36 - 48 | 41.1 | 40.3 | 36 - 48 |
Money market instruments | 13.4 | 17.2 | 0 - 29 | 13.9 | 14.9 | 0 - 29 |
Real estate | 4.8 | 5.1 | 5 - 10 | 5.4 | 5.0 | 5 - 10 |
Other assets | 3.0 | 0.5 | | 0.6 | 1.5 | |
| | |
Total | 100.0 | | 100.0 | |
* The interval expresses the scope of tactical deviation.
In 2014 100%2016 98% of the equity securities, 38%30% of bonds and 86%71% of money market instruments had quoted market prices in an active market (Level(level 1). In 20132015 100% of the equity securities, 84%38% of bonds and 96%100% of money market instruments had quoted market prices in an active market. Statoil does not have any equity securities, bonds or money market instruments classified in Level 3. Real Estate is classified as Level 3. For definition of the various levels, see note 25 Financial instruments: fair value measurement and sensitivity analysis of market risk.
No company contribution is expected to be paid to Statoil Pension in 2015.2017.
20 Provisions
(in NOK billion) | Asset retirement obligations | Other provisions | Total |
| | | |
Non-current portion at 31 December 2013 | 89.5 | 12.3 | 101.7 |
Current portion at 31 December 2013 reported as trade and other payables | 2.1 | 13.3 | 15.4 |
| | | |
Provisions at 31 December 2013 | 91.6 | 25.6 | 117.2 |
| | | |
New or increased provisions | 10.1 | 5.0 | 15.1 |
Decrease in the estimates * | (14.0) | (0.2) | (14.2) |
Amounts charged against provisions | (2.0) | (5.3) | (7.3) |
Effects of change in the discount rate | 15.0 | 0.4 | 15.5 |
Reduction due to divestments | (0.9) | (0.2) | (1.1) |
Accretion expenses | 3.7 | (0.0) | 3.7 |
Reclassification and transfer | 0.0 | (3.7) | (3.7) |
Currency translation | 5.2 | 3.8 | 9.0 |
| | | |
Provisions at 31 December 2014 | 108.8 | 25.5 | 134.2 |
| | | |
Current portion at 31 December 2014 reported as trade and other payables | 1.4 | 15.7 | 17.0 |
Non-current portion at 31 December 2014 | 107.4 | 9.8 | 117.2 |
(in USD million) | Asset retirement obligations | Claims and litigations | Other provisions | Total |
| | | | |
Non-current portion at 31 December 2015 | 10,632 | 1,116 | 675 | 12,422 |
Long term interest bearing provisions at 31 December 2015 reported as finance debt | - | - | 27 | 27 |
Current portion at 31 December 2015 reported as trade and other payables | 150 | 1,009 | 388 | 1,547 |
| | | | |
Provisions at 31 December 2015 | 10,782 | 2,124 | 1,090 | 13,997 |
| | | | |
New or increased provisions | 660 | 256 | 2,046 | 2,962 |
Decrease in the estimates | (1,168) | (21) | (583) | (1,772) |
Amounts charged against provisions | (221) | (3) | (195) | (420) |
Effects of change in the discount rate | 426 | - | 28 | 455 |
Reduction due to divestments | (41) | - | (0) | (41) |
Accretion expenses | 398 | - | - | 398 |
Reclassification and transfer | (44) | - | (0) | (45) |
Currency translation | 107 | (0) | 24 | 131 |
| | | | |
Provisions at 31 December 2016 | 10,899 | 2,356 | 2,409 | 15,664 |
| | | | |
Current portion at 31 December 2016 reported as trade and other payables | 188 | 1,147 | 922 | 2,258 |
Non-current portion at 31 December 2016 | 10,711 | 1,209 | 1,487 | 13,406 |
Expected timing of cash outflows |
(in NOK billion) | Asset retirement obligations | Other provisions | Total |
| | | |
2015 - 2019 | 11.7 | 21.9 | 33.5 |
2020 - 2024 | 11.6 | 0.4 | 12.0 |
2025 - 2029 | 22.8 | 0.1 | 22.9 |
2030 - 2034 | 20.2 | 0.6 | 20.8 |
Thereafter | 42.5 | 2.5 | 45.0 |
| | | |
At 31 December 2014 | 108.8 | 25.5 | 134.2 |
* The decrease in the estimates is mainly caused by reduced inflation expectations.
180Statoil, Annual Report on Form 20-F 20142016 171
Expected timing of cash outflows |
(in USD million) | Asset retirement obligations | Other provisions, including claims and litigations | Total |
| | | |
2017 - 2021 | 1,233 | 4,340 | 5,574 |
2022 - 2026 | 1,849 | 78 | 1,927 |
2027 - 2031 | 1,760 | 27 | 1,788 |
2032 - 2036 | 3,306 | 21 | 3,328 |
Thereafter | 2,751 | 298 | 3,048 |
| | | |
At 31 December 2016 | 10,899 | 4,765 | 15,664 |
The timing of cash outflows related to asset retirement obligations primarily depends on when the production ceases at the various facilities.
The Other provisionsclaims and litigations category mainly relates to expected payments on unresolved claims. The timing and amounts of potential settlements in respect of these provisions are uncertain and dependent on various factors that are outside management's control.
See also comments on provisions in note 23 Other commitments, contingent liabilities and contingent assets.assets.
The other provisions category relates to expected payments on onerous contracts, cancellation fees and other. In 2016 Statoil recognised a provision amounting to USD 1 billion of which USD 0.3 billion is current portion for a contingent consideration related to the BM-S-8 acquisition in Brazil. For further information, see note 4 Acquisitions and dispositions.
For further information of methods applied and estimates required, see note 2 Significant accounting policies.
21 Trade, and other payables and provisions
| At 31 December | At 31 December |
(in NOK billion) | 2014 | 2013 | |
(in USD million) | | 2016 | 2015 |
| | |
Trade payables | 21.8 | 28.3 | 2,358 | 2,052 |
Non-trade payables and accrued expenses | 25.2 | 19.0 | 1,623 | 2,323 |
Joint venture payables | 28.9 | 22.4 | 2,632 | 2,590 |
Associated companies and other related party payables | 6.6 | 9.5 | |
Equity accounted investments and other related party payables | | 620 | 622 |
| | |
Total financial trade and other payables | 82.5 | 79.2 | 7,233 | 7,587 |
Current portion of provisions and other payables | 18.1 | 16.4 | |
Current portion of provisions and other non-financial payables | | 2,433 | 1,746 |
| | |
Trade and other payables | 100.7 | 95.6 | |
Trade, other payables and provisions | | 9,666 | 9,333 |
Included in Currentcurrent portion of provisions and other non-financial payables are certain provisions that are further described in note 20 Provisions and in note 23 Other commitments, contingent liabilities and contingent assets. For information regarding currency sensitivities, see note 25 Financial instruments: fair value measurement and sensitivity analysis of market risk.risk. For further information on payables to associated companiesequity accounted investments and other related parties, see note 24 Related parties.
172Related partiesStatoil, Annual Report on Form 20-F 2016.
22 Leases
Statoil leases certain assets, notably drilling rigs, vessels and office buildings.
In 2014,2016, net rental expenditures were NOK 22.9 billion (NOK 17.4 billionUSD 2,569 million (USD 3,439 million in 20132015 and NOK 17.6 billionUSD 3,637 million in 2012)2014) consisting of which minimum lease payments were NOK 28.4 billion (NOK 21.2 billionof USD 3,113 million (USD 4,046 million in 20132015 and NOK 20.0 billionUSD 4,505 million in 2012) and2014) reduced with sublease payments received were NOK 5.5 billion (NOK 3.8 billionof USD 558 million (USD 608 million in 20132015 and NOK 2.4 billionUSD 870 million in 2012)2014). Net rental expenditures in 20142016 include rig cancellation payments of NOK 1.9 billion.USD 115 million. No material contingent rent payments have been expensed in 2014, 20132016, 2015 or 2012.2014.
The information in the table below shows future minimum lease payments due and receivable under non-cancellable operating leases at 31 December 2014:2016:
| Operating leases | Operating leases |
(in NOK billion) | Rigs | Vessels | Other | Total | Sublease | Net total | |
(in USD million) | | Rigs | Vessels | Land and buildings | Other | Total | Sublease | Net total |
| | | | |
2015 | 21.6 | 4.4 | 1.8 | 27.7 | (3.8) | 23.9 | |
2016 | 17.2 | 3.1 | 1.5 | 21.8 | (2.5) | 19.3 | |
2017 | 8.3 | 2.1 | 2.0 | 12.4 | (0.9) | 11.4 | 1,099 | 592 | 143 | 158 | 1,993 | (135) | 1,857 |
2018 | 5.7 | 2.0 | 1.6 | 9.3 | (0.8) | 8.5 | 807 | 462 | 132 | 114 | 1,514 | (100) | 1,414 |
2019 | 4.9 | 1.7 | 1.6 | 8.1 | (0.8) | 7.3 | 624 | 336 | 126 | 94 | 1,179 | (99) | 1,080 |
2020 | | 459 | 281 | 124 | 70 | 934 | (97) | 837 |
2021 | | 324 | 223 | 123 | 52 | 723 | (66) | 657 |
2022-2026 | | 572 | 396 | 591 | 91 | 1,650 | (76) | 1,574 |
2027-2031 | | - | 105 | 408 | 29 | 542 | - | 542 |
Thereafter | 11.5 | 6.5 | 10.4 | 28.4 | (2.1) | 26.4 | - | 100 | 15 | 114 | - | 114 |
| | | | |
Total future minimum lease payments | 69.1 | 19.8 | 18.9 | 107.8 | (10.9) | 96.8 | 3,885 | 2,395 | 1,746 | 624 | 8,649 | (573) | 8,076 |
Statoil had certain operating lease contracts for drilling rigs at 31 December 2014.2016. The remaining significant contracts' terms range from seven monthsone month to eight years. Certain contracts contain renewal options. Rig lease agreements are for the most part based on fixed day rates. Certain rigs have been subleased in whole or for part of the lease term mainly to Statoil operated licenses on the Norwegian continental shelf. These leases are shown gross as operating leases in the table above.
Statoil has a long-term time charter agreement with Teekay for offshore loading and transportation in the North Sea. The contract covers the lifetime of applicable producing fields and at year end 2014 included four2016 includes three crude tankers. The contract's estimated nominal amount was approximately NOK 5.0 billionUSD 650 million at year end 2014,2016, and it is included in Vesselsthe category vessels in the table above.
Statoil, Annual Report on Form 20-F 2014181
The category Otherland and buildings includes future minimum lease payments to related parties of NOK 4.3 billion related toUSD 474 million regarding the lease of twoone office buildingsbuilding located in Bergen and owned by Statoil`s pension fund (“Statoil Pension”). These operating lease commitments to a related party extend to the year 2034. NOK 3.2 billionUSD 367 million of the total is payable after 2019.2020.
Statoil had finance lease liabilities of NOK 5.4 billionUSD 507 million at 31 December 2014.2016. The nominal minimum lease payments related to these finance leases amount to NOK 7.7 billion. USD 667 million. Property, plant and equipment includes NOK 5.7 billionUSD 484 million for finance leases that have been capitalised at year end (NOK 4.9 billion(USD 768 million in 2013)2015), alsomainly presented mainly withinin the category Machinery,machinery, equipment and transportation equipment, including Vesselsvessels in note 11 Property, plant and equipmentequipment..
Certain contracts contain renewal options. The execution of such options will depend on future market development and business needs at the time when such options are to be exercised.
23 Other commitments, contingent liabilities and contingent assets
Contractual commitments
Statoil had contractual commitments of NOK 67.2 billionUSD 6,889 million at 31 December 2014.2016. The contractual commitments reflect Statoil's share and mainly comprise construction and acquisition of property, plant and equipment. equipment as well as commit<R>tThe sale of Statoil`s remaining 15.5% ownership interest</R>ed investments in Shah Deniz, announced in October 2014, will reduce contractual commitments related to Shah Deniz expansion by NOK 7.3 billion (USD 1.0 billion) .equity accounted entities.
As a condition for being awarded oil and gas exploration and production licences,licenses, participants may be committed to drill a certain number of wells. At the end of 2014,2016, Statoil was committed to participate in 3342 wells, with an average ownership interest of approximately 35%39%. Statoil's share of estimated expenditures to drill these wells amounts to NOK 8.7 billion.USD 777 million. Additional wells that Statoil may become committed to participating in depending on future discoveries in certain licenceslicenses are not included in these numbers.
Statoil, Annual Report on Form 20-F 2016173
Other long-term commitments
Statoil has entered into various long-term agreements for pipeline transportation as well as terminal use, processing, storage and entry/exit capacity commitments and commitments related to specific purchase agreements. The agreements ensure the rights to the capacity or volumes in question, but also impose on Statoil the obligation to pay for the agreed-upon service or commodity, irrespective of actual use. The contracts' terms vary, with durations of up to 30 years.
Take-or-pay contracts for the purchase of commodity quantities are only included in the table below if their contractually agreed pricing is of a nature that will or may deviate from the obtainable market prices for the commodity at the time of delivery.
Obligations payable by Statoil to entities accounted for using the equity method are included gross in the table below. For assets (for example pipelines) that Statoil accounts for by recognising its share of assets, liabilities, income and expenses (capacity costs) on a line-by-line basis in the Consolidated financial statements, the amounts in the table include the net commitment payable by Statoil (i.e. gross commitment less the non-StatoilStatoil's ownership share).
Nominal minimum other long-term commitments at 31 December 2014:2016:
(in NOK billion) | | |
(in USD million) | | |
| | |
2015 | 15.3 | |
2016 | 14.1 | |
2017 | 13.2 | 1,483 |
2018 | 12.7 | 1,395 |
2019 | 12.7 | 1,262 |
2020 | | 1,179 |
2021 | | 1,021 |
Thereafter | 143.3 | 5,513 |
| | |
Total | 211.3 | 11,853 |
The sale of Statoil`s remaining 15.5% ownership interest in Shah Deniz, will reduceLong term commitments related to long-term agreementscontracts in the process of being terminated, and for pipeline transportation by approximately NOK 60 billion upon closingwhich the termination fee has been provided for in the accounts, are not included in the above table.
Guarantees
Statoil has guaranteed for its proportionate portion of an associate’s long term bank debt, amounting to USD 160 million. The book value of the transaction.guarantee is immaterial.
Contingent liabilities and contingent assets
In 2014 Statoil received an arbitration ruling award payment which finally concluded a dispute against a counterparty concerning contractual obligations. An amount of NOK 2.8 billion (USD 0.5 billion) has been recognised in the MPR segment and presented as Other income in 2014.
A number of Statoil’s long-term gas sales agreements contain price review clauses. Certain counterparties have requested arbitration in connection with price review claims. The related exposure for Statoil has been estimated to an amount equivalent to approximately NOK 4.4 billion for gas delivered prior to year end 2014. Statoil has provided for its best estimate related to these contractual gas price disputes in the Consolidated financial statements, with the impact to the Consolidated statement of income reflected as revenue adjustments.
During the annual audits of Statoil's participation in Block 4, Block 15, Block 17 and Block 31 offshore Angola, the Angolan Ministry of Finance has assessed additional profit oil and taxes due on the basis of activities that currently include the years 2002 up to and including 2011.2014. Statoil disputes the assessments and is pursuing these matters in accordance with relevant Angolan legal and administrative procedures. On the basis of the assessments and continued activity on the four blocks up to and including 2014,2016, the exposure for Statoil at year end 20142016 is estimated at NOK 9.3 billion (USD 1.2 billion),to USD 1,808 million, the most significant part of which relates to profit oil elements. Statoil has provided in the Consolidated financial statements for its best estimate related to
182Statoil, Annual Report on Form 20-F 2014
the assessments, reflected in the Consolidated statement of income mainly as a revenue reduction, with additional amounts reflected as interest expenses and tax expenses, respectively.
Through its ownership in OML 128 in Nigeria, Statoil is party to an ownership interest redetermination process for the Agbami field. In October 2015, Statoil received the Expert’s final ruling which implies a reduction of 5.17 percentage points in Statoil’s equity interest in the field. Statoil had previously initiated arbitration proceedings to set aside interim decisions made by the Expert, but this was declined by the arbitration tribunal in its November 2015 judgment. Statoil has initiated proceedings before the Federal High Court in Lagos to set aside the arbitration award. In October 2016 Statoil also initiated a new arbitration to set aside the Expert’s final ruling. Currently Statoil has two distinct, but connected, legal processes ongoing related to the Agbami redetermination. As of 31 December 2016, Statoil has recognised a provision of USD 1,104 million net of tax, which reflects a reduction of 5.17 percentage points in Statoil’s equity interest in the Agbami field. The provision is reflected within Provisions in the Consolidated balance sheet.
Some long term gas sales agreements contain price review clauses. Certain counterparties have requested arbitration in connection with price review claims. The related exposure for Statoil has been estimated to an amount equivalent to approximately USD 374 million for gas delivered prior to year end 2016. Statoil has provided for its best estimate related to these contractual gas price disputes in the Consolidated financial statements, with the impact to the Consolidated statement of income reflected as revenue adjustments.
There is a dispute between the Nigerian National Petroleum Corporation (NNPC) and the partners (Contractor) in Oil Mining Lease (OML) 128 of the unitised Agbami field concerning interpretation of the terms of the OML 128 Production Sharing Contract (PSC). The dispute relates to the allocation between NNPC and Contractor of cost oil, tax oil and profit oil volumes. NNPC claims that in aggregate from the year 2009 to 2014, Contractor has lifted excess volumes compared to the PSC terms, and consequently NNPC has increased its lifting of oil. The Contractor disputes NNPC's position. Arbitration has been initiated arbitration in the matter in accordance with the terms of the PSC. In 2015 the Arbitral Tribunal ruled in favour of Contractor’s interpretation of the PSC on the main points. The Contractor is currently proceeding to enforce the favourable decision by the means available in the Nigerian legal system, while NNPC on its hand has initiated litigation concerning certain objections to the arbitration award. The Nigerian Federal Inland Revenue Service is also contesting the legality of the arbitration process as far as resolving tax related disputes goes, and is actively pursuing this view throughin March 2017 the channels ofarbitration award was set aside by the Nigerian legal system.Federal High Court (FHC) based on the dispute having a tax nature and therefore being non-arbitrable. The exposure for Contractor will challenge this ruling in the Court of Appeal. The FHC’s ruling will not impact Statoil’s
174Statoil, Annual Report on Form 20-F 2016
2016 financial statements, as Statoil’s stake in the dispute at year end 2014 is mainly relatedrelates to cost oil and profit oil volumes and has been estimated at NOK 1.9 billion (USD 0.3 billion). Statoil has provided in the Consolidated financial statements for its best estimate relatedpreviously lifted by NNPC contrary to the claims, whichPSC terms. NNPC has been reflected incontinued overlifting contrary to the Consolidated statement of income as a reduction of revenue.
Through its ownership in OML 128 in Nigeria, Statoil is party to an ownership interest redetermination process for the Agbami field for which the outcome is uncertain. Statoil has disputed certain aspects of the basis for the redetermination, and an arbitration process has been initiated. The exposure for Statoil at year end 2014 has been estimated to approximately NOK 6.3 billion (USD 0.8 billion). Statoil has made a provision based on its best estimate for the redetermination process. The provision has been reflected within Provisions in the Consolidated balance sheet at 31 December 2014.award.
In 2014, followingBrazilian tax authorities have issued an updated tax assessment for 2011 for Statoil’s Brazilian subsidiary which was party to Statoil’s divestment of 40% of the Peregrino field to Sinochem at that time. The assessment disputes Statoil’s allocation of the sale proceeds between entities and assets involved, resulting in a regular reviewsignificantly higher assessed taxable gain and related taxes payable in Brazil. Statoil disagrees with the assessment, and has provided an initial response to this effect. The process of formal communication with the Brazilian tax authorities, as well as any subsequent litigation that may become necessary, may take several years. No taxes will become payable until the matter has been finally settled. Statoil is of the view that all applicable tax regulations have been applied in the case and that the group has a strong position. No amounts have consequently been provided for in the accounts.
On 26 September 2016, the Norwegian Ministry of Finance (MoF) denied Statoil’s 2012 Consolidated financial statements,appeal related to a 2014 order from the Financial Supervisory Authority of Norway (the FSA) ordered Statoil to: ” Change its future accounting practices for redeterminationto change the timing of CGUs containing onerous contracts. Correct the described error by establishing a separateCove Point related onerous contract provision for the Cove Point capacity contract into a financial period prior to Q1-2013. The correction shall be presented in the next periodic financial report. Information about the circumstances shall be given in notes to the accounts.” Statoil appealed the order and has been granted a stay in carrying out the FSA’s order pending the final outcome of the appeal. The appeal is currently being assessed by the Norwegian Ministry of Finance and not yet concluded. If the outcome of the appeal would require implementing the FSA’s order, a provision would be recognised against Net operating income in an earlier reporting period than 2013. As the contracts were fully provided for in 2013, there would be no impact on equity at 31 December 2013 or thereafter. The actual amount to be provided in an earlier period would depend on the period in which the provision would be recorded. The FSA order does not specify which period prior to the first quarter of 2013, would be relevantin which Statoil originally reflected the provision. Statoil has decided not to pursue the matter further, as it does not impact any comparative financial periods presented in the annual Consolidated financial statements of 2016. Further reference is made to Note 23 Other commitments, contingent liabilities and contingent assets of Statoil’s 2015 Financial Statements.
On 6 July 2016, the Norwegian tax authorities issued a deviation notice for the provisionyears 2012 to be recognised. Statoil’s reading is that 2011 would be most relevant. There would be no impact2014 related to the internal pricing on the 2014 financial statements, however, the comparative amounts included therein for 2013 Net operating incomecertain transactions between Statoil Coordination Centre (SCC) in Belgium and Net income would be NOK 5.6 billion and NOK 5.0 billion higher, respectively. There would be a minor impact on the 2012 Consolidated statement of income, and a NOK 5.0 billion reductionNorwegian entities in the 2012 Shareholder’s equity.Statoil group. The main issue relates to SCC`s capital structure and its compliance with the arm’s length principle. Statoil is of the view that arm’s length pricing has been applied in these cases and that the group has a strong position, and no amounts have consequently been provided for in the accounts.
During the normal course of its business, Statoil is involved in legal proceedings, and several other unresolved claims are currently outstanding. The ultimate liability or asset, in respect of such litigation and claims cannot be determined at this time. Statoil has provided in its Consolidated financial statements for probable liabilities related to litigation and claims based on its best estimate. Statoil does not expect that its financial position, results of operations or cash flows will be materially affected by the resolution of these legal proceedings.
Statoil is actively pursuing the above disputes through the contractual and legal means available in each case, but the timing of the ultimate resolutions and related cash flows, if any, cannot at present be determined with sufficient reliability.
Provisions related to claims are reflected within note 20 Provisions.
24 Related parties
Transactions with the Norwegian State
The Norwegian State is the majority shareholder of Statoil and also holds major investments in other Norwegian companies. As of 31 December 20142016 the Norwegian State had an ownership interest in Statoil of 67.0% (excluding Folketrygdfondet, (Norwegianthe Norwegian national insurance fund)fund, of 3.1%3.2%). This ownership structure means that Statoil participates in transactions with many parties that are under a common ownership structure and therefore meet the definition of a related party. All transactions are considered to be on an arm's length basis.
Total purchases of oil and natural gas liquids from the Norwegian State amounted to NOK 86.4 billion, NOK 92.5 billionUSD 5,848 million, USD 7,431 million and NOK 96.6 billionUSD 13,718 million in 2016, 2015 and 2014, 2013 and 2012, respectively. PurchasesTotal purchases of natural gas regarding the Tjeldbergodden methanol plant from the Norwegian State amounted to NOK 0.5 billion, NOK 0.5 billionUSD 44 million, USD 68 million and NOK 0.4 billionUSD 73 million in 2016, 2015 and 2014, 2013respectively. These purchases of oil and 2012, respectively.natural gas are recorded in Statoil ASA. In addition, Statoil ASA sells in its own name, but for the Norwegian State’s account and risk, the Norwegian State’s gas production. These amountstransactions are presented net. For further information please see in note 2 Significant accounting policies. The most significant items included in the line item Associated companiesequity accounted investments and other related party payables in note 21 Trade and other payables, are amounts payable to the Norwegian State for these purchases.
Other transactions
In relation to its ordinary business operations Statoil enters into contracts such as pipeline transport, gas storage and processing of petroleum products, Statoil also has regular transactions with certain entitiescompanies in which Statoil has ownership interests. Such transactions are carried out on an arm's length basis and are included within the applicable captions in the Consolidated statement of income. Gassled and certain other infrastructure assets are operated by Gassco AS, which is an entity under common control by the Norwegian Ministry of Petroleum and Energy. Gassco’s activities are performed on behalf of and for the risk and reward of pipeline and terminal owners, and capacity payments flow through Gassco to the respective owners. Statoil payments that flowed through Gassco in this respect amounted to USD 1,167 million, USD 1,105 million and USD 1,476 million in 2016, 2015 and 2014, respectively. These payments are recorded in Statoil ASA. In addition, Statoil ASA process in its own name, but for the Norwegian State’s account and risk, the Norwegian State’s share of the Gassco costs. These transactions are presented net.
On 30 June 2016, Statoil increased its ownership interest in Lundin Petroleum AB (Lundin) to 20.1% of the outstanding shares and votes. Since 30 June, total purchase of oil and related products from Lundin amounted to USD 155 million. The purchase of oil and related products is recorded in Statoil ASA. For more information concerning the Lundin acquisition, see note 4 Acquisitions and disposals.
For information concerning certain lease arrangements with Statoil Pension, see note 22 Leases.
Statoil, Annual Report on Form 20-F 2016175
Related party transactions with management are presented in note 6 RemunerationRemuneration.. Management remuneration for 20142016 is presented in note 5 4 Remuneration in the financial statements of the parent company, Statoil ASA.
Statoil, Annual Report on Form 20-F 2014183
25 Financial instruments: fair value measurement and sensitivity analysis of market risk
Financial instruments by category
The following tables present Statoil's classes of financial instruments and their carrying amounts by the categories as they are defined in IAS 39 Financial Instruments: Recognition and Measurement.Measurement. All financial instruments' carrying amounts are measured at fair value or their carrying amounts reasonably approximate fair value except non-current financial liabilities. See note 18 Financedebt for fair value information of non-current bonds, bank loans and finance lease liabilities.
See note 2 Significant accounting policies for further information regarding measurement of fair values.
| | | | Fair value through profit or loss | | | | | | Fair value through profit or loss | | |
(in NOK billion) | Note | Loans and receivables | Available for sale | Held for trading | Fair value option | Non-financial assets | Total carrying amount | |
(in USD million) | | Note | Loans and receivables | Available for sale | Held for trading | Fair value option | Non-financial assets | Total carrying amount |
| | | | | | | | |
At 31 December 2014 | | | | | |
At 31 December 2016 | | | | | |
Assets | | | | | | | | |
Non-current derivative financial instruments | | 0.0 | 29.9 | 0.0 | 29.9 | | - | 1,819 | - | 1,819 |
Non-current financial investments | 13 | 0.0 | 1.4 | 0.0 | 18.2 | 0.0 | 19.6 | 13 | - | 207 | - | 2,137 | - | 2,344 |
Prepayments and financial receivables | 13 | 2.7 | 0.0 | 0.0 | 2.9 | 5.7 | 13 | 707 | - | - | 185 | 893 |
| | | | | | | | |
Trade and other receivables | 15 | 73.7 | 0.0 | 0.0 | 9.6 | 83.3 | 15 | 7,074 | - | - | 765 | 7,839 |
Current derivative financial instruments | | 0.0 | 5.3 | 0.0 | 5.3 | | - | 492 | - | 492 |
Current financial investments | 13 | 9.8 | 0.0 | 43.4 | 6.0 | 0.0 | 59.2 | 13 | 3,217 | - | 4,176 | 818 | - | 8,211 |
Cash and cash equivalents | 16 | 48.9 | 0.0 | 34.2 | 0.0 | 83.1 | 16 | 2,791 | - | 2,299 | - | 5,090 |
| | | | | | | | |
Total | | 135.2 | 1.4 | 112.8 | 24.2 | 12.6 | 286.2 | | 13,789 | 207 | 8,785 | 2,955 | 950 | 26,687 |
| | | | | | | | |
| | | | | | | | |
| | | | Fair value through profit or loss | | | | | | Fair value through profit or loss | | �� |
(in NOK billion) | Note | Loans and receivables | Available for sale | Held for trading | Fair value option | Non-financial assets | Total carrying amount | |
(in USD million) | | Note | Loans and receivables | Available for sale | Held for trading | Fair value option | Non-financial assets | Total carrying amount |
| | | | | | | | |
At 31 December 2013 | | | | | |
At 31 December 2015 | | | | | |
Assets | | | | | | | | |
Non-current derivative financial instruments | | 0.0 | 22.1 | 0.0 | 22.1 | | - | 2,697 | - | 2,697 |
Non-current financial investments | 13 | 0.0 | 0.9 | 0.0 | 15.6 | 0.0 | 16.4 | 13 | - | 209 | - | 2,127 | - | 2,336 |
Prepayments and financial receivables | 13 | 3.5 | 0.0 | 0.0 | 5.0 | 8.5 | 13 | 655 | - | - | 313 | 967 |
| | | | | | | | |
Trade and other receivables | 15 | 75.5 | 0.0 | 0.0 | 6.2 | 81.8 | 15 | 5,834 | - | - | 837 | 6,671 |
Current derivative financial instruments | | 0.0 | 2.9 | 0.0 | 2.9 | | - | 542 | - | 542 |
Current financial investments | 13 | 4.5 | 0.0 | 29.4 | 5.3 | 0.0 | 39.2 | 13 | 2,166 | 1 | 6,973 | 677 | - | 9,817 |
Cash and cash equivalents | 16 | 47.9 | 0.0 | 37.4 | 0.0 | 85.3 | 16 | 3,081 | - | 5,541 | - | 8,623 |
| | | | | | | | |
Total | | 131.5 | 0.9 | 91.8 | 20.9 | 11.2 | 256.2 | | 11,736 | 210 | 15,753 | 2,804 | 1,150 | 31,652 |
184176 Statoil, Annual Report on Form 20-F 20142016
(in NOK billion) | Note | Amortised cost | Fair value through profit or loss | Non-financial liabilities | Total carrying amount | |
(in USD million) | | Note | Amortised cost | Fair value through profit or loss | Non-financial liabilities | Total carrying amount |
| | | | |
At 31 December 2014 | | | |
At 31 December 2016 | | | |
Liabilities | | | | |
Non-current finance debt | 18 | 205.1 | 0.0 | 205.1 | 18 | 27,999 | - | 27,999 |
Non-current derivative financial instruments | | 0.0 | 4.5 | 0.0 | 4.5 | | - | 1,420 | - | 1,420 |
| | | | |
Trade and other payables | 21 | 82.5 | 0.0 | 18.1 | 100.7 | 21 | 7,233 | - | 2,433 | 9,666 |
Current finance debt | 18 | 26.5 | 0.0 | 26.5 | 18 | 3,674 | - | 3,674 |
Dividend payable | | 5.7 | 0.0 | 5.7 | | 712 | - | 712 |
Current derivative financial instruments | | 0.0 | 6.6 | 0.0 | 6.6 | | - | 508 | - | 508 |
| | | | |
Total | | 319.8 | 11.1 | 18.1 | 349.1 | | 39,618 | 1,928 | 2,433 | 43,979 |
| | | | |
| | | | |
(in NOK billion) | Note | Amortised cost | Fair value through profit or loss | Non-financial liabilities | Total carrying amount | |
(in USD million) | | Note | Amortised cost | Fair value through profit or loss | Non-financial liabilities | Total carrying amount |
| | | | |
At 31 December 2013 | | | |
At 31 December 2015 | | | |
Liabilities | | | | |
Non-current finance debt | 18 | 165.5 | 0.0 | 165.5 | 18 | 29,965 | - | 29,965 |
Non-current derivative financial instruments | | 0.0 | 2.2 | 0.0 | 2.2 | | - | 1,285 | - | 1,285 |
| | | | |
Trade and other payables | 21 | 79.2 | 0.0 | 16.4 | 95.6 | 21 | 7,587 | - | 1,746 | 9,333 |
Current finance debt | 18 | 17.1 | 0.0 | 17.1 | 18 | 2,326 | - | 2,326 |
Dividend payable | | | 700 | - | 700 |
Current derivative financial instruments | | 0.0 | 1.5 | 0.0 | 1.5 | | - | 264 | - | 264 |
| | | | |
Total | | 261.8 | 3.7 | 16.4 | 281.9 | | 40,578 | 1,549 | 1,746 | 43,873 |
Fair value hierarchy
The following table summarises each class of financial instruments which are recognised in the Consolidated balance sheet at fair value, split by Statoil's basis for fair value measurement.
(in NOK billion) | Non-current financial investments | Non-current derivative financial instruments - assets | Current financial investments | Current derivative financial instruments - assets | Cash equivalents | Non-current derivative financial instruments - liabilities | Current derivative financial instruments - liabilities | Net fair value | |
(in USD million) | | Non-current financial investments | Non-current derivative financial instruments - assets | Current financial investments | Current derivative financial instruments - assets | Cash equivalents | Non-current derivative financial instruments - liabilities | Current derivative financial instruments - liabilities | Net fair value |
| | |
At 31 December 2014 | | |
At 31 December 2016 | | |
Level 1 | 11.1 | 0.0 | 4.0 | 0.0 | 15.1 | 1,095 | - | 516 | - | 1,611 |
Level 2 | 7.0 | 17.2 | 45.5 | 4.7 | 34.2 | (4.5) | (6.6) | 97.4 | 1,042 | 970 | 4,479 | 426 | 2,299 | (1,414) | (503) | 7,299 |
Level 3 | 1.4 | 12.7 | 0.0 | 0.6 | 0.0 | (0.0) | 14.7 | 207 | 848 | - | 66 | - | (6) | (4) | 1,110 |
| | |
Total fair value | 19.6 | 29.9 | 49.4 | 5.3 | 34.2 | (4.5) | (6.6) | 127.3 | 2,344 | 1,819 | 4,994 | 492 | 2,299 | (1,420) | (508) | 10,019 |
| | |
At 31 December 2013 | | |
At 31 December 2015 | | |
Level 1 | 8.7 | 0.0 | 4.0 | 0.0 | (0.0) | 12.7 | 1,194 | - | 542 | - | 1,737 |
Level 2 | 6.9 | 10.1 | 30.7 | 1.6 | 37.4 | (2.2) | (1.5) | 83.0 | 932 | 1,756 | 7,109 | 491 | 5,541 | (1,226) | (264) | 14,340 |
Level 3 | 0.9 | 12.0 | 0.0 | 1.3 | 0.0 | (0.0) | 14.2 | 209 | 941 | - | 50 | - | (59) | - | 1,141 |
| | |
Total fair value | 16.4 | 22.1 | 34.7 | 2.9 | 37.4 | (2.2) | (1.5) | 109.9 | 2,336 | 2,697 | 7,651 | 542 | 5,541 | (1,285) | (264) | 17,218 |
Level 1, fair value based on prices quoted in an active market for identical assets or liabilities, includes financial instruments actively traded and for which the values recognised in the Consolidated balance sheet are determined based on observable prices on identical instruments. For Statoil this category will, in most cases, only be relevant for investments in listed equity securities and government bonds.
Statoil, Annual Report on Form 20-F 2016177
Level 2, fair value based on inputs other than quoted prices included within Levellevel 1, which are derived from observable market transactions, includes Statoil's non-standardised contracts for which fair values are determined on the basis of price inputs from observable market transactions. This will typically be when Statoil uses forward prices on crude oil, natural gas, interest rates and foreign exchange rates as inputs to the valuation models to determining the fair value of its derivative financial instruments.
Statoil, Annual Report on Form 20-F 2014185
Level 3, fair value based on unobservable inputs, includes financial instruments for which fair values are determined on the basis of input and assumptions that are not from observable market transactions. The fair values presented in this category are mainly based on internal assumptions. The internal assumptions are only used in the absence of quoted prices from an active market or other observable price inputs for the financial instruments subject to the valuation.
The fair value of certain earn-out agreements and embedded derivative contracts are determined by the use of valuation techniques with price inputs from observable market transactions as well as internally generated price assumptions and volume profiles. The discount rate used in the valuation is a risk-free rate based on the applicable currency and time horizon of the underlying cash flows adjusted for a credit premium to reflect either Statoil's credit premium, if the value is a liability, or an estimated counterparty credit premium if the value is an asset. In addition a risk premium for risk elements not adjusted for in the cash flow may be included when applicable. The fair values of these derivative financial instruments have been classified in their entirety in the third category within Currentcurrent derivative financial instruments and Non-currentnon-current derivative financial instruments - assets in the table above.instruments. Another reasonable assumption, that could have been applied when determining the fair value of these contracts, would be to extrapolate the last observed forward prices with inflation. If Statoil had applied this assumption, the fair value of the contracts included would have decreased by approximately NOK 3.5 billionUSD 97 million at end of 20142016 and decreased by NOK 0.5 billionUSD 526 million at end of 20132015 and impacted the Consolidated statement of income with corresponding amounts.
The reconciliation of the changes in fair value during 20142016 and 20132015 for all financial assetsinstruments classified in the third level in the hierarchy are presented in the following table.
(in NOK billion) | Non-current financial investments | Non-current derivative financial instruments - assets | Current derivative financial instruments - assets | Total amount |
| | | | |
Full year 2014 | | | | |
Opening balance | 0.9 | 12.0 | 1.3 | 14.2 |
Total gains and losses recognised | | | | |
- in statement of income | (0.0) | 0.3 | 0.6 | 0.9 |
- in other comprehensive income | 0.0 | 0.0 | 0.0 | 0.0 |
Purchases | 0.3 | 0.0 | 0.0 | 0.3 |
Sales | 0.0 | 0.4 | 0.0 | 0.4 |
Settlement | (0.0) | 0.0 | (1.3) | (1.3) |
Foreign currency translation differences | 0.2 | 0.1 | (0.0) | 0.3 |
| | | | |
Closing balance | 1.4 | 12.7 | 0.6 | 14.8 |
| | | | |
Full year 2013 | | | | |
Opening balance | 1.2 | 16.6 | 1.4 | 19.2 |
Total gains and losses recognised | | | | |
- in statement of income | (0.4) | (5.4) | 1.3 | (4.5) |
- in other comprehensive income | 0.0 | 0.0 | 0.0 | 0.0 |
Purchases | 0.3 | 0.0 | 0.0 | 0.3 |
Sales | 0.0 | 0.7 | 0.0 | 0.7 |
Settlement | (0.3) | 0.0 | (1.4) | (1.7) |
Foreign currency translation differences | 0.1 | 0.0 | (0.0) | 0.1 |
| | | | |
Closing balance | 0.9 | 12.0 | 1.3 | 14.2 |
(in USD million) | Non-current financial investments | Non-current derivative financial instruments - assets | Current derivative financial instruments - assets | Non-current derivative financial instruments liabilities | Current derivative financial instruments - liabilities | Total amount |
| | | | | | |
Full year 2016 | | | | | | |
Opening balance | 209 | 941 | 50 | (59) | - | 1,141 |
Total gains and losses recognised in statement of income | - | (98) | 66 | 49 | - | 17 |
Purchases | 2 | - | - | - | - | 2 |
Settlement | (5) | (17) | (53) | - | - | (75) |
Transfer to current portion | - | (1) | 1 | 4 | (4) | - |
Foreign currency translation differences | 1 | 23 | 1 | - | - | 25 |
| | | | | | |
Closing balance | 207 | 848 | 66 | (6) | (4) | 1,110 |
| | | | | | |
Full year 2015 | | | | | | |
Opening balance | 189 | 1,707 | 87 | - | - | 1,983 |
Total gains and losses recognised in statement of income | (2) | (442) | 54 | (59) | - | (449) |
Purchases | 28 | - | - | - | - | 28 |
Settlement | - | (110) | (79) | - | - | (190) |
Foreign currency translation differences | (5) | (214) | (11) | - | - | (231) |
| | | | | | |
Closing balance | 209 | 941 | 50 | (59) | - | 1,141 |
The assetsDuring 2016 the financial instruments within Levellevel 3 during 2014 have had a net increasedecrease in the fair value of NOK 0.6 billion. Of the NOK 0.9 billionUSD 31 million. The USD 44 million recognised in the Consolidated statement of income during 2014, NOK 0.8 billion is2016 are impacted by a reduction of USD 13 million related to changes in fair value of certain earn-out agreements. Related to the same earn-out agreements, NOK 1.3 billionUSD 69 million included in the opening balance for 20142016 has been fully realised as the underlying volumes have been delivered during 20142016 and the amount is presented as settled in the above table.
Substantially all gains and losses recognised in the Consolidated statement of income during 20142016 are related to assets held at the end of 2014.2016.
Sensitivity analysis of market risk
Commodity price risk
The table below contains the fair value and related commodity price risk sensitivities of Statoil's commodity based derivatives contracts. For further information related to the type of commodity risks and how Statoil manages these risks, see note 5 Financial risk management.
Statoil's assets and liabilities resulting from commodity based derivatives contracts are mainly related toconsist of both exchange traded and non-exchange traded derivative instruments, including embedded derivatives that have been bifurcated and recognised at fair value in the Consolidated balance sheet.
Price risk sensitivities at the end of 20142016 and 2013 have been calculated assuming2015 at 30% are assumed to represent a reasonably possiblelikely change based on the duration of 40% in crude oil, refined products, electricity and natural gas prices. the derivatives.
186178 Statoil, Annual Report on Form 20-F 20142016
Since none of the derivative financial instruments included in the table below are part of hedging relationships, any changes in the fair value would be recognised in the Consolidated statement of income.
(in NOK billion) | - 40% sensitivity | 40% sensitivity | |
Commodity price sensitivity | | 2016 | 2015 |
(in USD million) | | - 30% | + 30% | - 30% | + 30% |
| | | | |
At 31 December 2014 | | | |
At 31 December | | |
Crude oil and refined products net gains (losses) | (5.8) | 5.8 | 395 | (390) | 110 | (66) |
Natural gas and electricity net gains (losses) | 0.9 | (0.9) | 810 | (809) | 249 | (248) |
| | | | |
At 31 December 2013 | | | |
Crude oil and refined products net gains (losses) | (6.6) | 6.6 | |
Natural gas and electricity net gains (losses) | (0.2) | 0.2 | |
Currency risk
Currency risk constitutes significant financial risk for Statoil. In accordance with approved strategies and mandates total exposure is managed at a portfolio level on a regular basis. For further information related to the currency risk and how Statoil manages these risks, see note 5 Financial risk management.
The following currency risk sensitivities at the end of 2014 and 2013 havesensitivity has been calculated by assuming a 9%an 12% reasonably possible change in the main foreign exchange rates that Statoil is exposed to. At the end of 2015 a change of 11% in the foreign exchange rates were viewed as reasonably possible changes. An increase in the foreign exchange rates by 9% means that the transaction currency has strengthened in value. The estimated gains and the estimated losses following from a change in the foreign exchange rates would impact the Consolidated statement of income.
(in NOK billion) | - 9% sensitivity | 9% sensitivity |
| | |
At 31 December 2014 | | |
USD net gains (losses) | 8.1 | (8.1) |
NOK net gains (losses) | (8.3) | 8.3 |
| | |
At 31 December 2013 | | |
USD net gains (losses) | 8.7 | (8.7) |
NOK net gains (losses) | (8.0) | 8.0 |
Interest rate risk
Interest rate risk constitutes significant financial risk for Statoil. In accordance with approved strategies and mandates total exposure is managed at a portfolio level on a regular basis. For further information related to the interest riskscurrency risk and how Statoil manages these risks, see note 5 Financial risk management.
Currency risk sensitivity | 2016 | 2015 |
(in million) | - 12% | + 12% | - 11% | + 11% |
| | | | |
At 31 December | | | | |
USD net gains (losses) | 79 | (79) | 247 | (247) |
NOK net gains (losses) | 31 | (31) | (185) | 185 |
| | | | |
Interest rate risk
The following interest rate risk sensitivity has been calculated by assuming a 0.8%change of 0.8 percentage points as reasonably possible changes in the interest rates at the end of 2014.2016. At the end of 20132015 a change of 1.0%0.9 percentage points in the interest rates werewas viewed as reasonably possible changes. The estimated gains following from a decrease in the interest rates and the estimated losses following from an interest rate increase would impact the Consolidated statement of income. For further information related to the interest risks and how Statoil manages these risks, see note 5 Financial risk management.
(in NOK billion) | - 0.8% sensitivity | 0.8% sensitivity |
| | |
At 31 December 2014 | | |
Interest rate net gains (losses) | 7.1 | (7.1) |
| | |
| | |
(in NOK billion) | - 1% sensitivity | 1% sensitivity |
| | |
At 31 December 2013 | | |
Interest rate net gains (losses) | 6.1 | (6.1) |
Interest risk sensitivity | 2016 | 2015 |
(in USD million) | - 0.8 percentage points | + 0.8 percentage points | - 0.9 percentage points | + 0.9 percentage points |
| | | | |
At 31 December | | | | |
Interest rate net gains (losses) | 897 | (897) | 1,217 | (1,217) |
Statoil, Annual Report on Form 20-F 20142016 187179
26 Condensed consolidated financial information relatedChange of presentation currency
On 1 January 2016 Statoil changed its presentation currency from Norwegian kroner (NOK) to guaranteed debt securitiesUS dollars (USD). The change was made mainly in order to better reflect the underlying USD exposure of Statoil’s business activities and to align with industry practice.
Statoil Petroleum AS, a 100% owned subsidiary of Statoil ASA, is the co-obligor of certain existing debt securities of Statoil ASA that are registered under the US Securities Act of 1933 ("US registered debt securities"). As co-obligor, Statoil Petroleum AS fully, unconditionally and irrevocably assumes and agrees to perform, jointly and severally with Statoil ASA, the payment and covenant obligations for these US registered debt securities. In addition, Statoil ASA is also the co-obligor of a US registered debt security of Statoil Petroleum AS. As co-obligor, Statoil ASA fully, unconditionally and irrevocably assumes and agrees to perform, jointly and severally with Statoil Petroleum AS, the payment and covenant obligations of that security. In the future, Statoil ASA may from time to time issue future US registered debt securities for which Statoil Petroleum AS will be the co-obligor or guarantor.
The following financial information on a condensed consolidated basis provides financial information about Statoil ASA, as issuer and co-obligor, Statoil Petroleum AS, as co-obligor and guarantor, and all other subsidiaries as required by SEC Rule 3-10 of Regulation S-X. The condensed consolidated information is preparedchange in accordance with Statoil's IFRS accounting policies as described in note 2 Significant accounting policies, except that investments in subsidiaries and jointly controlled entities arepresentation currency has been accounted for usingas a policy change, and comparative figures have been re-presented to USD, to reflect the change in presentation currency. There are no policy changes other than the change in presentation currency.
The different components of assets and liabilities in USD correspond to the amount published in NOK translated at the USD/NOK closing rate applicable at the end of each reporting period. The same relates to the equity method as required by Rule 3-10.a whole. As such, the change in presentation currency will not impact the valuation of assets, liabilities, equity or any ratios between these components, such as debt to equity ratios. Income statements are translated at quarterly average rate.
All currency translation adjustments have been set to zero as of 1 January 2006, which was the date of Statoil’s transition to IFRS. Translation adjustments and cumulative translation adjustments have been presented as if Statoil had used USD as the presentation currency from that date.
The following is condensed consolidated financial informationrecalculation of currency translation adjustments in USD has an impact on the distribution of shareholders’ equity for comparable periods, between currency translation adjustments and other components of equity. Together with changes in net income arising from the full year 2014, 2013 and 2012, andchange in presentation currency, these effects are presented as of 31 December 2014 and 2013.re-presentations in the table below.
CONDENSED CONSOLIDATED STATEMENT OF INCOME AND OTHER COMPREHENSIVE INCOME |
| Statoil ASA | Statoil Petroleum AS | Non-guarantor subsidiaries | Consolidation adjustments | The Statoil group |
Full year 2014 (in NOK billion) |
| | | | | |
Revenues and other income | 411.1 | 210.8 | 213.7 | (212.7) | 622.9 |
Net income from equity accounted companies | 21.6 | (32.7) | (0.2) | 11.0 | (0.3) |
| | | | | |
Total revenues and other income | 432.8 | 178.1 | 213.4 | (201.6) | 622.7 |
| | | | | |
Total operating expenses | (417.8) | (89.1) | (222.4) | 216.0 | (513.2) |
| | | | | |
Net operating income | 15.0 | 89.0 | (8.9) | 14.4 | 109.5 |
| | | | | |
Net financial items | (12.6) | 0.0 | (0.4) | 12.9 | (0.0) |
| | | | | |
Income before tax | 2.4 | 89.0 | (9.3) | 27.3 | 109.4 |
| | | | | |
Income tax | 6.6 | (81.3) | (11.5) | (1.2) | (87.4) |
| | | | | |
Net income | 9.0 | 7.7 | (20.8) | 26.0 | 22.0 |
| | | | | |
Other comprehensive income | 55.4 | 26.0 | 70.5 | (109.3) | 42.5 |
| | | | | |
Total comprehensive income | 64.4 | 33.7 | 49.7 | (83.3) | 64.5 |
EFFECT OF CHANGES IN REPORTED EQUITY | | | | |
| | | | |
| Historical Consolidated financial statements in NOK billion | Historical Consolidated financial statements in USD million1) | Re-presentation in USD million | Consolidated financial statements in USD million |
31 December 2015 |
| | | | |
Share capital | 8.0 | 905 | 234 | 1,139 |
Additional paid-in capital | 40.1 | 4,552 | 1,168 | 5,720 |
Retained earnings | 215.1 | 24,417 | 14,276 | 38,693 |
Currency translation adjustments | 91.6 | 10,398 | (15,679) | (5,281) |
Non-controlling interests | 0.3 | 34 | 2 | 36 |
| | | | |
Total equity | 355.1 | 40,307 | 0 | 40,307 |
| | | | |
1) Translated at exchange rate USD/NOK 8,8090 as of 31 December 2015. | | | | |
| | | | |
| Historical Consolidated financial statements in NOK billion | Historical Consolidated financial statements in USD million1) | Re-presentation in USD million | Consolidated financial statements in USD million |
31 December 2014 |
| | | | |
Share capital | 8.0 | 1,072 | 67 | 1,139 |
Additional paid-in capital | 40.2 | 5,408 | 306 | 5,714 |
Retained earnings | 268.4 | 36,097 | 9,580 | 45,677 |
Currency translation adjustments | 64.3 | 8,650 | (9,955) | (1,305) |
Non-controlling interests | 0.4 | 54 | 3 | 57 |
| | | | |
Total equity | 381.2 | 51,282 | 0 | 51,282 |
| | | | |
1) Translated at exchange rate USD/NOK 7,4332 as of 31 December 2014. |
188180 Statoil, Annual Report on Form 20-F 20142016
CONDENSED CONSOLIDATED STATEMENT OF INCOME AND OTHER COMPREHENSIVE INCOME |
| Statoil ASA | Statoil Petroleum AS | Non-guarantor subsidiaries | Consolidation adjustments | The Statoil group |
Full year 2013 (in NOK billion) |
| | | | | |
Revenues and other income | 416.7 | 228.8 | 212.1 | (223.2) | 634.4 |
Net income from equity accounted companies | 55.0 | (8.0) | (0.2) | (46.6) | 0.1 |
| | | | | |
Total revenues and other income | 471.7 | 220.8 | 211.9 | (269.8) | 634.5 |
| | | | | |
Total operating expenses | (418.3) | (85.5) | (199.0) | 223.6 | (479.1) |
| | | | | |
Net operating income | 53.5 | 135.3 | 12.9 | (46.2) | 155.5 |
| | | | | |
Net financial items | (27.7) | (1.0) | 5.9 | 5.7 | (17.0) |
| | | | | |
Income before tax | 25.8 | 134.3 | 18.8 | (40.5) | 138.4 |
| | | | | |
Income tax | 8.1 | (95.3) | (11.7) | (0.2) | (99.2) |
| | | | | |
Net income | 33.9 | 39.0 | 7.1 | (40.7) | 39.2 |
| | | | | |
Other comprehensive income | 24.2 | 5.0 | 27.6 | (38.2) | 18.5 |
| | | | | |
Total comprehensive income | 58.1 | 44.0 | 34.7 | (78.9) | 57.7 |
The Consolidated statement of income, Consolidated statement of other comprehensive income, Consolidated statement of changes in equity and Consolidated statement of cash flows have been re-presented to reflect the currency rates of transactions in foreign currencies at the date of the transactions.
CONDENSED CONSOLIDATED STATEMENT OF INCOME AND OTHER COMPREHENSIVE INCOME |
| Statoil ASA | Statoil Petroleum AS | Non-guarantor subsidiaries | Consolidation adjustments | The Statoil group |
Full year 2012 (in NOK billion) |
| | | | | |
Revenues and other income | 480.2 | 251.8 | 257.0 | (272.5) | 716.5 |
Net income from equity accounted companies | 58.5 | (1.3) | 0.7 | (56.2) | 1.7 |
| | | | | |
Total revenues and other income | 538.7 | 250.5 | 257.7 | (328.7) | 718.2 |
| | | | | |
Total operating expenses | (480.4) | (76.8) | (225.3) | 270.9 | (511.6) |
| | | | | |
Net operating income | 58.3 | 173.7 | 32.4 | (57.8) | 206.6 |
| | | | | |
Net financial items | 18.8 | (5.1) | (8.7) | (4.8) | 0.2 |
| | | | | |
Income before tax | 77.1 | 168.6 | 23.6 | (62.6) | 206.7 |
| | | | | |
Income tax | (5.1) | (123.7) | (8.7) | 0.3 | (137.2) |
| | | | | |
Net income | 72.0 | 44.9 | 14.9 | (62.3) | 69.5 |
| | | | | |
Other comprehensive income | (12.9) | (6.7) | (11.7) | 23.4 | (7.9) |
| | | | | |
Total comprehensive income | 59.1 | 38.2 | 3.2 | (38.9) | 61.6 |
Statoil, Annual ReportUpon disposal of a foreign operation accumulated currency translation adjustments arising from currency movements between the Group’s presentation currency and the functional currency of the foreign operation are reclassified from equity to profit or loss and included as part of the gain or loss from the disposal, presented as other income. When changing the Group’s presentation currency from NOK to USD, the gains or losses from such disposals have been changed to reflect accumulated currency gains or losses being calculated based on Form 20-F 2014189USD being the presentation currency rather than NOK. These effects are presented as re-presentations in the table below, and represent the only re-measurements following the change in presentation currency to USD.
CONDENSED CONSOLIDATED BALANCE SHEET |
| Statoil ASA | Statoil Petroleum AS | Non-guarantor subsidiaries | Consolidation adjustments | The Statoil group |
At 31 December 2014 (in NOK billion) |
| | | | | |
ASSETS | | | | | |
Property, plant, equipment and intangible assets | 5.9 | 276.4 | 365.3 | (0.4) | 647.3 |
Equity accounted companies | 490.0 | 140.5 | 7.5 | (629.6) | 8.4 |
Other non-current assets | 34.8 | 13.0 | 28.2 | 0.0 | 76.0 |
Non-current financial receivables from subsidiaries | 68.6 | 0.4 | 0.2 | (69.2) | 0.0 |
| | | | | |
Total non-current assets | 599.3 | 430.3 | 401.2 | (699.2) | 731.7 |
| | | | | |
Current receivables from subsidiaries | 16.1 | 50.3 | 89.0 | (155.4) | 0.0 |
Other current assets | 116.7 | 14.2 | 46.8 | (6.0) | 171.6 |
Cash and cash equivalents | 71.5 | 0.6 | 11.0 | 0.0 | 83.1 |
| | | | | |
Total current assets | 204.4 | 65.0 | 146.7 | (161.4) | 254.8 |
| | | | | |
Total assets | 803.8 | 495.4 | 547.9 | (860.6) | 986.4 |
| | | | | |
EQUITY AND LIABILITIES | | | | | |
Total equity | 380.8 | 215.1 | 412.4 | (627.1) | 381.2 |
| | | | | |
Non-current liabilities to subsidiaries | 0.1 | 66.3 | 2.7 | (69.2) | 0.0 |
Other non-current liabilities | 238.2 | 144.9 | 45.3 | (2.3) | 426.2 |
| | | | | |
Total non-current liabilities | 238.4 | 211.2 | 48.0 | (71.4) | 426.2 |
| | | | | |
Other current liabilities | 68.1 | 60.0 | 57.6 | (6.7) | 179.0 |
Current liabilities to subsidiaries | 116.5 | 9.1 | 29.8 | (155.4) | 0.0 |
| | | | | |
Total current liabilities | 184.6 | 69.1 | 87.4 | (162.1) | 179.0 |
| | | | | |
Total liabilities | 423.0 | 280.3 | 135.5 | (233.5) | 605.2 |
| | | | | |
Total equity and liabilities | 803.8 | 495.4 | 547.9 | (860.6) | 986.4 |
190Statoil, Annual Report on Form 20-F 2014EFFECT OF CHANGES IN REPORTED NET INCOME
| Historical Consolidated financial statements in NOK billion | Historical Consolidated financial statements in USD million1) | Re-presentation in USD million | Consolidated financial statements in USD million |
Net income |
| | | | |
Full year 2015 | (37) | (4,684) | (485) | (5,169) |
| | | | |
Full year 2014 | 22 | 3,831 | 56 | 3,887 |
CONDENSED CONSOLIDATED BALANCE SHEET |
| Statoil ASA | Statoil Petroleum AS | Non-guarantor subsidiaries | Consolidation adjustments | The Statoil group |
At 31 December 2013 (in NOK billion) |
| | | | | |
ASSETS | | | | | |
Property, plant, equipment and intangible assets | 5.4 | 259.5 | 313.6 | 0.4 | 578.9 |
Equity accounted companies | 401.7 | 138.9 | 6.6 | (539.9) | 7.4 |
Other non-current assets | 26.5 | 13.3 | 20.7 | 0.0 | 60.5 |
Non-current financial receivables from subsidiaries | 69.4 | 0.6 | 0.2 | (70.1) | 0.0 |
| | | | | |
Total non-current assets | 503.1 | 412.3 | 341.0 | (609.6) | 646.8 |
| | | | | |
Current receivables from subsidiaries | 15.2 | 41.9 | 63.2 | (120.2) | 0.0 |
Other current assets | 100.5 | 14.9 | 43.8 | (5.7) | 153.5 |
Cash and cash equivalents | 77.0 | 0.0 | 8.3 | 0.0 | 85.3 |
| | | | | |
Total current assets | 192.7 | 56.7 | 115.3 | (125.9) | 238.8 |
| | | | | |
Total assets | 695.8 | 469.1 | 456.3 | (735.5) | 885.6 |
| | | | | |
EQUITY AND LIABILITIES | | | | | |
Total equity | 355.5 | 184.4 | 359.9 | (543.8) | 356.0 |
| | | | | |
Non-current liabilities to subsidiaries | 0.1 | 67.0 | 3.0 | (70.1) | 0.0 |
Other non-current liabilities | 190.4 | 138.4 | 34.8 | (1.0) | 362.7 |
| | | | | |
Total non-current liabilities | 190.5 | 205.5 | 37.8 | (71.1) | 362.7 |
| | | | | |
Other current liabilities | 57.8 | 68.1 | 41.4 | (0.4) | 166.9 |
Current liabilities to subsidiaries | 91.9 | 11.0 | 17.3 | (120.2) | 0.0 |
| | | | | |
Total current liabilities | 149.7 | 79.1 | 58.6 | (120.6) | 166.9 |
| | | | | |
Total liabilities | 340.3 | 284.6 | 96.5 | (191.7) | 529.6 |
| | | | | |
Total equity and liabilities | 695.8 | 469.1 | 456.3 | (735.5) | 885.6 |
1)Statoil, Annual ReportTranslated at average exchange rates for the quarters.
The disposal with most significant effect on Form 20-F 2014191the net income of the Group is the disposal of Statoil’s interests in Shah Deniz, presented within the DPI segment in the second quarter 2015, for which the gain presented in NOK included NOK 3.2 billion arising from reclassification of accumulated translation differences. As the disposed foreign operation had USD as functional currency, there are no accumulated translation differences when presented in USD for this transaction.
The Statement of cash flow has been re-presented to reflect the changes described above and based on the currency rates applicable at the transaction dates of relevant transactions. The re-presentation impacts the classification between the different lines in the statement of cash flow, between currency translation adjustments and other components of cash flow.
CONDENSED CONSOLIDATED CASH FLOW STATEMENT |
| Statoil ASA | Statoil Petroleum AS | Non-guarantor subsidiaries | Consolidation adjustments | The Statoil group |
Full year 2014 (in NOK billion) |
| | | | | |
Cash flows provided by (used in) operating activities | 18.6 | 73.2 | 56.9 | (22.2) | 126.5 |
Cash flows provided by (used in) investing activities | (16.9) | (59.4) | (55.5) | 19.8 | (112.0) |
Cash flows provided by (used in) financing activities | (11.0) | (13.2) | (1.3) | 2.4 | (23.1) |
| | | | | |
Net increase (decrease) in cash and cash equivalents | (9.3) | 0.6 | 0.1 | 0.0 | (8.6) |
| | | | | |
Effect of exchange rate changes on cash and cash equivalents | 3.8 | 0.1 | 1.9 | 0.0 | 5.8 |
Cash and cash equivalents at the beginning of the period (net of overdraft) | 77.0 | 0.0 | 8.3 | 0.0 | 85.3 |
| | | | | |
Cash and cash equivalents at the end of the period (net of overdraft) | 71.5 | 0.7 | 10.3 | 0.0 | 82.5 |
| | | | | |
| | | | | |
| Statoil ASA | Statoil Petroleum AS | Non-guarantor subsidiaries | Consolidation adjustments | The Statoil group |
Full year 2013 (in NOK billion) |
| | | | | |
Cash flows provided by (used in) operating activities | 64.3 | 69.9 | 39.6 | (72.6) | 101.3 |
Cash flows provided by (used in) investing activities | (46.9) | (46.0) | (87.4) | 69.9 | (110.4) |
Cash flows provided by (used in) financing activities | (0.6) | (23.9) | 48.5 | 2.7 | 26.6 |
| | | | | |
Net increase (decrease) in cash and cash equivalents | 16.8 | 0.0 | 0.7 | 0.0 | 17.5 |
| | | | | |
Effect of exchange rate changes on cash and cash equivalents | 2.7 | 0.0 | 0.2 | 0.0 | 2.9 |
Cash and cash equivalents at the beginning of the period (net of overdraft) | 57.4 | 0.0 | 7.5 | 0.0 | 64.9 |
| | | | | |
Cash and cash equivalents at the end of the period (net of overdraft) | 77.0 | 0.0 | 8.3 | 0.0 | 85.3 |
| | | | | |
| | | | | |
| Statoil ASA | Statoil Petroleum AS | Non-guarantor subsidiaries | Consolidation adjustments | The Statoil group |
Full year 2012 (in NOK billion) |
| | | | | |
Cash flows provided by (used in) operating activities | 78.1 | 94.0 | 40.9 | (85.0) | 128.0 |
Cash flows provided by (used in) investing activities | (62.9) | (76.9) | (79.0) | 122.2 | (96.6) |
Cash flows provided by (used in) financing activities | 0.9 | (17.1) | 35.2 | (37.2) | (18.2) |
| | | | | |
Net increase (decrease) in cash and cash equivalents | 16.1 | (0.0) | (2.9) | 0.0 | 13.2 |
| | | | | |
Effect of exchange rate changes on cash and cash equivalents | (1.4) | 0.0 | (0.5) | 0.0 | (1.9) |
Cash and cash equivalents at the beginning of the period (net of overdraft) | 42.7 | 0.0 | 10.9 | 0.0 | 53.6 |
| | | | | |
Cash and cash equivalents at the end of the period (net of overdraft) | 57.4 | (0.0) | 7.5 | 0.0 | 64.9 |
192Statoil, Annual Report on Form 20-F 2014
27 Supplementary oil and gas information (unaudited)
In accordance with Financial Accounting Standards Board Accounting Standards Codification "Extractive Activities - Oil and Gas" (Topic 932), Statoil is reporting certain supplemental disclosures about oil and gas exploration and production operations. While this information is developed with reasonable care and disclosed in good faith, it is emphasised that some of the data is necessarily imprecise and represents only approximate amounts because of the subjective judgement involved in developing such information. Accordingly, this information may not necessarily represent the present financial condition of Statoil or its expected future results.
For further information regarding the reserves estimation requirement, see note 2 Significant accounting policies- Critical accounting judgements and key sources of estimation uncertainty - Proved oil and gas reserves.
No new events have occurred since 31 December 20142016 that would result in a significant change in the estimated proved reserves or other figures reported as of that date.
The effectsdisputed equity determination at Agbami will potentially alter Statoil's equity share in this field. The effect on the proved reserves will be included once the redetermination is finalised and the effect is known.The effect of the agreement with PETRONAS to divest Statoil’s remaining 15.5% interest infarm out of the Shah Deniz project in Azerbaijan and the agreement with Southwestern Energy to reduce Statoil’s working interest in the non-operated Southern Marcellus onshore play in the United Statesoil sands projects will all be included in 2015. The net effect2017, after the closing date of these changesthe transaction, and will be a reduction inreduce the proved reserves at year end 2015 of approximately 230 million boe.2017 by an immaterial volume related to the Leismer field.
Oil and gas reserve quantities
Statoil's oil and gas reserves have been estimated by its qualified professionals in accordance with industry standards under the requirements of the U.S. Securities and Exchange Commission (SEC), Rule 4-10 of Regulation S-X. Statements of reserves are forward-looking statements.
The determination of these reserves is part of an ongoing process subject to continual revision as additional information becomes available. Estimates of proved reserve quantities are imprecise and change over time as new information becomes available. Moreover, identified reserves and contingent resources that may become proved in the future are excluded from the calculations.
Statoil, Annual Report on Form 20-F 2016181
Statoil's proved reserves are recognised under various forms of contractual agreements, including production sharing agreements (PSAs) where Statoil's share of reserves can vary due to commodity prices or other factors. Reserves from agreements such as PSAs and buy back agreements are based on the volumes to which Statoil has access (cost oil and profit oil), limited to available market access. At 31 December 2014, 12%2016, 7% of total proved reserves were related to such agreements (18%(13% of total oil, condensate and natural gas liquids (NGL) reserves and 8%2% of total gas reserves). This compares with 14%9% and 9%12% of total proved reserves for 20132015 and 2012,2014, respectively. Net entitlement oil and gas production from fields with such agreements was 96 million boe during 2016 (104 million boe for 2015 and 95 million boe during 2014 (93 million boe for 2013 and 89 million boe for 2012)2014). Statoil participates in such agreements in Algeria, Angola, Azerbaijan, Libya, Nigeria and Russia.
Statoil is recording, as proved reserves, volumes equivalent to our tax liabilities under negotiated fiscal arrangements (PSAs) where the tax is paid on behalf of Statoil. Reserves are net of royalty oil paid in kind and quantities consumed during production.
Rule 4-10 of Regulation S-X requires that the appraisal of reserves is based on existing economic conditions, including a 12-month average price prior to the end of the reporting period, unless prices are defined by contractual arrangements. OilThe proved reserves at year-end 2014year end 2016 have been determined based on a 12-month average 2014 Brent blend price equivalent of USD 42.82/bbl, compared to USD 101.27/bbl. The slight decrease in oil price from 2013, when the average Brent blend price was54.17/bbl and USD 108.02/101.27/bbl result in minor effect on the profitable oil to be recovered from the accumulations,for 2015 and on Statoil's proved oil reserves under PSAs and similar contracts. Gas reserves at year end 2014 have been determined based on achieved gas prices during 2014 giving arespectively. The volume weighted average gas price of 1.9 NOK/Sm3.for proved reserves at year end 2016 was USD 4.50MMBtu. The comparable volume weighted average gas price used to determine gas reserves at year end 20132015 and 2014 was 2.13 NOK/Sm3.USD 5.76MMBtu and USD 8.01MMBtu. The slight decrease in gas prices from 2013 result in no material effect on gas reserves. volume weighted average NGL price for proved reserves at year end 2016 was USD 24.85/boe. The corresponding NGL price used to determine NGL reserves at year end 2015 and 2014 have been determined based on achieved NGL prices during 2014 giving a volume weighted average NGL price ofwas USD 30.56/boe and USD 57.03/boe. The corresponding volume weighted NGL price at year end 2013 was USD 62.32/boe. The slight decrease in NGLcommodity prices affects the profitable reserves to be recovered from 2013 has had no material effectaccumulations resulting in NGLreduced reserves at year end 2014. marginally. The negative revisions due to price are in general a result of earlier economic cut-off. For fields with a production-sharing type of agreement this is to some degree offset by higher entitlement to the reserves. These changes are all included in the revision category in the tables below.below, giving a net reduction of Statoil’s proved reserves at year end.
From the Norwegian continental shelf (NCS), Statoil is responsible for managing, transporting and selling the Norwegian State's oil and gas on behalf of the Norwegian State's direct financial interest (SDFI). These reserves are sold in conjunction with the Statoil reserves. As part of this arrangement, Statoil delivers and sells gas to customers in accordance with various types of sales contracts on behalf of the SDFI. In order to fulfil the commitments, Statoil utilisesutilizes a field supply schedule which provides the highest possible total value for the joint portfolio of oil and gas between Statoil and the SDFI.
Statoil and the SDFI receive income from the joint natural gas sales portfolio based upon their respective share in the supplied volumes. For sales of the SDFI natural gas, to Statoil and to third parties, the payment to the Norwegian State is based on achieved prices, a net back formula calculated price or market value. All of the Norwegian State's oil and NGL is acquired by Statoil. The price Statoil pays to the SDFI for the crude oil is based on market reflective prices. The prices for NGL are either based on achieved prices, market value or market reflective prices.
The regulations of the owner's instruction, as described above, may be changed or withdrawn by the Statoil ASA's general meeting. Due to this uncertainty and the Norwegian State's estimate of proved reserves not being available to Statoil, it is not possible to determine the total quantities to be purchased by Statoil under the owner's instruction.
Topic 932 requires the presentation of reserves and certain other supplemental oil and gas disclosures by geographical area, defined as country or continent containing 15% or more of total proved reserves. Norway contains 68%76% of total proved reserves at 31 December 20142016 and no other country
Statoil, Annual Report on Form 20-F 2014193
contains reserves approaching 15% of total proved reserves. Accordingly, management has determined that the most meaningful presentation of geographical areas would be Norway and the continents of Eurasia (excluding Norway), Africa and Americas.
The following tables reflect the estimated proved reserves of oil and gas at 31 December 20112013 through 2014,2016, and the changes therein.
The reason for the most significant changes to our proved reserves at year end 2016 were:
·Positive revisions due to better performance of producing fields, maturing of improved recovery projects, and reduced uncertainty due to further drilling and production experience. This added a total of 409 million boe in 2016. A significant part of these positive revisions are related to large, producing fields offshore Norway where production is declining less than previously assumed for the proved reserves due to continuous improvement activities.
·Proved reserves from new discoveries have also been added through the sanctioning of new field development projects in 2016, Svale Nord Trestakk and Utgard in Norway and Julia in US. The new projects added a total of 66 million boe. New discoveries with proved reserves booked in 2016 are all expected to start production within a period of five years.
•Further drilling in the Bakken, Marcellus and Eagle Ford onshore plays in the US increased the proved reserves in 2016, and some of these additions are presented as extensions. Extension of proved area on existing field added a total of 112 million boe of new proved reserves in 2016. Together with proved reserves from new fields this adds a total of 179 million boe of proved reserves from Extensions and discoveries.
·The net effect of purchase and sale increased the reserves by 39million boe in 2016.
·Production during 2016 reduced proved reserves by 673 million boe.
Changes to the proved reserves in 2016 are also described in some detail in section 2.8 Operating and financial performance by each geographical area. Development of the proved reserves are described in section 2.8 Operating and financial performance, Development of reserves.
| Consolidated companies | Equity accounted | Total |
| Norway | Eurasia excluding Norway | Africa | Americas | Subtotal | Americas | Total |
Net proved oil and condensate reserves in million barrels oil equivalent | | | | | | | |
At 31 December 2011 | 996 | 114 | 293 | 373 | 1,775 | 95 | 1,870 |
| | | | | | | |
Revisions and improved recovery | 92 | 12 | 42 | 14 | 160 | (8) | 152 |
Extensions and discoveries | 77 | 85 | - | 52 | 213 | - | 213 |
Purchase of reserves-in-place | - | - | - | 0 | 0 | - | 0 |
Sales of reserves-in-place | (11) | - | - | (1) | (12) | - | (12) |
Production | (185) | (17) | (53) | (43) | (299) | (5) | (303) |
| | | | | | | |
At 31 December 2012 | 968 | 193 | 281 | 395 | 1,837 | 82 | 1,919 |
| - | - | - | - | | - | |
Revisions and improved recovery | 133 | 16 | 40 | 18 | 207 | (16) | 191 |
Extensions and discoveries | 19 | 47 | 8 | 34 | 108 | - | 108 |
Purchase of reserves-in-place | 13 | - | - | - | 13 | - | 13 |
Sales of reserves-in-place | (40) | (15) | - | (2) | (57) | - | (57) |
Production | (174) | (15) | (58) | (46) | (294) | (4) | (298) |
| | | | | | | |
At 31 December 2013 | 918 | 227 | 271 | 399 | 1,815 | 63 | 1,877 |
| | | | | | | |
Revisions and improved recovery | 143 | 10 | 85 | (4) | 235 | (3) | 232 |
Extensions and discoveries | 3 | - | 5 | 145 | 153 | - | 153 |
Purchase of reserves-in-place | - | - | - | 20 | 20 | - | 20 |
Sales of reserves-in-place | (5) | (27) | (2) | - | (34) | - | (34) |
Production | (173) | (14) | (64) | (51) | (301) | (4) | (306) |
| | | | | | | |
At 31 December 2014 | 886 | 196 | 296 | 508 | 1,887 | 55 | 1,942 |
182Statoil, Annual Report on Form 20-F 2016
| Consolidated companies | Equity accounted | Total |
| Norway | Eurasia excluding Norway | Africa | Americas | Subtotal | Norway | Eurasia excluding Norway | Americas | Subtotal | Total |
Net proved oil and condensate reserves in million barrels oil equivalent | | | | | | | | | | |
At 31 December 2013 | 918 | 227 | 271 | 399 | 1,815 | - | - | 63 | 63 | 1,877 |
| | | | | | | | | | |
Revisions and improved recovery | 143 | 10 | 85 | (4) | 235 | - | - | (3) | (3) | 232 |
Extensions and discoveries | 3 | - | 5 | 145 | 153 | - | - | - | - | 153 |
Purchase of reserves-in-place | - | - | - | 20 | 20 | - | - | - | - | 20 |
Sales of reserves-in-place | (5) | (27) | (2) | - | (34) | - | - | - | - | (34) |
Production | (173) | (14) | (64) | (51) | (301) | - | - | (4) | (4) | (306) |
| | | | | | | | | | |
At 31 December 2014 | 886 | 196 | 296 | 508 | 1,887 | - | - | 55 | 55 | 1,942 |
| | | | | | | | | | |
Revisions and improved recovery | 71 | (68) | 57 | (54) | 5 | - | - | (5) | (5) | 0 |
Extensions and discoveries | 437 | - | - | 74 | 511 | - | - | - | - | 511 |
Purchase of reserves-in-place | - | - | - | 4 | 4 | - | - | - | - | 4 |
Sales of reserves-in-place | (4) | (38) | - | (1) | (43) | - | - | - | - | (43) |
Production | (174) | (13) | (75) | (57) | (319) | - | - | (4) | (4) | (324) |
| | | | | | | | | | |
At 31 December 2015 | 1,216 | 76 | 278 | 474 | 2,045 | - | - | 46 | 46 | 2,091 |
| | | | | | | | | | |
Revisions and improved recovery | 111 | 6 | 16 | 17 | 149 | - | - | (12) | (12) | 137 |
Extensions and discoveries | 29 | - | - | 49 | 78 | - | - | - | - | 78 |
Purchase of reserves-in-place | - | - | - | - | - | 60 | 0 | - | 60 | 60 |
Sales of reserves-in-place | (14) | - | - | - | (14) | - | - | - | - | (14) |
Production | (169) | (12) | (72) | (60) | (313) | (2) | (0) | (4) | (6) | (320) |
| | | | | | | | | | |
At 31 December 2016 | 1,174 | 71 | 221 | 480 | 1,945 | 58 | - | 30 | 88 | 2,033 |
Statoil, Annual Report on Form 20-F 2016183
Proved reserves of bitumen in Americas, representing less than 2% of Statoil's proved reserves, is included as oil in the table above.
| Consolidated companies | Equity accounted | Total |
| Norway | Eurasia excluding Norway | Africa | Americas | Subtotal | Norway | Eurasia excluding Norway | Americas | Subtotal | Total |
Net proved NGL reserves in million barrels oil equivalent | | | | | | | | | | |
At 31 December 2013 | 368 | - | 16 | 56 | 441 | - | - | - | - | 441 |
| | | | | | | | | | |
Revisions and improved recovery | (2) | - | 1 | 5 | 4 | - | - | - | - | 4 |
Extensions and discoveries | 3 | - | - | 18 | 21 | - | - | - | - | 21 |
Purchase of reserves-in-place | - | - | - | - | - | - | - | - | - | - |
Sales of reserves-in-place | (10) | - | - | (2) | (12) | - | - | - | - | (12) |
Production | (42) | - | (2) | (7) | (51) | - | - | - | - | (51) |
| | | | | | | | | | |
At 31 December 2014 | 318 | - | 15 | 69 | 403 | - | - | - | - | 403 |
| | | | | | | | | | |
Revisions and improved recovery | 7 | - | 3 | (20) | (10) | - | - | - | - | (10) |
Extensions and discoveries | 11 | - | - | 16 | 27 | - | - | - | - | 27 |
Purchase of reserves-in-place | - | - | - | 4 | 4 | - | - | - | - | 4 |
Sales of reserves-in-place | (1) | - | - | (5) | (5) | - | - | - | - | (5) |
Production | (44) | - | (3) | (7) | (54) | - | - | - | - | (54) |
| | | | | | | | | | |
At 31 December 2015 | 291 | - | 15 | 57 | 364 | - | - | - | - | 364 |
| | | | | | | | | | |
Revisions and improved recovery | 37 | - | 3 | 6 | 46 | - | - | - | - | 46 |
Extensions and discoveries | 5 | - | - | 13 | 18 | - | - | - | - | 18 |
Purchase of reserves-in-place | - | - | - | - | - | 2 | - | - | 2 | 2 |
Sales of reserves-in-place | (0) | - | - | - | (0) | - | - | - | - | (0) |
Production | (46) | - | (2) | (9) | (58) | (0) | - | - | (0) | (58) |
| | | | | | | | | | |
At 31 December 2016 | 287 | - | 16 | 67 | 370 | 2 | - | - | 2 | 372 |
184Statoil, Annual Report on Form 20-F 2016
| Consolidated companies | Equity accounted | Total |
| Norway | Eurasia excluding Norway | Africa | Americas | Subtotal | Norway | Eurasia excluding Norway | Americas | Subtotal | Total |
Net proved gas reserves in billion standard cubic feet | | | | | | | | | | |
At 31 December 2013 | 14,761 | 1,923 | 328 | 1,404 | 18,416 | - | - | - | - | 18,416 |
| | | | | | | | | | |
Revisions and improved recovery | 439 | 32 | 8 | 197 | 676 | - | - | - | - | 676 |
Extensions and discoveries | 79 | - | - | 364 | 443 | - | - | - | - | 443 |
Purchase of reserves-in-place | - | - | - | - | - | - | - | - | - | - |
Sales of reserves-in-place | (355) | (681) | - | (15) | (1,051) | - | - | - | - | (1,051) |
Production | (1,229) | (56) | (38) | (242) | (1,565) | - | - | - | - | (1,565) |
| | | | | | | | | | |
At 31 December 2014 | 13,694 | 1,218 | 299 | 1,708 | 16,919 | - | - | - | - | 16,919 |
| | | | | | | | | | |
Revisions and improved recovery | 385 | (18) | 129 | (676) | (180) | - | - | - | - | (180) |
Extensions and discoveries | 179 | - | - | 318 | 497 | - | - | - | - | 497 |
Purchase of reserves-in-place | - | - | - | 31 | 31 | - | - | - | - | 31 |
Sales of reserves-in-place | (10) | (991) | - | (42) | (1,043) | - | - | - | - | (1,043) |
Production | (1,306) | (16) | (63) | (215) | (1,600) | - | - | - | - | (1,600) |
| | | | | | | | | | |
At 31 December 2015 | 12,942 | 193 | 366 | 1,123 | 14,624 | - | - | - | - | 14,624 |
| | | | | | | | | | |
Revisions and improved recovery | 1,160 | 29 | (25) | 102 | 1,265 | - | - | - | - | 1,265 |
Extensions and discoveries | 78 | - | - | 384 | 462 | - | - | - | - | 462 |
Purchase of reserves-in-place | - | - | - | - | - | 16 | 0 | - | 16 | 16 |
Sales of reserves-in-place | (5) | - | - | (65) | (70) | - | - | - | - | (70) |
Production | (1,338) | (34) | (60) | (227) | (1,659) | (1) | (0) | - | (2) | (1,661) |
| | | | | | | | | | |
At 31 December 2016 | 12,836 | 188 | 280 | 1,318 | 14,623 | 15 | - | - | 15 | 14,637 |
Statoil, Annual Report on Form 20-F 2016185
| Consolidated companies | Equity accounted | Total |
| Norway | Eurasia excluding Norway | Africa | Americas | Subtotal | Norway | Eurasia excluding Norway | Americas | Subtotal | Total |
Net proved reserves in million barrels oil equivalent | | | | | | | | | | |
At 31 December 2013 | 3,916 | 569 | 346 | 705 | 5,537 | - | - | 63 | 63 | 5,600 |
| | | | | | | | | | |
Revisions and improved recovery | 219 | 16 | 87 | 36 | 359 | - | - | (3) | (3) | 356 |
Extensions and discoveries | 20 | - | 5 | 227 | 253 | - | - | - | - | 253 |
Purchase of reserves-in-place | - | - | - | 20 | 20 | - | - | - | - | 20 |
Sales of reserves-in-place | (78) | (148) | (2) | (5) | (233) | - | - | - | - | (233) |
Production | (434) | (24) | (72) | (102) | (631) | - | - | (4) | (4) | (635) |
| | | | | | | | | | |
At 31 December 2014 | 3,644 | 413 | 364 | 882 | 5,304 | - | - | 55 | 55 | 5,359 |
| | | | | | | | | | |
Revisions and improved recovery | 146 | (72) | 83 | (194) | (37) | - | - | (5) | (5) | (42) |
Extensions and discoveries | 480 | - | - | 146 | 627 | - | - | - | - | 627 |
Purchase of reserves-in-place | - | - | - | 13 | 13 | - | - | - | - | 13 |
Sales of reserves-in-place | (6) | (215) | - | (13) | (235) | - | - | - | - | (235) |
Production | (450) | (16) | (88) | (103) | (658) | - | - | (4) | (4) | (662) |
| | | | | | | | | | |
At 31 December 2015 | 3,814 | 111 | 358 | 731 | 5,014 | - | - | 46 | 46 | 5,060 |
| | | | | | | | | | |
Revisions and improved recovery | 355 | 11 | 14 | 41 | 421 | - | - | (12) | (12) | 409 |
Extensions and discoveries | 48 | - | - | 130 | 179 | - | - | - | - | 179 |
Purchase of reserves-in-place | - | - | - | - | - | 65 | 0 | - | 65 | 65 |
Sales of reserves-in-place | (15) | - | - | (11) | (27) | - | - | - | - | (27) |
Production | (454) | (18) | (85) | (110) | (666) | (3) | (0) | (4) | (7) | (673) |
| | | | | | | | | | |
At 31 December 2016 | 3,748 | 104 | 287 | 782 | 4,921 | 62 | - | 30 | 92 | 5,013 |
Proved reserves of bitumen in Americas, representing less than 2% of Statoil's proved reserves, is included as oil in the table above.
194186 Statoil, Annual Report on Form 20-F 20142016
| Consolidated companies | Equity accounted | Total |
| Norway | Eurasia excluding Norway | Africa | Americas | Subtotal | Americas | Total |
Net proved NGL reserves in million barrels oil equivalent | | | | | | | |
At 31 December 2011 | 373 | - | 20 | 12 | 406 | - | 406 |
| | | | | | | |
Revisions and improved recovery | 58 | - | 0 | 7 | 65 | - | 65 |
Extensions and discoveries | 24 | - | - | 29 | 53 | - | 53 |
Purchase of reserves-in-place | - | - | - | 1 | 1 | - | 1 |
Sales of reserves-in-place | (5) | - | - | (0) | (5) | - | (5) |
Production | (45) | - | (2) | (2) | (50) | - | (50) |
| | | | | | | |
At 31 December 2012 | 405 | - | 18 | 47 | 469 | - | 469 |
| | | | | | | |
Revisions and improved recovery | 25 | - | (0) | 4 | 28 | - | 28 |
Extensions and discoveries | 1 | - | - | 10 | 11 | - | 11 |
Purchase of reserves-in-place | 0 | - | - | - | 0 | - | 0 |
Sales of reserves-in-place | (21) | - | - | - | (21) | - | (21) |
Production | (42) | - | (1) | (4) | (47) | - | (47) |
| | | | | | | |
At 31 December 2013 | 368 | - | 16 | 56 | 441 | - | 441 |
| | | | | | | |
Revisions and improved recovery | (2) | - | 1 | 5 | 4 | - | 4 |
Extensions and discoveries | 3 | - | - | 18 | 21 | - | 21 |
Purchase of reserves-in-place | - | - | - | - | - | - | - |
Sales of reserves-in-place | (10) | - | - | (2) | (12) | - | (12) |
Production | (42) | - | (2) | (7) | (51) | - | (51) |
| | | | | | | |
At 31 December 2014 | 318 | - | 15 | 69 | 403 | - | 403 |
| Consolidated companies | Equity accounted | Total |
| Norway | Eurasia excluding Norway | Africa | Americas | Subtotal | Norway | Eurasia excluding Norway | Americas | Subtotal | Total |
Net proved oil and condensate reserves in million barrels oil equivalent | | | | | | | | | | |
At 31 December 2013 | | | | | | | | | | |
Developed | 548 | 63 | 197 | 212 | 1,020 | - | - | 32 | 32 | 1,052 |
Undeveloped | 370 | 164 | 74 | 187 | 795 | - | - | 30 | 30 | 826 |
At 31 December 2014 | | | | | | | | | | |
Developed | 559 | 63 | 243 | 267 | 1,133 | - | - | 24 | 24 | 1,156 |
Undeveloped | 327 | 133 | 52 | 242 | 754 | - | - | 32 | 32 | 786 |
At 31 December 2015 | | | | | | | | | | |
Developed | 505 | 48 | 248 | 282 | 1,083 | - | - | 21 | 21 | 1,104 |
Undeveloped | 711 | 29 | 30 | 192 | 962 | - | - | 25 | 25 | 987 |
At 31 December 2016 | | | | | | | | | | |
Developed | 536 | 43 | 200 | 303 | 1,082 | 7 | - | 16 | 23 | 1,105 |
Undeveloped | 638 | 28 | 22 | 176 | 863 | 51 | - | 13 | 65 | 928 |
Net proved NGL reserves in million barrels oil equivalent | | | | | | | | | | |
At 31 December 2013 | | | | | | | | | | |
Developed | 287 | - | 10 | 34 | 330 | - | - | - | - | 330 |
Undeveloped | 82 | - | 7 | 22 | 111 | - | - | - | - | 111 |
At 31 December 2014 | | | | | | | | | | |
Developed | 258 | - | 9 | 42 | 310 | - | - | - | - | 310 |
Undeveloped | 60 | - | 6 | 27 | 93 | - | - | - | - | 93 |
At 31 December 2015 | | | | | | | | | | |
Developed | 235 | - | 9 | 45 | 290 | - | - | - | - | 290 |
Undeveloped | 56 | - | 6 | 12 | 74 | - | - | - | - | 74 |
At 31 December 2016 | | | | | | | | | | |
Developed | 213 | - | 10 | 53 | 276 | 1 | - | - | 1 | 277 |
Undeveloped | 74 | - | 6 | 14 | 94 | 1 | - | - | 1 | 95 |
Net proved gas reserves in billion standard cubic feet | | | | | | | | | | |
At 31 December 2013 | | | | | | | | | | |
Developed | 11,580 | 467 | 209 | 817 | 13,073 | - | - | - | - | 13,073 |
Undeveloped | 3,181 | 1,455 | 120 | 586 | 5,343 | - | - | - | - | 5,343 |
At 31 December 2014 | | | | | | | | | | |
Developed | 11,227 | 312 | 191 | 946 | 12,677 | - | - | - | - | 12,677 |
Undeveloped | 2,467 | 906 | 108 | 762 | 4,242 | - | - | - | - | 4,242 |
At 31 December 2015 | | | | | | | | | | |
Developed | 10,664 | 32 | 206 | 999 | 11,901 | - | - | - | - | 11,901 |
Undeveloped | 2,278 | 161 | 160 | 124 | 2,723 | - | - | - | - | 2,723 |
At 31 December 2016 | | | | | | | | | | |
Developed | 9,219 | 188 | 171 | 1,002 | 10,580 | 4 | - | - | 4 | 10,584 |
Undeveloped | 3,617 | - | 110 | 316 | 4,043 | 11 | - | - | 11 | 4,054 |
Net proved oil, condensate, NGL and gas reserves in million barrels oil equivalent | | | | | | | | | | |
At 31 December 2013 | | | | | | | | | | |
Developed | 2,898 | 146 | 244 | 392 | 3,679 | - | - | 32 | 32 | 3,711 |
Undeveloped | 1,018 | 423 | 103 | 314 | 1,858 | - | - | 30 | 30 | 1,888 |
At 31 December 2014 | | | | | | | | | | |
Developed | 2,818 | 119 | 287 | 477 | 3,701 | - | - | 24 | 24 | 3,725 |
Undeveloped | 826 | 295 | 78 | 405 | 1,603 | - | - | 32 | 32 | 1,635 |
At 31 December 2015 | | | | | | | | | | |
Developed | 2,641 | 53 | 294 | 505 | 3,494 | - | - | 21 | 21 | 3,515 |
Undeveloped | 1,173 | 57 | 64 | 226 | 1,521 | - | - | 25 | 25 | 1,546 |
At 31 December 2016 | | | | | | | | | | |
Developed | 2,392 | 76 | 240 | 535 | 3,244 | 8 | - | 16 | 24 | 3,268 |
Undeveloped | 1,357 | 28 | 47 | 246 | 1,678 | 54 | - | 13 | 68 | 1,746 |
Statoil, Annual Report on Form 20-F 20142016 195187
| Consolidated companies | Equity accounted | Total |
| Norway | Eurasia excluding Norway | Africa | Americas | Subtotal | Americas | Total |
Net proved gas reserves in billion standard cubic feet | | | | | | | |
At 31 December 2011 | 15,689 | 608 | 431 | 952 | 17,681 | - | 17,681 |
| | | | | | | |
Revisions and improved recovery | 824 | 29 | (49) | (39) | 766 | - | 766 |
Extensions and discoveries | 279 | - | - | 352 | 630 | - | 630 |
Purchase of reserves-in-place | - | - | - | 18 | 18 | - | 18 |
Sales of reserves-in-place | (305) | - | - | (14) | (319) | - | (319) |
Production | (1,483) | (62) | (41) | (161) | (1,748) | - | (1,748) |
| | | | | | | |
At 31 December 2012 | 15,003 | 575 | 341 | 1,107 | 17,027 | - | 17,027 |
| - | - | - | - | | - | |
Revisions and improved recovery | 391 | 187 | 27 | 382 | 987 | - | 987 |
Extensions and discoveries | 920 | 1,236 | - | 112 | 2,268 | - | 2,268 |
Purchase of reserves-in-place | 5 | - | - | - | 5 | - | 5 |
Sales of reserves-in-place | (295) | (3) | - | (2) | (300) | - | (300) |
Production | (1,264) | (72) | (40) | (196) | (1,571) | - | (1,571) |
| | | | | | | |
At 31 December 2013 | 14,761 | 1,923 | 328 | 1,404 | 18,416 | - | 18,416 |
| | | | | | | |
Revisions and improved recovery | 439 | 32 | 8 | 197 | 676 | - | 676 |
Extensions and discoveries | 79 | - | - | 364 | 443 | - | 443 |
Purchase of reserves-in-place | - | - | - | - | - | - | - |
Sales of reserves-in-place | (355) | (681) | - | (15) | (1,051) | - | (1,051) |
Production | (1,229) | (56) | (38) | (242) | (1,565) | - | (1,565) |
| | | | | | | |
At 31 December 2014 | 13,694 | 1,218 | 299 | 1,708 | 16,919 | - | 16,919 |
The effect of the farm out of Shah Deniz and the reduced working interest in the non-operated Southern Marcellus is not included in the table above, but will be included in 2015 after the closing date of the transaction.
196Statoil, Annual Report on Form 20-F 2014
| Consolidated companies | Equity accounted | Total |
| Norway | Eurasia excluding Norway | Africa | Americas | Subtotal | Americas | Total |
Net proved reserves in million barrels oil equivalent | | | | | | | |
At 31 December 2011 | 4,165 | 222 | 390 | 555 | 5,331 | 95 | 5,426 |
| | | | | | | |
Revisions and improved recovery | 297 | 17 | 33 | 14 | 361 | (8) | 353 |
Extensions and discoveries | 150 | 85 | - | 144 | 378 | - | 378 |
Purchase of reserves-in-place | - | - | - | 4 | 4 | - | 4 |
Sales of reserves-in-place | (71) | - | - | (4) | (74) | - | (74) |
Production | (495) | (28) | (63) | (74) | (660) | (5) | (665) |
| | | | | | | |
At 31 December 2012 | 4,046 | 296 | 360 | 639 | 5,340 | 82 | 5,422 |
| - | - | - | - | | - | |
Revisions and improved recovery | 227 | 49 | 44 | 90 | 411 | (16) | 395 |
Extensions and discoveries | 183 | 268 | 8 | 64 | 523 | - | 523 |
Purchase of reserves-in-place | 14 | - | - | - | 14 | - | 14 |
Sales of reserves-in-place | (113) | (15) | - | (2) | (131) | - | (131) |
Production | (441) | (28) | (66) | (85) | (621) | (4) | (625) |
| | | | | | | |
At 31 December 2013 | 3,916 | 569 | 346 | 705 | 5,537 | 63 | 5,600 |
| | | | | | | |
Revisions and improved recovery | 219 | 16 | 87 | 36 | 359 | (3) | 356 |
Extensions and discoveries | 20 | - | 5 | 227 | 253 | - | 253 |
Purchase of reserves-in-place | - | - | - | 20 | 20 | - | 20 |
Sales of reserves-in-place | (78) | (148) | (2) | (5) | (233) | - | (233) |
Production | (434) | (24) | (72) | (102) | (631) | (4) | (635) |
| | | | | | | |
At 31 December 2014 | 3,644 | 413 | 364 | 882 | 5,304 | 55 | 5,359 |
Proved reserves of bitumen in Americas, representing less than 2% of Statoil's proved reserves, is included as oil in the table above. The effect of the farm out of Shah Deniz and the reduced working interest in the non-operated Southern Marcellus is not included in the table above, but will be included in 2015 after the closing date of the transaction.
Statoil, Annual Report on Form 20-F 2014197
| Consolidated companies | Equity accounted | Total |
| Norway | Eurasia excluding Norway | Africa | Americas | Subtotal | Americas | Total |
Net proved oil and condensate reserves in million barrels oil equivalent | | | | | | | |
At 31 December 2011 | | | | | | | |
Developed | 637 | 102 | 208 | 101 | 1,048 | 37 | 1,085 |
Undeveloped | 359 | 11 | 84 | 272 | 727 | 58 | 785 |
At 31 December 2012 | | | | | | | |
Developed | 547 | 79 | 221 | 164 | 1,010 | 38 | 1,049 |
Undeveloped | 421 | 114 | 61 | 231 | 827 | 44 | 870 |
At 31 December 2013 | | | | | | | |
Developed | 548 | 63 | 197 | 212 | 1,020 | 32 | 1,052 |
Undeveloped | 370 | 164 | 74 | 187 | 795 | 30 | 826 |
At 31 December 2014 | | | | | | | |
Developed | 559 | 63 | 243 | 267 | 1,133 | 24 | 1,156 |
Undeveloped | 327 | 133 | 52 | 242 | 754 | 32 | 786 |
Net proved NGL reserves in million barrels oil equivalent | | | | | | | |
At 31 December 2011 | | | | | | | |
Developed | 282 | - | 11 | 3 | 296 | - | 296 |
Undeveloped | 91 | - | 9 | 10 | 110 | - | 110 |
At 31 December 2012 | | | | | | | |
Developed | 296 | - | 11 | 27 | 334 | - | 334 |
Undeveloped | 109 | - | 7 | 20 | 135 | - | 135 |
At 31 December 2013 | | | | | | | |
Developed | 287 | - | 10 | 34 | 330 | - | 330 |
Undeveloped | 82 | - | 7 | 22 | 111 | - | 111 |
At 31 December 2014 | | | | | | | |
Developed | 258 | - | 9 | 42 | 310 | - | 310 |
Undeveloped | 60 | - | 6 | 27 | 93 | - | 93 |
Net proved gas reserves in billion standard cubic feet | | | | | | | |
At 31 December 2011 | | | | | | | |
Developed | 12,661 | 371 | 293 | 404 | 13,730 | - | 13,730 |
Undeveloped | 3,027 | 237 | 138 | 548 | 3,951 | - | 3,951 |
At 31 December 2012 | | | | | | | |
Developed | 12,073 | 343 | 226 | 567 | 13,210 | - | 13,210 |
Undeveloped | 2,931 | 232 | 115 | 540 | 3,817 | - | 3,817 |
At 31 December 2013 | | | | | | | |
Developed | 11,580 | 467 | 209 | 817 | 13,073 | - | 13,073 |
Undeveloped | 3,181 | 1,455 | 120 | 586 | 5,343 | - | 5,343 |
At 31 December 2014 | | | | | | | |
Developed | 11,227 | 312 | 191 | 946 | 12,677 | - | 12,677 |
Undeveloped | 2,467 | 906 | 108 | 762 | 4,242 | - | 4,242 |
Net proved oil, condensate, NGL and gas reserves in million barrels oil equivalent | | | | | | | |
At 31 December 2011 | | | | | | | |
Developed | 3,175 | 168 | 272 | 175 | 3,790 | 37 | 3,827 |
Undeveloped | 990 | 54 | 118 | 380 | 1,541 | 58 | 1,599 |
At 31 December 2012 | | | | | | | |
Developed | 2,994 | 140 | 272 | 292 | 3,698 | 38 | 3,737 |
Undeveloped | 1,052 | 155 | 88 | 347 | 1,642 | 44 | 1,686 |
At 31 December 2013 | | | | | | | |
Developed | 2,898 | 146 | 244 | 392 | 3,679 | 32 | 3,711 |
Undeveloped | 1,018 | 423 | 103 | 314 | 1,858 | 30 | 1,888 |
At 31 December 2014 | | | | | | | |
Developed | 2,818 | 119 | 287 | 477 | 3,701 | 24 | 3,725 |
Undeveloped | 826 | 295 | 78 | 405 | 1,603 | 32 | 1,635 |
198Statoil, Annual Report on Form 20-F 2014
The conversion rates used are 1 standard cubic meter = 35.3 standard cubic feet, 1 standard cubic meter oil equivalent = 6.29 barrels of oil equivalent (boe) and 1,000 standard cubic meter gas = 1 standard cubic meter oil equivalent.
Capitalised cost related to Oil and Gas production activities | |
Capitalised cost related to oil and gas producing activities | | Capitalised cost related to oil and gas producing activities |
Consolidated companies | Consolidated companies | Consolidated companies |
| At 31 December | At 31 December |
(in NOK billion) | 2014 | 2013 | 2012 | |
(in USD million) | | 2016 | 2015 | 2014 |
| | | | | | |
Unproved properties | 97.5 | 83.8 | 76.0 | 13,563 | 13,341 | 13,121 |
Proved properties, wells, plants and other equipment | 1,178.8 | 984.1 | 896.8 | 159,284 | 150,653 | 158,586 |
| | |
Total capitalised cost | 1,276.3 | 1,068.0 | 972.8 | 172,847 | 163,994 | 171,707 |
Accumulated depreciation, impairment and amortisation | (687.2) | (543.7) | (498.2) | (109,160) | (99,118) | (92,451) |
| | |
Net capitalised cost | 589.1 | 524.3 | 474.5 | 63,687 | 64,876 | 79,256 |
Net capitalised cost related to equity accounted investments as of 31 December 20142016 was NOK 7.2 billion, NOK 5.9 billionUSD 2,000 million, USD 1,000 million in 20132015 and NOK 4.9 billionUSD 1,147 million in
2012. 2014. The increase is mainly related to the investment in Lundin Petroleum AB as described in note 12. The reported figures are based on capitalised costs within the upstream segments in Statoil, in line with the description below for result of operations for oil and gas producing activities.
Expenditures incurred in Oil and Gas Property Acquisition, Exploration and Development Activities | |
Expenditures incurred in oil and gas property acquisition, exploration and development activities | | Expenditures incurred in oil and gas property acquisition, exploration and development activities |
These expenditures include both amounts capitalised and expensed. | These expenditures include both amounts capitalised and expensed. | These expenditures include both amounts capitalised and expensed. |
| | | | |
Consolidated companies | Consolidated companies | Consolidated companies |
(in NOK billion) | Norway | Eurasia excluding Norway | Africa | Americas | Total | |
(in USD million) | | Norway | Eurasia excluding Norway | Africa | Americas | Total |
| | | | | |
Full year 2016 | | | |
Exploration expenditures | | 495 | 155 | 197 | 590 | 1,437 |
Development costs | | 5,245 | 661 | 780 | 2,118 | 8,804 |
Acquired proved properties | | 6 | 0 | 3 | 9 |
Acquired unproved properties | | 57 | 58 | 0 | 2,362 | 2,477 |
| | | |
Total | | 5,803 | 874 | 977 | 5,073 | 12,727 |
| | | |
Full year 2015 | | | |
Exploration expenditures | | 796 | 213 | 381 | 1,469 | 2,859 |
Development costs | | 5,863 | 1,420 | 1,315 | 3,600 | 12,198 |
Acquired proved properties | | 0 | 79 | 79 |
Acquired unproved properties | | 6 | 77 | 88 | 375 | 546 |
| | | |
Total | | 6,665 | 1,710 | 1,784 | 5,523 | 15,682 |
| | | | | | |
Full year 2014 | | | | |
Exploration expenditures | 7.0 | 2.5 | 7.3 | 7.1 | 23.9 | 1,117 | 291 | 1,244 | 1,075 | 3,727 |
Development costs | 52.2 | 13.4 | 13.3 | 22.7 | 101.7 | 8,354 | 2,140 | 2,107 | 3,389 | 15,990 |
Acquired proved properties | 0.0 | 4.7 | 4.7 | 0 | 778 | 778 |
Acquired unproved properties | 0.0 | (0.0) | 2.3 | 2.3 | 0 | 3 | (3) | 355 | 355 |
| | | | |
Total | 59.3 | 15.9 | 20.6 | 36.8 | 132.6 | 9,471 | 2,434 | 3,348 | 5,596 | 20,849 |
| | | |
Full year 2013 | | | |
Exploration expenditures | 7.9 | 3.8 | 2.7 | 7.4 | 21.8 | |
Development costs | 51.8 | 8.5 | 11.6 | 26.4 | 98.3 | |
Acquired proved properties | 2.2 | 0.0 | 2.2 | |
Acquired unproved properties | 0.0 | 0.4 | 0.0 | 1.8 | 2.2 | |
| | | |
Total | 61.9 | 12.7 | 14.3 | 35.6 | 124.5 | |
| | | |
Full year 2012 | | | |
Exploration expenditures | 5.2 | 4.1 | 3.8 | 7.8 | 20.9 | |
Development costs | 45.7 | 3.2 | 12.2 | 28.7 | 89.8 | |
Acquired proved properties | 0.0 | 0.3 | 0.3 | |
Acquired unproved properties | 0.0 | 0.4 | 0.0 | 6.0 | 6.4 | |
| | | |
Total | 50.9 | 7.7 | 16.0 | 42.8 | 117.4 | |
Expenditures incurred in Oil and Gas Development Activitiesdevelopment activities related to equity accounted investments was NOK 1.6 billionUSD 1,370 million in 20142016, USD 46 million in 2015 and NOK 0.4 billionUSD 255 million in 2013 and 2012.2014. The increase is mainly related to the investment in Lundin Petroleum AB, USD 1,199 million, as described in note 12.
188Statoil, Annual Report on Form 20-F 2016
Results of Operationoperation for Oiloil and Gas Producing Activitiesgas producing activities
As required by Topic 932, the revenues and expenses included in the following table reflect only those relating to the oil and gas producing operations of Statoil.
The result of operations for oil and gas producing activities contains the two upstream reporting segments Development and Production Norway (DPN) and Development and Production International (DPI) as presented in note 3 Segments. The figures inProduction cost is based on operating expenses related to production of oil and gas. From the "other" lines relate to gainsoperating expenses certain expenses such as; transportation costs, accruals for over/underlift position, royalty payments and losses from
Statoil, Annual Report on Form 20-F 2014199
commodity based derivatives, transportationdiluent costs are excluded. These expenses and processing costs within the upstream segments,mainly upstream business administration and business developmentare included as well asother expenses in the tables below. Other revenues mainly consist of gains and losses from sales of oil and gas interests.interests and gains and losses from commodity based derivatives within the upstream segments.
Income tax expense is calculated on the basis of statutory tax rates adjusted for uplift and tax credits. No deductions are made for interest or other elements not included in the table below.
Consolidated companies |
(in NOK billion) | Norway | Eurasia excluding Norway | Africa | Americas | Total |
| | | | | |
Full year 2014 | | | | | |
Sales | 1.8 | 4.3 | 5.0 | 3.9 | 15.0 |
Transfers | 172.6 | 6.1 | 32.6 | 28.6 | 239.9 |
Other revenues | 7.7 | 5.7 | 0.7 | (1.0) | 13.1 |
| | | | | |
Total revenues | 182.1 | 16.1 | 38.3 | 31.4 | 268.1 |
| | | | | |
Exploration expenses | (5.4) | (2.6) | (9.2) | (13.2) | (30.3) |
Production costs | (22.3) | (1.3) | (4.0) | (5.6) | (33.1) |
Depreciation, amortisation and net impairment losses | (40.0) | (4.9) | (14.1) | (37.9) | (96.8) |
Other expenses | (2.9) | (1.5) | (0.3) | (10.3) | (14.9) |
| | | | | |
Total costs | (70.5) | (10.1) | (27.5) | (67.0) | (175.2) |
| | | | | |
Results of operations before tax | 111.6 | 6.0 | 10.9 | (35.6) | 92.9 |
Tax expense | (74.8) | (0.5) | (8.4) | (0.4) | (84.0) |
| | | | | |
Results of operations | 36.8 | 5.5 | 2.5 | (36.0) | 8.8 |
| | | | | |
Net income from equity accounted investments | (0.0) | 1.0 | 0.0 | (1.7) | (0.7) |
Consolidated companies | Consolidated companies | Consolidated companies |
(in NOK billion) | Norway | Eurasia excluding Norway | Africa | Americas | Total | |
(in USD million) | | Norway | Eurasia excluding Norway | Africa | Americas | Total |
| | | | |
Full year 2013 | | | |
Full year 2016 | | | |
Sales | 0.3 | 4.0 | 3.9 | 4.1 | 12.3 | 57 | 161 | 305 | 226 | 749 |
Transfers | 192.5 | 7.4 | 30.9 | 27.1 | 257.9 | 12,962 | 494 | 2,803 | 2,466 | 18,725 |
Other revenues | 9.3 | 3.9 | 0.2 | 0.4 | 13.8 | 136 | 30 | 6 | 266 | 438 |
| | | | |
Total revenues | 202.1 | 15.3 | 35.0 | 31.6 | 284.0 | 13,155 | 685 | 3,114 | 2,958 | 19,912 |
| | | | |
Exploration expenses | (5.5) | (3.4) | (1.6) | (7.5) | (18.0) | (383) | (274) | (284) | (2,011) | (2,952) |
Production costs | (22.3) | (1.5) | (3.9) | (4.3) | (32.0) | (2,129) | (148) | (629) | (663) | (3,569) |
Depreciation, amortisation and net impairment losses | (32.2) | (2.4) | (13.3) | (16.2) | (64.1) | (5,698) | (130) | (2,181) | (3,199) | (11,208) |
Other expenses | (5.1) | (1.6) | (0.5) | (9.3) | (16.5) | (417) | (81) | (89) | (1,321) | (1,908) |
| | | | |
Total costs | (65.1) | (8.9) | (19.3) | (37.3) | (130.6) | (8,627) | (633) | (3,183) | (7,194) | (19,637) |
| | | | |
Results of operations before tax | 137.0 | 6.4 | 15.7 | (5.7) | 153.4 | 4,528 | 52 | (69) | (4,236) | 275 |
Tax expense | (90.9) | (2.0) | (8.1) | (1.0) | (102.0) | (2,760) | 272 | (123) | (25) | (2,636) |
| | | | |
Results of operations | 46.1 | 4.4 | 7.6 | (6.7) | 51.4 | 1,768 | 324 | (192) | (4,261) | (2,361) |
| | | | |
Net income from equity accounted investments | 0.1 | 0.3 | 0.0 | (0.3) | 0.1 | (78) | (86) | 0 | (14) | (178) |
200Statoil, Annual Report on Form 20-F 2016189
Consolidated companies |
(in USD million) | Norway | Eurasia excluding Norway | Africa | Americas | Total |
| | | | | |
Full year 2015 | | | | | |
Sales | 50 | 257 | (41) | 198 | 464 |
Transfers | 17,429 | 480 | 3,454 | 2,764 | 24,127 |
Other revenues | (143) | 1,169 | 3 | 7 | 1,036 |
| | | | | |
Total revenues | 17,336 | 1,906 | 3,416 | 2,969 | 25,627 |
| | | | | |
Exploration expenses | (576) | (190) | (630) | (2,476) | (3,872) |
Production costs | (2,629) | (160) | (671) | (794) | (4,254) |
Depreciation, amortisation and net impairment losses | (6,379) | (799) | (2,487) | (6,946) | (16,611) |
Other expenses | (594) | (165) | (237) | (1,374) | (2,370) |
| | | | | |
Total costs | (10,178) | (1,314) | (4,025) | (11,590) | (27,107) |
| | | | | |
Results of operations before tax | 7,157 | 593 | (609) | (8,622) | (1,481) |
Tax expense | (4,824) | 238 | (717) | (21) | (5,324) |
| | | | | |
Results of operations | 2,333 | 831 | (1,326) | (8,643) | (6,805) |
| | | | | |
Net income from equity accounted investments | 3 | 32 | 0 | (123) | (88) |
190 Statoil, Annual Report on Form 20-F 20142016
Consolidated companies | Consolidated companies | Consolidated companies |
(in NOK billion) | Norway | Eurasia excluding Norway | Africa | Americas | Total | |
(in USD million) | | Norway | Eurasia excluding Norway | Africa | Americas | Total |
| | | | |
Full year 2012 | | | |
Full year 2014 | | | |
Sales | 0.2 | 6.1 | 10.3 | 5.2 | 21.8 | 286 | 688 | 818 | 615 | 2,407 |
Transfers | 212.6 | 6.8 | 27.3 | 20.5 | 267.2 | 27,478 | 978 | 5,214 | 4,564 | 38,234 |
Other revenues | 7.9 | 1.3 | 0.2 | 1.0 | 10.4 | 1,151 | 932 | 117 | (152) | 2,048 |
| | | | |
Total revenues | 220.7 | 14.2 | 37.8 | 26.7 | 299.4 | 28,915 | 2,598 | 6,149 | 5,027 | 42,689 |
| | | | |
Exploration expenses | (3.5) | (3.6) | (3.4) | (7.6) | (18.1) | (838) | (397) | (1,349) | (2,078) | (4,662) |
Production costs | (22.2) | (1.1) | (3.5) | (3.9) | (30.7) | (3,555) | (225) | (719) | (856) | (5,355) |
Depreciation, amortisation and net impairment losses | (29.8) | (3.0) | (10.7) | (12.5) | (56.0) | (6,301) | (744) | (2,221) | (5,921) | (15,187) |
Other expenses | (3.6) | (1.9) | (0.5) | (6.8) | (12.8) | (479) | (170) | 33 | (1,718) | (2,334) |
| | | | |
Total costs | (59.1) | (9.6) | (18.1) | (30.8) | (117.6) | (11,173) | (1,536) | (4,256) | (10,573) | (27,538) |
| | | | |
Results of operations before tax | 161.6 | 4.6 | 19.7 | (4.1) | 181.8 | 17,742 | 1,062 | 1,893 | (5,546) | 15,151 |
Tax expense | (115.7) | (2.0) | (10.8) | 3.1 | (125.4) | (11,512) | (70) | (1,278) | (64) | (12,924) |
| | | | |
Results of operations | 45.9 | 2.6 | 8.9 | (1.0) | 56.4 | 6,230 | 992 | 615 | (5,610) | 2,227 |
| | | | |
Net income from equity accounted investments | 0.1 | 0.5 | 0.0 | 0.8 | 1.4 | 11 | 132 | 0 | (246) | (103) |
Average production cost in USD per boe based on entitlement volumes (consolidated) | Norway | Eurasia excluding Norway | Africa | Americas | Total |
| | | | | |
2016 | 5 | 8 | 7 | 6 | 5 |
2015 | 6 | 10 | 8 | 8 | 6 |
2014 | 8 | 10 | 10 | 8 | 8 |
Production cost per boe is calculated as the production costs in the result of operations table, divided by the produced entitlement volumes (mboe) for the corresponding period.
Standardised measure of discounted future net cash flows relating to proved oil and gas reserves
The table below shows the standardised measure of future net cash flows relating to proved reserves. The analysis is computed in accordance with Topic 932, by applying average market prices as defined by the SEC, year end costs, year end statutory tax rates and a discount factor of 10% to year end quantities of net proved reserves. The standardised measure of discounted future net cash flows is a forward-looking statement.
Future price changes are limited to those provided by existing contractual arrangements at the end of each reporting year. Future development and production costs are those estimated future expenditures necessary to develop and produce year-end estimated proved reserves based on year-end cost indices, assuming continuation of year-end economic conditions. Pre-tax future net cash flow is net of decommissioning and removal costs. Estimated future income taxes are calculated by applying the appropriate year-end statutory tax rates. These rates reflect allowable deductions and tax credits and are applied to estimated future pretax net cash flows, less the tax basis of related assets. Discounted future net cash flows are calculated using a discount rate of 10% per year. Discounting requires a year-by-year estimate of when future expenditures will be incurred and when reserves will be produced. The standardised measure of discounted future net cash flows prescribed under Topic 932 requires assumptions as to the timing and amount of future development and production costs and income from the production of proved reserves. The information does not represent management's estimate or Statoil's expected future cash flows or the value of its proved reserves and therefore should not be relied upon as an indication of Statoil's future cash flow or value of its proved reserves.
Statoil, Annual Report on Form 20-F 20142016 201191
(in NOK billion) | Norway | Eurasia excluding Norway | Africa | Americas | Total | |
At 31 December 2014 | | |
(in USD million) | | Norway | Eurasia excluding Norway | Africa | Americas | Total |
At 31 December 2016 | | |
Consolidated companies | | |
Future net cash inflows | 1,467.9 | 203.4 | 213.6 | 323.0 | 2,207.9 | 120,355 | 4,032 | 10,644 | 20,034 | 155,065 |
Future development costs | (166.8) | (59.9) | (12.3) | (51.7) | (290.8) | (14,572) | (927) | (733) | (3,559) | (19,791) |
Future production costs | (439.8) | (91.6) | (58.3) | (142.7) | (732.4) | (45,357) | (2,101) | (4,909) | (11,701) | (64,069) |
Future income tax expenses | (606.8) | (8.1) | (48.6) | (34.0) | (697.5) | (36,268) | (127) | (1,492) | (1,355) | (39,243) |
Future net cash flows | 254.5 | 43.8 | 94.4 | 94.6 | 487.3 | 24,158 | 876 | 3,510 | 3,418 | 31,962 |
10 % annual discount for estimated timing of cash flows | (99.7) | (27.8) | (28.1) | (41.9) | (197.6) | |
10% annual discount for estimated timing of cash flows | | (8,729) | (241) | (646) | (1,255) | (10,870) |
Standardised measure of discounted future net cash flows | 154.7 | 16.0 | 66.3 | 52.7 | 289.8 | 15,429 | 635 | 2,864 | 2,164 | 21,092 |
| | |
Equity accounted investments | | |
Standardised measure of discounted future net cash flows | - | 5.1 | 279 | - | 127 | 406 |
| | |
Total standardised measure of discounted future net cash flows including equity accounted investments | 154.7 | 16.0 | 66.3 | 57.8 | 294.8 | 15,708 | 635 | 2,864 | 2,290 | 21,498 |
| | |
| | |
(in NOK billion) | Norway | Eurasia excluding Norway | Africa | Americas | Total | |
At 31 December 2013 | | |
(in USD million) | | Norway | Eurasia excluding Norway | Africa | Americas | Total |
At 31 December 2015 | | |
Consolidated companies | | |
Future net cash inflows | 1,700.2 | 273.7 | 205.2 | 257.5 | 2,436.6 | 160,277 | 5,455 | 17,073 | 23,595 | 206,399 |
Future development costs | (200.0) | (80.8) | (16.0) | (38.9) | (335.7) | (19,409) | (1,345) | (1,330) | (5,157) | (27,242) |
Future production costs | (471.3) | (125.4) | (54.8) | (104.3) | (755.8) | (54,911) | (2,765) | (6,832) | (12,762) | (77,271) |
Future income tax expenses | (740.9) | (12.2) | (50.0) | (24.0) | (827.1) | (56,680) | (118) | (3,149) | (800) | (60,747) |
Future net cash flows | 288.0 | 55.3 | 84.4 | 90.3 | 518.0 | 29,276 | 1,226 | 5,762 | 4,875 | 41,139 |
10 % annual discount for estimated timing of cash flows | (120.8) | (39.7) | (27.6) | (41.3) | (229.4) | |
10% annual discount for estimated timing of cash flows | | (12,011) | (406) | (1,386) | (1,969) | (15,773) |
Standardised measure of discounted future net cash flows | 167.2 | 15.6 | 56.8 | 49.0 | 288.6 | 17,264 | 820 | 4,375 | 2,906 | 25,366 |
| | |
Equity accounted investments | | |
Standardised measure of discounted future net cash flows | - | 4.8 | - | 140 |
| | |
Total standardised measure of discounted future net cash flows including equity accounted investments | 167.2 | 15.6 | 56.8 | 53.8 | 293.4 | 17,264 | 820 | 4,375 | 3,047 | 25,506 |
| | | | |
| | | | |
(in NOK billion) | Norway | Eurasia excluding Norway | Africa | Americas | Total | |
At 31 December 2012 | | |
(in USD million) | | Norway | Eurasia excluding Norway | Africa | Americas | Total |
At 31 December 2014 | | |
Consolidated companies | | | | |
Future net cash inflows | 1,812.8 | 138.6 | 203.4 | 228.5 | 2,383.3 | 234,404 | 32,474 | 34,114 | 51,585 | 352,577 |
Future development costs | (196.1) | (39.6) | (16.2) | (41.2) | (293.1) | (26,643) | (9,571) | (1,961) | (8,262) | (46,437) |
Future production costs | (499.1) | (39.8) | (55.4) | (90.9) | (685.2) | (70,229) | (14,622) | (9,310) | (22,785) | (116,946) |
Future income tax expenses | (862.7) | (15.0) | (48.9) | (25.1) | (951.7) | (96,896) | (1,287) | (7,764) | (5,432) | (111,378) |
Future net cash flows | 254.9 | 44.2 | 82.9 | 71.3 | 453.3 | 40,636 | 6,995 | 15,079 | 15,107 | 77,816 |
10 % annual discount for estimated timing of cash flows | (113.2) | (25.0) | (27.6) | (34.7) | (200.5) | |
10% annual discount for estimated timing of cash flows | | (15,925) | (4,438) | (4,494) | (6,688) | (31,546) |
Standardised measure of discounted future net cash flows | 141.7 | 19.2 | 55.3 | 36.6 | 252.8 | 24,711 | 2,556 | 10,584 | 8,419 | 46,270 |
| | |
Equity accounted investments | | |
Standardised measure of discounted future net cash flows | - | 1.0 | - | 806 |
| | |
Total standardised measure of discounted future net cash flows including equity accounted investments | 141.7 | 19.2 | 55.3 | 37.6 | 253.8 | 24,711 | 2,556 | 10,584 | 9,225 | 47,076 |
202192 Statoil, Annual Report on Form 20-F 20142016
Changes in the standardised measure of discounted future net cash flows from proved reserves | Changes in the standardised measure of discounted future net cash flows from proved reserves | Changes in the standardised measure of discounted future net cash flows from proved reserves |
(in NOK billion) | 2014 | 2013 | 2012 | |
(in USD million) | | 2016 | 2015 | 2014 |
| | | | | | |
Consolidated companies | | | | |
Standardised measure at beginning of year | 288.6 | 252.8 | 302.1 | 25,366 | 46,270 | 47,448 |
Net change in sales and transfer prices and in production (lifting) costs related to future production | (98.3) | (24.0) | 9.6 | (21,148) | (71,817) | (20,157) |
Changes in estimated future development costs | (32.3) | (54.9) | (63.7) | (16) | 6,739 | (3,838) |
Sales and transfers of oil and gas produced during the period, net of production cost | (232.6) | (243.2) | (275.1) | (16,824) | (20,803) | (36,904) |
Net change due to extensions, discoveries, and improved recovery | 23.1 | 10.6 | 11.1 | 1,099 | 3,745 | 3,685 |
Net change due to purchases and sales of minerals in place | (25.1) | (33.9) | (13.4) | (566) | (1,026) | (4,181) |
Net change due to revisions in quantity estimates | 126.1 | 126.5 | 114.3 | 8,163 | 7,491 | 19,340 |
Previously estimated development costs incurred during the period | 99.6 | 95.1 | 88.7 | 7,998 | 10,474 | 15,811 |
Accretion of discount | 77.3 | 81.4 | 84.4 | 5,949 | 11,335 | 12,691 |
Net change in income taxes | 63.3 | 78.2 | (5.2) | 11,070 | 32,958 | 12,374 |
| | |
Total change in the standardised measure during the year | 1.2 | 35.8 | (49.3) | (4,274) | (20,904) | (1,178) |
| | |
Standardised measure at end of year | 289.8 | 288.6 | 252.8 | 21,092 | 25,366 | 46,270 |
| | |
Equity accounted investments | | |
Standardised measure at end of year | 5.1 | 4.8 | 1.0 | 406 | 140 | 806 |
| | |
Standardised measure at end of year including equity accounted investments | 294.8 | 293.4 | 253.8 | 21,498 | 25,506 | 47,076 |
In the table above, each line item presents the sources of changes in the standardised measure value on a discounted basis, with the Accretionaccretion of discount line item reflecting the increase in the net discounted value of the proved oil and gas reserves due to the fact that the future cash flows are now one year closer in time.
The standardized measure at the beginning of the year represents the discounted net present value after deductions of both future development costs, production costs and taxes. The ‘Net change in sales and transfer prices and in production (lifting) costs related to future production’ is, on the other hand, related to the future net cash flows at 31 December 2015. The proved reserves at 31 December 2015 were multiplied by the actual change in price, and change in unit of production costs, to arrive at the net effect of changes in price and production costs. Development costs and taxes are reflected in the line items ‘Change in estimated future development costs’ and ‘Net change in income taxes’ and are not included in the ‘Net change in sales and transfer prices and in production (lifting) costs related to future production’.
28 Subsequent events
On 10 February 2015 Statoil issued bonds of EUR 3.75 billion, equivalent to NOK 32.1 billion at the transaction date. The bonds have maturities of 4-20 years. All of the bonds are unconditionally guaranteed by Statoil Petroleum AS.
On 5 February 2015 the board of directorsSee note 17 Equity and dividend for proposed to declare a dividend for the fourth quarter of 2014 of NOK 1.80 per share.2016.
Statoil, Annual Report on Form 20-F 20142016 203193
8.229 Condensed consolidated financial information related to guaranteed debt securities
Statoil Petroleum AS, a 100% owned subsidiary of Statoil ASA, is the co-obligor of certain existing debt securities of Statoil ASA that are registered under the US Securities Act of 1933 ("US registered debt securities"). As co-obligor, Statoil Petroleum AS fully, unconditionally and irrevocably assumes and agrees to perform, jointly and severally with Statoil ASA, the payment and covenant obligations for these US registered debt securities. In addition, Statoil ASA is also the co-obligor of a US registered debt security of Statoil Petroleum AS. As co-obligor, Statoil ASA fully, unconditionally and irrevocably assumes and agrees to perform, jointly and severally with Statoil Petroleum AS, the payment and covenant obligations of that security. In the future, Statoil ASA may from time to time issue future US registered debt securities for which Statoil Petroleum AS will be the co-obligor or guarantor.
The following financial information on a condensed consolidated basis provides financial information about Statoil ASA, as issuer and co-obligor, Statoil Petroleum AS, as co-obligor and guarantor, and all other subsidiaries as required by SEC Rule 3-10 of Regulation S-X. The condensed consolidated information is prepared in accordance with Statoil's IFRS accounting policies as described in note 2 Significant accounting policies, except that investments in subsidiaries and jointly controlled entities are accounted for using the equity method as required by Rule 3-10.
The following is condensed consolidated financial information for the full year 2016, 2015 and 2014, and as of 31 December 2016 and 2015.
CONDENSED CONSOLIDATED STATEMENT OF INCOME AND OTHER COMPREHENSIVE INCOME |
| Statoil ASA | Statoil Petroleum AS | Non-guarantor subsidiaries | Consolidation adjustments | The Statoil group |
Full year 2016 (in USD million) |
| | | | | |
Revenues and other income | 31,580 | 15,405 | 15,472 | (16,464) | 45,993 |
Net income from equity accounted companies | (2,726) | (3,987) | 26 | 6,567 | (119) |
| | | | | |
Total revenues and other income | 28,854 | 11,418 | 15,498 | (9,898) | 45,873 |
| | | | | |
Total operating expenses | (31,784) | (10,989) | (19,364) | 16,344 | (45,793) |
| | | | | |
Net operating income | (2,930) | 429 | (3,865) | 6,446 | 80 |
| | | | | |
Net financial items | 728 | (560) | (115) | (311) | (258) |
| | | | | |
Income before tax | (2,202) | (131) | (3,980) | 6,135 | (178) |
| | | | | |
Income tax | (407) | (2,392) | 97 | (23) | (2,724) |
| | | | | |
Net income | (2,608) | (2,523) | (3,884) | 6,113 | (2,902) |
| | | | | |
Other comprehensive income | (671) | 153 | (280) | 441 | (357) |
| | | | | |
Total comprehensive income | (3,279) | (2,370) | (4,163) | 6,553 | (3,259) |
194Statoil, Annual Report of Independent Registered Public Accounting firmon Form 20-F 2016
CONDENSED CONSOLIDATED STATEMENT OF INCOME AND OTHER COMPREHENSIVE INCOME |
| Statoil ASA | Statoil Petroleum AS | Non-guarantor subsidiaries | Consolidation adjustments | The Statoil group |
Full year 2015 (in USD million) |
| | | | | |
Revenues and other income | 39,289 | 20,583 | 20,248 | (20,448) | 59,671 |
Net income from equity accounted companies | (4,686) | (8,350) | (42) | 13,050 | (29) |
| | | | | |
Total revenues and other income | 34,603 | 12,232 | 20,205 | (7,399) | 59,642 |
| | | | | |
Total operating expenses | (39,372) | (12,561) | (26,907) | 20,566 | (58,276) |
| | | | | |
Net operating income | (4,769) | (329) | (6,702) | 13,167 | 1,366 |
| | | | | |
Net financial items | (2,771) | (106) | 139 | 1,427 | (1,311) |
| | | | | |
Income before tax | (7,541) | (435) | (6,563) | 14,594 | 55 |
| | | | | |
Income tax | 925 | (5,301) | (840) | (9) | (5,225) |
| | | | | |
Net income | (6,616) | (5,736) | (7,402) | 14,585 | (5,169) |
| | | | | |
Other comprehensive income | (1,414) | (1,771) | (1,405) | 1,751 | (2,838) |
| | | | | |
Total comprehensive income | (8,030) | (7,507) | (8,807) | 16,336 | (8,007) |
CONDENSED CONSOLIDATED STATEMENT OF INCOME AND OTHER COMPREHENSIVE INCOME |
| Statoil ASA | Statoil Petroleum AS | Non-guarantor subsidiaries | Consolidation adjustments | The Statoil group |
Full year 2014 (in USD million) |
| | | | | |
Revenues and other income | 65,647 | 33,454 | 34,189 | (33,991) | 99,299 |
Net income from equity accounted companies | 3,812 | (4,794) | (41) | 989 | (34) |
| | | | | |
Total revenues and other income | 69,458 | 28,660 | 34,148 | (33,002) | 99,264 |
| | | | | |
Total operating expenses | (66,668) | (14,120) | (35,114) | 34,516 | (81,386) |
| | | | | |
Net operating income | 2,791 | 14,540 | (966) | 1,514 | 17,878 |
| | | | | |
Net financial items | (1,841) | (28) | (51) | 1,940 | 20 |
| | | | | |
Income before tax | 950 | 14,512 | (1,017) | 3,453 | 17,898 |
| | | | | |
Income tax | 981 | (13,007) | (1,802) | (184) | (14,011) |
| | | | | |
Net income | 1,931 | 1,505 | (2,819) | 3,269 | 3,887 |
| | | | | |
Other comprehensive income | (2,648) | (2,384) | (1,385) | 1,829 | (4,587) |
| | | | | |
Total comprehensive income | (717) | (879) | (4,204) | 5,099 | (701) |
8.2.1 Statoil, Annual Report on Form 20-F 2016195
CONDENSED CONSOLIDATED BALANCE SHEET |
| Statoil ASA | Statoil Petroleum AS | Non-guarantor subsidiaries | Consolidation adjustments | The Statoil group |
At 31 December 2016 (in USD million) |
| | | | | |
ASSETS | | | | | |
Property, plant, equipment and intangible assets | 576 | 29,944 | 38,310 | (31) | 68,799 |
Equity accounted companies | 40,294 | 18,089 | 1,013 | (57,151) | 2,245 |
Other non-current assets | 3,212 | 945 | 3,933 | 0 | 8,090 |
Non-current receivables from subsidiaries | 23,644 | (0) | 26 | (23,670) | 0 |
| | | | | |
Total non-current assets | 67,725 | 48,979 | 43,281 | (80,852) | 79,133 |
| | | | | |
Current receivables from subsidiaries | 4,305 | 2,141 | 12,879 | (19,325) | 0 |
Other current assets | 14,716 | 924 | 4,769 | (639) | 19,769 |
Cash and cash equivalents | 4,274 | 46 | 770 | 0 | 5,090 |
| | | | | |
Total current assets | 23,295 | 3,111 | 18,418 | (19,964) | 24,859 |
| | | | | |
Assets classified as held for sale | 0 | 0 | 537 | 0 | 537 |
| | | | | |
Total assets | 91,021 | 52,089 | 62,236 | (100,816) | 104,530 |
| | | | | |
EQUITY AND LIABILITIES | | | | | |
Total equity | 35,072 | 17,974 | 39,510 | (57,457) | 35,099 |
| | | | | |
Non-current liabilities to subsidiaries | 17 | 12,848 | 10,806 | (23,670) | 0 |
Other non-current liabilities | 33,065 | 13,812 | 5,953 | (198) | 52,633 |
| | | | | |
Total non-current liabilities | 33,082 | 26,660 | 16,759 | (23,868) | 52,633 |
| | | | | |
Other current liabilities | 7,757 | 4,419 | 4,735 | (166) | 16,744 |
Current liabilities to subsidiaries | 15,109 | 3,037 | 1,179 | (19,325) | 0 |
| | | | | |
Total current liabilities | 22,866 | 7,456 | 5,913 | (19,492) | 16,744 |
| | | | | |
Liabilities directly associated with the assets classified as held for sale | 0 | 0 | 54 | 0 | 54 |
| | | | | |
Total liabilities | 55,948 | 34,116 | 22,727 | (43,359) | 69,431 |
| | | | | |
Total equity and liabilities | 91,021 | 52,089 | 62,236 | (100,816) | 104,530 |
196Statoil, Annual Report of Independent Registered Public Accounting firmon Form 20-F 2016
CONDENSED CONSOLIDATED BALANCE SHEET |
| Statoil ASA | Statoil Petroleum AS | Non-guarantor subsidiaries | Consolidation adjustments | The Statoil group |
At 31 December 2015 (in USD million) |
| | | | | |
ASSETS | | | | | |
Property, plant, equipment and intangible assets | 636 | 29,653 | 41,205 | (36) | 71,458 |
Equity accounted companies | 53,643 | 20,547 | 434 | (73,800) | 824 |
Other non-current assets | 4,357 | 1,014 | 3,937 | (3) | 9,305 |
Non-current receivables from subsidiaries | 13,976 | (0) | 24 | (13,999) | 0 |
| | | | | |
Total non-current assets | 72,612 | 51,214 | 45,600 | (87,839) | 81,588 |
| | | | | |
Current receivables from subsidiaries | 1,239 | 2,319 | 13,631 | (17,189) | (0) |
Other current assets | 14,847 | 1,006 | 4,118 | (440) | 19,532 |
Cash and cash equivalents | 7,471 | 87 | 1,066 | 0 | 8,623 |
| | | | | |
Total current assets | 23,557 | 3,412 | 18,815 | (17,629) | 28,154 |
| | | | | |
Total assets | 96,169 | 54,626 | 64,415 | (105,468) | 109,742 |
| | | | | |
EQUITY AND LIABILITIES | | | | | |
Total equity | 40,271 | 20,895 | 52,607 | (73,466) | 40,307 |
| | | | | |
Non-current liabilities to subsidiaries | 15 | 13,726 | 259 | (13,999) | 0 |
Other non-current liabilities | 34,415 | 14,363 | 5,432 | (138) | 54,073 |
| | | | | |
Total non-current liabilities | 34,430 | 28,089 | 5,691 | (14,137) | 54,073 |
| | | | | |
Other current liabilities | 5,954 | 4,377 | 5,707 | (675) | 15,363 |
Current liabilities to subsidiaries | 15,514 | 1,265 | 410 | (17,189) | 0 |
| | | | | |
Total current liabilities | 21,468 | 5,643 | 6,117 | (17,865) | 15,363 |
| | | | | |
Total liabilities | 55,899 | 33,731 | 11,808 | (32,002) | 69,436 |
| | | | | |
Total equity and liabilities | 96,169 | 54,626 | 64,415 | (105,468) | 109,743 |
Statoil, Annual Report on Form 20-F 2016197
CONDENSED CONSOLIDATED CASH FLOW STATEMENT |
| Statoil ASA | Statoil Petroleum AS | Non-guarantor subsidiaries | Consolidation adjustments | The Statoil group |
Full year 2016 (in USD million) |
| | | | | |
Cash flows provided by (used in) operating activities | 3,330 | 7,262 | 1,561 | (3,119) | 9,034 |
Cash flows provided by (used in) investing activities | (3,138) | (6,785) | (5,393) | 4,869 | (10,447) |
Cash flows provided by (used in) financing activities | (3,308) | (516) | 3,616 | (1,750) | (1,958) |
| | | | | |
Net increase (decrease) in cash and cash equivalents | (3,116) | (39) | (216) | 0 | (3,371) |
| | | | | |
Effect of exchange rate changes on cash and cash equivalents | (81) | (2) | (69) | 0 | (152) |
Cash and cash equivalents at the beginning of the period (net of overdraft) | 7,471 | 87 | 1,056 | 0 | 8,614 |
| | | | | |
Cash and cash equivalents at the end of the period (net of overdraft) | 4,274 | 46 | 770 | 0 | 5,090 |
| | | | | |
| | | | | |
| Statoil ASA | Statoil Petroleum AS | Non-guarantor subsidiaries | Consolidation adjustments | The Statoil group |
Full year 2015 (in USD million) |
| | | | | |
Cash flows provided by (used in) operating activities | 2,883 | 8,348 | 4,567 | (2,170) | 13,628 |
Cash flows provided by (used in) investing activities | (5,694) | (17,219) | (5,630) | 14,042 | (14,501) |
Cash flows provided by (used in) financing activities | 1,333 | 8,986 | 824 | (11,872) | (729) |
| | | | | |
Net increase (decrease) in cash and cash equivalents | (1,478) | 115 | (239) | 0 | (1,602) |
| | | | | |
Effect of exchange rate changes on cash and cash equivalents | (677) | (106) | (88) | 0 | (871) |
Cash and cash equivalents at the beginning of the period (net of overdraft) | 9,625 | 78 | 1,382 | 0 | 11,085 |
| | | | | |
Cash and cash equivalents at the end of the period (net of overdraft) | 7,470 | 87 | 1,055 | 0 | 8,612 |
| | | | | |
| | | | | |
| Statoil ASA | Statoil Petroleum AS | Non-guarantor subsidiaries | Consolidation adjustments | The Statoil group |
Full year 2014 (in USD million) |
| | | | | |
Cash flows provided by (used in) operating activities | 2,666 | 11,966 | 8,927 | (3,354) | 20,205 |
Cash flows provided by (used in) investing activities | (2,528) | (9,872) | (8,500) | 3,125 | (17,775) |
Cash flows provided by (used in) financing activities | (1,852) | (2,015) | (390) | 229 | (4,028) |
| | | | | |
Net increase (decrease) in cash and cash equivalents | (1,714) | 79 | 37 | 0 | (1,598) |
| | | | | |
Effect of exchange rate changes on cash and cash equivalents | (1,309) | (1) | (19) | 0 | (1,329) |
Cash and cash equivalents at the beginning of the period (net of overdraft) | 12,648 | (2) | 1,367 | 0 | 14,013 |
| | | | | |
Cash and cash equivalents at the end of the period (net of overdraft) | 9,625 | 76 | 1,385 | 0 | 11,086 |
Report of Independent Registered Public Accounting Firm
To the board of directors and shareholders of Statoil ASA
We have audited the accompanying consolidatedConsolidated balance sheets of Statoil ASA and subsidiaries as of 31December 20142016 and 20132015, and the related consolidatedConsolidated statements of income, comprehensive income, changes in equity, and cash flows for each of the years in the three-year period ended 31 December 2014.2016. These consolidatedConsolidated financial statements are the responsibility of the Statoil ASA’sASA's management. Our responsibility is to express an opinion on these consolidatedConsolidated financial statements based on our audits.
198Statoil, Annual Report on Form 20-F 2016
We conducted our auditaudits in accordance with the standards of the Public Company Accounting Oversight Board (United States). Those standards require that we plan and perform the audit to obtain reasonable assurance about whether the financial statements are free of material misstatement. An audit includes examining, on a test basis, evidence supporting the amounts and disclosures in the financial statements. An audit also includes assessing the accounting principles used and significant estimates made by management, as well as evaluating the overall financial statement presentation. We believe that our audits provide a reasonable basis for our opinion.
In our opinion, the consolidatedConsolidated financial statements referred to above present fairly, in all material respects, the consolidated financial position of Statoil ASA and subsidiaries as of 31December 20142016 and 2013,2015, and the results of their operations and their cash flows for each of the years in the three-year period ended 31 December 2014,2016, in conformity with International Financial Reporting Standards as issued by the International Accounting Standards Board and International Financial Reporting Standards as adopted by the European Union.
As discussed in Note 8.1.226 to the consolidatedConsolidated financial statements, in 2014 Statoil ASA changedhas elected to change its policy forpresentation currency from Norwegian Kroner to US Dollar. In addition to the presentationinformation included in Note 26, Statoil ASA has also included a US Dollar Consolidated balance sheet as of natural gas sales, and related expenditure, on behalf of the Norwegian state made by Statoil subsidiaries in their own name, as well as its policy for the recognition of income tax positions for which payment has been made despite Statoil disputing the tax claim involved.31 December 2014.
We also have audited, in accordance with the standards of the Public Company Accounting Oversight Board (United States), Statoil ASA’s internal control over financial reporting as of 31December 2014,2016, based on criteria established in Internal Control -– Integrated Framework (2013) issued by the Committee of Sponsoring Organizations of the Treadway Commission (COSO), and our report dated 109 March 20152017 expressed an unqualified opinion on the effectiveness of the Statoil ASA'sASA’s internal control over financial reporting.
Statoil, Annual Report on Form 20-F 2016199
/s/ KPMG AS
Stavanger,Oslo, Norway
109 March 20152017
204200 Statoil, Annual Report on Form 20-F 20142016
8.2.2 Report of KPMG on Statoil'sStatoil’s internal control over financial reporting
Report of Independent Registered Public Accounting Firm
To the board of directors and shareholders of Statoil ASA
We have audited Statoil ASA’s internal control over financial reporting as of 31 December2014,December 2016, based on criteria established in Internal Control -Integrated– Integrated Framework (2013) issued by the Committee of Sponsoring Organizations of the Treadway Commission (COSO). Statoil ASA’s management is responsible for maintaining effective internal control over financial reporting and for its assessment of the effectiveness of internal control over financial reporting, included in the accompanying Management's ReportThe management's report on Internal Controlinternal control over Financial Reportingfinancial reporting. Our responsibility is to express an opinion on the Company'sStatoilASA’s internal control over financial reporting based on our audit.
We conducted our audit in accordance with the standards of the Public Company Accounting Oversight Board (UnitedStates)(United States). Those standards require that we plan and perform the audit to obtain reasonable assurance about whether effective internal control over financial reporting was maintained in all material respects. Our audit included obtaining an understanding of internal control over financial reporting, assessing the risk that a material weakness exists, and testing and evaluating the design and operating effectiveness of internal control based on the assessed risk. Our audit also included performing such other procedures as we considered necessary in the circumstances. We believe that our audit provides a reasonable basis for our opinion.
A company'scompany’s internal control over financial reporting is a process designed to provide reasonable assurance regarding the reliability of financial reporting and the preparation of financial statements for external purposes in accordance with generally accepted accounting principles. A company'scompany’s internal control over financial reporting includes those policies and procedures that (1) pertain to the maintenance of records that, in reasonable detail, accurately and fairly reflect the transactions and dispositions of the assets of the company; (2) provide reasonable assurance that transactions are recorded as necessary to permit preparation of financial statements in accordance with generally accepted accounting principles, and that receipts and expenditures of the company are being made only in accordance with authorizations of management and directors of the company; and (3) provide reasonable assurance regarding prevention or timely detection of unauthorized acquisition, use, or disposition of the company'scompany’s assets that could have a material effect on the financial statements.
Because of its inherent limitations, internal control over financial reporting may not prevent or detect misstatements. Also, projections of any evaluation of effectiveness to future periods are subject to the risk that controls may become inadequate because of changes in conditions, or that the degree of compliance with the policies or procedures may deteriorate.
In our opinion, Statoil ASA maintained, in all material respects, effective internal control over financial reporting as of 31 December2014,December 2016, based on criteria established in Internal Control -– Integrated Framework (2013) issued by the Committee of Sponsoring Organizations of the Treadway Commission (COSO).
We also have audited, in accordance with the standards of the Public Company Accounting Oversight Board (United States), the consolidatedConsolidated balance sheets of Statoil ASA and subsidiaries as of 31December 20142016 and 20132015, and the related consolidatedConsolidated statements of income, comprehensive income, changes in equity, and cash flows for each of the years in the three-year period ended 31 December2014,December 2016, and our report dated 10 9March 20152017 expressed
an unqualified opinion on those consolidatedConsolidated financial statements.
Statoil, Annual Report on Form 20-F 2016201
/s/ KPMG AS
Stavanger,Oslo, Norway
109 March 20152017
202Statoil, Annual Report on Form 20-F 2016
5.1 SHAREHOLDER INFORMATION
Statoil is the largest company listed on the Oslo Børs where it trades under the ticker code STL. Statoil is also listed on the New York Stock Exchange under the ticker code STO, trading in the form of American Depositary Shares (ADS).
Statoil's shares have been listed on the Oslo Børs since our initial public offering on 18 June 2001. The ADSs traded on the New York Stock Exchange are evidenced by American Depositary Receipts (ADR), and each ADS represents one ordinary share.
Statoil Share | 2016 | 2015 | 2014 | 2013 | 2012 |
| | | | | | |
Shareprice STL (low) (NOK) | 97.90 | 116.30 | 120.00 | 123.00 | 133.80 |
Shareprice STL (average) (NOK) | 133.50 | 137.59 | 166.41 | 136.72 | 146.97 |
Shareprice STL (high) (NOK) | 159.80 | 160.80 | 194.80 | 147.70 | 162.40 |
Shareprice STL (year-end) (NOK) | 158.40 | 123.70 | 131.20 | 147.00 | 139.00 |
Shareprice STO (low) (USD) | 11.38 | 13.42 | 15.82 | 20.14 | 22.15 |
Shareprice STO (average) (USD) | 15.92 | 17.11 | 26.52 | 23.32 | 25.29 |
Shareprice STO (high) (USD) | 18.51 | 21.31 | 31.91 | 27.00 | 28.92 |
Shareprice STO (year-end) (USD) | 18.24 | 13.96 | 17.61 | 24.13 | 25.04 |
| | | | | | |
STL Market value year-end (NOK billion) | 514 | 394 | 418 | 469 | 443 |
STL Daily turnover (million shares) | 4.7 | 5.1 | 3.7 | 3.0 | 4.3 |
| | | | | | |
Ordinary shares outstanding, year-end | 3,245,049,411 | 3,188,647,103 | 3,188,647,103 | 3,188,647,103 | 3,188,647,103 |
| | | | | | |

As of 31 December 2016, Statoil represented 23.24% of the total value of all companies registered on the Oslo Børs, with a market value of NOK 514 billion. Total shareholder return (dividend reinvested) for 2016 is 35.4%.
The graph shows the development of the Statoil share price compared to the oil price and the Oslo Børs Benchmark Index (OSEBX). The turnover of shares is a measure of traded volumes. On average, 4.62 million Statoil shares were traded on the Oslo Børs every day in 2016 compared to 5.1 million shares in 2015. In 2016, Statoil shares accounted for 15% of the total market value traded throughout the year which is equal to 2015.
Statoil, Annual Report on Form 20-F 20142016 205203
Statoil ASA has one class of shares, and each share confers one vote at the general meeting. Statoil ASA had 3,245,049,411ordinary shares outstanding at year end. As of 31 December 2016, Statoil had 91,128 shareholders registered in the Norwegian Central Securities Depository (VPS), down from 91,774 shareholders at 31 December 2015.
Share prices
These are the reported high and low quotations at market closing for the ordinary shares on the Oslo Børs and New York Stock Exchange for the periods indicated. They are derived from the Oslo Børs Daily Official List, and the highest and lowest sales prices of the ADSs as reported on the New York Stock Exchange composite tape.
204Statoil, Annual Report on Form 20-F 2016
| NOK per ordinary share | | USD per ADS |
Share price | High | Low | | High | Low |
| | | | | |
Year ended 31 December | | | | | |
2012 | 162.40 | 133.80 | | 28.92 | 22.15 |
2013 | 147.70 | 123.00 | | 27.00 | 20.14 |
2014 | 194.80 | 120.00 | | 31.91 | 15.82 |
2015 | 160.80 | 116.30 | | 21.31 | 13.42 |
2016 | 159.80 | 97.90 | | 18.51 | 11.38 |
| | | | | |
Quarter ended | | | | | |
Monday, March 31, 2015 | 149.80 | 125.80 | | 19.62 | 16.25 |
Monday, June 30, 2015 | 160.80 | 140.10 | | 21.31 | 17.59 |
Wednesday, September 30, 2015 | 141.40 | 116.30 | | 17.56 | 13.85 |
Thursday, December 31, 2015 | 145.60 | 118.70 | | 17.74 | 13.42 |
Thursday, March 31, 2016 | 135.50 | 97.90 | | 16.01 | 11.38 |
Thursday, June 30, 2016 | 144.80 | 122.40 | | 17.68 | 14.66 |
Friday, September 30, 2016 | 149.80 | 124.00 | | 17.74 | 15.07 |
Friday, December 30, 2016 | 159.80 | 129.30 | | 18.51 | 15.86 |
Up until March 8, 2017 | 162.90 | 97.90 | | 19.21 | 11.38 |
| | | | | |
Month of | | | | | |
September 2016 | 135.00 | 124.00 | | 16.80 | 15.07 |
October 2016 | 140.70 | 133.90 | | 17.30 | 16.24 |
November 2016 | 146.40 | 129.30 | | 17.40 | 15.86 |
December 2016 | 159.80 | 147.30 | | 18.51 | 18.51 |
January 2017 | 162.90 | 153.40 | | 19.21 | 18.47 |
February 2017 | 156.50 | 147.10 | | 18.81 | 17.41 |
Up until March 8, 2017 | 162.90 | 122.40 | | 19.21 | 14.66 |
| | | | | |
Dividend policy and dividends
It is Statoil's ambition to grow the annual cash dividend measured in USD per share in line with long-term underlying earnings.
Statoil’s board approves first, second and third quarter interim dividends, based on an authorisation from the annual general meeting (AGM), while the AGM approves the fourth quarter dividend and implicitly the total annual dividend based on a proposal from the board. It is Statoil’s intention to pay quarterly dividends, although when deciding the interim dividends and recommending the total annual dividend level, the board will take into consideration expected cash flow, capital expenditure plans, financing requirements and appropriate financial flexibility.
In addition to cash dividend, Statoil might buy back shares as part of total distribution of capital to the shareholders. The shareholders at the AGM may vote to reduce, but may not increase, the fourth quarter dividend proposed by the board of directors. Statoil announces dividend payments in connection with quarterly results. Payment of quarterly dividends is expected to take place within six months after the announcement of each quarterly dividend.
The board of directors proposes to the AGM a dividend of USD 0.2201 per share for the fourth quarter 2016 and to continue with the two-year scrip dividend programme which started from fourth quarter 2015. The scrip programme will give shareholders the option to receive quarterly dividends in cash or in newly issued shares in Statoil at a 5% discount for the fourth quarter 2016. On 11 May 2016, Statoil and the Norwegian state entered into a two-year agreement whereby the Norwegian state shall use the part of its quarterly dividend to subscribe for the number of shares that is required to maintain its ownership of 67%. Any part of the Dividend not used as settlement for dividend shares by the Norwegian state shall be paid in cash. For further information about dividends and our scrip dividend programme see Statoil.com.
The following table shows the cash dividend amounts to all shareholders since 2011 on a per share basis and in aggregate.
Statoil, Annual Report on Form 20-F 2016205
| | Ordinary dividend per share | | | Ordinary dividend per share |
Fiscal year | Curr. | Q1 | | Curr. | Q2 | | Curr. | Q3 | | Curr. | Q4 | | Curr. |
| | | | | | | | | | | | | | |
2012 | | | | | | | | | | | | | NOK | 6.7500 |
2013 | | | | | | | | | | | | | NOK | 7.0000 |
2014 | NOK | 1.8000 | | NOK | 1.8000 | | NOK | 1.8000 | | NOK | 1.8000 | | NOK | 7.2000 |
2015 | NOK | 1.8000 | | NOK | 0.0000 | | NOK | 0.0000 | | NOK | 0.0000 | | NOK | 1.8000 |
2015 | USD | 0.0000 | | USD | 0.2201 | | USD | 0.2201 | | USD | 0.2201 | | USD | 0.6603 |
2016 | USD | 0.2201 | | USD | 0.2201 | | USD | 0.2201 | | USD | 0.2201 | | USD | 0.8804 |
| | | | | | | | | | | | | | |
The proposed fourth quarter 2016 dividend will be considered at the annual general meeting 11 May 2017. The Statoil share will be traded ex dividend 12 May 2017 and the dividend will be disbursed around late June 2017. For US ADR holders, the ex-dividend date will be 11 May 2017 and expected payment and allocation of new dividend shares for ADR holders will be in June 2017.
Dividends in NOK per share will be calculated and communicated four business days after record date for shareholders at Oslo Børs. The NOK dividend will be based on average USD/NOK fixing rates from Norges Bank in the period plus/minus three business days from record date, in total seven business dates.
Share repurchase
For the period 2013-2016, the board of directors was authorised by the annual general meeting of Statoil to repurchase Statoil shares in the market for subsequent annulment. Statoil has not undertaken any share repurchase based on this authorisation.
It is Statoil’s intention to renew this authorisation at the annual general meeting in May 2017.
206Statoil, Annual Report on Form 20-F 2016
Shares purchased by issuer
Shares are acquired in the market for transfer to employees under the share savings scheme in accordance with the limits set by the board of directors. No shares were repurchased in the market for the purpose of subsequent annulment in 2016.
Statoil's share savings plan
Since 2004, Statoil has had a share savings plan for employees of the company. The purpose of this plan is to strengthen the business culture and encourage loyalty through employees becoming part-owners of the company.
Through regular salary deductions, employees can invest up to 5% of their base salary in Statoil shares. In addition, the company contributes 20% of the total share investment made by employees in Norway, up to a maximum of NOK 1,500 per year (approximately USD 170). This company contribution is a tax-free employee benefit under current Norwegian tax legislation. After a lock-in period of two calendar years, one extra share will be awarded for each share purchased. Under current Norwegian tax legislation, the share award is a taxable employee benefit, with a value equal to the value of the shares and taxed at the time of the award.
The board of directors is authorized to acquire Statoil shares in the market on behalf of the company. The authorization is valid until the next annual general meeting, but not beyond 30 June 2017. This authorisation replaces the previous authorisation to acquire Statoil's own shares for implementation of the share savings plan granted by the annual general meeting 19 May 2015. It is Statoil’s intention to renew this authorisation at the annual general meeting. Statoil intends to use share buybacks more actively going forward, based on balance sheet strength considerations.
Period in which shares were repurchased | Number of shares repurchased | Average price per share in NOK | Total number of shares purchased as part of programme | Maximum number of shares that may yet be purchased under the programme authorisation |
| | | | | |
Jan-16 | 878,834 | 102.6997 | 5,821,999 | 8,178,001 |
Feb-16 | 745,858 | 117.5826 | 6,567,857 | 7,432,143 |
Mar-16 | 700,095 | 127.9825 | 7,267,952 | 6,732,048 |
Apr-16 | 682,975 | 130.5009 | 7,950,927 | 6,049,073 |
May-16 | 657,216 | 135.2827 | 8,608,143 | 5,391,857 |
Jun-16 | 665,179 | 133.1370 | 665,179 | 13,334,821 |
Jul-16 | 589,151 | 149.4623 | 1,254,330 | 12,745,670 |
Aug-16 | 653,493 | 134.1070 | 1,907,823 | 12,092,177 |
Sep-16 | 703,884 | 124.1965 | 2,611,707 | 11,388,293 |
Oct-16 | 627,062 | 138.7885 | 3,238,769 | 10,761,231 |
Nov-16 | 631,197 | 137.8332 | 3,869,966 | 10,130,034 |
Dec-16 | 567,259 | 153.3690 | 4,437,225 | 9,562,775 |
Jan-17 | 520,716 | 162,6375 | 4,957,941 | 9,042,059 |
Feb-17 | 577,674 | 147.8341 | 5,535,615 | 8,464,385 |
| | | | | |
TOTAL | 9,200,593 1) | 144.3980 2) | | |
| | | | | |
1) | All shares repurchased have been purchased in the open market and pursuant to the authorisation mentioned above. |
2) | Weighted average price per share. |
Statoil, Annual Report on Form 20-F 2016207
Statoil ADR programme fees
Fees and charges payable by a holder of ADSs.
As depositary from 31 January 2013, Deutsche Bank Trust Company Americas collects its fees for the delivery and surrender of ADSs directly from investors depositing shares or surrendering ADSs for the purpose of withdrawal, or from intermediaries acting for them. The depositary collects fees from investors by deducting the fees from the amounts distributed or by selling a portion of distributable property to pay the fees. The depositary may refuse to provide fee-attracting services until its fees for those services are paid.
The charges of the depositary payable by investors are as follows:
Persons depositing or withdrawing shares must pay: | For: |
|
|
USD 5.00 (or less) per 100 ADSs (or portion of 100 ADSs) | • Issuance of ADSs, including issuances resulting from a distribution of shares or rights or other property |
| • Cancellation of ADSs for the purpose of withdrawal, including if the deposit agreement terminates |
| |
USD 0.02(or less) per ADS, subject to the company's consent | • Any cash distribution to ADS registered holders |
| |
USD 0.05 (or less) per ADS, subject to the company's consent | • For the operation and maintenance costs in administering the ADR programme |
| |
A fee equivalent to the fee that would be payable if securities distributed to you had been shares and the shares had been deposited for issuance of ADSs | • Distribution of securities distributed to holders of deposited securities which are distributed by the Depositary to ADS registered holders |
| |
Registration or transfer fees | • Transfer and registration of shares on our share register to or from the name of the Depositary or its agent when you deposit or withdraw shares |
| |
Expenses of the Depositary | • Cable, telex and facsimile transmissions (as provided in the deposit agreement) |
| • Converting foreign currency to USD |
| |
Taxes and other governmental charges the Depositary or the custodian have to pay on any ADS or share underlying an ADS, for example, stock transfer taxes, stamp duty or withholding taxes | • As necessary |
| |
Any charges incurred by the Depositary or its agents for servicing the deposited securities | • As necessary |
| |
Reimbursements and payments made and fee waivers granted by the depositary
The depositary has agreed to reimburse certain company expenses related to the company's ADR programme and incurred by the company in connection with the programme. In the year ended 31 December 2016, the depositary reimbursed approximately USD 1.29 million to the company in relation to certain expenses including investor relations expenses, expenses related to the maintenance of the ADR programme, legal counsel fees, printing and ADR certificates.
The depositary has also agreed to waive fees for costs associated with the administration of the ADR programme, and it has paid certain expenses directly to third parties on behalf of the company. The expenses paid to third parties include expenses relating to reporting services, access charges to its online platform, re-registration costs borne by the custodian and costs in relation to printing and mailing AGM materials. For the year ended 31 December 2016, the depositary paid expenses of approximately USD 214,814 directly to third parties.
208Statoil, Annual Report on Form 20-F 2016
TAXATION
This section describes the material Norwegian tax consequences that apply to shareholders resident in Norway and to non-resident shareholders in connection with the acquisition, ownership and disposal of shares and American Depositary Shares (ADS). The term “shareholder” refers to both holders of shares and holders of ADSs, unless otherwise explicitly stated.
Norwegian tax matters
The outline does not provide a complete description of all tax regulations that might be relevant (i.e. for investors to whom special regulations may be applicable), and is based on current law and practice. Shareholders should consult their professional tax adviser for advice about individual tax consequences.
Taxation of dividends
Corporate shareholders (i.e. limited liability companies and similar entities) residing in Norway for tax purposes are generally subject to tax in Norway on dividends received from Norwegian companies. The basis for taxation is 3% of the dividends received, which is subject to the standard income tax rate. The standard income tax rate has been reduced from 25% in 2016 to 24% in 2017.
Individual shareholders resident in Norway for tax purposes are subject to the standard income tax rate (reduced from 25% in 2016 to 24% in 2017) in Norway for dividend income exceeding a basic tax free allowance. However, in 2017 dividend income exceeding the basic tax free allowance is grossed up with a factor of 1.24 before included in the ordinary taxable income, resulting in an effective tax rate of 29.76% (24% x 1.24). The tax free allowance is computed for each individual share or ADS and corresponds as a rule to the cost price of that share or ADS multiplied by an annual risk-free interest rate. Any part of the calculated allowance for one year that exceeds the dividend distributed for the share or ADS ("unused allowance") may be carried forward and set off against future dividends received for (or gains upon the realisation of, see below) the same share or ADS. Any unused allowance will also be added to the basis for computation of the allowance for the same share or ADS the following year.
Non-resident shareholders are as a rule subject to withholding tax at a rate of 25% on dividends distributed by Norwegian companies. It is the responsibility of the distributing company to deduct the withholding tax when dividends are paid to non-resident shareholders. This withholding tax does not apply to corporate shareholders in the EEA area that document that they are genuinely established and carry on genuine economic business activity within the EEA area, provided that Norway is entitled to receive information from the state of residence pursuant to a tax treaty or other international treaty. If no such treaty exists with the state of residence, the shareholder may instead present confirmation issued by the tax authorities of the state of residence verifying the documentation. Individual shareholders resident for tax purposes in the EEA area may apply to the Norwegian tax authorities for a refund if the tax withheld by the distributing company exceeds the tax that would have been levied on individual shareholders resident in Norway.
The withholding rate of 25% is often reduced in tax treaties between Norway and other countries. The reduced withholding rate will generally only apply to dividends paid on shares held by shareholders who are able to properly demonstrate that they are the beneficial owner and entitled to the benefits of the tax treaty.
For holders of shares and ADSs deposited with Deutsche Bank Trust Company Americas (Deutsche Bank), documentation establishing that the holder is eligible for the benefits under the tax treaty with Norway, may be provided to Deutsche Bank. Deutsche Bank has been granted permission by the Norwegian tax authorities to receive dividends from us for redistribution to a beneficial owner of shares and ADSs at the applicable treaty withholding rate.
Dividends paid to shareholders (either directly or through a depositary) who have not provided the relevant documentation to the relevant party that they are eligible for the reduced rate, will be subject to withholding tax of 25%. The beneficial owners will in this case have to apply to the Central Office - Foreign Tax Affairs for a refund of the excess amount of tax withheld.
Corporate shareholders that carry on business activities in Norway, and whose shares or ADSs are effectively connected with such activities are not subject to withholding tax. For such shareholders, 3% of the received dividends are subject to the standard income tax rate (reduced from 25% in 2016 to 24% in 2017).
Taxation on the realisation of shares and ADSs
Corporate shareholders resident in Norway for tax purposes are not subject to tax in Norway on gains derived from the sale, redemption or other disposal of shares or ADSs in Norwegian companies. Capital losses are not deductible.
Individual shareholders residing in Norway for tax purposes are subject to tax in Norway on the sale, redemption or other disposal of shares or ADSs. Gains or losses in connection with such realisation are included in the individual's ordinary taxable income in the year of disposal, which is subject to the standard income tax rate, being reduced from 25% in 2016 to 24% in 2017. However, in 2017 the taxable gain or deductible loss is grossed up with a factor of 1.24 before included in the ordinary taxable income, resulting in an effective tax rate of 29.76% (24% x 1.24).
The taxable gain or deductible loss (before gross up) is calculated as the sales price adjusted for transaction expenses minus the taxable basis. A shareholder's tax basis is normally equal to the acquisition cost of the shares or ADSs. Any unused allowance pertaining to a share may be
Statoil, Annual Report on Form 20-F 2016209
deducted from a taxable gain on the same share or ADS, but may not lead to or increase a deductible loss. Furthermore, any unused allowance may not be set off against gains from the realisation of the other shares or ADSs.
If the shareholder disposes of shares or ADSs acquired at different times, the shares or ADSs that were first acquired will be deemed to be first sold (the "FIFO" principle) when calculating gain or loss for tax purposes.
From 2017, individual shareholders may hold listed shares in companies resident within EEA through a stock savings account. If the conditions for the stock savings account are met, taxable gain or loss on shares owned through the stock savings account will be payable when deposits are withdrawn from the account whereas loss on shares will be deductible when the account is terminated. Dividends are not comprised by the stock savings account scheme and will thus be taxed pursuant to the ordinary rules described above.
A corporate shareholder or an individual shareholder who ceases to be tax resident in Norway due to domestic law or tax treaty provisions may, in certain circumstances, become subject to Norwegian exit taxation on capital gains related to shares or ADSs.
Shareholders not residing in Norway are generally not subject to tax in Norway on capital gains, and losses are not deductible on the sale, redemption or other disposal of shares or ADSs in Norwegian companies, unless the shareholder carries on business activities in Norway and such shares or ADSs are or have been effectively connected with such activities.
Wealth tax
The shares or ADSs are included in the basis for the computation of wealth tax imposed on individuals resident in Norway for tax purposes. Norwegian limited companies and certain similar entities are not subject to wealth tax. The current marginal wealth tax rate is 0.85% of the value assessed. The assessment value of listed shares (including ADSs) is 90% of the listed value of such shares or ADSs on 1 January in the assessment year.
Non-resident shareholders are not subject to wealth tax in Norway for shares and ADSs in Norwegian limited companies unless the shareholder is an individual and the shareholding is effectively connected with the individual's business activities in Norway.
Inheritance tax and gift tax
No inheritance or gift tax is imposed in Norway.
Transfer tax
No transfer tax is imposed in Norway in connection with the sale or purchase of shares or ADSs.
United States tax matters
This section describes the material United States federal income tax consequences for US holders (as defined below) of owning shares or ADSs. It only applies to you if you hold your shares or ADSs as capital assets for tax purposes and are not a member of a special class of holders subject to special rules, including dealers in securities, insurance companies, partnerships, persons liable for the alternative minimum tax, persons that actually or constructively own 10% of the voting stock of Statoil, persons that hold shares or ADSs as part of a straddle or a hedging or conversion transaction, or persons whose functional currency is not USD.
This section is based on the Internal Revenue Code of 1986, as amended, its legislative history, existing and proposed regulations, published rulings and court decisions, and the Convention between the United States of America and the Kingdom of Norway for the Avoidance of Double Taxation and the Prevention of Fiscal Evasion with Respect to Taxes on Income and Property (the ''Treaty''). These laws are subject to change, possibly on a retroactive basis. In addition, this section is based in part upon the representations of the depositary and the assumption that each obligation in the deposit agreement and any related agreement will be performed in accordance with its terms. For United States federal income tax purposes, if you hold ADRs evidencing ADSs, you will generally be treated as the owner of the ordinary shares represented by those ADRs. Exchanges of shares for ADRs and ADRs for shares will not generally be subject to United States federal income tax.
A ''US holder'' is a beneficial owner of shares or ADSs that is: (i) a citizen or resident of the United States; (ii) a United States domestic corporation; (iii) an estate whose income is subject to United States federal income tax regardless of its source; or (iv) a trust if a United States court can exercise primary supervision over the trust's administration and one or more United States persons are authorised to control all substantial decisions of the trust.
You should consult your own tax adviser regarding the United States federal, state and local and Norwegian and other tax consequences of owning and disposing of shares and ADSs in your particular circumstances.
Taxation of dividends
The gross amount of any dividend (including any Norwegian tax withheld from the dividend payment) paid by Statoil out of its current or accumulated earnings and profits (as determined for United States federal income tax purposes) is taxable for you when you, in the case of shares, or the depositary, in the case of ADSs, receive the dividend, actually or constructively. If you are a non-corporate US holder, dividends paid to you will be eligible to be taxed at the preferential rates applicable to long-term capital gains as long as, in the year that you receive the dividend, the shares or ADSs are readily tradable on an established securities market in the United States or Statoil is eligible for benefits under the Treaty. To qualify for the preferential rates, you must hold the shares or ADSs for more than 60 days during the 121-day period beginning 60 days before
210Statoil, Annual Report on Form 20-F 2016
the ex-dividend date and meet certain other requirements. The dividend will not be eligible for the dividends-received deduction generally allowed to United States corporations in respect of dividends received from other United States corporations.
The amount of the dividend distribution that you must include in your income as a US holder will be the value in USD of the payments made in NOK determined at the spot NOK/USD rate on the date the dividend distribution is includible in your income, regardless of whether or not the payment is in fact converted into USD. Distributions in excess of current and accumulated earnings and profits, as determined for United States federal income tax purposes, will be treated as a non-taxable return of capital to the extent of your tax basis in the shares or ADSs and, to the extent in excess of your tax basis, will be treated as capital gain.
Subject to certain limitations, the 15% Norwegian tax withheld in accordance with the Treaty and paid to Norway will be creditable or deductible against your United States federal income tax liability, unless a refund of the tax withheld is available to you under Norwegian law. Special rules apply when determining the foreign tax credit limitation with respect to dividends that are subject to the preferential rates. Dividends will be income from sources outside the United States and will generally, depending on your circumstances, be either ''passive'' or ''general'' income for purposes of computing the foreign tax credit allowable to you. Any gain or loss resulting from currency exchange rate fluctuations during the period from the date you include the dividend payment in income until the date you convert the payment into USD will generally be treated as US-source ordinary income or loss and will not be eligible for the special tax rate.
Taxation of capital gains
If you sell or otherwise dispose of your shares or ADSs, you will generally recognise a capital gain or loss for United States federal income tax purposes equal to the difference between the value in USD of the amount that you realise and your tax basis, determined in USD, in your shares or ADSs. A capital gain of a non-corporate US holder is generally taxed at preferential rates if the property is held for more than one year. The gain or loss will generally be income or loss from sources within the United States for foreign tax credit limitation purposes. If you receive any foreign currency on the sale of shares or ADSs, you may recognise ordinary income or loss from sources within the United States as a result of currency fluctuations between the date of the sale of the shares or ADSs and the date the sales proceeds are converted into USD. You should consult your own tax adviser regarding how to account for payments made or received in a currency other than USD.
PFIC rules
We believe that the shares and ADSs should not be treated as stock of a PFIC for United States federal income tax purposes, but this conclusion is a factual determination that is made annually and thus may be subject to change. If we were to be treated as a PFIC, a gain realised on the sale or other disposition of the shares or ADSs would in general not be treated as a capital gain. Instead, unless you elect to be taxed annually on a mark-to-market basis with respect to the shares or ADSs, you would be treated as if you had realised such gain and certain "excess distributions" ratably over your holding period for the shares or ADSs. Amounts allocated to the year in which the gain is realised or the “excess distribution” is received or to a taxable year before we were classified as a PFIC would be subject to tax at ordinary income tax rates, and amounts allocated to all other years would be taxed at the highest tax rate in effect for each such year to which the gain or distribution was allocated, together with an interest charge in respect of the tax attributable to each such year. With certain exceptions, your shares or ADSs will be treated as stock in a PFIC if we were a PFIC at any time during the period you held the shares or ADSs. Dividends that you receive from us will not be eligible for the preferential tax rates if we are treated as a PFIC with respect to you, either in the taxable year of the distribution or the preceding taxable year, but will instead be taxable at rates applicable to ordinary income.
Foreign Account Tax Compliance Withholding
A 30% withholding tax will be imposed on certain payments to certain non-US financial institutions that fail to comply with information reporting requirements or certification requirements in respect of their direct and indirect United States shareholders and/or United States accountholders. To avoid becoming subject to the 30% withholding tax on payments to them, we and other non-US financial institutions may be required to report information to the IRS regarding the holders of shares or ADSs and to withhold on a portion of payments under the shares or ADSs to certain holders that fail to comply with the relevant information reporting requirements (or hold shares or ADSs directly or indirectly through certain non-compliant intermediaries). However, such withholding will not apply to payments made before January 1, 2019. The rules for the implementation of this legislation have not yet been fully finalised, so it is impossible to determine at this time what impact, if any, this legislation will have on holders of the shares and ADSs.
Statoil, Annual Report on Form 20-F 2016211
EXCHANGE RATES
The table below shows the high, low, average and end-of-period exchange rates for the Norwegian krone for USD 1.00 as announced by Norges Bank (Norway's central bank).
The average is computed using the quarterly average exchange rates announced by Norges Bank during the period indicated.
For the year ended 31 December | Low | High | Average | End of Period |
| | | | |
2012 | 5.5349 | 6.1471 | 5.8172 | 5.5664 |
2013 | 5.4438 | 6.2154 | 5.8753 | 6.0837 |
2014 | 5.8611 | 7.6111 | 6.3011 | 7.4332 |
2015 | 7.3593 | 8.8090 | 8.0637 | 8.8090 |
2016 | 7.9766 | 8.9578 | 8.4014 | 8.6200 |
| Low | High |
| | |
2016 | | |
September | 8.0517 | 8.3483 |
October | 7.9766 | 8.2810 |
November | 8.1780 | 8.6138 |
December | 8.3662 | 8.7277 |
| | |
2017 | | |
January | 8.2641 | 8.6676 |
February | 8.1953 | 8.3868 |
March (up to and including 8 March 2017) | 8.4134 | 8.4798 |
On 8March 2017, the exchange rate announced by the Norges Bank for the Norwegian krone was USD 1.00 = NOK 8.4798
Fluctuations in the exchange rate between the NOK and USD will affect the amounts in USD received by holders of American Depositary Shares (ADSs) on the conversion of dividends, if any, paid in Norwegian kroner on the ordinary shares, and they may affect the USD price of the ADSs on the New York Stock Exchange.
212Statoil, Annual Report on Form 20-F 2016
MAJOR SHAREHOLDERS
The Norwegian State is the largest shareholder in Statoil, with a direct ownership interest of 67%. Its ownership interest is managed by the Norwegian Ministry of Petroleum and Energy.


Pursuant to the exchange ratio agreed in connection with the merger with Hydro's oil and gas activities, the State's ownership interest in the merged company was 62.5%, or 1,992,959,739 shares, on 1 October 2007. In accordance with the Norwegian parliament's decision of 2001 concerning a minimum state shareholding in Statoil of two-thirds, the Government built up the State's ownership interest in Statoil by buying shares in the market during the period from June 2008 to March 2009. In March 2009, the Government announced that the State's direct ownership interest had reached 67% and the Government's direct purchase of Statoil shares was completed.
As of 31 December 2016, the Norwegian State had a 67% direct ownership interest in Statoil and a 3.22% indirect interest through the National Insurance Fund (Folketrygdfondet), totaling 70.22%. Also, the Norwegian State has entered into an agreement where it commits for each quarterly dividend where a scrip option is offered to receive newly issued shares for a fraction of its shareholdings equal to the average participation among the other shareholders. This to ensure that the States ownership share is not impacted by the scrip programme.
Statoil has one class of shares, and each share confers one vote at the general meeting. The Norwegian State does not have any voting rights that differ from the rights of other ordinary shareholders. Pursuant to the Norwegian Public Limited Liability Companies Act, a majority of at least two-thirds of the votes cast as well as of the votes represented at a general meeting is required to amend our articles of association. As long as the Norwegian State owns more than one-third of our shares, it will be able to prevent any amendments to our articles of association. Since the Norwegian State, acting through the Norwegian Minister of Petroleum and Energy, has in excess of two-thirds of the shares in the company, it has sole power to amend our articles of association. In addition, as majority shareholder, the Norwegian State has the power to control any decision at general meetings of our shareholders that requires a majority vote, including the election of the majority of the corporate assembly, which has the power to elect our board of directors and approve the dividend proposed by the board of directors.
The Norwegian State endorses the principles set out in "The Norwegian Code of Practice for Corporate Governance", and it has stated that it expects companies in which the State has ownership interests to adhere to the code. The principle of ensuring equal treatment of different groups of shareholders is a key element in the State's own guidelines. In companies in which the State is a shareholder together with others, the State wishes to exercise the same rights and obligations as any other shareholder and not act in a manner that has a detrimental effect on the rights or financial interests of other shareholders. In addition to the principle of equal treatment of shareholders, emphasis is also placed on transparency in relation to the State's ownership and on the general meeting being the correct arena for owner decisions and formal
Statoil, Annual Report on Form 20-F 2016213
resolutions.
214Statoil, Annual Report on Form 20-F 2016
Shareholders at December 2016 | Number of Shares | Ownership in % |
| | | |
1 | Government of Norway | 2,174,183,105 | 67.00% |
2 | Folketrygdfondet | 104,403,441 | 3.22% |
3 | BlackRock Institutional Trust Company, N.A. | 29,242,733 | 0.90% |
4 | Lazard Asset Management, L.L.C. | 28,711,525 | 0.88% |
5 | SAFE Investment Company Limited | 24,698,519 | 0.76% |
6 | INVESCO Asset Management Limited | 22,281,500 | 0.69% |
7 | Fidelity Management & Research Company | 21,301,248 | 0.68% |
8 | The Vanguard Group, Inc. | 21,120,974 | 0.65% |
9 | State Street Global Advisors (US) | 18,293,972 | 0.61% |
10 | Schroder Investment Management Ltd. (SIM) | 19,493,851 | 0.60% |
11 | Storebrand Kapitalforvaltning AS | 17,611,950 | 0.54% |
12 | KLP Forsikring | 16,761,633 | 0.52% |
13 | DNB Asset Management AS | 16,032,525 | 0.49% |
14 | UBS Asset Management (UK) Ltd. | 12,890,335 | 0.40% |
15 | Fidelity Worldwide Investment (UK) Ltd. | 11,731,543 | 0.36% |
16 | TIAA Global Asset Management | 11,413,046 | 0.35% |
17 | Allianz Global Investors GmbH | 11,397,417 | 0.35% |
18 | Epoch Investment Partners, Inc. | 11,194,404 | 0.35% |
19 | Legal & General Investment Management Ltd. | 10,152,188 | 0.31% |
20 | AXA Investment Managers UK Ltd. | 9,304,532 | 0.29% |
| | | |
Source: Data collected by third party, authorized by Statoil, December 2016. | | |
| | | |
| | | |
EXCHANGE CONTROLS AND LIMITATIONS
Under Norwegian foreign exchange controls currently in effect, transfers of capital to and from Norway are not subject to prior government approval. An exception applies to the physical transfer of payments in currency exceeding certain thresholds, which must be declared to the Norwegian custom authorities. This means that non-Norwegian resident shareholders may receive dividend payments without Norwegian exchange control consent as long as the payment is made through a licensed bank or other licensed payment institution.
There are no restrictions affecting the rights of non-Norwegian residents or foreign owners to hold or vote for our shares.
Statoil, Annual Report on Form 20-F 2016215
5.2 ACCOUNTING STANDARDS (IFRS) AND non-GAAP MEASURES
Since 2007, Statoil has been preparing the Consolidated financial statements in accordance with International Financial Reporting Standards (IFRS) as adopted by the EU and as issued by the International Accounting Standards Board. The IFRS standards have been applied consistently to all periods presented in the Consolidated financial statements. See note 2 Significant accounting policiesto the Consolidated financial statements for a discussion of key accounting estimates and judgements.
Non-GAAP MEASURES
Statoil is subject to SEC regulations regarding the use of "non-GAAP financial measures" in public disclosures. Non-GAAP financial measures are defined as numerical measures that either exclude or include amounts that are not excluded or included in the comparable measures calculated and presented in accordance with generally accepted accounting principles, which in Statoil’s case refers to IFRS. The following financial measures may be considered non-GAAP financial measures:
·Return on average capital employed (ROACE)
·Net debt to capital employed ratio before adjustments
·Net debt to capital employed ratio adjusted
·Adjusted earnings after tax
·Organic capital expenditures
For information regarding Organic capital expenditures, see Investments in section 2.9 Liquidity and capital resources.
Return on average capital employed (ROACE)
This measure provides useful information for both the group and investors about performance during the period under evaluation. Statoil uses ROACE to measure the return on capital employed, regardless of whether the financing is through equity or debt. The use of ROACE should not be viewed as an alternative to income before financial items, income taxes and minority interest, or to net income, which are measures calculated in accordance with GAAP or ratios based on these figures. Impacted by impairments, ROACE was negative 4.7% in 2016 compared to negative 8.9% in 2015 and 3.4% in 2014. The change from 2015 is mainly due to an increase in net income adjusted for financial items.
Calculation of numerator and denominator used in ROACE calculation | For the year ended 31 December | | |
(in USD million, except percentages) | 2016 | 2015 | 2014 | 16-15 change | 15-14 change |
| | | | | | |
Net income for the year | (2,902) | (5,169) | 3,887 | | |
- Net financial items | (258) | (1,311) | 20 | | |
- Tax on financial items | (75) | 1,259 | 1,466 | | |
+ Accretion expense net after tax | 21 | (124) | (175) | | |
| | | | | | |
Net income adjusted for financial Items after tax (A1) | (2,548) | (5,241) | 2,226 | 51% | N/A |
| | | | | | |
Capital employed before adjustments to net interest-bearing debt: 1) | | | | | |
Year End 2016 | 53,471 | | | | |
Year End 2015 | 54,159 | 54,159 | | | |
Year End 2014 | | 63,311 | 63,311 | | |
Year End 2013 | | | 68,092 | | |
| | | | | | |
Sum of capital employed for two years (B1) | 107,630 | 117,470 | 131,403 | | |
| | | | | | |
Calculated average capital employed: | | | | | |
Average capital employed before adjustments to net interest-bearing debt (B1/2) | 53,815 | 58,735 | 65,702 | (8%) | (11%) |
| | | | | | |
Calculated ROACE: | | | | | |
Return on average capital employed (A1/(B1/2)) | (4.7%) | (8.9%) | 3.4% | 47% | N/A |
| | | | | | |
1) | Capital employed before adjustments for each year is reconciled in the table in section 5.2 Net debt to capital employed ratio. |
216Statoil, Annual Report on Form 20-F 2016
Net debt to capital employed ratio
In the Company's view, the calculated net debt to capital employed ratio gives a more complete picture of the Group's current debt situation than gross interest-bearing financial liabilities.
The calculation uses balance sheet items relating to gross interest bearing financial liabilities and adjusts for cash, cash equivalents and current financial investments. Certain adjustments are made, such as collateral deposits classified as cash and cash equivalents in the Consolidated balance sheet but considered non cash in the non-GAAP calculations. The financial investments held in Statoil Forsikring AS are excluded in the non-GAAP calculations as they are deemed restricted. These two adjustment are increasing the net debt and give a stricter definition of the net debt to capital employed ratio than the IFRS based definition. Similarly, certain net interest-bearing debts incurred from activities pursuant to the Owners Instruction from the Norwegian State are set off against receivables on the Norwegian State's direct financial interest (SDFI).
The net interest-bearing debt adjusted for these items is included in the average capital employed. The table below reconciles the net interest-bearing liabilities adjusted, capital employed and net debt to capital employed adjusted ratio with the most directly comparable financial measure or measures calculated in accordance with IFRS.
| | For the year ended 31 December |
Calculation of capital employed and net debt to capital employed ratio | 2016 | 2015 | 2014 |
(in USD million, except percentages) | | | |
| | | | |
Shareholders' equity | 35,072 | 40,271 | 51,225 |
Non-controlling interests (Minority interest) | 27 | 36 | 57 |
| | | | |
Total equity (A) | 35,099 | 40,307 | 51,282 |
| | | | |
Current bonds, bank loans, commercial papers and collateral liabilities | 3,674 | 2,326 | 3,561 |
Bonds, bank loans and finance lease liabilities | 27,999 | 29,965 | 27,593 |
| | | | |
Gross interest-bearing financial liabilities (B) | 31,673 | 32,291 | 31,154 |
| | | | |
Cash and cash equivalents | 5,090 | 8,623 | 11,182 |
Current financial investments | 8,211 | 9,817 | 7,968 |
| | | | |
Cash and cash equivalents and current financial investments (C) | 13,301 | 18,440 | 19,150 |
| | | | |
Net interest-bearing liabilities before adjustments (B1) (B-C) | 18,372 | 13,852 | 12,004 |
| | | | |
Other interest-bearing elements 1) | 1,216 | 1,111 | 1,081 |
Marketing instruction adjustment 2) | (199) | (214) | (212) |
Adjustment for project loan 3) | 0 | 0 | (18) |
| | | | |
Net interest-bearing liabilities adjusted (B2) | 19,389 | 14,748 | 12,855 |
| | | | |
Calculation of capital employed: | | | |
Capital employed before adjustments to net interest-bearing liabilities (A+B1) | 53,471 | 54,159 | 63,286 |
Capital employed adjusted (A+B2) | 54,488 | 55,055 | 64,137 |
| | | | |
Calculated net debt to capital employed: | | | |
Net debt to capital employed before adjustments (B1/(A+B1) | 34.4% | 25.6% | 19.0% |
Net debt to capital employed adjusted (B2/(A+B2) | 35.6% | 26.8% | 20.0% |
| | | | |
1) | Other interest-bearing elements are cash and cash equivalents adjustments regarding collateral deposits classified as cash and cash equivalents in the Consolidated balance sheet but considered as non-cash in the non-GAAP calculations as well as financial investments in Statoil Forsikring AS classified as current financial investments. |
2) | Marketing instruction adjustment is an adjustment to gross interest-bearing financial debt due to the SDFI part of the financial lease in the Snøhvit vessels that are included in Statoil's Consolidated balance sheet. |
3) | Adjustment for project loan is adjustment to gross interest-bearing debt due to the BTC project loan structure. |
Statoil, Annual Report on Form 20-F 2016217
Adjusted earnings after tax
Adjusted earnings are based on net operating income and adjusts for certain items affecting the income for the period in order to separate out effects that management considers may not be well correlated to Statoil's underlying operational performance in the individual reporting period. Management considers adjusted earnings to be a supplemental measure to Statoil's IFRS measures that provides an indication of Statoil's underlying operational performance in the period and facilitates a better understanding of operational trends between the periods, and this metric is used in determining variable remuneration and awards of LTI grants to members of the corporate executive committee. Adjusted earnings adjusts for the following items:
·Certain gas contracts are, due to pricing or delivery conditions, deemed to contain embedded derivatives, required to be carried at fair value. Certain transactions related to historical divestments include contingent consideration, carried at fair value. The accounting impacts of changes in fair value of the aforementioned are excluded from adjusted earnings. In addition, adjustments are also made for changes in the unrealised fair value of derivativesrelated to some natural gas trading contracts. Due to the nature of these gas sales contracts, these are classified as financial derivatives to be measured at fair value at the balance sheet date. Unrealised gains and losses on these contracts reflect the value of the difference between current market gas prices and the actual prices to be realised under the gas sales contracts. Only realised gains and losses on these contracts are reflected in adjusted earnings. This presentation best reflects the underlying performance of the business as it replaces the effect of temporary timing differences associated with the re-measurements of the derivatives to fair value at the balance sheet date with actual realised gains and losses for the period
·Periodisation of inventory hedging effect: Commercial storage is hedged in the paper market. Commercial storage is accounted for by using the lower of cost and market price. If market prices increase above cost price, there will be a loss in the IFRS income statement since the derivatives always reflect changes in the market price. An adjustment is made to reflect the unrealised market value of the commercial storage. As a result, loss on derivatives is matched by a similar adjustment for the exposure being managed. If market prices decrease below cost price, the write-down and the derivative effect in the IFRS income statement will offset each other and no adjustment is made
·Over/underlift is accounted for using the sales method and therefore revenues are reflected in the period the product is sold rather than in the period it is produced. The over/underlift position depends on a number of factors related to our lifting programme and the way it corresponds to our entitlement share of production. The effect on income for the period is therefore adjusted, to show estimated revenues and associated costs based upon the production for the period which management believes reflects operational performance and increase comparability with peers
·Statoil holdsoperational storagewhich is not hedged in the paper market due to inventory strategies. Cost of goods sold is measured based on the FIFO (first-in, first-out) method, and includes realised gains or losses that arise due to changes in market prices. These gains or losses will fluctuate from one period to another and are not considered part of the underlying operations for the period
·Impairment and reversal of impairmentare excluded from adjusted earnings since they affect the economics of an asset for the lifetime of that asset; not only the period in which it is impaired or the impairment is reversed. Impairment and reversal of impairment can impact both the exploration expenses and the depreciation, amortisation and impairment line items
·Gain or loss from sales is eliminated from the measure since the gain or loss does not give an indication of future performance or periodic performance; such a gain or loss is related to the cumulative value creation from the time the asset is acquired until it is sold
·Internal unrealised profit on inventories: Volumes derived from equity oil inventory will vary depending on several factors and inventory strategies, i.e. level of crude oil in inventory, equity oil used in the refining process and level of in-transit cargoes. Internal profit related to volumes sold between entities in the group, and still in inventory at period end, is eliminated according to IFRS (write down to production cost). The proportion of realised versus unrealised gain will fluctuate from one period to another due to inventory strategies and accordingly impact net operating income. This impact is not assessed to be a part of the underlying operational performance, and elimination of internal profit related to equity volumes is excluded in adjusted earnings
·Other items of income and expenseare adjusted when the impacts on income in the period are not reflective of Statoil's underlying operational performance in the reporting period. Such items may be unusual or infrequent transactions but they may also include transactions that are significant which would not necessarily qualify as either unusual or infrequent. Other items can include transactions such as provisions related to reorganisation, early retirement, etc
The measure adjusted earnings after tax excludes net financial items and the associated tax effects on net financial items. It is based on adjusted earnings less the tax effects on all elements included in adjusted earnings (or calculated tax on operating income and on each of the adjusting items using an estimated marginal tax rate). In addition, tax effect related to tax exposure items not related to the individual reporting period is excluded from adjusted earnings after tax. Management considers adjusted earnings after tax, which reflects a normalised tax charge associated with its operational performance excluding the impact of financing, to be a supplemental measure to Statoil's net income. Certain net USD denominated financial positions are held by group companies that have a USD functional currency that is different from the currency in which the taxable income is measured. As currency exchange rates change between periods, the basis for measuring net financial items for IFRS will change disproportionally with taxable income which includes exchange gains and losses from translating the net USD denominated financial positions into the currency of the applicable tax return. Therefore, the effective tax rate may be significantly higher or lower than the statutory tax rate for any given period.
Management considers that adjusted earnings after tax provides a better indication of the taxes associated with underlying operational performance in the period (excluding financing), and therefore better facilitates a comparison between periods. However, the adjusted taxes included in adjusted earnings after tax should not be considered indicative of the amount of current or total tax expense (or taxes payable) for the period.
218Statoil, Annual Report on Form 20-F 2016
Adjusted earnings and adjusted earnings after tax should be considered additional measures rather than substitutes for net operating income and net income, which are the most directly comparable IFRS measures. There are material limitations associated with the use of adjusted earnings and adjusted earnings after tax compared with the IFRS measures since they do not include all the items of revenues/gains or expenses/losses of Statoil which are needed to evaluate its profitability on an overall basis. Adjusted earnings and adjusted earnings after tax are only intended to be indicative of the underlying developments in trends of our on-going operations for the production, manufacturing and marketing of our products and exclude pre and post-tax impacts of net financial items. We reflect such underlying development in our operations by eliminating the effects of certain items that may not be directly associated with the period's operations or financing. However, for that reason, adjusted earnings and adjusted earnings after tax are not complete measures of profitability. The measures should therefore not be used in isolation.
Adjusted earnings equal the sum of net operating income less all applicable adjustments. Adjusted earnings after tax equals the sum of net operating income less income tax in business areas and adjustments to operating income taking the applicable marginal tax into consideration. See the table below for details.
Calculation of adjusted earnings after tax | For the year ended 31 December |
(in USD million) | 2016 | 2015 |
| | |
Net operating income | 80 | 1,366 |
| | |
Total revenues and other income | 1,020 | (924) |
Changes in fair value of derivatives | 738 | 356 |
Periodisation of inventory hedging effect | 360 | (39) |
Impairment from associated companies | 25 | 153 |
Over-/underlift | 232 | (96) |
Other adjustments | - | (53) |
Gain/loss on sale of assets | (333) | (1,750) |
Provisions | - | 639 |
Eliminations | - | (133) |
| | |
Purchases [net of inventory variation] | (9) | 262 |
Operational storage effects | (228) | 262 |
Eliminations | 219 | - |
| | |
Operating and administrative expenses | 617 | 843 |
Over-/underlift | (59) | 236 |
Other adjustments | 168 | 322 |
Gain/loss on sale of assets | 86 | - |
Provisions | 422 | 285 |
| | |
Depreciation, amortisation and impairment | 1,300 | 5,990 |
Impairment | 2,946 | 7,710 |
Reversal of impairment | (1,646) | (1,649) |
Other adjustments | - | (72) |
| | |
Exploration expenses | 1,061 | 2,096 |
Impairment | 1,141 | 2,265 |
Reversal of impairment | (149) | (312) |
Other adjustments | 41 | 24 |
Provisions | 28 | 119 |
| | |
Sum of adjustments to net operating income | 3,990 | 8,267 |
| | |
Adjusted earnings | 4,070 | 9,633 |
| | |
Tax on adjusted earnings | (4,277) | (7,168) |
| | |
Adjusted earnings after tax | (208) | 2,465 |
Statoil, Annual Report on Form 20-F 2016219
5.3 LEGAL PROCEEDINGS
Statoil is involved in a number of proceedings globally concerning matters arising in connection with the conduct of its business. No further update is provided on previously reported legal or arbitration proceedings which Statoil does not believe will, individually or in the aggregate, have a significant effect on Statoil’s financial position, profitability, results of operations or liquidity. See also note 9Income taxes and note 23 Other commitments, contingent liabilities and contingent assets in Consolidated financial statements.
220Statoil, Annual Report on Form 20-F 2016
5.6 Terms and definitionsABBREVIATIONS
Organisational abbreviations
·ADS – American Depositary Share
·ADR – American Depositary Receipt
· ACG - Azeri-Chirag-GunashliAzeri-Chirag-GunashliX
· ACQ - Annual contract quantity
· AFP - Agreement-based early retirement plan
·AGM - Annual general meeting
· ÅTS - Åsgard transport system
· APA - Awards in pre-defined areas
· ARO - Asset retirement obligation
·BTC - Baku-Tbilisi-Ceyhan pipeline
· CCS - Carbon capture and storage
· CHPCH4 - Combined heat and power plantMethane
· CO2 - Carbon dioxide
· D&PDKK - Development and productionDanish Krone
· DPI - Development and productionProduction International
· DPN - Development and productionProduction Norway
· DPNADPUSA - Development and production North AmericaProduction USA
·DST - Drill Stem Test
·D&W - Drilling and Well
· EEA - European Economic Area
· EFTA - European Free Trade Association
· EMTN - Euro medium-term note
· EXPEU - ExplorationEuropean Union
· FCCEU ETS - Fluid catalytic crackingEU Emissions Trading System
· FEEDEUR - Front-end engineering designEuro
· FIDEXP - Final investment decisionExploration
· FPSO - Floating production, storage offloadingand offload vessel
·GAAP - Generally Accepted Accounting Principals
·GBP - British Pound
· GBS - Gravity-based structure
· GDP - Gross domestic product
· GoMGHG - Gulf of MexicoGreenhouse gas
· GSB - Global strategyStrategy and business developmentBusiness Development
· HSE - Health, safety and environment
· HTHP - High-temperature/high pressure
· IASB - International Accounting Standards Board
·ICE - Intercontinental Exchange
· IEA - International Energy Agency
· IFRS - International Financial Reporting Standards
· IOR - Improved oil recovery
· LNG - Liquefied natural gas
· LPG - Liquefied petroleum gas
· MPRMMP - Marketing, processingMidstream and renewable energyProcessing
· MPE - Norwegian Ministry of Petroleum and Energy
· MW - Mega watt
·NCS - Norwegian continental shelf
· NG - Natural Gas business cluster
·NICO - Naftiran Intertrade Co. Ltd.NES – New Energy Solutions
· NIOC - National Iranian Oil Company
· NOK - Norwegian kroner
· NOx- Nitrogen oxide
· OECD - Organisation of Economic Co-Operation and Development
· OML - Oil mining lease
·OPEC - Organization of the Petroleum Exporting Countries
· OTC - Over-the-counter
· OTS - Oil trading and supply department
· PBO - Project benefit obligationP5+1 – UN Security Council`s five permanent members
· PDO - Plan for development and operation
· PDQ – Production drilling quarters
·PIO - Plan for installation and operation
· PRD - Project Development organisation
·PSA - Production sharing agreement
·PSC – Production sharing contract
Statoil, Annual Report on Form 20-F 2016221
·PSR - Procurement and Supplier Relations
·RDI - Research, Development and Innovation
· R&D - Research and development
· ROACE - Return on average capital employed
· RRR - Reserve replacement ratio
· SAGD - Steam-assisted gravity drainage
· SCP - South Caucasus Pipeline System
· SDAG - Shtokman Development AG
·SDFI - Norwegian State's Direct Financial Interest
·SEC - Securities and Exchange Commission
·SEK - Swedish Krona
· SFR - Statoil Fuel & Retail
· SIF - Serious Incident Frequency
·TAP - Trans Adriatic Pipeline AG
·TEX - Technology Excellence
·TLP - Tension leg platform
·TPD - Technology, projects and drilling
·TRIF - Total recordable injuries per million hours worked
· TSP - Technical service provider
· UKCS - UK continental shelf
·USD - United States dollar
·WTG - Wind Turbine Generators
206Statoil, Annual Report on Form 20-F 2014
Metric abbreviations etc.
· bbl - barrel
· mbbl - thousand barrels
· mmbbl - million barrels
· boe - barrels of oil equivalent
· mboe - thousand barrels of oil equivalent
· mmboe - million barrels of oil equivalent
· mmcf - million cubic feet
· MMBtu - million british thermal units
· bcf - billion cubic feet
· tcf - trillion cubic feet
· scm - standard cubic metre
· mcm - thousand cubic metres
· mmcm - million cubic metres
· bcm - billion cubic metres
· mmtpa - million tonnes per annum
· km - kilometre
· ppm - part per million
· one billion - one thousand million
Equivalent measurements are based upon
· 1 barrel equals 0.134 tonnes of oil (33 degrees API)
· 1 barrel equals 42 US gallons
· 1 barrel equals 0.159 standard cubic metres
· 1 barrel of oil equivalent equals 1 barrel of crude oil
· 1 barrel of oil equivalent equals 159 standard cubic metres of natural gas
· 1 barrel of oil equivalent equals 5,612 cubic feet of natural gas
· 1 barrel of oil equivalent equals 0.0837 tonnes of NGLs
· 1 billion standard cubic metres of natural gas equals 1 million standard cubic metres of oil equivalent
· 1 cubic metre equals 35.3 cubic feet
· 1 kilometre equals 0.62 miles
· 1 square kilometre equals 0.39 square miles
· 1 square kilometre equals 247.105 acres
· 1 cubic metre of natural gas equals 1 standard cubic metre of natural gas
· 1,000 standard cubic meter gas equals 1 standard cubic meter oil equivalent
· 1,000 standard cubic metres of natural gas equals 6.29 boe
· 1 standard cubic foot equals 0.0283 standard cubic metres
· 1 standard cubic foot equals 1000 British thermal units (btu)
· 1 tonne of NGLs equals 1.9 standard cubic metres of oil equivalentsequivalent
· 1 degree Celsius equals minus 32 plus five-ninths of the number of degrees Fahrenheit
Miscellaneous terms
· Appraisal well: A well drilled to establish the extent and the size of a discovery.discovery
222Statoil, Annual Report on Form 20-F 2016
· Backwardation and contango are terms used in the crude oil market. Contango is a condition where forward prices exceed spot prices, so the forward curve is upward sloping. Backwardation is the opposite condition, where spot prices exceed forward prices, and the forward curve slopes downward.downward
· Biofuel: A solid, liquid or gaseous fuel derived from relatively recently dead biological material and is distinguished from fossil fuels, which are derived from long dead biological material.material
· BOE (barrels of oil equivalent): A measure to quantify crude oil, natural gas liquids and natural gas amounts using the same basis. Natural gas volumes are converted to barrels on the basis of energy content.
·Carbon footprint: Total set of greenhouse gas emissions caused directly and indirectly by an individual, organisation, event or product.content
· Clastic reservoir systems: The integrated static and dynamic characteristics of a hydrocarbon reservoir formed by clastic rocks of a specific depositional sedimentary succession and its seal.seal
· Condensates: The heavier natural gas components, such as pentane, hexane, iceptane and so forth, which are liquid under atmospheric pressure – also called natural gasoline or naphtha.naphtha
· Crude oil, or oil: Includes condensate and natural gas liquids.liquids
· Development: The drilling, construction, and related activities following discovery that are necessary to begin production of crude oil and natural gas fields.fields
· Downstream: The selling and distribution of products derived from upstream activities.activities
· Equity and entitlement volumes of oil and gas: Equity volumes represent volumes produced under a production sharing agreement (PSA) that correspond to Statoil's percentage ownership in a particular field. Entitlement volumes, on the other hand, represent Statoil's share of the volumes distributed to the partners in the field, which are subject to deductions for, among other things, royalties and the host government's share of profit oil.
Under the terms of a PSA, the amount of profit oil deducted from equity volumes will normally increase with the cumulative return on investment to the partners and/or production from the licence. The distinction between equity and entitlement is relevant to most PSA regimes, whereas it is not applicable in most concessionary regimes such as those in Norway, the UK, Canada and Brazil. The overview of equity production provides additional
Statoil, Annual Report on Form 20-F 2014207
information for readers, as certain costs described in the profit and loss analysis were directly associated with equity volumes produced during the reported years.
·FCC (fluid catalytic cracking): A process used to convert the high-boiling hydrocarbon fractions of petroleum crude oils to more valuable gasoline, gases and other products.
·GTL (gas to liquids): The technology used for chemical conversion of natural gas into transportable liquids (diesel and naphtha) and specialty products (base oils).years
· Heavy oil: Crude oil with high viscosity (typically above 10 cp), and high specific gravity. The API classifies heavy oil as crudes with a gravity below 22.3° API. In addition to high viscosity and high specific gravity, heavy oils typically have low hydrogen-to-carbon ratios, high asphaltene, sulphur, nitrogen, and heavy-metal content, as well as higher acid numbers.numbers
· High grade: Relates to selectively harvesting goods, to cut the best and leave the rest. In reference to exploration and production this entails strict prioritisation and sequencing of drilling targets.targets
· Hydro: A reference to the oil and energy activities of Norsk Hydro ASA, which merged with Statoil ASA.ASA
· IOR (improved oil recovery): Actual measures resulting in an increased oil recovery factor from a reservoir as compared with the expected value at a certain reference point in time. IOR comprises both of conventional and emerging technologies.technologies
· Liquids: Refers to oil, condensates and NGL.NGL
· LNG (liquefied natural gas): Lean gas - primarily methane - converted to liquid form through refrigeration to minus 163 degrees Celsius under atmospheric pressures.pressures
· LPG (liquefied petroleum gas): Consists primarily of propane and butane, which turn liquid under a pressure of six to seven atmospheres. LPG is shipped in special vessels.vessels
· Midstream: Processing, storage, and transport of crude oil, natural gas, natural gas liquids and sulphur.sulphur
· Naphtha: inflammable oil obtained by the dry distillation of petroleum.petroleum
· Natural gas: Petroleum that consists principally of light hydrocarbons. It can be divided into 1) lean gas, primarily methane but often containing some
ethane and smaller quantities of heavier hydrocarbons (also called sales gas) and 2) wet gas, primarily ethane, propane and butane as well as smaller amounts of heavier hydrocarbons; partially liquid under atmospheric pressure.pressure
· NGL (natural gas liquids): Light hydrocarbons mainly consisting of ethane, propane and butane which are liquid under pressure at normal temperature.temperature
· Oil sands: A naturally occurring mixture of bitumen, water, sand, and clay. A heavy viscous form of crude oil.oil
· Oil and gas value chains: Describes the value that is being added at each step from 1) exploring; 2) developing; 3) producing; 4) transportation and refining; and 5) marketing and distribution.distribution
·Organic capital expenditures: Capital expenditures excluding acquisitions, capital leases and other investments with significant different cash flow pattern
·Oslo Børs : Oslo stock exchange
·Peer group: Statoil’s peer group consists of Statoil, Shell, ExxonMobil, OMV, ConocoPhillips, BP, Marathon, Chevron, Total, Repsol, Anadarko and Eni
· Petroleum: A collective term for hydrocarbons, whether solid, liquid or gaseous. Hydrocarbons are compounds formed from the elements hydrogen
(H) and carbon (C). The proportion of different compounds, from methane and ethane up to the heaviest components, in a petroleum find varies from discovery to discovery. If a reservoir primarily contains light hydrocarbons, it is described as a gas field. If heavier hydrocarbons predominate, it is described as an oil field. An oil field may feature free gas above the oil and contain a quantity of light hydrocarbons, also called associated gas.gas
· Proved reserves: Reserves claimed to have a reasonable certainty (normally at least 90% confidence) of being recoverable under existing economic and political conditions, and using existing technology. They are the only type the US Securities and Exchange Commission allows oil companies to report.
·Rebased production: Equity production is adjusted for full year impact of transactions and redetermination.report
· Refining reference margin: Is a typical average gross margin of our two refineries, Mongstad and Kalundborg. The reference margin will differ from the actual margin, due to variations in type of crude and other feedstock, throughput, product yields, freight cost, inventory etc.etc
· Rig year: A measure of the number of equivalent rigs operating during a given period. It is calculated as the number of days rigs are operating divided by the number of days in the period.
·Share turnover: Turnover of shares is a measure of stock liquidity calculated by dividing the total number of shares traded over a period by the average number of shares outstanding for the period. The higher the share turnover, the more liquid the share of the company.
·Syncrude: The output from bitumen extra heavy oil upgrader facility used in connection with oil sand production.
· Upstream: Includes the searching for potential underground or underwater oil and gas fields, drilling of exploratory wells, subsequent operating wells which bring the liquids and or natural gas to the surface.surface
· VOC (volatile organic compounds): Organic chemical compounds that have high enough vapour pressures under normal conditions to significantly vaporise and enter the earth's atmosphere (e.g. gasses formed under loading and offloading of crude oil).
·Wildcat well: The first well to test a new, clearly defined geological unit (prospect).
·Økokrim: Prosecution of Economic and Environmental Crime in Norway.
208Statoil, Annual Report on Form 20-F 20142016 223
105.7 Forward-looking statements
This Annual Report on Form 20-F contains certain forward-looking statements that involve risks and uncertainties, in particular in the sections "Business overview" and "Strategy and market overview". In some cases, we use words such as "aim", "ambition", "anticipate", "believe", "continue", "could", "estimate", "expect", "intend", "likely", "objective", "outlook", "may", "plan", "schedule", "seek", "should", "strategy", "target", "will", "goal" and similar expressions to identify forward-looking statements. All statements other than statements of historical fact, including, among others, statements regarding future financial position, results of operations and cash flows; future financial ratios and information; future financial or operational portfolio or performance; future market position and conditions; future credit rating; business strategy; growth strategy; sales, trading and market strategies; research and development initiatives and strategy; market outlook and future economic projections and assumptions; competitive position; projected regularity and performance levels; expectations related to our recent transactions and projects, such as the Wintershall agreement,sale of interests in the Shah Deniz project and the South Caucasus Pipeline, interests in the Marcellus onshore play in the U.S.,US, interests in Trans Adriatic Pipeline, interests in Gudrun and acquisition of interests in Eagle Ford in the Kai Kos Dehseh oil sands swap agreement,US, the UK Mariner project, the Peregrino phase II project in Brazil, in addition to the Johan Sverdrup and Aasta Hansteen and Gina Krogh projects on the NCS, discoveries on the NCS and internationally; our ownership share in Gassled; completion and results of acquisitions, disposals and other contractual arrangements; reserve information; recovery factors and levels; future margins; projected returns; future levels or development of capacity, reserves or resources; future decline of mature fields; planned turnarounds and other maintenance; plans for cessation and decommissioning; oil and gas production forecasts and reporting; growth, expectations and development of production, projects, pipelines or resources; estimates related to production and development levels and dates; operational expectations, estimates, schedules and costs; exploration and development activities, plans and expectations; projections and expectations for upstream and downstream activities; expectations relating to licences; oil, gas, alternative fuel and energy prices and volatility; oil, gas, alternative fuel and energy supply and demand; renewable energy production, industry outlook and carbon capture and storage; organisational structure and policies; planned responses to climate change; technological innovation, implementation, position and expectations; future energy efficiency; projected operational costs or savings; our ability to create or improve value; future sources of financing; exploration and project development expenditure; our goal of safe and efficient operations; effectiveness of our internal policies and plans; our ability to manage our risk exposure; our liquidity levels and management; estimated or future liabilities, obligations or expenses; expected impact of currency and interest rate fluctuations; expectations related to contractual or financial counterparties; capital expenditure estimates and expectations; projected outcome, impact or timing of HSE regulations; HSE goals and objectives of management for future operations; expectations related to regulatory trends; impact of PSA effects; projected impact or timing of administrative or governmental rules, standards, decisions, standards or laws (including taxation laws); projected impact of legal claims against us; plans for capital distribution and amounts of dividends are forward-looking statements. You should not place undue reliance on these forward-looking statements. Our actual results could differ materially from those anticipated in the forward-looking statements for many reasons, including the risks described above in "Risk review", and in "Operational review", and elsewhere in this Annual Report on Form 20-F.
These forward-looking statements reflect current views about future events and are, by their nature, subject to significant risks and uncertainties because they relate to events and depend on circumstances that will occur in the future. There are a number of factors that could cause actual results and developments to differ materially from those expressed or implied by these forward-looking statements, including levels of industry product supply, demand and pricing; exchange rate and interest rate fluctuations; the political and economic policies of Norway and other oil-producing countries; EU directives; general economic conditions; political and social stability and economic growth in relevant areas of the world; Euro-zone uncertainty; global political events and actions, including war, terrorism and sanctions; security breaches, including breaches of our digital infrastructure (cybersecurity); changes or uncertainty in or non-compliance with laws and governmental regulations; the timing of bringing new fields on stream; an inability to exploit growth opportunities; material differences from reserves estimates; unsuccessful drilling; an inability to find and develop reserves; ineffectiveness of crisis management systems; adverse changes in tax regimes; the development and use of new technology, particularly in the renewable energy sector; geological or technical difficulties; operational problems; operator error; inadequate insurance coverage; the lack of necessary transportation infrastructure when a field is in a remote location and other transportation problems; the actions of competitors; the actions of field partners; the actions of the Norwegian state as majority shareholder; counterparty defaults; natural disasters, adverse weather conditions, climate change, and other changes to business conditions; failure to meet our ethical and social standards; an inability to attract and retain personnel and other factors discussed elsewhere in this report.
Although we believe that the expectations reflected in the forward-looking statements are reasonable, we cannot assure you that our future results, level of activity, performance or achievements will meet these expectations. Moreover, neither we nor any other person assumes responsibility for the accuracy and completeness of the forward-looking statements. Unless we are required by law to update these statements, we will not necessarily update any of these statements after the date of this Annual Report, either to make them conform to actual results or changes in our expectations.
224Statoil, Annual Report on Form 20-F 20142016 209
115.8 Signature page
The registrant hereby certifies that it meets all of the requirements for filing on Form 20-F and that it has duly caused and authorizedauthorised the undersigned to sign this Annual Report on its behalf.
STATOIL ASA
(Registrant)
By: /s/ Torgrim Reitan Hans Jakob Hegge
Name: Torgrim ReitanHans Jakob Hegge
Title: Executive Vice President and Chief Financial Officer
Dated: 1917 March 20152017
210Statoil, Annual Report on Form 20-F 20142016 225
125.9 Exhibits
The following exhibits are filed as part of this Annual Report:
Exhibit no | Description |
| | |
Exhibit 1 | Articles of Association of Statoil ASA, as amended, effective from 14 May 201326 October 2016 (English translation). |
Exhibit 2.1 | Form of Indenture among Statoil ASA (formerly known as StatoilHydro ASA), Statoil Petroleum AS (formerly known as Statoil Hydro Petroleum AS) and Deutsche Bank Trust Company Americas (incorporated by reference to Exhibit 4.1 of Statoil ASA’s and Statoil Petroleum AS’s Post‐Effective Amendment No. 1 to their Registration Statement on Form F‐3 (File No. 333‐143339) filed with the Commission on April 2, 2009). |
Exhibit 2.2 | Amended and Restated Agency Agreement, dated as of 5 February 2016, by and among Statoil ASA, as Issuer, Statoil Petroleum AS as Guarantor, the Bank of New York Mellon, as Agent and the Bank of New York Mellon (Luxembourg) S.A. as Paying Agent in respect of a €20,000,000 Euro Medium Term Note Programme. |
Exhibit 2.3 | Deed of Covenant, dated as of 5 February 2016, of Statoil ASA in respect of a €20,000,000 Euro Medium Term Notes Programme. |
Exhibit 2.4 | Deed of Guarantee, dated as of 5 February 2016, of Statoil Petroleum AS in respect of a €20,000,000 Euro Medium Term Notes Programme. |
Exhibit 4(a)(i) | Technical Services Agreement between Gassco AS and Statoil Petroleum AS, dated November 24, 2010 (incorporated by reference to Exhibit 4(a)(i) to Statoil’s Annual Report on Form 20-F for the fiscal year ended December 31, 2013 (File No. 1-15200)).2010. |
Exhibit 4(c) | Employment agreement with Eldar Sætre as of 4 February 2015. |
Exhibit 7 | Calculation of ratio of earnings to fixed charges. |
Exhibit 8 | Subsidiaries (see Section 3.9 “Significant subsidiaries”Significant subsidiaries included in section 2.7 Corporate in this Annual Report). |
Exhibit 12.1 | Rule 13a-14(a) Certification of Chief Executive Officer. |
Exhibit 12.2 | Rule 13a-14(a) Certification of Chief Financial Officer. |
Exhibit 13.1 | Rule 13a-14(b) Certification of Chief Executive Officer.*1) |
Exhibit 13.2 | Rule 13a-14(b) Certification of Chief Financial Officer.*1) |
Exhibit 15(a)(i) | Consent of KPMG AS. |
Exhibit 15(a)(ii) | Consent of DeGolyer and MacNaughton. |
Exhibit 15(a)(iii) | Report of DeGoylerDeGolyer and MacNaughton. |
| | |
*1)
| Furnished onlyonly. |
| | |
The total amount of long term debt securities of Statoil ASA and its subsidiaries authorized under instruments other than those listed above does not exceed 10% of the total assets of Statoil ASA and its subsidiaries on a consolidated basis. The company agrees to furnish copies of any or all such instruments to the Commission upon request. |
The total amount of long-term debt securities of the Registrant and its subsidiaries authorized under any one instrument does not exceed 10% of the total assets of Statoil ASA and its subsidiaries on a consolidated basis. The company agrees to furnish copies of any or all such instruments to the Securities and Exchange Commission upon request.
226Statoil, Annual Report on Form 20-F 20142016 211
135.10 Cross reference to Form 20-F
| | Sections |
Item 1. | Identity of Directors, Senior Management and Advisers | N/A |
Item 2. | Offer Statistics and Expected Timetable | N/A |
Item 3. | Key Information | |
| A. Selected Financial Data | 1.2; 4.1.2; 6; 6.1.1; 6.7Key Figures and Highlights
|
| B. CapitalizationCapitalisation and Indebtedness | N/A |
| C. Reasons for the Offer and Use of Proceeds | N/A |
| D. Risk Factors | 5.12.10 (Risk review—Risk factors)
|
Item 4. | Information on the Company | |
| A. History and Development of the Company | 3.1; 3.2; 4.1.4; 4.1.5; 4.2.3; 8.1.4Statoil at a Glance; 2.2 (Business Overview); 2.3 (DPN – Development and production Norway); 2.4 (DPI – Development and production international); 2.5 (MMP – Marketing, Midstream and processing); 2.6 (Other group); 2.9 (Liquidity and capital resources—Reviews of cash flows); 2.9 (Liquidity and Capital Resources—Investments); note 4 (Acquisitions and disposals) to Statoil’s Consolidated financial statements)
|
| B. Business Overview | 2; 3; 4.1.1; 4.1.32.1 (Strategy and market overview); 2.2 (Business overview); 2.3 (DPN – Development and production Norway); 2.4 (DPI – Development and production international); 2.5 (MMP – Marketing, midstream and processing); 2.6 (Other group); 2.7 (Corporate)
|
| C. OrganizationalOrganisational Structure | 3.1; 3.4; 3.92.2 (Business overview—Corporate structure); 2.2 (Business Overview—Segment reporting); 2.7 (Corporate—Subsidiaries and properties)
|
| D. Property, Plants and Equipment | 3.5 - 3.7; 3.13; 4.2.3; 8.1.11; 8.1.222.3 (DPN – Development and production Norway); 2.4 (DPI – Development and production international); 2.5 (MMP – Marketing, midstream and processing); 2.7 (Corporate—Property, plant and equipment); 2.9 (Liquidity and Capital Resources—Investments); notes 10 (Property, plant and equipment) and 22 (Leases) to Statoil’s Consolidated financial statements
|
| Oil and Gas Disclosures | 3.10.1; 3.10.2; 3.11; 3.11.1; 3.11.2; 3.11.3; 3.11.4; 8.1.27;2.8 (Operating and financial performance—Proved oil and gas reserves); 2.8 (Operating and financial performance—Production volumes and pricing); Exhibit 15(a)(iv)(iii)
|
Item 4A. | Unresolved Staff Comments | None |
Item 5. | Operating and Financial Review and Prospects | |
| A. Operating Results | 3.12; 4.1; 4.2.4; 5.2.1; 8.1.252.8 (Operating and financial performance); 2.7 (Corporate—Applicable laws and regulations); 2.9 (Liquidity and capital resources—Impact of reduced prices); 2.10 (Risk review—Risk management—Managing operational risks); note 25 (Financial instruments: fair value measurement and sensitivity analysis of market risk) to Statoil’s Consolidated financial statements
|
| B. Liquidity and Capital Resources | 4.2; 4.2.1; 4.2.2; 4.2.5; 5.2.1; 5.2.2; 8.1.5; 8.1.16; 8.1.18; 8.1.252.9 (Liquidity and capital resources); 2.10 (Risk review—Risk management); notes 5 (Financial risk management), 15 (Trades and other receivables); 18 (Finance debt), 23 (Other commitments, contingent liabilities and contingent assets) and 25 (Financial instruments: fair value measurement and sensitivity analysis of market risk) to Statoil’s Consolidated financial statements
|
| C. Research and development, Patents and Licenses, etc. | 3.8.2; 8.1.72.2 (Business overview—Research and development); note 7 (Other expenses) to Statoil’s consolidated financial statements
|
| D. Trend Information | 2; 3.3; 3.5.1; 3.5.3; 3.5.4; 3.6; 3.7.1; 3.11; 3.12.3; 4.2; 5; 8.1.23passim
|
| E. Off-BalanceOff‐Balance Sheet Arrangements | 4.2.5; 4.2.6; 8.1.22; 8.1.232.9 (Liquidity and capital resources—Principal Contractual obligations); 2.9 (Liquidity and capital resources—Off balance sheet arrangements); notes 22 (Leases) and 23 (Other commitments, contingent liabilities and contingent assets) to Statoil’s Consolidated financial statements
|
| F. Tabular Disclosure of Contractual Obligations | 4.2.52.9 (Liquidity and capital resources—Principal contractual obligations)
|
| G. Safe Harbor | 105.7 (Forward-Looking Statements)
|
Item 6. | Directors, Senior Management and Employees | |
| A. Directors and Senior Management | 7.6; 7.83.5 (Board of directors); 3.6 (Management)
|
| B. Compensation | 7.9; 8.1.193.7 (Compensation to governing bodies)
|
| C. Board Practices | 7.5; 7.6; 7.83.4 (Corporate assembly); 3.5 (Board of directors); 3.6 (Management)
|
| D. Employees | 3.16.1; 3.16.32.12 (Our people—Employees in Statoil); 2.12 (Our people—Unions and representatives)
|
| E. Share Ownership | 6.2.1; 7.6; 7.8; 7.103.8 (Share ownership); 5.1 (Shareholder information—Shares purchased by the issuer—Statoil’s share savings plan)
|
Item 7. | Major Shareholders and Related Party Transactions | |
| A. Major Shareholders | 6.85.1 (Shareholder information—Major shareholders)
|
| B. Related Party Transactions | 3.14; 8.1.242.7 (Corporate—Related party transactions); note 24 (Related parties) to Statoil’s Consolidated financial statement
|
| C. Interests of Experts and Counsel | N/A |
Item 8. | Financial Information | |
| A. Consolidated Statements and Other Financial Information | 4.1.3; 5.3; 6.1; 84.1 (Consolidated financial statements of Statoil); 5.3 (Legal proceedings)
|
| B. Significant Changes | 8.1.27note 28 (Subsequent events) to Statoil’s Consolidated financial statements)
|
Item 9. | The Offer and Listing | |
| A. Offer and Listing Details | 6.45.1 (Shareholder information); 5.1 (Shareholder information—Share Prices)
|
| B. Plan of Distribution | N/A |
| C. Markets | 6; 6.4; 7.75.1 (Shareholder Information)
|
| D. Selling Shareholders | N/A |
| E. Dilution | N/A |
| F. Expenses of the Issue | N/A |
Item 10. | Additional Information | |
| A. Share Capital | N/A |
| B. Memorandum and Articles of Association | 6.1; 6.8; 7.1; 7.3; 7.10; 8.1.172.10 (Risk review—Risks related to state ownership); 3.1 (Introduction—Articles of association); 3.2 (General meeting of shareholders); 5.1 (Shareholder information); 5.1 (Shareholder Information—Major Shareholders) and note 17 (Shareholders’ Equity and dividends) to Statoil’s Consolidated financial statements
|
| C. Material Contracts | N/A |
| D. Exchange Controls | 6.65.1 (Shareholder information—Exchange controls and limitations
|
| E. Taxation | 6.55.1 (Shareholder information—Taxation)
|
| F. Dividends and Paying Agents | N/A |
| G. Statements by Experts | N/A |
| H. Documents On Display | 1.1About this Report
|
| I. Subsidiary Information | N/A |
Item 11. | Quantitative and Qualitative Disclosures About Market Risk | 5; 8.1.5; 8.1.252.10 (Risk review—Risk management); notes 5 (Financial risk management) and 25 (Financial instruments; fair value measurement and sensitivity analysis of market risk) to Statoil’s Consolidated financial statements
|
Item 12. | Description of Securities Other than Equity Securities | 5; 8.1.5; 8.1.25
|
| A. Debt Securities | N/A |
| B. Warrants and Rights | N/A |
| C. Other Securities | N/A |
| D. American Depositary Shares | 6.4.25.1 (Shareholder Information—Statoil ADR Programme Fees)
|
Item 13. | Defaults, Dividend Arrearages and Delinquencies | None |
Item 14. | Material Modifications to the Rights of Security Holders and Use of | None |
| Proceeds | None
|
Item 15. | Controls and Procedures | 7.12; 8.2.23.10 (Controls and Procedures);
|
Item 16A. | Audit Committee Financial Expert | 7.6.13.5 (Board of Directors—Audit Committee)
|
Item 16B. | Code of Ethics | 7.23.1 (Introduction—Code of Conduct)
|
Item 16C. | Principal Accountant Fees and Services | 7.13.9 (External Auditor)
|
Item 16D. | Exemptions from the Listing Standards for Audit Committees | 7.73.1 (Introduction—Compliance with NYSE listing rules)
|
Item 16E. | Purchases of Equity Securities by the Issuer and Affiliated Purchases | 6.25.1 (Shareholder Information—Shares purchased by the Issuer)
|
Item 16F. | Changes in Registrant’s Certifying Accountant | N/A |
Item 16G. | Corporate Governance | 7.73.1 (Introduction—Compliance with NYSE listing rules)
|
Item 16H | Mine Safety Disclosure | None |
Item 17. | Financial Statements | N/A |
Item 18. | Financial Statements | 8
|
Item 19.
| Exhibits
| 124.1 (Financial statements of Statoil)
|
212Statoil, Annual Report on Form 20-F 2016227
228 Statoil, Annual Report on Form 20-F 20142016
Statoil, Annual Report on Form 20-F 2014213