UNITED STATES
SECURITIES AND EXCHANGE COMMISSION
WASHINGTON, D.C. 20549
FORM 20-F
| ¨ | REGISTRATION STATEMENT PURSUANT TO SECTION 12(b) OR (g) | |
| OF THE SECURITIES EXCHANGE ACT OF 1934 |
OR
| OR | ||
| x | ANNUAL REPORT PURSUANT TO SECTION 13 OR 15(d) | |
| OF THE SECURITIES EXCHANGE ACT OF 1934 |
For the fiscal year ended December 31, 2011
OR
| For the fiscal year ended December 31, 2012 | ||
| OR | ||
| ¨ | TRANSITION REPORT PURSUANT TO SECTION 13 OR 15(d) OF THE | |
| SECURITIES EXCHANGE ACT OF 1934 |
OR
| OR | ||
| ¨ | SHELL COMPANY REPORT PURSUANT TO SECTION 13 OR 15(d) | |
| OF THE SECURITIES EXCHANGE ACT OF 1934 |
Date of event requiring this shell company report
For the transition period from to
Commission file number 001-14370
COMPAÑÍA DE MINAS BUENAVENTURA S.A.A.
(Exact(Exact name of Registrant as specified in its charter)
BUENAVENTURA MINING COMPANY INC.
(Translation of Registrant’s name into English)
REPUBLIC OF PERU
(Jurisdiction of incorporation or organization)
CARLOS VILLARAN 790
SANTA CATALINA, LA VICTORIA, LIMA 13, PERU
(Address of principal executive offices)
Carlos E. Gálvez, Vice President and Chief Financial Officer
Telephone: (511) 419-2540
Facsimile: (511) 471-7349
Address: Carlos Villarán 790, Santa Catalina, La Victoria, Lima 13, Perú
(Name, telephone, e-mail and/or facsimile number and address of company contact person)
Securities registered or to be registered pursuant to Section 12(b) of the Act:
| Title of each class | Name of each exchange on which registered | |
Common shares, nominal (par) value of ten Peruvian Nuevos Soles per share (Common Shares) American Depositary Shares (ADSs) representing one Common Share each | New York Stock Exchange Inc.٭ Lima Stock Exchange
New York Stock Exchange Inc. |
٭ Not *Not for trading but only in connection with the registration of ADSs pursuant to the requirements of the Securities and Exchange Commission.
Securities registered or to be registered pursuant to Section 12(g) of the Act: None
Securities for which there is a reporting obligation pursuant to Section 15(d) of the Act: None
Indicate the number of outstanding shares of each of the issuer’s classes of capital or common stock as of the close of the period covered by the annual report.
| Common Shares nominal (par) value of S/.10.00 per share | 274,889,924 | * | ||
| Investment shares nominal (par) value of S/.10.00 per share | 744,640 |
Indicate by check mark if the registrant is a well-known seasoned issuer, as defined in Rule 405 of the Securities Act.
Yesx No¨
If this report is an annual or transition report, indicate by check mark if the registrant is not required to file reports pursuant to Section 13 or 15(d) of the Securities Exchange Act of 1934.
Yes¨ Nox
Indicate by check mark whether the registrant (1) has filed all reports required to be filed by Section 13 or 15(d) of the Securities Exchange Act of 1934 during the preceding 12 months (or for such shorter period that the registrant was required to file such reports), and (2) has been subject to such filing requirements for the past 90 days.
Yesx No¨
Indicate by check mark whether the registrant has submitted electronically and posted on its corporate Web site, if any, every Interactive Data File required to be submitted and posted pursuant to Rule 405 of Regulation S-T (§232.405 of this chapter) during the preceding 12 months (or for such shorter period that the registrant was required to submit and post such files).
Yes¨ No¨
Indicate by check mark whether the registrant is a large accelerated filer, an accelerated filer, or a non-accelerated filer. See definition of “accelerated filer and large accelerated filer” in Rule 12b-2 of the Exchange Act.
Large accelerated filerx Accelerated filer¨ Non-accelerated filer¨
Indicate by check mark which basis of accounting the registrant has used to prepare the financial statements included in this filing:
| U.S. GAAP¨ | International Financial Reporting Standards as issued by the International Accounting Standards Boardx | Other¨ |
If “Other” has been checked in response to the previous question, indicate by check mark which financial statement item the registrant has elected to follow.
Item 17¨ Item 18¨
If this is an annual report, indicate by check mark whether the registrant is a shell company (as defined in Rule 12b-2 of the Exchange Act).
Yes¨ Nox
| ITEM 16G. | Corporate Governance | |
| ITEM 16H. | Mine Safety Disclosure | |
| PART III | ||
| ITEM 17. | Financial Statements | |
| ITEM 18. | Financial Statements | |
| ITEM 19. | Exhibits |
INTRODUCTION
Presentation of Financial Information
As used in this Annual Report on Form 20-F, or Annual Report, unless the context otherwise requires, references to “we,” “us,” “our,” “Company,” “BVN” and “Buenaventura” mean Compañía de Minas Buenaventura S.A.A. and its consolidated subsidiaries. Unless otherwise specified or the context otherwise requires, references to “$,” “US$,” “Dollars” and “U.S. Dollars” are to United States Dollars, and references to “S/.,” “Nuevo Sol” or “Nuevos Soles” are to Peruvian Nuevos Soles, the legal currency of the Republic of Peru, or Peru.
Until December 31, 2010, we presented our consolidated financial statements, which we refer to as our Financial Statements, in conformity with accounting principles generally accepted in Peru, or Peruvian GAAP. Effective January 1, 2011, we changed the accounting principles governing the presentation of our consolidated financial statements from Peruvian GAAP to International Financial Reporting Standards, or IFRS, as issued by the International Accounting Standards Board, or the IASB. See Note 3 to the Financial Statements for a description of how the transition from Peruvian GAAP to IFRS affected our reported financial position, financial performance and cash flows for the periods covered.
Pursuant to the rules of the United States Securities and Exchange Commission, or the SEC, this Annual Report includes certain separate financial statements and other financial information of Minera Yanacocha S.R.L., or Yanacocha, and Sociedad Minera Cerro Verde S.A.A., or Cerro Verde. Yanacocha and Cerro Verde maintain their financial books and records in U.S. Dollars and present their financial statements in accordance with accounting principles generally accepted in the United States of America, or U.S. GAAP, and IFRS as issued by the IASB, respectively. See Note 109 to the Financial Statements.
We record our investments in Yanacocha and Cerro Verde in accordance with the equity method as described in “Item 5. Operating and Financial Review and Prospects—Buenaventura—General” and Note 2.3(e) to the Financial Statements. Our partnership interest in Yanacocha was calculated at 43.65 percent for the years ended December 31, 20102011 and 2011.2012. As of December 31, 20102011 and 2011,2012, our equity interest in Cerro Verde was 19.2619.35 percent and 19.3519.58 percent, respectively.
Forward-Looking Statements
Certain statements contained in this Annual Report are “forward-looking statements” as defined in the U.S. Private Securities Litigation Reform Act of 1995 and are intended to be covered by the safe harbor provided for under these sections. Our forward-looking statements are based on management’s assumptions and beliefs in light of the information currently available to it and may include, without limitation:
| · | our, Yanacocha’s and Cerro Verde’s costs and expenses; |
| · | estimates of future costs applicable to sales; |
| · | estimates of future exploration and production results; |
| · | plans for capital expenditures; |
| · | expected commencement dates of mining or metal production operations; and |
| · | estimates regarding potential cost savings and operating performance. |
The words “anticipate,” “may,” “can,” “plan,” “believe,” “estimate,” “expect,” “project,” “intend,” “likely,” “will,” “should,” “to be” and any similar expressions are intended to identify those assertions as forward-looking statements. In making any forward-looking statements, we believe that the expectations are based on reasonable assumptions. We caution readers that those statements are not guarantees of future performance and our actual results may differ materially from those anticipated, projected or assumed in the forward-looking statements. Important factors that can cause our actual results to differ materially from those anticipated in the forward-looking statements include:
| · | our, Yanacocha’s and Cerro Verde’s results of exploration; |
| · | the results of our joint ventures and our share of the production of, and the income received from, such joint ventures; |
| · | commodity prices; |
| · | production rates; |
| · | geological and metallurgical assumptions; |
| · | industry risks; |
| · | timing of receipt of necessary governmental permits or approvals; |
| · | regulatory changes; |
| · | political risks; |
| · | inaccurate estimates of reserves orMineralized Material Not in Reserve; |
| · | anti-mining protests or other potential issues with local community relationships; |
| · | labor relations; |
| · | environmental risks; and |
| · | other factors described in more detail under “Item 3. Key Information—D. Risk Factors.” |
Many of the assumptions on which our forward-looking statements are based are likely to change after our forward-looking statements are made, including, for example, commodity prices, which we cannot control, and our, Yanacocha’s and Cerro Verde’s production volumes and costs, some aspects of which we may or may not be able to control. Further, we may make changes to our business plans that could or will affect our results. We do not intend to update our forward-looking statements, notwithstanding any changes in our assumptions, changes in our business plans, our actual experience or other changes, and we undertake no obligation to update any forward-looking statements more frequently than required by applicable securities laws.
PART I
ITEM 1. Identity of Directors, Senior Management and Advisers
Not applicable.
ITEM 2. Offer Statistics and Expected Timetable
Not applicable.
ITEM 3. Key Information
A. Selected Financial Data
Selected Financial Information and Operating Data
The following information should be read in conjunction with, and is qualified in its entirety by reference to, the Financial Statements, including the notes thereto appearing elsewhere in this Annual Report. The selected financial information as of December 31, 20102011 and 2011,2012, and for the years ended December 31, 2010, 2011 and 2011,2012, is derived from the consolidated statement of financial position, consolidated statements of income and statement of comprehensive income, respectively, included in the Financial Statements appearing elsewhere in this Annual Report. The report of Medina, Zaldívar, Paredes & Asociados (a member firm of Ernst & Young Global) on our 2010, 2011 and 20112012 Financial Statements appears elsewhere in this Annual Report. OurReport.Our 2010, 2011 and 20112012 Financial Statements are prepared and presented in accordance with IFRS as issued by the IASB, which differs in certain respects from U.S. GAAP. For periods up to and including the year ended December 31, 2010, we prepared our financial statements in accordance with Peruvian GAAP. Our consolidated financial statements for the year ended December 31, 2011 arewere the first that we have prepared in accordance with IFRS as issued by the IASB. We have applied IFRS 1 “First Time Adoption of International Financial Reporting Standard” to the opening balance as of January 1, 2010, the date of our transition to IFRS. The IFRS 1 application implies that all the standards are applied retrospectively at the transition date, including certain mandatory exceptions and voluntary exemptions defined in the standard. See Note 3 to the Financial Statements for further details. The operating data presented below are derived from our records and havehas not been subject to audit. The financial information and operating data presented below should be read in conjunction with “Item 5. Operating and Financial Review and Prospects—Buenaventura,” the Financial Statements and the related notes thereto and other financial information included in this Annual Report.
| As of and for the year ended December 31, | ||||||||||||
| 2010 | 2011 | 2012 | ||||||||||
| (In thousands of US$)(1) | ||||||||||||
| Income statement data: | ||||||||||||
| IFRS(2) | ||||||||||||
| Net sales | 1,047,885 | 1,493,882 | 1,496,349 | |||||||||
| Royalty income | 55,883 | 62,742 | 67,178 | |||||||||
| Total income | 1,103,768 | 1,556,624 | 1,563,527 | |||||||||
| Operating costs: | ||||||||||||
| Cost of sales, without considering depreciation and amortization | (347,129 | ) | (446,163 | ) | (629,492 | ) | ||||||
| Exploration in units in operation | (91,441 | ) | (109,355 | ) | (153,018 | ) | ||||||
| Depreciation and amortization | (74,864 | ) | (96,381 | ) | (123,043 | ) | ||||||
| Royalties | (52,270 | ) | (60,262 | ) | (37,667 | ) | ||||||
| Total operating costs | (565,704 | ) | (712,161 | ) | (943,220 | ) | ||||||
| Gross income | 538,064 | 844,463 | 620,307 | |||||||||
| Operating expenses: | ||||||||||||
| Administrative expenses | (107,237 | ) | (75,170 | ) | (99,295 | ) | ||||||
| Exploration in non-operating areas | (36,105 | ) | (49,593 | ) | (95,491 | ) | ||||||
| Selling expenses | (9,375 | ) | (11,617 | ) | (18,090 | ) | ||||||
| Reversal (provision) for impairment of long-lived assets | 13,135 | - | (3,617 | ) | ||||||||
| Excess of workers’ profit sharing | - | (6,221 | ) | (2,164 | ) | |||||||
| Reimbursement of exploration expenses on projects | 15,013 | - | - | |||||||||
| Other, net | 10,653 | 2,513 | 16,584 | |||||||||
| Total operating expenses | (113,916 | ) | (140,088 | ) | (202,073 | ) | ||||||
| Operating income | 424,148 | 704,375 | 418,234 | |||||||||
| Other income (expenses), net: | ||||||||||||
| Share in the results of associates under equity method | 428,885 | 468,363 | 464,239 | |||||||||
| Interest income | 8,203 | 11,827 | 9,486 | |||||||||
| Interest expense | (12,271 | ) | (11,823 | ) | (8,290 | ) | ||||||
| Net gain (loss) from currency exchange difference | (750 | ) | (675 | ) | 1,715 | |||||||
| Total other income, net | 424,067 | 467,692 | 467,150 | |||||||||
| Income before income tax | 848,215 | 1,172,067 | 885,384 | |||||||||
| Income tax | (123,326 | ) | (211,589 | ) | (142,594 | ) | ||||||
| Net income | 724,889 | 960,478 | 742,790 | |||||||||
| Net income attributable to non-controlling interest | 64,068 | 101,551 | 58,105 | |||||||||
| Net income attributable to Buenaventura | 660,821 | 858,927 | 684,685 | |||||||||
| Basic and diluted earnings per share(3)(4) | 2.60 | 3.38 | 2.69 | |||||||||
| Basic and diluted earnings per ADS(3)(4) | 2.60 | 3.38 | 2.69 | |||||||||
| Dividends per share | 0.46 | 0.56 | 0.60 | |||||||||
| Average number of shares outstanding | 254,442,328 | 254,442,328 | 254,232,571 | |||||||||
| Statement of financial position data: | ||||||||||||
| IFRS(2) | ||||||||||||
| Total assets | 3,279,346 | 3,953,549 | 4,588,653 | |||||||||
| Financial obligations | 57,152 | 106,114 | 179,304 | |||||||||
| As of and for the year ended December 31, | ||||||||||||
| 2010 | 2011 | 2012 | ||||||||||
| (In thousands of US$)(1) | ||||||||||||
| Capital stock | 750,540 | 750,540 | 750,540 | |||||||||
| Shareholders’ equity | 2,845,337 | 3,440,479 | 3,964,386 | |||||||||
| Operating data (unaudited): | ||||||||||||
| Production(5) | ||||||||||||
| Gold (oz.) | 481,768 | 524,101 | 447,472 | |||||||||
| Silver (oz.) | 14,840,678 | 16,724,717 | 18,884,824 | |||||||||
| Proven and probable reserves(6) | ||||||||||||
| Gold (oz.) | 1,772,000 | 1,485,000 | 1,385,000 | |||||||||
| Silver (oz.) | 152,161,000 | 155,437,000 | 154,606,000 | |||||||||
| As of and for the year ended December 31, | ||||||||
| 2010 | 2011 | |||||||
| (In thousands of US$)(1) | ||||||||
| Income statement data: | ||||||||
| IFRS | ||||||||
| Net sales | 1,047,885 | 1,493,882 | ||||||
| Royalty income | 55,883 | 62,742 | ||||||
| Total income | 1,103,768 | 1,556,624 | ||||||
| Operating costs: | ||||||||
| Cost of sales, without considering depreciation and amortization | (347,129 | ) | (446,163 | ) | ||||
| Exploration in units in operation | (91,441 | ) | (109,355 | ) | ||||
| Depreciation and amortization | (74,864 | ) | (96,381 | ) | ||||
| Royalties | (52,270 | ) | (60,262 | ) | ||||
| Total operating costs | (565,704 | ) | (712,161 | ) | ||||
| Gross income | 538,064 | 844,463 | ||||||
| Operating expenses: | ||||||||
| Administrative expenses | (107,237 | ) | (75,170 | ) | ||||
| Exploration in non-operational areas | (36,105 | ) | (49,593 | ) | ||||
| Selling expenses | (9,375 | ) | (11,617 | ) | ||||
| Excess of workers’ profit sharing | - | (6,221 | ) | |||||
| Reimbursement of exploration expenses on projects | 15,013 | - | ||||||
| Other, net | 10,653 | 2,513 | ||||||
| Reversal (provision) for impairment of long-lived assets | 13,135 | - | ||||||
| Total operating expenses | (113,916 | ) | (140,088 | ) | ||||
| Operating income (loss) | 424,148 | 704,375 | ||||||
| Other income (expenses), net: | ||||||||
| Share in the results of associates | 428,885 | 468,363 | ||||||
| Interest income | 8,203 | 11,827 | ||||||
| Interest expense | (12,271 | ) | (11,823 | ) | ||||
| Loss from currency exchange difference, net | (750 | ) | (675 | ) | ||||
| Total other income, net | 424,067 | 467,692 | ||||||
| Income tax and non-controlling interest | 848,215 | 1,172,067 | ||||||
| Income tax, net | (123,326 | ) | (211,589 | ) | ||||
| Net income | 724,889 | 960,478 | ||||||
| Net income attributable to non-controlling interest | 64,068 | 101,551 | ||||||
| Net income attributable to Buenaventura | 660,821 | 858,927 | ||||||
| Basic and diluted earnings per share(2)(3) | 2.85 | 3.77 | ||||||
| Basic and diluted earnings per ADS(2)(3) | 2.85 | 3.77 | ||||||
| Dividends per share | 0.46 | 0.56 | ||||||
| Average number of shares outstanding | 254,442,328 | 254,442,328 | ||||||
| Statement of financial position: | ||||||||
| IFRS(4) | ||||||||
| Total assets | 3,279,346 | 3,953,549 | ||||||
| Financial obligations | 57,152 | 106,114 | ||||||
| Capital stock | 750,540 | 750,540 | ||||||
| Shareholders’ equity | 2,845,337 | 3,440,479 | ||||||
| As of and for the year ended December 31, | ||||||||
| 2010 | 2011 | |||||||
| (In thousands of US$)(1) | ||||||||
| Operating data (unaudited): | ||||||||
| Production(5) | ||||||||
| Gold (oz.) | 481,768 | 524,101 | ||||||
| Silver (oz.) | 14,840,678 | 16,724,717 | ||||||
| Proven and probable reserves(6) | ||||||||
| Gold (oz.) | 2,430,000 | 2,066,099 | ||||||
| Silver (oz.) | 159,880,000 | 155,840,109 | ||||||
| (1) | Except per share, per ADS, outstanding shares and operating data. |
| (2) | Effective January 1, 2011, we changed the accounting principles governing our presentation of our consolidated financial statements from Peruvian GAAP to IFRS. Acccordingly, our financial information for the year ended December 31, 2010 has been presented in accordance with IFRS. |
| (3) | Income per share has been calculated for each year as net income divided by average number of shares outstanding during the year. As of March 31, 2010, 2011 and |
| We have no outstanding options, warrants or convertible securities that would have a dilutive effect on earnings per share. As a result, there is no difference between basic and diluted earnings per share or ADS. |
| (5) | The amounts in this table reflect the total production of all of our consolidated subsidiaries, including Sociedad Minera El Brocal S.A.A., or El Brocal, in which we owned a 53.76% controlling equity interest, and Minera La Zanja S.R.L., or La Zanja, in which we owned a 53.06% controlling equity interest, in each case as of December 31, |
| (6) | The conceptual framework used to estimate proven and probable reserves for our wholly-owned mines as of December 31, 2010 and 2011 were |
| 5 |
Yanacocha Selected Financial Information and Operating Data
The following table presents selected financial information and operating data for Yanacocha at the dates and for each of the periods indicated. This information should be read in conjunction with, and is qualified in its entirety by reference to, Yanacocha’s audited consolidated financial statements as of December 31, 20102011 and 20112012 and for the years ended December 31, 2009, 2010, 2011 and 2011,2012, or the Yanacocha Financial Statements. The report of Dongo-Soria Gaveglio y Asociados on the Yanacocha Financial Statements appears elsewhere in this Annual Report. The selected financial information as of December 31, 2007, 2008, 2009 and 20092010 and for the years ended December 31, 20072008 and 20082009 has been derived from balance sheets and statements of income, respectively, which are not included in this Annual Report. The Yanacocha Financial Statements are prepared and presented in accordance with U.S. GAAP, which differ in certain respects from IFRS. See Note 10(e.1)9(e.1) to the Financial Statements for a reconciliation to U.S. GAAP of net income and shareholders’ equity as of January 1, 2010 and as offor the years ended December 31, 2010, 2011 and 2011.2012. The operating data presented below, which are based on 100 percent of Yanacocha’s production and reserves, are derived from Yanacocha’s records and have not been subject to audit. The financial information presented below should be read in conjunction with “Item 5. Operating and Financial Review and Prospects—Yanacocha,Prospects-Yanacocha,” the Yanacocha Financial Statements and the related notes thereto and other financial information included in this Annual Report.
| 6 |
| As of and for the year ended December 31, | ||||||||||||||||||||
| 2007 | 2008 | 2009 | 2010 | 2011 | ||||||||||||||||
| (In thousands of US$)(1) | ||||||||||||||||||||
| Income statement data: | ||||||||||||||||||||
| U.S. GAAP | ||||||||||||||||||||
| Revenues | 1,093,347 | 1,612,618 | 2,013,228 | 1,778,260 | 2,002,602 | |||||||||||||||
| Costs and expenses: | ||||||||||||||||||||
| Costs applicable to sales | (506,261 | ) | (659,867 | ) | (671,055 | ) | (655,007 | ) | (738,336 | ) | ||||||||||
| Depreciation, depletion and amortization | (159,148 | ) | (169,131 | ) | (166,053 | ) | (160,424 | ) | (231,520 | ) | ||||||||||
| Exploration costs | (28,234 | ) | (28,151 | ) | (22,968 | ) | (34,579 | ) | (66,272 | ) | ||||||||||
| General and administrative costs | (2,928 | ) | (3,168 | ) | (3,602 | ) | (3,824 | ) | (1,281 | ) | ||||||||||
| Other expenses | (80,941 | ) | (83,424 | ) | (86,469 | ) | (69,122 | ) | (60,192 | ) | ||||||||||
| Total operating expenses | (777,512 | ) | (943,741 | ) | (950,147 | ) | (922,956 | ) | (1,097,601 | ) | ||||||||||
| Operating income | 315,835 | 668,877 | 1,063,081 | 855,304 | 905,001 | |||||||||||||||
| Interest expense and other | 12,698 | 3,642 | (712 | ) | 4,263 | 30,424 | ||||||||||||||
| Pre-tax income | 328,533 | 672,519 | 1,062,369 | 859,567 | 935,425 | |||||||||||||||
| Income tax provision | (107,044 | ) | (196,057 | ) | (335,293 | ) | (269,673 | ) | (293,038 | ) | ||||||||||
| Net income before cumulative effect of change in accounting principles | 221,489 | 476,462 | 727,076 | 589,894 | 642,387 | |||||||||||||||
| Cumulative effect of change in accounting principle, net | - | - | - | - | - | |||||||||||||||
| Net income and comprehensive income | 221,489 | 476,462 | 727,076 | 589,894 | 642,387 | |||||||||||||||
| Balance sheet data: | ||||||||||||||||||||
| U.S. GAAP | ||||||||||||||||||||
| Total assets | 1,895,884 | 1,891,963 | 2,466,500 | 2,936,994 | 3,787,234 | |||||||||||||||
| Total debt | 218,111 | 205,618 | 178,336 | 1,959 | - | |||||||||||||||
| Partners’ equity | 1,326,325 | 1,212,787 | 1,711,102 | 2,302,145 | 2,943,021 | |||||||||||||||
| Operating data (unaudited): | ||||||||||||||||||||
| Gold produced (oz.) | 1,563,669 | 1,810,338 | 2,058,180 | 1,461,620 | 1,293,123 | |||||||||||||||
| Gold proven and probable reserves (thousands of oz.) | 27,594 | 24,850 | 22,362 | 21,538 | 20,295 | |||||||||||||||
| As of and for the year ended December 31, | ||||||||||||||||||||
| 2008 | 2009 | 2010 | 2011 | 2012 | ||||||||||||||||
| (In thousands of US$)(1) | ||||||||||||||||||||
| Income statement data: | ||||||||||||||||||||
| U.S. GAAP | ||||||||||||||||||||
| Revenues | 1,612,618 | 2,013,228 | 1,778,260 | 2,002,602 | 2,201,815 | |||||||||||||||
| Costs and expenses: | ||||||||||||||||||||
| Costs applicable to sales | (659,867 | ) | (671,055 | ) | (655,007 | ) | (738,336 | ) | (694,146 | ) | ||||||||||
| Depreciation, depletion and amortization | (169,131 | ) | (166,053 | ) | (160,424 | ) | (231,520 | ) | (252,900 | ) | ||||||||||
| Reclamation and remediation | (11,174 | ) | (13,016 | ) | (14,632 | ) | (19,135 | ) | (20,090 | ) | ||||||||||
| Exploration costs | (28,151 | ) | (22,968 | ) | (34,549 | ) | (66,272 | ) | (121,724 | ) | ||||||||||
| Write-down of long-lived assets | (442 | ) | (2,923 | ) | (312 | ) | (1,864 | ) | (17,577 | ) | ||||||||||
| General and administrative costs | (3,168 | ) | (3,602 | ) | (3,824 | ) | (1,281 | ) | (3,021 | ) | ||||||||||
| Other expenses | (71,808 | ) | (70,530 | ) | (54,208 | ) | (39,193 | ) | (109,974 | ) | ||||||||||
| Total operating expenses | (943,741 | ) | (950,147 | ) | (922,956 | ) | (1,097,601 | ) | (1,219,432 | ) | ||||||||||
| Operating income | 668,877 | 1,063,081 | 855,304 | 905,001 | 982,383 | |||||||||||||||
| Interest expense and other | 3,642 | (712 | ) | 4,263 | 30,424 | 6,014 | ||||||||||||||
| Pre-tax income | 672,519 | 1,062,369 | 859,567 | 935,425 | 988,397 | |||||||||||||||
| Income tax provision | (196,057 | ) | (335,293 | ) | (269,673 | ) | (293,038 | ) | (361,857 | ) | ||||||||||
| Net income before cumulative effect of change in accounting principles | 476,462 | 727,076 | 589,894 | 642,387 | 626,540 | |||||||||||||||
| Cumulative effect of change in accounting principle, net | - | - | - | - | - | |||||||||||||||
| Net income and comprehensive income | 476,462 | 727,076 | 589,894 | 642,387 | 626,540 | |||||||||||||||
| Statement of financial position data: | ||||||||||||||||||||
| U.S. GAAP | ||||||||||||||||||||
| Total assets | 1,891,963 | 2,466,500 | 2,936,994 | 3,787,234 | 4,451,535 | |||||||||||||||
| Total debt | 205,618 | 178,336 | 1,959 | - | - | |||||||||||||||
| Partners’ equity | 1,212,787 | 1,711,102 | 2,302,145 | 2,943,021 | 3,570,690 | |||||||||||||||
| Operating data (unaudited): | ||||||||||||||||||||
| Gold produced (oz.) | 1,810,338 | 2,058,180 | 1,461,620 | 1,293,123 | 1,345,992 | |||||||||||||||
| Gold proven and probable reserves (thousands of oz.) | 24,850 | 22,362 | 21,538 | 20,295 | 18,500 | |||||||||||||||
| (1) | Except operating data. |
Cerro Verde Selected Financial Information and Operating Data
The following table presents selected financial information and operating data for Cerro Verde at the dates and for each of the periods indicated. This information should be read in conjunction with, and is qualified in its entirety by reference to, Cerro Verde’s audited financial statements as of December 31, 20102011 and 20112012 and for the years ended December 31, 2010, 2011 and 2011,2012, or the Cerro Verde Financial Statements. The selected financial information as of December 31, 2010 has been derived from a balance sheet that is not included in this Annual Report. The report of Medina, Zaldívar, Paredes & Asociados on Cerro Verde’s financial statements appears elsewhere in this Annual Report. The Cerro Verde Financial Statements are prepared and presented in accordance with IFRS as issued by the IASB, which differs in certain respects from U.S. GAAP. Until December 31, 2010, Cerro Verde presented its financial statements in conformity with Peruvian GAAP. See Note 3 to the Cerro Verde Financial Statements fora description of how the transition from Peruvian GAAP to IFRS affected Cerro Verde’s reported financial position, financial performance and cash flows for the periods covered. The operating data presented below, which are based on 100 percent of Cerro Verde’s production and reserves, are derived from Cerro Verde’s records and have not been subject to audit. The financial information presented below should be read in conjunction with “Item 5. Operating and Financial Review and Prospects—Cerro Verde,” the Cerro Verde Financial Statements and the related notes thereto and other financial information included in this Annual Report.
| As of and for the year ended December 31, | ||||||||||||
2010(2) | 2011 | 2012 | ||||||||||
| (In thousands of US$)(1) | ||||||||||||
| Income statement data: | ||||||||||||
| IFRS(2) | ||||||||||||
| Net sales | 2,368,988 | 2,520,050 | 2,127,023 | |||||||||
| Total revenues | 2,368,988 | 2,520,050 | 2,127,023 | |||||||||
| Costs of sales | ||||||||||||
| Total costs of sales | (645,959 | ) | (824,700 | ) | (801,571 | ) | ||||||
| Gross margin | 1,723,029 | 1,695,350 | 1,325,452 | |||||||||
| Operating expenses | ||||||||||||
| Selling expenses | (76,638 | ) | (83,612 | ) | (78,674 | ) | ||||||
| Excess of workers’ profit sharing | (34,427 | ) | (21,923 | ) | - | |||||||
| Expenses related to water plant | (4,300 | ) | (13,670 | ) | (19,606 | ) | ||||||
| Voluntary contribution | (41,081 | ) | - | - | ||||||||
| Other operating expenses | (10,749 | ) | (16,865 | ) | (9,898 | ) | ||||||
| Total operating expenses | (167,195 | ) | (136,070 | ) | (108,178 | ) | ||||||
| Operating income | 1,555,834 | 1,559,280 | 1,217,274 | |||||||||
| Other income (expenses), net | ||||||||||||
| Financial expense | (101 | ) | (165 | ) | (6,951 | ) | ||||||
| Financial income | 1,261 | 1,078 | 1,886 | |||||||||
| Exchange Difference, net | 669 | 1,924 | 3,149 | |||||||||
| Total other income (expenses), net | 1,829 | 2,837 | (1,916 | ) | ||||||||
| Profit before income tax | 1,557,663 | 1,562,117 | 1,215,358 | |||||||||
| Income tax | (483,270 | ) | (483,718 | ) | (443,288 | ) | ||||||
| Net income | 1,074,393 | 1,078,399 | 772,070 | |||||||||
| Basic and diluted earnings per share | 3.069 | 3.081 | 2.206 | |||||||||
| Dividends per share | 2.714 | - | - | |||||||||
| Average number of shares outstanding | 350,056,012 | 350,056,012 | 350,056,012 | |||||||||
| Statement of financial position data: | ||||||||||||
| IFRS(2) | ||||||||||||
| Total assets | 2,294,078 | 3,196,597 | 4,042,771 | |||||||||
| Total debt | - | - | - | |||||||||
| Capital stock | 990,659 | 990,659 | 990,659 | |||||||||
| Shareholders’ equity | 1,599,239 | 2,677,638 | 3,449,708 | |||||||||
| Operating data (unaudited): | ||||||||||||
| Production: | ||||||||||||
| Copper (in thousands of recoverable pounds) | 667,363 | 647,234 | 594,474 | |||||||||
| Proven and probable reserves: | ||||||||||||
| Copper (in thousands of metric tons) | 3,571,531 | 3,977,211 | 4,194,537 | |||||||||
| As of and for the year ended December 31, | ||||||||
2010(2) | 2011 | |||||||
| (In thousands of US$)(1) | ||||||||
| Income statement data: | ||||||||
| IFRS | ||||||||
| Net sales of goods | 2,368,988 | 2,520,050 | ||||||
| Total revenues | 2,368,988 | 2,520,050 | ||||||
| Costs of sales | ||||||||
| Total costs of sales | (645,959 | ) | (824,700 | ) | ||||
| Gross margin | 1,723,029 | 1,695,350 | ||||||
| Operating expenses | ||||||||
| Selling expenses | (76,638 | ) | (83,612 | ) | ||||
| Excess of workers’ profit sharing | (34,427 | ) | (21,923 | ) | ||||
| Provision for water plant | (4,300 | ) | (13,670 | ) | ||||
| Voluntary contribution | (41,081 | ) | - | |||||
| Other operating expenses | (10,749 | ) | (16,865 | ) | ||||
| Total operating expenses | (167,195 | ) | (136,070 | ) | ||||
| Operating income | 1,555,834 | 1,559,280 | ||||||
| Other income (expenses), net | ||||||||
| Financial expense | (101 | ) | (165 | ) | ||||
| Financial income | 1,261 | 1,078 | ||||||
| Exchange Difference, net | 669 | 1,924 | ||||||
| Total other income (expenses), net | 1,829 | 2,837 | ||||||
| Profit before income tax | 1,557,663 | 1,562,117 | ||||||
| Income tax | (483,270 | ) | (483,718 | ) | ||||
| Net income | 1,074,393 | 1,078,399 | ||||||
| Basic and diluted earnings per share | 3.069 | 3.081 | ||||||
| Dividends per share | 2.714 | - | ||||||
| Average number of shares outstanding | 350,056,012 | 350,056,012 | ||||||
| Balance sheet data: | ||||||||
| IFRS(1) | ||||||||
| Total assets | 2,294,078 | 3,196,597 | ||||||
| Total debt | - | - | ||||||
| Capital stock | 990,659 | 990,659 | ||||||
| Shareholders’ equity | 1,599,239 | 2,677,638 | ||||||
| Operating data (unaudited): | ||||||||
| Production: | ||||||||
| Copper (in thousands of recoverable pounds) | 667,363 | 647,234 | ||||||
| Proven and probable reserves: | ||||||||
| Copper (in thousands of metric tons) | 3,571,531 | 3,977,211 | ||||||
| (1) | Except per share and operating data |
| (2) | Effective January 1, 2011, Cerro Verde changed the accounting principles governing the presentation of its consolidated financial statements from Peruvian GAAP to IFRS. Accordingly, Cerro Verde’s financial information for the year ended December 31, 2010 has been presented in accordance with IFRS. See Note 3 to the Cerro Verde Financial Statements. |
Exchange Rates
The following table sets forth the high and low month-end rates and the average and end-of-period offered rates for the sale of Nuevos Soles in U.S. Dollars for the periods indicated, as published by theSuperintendencia de Bancos y Seguros (Superintendent of Bank and Insurance, or the SBS). The Federal Reserve Bank of New York does not report a noon buying rate for Nuevos Soles.
Exchange Rates
(Nuevos Soles per US$)(1)
| Year | High(2) | Low(2) | Average(3) | Period end(4) | High(2) | Low(2) | Average(3) | Period end(4) | ||||||||||||||||||||||||
| 2007 | 3.201 | 2.967 | 3.123 | 2.995 | ||||||||||||||||||||||||||||
| 2008 | 3.141 | 2.690 | 2.922 | 3.139 | 3.141 | 2.690 | 2.922 | 3.139 | ||||||||||||||||||||||||
| 2009 | 3.259 | 2.853 | 3.012 | 2.891 | 3.259 | 2.853 | 3.012 | 2.891 | ||||||||||||||||||||||||
| 2010 | 2.856 | 2.787 | 2.826 | 2.809 | 2.856 | 2.787 | 2.826 | 2.809 | ||||||||||||||||||||||||
| 2011 | 2.834 | 2.694 | 2.755 | 2.697 | 2.834 | 2.694 | 2.755 | 2.697 | ||||||||||||||||||||||||
| 2012 | 2.710 | 2.551 | 2.640 | 2.551 | ||||||||||||||||||||||||||||
| 2011 | High(5) | Low(5) | Average(6) | Period end(7) | ||||||||||||
| October | 2.776 | 2.707 | 2.732 | 2.707 | ||||||||||||
| November | 2.713 | 2.700 | 2.705 | 2.700 | ||||||||||||
| December | 2.701 | 2.694 | 2.697 | 2.697 | ||||||||||||
| High(5) | Low(5) | Average(6) | Period end(7) | |||||||||||||||||||||||||||||
| 2012 | ||||||||||||||||||||||||||||||||
| October | 2.602 | 2.578 | 2.588 | 2.592 | ||||||||||||||||||||||||||||
| November | 2.616 | 2.579 | 2.599 | 2.579 | ||||||||||||||||||||||||||||
| December | 2.581 | 2.551 | 2.568 | 2.551 | ||||||||||||||||||||||||||||
| 2013 | ||||||||||||||||||||||||||||||||
| January | 2.700 | 2.691 | 2.693 | 2.691 | 2.578 | 2.541 | 2.552 | 2.578 | ||||||||||||||||||||||||
| February | 2.691 | 2.678 | 2.684 | 2.678 | 2.587 | 2.567 | 2.579 | 2.587 | ||||||||||||||||||||||||
| March | 2.678 | 2.668 | 2.672 | 2.668 | 2.604 | 2.586 | 2.595 | 2.589 | ||||||||||||||||||||||||
| (1) | Expressed in nominal (not inflation adjusted) Nuevos Soles. |
| (2) | Highest and lowest of the twelve month-end exchange rates for each year based on the offered rate. |
| (3) | Average of month-end exchange rates based on the offered rate. |
| (4) | End of period exchange rates based on the offered rate. |
| (5) | Highest and lowest of the exchange rates based on the offered rate on the last day of each month. |
| (6) | Average of the exchange rates based on the offered rate on the last date of each day in the relevant month. |
| (7) | The exchange rate based on the offered rate on the last day of each relevant month. |
Source: SBS
On April 23, 2012,25, 2013, the offered rate for Dollars as published by the SBS was S/.2.652.2.624 = US$1.00.
B. Capitalization and Indebtedness
Not applicable.
C. Reasons for the Offer and Use of Proceeds
Not applicable.
| 10 |
D. Risk Factors
Factors Relating to the Company
Our financial performance is highly dependent on the performance of our partners under our mining exploration and operating agreements.
Our participation in joint venture mining exploration projects and mining operations with other experienced mining companies is an integral part of our business strategy. Our partners, co-venturers and other shareholders in these projects generally contribute capital to cover the expenses of the joint venture or provide critical technological, management and organizational expertise. The results of these projects can be highly dependent upon the efforts of our joint venture partners and we rely on them to fulfill their obligations under our agreements. For example, our Yanacocha joint venture with Newmont Mining Corporation, a Delaware corporation, or Newmont Mining, is dependent upon Newmont Peru Limited, Peruvian Branch, or Newmont Peru, to provide management and other expertise to the Yanacocha project. If our counterparts do not carry out their obligations to us or to third parties, or any disputes arise with respect to the parties’ respective rights and obligations, the value of our investment in the applicable project could be adversely affected and we could incur significant expense in enforcing our rights or pursuing remedies. There can be no assurance that our current or future partners will fulfill their obligations under our agreements. In addition, we may be unable to exert control over strategic decisions made in respect of such properties. There canFor example, we currently depend on Newmont Peru to conduct operations at Yanacocha and the Conga project, and should Yanacocha be no assurance thatunable to continue with the current development plan at the Conga project, our current or futuremining partners will fulfill their obligations under our agreements.in this project may reprioritize and reallocate capital to development alternatives. See “Item 4. Information on the Company—Yanacocha” and “Item 4. Information on the Company—Buenaventura—B. Business Overview—Exploration.”
Our financial performance is highly dependent on the prices of gold, silver, copper and other metals.
Our revenues are derived primarily from the sale of ore concentrates containing gold and silver; the revenues of Yanacocha, in which we have a material equity investment, are derived primarily from the sale of gold and silver; and the revenues of Cerro Verde, in which we have a material equity investment, are derived primarily from copper sales. The prices that we, Yanacocha and Cerro Verde obtain for gold, silver, copper and ore concentrates containing such metals, as applicable, are directly related to world market prices for such metals. Such prices have historically fluctuated widely and are affected by numerous factors beyond our control, including the overall demand for and worldwide supply of gold, silver, copper and other metals, the availability and price of competing commodities, international economic trends, currency exchange fluctuations, expectations of inflation, actions of commodity markets participants, consumption and demand patterns and political events in major producing countries. We have in the past engaged in hedging activities, such as forward sales and option contracts, to minimize our exposure to fluctuations in the prices of gold, silver and other metals; however, we and our wholly-owned subsidiaries no longer hedge the price at which our gold and silver will be sold. In addition, neither Yanacocha nor Cerro Verde engages in hedging activities. As a result, the prices at which we, Yanacocha and Cerro Verde sell gold, silver, copper and ore concentrates, as applicable, are fully exposed to the effects of changes in prevailing market prices.See “Item 11. Quantitative and Qualitative Disclosures About Market Risk” and Note 2928 to the Financial Statements. For information on gold and silver prices for each of the years in the five-year period ended December 31, 2011, see “Item 4. Information on the Company—Buenaventura—B. Business Overview—Sales of Metal Concentrates.”
On December 31, 2011 and2012, March 31, 2012,2013 and April 24, 2013, the morning fixing price for gold on the London Bullion Market was US$1,574.50per1,664per ounce, US$1,602 per ounce and US$1,660.751,451 per ounce, respectively. On December 31, 20112012 and March 31, 2012,2013, the afternoon fixing spot price of silver on the London market, or London Spot, was US$28.18per29.95per ounce and US$32.43per28.64per ounce, respectively. On December 31, 20112012 and March 31, 2012,2013, the London Metal Exchange Settlement price for copper was US$7,554per7,915,per metric ton and US$8,4807,582, per metric ton, respectively.
The world market prices of gold, silver and copper have historically fluctuated widely and there is no assurance that the prices for these metals will continue to maintain their current high historical levels. We cannot predict whether metal prices will rise or fall in the future. A decline in the market price of one or more of these metals could adversely impact our revenues, net income and cash flows and adversely affect our ability to meet our financial obligations.
In addition, sustained low gold, silver or copper prices could reduce revenues further through production declines due to cessation of the mining of deposits, or portions of deposits, that have become uneconomic at the then-prevailing market price; reduce or eliminate the profit that we currently expect from reserves; halt or delay the development of new projects; reduce funds available for exploration; and reduce existing reserves by removing ores from reserves that can no longer be economically processed at prevailing prices. Such declines in price and/or reductions in operations could also cause significant volatility in our financial performance and adversely affect the trading prices of our Common Shares and ADSs.
Economic, mining and other regulatory policies of the Peruvian government, as well as political, regulatory and economic developments in Peru, may have an adverse impact on our, Yanacocha’s and Cerro Verde’s businesses.
Our, Yanacocha’s and Cerro Verde’s activities in Peru require us to obtain mining concessions or provisional permits for exploration and processing concessions for the treatment of mining ores from the Peruvian Ministry of Energy and Mines, or MEM. Under Peru’s current legal and regulatory regime, these mining and processing rights are maintained by meeting a minimum annual level of production or investment and by the annual payment of a concession fee. A fine is payable for the years in which minimum production or investment requirements are not met. Although we are, and Yanacocha and Cerro Verde have informed us that they are, current in the payment of all amounts due in respect of mining and processing concessions, failure to pay such concession fees, processing fees or related fines for two consecutive years could result in the loss of one or more mining rights and processing concessions, as the case may be.
Mining companies are also required to pay the Peruvian government mining royalties and/or mining taxes. See “Item 4. Information on the Company—Buenaventura—B. Business Overview—Regulatory Framework—Mining Royalties and Taxes.” There can be no assurance that the Peruvian government will not impose additional mining royalties or taxes in the future or that such mining royalties or taxes will not have an adverse effect on our, Yanacocha’s or Cerro Verde’s results of operations or financial condition. Future regulatory changes, changes in the interpretation of existing regulations or stricter enforcement of such regulations, including changes to our concession agreements, may increase our compliance costs and could potentially require us to alter our operations. We cannot assure you that future regulatory changes will not adversely affect our business, financial condition or results of operations.
Environmental and other laws and regulations may increase our costs of doing business, restrict our operations or result in operational delays.
Our, Yanacocha’s and Cerro Verde’s exploration, mining and milling activities, as well our and Yanacocha’s smelting and refining activities, are subject to a number of Peruvian laws and regulations, including environmental laws and regulations.
Additional matters subject to regulation include, but are not limited to, concession fees, transportation, production, water use and discharges, power use and generation, use and storage of explosives, surface rights, housing and other facilities for workers, reclamation, taxation, labor standards, mine safety and occupational health.
We anticipate additional laws and regulations will be enacted over time with respect to environmental matters. The development of more stringent environmental protection programs in Peru could impose constraints and additional costs on our, Yanacocha’s and Cerro Verde’s operations and require us, Yanacocha and Cerro Verde to make significant capital expenditures in the future. Although we believe that we are substantially in compliance, and Yanacocha and Cerro Verde have advised us that they are substantially in compliance, with all applicable environmental regulations, there can be no assurance that future legislative or regulatory developments will not have an adverse effect on our, Yanacocha’s or Cerro Verde’s business or results of operations. See “Item 4. Information on the Company—Buenaventura—B. Business Overview—Regulatory Framework—Environmental Matters” and “—Permits” and “Item 4. Information on the Company—Yanacocha—B. Business Overview—Regulation, Permit and Environmental Matters.”
Our and Yanacocha’s ability to successfully obtain key permits and approvals to explore for, develop and successfully operate mines will likely depend on our and Yanacocha’s ability to do so in a manner that is consistent with the creation of social and economic benefits in the surrounding communities. Our and Yanacocha’s ability to obtain permits and approvals and to successfully operate in particular communities or to obtain financing may be adversely impacted by real or perceived detrimental events associated with our or Yanacocha’s activities or those of other mining companies affecting the environment, human health and safety or the surrounding communities. Delays in obtaining or failure to obtain government permits and approvals may adversely affect our and Yanacocha’s operations, including our and Yanacocha’s ability to explore or develop properties, commence production or continue operations.
Our metals exploration efforts are highly speculative in nature and may not be successful.
Precious metals exploration, particularly gold exploration, is highly speculative in nature, involves many risks and frequently is unsuccessful. There can be no assurance that our, Yanacocha’s or Cerro Verde’s metals exploration efforts will be successful. Once mineralization is discovered, it may take a number of years from the initial phases of drilling before production is possible, during which time the economic feasibility of production may change. Substantial expenditures are required to establish proven and probable ore reserves through drilling, to determine metallurgical processes to extract the metals from the ore and, in the case of new properties, to construct mining and processing facilities. As a result of these uncertainties, no assurance can be given that our or Yanacocha’s exploration programs will result in the expansion or replacement of current production with new proven and probable ore reserves.
Advanced exploration projects have no operating history upon which to base estimates of proven and probable ore reserves and estimates of future cash operating costs. Such estimates are, to a large extent, based upon the interpretation of geologic data obtained from drill holes and other sampling techniques, and feasibility studies which derive estimates of cash operating costs based upon anticipated tonnage and grades of ore to be mined and processed, the configuration of the ore body, expected recovery rates of the mineral from the ore, comparable facility and equipment operating costs, anticipated climatic conditions and other factors. As a result, it is possible that actual cash operating costs and economic returns based upon proven and probable ore reserves may differ significantly from those originally estimated. Moreover, significant decreases in actual over expected prices may mean reserves, once found, will be uneconomical to produce. It is not unusual in new mining operations to experience unexpected problems during the start-up phase. See “Item 4. Information on the Company—Buenaventura—D. Property, Plants and Equipment—Our Properties—Reserves,” “—Yanacocha—D. Property, Plants and Equipment—Yanacocha’s Properties—Reserves” and “Item 5. Operating and Financial Review and Prospects—Cerro Verde—A. Operating Results” for the price per ounce used by us, Yanacocha and Cerro Verde, respectively, to calculate our respective proven and probable reserves.
Increased operating costs could affect our profitability.
Costs at any particular mining location frequently are subject to variation due to a number of factors, such as changing ore grade, changing metallurgy and revisions to mine plans in response to the physical shape and location of the ore body. In addition, costs are affected by the price of commodities, such as fuel and electricity, as well as by the price of labor. Commodity costs are at times subject to volatile price movements, including increases that could make production at certain operations less profitable. Reported costs may be affected by changes in accounting standards. A material increase in costs at any significant location could have a significant effect on our profitability.
Our business is capital-intensive and we may not be able to finance necessary capital expenditures required to execute our business plans.
Precious metals exploration requires substantial capital expenditures for the exploration, extraction, production and processing stages and for machinery, equipment and experienced personnel. Our estimates of the capital required for our projects may be preliminary or based on assumptions we have made about the mineral deposits, equipment, labor, permits and other factors required to complete our projects. If any of these estimates or assumptions change, the actual timing and amount of capital required may vary significantly from our current anticipated costs. In addition, we may require additional funds in the event of unforeseen delays, cost overruns, design changes or other unanticipated expenses. We may also incur debt in future periods or reduce our holdings of cash and cash equivalents in connection with funding future acquisitions, existing operations, capital expenditures or in pursuing other business opportunities. Our ability to meet our payment obligations will depend on our future financial performance, which will be affected by financial, business, economic and other factors, many of which we are unable to control. There can be no assurance that we or Yanacocha will generate sufficient cash flow and/or that we will have access to sufficient external sources of funds in the form of outside investment or loans to continue exploration activities at the same or higher levels than in the past or that we will be able to obtain additional financing, if necessary, on a timely basis and on commercially acceptable terms.
Estimates of proven and probable reserves are subject to uncertainties and the volume and grade of ore actually recovered may vary from our estimates.
The proven and probable ore reserve figures presented in this Annual Report are our, Yanacocha’s and Cerro Verde’s estimates, and there can be no assurance that the estimated levels of recovery of gold, silver, copper and certain other metals will be realized. Such estimates depend on geological interpretation and statistical inferences or assumptions drawn from drilling and sampling analysis, which may prove to be materially inaccurate. Actual mineralization or formations may be different from those predicted. As a result, reserve estimates may require revision based on further exploration development activity or actual production experience, which could materially and adversely affect such estimates. No assurance can be given that our, Yanacocha’s or Cerro Verde’s mineral resources constitute or will be converted into reserves. Market price fluctuations of gold, silver and other metals, as well as increased production costs or reduced recovery rates, may render proven and probable ore reserves containing relatively lower grades of mineralization uneconomic to exploit and may ultimately result in a restatement of proven and probable ore reserves. Moreover, short-term operating factors relating to the reserves, such as the processing of different types of ore or ore grades, could adversely affect our or Yanacocha’s profitability in any particular accounting period. See “Item 4. Information on the Company—Buenaventura—D. Property, Plants and Equipment—Our Properties—Reserves” and “Item 4. Information on the Company—D. Property, Plants and Equipment—Yanacocha—Yanacocha’s Properties—Reserves.”
We and Yanacocha may be unable to replace reserves as they become depleted by production.
As we and Yanacocha produce gold, silver, zinc and other metals, we and Yanacocha deplete our respective ore reserves for such metals. To maintain production levels, we and Yanacocha must replace depleted reserves by exploiting known ore bodies and locating new deposits. Exploration for gold, silver and the other metals we produceproduced is highly speculative in nature. Our and Yanacocha’s exploration projects involve significant risks and are often unsuccessful. Once we discover a site is discovered with mineralization, we and Yanacocha may require several years between initial drilling and mineral production, and the economic feasibility of production may change during such period. Substantial expenditures are required to establish proven and probable reserves and to construct mining and processing facilities. Based on the current recovery rate and estimated gold production levels in 2012, Yanacocha’s proven and probable reserves as of December 31, 2012 will be depleted by 2015 unless Yanacocha continues to add to its reserves. As a result, there can be no assurance that current or future exploration projects will be successful and there is a risk that our depletion of reserves will not be offset by new discoveries. See “Item 4. Information on the Company—Buenaventura—B. Business Overview—Exploration,” “—Yanacocha—B. Business Overview—Exploration”Exploration,” “—D. Property, Plants and Equipment—Reserves,” “—Yanacocha’s Properties—Reserves” and “Item 5. Operating and Financial Review and Prospects—Cerro Verde—A. Operating Results” for a summary of our, Yanacocha’s and Cerro Verde’s estimated proven and probable reserves as of December 31, 2011.2012.
Our operations are subject to risks, many of which are not insurable.
The business of mining, smelting and refining gold, silver, copper and other metals is generally subject to a number of risks and hazards, including industrial accidents, labor disputes, unavailability of materials and equipment, unusual or unexpected geological conditions, changes in the regulatory environment, environmental hazards and weather and other natural phenomena such as earthquakes, most of which are beyond our control. Such occurrences could result in damage to, or destruction of, mining properties or production facilities, personal injury or death, environmental damage, delays in mining, monetary losses and possible legal liability. We, Yanacocha and Cerro Verde each maintain insurance against risks that are typical in the mining industry in Peru and in amounts that we and Yanacocha believe to be adequate but which may not provide adequate coverage in certain circumstances. No assurance can be given that such insurance will continue to be available at economically feasible premiums or at all. Insurance against certain risks (including certain liabilities for environmental pollution or other hazards as a result of exploration and production) is not generally available to us or Yanacocha or to other companies within the industry.
| 15 |
Increases in equipment costs, energy costs and other production costs, disruptions in energy supply and shortages in equipment and skilled labor may adversely affect our results of operations.
In recent years, there has been a significant increase in mining activity worldwide in response to increased demand and significant increases in prices of natural resources. The opening of new mines and expansion of existing mines has led to increased demand for, and increased costs and shortages of, equipment, supplies and experienced personnel. These cost increases have significantly increased overall operating and capital budgets of companies like ours, and continuing shortages could affect the timing and feasibility of expansion projects.
Energy represents a significant portion of our production costs. Our principal energy sources are electricity, purchased petroleum products, natural gas and coal. An inability to procure sufficient energy at reasonable prices or disruptions in energy supply could adversely affect our profits, cash flow and growth opportunities. Our production costs are also affected by the prices of commodities we consume or use in our operations, such as sulfuric acid, grinding media, steel, reagents, liners, explosives and diluents. The prices of such commodities are influenced by supply and demand trends affecting the mining industry in general and other factors outside our control and such prices are at times subject to volatile movements. Increases in the cost of these commodities or disruptions in energy supply could make our operations less profitable, even in an environment of relatively high copper prices. Increases in the costs of commodities that we consume or use may also significantly affect the capital costs of new projects.
We may be adversely affected by labor disputes.
Our ability to achieve our goals and objectives is dependent, in part, on maintaining good relations with our employees. A prolonged labor disruption at any of our material properties could have a material adverse impact on our results of operations. We, Yanacocha and Cerro Verde have all experienced strikes or other labor-related work stoppages in the past. Most recently, we experienced a 21-day15-day work stoppage at our UchucchacuaOrcopampa mine due to a strike and related local community demonstrations, as well as two three-day strikes at our Orcopampa mine, in May and June and a further 9-day work stoppage at Orcopampa due to strikes in October 2011.2012. As of December 31, 2011,2012, unions represented approximately 5554 percent of our permanent employees. Although we consider our relations with our employees to be positive, there can be no assurance that we will not experience strikes or other labor-related work stoppages that could have a material adverse effect on our operations and/or operating results in the future.
Our and Yanacocha’s operations are subject to political and social risks.
Our and Yanacocha’s exploration and production activities are potentially subject to political and social risks. Over the past several years, we and Yanacocha have been the target of local political protests. In recent years, certain areas in the south and northern highlands of Peru with significant mining developments have experienced strikes and protests related to the environmental impact of mining activities. Such strikes and protests have resulted in commercial disruptions and a climate of uncertainty with respect to future mining projects. There can be no assurance that these incidents will not continue or that similar incidents will not occur in areas in which we and Yanacocha operate, or that the continuation or intensification of community protests will not adversely affect our or Yanacocha’s exploration and production activities or our or Yanacocha’s results of operations or financial condition.
In addition, during 2011, Peru enacted Law No. 29785, the Law of Prior Consultation for Indigenous and Native Communities(Ley del Derecho a la Consulta Previa a los Pueblos Indígenas y Originarios, Reconocido en el Convenio 169 de la Organización Internacional del Trabajo). Implementing regulations thereunder were approved by Supreme Decree No. 001-2012-MC, which became effective on April 2, 2012. This law establishes a prior consultation procedure that the Peruvian government must undertake in concert with local indigenous communities whose collective rights may be directly affected by new legislative or administrative measures, including the granting of new mining concessions. The implementing regulations specify the form and circumstances of the required consultation and the manner in which agreements will be formalized, and cap the consultation process at 120 calendar days. Under the law, the Peruvian government,governmental body responsible for issuing or approving the administrative measure or decree in question, rather than the affected local indigenous community, retains the right to approve or reject the relevant legislative or administrative matter following such consultation. However, to the extent that any future projects operated by us, Yanacocha or Cerro Verde require legislative or administrative measures that impact local indigenous communities, the required prior consultation procedure may result in delays, additional expenses or failure to obtain approval for such new project.
| 16 |
We could face geotechnical challenges, which could adversely impact our production and profitability.
No assurances can be given that unanticipated adverse geotechnical and hydrological conditions, such as landslides and pit wall failures, will not occur in the future or that such events will be detected in advance. Geotechnical instabilities can be difficult to predict and are often affected by risks and hazards outside of our control, such as severe weather and considerable rainfall, which may lead to periodic floods, mudslides, wall instability and seismic activity, which may result in slippage of material.
Geotechnical failures could result in limited or restricted access to mine sites, suspension of operations, government investigations, increased monitoring costs, remediation costs, loss of ore and other impacts, which could cause one or more of our projects to be less profitable than currently anticipated and could result in a material adverse effect on our results of operations and financial position.
We rely on contractors to conduct a significant portion of our operations and mine development projects.
A significant portion of our operations and mine development projects are currently conducted by contractors. As a result, our operations are subject to a number of risks, some of which are outside our control, including:
| · | failure of a contractor to perform under its agreement; |
| · | interruption of operations or increased costs in the event that a contractor ceases its business due to insolvency or other unforeseen events; |
| · | failure of a contractor to comply with applicable legal and regulatory requirements, to the extent it is responsible for such compliance; and |
| · | problems of a contractor with managing its workforce, labor unrest or other employment issues. |
In addition, we may incur liability to third parties as a result of the actions of our contractors. The occurrence of one or more of these risks could adversely affect our results of operations and financial position.
We are not, and do not intend to become, regulated as an investment company under the U.S. Investment Company Act of 1940, as amended, or the Investment Company Act, and if we were deemed an “investment company” under the Investment Company Act, applicable restrictions could make it impractical for us to operate as contemplated.
As of December 31, 2011,2012, we owned a 43.65 percent partnership interest in Yanacocha and a 19.3519.58 percent equity interest in Cerro Verde. These interests may constitute “investment securities” for purposes of the Investment Company Act.
Under the Investment Company Act, an investment company is defined in relevant part to include (i) any company that is or holds itself out as being engaged primarily, or proposes to engage primarily, in the business of investing, reinvesting or trading in securities and (ii) any company that owns or proposes to acquire investment securities having a value exceeding 40 percent of such company’s total assets (exclusive of certain items) on an unconsolidated basis. Issuers that are investment companies within the meaning of the Investment Company Act, and which do not qualify for an exemption from the provisions of such act, are required to register with the SEC and are subject to substantial regulations with respect to capital structure, operations, transactions with affiliates and other matters. If we were deemed to be an investment company and did not qualify for an exemption from the provisions of the Investment Company Act, we would be required to register with the SEC and would be subject to such regulations, which would be unduly burdensome and costly for us and possibly adversely impact us.
We received an order from the SEC on April 19, 1996 declaring us to be primarily engaged in a business other than that of an investment company and, therefore, not an investment company within the meaning of the Investment Company Act. We intend to conduct our operations and maintain our investments in a manner, and will take appropriate actions as necessary, to ensure we will not be deemed to be an investment company in the future. The SEC, however, upon its motion or upon application, may find that the circumstances that gave rise to the issuance of the order no longer exist, and as a result may revoke such order. There can be no assurance that such order will not be revoked.
Our or Yanacocha’s inability to maintain positive relationships with the communities in which we operate may affect our or Yanacocha’s reputation and financial condition.
Our and Yanacocha’s relationships with the communities in which we operate are critical to ensuring the future success of our existing operations and the construction and development of our projects. Adverse publicity generated by non-governmental organizations or local communities related to extractive industries generally, or our or Yanacocha’s operations specifically, could have an adverse effect on our reputations or financial condition and may impact our relationships with the communities in which we operate. In addition, following the enactment of Law No. 29785, the Law of Prior Consultation for Indigenous and Native Communities in 2011, the Peruvian government must undertake a prior consultation procedure in concert with local indigenous communities whose collective rights may be directly affected by new legislative or administrative measures, including the granting of new mining concessions. Implementing regulations under Law No. 29785 were approved by Supreme Decree No. 001-2012-MC, which became effective on April 2, 2012. The implementing regulations specify the form and circumstances of the required consultation and the manner in which agreements will be formalized, and cap the consultation process at 120 calendar days. Our and Yanacocha’s national reputation for maintaining positive relationships with the communities in which we operate may affect the outcome of any such prior consultation process involving approvals that we or Yanacocha seek for new projects. While we and Yanacocha are committed to operating in a socially responsible manner, there is no guarantee that our efforts in this regard will mitigate this potential risk. We and Yanacocha have implemented extensive community relations and security and safety initiatives to anticipate and manage social issues that may arise at our operations. See “Item 4. Information on the Company—Yanacocha—B. Business Overview—Social Development.”
In November 2011, construction activities at the Conga project were suspended at the request of Peru’s central government following increasing protests in Cajamarca by anti-mining activists led by the regional president. At the request of the Peruvian central government, the environmental impact assessment, or EIA, prepared in connection with the project, which was previously approved by the central government in October 2010, was reviewed by independent experts in an effort to resolve allegations surrounding the environmental viability of the Conga project. Construction was suspended for the duration of the review, except for sediment control work conducted in the project area. The report was released in April 2012. As of the date of this Annual Report, Yanacocha is evaluating the report’s findings. Progress continues on engineering and procurement work.
The Conga project is located within close proximity of existing operations at Yanacocha. Due to local political and community protests, construction and development activities at the Conga project were largely suspended in November 2011. The results of the Peruvian central government-initiated EIA independent review, announced on April 20, 2012, confirmed that Yanacocha’s initial EIA met Peruvian and international standards. The review made recommendations to provide additional water capacity and social funds, which Yanacocha has largely accepted. Yanacocha announced its decision to move the project forward on a “water first” basis on June 22, 2012, which consists of building the originally planned community water reservoirs prior to resuming any mine development. As a result, during 2013, the project will be focused on building water reservoirs, completing the remaining engineering activities, and accepting delivery of the main equipment purchases. Should Yanacocha be unable to continue with the current development plan at Conga, we or our mining partners in this project may reprioritize and reallocate capital to development alternatives, which may result in a potential accounting impairment. See “Item 4. Information on the Company—Yanacocha—B. Business Overview—Exploration.”
Factors Relating to Peru
Peruvian political conditions may have an adverse impact on our, Yanacocha’s and Cerro Verde’s business.
All of our, Yanacocha’s and Cerro Verde’s operations are conducted in Peru. Accordingly, our, Yanacocha’s and Cerro Verde’s business, financial condition or results of operations could be affected by changes in economic or other policies of the Peruvian government or other political, regulatory or economic developments in Peru.
During the past several decades, Peru has had a history of political instability that has included military coups and a succession of regimes with differing policies and programs. Past governments have frequently played an interventionist role in the nation’s economy and social structure. Among other things, past governments have imposed controls on prices, exchange rates and local and foreign investment as well as limitations on imports, restricted the ability of companies to dismiss employees, expropriated private sector assets (including mining companies) and prohibited the remittance of profits to foreign investors.
RegionalIn the second quarter of 2011, Presidential and Congressional elections resulted in Peru took placea change in October 2010, andgovernment in Peru. During the Peruvian general election took place in April 2011.third quarter of 2011, the new government enacted four new tax laws. During 2012, the new administration, under President Ollanta Humala, largely supported mining as a driver for the continued growth and future development of Gana Perú defeated Keiko Fujimori of Fuerza 2011 in a run-off election held in June 2011. Although President Humala had made statements during his 2006 presidential campaign indicating his intention to nationalize the mining sector, renegotiate what he considered unfair mining contracts and impose windfall profit taxes on mining activities, albeit without affecting competitiveness, his current government has generally taken positions promoting private investment.Peru. However, we are unable to predict whether the central government will continue to take similar positions in the future. Furthermore, the regional government in Cajamarca actively opposed the Conga project in 2012 and continues to reject the viability of its development. We cannot predict the future positions of either the central government positionsor regional governments on foreign investment, mining concessions, land tenure or other regulation. Any change in government positions or laws on these issues could adversely affect the assets and operations of us, Yanacocha or Conga, which could have a material adverse effect on our business, results of operations and financial position. Regulatory changes may include increased labor regulations, environmental regulationand other regulatory requirements, and additional taxes and royalties, and we may experience future protests, community demands and road blockages. Additionally, any inability to continue to develop the Conga project or taxation or assure you that the Humala government will maintainoperate at Yanacocha could have a generally favorablematerial adverse impact on our business, climateresults of operations and economic policies.
financial position if Yanacocha is not able to replace its expected production.
Inflation, reduced economic growth and fluctuations in the Nuevo Sol exchange rate may adversely affect our financial condition and results of operations.
Over the past several decades, Peru has experienced periods of high inflation, slow or negative economic growth and substantial currency devaluation. The inflation rate in Peru, as measured by theIndice de Precios al Consumidor, or IPC, and published byInstituto Nacional de Estadística e Informática, orINEI, has fallen from a high of 7,649.7 percent in 1990 to 4.72.6 percent in 2011.2012. The Peruvian currency has been devalued numerous times during the last 20 years. The devaluation rate has decreased from a high of 4,019.3 percent in 1990 to a revaluation of 3.85.5 percent in 2011.2012. Our revenues and operating expenses are primarily denominated in U.S. Dollars. If inflation in Peru were to increase without a corresponding devaluation of the Nuevo Sol relative to the U.S. Dollar, our financial position and results of operations, and the market price of our Common Shares and ADSs, could be affected. Although the Peruvian government’s stabilization plan has significantly reduced inflation, and the Peruvian economy has experienced strong growth in recent years, there can be no assurance that inflation will not increase from its current level or that such growth will continue in the future at similar rates or at all.
Among the economic circumstances that could lead to a devaluation would be the decline of Peruvian foreign reserves to inadequate levels. Peru’s foreign reserves at December 31, 20112012 were US$48.864.0 billion as compared to US$44.148.8 billion at December 31, 2010.2011. Although actual foreign reserves must be maintained at levels that will allow the succeeding government the ability to manage the Peruvian economy and to assure monetary stability in the near future, there can be no assurance that Peru will be able to maintain adequate foreign reserves to meet its foreign currency denominated obligations, or that Peru will not devalue its currency should its foreign reserves decline. See “Item 3. Key Information—A. Selected Financial Data—Exchange Rates.”
Peru’s current account deficit is being funded partially by foreign direct investment. There can be no assurance that foreign direct investment will continue at current levels, particularly if adverse political or economic developments in Peru arise, a development that may also contribute to devaluation pressure.
Deterioration in economic and market conditions in Latin America, Peru and other emerging market countries could affect the prices of our Common Shares and American Depositary Receipts.
The market for securities issued by Peruvian companies is influenced by economic and market conditions in Peru and, to varying degrees, market conditions in other Latin American and emerging market countries. Within Peru, news of Ollanta Humala’s June 5, 2011 victory in the presidential election was followed by a 12 percent decline in both the Lima stock exchange (Bolsa de Valores de Lima, or BVL) and BVL’s mining sub-index the following day. The price of our American Depositary Receipts, or ADRs, fell 15 percent. A number of banking analysts lowered their recommendations on Peruvian mining companies following the election as a result of concerns of higher taxes and delays in mining projects.
Although economic conditions are different in each country, the reaction of investors to developments in one country is likely to cause the capital markets in other countries to fluctuate. For example, political and economic events, such as the crises in Venezuela, Ecuador, Bolivia, Brazil and Argentina, have influenced investors’ perceptions of risk with regard to Peru. The negative investor reaction to developments in our neighboring countries may adversely affect the market for securities issued by countries in the region, cause foreign investors to decrease the flow of capital into Latin America and introduce uncertainty about plans for further integration of regional economies.
Peruvian exchange and investment control policies could affect dividends paid to holders of Common Shares and ADRs.
Peruvian law currently imposes no restrictions on the ability of companies operating in Peru to transfer foreign currency from Peru to other countries, to convert Peruvian currency into foreign currency or foreign currency into Peruvian currency or to remit dividends abroad, or on the ability of foreign investors to liquidate their investment and repatriate their capital. Prior to 1991, Peru had restrictive exchange controls and exchange rates. During the latter part of the 1980s, exchange restrictions prevented payment of dividends to our shareholders in the United States in U.S. Dollars. Accordingly, should such or similar controls be instituted, dividends paid to holders of Common Shares and, consequently, holders of ADRs, could be affected. There can be no assurance that the Peruvian government will continue to permit such transfers, remittances or conversion without restriction. See “Item 10. Additional Information—D. Exchange Controls.”
U.S. securities laws do not require us to disclose as much information to investors as a U.S. issuer is required to disclose, and you may receive less information about us than you might otherwise receive from a comparable U.S. company.
The corporate disclosure requirements applicable to us may not be equivalent to the requirements applicable to a U.S. company and, as a result, you may receive less information about us than you might otherwise receive in connection with a comparable U.S. company. We are subject to the periodic reporting requirements of the United States Securities Exchange Act of 1934, as amended, or the Exchange Act, that apply to “foreign private issuers.” The periodic disclosure required of foreign private issuers under the Exchange Act is more limited than the periodic disclosure required of U.S. issuers.
Holders of our securities may find it difficult to enforce judgments against us outside of Peru.
We are organized under the laws of Peru. A significant majority of our directors and officers reside outside the United States (principally in Peru). All or a substantial portion of our assets or the assets of such persons are located outside the United States. As a result, it may not be possible for investors to effect service of process within the United States upon us or upon such persons or to enforce against them in federal or state courts in the United States judgments predicated upon the civil liability provisions of the federal securities laws of the United States. We have been advised by our Peruvian counsel that there is uncertainty as to the enforceability, in original actions in Peruvian courts, of liabilities predicated solely under the United States federal securities laws and as to the enforceability in Peruvian courts of judgments of United States courts obtained in actions predicated upon the civil liability provisions of the United States federal securities laws.
Factors Relating to the Common Shares and ADSs
The concentration of our capital stock ownership with the Benavides Family will limit our stockholders’ ability to influence corporate matters.
The aggregate percentage of the economic interest of our outstanding share capital controlled by Alberto Benavides de la Quintana, our former Chairman and Chief Executive Officer, and held by certain members of his immediate and extended family and their spouses, or the Benavides Family, as of March 31, 20122013 was 27.2027.22 percent (including outstanding Common Shares and Investment Shares). Because of the significant ownership interest the Benavides Family holds in common shares and because the Investment Shares held by others do not have voting rights, the Benavides Family has the power to elect a significant number of the outstanding directors and has significant influence over the outcome of substantially all matters to be decided by a vote of shareholders.
In addition, under the terms of the Amended and Restated Deposit Agreement dated May 3, 2002, as further amended and restated as of November 12, 2003, among us, The Bank of New York Mellon (formerly The Bank of New York), as depositary, or the Depositary, and the owners and beneficial owners of ADSs, or the Amended and Restated Deposit Agreement, relating to our ADSs, if holders of ADSs do not provide the Depositary with timely instructions for the voting of Common Shares represented by such ADRs, the Depositary will be deemed to be instructed to give a person designated by us, which will likely be Alberto Benavides de la Quintana, a discretionary proxy to vote such shares, unless we inform the Depositary that we do not wish such proxy to be given.
Shareholders’ rights under Peruvian law may be fewer and less well-defined than shareholders’ rights in other countries, including the United States.
Our shareholders have fewer and less well-defined rights under applicable Peruvian law than they might have as shareholders of a corporation incorporated in a jurisdiction of the United States or certain other countries. For example, Peruvian law does not provide for proceedings by which non-controlling shareholders may file class action lawsuits or shareholder derivative actions against controlling shareholders or officers and directors, and the procedural requirements to file shareholder actions in Peru differ from those of the United States. As a result, holders of our shares may face difficulty enforcing their rights.
A sale of a substantial number of shares by the Benavides Family could have an adverse impact on the price of our Common Shares and ADSs.
Sales of a substantial number of our shares by members of the Benavides Family, or a market perception of the intention of members of the Benavides Family to sell a substantial number of shares, could materially and adversely affect prevailing market prices for the Common Shares and ADSs. There is no contractual restriction on the disposition of shares of our share capital by our shareholders, including the Benavides Family. Furthermore, under theLey General de Sociedades Peruana, or Peruvian Companies Law, any restriction on the free sale of shares in asociedad anónima abierta(open stock company) such as we are, is null and void.
Holders of ADSs may be unable to exercise preemptive rights and accretion rights available to the Common Shares underlying the ADSs.
Holders of the ADSs are, under Peruvian law, entitled to exercise preemptive rights and accretion rights on the Common Shares underlying the ADSs in the event of any future capital increase by us unless (x) the increase is approved, expressly stating that the shareholders have no preemptive rights to subscribe and pay for the Shares to be issued in such increase, by holders of Common Shares holding at least 40 percent of the Common Shares at a properly called meeting with a proper quorum and (y) the increase is not designed to improve directly or indirectly the shareholding of any shareholder. However, United States holders of ADSs may not be able to exercise through the Depositary for the ADSs the preemptive rights and accretion rights for Common Shares underlying their ADSs unless a registration statement under the Securities Act of 1933, as amended, or the Securities Act, is effective with respect to such rights or an exemption from the registration requirement thereunder is available. Any such rights offering would have a dilutive effect upon shareholders who are unable or unwilling to exercise their rights. We intend to evaluate, at the time of any rights offering, the costs and potential liabilities associated with any registration statement as well as the associated benefits of enabling the holders of ADSs to exercise such rights and will then make a decision as to whether to file such a registration statement. Therefore, no assurance can be given that we will file any such registration statement. To the extent that holders of ADSs are unable to exercise such rights because a registration statement has not been filed and no exemption from such registration statement under the Securities Act is available, the Depositary will, to the extent practicable, sell such holders’ preemptive rights or accretion rights and distribute the net proceeds thereof, if any, to the holders of ADSs, and such holders’ equity interest in us will be diluted proportionately. The Depositary has discretion to make rights available to holders of ADSs or to dispose of such rights and to make any net proceeds available to such holders. If, by the terms of any rights offering or for any other reason, the Depositary is not able to make such rights or such net proceeds available to any holder of ADSs, the Depositary may allow the rights to lapse.
ITEM 4. Information on the Company
In this Item 4, we present information first with respect to Buenaventura, followed by information with respect to Yanacocha, in which we have a 43.65 percent partnership interest.
BUENAVENTURA
A. History and Development
Overview
We are Peru’s largest publicly traded precious metals company and are engaged in the exploration, mining and processing of gold, silver and, to a lesser extent, other metals in Peru. We currently operate the Julcani, Recuperada, Orcopampa, Poracota, Uchucchacua, Antapite, Ishihuinca, Shila-Paula, Mallay and Shila-PaulaBreapampa mines and have controlling interests in three other mining companies which operate the Colquijirca, Marcapunta, Tantahuatay and La Zanja mines.We also own an electric power transmission company and an engineering services consulting company and have non-controlling interests in several other mining companies, including a significant ownership interest in Yanacocha, a Peruvian partnership that operates South America’s largest gold mine, and Cerro Verde, a Peruvian company that operates a copper mine located in the south of Peru. For the year ended December 31, 2011,2012, our consolidated net sales were US$1,493.91,496 million and our consolidated net income was US$960.5million.684.7million. The tables below summarize the total production and our equity share of production for the Julcani, Recuperada, Orcopampa, Poracota, Uchucchacua, Antapite, Ishihuinca, Shila-Paula, Colquijirca and Marcapunta,Mallay, Breapampa, Colquijirca-Marcapunta, La Zanja, Tantahuatay, Yanacocha and Cerro Verde mines for the year ended December 31, 2011:2012:
| TOTAL PRODUCTION | BUENAVENTURA’S EQUITY SHARE OF PRODUCTION | TOTAL PRODUCTION | BUENAVENTURA’S EQUITY SHARE OF PRODUCTION | |||||||||||||||||||||||||||||||||||||||||||||||||||||||||||||||||||||||||||||||||||||
| UNIT | Buenaventura’s Equity Ownership | Silver Oz | Gold Oz | Lead DST | Zinc DST | Copper DST | Silver Oz | Gold Oz | Lead DST | Zinc DST | Copper DST | Buenaventura’s Equity Ownership | Silver Oz | Gold Oz | Lead DST | Zinc DST | Copper DST | Silver Oz | Gold Oz | Lead DST | Zinc DST | Copper DST | ||||||||||||||||||||||||||||||||||||||||||||||||||||||||||||||||||
| Orcopampa | 100 | % | 320,964 | 285,200 | - | - | - | 320,964 | 285,200 | - | - | - | 100 | % | 425,620 | 260,379 | - | - | - | 425,620 | 260,379 | - | - | - | ||||||||||||||||||||||||||||||||||||||||||||||||||||||||||||||||
| Poracota | 100 | % | 43,092 | 49,201 | - | - | - | 43,092 | 49,201 | - | - | - | 100 | % | 16,181 | 19,238 | - | - | - | 16,181 | 19,238 | - | - | - | ||||||||||||||||||||||||||||||||||||||||||||||||||||||||||||||||
| Uchucchacua | 100 | % | 10,090,337 | - | 8,319 | 7,351 | - | 10,090,337 | - | 8,319 | 7,351 | - | 100 | % | 11,263,322 | - | 9,636 | 10,824 | - | 11,263,322 | - | 9,636 | 10,824 | - | ||||||||||||||||||||||||||||||||||||||||||||||||||||||||||||||||
| Julcani | 100 | % | 2,428,330 | 2,051 | 2,065 | - | 394 | 2,428,330 | 2,051 | 2,065 | - | 394 | 100 | % | 2,438,084 | 1,220 | 2,529 | - | 423 | 2,438,084 | 1,220 | 2,529 | - | 423 | ||||||||||||||||||||||||||||||||||||||||||||||||||||||||||||||||
| Recuperada | 100 | % | 498,424 | - | 3,213 | 3,581 | - | 498,424 | - | 3,213 | 3,581 | - | 100 | % | 467,475 | - | 3,516 | 4,898 | - | 467,475 | - | 3,516 | 4,898 | - | ||||||||||||||||||||||||||||||||||||||||||||||||||||||||||||||||
| Antapite | 100 | % | 33,521 | 28,588 | - | - | - | 33,521 | 28,588 | - | - | - | 100 | % | 13,254 | 11,720 | - | - | - | 13,254 | 11,720 | - | - | - | ||||||||||||||||||||||||||||||||||||||||||||||||||||||||||||||||
| Ishihuinca | 100 | % | - | 1,773 | - | - | 27 | - | 1,773 | - | - | 27 | 100 | % | - | 4,016 | - | - | 22 | - | 4,016 | - | - | 22 | ||||||||||||||||||||||||||||||||||||||||||||||||||||||||||||||||
| Shila-Paula | 100 | % | 34,833 | 14,594 | - | - | - | 34,833 | 14,594 | - | - | - | 100 | % | 95,485 | 19,359 | - | - | - | 95,485 | 19,359 | - | - | - | ||||||||||||||||||||||||||||||||||||||||||||||||||||||||||||||||
| Colquijirca and Marcapunta | 53.76 | % | 2,911,749 | 8,498 | 10,432 | 25,968 | 26,231 | 1,565,356 | 4569 | 5,608 | 13,960 | 14,102 | ||||||||||||||||||||||||||||||||||||||||||||||||||||||||||||||||||||||||||||
| Mallay | 100 | % | 682,708 | 107 | 4,952 | 6,711 | - | 682,708 | 107 | 4,952 | 6,711 | - | ||||||||||||||||||||||||||||||||||||||||||||||||||||||||||||||||||||||||||||
| Breapampa | 100 | % | 17,212 | 8,817 | - | - | - | 17,212 | 8,817 | - | - | - | ||||||||||||||||||||||||||||||||||||||||||||||||||||||||||||||||||||||||||||
| Colquijirca & Marcapunta | 53.76 | % | 3,077,606 | 10,229 | 13,590 | 38,525 | 26,696 | 1,654,521 | 5,499 | 7,306 | 20,711 | 14,352 | ||||||||||||||||||||||||||||||||||||||||||||||||||||||||||||||||||||||||||||
| La Zanja | 53.06 | % | 363,927 | 134,190 | - | - | - | 193,100 | 71,201 | - | - | - | 53.06 | % | 387,877 | 112,387 | - | - | - | 205,808 | 59,633 | - | - | - | ||||||||||||||||||||||||||||||||||||||||||||||||||||||||||||||||
| Tantahuatay | 40.00 | % | 260,073 | 46,164 | - | - | - | 104,029 | 18,466 | - | - | - | 40.06 | % | 919,343 | 141,268 | - | - | - | 367,737 | 56,507 | - | - | - | ||||||||||||||||||||||||||||||||||||||||||||||||||||||||||||||||
| Yanacocha | 43.65 | % | 1,348,004 | 1,293,123 | - | - | - | 588,404 | 564,448 | - | - | - | 43.65 | % | 553,092 | 1,345,992 | - | - | - | 241,425 | 587,526 | - | - | - | ||||||||||||||||||||||||||||||||||||||||||||||||||||||||||||||||
| Cerro Verde | 19.35 | % | 1,749,611 | - | - | - | 313,658 | 338,550 | - | - | - | 60,693 | 19.58 | % | 2,134,632 | - | - | - | 307,594 | 417,961 | - | - | - | 60,227 | ||||||||||||||||||||||||||||||||||||||||||||||||||||||||||||||||
| TOTAL PRODUCTION | TOTAL PRODUCTION | 20,083,463 | 1,863,388 | 24,029 | 36,900 | 340,310 | 16,239,538 | 1,040,097 | 19,205 | 24,892 | 75,216 | 22,491,891 | 1,934,732 | 34,223 | 60,958 | 334,735 | 18,306,793 | 1,034,021 | 27,939 | 43,144 | 75,024 | |||||||||||||||||||||||||||||||||||||||||||||||||||||||||||||||||||
Compañía de Minas Buenaventura S.A.A., asociedad anónima abierta (open stock company) under the laws of Peru,was originally established in 1953 as asociedad anónima (company) under the laws of Peru, and currently operates under the laws of Peru. Our registered office is located at Carlos Villarán 790, Santa Catalina, La Victoria, Lima 13, Perú, telephone no. 5-11-419-2500. Our Internet website address is http://www.buenaventura.com. The information on our website is not a part of, and is not incorporated into, this document.
History
During the first several decades of our operations, we focused on the exploration and development of silver mines in Peru, including our Julcani, Orcopampa and Uchucchacua mines. Beginning in the early 1980s, we began to explore for gold and other metals in Peru to diversify our business and reduce our dependence on silver. We expanded our mineral reserves through property acquisition and intensive exploration programs designed to increase reserves and production of gold. We also conducted exploration leading to the discovery of gold mineralization and subsequent production of gold at our Orcopampa, Shila, Ishihuinca and Antapite mines. In addition, we made significant equity investments in Yanacocha, which operates South America’s largest gold mine, and Cerro Verde, which operates an open-pit copper mine in Peru. As a result of these initiatives, the majority of our revenues are now derived from the production of gold. In 2011,2012, gold, copper, silver and other metals accounted for 5759 percent, 2219 percent, 18 percent and 34 percent, respectively, of our equity share of revenues from our consolidated subsidiaries and our equity investees, Yanacocha, Cerro Verde and Compañía Minera Coimolache S.A., or Coimolache.
Business Strategy
Our strategy is to sustain our position as Peru’s largest, publicly-traded gold and silver mining company by expanding our reserves and production. We are currently engaged in an active exploration and mine development program and participate in several mining exploration projects with Newmont Mining, Minera Gold Fields Peru S.A., or Gold Fields, and Southern Copper Corporation, or SCC. In addition, we seek to increase the efficiency and capacity of our mining operations. We are aware of our social and environmental responsibilities and aim to excel in the prevention, mitigation and rehabilitation of mining-related disturbances.
Maintaining an Active Exploration Program
We view an active exploration program as our primary means to obtain new reserves. As of December 31, 2011,2012, we hold and currently evaluate, either directly or in conjunction with exploration partners, 360,383230,896 hectares of mining rights, excluding an additional 305,972hectares443,393hectares in mining properties which are consolidated in our production units, including our La Zanja, Compañía Minera Colquirrumi S.A., or Colquirrumi, and Compañía de Exploraciones, Desarrollo e Inversiones Mineras S.A.C., or Cedimin, subsidiaries and our equity investee, Coimolache.
During 2011,2012, we spent approximately US$21.195.5 million on “greenfield” and US$27.0153.0 million on “brownfield” exploration-related investments primarily in Peru and, to a lesser extent, in Chile and Mexico. Our “greenfield” investments mainly focused on the following exploration projects: Trapiche, Tambomayo, San Gregorio, Chancas, Hualgayoc, Marcapunta, Colquemayo, Pachuca Norte (Mexico), Vacas Heladas (Chile), Pisqahuanca, Trapiche, Hualgayoc,Surichata and El Faique, Terciopelo, Chaje and Surichata.Faique. Our “brownfield” investments were mainly focused onin the following exploration projects in 2011:Orcopampa, Poracota, Uchucchacua, Antapite, Mallay, Yumpag, Huamani Huayta, TambomayoRecuperada and Parihuanas.Julcani areas. We financed our 20112012 exploration program with internal funds.
In 2012,2013, we intend to invest approximately US$30.6100 to US$120 million in the Mallay, Tambomayo, Huamanihuayta, San Francisco Parihuanas, Pucay, Chanca and Yumpagbrownfieldbrownfield exploration projects. In 2012,2013, we expect to invest approximately US$22.670 to US$80 million, mainly in the following greenfield exploration projects: Tambomayo, Trapiche, San Gregorio, Hualgayoc, Colquemayo and El Faique, Vacas Heladas, Ccaccapaqui-Bx Andrea, Surichata and Costa Sur. We also expect to invest approximately US$10.8 million in the Trapiche and Hualgayoc exploration projects during 2012.
among others.
Participation in Mining Exploration Agreements
In addition to managing and operating precious metals mines, we participate in mining exploration agreements with mining partners to reduce risks, gain exposure to new technologies and diversify revenues to include other base metals, such as copper and zinc. See “—B. Business Overview—Exploration.” We believe that maintaining our focus on mining operations complements our partnership strategy because the engineering and geological expertise gained from such operations enhances our ability to participate in and contribute to those projects.
Capital Expenditures
Our capital expenditures in the past three years have related principally to the acquisition of new mining properties, construction of new facilities and renewal of plant and equipment. Capital expenditures relating to exploration are not included in the table below and are discussed separately in “—B. Business Overview—Exploration.” Set forth below is information concerning capital expenditures incurred by us in respect of each of our principal operating mines (not including capital expenditures for administrative purposes or other non-mining subsidiaries) and by category of expenditure:
| Year Ended December 31,(a) | ||||||||||||
| 2009 | 2010 | 2011 | ||||||||||
| (in thousands) | ||||||||||||
| Julcani | US$ | 765 | US$ | 853 | US$ | 1,967 | ||||||
| Uchucchacua | 7,157 | 11,781 | 10,689 | |||||||||
| Orcopampa(b) | 8,163 | 17,490 | 26,859 | |||||||||
| Recuperada | 1,172 | 1,284 | 1,100 | |||||||||
| Ishihuinca | 9 | 17 | 3 | |||||||||
| Shila-Paula | 1,134 | 1,429 | 2,415 | |||||||||
| Colquijirca and Marcapunta(c) | 72,389 | 70,974 | 151,392 | |||||||||
| Antapite | 49 | 302 | 750 | |||||||||
| Conenhua | 1,283 | 3,204 | 4,668 | |||||||||
| Mallay | - | 7,735 | 36,058 | |||||||||
| Breapampa | - | - | 20,314 | |||||||||
| La Zanja | 26,481 | 48,998 | 34,043 | |||||||||
| Huanza | 6,492 | 62,828 | 60,102 | |||||||||
| Total | US$ | 125,094 | US$ | 226,895 | US$ | 350,360 | ||||||
| Year Ended December 31, | ||||||||||||
| 2010 | 2011 | 2012 | ||||||||||
| (in thousands) | ||||||||||||
| Julcani | US$ | 853 | US$ | 1,967 | US$ | 3,549 | ||||||
| Uchucchacua | 11,781 | 10,689 | 18,379 | |||||||||
| Orcopampa(a) | 17,490 | 26,859 | 19,047 | |||||||||
| Recuperada | 1,284 | 1,100 | 2,224 | |||||||||
| Ishihuinca | 17 | 3 | 139 | |||||||||
| Shila-Paula | 1,429 | 2,415 | 3,012 | |||||||||
| Colquijirca and Marcapunta(a) | 70,974 | 64,013 | 86,384 | |||||||||
| Antapite | 302 | 750 | 1,126 | |||||||||
| Conenhua | 3,204 | 4,668 | 5,760 | |||||||||
| Mallay | 7,735 | 36,058 | 18,687 | |||||||||
| Breapampa | - | 20,314 | 37,004 | |||||||||
| La Zanja | 48,998 | 34,043 | 75,742 | |||||||||
| Huanza | 62,828 | 60,102 | 66,378 | |||||||||
| Río Seco | - | 23,574 | 62,163 | |||||||||
| Total | US$ | 226,895 | US$ | 286,555 | US$ | 399,594 | ||||||
| Year Ended December 31,(a) | Year Ended December 31,(a) | |||||||||||||||||||||||
| 2009 | 2010 | 2011 | 2010 | 2011 | 2012 | |||||||||||||||||||
| (in thousands) | (in thousands) | |||||||||||||||||||||||
| Machinery and equipment | US$ | 4,796 | US$ | 12,658 | US$ | 4,534 | US$ | 12,658 | US$ | 5,622 | US$ | 3,462 | ||||||||||||
| Infrastructure | 114,201 | 187,534 | 287,669 | 187,534 | 222,743 | 311,864 | ||||||||||||||||||
| Mining | 1,102 | 7,624 | 23,325 | 7,624 | 23,325 | 2,620 | ||||||||||||||||||
| Milling | 2,192 | 13,754 | 5,533 | 13,754 | 5,533 | 3,751 | ||||||||||||||||||
| Transportation | 159 | 1,108 | 631 | 1,108 | 664 | 316 | ||||||||||||||||||
| Communications | 118 | 309 | 71 | 309 | 71 | 562 | ||||||||||||||||||
| Environmental | 0 | 249 | 105 | 249 | 105 | 1,496 | ||||||||||||||||||
| Other | 2,526 | 3,659 | 28,492 | 3,659 | 28,492 | 75,523 | ||||||||||||||||||
| Total | US$ | 125,094 | US$ | 226,895 | US$ | 350,360 | US$ | 226,895 | US$ | 286,555 | US$ | 399,594 | ||||||||||||
| (a) |
| For 2010, 2011 and |
We financed our capital expenditures in 2009, 2010, 2011 and 20112012 with internally-generated funds and a US$119 million financial lease agreement, which was used to finance construction of the Huanza hydroelectric power station. See “Item 5. Operating and Financial Review and Prospects—Buenaventura—B. Liquidity and Capital Resources—Long-Term Debt.”
We have budgeted approximately US$250300 million for capital expenditures for 2012.2013. We continuously evaluate opportunities to expand our business within Peru, as well as in other countries as opportunities arise, and expect to continue to do so in the future. We may in the future decide to acquire part or all of the equity of, or undertake other transactions with, other companies involved in the same business as us or in other related businesses. However, there can be no assurance that we will decide to pursue any such new activity or transaction.
B. Business Overview
Production
We principally produce refined gold and silver, either as concentrates or doré bars, or concentrates, and other metals such as lead, zinc and copper as concentrates that we distribute and sell locally and internationally. The following table sets forth the production of the Antapite, Julcani, Uchucchacua, Orcopampa, Poracota, Recuperada, Mallay, Breapampa, Ishihuinca, Colquijirca, Marcapunta, La Zanja and Shila-Paula mines by type of product for the last three years, calculated in each case on the basis of 100 percent of the applicable mine’s production. Production from Cerro Verde, Yanacocha and Tantahuatay are not included in these production figures.
Year Ended December 31,(1) | Year Ended December 31,(1) | |||||||||||||||||||||||
| 2009 | 2010 | 2011 | 2010 | 2011 | 2012 | |||||||||||||||||||
| Gold (oz.)(2) | 426,465 | 481,768 | 524,101 | 481,768 | 524,101 | 447,472 | ||||||||||||||||||
| Silver (oz.) | 16,824,190 | 14,840,678 | 16,724,717 | 14,840,678 | 16,724,717 | 18,884,824 | ||||||||||||||||||
| Zinc (ST)(3) | 85,464 | 49,151 | 36,900 | 49,151 | 36,900 | 60,958 | ||||||||||||||||||
| Lead (ST) | 34,867 | 27,145 | 24,029 | 27,145 | 24,029 | 34,223 | ||||||||||||||||||
| Copper (ST) | 9,140 | 19,012 | 26,652 | 19,012 | 26,652 | 27,141 | ||||||||||||||||||
| (1) | The amounts in this table reflect the total production of all of our consolidated subsidiaries, including El Brocal and La Zanja, in which we owned a 53.76% and 53.06% controlling equity interest, respectively, as of December 31, |
| (2) | Throughout this Annual Report, “oz.” refers to troy ounces of a fineness of 999.9 parts per 1,000, equal to 31.0135 grams. |
| (3) | Throughout this Annual Report, “ST” refers to short tons, each weighing 2,000avoirdupois pounds. |
Exploration
We view exploration as our primary means of generating growth value for shareholders and typically maintain a portfolio of active exploration projects at various stages of exploration for mineral resources in Peru. We currently hold, either directly or in conjunction with exploration partners, 360,383230,896 hectares of mining rights as part of our exploration program. We hold an additional 305,972443,393 hectares in mining properties which are consolidated in our production units. We invested approximately US$21.195.4 million in exploration forMineralized Material Not in Reserve, or NRM,during 2011,2012, including exploration related to the Trapiche, Tambomayo, San Gregorio, Chancas, Hualgayoc, Marcapunta, Colquemayo, Pachuca Norte (Mexico), Vacas Heladas (Chile), Pisqahuanca, Trapiche, Hualgayoc,Surichata and El Faique Terciopelo, Chaje and Surichata projects. In addition, our exploration partners invested US$1.5million in the Hualgayoc project and US$33.5 million in the Chucapaca project.
In 2012,2013, we expect to invest approximately US$70170.0 to US$90200.0 million in greenfield exploration and brownfield exploration activities. Exploration programs at our principal operating mines are not included in our exploration budget and are accounted for as part of the operating costs for each mine. Exploration expenditures in greenfield and brownfield projects include all of the costs associated with geologists, contractors, engineering, drilling equipment, metallurgical testing and environmental, social, engineering and economic feasibility studies. Our exploration team prepares programs and budgets for individual projects each year and we allocate, subject to board approval, the proper amount to finance each particular exploration activity considered worthwhile. In light of the nature of mining exploration and in order to maintain flexibility to take advantage of opportunities, we allocate budgeted amounts by property or project only in the case of high geological expectation as decided by management.We also allocate non-budgeted amounts over the course of the year to new projects based on factual results, our needs and our geologists’ periodic evaluations and opinions regarding the progress of each opportunity and its potential for further exploration of minerals.
An integral part of our exploration program is the participation in mining exploration agreements with affiliates of experienced mining companies, including Newmont Peru S.R.L., Compañía Minera Barrick Chile Limitada, Southern Copper Corporation, Gold Fields La Cima and Minera Gold Fields Peru S.A. The benefits of these joint exploration projects include greater investment in the exploration of our mining rights from the funds contributed by the partners, access to the assets of the partners without the costs and risks of outright acquisition, increased exposure to new exploration technologies and expansion of knowledge and sharing of experiences of management, geologists and engineers. In these mining exploration agreements, we may be the designated operator, an equity participant, the manager or a combination of these and other functions.
We generally do not conduct significant research and development activities other than our investments in geological research and exploration as described herein.
The following table lists our current mine development projects, our effective participation in each project, our partners with respect to each project, the total hectares in each project, observed mineralization of each project and exploration expenditures for each project during 2009, 2010, 2011 and 2011.2012.
Exploration Projects | Buenaventura’s Effective Participation | Principal Partners | Property Hectares | Observed Mineralization | Total Exploration Expenditures During 2010 | Total Exploration Expenditures During 2011 | Total Exploration Expenditures During 2012 | |||||||||||||||||||||||||||||
At March 31, 2013 | Total (Buenaventura and Partners) | Buenaventura | Total (Buenaventura and Partners) | Buenaventura | Total (Buenaventura and Partners) | Buenaventura | ||||||||||||||||||||||||||||||
| (US$ in millions) | (US$ in millions) | (US$ in millions) | ||||||||||||||||||||||||||||||||||
| Buenaventura’s Projects: | ||||||||||||||||||||||||||||||||||||
| Breapampa(1) | 100.00 | % | None | 41,866 | Gold & silver | 1.05 | 1.05 | 4.70 | 4.70 | 0.40 | 0.40 | |||||||||||||||||||||||||
| Mallay(2) | 100.00 | % | None | 7,030 | Silver, lead & zinc | 9.78 | 9.78 | 10.30 | 10.30 | 8.0 | 8.0 | |||||||||||||||||||||||||
| 99,459 | 12.74 | 11.84 | 15.77 | 15.41 | 1.20 | 1.20 | ||||||||||||||||||||||||||||||
Exploration Projects | Buenaventura’s Effective Participation | Principal Partners | Property Hectares | Observed Mineralization | Total Exploration Expenditures During 2009 | Total Exploration Expenditures During 2010 | Total Exploration Expenditures During 2011 | |||||||||||||||||||||||||||||
| At March 31, 2012 | Total (Buenaventura and Partners) | Buenaventura | Total (Buenaventura and Partners) | Buenaventura | Total (Buenaventura and Partners) | Buenaventura | ||||||||||||||||||||||||||||||
| (US$ in millions) | (US$ in millions) | (US$ in millions) | ||||||||||||||||||||||||||||||||||
| Joint Venture Projects: | ||||||||||||||||||||||||||||||||||||
| La Zanja(1) | 53.06 | % | Newmont | 32,821 | Gold & copper | 1.29 | 0.68 | 1.91 | 1.01 | 1.24 | 0.66 | |||||||||||||||||||||||||
| Tantahuatay(2) | 40.10 | % | SCC, Espro | 17,742 | Gold & copper | 3.59 | 2.01 | - | - | - | - | |||||||||||||||||||||||||
| Buenaventura’s Projects: | ||||||||||||||||||||||||||||||||||||
| Breapampa(3) | 100.00 | % | None | 41,866 | Gold & silver | 3.24 | 3.24 | 1.05 | 1.05 | 4.70 | 4.70 | |||||||||||||||||||||||||
| Mallay(4) | 100.00 | % | None | 7,030 | Silver, lead & zinc | 6.12 | 6.12 | 9.78 | 9.78 | 10.30 | 10.30 | |||||||||||||||||||||||||
| 99,459 | 14.24 | 12.05 | 12.74 | 11.84 | 15.77 | 15.41 | ||||||||||||||||||||||||||||||
_____________________________
| (1) |
| Prior to 2010, Breapampa was classified as a greenfield exploration project. |
| Prior to 2010, Mallay was classified as a brownfield exploration project. Includes 2010 Tinta, Condorsenja and Isguiz exploration costs. |
The following table lists our current greenfield exploration projects, our effective participation in each project, our partners with respect to each project, the total hectares in each project, observed mineralization of each project and the exploration expenditures for each project during 2009, 2010, 2011 and 2011.2012.
Exploration Projects(1)(2) | Buenaventura’s Effective Participation | Principal Partners | Property Hectares | Observed Mineralization | Total Exploration Expenditures During 2009 | Total Exploration Expenditures During 2010 | Total Exploration Expenditures During 2011 | |||||||||||||||||||||||||||||
| at March 31, 2012 | Total (Buenaventura and Partners) | Buenaventura | Total (Buenaventura and Partners) | Buenaventura | Total (Buenaventura and Partners) | Buenaventura | ||||||||||||||||||||||||||||||
| (US$ in millions) | (US$ in millions) | (US$ in millions) | ||||||||||||||||||||||||||||||||||
| Joint Venture Projects: | ||||||||||||||||||||||||||||||||||||
| Ccalla Arma | 60.00 | % | Sumitomo | 0 | Gold & copper | 0.46 | 0.28 | - | - | - | - | |||||||||||||||||||||||||
| Chucapaca(5) | 49.00 | % | Gold Fields | 12,900 | Gold & copper | 7.01 | 0.74 | 21.18 | 10.38 | 65.73 | 32.21 | |||||||||||||||||||||||||
| Hualgayoc | 50.00 | % | Gold Fields | 12,720 | Silver, zinc & lead | 1.01 | 0.51 | 0.65 | 0.32 | 2.98 | 1.49 | |||||||||||||||||||||||||
| Lucanas | 60.00 | % | Sumitomo | 10,900 | Copper & gold | - | - | 0.19 | 0.12 | - | - | |||||||||||||||||||||||||
| Buenaventura’s Projects: | ||||||||||||||||||||||||||||||||||||
| Chaje | 100.00 | % | None | 18,400 | Gold | - | - | 1.05 | 1.05 | 0.21 | 0.21 | |||||||||||||||||||||||||
| Colquemayo | 100.00 | % | None | 28,800 | Gold, silver & copper | - | - | 2.46 | 2.46 | 4.29 | 4.29 | |||||||||||||||||||||||||
| El Faique | 100.00 | % | None | 13,209 | Copper, zinc & gold | 0.39 | 0.39 | 0.49 | 0.49 | 0.62 | 0.62 | |||||||||||||||||||||||||
| Pachuca Norte | 100.00 | % | None | 31,000 | Silver & gold | - | - | - | - | 4.02 | 4.02 | |||||||||||||||||||||||||
| Pisqahuanca(3) | 70.00 | % | None | 0 | Silver & gold | - | - | 0.18 | 0.18 | 1.65 | 1.65 | |||||||||||||||||||||||||
| Terciopelo | 100.00 | % | None | 4,200 | Gold & copper | 0.58 | 0.58 | 1.36 | 1.36 | 0.14 | 0.14 | |||||||||||||||||||||||||
| Trapiche | 100.00 | % | None | 37,291 | Copper & molybdenum | 3.16 | 3.16 | 1.39 | 1.39 | 3.10 | 3.10 | |||||||||||||||||||||||||
| Vacas Heladas | 100.00 | % | None | 910 | Gold & silver | - | - | - | - | 2.17 | 2.17 | |||||||||||||||||||||||||
| Others(4) | 100.00 | % | None | 85,068 | Gold & polymetallic | 3.44 | 3.44 | - | - | 3.55 | 3.55 | |||||||||||||||||||||||||
| 215,350 | 12.61 | 5.66 | 28.95 | 17.75 | 88.46 | 53.45 | ||||||||||||||||||||||||||||||
Exploration Projects(1)(2) | Buenaventura’s Effective Participation | Principal Partners | Property Hectares | Observed Mineralization | Total Exploration Expenditures During 2010 | Total Exploration Expenditures During 2011 | Total Exploration Expenditures During 2012 | |||||||||||||||||||||||||||||
at March 31, 2013 | Total (Buenaventura and Partners) | Buenaventura | Total (Buenaventura and Partners) | Buenaventura | Total (Buenaventura and Partners) | Buenaventura | ||||||||||||||||||||||||||||||
| (US$ in millions) | (US$ in millions) | (US$ in millions) | ||||||||||||||||||||||||||||||||||
| Joint Venture Projects: | ||||||||||||||||||||||||||||||||||||
| Hualgayoc | 50.00 | % | Gold Fields | 15,417 | Silver, zinc & lead | 0.65 | 0.32 | 2.98 | 1.49 | 3.60 | 1.80 | |||||||||||||||||||||||||
| Lucanas | 60.00 | % | Sumitomo | 0 | Copper & gold | 0.19 | 0.12 | - | - | — | — | |||||||||||||||||||||||||
Exploration Projects(1)(2) | Buenaventura’s Effective Participation | Principal Partners | Property Hectares | Observed Mineralization | Total Exploration Expenditures During 2010 | Total Exploration Expenditures During 2011 | Total Exploration Expenditures During 2012 | |||||||||||||||||||||||||||||
at March 31, 2013 | Total (Buenaventura and Partners) | Buenaventura | Total (Buenaventura and Partners) | Buenaventura | Total (Buenaventura and Partners) | Buenaventura | ||||||||||||||||||||||||||||||
| (US$ in millions) | (US$ in millions) | (US$ in millions) | ||||||||||||||||||||||||||||||||||
| Buenaventura’s Projects: | ||||||||||||||||||||||||||||||||||||
| Chaje | 100.00 | % | None | 18,400 | Gold | 1.05 | 1.05 | 0.21 | 0.21 | 0.02 | 0.02 | |||||||||||||||||||||||||
| Colquemayo | 100.00 | % | None | 28,800 | Gold, silver & copper | 2.46 | 2.46 | 4.29 | 4.29 | 4.33 | 4.33 | |||||||||||||||||||||||||
| El Faique | 100.00 | % | None | 13,209 | Copper, zinc & gold | 0.49 | 0.49 | 0.62 | 0.62 | 0.96 | 0.96 | |||||||||||||||||||||||||
| Pachuca Norte | 100.00 | % | None | 31,000 | Silver & gold | - | - | 4.02 | 4.02 | 0.00 | 0.00 | |||||||||||||||||||||||||
| Pisqahuanca(3) | 70.00 | % | None | 0 | Silver & gold | 0.18 | 0.18 | 1.65 | 1.65 | - | - | |||||||||||||||||||||||||
| Surichata | 100.00 | % | None | 700 | Silver, zinc & lead | - | - | 0.38 | 0.38 | 1.28 | 1,28 | |||||||||||||||||||||||||
| Terciopelo(4) | 100.00 | % | None | 0 | Gold & copper | 1.36 | 1.36 | 0.14 | 0.14 | - | - | |||||||||||||||||||||||||
| Trapiche | 100.00 | % | None | 37,291 | Copper & molybdenum | 1.39 | 1.39 | 3.10 | 3.10 | 15.91 | 15.91 | |||||||||||||||||||||||||
| Others(5) | 100.00 | % | None | 172,577 | Gold & polymetallic | - | - | 3.55 | 3.55 | 6.65 | 4.85 | |||||||||||||||||||||||||
| 301,977 | 28.95 | 17.75 | 88.46 | 53.45 | 29.15 | 27.35 | ||||||||||||||||||||||||||||||
| (1) | This table does not include projects abandoned by us, consolidated mining units or those placed on hold prior to |
| (2) | In addition to these projects, we continue to conduct exploration at all of our operating mines and our subsidiaries. |
| (3) | This project was terminated in 2011. |
| (4) | This project was terminated in 2012. |
| (5) | Includes generative exploration in new areas. |
The following table lists our current brownfield exploration projects, our effective participation in each project, the total hectares in each project, observed mineralization of each project and the exploration expenditures for each project during 2009, 2010, 2011 and 2011.2012.
Exploration Projects | Company’s Effective Participation | Principal Partners | Property Hectares | Observed Mineralization | Total Exploration Expenditures During 2009 | Total Exploration Expenditures During 2010 | Total Exploration Expenditures During 2011 | |||||||||||||||||||||||||||||
| at March 31, 2012 | Total (Buenaventura and Partners) | Buenaventura | Total (Buenaventura and Partners) | Buenaventura | Total (Buenaventura and Partners) | Buenaventura | ||||||||||||||||||||||||||||||
| (US$ in millions) | (US$ in millions) | (US$ in millions) | ||||||||||||||||||||||||||||||||||
| Brownfield Projects: | ||||||||||||||||||||||||||||||||||||
| Yumpag(1) | 100.00 | % | None | 1,847 | Silver, lead & zinc | - | - | 0.75 | 0.75 | 1.25 | 1.25 | |||||||||||||||||||||||||
| Anamaray(2) | 100.00 | % | None | 6,583 | Zinc, lead & silver | 1.00 | 1.00 | 0.64 | 0.64 | 1.70 | 1.70 | |||||||||||||||||||||||||
| Mallay(3) | 100.00 | % | None | 2,300 | Zinc, lead & silver | 6.12 | 6.12 | 9.78 | 9.78 | 10.32 | 10.32 | |||||||||||||||||||||||||
| Chanca(4) | 100.00 | % | None | 3,880 | Silver | - | - | 1.40 | 1.40 | 3.69 | 3.69 | |||||||||||||||||||||||||
| Julcani-Recuperada(5) | 100.00 | % | None | 4,800 | Silver | 2.47 | 2.47 | 0.72 | 0.72 | 0.14 | 0.14 | |||||||||||||||||||||||||
| Antapite | 100.00 | % | None | 22,075 | Gold | 1.61 | 1.61 | 0.14 | 0.14 | - | - | |||||||||||||||||||||||||
| Poracota(6) | 100.00 | % | None | 6,680 | Gold & silver | 1.24 | 1.24 | 0.78 | 0.78 | 0.94 | 0.94 | |||||||||||||||||||||||||
| Orcopampa(7) | 100.00 | % | None | 18,000 | Gold & silver | 0.97 | 0.97 | 2.91 | 2.91 | 2.41 | 2.41 | |||||||||||||||||||||||||
| Shila-Paula(8) | 100.00 | % | None | 30,700 | Gold & silver | 0.58 | 0.58 | 1.90 | 1.90 | 6.57 | 6.57 | |||||||||||||||||||||||||
| 96,865 | 13.99 | 13.99 | 19.01 | 19.01 | 27.02 | 27.02 | ||||||||||||||||||||||||||||||
Exploration Projects | Buenaventura’s Effective Participation | Principal Partners | Property Hectares | Observed Mineralization | Total Exploration Expenditures During 2010 | Total Exploration Expenditures During 2011 | Total Exploration Expenditures During 2012 | |||||||||||||||||||||||||||||
at March 31, 2013 | Total (Buenaventura and Partners) | Buenaventura | Total (Buenaventura and Partners) | Buenaventura | Total (Buenaventura and Partners) | Buenaventura | ||||||||||||||||||||||||||||||
| (US$ in millions) | (US$ in millions) | (US$ in millions) | ||||||||||||||||||||||||||||||||||
| Buenaventura’s Projects: | ||||||||||||||||||||||||||||||||||||
| Orcopampa | 100.00 | %1 | None | 18,000 | Gold & silver | 2.91 | 2.91 | 2.41 | 2.41 | 6.90 | 5.85 | |||||||||||||||||||||||||
| Yumpag(1) | 100.00 | % | None | 1,847 | Silver, lead & zinc | 0.75 | 0.75 | 1.25 | 1.25 | 0.41 | 0.41 | |||||||||||||||||||||||||
| Anamaray(1) | 100.00 | % | None | 4,380 | Zinc, lead & silver | 0.64 | 0.64 | 1.70 | 1.70 | 2.19 | 2.19 | |||||||||||||||||||||||||
| Mallay | 100.00 | % | None | 2,300 | Zinc, lead & silver | 9.78 | 9.78 | 10.32 | 10.32 | - | - | |||||||||||||||||||||||||
| Chanca(2) | 100.00 | % | None | 3,880 | Silver | 1.40 | 1.40 | 3.69 | 3.69 | 10.98 | 10.98 | |||||||||||||||||||||||||
| Julcani-Recuperada(3) | 100.00 | % | None | 3,213 | Silver | 0.72 | 0.72 | 0.14 | 0.14 | 0.84 | 0.84 | |||||||||||||||||||||||||
| Antapite | 100.00 | % | None | 22,075 | Gold | 0.14 | 0.14 | - | - | - | - | |||||||||||||||||||||||||
| Poracota(4) | 100.00 | % | None | 6,680 | Gold & silver | 0.78 | 0.78 | 0.94 | 0.94 | 2.06 | 2.06 | |||||||||||||||||||||||||
| Shila-Paula(6) | 100.00 | % | None | 30,318 | Gold & silver | 1.90 | 1.90 | 6.57 | 6.57 | 16.97 | 16.97 | |||||||||||||||||||||||||
| 96,865 | 19.01 | 19.01 | 27.02 | 27.02 | 40.35 | 39.25 | ||||||||||||||||||||||||||||||
| 30 |
| (1) | Includes part of |
| (2) |
| (3) | Includes |
| (4) | Includes exploration costs of |
| (5) | Includes |
| (6) | Includes |
The following is a brief summary of current mine development and exploration activities conducted by us directly and through joint exploration agreements, which we believe represent the best prospects for discovering new reserves. There can be no assurance, however, that any of our current exploration projects will result in viable mineral production or that any of the mineralization identified to date will ultimately result in an increase in our ore reserves. Non-reserve mineralization has been included in our 20112012 Annual Report from the Tantahuatay, Chucapaca, Tambomayo, Parihuanas, Breapampa, Mallay and Yumpag exploration and mine development projects.Set forth below is a map of all of our mine development and exploration projects in Peru as of December 31, 2011:2012:
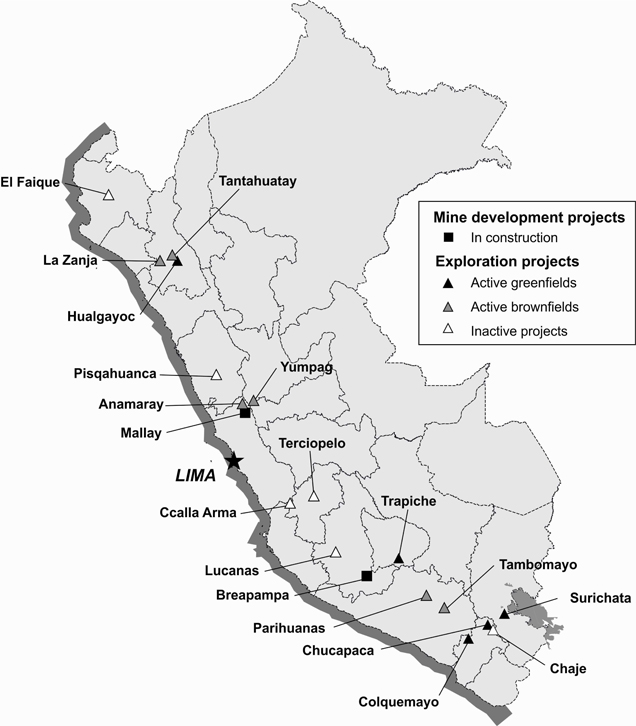
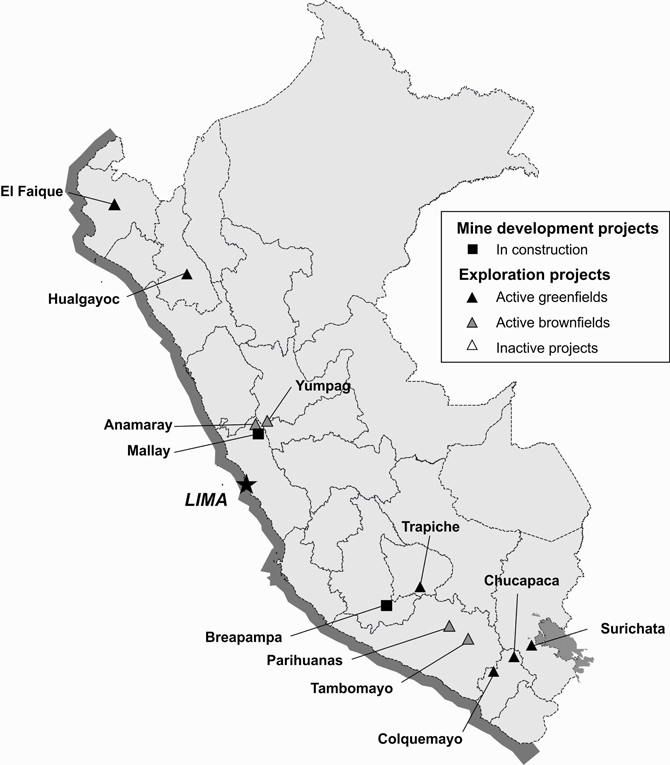
Mine Development Projects
La Zanja. Minera La Zanja S.R.L., or La Zanja, controls 32,821 hectares of mineralized property located 35 kilometers northwest of the city of Cajamarca. We currently own 53.06 percent of La Zanja, with the remainder owned by Newmont Peru. In 2009, we obtained approval of ourenvironmental impact study, or EIS, for the La Zanja project. La Zanja is an open pit mine that commenced production in September 2010. There are two ore deposits: San Pedro Sur and Pampa Verde. In 2011, this mine produced 134,190 ounces of gold and 363,927 ounces of silver. During 2012, La Zanja intends to conduct a drilling program in the San Pedro Sur, Pampa Verde and Cocan zones in the brownfield explorations area.
Tantahuatay. The Tantahuatay project, a gold-copper project, is wholly owned by Coimolache, an entity that is 40.1 percent owned by us, 44.2 percent owned by SCC, and 15.7 percent owned by ESPRO S.A.C., a Peruvian-based holding company. We are focusing our efforts on resolving community issues and obtaining permits to continue our explorationandenhance support of our infill drilling and feasibility studies for both oxide and sulfide targets. In 2009, we obtained approval of an EIS for the Tantahuatay 2 deposit. Construction of the mine infrastructure commenced in July 2010 and was completed in July 2011. In August 2011, the MEM granted the permits necessary to initiate metallurgical operations at Tantahuatay. Production in 2011 was 46,164 ounces of gold and 260,073 ounces of silver. We expect to begin project construction on the Ciénaga Norte project as part of our Tantahuatay expansion efforts in mid-2012, following approval of the environmental impact assessment.
Greenfield Exploration Projects
Chucapaca. The Chucapaca project is a gold-copper-silver greenfield exploration project wholly owned by Canteras del Hallazgo S.A.C., or CDH, which is 51 percent-owned by Minera Gold Fields Peru S.A. and 49 percent-owned by us. The project encompasses a total of 12,900 hectares of mining concessions owned by CDH, which are located in the Moquegua region in southern Peru. Our preliminary exploration activities at the Chucapaca project have included geophysical magnetic surveys, induced polarization surveys and diamond drilling, which resulted in the discovery of gold mineralization. During 2011,2012, our equity investment in CDH investedwas US$65.732.4 million, to complete 49,531 meterswhich was mainly for the preparation of an infill diamond drilling campaign as well as 18,346 meters of reverse circulation drilling within the Canahuire area, and to start a pre-feasibility study and an EIS.feasibility study. During 2012,2013, CDH intends to invest US$204.7 million, of which we will contribute 49 percent, to complete a feasibility study, conduct infill diamond drilling acquire land, address social issues, conduct logistical planning and construct site facilities. Atin the underground areas. As of December 31, 2011,2012, CDH estimated NRM for the Chucapaca project to be 132.7 million tons, with an average grade of 1.4 grams per ton of gold and 10.8 grams per ton of silver. Exploration expenses related to this project are not consolidated in Buenaventura’s financial results, but are reflected in “Share in the results of associates” in Buenaventura’s Consolidated Income Statement. See Note 109 to the Financial Statements.
Trapiche. The Trapiche project is wholly owned by us and encompasses 37,29129,798 hectares of mining concessions owned by us, with porphyry copper and skarn mineralization in the Apurimac region. The Apurimac region is part of a mineralized belt known as the Abancay Batholith, where several iron, copper and gold deposits have been identified. Our exploration activities at the Trapiche project have included diamond drilling and magnetic and induced polarization surveys. In 2011, we negotiated and obtained a 30-year lease with the Mollebamba community for 2,300 hectares of surface rights to conduct infill and additional diamond drilling and other engineering studies. We invested US$3.1 million in payments to the local community, to start preliminary engineering studies and to restart drilling at the end of 2011. We created a new company to operate the Trapiche project, El Molle Verde S.A.C, which is wholly owned by us, and we leased all mining properties to the new company. In 2012, we plan to invest approximatelyinvested US$9.116.1 million to complete a detailed surface exploration of copper oxides and to carry out a program of 25,000conduct 26,000 meters of diamond drilling, both into the copper oxide zone and as an infill program into the porphyry area, and to conduct 3,714 meters of diamond drilling for metallurgical testing. Independent consultant AMEC plc also conducted a preliminary engineering study of this area. We currently do not plan to make further investments in the Trapiche project in 2013. As of December 31, 2011,2012, we estimated NRM for the Trapiche project to be 499.5571 million tons, with an average grade of 0.480.46 percent of copper and 0.0150.075 percent of molybdenum into the Trapiche porphyry and MillucuchoMillocucho skarn.
Hualgayoc. Hualgayoc is a silver, zinc and lead exploration project, with copper and gold potential, owned by Consolidada de Hualgayoc S.A., or Consolidada, which is 50 percent owned by Colquirrumi, our 99.99 percent-owned subsidiary, and 50 percent owned by Gold Fields La Cima S.A.A., a wholly-owned subsidiary of Gold Fields. Colquirrumi has been the operator of the project since 2011. Consisting of 12,72015,417 hectares of mining concessions owned by Consolidada, the project is located in the Hualgayoc district, Cajamarca region. During 2011,2012, we invested US$1.55.7 million to conduct 7,143 meters of diamond drilling and, in 2012,2013, we intend to invest US$1.71.0 million to continue aour drilling campaign.
El Faique.The El Faique project is wholly owned and operated by us. The project encompasses 13,209 hectares of mining concessions owned by us and is located in the Sechura desert of northern Peru in the Piura region. The El Faique project consists of a deep massive sulfide deposit evidenced by diamond drilling. Pursuant to our exploration program, we have invested in social infrastructure and support for local communities in order to obtain surface permits and properties. In 2011,2012, we invested US$0.61.0 million to continue our efforts to negotiate with local communities. In 2012,2013, we plan to invest US$5.22.5 million to conduct thea diamond drilling campaign. We are working to obtain community consent and environmental permits in the second half of 2012.
2013.
Colquemayo.The Colquemayo project is wholly owned by us and encompasses 28,800 hectares of mining concessions located in the Moquegua region in southern Peru, 70 kilometers southwest of the Chucapaca project. The project is located in tertiary volcanic rocks covered by younger volcanic events. The high sulfidation alteration system covers an area of 40 square kilometers. During 2011,2012, we invested US$4.34.0 million to conduct a5,319 meters of diamond drilling campaign and, during 2012,2013, we intend to invest US$4.91.5 million to continue drilling.
Vacas Heladas. Vacas Heladas is a new exploration project located in the IV Region Coquimbo in northern Chile, in the El Indio metallogenic belt, eight kilometers south from the old Tambo mine. This belt is 100 kilometers long and encompasses gold deposits such as El Indio (8 million ounces), Veladero (11 million ounces) and Pascua Lama (17 million ounces). We signed an agreement with Compañía Minera Barrick Chile Limitada to evaluate several epithermal precious metal targets in the El Indio gold belt. We created a new subsidiary, Compañía de Minas Buenaventura Chile Limitada, or Buenaventura Chile, which is wholly-owned by us, to operate the Vacas Heladas project. We are currently conducting an initial drilling program to test the continuity, metallurgy and ore potential in the Vacas Heladas prospect. In 2011, we invested US$2.2 million to undertake 31.6 kilometers of geophysical surveys and to commence our diamond drilling campaign, and we intend to invest approximately US$3.4 million during 2012 to complete this drilling program.
Surichata. Surichata is a new exploration project located in the Puno region of southern Peru, consisting of 17,800 hectares of mining concessions, of which we own 15,900 hectares and lease 1,900 hectares from Minera Joncijirca S.A.C. The Surichata project shows evidence of epithermal and precious metal disseminations andsilver enriched polymetallic veins. In 2011,2012, we invested US$0.41.1 million to conduct geological mapping and trenching.2,932 meters of diamond drilling as part of a first-pass drilling campaign. In 2012,2013, we plan to invest US$0.73.1 million in a first-passsecond drilling campaign after obtaining community consent and environmental permits.campaign.
Brownfield Exploration Projects
Uchucchacua. The Uchucchacua brownfield exploration project is located throughout 8,430 hectares of our mining and exploration properties and 1,500 hectares of property owned by a joint venture between us and Minera Focus S.A.C. We are currently focusing our exploration efforts on three prospects: Anamaray, Yumpag and Chanca.
The Anamaray prospect is considered an epithermal deposit of silver, lead and zinc in a setting of tectonic breccias and veins in cretaceous limestone. In 2011,2012, we invested US$1.72.19 million to explore the parallel veins close to the Falla longitudinal fault and explore the San Francisco mineralized structure in greater depth through 1,504with 5,253 meters of diamond drilling and 2,205 meters of underground tunnels. InWe decided to halt our exploration of the Anamaray prospect at the end of 2012 wedue to disappointing results, and do not plan to invest approximately US$0.6 million to continue exploring the Anamaray-San Francisco prospect. As of December 31, 2012, we had estimated NRM of 172,507 dry short tons, or DST, with 10.5 ounces per ton of silver, 0.38 percent lead and 4.32 percent zincfurther in this prospect in 2013.
The Yumpag prospect consists of 1,847 hectares located 4 kilometers northeast of the Uchucchacua mine. The Yumpag prospect is an epithermal deposit of silver, lead, zinc and manganese structurally influenced by the Cachipampa geological fault, which also influences significant areas of silver mineralization at the Uchucchacua mine. During 2011,2012, we invested US$1.30.41 million, mainly on diamond drilling exploration.to complete mine audits and obtain necessary permits. In 2012,2013, we plan to invest approximately US$2.85.74 million to complete 2,150 meters of tunnels and undertake 1,500 meters of diamond drilling in an effort to continue exploration of the Yumpag prospect. As of December 31, 2012, we had estimated NRM of 147,096 dry short tons, or DST, with 9.26 ounces per ton of silver, 0.016 ounces per ton of gold, 1.68 percent lead and 1.23 percent zinc.
Mallay. Our exploration efforts in this area include the old Chanca silver mine and surrounding area of Chanca, which encompasses the Candelaria, Santa Rosa and Chiptaj brownfield exploration areas.
The Chanca prospect is located in the province of Oyón-Cajatambo,n, department of Lima, about 15 kilometers northwest of Mallay-Isguiz and adjacent to the old Chanca silver mine. The Chanca prospect consists of about 3,880 hectares, including the Chiptaj exploration area, and 1,500 hectares of what has historically been a joint venture between us and Minera Focus S.A.C. During 2011,2012, we invested US$10.00 million and completed underground10,421 meters of diamond drilling and 3,906 meters of exploration worktunnels, focusing primarily on the Shirley, Tarazca, Poderoso, Candelaria and Santa Rosa veins. In 2013, we plan to invest US$4.80 million to complete 4,200 meters of exploration tunnels and 7,200 meters of diamond drilling.
Mallay. The Mallay project is wholly owned and operated by us and is located 21 kilometers southwest of the Uchucchacua mine in the district of Mallay, province of Oyón, department of Lima. The project comprises about 2,300 hectares of mining concessions. Mallay is considered an epithermal deposit of silver, lead, zinc and some gold. We have recognized the following major ore structures: Isguiz, Pierina, María and Fortuna Body. Mallay is currently an advanced exploration project and has already commenced construction and entered the development stage. During 2011, we conducted underground tunneling and a diamond drilling program. This allowed us to report proven reserves of 489,770 DST, with ore grades of 0.014 ounces per ton of gold, 8.13 ounces per ton of silver, 5.07 percent lead and 7.37 percent zinc, and probable reserves of 201,119 DST, with ore grades of 0.017 ounces per ton of gold, 8.62 ounces per ton of silver, 4.36 percent lead and 6.27 percent zinc. NRM was 376,821 DST, with ore grades of 0.031 ounces per ton of gold, 8.66 ounces per ton of silver, 4.13 percent lead and 5.52 percent zinc. In 2011, we invested US$10.3 million in brownfield exploration. We expect that production at Mallay will begin in mid-2012.
| 34 |
Orcopampa. The Orcopampa brownfield exploration project is located on a total of 18,000 hectares of our mining and exploration concessions and 6,850 hectares of property to which we have access as a result of option agreements with SCC (in respect of Pucay) and Compañía Minera Ares S.A.C., or Minera Ares (in respect of Pariguanas), and SCC (in respect of Pucay). We are currently focusing our exploration efforts on the Pariguanas, Ocoruro, Quello and Pucay projects.Aseruta.
The Pariguanas project is located 24 kilometers northeast of Chipmo and consists of 4,440 hectares, 2,240 hectares of which we own and 2,200 hectares to which we have access as a result of an optiona joint venture agreement with Minera Ares. Pariguanas is considered an epithermal low sulfidation deposit mainly of silver and gold, hosted completely in volcanic andesitic rocks.gold. During 2011,2012, we invested US$1.022.69 million in diamond drilling to explore veins at depth. Asworks.
The Ocoruro project consists of December 31, 2011, estimated NRM was 346,517 DST, with 20.96 ounces per ton2,085 hectares and is located 2 kilometers west of silver and 0.018 ounces per ton of gold.the Chipmo mine. In 2012, we continued the diamond drilling campaign to define a mineralized vein system with gold and silver deposits, which we classified as low sulphidation epithermal deposits. In 2012, we invested US$2.75 million, mainly in diamond drilling. In 2013, we plan to invest US$5.3 million to complete our diamond drilling program and begin underground exploration.
The Pucayproject consists of 2,400 hectares to which we have access as a result of an option agreement with SCC. The project is located 3.5 kilometers southwest of Chipmo. In 2011, we completed 31,555 meters of geophysical lines and drilled 2,355 meters in the anomalous zone that showed a probable ore body with silver-gold mineralization. We invested US$0.61 million in 2011 and, in 2012, we plan to invest US$2.81.40 million to complete a diamond drilling program.program and conduct geophysical surveys.
The Quello project consists of 1,118 hectares and is located 3.3 kilometers northwest of the Chipmo mine. This project consists of a system of veins that contain gold. In 2012, we performed a geophisycal survey which showed two interesting geophisycal anomalies that may be related to the mineralized structures Sausa Norte and Sausa Centro. During 2012, we invested US$0.77 million mainly in geological surveys. In 2013, we plan to invest US$1.5 million to explore mineralized structures that were evidenced by our geophysical survey.
The Aseruta-Allhuire project consists of 2,925 hectares and is located 8 kilometers southeast of the town of Orcopampa. It consists of a system of veins with mainly silver content. We performed geophysical studies, which showed mapped veins and probable hydrothermal breccia body at depth. During 2012, we invested US$0.29 million, mainly to perform geological mapping and sampling. In 2013, we plan to invest US$1.50 million to develop a diamond drilling program at the main veins.
Poracota.The Poracota brownfield exploration project currently encompasses 6,680 hectares of mining concessions owned and operated by us and is located 20 kilometers west of the Orcopampa mine in southern Peru. The mineral deposit is considered an epithermal high sulfidation system, hosted in volcanic rocks, mainly tuffs. The deposit is comprised of two main areas, Huamanihuayta and Perseverancia.
The Huamanihuayta Oeste project consists of 440 hectares and is located 1 kilometer southwest of the Poracota mine. In 2011,2012, we explored the Huamanihuayta area and conducted ainvested US$2.07 million in diamond drilling, program. We invested US$1.7 millionfocusing primarily in the southwest extension of the main veins María Fe, Silvana and Malena. We also explored additional veins that are part of the vein system for the Poracota project in 2011.mine. In 2012,2013, we plan to invest US$1.41.0 million to conduct a diamond drilling program to define other mineralized structures inside Huamanihuayta.continue exploration of these veins and the Faculla and Soras projects, which consist of 1,102 hectares.
Julcani-Recuperada.The Julcani-Recuperada brownfield exploration project currently encompasses 1,8003,213 hectares of mining concessions and is wholly owned and operated by us. During 2011,2012, we invested US$0.110.84 million to perform geological surveys, outcrops sampling and sampling outcrops792 meters of veins.diamond drilling. In 2012,2013, we expect that exploration efforts will focusto invest US$1.4 million, mainly on diamond drilling in the brownfield Recuperada mine.Escopeta and Patara prospects.
Shila-Paula.TambomayoThe Shila-Paula brownfield.Tambomayo project is wholly owned and operated by us. The project encompasses a total of 30,70027,900 hectares, of mining concessionsand includes the Tambomayowhich 25,700 hectares are owned by us and Japotani projects.2,200 hectares are optioned by Minera Ares. This option contract expires in 2015.
The Tambomayo project is located 20 kilometers east of the Paula mine and comprises 29,700 hectares.mine. The project is considered a low sulfidation epithermal deposit with significant gold and silver mineralization in a vein system. During 2012, we continued the underground exploration tunnels to explore the Mirtha and Paola veins. As of December 31, 2011,2012, we had estimated NRM of 919,1841,269,296 DST, with 0.2790.323 ounces per ton of gold, and 8.967.69 ounces per ton of silver.silver, 1.5 percent lead and 2.86 percent zinc. In 2011,2012, we invested US$6.616.77 million in the exploration and development of the Mirtha vein and a diamond drilling campaign and underground exploration work.campaign. In 2012,2013, we plan to invest US$13.538.0 million, mainly for preparation and construction of basic infrastructure, underground exploration and tunnel development.
Breapampa. The Breapampa advanced project, which is wholly owned by us, encompasses 41,866 hectares of mining concessions and is located in the district of Chumpi, province of Parinacochas, department of Ayacucho. The project consists of gold and silver mineralization in an epithermal high-sulfidation deposit, emplaced into breccias of Tertiary volcanic rocks. As of December 31, 2011 we had proven and probable ore reserves of 5,645,000 DST, with 0.035 ounces per ton of gold and 0.63 ounces per ton of silver. As of December 31, 2011, NRM was 2,842,000 DST, with 0.016 ounces per ton of gold and 0.10 ounces per ton of silver; this includes NRMs of the Pucagallo and Senccata prospects. In 2011, we invested US$18.91 million from the estimated total budget for the project of US$48.0 million. In 2012, we plan to invest US$2.4 million to carry out a further intense drilling program. We plan to begin production in September 2012.
Competition
We believe that competition in the metals market is based primarily upon cost. We also compete with other mining companies and private individuals for the acquisition of mining concessions and leases in Peru and for the recruitment and retention of qualified employees.
Sales of Metal Concentrates
All of our metal production is sold to smelters, traders and banks, either in concentrate or metal form, such as gold-silver concentrate, silver-lead concentrate, zinc concentrate, lead-gold-copper concentrate and gold and silver bullion. Our concentrates sales are made under one- to three-year, U.S. Dollar-denominated contracts, pursuant to which the selling price is based on world metal prices as follows: generally, in the case of gold and silver-based concentrates, the London Spot settlement prices for gold, less certain allowances, and the London Spot or the United States Commodities Exchange settlement price for silver, less certain allowances; and, in the case of base-metal concentrates, such as zinc, lead and copper, the London Metals Exchange, or LME, settlement prices for the specific metal, less certain allowances. Sales prices vary according to formulas that take into account agreed contractual average prices for a quotational period, generally being the month of, the month prior to, or the month following the scheduled month of shipment or delivery according to the terms of the contracts.
The historical average annual prices for gold and silver per ounce and our average annual gold and silver prices per ounce for each of the last five years are set forth below:
| Gold | Silver | Gold | Silver | |||||||||||||||||||||||||||||
Average Annual Market Price | Our Average Annual Price(1) | Average Annual Market Price | Our Average Annual Price(1) | Average Annual Market Price | Our Average Annual Price(1) | Average Annual Market Price | Our Average Annual Price(1) | |||||||||||||||||||||||||
| US$/oz.(2) | US$/oz. | US$/oz.(3) | US$/oz. | US$/oz. (2) | US$/oz. | US$/oz.(3) | US$/oz. | |||||||||||||||||||||||||
| 2007 | 696.66 | 684.59 | 13.39 | 13.37 | ||||||||||||||||||||||||||||
| 2008 | 871.71 | 872.21 | �� | 15.02 | 14.26 | 871.71 | 872.21 | 15.02 | 14.26 | |||||||||||||||||||||||
| 2009 | 972.98 | 988.32 | 14.65 | 15.52 | 972.98 | 988.32 | 14.65 | 15.52 | ||||||||||||||||||||||||
| 2010 | 1,224.66 | 1,253.35 | 20.16 | 20.86 | 1,224.66 | 1,253.35 | 20.16 | 20.86 | ||||||||||||||||||||||||
| 2011 | 1,568.58 | 1,574.45 | 35.11 | 35.36 | 1,568.58 | 1,574.45 | 35.11 | 35.36 | ||||||||||||||||||||||||
| 2012 (through March 31, 2012) | 1,690.57 | 1,721.47 | 32.63 | 32.19 | ||||||||||||||||||||||||||||
| 2012 | 1,668.98 | 1,678.92 | 31.15 | 31.25 | ||||||||||||||||||||||||||||
| 2013 (through March 31, 2013) | 1,631.77 | 1,606.08 | 30.11 | 29.92 | ||||||||||||||||||||||||||||
| (1) | Our average annual price includes only the consolidated average annual price from the Julcani, Uchucchacua, Orcopampa, Antapite, Recuperada, Colquijirca, Marcapunta, Ishihuinca and Shila mines. |
| (2) | Average annual gold prices are based on the London PM fix as provided by Metals Week. |
| (3) | Average annual silver prices are based on London Spot prices. |
Most of the sales contracts we enter into with our customers state a specific amount of metal or concentrate the customer will purchase. We have sales commitments from various parties for nearly all of our estimated 20122013 production; however, concentrates not sold under any of our contracts may be sold on a spot sale basis to merchants and consumers.
| 36 |
Sales and Markets
The following table sets forth our total revenues from the sale of gold, silver, lead, zinc and copper in the past twothree fiscal years:
Year ended December 31(1) | Year ended December 31(1) | |||||||||||||||||||
| Product | 2010 | 2011 | 2010 | 2011 | 2012 | |||||||||||||||
| (In thousands of US$) | (In thousands of US$) | |||||||||||||||||||
| Gold | 578,582 | 796,502 | 578,582 | 791,387 | 738,477 | |||||||||||||||
| Silver | 274,624 | 524,847 | 274,624 | 526,380 | 544,947 | |||||||||||||||
| Lead | 46,913 | 41,157 | 46,913 | 36,880 | 52,834 | |||||||||||||||
| Zinc | 92,884 | 73,267 | 92,884 | 72,095 | 82,873 | |||||||||||||||
| Copper | 129,444 | 199,036 | 129,444 | 193,215 | 177,573 | |||||||||||||||
(1) Does not include refinery charges and penalties incurred in 2012, 2011 and 2010 of US$133,237and147,930, US$133,502,127,957and US$112,254, respectively.
We sold our concentrates to 1520 customers in 2011.2012. Approximately 54 percent, 5457 percent and 5762 percent of our concentrate sales in 2009, 2010, 2011 and 2011,2012, respectively, were sold outside Peru. Set forth below is a table that shows the percentage of sales of concentrate from our mines and gold bullion that were sold to our various customers from 20092010 to 2011.2012.
| Percentage of Concentrates and Gold Bullion Sales | Percentage of Concentrates and Gold Bullion Sales | |||||||||||||||||||||||
| 2009 | 2010 | 2011 | 2010 | 2011 | 2012 | |||||||||||||||||||
| Export Sales: | ||||||||||||||||||||||||
| Johnson Matthey Limited | 44.91 | % | 49.90 | % | 47.42 | % | 49.90 | % | 47.42 | % | 47.75 | % | ||||||||||||
| Glencore International AG | 1.96 | 0.75 | 0.48 | 0.75 | 0.48 | - | ||||||||||||||||||
| N.V. Umicore SA | 1.82 | 2.18 | 4.14 | 2.18 | 4.14 | 1.34 | ||||||||||||||||||
| Transamine Trading SA | 0.51 | - | - | - | - | 0.35 | ||||||||||||||||||
| J.P. Morgan Chase Bank | 2.09 | - | - | - | - | 1.97 | ||||||||||||||||||
| MRI Trading AG | 0.75 | 0.13 | 3.20 | 0.13 | 3.20 | 5.60 | ||||||||||||||||||
| MK Metal Trading GMBH | 1.19 | 0.19 | 1.23 | 0.19 | 1.23 | 1.36 | ||||||||||||||||||
| Lois Dreyfus Commodities Metal Suisse SA | 0.34 | - | - | - | - | 0.24 | ||||||||||||||||||
| Standard Bank PLC | - | 0.04 | - | 0.04 | - | - | ||||||||||||||||||
| Korea Zinc Company Ltd. | 0.07 | - | - | - | - | 2.99 | ||||||||||||||||||
| Mintrade Ltd. | - | 0.39 | - | 0.39 | - | - | ||||||||||||||||||
| Xstrata Commodities | - | 0.39 | 0.19 | 0.39 | 0.19 | 0.36 | ||||||||||||||||||
| Total Export Sales | 53.64 | % | 53.58 | % | 56.78 | % | 53.97 | % | 56.66 | % | 61.96 | % | ||||||||||||
| Domestic Sales: | ||||||||||||||||||||||||
| Doe Run Perú SRL | 1.90 | - | - | - | - | 1.08 | ||||||||||||||||||
| Glencore Peru S.A.C. | - | 7.76 | 18.93 | 7.76 | 18.93 | 17.91 | ||||||||||||||||||
| Consorcio Minero SA | 14.56 | 10.81 | 6.89 | 10.62 | 6.89 | 5.88 | ||||||||||||||||||
| Votorantim Metais – Cajamarquilla SA | 4.40 | 3.33 | 2.57 | 3.33 | 2.57 | 0.42 | ||||||||||||||||||
| Sudamericana Trading SRL | 1.31 | 1.15 | 2.58 | 1.15 | 2.58 | 2.44 | ||||||||||||||||||
| Ays SA | 16.46 | 10.50 | - | 10.50 | - | - | ||||||||||||||||||
| MK Metal Trading Perú SAC | 0.5 | 0.88 | 0.39 | 0.88 | 0.39 | 0.14 | ||||||||||||||||||
| Louis Dreyfus Peru SAC | 6.48 | 10.74 | 10.54 | 10.54 | 10.66 | 8.11 | ||||||||||||||||||
| Traxxys Peru SAC | 0.75 | 1.25 | 1.23 | 1.25 | 1.23 | 0.95 | ||||||||||||||||||
| Cia. Minera Casapalca S.A. | - | - | 0.09 | - | 0.09 | 0.20 | ||||||||||||||||||
| Total Domestic Sales | 46.36 | % | 46.42 | % | 43.22 | % | 46.03 | % | 43.34 | % | 38.04 | % | ||||||||||||
| Total Sales | 100 | % | 100 | % | 100 | % | 100 | % | 100 | % | 100 | % | ||||||||||||
| 37 |
The following table shows our committed sales volumes of silver-lead, gold-silver and zinc concentrates from 20122013 to 2014:2015:
| Wet metric tons | Wet metric tons | Wet metric tons | Wet metric tons | Wet metric tons | Wet metric tons | |||||||||||||||||||
| Concentrate | 2012 | 2013 | 2014 | 2013 | 2014 | 2015 | ||||||||||||||||||
| Recuperada’s Silver-Lead | 7,775 | 10,790 | 3,500 | 6,000 | 6,000 | 6,000 | ||||||||||||||||||
| Recuperada’s Zinc | 6,640 | 8,640 | 8,640 | 9,600 | - | - | ||||||||||||||||||
| Uchucchacua’s Silver-Lead | 31,000 | 15,750 | 27,250 | 31,900 | 21,500 | - | ||||||||||||||||||
| Uchucchacua’s Zinc | 52,530 | 22,000 | 15,000 | 25,000 | 25,000 | - | ||||||||||||||||||
| Poracota’s Gold-Silver | 10,350 | - | - | - | - | - | ||||||||||||||||||
| Julcani’s Silver-Lead | 4,500 | 4,000 | - | 6,800 | - | - | ||||||||||||||||||
Note: The price of the concentrate supplied under the contract is based on specified market quotations minus deductions.
We also sell refined gold, which is derived from our operations at Orcopampa, Shila-Paula, Antapite, Ishihuinca and La Zanja and processed at a local smelter in Lima, to Johnson Matthey Public Limited Company, or Johnson Matthey, which further refines the gold. Pursuant to our agreement with Johnson Matthey, we supplied Johnson Matthey, at our option, with gold assaying in excess of 75 percent gold and approximately 2025 percent silver, monthly from January 1, 20112012 to December 31, 2011.2012. The price of the gold supplied was determined based on, for the gold content, the quotation for gold at the London Gold Market PM fixing in U.S. Dollars, and for the silver content, the quotation for silver at the London Silver Market spot fixing in U.S. Dollars or at spot prices, minus, in each case, certain minimum charges, as well as charges for customs clearance and treatment of the gold (which varies depending on its gold and silver content). We may elect to have our material toll refined at Johnson Matthey’s Brampton, Canada works and returned to our account for sale to third parties. Pursuant to our agreement, we are responsible for delivering the gold to Johnson Matthey’s designated flight at the Lima airport.
Hedging/Normal Sales Contracts
Between 2003 and 2008, we modified the terms of certain derivative instruments in order to qualify them as normal sales contracts and eliminated the fixed or maximum price component on all of our outstanding gold commitments. These modifications required us to make aggregate payments of US$832.84 million during 2007 and 2008. As a result of these transactions, weWe and our wholly-owned subsidiaries are now completely unhedged as to the price at which our gold and silver will be sold. See “Item 3. Key Information—D. Risk Factors—Factors Relating to the Company—Our financial performance is highly dependent on the prices of gold, silver, copper and other metals.”
At Sociedad Minera El Brocal S.A.A., or El Brocal, we implemented a base metal hedging policy for a maximum of 25 percent of El Brocal’s total payable metal contained per year, for up to three years. El Brocal didhas not enterentered into any new hedging transactions during 2011. As of March 31, 2012, allsince 2010 and has no outstanding hedging transactions were non-delivery zero cost (Asian) option collars. Remaining hedging commitments amount to 18 percent of payable metal during 2012 on the following terms: 4,500 metric tons of copper at an average price range of US$7,500 to US$8,420 per metric ton.commitments.
Yanacocha and Cerro Verde have not engaged in, and are currently not engaged in, gold or copper price hedging activities, such as forward sales or option contracts, to minimize their respective exposures to fluctuations in the price of gold and copper.
| 38 |
Regulatory Framework
Mining and Processing Concessions
In Peru, as in many other countries, while surface land is owned by private landowners, the government retains ownership of all subsurface land and mineral resources. Our right to explore, extract, process and/or produce silver, gold and other metals is granted by the Peruvian government in the form of mining and processing concessions. The rights and obligations of holders of mining concessions, provisional permits and processing concessions are currently set forth in the General Mining Law (Single Unified Text approved by Supreme Decree 014-92-EM), which is administered by the MEM.
Pursuant to the General Mining Law, filers of mining claims must obtain a mining concession before they may explore the areas claimed. Applications for mining concessions must be filed with the regional mining directors of each regional government and with INGEMMET (Instituto Geológico Minero y Metalúrgico, or the Geological, Mining and Metallurgical Institute of Peru).
Mining concessions granted since October 2008 have an indefinite term, subject to payment of an annual concession fee per hectare claimed and achievement of minimum annual production for each hectare. Failure to achieve annual production targets will result in a fine. Failure to pay concession fees or fines for two consecutive years could result in the loss of one or more of the mining rights. Failure to satisfy minimum annual production thresholds for a specified period of time could result in cancellation of the concessions.
Our and Yanacocha’s processing concessions enjoy the same duration and tenure as our mining rights, subject to payment of a fee based on nominal capacity for the applicable processing plant. Failure to pay processing fees or fines for two consecutive years could result in the loss of the processing concessions.
As of MarchDecember 31, 2012, we owned and administered, directly or indirectly, through subsidiaries or in conjunction with joint venture partners, approximately 1,015,4931,194,021 hectares of mining concessions devoted to mineral exploration and mining operations. Mining rights and processing concessions are in full force and effect under applicable Peruvian laws. We believe that we are in compliance with all material terms and requirements applicable to the mining rights and processing concessions and that we are not subject to any condition, occurrence or event that would cause the revocation, cancellation, lapse, expiration or termination thereof, except that we may, from time to time, allow to lapse, revoke, cancel or terminate mining rights and processing concessions that are not material to the conduct of our business.
In addition to obtaining mining rights from the Peruvian government, applicable Peruvian regulations require us to obtain easements or other rights from private landowners that own the surface land above the mineral resources that we intend to explore or mine. Supreme Decree 020-2008-EM requires us to obtain such easements or other rights prior to commencing exploration activities. We have been actively seeking to acquire land surface, easements to land containing prospective geological exploration target sites, deposits that can be exploited in the future and areas suitable as plant or facility sites.
The Law Regulating Mining Concessions in Urban Areas and Urban Expansion Areas and related regulations set forth procedures for the granting of mining rights in urban and urban expansion areas. In order to grant a mining concession in an urban or urban expansion area, the MEM is required to receive the approval of the council of the applicable provincial municipality. Mining concessions in urban areas are granted for 10-year terms, which may be renewed by the MEM subject to the approval of municipal authorities.
Law No. 28964, which became effective on January 25, 2007, created theOrganismo Supervisor de la Inversión en Energía y Minería(OSINERGMIN) as the government agency in charge of regulating and auditing the electricity, hydrocarbon and mining activities of companies. Law No. 28964 provides that the overview and audit of activities related to the environment, mining safety and health regulations may be performed by companies duly certified and approved by OSINERGMIN.However, pursuant to Supreme Decree 001-2010-MINAM, OSINERGMIN has transferred its environmental supervisory functions to the Environmental Evaluation and Oversight Agency, or OEFA. Beginning July 22, 2010, OEFA assumed the authority to carry out unexpected audits and levy fines on companies if they fail to comply with prescribed environmental standards.
Law No. 28964 has been abrogated by Law No. 29783 with respect to employee safety and employer liability.liability, which matters are audited by theMinisterio de Trabajo y Promoción del Empleo. Law No. 29783 establishes rules designed to prevent employee safety risks and allocate liabilities in relation to such risks. This legislation entitles labor inspectors to inspect commercial facilities and, under certain circumstances, suspend operations.
Environmental Matters
In 2005, Peru enacted the General Environmental Law (Law No. 28611), which establishes the main environmental guidelines and principles applicable in Peru. Pursuant to the General Environmental Law, the MEM has issued regulations mandating environmental standards for the mining industry and reviews and approves environmental studies for mining operations. OEFA has the authority to inspect mining operations and fine companies that fail to comply with prescribed environmental standards.
The MEM has issued regulations that establish maximum permissible levels of (i) emissions of liquid effluents and (ii) elements and compounds present in gaseous emissions resulting from the mining activities. Generally, holders of mining rights and processing plants that were in operation prior to May 1993 are required to comply with maximum permissible levels within 10 years. In the interim, mining operators are required to prepare Environmental Adaptation and Management Programs, or PAMAs, that set forth plans to ensure compliance with more stringent maximum permissible levels.
In addition, each mining company that initiated operations prior to May 1993 was required to file a Preliminary Environmental Evaluation, or EVAP, for each of its mining units to disclose any pollution problems in its operations and, thereafter, to submit a follow-up PAMA aimed at implementing measures in order to solve problems identified in the EVAP. Companies must correct the pollution problems relating to their mining activities within five years, while smelters must comply within ten years. These companies must allocate no less than 1 percent of their annual sales to redress the problems identified in their EVAPs and contemplated in their PAMAs.
Since May 1993, new mining and processing activities have been required to file and obtain approval for an EIS before being authorized to commence operations. New mining and plant processing activities are required to comply with the maximum permissible levels for liquid effluents from the initiation of their operations.
Many of our mining rights and processing plants were in operation prior to May 1993, and we are in substantial compliance with the maximum permissible levels set forth in the MEM’s regulations. EVAPs for Julcani, Uchucchacua, Orcopampa, Recuperada, Ishihuinca and Shila were all accepted between August and September 1995. Between November 2002 and April 2003, the MEM approved and verified the PAMAs for all these entities, issuing and approving resolution for each respective mining unit. The EISs for Paula, Antapite, Esperanza, Poracota and Pozo Rico were approved in 2001, 2001, 2006, 2007 and 2008, respectively.
EISs for capacity expansion at the Orcopampa, Uchucchacua and Antapite mines were approved in 2004, 2006 and 2008, respectively.
The MEM approved the EISs for the Huancarama-Chipmo-Poracota and La Zanja transmission lines and their substations in 2006 and 2008, respectively. This connection to the national grid should result in lower energy costs.
In 2009, the MEM approved the EISs for the La Zanja, Mallay, Tantahuatay Esperanza and Angélica Rublo Chico projects.
The following EISs were approved in 2011:
In May 2008, the Environmental Ministry of Peru was established by legislative decree. The principal functions of the Environmental Ministry include formulating and implementing policies and regulations relating to environmental matters and controlling pollution, including regulating air and water quality standards, through supervision and education. In 2009, the caseMEM approved the EISs for the La Zanja, Mallay, Tantahuatay and Esperanza projects. In 2010, the MEM approved the EISs for the Angélica Rublo Chico project. In 2011, the MEM approved the EISs for our Orcopampa and Breampampa projects. The MEM approved the modified EIS for the Mallay mine and the second modified EIS for the Shila cyanidation circuit in 2012.
In 2012, Peru enacted Supreme Decree N° 020-2012, which requires all activities to start and re-start exploration, development, preparation and exploitation to obtain the approval of the Mining Department of the Ministry of Energy and Mines. With regard to water regulation, all Peruvian mining companies must presentwere required to submit their updated environmental management plans beforeto comply with water quality standards and the new maximum permissible levels for liquid effluents by August 31, 2012. Buenaventura and its associated companies submitted our plans. We expect that we will be required to implement these plans and be in compliance with the new maximum permissible levels for liquid effluents and water quality standards by 2014 and 2015, respectively.
Except as described above, there are no material legal or administrative proceedings pending against us with respect to any environmental matters.
Regulations governing mining explorations. In May 2008, the Peruvian government enacted DS 020-2008-EM, which governs mining exploration activities and related matters. Under DS 020-2008-EM, exploration activities are divided into 2 categories, Category I and Category II. Category I exploration activities are those involving no more than 20 drilling platforms and environmentally affecting no more than 10 hectares, while Category II exploration activities are those involving more than 20 drilling platforms and environmentally affecting more than 10 hectares. For Category I exploration activities, an Environmental Impact Declaration, or EID, is required. For Category II exploration activities, a Semi-detailed Environmental Impact Study, or EISsd, is required, which incorporates technical, environmental and social matters. Exploration activities must start within twelve months following the date that an EID or the EISsd is approved. The commitments assumed by mining companies in their EID, EISsd and EIS are mandatory; if they are not fulfilled, OSINERGMIN has the authority to fine these companies.
InAlso in May 2008, MEM enacted DS 028-2008, which establishes the right of every person to participate in the process of making decisions related to the sustainable development of mining activities on government territory. The EID, EIS and EISsd require local communities to have an opportunity to actively participate in this process.
The following EIDs and EISsd were approved in 2011:2012:
| Buenaventura | ||||||
| Mine/Project | Type of Study | Approving Resolution | Date of Approval | |||
| EID | N° | |||||
| EID | N° | |||||
| EID | N° | |||||
| EID | N° | |||||
| June | ||||||
| EISsd | N° | |||||
| EISsd | N° | September | ||||
| EISsd | N° | |||||
| Santa Rosa | EISsd | N° 066-2012-MEM-AAM | February 28, 2012 | |||
| La Zanja SRL | ||||||
| Mine/Project | Type of Study | Approving Resolution | Date of Approval | |||
| N° | September | |||||
| Mine/Project | Type of Study | Approving Resolution | Date of Approval | |||
| Mod EISsd | N° | |||||
| July | ||||||
Regulations governing mine closures. In 2003, Law No. 28090,Ley que Regula el Cierre de Minas (Law that Regulates the Closing of Mines), established the obligations and procedures that mining companies must follow to prepare, submit and execute plans for the closing of mines, or Closure Plans, and the granting of environmental guarantees to secure compliance with Closure Plans. We are required to submit a Closure Plan for new projects to the MEM within one year following approval of an EIS or PAMA; inform the MEM semi-annually of any progress on the conditions established in the Closure Plan; perform the Closure Plan consistent with the schedule approved by the MEM during the life of the concession; and grant an environmental guarantee that covers the estimated amount of the Closure Plan.
In addition, Supreme Decree No. 020-2008-EM requires mining companies that perform exploration activities to conduct certain closing activities in accordance with the applicable environmental study approved by the relevant authority, subject to deferral under certain circumstances, and contemplates a Closure Plan to be submitted by the mining companyfollowing the terms and conditions of Supreme Decree Nº 033-2005-EM.
We have presented Closure Plans to the MEM for all of our mines and advanced explorations. To date, the MEM has approved our Closure Plans for Julcani, Recuperada, Uchucchacua, Orcopampa, Poracota, Antapite, Caravelí, Shila, Esperanza, Pozo Rico, Mallay, Trapiche, Angélica Rublo Chico and Anamaray-Jancapata.
The follow Closure Plan Studies were approved in 2011:2012:
| Buenaventura | ||||||
| Mine/Project | Type of Study | Approving Resolution | Date of Approval | |||
| Update Closure Plan | N° | |||||
| Modified Closure Plan | N° | |||||
| N° | ||||||
| N° | ||||||
| Mine/Project | Type of Study | Approving Resolution | Date of Approval | |||
| Update Closure Plan | N° | |||||
On November 9, 2009 Supreme Decree No. 078-2009-EM became effective, creating additional environmental obligations for the holders of mining concessions. Under this provision, holders of mining concessions that have performed mining activities, including mining exploration, exploitation and processing activities or related activities, without having an Environmental Certification will be required to prepare and perform an Environmental Remediation Plan to cure the environmental impact in the areas in which such activities have been conducted. The Environmental Remediation Plan will contain a detailed description of all the mining items and activities performed without the correspondent Environmental Certification, including maps and related information, a detailed description of the environmental impacts created by such activities, a detailed description of the remediation actions, a detailed description of the compensation that is proposed to be made, a budget and schedule of the remediation activities, including their costs, a bond in favor of MEM for the cost of the execution of the measures contained in the Environmental Remediation Plan.
Law No. 28271,Ley que Regula los Pasivos Ambientales de la Actividad Minera (Law that Regulates the Environmental Liabilities of Mining Activities), became effective on July 7, 2004 to regulate the identification of liabilities in mining activityactivities and financial responsibility for remediation, in each case to mitigate any negative impact mining may have with respect to the health of the population, environment and property. Pursuant to Law No. 28271, as amended, the technical branch of the MEM will identify environmental liabilities, mining companies responsible for abandoned mining facilities, mining works and residue deposits that may be linked to such environmental liabilities and holders of inactive mining concessions with mining liabilities. Holders of inactive mining concessions with environmental mining liabilities will be required to submit a Closure Plan and enter into environmental remediation agreements with the MEM to perform any studies and work necessary to control and mitigate the risk and effects of any contamination.
Regulations under Law No. 28271,Reglamento de Pasivos Ambientales de la Actividad Minera (Regulations of Environmental Liabilities of Mining Activities), were approved by Supreme Decree No. 059-2005-EM.
We have presented Closure Plans to the MEM for all our mining concessions with environmental mining liabilities. To date, the MEM has approved the mining liabilities for Hualchocopa, Lircay, Bella Unión-Pucaray and Chaquelle.Chaquelle, and all of these concessions have been closed.
We anticipate additional laws and regulations will be enacted over time with respect to environmental matters. The development of more stringent environmental protection programs in Peru could impose constraints and additional costs on our operations, and we would be required to make significant additional capital expenditures in the future. Although we believe that we are substantially in compliance with all applicable environmental regulations of which we are now aware, there is no assurance that future legislation or regulatory developments will not have an adverse effect on our business or results of operations.
Prior Consultation with Local Indigenous Communities
In 2011, Peru enacted Law No. 29785, the Law of Prior Consultation for Indigenous and Native Communities (Ley del Derecho a la Consulta Previa a los Pueblos Indígenas y Originarios, Reconocido en el Convenio 169 de la Organización Internacional del Trabajo). This law establishes a prior consultation procedure that the Peruvian government must undertake in concert with local indigenous communities whose collective rights may be directly affected by new legislative or administrative measures, including the granting of new mining conessions.concessions. Under the law, the Peruvian government,governmental body responsible for issuing or approving the administrative measure or decree in question, rather than the affected local indigenous community, retains the right to approve or reject the relevant legislative or administrative matter following such consultation. However, to the extent that any future projects of us, Yanacocha or Cerro Verde require legislative or administrative measures that impact local indigenous communities, the required prior consultation procedure may result in delays, additional expenses or failure to obtain approval for such new project.
Regulations under Law No. 29785 were approved by Supreme Decree No. 001-2012-MC, which became effective on April 4,2, 2012. These regulations specify the form and circumstances of the required consultation and the manner in which agreements will be formalized, and cap the consultation process at 120 calendar days.
Permits
We believe that our mines and facilities have all necessary material permits. All future exploration projects will require a variety of permits. Although we believe the permits for these projects can be obtained in a timely fashion, permitting procedures are complex, time-consuming and subject to potential regulatory delay. We cannot predict whether we will be able to renew our existing permits or whether material changes in existing permitting conditions will be imposed. Non-renewal of existing permits or the imposition of additional conditions could have a material adverse effect on our financial condition or results of operations.
Insurance
We maintain a comprehensive insurance program designed to address specific risks associated with our operations, in addition to covering the insured risks common to major mining companies. Our insurance program is provided through the local Peruvian insurance market and includes employers’ liability, comprehensive third party general liability, comprehensive automobile liability, all risk property on a replacement basis, including transit risks, business interruption insurance and mining equipment.
Mining Royalties and Taxes
Under Peruvian law, holders of mining concessions are required to pay the Peruvian government a mining royalty (regalia minera) for the exploitation of metallic and non-metallic resources. In accordance with Law No. 28258, as amended by Law No. 29788, mining royalties shall be payable either as a specified percentage of operating profit or 1 percent of revenues, whichever is higher. If the mining royalty is calculated as a percentage of operating profit, marginal rates ranging from 1 percent to 12 percent, increasing progressively for companies with higher operating margins, will apply.
Mining companies that are party to mining stabilization agreements will not be required to pay a mining royalty during the tenure of their stabilization agreements. Although we are not party to a stabilization agreement, Yanacocha currently has effectivestabilization agreements for the Yanacocha, La Quinua and Maqui Maqui mines.
In addition to mining royalties, pursuant to Law No. 29789, effective from October 1, 2011, mining operations in Peru are subject to a new extraordinary mining tax. Mining companies that do not have taxation stability agreements with the Peruvian government, such as Buenaventura, will pay the “Special Mining Tax” (Impuesto Especial de Minería). The Special Mining Tax is calculated as a percentage of operating profit. Marginal rates range from 2 percent to 8.4 percent, increasing progressively for companies with higher operating margins. Mining companies that have stability agreements with the Peruvian government will pay the “Special Mining Duty” (Gravamen Especial de Minería). The Special Mining Duty is calculated as a percentage of operating profit, with marginal rates ranging from 4 percent to 13.12 percent, increasing progressively for companies with higher operating margins.
Safety
The safety and health of our employees is our highest priority. We believe that we have implemented robust safety measures and work continuously to improve our occupational health and safety training and performance. We regularly monitor occupational health and safety performance and compliance through safety training programs, review and analysis of accident reports and other routine safety measures at our operating mines. Our Uchucchacua, Julcani, Antapite, Orcopampa and Shila-Paula mining units are Occupational Health and Safety Assessment Series 18001 certified.
Our safety program includes the following core components:
| · | Risk Detection Training and Log Book: to train workers to detect, identify and record job-related hazards. |
| · | Safety Performance Indicators: to regularly monitor the performance of each operating unit and target safety efforts and training. |
| · | Specialized Safety Training: to provide training related to safety techniques and tools tailored to the risks associated with each employee’s job. |
| · | Mine School: to provide on-site theoretical and practical training to employees in different fields of work. |
| · | Implementation of International Safety Standards: to establish and comply with internationally accepted safety standards. |
| · | Safety Audits: to regularly audit safety procedures and systems at each operating mine by certified auditors. |
During 2011,2012, we experienced 117 total reportable injuries, 115 lost-time injuries and 2 fatal injuries, as compared to 105 total reportable injuries, 101 lost-time injuries and 4 fatal injuries as compared to 304 total reportable injuries, 138 lost-time injuries and 3 fatal injuries for the year ended December 31, 2010.2011. Under Peruvian law, the number of lost-time injuries recorded includes days away from work as a result of injury, restricted duty injuries and certain medical treatment injuries. The total number of reportable injuries includes lost-time injuries, as well as other minor and major first aid injuries and fatal injuries.
C. Organizational Structure
As of March 31,2012,31,2013, we conducted our mining operations, explorations projects and other activities directly and through various majority-owned subsidiaries, controlled companies and other affiliated companies as described in the following organizational chart.

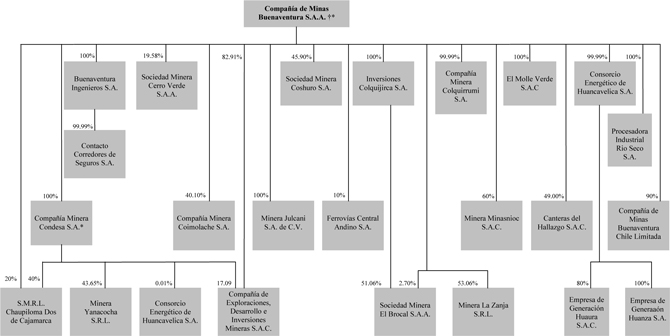
| † | All entities in this chart, with the exception of Minera Julcani S.A. de C.V. and Compañía de Minas Buenaventura Chile Limitada (which are organized in Mexico and Chile, respectively), are incorporated in Peru. |
| * | Compañía Minera Condesa S.A. also holds 21,222,236 treasury shares of Compañía de Minas Buenaventura S.A.A., or approximately 7.68 percent of our outstanding equity. |
| 47 |
Intermediate Holding Companies, Subsidiaries and Equity Participations
Compañía Minera Condesa S.A.
Condesa, which is wholly owned by us, is a mining and facilities holding company with direct and indirect ownership participation in two mining-related entities, Cedimin and Yanacocha, and in exploration projects conducted by Minas Conga and Conenhua (as defined below). See “—B. Business Overview—Exploration.” As a partner in Yanacocha, Condesa shares responsibility for the investments made in the Yanacocha mine. In addition, Condesa holds an equity interest in Chaupiloma, and, as a result, receives a portion of the royalty revenues paid by Yanacocha to Chaupiloma equal to such ownership interest. See “—S.M.R.L. Chaupiloma Dos de Cajamarca” below. Condesa also holds a 7.68 percent interest in us.
Compañía de Exploraciones, Desarrollo e Inversiones Mineras S.A.C.
Cedimin, wholly owned by us, is a mining and facilities holding company that operates the Shila-Paula mine and conducts explorations at the Tambomayo project. At our annual shareholders’ meeting on March 26, 2013, the shareholders approved the merger of Cedimin with and into Buenaventura, with Buenaventura as the surviving entity of the merger, and accordingly, in 2013, Cedimin will be merged with and into Buenaventura.
S.M.R.L. Chaupiloma Dos de Cajamarca
S.M.R.L. Chaupiloma Dos de Cajamarca, or Chaupiloma, is a Peruvian limited liability company that holds all of the mining rights for the areas mined by Yanacocha and Minas Conga. Chaupiloma receives a royalty that is calculated as a percentage of the total revenues of Yanacocha. We own, directly and indirectly, through our interest in Condesa, a 60 percent interest in Chaupiloma. Newmont Peru owns the remaining 40 percent equity interest.
Consorcio Energético Huancavelica S.A.
Consorcio Energético Huancavelica S.A., or Conenhua, is an electrical transmission and generation company that provides a significant portion of our electrical needs through its transmission facilities. We own 100 percent of Conenhua and manage its operations. Conenhua obtained the concession for power transmission in the Huancavelica area in 1983 and subsequently obtained concessions in the Cajamarca and Arequipa regions, enabling us to buy energy from Electro Perú and to transmit electric power to our mining facilities through our own facilities.
Conenhua
Conenhua is a wholly-owned subsidiary that provides electrical transmission and generation services. Conenhua obtained a concession for power transmission in the Huancavelica area in 1983, and subsequently obtained concessions in the Cajamarca and Arequipa regions. Conenhua’s transmission infrastructure enables us to purchase electricity from various power generating companies and transmit it to certain of our mining units and affiliates, including Uchucchacua, Orcopampa, Poracota, Shila-Paula, Antapite, Yanacocha, La Zanja and Coimolache, as well as to other mining companies and municipalities in the area.area, through our own facilities.
In order to secure a reliable energy supply from a clean and renewable source for our direct operations and projects at competitive prices, Conenhua, through its subsidiary Empresa de Generación Huanza S.A., or Huanza, was commissioned to construct a 90.6 megawatt, or MW, capacity hydroelectric power plant in the valley of Santa Eulalia. The construction of the 90.6 MW Huanza Hydroelectric Power Plant is in progress and should be completed by the end of 2012.the second quarter of 2013. This US$160180-200 million project commenced in March 2010 and has been partially financed through a US$119 million finance lease obtained from Banco de Crédito del Peru.
Buenaventura Ingenieros S.A.
Buenaventura Ingenieros S.A., or BISA, one of our wholly-owned subsidiaries, has provided geological, engineering, design and construction consulting services to the mining sector for over 30 years. During this time, BISA has consulted in Peru, Chile, Argentina, Mexico and Ecuador on a range of projects, operations and expansions. BISA owns a 99.99 percent interest in Contacto Corredores de Seguros S.A., an insurance brokerage company that provides insurance brokerage and related services to us and our affiliates.
Minera Julcani S.A. de C.V.
Minera Julcani S.A. de C.V., or Minera Julcani, is a wholly-owned subsidiary created for the purpose of conducting exploration pursuant to our joint venture agreement with Solitario México S.A. de C.V., or Solitario. Under this agreement, Solitario granted us the exclusive right to conduct exploration within its properties situated in Hidalgo, Mexico. The first earn-in phase of thisIn January 2012, we terminated the agreement allows us to earn a 51 percent participating interestwith Solitario.
Currently we are conducting due diligence on the Guadalupe project, an exploration property owned by contributing all the results derived as a result of our exploration expenditures as of or during the 54 months following July 2010. We may withdraw at any time upon contribution of the minimum required expense of US$2.0 million. Upon completion of the first earn-in phase, we may elect, in our sole discretion, to earn an additional 14 percent participating interest, for a total 65 percent participating interest, by completing a positive feasibility study at our cost as part of the second earn-in phase.
First Mexican Gold Corp.
Inversiones Colquijirca S.A. / Sociedad Minera El Brocal S.A.A.
Sociedad Minera El Brocal S.A.A., or El Brocal, owns the Colquijirca and Marcapunta Norte mines. El Brocal was formed in 1956 and is engaged in the extraction, concentration and sale of concentrates of polymetallic minerals, mainly zinc, lead and silver. On July 22, 2011, we completed the purchase of all of the outstanding equity of Inversiones Colquijirca S.A., which, in turn, owns 51.06 percent of El Brocal. As a result of this transaction, we increased our equity holding of El Brocal from 46.08 percent to a 53.76 percent controlling interest, including shares held directly by us and indirectly through our wholly-owned subsidiary, Inversiones Colquijirca S.A.
Minera La Zanja S.R.L.
Minera La Zanja S.R.L., or La Zanja, controls 32,070 hectares of mineralized ground in the La Zanja project, which is located 35 kilometers northwest of the city of Cajamarca. La Zanja, which is currently 53.06 percent owned by us and 46.94 percent owned by Newmont Peru, began operations in September 2010 as an open-pit mine producing gold and silver.
Compañía Minera Coimolache S.A.
Compañía Minera Coimolache S.A., or Coimolache, is a mining company that owns the Tantahuatay project, which is located in the province and district of Hualgayoc in the Cajamarca region, 35 kilometers northwest of the Yanacocha mine. We, SCC and other third parties hold a 40 percent interest, a 40 percent interest and a 20 percent interest, respectively, in Coimolache. Construction of mining infrastructure at the on the Tantahuatay mine commenced in July 2010. Gold mining operations commenced in mid-2011.
Canteras del Hallazgo S.A.C.
Canteras del Hallazgo S.A.C. holds mining rights to the Chucapaca project. We and Gold Fields hold a 49 percent interest and a 51 percent interest, respectively, inthis company.
Ferrovías Central Andino S.A.
We hold 10 percent of Ferrovías Central Andino S.A., or Ferrovías, a railroad company, pursuant to a concession granted to a consortium of several companies in April 2000. Among the other companies holding interests in the share capital of Ferrovías are Railroad Development Corporation, Cemento Andino S.A., Commonwealth Development Corporation and others. Ferrovías provides transportation for concentrates from El Brocal’s mining operations.
Sociedad Minera Cerro Verde S.A.A.
We currently hold a 19.3519.58 percent interest in Cerro Verde, which owns the Cerro Verde copper deposit located approximately 1,100 kilometers southeast of Lima. For more detail, see “Item 5. Operating and Financial Review and Prospects—Buenaventura” and “Item 5. Operating and Financial Review and Prospects—Cerro Verde.”
YANACOCHA
A. History and Development of the Company
Founded in Peru in 1992, Yanacocha is the largest gold producer in South America. Yanacocha produced 1,293,123ounces1,345,992ounces of gold in 2011.2012. Yanacocha’s operations are located in the Andes Mountains in Northern Peru in the area of Cajamarca, located approximately 900 kilometers north of Lima and north of the city of Cajamarca at an altitude of 4,000 meters above sea level. The Yanacocha property consists of six open-pit mines: Carachugo, Chaquicocha, Maqui Maqui, San José, Cerro Yanacocha and La Quinua. As of December 31, 2011,2012, the Chaquicocha, Cerro Yanacocha and La Quinua mines were in operation.
Yanacocha is developingcontinues to develop the Conga project, which consists of two gold-copper porphyry deposits that are estimated to more than double Yanacocha’s proven and probable reserves. The Conga project is located approximately 24 kilometers northeast of the Yanacocha operating mine in the provinces of Celendin, Cajamarca and Hualgayoc. Construction activityThe project consists of two gold-copper porphyry deposits that are estimated to more than double Yanacocha’s proven and probable reserves. However, since the middle of 2012, the development of Conga has been based on a “water first” approach, which consists of building the originally planned community water reservoirs prior to resuming any mine development. At the end of 2012, the first of these reservoirs in San Nicolás and associated roads were under construction. Activity relating to design and procurement continued throughout 2012 and earth work forwill be completed in early 2013, with the Conga project began in 2011. In November 2011, construction activities atmajority of equipment having already been delivered to the Conga project were suspended atYanacocha mine site. Work to ensure the request of Peru’s central government pending a revieweconomic viability as well as the social acceptance of the environmental viability ofproject continues in parallel with the project. The report was released in April 2012. As of the date of this Annual Report, Yanacocha is evaluating the report’s findings.site reservoir construction activities.
As of December 31, 2011,2012, Yanacocha’s proven and probable reserves (excluding the Conga project’s proven and probable reserves) were estimated to be 7.75.9 million ounces of gold, representing a 21percent23percent decrease over Yanacocha’s proven and probable reserves as of December 31, 2010,2011, which were estimated to be 9.77.7 million ounces of gold. As of December 31, 2011,2012, the Conga project’s proven and probable reserves were estimated to be 12.6 million ounces of gold and 3.3 billion pounds of copper, representing a 6 percent and 2 percent increase, respectively,unchanged from the estimated 20102011 gold and copper reserves. As of December 31, 2011,2012, Yanacocha’s total proven and probable reserves (including the Conga project) were estimated to be 20.318.5 million ounces of gold, representing a 69 percent decrease over Yanacocha’s total proven and probable reserves as of December 31, 2010,2011, which were estimated to be 21.520.3 million ounces of gold. Yanacocha’s total proven and probable reserves of copper were 3.23.3 billion pounds as of December 31, 2011.2012.
Proven and probable reserves are based on extensive drilling, sampling, mine modeling and metallurgical testing from which economic feasibility has been determined. Under the Management Contract (as defined below), Newmont Mining, in conjunction with Yanacocha, calculates Yanacocha’s reserves by methods generally applied within the mining industry and in accordance with SEC Industry Guide 7. Reserves represent estimated quantities of proven and probable ore that, under present and anticipated conditions, may be economically mined and processed. Newmont Mining has not quoted silver reserves at Yanacocha for the last year due to recovery issues.
In 2011,2012, Yanacocha produced 1,293,1231,345,992 ounces of gold, compared to 1,461,6201,293,123 ounces in 2010.2011.The decreaseincrease in gold production in 20112012 as compared to 20102011 was mainly attributable to mine sequencing resulting in a lower volume of ore placed on leach padshigher production at the La Quinua,gold mill facility at Yanacocha, and Carachugo mines, partially offset by higher mill grade and recovery.or theYanacocha Gold Mill, due to high ore grades from El Tapado pit.
Silver production was 3,561,991 ounces in 2010 and 1,348,004 ounces in 2011.2011 and 553,092 ounces in 2012.The decrease in silver production in 20112012 as compared to 20102011 was mainly attributable tolower oreounces placed due to Yanacocha’s decision not to conduct silver mining activities at the Yanacocha mine, which has high grade and lower recovery in the mill.
silver.
Yanacocha is owned 51.35 percent by Newmont Mining, through its wholly-owned subsidiary Newmont Second, 43.65 percent by us through our wholly-owned subsidiary Condesa and 5 percent by IFC. Yanacocha is managed by Newmont Peru. See “—Management of Yanacocha—General Manager/Management Agreement.” Although Yanacocha has no fixed dividend policy, there is an understanding among the partners that the net income not required for sustaining capital expenditures or future development projects should be distributed after agreement between the two major shareholders, Newmont Mining and us.
Capital Expenditures
Yanacocha’s capital expenditures from its formation in 1992 through 20112012 have related principally to the construction of the Carachugo, Maqui Maqui, San José, Cerro Yanacocha and La Quinua mining operations, the construction of two plants at Carachugo and Yanacocha, each of which includes a leach solution processing facility and a smelter at each plant, the construction of four carbon column plants at Cerro Yanacocha and La Quinua, the acquisition of both new and used mining equipment, the construction of two dams, the construction of one agglomeration plant at La Quinua, the construction of a gold mill facility at Yanacocha, or the Yanacocha Gold Mill, and several expansions of the leach pads located at the Carachugo, Maqui Maqui, Cerro Yanacocha and La Quinua mining operations.Yanacocha’s capital expenditures from its formation through December 31, 20112012 totaled approximately US$4,145.35,393 million, including capital expenditures of US$298.6 million in 2010 and US$1,094 million in 2011.2011 and US$1,148 million in 2012. In 2011,2012, Yanacocha’s principal capital expenditures included US$739498 million for engineering, construction equipment and off-site infrastructureequipment at the Conga project, US$156.3338 million for mine development at the El Tapado Oeste, the Western Oxides and Maqui Maquithe Eastern Oxides deposits, US$52.530 million for leach pad expansions at La Quinua (area of Western Oxides),equipment components, US$2425 million for land purchases,water treatment plant studies and construction, US$14.518 million for gold mill tailings improvements, US$17 million for bio-leach studies and plant construction and US$15 million for the standardization of information technology systems across the Newmont Group and the selection of SAP as its global information technology platform, US$9.9 million for water treatment project studies, US$9.6 million for La Quinua 2C studies of the instability and failure of the pit, US$8.6 million for life extension of the haul trucks fleet and US$4.9 million for construction of a new central warehouse.systems.
Yanacocha anticipates that its capital expenditures for 20122013 will be approximatelyUS$1,728566 million,, of which it plans to use approximately US$1,242300 million in connection with the construction of the Conga project. The remaining capital expenditure budget has been allocated for mine development at the El Tapado Oeste, Maqui Maquiinvestment in current operations and Chaquicocha deposits, leach pad expansions at La Quinua (Western Oxides and Eastern Oxides), standardization of information technology systems, continuation of the water treatment project, maintenance of the San Jose Reservoir, gold mill tailings pipelines, development of Verde bio-leach demonstration facility studies to upgrade gold recovery process and payments for waterways and irrigation channels acquired from the Encajón-Collotán communities.future operations.
Yanacocha expects that it will meet its working capital, capital expenditure and exploration requirements for the next several years from internally-generated funds, cash on hand and financing from banks and financial institutions.There can be no assurance that sufficient funding will be available to Yanacocha from internal or external sources to finance future working capital, capital expenditures and exploration and construction requirements, or that external funding will be available for such purposes on terms or at prices favorable to Yanacocha. A very significant decline in the price of gold would be reasonably likely to affect the availability of such sources of liquidity. See “Item 5. Operating and Financial Review and Prospects—Yanacocha—B. Liquidity and Capital Resources—Exploration Costs; Capital Expenditures.”
B. Business Overview
Description of Yanacocha’s Operations
The Yanacocha property consists of the following open-pit mines: Carachugo, Chaquicocha, Maqui Maqui, San José, Cerro Yanacocha, La Quinua Complex (La Quinua, El Tapado, Tapado Oeste), Cerro Negro Este, Western Oxide Pitspits (La Quinua Sur and Cerro Negro Oeste), Eastern Oxide Pitspits (Quecher Norte and Marleny) and Carachugo Alta.
Alto.
Leach pads are located atCarachugo (410 million ton capacity), Maqui Maqui (70 million ton capacity), Cerro Yanacocha (470 million ton capacity) and La Quinua (640 million ton capacity, including the Western Oxides). Each of these leach pads includes at least two leach solution storage ponds and storm water ponds located down gradient from each leach pad. The Cerro Yanacocha site has two additional solution ponds for the segregation of solution generated from the treatment of transition ores. A raw water pond is used both for storm containment and to store excess solution during the wet season.
Yanacocha has four processing facilities: Pampa Larga, Yanacocha Norte, La Quinua and the Yanacocha Gold Mill. The processing facilities can be used to process gold-bearing solutions from any of the leach pads through a network of solution pumping facilities located adjacent to the solution storage ponds or, in the case of the Yanacocha Gold Mill, to process high-grade gold ore to produce a gold-bearing solution for treatment at the La Quinua processing plant. The Yanacocha Gold Mill commenced operations in March 2008, and its total annual production is between 5.5 and 6.0 million dry metric tons, or DMT. Production at the Yanacocha Gold Mill is expected to significantly impact Yanacocha’s future production capabilities, with total production measured in life-of-mine ounces at the Yanacocha Gold Mill representing 38percent of the total ounces produced by Yanacocha. In order to balance mining production and Yanacocha Gold Mill total production capacity, Yanacocha has established ore stockpiles in which it deposits most of the ore from the pits, and feeds a small portion directly to the plant. The Yanacocha Gold Mill sources mill ore from the Yanacocha, Chaquicocha, El Tapado and Tapado Oeste pits.
Mining consists of a sequence of drilling, blasting, loading and hauling. Ore containing gold is transported from each mine to the nearest active leach pad while waste is taken to specially designed storage facilities. Ore is then leached by introducing diluted solutions of cyanide through an irrigation system placed on top of the ore. This solution percolates through the ore, dissolving gold and silver as AuCN and AgCN complexes respectively, and results in a “pregnant” solution which drains to solution storage ponds to be transferred to the nearest recovery facility. The end product is doré bars currently assaying approximately 52 percent gold and 45 percent silver. The doré bars are transported from the processing plant by an outside security firm to be refined outside of Peru. See “—Transportation and Refining.” The solution from which the gold is removed (barren solution) is recycled to the leach pads for further heap-leaching after having been reconstituted with cyanide. The leaching process is generally a closed system. However, during periods of high rainfall, excess water must be treated at the facilities located at Yanacocha Norte and Pampa Larga, which have been designed to meet or exceed standards for drinking water and for agriculture and livestock as set out by the Peruvian Ministry of Health, the U.S. Environmental Protection Agency, the State of Nevada Regulations and World Bank guidelines. See “—Regulation,“Regulation, Permit and Environmental Matters.”
Electric power for Yanacocha’s operations is currently provided by local power companies via two separate networks from the Cajamarca Norte substation in 60 kilovolts, or kV, and 220 kV, respectively. Yanacocha also maintains diesel generation capacity for emergency requirements, which have an aggregate power generation capacity of approximately 22 MW and plans to increase its reserve by 6 MW in 2012.33.75 MW. In addition, Yanacocha has been connected to the Peruvian national electricity grid since the end of 1997. Yanacocha currently receives its supply of electric power through a 220 kV power line originating in Trujillo, which is owned by Buenaventura and has the capacity to provide up to 150 MW to Yanacocha (although current contracted demand is limited to 70 MW). In addition, a 60 kV power line routed through Cajamarca permits Yanacocha to receive up to 10 MW. This power line is used only in emergencies. See “Item 5. Operating and Financial Review and Prospects.”
Water for Yanacocha’s operations is collected from rainfall and wells. All excess water used by Yanacocha undergoes treatment at the facilities described above.
Set forth below are certain unaudited operating data for the years shown for each of Yanacocha’s mining operations that were then in operation:
| 2009 | 2010 | 2011 | 2010 | 2011 | 2012 | |||||||||||||||||||
| Mining Operations: | ||||||||||||||||||||||||
| Ore mined (DST): | ||||||||||||||||||||||||
| Cerro Yanacocha | 74,309,421 | 28,817,797 | 1,434,279 | 28,817,797 | 1,434,279 | 1,244,162 | ||||||||||||||||||
| Carachugo | 5,895,215 | 23,455,796 | 31,494,122 | 23,455,796 | 31,494,122 | 26,270,839 | ||||||||||||||||||
| Maqui Maqui | — | 1,267 | 542,447 | 1,267 | 542,447 | 1,590,491 | ||||||||||||||||||
| La Quinua | 66,806,796 | 26,348,322 | 27,161,711 | 26,348,322 | 27,161,711 | 9,988,448 | ||||||||||||||||||
| San José | — | 5,090,528 | 3,556,183 | 5,090,528 | 3,556,183 | 692,086 | ||||||||||||||||||
| Cerro Negro | — | — | 24,231 | — | 24,231 | 2,872,609 | ||||||||||||||||||
| Total ore mined (DST) | 147,011,432 | 83,713,710 | 64,212,973 | 83,713,710 | 64,212,973 | 42,658,634 | ||||||||||||||||||
| Average gold grade of ore mined (oz./DST): | ||||||||||||||||||||||||
| Cerro Yanacocha | 0.022 | 0.032 | 0.011 | 0.032 | 0.011 | 0.052 | ||||||||||||||||||
| Carachugo | 0.022 | 0.028 | 0.034 | 0.028 | 0.034 | 0.032 | ||||||||||||||||||
| Maqui Maqui | — | 0.007 | 0.010 | 0.007 | 0.010 | 0.016 | ||||||||||||||||||
| San José | — | 0.016 | 0.019 | 0.016 | 0.019 | 0.017 | ||||||||||||||||||
| La Quinua | 0.023 | 0.019 | 0.030 | 0.019 | 0.030 | 0.052 | ||||||||||||||||||
| Cerro Negro | — | 0.004 | 0.012 | |||||||||||||||||||||
| Total average gold grade of ore mined (oz./DST) | 0.025 | 0.031 | 0.035 | |||||||||||||||||||||
| Total average gold grade of ore mined (oz./DST) | 0.022 | 0.025 | 0.031 | |||||||||||||||||||||
| Gold production (oz.): | ||||||||||||||||||||||||
| Cerro Yanacocha | 1,087,028 | 659,080 | 659,996 | 659,080 | 659,996 | 141,038 | ||||||||||||||||||
| Carachugo | 453,374 | 399,268 | 319,994 | 344,698 | 274,723 | 690,503 | ||||||||||||||||||
| Maqui Maqui | 18,555 | 12,701 | 9,906 | 12,701 | 9,906 | 5,810 | ||||||||||||||||||
| San José | — | — | — | 54,570 | 45,271 | 8,117 | ||||||||||||||||||
| La Quinua | 499,223 | 390,571 | 303,226 | 390,571 | 303,226 | 488,320 | ||||||||||||||||||
| Cerro Negro | — | — | 12,204 | |||||||||||||||||||||
| Total gold (oz.) | 2,058,180 | 1,461,620 | 1,293,123 | 1,461,620 | 1,293,123 | 1,345,992 | ||||||||||||||||||
Exploration
Yanacocha’s mining activities encompass 320,121313,049 hectares covered by 454439 mining concessions. Of these 320,021313,049 hectares, Chaupiloma holds the mining rights related to 106,765105,666 hectares, covered by 144 mining concessions. Chaupiloma has assigned these mining concessions to Yanacocha pursuant to several assignments of mining rights, each with an initial term of 20 years, which are renewable at Yanacocha’s request for an additional 20-year term.
Yanacocha has three processing concessions from the MEM for its processing plants: Cerro Yanacocha (Yanacocha Gold Mill, Cerro Negro, La Quinua and Yanacocha), Yanacocha (Carachugo and Pampa Larga) and China Linda. The processing concessions have indefinite terms, subject to the payment of an annual fee based on nominal capacity for the processing plant. An additional processing concession is pending for the Conga project.
Exploration expenditures amounted to approximately US$34.624.0 million and US$66.340.0 million in 20102011 and 2011,2012, respectively. These expenditures have resulted in the identification of several deposits, which have been advanced to reserves, including Carachugo, Maqui Maqui, San José, Cerro Yanacocha, La Quinua (which includes Cerro Negro), Chaquicocha, El Tapado, El Tapado Oeste (Corimayo), Antonio, Quecher and the Conga project (Perol, Chailhuagón and Amaro). Exploration expenditures have also been used to identify deep sulfide mineralization beneath the oxide deposits at El Tapado, El Tapado Oeste (Corimayo), Antonio, Maqui Maqui,North, Yanacocha Sur, La Quinua Sur and Chaquicocha.Cerro Negro, to reevaluate and advance the Chaquicocha Sulfides and Yanacocha Verde projects and to complete additional drilling designed to increase ore grade and resources and continue exploration in the Yanacocha district and surrounding areas. In 2012,2013, exploration efforts will focus on further identifying sulfide mineralization beneath existing oxide resources, higher grade deep targetscontinuing the development of the Chaquicocha Sulfides project, testing the extension of the Yanacocha Verde deposit, continuing exploration in the Yanacocha district and copper-gold mineralization related to thatconducting an exploration program in reserve at the Conga project.
Yanacocha concession block outside of the operation district.
Yanacocha’s exploration expenditures include all of the costs associated with exploration activities such as drilling, geological and metallurgical testing. In addition, exploration costs cover engineering and project development costs on advanced stage projects. Yanacocha prepares a budget for each year and allocates an amount for exploration activities based on specific projects or regions.
Yanacocha intends to continue to develop the Cerro Yanacocha, La Quinua and Chaquicocha gold deposit projects and the Conga gold-copper deposit project over the next several years, while continuing to explore the remainder of the Yanacocha district along with the adjacent Minas Conga and Solitario mineral holdings. The Conga project currently consists of two gold-copper porphyry deposits that are estimated to more than double Yanacocha’s proven and probable reserves. The Conga project is located approximately 24 kilometers northeast of Yanacocha’s operating mine in the provinces of Celendin, Cajamarca and Hualgayoc. This project, incorporated into reserves beginning in 2004 and 2005, reported 12.6 million ounces of gold reserves and 3.3 billion pounds of copper reserves as of December 31, 2011.2012.
In November 2011,Due to local political and community protests, construction and development activities at the Conga project were largely suspended at the request of Peru’s central government following increasing protests in Cajamarca by anti-mining activists led by the regional president. At the requestNovember 2011. The results of the Peruvian central government,government-initiated EIA independent review were announced on April 20, 2012 and confirmed that our initial EIA met Peruvian and international standards. The review made recommendations to provide additional water capacity and social funds, which Yanacocha has largely accepted. Yanacocha announced its decision to move the environmental impact assessment preparedproject forward on a “water first” approach on June 22, 2012. As a result, investment on the project will be reduced in connection2013 to approximately US$250 million to US$300 million, and focus on building water reservoirs, completing the last engineering activities and accepting delivery of the main equipment purchases. Construction of Conga and the implementation of the independent EIA review recommendations will continue provided it can be done in a safe manner with risk-adjusted returns that justify future investment. Should Yanacocha be unable to continue with the project, which was previously approved by the central government in October 2010, was reviewed by independent experts in an effort to resolve allegations surrounding the environmental viability of thecurrent development plan at Conga, project. Construction was suspended for the duration of the review, except for sediment control works conductedwe or our mining partners in the project area. The report was releasedmay reprioritize and reallocate capital to development alternatives which may result in April 2012. As of the date of this Annual Report, Yanacocha is evaluating the report’s findings. Progress continues on engineering and procurement work.a potential accounting impairment.
For 2012,2013, Yanacocha estimates expenditures of US$54million19.8 million for exploration, which will be expensed, and an additional US$2.41.2 million related to delineation, characterization and sterilization activities for ore bodies that are currently classified as reserves, which will be capitalized.reserves. Both expenditure estimates are exclusive of significant development engineering charges. This budgeted amount will be expended mainly on sulfide development at Yanacocha the Conga project environs and the San José gravel deposits along with an extensive exploration program in district and regional properties that Yanacocha controls.
As of December 31, 2011,2012, the Yanacocha district’s proven and probable reserves (excluding the Conga project’s proven and probable reserves) were estimated to be 7.75.9 million ounces of gold, a 2123 percent decreasefrom the Yanacocha district’s proven and probable reserves as of December 31, 2010,2011, which were estimated to be 9.77.7 million ounces of gold. The decreasein reserves of gold was mainly due to mine depletion, and to a mining depletion of 1.6 million ounces and 0.4 million ounces of netlesser extent, to reserve revisions due to revised pit designs, geotechnical changes and leach padand stockpile inventory adjustments due to low performance in transitional recovery.changes.
As of December 31, 2011,2012, the Conga project’s proven and probable reserves were estimated to be 12.6 million ounces of gold and 3.3 billion pounds of copper, representing a 6 percent and 2 percent increaseunchanged from the 20102011 gold and copper reserves, respectively.reserves.
| 55 |
Transportation and Refining
The doré bars produced by Yanacocha are transported to refineries outside of Peru and, accordingly, Yanacocha has entered into pre-established transportation contracts. Yanacocha has engaged Hermes Transportes Blindados S.A., or Hermes, to service its local transportation requirements. Under the terms of Yanacocha’s agreement with Hermes, the risk of loss with respect to the doré bars is assumed in its entirety by Hermes during the transportation of the doré bars from the mines to Jorge Chávez Airport in Lima. Thereafter, the responsibility for the doré bars shifts to the refiner, which has entered into a contract with an outside security firm to provide offshore transportation. The doré bars are melted, weighed and sampled in refineries abroad, which store the doré bars in strong-room vaults and assume responsibility there for the doré bars. Yanacocha pays a predetermined fee for the refining service. The final output from refineries, known as London Good Delivery gold and silver, is credited to Yanacocha’s London bullion accounts until transferred to purchasers.
Sales of Gold
Yanacocha’s gold sales are made through a monthly open-bidding process in which Yanacocha auctions its production corresponding to the next four to five weeks. This bidding process is set up by Yanacocha with approximately 10 financial institutions and trading firms prior to each month. Yanacocha collects bids and confirms sales. The gold is typically sold on the date of departure from Jorge Chávez Airport in Lima. If a portion of gold remains unsold, it is sold on the spot market within a few days. Silver is sold on the spot market approximately once a month to financial institutions or trading firms. The cash from such sales is received into a collection account in London against orders to the London bullion bank for deliveries of the gold and silver to the purchasers.
Delivery is made once a week and payments are collected on the day of confirmation. The payment price for the gold consists of either (i) the market price at the confirmation of the sale, or (ii) the average London PM Fixing price over the tendered period plus a small premium established pursuant to the bidding process. Since 1994, Yanacocha has consistently sold to five or six financial institutions and trading firms at each auction. Such buyers are market makers and active participants in precious metal markets.
Employees
As of December 31, 2011,2012, Yanacocha had 3,5472,647 employees.Compensation received by Yanacocha’s employees includes base salary and other non-cash benefits such as a health program and term life insurance. In addition, pursuant to the profit sharing plan mandated by Peruvian labor legislation, employees at Yanacocha are entitled to receive 8 percent of Yanacocha’s annual pre-tax profits, or the Employee Profit Sharing Amount, with 50 percent of such profits to be distributed based on the number of days each employee worked during the preceding year and the remaining 50 percent of such profits to be distributed among the employees based on the aggregate annual salary of each employee.
Yanacocha has entered into arrangements with independent contractors that are responsible for the security services and staffing for several operational and administrative areas. As of December 31, 2011,2012, independent contractors employed 6,6659,790 persons who worked at Yanacocha’s operations. In 2004, Yanacocha entered into its first collective bargaining agreement with a union representing certain of its employees, which was created on December 9, 2003. The Department of Industrial Relations meets regularly with union leaders to address labor problems in the organization and to promote the creation of a productive and harmonious labor environment. The parties address their issues through open and transparent dialogue. Yanacocha has informed us that it considers its relationsIn 2012, a new union was established, and in 2013, a new collective bargaining agreement process will occur with its employees to be good.
both the new union and existing unions.
Social Development
Since its formation, Yanacocha has been attentive to social development and its relationships with local communities.
During 2011,2012, Yanacocha invested a total of US$31.2 million in social matters, including US$16.140.5 million for social development at various projects, including the Conga project and “TheThe Associaiton Los Andes of Cajamarca Foundation” (ALAC), of which US$13.124.4 million was used for farming activities, promotion of community capabilities, education and public infrastructure. Additionally, Yanacocha invested US$16.1 million for social impact mitigation related to the implemention of social and livestock development projects, thefarming, construction of irrigation infrastructure, the development of a former landowner families program and the completion of pending commitments. The social investment projects are focused on water management, local economic development, education, health and institutional strengthening. In addition, Yanacocha invested US$2.0 million forcommitments with the maintenance of the Kunturwasi Road, an alternate road to the coast of Peru.surronding communitties.
In addition, Yanacocha also invested US$12.210.1 million in contributions for social investment through the Cajamarca Mining Solidarity Fund in 2011.2012.
Since 1993, Yanacocha has invested nearly US$345395.5 million in social development programs including education, health, social infrastructure (schools and medical posts), productive infrastructure projects, rural electrification, roads, transformation plants, business promotion programs, local touristtourism programs livestock and agricultural assistance programs.
Security
Yanacocha has 5751 security employees on its payroll, including 97 employees responsible for the security of the region as a whole. In addition, Yanacocha has a contracted security force of over 395221 persons assigned to rotating shifts at its mine, its Lima offices, the city of Cajamarca, and checkpoints along the road to the coast of Peru and residential areas in Cajamarca and the supervision of the security CCTV and alarm system.Cajamarca. The Conga project has a total of 189130 security personnel responsible for patrolling the project, including Yanacocha’s offices in the city of Cajamarca.
As of March 31, 2012,2013, none of Yanacocha’s employees, the properties on which it conducts mining operations or its Lima headquarters had been the target of a terrorist incident.
Mining and Processing Concessions
Yanacocha’s mining activities encompass 320,121313,049 hectares covered by 454439 mining concessions. Of these 320,021313,049 hectares, Chaupiloma holds the mining rights related to 106,765105,666 hectares, covered by 144 mining concessions. Chaupiloma has assigned these mining concessions to Yanacocha pursuant to several assignments of mining rights, each with an initial term of 20 years, which are renewable at Yanacocha’s request for an additional 20-year term. The rights to four additional concessions are currently pending, one of which relates to the Conga project.
Yanacocha believes that the mining concessions assigned to it are in full force and effect under applicable Peruvian laws and that it is in compliance with all material terms and requirements applicable to the mining concessions. Yanacocha is not experiencing any condition, occurrence or event known to it that would cause the revocation, cancellation, lapse, expiration or termination thereof, except that Yanacocha and Chaupiloma may, from time to time, remake, cancel, terminate or allow to lapse mining concessions assigned to Yanacocha that are not material to the conduct of Yanacocha’s business.
Yanacocha has been actively pursuing the acquisition of the land surface rights or obtaining easements relating to land positions containing prospective geological exploration target sites, deposits that can be developed in the future or areas that would be considered for plant or facility sites. To date, Yanacocha has acquired all the surface rights with respect to 24,502 hectares of the surface land covering its Carachugo, Chaquicocha, Maqui Maqui, Haussing, Laboratorio, Línea de Alta Tensión, Presas, Museo, Sorpresa Mishacocha, San José, Cerro Yanacocha, Las Lagunas, the Conga project, China Linda, Amaru, Chasu and La Quinua (which includes the Cerro Negro deposit) mining operations, and a majority of the Cerro Quilish deposit and Calera China Linda.
In addition, as of December 31, 2011,2012, Yanacocha had acquired 2,55524,692 hectares, including 2,4145,804 hectares of surface rights with respect to the Conga deposit, 107.813,589 hectares for Carachugo, 19.84Carachugo/San José/Chaquicocha, 2,154 hectares for Yanacocha and 13.121,651 hectares for Quilish. See “—Yanacocha—“Yanacocha—A. History and Development of the Company.”
Regulation, Permit and Environmental Matters
Yanacocha is subject to a full range of governmental regulation and supervision generally applicable to companies engaged in business in Peru, including mining laws, labor laws, social security laws, public health, consumer protection laws, environmental laws, securities laws and antitrust laws. See “—Buenaventura—B. Business Overview—Regulatory Framework—Mining and Processing Concessions” and “—Buenaventura—B. Business Overview—Regulatory Framework—Environmental Matters” for a general description of Peruvian regulations of mining companies and environmental obligations. See “—Mining and Processing Concessions” above for a discussion of Peruvian regulations relating to the mining and processing concessions utilized by Yanacocha in its mining operations.
Yanacocha is required to submit certain documentation with respect to its plans and operations for the review and approval of various Peruvian government entities, including the MEM, the Ministry of Agriculture, the Water National Authority, and the Ministry of Health. Yanacocha is required to file and obtain approval of an EIS with a Benefit Concession Permit for each of its mining operations before being authorized to operate such mine. EISs for the Carachugo, Maqui Maqui, San José, Cerro Yanacocha, La Quinua (including Cerro Negro) mining operations and China Linda lime plant have been approved. Pursuant to current Peruvian regulations, Yanacocha also submits supplemental EISs each time a project’s production rate or disturbed area used is expanded by more than 50 percent. In 2006, Yanacocha filed an EIS to expand its operations at the Yanacocha and La Quinua areas. After an EIS and the Benefit Concession Permit are approved and construction activities are initiated, a governmental-accredited environmental auditing firm is required to audit the operation. Each of the Carachugo, Maqui Maqui, San José, Cerro Yanacocha, La Quinua (including Cerro Negro) mining operations and China Linda lime plant has been and continues to be audited as required with no pollution problems identified.
Yanacocha’s corporate policy is tooperate in compliance with all applicable laws and regulations and adopt and adhere to standards that are protective of both human health and the environment at the facilities it builds and operates.
Yanacocha has informed us that its management believes that its operations are conducted in accordance withallapplicable laws and regulations.All future Audits and corrective action plans are used to assure compliance. Future exploration, expansion and constructionnew projects require or will require a variety of permits. Although procedures for permit applications and approvals are customarilyhave been historically faster in Peru than in the United States, permittingcurrent procedures and the existing regulatory environment are stillmore complex, time-consuming and subjectsusceptible to potential regulatory delay.
delays.
Yanacocha has informed us that as a result of the enactment of the new Water Resources Law and the new Rule for Exploration Activities,new environmental quality standards for water and new maximum permissible limits will require the adoption of new technologies for the adjustment of water treatment and management systems. In 2010, Yanacocha implemented a Water Management Project to improve its treatment system and water management in order to comply with the new water regulations.
Yanacocha has informed us that its management believes that it is in compliance with all applicable regulations and international standards concerning safety. For the year ended December 31, 2011,2012, Yanacocha experienced 47119 injuries compared to 4167 during the year ended December 31, 2010.2011.
Insurance
Yanacocha maintains a comprehensive insurance program designed to address the specific risks associated with its operations, in addition to covering the normal insured risks encountered by major mining companies.
Yanacocha’s insurance program consists of a “Primary Program” and an “Umbrella/Excess Program.” Coverage under the Primary Program is provided through the local Peruvian insurance market and includes employers’ liability, comprehensive third party general liability, comprehensive automobile liability, and all risk property on a replacement basis, including transit risks, business interruption insurance and mining equipment. Coverage under the Umbrella/Excess Program is provided through Newmont Mining’s master worldwide insurance program and addresses claims that the Primary Program cannot, or will not, cover. Yanacocha received an additional US$14.4 million settlement in 2008 from its insurance program in connection with a mercury spill.
By-Laws of Yanacocha
Yanacocha is governed by the Peruvian Companies Law and theestatutos (the combined articles of incorporation and by-laws) of Yanacocha, or the Yanacocha By-Laws.
Control Over Major Corporate Events
Pursuant to the Peruvian Companies Law and the Yanacocha By-Laws (including applicable quorum requirements), without the affirmative vote of the partners of Yanacocha representing at least 51 percent of the voting shares, none of the following may occur: (i) an increase or decrease in Yanacocha’s capital, (ii) the issuance of any debentures, (iii) any sale of an asset whose book value is at least 50 percent of the paid-in capital relating to such asset, (iv) any amendment to the Yanacocha By-Laws in order to change its business form, (v) the merger, consolidation, dissolution or liquidation of Yanacocha or (vi) any other amendment of the Yanacocha By-Laws.
Pursuant to the Shareholders Agreement among Newmont Second, Condesa,Compagnie Miniére Internationale Or S.A.and IFC, dated as of August 16, 1993, as amended by a General Amendment Letter, dated August 17, 1994, any member of the Executive Committee of Yanacocha who wishes to propose that Yanacocha’s Executive Committee authorize Yanacocha to take a Significant Action (as defined below) must (i) give written notice to each partner of such proposal prior to consideration thereof at a meeting of the Executive Committee and (ii) refrain from voting to approve such Significant Action until (x) the Executive Committee has received the consent of 80 percent of the partners of Yanacocha (a partner is deemed to have consented if no objection is received from such partner within 30 days after being notified) or (y) the Executive Committee has received the consent of at least 51 percent of the partners of Yanacocha and 45 days have elapsed since the member of the Executive Committee who proposed the Significant Action has responded in writing to objections received from objecting partners. “Significant Action” means (i) a disposal or sale of more than 20 percent by value of Yanacocha’s fixed assets, (ii) any planned shutdown or cessation of Yanacocha’s mining activities that is planned to last for more than one year, (iii) any capital expenditure by Yanacocha exceeding US$20 million, (iv) any disposal or sale by Yanacocha of the mining rights covered by certain concessions or (v) the approval of the construction of a project in the area owned by Yanacocha (other than the Carachugo mine and processing facilities).
Preemptive Rights
The Peruvian Companies Law and the Yanacocha By-Laws provide preemptive rights to all partners of Yanacocha. In the event of a capital increase, any partner has a preemptive right to pay its pro rata share of such increase in order to maintain such partner’s existing participation in Yanacocha.
In the event of a proposed transfer, exchange or sale, either voluntary or involuntary, of participation, collectively referred to as the Offered Participation, of one or more partners, any partner has a right to acquire the Offered Participation in proportion to its holdings of partners’ capital. In the event that not all of the partners wish to exercise this right or some indicate their decision to acquire a smaller share than that to which they are entitled, the other partners will be entitled to an increase, and consequently, the remaining participation will be distributed among them in proportion to such partners’ capital participation and within the maximum limit of the participation they have stated their intention to acquire. Finally, any Offered Participation remaining unsubscribed by the partners must first be offered to Yanacocha before they may be offered to third parties.
Legal Proceedings
For a discussion of legal proceedings, see Note 2019 to the Yanacocha Financial Statements.
Other than the legal proceedings described in the Yanacocha Financial Statements, Yanacocha is also involved in certain legal proceedings arising in the normal course of its business, none of which individually or in the aggregate is material to Yanacocha or its operations.
Management of Yanacocha
Executive Committee
Pursuant to the Yanacocha By-Laws, Yanacocha’s Executive Committee consists of six members, all of whom are appointed by the partners of Yanacocha. Richard T. O’Brien, President and Chief Executive Officer of Newmont Mining Corporation, has been appointed Chairman of Yanacocha’s Executive Committee, and Alberto Benavides, our former Chairman, serves as the Vice Chairman of Yanacocha’s Executive Committee through 2013. The Vice Chairman has the power to preside over the meetings of Yanacocha’s Executive Committee in the Chairman’s absence. The members of the Executive Committee are elected for a three-year term but may continue in their positions until the next election takes place and the newly elected members accept their positions. Alternate members are elected in the same manner as members and can act in place of and with all the authority of members when a member is unavailable, except that an alternate member may not act as either Chairman or Vice Chairman of Yanacocha’s Executive Committee. The Chairman has the right to cast the deciding vote in the event of a deadlock among Yanacocha’s Executive Committee.
General Manager/Management Agreement
The Yanacocha By-Laws provide that the Yanacocha Partners’ Meeting has the power to appoint and remove the Manager of Yanacocha; the Executive Committee has the power to appoint and remove other officers of Yanacocha, determine their duties and compensation and grant and revoke powers of attorney. Newmont Peru was named as Yanacocha’s Manager according to a publicly filed deed, and it continues to hold that position. Newmont Peru’s duties as Manager are defined in the Management Contract dated February 28, 1992, as amended, between Yanacocha and Newmont Peru. Pursuant to the Management Contract, Newmont Peru is responsible for managing, conducting and controlling the day-to-day operations of Yanacocha and keeping Yanacocha’s Executive Committee informed of all operations through the delivery of various written reports. The Management Contract was amended as of December 19, 2000. The amendment extends the term of the Management Contract for a period of 20 years starting at the date of amendment and provides that it may be extended for additional terms of 20 years upon request by Newmont Peru. Newmont Peru, however, may cancel the Management Contract by giving six months’ prior notice to Yanacocha. The Management Contract will be deemed terminated if, due to reasons attributable to the bad management of Yanacocha, except for reasons beyond its control, Newmont Peru is unable to substantially complete the agreed work programs. In exchange for its services as Manager, Newmont Peru receives remuneration of US$2 per ounce of gold production and its equivalent for copper production paid on a quarterly basis, which amount is expected to cover the overhead and administrative expenses for the management of the operations. Also, Newmont Peru may charge Yanacocha for the salaries of employees of Newmont Peru or its affiliates who are directly involved in the operation of Yanacocha. In 2011,2012, Yanacocha accrued fees of US$2.688 million owed to Newmont Peru and its affiliates under the Management Contract.
Control Over Major Corporate Events
See “—By-Laws of Yanacocha” above for a description of certain provisions of Peruvian law and of the Yanacocha By-Laws relating to control over major corporate events.
Preemptive Rights and Rights of First Refusal
See “—By-Laws of Yanacocha” above for a description of certain provisions of Peruvian law and of the Yanacocha By-Laws relating to preemptive rights and rights of first refusal.
D.Property, Plants and Equipment
Our Properties
Introduction
We operate eightten mines: Julcani, Recuperada, Uchucchacua, Orcopampa, Poracota, Mallay, Breapampa, Antapite, Ishihuinca and Shila-Paula. We also have controlling interests in two mining companies which operate the Colquijirca, Marcapunta and La Zanja mines. We also own an electric power transmission company and an engineering services consulting company and have non-controlling interests in several other mining companies, including a significant ownership interest in companies that own and operate the Yanacocha, Cerro Verde and Tantahuatay mines. See “—Buenaventura—Organizational Structure” and “—Intermediate Holding Companies, Subsidiaries and Equity Participations.” Set forth below is a map of our principal mining operations as of April 30, 2012.2013.
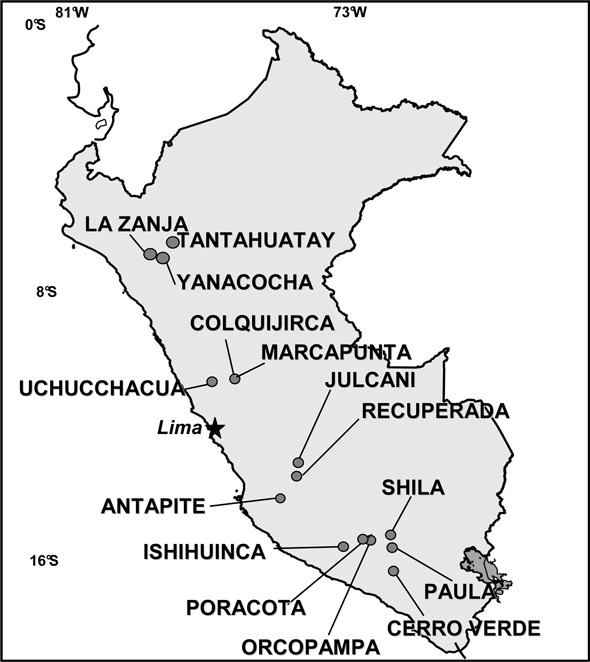
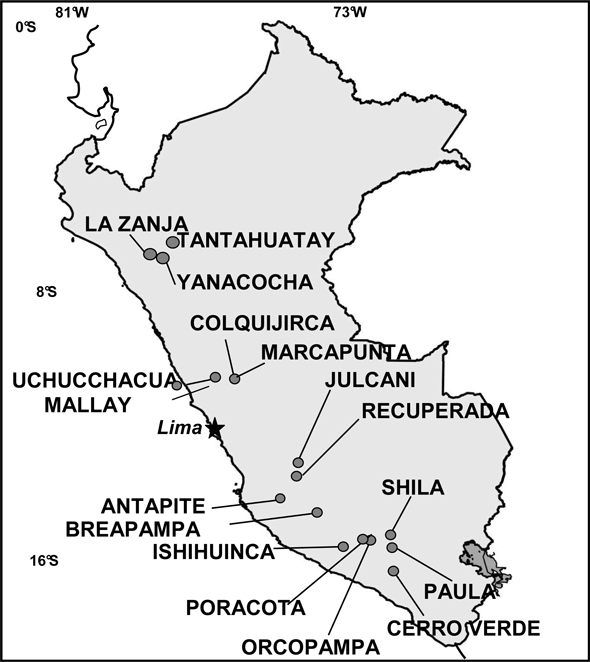
Operating Properties
Orcopampa
The Orcopampa mine is wholly owned and operated by us. We lease the rights to the mining concessions of Orcopampa from a group of private investors. This lease, which expires in 2043, requires a payment from us equal to 10 percent of production value, subject to certain conditions. Operations started in the Orcopampa mine in 1965. In 2011,2012, we made lease payments of US$31.88million.38.39million. We operated Orcopampa as a silver mine until the late 1990s, when we also began to mine gold-bearing veins. At December 31, 2011,2012, the net total fixed assets of Orcopampa were approximately US$61.1million.60.3 million.
The Orcopampa mine is located in the province of Castilla, department of Arequipa, approximately 1,350 kilometers southeast of the city of Lima, at an altitude of between 3,800 and 4,500 meters above sea level. Access is by a 192-kilometer unpaved public road, which connects to the Pan American highway, and by airstrip.
The Orcopampa mining property consists of an epithermal gold telluride deposit hosted by early Miocene to Holocene calc-alkaline to high potassium calc-alkaline lava flows and domes of the Sarpane Complex, which forms part of the tertiary metallogenic (Au-Ag) belt of Southern Peru.
Mining at Orcopampa is conducted underground using the mechanized cut-and-fill method. Ore is processed at a mill located at Orcopampa. Electric power is generated and supplied by a 3,900 kW hydroelectric plant that is owned by us and a power line, which is connected to the Peruvian national electricity grid. Water for operations at Orcopampa is obtained from a lake and three rivers. When water is scarce, electric power for the Orcopampa mine can be provided by a 3,976 kW diesel generator. In 2011,2012, we begancompleted construction of a new tailing dam to extend the life of this mine. The 4A tailing dam has a capacity of 2.5 million cubic meters and is expected to be operational in late 2012.until 2016.
During 2011,2012, we focused our geological exploration below the 3,440-meter level on the Nazareno, Esperanza, Prosperidad, Lucia Angela and Concepción veins and other main veins.below the 3,540-meter level on the Natividad-Ocoruro vein system. We completed 12,12513,283 meters of underground mining exploration works and 29,17033,630 meters of diamond drilling. We also deepened the Nazareno and Prometida shafts, which will improve our exploration of the lower levels of the Chipmo mine. In 2012,2013, we plan to continue exploration of the lower levels of the Chipmo mine and have deepened the Nazareno shaft and ramps system in preparation.mine. We also plan to explore the northeastsoutheast extension of mineralized structures at Pucay and OcoruroNatividad-Ocoruro at the 3,540-meter level through underground mining workstunnel development and diamond drilling.
As of December 31, 2011,2012, we calculated proven ore reserves of 637,675673,722 DST,, with 0.500.53 ounces per ton of silver and 0.4730.43 ounces per ton of gold, and probable ore reserves of 381,989417,169 DST,, with 0.500.56 ounces per ton of silver and 0.4280.40 ounces per ton of gold. We have estimated NRM of 228,771420,030 DST, with 0.805.05 ounces per ton of silver and 0.4180.435 ounces per ton of gold.
Set forth below are certain unaudited operating data for the periods shown for Orcopampa, calculated on the basis of 100 percent of the mine’s production.
| Year Ended December 31,(1)(2) | ||||||||||||
2009 | 2010 | 2011 | ||||||||||
| Mining Operations: | ||||||||||||
| Ore mined (ST) | 484,621 | 484,767 | 499,732 | |||||||||
| Average gold grade (oz./ST) | 0.602 | 0.625 | 0.551 | |||||||||
| Average silver grade (oz./ST) | 0.21 | 0.30 | 0.40 | |||||||||
| Production: | ||||||||||||
| Gold (oz.) | 315,277 | 319,694 | 285,200 | |||||||||
| Silver (oz.) | 91,525 | 104,400 | 320,964 | |||||||||
| Recovery rate (gold) (%)(3) | 95.7 | 95.9 | 94.8 | |||||||||
| Recovery rate (silver) (%)(3) | 57.8 | 53.5 | 54.3 | |||||||||
| Year Ended December 31,(1) (2) | ||||||||||||
| 2010 | 2011 | 2012 | ||||||||||
| Mining Operations: | ||||||||||||
| Ore mined (ST) | 484,767 | 499,732 | 508,647 | |||||||||
| Average gold grade (oz./ST) | 0.625 | 0.551 | 0.492 | |||||||||
| Average silver grade (oz./ST) | 0.30 | 0.40 | 0.43 | |||||||||
| Production: | ||||||||||||
| Gold (oz.) | 319,694 | 285,200 | 260,379 | |||||||||
| Silver (oz.) | 104,400 | 320,964 | 425,620 | |||||||||
| Recovery rate (gold) (%)(3) | 95.9 | 94.8 | 95.9 | |||||||||
| Recovery rate (silver) (%)(3) | 53.5 | 54.3 | 50.5 | |||||||||
| (1) | Incorporates losses for mining dilution and recovery. |
| (2) | Incorporates gold and silver production from final tail treatment. During |
| (3) | Only reflects recovery rate of gold and silver from Chipmo ore. |
Poracota
Poracota is an underground mine that is wholly owned and operated by us. Poracota is located in the province of Condesuyos, department of Arequipa, at an altitude of between 4,500 and 5,000 meters above sea level. Access to the mine is available by means of a 33-kilometer unpaved road connected to the Orcopampa mine. Operations at our Poracota mine commenced in February 2007. As of December 31, 2011,2012, Poracota’s net total fixed assets were approximately US$2.62.4 million.
Gold mineralization at Poracota has been classified as an epithermal high sulfidation system, which is formed by two main areas, Huamanihuayta and Perseverancia. The more important veins are María Fé, Silvana, Rocio and Malena, which are hosted by the tertiary rocks of the Huamanihuayta volcano.
Ore from the Poracota mine is treated by flotation at the Orcopampa concentrator plant.
During 2011,2012, we conducted 8,6089,554 meters of underground exploration tunnels and 25,18234,361 meters of diamond drilling. In 2012,2013, we plan to continue our exploration efforts in Huamanihuayta Oeste (brownfield) and other parallelevaluate three new structures, southJuliana, Milagros and Marely, as well as the southwest extension of María Fé,the Malena, Silvana and Rocio.Paoloa veins.
As of December 31, 2011,2012, we calculated Poracota’s proven reserves of 39,85929,741 DST, with 0.4400.332 ounces per ton of gold and 0.2030.096 ounces per ton of silver, and probable reserves of 4,1126,746 DST, with 0.4000.330 ounces per ton of gold and 0.0100.004 ounces per ton of silver. The NRM for sulfides and oxides was 891,58429,212 DST, with 0.2080.386 ounces per ton of gold and 4,093,8874,093,924 DST, with 0.0320.037 ounces per ton of gold, respectively.
Set forth below are certain unaudited operating data for the periods shown for Poracota, calculated on the basis of 100 percent of the mine’s production.
| Year Ended December 31, | ||||||||||||
| 2009 | 2010 | 2011 | ||||||||||
| Mining Operations: | ||||||||||||
| Ore mined (ST) | 244,450 | 245,041 | 260,475 | |||||||||
| Average gold grade (oz./ST) | 0.261 | 0.290 | 0.236 | |||||||||
| Average silver grade (oz./ST) | 0.16 | 0.15 | 0.23 | |||||||||
| Production: | ||||||||||||
| Gold (oz.) | 51,516 | 59,803 | 49,201 | |||||||||
| Silver (oz.) | 30,395 | 27,169 | 43,092 | |||||||||
| Recovery rate (gold) (%) | 80.8 | 84.2 | 81.8 | |||||||||
| Recovery rate (silver) (%) | 79.1 | 73.8 | 74.6 | |||||||||
| Year Ended December 31, | ||||||||||||
| 2010 | 2011 | 2012 | ||||||||||
| Mining Operations: | ||||||||||||
| Ore mined (ST) | 245,041 | 260,475 | 134,886 | |||||||||
| Average gold grade (oz./ST) | 0.290 | 0.236 | 0.183 | |||||||||
| Average silver grade (oz./ST) | 0.15 | 0.23 | 0.180 | |||||||||
| Production: | ||||||||||||
| Gold (oz.) | 59,803 | 49,201 | 19,238 | |||||||||
| Silver (oz.) | 27,169 | 43,092 | 16,181 | |||||||||
| Recovery rate (gold) (%) | 84.2 | 81.8 | 77.8 | |||||||||
| Recovery rate (silver) (%) | 73.8 | 74.6 | 67.4 | |||||||||
Uchucchacua
The Uchucchacua mine is wholly owned and operated by us. Operations started in 1975, and Uchucchacua is currently our largest producer of silver. Uchucchacua is located in the province of Oyón, department of Lima, approximately 265 kilometers northeast of the city of Lima at an altitude of between 4,000 and 5,000 meters above sea level. At December 31, 2011,2012, the net total fixed assets of Uchucchacua were approximately US$43.655.1 million.
Uchucchacua’s mineral structures are hosted by Mesozoic limestone of the Jumasha Formation and are classified as a mesothermal polymetallic deposit of silver-lead-zinc with important contents of manganese. The main mineralized structures are veins and ore bodies with high-grade silver mineralization.
Mining at Uchucchacua is conducted underground utilizing cut-and-fill stopping, shrinkage stopping, and sublevel stopping methods. Ore is processed at a mill located at Uchucchacua. The mill has a rated capacity of 3,000 DST per day, and utilizes differential flotation to obtain a lead-silver concentrate and a zinc concentrate. Electric power is generated by a 3,400 kW hydroelectric plant that we own and by a 3,025 kW diesel generator. We utilize a power line connecting Uchucchacua to the Peruvian national electricity grid and have electrical distribution facilities within the Uchucchacua mine. Water for operations at Uchucchacua is obtained from three lakes. In 2011,2012, we commencedcontinued construction of a manganese sulfate plant located in Huaral,Sayan, Lima which will treat Uchucchacua’s mine concentrate, improve silver recovery and increase the average realized price for silver concentrates produced at this mine. We will begin opearating the manganese sulfate plant in May 2013.
In 2011,2012, we conducted exploration efforts on three mines: Socorro, Carmen and Huantajalla. We completed 52,84152,494 meters of diamond drilling and constructed 19,13123,236 meters of underground exploration tunnels. During 2012,2013, we plan to focus our exploration efforts mainly on Huantajalla and Socorro.Socorroto to incease our reserves with high grades of silver-maganese.
At December 31, 2011,2012, proven ore reserves were 3,023,4603,498,580 DST, with 13.712.6 ounces per ton of silver, 1.41.21 percent lead and 1.91.77 percent zinc, and probable ore reserves were 1,689,4752,186,410 DST, with 13.812.8 ounces of silver per ton, 1.41.32 percent lead and 1.91.78 percent zinc. Total NRM was 3,222,1573,815,346 DST, with 13.713.2 ounces per ton of silver, 1.891.66 percent lead and 2.332.20 percent zinc.
Set forth below are certain unaudited operating data for the periods shown for Uchucchacua, calculated on the basis of 100 percent of the mine’s production.
Year Ended December 31,(1) | ||||||||||||
| 2009 | 2010 | 2011(2) | ||||||||||
| Mining Operations: | ||||||||||||
| Ore mined (ST) | 1,017,117 | 1,013,395 | 1,086,124 | |||||||||
| Average silver grade (oz./ST) | 13.98 | 12.93 | 13.04 | |||||||||
| Average zinc grade (%) | 1.56 | 1.47 | 1.31 | |||||||||
| Average lead grade (%) | 1.10 | 0.98 | 0.89 | |||||||||
| Production: | ||||||||||||
| Silver (oz.) | 10,555,566 | 9,269,718 | 10,090,337 | |||||||||
| Zinc (ST) | 9,049 | 7,702 | 7,351 | |||||||||
| Lead (ST) | 9,423 | 8,687 | 8,319 | |||||||||
| Recovery rate (silver) (%) | 74.0 | 70.7 | 71.20 | |||||||||
| Year Ended December 31,(1) | ||||||||||||
| 2010 | 2011(2) | 2012(2) | ||||||||||
| Mining Operations: | ||||||||||||
| Ore mined (ST) | 1,013,395 | 1,086,124 | 1,156,656 | |||||||||
| Average silver grade (oz./ST) | 12.93 | 13.04 | 13.00 | |||||||||
| Average zinc grade (%) | 1.47 | 1.31 | 1.51 | |||||||||
| Average lead grade (%) | 0.98 | 0.89 | 1.02 | |||||||||
| Production: | ||||||||||||
| Silver (oz.) | 9,269,718 | 10,090,337 | 11,263,322 | |||||||||
| Zinc (ST) | 7,702 | 7,351 | 10,824 | |||||||||
| Lead (ST) | 8,687 | 8,319 | 9,636 | |||||||||
| Recovery rate (silver) (%) | 70.7 | 71.20 | 74.88 | |||||||||
| (1) | Incorporates losses for mining dilution and recovery. |
| (2) | Incorporates total Socorro, Carmen and Huantajalla mine production. |
Julcani
Julcani is an underground mine that is wholly owned and operated by us. We acquired Julcani in 1953 as our first operating mine. Julcani is located in the province of Angaraes, department of Huancavelica, approximately 500 kilometers southeast of Lima at an altitude of between 4,200 and 5,000 meters above sea level. As of December 31, 2011,2012, the net total fixed assets of Julcani were approximately US$3.87million.6.2million.
Julcani is a large polymetallic deposit in Central Peru, which principally produces silver that occurs mainly as tetrahedrite and sulfosalts in a multitude of mineralogically complex veins hosted by dacite domes, surge deposits and other tertiary volcanic rocks.
Ore is processed in a concentrator plant located adjacent to the mine entrance. The ore is crushed and ground, and bulk flotation is used thereafter to obtain a silver-gold-lead concentrate. The plant has a rated capacity of 400500 DST per day and had a 95.079 percent utilization rate in 2011.2012. Electric power is generated by three Conenhua hydroelectric plants. Power generation capacity from these plants is 800 kW, 1,200 kW and 760 kW, respectively. We also rely on the Peruvian national electricity grid for the mine’s remaining electrical power. Water for operations of Julcani is obtained from a creek, two springs and a lake.
During 2011,2012, our exploration activities were focused on deepening the main mineralized structures of our Acchilla and Estela mines.mines, where we completed 12,668 meters of underground exploration tunnels and 12,830 meters of diamond drilling. In 2012,2013, we plan to perform intense underground mining exploration in Acchilla and Estela, exploring, onat the 610-meter, 660-meter and 710-meter levels, 560 and 510 all recognized veins of Acchilla, and on levels 490at the 560-meter, 610-meter and 560660-meter of Estela, complemented by a diamond drilling program.
At December 31, 2011,2012, total proven ore reserves were 258,565261,405 DST, with 18.5 ounces per ton of silver, 0.021 ounces per ton of gold, 2.01.8 percent lead and 0.460.52 percent copper, and total probable ore reserves were 141,450163,200 DST, with 18.818.7 ounces per ton of silver, 0.0270.012 ounces per ton of gold, 2.11.9 percent lead and 0.520.44 percent copper. Total estimated NRM was 332,725315,475 DST, with 19.319.1 ounces per ton of silver, 0.0140.034 ounces per ton of gold, 2.0 percent lead and 0.30.60 percent copper.
Set forth below are certain unaudited operating data for the periods shown for Julcani, calculated on the basis of 100 percent of the mine’s production.
| Year Ended December 31,(1) | Year Ended December 31,(1) | |||||||||||||||||||||||
| 2009 | 2010 | 2011 | 2010 | 2011 | 2012(2) | |||||||||||||||||||
| Mining Operations: | ||||||||||||||||||||||||
| Ore mined (ST) | 112,000 | 127,500 | 140,300 | 127,500 | 140,300 | 141,820 | ||||||||||||||||||
| Average gold grade (oz./ST) | 0.010 | 0.024 | 0.022 | 0.024 | 0.022 | 0.017 | ||||||||||||||||||
| Average silver grade (oz./ST) | 17.61 | 18.96 | 18.62 | 18.96 | 18.62 | 18.50 | ||||||||||||||||||
| Average lead grade | 1.73 | 1.89 | 1.61 | 1.89 | 1.61 | 1.94 | ||||||||||||||||||
| Average copper grade (%) | – | 0.27 | 0.31 | 0.27 | 0.31 | 0.32 | ||||||||||||||||||
| Production: | ||||||||||||||||||||||||
| Gold (oz.) | 799 | 2,118 | 2,051 | 2,118 | 2,051 | 1,220 | ||||||||||||||||||
| Silver (oz.) | 1,819,375 | 2,237,063 | 2,428,330 | 2,237,063 | 2,428,330 | 2,438,084 | ||||||||||||||||||
| Lead (ST) | 1,744 | 2,202 | 2,065 | 2,202 | 2,065 | 2,529 | ||||||||||||||||||
| Copper (ST) | – | 3.5 | 394 | 3.5 | 394 | 423 | ||||||||||||||||||
| Recovery rate (gold) (%) | 75.0 | 76.1 | 66.6 | 76.1 | 66.6 | 51.2 | ||||||||||||||||||
| Recovery rate (silver) (%) | 92.2 | 92.5 | 92.9 | 92.5 | 92.9 | 92.9 | ||||||||||||||||||
| (1) | Incorporates losses for mining dilution and recovery. |
| (2) | Incorporates total Acchilla and Estela mine production. |
Recuperada
The Recuperada mine is wholly owned and operated by us. Recuperada is located in the province of Huancavelica, department of Huancavelica, approximately 540 kilometers southeast of Lima at an altitude of between 4,300 and 4,800 meters above sea level. Access is by a 242-kilometer unpaved public road, which connects to the Pan-American highway.Highway. Electricity is supplied by access to the Peruvian national electricity grid via a 50-kilometer power line, which has a capacity of 22 kilovolts and 4,000 kilowatts. At December 31, 2011,2012, the net total fixed assets of Recuperada were approximately US$35.3million.3.8million.
The Recuperada mining district mainly contains polymetallic mineralization in veins of zinc, lead and silver (including the Teresita, Esperanza and Angelica deposits), as well as some silver-rich veins (including the María Luz, Nancy Luz and Rico Antimonio deposits).
Recuperada is an underground mine that uses the conventional cut and fill mining method. Mine ore is processed at a concentrator plant on site with a processing capacity rate of 600 stpd. Tailing damsThe tailing dam on site currently provideprovides us with approximately 2.53.0 years of storage capacity based on current production rates.
During 2011,2012, we completed 8,6419,494 meters of underground exploration tunnels and 5,5107,995 meters of diamond drilling. We focused on searching for silver mineral in the Germana, Esperanza areaand Nancy Luz areas and completing exploration inat the 40-meter level 040 of the Teresita mine. In 2012,2013, we plan to continue exploration, focusing mainly in the Teresita mine.mines with silver mineralization, such as Germana Este, Nancy Luz, Acchisayhua and Escopeta.
At December 31, 2011,2012, total proven ore reserves were 70,40066,480 DST, with 7.38.3 ounces per ton of silver, 5.74.51 percent lead and 8.57.64 percent zinc, and total probable ore reserves were 44,31048,005 DST, with 8.59.5 ounces per ton of silver, 4.53.39 percent lead and 7.56.24 percent zinc. Total estimated NRM was 52,005121,560 DST, with 11.68.50 ounces per ton of silver, 2.04.67 percent lead and 3.76.74 percent zinc.
Set forth below are certain unaudited operating data for the periods shown for Recuperada, calculated on the basis of 100 percent of the mine’s production.
| Year Ended December 31,(1) | Year Ended December 31,(1) | |||||||||||||||||||||||
| 2009 | 2010 | 2011(2) | 2010 | 2011(2) | 2012(2) | |||||||||||||||||||
| Mining Operations: | ||||||||||||||||||||||||
| Ore mined (ST) | 57,620 | 120,800 | 112,450 | 120,800 | 112,450 | 117,600 | ||||||||||||||||||
| Average silver grade (oz./ST) | 6.79 | 5.03 | 4.67 | 5.03 | 4.67 | 4.19 | ||||||||||||||||||
| Average lead grade (%) | 2.87 | 3.10 | 3.07 | 3.10 | 3.07 | 3.20 | ||||||||||||||||||
| Average zinc grade (%) | 3.69 | 2.54 | 3.77 | 2.54 | 3.77 | 4.88 | ||||||||||||||||||
| Production: | ||||||||||||||||||||||||
| Silver (oz.) | 370,500 | 571,189 | 498,424 | 571,189 | 498,424 | 467,475 | ||||||||||||||||||
| Lead (ST) | 1,504 | 3,488 | 3,213 | 3,488 | 3,213 | 3,516 | ||||||||||||||||||
| Zinc (ST) | 1,801 | 2,494 | 3,581 | 2,494 | 3,581 | 4,898 | ||||||||||||||||||
| Recovery rate (silver) (%) | 94.7 | 94.1 | 94.9 | 94.1 | 94.9 | 94.78 | ||||||||||||||||||
| (1) | Incorporates losses for mining dilution and recovery. |
| (2) | Incorporates total Teresita, Esperanza and Angélica mine production. |
Antapite
Antapite is an underground mine that is wholly owned and operated by us. Antapite is located in the province of Huaytará, department of Huancavelica, approximately 434 kilometers southeast of the city of Lima at an altitude of approximately 3,400 meters above sea level. The Antapite mine consists of an epithermal low sulfidation gold deposit in veins hosted by Eocene-Miocene calc-alkaline volcanic rocks. At December 31, 2011,2012, the net total fixed assets of Antapite were approximately US$2.2million.2.0million.
Mining is conducted underground utilizing the conventional cut-and-fill stopping method. Ore is processed at a cyanidation plant located at Antapite. The plant has a capacity of 600 DST per day and had a 62.052.0 percent utilization rate in 2011.2012.
The Antapite mine obtains approximately substantially all of its electric power through the Peruvian national electricity grid. Water for operations at Antapite is obtained from an underground drainage system.
During 2011,2012, we focused our exploration efforts on the Antapite, Euriosa, Soledad, Olvidada, Pampeñita 1, Pucarumi, Fabiola, Nidia, Verónica and Alicia veins. We completed 11,7239,117 meters of underground exploration tunnels and 25,12620,830 meters of diamond drilling. In 2012,2013, we plan to continue our exploration efforts for ore reserves in the southeastern region ofover the mineralized alignments formed by the Soledad, Olvidada, Carolina, Amatista, Furiosa, Pucarumi and FuriosaZorro Rojo veins.
As of December 31, 2011,2012, total proven ore reserves were 20,95529,951 DST with 0.2580.330 ounces per ton of gold and 0.30.22 ounces per ton of silver, and total probable ore reserves were 8,50617,794 DST with 0.2480.210 ounces per ton of gold and 0.30.22 ounces per ton of silver. Total estimated NRM was 26,4206,790 DST, with 0.2620.280 ounces per ton of gold and 0.30.20 ounces per ton of silver.
Set forth below are certain unaudited operating data for the periods shown for Antapite, calculated on the basis of 100 percent of the mine’s production.
| Year Ended December 31,(1)(2) | Year Ended December 31,(1)(2) | |||||||||||||||||||||||
| 2009 | 2010 | 2011 | 2010 | 2011 | 2012 | |||||||||||||||||||
| Mining Operations: | ||||||||||||||||||||||||
| Ore mined (ST) | 142,760 | 145,915 | 155,842 | 145,915 | 155,842 | 86,113 | ||||||||||||||||||
| Average gold grade (oz./ST) | 0.228 | 0.254 | 0.190 | 0.254 | 0.190 | 0.142 | ||||||||||||||||||
| Average silver grade (oz./ST) | 0.46 | 0.34 | 0.295 | 0.34 | 0.295 | 0.219 | ||||||||||||||||||
| Production: | ||||||||||||||||||||||||
| Gold (oz.) | 31,004 | 35,803 | 28,588 | 35,803 | 28,588 | 11,720 | ||||||||||||||||||
| Silver (oz.) | 50,100 | 36,870 | 33,521 | 36,870 | 33,521 | 13,254 | ||||||||||||||||||
| Recovery rate (gold) (%) | 95.2 | 96.8 | 96.4 | 96.8 | 96.4 | 95.6 | ||||||||||||||||||
| Recovery rate (silver) (%) | 76.3 | 74.0 | 72.8 | 74.0 | 72.8 | 70.2 | ||||||||||||||||||
| (1) | Incorporates losses for mining dilution and recovery. |
| (2) | Data reflect only mining operations at the Antapite mine. |
Shila-Paula
Shila and Paula are underground mines that are wholly owned and operated by Cedimin, our wholly-owned subsidiary. Shila and Paula encompass an aggregate of41,152 hectares of mining concessions, which are owned by Cedimin.At December 31, 2011,2012, the net total fixed assets of the Shila and Paula mining operations were approximately US$5.33.5 million.
The Shila mine is located in the province of Castilla, department of Arequipa, approximately 1,350 kilometers southeast of Lima and 25 kilometers south of the Orcopampa mining operation, at an altitude of between 4,650 and 5,400 meters above sea level. Access is by a 250-kilometer unpaved road. The Shila mine is currently not operating due to a lack of ore reserves.
The Paula mine is located in the province of Castilla, department of Arequipa, approximately 1,400 kilometers southeast of the city of Lima and 40 kilometers south of the Orcopampa mining operation, at an altitude of between 5,000 and 5,400 meters above sea level.
Gold mineralization deposits in Shila-Paula have been classified as epithermal low sulfidation of the Quartz-Adularia-Sericite type. The veins are hosted in tertiary volcanic rocks associated with the Chinchón and Huayta calderas.
Mining operations are currently conducted only in the Paula mine. Mining is conducted underground using the conventional cut-and-fill stoppingascending method. Ore is processed at a metallurgical plant located at the Shila mine with a rated capacity of 230 DST per day. The plant had an approximately 6572 percent utilization rate in 2011. In addition, due to the high cost of transportation and smelting of the concentrates, we installed a small2012. The cyanidation plant at the Shila mine withhas a net capacity of 3,200 metric tons per year.
Electric power for Shila-Paula is currently provided by the Peruvian national electricity grid. Four diesel generators with a total installed capacity of 3,850 kW ensure the availability of electric power. The water for operations at Paula is obtained from runoff from snow peaks.
During 2011,2012, we completed 12,53811,397 meters of underground mining explorations and 24,40027,201 meters of diamond drilling, mainly atbelow the 4,830-meter and 4,780-levels,level, on the Nazareno, Ramal Crucero, Nazareno 3, Angélica Maria, Lucia, Betty Norte,Ramal Chapi, Liliana, Maria Belen and Juliana veins. In 2012,2013, we plan to explore the east and west extension of the Nazareno, Celinda and Angélica Maria veins at the 4,830-meter and 4,780-meter levels, and to continue our exploration efforts in all recognized veins.efforts.
As of December 31, 2011,2012, our proven ore reserves were 15,2045,971 DST, with 0.4600.410 ounces per ton of gold and 1.40.910 ounces per ton of silver and our probable ore reserves were 12,0862,400 DST, with 0.4730.364 ounces per ton of gold and 1.40.950 ounces per ton of silver. Total NRM was 17,13431,427 DST, with 0.4150.373 ounces per ton of gold and 1.00.91 ounces per ton of silver. All ore reserves and NRM are in the Paula mine.
Set forth below are certain unaudited operating data for Shila-Paula, calculated on the basis of 100 percent of both mines’ combined production.
| Year Ended December 31,(1)(2) | ||||||||||||
| 2009 | 2010 | 2011 | ||||||||||
| Mining Operations: | ||||||||||||
| Ore mined (ST) | 65,526 | 64,047 | 47,590 | |||||||||
| Average gold grade (oz./ST) | 0.386 | 0.234 | 0.319 | |||||||||
| Average silver grade (oz./ST) | 1.75 | 0.96 | 0.90 | |||||||||
| Production: | ||||||||||||
| Gold (oz.) | 24,072 | 14,157 | 14,594 | |||||||||
| Silver (oz.) | 85,994 | 46,578 | 34,833 | |||||||||
| Recovery rate (gold) (%) | 95.2 | 94.4 | 96.1 | |||||||||
| Recovery rate (silver) (%) | 74.8 | 75.9 | 79.3 | |||||||||
| Year Ended December 31,(1)(2) | ||||||||||||
| 2010 | 2011 | 2012(2) | ||||||||||
| Mining Operations: | ||||||||||||
| Ore mined (ST) | 64,047 | 47,590 | 59,056 | |||||||||
| Average gold grade (oz./ST) | 0.234 | 0.319 | 0.342 | |||||||||
| Average silver grade (oz./ST) | 0.96 | 0.90 | 2.022 | |||||||||
| Production: | ||||||||||||
| Gold (oz.) | 14,157 | 14,594 | 19,359 | |||||||||
| Silver (oz.) | 46,578 | 34,833 | 95,485 | |||||||||
| Recovery rate (gold) (%) | 94.4 | 96.1 | 95.98 | |||||||||
| Recovery rate (silver) (%) | 75.9 | 79.3 | 79.96 | |||||||||
| (1) | Incorporates losses for mining dilution and recovery. |
| (2) | Data reflect |
Ishihuinca
The Ishihuinca mine is wholly owned by us. We lease the rights to the mining concessions of Ishihuinca from a third party. The lease agreement, which expires in 2015, requires payment by Inminsur to the lessor of a royalty of 7 percent of the price of the concentrates sold.At December 31, 2011,2012, the net total fixed assets of Ishihuinca were approximately US$0.06million.
0.2million.
The Ishihuinca mine is located in the province of Caravelí, department of Arequipa, approximately 780 kilometers southeast of the city of Lima at an altitude of 2,200 meters above sea level. Access is by the Pan-American highway.Highway.
Mining is conducted underground utilizing the conventional cut-and-fill stopping method. Ore is processed at a metallurgical plant located at Ishihuinca. The metallurgical plant, which has a rated capacity of 220 DST per day, utilizes bulk flotation and gravity concentration processes. The bulk flotation process produces a copper/gold concentrate. The gravity concentrates and gold-bearing concentrates are treated by cyanidation in vats and agitator tanks, respectively. The dissolved gold obtained from the cyanidation of both concentrates is precipitated using zinc dust. The resulting precipitate is refined in Lima and then sold to Johnson Matthey.
Electric power is provided by three electric generators with total installed capacity of 2,315 kW. Water for operations at Ishihuinca is obtained from underground wells.
During 2011,2012, we conducted a programcompleted 1,156 meters of underground exploration and diamond drilling.tunnels. In 2012,2013, we plan to continue our exploration efforts to increase our reserves of gold ore by conducting intensive exploration in newsurrounding areas.
As of December 31, 2011,2012, our proven ore reserves were 12,6228,620 DST, with 0.3330.330 ounces per ton of gold, and probable ore reserves were 5,5064,327 DST, with 0.3430.342 ounces per ton of gold. Total NRM was 3,1802,938 DST, with 0.3510.369 ounces per ton of gold.
Set forth below are certain unaudited operating data for the periods shown for Ishihuinca, calculated on the basis of 100 percent of the mine’s production.
| Year Ended December 31,(1) | Year Ended December 31,(1) | |||||||||||||||||||||||
| 2009 | 2010 | 2011 | 2010 | 2011 | 2012 | |||||||||||||||||||
| Mining Operations: | ||||||||||||||||||||||||
| Ore mined (ST) | 3,055 | 4,708 | 8,092 | 4,708 | 8,092 | 17,751 | ||||||||||||||||||
| Average gold grade (oz./ST) | 0.265 | 0.223 | 0.269 | 0.223 | 0.269 | 0.261 | ||||||||||||||||||
| Average copper grade (%) | 0.45 | 0.53 | 0.50 | 0.53 | 0.50 | 0.18 | ||||||||||||||||||
| Production: | ||||||||||||||||||||||||
| Gold (oz.) | 638 | 917 | 1,773 | 917 | 1,773 | 4,016 | ||||||||||||||||||
| Copper (ST) | 9 | 16 | 27 | 16 | 27 | 22 | ||||||||||||||||||
| Recovery rate (gold) (%) | 81.90 | 80.3 | 8,092 | 80.3 | 8,092 | 86.57 | ||||||||||||||||||
| Recovery rate (copper) (%) | 66.80 | 68.7 | 0.269 | 68.7 | 0.269 | 67.29 | ||||||||||||||||||
| (1) | Incorporates losses for mining dilution and recovery. |
La Zanja
The La Zanja mine is located in the district of Pulan, province of Santa Cruz, department of Cajamarca in northern Peru. La Zanja consists of approximately 37,000 hectares of mining concessions and is located 48 kilometers northwest of the Yanacocha gold mine, at an average altitude of 3,500 meters above sea level. We hold a 53.06 percent interest in La Zanja and Newmont holds a 46.94 percent interest.
La Zanja is located within a large area of hydrothermal alteration, mainly related to epithermal gold deposits in high sulfidation environments, in addition to some vein systems of intermediate to low sulfidation. We have recognized two ore deposits: San Pedro Sur and Cerro Pampa Verde.
Mining operations are conducted through the open-pit method and carbon-in-column circuits are utilized to recover gold from heap leach operations. The gold-laden carbon is then transported to Yanacocha to continue processing into doré bars.
During 2011,2012, we completed 16,70026,026 meters of diamond drilling in areas around the San Pedro Sur open pit and added NRM of 100,000 ounces of gold and 600,000 ounces of silver. In 2012, we plan to enter the construction stage at Pampa Verde, which will consist of a 7-kilometer access road to transport ore to a lixiviation pad in San Pedro. We expect that Pampa Verde will enter production in the fourth quarter of 2012. We also plan to perform 13,000 meters of diamond drilling at San Pedro Sur, Pampa Verde and Cocan and 11,000Cocan. In 2013, we plan to perform 20,000 meters of diamond drilling at the Pampa Verde, San Pedro Sur and Cocan projects. We plan to complete our brownfield exploration of Castrejón and Cerro La Zanja.start mining at Pampa Verde in July 2013.
Total proven and probable ore reserves at December 31, 20112012 were 44,183,00824,795,233 DST, with 0.018 ounces per ton of gold and 0.208 ounces per ton of silver. Total NRM was 12,131,615 DST, with 0.015 ounces per ton of gold and 0.20 ounces per ton of silver. Total NRM was 4,420,510 DST, with 0.015 ounces per ton of gold and 0.110.211 ounces per ton of silver.
Set forth below are certain unaudited operating data for La Zanja, calculated on the basis of 100 percent of the mine’s production.
Year Ended December 31,(1) | Year Ended December 31,(1) | |||||||||||||||||||
| 2010 | 2011 | 2010 | 2011 | 2012 | ||||||||||||||||
| Mining Operations: | ||||||||||||||||||||
| Ore mined (ST) | 64,047 | 8,408,399 | 64,047 | 8,408,399 | 10,231,321 | |||||||||||||||
| Average gold grade (oz./ST) | 0.234 | 0.022 | 0.234 | 0.022 | 0.017 | |||||||||||||||
| Average silver grade (oz./ST) | 0.96 | 0.40 | 0.96 | 0.40 | 0.24 | |||||||||||||||
| Production: | ||||||||||||||||||||
| Gold (oz.) | 14,157 | 134,190 | 14,157 | 134,190 | 112,387 | |||||||||||||||
| Silver (oz.) | 46,578 | 363,927 | 46,578 | 363,927 | 387,877 | |||||||||||||||
| (1) | Data reflect mining operations at the San Pedro Sur deposit only. |
Tantahuatay
Tantahuatay is a gold-copper mine is located in the district and province of Hualgayoc, department of Cajamarca, in northern Peru, at an average altitude of 3,900 meters above sea level. The project includes a total of 17,721 hectares of mining claims. The Tantahuatay mine is wholly owned by Coimolache, in which we hold a 40 percent equity interest.
Geologically, the Tantahuatay deposits are located asat diatremes, or volcanic necks, in a predominantly sequence volcano magmatic hydrothermal manifestation, linked to the regional sector north of Peru. We have identified several geologic targets with gold mineralization and have conducted detailed studies of the Tantahuatay 2, Ciénaga Norte and Mirador Norte deposits.
Tantahuatay 2 consists of hydrothermal breccia bodies, formed by silicified tuff fragments in a matrix of quartz-alunite-pyrophyllite, with iron oxides inside fractures and cavities, which contain free gold and electrum as submicroscopic particles.
Ciénaga Norte and Mirador Norte consist of hydrothermal breccia bodies, formed in facies of vuggy silica and sandy silica, hosted in tuffs and hornblendichornblende lavas, which contain free submicroscopic gold mainly in iron oxides.
In August 2011, we received approval to commence operations at the Tantahuatay processing plant and began to produce gold and silver.silver at Tantahuatay 2.
During 2011, we completed 4,000 meters of diamond drilling to model and explore ore deposits. In 2012, we launched a new smelting furnace and completed the expansion in the capacity of our Merrill-Crowe-type ore processing facility from 800 to 1,100 cubic meters per hour. We also completed 6,763 meters of reverse circulation drilling to explore ore deposits and conduct metallurgical tests. In 2013, we expect to commencecomplete infrastructure construction to allow for mining of the Ciénaga Norte deposit.deposit in the fourth quarter of 2013.
Total proven and probable ore reserves at December 31, 20112012 were 24,790,00024,427,771 DST, with ore grades of 0.0240.019 ounces per ton of gold and 0.24 ounces per ton of silver. Total NRM in oxides was 109,082105,884,751 DST, with ore grades of 0.0130.012 ounces per ton of gold.gold and 0.17 ounces per ton of silver. Total NRM in sulfides was 422,317422,318,006 DST, with ore grades of 0.007 ounces per ton of gold, 0.1800.18 ounces per ton of silver and 0.660.67 percent copper.
Set forth below are certain unaudited operating data for the Tantahuatay mine, calculated on the basis of 100 percent of the mine’s production.
| ||||
Year Ended December 31,(1)(2) | ||||||||
| 2011 | 2012 | |||||||
| Mining Operations: | ||||||||
| Ore mined (ST) | 3,963,580 | 10,881,767 | ||||||
| Average silver grade (oz./ST) | 0.63 | 0.48 | ||||||
| Average gold grade (oz./ST) | 0.017 | 0.017 | ||||||
| Production: | ||||||||
| Silver (oz.) | 260,073 | 919,343 | ||||||
| Gold (oz.) | 46,164 | 141,268 | ||||||
| (1) | Incorporates losses for mining dilution and recovery. |
| (2) | Data reflect mining operations at the Tantahuatay 2 deposit only. |
Breapampa
The Breapampa mine, is wholly owned and operated by us and encompasses 38,690 hectares of mining concessions. It is located in the district of Chumpi, province Parinacochas, department of Ayacucho. The ore deposit consists of gold and silver mineralization in an epithermal system high-sulfidation, emplaced into breccias of tertiary volcanic rocks. We located higher concentrations of gold-silver in oxides in the Cerro Parccaorcco, Senccata, Pucagallo, Andrea, Ccaccapaqui, Sancos and Grace prospects. In July 2012, we began the production phase at Cerro Parccaorcco, having disseminated gold in silica-oxides.
We performed 10,387 meters of diamond drilling to update model ore distribution and explore around the Parccaorcco open pit, where we have recognized an ore body that is part of current reserves. In Senccata and Pucagallo, we performed a geophisycal survey of induced polarization that confirmed the existence of two silicified bodies to over 50 meters deep.
Proven ore reserves as of December 31, 2012 were 4,542,614 DST, with 0.041 ounces per ton of gold and 0.77 ounces per ton of silver. Probable ore reserves were 590,683 DST, with 0.017 ounces per ton of gold and 0.40 ounces per ton of silver. Total NRM in oxides were 1,692,792 DST, with 0.038 ounces per ton of gold and 0.11 ounces per ton of silver, 56.8% of which were derived from the Pucagallo prospect and 43.2% of which derived from the Senccata prospect. In 2013, we plan to conduct an intense drilling program, focusing primarily in new areas, and also complete modeling of the Senccata and Pucagallo prospects.
Set forth below are certain unaudited operating data for the Breapampa mine, calculated on the basis of 100 percent of the mine’s production.
Year Ended December 31,(1)(2) | ||||||||
| 2011 | 2012 | |||||||
| Mining Operations: | ||||||||
| Ore mined (ST) | - | 579,115 | ||||||
| Average silver grade (oz./ST) | - | 0.502 | ||||||
| Average gold grade (oz./ST) | - | 0.028 | ||||||
| Production: | ||||||||
| Silver (oz.) | - | 17,212 | ||||||
| Gold (oz.) | - | 8,817 | ||||||
| (1) | Incorporates losses for mining dilution and recovery. |
| (2) | Data reflect mining operations at the Parccaorcco deposit only. |
Mallay
The Mallay mine is wholly owned and operated by us and is located 21 kilometers southwest of the Uchucchacua mine in the district of Mallay, province of Oyón, department of Lima. The project is comprised of approximiately 2,300 hectares of mining concessions. Mallay is considered an epithermal deposit of silver, lead, zinc and gold. We have recognized the following major ore structures: Isguiz, Pierina, María and Fortuna Body.
The metallurgical processing plant began operations in mid-July 2012 with an average of 450 DST/day. During 2012, we constructed 9,389 meters of exploration tunnels and 20,380 meters of diamond drilling, focused mainly on mineralized structures of the Isguiz mine.
As of December 31, 2012, the proven ore reserves were 192,679 DST, with ore grades of 0.025 ounces per ton of gold, 10.29 ounces per ton of silver, 6.50 percent lead and 7.50 percent zinc, and the probable reserves were 95,434 DST, with ore grades of 0.028 ounces per ton of gold, 12.05 ounces per ton of silver, 5.71 percent lead and 6.26 percent zinc. Total NRM was 179,639 DST, with ore grades of 0.060 ounces per ton of gold, 11.56 ounces per ton of silver, 4.62 percent lead and 5.12 percent zinc. In 2013, we will focus exploration efforts on the Isguis and María-Dana vein systems, mainly at the 4370-meter and 4090-meter levels, as well as continue exploration of the Pierina vein at the 4310-meter and 4250-meter levels.
Set forth below are certain unaudited operating data for the Mallay mine, calculated on the basis of 100 percent of the mine’s production.
Year Ended December 31,(1)(2) | ||||||||
| 2011 | 2012 | |||||||
| Mining Operations: | ||||||||
| Ore mined (ST) | - | 114,166 | ||||||
| Average silver grade (oz./ST) | - | 6.65 | ||||||
| Average gold grade (oz./ST) | - | 0.011 | ||||||
| Average lead grade (%) | - | 5.18 | ||||||
| Average zinc grade (%) | - | 7.24 | ||||||
| Production: | ||||||||
| Silver (oz.) | - | 682,708 | ||||||
| Gold (oz.) | - | 107 | ||||||
| Lead (ST.) | - | 4,952 | ||||||
| Zinc (ST.) | - | 6,711 | ||||||
| Recovery rate silver (%) | - | 89.9 | ||||||
| (1) | Incorporates losses for mining dilution and recovery. |
| (2) | Data reflects mining operations at the Mallay deposit only. |
Colquijirca and Marcapunta Norte
The Colquijirca (also known as Tajo Norte) and Marcapunta Norte mines are wholly owned by El Brocal. El Brocal was founded in 1956 and is engaged in the extraction, concentration and sale of concentrates of polymetallic minerals—mainly zinc, copper, lead and silver. Our aggregate direct and indirect equity interest in El Brocal was 53.76 percent at December 31, 2011.2012. At December 31, 20112012 the net total fixed assets of Colquijirca and Marcapunta Norte were approximately US$174.1million.343 million.
The Colquijirca and Marcapunta Norte mines are adjacent and are located 285 kilometers east of the city of Lima and 10 kilometers south of the city of Cerro de Pasco. El Brocal produces zinc and lead/silver concentrates from the Colquijirca mine and copper concentrates from the Marcapunta Norte mine. The Colquijirca mine consists of three important polymetallic deposits: (1) Tajo Norte, which contains zinc, silver and lead ore; (2) Marcapunta, which contains an auriferous mineralization in breccia oxides a to non-arsenic copper chalcosite mineralization, and an arsenic copper enargite mineralization as a continuation of the mineralized mantles of the Marcapunta Norte mine; and (3) San Gregorio, which contains zinc.
Mining at Colquijirca is conducted through the open-pit method from which zinc and lead concentrates are produced. El Brocal’s zinc concentrate typically contains 50 percent zinc, while its lead concentrate typically contains 5551 percent lead. The concentrates are sold to local smelters and refiners due to currenttraders depending on market conditions. Mining at Marcapunta Norte is conducted through the room and pillars method, from which copper concentrates are produced. El Brocal’s copper concentrates typically contains 25 percent copper, 7 ounces of silver and 8 percent arsenic. The concentrates are sold to local traders.
The Huaraucaca concentrator plant processes ore from both mines. The current capacity ofIn 2012, average treated ore at the concentrator plant is 10,000 tpd and the mill had a 98 percent utilization rate in 2011.reached up to 10,634metric tons per day. The Colquijirca mine primarily relies on a power line connected to the Peruvian national electricity grid.
El Brocal has conducted an intensive exploration program at the Marcapunta deposit to confirm mineralization and find possible extensions, as well as to increase reserves at the Colquijirca and Marcapunta Norte mines.
This program will continue throughout 2013.
In 2011,2012, we invested US$43.7103.7 million to expand the project, and have invested a total of US$174.3278.0 million since 2008. We also continued exploration in prospective areas such as San Gregorio, and Marcapunta Oeste and other areas, at a cost of US$11.018.4 million. We focused on expandingalso continued the Tajo Norte open pit mine, expanding the Marcapunta Norte underground mine, expandingconstruction and modernizing the Huaraucaca plant to increase the capacityimplementation of the lead-zinc-silver circuit to 10,000 tpd,crushing, milling and buildingfloatation processes under our expansion program, as well as construction of the Huachuacaca tailings facility and upgrading existing infrastructure.facility.
In 2012,2013, we plan to conduct an intensiveinitial exploration program in Huancavelica at the San Gregorio depositYanamina Millocucho zone to confirm mineralization andcontinue with prospecting activities. The expansion project, which will enable us to determine whetherincrease treatment capacity to initiate feasibility studies. We have already reached an agreement with the local community of Viccoup to conduct a second diamond drilling campaign. We will also continue our project to expand production. We have already completed approximately 68 percent of our planned expansion and expect to produce at a rate of 18,000 tpd of inore, should be completed during the second half of 2013.
Total proven and probable reserves of Colquijirca as of December 31, 20112012 were 75,516,22063,333,000 DST, with 0.810.76 ounces of silver per ton, 2.232.4 percent of zinc and 0.730.8 percent of lead.Total proven and probablereserves of Marcapunta Norte as of December 31, 20112012 were 6,173,62720,016,145 DST, with 0.480.47 ounces of silver per ton, 0.0120.010 ounces of gold per ton and 1.951.99 percent copper. Total NRM as of December 31, 20112012 for Colquijirca was 85,427,92345,532,188 DST, with 0.810.42 ounces per ton of silver, 0.721.76 percent leadzinc and 2.190.52 percent zinc.lead. Total NRM for Marcapunta Norte was 47,969,23956,430,044 DST, with 0.0080.57 ounces per ton of silver, 0.013 ounces per ton of gold 0.51 ounces per ton of silver and 1.851.71 percent copper.
Set forth below are certain unaudited operating data for the Colquijirca mine, calculated on the basis of 100 percent of the mine’s production.
Year Ended December 31,(1) | ||||||||||||||||||||||||
Year Ended December 31,(1) | 2010 | 2011 | 2012 | |||||||||||||||||||||
| 2009 | 2010 | 2011 | ||||||||||||||||||||||
| Mining Operations: | ||||||||||||||||||||||||
| Ore mined (ST) | 1,940,119 | 1,150,527 | 929,032 | 1,150,527 | 929,032 | 1,862,717 | ||||||||||||||||||
| Average silver grade (oz./ST) | 2.92 | 2.30 | 2.67 | 2.30 | 2.67 | 1.20 | ||||||||||||||||||
| Average zinc grade (%) | 5.33 | 4.69 | 3.90 | 4.69 | 3.90 | 2.93 | ||||||||||||||||||
| Average lead grade (%) | 1.90 | 1.68 | 1.69 | 1.68 | 1.69 | 1.10 | ||||||||||||||||||
| Production: | ||||||||||||||||||||||||
| Silver (oz.) | 3,651,041 | 1,901,661 | 1,876,434 | 1,901,661 | 1,876,434 | 1,409,877 | ||||||||||||||||||
| Zinc (ST) | 74,615 | 38,955 | 25,968 | 38,955 | 25,968 | 33,268 | ||||||||||||||||||
| Lead (ST) | 22,195 | 12,768 | 10,432 | 12,768 | 10,432 | 10,654 | ||||||||||||||||||
| Recovery rate (silver) (%) | 64.4 | 69.1 | 76.1 | 69.1 | 76.1 | 63.2 | ||||||||||||||||||
| Recovery rate (zinc) (%) | 72.20 | 72.17 | 71.92 | 72.17 | 71.92 | 67.11 | ||||||||||||||||||
| Recovery rate (lead) (%) | 60.20 | 66.00 | 66.57 | 66.00 | 66.57 | 57.25 | ||||||||||||||||||
| (1) | Incorporates losses for mining dilution and recovery. |
Set forth below are certain unaudited operating data for the Marcapunta Norte mine, calculated on the basis of 100 percent of the mine’s production.
Year Ended December 31,(1) | ||||||||||||||||||||||||
Year Ended December 31,(1) | 2010 | 2011 | 2012 | |||||||||||||||||||||
| 2009 | 2010 | 2011 | ||||||||||||||||||||||
| Mining Operations: | ||||||||||||||||||||||||
| Ore mined (ST) | 384,410 | 946,659 | 1,961,759 | 946,659 | 1,961,759 | 2,042,904 | ||||||||||||||||||
| Average silver grade (oz./ST) | 0.61 | 1.06 | 1.03 | 1.06 | 1.03 | 0.38 | ||||||||||||||||||
| Average gold grade (oz./ST) | 0.016 | 0.013 | 0.01 | |||||||||||||||||||||
| Average gold grade (%) | 0.013 | 0.010 | 0.011 | |||||||||||||||||||||
| Average copper grade (%) | 2.75 | 2.30 | 1.60 | 2.30 | 1.60 | 1.41 | ||||||||||||||||||
| Production: | ||||||||||||||||||||||||
| Silver (oz.) | 169,694 | 608,438 | 1,035,315 | 608,438 | 1,035,315 | 421,512 | ||||||||||||||||||
| Gold (oz.) | 3,215 | 5,549 | 8,498 | |||||||||||||||||||||
| Gold (oz) | 5,549 | 8,498 | 10,220 | |||||||||||||||||||||
| Copper (ST) | 9,092 | 18,707 | 26,231 | 18,707 | 26,231 | 22,785 | ||||||||||||||||||
| Recovery rate (silver) in copper (%) | 72.4 | 60.81 | 50.67 | 60.81 | 50.67 | 54.37 | ||||||||||||||||||
| Recovery rate (gold) in copper (%) | 52.8 | 45.79 | 45.02 | 45.79 | 45.02 | 45.21 | ||||||||||||||||||
| Recovery rate copper (%) | 85.86 | 83.06 | 86.52 | |||||||||||||||||||||
| (1) | Incorporates losses for mining dilution and recovery. |
Reserves
We calculate our ore reserves by methods generally applied within the mining industry and in accordance with Commission Industry Guide 7. All mineral reserves are estimated quantities of proven and probable ore that under present conditions may be economically mined and processed.
The proven and probable ore reserve figures presented in this Annual Report are estimates, and no assurance can be given that the level of recovery of gold, silver and certain other metals will be realized. See “Item 3. Key Information—D. Risk Factors—Factors Relating to the Company—Estimates of proven and probable reserves are subject to uncertainties and the volume and grade of ore actually recovered may vary from our estimates.”
The term “reserves” refers to mineral deposits that could be economically and legally extracted or produced at the time of reserve determination. The term “proven reserves” means ore reserves for which (a) quantity is computed from dimensions revealed in outcrops, trenches, workings or drill holes, and grade and/or quality are computed from the results of detailed sampling, and (b) the sites for inspection, sampling and measurement are spaced so closely and the geologic character is so well defined that size, shape, depth and mineral content of reserves are well established. The term “probable reserves” means ore reserves for which quantity and grade and/or quality are computed from information similar to that used for proven reserves, but the sites for inspection, sampling and measurement are farther apart or are otherwise less adequately spaced. The degree of assurance, although lower than that for proven reserves, is high enough to assume continuity between points of observation.
As of December 31, 2012, our total proven and probable reserves were estimated to be 1,385 million ounces of gold, representing a 7% decrease over our total proven and probable reserves as of December 31, 2011, which were estimated to be 1,485 million ounces of gold. The decrease in reserves of gold was mainly due to mine depletion and the lack of replacements for gold production at La Zanja.
As of December 31, 2012, our total proven and probable reserves were estimated to be 154,606 million ounces of silver, representing a 1% decrease over our total proven and probable reserves as of December 31, 2011, which were estimated to be 155,437 million ounces of silver. The decrease in reserves of silver was mainly due to mine depletion and the lack of replacements for silver production at El Brocal.
The following table lists the proven and probable ore reserves, and the average grade of such ore, as of December 31, 2011,2012, for each of our consolidated mining operations and the Tantahuatay mine, in which we have a 40.140 percent equity interest, calculated on the basis of 100 percent of each mine’s reserves and US$12001,400 per ounce of gold and US$22.0030.00 per ounce of silver.
Proven and Probable Ore Reserves at December 31, 20112012(1)(2)(3)
| Julcani(4) | Uchucchacua(5) | Orcopampa(6) | Recuperada(7) | Colquijirca(8)(9) | Marcapunta(8)(10) | Ishihuinca | Antapite(11) | Shila-Paula(12) | Poracota(13) | Breapampa(14) | Tantahuatay(15) | La Zanja(16) | Total/ Average | Julcani(4) | Uchucchacua(5) | Orcopampa(6) | Recuperada(7) | Mallay(8) | Colquijirca(9)(10) | Marcapunta(9)(11) | Ishihuinca | Antapite(12) | Shila- Paula(13) | Poracota(14) | Breapampa(15) | Tantahuatay(16) | La Zanja(17) | Total/ Average | ||||||||||||||||||||||||||||||||||||||||||||||||||||||||||||||||||||||||||||||||||||||||
| Ore Reserves (ST) | 400,015 | 4,712,935 | 1,019,664 | 114,710 | 75,516,220 | 6,173,627 | 18,128 | 29,461 | 27,290 | 43,971 | 5,645,000 | 24,790,952 | 44,183,008 | 162,674,941 | 424,605 | 5,684,990 | 1,090,891 | 114,485 | 288,113 | 63,333,221 | 20,016,327 | 12,947 | 47,745 | 8,371 | 36,487 | 5,133,297 | 39,273,107 | 24,795,233 | 160,259,819 | |||||||||||||||||||||||||||||||||||||||||||||||||||||||||||||||||||||||||||||||||||||||
| Grade: | ||||||||||||||||||||||||||||||||||||||||||||||||||||||||||||||||||||||||||||||||||||||||||||||||||||||||||||||||||||
| Gold (oz./ST) | 0.023 | - | 0.456 | - | - | 0.012 | 0.336 | 0.255 | 0.466 | 0.435 | 0.035 | 0.024 | 0.015 | 0.013 | 0.017 | - | 0.421 | - | 0.026 | - | 0.010 | 0.334 | 0.300 | 0.397 | 0.332 | 0.038 | 0.013 | 0.018 | 0.014 | |||||||||||||||||||||||||||||||||||||||||||||||||||||||||||||||||||||||||||||||||||||||
| Silver (oz./ST) | 18.60 | 13.72 | 0.50 | 7.79 | 0.81 | 0.48 | - | 0.30 | 1.40 | 0.185 | 0.63 | 0.24 | 0.20 | 0.96 | 18.56 | 12.68 | 0.54 | 8.80 | 10.87 | 0.76 | 0.47 | - | 0.22 | 0.92 | 0.079 | 0.73 | 0.313 | 0.208 | 1.02 | |||||||||||||||||||||||||||||||||||||||||||||||||||||||||||||||||||||||||||||||||||||||
| Copper (%) | 0.48 | - | - | - | - | 1.95 | - | - | - | - | - | - | - | 0.07 | 0.50 | - | - | - | - | - | 1.99 | - | - | - | - | - | - | - | - | |||||||||||||||||||||||||||||||||||||||||||||||||||||||||||||||||||||||||||||||||||||||
| Zinc (%) | - | 1.89 | - | 8.11 | 2.23 | - | - | - | - | - | - | - | - | 1.10 | - | 1.77 | - | 7.05 | 7.09 | 2.40 | - | - | - | - | - | - | - | - | - | |||||||||||||||||||||||||||||||||||||||||||||||||||||||||||||||||||||||||||||||||||||||
| Lead (%) | 2.04 | 1.39 | - | 5.20 | 0.73 | - | - | - | - | - | - | - | - | 0.39 | 1.88 | 1.25 | - | 4.04 | 6.24 | 0.80 | - | - | - | - | - | - | - | - | - | |||||||||||||||||||||||||||||||||||||||||||||||||||||||||||||||||||||||||||||||||||||||
| Content: | ||||||||||||||||||||||||||||||||||||||||||||||||||||||||||||||||||||||||||||||||||||||||||||||||||||||||||||||||||||
| Gold (oz.) | 9,174 | - | 464,967 | - | - | 73,826 | 6,098 | 7,504 | 12,717 | 19,118 | 197,575 | 594,983 | 680,137 | 2,066,099 | 7,398 | - | 459,265 | - | 7,596 | - | 204,333 | 4,326 | 14,324 | 3,323 | 12,114 | 197,144 | 528,346 | 437,345 | 2,206,514 | |||||||||||||||||||||||||||||||||||||||||||||||||||||||||||||||||||||||||||||||||||||||
| Silver (oz.) | 7,439,945 | 64,642,638 | 509,832 | 893,591 | 60,971,448 | 2,968,332 | - | 8,700 | 38,206 | 8,116 | 3,545,060 | 5,949,828 | 8,696,394 | 155,840,109 | 7,879,249 | 72,097,949 | 589,081 | 1,007,468 | 3,132,941 | 48,262,200 | 9,442,435 | 10,504 | 7,732 | 2,882 | 3,749,722 | 12,278,957 | 5,156,137 | 163,617,257 | ||||||||||||||||||||||||||||||||||||||||||||||||||||||||||||||||||||||||||||||||||||||||
| Copper (ST) | 1,915 | - | - | - | - | 120,386 | - | - | - | - | - | - | - | 116,127 | 2,102 | - | - | - | - | - | 398,325 | - | - | - | - | - | - | - | 400,427 | |||||||||||||||||||||||||||||||||||||||||||||||||||||||||||||||||||||||||||||||||||||||
| Zinc (ST) | - | 89,132 | - | 9,303 | 1,684,012 | - | - | - | - | - | - | - | - | 1,782,447 | - | 100,345 | - | 8,071 | 20,427 | 1,519,997 | - | - | - | - | - | - | - | - | 1,648,840 | |||||||||||||||||||||||||||||||||||||||||||||||||||||||||||||||||||||||||||||||||||||||
| Lead (ST) | 8,160 | 65,342 | - | 5,965 | 551,268 | - | - | - | - | - | - | - | - | 630,735 | 7,990 | 71,139 | - | 4,625 | 17,978 | 506,666 | - | - | - | - | - | - | - | - | 608,398 | |||||||||||||||||||||||||||||||||||||||||||||||||||||||||||||||||||||||||||||||||||||||
| (1) | Algon Investment S.R.L., an independent consultant, is in the process of reviewing the framework used to estimate proven and probable reserves for our wholly-owned mines |
| (2) | The metallurgical recovery factors used to calculate |
| (3) | For the year ended December 31, |
| (4) | The metallurgical recovery factors that impacted the calculated reserves for Julcani at December 31, |
| (5) | The metallurgical recovery factors that impacted the calculated reserves for Uchucchacua at December 31, |
| (6) | The metallurgical recovery factors that impacted the calculated reserves for Orcopampa at December 31, |
| (7) | The metallurgical recovery factors that impacted the calculated reserves for Recuperada at December 31, |
| (8) | The metallurgical recovery factors that impacted the calculated reserves for Mallay at December 31, 2012 were the high variation in ore grade and the variation in the hardness of the host rocks. |
| (9) | El Brocal, in which we owned a 53.76% controlling equity interest at December 31, |
| The metallurgical recovery factors that impacted the calculated reserves for Colquijirca at December 31, |
| The metallurgical recovery factors that impacted the calculated reserves for Marcapunta at December 31, |
| The metallurgical recovery factors that impacted the calculated reserves for Antapite at December 31, |
| (13) | The metallurgical recovery factors that impacted the calculated reserves for Shila-Paula at December 31, 2012 was the high variation in ore grade. |
| (14) | The metallurgical recovery factors that impacts the calculated reserves for Poracota at December 31, |
| The metallurgical recovery factors that impacted the calculated reserves for Breapampa |
| The reserves shown for Tantahuatay, in which we owned a |
| The reserves shown for La Zanja, in which we owned a 53.06% |
We operate nineten underground mines and threefour open pit mines. The following table sets forth the aggregate amount of production of ore, gold and silver and the average grade of gold and silver for each of our twelvefourteen mines for the ten-year period ended December 31, 2011,2012, calculated in each case on the basis of 100 percent of the relevant mine’s production.
| Julcani | Uchucchacua | Orcopampa(1) | Recuperada | Colquijirca(2) | Marcapunta(2) | Ishihuinca | Antapite | Tantahuatay(3) | Shila-Paula | Poracota | La Zanja(4) | Total | Julcani | Uchucchacua | Orcopampa(1) | Recuperada | Mallay | Colquijirca(2)(6) | Marcapunta(2) | Ishihuinca | Antapite | Shila - Paula(3) | Poracota | Breapampa(6) | Tantahuatay(4) (6) | La Zanja(5) (6) | Total | |||||||||||||||||||||||||||||||||||||||||||||||||||||||||||||||||||||||||||||||||||||
| Ore mined (ST) | 876,800 | 8,827,945 | 4,535,613 | 565,040 | 15,543,845 | 3,647,839 | 389,176 | 1,646,633 | 3,963,580 | 637,205 | 990,023 | 13,589,701 | 55,213,400 | 957,120 | 9,239,911 | 4,693,309 | 682,640 | 114,166 | 16,397,908 | 5,690,763 | 368,511 | 1,611,585 | 634,734 | 1,124,909 | 579,115 | 14,845,347 | 23,821,022 | 80,761,040 | ||||||||||||||||||||||||||||||||||||||||||||||||||||||||||||||||||||||||||||||||||||
| Gold produced (oz.) | 6,542 | - | 2,512,561 | - | - | 21,071 | 136,774 | 672,065 | 46,164 | 259,251 | 223,325 | 177,917 | 4,055,670 | 6,942 | - | 2,612,923 | - | 107 | - | 31,300 | 125,096 | 611,405 | 250,031 | 242,563 | 8,817 | 187,432 | 290,304 | 4,366,920 | ||||||||||||||||||||||||||||||||||||||||||||||||||||||||||||||||||||||||||||||||||||
| Average gold grade (oz./ST) | 0.011 | - | 0.561 | - | - | 0.012 | 0.416 | 0.427 | 0.017 | 0.429 | 0.273 | 0.023 | 0.079 | 0.011 | - | 0.556 | - | 0.011 | - | 0.012 | 0.402 | 0.399 | 0.416 | 0.262 | 0.028 | 0.017 | 0.021 | 0.059 | ||||||||||||||||||||||||||||||||||||||||||||||||||||||||||||||||||||||||||||||||||||
| Silver produced (oz.) | 14,661,804 | 99,907,775 | 1,061,107 | 3,250,744 | 42,400,207 | 1,958,147 | - | 752,476 | 260,073 | 2,717,333 | 130,660 | 400,170 | 167,500,496 | 16,266,407 | 101,784,006 | 1,458,349 | 3,718,219 | 682,708 | 42,636,134 | 2,379,792 | - | 667,609 | 2,278,745 | 130,660 | 17,212 | 1,179,416 | 788,047 | 173,987,304 | ||||||||||||||||||||||||||||||||||||||||||||||||||||||||||||||||||||||||||||||||||||
| Average silver grade (oz./ST) | 18.0 | 15.39 | 0.28 | 6.13 | 3.83 | 0.95 | - | 0.68 | 0.63 | 5.19 | 0.17 | 0.37 | 4.19 | 18.25 | 14.97 | 0.30 | 5.79 | 6.65 | 3.71 | 0.75 | - | 0.60 | 4.36 | 0.15 | 0.50 | 0.52 | 0.31 | 3.05 | ||||||||||||||||||||||||||||||||||||||||||||||||||||||||||||||||||||||||||||||||||||
| (1) | Includes a cumulative total of |
| (2) | El Brocal, in which we |
| (3) | Includes a cumulative total of 701 ounces of gold and 48,677 ounces of silver from metallurgical test treatments to ore from the Tambomayo mine. |
| (4) | The production data shown for Tantahuatay, in which we own a |
| The production data shown for La Zanja, in which we own a |
| (6) | Colquijirca, Breapampa, Tantahuatay and La Zanja are open pit mines. |
Yanacocha’s Properties
Operating Properties
For operating data (including ore mined, average gold grade of ore mined and gold production) for each of Yanacocha’s operating properties and a description of how ore is processed and the source of electricity and water for each of Yanacocha’s operating properties, see “—Yanacocha—Business Overview” and “—Description of Yanacocha’s Operations.”
Carachugo - Chaquicocha
Chaquicocha Sur is an 85-hectare gold deposit (ultimate pit) which lies in the east-central part of the Yanacocha District,district, approximately 1 kilometer southeast of the mined out Carachugo deposit and 300 meters south of the Chaquicocha Norte pit.
Carachugo is a 90-hectare gold deposit with a leach pad that covers approximately 306 hectares. Carachugo, Yanacocha’s first mine, commenced operations in August 1993. Mining is conducted by the open-pit method. The Carachugo open-pit mine ceased mining operations in 2004, although one ore processing facility remains in operation.
Maqui Maqui
Maqui Maqui is a 75-hectare gold deposit with a leach pad covering 67 hectares, located five kilometers northeast of the Carachugo pit. Mining operations at Maqui Maqui began in October 1994 and used the open-pit mining method. Although mining operations at Maqui Maqui ceased in September 2000, gold recovery from the leach pad continues. The Maqui Maqui East expansion commenced operations in 2010.2010 and will finish in February 2014.
San José
San José is a 100-hectare gold deposit, located 1.5 kilometers southwest of the Carachugo pit, that shares the leach pad located at Carachugo. Mining operations at San José began in January 1996 using the open-pit mining method. Mining operations at San José temporarily ceased during the fourth quarter of 2002 and reopened in 2005 to complete San José East. San José West started operations in early 2010.2010 and ceased operations in November 2012.
Cerro Yanacocha
Cerro Yanacocha is a 247-hectare gold deposit (ultimate pit) with a leach pad covering approximately 310 hectares. The Cerro Yanacocha pit is located two kilometers northwest of the Carachugo pit. Operations began in the fourth quarter of 1997 using the open-pit mining method. Cerro Yanacocha includes a carbon column gold recovery plant and a Merrill-Crowe-type ore processing facility. Cerro Yanacocha temporarily ceased operations in October 2010 and expects to reopen in 2015.2017.
La Quinua
La Quinua is a 450-hectare gold deposit (ultimate pit) with a leach pad covering 426 hectares. The La Quinua, El Tapado and El Tapado Oeste pits are located three kilometers southwest of the Cerro Yanacocha pit. Operations began in the fourth quarter of 2001 using the open-pit mining method. All solution processing occurs at the Cerro Yanacocha plant following treatment at the La Quinua leach pad and carbon column facility.
The La Quinua mining operation included Cerro Negro Este, a 15-hectare gold deposit (ultimate pit) which is located six kilometers southwest of the La Quinua pit. Cerro Negro Este utilized the La Quinua leach pad. Operations began in April 2004 using the open-pit mining method and all solution processing occurred at the Cerro Yanacocha plant following treatment at the La Quinua leach pad and carbon column facility. Mining operations at Cerro Negro Este ceased in March 2005.
Western Oxides
The Western Oxides are comprised of the Cerro Negro Oeste and La Quinua Sur open-pit mines. Cerro Negro Oeste, a 40-hectare gold deposit, is located 6.5 kilometers southwest of the La Quinua pit. This pit utilizes the La Quinua leach pad as its ore facility. La Quinua Sur, a 110-hectare gold deposit, is located south of the Tapado Oeste pit and is completely covered by La Quinua gravel. La Quinua Sur is scheduled to commence mining activities in June 2013May 2014 and terminatefinish in 2015. The ore mined from this pit will be processed at the La Quinua leach pad.
Eastern Oxides
The Eastern Oxides are comprisedconsist of the Quecher Norte and Marleny open-pit mines. The Quecher Norte pit, a 12-hectare deposit, is located to the east of the Carachugo pad. Quecher Norte is scheduled to commence mining operations in September 2012 and complete operations in 2014.mine. The Marleny pit, an 8-hectare deposit, is located to the west of the Carachugo backfill. Marleny is scheduled to commence mining operations in JanuaryMay 2013 and complete operations in 2014.2015.
Carachugo Alto
The Carachugo Alto pit, a 9-hectare deposit, is located to the east of the Carachugo backfill. Carachugo Alto commenced mining operations in July 2010, and its second phase is scheduled for June 2011 through July 2012.will finish in August 2013.
China Linda
Yanacocha owns and operates the China Linda lime plant, which is located in Cajamarca, 12 kilometers to the northeast of the Yanacocha installations. Access to the plant from Yanacocha is by a ten-kilometer private, unpaved road. Lime is used in the gold and silver mining process to regulate the alkalinity of the cyanide solutions in the leaching process and for pH control in water treatment applications. Currently, the plant has a production capacity of 78,000 tons of lime per year.
Reserves
Proven and probable reserves are based on extensive drilling, sampling, mine modeling and metallurgical testing from which economic feasibility is determined. Under the Management Contract, Newmont Mining, in conjunction with Yanacocha, calculates Yanacocha’s reserves by methods generally applied within the mining industry and in accordance with SEC Industry Guide 7. Reserves represent estimated quantities of proven and probable ore that under present and anticipated conditions may be economically mined and processed.
The following table lists proven and probable reserves and the average grade of ore as of December 31, 20112012 for Yanacocha and the Conga project. Calculations with respect to the estimates of proven and probable reserves are based on a gold price of US$1,2001,400 per ounce as of December 31, 2011.2012. Calculations with respect to the Conga project’s copper reserves were calculated at a price of and US$3.003.25 per pound as of December 31, 2011.2012. The proven and probable reserves presented below represent the total quantity of ore to be extracted from the deposits, allowing for mining efficiencies and ore dilution. Ounces of gold and pounds of copper in the districts of Yanacocha’s and the Conga project’s proven and probable reserves are calculated prior to any losses during metallurgical treatment.
| Proven and Probable Reserves at December 31, 2012 | ||||||||||||
| Tonnage (thousands of DST) | Average Gold Grade (oz./DST) | Ounces Contained (thousands of ounces) | ||||||||||
| Maqui Maqui | 10,181 | 0.025 | 254 | |||||||||
| Carachugo | 11,297 | 0.041 | 459 | |||||||||
| San José | - | - | - | |||||||||
| Giuliana | - | - | - | |||||||||
| Marleny | 8,873 | 0.010 | 91 | |||||||||
| Cerro Yanacocha | 4,122 | 0.058 | 238 | |||||||||
| La Quinua | - | - | - | |||||||||
| Tapado | - | - | - | |||||||||
| Corimayo | 48,674 | 0.044 | 2,120 | |||||||||
| La Quinua Sur | 71,549 | 0.013 | 932 | |||||||||
| Cerro Negro | 33,021 | 0.015 | 499 | |||||||||
| In process | 33,061 | 0.040 | 1,314 | |||||||||
| Subtotal Yanacocha/avg | 220,778 | 0.027 | 5,907 | |||||||||
| Subtotal Conga project/avg.* | 590,855 | 0.021 | 12,582 | |||||||||
| Total/average | 811,633 | 0.023 | 18,489 | |||||||||
| Proven and Probable Reserves at December 31, 2011 | ||||||||||||
| Tonnage | Average Gold Grade | Ounces Contained | ||||||||||
(thousands of DST) | (oz./DST) | (thousands of ounces) | ||||||||||
| Maqui Maqui | 8,514 | 0.031 | 265 | |||||||||
| Carachugo | 34,878 | 0.039 | 1,358 | |||||||||
| San José | 1,664 | 0.015 | 25 | |||||||||
| Giuliana | - | - | - | |||||||||
| Cerro Yanacocha | 9,489 | 0.055 | 518 | |||||||||
| La Quinua | - | - | - | |||||||||
| Tapado | 7,605 | 0.052 | 398 | |||||||||
| Corimayo | 55,357 | 0.038 | 2,106 | |||||||||
| La Quinua Sur | 64,464 | 0.013 | 849 | |||||||||
| Cerro Negro | 37,545 | 0.015 | 564 | |||||||||
| In process | 43,611 | 0.037 | 1,629 | |||||||||
| Subtotal Yanacocha/avg | 263,127 | 0.029 | 7,712 | |||||||||
| Subtotal Conga project/avg.* | 617,786 | 0.019 | 12,582 | |||||||||
| Total/average | 880,913 | 0.023 | 20,294 | |||||||||
* The Conga project’s proven and probable reserves as of December 31, 20112012 included 3.760.6 billion ST of 0.28 percent grade copper.
As of December 31, 2011,2012, the Yanacocha district’s proven and probable reserves (excluding the Conga project’s proven and probable reserves) were estimated to be 7.75.9 million ounces of gold, a 2123 percent decreasefrom the Yanacocha district’s proven and probable reserves as of December 31, 2010,2011, which were estimated to be 9.77.7 million ounces of gold. The decreasein reserves of gold was mainly due to mine depletion, and to a mining depletion of 1.6 million ounces and 0.4 million ounces of netlesser extent, to reserve revisions due to revised pit designs, geotechnical changes and leach padand stockpile inventory adjustments due to low performance in transitional recovery.changes.
As of December 31, 2011,2012, the Conga project’s proven and probable reserves were estimated to be 12.6 million ounces of gold and 3.3 billion pounds of copper, representing a 7 percent increase and a 1 percent increaseunchanged from the 2010 gold reserves and2010 copper reserves, respectivelyreported in 2011.
As of December 31, 2011,2012, Yanacocha’s total proven and probable reserves (including the Conga project) were estimated to be 20.3million18.5million ounces of gold, representing a 6percent9percent decreaseover Yanacocha’s total proven and probable reserves as of December 31, 2010,2011, which were estimated to be 21.520.3 million ounces of gold. Yanacocha’s total proven and probable reserves of copper were 3.3 billion pounds as of December 31, 2011, representing a 1 percent increase from Yanacocha’s total proven and probable reserves2012, the same as reported as of December 31, 2010. Newmont Mining did not quote silver reserves at Yanacocha for the year ended December 31, 2011.
Based on the current recovery rate and estimated gold production levels in 2011,2012, Yanacocha’s proven and probable reserves as of December 31, 20112012 will be depleted by 2015 unless Yanacocha continues to add to its reserves. Yanacocha’s management believes that its prospective land positions and mining concessions provide it with potential for future exploration and additions to its reserves.
| ITEM 4A. | Unresolved Staff Comments |
None.
| ITEM 5. | Operating and Financial Review and Prospects |
In this Item 5, we present information first with respect to Buenaventura, followed by information with respect to Yanacocha, in which we have a 43.65 percent partnership interest, followed by information with respect to Cerro Verde, in which we have a 19.3519.58 percent equity interest.
BUENAVENTURA
Introduction
The following discussion should be read in conjunction with the Financial Statements as of December 31, 20102011 and 20112012 and for the years ended December 31, 2010, 2011 and 20112012 and the related notes thereto included elsewhere in this Annual Report. The Financial Statements are prepared and presented in accordance with IFRS as issued by the IASB.For periods up to and including the year ended December 31, 2010, we prepared our financial statements in accordance with Peruvian GAAP. Our consolidated financial statements for the year ended December 31, 2011 arewere the first that we have prepared in accordance with IFRS. We have applied IFRS 1 “First Time Adoption of International Financial Reporting Standard” to the opening balance as of January 1, 2010, the date of our transition to IFRS. The IFRS 1 application implies that all the standards are applied retrospectively at the transition date, including certain mandatory exceptions and voluntary exemptions defined in the standard. See Note 3 to the Financial Statements for further details and a description of the exceptions and exemptions applicable to first-time adopters.We present our financial statements in U.S. Dollars.
A. Operating Results
General
Overview.We were established in 1953 and are one of Peru’s leading producers of gold, silver and other metals. Our consolidated financial statements comprise all of our accounts and those of our subsidiaries, which include: (i) the Julcani, Mallay, Breapampa, Recuperada, Uchucchacua, Orcopampa, Poracota, Antapite and Ishihuinca mining units; (ii) the Colquijirca, Marcapunta, Shila-Paula and La Zanja mines, which are owned through consolidated subsidiaries; (iii) Chaupiloma, which receives a royalty payment from Yanacocha; (iv) Condesa, which is mainly a holding company for investments in us, Yanacocha and other affiliated mining companies; (v) Conenhua, which is mainly engaged in the transmission of electric power to Yanacocha and other mining companies; and (vi) other minor subsidiaries. We also have material equity investments in (i) Yanacocha, which is an equity investee engaged in the exploitation and commercialization of gold, (ii) Cerro Verde, which is an equity investee engaged in the exploitation and commercialization of copper and (ii)(iii) Tantahuatay, which is an equity investee engaged in the exploitation and commercialization of gold and silver. We account for these investments under the equity method.
Yanacocha.A substantial part of our net income before income tax was derived from our equity interest in Yanacocha. We have a 43.65 percent equity participation in Yanacocha, which is held through our wholly-owned subsidiary, Condesa. Our partnership interest in Yanacocha is accounted for under the equity method and is included under the caption “Investment in associates” on our consolidated balance sheets. Although Yanacocha has no fixed dividend policy, there is an understanding among the partners that the net income not required for sustaining capital expenditures or future development projects should be distributed after agreement between the two major shareholders, Newmont Mining and us.
Cerro Verde.As of December 31, 2011,2012, we had a 19.3519.58 percent equity participation in Cerro Verde, which allows us to exercise significant influence over this company. As a result, we account for our investment in Cerro Verde using the equity method. Although Cerro Verde has no fixed dividend policy, there is an understanding that earnings not required for capital expenditures or future development projects are expected to be distributed.
Results of operations. The primary factors affecting our results of operations are (i) the amount of gold, silver, zinc and copper produced and sold by us; (ii) prevailing world market prices for gold, silver, zinc and copper; (iii) commercial terms with respect to the sale of ore concentrates; and (iv) our operating expenses.
| 83 |
Gold and silver price hedging. Our revenues and earnings are strongly influenced by world market prices for gold, silver, zinc and copper that fluctuate widely and over which we have no control. Depending upon the metal markets and other conditions, we may from time to time hedge our gold and silver sales in order to decrease our exposure to fluctuations in the prices of these metals. We and our wholly-owned subsidiaries are currently completely unhedged as to the price at which our gold and silver will be sold. As a result, we are fully exposed to the effects of changes in prevailing market prices of gold and silver.
During 2008, our indirect subsidiary, El Brocal, entered into price-hedging contracts (Asian swaps) to protect its future cash flows derived from sales. During 2010, El Brocal also entered into price-hedging option contracts at zero cost to protect future cash flows derived from sales. See “—Critical Accounting Policies and Estimates—Fair value of derivative financial instruments—Outstanding derivative contracts” for additional information. El Brocal did not enter into any new hedging transactions during 2011. As of March 31, 2012, all outstanding hedging transactions were non-delivery zero cost (Asian) option collars. Remaining hedging commitments amount to 18 percent of payable metal during 2012 on the following terms: 4,500 metric tons of copper at an average price range of US$7,500 to US$8,420 per metric ton.
Operating costs and expenses. Operating costs and expenses consist of (i) operating costs, which are direct production costs, the major component of operating expenses; (ii) exploration costs in operational mining sites; (iii) depreciation and amortization expenses; (iv) exploration costs in non-operational mining areas; (v) administrative expenses, which principally consist of personnel expenses; (vi) royalties, which consist of payments to third parties and the Peruvian government to operate leased mining rights; and (vii) selling expenses, which principally consist of freight expenses.
Reserves. We utilize geological mapping, projection of ore-bearing structures, diamond drilling, core logging and chemical assaying, in addition to drifting along previously indicated mineralization, to replace and grow reserves. In addition, we use metallurgical test-work of core and bulk samples as a follow-up activity to prove the amenability of any previously indicated mineralization to certain methods available on site. We continuously analyze this information with respect to tonnage, precious-metals average grades, metallurgical recoveries and economic value and allocate funds preferentially to those projects that have the best potential to sustain or enhance profitable mine production in the near-term. Our mining operations are primarily conducted underground and consist of deposits that are difficult to explore and measure in advance of mining and in which the value or prospects for ore based on geologic evidence exceeds the value based on proved reserves throughout most of the life of mines supported by them, or extramensurate deposits.
In addition, underground mine infrastructure, such as declines, shafts and/or dewatering/ore haulage crosscuts, that facilitate access to ore reserves are constructed and categorized as mine development. We consider such underground mine infrastructure vital to assure sustainable mine production and reserve production. The design, construction and implementation of our underground mine infrastructure are presented and supervised by our Operations Manager with the Board of Directors’ approval. We capitalize mine development and mineral land costs incurred after we have identified proven and probable reserves. Upon commencement of production, we amortize these costs over the expected life of the mining area, based on proven and probable reserves and other factors.
Our other mining operations are smaller and have variable fluctuations in production and reserves due to complexities of the ore located in certain mining operations (such as the Colquijirca mine); the sale of certain mining operations (such as the Huallanca mine); partial and temporary closures of mining operations (such as the Shila-Paula and Recuperada mines); and the production of silver only as by-product of gold (such as the Orcopampa, Antapite and Shila-Paula mines).
Net income and net distributable income.Under Peruvian law, each company is required to establish a legal reserve of at least 20 percent of its paid-in capital on an unconsolidated basis. An annual contribution of at least 10 percent of net income must be made until such legal reserve equals 20 percent of paid-in capital. The legal reserve may offset losses or be capitalized. However, following any instance in which the reserve is used, Peruvian law calls for mandatory replenishment of the reserve.
Royalties.Royalty expenses consist mainly of payments made by us pursuant to lease agreements relating to mining rights for the Orcopampa and Ishihuinca mines. Specifically, we pay the applicable lessor a royalty of 10 percent of the value of the concentrates produced in the Orcopampa mine and 7 percent of the value of the concentrates produced in the Ishihuinca mine. We are also required to pay the Peruvian government mining royalties and taxes. In addition to mining royalties, pursuant to Law No. 29789, effective October 1, 2011, mining operations in Peru are subject to a new extraordinary mining tax. See “Item 4. Information on the Company—Buenaventura—B. Business Overview—Regulatory Framework—Mining Royalties and Taxes.”
Environmental protection laws and related regulations. Our business is subject to Peruvian laws and regulations relating to the exploration and mining of mineral properties, as well as the possible effects of such activities on the environment. We conduct our operations substantially in accordance with such laws and regulations.
Critical Accounting Policies and Estimates
The following is a discussion of our application of critical accounting policies that require our management, or Management, to make certain assumptions about matters that are highly uncertain at the time the accounting estimate is made, and where different estimates that Management reasonably could have used in the current period, or changes in the accounting estimate that are reasonably likely to occur from period to period, would have a material impact on our financial statements. Management has identified the following accounting estimates and policies as critical:
| § | mineral reserves and resources; |
| § |
| § | impairment of non-financial assets; |
| § | deferred income tax asset and recoverability; |
| § | inventories; |
| § | accrual for mine closing costs; |
| § | fair value of derivative instruments; |
| § | fair value of the liability related to share-based payment transactions; |
| § | contingencies; |
| § | production start date; |
| § | unit-of-production depreciation; and |
| § | expected recovery rates used to estimate mineral contained in in-process inventories. |
Other significant accoundingaccounting policies include:
| § | deferred stripping costs; |
| § | useful life of property, plant and equipment; |
| § | fair value of embedded derivative for concentrates sales; and |
| § | revenues. |
We also have certain accounting policies that we consider to be important, such as our policies for investments carried at fair value, revenue recognition and exploration costs, that do not meet the definition of critical accounting estimates as they do not require Management to make estimates or judgments that are subjective or highly uncertain.
Management has discussed the development and selection of our critical accounting estimates with the Audit Committee of the Board of Directors.
Mineral reserves and resources
Recoverable proven and probable reserves are the part of a mineral deposit that can be economically and legally extracted or produced at the time of the reserve determination. The determination of reserves involves numerous uncertainties with respect to the ultimate geology of the ore bodies, including quantities, grades and recovery rates. Estimating the quantity and grade of reserves requires us to determine the size, shape and depth of our ore bodies by analyzing geological data, such as samplings of drill holes, tunnels and other underground workings. In addition to the geology of our mines, assumptions are required to determine the economic feasibility of mining these reserves, including estimates of future commodity prices and demand, the mining methods we use and the related costs incurred to develop and mine our reserves. Our estimates of recoverableThe conceptual framework used to estimate proven and probable reserves are the responsibilityfor our wholly-owned mines as of our employeesDecember 31, 2010 and are audited2011 were reviewed by an independent experts in mining, geology and reserve determination, such asconsultant, Algon Investment S.R.L. Algon Investment S.R.L. is in the process of reviewing the framework used to estimate proven and probable reserves for Buenaventura’s mining unitsour wholly-owned mines as of December 31, 2012. The conceptual framework used to estimate proven and AMEC plcprobable reserves for El Brocal’s mining units.mines as of December 31, 2010 and 2011 were reviewed by independent consultants, AMEC plc and MINTEC Inc., respectively. MINTEC Inc. is in the process of reviewing the conceptual framework used to estimate proven and probable reserves for El Brocal’s mines as of December 31, 2012.
Changes in estimated reserves could affect mainly the depreciation of fixed assets related directly to mining activity, the provision for mine closure, the assessment of the deferred asset’s recoverability and the amortization period for development costs.
Exploration and mineMine development costs
We review and evaluate our accounting policy regarding exploration and mine development costs, which requires judgment in determining whether it is likely that future exploitation will result in future economic benefits. The determination of reserves and mineral resources is a complex estimation that entails varying degrees of uncertainty depending on sub-classification, and these estimates directly impact the point of deferral of exploration and mine development costs and the amortization method for development costs. The deferral policy requires us to make certain estimates and assumptions about future events or circumstances—in particular, whether an economically viable extraction operation and mineral sale can be established. Estimates and assumptions made may change as new information becomes available. If, after the expenditure is capitalized, information becomes available suggesting that we are unlikely to recover the expenditure, the amount capitalized is written off in our profit and loss statement for the period in which the new information becomes available.
| 86 |
Impairment of non-financial assets
We determine whether the operations of each mining unit are cash generating units, considering each mining unit operation independently. We assess at each reporting date whether there is an indication that an asset may be impaired. If any such indication exists, we estimate the asset’s recoverable amount. An asset’s recoverable amount is the higher of the asset’s fair value less costs to sell and its use value and is determined for an individual asset (cash-generating unit) unless the asset does not generate cash inflows that are clearly independent of those from other assets or groups of assets. These assessments require the use of estimates and assumptions such as long-term commodity prices, discount rates, operating costs, and others.
A cash-generating unit is the smallest identifiable group of assets that generates cash inflows from continuing use that are independent of the cash inflow generated by other assets or groups of assets.
In assessing use value, the estimated future cash flows are discounted to their present value using a discount rate that reflects current market assessments of the time value of money and the risks specific to the asset.
During the fourth quarter of 2010, we updated our assessment of the recoverability of the book value of our long-term assets under the procedures established by IAS 36 – “Impairment of Assets” and reversed the impairment of the Antapite, Recuperada and Poracota mining units as of December 31, 2010 following positive changes in the assumptions used to calculate the impairment provision recorded in order to determine the recovery carrying amount of our long-lived assets. The impairment reversed as of December 31, 2010 amounted to US$16.2 million, with US$8.7 million recorded as “Mining concessions and property, plant and equipment” and US$7.6 million recorded as “Development costs.” See Notes 11 and 12 to the Financial Statements.13.1 million.
During the fourth quarter of 2011, we updated our assessment of the recoverability of the book value of our long-term assets under the procedures established by IAS 36 – “Impairment of Assets” and identified no impairment indication in our long-lived assets.
AssessingDuring the impairmentfourth quarter of long-lived assets involves comparing their respective carrying amounts with their recoverable values. The recoverable2012, we updated our assessment of the recoverability of the book value of anour long-term assets under the procedures established by IAS 36 – “Impairment of Assets” for three of our mining units (Recuperada, Poracota and Antapite), which resulted in the recognition of asset is the greaterimpairment charges of its fair value less the cost of sale or its value in use.
In 2010, we recorded anUS$3.6 million (recognized as operating expense). These impairment charges had no impact on our operating cash flows. Cash flows used to assess recoverability of our long-lived assets provision in connection withand measure the Shila-Paula mining unit in the amount of US$3.1 million, with US$1.3 million recorded as “Mining concessions and property, plant and equipment” and US$1.8 million recorded as “Development costs.”The recoverable amount used in assessing the Shila-Paula cash generating unit is the faircarrying value of its assets less the associated cost of sale. According to Management, the market valueour mining operations were derived from current business plans using near-term price forecasts reflective of the assets, discounting cost of sale, is US$4.7 million.
The recoverable value used in assessing the Poracota, Antapitecurrent environment and Recuperada units is their value in use. We estimated the use value of their long-lived assets using a discounted cash flow model. Cash flow was projectedManagement’s projections for the useful life of the mining units based on Management’s expectations. This useful life depends on several variables, including the mineral reserves of each unit.long-term average metal prices and operating costs.
Our asset impairment evaluations required us to make several assumptions in the discounted cash flow valuation of (i) our individual mining operations, including near and long-term metal price assumptions, production volumes, estimates of commodity-based and other input costs and (ii) proven and probable reserve estimates, including any costs to develop the reserves and the timing of producing the reserves, as well as the appropriate discount rate. Our December 31, 20102011 and 2011,2012 impairment evaluation was based on price assumptions reflecting prevailing metals prices for the following four years.
We believe events that could result in additional impairment of our long-lived assets include, but are not limited to, (i) decreases in future metal prices, (ii) decreases in estimated recoverable proven and probable reserves and (iii) any event that might otherwise have a material effect on mine site production levels or costs.
Deferred income tax asset and recoverability
In preparing our annual consolidated financial statements, we estimate the actual amount of taxes currently payable or receivable as well as deferred tax assets and liabilities attributable to temporary differences between the tax and book bases of assets and liabilities. Deferred income tax assets and liabilities are measured using tax rates applicable to taxable income in the years in which these temporary differences are expected to be recovered or settled. The effect on deferred tax assets and liabilities of a change in tax rates and laws is recognized in income in the period in which such changes are enacted.
All deductible temporary differences and loss carry-forwards generate the recognition of deferred assets to the extent that it is probable that they can be used in calculating taxable income in future years. Deferred income tax liability is recognized for all deductible temporary differences and tax loss carry-forwards, to the extent that it is probable that taxable profit will be available against which the deductible temporary differences and unused tax losses can be utilized. The carrying amount of the deferred income tax asset is reviewed at each consolidated statement of financial position date and reduced to the extent that it is no longer probable that sufficient taxable profit will be available to allow all or part of the deferred asset to be utilized. Unrecognized deferred assets are reassessed at each consolidated statement of financial position date.
Deferred assets and liabilities are offset if there is a legal right to set them off and the taxes deferred relate to the same entity and the same tax authority.
Deferred tax assets, including those resulting from unused tax losses, require that we assess the probabilitylikelihood that we would generate taxable earnings in future periods to apply the deferred tax assets. Estimated future taxable income is based on projections of cash flow from operations and application of the tax law existing in each jurisdiction. To the extent thatto which actual future cash flows and taxable income differ significantly from those estimated, our ability to realize the deferred tax assets posted as of the reporting date may be affected.
In addition, future changes in the tax law in jurisdictions where we operate could limit our ability to obtain tax deductions in future periods.
At December 31, 2012, 2011 and 2010, our valuation allowance totaled US$5.3 million, US$3.8 million and US$2.6 million, respectively.
Inventories
Inventories are classified as short-term or long-term depending on the length of time that management estimates that minerals will be placed in stockpiles priorneeded to reach the production state of concentrate extraction of concentrates atfor each mining unit.
Net realizable value tests are performed at least annually and represent the estimated future sales price of the product based on prevailing spot metals prices at the reporting date, less estimated costs to complete production and bring the product to sale. StockpilesAdditionally, management also considers the time value of money in calculating the net realizable value of our long-term inventories.
Classified minerals, which are materials with metal content that were removed from the pit of the Colquijirca mining unit for treatment at the expansion operation plant, contain lower grade ore than the average of treated minerals and are available to continue in the process of recovery of mineral and concentrates. Because it is generally impracticable to determine the mineral contained in the classified mineral located in the deposit field near Tajo Norte by physical count, reasonable estimation methods are employed. The quantity of minerals delivered to classified mineral is based on surveyed volumes of mined material and daily production records. Sampling and assaying of blasthole cuttings determine the estimated copper, lead and zinc grades of material delivered to classified minerals.
For minerals outside leach platform inventories, finished and in-progress goods are measured by estimating the number of tons added and removed from the stockpile.removed. The contentnumber of contained gold ounces and activated coal is calculated based on assay data, and the estimated recovery percentage according tois based on the expected processing method. Stockpile tonnagesTonnages and ounces of mineral are verified by periodic surveys.
For minerals inside leach platform inventories, reasonable estimation methods are employed because it is generally impracticable to determine the mineral contained in leach platforms by physical count. The quantity of material delivered to leach platforms are based on surveyed volumes of mined material and daily production records. Sampling and assaying of blasthole cuttings determine the estimated ore grades of material delivered to leach platforms.
Accrual for mine closing costs
We record a provision for mine closure when a legally enforceable obligation arises, which is independent of the full depletion of the mine reserves. Once such an obligation has been appropriately measured, it is recorded by creating a liability equal to the amount of the obligation and recording a corresponding increase to the carrying amount of the related long-lived asset (mine development cost and property, plant and equipment). Over time, the amount of the obligation changes, impacting recording and accretion expenses. Additionally, the capitalized cost is depreciated and/or amortized based on the useful lives of the related assets.
Any difference in the settlement of the liability will be recorded in the results of the period in which such settlement occurs. The changes in the fair value of an obligation or the useful life of the related assets that occur from the revision of the initial estimates should be recorded as an increase or decrease in the book value of the obligation and related asset.
Following our accounting treatment, we have recorded an accrual for mine closure costs of US$81.999.4 million, as of December 31, 20112012 in order to comply with governmental requirements for environmental remediation.
We assess our provision for closure of mining units annually. It is necessary to make significant estimates and assumptions in determining this provision because there are a number of factors that will affect the ultimate liability for this obligation. These factors include estimating the scope and costs of closing activities, technological changes, regulatory changes, increases in costs compared to inflation rates and changes in the discount rates. Such estimates or assumptions may result in actual expenses in the future that differ from the amounts provisioned at the time the provisions were established. The provision at the date of this report presents our best estimate of the present value of future costs for the closure of mining units.
Fair value of derivative financial instruments
Outstanding derivative contracts.We recognize derivative instruments as assets or liabilities, measured at their fair value, in our consolidated statements of financial position pursuant to IAS 39, “Financial Instruments — Recognition and Measurement.”
Subsidiary derivative contracts. During 2010 and 2011, our indirect subsidiary, El Brocal, entered into price-hedgingoption contracts at zero cost to protect future cash flows derived from sales in 2011 and 2012. Derivative contracts are recognized as assets and liabilities at fair value in the consolidated financial statements. El Brocal applies hedge accounting for those transactions that meet the specific criteria applicable in accordance with IAS-39. The key termsAs of these hedge agreements were negotiatedDecember 31, 2012, El Brocal was not a party to coincide with the negotiated terms of the commercial contracts to which they are related. The hedge of cash flow from future sales was assessed by El Brocal’s management as highly effective. The effectiveness ofany hedging transactions has been measured by means of the cumulative cash flow change offset method, which El Brocal management believes best reflects the objective of managing price risk.and had no outstanding hedging commitments.
The critical terms of hedging transactions have been negotiated with the brokers so as to agree with the terms negotiated in the related commercial contracts. These hedging options establish a maximum and a minimum price. When the average price for the quotation period is above the maximum price established, the purchase option in favor of the counterparty is activated, generating a payment to El Brocal of the difference between the two prices. On the other hand, when the average price for the quotation period is below the minimum price established, the sale option in favor of El Brocal is activated, resulting in receipt of the difference between the two prices.
Our derivative contracts. As of December 31, 2010, 2011 and 2011,2012, neither we nor any of our wholly-owned subsidiaries held gold derivative contracts.
Fair value of the liability related to long-term officer compensation
Our senior executive officers are granted share appreciation rights, which can only be settled in cash, if the executive is working for us at each program’s settlement date. These programs are mainly structured in a ten-year term, allocated in several programs with progressive maturities. The average price of the granted share appreciation rights is assigned based on last quarter market quotation of the shares before the grant date and the settlement price is determined based on the variation of the market prices at the maturity date as compared to the price at the date of the grant.
We used the Turnbull & Wakeman Method to estimate the fair value of this liability and the principal assumptions made are as follows: the historical volatility, risk-free interest rate, dividend yield, period covered by the program and market value of the shares at closing. See Note 1514 to the Financial Statements.
Contingencies
Contingent liabilities, when identified, are assessed as either remote, possible or probable. Contingent liabilities are recorded in the consolidated financial statements when it is probable that future events will confirm them and when their amount can be reasonably estimated. Contingent liabilities deemed as possible are only disclosed, together with a possible debit range, when determinable, in notes to the Financial Statements.
Contingent assets are not recognized in the financial statements; however, they may be disclosed in notes to the financial statements if it is probable that such contingent assets will be realized. See Note 3130 to the Financial Statements.
Determining contingencies inherently involves the exercise of judgment and calculation of the estimated resultsoutcomes of future events.
Production start date
We assess the stage of each mine under development to determine when a mine moves into the production stage. The criteria used to assess the start date are determined based on the nature of each mining project, the complexity of a plant and its location. We consider differentvarious relevant criteria for assessing when the mine is substantially complete and ready for its planned use. Some of these criteria are the level of capital expenditure compared to development cost estimates, a reasonable testing period for the mine’s plant and equipment and the ability to sustainproduce ongoing production of metal.
When a mine development project moves into the production stage, the capitalization of certain costs ceases, and they are considered as inventory or expenses, except for costs that qualify for capitalization relating to mining asset additions or improvements, underground mine development or mineable reserve development. It is also at this point that depreciation or amortization commences.
Unit-of-production depreciation
Reserves are used in determining the depreciation and amortization of mine-specific assets. This results in a depreciation or amortization charge proportional to the depletion of the anticipated remaining life of mine production. Each mine’s life is assessed annually to evaluate: (i) physical life limitations and (ii) present assessments of economically recoverable reserves of the mine property. These calculations require the use of estimates and assumptions, including the amount of recoverable reserves. Changes are recorded prospectively.
Depreciation and amortization of assets whose useful life is longer than the life of the mine is calculated on a unit-of-production basis over the economically recoverable reserves of the mine. Depreciation and amortization of assets whose useful life is shorter than the life of the mine is calculated using the straight-line method.
The units of production are measured in recoverable metric tons of concentrate. The unit-of-production rate for depreciation and amortization takes into account expenditures incurred to date.
Expected recovery rates used to estimate mineral contained in in-process inventories
For determining the quantity of mineral contained in the products in process we use a reasonable methodology to estimate the mineral content that is treated at the date of the consolidated financial statement. The amount of mineral added in the products in process is determined by the sampling of mill volumes and the daily production records. The sampling and assays determine the head grade of the mineral added to the products in process.
The recovery rates of the productsfor leach platforms in process are determined by metallurgical sampling. The mineral recoverability of the products in process,leach platforms, once the production process begins, can be reasonably estimated. The rate is determined using pilot laboratory tests, historic trends and others factors. TheProcess and recovery rates are monitored continuously, and estimatesrecovery rates are adjusted periodically.periodically as additional information becomes available and as related technology changes.
Deferred stripping cost
Stripping costs incurred in the development of a mine before production commences are capitalized as part of the cost of constructing the mine and subsequently amortized over the life of the mine on a unit-of-production basis.
Where a mine operates several open pits that are regarded as separate operations for the purpose of mine planning, stripping costs are accounted for separately by reference to the ore from each separate pit. If, however, the pits are highly integrated for the purpose of the mine planning, the second and subsequent pits are regarded as extensions of the first pit in accounting for stripping costs. In such cases, the initial stripping (i.e., overburden and other waste removal) of the second and subsequent pits is considered to be production-phase stripping relating to the combined operation.
Deferred stripping cost is included in “Mining rights, development cost and property, plant and equipment, net” caption in the consolidated statement of financial position. These form part of the total investment in the relevant cash generating units, which are reviewed for impairment if events or changes of circumstances indicate that the carrying value may not be recoverable.
The stripping costs incurred during the production phase are recognized as an operating expense when they are incurred. Theses costs of products are included as part of the cost of inventory.
Useful life of property, plant and equipment
Straight-line method
Depreciation is calculated under the straight-line method of accounting considering the lower of estimated useful lives of the asset or estimated reserves of the mining unit. The useful lives are the following:
| Property, Plant and Equipment | Estimated Years of Useful Life | |||
| Buildings, construction and other | Between 6 and 20 | |||
| Machinery and equipment | Between 5 and 10 | |||
| Transportation units | 5 | |||
| Furniture and fixtures | 10 | |||
| Computer equipment | 4 | |||
An item of property, plant and equipment is de-recognized upon disposal or when no future economic benefits are expected from its use or disposal. Any gain or loss arising from de-recognizing an asset (calculated as the difference between the proceeds from the sale and the book value of the asset) is included in the consolidated income statement in the year the asset is de-recognized.
The asset’s residual value, useful lives and methods of depreciation are reviewed, and adjusted if appropriate, at each financial year end.
Fair value of embedded derivative for concentrates sales
Substantially all of our concentrate sales contracts provide final copper pricing in a specified period (generally one to four months from the shipment date) based on quoted LME prices. We ultimately receive market prices based on prices in the specified future period; however, the accounting rules applied to these sales result in changes recorded as revenue until the specified future period. We record revenues and invoice customers at the time of shipment based on the current LME prices, which result in an embedded derivative on our provisional priced concentrate sales that are adjusted to fair value through earnings of each period until the date of final pricing. To the extent final prices are higher or lower than what was recorded on a provisional basis, an increase or decrease to revenues is recorded each reporting period until the date of final pricing. See Notes 1918 and 28(c)27(c) to the Financial Statements.
Revenues
According to our accounting policies, revenue is recognized to the extent that it is probable that the economic benefits will flow to us. Revenue is measured at the fair value of the consideration received, excluding discounts and other sales taxes or duty.
Revenues from sales of concentrates, gold and silver are recognized when the significant risks and rewards of ownership have been transferred, which is considered to occur when title passes to the customer. This generally occurs when the product is physically transferred to the buyer.
Revenues for engineering services rendered by Buenaventura Ingenieros S.A. are recognized based on the progress of the current service contracts.
Revenues for construction services are recognized when the outcome of a contract can be estimated reliably. Contract revenue associated with a construction contract is recognized by reference to the stage of completion of the contract activity at the end of the reporting period.
Results of Operations for the Years Ended December 31, 2012 and 2011
Net sales. Net salesincreased by 0.16 percent, from US$1,493.9 million in 2011 to US$1,496.3 million in 2012, principally due to anincrease in the average realized prices of gold and increases in the volume of silver, lead and zinc sold, partially offset bylower volumes of gold and copper sold. The following tables reflect the average realized price and volume sold of gold, silver, lead, zinc and copper during the years ended December 31, 2011 and 2012:
| Average Realized Price | Year ended December 31, | |||||||||||
| 2011 | 2012 | Variation | ||||||||||
| Gold (US$/oz.) | US$ | 1,574.45 | US$ | 1,678.92 | 6.64 | % | ||||||
| Silver (US$/oz.) | 35.36 | 31.25 | (11.62 | )% | ||||||||
| Lead (US$/MT) | 2,262.34 | 2,064.65 | (8.74 | )% | ||||||||
| Zinc (US$/MT) | 2,199.72 | 1,919.04 | (12.76 | )% | ||||||||
| Copper (US$/MT) | 8,567.64 | 7,937.08 | (7.36 | )% | ||||||||
| Volume Sold | Year ended December 31, | |||||||||||
| 2011 | 2012 | Variation | ||||||||||
| Gold (oz.) | 505,894 | 439,816 | (13.06 | )% | ||||||||
| Silver (oz.) | 14,843,193 | 17,474,113 | 17.72 | % | ||||||||
| Lead (MT) | 18,192 | 25,589 | 40.66 | % | ||||||||
| Zinc (MT) | 33,307 | 43,180 | 29.64 | % | ||||||||
| Copper (MT) | 23,231 | 22,373 | (3.69 | )% | ||||||||
(a) Gold sales. The average sales price for gold increased from US$1,574.45 per ounce in 2011 to US$1,678.92 per ounce in 2012. Gold sales volume decreased from 505,894ounces in 2011 to 439,816 ounces in 2012, primarily due to decreased gold production at our Poracota and Antapite mining units. These combined effect of these changes resulted in a US$52.9 million decrease in income from sales of gold in 2012 compared to 2011.
(b) Silver sales. Average realized silver prices decreased from US$35.36 per ounce in 2011 to US$31.25 per ounce in 2012. The volume of silver sales increased from 14,843,193 ounces in 2011 to 17,474,113 ounces in 2012, primarily due to increased silver production at our Uchucchacua and Colquijirca mining units. These combined effect of these changes resulted in a US$18.6 million increase in income from sales of silver in 2012 compared to 2011.
(c) Lead sales.Average realized lead prices decreased from US$2,262.34 per metric ton in 2011 to US$2,064.65 per metric ton in 2012. Additionally, the volume of lead sold increased from 18,192 metric tons in 2011 to 25,589 metric tons in 2012, primarily due to increased lead production at our Colquijirca mining unit. The combined effect of these changes resulted in a US$15.9 million increase in income from sales of lead in 2012 compared to 2011.
(d) Zinc sales.Average realized zinc prices decreased from US$2,199.72 per metric ton in 2011 to US$1,919.04 per metric ton in 2012. The volume of zinc sold increased from 33,307 metric tons in 2011 to 43,180 metric tons in 2012, primarily due to increased zinc production at our Uchucchacua and Mallay mining units. The combined effect of these changes resulted in a US$10.8 million increase in income from sales of zinc in 2012 compared to 2011.
(e) Copper sales.Average copper prices decreased from US$8,567.64 per metric ton in 2011 to US$7,937.08 per metric ton in 2012. The volume of copper sold decreased from 23,231 metric tons in 2011 to 22,373 metric tons in 2012, largely due to decreased copper production at our Colquijirca mine. These changes resulted in a US$15.6 million decrease in income from sales of copper in 2012 compared to 2011.
The revenues from gold, silver, lead, zinc and copper mentioned above do not include refinery charges and penalties incurred, which amounted to US$147.9 million in 2012, compared to US$127.9million in 2011.
Royalty income. In 2012, royalty income received by our subsidiary, Chaupiloma, amounted to US$67.2 million, representing a7 percent increasefrom the US$62.7 million of royalty income received in 2011. This increase is attributed to increased sales by Yanacocha in 2012, which resulted primarily from an increase in the average realized price of gold and an increase in Yanacocha’s production. See Note 31(a) to the Financial Statements. Yanacocha pays Chaupiloma, in which we directly and indirectly hold a 60 percent interest, a royalty equal to 3 percent of Yanacocha’s net sales.
Total operating costs. Total operating costsincreasedby32 percent, from US$712.2 million in 2011to US$943.2 in 2012, due to the following:
(a) Cost of sales, without considering depreciation and amortization,increasedby41 percent, from US$446.2million in 2011to US$629.5 million in 2012, mainly due to a US$100.9 million increase in services provided by third parties and a US$32.9 million increase as a result of spare parts and supplies. The increase was mainly due to: (i) a US$54.6 million increase in the cost of the inventories held at the beginning of 2012 as compared to the beginning of 2011 (ii) a US$44.3 million increase reflecting the impact of costs incurred in connection with commencing operations at our Mallay and Breapampa mining units; and (iii) a US$36.6 million increase reflecting an increase in the services and raw materials provided by contractor suppliers at our Orcopampa and Uchucchacua mining units due to an increase in exploration activities and diamond drilling works in order to maintain our ore reserves level and an increase in cost related to the higher volume of mineral treated in 2012.
(b) Exploration in units in operation increased by 40 percent, from US$109.4 million in 2011to US$153.0 million in 2012. These increasedcosts were principally due to anincrease in exploration projects at our Orcopampa, Poracota, Uchucchacua, Mallay and Antapite mines. See Note 20 to the Financial Statements.
(c) Depreciation and amortization costsincreased by28 percent, from US$96.4 million in 2011to US$123.0 million in 2012, mainly due to: (i) a US$13.4 million increase inthe depreciation and amortization of the tailing areas put into operationat our Colquijirca mining unit during 2012 and (ii) a US$9.9 million increase in acquired assets put into operation during 2012 at our La Zanja mining unit.
(d)Royalty expenses to third parties and the Peruvian governmentdecreased by37 percent, from US$60.3 million in 2011to US$37.7 million in 2012. Royalties paid to third parties amounted to US$32.0 million and US$35.2 million in 2011 and 2012, respectively. Royalties paid to the Peruvian government amounted to US$28.2 million and US$2.5million in 2011 and 2012, respectively. Thedecreasein royalties paid to third parties and the Peruvian government was mainly due to Peruvian legislative changes. Peruvian legislation requires owners of mining concessions to pay the Peruvian government for the exploitation of metallic and non-metallic resources. Prior to October 1, 2011, mining royalties were calculated with rates ranging from 1 to 3 percent of the value of mineral concentrates or the equivalent, according to the quoted market price published by the Ministry of Energy and Mines. Beginning on October 1, 2011, the Peruvian government instituted a new mining royalty and tax regime.See “Item 4. Information on the Company—Buenaventura—B. Business Overview—Regulatory Framework—Mining Royalties and Taxes” for additional information regarding the mining royalties and taxes now applicable to us.
Total operating expenses. Operating expensesincreased by44 percent, from US$140.1 million in 2011to US$202.1 million in 2012, due to changes in the following components:
(a) Administrative expensesincreased by32 percent, from US$75.2million in 2011to US$99.3 million in 2012, mainly due to (i) a US$7.7 million increase in expenses recorded for long-term officers’ compensation (stock appreciation rights) and (ii) a US$5.7 million increase in other management expenses related to foreign engineering consulting services.See Note 22 to the Financial Statements.
(b) Exploration in non-operational areasincreased by92 percent, from US$49.6 million in 2011to US$95.5 million in 2012, due to higher expenditures in exploration areas, primarily Shila, Trapiche, San Gregorio and Chancas.See Note 23 to the Financial Statements.
(c) Impairment of long-lived assets resulted in a loss of US$3.6 million being recorded in 2012. We evaluated our long-lived assets for impairment as of December 31, 2012, which resulted in a reduction in the carrying amount of mining concessions, development costs and property, plant and equipment to their recoverable amount. See Note 11 to the Financial Statements.
Operating income. As a result of the foregoing, operating incomedecreased by41 percent, from US$704.4 million in 2011to US$418.2 million in 2012.
Share in the results of related parties under equity method. Income from equity investments in related partiesdecreased by1 percent, from US$468.4 million in 2011to US$464.2 million in 2012, principally due to decreases in income from our equity investments in Yanacocha and Cerro Verde, partially offset by the effect of an increase in income from our equity investment in Coimolache. Income from our interest in Yanacocha decreased by 2 percent, from US$279.7 million in 2011 to US$272.9 million in 2012.Income from our interest in Cerro Verde decreased by 28 percent, from US$208.7 million in 2011 to US$151.2 million in 2012. Income from our interest in Coimolache increased from US$9.6 million in 2011 to US$40.2 million in 2012, due to the impact of increased gold production at the Tantahuatay mine.
Income tax. Provision for income taxdecreased from US$211.6 million in 2011to US$142.6 million in 2012, principally due to a US$286.7 million decrease in pre-tax income, from US$1,172.1 million in 2011 to US$885.4 million in 2012.
Non-controlling interest. Non-controlling interest expense decreased by 43 percent, from US$101.6 million in 2011 to US$58.1 million in 2012, mainly due to a decrease in contribution of profits from El Brocal and La Zanja, partially offset an increase in contribution of profits from Chaupiloma.
Net income. As a result of the foregoing, net income decreased by 20 percent, from US$858.9 million in 2011 to US$684.7 million in 2012. As a percentage of net sales, net income was 44 percent in 2012 as compared to 55 percent in 2011.
Results of Operations for the Years Ended December 31, 2011 and 2010
Net sales. Net salesincreased by 43 percent, from US$1,047.9 million in 2010 to US$1,493.9 million in 2011, principally due to anincrease in the average realized prices of gold and silver and increases in the volume of gold, silver and copper sold, partially offset bylower volumes of other base metals sold. The following tables reflect the average realized price and volume sold of gold, silver, lead, zinc and copper during the years ended December 31, 2010 and 2011:
| Average Realized Price | Year ended December 31, | |||||||||||
| 2010 | 2011 | Variation | ||||||||||
| Gold (US$/oz.) | US$ | 1,253.35 | US$ | 1,574.45 | 25.62 | % | ||||||
| Silver (US$/oz.) | 20.86 | 35.36 | 69.51 | % | ||||||||
| Lead (US$/MT) | 2,106.41 | 2,262.34 | 7.40 | % | ||||||||
| Zinc (US$/MT) | 2,135.57 | 2,199.72 | 3.00 | % | ||||||||
| Copper (US$/MT) | 8,113.56 | 8,567.64 | 5.60 | % | ||||||||
| Volume Sold | Year ended December 31, | |||||||||||
| 2010 | 2011 | Variation | ||||||||||
| Gold (oz.) | 461,817 | 505,894 | 9.54 | % | ||||||||
| Silver (oz.) | 13,176,383 | 14,843,193 | 12.65 | % | ||||||||
| Lead (MT) | 22,970 | 18,192 | (20.80 | )% | ||||||||
| Zinc (MT) | 43,562 | 33,307 | (23.54 | )% | ||||||||
| Copper (MT) | 15,946 | 23,231 | 45.69 | % | ||||||||
(a) Gold sales. The average sales price for gold increased from US$1,253.35 per ounce in 2010 to US$1,574.45 per ounce in 2011. Gold sales volume increased from 461,817 ounces in 2010 to 505,894ounces in 2011, primarily due to the impact of a full year of gold production at our La Zanja mining unit, partially offset by decreased gold production at our Orcopampa mining unit. These changes resulted in a US$212.8 million increasein income from sales of gold in 2011 compared to 2010.
(b)Silver sales. Average realized silver prices increased from US$20.86 per ounce in 2010 to US$35.36 per ounce in 2011. The volume of silver sales increased from 13,176,383 ounces in 2010 to 14,843,193 ounces in 2011, primarily due to increased silver production at our Julcani and Colquijirca mining units. These changes resulted in a US$251.8 million increase in income from sales of silver in 2011 compared to 2010.
(c) Lead sales. Average realized lead prices increased from US$2,106.41 per metric ton in 2010 to US$2,262.34 per metric ton in 2011. Additionally, the volume of lead sold decreased from 22,970 metric tons in 2010 to 18,192 metric tons in 2011. The combined effect of these changes resulted in a US$10.0 million decrease in income from sales of lead in 2011 compared to 2010.
(d) Zinc sales. Average realized zinc prices increased from US$2,135.57 per metric ton in 2010 to US$2,199.72 per metric ton in 2011. The volume of zinc sold decreased from 43,562 metric tons in 2010 to 33,307 metric tons in 2011, primarily due to decreased zinc production at our Colquijirca mining unit. The combined effect of these changes resulted in a US$20.8 million decrease in income from sales of zinc in 2011 compared to 2010.
(e) Copper sales. Average copper prices increased from US$8,113.56 per metric ton in 2010 to US$8,567.64 per metric ton in 2011. The volume of copper sold increased from 15,946 metric tons in 2010 to 23,231 metric tons in 2011, largely due to increased copper production at our Colquijirca mine. The combined effect of these changes resulted in a US$63.8 million increase in income from sales of copper in 2011 compared to 2010.
The revenues from gold, silver, lead, zinc and copper mentioned above do not include refinery charges and penalties incurred, which amounted to US$127.9 million in 2011, compared to US$112.3 million in 2010.
Royalty income. In 2011, royalty income received by our subsidiary, Chaupiloma, amounted to US$62.7 million, representing a12 percentincrease from the US$55.9 million of royalty income received in 2010. This increase is attributed toincreased sales by Yanacocha in 2011, which resultedprimarily from an increase in the average realized price of gold,, partially offset by lower production.production. See Note 32(a)31(a) to the Financial Statements. Yanacocha pays Chaupiloma, in which we directly and indirectly hold a 60 percent interest, a royalty equal to 3 percent of Yanacocha’s net sales.
Total operating costs. Total operating costsincreasedby26 percent, from US$565.7 million in 2010 to US$712.2 million in 2011, due to the following:
(a) Cost of sales, without considering depreciation and amortization,increasedby29 percent, from US$347.1 million in 2010 to US$446.2million in 2011. The increase was mainly due to: (i) a US$27.6 million increase due to the impact of a full year of gold production at our La Zanja mining unit; (ii) a US$22.2 million increase due to an increase in the services provided by contractor suppliers at our Colquijirca mining unit, (iii) a US$16.9 million increase due to the acquisition of zinc concentrate from third parties as a result ofdecreased zinc production at our Colquijirca mining unit and (iv) a US$14.5 million increase due to fixed costs at our Orcopampa mining unit due to a decrease in gold production.
(b) Exploration in units in operationincreased by 20 percent, from US$91.4 million in 2010 to US$109.4 million in 2011. Theseincreasedcosts were principally due to anincrease in exploration projects at our Uchucchacua, Orcopampa, Shila-Paula and La Zanja mines. See Note 2120 to the Financial Statements.
(c) Depreciation and amortization costsincreased by29 percent, from US$74.9 million in 2010 to US$96.4 million in 2011, mainly due to: (i)the impact of a full year of depreciation of the assets of La Zanja S.R.L. and (ii) the depreciation of the assets of a new plant put into operationat our Colquijirca mining unit during 2011.
(d)Royalty expenses to third parties and the Peruvian governmentincreased by15 percent, from US$52.3 million in 2010 to US$60.3 million in 2011. Royalties paid to third parties amounted to US$27.7 million and US$32.0 million in 2010 and 2011, respectively. Royalties paid to the Peruvian government amounted to US$24.6 million and US$28.2 million in 2010 and 2011, respectively. Theincrease in royalties paid to third parties and the Peruvian government was mainly due to the increased value of metals and concentrates sold. Peruvian legislation requires owners of mining concessions to pay the Peruvian government for the exploitation of metallic and non-metallic resources. Prior to October 1, 2011, mining royalties were calculated with rates ranging from 1 to 3 percent of the value of mineral concentrates or equivalent, according to the quoted market price published by the Ministry of Energy and Mines. Beginning on October 1, 2011, the Peruvian government instituted a new mining royalty and tax regime. See “Item 4. Information on the Company—Buenaventura—B. Business Overview—Regulatory Framework—Mining Royalties and Taxes” for additional information regarding the mining royalties and taxes now applicable to us.
Total operating expenses. Operating expensesincreased by23 percent, from US$113.9 million in 2010 to US$140.1 million in 2011, due to changes in the following components:
(a) Administrative expensesdecreased by30 percent, from US$107.2 million in 2010 to US$75.2million in 2011, mainly due to decreased expenses recorded for long-term officers’ compensation (stock appreciation rights).See Note 2322 to the Financial Statements.
(b) Exploration in non-operational areasincreased by37 percent, from US$36.1 million in 2010 to US$49.6 million in 2011, due to higher expenditures in exploration areas, primarily Mallay, Breapampa, Trapiche, Colquemayo, Pachuca and Marcapunta.See Note 2423 to the Financial Statements.
(c) Reimbursement of exploration expenses on projects. During 2010, US$15.0 million considered as an exploration expense from Coimolache was reversed and capitalized on our balance sheet as an Investment in associates. No comparable amounts were received in 2011.
(d) Reversal for impairment of long-lived assets resulted in a net recovery of US$13.1 million being recorded in 2010. We updated our assessment of the recoverability of the book value of our long-lived assets and reversed the impairment of the Antapite, Recuperada and Poracota mining units as of December 31, 2010 following positive changes in the assumptions used to calculate the impairment provision recorded in order to determine the recovery carrying amount of our long-lived assets. The impairment reversed as of December 31, 2010 amounted to US$16.2 million, with US$8.6 million recorded as “Mining concessions and property, plant and equipment” and US$7.6 million recorded as “Development costs.” We also recorded an impairment of our long-lived assets from the Shila-Paula mining unit in the amount of US$3.1 million, with US$1.3 million recorded as “Mining concessions and property, plant and equipment” and US$1.8 million recorded as “Development costs.” See Note 1211 to the Financial Statements. During 2011, we updated our assessment of the value in use of our long-lived assets and concluded that there was no impairment indication.
Operating income. As a result of the foregoing, operating incomeincreased by66 percent, from US$424.1 million in 2010 to US$704.4 million in 2011.
Share in the results of related parties by equity method. Income from equity investments in related partiesincreased by9 percent, from US$428.9 million in 2010 to US$468.4 million in 2011, principally due toincreases in income from our equity investments in Coimolache, Yanacocha and Cerro Verde. Income from our interest in Yanacocha increased by 11 percent, from US$251.5 million in 2010 to US$279.7 million in 2011. This increase is attributable to an increase in the average realized price of gold, partially offset bydecreased gold production. Income from our interest in Coimolache increased from a loss of US$15.9 million in 2010 to an income of US$9.6 million in 2011, due to the commencement of gold production at the Tantahuatay mine in mid-2011.
Income tax. Provision for income taxincreased from US$123.3 million in 2010 to US$211.6 million in 2011, principally due to a US$323.9 million increase in pre-tax income, from US$848.2 million in 2010 to US$1,172.1 million in 2011.
Non-controlling interest. Non-controlling interest expense increased by 59 percent, from US$64.1 million in 2010 to US$101.6 million in 2011, mainly due to an increase in contribution of profits to non-controlling investors in La Zanja and Chaupiloma, partially offset by a decrease in contribution of profits from El Brocal.
Net income. As a result of the foregoing, net income increased by 30 percent, from US$660.8 million in 2010 to US$858.9 million in 2011. As a percentage of net sales, net income was 55 percent in 2011 as compared to 60 percent in 2010.
B. Liquidity and Capital Resources
As of December 31, 2011,2012, we had cash and cash equivalents of US$470.8186.7 million, compared to US$582.9470.8 million at December 31, 2010.2011.
Cash provided by operating activities for the years ended December 31, 2012 and 2011. Net cash and cash equivalents provided by operating activities were US$335.7 million in 2012 compared to US$567.5 million in 2011.The decrease in net cash flow provided by operating activities was mainly attributable to (i)decreased proceeds from sales, from US$1,505.5 million in 2011 to US$1,410.1 million in 2012; (ii) increased payments to third parties, from US$672.5 million in 2011 to US$838.3 million in 2012; and (iii) increased income tax paid, from US$111.8 million in 2011 to US$136.3 million in 2012; partially offset by (i) increased royalties received, from US$56.2 million in 2011 to US$76.1 million in 2012; (ii) increased dividends received from Coimolache, from no dividends received in 2011 to US$16.5 million in 2012; (iii) an increase in value-added tax recovered, from US$22.6 million in 2011 to US$40.9 million in 2012; and (iv) decreased royalty payments, from US$73.8 million in 2011 to US$38.9 million in 2012, as a result of increased royalty payments to third parties and decreased payments to the Peruvian government.
Cash provided by operating activities for the years ended December 31, 2011 and 2010. Net cash and cash equivalents provided by operating activities were US$567.5 million in 2011 compared to US$537.6 million in 2010.The increase in net cash flow provided by operating activities was mainly attributable to (i)increased proceeds from sales, from US$997.8 million in 2010 to US$1,505.5 million in 2011 and (ii) an increase in value-added tax recovered, from US$7.5 million in 2010 to US$22.6 million in 2011; partially offset by (i) increased payments to third parties, from US$473.6 million in 2010 to US$701.7672.5 million in 2011; (ii) decreased dividends received from Yanacocha and Cerro Verde, from US$183.0 million received in 2010 to no dividends received in 2011; (iii) increased income tax paid, from US$56.3 million in 2010 to US$111.8 million in 2011; and (iv) increased royalty payments, from US$55.3 million in 2010 to US$73.8 million in 2011, as a result of increased royalty payments to third parties and increased payments to the Peruvian government.
Cash used in investing activities for the years ended December 31, 2012 and 2011. Net cash and cash equivalents used in investingactivities were US$487.5 million in 2012 compared to US$354.3 million in 2011.The increase in net cash flowused in investingactivitieswas mainly attributable to: an increase in mining concessions, development cost and property, plant and equipment, from US$317.8 million in 2011 to US$442.9 million in 2012, in connection with hydroelectric construction at our subsidiary, Huanza; and the expansion of the refining plant capacity at our subsidiary, El Brocal.
Cash used in investment activities for the years ended December 31, 2011 and 2010. Net cash and cash equivalents used in investing activities were US$340.1 million in 2010 compared to US$519.2354.3 million in 2011. Theincrease in net cash flow used in investing activities in 2011 compared with 2010 was mainly attributable to: an increase in payments for the purchase of investment shares, from US$19.6 million in 2010 to US$277.552.2 million in 2011; US$60.4 million in sales of investments related to sales of El Brocal shares; an increase in mining concessions, development cost and property, plant and equipment, from US$253.3 million in 2010 to US$317.8 million in 2011, in connection with hydroelectric construction at our subsidiary, Huanza; and the expansion of the refining plant capacity at our subsidiary, El Brocal.
Cash used in financing activities for the years ended December 31, 2012 and 2011. Net cash and cash equivalents used in financingactivities were US$132.3 in 2012 compared to US$325.2 million in 2011.The decrease in net cash flowused in financingactivitieswas mainly attributable to:a decrease in payments for purchase of shares to non-controlling shareholder, from US$225.3 million in 2011 from nil in 2012; an increase in financial obligations, from US$50.9 million in 2011 to US$74.3 million in 2012; and a decrease in the payment of dividends to non-controlling shareholders, from US$66.7 million in 2011 to US$44.9 million in 2012;partially offset by a decrease in proceeds from the sale of investments, shares from US$60.4 million in 2011 to nil in 2012; and an increase in the payment of dividends to shareholders, from US$142.5 million in 2011 to US$152.7 million in 2012.
Cash used in financing activities for the years ended December 31, 2011 and 2010. Net cash and cash equivalents used in financing activities were US$160.3352.2 million in 2011 compared to net cash used in financing activities of US$329.1 million in 2010.The decrease in net cash flow used in financing activities in 2011 compared with 2010 was mainly attributable to a decrease in payments of financial obligations, from US$226.1 million in 2010 to US$2.0 million in 2011, and a decrease in financial obligations, from US$53.3 million in 2010 to US$51.0 million in 2011, partially offset by an increase in the payment of dividends to shareholders, from US$117.0 million in 2010 to US$142.5 million in 2011, and an increase in the payment of dividends to non-controlling shareholders, from US$39.2 million in 2010 to US$66.7 million in 2011, an increase of US$60.4 million in sales of investments related to sales of El Brocal shares, and an increase in payments for the purchase of shares to non-controlling shareholders, from nil in 2010 to US$225.3 million in 2011.
Long-Term Debt
On December 2, 2009, Banco de Crédito del Peru executed a financial lease agreement with Conenhua, Huanza and us in the amount of US$119 million for construction of a hydroelectric power station. The lease was executed in favor of Huanza as lessee, and commits us to act as joint surety of Huanza to guarantee Huanza’s payment obligations. The term of the lease is 10 years and the interest rate is (i) LIBOR plus 4 percent from the first disbursement until six months after the start of commercial operation of the power station and (ii) LIBOR plus 4.1 percent from six months after the start of commercial operation of the power station until maturity. As of December 31, 20112012 and 2010,2011, amounts outstanding under this lease were US$105.1 million119.0 and US$54.1105.1 million, respectively.
On August 22, 2012, El Brocal entered into a medium-term loan contract with Banco de Crédito del Peru in the amount of US$120 million. This loan is variable rate (three-month LIBOR plus 3 percent) and has a term of four years. The loan is guaranteed by a pledge of one contract for the sale of copper concentrate and one contract for the sale of lead concentrate. As of December 31, 2012, US$60.0 million was outstanding under this loan. The interest expense related to this loan was US$0.3 million during the year ended December 31, 2012, which resulted in an increase in mining concessions, development cost and property, plant and equipment, net.
Exploration Costs; Capital Expenditures
Capital expenditures (estimatedfor 2013 are estimated to be approximately US$250) and exploration costs (estimated to be between approximately US$70 million and US$90 million) for 2012 (excluding exploration costs at our principal mines, which are included as part of their cost of production) are estimated to total between approximately US$320 million and US$340300 million. These budgeted capital expenditures include the following projects: the construction of Breapampa and Mallay projects, the expansion of El Brocal treatment plant, the construction of the Procesadora Industrial Rio Seco chemical plant to treat concentrates from Uchucchacua and the construction of the Huanza hydroelectrical plant.
During 2011,2012, we spent approximately US$21.195.5 million on “greenfield” and US$27.0153.0 million on “brownfield” exploration-related investments primarily in Peru and, to a lesser extent, in Chile and Mexico. Our “greenfield” investments mainly focused on the following exploration projects: Trapiche, Tambomayo, San Gregorio, Chancas, Hualgayoc, Marcapunta, Colquemayo, Pachuca Norte (Mexico), Vacas Heladas (Chile), Pisqahuanca, Trapiche, Hualgayoc,Surichata and El Faique, Terciopelo, Chaje and Surichata.Faique. Our “brownfield” investments were mainly focused onin the following exploration projects in 2011:Orcopampa, Poracota, Uchucchacua, Antapite, Mallay, Yumpag, Huamani Huayta, TambomayoRecuperada and Parihuanas.Julcani areas. We financed our 20112012 exploration program with internal funds.
In 2012,2013, we intend to invest approximately US$30.6100 to US$120 million in the Mallay, Tambomayo, Huamanihuayta, San Francisco Parihuanas, Pucay, Chanca and Yumpagbrownfieldbrownfield exploration projects. In 2012,2013, we expect to invest approximately US$22.670 to US$80 million in greenfield exploration projects, mainly in the following greenfield exploration projects: Tambomayo, Trapiche, San Gregorio, Hualgayoc, Colquemayo and El Faique, Vacas Heladas, Ccaccapaqui-Bx Andrea, Surichata and Costa Sur. We also expect to invest approximately US$10.8 million in Trapiche and Hualgayoc projects during 2012.among others.
We expect that we will meet our working capital, capital expenditure and exploration expense requirements for the next several years from internally generated funds, cash on hand and dividends received from our investments in non-consolidated mining operations, including Yanacocha. Additional financing, if necessary for the construction of any project, is expected to be obtained from borrowings under bank loans and the issuance of debt securities. There can be no assurance, however, that sufficient funding will be available to us from the internal or external sources to finance any future capital expenditure program, or that external funding will be available to us for such purpose on terms or at prices favorable to us. A very significant decline in the prices of gold and silver would be reasonably likely to affect the availability of such sources of liquidity. In addition, if we fund future capital expenditures from internal cash flow, there may be less funds available for the payment of dividends.
Recent Accounting Pronouncements
IFRS
We prepare and present the Financial Statements in accordance withIFRS as issued by the IASB. For periods up to and including the year ended December 31, 2010, we prepared our financial statements in accordance with Peruvian GAAP. Our consolidated financial statements for the year ended December 31, 2011 are the first that we have prepared in accordance with IFRS. We have applied IFRS 1 “First Time“First-time Adoption of International Financial Reporting Standard”Standards” to the opening balance as of January 1, 2010, the date of our transition to IFRS. The IFRS 1 application implies that all the standards are applied retrospectively at the transition date, including certain mandatory exceptions and voluntary exemptions defined in the standard. In addition, as a foreign private issuer in the United States, we are subject to less intensive reporting requirements and information regarding us may not be as readily disseminated into the market. See Note 3 to the Financial Statements for further details.
AsImprovements and interpretations issued as of April 30,December 31, 2012, thereinclude the following:
Effective the year 2012 –
There were no new accounting pronouncements under IFRS approved by the IASBstandards and interpretations that were applicable to us.The following IFRS and International Financial Reporting Interpretations Committee, or IFRIC, updates were issued internationallyus for 2012.
| 101 |
Effective as of December 31, 2011 and could affect us, but were not yet effective on the issuance date of the consolidated financial statements, for which reason they have not yet been implemented by us:
from January 1, 2013 -
| IAS 1, Presentation of Financial |
| IAS 27, Separate Financial Statements |
| IAS 28, Investments in |
| IFRS 9, |
| IFRS 10, |
| IFRS 11, |
| IFRS 12, |
| IFRS 13, |
| IFRIC 20, |
Our management is currently analyzingAnnual improvements to IFRS (issued in May 2012) -
| - | IAS 1, Presentation of Financial Statements, clarifies the difference between voluntary annual comparative information and the minimum required of comparative period is the previous period. |
| - | IAS 16, Property, Plant and Equipment, clarifies that major spare parts and servicing equipments that meet the definition of property, plant and equipment are not inventories. |
| - | IAS 32, Financial Instruments: Presentation, clarifies that income taxes arising from distributions to equity holders are accounted for in accordance with IAS 12. |
Such improvements are effective for annual periods beginning on or after January 1, 2013.
Although we do not believe the impact that these standards and interpretationsnew pronouncements will have a significant impact on us, we are currently evaluating their impact, if any, on our operations when such standards become internationally effective, as well as determining the implementation process and the adjustments necessary in order to be in compliance with these standards.consolidated financial statements for 2013.
C. Research and Development
Not applicable.
D. Trend Information
Other than as disclosed in this Annual Report, we are not aware of any trends, uncertainties, demands, commitments or events which are reasonably likely to have a material effect upon our net sales or revenues, income from continuing operations, profitability, liquidity or capital resources, or that would cause reported financial information to be not necessarily indicative of future operating results or financial condition.
For our exploration activities, there is no production, sales or inventory in a conventional sense. Our financial success is dependent upon the extent to which we are capable of discovering mineralization and the economic viability of exploration properties. The construction and operation of such properties may take years to complete and the resulting income, if any, cannot be determined with certainty. Further, the sales value of mineralization discovered by us is largely dependent upon factors beyond our control, including the market value at any given time of the metals produced.
E. Off-Balance Sheet Arrangements
There are no off-balance sheet arrangements that have or are reasonably likely to have a current or future effect on our financial condition, changes in financial condition, revenues or expenses, results of operations, liquidity, capital expenditures or capital resources that are material to investors.
F. Tabular Disclosure of Contractual Obligations
The following table shows our contractual obligations as of December 31, 2011:2012:
| Payments due by Period (US$ in millions) | Payments due by Period (US$ in millions) | |||||||||||||||||||||||||||||||||||||||
| Less than | 1-2 | 2-5 | More than | |||||||||||||||||||||||||||||||||||||
| Less than | 1-3 | 3-5 | More than | Total | 1 year | years | years | 5 years | ||||||||||||||||||||||||||||||||
| Total | 1 year | years | years | 5 years | ||||||||||||||||||||||||||||||||||||
| Long-Term Debt(*) | 110.5 | 1.1 | 31.3 | 31.2 | 46.9 | |||||||||||||||||||||||||||||||||||
| Long-Term Debt (principal and interest)(*) | 188.5 | 6.1 | 29.8 | 29.7 | 122.9 | |||||||||||||||||||||||||||||||||||
| Capital Lease Obligations | - | - | - | - | - | - | - | - | - | - | ||||||||||||||||||||||||||||||
| Reclamation and Remediation Liability | 81.9 | 22.8 | 19.1 | 13.6 | 26.4 | |||||||||||||||||||||||||||||||||||
| Open Purchase Orders | - | - | - | - | - | - | - | - | - | - | ||||||||||||||||||||||||||||||
| Other Long-Term Obligations | - | - | - | - | - | - | - | - | - | - | ||||||||||||||||||||||||||||||
| Total Contractual Cash Obligations | 192.4 | 23.9 | 50.4 | 44.8 | 73.3 | 188.5 | 6.1 | 29.8 | 29.7 | 122.9 | ||||||||||||||||||||||||||||||
| (*) | Long-term debt includes US$ |
As of December 31, 2011,2012, we had no other commercial commitments.
YANACOCHA
Introduction
The following discussion should be read in conjunction with the Yanacocha Financial Statements as of December 31, 20102011 and 20112012 and for the years ended December 31, 2009, 2010, 2011 and 20112012 and the related notesNotes thereto included elsewhere in this Annual Report. The Yanacocha Financial Statements are prepared and presented in accordance with U.S. GAAP and in U.S. Dollars.
A. Operating Results
Overview
Yanacocha, the largest gold producer in South America, was established in Peru in January 1992, and commenced production activities in August 1993. Yanacocha’s operations are located in the Andes mountains in Northern Peru, in the area of Cajamarca which is located approximately 900 kilometers north of Lima and north of the city of Cajamarca, at an altitude of 4,000 meters above sea level. Yanacocha is 51.35 percent owned by Newmont Mining, through its wholly-owned subsidiary Newmont Second, 43.65 percent by us through our wholly-owned subsidiary Condesa, and 5 percent by IFC.Yanacocha is managed by Newmont Peru S.R.L. See “Item 4. Information on the Company—Yanacocha—B. Business Overview—Management of Yanacocha—General Manager/Management Agreement.”
The table below highlights Yanacocha’s key financial and operating results:
Summary of Financial and Operating Performance
| Year Ended December 31, | ||||||||||||
| 2011 | 2010 | 2009 | ||||||||||
| Gold Sales (in thousands of US$) | 2,002,602 | 1,778,260 | 2,013,228 | |||||||||
| Gold sold (oz.) | 1,294,194 | 1,465,541 | 2,068,205 | |||||||||
| Average gold price received (US$/oz.) | 1,576 | 1,216 | 973 | |||||||||
| Costs applicable to sales (US$/oz.) | 581 | 448 | 325 | |||||||||
| Other expenses(in thousands of US$) | 60,192 | 69,122 | 86,469 | |||||||||
| Net income (in thousands of US$) | 642,387 | 589,894 | 727,076 | |||||||||
| Dividends paid (in thousands of US$) | - | - | 230,000 | |||||||||
| Year Ended December 31, | ||||||||||||
| 2012 | 2011 | 2010 | ||||||||||
| Gold Sales (in thousands of US$) | 2,201,815 | 2,002,602 | 1,778,260 | |||||||||
| Gold sold (oz.) | 1,335,065 | 1,294,194 | 1,465,541 | |||||||||
| Average gold price received (US$/oz.) | 1,662 | 1,576 | 1,216 | |||||||||
| Costs applicable to sales (US$/oz.) | 517 | 581 | 448 | |||||||||
| Other expenses(in thousands of US$) | 147,641 | 60,192 | 69,152 | |||||||||
| Net income (in thousands of US$) | 626,540 | 642,387 | 589,894 | |||||||||
| Dividends paid (in thousands of US$) | - | - | - | |||||||||
Gold sales.Gold sales increased by 1310 percent, or US$224199.2 million, from 20102011 to 2011,2012, due principally toan increase in the average realized price of gold. This combined with an increase was partially offset bya decrease in the number of ounces sold. Yanacocha has not engaged in gold price hedging activities, such as forward sales or option contracts, to minimize its exposure to fluctuations in the price of gold.
Costs applicable to sales.Costs applicable to sales increaseddecreased by 1411 percent from 20102011 to 2011,2012, due primarily to an increase inlower operating costs;costs and lower production taxes, partially offset by higher third-party royalties due to higher sales revenues;revenues and lower by-product metal silver and coppersilver sales credit due to lower production; partially offset by lower operating costs.Costsproduction.Costs applicable to sales include: (i) operating costs, consisting primarily of direct production costs such as mining and treatment of the ore, which are the most significant components of costs applicable to sales, (ii) employee profit sharing of 8 percent of pre-tax profits calculated in accordance with Peruvian GAAP, (iii) royalties of 3 percent of the quarterly net sale value of all gold and silver extracted from the mining concessions payable to Chaupiloma after deducting refinery and transportation costs, (iv) management fees payable to Newmont Peru, the operator of Yanacocha, (v) selling expenses, (vi) credit from by-product sales, mainly in connection with silver sales, (vii) government mining royalties in connection with the Carachugo mine, which resulted from the expiration of its 15-year stability agreement on January 1, 2010 and (viii) other costs.
| 105 |
Other expenses.Other expenses decreasedincreased by 1345 percent, or US$987.4 million, from 20102011 to 2011,2012, mainly due to a lower voluntary contribution as a result of the expiration of the agreement requiring payment of the contribution during 2011.an employee severance program in order to align Yanacocha’s organization with future business needs and increased community development and community affairs activities.
Income tax.Yanacocha’s financial and operating results were impacted by a tax expense of US$361.9 million in 2012, as compared to US$293.0 million in 2011, as compared to US$269.7 million in 2010, which reflects Yanacocha’s increased profitability and the full year impact of a new mining tax payable to the Peruvian government for extracting metallic and non-metallic resources.
Dividends.During the yearyears ended December 31, 2011 and 2012, Yanacocha did not pay dividends to its partners and did not reserve any money related to reinvestment programs.
Critical Accounting Policies
Yanacocha has furnished us with a discussion of its critical accounting policies or methods used in the preparation of its financial statements. Critical accounting policies are defined as those that are reflective of significant judgments and uncertainties and could potentially impact results under different assumptions and conditions. Note 2to the Yanacocha Financial Statements includes a summary of the significant accounting policies and methods used in the preparation of the Yanacocha Financial Statements. The following is a brief discussion of the identified critical accounting policies and the estimates and judgments made by Yanacocha.
Principles of Consolidation
The Consolidated Financial Statements include the accounts of Minera Yanacocha S.R.L. and the San José Reservoir Trust, or the Trust. In November 2008, Yanacocha funded the Trust to ensure the continuous operation of the San José Reservoir after 2018. Yanacocha transferred US$13 million to the Trust in 2008. No withdrawals are allowed until 2018 and Yanacocha is committed to a US$23 million fund as of such date. This Trust is irrevocable and is a separate legal entity. The grantor is Yanacocha, the trustee is FiduPeru S.A. and Yanacocha is the Banco de Crédito del Perúgrantor and the beneficiary is Yanacocha.beneficiary. As a result, Yanacocha consolidates the Trust in the Yanacocha Financial Statements.
Use of Estimates
The Yanacocha Financial Statements have been prepared in accordance with U.S. GAAP. The preparation of the the Yanacocha Financial Statements requires Yanacocha to make estimates and assumptions that affect the reported amounts of assets and liabilities and the related disclosure of contingent assets and liabilities at the date of the Consolidated Financial Statements and the reported amounts of revenues and expenses during the reporting period. The more significant areas requiring the use of management estimates and assumptions relate to (i) mineral reserves that are the basis for future cash flow estimates utilized in impairment calculations and unit-of-production amortization calculations; (ii) environmental, reclamation and closure obligations; (iii) estimates of recoverable gold and other minerals in stockpile and leach pad inventories; (iv) write-downs of inventory, ore on leach pads and stockpiles to net realizable value; (v) employee benefit liabilities; (vi) valuation allowances for deferred tax assets; (vii) workers’ profit participation; (viii) reserves for contingencies and litigation; and (ix) the fair value and accounting treatment of financial instruments. Yanacocha bases its estimates on historical experience and on various other assumptions that are believed to be reasonable under the circumstances. Accordingly, actual results may differ significantly from these estimates under different assumptions or conditions.
Currency
TheYanacocha Financial Statements are stated in U.S. Dollars, Yanacocha’s functional currency, as most of its transactions are traded, collected and paid in such currency. Transactions in other currencies are recorded in U.S. Dollars based on exchange rates prevailing at the time of such transactions. Monetary assets and liabilities denominated in other currencies are translated into the U.S. Dollar at exchange rates prevailing at the statement of financial position dates, and any resulting gains or losses are reflected in current earnings.
Cash and Cash Equivalents
Cash and cash equivalents consist of all cash balances and highly liquid investments with an original maturity of three months or less. Because of the short maturity of these balances, the carrying amounts approximate their fair value. Restricted cash is excluded from cash and cash equivalents and is included in other current assets or long-term assets depending on restrictions.
Investments
Management determines the appropriate classification of its investments in equity securities at the time of purchase and reevaluates such determinations at each reporting date. Yanacocha accounts for its marketable security investments as available for sale securities in accordance with FASB Accounting Standards Codification, or ASC, guidance on accounting for certain investments in debt and equity securities. Yanacocha periodically evaluates whether declines in fair values of its investments below Yanacocha’s carrying value are other-than-temporary in accordance with guidance for the meaning of other-than-temporary impairment and its application to certain investments. Yanacocha’s policy is to generally treat a decline in the investment’s quoted market value that has lasted continuously for more than six months as an other-than-temporary decline in value. Yanacocha also monitors its investments for events or changes in circumstances that have occurred that may have a significant adverse effect on the fair value of the investment and evaluates qualitative and quantitative factors regarding the severity and duration of the unrealized loss and Yanacocha’s ability to hold the investment until a forecasted recovery occurs to determine if the decline in value of an investment is other-than-temporary. Declines in fair value below Yanacocha’s carrying value deemed to be other-than-temporary are charged to earnings.
Stockpiles, Ore on Leach Pads and Inventories
As described below, costs that are incurred in or benefit the productive process are accumulated as stockpiles, ore on leach pads and inventories. Stockpiles, ore on leach pads and inventories are carried at the lower of average cost or net realizable value. Net realizable value represents the estimated future sales price of the product based on current and long-term metals prices, less the estimated costs to complete production and bring the product to sale. Write-downs of stockpiles, ore on leach pads and inventories to net realizable value are reported as a component of Costs applicable to sales. The current portion of stockpiles, ore on leach pads and inventories is determined based on the expected amounts to be processed within the next twelve months. Stockpiles, ore on leach pads and inventories not expected to be processed within the next twelve months are classified as long-term. The major classifications are as follows:
Stockpiles.Stockpiles represent ore that has been extracted from a mine and is available for further processing. Stockpiles are measured by estimating the number of tons added and removed from the stockpile, the number of contained ounces (based on assay data) and the estimated metallurgical recovery rates (based on the expected processing method). Stockpile ore tonnages are verified by periodic surveys. Costs are allocated to stockpiles based on relative values of material stockpiled and processed using current mining costs incurred up to the point of stockpiling the ore, including applicable overhead and amortization relating to mining operations, and removed at each stockpile’s average cost per recoverable unit.
Ore on Leach Pads. The recovery of gold from certain gold oxide ores is achieved through the heap leaching process. Under this method, ore is placed on leach pads where it is treated with a chemical solution, which dissolves the gold contained in the ore. The resulting gold-bearing solution is further processed in a plant where the gold is recovered. Costs are added to ore on leach pads based on current mining costs, including applicable overhead and amortization relating to mining operations. Costs are removed from ore on leach pads as ounces are recovered based on the average cost per recoverable ounce of gold on the leach pad.
The estimates of recoverable gold on the leach pads are calculated from the quantities of ore placed on the pads (measured tons added to the leach pads), the grade of ore placed on the leach pads (based on assay data) and a recovery percentage (based on ore type). In general, the leach pads recover approximately 50 percent to 95 percent of the ultimate recoverable ounces in the first year of leaching, declining each year thereafter until the leaching process is complete.
Although the quantities of recoverable gold placed on the leach pads are reconciled by comparing the grades of ore placed on the pads to the quantities of gold actually recovered (metallurgical balancing), the nature of the leaching process inherently limits the ability to precisely monitor inventory levels. As a result, the metallurgical balancing process is constantly monitored and estimates are refined based on actual results over time. Historically, Yanacocha’s operating results have not been materially impacted by variations between the estimated and actual recoverable quantities of gold on its leach pads. Variations between actual and estimated quantities resulting from changes in assumptions and estimates that do not result in write-downs to net realizable value are accounted for on a prospective basis.
In-process Inventory. In-process inventories represent materials that are currently in the process of beingconverted to a saleable product. Yanacocha’s conversion processes vary depending on the nature of the ore and the specific processing facility and include mill in-circuit and leach in-circuit. In-process material is measured based on assays of the material fed into the process and the projected recoveries of the respective plants. In-process inventories are valued at the average cost of the material fed into the process attributable to the source material coming from the mines, stockpiles and/or leach pads plus the in-process conversion costs, including applicable amortization relating to the process facilities incurred to that point in the process.
Precious Metals Inventory. Precious metals include gold doré and/or gold bullion. Precious metals thatresult from Yanacocha’s mining, processing and refining activities are valued at the average cost of the respective in-process inventories incurred prior to the refining process, plus applicable refining costs.
Concentrate Inventory. Concentrate inventory represents silver, gold and copper concentrate available for shipment.shipment. Yanacocha values concentrate inventory at the average cost, including an allocable portion of support costs and amortization. Costs are added and removed to the concentrate inventory based on tons of concentrate and are valued at the lower of average cost or net realizable value.
Materials and Supplies
Materials and supplies are valued at the lower of average cost or net realizable value. Cost includes applicable taxes and freight.
Property, Plant and Mine Development
Facilities and Equipment. Expenditures for new facilities or equipment and expenditures that extend the useful lives of existing facilities or equipment are capitalized and recorded at cost. The facilities and equipment are amortized using the straight-line method at rates sufficient to amortize such costs over the estimated productive lives, which do not exceed the related estimated mine lives, of such facilities based on proven and probable reserves.
Mine Development.Mine development costs include engineering and metallurgical studies, drilling and other related costs to delineate an ore body and the removal of overburden to initially expose an ore body, at open-pit surface mines. Costs incurred before mineralization is classified as proven and probable reserves are expensed and classified as an Exploration and Advanced projects expense. Capitalization of mine development project costs that meet the definition of an asset begins once mineralization is classified as proven and probable reserves.
Drilling and related costs are capitalized for an ore body where proven and probable reserves exist, the activities are directed at obtaining additional information on the ore body or converting non-reserve mineralization to proven and probable reserves. All other drilling and related costs are expensed as incurred. Drilling costs incurred during the production phase for operational ore control are allocated to inventory costs and then included as a component of Costs applicable to sales.
The cost of removing overburden and waste materials to access the ore body at an open-pit mine prior to the production phase is referred to as “pre-stripping costs.” Pre-stripping costs are capitalized during the development of an open-pit mine. Where multiple open pits exist at a mining complex utilizing common processing facilities, pre-stripping costs are capitalized at each pit. The removal and production of de minimis saleable materials may occur during development and are recorded as Other income, net of incremental mining and processing costs.
The production phase of an open pit mine commences when saleable minerals, beyond a de minimis amount, are produced. Stripping costs incurred during the production phase of a mine are variable production costs that are included as a component of inventory to be recognized in Costs applicable to sales in the same period as the revenue from the sale of inventory.
Yanacocha’s definition of a mine and the mine’s production phase may differ from that of other companies in the mining industry, resulting in incomparable allocations of stripping costs to deferred mine development and production costs. Other mining companies may expense pre-stripping costs associated with subsequent pits within a mining complex.
Mine development costs are amortized using the unit-of-production method based on estimated recoverable ounces in proven and probable reserves. To the extent that these costs benefit an entire ore body, they are amortized over the estimated life of the ore body. Costs incurred to access specific ore blocks or areas that only provide benefit over the life of that area are amortized over the estimated life of that specific ore block or area.
| 109 |
Mineral Interests
Mineral interests include acquired interests in production, development and exploration stage properties. The mineral interests are capitalized at their fair value at the acquisition date, either as an individual asset purchase or as part of a business combination.
The value of such assets is primarily driven by the nature and amount of mineralized material believed to be contained in such properties. Production stage mineral interests represent interests in operating properties that contain proven and probable reserves. Development stage mineral interests represent interests in properties under development that contain proven and probable reserves. Exploration stage mineral interests represent interests in properties that are believed to potentially contain mineralized material consisting of (i) mineralized material such as inferred material within pits; measured, indicated and inferred material with insufficient drill spacing to qualify as proven and probable reserves; and inferred material in close proximity to proven and probable reserves; (ii) around-mine exploration potential such as inferred material not immediately adjacent to existing reserves and mineralization, but located within the immediate mine area; (iii) other mine-related exploration potential that is not part of measured, indicated or inferred material and is comprised mainly of material outside of the immediate mine area; (iv) greenfield exploration potential that is not associated with any other production, development or exploration stage property, as described above; or (v) any acquired right to explore or extract a potential mineral deposit. Yanacocha’s mineral rights generally are enforceable regardless of whether proven and probable reserves have been established. Yanacocha has the ability and intent to renew mineral interests where the existing term is not sufficient to recover all identified and valued proven and probable reserves and/or undeveloped mineralized material.
Asset Impairment
Yanacocha reviews and evaluates its long-lived assets for impairment when events or changes in circumstances indicate that the related carrying amounts may not be recoverable. Impairment is considered to exist if the total of the assets’ estimated future cash flows on an undiscounted basis are less than the carrying amount of the assets. Impairment loss is measured and recorded based on discounted estimated future cash flows. Future cash flows are estimated based on quantities of recoverable minerals, expected gold and other commodity prices (considering current and historical prices, trends and related factors), production levels, operating costs, capital requirements and reclamation costs, all based on life-of-mine plans. Existing proven and probable reserves and value beyond proven and probable reserves, including mineralization that is not part of the measured, indicated or inferred resource base, are included when determining the fair value of mine site reporting units at acquisition and, subsequently, in determining whether the assets are impaired. The term “recoverable minerals” refers to the estimated amount of gold or other commodities that will be obtained after taking into account losses during ore processing and treatment. Estimates of recoverable minerals from such exploration stage mineral interests are risk adjusted based on management’s relative confidence in such materials. In estimating future cash flows, assets are grouped at the lowest level for which there are identifiable cash flows that are largely independent of future cash flows from other asset groups. Yanacocha’s estimates of future cash flows are based on numerous assumptions and it is possible that actual future cash flows will be significantly different than the estimates, as actual future quantities of recoverable minerals, gold and other commodity prices, production levels and costs and capital are each subject to significant risks and uncertainties.
Revenue Recognition
Revenue is recognized, net of treatment and refining charges, from a sale when persuasive evidence of an arrangement exists, the price is determinable, the product has been delivered, the title has been transferred to the customer and collection of the sales price is reasonably assured. Revenues from silver and copper sales are credited to Costs applicable to sales as a by-product credit.
Income and Mining Taxes and Profit Sharing
Yanacocha accounts for income and mining taxes and legally required profit sharing using the liability method, recognizing certain temporary differences between the financial reporting basis of Yanacocha’s liabilities and assets and the related income tax basis for such liabilities and assets. This method generates a net deferred income tax liability and profit sharing liability or net deferred income tax asset and profit sharing asset for Yanacocha, as measured by the statutory tax and profit sharing rates in effect as enacted. Yanacocha derives its deferred income tax charge or benefit and profit sharing charge or benefit by recording the change in the net deferred income tax liability and profit sharing liability or net deferred income tax asset and profit sharing asset balance for the year, based on Peruvian income and mining tax and profit sharing rates.
Yanacocha’s deferred income tax assets include certain future tax benefits. Yanacocha records a valuation allowance against any portion of those deferred income tax assets when it believes, based on the weight of available evidence, it is more likely than not that some portion or all of the deferred income tax asset will not be realized.
Reclamation and Remediation Costs
Asset retirement obligations are recognized when incurred and recorded as liabilities at fair value. The liability is accreted over time through periodic charges to earnings. In addition, the asset retirement cost is capitalized as part of the asset’s carrying value and amortized over the life of the related asset. Reclamation costs are periodically adjusted to reflect changes in the estimated present value resulting from the passage of time and revisions to the estimates of either the timing or amount of the reclamation costs. The retirement obligation is based on when spending for an existing environmental disturbance will occur. Yanacocha reviews, on an annual basis, unless otherwise deemed necessary, the reclamation obligation at each mine site in accordance with ASC guidance for reclamation obligations.
Future remediation costs for inactive mines are accrued based on management’s best estimate at the end of each period of the costs expected to be incurred at a site. Such cost estimates include, where applicable, ongoing care, maintenance and monitoring costs. Changes in estimates at inactive mines are reflected in earnings in the period an estimate is revised.
Comprehensive Income
In addition to Net income, Comprehensive income (loss) includes all changes in equity during a period, such as cumulative unrecognized changes in fair value of marketable securities available-for-sale or other investments, except those resulting from investments by and distributions to owners.
Recently Adopted Accounting Pronouncements
Fair Value AccountingAccounting.. In January 2010,May 2011, ASC guidance forwas issued related to disclosures around fair value accounting. The updated guidance clarifies different components of fair value accounting, including the application of the highest and best use and valuation premise concepts, measuring the fair value of an instrument classified in a reporting entity’s shareholders’ equity and disclosing quantitative information about the unobservable inputs used in fair value measurements and disclosure was updated to require enhanced detailthat are categorized in Level 3 reconciliation. Adoptionof the fair value hierarchy. Yanacocha’s January 1, 2012 adoption of the updated guidance effective for Yanacocha’s fiscal year beginning January 1, 2011, had no impact on Yanacocha’s consolidated financial position, results of operations or cash flows. Refer to Notenote 6 to the Yanacocha Financial Statements for further details regarding Yanacocha’s assets and liabilities measured at fair value.
| 111 |
Comprehensive IncomeIncome.. In June 2011, ASC guidance was issued related to comprehensive income. Under the updated guidance, an entity will have the option to present the total of comprehensive income either in a single continuous statement of comprehensive income or in two separate but consecutive statements. In addition, the update requires certain disclosure requirements when reporting other comprehensive income. The update does not change the items reported in other comprehensive income or when an item of other comprehensive income must be reclassified to income. The update is effective for Yanacocha’s fiscal year beginning January 1, 2012. Yanacocha adopted the new guidance and its deferral and opted to present the total of comprehensive income in a single continuous statementtwo separate but consecutive statements effective for its fiscal year beginning January 1, 2011. The early adoption had no impact on Yanacocha’s consolidated financial position, results of operations or cash flows.
Recently Issued Accounting Pronouncements
Fair Value AccountingReporting of Amounts reclassified out of Accumulated Other Comprehensive Income..In May 2011,In February 2013, ASC guidance was issued related to disclosures around fair value accounting.items reclassified from Accumulated Other Comprehensive Income. The updated guidance clarifies different components of fair value accounting includingnew standard requires disclosure either in a single note or parenthetically on the applicationface of the highestfinancial statements as to: (i) the effect of significant amounts reclassified from each component of accumulated other comprehensive income based on its source and best use and valuation premise concepts, measuring(ii) the fair value of an instrument classified in a reporting entity’s shareholders’ equity and disclosing quantitative information aboutincome statement line items affected by the unobservable inputs used in fair value measurements that are categorized in Level 3 of the fair value hierarchy.reclassification. The update is effective for Yanacocha’s fiscal year beginning January 1, 2012.2013 with early adoption permitted. Yanacocha does not expect the updated guidance to have a significant impact on itsthe consolidated financial position, results of operations or cash flows.
Disclosures about Offsetting Assets and Liabilities.In November 2011, ASC guidance was issued related to disclosures about offsetting assets and liabilities. The new standard requires disclosures to allow investors to better compare financial statements prepared under U.S. GAAP with financial statements prepared under IFRS. The update is effective for Yanacocha’s fiscal year beginning January 1, 2013, and interim periods within those annual periods. Retrospective application is required.
In January 2013, ASC guidance was issued to clarify that the disclosure requirements are limited to derivatives, repurchase agreements, and securities lending transactions to the extent that they are (i) offset in the financial statements or (ii) subject to an enforceable master netting arrangement or similar agreement. Yanacocha does not expect the updated guidance to have an impact on the consolidated financial position, results of operations or cash flows.
Results of Operations for the Years Ended December 31, 2012 and 2011
Sales
Sales increased by 10 percent from US$2,002.6 million in 2011 to US$2,201.8 million in 2012, due primarily tohigher average realized prices combined with an increase in the number of ounces sold. Production by mine was as follows:
| Mine | 2012 | 2011 | ||||||
| (ounces) | ||||||||
| Cerro Yanacocha | 662,577 | 659,996 | ||||||
| Carachugo | 300,368 | 319,995 | ||||||
| Maqui Maqui | 5,811 | 9,906 | ||||||
| La Quinua | 377,236 | 303,226 | ||||||
| Total | 1,345,992 | 1,293,123 | ||||||
The increase in gold produced in 2012 as compared to 2011 was mainly attributable to an increase of milling activities related to higher volume of tons milled, which was 6.3 million DMT for the year ended December 31, 2012 as compared to 6.2 million DMT for the year ended December 31, 2011, and a higher gold grade and recovery rate of 3.89 grams per ton mined and 87.1%, respectively, for the year ended December 31, 2012 as compared to 2.92 and 82.3%, respectively, for the year ended December 31, 2011.
Costs applicable to sales
Costs applicable to sales decreased by 6 percent from 2011 to 2012 due primarily to lower operating costs and lower production taxes, partially offset by higher third-party royalties due to higher sales revenues andlower by-product metal silverand coppersales credit due to lower production.Costs applicable to sales per ounce of gold decreased by 11 percent, from US$581 in 2011 to US$517 in 2012, primarily due to lower direct mining cost per ounce of US$409 in 2012 as compared to US$497 in 2011, lower production taxes per ounce of US$9 in 2012 as compared to US$4 in 2011, partially offset by a lower silver credit per ounce of US$13 in 2012 as compared to US$36 in 2011.
Operating costs decreased by 11 percent from US$618.9 million in 2011 to US$549.9 million in 2012. Operating costs consist primarily of drilling, blasting, loading, hauling and milling costs, which decreased in 2012 primarily as a result of a decrease in the volume of ore mined, which was 42.6 million DST compared to 64.2 million DST for the year ended December 31, 2011.
Royalty expense was US$66.6 million in 2012 as compared to US$60.8 million in 2011. The increase in the royalty expense paid to Chaupiloma, which equals 3 percent of Yanacocha’s net sales, was directly related to the increase in Yanacocha’s sales revenues.
Workers’ profit participation increased by 2 percent, from US$79.1 million in 2011 to US$80.7 million in 2012. The increase in workers’ profit participation expense is related to the increase in Yanacocha’s sales revenues. Workers’ profit participation expense is calculated based on taxable net income and in accordance with Peruvian labor legislation. See “Item 4. Information on the Company—Yanacocha—B. Business Overview—Employees.”
Depreciation, depletion and amortization
Depreciation, depletion and amortization increased by 9 percent from US$231.5 million in 2011 to US$252.9 million in 2012. This increase was attributable principally to higher depreciation from inventory variation expenses.
Exploration expenses
Exploration costs, which include advanced projects, increased by 84 percent, from US$66.3 million in 2011 to US$121.7 million in 2012. This increase was attributable principally to increased advanced project activities related to the Conga project, an increased number of exploration works in the Yanacocha area and other regional/oxide development programs.
| 113 |
Other expenses
Other expenses increased by 180 percent, or US$70.8 million, from 2011 to 2012, mainly due to the execution of an employee severance program in order to align Yanacocha’s organization with future business needs, higher regional administration expenses and higher community development and external affairs activities.
Income tax provision
The increase in income tax provision was directly related to Yanacocha’s increase in taxable income and the full year impact of the new Peruvian mining and income taxes. The net effective tax rate was 39.0 percent in 2012 compared to 32.2 percent in 2011. The statutory rate for both years was a weighted average of 30 percent. The factors that most significantly impacted Yanacocha’s net effective tax rate were related to higher non-deductible expenses and the full year impact of the Special Mining Tax (Impuesto Especial de Minería), which applies to mines that are not party to a tax stabilization agreement and requires the payment of rates ranging from 2 percent to 8.4 percent of operating profit, as determined in accordance with Peruvian GAAP, payable on a quarterly basis, and the Special Mining Duty (Gravamen Especial a la Minería), which applies to companies that are party to tax stability agreements and is calculated as a percentage of operating profit, with marginal rates ranging from 4 percent to 13.12 percent, increasing progressively for companies with higher operating margins.
Net income
As a consequence of the foregoing, net income decreased by 2 percent, or US$15.8 million,from US$642.4 millionin 2011 to US$626.5 millionin 2012. As a percentage of sales, net income decreased from 32 percent in 2011 to 28 percent in 2012.
Results of Operations for the Years Ended December 31, 2011 and 2010
Sales
Sales increased by 13 percent from US$1,778.3 million in 2010 to US$2,002.6 million in 2011, due primarily tohigher average realized prices.This increase was partially offset bya decrease in the number of ounces sold. Production by mine was as follows:
| Mine | 2011 | 2010 | ||||||
| (ounces) | ||||||||
| Cerro Yanacocha | 659,996 | 659,080 | ||||||
| Carachugo | 319,995 | 399,268 | ||||||
| Maqui Maqui | 9,906 | 12,701 | ||||||
| La Quinua | 303,226 | 390,571 | ||||||
| Total | 1,293,123 | 1,461,620 | ||||||
The decrease in gold produced in 2011 as compared to 2010 was mainly attributable to a decrease in the volume of leach tons placed, which was 39.2 million DMT for the year ended December 31, 2011 as compared to 53.2 million DMT for the year ended December 31, 2010 and a higher waste to ore ratio, which was 1.57 for the year ended December 31, 2011 as compared to 1.38 for the year ended December 31, 2010.
Costs applicable to sales
Costs applicable to sales increased by 14 percent from 2010 to 2011 due primarily to higher operating costs,higher third-party royalties due to higher sales revenues andlower by-product metal silverand coppersales credit due to lower production, partially offset by lower operating costs.Costs applicable to sales per ounce of gold increased by 30 percent, from US$448 in 2010 to US$581 in 2011, primarily due to the effect of lower ounces sold, higher direct mining cost per ounce of US$497 in 2011 as compared to US$391 in 2010, a higher royalty expense per ounce of US$48 in 2011 as compared to US$38 in 2010 and a higher workers’ profit participation expense per ounce of US$57 in 2011 as compared to US$53 in 2010.
Operating costs decreased by 8 percent from US$669.1 million in 2010 to US$618.9 million in 2011. Operating costs consist primarily of drilling, blasting, loading, hauling and milling costs, which decreased in 2011 primarily as a result of a decrease in the volume of ore mined, which was 58.364.2 million DMTDST compared to 75.983.7 million DMTDST for the year ended December 31, 2010.
Royalty expense was US$60.8 million in 2011 as compared to US$55.8 million in 2010. The increase in the royalty expense paid to Chaupiloma, which equals 3 percent of Yanacocha’s net sales, was directly related to the increase in Yanacocha’s sales revenues.
Workers’ profit participation increased by 2 percent, from US$77.4 million in 2010 to US$79.1 million in 2011. The increase in workers’ profit participation expense is directly related to the increase in Yanacocha’s sales revenues. Workers’ profit participation expense is calculated based on taxable net income and in accordance with Peruvian labor legislation. See “Item 4. Information on the Company—Yanacocha—B. Business Overview—Employees.”
Depreciation, depletion and amortization
Depreciation, depletion and amortization increased by 44 percent from US$160.4 million in 2010 to US$231.5 million in 2011. This increase was attributable principally to higher amortization from mine development and higher amortization from asset retirement costs.
Exploration expenses
Exploration costs, which include advanced projects, increased by 92 percent, from US$34.6 million in 2010 to US$66.3 million in 2011. This increase was attributable principally to increased perforation and advanced projects related to the Conga project, an increased number of exploration works in connection with regional/oxide development programs and an increased number of advanced projects related to water treatment and information solutions.
Other expenses
Other expenses decreased by 13 percent, or US$9 million, from 2010 to 2011, mainly due to lower voluntary contribution as a result of the expiration of the agreement requiring payment of the contribution during 2011.
Income tax provision
The increase in income tax provision was directly related to Yanacocha’s increase in taxable income. The net effective tax rate was 32.2 percent in 2011 compared to 31.4 percent in 2010. The statutory rate for both years was a weighted average of 30 percent. The factors that most significantly impacted Yanacocha’s net effective tax rate were related to higher non-deductible expenses and the enactment of the Special Mining Tax (Impuesto Especial de Minería), which applies to mines that are not party to a tax stabilization agreement and requires the payment of rates ranging from 2 percent to 8.4 percent of operating profit, as determined in accordance with Peruvian GAAP, payable on a quarterly basis, and the Special Mining Duty (Gravamen Especial a la Minería), which applies to companies that are party to tax stability agreements and is calculated as a percentage of operating profit, with marginal rates ranging from 4 percent to 13.12 percent, increasing progressively for companies with higher operating margins.
Net income
As a consequence of the foregoing, net income increased by 9 percent, or US$52.5 million,from US$589.9 million in 2010 to US$642.4 millionin 2011. As a percentage of sales, net income decreased from 33 percent in 2010 to 32 percent in 2011.
Results of Operations for the Years Ended December 31, 2010 and 2009
Sales
Sales decreased by 12 percent from US$2,013.2 million in 2009 to US$1,778.3 million in 2010, due primarily to a 29 percent decrease in the volume of gold sold, as a consequence of the lower level of gold production, partially offset by a higher average realized price, which increased from US$973 per ounce in 2009 to US$1,216 per ounce in 2010. Production by mine was as follows:
| Mine | 2010 | 2009 | ||||||
| (ounces) | ||||||||
| Cerro Yanacocha | 659,080 | 1,087,028 | ||||||
| Carachugo | 399,268 | 453,374 | ||||||
| Maqui Maqui | 12,701 | 18,555 | ||||||
| La Quinua | 390,571 | 499,223 | ||||||
| Total | 1,461,620 | 2,058,180 | ||||||
The decrease in gold produced in 2010 as compared to 2009 was mainly attributable to a decrease in the volume of leach and mill tons placed, which was 59.4 million DMT for the year ended December 31, 2010 as compared to 129.3 million DMT for the year ended December 31, 2009, a higher waste to ore ratio, which was 1.38 for the year ended December 31, 2010 as compared to 0.34 for the year ended December 31, 2009, and lower placed ore grade, which was 0.64 grams per ton for the year ended December 31, 2010 as compared to 0.78 grams per ton for the year ended December 31, 2009.
Costs applicable to sales
Costs applicable to sales decreased by 2 percent from US$671.5 million in 2009 to US$655 million in 2010 due primarily to inventory variation costs, decreases in workers’ profit participation and third-party royalty costs resulting from lower sales revenues, higher silver credit sales due to higher silver sales prices, and lower selling expenses, partially offset by higher operating costs mainly related to fuel and labor costs, and increased government mining royalties in connection with the Carachugo mine, which resulted from the expiration of its 15-year stability agreement on January 1, 2010. Costs applicable to sales per ounce of gold increased by 38 percent from US$325 in 2009 to US$448 in 2010, primarily as a result of a higher operating cost per ounce of US$457 in 2010 as compared to US$297 in 2009, a higher royalty expense per ounce of US$38 in 2010 as compared to US$26 in 2009, a higher workers’ profit participation expense per ounce of US$53 in 2010 as compared to US$47 in 2009, and higher government mining royalties of US$9 per ounce in 2010 as compared to US$0 in 2009 in connection with the Carachugo mine, which resulted from the expiration of its 15-year stability agreement on January 1, 2010.
Operating costs increased by 8 percent from US$613.7 million in 2009 to US$669.1 million in 2010. Operating costs consist primarily of drilling, blasting, loading, hauling and milling costs, which increased in 2010 primarily as a result of an increase in fuel prices, from an average of US$2.53 per gallon in 2009 to US$3.00 per gallon in 2010. Additional increases in operating costs resulted from higher labor costs as a result of hiring new employees and higher bonuses paid to employees, and higher maintenance costs related to repairs of haul truck fleets due to premature failures.
Royalty expense was US$55.8 million in 2010 as compared to US$62.3 million in 2009. The decrease in the royalty expense paid to Chaupiloma, which equals 3 percent of Yanacocha’s net sales, was directly related to the decrease in Yanacocha’s sales revenues.
Workers’ profit participation decreased by 15 percent, from US$90.7 million in 2009 to US$77.4 million in 2010. The decrease in workers’ profit participation expense is directly related to the decrease in Yanacocha’s taxable net income. Workers’ profit participation expense is calculated based on taxable net income and in accordance with Peruvian labor legislation. See “Item 4. Information on the Company—Yanacocha—B. Business Overview—Employees.”
Depreciation, depletion and amortization
Depreciation, depletion and amortization decreased by 3 percent from US$166.1 million in 2009 to US$160.4 million in 2010. This decrease was attributable principally to lower amortization related to lower ore mined in 2010 as compared to 2009 and lower amortization from asset retirement costs.
Exploration expenses
Exploration costs increased by 51 percent from US$23.0 million in 2009 to US$34.6 million in 2010. This increase was attributable principally to increased perforation and advanced projects related to the Conga project, an increased number of exploration works in connection with regional/oxide development programs and an increased number of advanced projects related to water treatment and information solutions.
Other expenses
Other expenses decreased by 20 percent, or US$17.3 million, from 2009 to 2010, mainly as a result of a lower negotiated payment to the Peruvian government and lower expenses related to community development and external affairs.
Peruvian mining companies, represented by the Sociedad Nacional de Minería, Petróleo y Energía, agreed to a mining payment equivalent to 3.75 percent of net income after taxes. On December 21, 2006, the Peruvian government issued Supreme Decree No. 071-2006-EM, which regulates the conditions under which the negotiated payment will be paid by Peruvian mining companies. The payment amounts to 3.75 percent of Peruvian net income after income tax, including 2.75 percent to be paid to a local mining fund and 1 percent to be paid to a regional mining fund. This payment was payable from 2006 through 2010, if certain conditions were met.
Income tax provision
The decrease in income tax provision was directly related to Yanacocha’s decrease in taxable income. The net effective tax rate was 31.4 percent in 2010 compared to 31.5 percent in 2009. The statutory rate for both years was a weighted average of 30 percent. The factors that most significantly impacted Yanacocha’s net effective tax rate were related tohigher sales revenues from the sale of gold as a consequence of the increased average realized price of gold and due to a new mining tax payable to the Peruvian Government for extracting metallic and non-metallicminerals.
The uniform income tax rate in Peru was 27 percent of taxable income in 2003. Effective January 1, 2004, the income tax rate in Peru is 30 percent of taxable income (Yanacocha, as explained below, has a stabilized corporate tax rate of 30 percent, excluding income from the La Quinua mine, which had a tax rate of 27 percent until December 31, 2003 and 29 percent since January 1, 2004) and for financial statement purposes is calculated for Yanacocha in accordance with U.S. GAAP. Pursuant to Supreme Decree No. 027-98-EF, mining companies can obtain a tax benefit in the form of an investment credit, by effectively reinvesting non-distributed earnings into capital expansion projects that increase their productivity. This investment credit is based on 80 percent of amounts reinvested and is obtained by application to and approval by the MEM.
Yanacocha has entered into Mining Law Stabilization Agreements under the General Mining Law with the Peruvian government. A Mining Law Stabilization Agreement is a standardized agreement prepared by the MEM, the Ministry of Economy and Finance, the Central Bank and other Peruvian governmental ministries. Such agreements (i) provide stabilized corporate tax rates, (ii) grant the ability to obtain VAT credit, (iii) provide full access to foreign currency and guarantee treatment in all foreign exchange matters as is given to Peruvian nationals, (iv) protect against foreign exchange controls and (v) grant the right to freely dispose of and export mineral products. Yanacocha has entered into such agreements with regard to the following mines: Carachugo/San José, Maqui Maqui, Cerro Yanacocha and La Quinua.Pursuant to these agreements, the income tax rate in Peru is 30 percent of taxable income, excluding income from the La Quinua mine which had a tax rate of 27 percent until December 31, 2003 and 29 percent sinceJanuary 1, 2004. On January 1, 2010, the 15-year term of the Carachugo/San José mine’s tax stability agreement expired and, as a result, this mine no longer benefits from a tax stability agreement.
Net Income
As a consequence of the foregoing, net income decreased by 19 percent, or US$137.2million,from US$727.1 million in 2009 to US$589.9 millionin 2010. As a percentage of sales, net income decreased from 36 percent in 2009 to 33 percent in 2010.
B. Liquidity and Capital Resources
As of December 31, 2011,2012, Yanacocha had cash and cash equivalents of US$798.0million,618.1million, substantially all of which were held in U.S. Dollars, as compared to US$880.9million798.0million as of December 31, 2010.2011.
Cash provided by operating activities
Yanacocha’s operations generated a net cash flow of US$936.7 million in 2012, US$911.6million in 2011 and US$621.7 in 20102010. The net cash flow in 2012 was essentially the same as in 2011 as the benefit from increased sales volumes and US$981.4 millionaverage realized prices in 2009.2012 were offset in part by increased costs driven in part by higher Peruvian tax rates and employee severance costs. The increase in net cash flow provided by operating activities in 2011 was mainly due to higher sales revenues as a result of an increase in average realized prices, partially offset by a lower volume of ounces sold and higher working capital. The decrease in net cash flow provided by operating activities in 2010 was mainly due to lower sales revenues due to a decrease in the volume of gold sold, offset by higher average realized prices in 2010 and lower working capital related to higher income tax prepayments, higher accrued liabilities, and lower inventories.
Cash used in investing activities
Net cash used in investing activities was US$1.1 billion in 2012, US$992.5million in 2011 and US$296.7 in 20102010. In 2012, Yanacocha’s investing activities consisted primarily of US$498 million for engineering, construction and equipment at the Conga project, US$148.9338 million in 2009.for mine development at El Tapado Oeste, the Western Oxides and the Eastern Oxides, US$30 million for equipment components, US$25 million for water treatment plant studies and construction, US$18 million for gold mill tailings improvements, US$17 million for bio-leach studies and plant construction and US$15 million for the standardization of information technology systems. In 2011, Yanacocha’s investing activities consisted primarily of US$739 million for engineering, construction, equipment and off-site infrastructure at the Conga project, US$156.3 million for mine development at the El Tapado Oeste, the Western Oxides and the Maqui Maqui deposits, US$55 million for leach pad expansions at La Quinua (area of the Western Oxides), US$24 million for land purchases, US$14.5 million for the standardization of information technology systems across the Newmont Group and the selection of SAP as its global information technology platform, US$9.9 million for water treatment project studies, US$9.6 million for La Quinua 2C studies of the instability and failure of the pit, US$8.6 million for life extension of the haul trucks fleet and US$4.9 million for construction of a new central warehouse. In 2010, Yanacocha’s investing activities consisted primarily of US$131.9 million for the Conga project, US$23.3 million for the purchase of high altitude mining trucks, US$15.1 million for the construction of an alternate road to the coast of Peru, US$38.6 million for mine development at the El Tapado Oeste, Chaquicocha, Western Oxides and Maqui Maqui deposits, US$17.9 million for leach pad expansions at La Quinua (Stage 7B) and Carachugo (Stage 10C), US$6.9 million for the construction of a reverse osmosis plant for excess water treatment at Pampa Larga, US$6.5 million for the construction of a carbon column processing plant and US$4.7 million for the construction of a new central warehouse.
Cash used in financing activities
Net cash used in financing activities was US$0 in 2012, US$2million in 2011 and US$176.7 million in 20102010. In 2012, Yanacocha carried no debt and US$257.3 million in 2009.accordingly had no financing costs. In 2011, Yanacocha’s financing activities consisted primarily of the last four installments of lease payments for haul trucks. In 2010, Yanacocha’s financing activities consisted primarily of US$176.4 million of debt repayments, including the repayment in full of a credit facility and all amounts outstanding under a 2006 US$100 million bond issuance in the Peruvian capital markets under a US$200 million bond program approved by the Peruvian securities regulatory authority. Yanacocha used the funds generated from the issuance primarily for capital expenditures.
Exploration Costs; Capital Expenditures
Exploration
Yanacocha’s basic exploration and advanced explorationproject costs during the period from 1992 through 20112012 were financed with a combination of internally generated funds, advances from partners and loans from DEG and IFC.During 2009, 2010, 2011 and 2011,2012,Yanacocha incurred US$23.034.6 million, US$34.666.3 million and US$66.3121.7 million, respectively, in exploration costs.In 2012,2013, exploration efforts will focus on further identifying sulfide mineralization beneath existing oxide resources, higher grade deep targetscontinued development of the Chaquicocha Sulfides project, testing the extension of the Yanacocha Verde deposit, continued exploration in the Yanacocha district and copper-gold mineralization related to thatconducting an exploration program in reserve at the Conga project.Yanacocha concession block outside of the operation district.
Capital Expenditures
Yanacocha’s capital expenditures from its formation in 1992 through 20112012 were financed with a combination of internally generated funds, advances from partners, loans from DEG and IFC and proceeds from Yanacocha’s Receivables Securitization (see Note 11 to the Yanacocha Financial Statements). Yanacocha’s capital expenditures from its formation in 1992 through 20112012 have related principally to the construction of the Carachugo, Maqui Maqui, San José, Cerro Yanacocha and La Quinua mining operations, the construction of two plants at Carachugo and Yanacocha, each of which includes a leach solution processing facility and a smelter at each plant, the construction of four carbon column plants at Cerro Yanacocha and La Quinua, the acquisition of both new and used mining equipment, the construction of two dams, the construction of one agglomeration plant at La Quinua, the construction of a gold mill facility at Yanacocha, or the Yanacocha Gold Mill, and several expansions of the leach pads located at the Carachugo, Maqui Maqui, Cerro Yanacocha and La Quinua mining operations.Yanacocha’s capital expenditures from its formation through December 31, 20112012 totaled approximatelyUS$4,158.85,393 million, including capital expenditures of US$298.6 million in 2010 and US$1,094 million in 2011.2011 and US$1,148 million in 2012. In 2011,2012, Yanacocha’s principal capital expenditures included US$739498 million for engineering, construction equipment and off-site infrastructureequipment at the Conga project, US$156.3338 million for mine development at the El Tapado Oeste, the Western Oxides and Maqui Maquithe Eastern Oxides deposits, US$5530 million for leach pad expansions at La Quinua (area of Western Oxides),equipment components, US$2425 million for land purchases,water treatment plant studies and construction, US$14.518 million for gold mill tailings improvements, US$17 million for bio-leach studies and plant construction and US$15 million for the standardization of information technology systems across the Newmont Group and the selection of SAP as its global information technology platform, US$9.9 million for water treatment project studies, US$9.6 million for La Quinua 2C studies of the instability and failure of the pit, US$8.6 million for life extension of the haul trucks fleet and US$4.9 million for construction of a new central warehouse.systems.
Yanacocha anticipates that its capital expenditures for 20122013 will be approximatelyUS$1,728566 million,, of which it plans to use primarilyapproximately US$300 million in connection with the continuationconstruction of the Conga project, as well asproject. The remaining capital expenditure budget has been allocated for minesustaining investment in current operations and development at the El Tapado Oeste, Maqui Maqui and Chaquicocha deposits, leach pad expansions at La Quinua (Western Oxides and Eastern Oxides), standardization of information technology systems, continuation of the water treatment project, maintenance of the San Jose Reservoir, gold mill tailings pipelines, development of Verde bio-leach demonstration facility studies to upgrade gold recovery processes and paymentscapital for waterways and irrigation channels acquired from the Encajón-Collotán communities.upcoming operations.
C. Research and Development
Yanacocha is a mining exploration and production company and does not engage in research and development activities.
D. Trend Information
Other than as disclosed in this Annual Report, Yanacocha has informed us that it is not aware of any trends, uncertainties, demands, commitments or events which are reasonably likely to have a material effect upon Yanacocha’s net sales or revenues, income from continuing operations, profitability, liquidity or capital resources, or that would cause reported financial information to not necessarily be indicative of future operating results or financial condition.
E. Off-Balance Sheet Arrangements
Yanacocha has informed us that there are no off-balance sheet arrangements that have or are reasonably likely to have a current or future effect on Yanacocha’s financial condition, changes in financial condition, revenues or expenses, results of operations, liquidity, capital expenditures or capital resources that are material to investors.
F. Tabular Disclosure of Contractual Obligations
The following table shows Yanacocha’s contractual obligations as of December 31, 2011:2012:
| Payments due by Period (US$ in millions) | ||||||||||||||||||||||||||||||||||||||||
| Payments due by Period (US$ in millions) | ||||||||||||||||||||||||||||||||||||||||
| Less than | 1-3 | 3-5 | More than | Less than | 1-3 | 3-5 | More than | |||||||||||||||||||||||||||||||||
| Total | 1 year | years | years | 5 years | Total | 1 year | years | years | 5 years | |||||||||||||||||||||||||||||||
| Long-Term Debt | - | - | - | - | - | - | - | - | - | - | ||||||||||||||||||||||||||||||
| Capital Lease Obligations | - | - | - | - | - | - | - | - | - | - | ||||||||||||||||||||||||||||||
| Reclamation and Remediation Liability | 334.9 | 10.6 | 59.1 | 50.6 | 214.6 | 529.4 | -4.7 | 28.1 | 30.0 | 476.0 | ||||||||||||||||||||||||||||||
| Open Purchase Orders | - | - | - | - | - | - | - | - | - | - | ||||||||||||||||||||||||||||||
| Other Long-Term Obligations(*) | 17 | 17 | - | - | - | 18.0 | 18.0 | - | - | - | ||||||||||||||||||||||||||||||
| Total Contractual Cash Obligations | 351.9 | 27.6 | 59.1 | 50.6 | 214.6 | 547.4 | 13.3 | 28.1 | 30.0 | 476.0 | ||||||||||||||||||||||||||||||
| (*) | Other long-term contracts include deferred workers’ compensation obligations, power and fuel supply contract commitments and fuel and inventory obligations. |
CERRO VERDE
Introduction
The following discussion should be read in conjunction with the Cerro Verde Financial Statements as of December 31, 20102011 and 20112012 and for the years ended December 31, 2010, 2011 and 20112012 and the related notes thereto included elsewhere in this Annual Report. The Cerro Verde Financial Statements are prepared and presented in accordance with IFRS as issued by the IASB. Cerro Verde adopted IFRS effective January 1, 2010. The Cerro Verde Financial Statements for the year ended December 31, 2011 arewere the first that Cerro Verde has prepared in accordance with IFRS. We have applied IFRS 1 “First Time“First-time Adoption of International Financial Reporting Standard”Standards” to the opening balance as of January 1, 2010, Cerro Verde’s transition date to IFRS. The IFRS 1 application implies that all the standards are applied retrospectively at the transition date, including certain mandatory exceptions and voluntary exemptions defined in the standard. See Note 23 to the Cerro Verde Financial Statements for further details and a description of the exceptions and exemptions applicable to first-time adopters.
A. Operating Results
Overview
We hold a 19.3519.58 percent interest in Cerro Verde, which operates an open-pit copper and molybdenum mining complex located 20 miles southwest of Arequipa, Peru. The site is accessible by paved highway. The Cerro Verde mine has been in operation since 1976, and was previously owned by the Peruvian government prior to its privatization in 1993. Freeport-McMoRan Copper & Gold Inc. holds a majority interest in Cerro Verde.
The Cerro Verde mine is a porphyry copper deposit that has leachable oxide and secondary sulfide mineralization, and millable primary sulfide mineralization. The predominant oxide copper minerals are brochantite, chrysocolla, malachite and copper “pitch.” Chalcocite and covellite are the most important secondary copper sulfide minerals. Chalcopyrite and molybdenite are the dominant primary sulfides.
Cerro Verde’s current operations consist of an open-pit copper mine, a 120,000 metric ton-per-day concentrator and leaching facilities. Leach-copper production is derived from a 39,000 metric ton-per-day crushed leach facility and a leach system. This leaching operation has a capacity of approximately 200 million pounds of copper per year.
Cerro Verde has sufficient equipment to move an average of 308,000 metric tons of material per day using a fleet of haul trucks. Copper cathodes and concentrate production are transported approximately 70 miles by truck and rail to the Pacific Port of Matarani for shipment to international markets.
Cerro Verde receives electrical power under long-term contracts with electric utility companies. Water for Cerro Verde’s processing operations comes from renewable sources through a series of storage reservoirs, which Cerro Verde believes will be sufficient to support its currently planned operations.
Presented in the table below are certain summary financial and operating data regarding Cerro Verde for the years ended December 31, 2010, 2011 and 2011:2012:
| As of and for the year ended December 31, | ||||||||||||
| 2010 | 2011 | 2012 | ||||||||||
| Income statement data(1) | ||||||||||||
| Total revenues (US$ in thousands) | 2,368,988 | 2,520,050 | 2,127,023 | |||||||||
| Net income (US$ in thousands) | 1,074,393 | 1,078,399 | 772,070 | |||||||||
| Proven and Probable Reserves(2) | ||||||||||||
| Proven: | ||||||||||||
| Leachable ore reserves (metric tons in thousands) | 145,302 | 127,684 | 64,462 | |||||||||
| Millable ore reserves (metric tons in thousands) | 903,950 | 888,371 | 995,134 | |||||||||
| Probable: | ||||||||||||
| Leachable ore reserves (metric tons in thousands) | 97,911 | 96,857 | �� | 137,691 | ||||||||
| Millable ore reserves (metric tons in thousands) | 2,424,368 | 2,864,299 | 2,997,250 | |||||||||
| Average copper grade of leachable ore reserves (%) | 0.41 | 0.40 | 0.34 | |||||||||
| Average copper grade of millable ore reserves (%) | 0.40 | 0.39 | 0.38 | |||||||||
| Production(3) | ||||||||||||
| Cathodes (in thousands of recoverable pounds) | 183,426 | 166,017 | 118,703 | |||||||||
| Concentrates (in thousands of recoverable pounds) | 483,937 | 481,217 | 445,771 | |||||||||
| Average realized price of copper sold (US$ per pound payable) | 3.42 | 4.00 | 3.61 | |||||||||
| As of and for the year ended December 31, | ||||||||
| 2010 | 2011 | |||||||
| Income statement data(1) | ||||||||
| Total revenues (US$ in thousands) | 2,368,988 | 2,520,050 | ||||||
| Net income (US$ in thousands) | 1,074,393 | 1,078,399 | ||||||
Proven and Probable Reserves(2) | ||||||||
| Proven: | ||||||||
| Leachable ore reserves (metric tons in thousands) | 145,302 | 127,684 | ||||||
| Millable ore reserves (metric tons in thousands) | 903,950 | 888,371 | ||||||
| Probable: | ||||||||
| Leachable ore reserves (metric tons in thousands) | 97,911 | 96,857 | ||||||
| Millable ore reserves (metric tons in thousands) | 2,424,368 | 2,864,299 | ||||||
| Average copper grade of leachable ore reserves (%) | 0.41 | 0.40 | ||||||
| Average copper grade of millable ore reserves (%) | 0.40 | 0.39 | ||||||
Production(3) | ||||||||
| Cathodes (in thousands of recoverable pounds) | 183,426 | 166,017 | ||||||
| Concentrates (in thousands of recoverable pounds) | 483,937 | 481,217 | ||||||
| Average realized price of copper sold (US$ per pound payable) | 3.62 | 3.84 | ||||||
| (1) | Derived from Cerro Verde’s financial statements filed with theSuperintendencia del Mercado de Valores, or the SMV. See the Cerro Verde Financial Statements, including the notes thereto, appearing elsewhere in this Annual Report. |
| (2) | Reserve calculations are derived from the audited financial statements filed by Cerro Verde with the SMV. Cerro Verde used US$2.00 per pound of copper to determine copper reserves as of December 31, |
| (3) | Derived from Cerro Verde’s financial statements filed with the SMV. See the Cerro Verde Financial Statements, including the notes thereto, appearing elsewhere in this Annual Report. |
Cerro Verde Mining Royalties
SUNAT, the Peruvian national tax authority, has assessed mining royalties on materials processed by the Cerro Verde concentrator that commenced operations in late 2006. These assessments cover the period from October 2006 to December 2007 and the years 2008 and 2009. SUNAT has issued rulings denying Cerro Verde’s protest of the assessments. Cerro Verde has appealed these decisions and currently has threethese cases are pending before the Peruvian Tax Tribunal. Cerro Verde is challenging these royalties because it believes its stability agreement provides an exemption for all minerals extracted from its mining concession, irrespective of the method used for processing those minerals. Although Cerro Verde believes its interpretation of the stability agreement is correct, if Cerro Verde is ultimately found responsible for these assessments, it will also be liable for interest, which accrues at rates that range from approximately 7 to 18 percent based on the year accrued and the currency in which the amounts would be payable. AtAs of December 31, 2011,2012, the aggregate amount of the assessments, including interest and penalties, totaled US$190218 million. SUNAT may continue to assess mining royalties annually until this matter is resolved by the Peruvian Tax Tribunal.
Critical Accounting Policies
Cerro Verde has furnished us with a discussion of its critical accounting policies and methods used in the preparation of its financial statements. Critical accounting policies are defined as those that are reflective of significant judgments and uncertainties and could potentially impact results under different assumptions and conditions. Note 2to the Cerro Verde Financial Statements includes a summary of the significant accounting policies and methods used in the preparation of the Cerro Verde Financial Statements. The following is a brief discussion of the identified critical accounting policies and the estimates and judgments made by Cerro Verde.
Estimates of Ore Reserves and Resources and Depreciation, Depletion and Amortization
Ore reserves are estimates of the ore quantity that can be economically and legally extracted from the mine properties. Cerro Verde estimates its ore reserves based on information compiled by individuals qualified in reference to geological data about the size, depth and form of the ore body, which requires complex judgments in order to interpret the data.
The estimation of recoverable reserves is based on factors such as estimated exchange rates, commodity prices, future requirements of capital and production costs, together with geological hypotheses and judgments made when estimating the size and quality of ore. Revisions in reserve or resource estimates may have an impact on the value of mining properties, property, plant and equipment, provisions for cost of mine closure, recognition of assets for deferred taxes and depreciation and amortization of assets.
Units of Production (“UOP”) Depreciation
Estimates of recoverable reserves are used in determining the depreciation and amortization of mine assets. This results in a depreciation/amortization charge proportional to the depletion of the anticipated remaining life of mine production. Each item’s life, which is assessed annually, takes into account its physical life limitations and the present assessments of economically recoverable reserves. These calculations require the use of estimates and assumptions, including the amount of recoverable reserves that may be recovered.
Inventories
Net realizable value tests are performed at least annually and represent the estimated future sales price of the product based on prevailing spot metals prices, less estimated costs to complete production and bring the inventory to sale. Additionally, in calculating the net realizable value of Cerro Verde’s long-term stockpiles, management also considers the time value of money.
Mill and leach stockpiles generally contain lower grade ores that have been extracted from the ore body and are available for copper recovery. For mill stockpiles, recovery is through milling and concentrating. For leach stockpiles, recovery is through exposure to acidic solutions that dissolve copper and deliver it in solution form to extraction processing facilities.
Because it is generally impracticable to determine copper contained in mill and leach stockpiles by physical count, reasonable estimation methods are employed. The quantity of material delivered to mill and leach stockpiles is based on surveyed volumes of mined material and daily production records. Sampling and assaying of blasthole cuttings determine the estimated copper grades of material delivered to mill and leach stockpiles.
Expected copper recovery rates for mill stockpiles are determined by metallurgical sampling. The recoverable copper in mill stockpiles, once entered into the production process, can be produced into copper concentrate almost immediately.
Estimated copper recovery rates for leach stockpiles are determined using small-scale laboratory tests, historical trends and other factors. Ultimate recovery of copper contained in leach stockpiles can vary significantly depending on several variables, including the type of copper recovery, mineralogy and particle size of the rock. Processes and recovery rates are monitored continuously, and recovery rates are adjusted periodically as additional information becomes available and as related technology changes.
Mine Closure Provision
Cerro Verde assesses its mine closure provision annually. It is necessary to make estimates and assumptions in determining this provision, including cost estimates of activities that are necessary for the rehabilitation of the site, technological and regulatory changes, and interest rates and inflation rates. As discussed in Note 2.3(h) to the Cerro Verde Financial Statements, estimated changes in the fair value of the mine closure provision or the useful life of the related assets are recognized as an increase or decrease in the book value of the provision and related asset retirement cost (ARC) in accordance with IAS 16, “Property, Plant and Equipment.” If any change in the estimate results in an increase to the mine closure provision and related ARC, Cerro Verde will consider whether or not this is an indicator of impairment of the assets and apply impairment tests in accordance with IAS 36, “Impairments of Assets.”
Deferred Taxes
Deferred taxes are presented using the liability method for differences between the tax bases of assets and liabilities and their book values for financial reporting purposes. Deferred tax liabilities are recognized for all taxable differences. Deferred tax assets are recorded for all deductible differences when there is a probability that there could be taxable earnings against which the deductible difference could be applied.
The book value of deferred tax assets is reviewed at the end of each period and reduced to an amount that is more likely than not to be realized against taxable earnings. Deferred tax assets that are not recognized are reassessed at each period and are recognized when it is more likely than not that future taxable earnings will allow for the deferred tax asset to be recovered.
Deferred tax assets and liabilities are measured at tax rates that are expected to be applicable during the year in which the assets are realized or the liabilities are liquidated, based on the tax rates (and tax laws) that have been enacted at the end of such period. Deferred tax assets and liabilities are offset if there is a legally enforceable right to offset tax assets against tax liabilities and the deferred tax is related to the same entity and the same tax authority.
Impairment of Long-lived Assets
Cerro Verde has determined that its operation consists of one cash generating unit, which is the operation as a whole. Therefore, the Cerro Verde operation is evaluated annually in order to determine if there are any impairment indicators. If any such indication exists, Cerro Verde makes an estimate of the recoverable amount, which is the greater of the fair value less costs to sell and the value in use. These assessments require the use of estimates and assumptions, such as long-term commodity prices, discount rates, operating costs and others.
Fair value is defined as the amount that would be obtained from the sale of the asset in an arm’s-length transaction between willing and knowledgeable parties. The fair value of assets is generally determined as the current value of future cash flows derived from the continuous use of the asset, which includes estimates, such as the cost of future expansion plans and eventual disposal, while applying assumptions that an independent market participant may take into account. The cash flows are discounted by applying a discount rate that reflects the current market, the time value of money and risks specific to the asset. See Note 2.3(g) to the Cerro Verde Financial Statements for further discussion.
Contingencies
By their nature, contingencies will only be resolved when one or more future events do or do not occur. Determining contingencies inherently involves the exercise of judgment and calculation of the estimated results of future events.
Results of Operations for the Years Ended December 31, 2012 and 2011
Net sales. Net sales, including mark-to-market adjustments for pounds of copper pending settlement, decreasedby 16 percent, from US$2,520.1 million in 2011 to US$2,127.0 million in 2012, principally due to a decrease in average realized copper price during 2012 and lower volume of copper sold. The following table reflects the average realized price and volume sold of copper (both cathode and concentrate) during the years ended December 31, 2011 and 2012:
| Year ended December 31, | ||||||||||||
| 2011 | 2012 | Variation | ||||||||||
| Average price | ||||||||||||
| Copper (US$/MT) | US$ | 8,584 | US$ | 7,965 | (7 | )% | ||||||
| Volume sold | ||||||||||||
| Copper (MT) | 293,581 | 267,040 | (9 | )% | ||||||||
Average realized copper prices per metric ton decreased from US$8,584 in 2011 to US$7,965 in 2012. The volume of copper solddecreased from 293,581 metric tons in 2011 to 267,040 metric tons in 2012, mainly due to a decrease in the volume of copper cathodes sold. The combined effect of these changes resulted in a US$393.0 million decrease in income from sales of copper in 2012 compared to 2011.
Total costs of sales. Total costs of sales decreased by 3 percent, from US$824.7 million in 2011 to US$801.6 million in 2012, due mainly to the net effect of the following:
(a) Material and supplies consumption costsincreased by 15 percent, from US$315.5 million in 2011 to US$362.3 million in 2012, mainly due to the increase in price and quantity of fuel consumption used for the process of waste removal;
(b) Labor costs, including workers’ profit sharing, decreasedby 25 percent, from US$256.2 million in 2011 to US$191.9million in 2012, due mainly to lower workers’ profit sharing to be paid to employees calculated in 2012 as lower income tax basis was obtained;
(c)The variation of in process inventories decreased from US$19.1 million in 2011 to US$48.1 million in 2012 as a result of the current mining plan of processing high grade concentrates first and then low grade concentrates;
(d) Depreciation and amortization costs increased by 14 percent, from US$84.1 million in 2011 to US$95.9 million in 2012, due mainly to an increase in depreciation charges as the level of fixed assets increased;
(e)Repair and maintenance services increased by 19 percent, from US$74.2 million in 2011 to US$88.5 million in 2012; and
(f) Energy costsincreased by 6percent, from US$69.3 million in 2011 to US$73.1 million in 2012, mainly due to an increase in the unit cost per kilowatt during 2012.
Total operating expenses. Operating expensesdecreased by 21 percent, from US$136.1 million in 2011 to US$108.2 million in 2012, due mainly to changes in the following components:
(a) Selling expenses decreased by 6 percent, from US$83.6 million in 2011 to US$78.7 million in 2012, due mainly to lower copper sales during 2012;and
(b) Excess of workers’ profit sharing expensedecreased from US$21.9 million in 2011 to US$0 million in 2012, due to lower profit and taxable income during 2012.
Operating income.As a result of the foregoing, operating income decreased by 22percent, from US$1,559.3 million in 2011 to US$1,217.3 million in 2012.
Income tax. Income tax expense, including current and deferred expense, decreased by 8percent, from an expense of US$483.7 million in 2011 to an expense of US$443.3 million in 2012. Net current income tax expense decreased due to lower taxable income, partially offset by (i) higher deferred taxes mainly related to the deduction of costs for construction of the water treatment plant, mark-to-market adjustments and an increase of the effective tax rate from 30% to 32% beginning in 2014 pursuant to the New Tax Stability Agreement executed in July 2012 and (ii) higher mining taxes expense due to new taxes in force since the fourth quarter of 2011.
Net income. As a result of the foregoing, net income decreased by 28 percent, from US$1,078.4 million in 2011 to US$772.0 million in 2012. As a percentage of net sales, net income was 36 percent in 2012, compared with 43 percent in 2011.
Results of Operations for the Years Ended December 31, 2011 and 2010
Net sales. Net sales, including mark-to-market adjustments for pounds of copper pending settlement,increasedby 6 percent, from US$2,369.0 million in 2010 to US$2,520.1 million in 2011, principallymainly due to an increase in average realized copper price during 2011. The following table reflects the average realized price and volume sold of copper (both cathode and concentrate) during the years ended December 31, 2010 and 2011:
| Year ended December 31, | Year ended December 31, | |||||||||||||||||||||||
| 2010 | 2011 | Variation | 2010 | 2011 | Variation | |||||||||||||||||||
| Average price | ||||||||||||||||||||||||
| Copper (US$/MT) | US$7,981 | US$8,584 | 8 | % | US$7,981 | US$8,584 | 11 | % | ||||||||||||||||
| Volume sold | ||||||||||||||||||||||||
| Copper (MT) | 296,821 | 293,581 | (1 | )% | 296,821 | 293,581 | (1 | )% | ||||||||||||||||
Average realized copper prices per metric tonincreased from US$7,981 in 2010 to US$8,584 in 2011. The volume of copper solddecreased from 296,821 metric tons in 2010 to 293,581 metric tons in 2011, mainly due to a decrease in the volume of copper cathodes sold, partially offset by higher volumes of copper concentrates sold. The combined effect of these changes resulted in a US$151.1 millionincrease in income from sales of copper in 2011 compared to 2010.
Total costs of sales. Total costs of salesincreased by 28 percent, from US$646.0 million in 2010 to US$824.7 million in 2011, due to the following:
(a) Material and supplies consumption costsincreased by 14 percent, from US$276.3 million in 2010 to US$315.5 million in 2011, principallymainly related to increased utilization of materials and operating supplies, primarily in the concentrator plant;
(b) Depreciation and amortization costsdecreased by 4 percent, from US$87.7 million in 2010 to US$84.1 million in 2011, due principallymainly to a decrease in depreciation charges;
(c) Energy costsincreased by 31percent, from US$53.0 million in 2010 to US$69.3 million in 2011, mainly due to increases in energy consumption during the milling process and in the unit cost per kilowatt negotiated with the electricity supplier during 2011; and
(d) Labor costs, including workers’ profit sharing,increasedby 54 percent, from US$166.5 million in 2010 to US$256.2million in 2011, due mainly to signing bonuses paid to employees pursuant to the new collective bargaining agreement entered into with union employees and higher workers’ profit sharing to be paid to employees calculated in 2011.
Total operating expenses. Operating expensesdecreased by 19 percent, from US$167.2 million in 2010 to US$136.1 million in 2011, due to changes in the following components:
(a) Selling expensesincreased by 9 percent, from US$76.6 million in 2010 to US$83.6 million in 2011, due mainly to an increase in freight expenses relating to the transport of copper concentrates;
(b) Other operating expensesincreased by 57 percent, from US$10.7 million in 2010 to US$16.9 million in 2011, principally due toan increase in costs incurred in connection with pre-feasibility studies for the expansion of mining operations;
(c) Voluntary contribution expensedecreased from US$41.1 million in 2010 to US$0.0 in 2011. The agreement mandating payment of the voluntary contribution expired as of December 31, 2010 as a result of Supreme Decree 071-2006 ME, and, as a result, Cerro Verde did not recognize any voluntary contribution expense for 2011; and
(d) Excess of workers’ profit sharing expensedecreased by 36 percent, from US$34.4 million in 2010 to US$21.9 million in 2011, due to lower taxable income.
Operating income.As a result of the foregoing, operating incomeincreased by 0.22percent, from US$1,555.8 million in 2010 to US$1,559.3 million in 2011.
Income tax. Income tax expense, including current and deferred expense,increased by 0.1percent, from an expense of US$483.3 million in 2010 to an expense of US$483.7 million in 2011. Net current income tax expenseincreased due to higher taxable income, partially offset by lower deferred taxes mainly related to mark-to-market adjustments.
Net income. As a result of the foregoing, net incomeincreased by0.4 percent, from US$1,074.4 million in 2010 to US$1,078.4 million in 2011. As a percentage of net sales, net income was 43 percent in 2011, compared with 45 percent in 2010.
B. Liquidity and Capital Resources
As of December 31, 2011,2012, Cerro Verde had cash and cash equivalents of US$1,383.61,427.5 million, compared to US$388.11,383.6 million at December 31, 2010.2011.
Cash provided by operating activities for the years ended December 31, 2012 and 2011. Net cash and cash equivalents provided by operating activities were US$644.7 million in 2012 and US$1,190.7 million in 2011. The decrease in net cash flow provided by operating activities in 2012 compared with 2011 was mainly attributable to the following factors: (i) decrease in proceeds from sales from US$2,865 million in 2011 to US$1,961 million in 2012; (ii) decrease in payments to suppliers and salaries from US$1,057 million in 2011 to US$805 million in 2012 and (iii) decrease in payment of income tax from US$622 million in 2011 to US$413 million in 2012.
Cash provided by operating activities for the years ended December 31, 2011 and 2010. Net cash and cash equivalents provided by operating activities were US$1,190.7 million in 2011 and US$1,256.9 million in 2010. The decrease in net cash flow provided by operating activities in 2011 compared with 2010 was mainly attributable to the following factors: (i) increased proceeds from sales, from US$2,301 million in 2010 to US$2,865.5 million in 2011 and (ii) an increase in value-added tax recovered, from US$56.3 million in 2010 to US$61.5 million in 2011; partially offset by (i) increased payments to suppliers and of salaries, from US$505 million in 2010 to US$708.5 million in 2011; (ii) increased payments to contractors, from US$238 million in 2010 to US$316.4 million in 2011; (iii) increased payments of income tax, from US$327.1 million in 2010 to US$626.9 million in 2011; and (iv) an increase in other operating expenses, from US$52.4 million in 2010 to US$106.8 million in 2011.
Cash used in investing activities for the years ended December 31, 2012 and 2011. Net cash used in investing activities increased from US$195.2 million in 2011 to US$600.8 million in 2012, mainly due to the expansion of production at Cerro Verde.
Cash used in investing activities for the years ended December 31, 2011 and 2010. Net cash used in investing activities increased from US$122.2 million in 2010 to US$195.2 million in 2011, mainly due to an increase in the purchase of property, plant and equipment during 2011.
Cash used in financing activities for the years ended December 31, 2012 and 2011.Net cash and cash equivalents used in financing activities was US$0 in 2011 and 2012.
Cash used in financing activities for the years ended December 31, 2011 and 2010. Net cash and cash equivalents used in financing activities decreased from US$950.0 in 2010 to US$0 million in 2011.Thedecrease in net cash flow used in financing activities in 2011 compared with 2010 was mainly attributable to the non-payment of dividends during 2011.2011.
Long-term Debt
As of December 31, 2011,2012, Cerro Verde had no debt outstanding.
C. Research and Development
Not applicable.
D. Trend Information
Expansion of operations
During 2010, Cerro Verde completed its concentrator plant expansion to increase the treatment of copper concentrate from 108,000 to 120,000 metric tons per day. During the second half of 2011, Cerro Verde completed the feasibility study for a major expansion of its concentrator and leaching facilities. The approximately US$4.0 billion project will expand the processing capacity from 120,000 metric tons per day of ore to 360,000 metric tons per day, targeting incremental annual production of approximately 600 million pounds of copper and 15 million pounds of molybdenum beginning in 2016. In December 2011, Cerro Verde submitted the EIS to the Peruvian authorities for review and approval.
approval in December 2011 and received approval from the MEM in December 2012. In 2012, Cerro Verde continued with the execution of its unit of production expansion by undertaking detailed engineering studies and procuring long-lead items. Cerro Verde expects to begin the construction phase of this project in 2013.
Other than as disclosed in this Annual Report, Cerro Verde has informed us that it is not aware of any trends, uncertainties, demands, commitments or events which are reasonably likely to have a material effect upon Cerro Verde’s net sales or revenues, income from continuing operations, profitability, liquidity or capital resources, or that would cause reported financial information to not necessarily be indicative of future operating results or financial condition.
E. Off-Balance Sheet Arrangements
Cerro Verde has informed us that there are no off-balance sheet arrangements that have or are reasonably likely to have a current or future effect on Cerro Verde’s financial condition, changes in financial condition, revenues or expenses, results of operations, liquidity, capital expenditures or capital resources that are material to investors.
F. Tabular Disclosure of Contractual Obligations
The following table shows Cerro Verde’s contractual obligations as of December 31, 2011:2012:
| Payments due by Period (US$ in millions) | ||||||||||||||||||||
| Less than | 1-3 | 3-5 | More than | |||||||||||||||||
Total | 1 year | years | years | 5 years | ||||||||||||||||
| Provision for Remediation and Mine Closure | 7 | - | - | - | 7 | |||||||||||||||
| Other Long-Term Contractual Obligations | 5 | 4 | 1 | - | - | |||||||||||||||
| Total Contractual Cash Obligations | 12 | 4 | 1 | - | 7 | |||||||||||||||
| Payments due by Period (US$ in millions) | ||||||||||||||||||||
| Less than | 1-3 | 3-5 | More than | |||||||||||||||||
| Total | 1 year | years | years | 5 years | ||||||||||||||||
| Provision for Remediation and Mine Closure | 80 | - | - | - | 80 | |||||||||||||||
| Other Long-Term Contractual Obligations | 176 | 175 | 1 | - | - | |||||||||||||||
| Total Contractual Cash Obligations | 256 | 175 | 1 | - | 80 | |||||||||||||||
| ITEM 6. | Directors, Senior Management and Employees |
A. Board of Directors and Senior Management
Our Board of Directors is responsible for policy decisions and our overall direction and other corporate matters in accordance with our By-laws and the Peruvian Companies Law. Our executive officers oversee our business and are responsible for the execution of the policy decisions of the Board of Directors. The Board of Directors, which must be comprised of seven members, is elected at the annual obligatory meeting of shareholders, or the Annual Obligatory Meeting, for a three-year term. The last election took place in March 2011, and the next election is scheduled for March 2013.2014. See “Item 10. Additional Information—B. Memorandum and Articles of Association.”
Our current directors and executive officers are as follows:
| Name | Age | Position | Date First Appointed | Current Term Ends | Age | Position | Date First Appointed | Current Term Ends | ||||||||
| Directors | ||||||||||||||||
| Roque Benavides | 56 | Chairman of the Board | 1980 | March 2013 | 58 | Chairman of the Board | 1980 | March 2014 | ||||||||
| Timothy Snider | 61 | Director | 2011 | March 2013 | 63 | Director | 2011 | March 2014 | ||||||||
| Luis Coleridge | 74 | Director | 2000 | March 2013 | ||||||||||||
| Jose Miguel Morales(1) | 67 | Director | 2012 | March 2014 | ||||||||||||
| Aubrey Laurence Paverd | 72 | Director | 2002 | March 2013 | 74 | Director | 2002 | March 2014 | ||||||||
| Felipe Ortiz-de-Zevallos | 63 | Director | 2003 | March 2013 | 65 | Director | 2003 | March 2014 | ||||||||
| Carlos del Solar | 70 | Director | 2011 | March 2013 | 72 | Director | 2011 | March 2014 | ||||||||
| Germán Suárez | 69 | Director | 2005 | March 2013 | 71 | Director | 2005 | March 2014 | ||||||||
| Executive Officers | ||||||||||||||||
| Roque Benavides(1) | 56 | President and Chief Executive Officer | 2001 | 58 | President and Chief Executive Officer | 2001 | ||||||||||
| Carlos E. Gálvez | 58 | Vice President and Chief Financial Officer | 2001 | 60 | Vice President and Chief Financial Officer | 2001 | ||||||||||
| Raúl Benavides(1) | 55 | Business Development Vice President | 1997 | 57 | Business Development Vice President | 1997 | ||||||||||
| Alejandro Hermoza | 49 | Vice President Community Relations | 2008 | 51 | Vice President Community Relations | 2008 | ||||||||||
| Francois Muths | 59 | Operations Vice President | 2007 | 61 | Operations Vice President | 2007 | ||||||||||
| César E. Vidal | 56 | Explorations Vice President | 1996 | 58 | Explorations Vice President | 1996 | ||||||||||
| José Miguel Morales(1) | 65 | General Counsel | 1970 | |||||||||||||
| Gulnara la Rosa | 48 | General Counsel | 2012 | |||||||||||||
| Leandro Garcia | 44 | General Comptroller and Compliance Officer | 2011 | |||||||||||||
| (1) | Roque Benavides is the brother of Raúl Benavides, and José Miguel Morales is the brother-in-law of Roque Benavides and Raúl Benavides. |
Set forth below is biographical information concerning members of our management:
Roque Benavides, Chairman of the Board, President and Chief Executive Officerand member of the Nominating Committee. Mr. Benavides has been a director since July 2004 and was our Chief Financial Officer from 1985 to February 2001, when he was appointed President and Chief Executive Officer. Prior to that time, he served as Assistant to our Chairman of the Board from 1980 to 1985 and as a Project Engineer from 1977 to 1979. Mr. Benavides also has been an alternate member of the Executive Committee of Yanacocha since 1992. In addition, he is an alternate board member of Cerro Verde and was the General Manager of Recuperada S.A., formerly one of our majority-owned subsidiaries that has since merged into us, from 1981 to 1996. He currently is serving as an executive officer and as a director of several of our related companies. He also has served as a director of theSociedad Nacional de Minería, Petróleo y Energía (National Association of Minerals, Petroleum and Energy) since 1988, serving as Chairman of the Board from 1993 to 1995. Mr. Benavides served as chairman of theConfederación Nacional de Instituciones Empresariales Privadas(National Confederation of Private Companies, or CONFIEP) from 1999 to March 2001. In 2001, Mr. Benavides was appointed Vice Chairman of the World Gold Council and Vice Chairman of the Silver Institute in 2007. Mr. Benavides received a B.S. in Engineering fromPontificia Universidad Católica del Perú (Pontifical Catholic University of Peru) in Lima, Peru in 1977 and an M.B.A. from Henley, The Management College of Brunnel University in 1980, and completed the Program for Management Development at the Harvard Business School in 1985 and the Advanced Management Program at Templeton College of Oxford University in 1997. He is a board member of Banco de Crédito and Cementos Lima, both Peruvian companies.
Timothy Snider, Director and member of the Nominating/Corporate Governance Committee. Mr. Snider was appointed a director in March 2011. He serves as Chairman of Cupric Canyon Capital, LLC., a private equity company seeking investments in copper mining. In addition, he is a director of Compass Minerals International, Inc., and is Chairman of the Institute for Mineral Resources, a research organization sponsored by the University of Arizona. Mr. Snider is also a board member of the Northern Arizona University Foundation. Mr. Snider’s career in the copper business spans 41 years, the vast majority of which were with Phelps Dodge Corporation (now Freeport-McMoRan Copper and Gold). He began his career in 1970 as an underground mine laborer in the Copper Queen operation in Bisbee, Arizona, and held numerous operational, technical, and exploration positions at several of Phelps Dodge’s operations in the United States and Chile. He led Phelps Dodge in the application of hydrometallurgical processing during the 1980s and 1990s. In 1998, Mr. Snider was appointed President of Phelps Dodge Mining Company and in 2003 was promoted to President and Chief Operating Officer of Phelps Dodge Corporation. In these roles, he led the operational and technical integration of Phelps Dodge’s Cyprus-AMAX acquisition, led several greenfield and brownfield expansion projects, and helped to establish Phelps Dodge as one of the industry leaders in technology development and operational excellence. In early 2007, he assumed the role of President and Chief Operating Officer of Freeport-McMoRan Copper and Gold, Inc. upon Freeport’s acquisition of Phelps Dodge, a position he held until the end of the first quarter of 2008. Mr. Snider holds a B.S. in Geology and Chemistry from Northern Arizona University and is a graduate of the Wharton Advanced Management Program at the University of Pennsylvania.
Luis Coleridge, Director, Financial Expert, Chairman of the Audit Committee and member of the Nominating/Corporate Governance Committee. Mr.Coleridge was elected a Board Member on March 29, 2000. He is presently an independent business consultant. A retired partner of Arthur Andersen, Mr. Coleridge’s career as a public accountant spanned 33 years, in which he rose to the position of Managing Partner of Arthur Andersen’s Peruvian operations and retired in 1997. He was also professor of accounting and auditing at theUniversidad Nacional Mayor de San Marcos, or UNMSM, and other Peruvian universities and colleges. Mr. Coleridge graduated from UNMSM with a B.S. degree in 1962 and completed post-graduate studies in Economics in 1964.
Aubrey Laurence Paverd, Director and member of the Nominating/Corporate Governance Committee and Audit Committee. Dr. Paverd is currently a private consultant based in Melbourne, Australia. He has been a director since 2002. From 1994 to 2000, he held the position of Group Executive Exploration with North Ltd., a diversified mining company with gold and base metal mines in Australia, Europe and North and South America. His career with Newmont Mining Corporation spanned 21 years. He began as Chief Geologist of South Africa in 1973, rising through the positions of Chief Geologist at Tsumeb Corporation Ltd., Namibia, a subsidiary of Newmont, to assistant to the Vice President of Exploration in New York in 1979, Director of Foreign Exploration in 1981 and ultimately Vice President of Exploration when he left Newmont in 1994. Mr.Dr. Paverd was also a lecturer in geology at Rhodes University during 1972 and 1973 and worked as a field and mining geologist in Australia and Zambia during the period from 1962 to 1969. He received B.S. (Hons) and M.S. degrees from Rhodes University in 1961 and 1966, respectively, and a Ph.D. from the University of James Cook North Queensland in 1972. Mr.Dr. Paverd is currently also a director of Randgold Resources Ltd., a London-listed West African gold mining company.
José Miguel Morales, Director and member of the Nominating/Corporate Governance Committee. Mr. Morales was our General Counsel from 1973 to 2012 and was appointed a member of the Board in 2012. From 1992 to 1995, Mr. Morales served as an alternate member of the Executive Committee of Yanacocha. Mr. Morales has also served as a member of the Executive Committee of Yanacocha since 1995. Mr. Morales currently serves as a director of seven of our nineteen mining and mining-related subsidiaries or affiliates. In addition, he has served as a director of theInstituto Nacional de Derecho de Minería y Petróleo (National Institute of Mining and Petroleum Law), serving as its President from 1989 to 1990 and as a director of theSociedad de Minería y Petróleo del Perú (Mining and Petroleum Society of Peru) since 1998, serving as its vice chairman since 2000. He has been a director of the following non-mining related companies: Almaceneradel Perú S.A. from 1992, Inversiones Cosepa S.A. from 1979, Hotel Costa del Pacífico S.A. from 1994 and El Pacífico—Peruana Suiza Compañía de Seguros from 1979. Since 1973, he also has been a partner of Estudio Aurelio García Sayán Abogados, a Lima law firm. In February 2003, Mr. Morales was elected president of theSociedad Nacional de Minería, Petróleo y Energía(National Association of Minerals, Petroleum and Energy). On January 31, 2005, Mr. Morales ended his tenure as President ofSociedad Nacional de Minería, Petróleoy Energía and was elected on March 16, 2005 President ofConfederación Nacional de Instituciones Empresariales Privadas (National Confederation of Private Companies, or CONFIEP) until 2007. Mr. Morales received his law degree fromPontificia Universidad Católicadel Perú in 1968 and completed the Sloan Program at Stanford University’s Graduate School of Business in 1976.
Felipe Ortiz-de-Zevallos, Director and member of the Audit Committee, Compensation Committee and Nominating/Corporate Governance Committee. Mr. Ortiz-de-Zevallos has been a director since August 2003. He was President of the Universidad del Pacífico de Lima from 2004 to 2006 and is the founder and chairman of the Board of Grupo APOYO since 1977. Mr. Ortiz-de-Zevallos received a degree in Industrial Engineering from The National University of Engineering in 1968, received an M.S. in Administration and System Analysis from the University of Rochester in 1970 and completed the Owner/President Management program at Harvard Business School in 1996. He was the Peruvian ambassador to the United States of America from 2006 to March 2009.
Carlos del Solar, Director, member of the Audit Committee, Compensation Committee and Nominating/Corporate Governance Committee. Mr. del Solar was appointed a director in March 2011.He graduated with degrees in Geology and Geological Engineering from the National University of San Marcos, earned a Master of Science degree from Stanford University, California and completed the Advanced Executive Management Program at the University of Piura.Between 1998 and 2001, Mr. del Solar served as President and General Manager of ARCO for Brazil, Colombia, Peru, and Trinidad. In April 2001, he joined Hunt Oil in Peru as President and General Manager. From January 2005 through January 2007, he served as President of the National Society of Mining, Petroleum and Energy and as First Vice President of the Peruvian Confederation of Private Business Associations (CONFIEP) from March 2007 through March 2009. Since March 2010, Mr. del Solar has served as Second Vice President of the Peruvian Exporters Committee (COMEXPERU). He is currently a director and member of the Executive Committees of the National Society of Mining, Petroleum and Energy, of the Peruvian Confederation of Private Business Associations (CONFIEP) and of COMEXPERU. Mr. del Solar also serves as President of the Advisory Council of the Graduate School of the Peruvian University of Applied Sciences (UPC).
German Suárez, Director and memberChairman of the Audit Committee, Compensation Committee and Nominating/Corporate Governance Committee. Mr. Suárez has been a director since March 2005. Mr. Suárez is an economist who was employed by the Central Bank from 1964 to 1990. From 1979 to 1980, he worked at the International Monetary Fund, or IMF, representing Peru, and from 1981 to 1990 he was in charge of different posts at the Ministry of Economy and Finance. Mr. Suárez served as Chairman ofBanco de la Naciónfrom 1990 to 1992 and Chairman of the Central Bank of Peru from 1992 to 2001. He was a member of the board of directors at Bladex, Extebandes and Arlabank, Latin American Reserves Fund, Credicorp Ltd. and Banco de Crédito delditodel Peru. From 1993 to 2001, Mr. Suárez served as Governor of the IMF and Alternate Governor of the Inter-American Development. For the period from 2000 to 2001, Mr. Suárez was elected Chairman of the G-24 (IMF-World Bank). Mr. Suárez graduated from UNMSM with a B.S. in Economics in 1965 and received an M.A. in Economics from Columbia University in 1969.
Carlos E. Gálvez, Vice President and Chief Financial Officer. Mr. Gálvez was the Deputy Manager, Finance and Information Systems, from 1985 to February 2001, when he was appointed Vice President and Chief FinancialOfficer. He served as Deputy Manager of our Treasury from 1980 to 1985, and as Treasurer from 1978 to 1980. Mr. Gálvez has also served as director of Colquirrumi, our subsidiary, and was appointed director of Conenhua in 2000, director of El Brocal in 2002 and director of Contacto S.A. in 2005. He has served as an alternate member of the Executive Committee of Yanacocha since 2005 and an alternate board member of Cerro Verde since 2005. He also has served as director of theSociedad de Minería, Petróleo y Energía del Perú(Mining, Petroleum and Energy Society of Peru) since 2000. Prior to joining us, Mr. Gálvez served as Managerial Adjunct for Finance and Credit from 1971 to 1978 atBanco Minero del Perú (Mining Bank of Peru). He has also served as a board member of theComité de Operación Económica del Sistema Eléctrico Nacional (Committee of Economic Operation of the National Electric System). Mr. Gálvez received his B.A. in Economics from theUniversidad Nacional Federico Villarreal in 1976, his M.B.A. from theUniversidad del Pacifico de Lima in 1980 and completed the Program for Management Development, in 1997, and the Advanced Management Program, in 2005, at The Harvard Business School.
Raúl Benavides Ganoza, Vice President Business Development. Mr. Benavides has been Vice President of Business Development since 1992. He is also a member of the Executive Committee of Yanacocha and board member of Cerro Verde and several of our related companies. From 1984 to 1996 he was General Manager (CEO) of Compañía de Minas Orcopampa. Prior to that time, Mr. Benavides was Manager of Operations from 1983 to 1984 and Mine Manager from 1980 to 1983 at Colquirrumi.Since 1995, he has been a professor of mining administration atPontificia Universidad Católica del Perú. Mr. Benavides also has served as President of theInstituto de Ingenieros de Minas (Institute of Mining Engineering), was also the Founder and President of theInstituto de Seguridad Minera del Perú(Mining Safety Institute of Peru) from 1996 to 2000. Mr. Benavides received a B.S. in Mining Engineering from the University of Missouri-Rolla in 1980, an M.S. in Mineral Engineering-Management from Pennsylvania State University in 1984 and completed the Advanced Management Program at The Harvard Business School in 2001.
Alejandro Hermoza Maraví, Vice President Community Relations. A Mechanical Engineer graduated from the University of Maryland, Mr. Hermoza also holds an MSc in Engineering from the same University and an MBA from theUniversidad de Ciencia Aplicadas – UPC. He worked as Development Manager for theConfederación Nacional de Instituciones Empresariales Privadas – CONFIEP, and later joined us in 2003, where he began as Deputy Manager for Administration and Human Resources. In 2011, Mr. Hermoza completed the Advance Management Program at Harvard Business School.
Francois Muths, Vice President of Operations. Mr. Muths was appointed Vice President of Operations in February 2007. Prior to that time, Mr. Muths served as a director and general manager of Inversiones Mineras del Sur S.A., our wholly-owned subsidiary from 2005 to 2006, general manager from 1985 to 2005 and general superintendent of the Uchucchacua mine from 1981 to 1983. He received a B.S. in engineering from the National Engineering University of Peru and a M.S. in Mining Engineering from the Colorado School of Mines. In 2005, Mr. Muths completed the Program for Management Development at Harvard Business School.
César E. Vidal, Explorations Vice President.President of Exploration. Mr.Dr. Vidal has been our ExplorationsExploration Manager from 1996 to 2010 and Vice President since the beginning of 1996. Mr. Vidal also currently serves as director of El Brocal and Coimolache and as an alternate member of the Executive Committee of Yanacocha.From 1981 to 1987, he served as a geologist for BISA. Prior to joining us,Exploration from 1991 to 1995, he served as an independent economic geologist consultant to several mining companies, including us. From 1987 to 1991, he served as the chief geologist for Perubar S.A., a Peruvian zinc mining company. Mr.2011 onwards. Dr. Vidal received his B.S.B.Sc. in Geology from UNIUniversidad Nacional de Ingenieria (UNI) in 1977, a Ph.D. in Geology from the University of Liverpool, UK, in 1980 and certification as an engineering geologist in Peru from UNI in 1984. He also was a post-doctoral research fellow at theUniversität Heidelberg (the University of Heidelberg)Heidelberg, Germany, from 1985 to 1986. From 1981 to 1987, he served as a geologist for Buenaventura Ingenieros S.A. From 1987 to 1991, he served as an exploration geologist for Perubar S.A., a Peruvian zinc mining company of the Glencore Group. Prior to rejoining Buenaventura, from 1991 to 1995, he served as an independent consultant to several mining companies. In 2002, he received the “Distinguished Engineering Geologist” award given by the Colegio de Ingenieros del Perú. He completed the Advanced Management Program at Templeton College, of Oxford University in 2005.
José Miguel Morales, General Counsel. Mr. Morales has been our General Counsel since 1973. From 1992 to 1995, Mr. Morales served2005 and currently serves as an alternate member of Minera Yanacocha’s Executive Committee.
Leandro Garcia, General Comptroller and Compliance Officer. Mr. Garcia received his Bachelor in Business Administration and Bachelor in Accounting from Universidad del Pacifico and his M.B.A. from the Executive CommitteeUniversity of Yanacocha.Miami, Florida. Mr. Morales has alsoGarcia worked at Buenaventura from 1990 to 1997, where he served as a memberHead of Treasury. He performed as CFO in Sociedad Minera El Brocal until 2000. He was also Manager of BTL Drugstores until 2005 and General Manager of Inkafarma Drugstores until June 2011. He rejoined Buenaventura as General Comptroller in July 2011.
Gulnara La Rosa,General Counsel. Ms. La Rosa has worked at Buenaventura since 1990. She was the Legal Director from 2006 to June 2012 and was appointed as Legal Manager and General Counsel in July 2012. Ms. La Rosa served as Head of the Executive Committee of Yanacocha since 1995. Mr. Morales currently serves as a director of seven of our nineteen mining and mining-related subsidiaries or affiliates. In addition, he has served as a director of theInstituto Nacional de Derecho de Minería y Petróleo (National Institute of Mining and Petroleum Law), serving as its PresidentLegal Department from 19891997 to 19902006 and as a director of theSociedad de Minería y Petróleo del Perú(Mining and Petroleum Society of Peru) since 1998, serving as its vice chairman since 2000. He has been a director of the following non-mining related companies: Almacenera del Perú S.A.lawyer from 1992, Inversiones Cosepa S.A. from 1979, Hotel Costa del Pacífico S.A. from 1994 and El Pacífico—Peruana Suiza Compañía de Seguros from 1979. Since 1973, he also has been a partner of Estudio Aurelio García Sayán—Abogados, a Lima law firm. In February 2003, Mr. Morales was elected president of the Sociedad Nacional de Minería, Petróleo y Energía (National Association of Minerals, Petroleum and Energy). On January 31, 2005, Mr. Morales ended his tenure as President ofSociedad Nacional de Minería, Petróleo y Energía and was elected on March 16, 2005 President ofConfederación Nacional de Instituciones Empresariales Privadas(National Confederation of Private Companies, or CONFIEP) until 2007. Mr. Morales1991 to 1997. Ms. La Rosa received hisher law degree fromPontificia Universidad Católica del Perú in 1968 and1992. She also completed the SloanCorporate Law Specialization Program at Stanford University’sUniversidad de Navarra, Spain, in 1991 and the High Specialization Program of Finance and Corporate Law at ESAN Graduate School of Business, Perú, in 1976.
2001. In addition, Ms. La Rosa attended the Management Program for Lawyers at Yale School of Management in 2005 and the Corporate Governance and Performance Program at Yale School of Management in 2012.
B. Compensation
During the year ended December 31, 2011,2012, the aggregate amount of compensation that we paid to all directors and executive officers was approximately US$27.327.5 million, including director’s fees accrued in 20102011 and paid in 2011.2012. We do not disclose to our shareholders or otherwise make public information with respect to the compensation of our individual directors or executive officers.
We have a long-term stock appreciation program, with a term of ten years once initiated, that allows certain executives to receive a cash remuneration equivalent to any excess of the market value at a future date over a stated price of a stated number of our ADSs. This program is in effect as long as the executives are employed by us at the settlement date of the program. See Note 15(b)14(b) to the Financial Statements.
C. Board Practices
Audit Committee
The Audit Committee, which is composed entirely of independent directors as defined in Section 303A.02 of the New York Stock Exchange’s Listed Company Manual, is responsible for assisting the Board of Directors in the appointment of independent auditors, upon delegation of such responsibility by the shareholders at the general meeting of shareholders, or the General Meeting, and reviewing the scope of internal and external audits. The Audit Committee also reviews compliance with internal control systems, reviews our annual and quarterly financial statements, reviews financial statements before their presentation to theSuperintendencia del Mercado de Valores,or the SMV(formerly known as the Comisión Nacional Supervisora de Empresas y Valores (National Supervisory Commission of Business and Securities), or CONASEV), theBolsa de Valores de Lima (Lima Stock Exchange) and the SEC and maintains the integrity of the preparation of audits. The members of the Audit Committee are currently Messrs. Coleridge,Suárez, Paverd, Ortiz-de-Zevallos and del Solar and Suárez.Solar.
Compensation Committee
The Compensation Committee is responsible for evaluating executive performance and approving executive compensation, including compensation of the chief executive officer and any stock option compensation plans. The members of the Compensation Committee are currently Messrs. del Solar, Ortiz-de-Zevallos and Suárez.
Nominating/Corporate Governance Committee
The Nominating/Corporate Governance Committee is responsible for preparing the proposals for the general meetings in respect of the composition of the Board of Directors along with the director remuneration to be approved by the shareholders, monitoring issues and practices related to corporate governance and proposing necessary actions in respect thereof. The members of the Nominating/Corporate Governance Committee are currently Messrs. Benavides-Ganoza, Coleridge, del-Solar,Suárez, Morales, del Solar, Paverd, Ortiz-de-Zevallos Snider and Suárez.
Snider.
D. Employees
As of December 31, 2011,2012, we and our subsidiaries had 3,5985,088 employees. In addition, we have entered into arrangements with independent contractors which employed 8,40415,535 persons who worked at our operations. We have sought to strengthen our workforce by implementing a qualifications-based hiring policy and, with respect to employees working in the mines, reducing the average age of the workforce. As of December 31, 2011,2012, the average tenure of our permanent laborers at the Julcani, Uchucchacua, Orcopampa, Poracota, Recuperada, Ishihuinca, Mallay, Breapampa and Antapite mines (the only mines for which we have long-term historical records) was approximately 10.510 years.
Of our 1,7921,954 permanent employees, approximately 5584 percent are members of nine different labor unions (including three unions and one labor union committee for clerical workers and five unions for laborers), which represent all clerical workers and laborers in collective bargaining negotiations with us. There are also five unions for workers employed by independent contractors that were formed over the last four years in our mines at Uchucchacua, Antapite, Orcopampa, Poracota and Julcani.
Each of the labor unions is a company-based union with an affiliation to a national union. Administrative personnel are not represented by unions. Labor relations for unionized and non-unionized employees in our production facilities, including compensation and benefits, are governed by collective bargaining agreements, the terms and length of which are negotiated throughout the year as the various collective bargaining agreements come up for renewal. These collective bargaining agreements are typically one year in length and set wages for the applicable period, including increases as negotiated and certain other employee benefits, such as overtime, bonuses and family benefits.
During the six years prior to April 30, 2007, we did not experience any strikes. Between April 2007 and June 2008, we were affected by five strikes, each lasting three to seven days, at our Uchucchacua, Orcopampa, Ishihuinca and Antapite mines. On October 19, 2009, the National Mining Federation held a two-day strike at our Uchucchacua mine. In 2010, we experienced two simultaneous strikes, each lasting approximately seven days, affecting operations at our Orcopampa, Uchucchacua and Antapite mines. In April 2011, we experienced a 21-day work stoppage at our Uchucchacua mine due to a strike and related local community demonstrations. In May and October 2011, we experienced two three-day strikes at our Orcopampa mine. In May and June 2012, we experienced a 15-day work stoppage at our Orcopampa mine due to strikes related to the collective bargaining process with our labor unions and a further 9-day work stoppage at our Orcopampa mine in October 2012 due to a strike by a contract labor union.
Compensation received by our employees includes salary, other cash payments (such as overtime, vacation pay and bonuses including, but not limited to, high altitude and underground mining bonuses) and non-cash benefits. Non-cash benefits include medical insurance, life insurance and training programs for workers and administrative staff. For mine and processing plant workers, benefits also include transportation services, meals or food allowances, education for children of our employees and housing, hospitals and a full range of social services for our permanent employees and their families at town sites near our mines in compliance with mining regulations. We voluntarily provide power, water and sewage services for the camp and houses of the workers as well as for certain towns nearby. In addition, pursuant to a profit-sharing plan mandated by Peruvian labor legislation, employees of mining companies in Peru are entitled to receive the Employee Profit Sharing Amount equivalent to 8 percent of the annual pre-tax profits of their employer, 50 percent of such profits to be distributed based on the number of days each employee worked during the preceding year and the remaining 50 percent of such profits to be distributed based on the aggregate annual salary of each employee. Effective January 1, 1997, the annual payment to each employee under the profit sharing plan cannot exceed 18 times such employee’s monthly salary, and any difference between the Employee Profit Sharing Amount and the aggregate amount paid to employees must be contributed by us to theFONDO-EMPLEO, a fund established to promote employment and employee training.
Under Peruvian law, we may dismiss workers for cause by following certain formal procedures. We may dismiss a worker without cause, provided that we pay such worker a layoff indemnification in an amount equal to one and a half month’s salary for each full year worked plus the pro rata portion for any uncompleted year, not to exceed in the aggregate 12 months’ salary. Several decisions adopted by the Peruvian Constitutional Court, holding that an employee is entitled for reinstatement if no cause for dismissal is expressed by the employer or for failure to present evidence supporting the employer’s grounds, have limited our ability to dismiss a worker without cause. However, all employees are entitled to a severance payment upon termination of their employment, regardless of the reason for such termination, equal to approximately one month’s salary for each full year worked plus the pro rata portion for any uncompleted year. Pursuant to the Peruvian labor laws enacted in 1991, we deposit funds for severance payments in a bank account selected by each employee and for the benefit of such employee, in both May and November of each year.
Our permanent employees receive the benefit of one of two types of pension arrangements. All workers can choose to enroll in the ONP (a public pension fund managed by the state) or in AFPs (private pension funds). We are required to withhold from each of the salaries of the employees enrolled in the ONP system approximately 13 percent of such employee’s salary, and pay such amount to the ONP system and withhold from the salary of each employee enrolled in the AFP system approximately 13 percent of such employee’s salary, and pay such amounts to the respective AFP (exact amount varies from one AFP to another). Additionally, for workers involved in mining and metallurgical processes, an additional 2 percent is withheld from their salaries, and we contribute an additional 2 percent to increase their pension funds. We have no liability for the performance of these pension plans. In addition, our independent contractors are responsible for covering severance and pension payments with respect to their employees.
In addition, we pay ESSALUD 9 percent of our total payroll for general health services for all permanent employees. Prior to May 1997, we were required to pay to ESSALUD 1 percent of our payroll of blue collar employees for employment-related illness and accidents, or the Workers Compensation Fund Payment. In addition, Law No. 26790 also requires us to provide private insurance representing an average payment equal to 1.30 percent of the payroll of covered employees for employment-related incapacity and death for blue collar employees and other employees exposed to mining-related hazards.
E. Share Ownership
As of March 31, 2012,2013, our directors and executive officers, as a group, owned 681,396948,624 Common Shares, representing 0.270.37 percent of all the 254,412,328254,232,571 Common and Investment Shares outstanding. Our directors and executive officers do not own any Investment Shares.
The share ownership of the Company’s directors and executive officers on an individual basis as of March 31, 20122013 is set forth below:
| Shareholder | Number of Common Shares | Percentage Beneficial Ownership of Common Shares | Number of Investment Shares | Percentage Beneficial Ownership of Investment Shares | Number of Common Shares and Investment Shares | Percentage Beneficial Ownership of Common Shares and Investment Shares | ||||||||||||||||||
| Roque Benavides† | 365,398 | 0.14 | — | — | 365,398 | 0.14 | ||||||||||||||||||
| Timothy Snider | — | — | — | — | — | — | ||||||||||||||||||
| Luis Coleridge | — | — | — | — | — | — | ||||||||||||||||||
| Aubrey Laurence Paverd | — | — | — | — | — | — | ||||||||||||||||||
| Felipe Ortiz-de-Zevallos | — | — | — | — | — | — | ||||||||||||||||||
| Carlos del Solar | — | — | — | — | — | — | ||||||||||||||||||
| Germán Suárez | — | — | — | — | — | — | ||||||||||||||||||
| Raúl Benavides† | 267,228 | 0.11 | — | — | 267,228 | 0.11 | ||||||||||||||||||
| Carlos E. Gálvez. | 48,770 | 0.02 | — | — | 48,770 | 0.02 | ||||||||||||||||||
| Alejandro Hermoza | — | — | — | — | — | — | ||||||||||||||||||
| Francois Muths | — | — | — | — | — | — | ||||||||||||||||||
| César E. Vidal | — | — | — | — | — | — | ||||||||||||||||||
| José Miguel Morales | — | — | — | — | — | — | ||||||||||||||||||
| Directors and Executive Officers as a Group† | 681,396 | 0.27 | % | — | — | 681,396 | 0.27 | % | ||||||||||||||||
| Shareholder | Number of Common Shares | Percentage Beneficial Ownership of Common Shares | Number of Investment Shares | Percentage Beneficial Ownership of Investment Shares | Number of Common Shares and Investment Shares | Percentage Beneficial Ownership of Common Shares and Investment Shares | ||||||||||||||||||
| Roque Benavides† | 365,398 | 0.14 | — | — | 365,398 | 0.14 | ||||||||||||||||||
| Timothy Snider | — | — | — | — | — | — | ||||||||||||||||||
| José Miguel Morales† | 267,228 | 0.11 | — | — | 267,228 | 0.11 | ||||||||||||||||||
| Aubrey Laurence Paverd | — | — | — | — | — | — | ||||||||||||||||||
| Felipe Ortiz-de-Zevallos | — | — | — | — | — | — | ||||||||||||||||||
| Carlos del Solar | — | — | — | — | — | — | ||||||||||||||||||
| Germán Suárez | — | — | — | — | — | — | ||||||||||||||||||
| Raúl Benavides† | 267,228 | 0.11 | — | — | 267,228 | 0.11 | ||||||||||||||||||
| Carlos E. Gálvez. | 48,770 | 0.02 | — | — | 48,770 | 0.02 | ||||||||||||||||||
| Alejandro Hermoza | — | — | — | — | — | — | ||||||||||||||||||
| Francois Muths | — | — | — | — | — | — | ||||||||||||||||||
| César E. Vidal | — | — | — | — | — | — | ||||||||||||||||||
| Gulnara la Rosa | — | — | — | — | — | — | ||||||||||||||||||
| Leandro Garcia | — | — | — | — | — | — | ||||||||||||||||||
| Directors and Executive Officers as a Group† | 948,624 | 0.37 | % | — | — | 948,624 | 0.37 | % | ||||||||||||||||
| † | Does not include Common Shares owned by Roque Benavides, |
| ITEM 7. | Major Shareholders and Related Party Transactions |
A. Major Shareholders
As of March 31, 2012,2013, we had 274,889,924 Common Shares, including 21,160,26021,130,260 treasury shares, and 744,640 Investment Shares, including 61,976271,733 treasury shares. The Common Shares are voting securities. The table below sets forth certain information concerning ownership of (i) the Common Shares and Investment Shares and (ii) the aggregate Common Shares and Investment Shares, as of March 31,2012,31,2013, with respect to each shareholder known to us to own more than 2.5 percent of the outstanding Common Shares and with respect to all directors and executive officers as a group.
Control of the Company(1)
| Shareholder | Number of Common Shares | Percentage Beneficial Ownership of Common Shares(3) | Number of Investment Shares | Percentage Beneficial Ownership of Investment Shares(4) | Number of Common Shares | Percentage Beneficial Ownership of Investment Shares(5) | ||||||||||||||||||
| Benavides Family(2) | 69,187,744 | 27.27 | — | — | 69,187,744 | 27.20 | ||||||||||||||||||
| BlackRock Investment Management (UK) Ltd. | 26,015,558 | 10.25 | — | — | 28,015,558 | 11.01 | ||||||||||||||||||
| BlackRock Global Funds-World Mining Fund | 12,391,006 | 4.88 | — | — | 12,391,006 | 4.87 | ||||||||||||||||||
| Prima, AFP | 11,879,643 | 4.68 | — | — | 11,879,643 | 4.67 | ||||||||||||||||||
| Integra, AFP | 11,240,828 | 4.43 | — | — | 11,240,828 | 4.42 | ||||||||||||||||||
| Market Vectors ETF Trust Gold Miners ETF | 10,829,925 | 4.27 | 10,829,925 | 4.26 | ||||||||||||||||||||
| Van Eck Global | 11,081,020 | 4.37 | 11,081,020 | 4.36 | ||||||||||||||||||||
| Shareholder | Number of Common Shares | Percentage Beneficial Ownership of Common Shares(3) | Number of Investment Shares | Percentage Beneficial Ownership of Investment Shares(4) | Number of Common Shares | Percentage Beneficial Ownership of Investment Shares(5) | ||||||||||||||||||
| BlackRock Global Funds-World Gold Fund | 10,401,677 | 4.09 | — | — | 10,401,677 | 4.09 | ||||||||||||||||||
| Fidelity Management & Research Co | 6,931,700 | 2.73 | — | — | 6,931,700 | 2.72 | ||||||||||||||||||
| Horizonte, AFP | 8,682,028 | 3.42 | — | — | 8,682,028 | 3.41 | ||||||||||||||||||
| BlackRock Fund Advisors | 8,452,544 | 3.33 | — | — | 8,452,544 | 3.32 | ||||||||||||||||||
| Shareholder | Number of Common Shares | Percentage Beneficial Ownership of Common Shares(3) | Number of Investment Shares | Percentage Beneficial Ownership of Investment Shares(4) | Number of Common Shares and Investment Shares | Percentage Beneficial Ownership of Common Shares and Investment Shares(5) | ||||||||||||||||||
| Benavides Family(2) | 69,187,744 | 27.27 | — | — | 69,187,744 | 27.21 | ||||||||||||||||||
| BlackRock Investment Management (UK) Ltd. | 19,206,054 | 7.57 | — | — | 19,206,054 | 7.55 | ||||||||||||||||||
| BlackRock Global Funds-World Mining Fund | 8,750,000 | 3.45 | — | — | 8,750,000 | 3.44 | ||||||||||||||||||
| Prima, AFP | 12,806,114 | 5.05 | — | — | 12,806,114 | 5.04 | ||||||||||||||||||
| Integra, AFP | 12,619,755 | 4.97 | — | — | 12,619,755 | 4.96 | ||||||||||||||||||
| Market Vectors ETF Trust Gold Miners ETF | 11,015,164 | 4.34 | 11,015,164 | 4.33 | ||||||||||||||||||||
| Van Eck Global | 12,079,992 | 4.76 | 12,079,992 | 4.75 | ||||||||||||||||||||
| BlackRock Global Funds-World Gold Fund | 7,800,000 | 3.08 | — | — | 7,800,000 | 3.07 | ||||||||||||||||||
| Fidelity Management & Research Co | 4,288,376 | 1.69 | — | — | 4,288,376 | 1.69 | ||||||||||||||||||
| Horizonte, AFP | 9,349,815 | 3.68 | — | — | 9,349,815 | 3.68 | ||||||||||||||||||
| BlackRock Fund Advisors | 8,064,437 | 3.18 | — | — | 8,064,437 | 3.17 | ||||||||||||||||||
| (1) | The table above excludes treasury shares. As of March 31, |
| (2) | These Common Shares are owned by certain members of Alberto Benavides de la Quintana’s immediate and extended family and their spouses and include the Common Shares over which Alberto Benavides de la Quintana exercises voting and dispositive control pursuant to usufructo agreements and related legal instruments. |
| (3) | Percentage calculated on the basis of 253,729,664 Common Shares outstanding, which excludes 21,160,260 treasury shares. |
| (4) | Percentage calculated on the basis of |
| (5) | Percentage calculated on the basis of |
As of March 31, 2012,2013, we estimate that 150,037,442152,022,687 ADSs were held in the United States, which represented approximately 58.9855.31 percent of Common Shares outstanding. The number of institutional record holders of our Common Shares (or of ADSs representing our Common Shares) in the United States was 5358 institutions.
B. Related Party Transactions
Except as otherwise disclosed herein, no director, senior officer, principal shareholder or any associate or affiliate thereof had any material interest, direct or indirect, in any transaction since the beginning of our last financial year that has materially affected us, or in any proposed transaction that would materially affect us. Except as otherwise disclosed herein, we have entered into no transactions with parties that are not “related parties” but who would be able to negotiate terms not available on an arm’s-length basis. From time to time in the ordinary course of business, we enter into management, exploration, mine construction, engineering and employment contracts with joint venture companies in which one or more of our direct or indirect subsidiaries holds equity or partnership interests.
The compensation of our key executives (including the related income taxes we assumed in connection therewith) totaled US$75.6 million in 2010 and US$51.1 million in 2011.2011 and US$32.3 million in 2012.
Chaupiloma is the legal owner of the mineral rights operated by Yanacocha and receives a 3 percent royalty based on quarterly sales, after deducting refinery and transportation costs. Royalties amounted to US$62.355.9 million, US$55.962.7 million and US$62.767.2 million in 2009, 2010, 2011 and 2011,2012, respectively, and are presented as royalty income in our consolidated statements of income.
Condesa received cash dividends from Yanacocha of approximately US$100.4 million in 2009 and did not receive a cash dividend from Yanacocha in 2010, and 2011.2011 or 2012.
CashWe received cash dividends received from Cerro Verde amounted toof approximately US$128.1 million in 2009, US$183.0million in 2010 and no2010. We did not receive a cash dividend from Cerro Verde in 2011 or 2012.
We received cash dividends receivedfrom Coimolache of approximately US$16.5 million in 2011.2012.
In March 2002, Buenaventura Ingenieros S.A. signed a technical service agreement with Yanacocha to perform a number of specialized activities and services. Pursuant to the agreement, the services performed relate to the construction of mining projects and include completion of analysis and studies, work plan design, and functions related to planning, monitoring and administrating the infrastructure projects required by Yanacocha in its operations.
In November 2000, Conenhua signed an agreement with Yanacocha for the construction and operation of a 220 kW transmission line between Trujillo and Cajamarca, a 60 kW transmission line between Cajamarca and La Pajuela, and the Cajamarca Norte substation; this agreement also encompassed activities necessary to enlarge the Trujillo substation. Pursuant to this contract, the construction work was completed in October 2001.Concurrently, we and Yanacocha signed a 10-year agreement covering electric energy transmission and infrastructure operation beginning in November 2001. In exchange for us operating and managing the transmission project, Yanacocha pays an annual fee of US$3.7 million. The revenues for these services amounted to approximately US$4.3 million in each of 2010, 20092011 and 2008,2010, respectively.
C. Interests of Experts and Counsel
Not applicable.
| ITEM 8. | Financial Information |
A. Consolidated Statements and Other Financial Information
Consolidated Financial Statements
See “Item 19. Exhibits” for a list of financial statements filed under Item 18.
Other Financial Information
Export Sales
See “Item 4. Information on the Company—Buenaventura—B. Business Overview—Sales of Metal Concentrates—Sales and Markets” for information on export sales.
Legal Proceedings
Other than the legal proceedings relating to Yanacocha described in “Item 4. Information on the Company—Yanacocha—B. Business Overview—Legal Proceedings,” we and Yanacocha are each parties to certain other legal proceedings arising in the normal course of business, none of which, individually or in the aggregate, is material.
Dividends and Dividend Policy
We can distribute three kinds of dividends: (i) cash dividends, which are paid out of our net distributable income for each year, (ii) stock dividends that are akin to stock splits rather than distributions of earnings, which are issued for the purpose of adjusting the book value per share of our stock, and (iii) stock dividends for the purpose of capitalizing profits, in each case as described in more detail below. All shares outstanding and fully paid are entitled to share equally in any dividend declared based on the portion of our capital represented by such share. Shares of capital stock which are only partially paid participate in a dividend or distribution in the same proportion that such shares have been paid at the time of the dividend or distribution. No cash dividend may be declared in respect of a given year unless we have earned net distributable income in respect of such year. However, we may declare dividends during the year. We may make interim provisional payments to shareholders in respect of net distributable income for the current fiscal year, which are referred to as “provisional dividends,” as explained below.
The Board of Directors, following the end of each fiscal year, makes a recommendation at the annual obligatory shareholders’ meeting regarding the amount and timing of payments, if any, to be made as dividends on our Common Shares and Investment Shares.
The dividend policy establishes that dividends will be not less than 20 percent of our net profits. In principle there are two kinds of dividend payments: the interim dividends, which are approved by the Board and are generally paid during the fourth quarter of the year, and the final dividend payment, which will be paid in accordance with the general shareholders’ meeting resolutions. However, the amount and timing of such payments is subject to the final approval at such annual obligatory shareholders’ meeting and Board meeting, as well as to the availability of earnings to distribute. According to the Peruvian Companies Law, shareholdersholders of at least 20 percent of the total Common Shares outstanding can request a dividend of 50 percent or less of the previous year’s after-tax profits, net of amounts allocated to the legal reserve, if there is an affirmative vote among holders of at least 20 percent of the total Common Shares outstanding.reserve.
Available earnings are subject to the following priorities. First, the mandatory employee profit sharing of 8 percent of pre-tax profits (which may differ from pre-tax profits determined under IFRS due to different depreciation treatment and different adjustments of non-taxable income and/or non-deductible expenses) is paid. Next, remaining earnings are taxed at the standard corporate income tax rate, which has been 30 percent since January 1, 2004. Not less than 10 percent of such after-tax net profits must then be allocated to a legal reserve, which is not available thereafter except to cover future losses or for use in future capitalizations. Amounts reserved are nevertheless included in taxable income. The obligation to fund this reserve continues until the reserve constitutes 20 percent of the paid-in share capital. In addition, the holders of Common Shares can agree to allocate any portion of the net profits to any special reserve. The remainder of the net profits is available for distribution to shareholders. Any dividend approved by a shareholders’ meeting after December 31, 2002 is subject to an additional withholding tax at the rate of 4.1 percent of the total amount of dividends distributed to shareholders who are either (i) individuals, whether domiciled or non-domiciled in Peru, or (ii) non-domiciled companies or entities. Dividends paid to domiciled companies or entities are not subject to such withholding tax. If any tax or other governmental charge will become payable by Scotiabank Peru, as custodian, the Depositary or us with respect to any ADR or any deposited securities represented by the ADSs evidenced by such ADR, such tax or other governmental charge will be payable by the owner or beneficial owner of such ADR to the Depositary.
Dividends on issued and outstanding Common Shares and Investment Shares are distributed in accordance with the proportion of the total capital represented by such respective shares. Dividends are distributed pro rata in accordance with the number of Common Shares or Investment Shares. Accordingly, any dividend declared would be apportioned 99.73 percent to the holders of Common Shares and 0.27 percent to the holders of Investment Shares. This proportion will not change in the future except and to the extent holders of Common Shares and Investment Shares exercise their preemptive rights disproportionately in any future issuance of Common Shares and Investment Shares, or we issue Common Shares without preemptive rights in accordance with Article 259 of the Peruvian Companies Law.
Holders of Common Shares and Investment Shares are not entitled to interest on dividend payments.
Holders of ADRs are entitled to receive dividends with respect to the Common Shares underlying the ADSs evidenced by such ADRs, subject to the terms of the related Amended and Restated Deposit Agreement, to the same extent as owners of Common Shares.
To the extent that we declare and pay dividends on the Common Shares, owners of the ADSs on the relevant record date are entitled to receive the dividends payable in respect of the Common Shares underlying the ADSs, subject to the terms of the Amended and Restated Deposit Agreement. Cash dividends are paid to the Depositary in Nuevos Soles and, except as otherwise described under the Amended and Restated Deposit Agreement, are converted by the Depositary into U.S. Dollars and paid to owners of ADRs net of currency conversion expenses. Under the Amended and Restated Deposit Agreement, the Depositary may, and will if we so request, distribute stock dividends in the form of additional ADRs evidencing whole ADSs resulting from a dividend or free distribution of Common Shares by us received by the Depositary. Cash dividends paid with respect to the Common Shares and amounts distributed with respect to ADSs are currently subject to a Peruvian withholding income tax of 4.1 percent. See “Item 10. Additional Information—E. Taxation—Peruvian Tax Considerations.”
We issue stock dividends for value per share of our stock. The book value of our share capital is based on the nominal (par) value of each share but is adjusted to account for inflation; thus, in inflationary periods, our book value will increase while the nominal value will remain constant. In order to adjust the book value of each share to equal or approximate the nominal value, we periodically issue new shares that are distributed as stock dividends to each existing shareholder in proportion to such shareholder’s existing holdings, unless it increases the nominal value of the existing shares. These stock dividends (which under the Peruvian income tax law are not considered dividends) do not change a stockholder’s percentage of interest in us. In addition, we may from time to time capitalize profits and, in such case, we have to distribute stock dividends representing the profits capitalized.
Dividends not collected within ten years will be retained by us, increasing our legal reserve, and the right to collect such dividends will expire.
Under Peruvian law, each company may make formal cash distributions only out of net distributable income (calculated on an individual, unconsolidated basis and demonstrated by a statement of financial position at any given time). We, however, may pay provisional dividends. Payment of provisional dividends will be approved on the basis of financial statements which show the existence of net distributable income obtained during the current fiscal year. In the event that, following such an interim provisional payment, we suffer a loss or if we finish the fiscal year with a net income that is lower than the amount of provisional dividends paid during such fiscal year, we could legally require all shareholders (including holders of ADRs) to return such payment to us with interest. However, it has been and continues to be our policy not to require shareholders to return such payment of provisional dividends, but rather to cover such contingency through a “dividends paid in advance” account to be offset by future net distributable income.
The following table sets forth the amounts of interim and final cash dividends and the aggregate of cash dividends paid with respect to the years 20072008 to 2011.2012. Dividends with respect to the years 20072008 to 20112012 were paid per Common Share and ADS.
| Year ended December 31,(1) | Per Common Share | Per ADSs | Per Investment Share | |||||||||||||||||||||||||||||||||
| Interim | Final | Total | Interim | Final | Total | Interim | Final | Total | ||||||||||||||||||||||||||||
| 2008 | 0.09 | 0.02 | 0.11 | 0.09 | 0.02 | 0.11 | 0.09 | 0.02 | 0.11 | |||||||||||||||||||||||||||
| 2009 | 0.02 | 0.14 | 0.16 | 0.02 | 0.14 | 0.16 | 0.02 | 0.14 | 0.16 | |||||||||||||||||||||||||||
| 2010 | 0.30 | 0.16 | 0.46 | 0.30 | 0.16 | 0.46 | 0.30 | 0.16 | 0.46 | |||||||||||||||||||||||||||
| 2011 | 0.33 | 0.23 | 0.56 | 0.33 | 0.23 | 0.56 | 0.33 | 0.23 | 0.56 | |||||||||||||||||||||||||||
| 2012 | 0.40 | 0.20 | 0.60 | 0.40 | 0.20 | 0.60 | 0.40 | 0.20 | 0.60 | |||||||||||||||||||||||||||
Year ended December 31, (1) | Per Common Share | Per ADSs | Per Investment Share | |||||||||||||||||||||||||||||||||
| Interim | Final | Total | Interim | Final | Total | Interim | Final | Total | ||||||||||||||||||||||||||||
| 2007 | 0.18 | 0.22 | 0.40 | 0.18 | 0.22 | 0.40 | 0.18 | 0.22 | 0.40 | |||||||||||||||||||||||||||
| 2008 | 0.09 | 0.02 | 0.11 | 0.09 | 0.02 | 0.11 | 0.09 | 0.02 | 0.11 | |||||||||||||||||||||||||||
| 2009 | 0.02 | 0.14 | 0.16 | 0.02 | 0.14 | 0.16 | 0.02 | 0.14 | 0.16 | |||||||||||||||||||||||||||
| 2010 | 0.30 | 0.16 | 0.46 | 0.30 | 0.16 | 0.46 | 0.30 | 0.16 | 0.46 | |||||||||||||||||||||||||||
| 2011 | 0.33 | 0.23 | 0.56 | 0.33 | 0.23 | 0.56 | 0.33 | 0.23 | 0.56 | |||||||||||||||||||||||||||
| (1) | Interim and final dividend amounts are expressed in U.S. Dollars. |
Non-controlling Shareholders
Law No. 28370, published on October 30, 2004, included in the Peruvian Companies Law certain provisions for the protection of the non-controlling shareholders that were formerly contained in Law No. 26985, which had been abrogated. Legislative Decree No. 1061, effective since June 29, 2008, has amended certain of these provisions. Pursuant to Article 262-A of the Peruvian Companies Law, we will issue a notice within sixty days after the Annual Obligatory Shareholders’ Meeting, or after the expiration of the three-month period after the end of the prior fiscal year in which such Annual Obligatory Shareholders’ Meeting is required to be held, thecontaining information regarding total number and value of any shares not claimed by shareholders, the name of such shareholders, the share quote in the securities market for such shares; the total amount of uncollected dividends; and where shares and dividends pending claim are available for the non-controlling shareholders. The publication must be made in the official gazette “El Peruano,” on our website and on the SMV’s website. Article 262-B describes the procedure to request share certificates and/or dividends. Article 262-F describes the procedure for handling any claim that the non-controlling shareholders may file, such claims to be resolved by the SMV.
B. Significant Changes
No significant change in our financial affairs has occurred since the date of the annual financial statements included in this Annual Report.
| ITEM 9. | The Offer and Listing |
A. Offer and Listing Details
Trading Information
The table below sets forth the trading volume and the high and low closing prices of the Common Shares and Investment Shares in Nuevos Soles. The table also includes the trading volume and the high and low closing prices of the ADSs representing the Common Shares in U.S. Dollars for the same periods.
| Common Shares(1) | ADSs(2) | Investment Shares(1) | ||||||||||||||||||||||||||||||||||
| Trading Volume | High | Low | Trading Volume | High | Low | Trading Volume | High | Low | ||||||||||||||||||||||||||||
| (in millions) | (in nominal S/. per share) | (in millions) | (in US$ per ADS) | (in millions) | (in nominal S/. per share) | |||||||||||||||||||||||||||||||
| Annual highs and lows | ||||||||||||||||||||||||||||||||||||
| 2008 | 1.63 | 118.75 | 33.00 | 274.92 | 42.89 | 9.00 | 0.02 | 90.00 | 40.00 | |||||||||||||||||||||||||||
| 2009 | 2.53 | 122.00 | 45.05 | 345.53 | 42.69 | 14.00 | 0.61 | 90.00 | 40.00 | |||||||||||||||||||||||||||
| 2010 | 1.44 | 155.50 | 83.00 | 271.37 | 57.20 | 28.59 | 0.04 | 110.00 | 78.00 | |||||||||||||||||||||||||||
| 2011 | 2.50 | 136.00 | 98.72 | 323.07 | 49.53 | 35.33 | 0.02 | 110.00 | 98.00 | |||||||||||||||||||||||||||
| 2012 | 2.15 | 117.00 | 82.55 | 236.28 | 43.90 | 30.86 | 0.22 | 109.30 | 75.00 | |||||||||||||||||||||||||||
| Quarterly highs and lows | ||||||||||||||||||||||||||||||||||||
| 2011 | ||||||||||||||||||||||||||||||||||||
| 1st quarter | 0.22 | 136.00 | 113.00 | 75.72 | 49.53 | 39.30 | 0.01 | 110.00 | 100.00 | |||||||||||||||||||||||||||
| 2nd quarter | 0.87 | 121.80 | 99.10 | 101.09 | 44.78 | 35.33 | 0.01 | 100.00 | 100.00 | |||||||||||||||||||||||||||
| 3rd quarter | 0.71 | 134.10 | 100.40 | 82.42 | 49.45 | 36.12 | 0.01 | 105.00 | 98.00 | |||||||||||||||||||||||||||
| 4th quarter | 0.70 | 123.00 | 98.72 | 63.84 | 45.80 | 35.58 | 0.00 | 104.60 | 101.40 | |||||||||||||||||||||||||||
| 2012 | ||||||||||||||||||||||||||||||||||||
| 1st quarter | 0.52 | 117.00 | 99.50 | 54.58 | 43.90 | 37.71 | 0.01 | 109.30 | 99.50 | |||||||||||||||||||||||||||
| 2nd quarter | 0.52 | 113.00 | 93.50 | 67.42 | 43.04 | 35.03 | 0.22 | 110.00 | 89.42 | |||||||||||||||||||||||||||
| 3rd quarter | 0.22 | 95.00 | 86.00 | 59.88 | 40.09 | 31.05 | 0.00 | 77.00 | 77.00 | |||||||||||||||||||||||||||
| 4th quarter | 0.90 | 100 | 82.55 | 54.42 | 39.28 | 30.86 | 0.01 | 77.00 | 75.00 | |||||||||||||||||||||||||||
| Monthly highs and lows | ||||||||||||||||||||||||||||||||||||
| 2012 | ||||||||||||||||||||||||||||||||||||
| October | 0.02 | 100.00 | 90.90 | 13.97 | 39.28 | 34.56 | 0.00 | 77.00 | 77.00 | |||||||||||||||||||||||||||
| November | 0.84 | 93.55 | 83.00 | 19.06 | 37.52 | 32.00 | 0.01 | 77.00 | 77.00 | |||||||||||||||||||||||||||
| December | 0.05 | 92.50 | 82.55 | 21.39 | 36.27 | 30.86 | 0.01 | 75.00 | 75.00 | |||||||||||||||||||||||||||
| 2013 | ||||||||||||||||||||||||||||||||||||
| January | 0.34 | 90.09 | 75.25 | 27.25 | 36.58 | 29.50 | 0.00 | 0.00 | 0.00 | |||||||||||||||||||||||||||
| February | 0.20 | 76.30 | 65.00 | 27.72 | 30.42 | 25.42 | 0.00 | 0.00 | 0.00 | |||||||||||||||||||||||||||
| March | 0.07 | 67.31 | 63.80 | 27.40 | 26.59.59 | 24.00 | 0.00 | 0.00 | 0.00 | |||||||||||||||||||||||||||
| Common Shares(1) | ADSs(2) | Investment Shares(1) | ||||||||||||||||||||||||||||||||||
Trading Volume |
High |
Low | Trading Volume |
High |
Low | Trading Volume |
High |
Low | ||||||||||||||||||||||||||||
| (in millions) | (in nominal S/. per share) | (in millions) | (in US$ per ADS) | (in millions) | (in nominal S/. per share) | |||||||||||||||||||||||||||||||
| Annual highs and lows | ||||||||||||||||||||||||||||||||||||
| 2007 | 1.53 | 186.00 | 82.50 | 137.20 | 61.00 | 25.39 | 0.02 | 126.50 | 82.00 | |||||||||||||||||||||||||||
| 2008 | 1.63 | 118.75 | 33.00 | 274.92 | 42.89 | 9.00 | 0.02 | 90.00 | 40.00 | |||||||||||||||||||||||||||
| 2009 | 2.53 | 122.00 | 45.05 | 345.53 | 42.69 | 14.00 | 0.61 | 90.00 | 40.00 | |||||||||||||||||||||||||||
| 2010 | 1.44 | 155.50 | 83.00 | 271.37 | 57.20 | 28.59 | 0.04 | 110.00 | 78.00 | |||||||||||||||||||||||||||
| 2011 | 2.50 | 136.00 | 98.72 | 323.07 | 49.53 | 35.33 | 0.02 | 110.00 | 98.00 | |||||||||||||||||||||||||||
| Quarterly highs and lows | ||||||||||||||||||||||||||||||||||||
| 2010 | ||||||||||||||||||||||||||||||||||||
| 1st quarter | 0.28 | 112.00 | 83.00 | 72.88 | 38.84 | 28.59 | 0.01 | 86.00 | 78.00 | |||||||||||||||||||||||||||
| 2nd quarter | 0.17 | 114.50 | 87.90 | 85.56 | 40.89 | 29.84 | 0.02 | 87.50 | 80.00 | |||||||||||||||||||||||||||
| 3rd quarter | 0.34 | 126.60 | 100.50 | 53.78 | 45.20 | 35.59 | 0.01 | 90.00 | 86.00 | |||||||||||||||||||||||||||
| 4th quarter | 0.65 | 155.50 | 126.50 | 59.46 | 57.20 | 44.67 | 0.01 | 110.00 | 100.00 | |||||||||||||||||||||||||||
| 2011 | ||||||||||||||||||||||||||||||||||||
| 1st quarter | 0.22 | 136.00 | 113.00 | 75.72 | 49.53 | 39.30 | 0.01 | 110.00 | 100.00 | |||||||||||||||||||||||||||
| 2nd quarter | 0.87 | 121.80 | 99.10 | 101.09 | 44.78 | 35.33 | 0.01 | 100.00 | 100.00 | |||||||||||||||||||||||||||
| 3rd quarter | 0.71 | 134.10 | 100.40 | 82.42 | 49.45 | 36.12 | 0.01 | 105.00 | 98.00 | |||||||||||||||||||||||||||
| 4th quarter | 0.70 | 123.00 | 98.72 | 63.84 | 45.80 | 35.58 | 0.00 | 104.60 | 101.40 | |||||||||||||||||||||||||||
| Monthly highs and lows | ||||||||||||||||||||||||||||||||||||
| 2011 | ||||||||||||||||||||||||||||||||||||
| October | 0.34 | 118.00 | 100.10 | 19.97 | 44.15 | 35.58 | 0.00 | 104.60 | 104.60 | |||||||||||||||||||||||||||
| November | 0.29 | 123.00 | 103.30 | 21.14 | 45.80 | 37.94 | 0.00 | 104.50 | 101.40 | |||||||||||||||||||||||||||
| December | 0.08 | 109.00 | 98.72 | 22.74 | 40.62 | 36.14 | 0.00 | 101.40 | 101.40 | |||||||||||||||||||||||||||
| 2012 | ||||||||||||||||||||||||||||||||||||
| January | 0.04 | 117.00 | 102.00 | 15.48 | 43.90 | 37.71 | 0.00 | 100.10 | 100.10 | |||||||||||||||||||||||||||
| February | 0.17 | 115.50 | 105.51 | 15.65 | 43.50 | 38.61 | 0.00 | 100.30 | 99.50 | |||||||||||||||||||||||||||
| March | 0.32 | 112.00 | 103.00 | 23.46 | 40.95 | 37.69 | 0.00 | 99.50 | 99.50 | |||||||||||||||||||||||||||
(1) Source: Lima Stock Exchange
(2) Source: Bloomberg; Yahoo Finance
| (1) | Source: Lima Stock Exchange |
| (2) | Source: Bloomberg; Yahoo Finance |
As of March 31, 2012,2013, the share capital with respect to the Common Shares was S/.2,748,899,240 represented by 274,889,924 shares and the share capital with respect to the Investment Shares was S/.7,446,400 represented by 744,640 shares. The Common Shares represent 100 percent of our outstanding share capital. The Investment Shares have no voting rights and are not, under Peruvian law and accounting rules, characterized as share capital. As of March 31, 2012,2013, there were 1,2141,210 owners of record of the Common Shares and 920918 owners of record of the Investment Shares.
B. Plan of Distribution
Not applicable.
C. Markets
The Common Shares and ADSs representing the Common Shares (each ADS representing two Common Shares) have been listed and traded on the New York Stock Exchange under the symbol “BVN.” In addition, the Common Shares and Investment Shares are listed and traded on the Lima Stock Exchange.
D. Selling Shareholders
Not applicable.
E. Dilution
Not applicable.
F. Expenses of the Issue
Not applicable.
| ITEM 10. | Additional Information |
A. Share Capital
Not applicable.
B. Memorandum and Articles of Association
Organization and Register
We were formed on September 7, 1953 by public deed as a Peruviansociedad anónima.However, in May of 1998, our By-laws were changed to conform with the new Peruvian Companies Law. The term of existence is indefinite and our principal place of business is Lima, Peru. We are registered under file number 02136988 at the Companies Registry of Lima.
We are managed by the General Meeting, the Board of Directors and the management.
Objectives and Purposes
Our legal purpose, as set forth in our Articles of Association and By-laws, is to engage in mining operations and related activities either directly or through majority-owned subsidiaries and controlled companies. Likewise, we may hold shares of companies performing mining operations.
Directors
The Board of Directors, which must be comprised of seven members, is elected at the Annual Obligatory Meeting. Any changes in the Board of Directors require the approval of the shareholders. The removal of the Board of Directors must be approved at a shareholders’ meeting, attended by holders of 75 percent of the Common Shares in the first summons and 70 percent of the Common Shares in the second summons, by resolution approved by at least two thirds of the total number of Common Shares outstanding. In the case of resignation of Directors, the Board of Directors may appoint substitute Directors who will serve until the next shareholders’ meeting.
Directors are elected as a group for a term of three years and may be reelected indefinitely. Pursuant to Article 29 of our By-laws, Directors are not required to be shareholders. The Board of Directors, in its first meeting after the Annual Obligatory Meeting during which elections are held, must choose from among its members a Chairman and a Vice Chairman. The Peruvian Companies Law requires that all companies (sociedades anónimas) provide for the representation of non-controlling shareholders on their Boards of Directors. To that effect, each of our Common Shares gives the holder the right to as many votes as there are directors to be elected. Each holder may pool his votes in favor of one person or distribute them among various persons. Those candidates for the Board who receive the most votes are elected directors.
The Board of Directors meets when called by the Chairman of the Board, who is appointed by the Board. The Board of Directors is validly convened when all Directors are present and unanimously agree to carry out the meeting for the purpose of transacting the business that has been proposed. Pursuant to Article 177 of the Peruvian Companies Law, Directors may be jointly and severally liable to us, the shareholders and third parties for their actions if they act with willful misconduct, gross negligence or abuse their powers. In addition, Article 3 of Law No. 29720, which has been in force since June 26, 2011, provides that directors and managers are liable for economic damages or any other kind of damages caused to us by any transaction we may enter into with them.
Our By-laws do not contain any provisions related to a director’s power to vote on matters in which the director is materially interested. However, Article 180 of the Peruvian Companies Law requires a director with an interest that conflicts with an interest of ours on a specific matter to disclose such interest to us and abstain from participating in the deliberation and decision of the said matter. A director that contravenes such requirement is liable for the damages suffered by us and can be removed by the Board of Directors or a shareholders’ meeting upon the request of any shareholder or any member of the Board.
Our By-laws also do not contain any provisions with respect to the power of the Directors to vote upon matters relating to their own compensation. Nevertheless, Article 30 of the By-laws requires that the Board of Directors receive compensation of no more than 4 percent of the profits of each fiscal year after making deductions for workers’ profit sharing, taxes, reinvestment of profits for tax benefits and legal reserves. This amount will be submitted for ratification by the General Meeting during the annual obligatory meeting, at which time it approves the statement of financial position, taxes, reinvestment of profits for tax benefits and legal reserves.
Our By-laws contain no provision relating to the directors’ power to borrow from us. However, Article 179 of the Peruvian Companies Law provides that directors of a company may enter into an agreement with such company only in the event that the agreement relates to operations the company performs in the regular course of business and in an arms-length transaction. Further, a company may provide a loan to a director or grant securities in his favor only in connection with operations that the company usually performs with third parties. Agreements, credits, loans or guarantees that do not meet the requirements set forth above require prior approval from at least two thirds of the members of the company’s Board of Directors. Directors are jointly liable to the company and the company’s creditors for contracts, credit, loans or securities executed or granted without complying with Article 179 of the Peruvian Companies Law. In addition, as mentioned above, Article 3 of Law No. 29720 provides that directors and managers are liable for economic or other damages we incur as a result of transactions we may enter into with them.
Neither our By-laws nor the Peruvian Companies Law contain age limit requirements for the retirement or non-retirement of directors.
Shares and Voting Rights
We have two classes of shares, the Common Shares and the Investment Shares. The Common Shares represent 100 percent of our outstanding share capital. The Investment Shares have no voting rights and are not, under Peruvian law and accounting rules, characterized as share capital. The Common Shares and the Investment Shares may be either physical share certificates in registered form or book-entry securities in the CAVALI ICLV S.A. book-entry settlement system, also in registered form.
Holders of Common Shares are entitled to one vote per share, with the exception of the election of the Board of Directors, where each such holder is entitled to one vote per share per nominee. Each holder’s votes may be cast all for a single nominee or distributed among the nominees at the holder’s discretion. Holders of Common Shares may attend and vote at shareholders’ meetings either in person or through a proxy. Additionally, holders of Common Shares have the right to participate in the distribution of dividends and shareholder equity resulting from liquidation. Our By-laws do not establish a maximum time limit for the payment of the dividends. However, according to Article 232 of the Peruvian Companies Law, the right to collect past-due dividends in the case of public companies that aresociedades anónimas abiertas, as we are, expires at 10 years from the date on which the payment was due in accordance with the dividend declaration.
Our share capital may be increased by holders of Common Shares at a shareholders’ meeting. Capital reductions may be voluntary or mandatory and must be approved by holders of Common Shares at a shareholders’ meeting. Capital reductions are mandatory when accumulated losses exceed 50 percent of capital to the extent such accumulated losses are not offset by accumulated earnings and capital increases within the following fiscal year. Capital increases and reductions must be communicated to the SMV, the Lima Stock Exchange and theSuperintendencia Nacional de Administración Tributaria (SUNAT) and published in the official gazette El Peruano and in a widely circulated newspaper in the city in which we are located.
The Investment Shares do not represent our stock obligations. Holders of Investment Shares are neither entitled to exercise voting rights nor to participate in shareholders’ meetings. However, Investment Shares confer upon the holders thereof the right to participate in the dividends distributed according to their nominal value, in the same manner as Common Shares.
Changes in the Rights of Shareholders
Our By-laws do not contain special provisions relating to actions necessary to change the rights of holders of the classes of shares. However, Article 88 of the Peruvian Companies Law establishes that all shares of a same class must have the same rights and obligations, and that in the event that we decide to establish different rights and obligations we must create a different class of shares, which creation will be agreed upon by the General Meeting in accordance with the requirements for modification of the By-laws. The Common Shares are the only class of shares representing 100 percent of our share capital, and, therefore, each Common Share has the same rights and obligations of each other Common Share. These requirements are described under “—Shares and Voting Rights” above.
The rights of any class of shares may not be reduced except in accordance with the Peruvian Companies Law.
Shareholders’ Meetings
Pursuant to Peruvian law and our By-Laws, the Annual Obligatory Meeting must be held during the three-month period after the end of each fiscal year. Additional General Meetings may be held during the year. Because we are asociedad anónima abierta, we are subject to the special control of the SMV, as provided in Article 253 of the Peruvian Companies Law. If we do not hold the Annual Obligatory Meeting during the three-month period after the end of each fiscal year or any other shareholders’ meeting required by the Peruvian Companies Law or our By-Laws, the SMV will directly, or at the request of at least one shareholder of the Common Shares, call for such a meeting, which will take place in a reasonable period of time. Other shareholders’ meetings are convened by the Board of Directors when deemed convenient for us or when it is requested by the holders of at least 5 percent of the Common Shares, provided that such Common Shares do not have their voting rights suspended. If, at the request of holders of 5 percent of the Common Shares, the shareholders’ meeting is not convened by the Board of Directors within 15 business days of the receipt of such request, or the Board expressly or implicitly refuses to convene the shareholders’ meeting, the SMV will call for such meeting after giving notice to the Board of such request. The Board is deemed to have implicitly refused to convene the meeting if the Board (a) does not convene a shareholders’ meeting within 15 business days of receipt of the request, (b) suspends or amends the terms of the agenda or the date of the meeting prescribed by the request or (c) schedules the shareholders’ meeting more than 4540 days after the date on which the summons is published. If the SMV calls for a shareholders’ meeting, the SMV will indicate the place, time and hour of the meeting, the agenda and the person who will preside. If it is a meeting other than the Annual Obligatory Meeting or a shareholders’ meeting required by the Peruvian Companies Law or theour By-Laws, the agenda will contain those matters requested by the shareholders who requested the meeting. Resolución CONASEV No. 111-2003-EF-94.10, as amended by Resolución CONASEV No. 016-2004-EF/94.10, Resolución CONASEV No. 015-2005-EF/94.10 and Resolución CONASEV No. 078-2010-EF/94.01.1, approved provisions related to the right of the non-controlling shareholders to obtain information regarding asociedad anónima abiertasuch as us and to request the SMV to call a shareholders’ meeting if it is not called by thesociedad anónima abierta upon request. Notwithstanding the notice requirements as described in the preceding two sentences, any shareholders’ meeting will be deemed called and legally installed, provided that the shareholders representing all of the voting shares are present, and provided that every present shareholder, whether or not such shareholder has paid the full price of such shareholder’s shares, agrees to hold the shareholders’ meeting and accepts the business to be discussed therein. Holders of Investment Shares have no right to request the Board to convene shareholders’ meetings.
Since we are asociedad anónima abierta, notice of shareholders’ meetings must be given by publication of a notice, with the publication occurring at least 25 days prior to any shareholders’ meeting, in El Peruano and in a widely circulated newspaper in the city in which we are located. The notice requirement may be waived at the shareholders’ meeting by holders of 100 percent of the outstanding Common Shares. According to Article 25 of theour By-Laws and Article 257 of the Peruvian Companies Law, shareholders’ meetings called for the purpose of considering a capital increase or decrease, the issuance of obligations, a change in theour By-Laws, the sale in a single act of assets with an accounting value that exceeds 50 percent of our capital stock, a merger, division, reorganization, transformation or dissolution, are subject to a first, second and third quorum call, each of the second and third quorum to occur upon the failure of the preceding one. A quorum for the first call requires the presence of shareholders holding 50 percent of our total voting shares. For the second call, the presence of shareholders holding at least 25 percent of our total voting shares constitutes a quorum, and for the third call there is no quorum requirement. These decisions require the approval of the majority of the voting shares represented at the shareholders’ meeting. General Meetings convened to consider all other matters are subject to a first and second quorum call, the second quorum call to occur upon the failure of the first quorum.
In the case of shareholders’ meetings called for the purpose of considering the removal of members of the Board of Directors, at least 75 percent and 70 percent of the total number of Common Shares outstanding are required to be represented at the shareholders’ meeting on the first quorum call and second quorum call respectively. Provided such quorum is attained, the affirmative vote of no less than two thirds of the total number of Common Shares outstanding is required to effect the removal of members of the Board of Directors. The special quorum and voting requirements described above cannot be modified at a shareholders’ meeting called for the purpose of considering the removal of members of the Board of Directors.
Under our By-Laws, the following actions are to be taken at the annual obligatory shareholders’ meetings: approval of our statements of financial position, profit and loss statements and annual reports; approval of management performance; allocation of profits; election of external auditors; election of the members of the Board of Directors; and any other matters submitted by the Board of Directors. The following actions are to be taken at the same annual shareholders’ meetings if the quorum and majority requirements are met or at any other shareholders’ meeting: any amendment of theour By-Laws; any decision to increase or reduce capital; any decision to issue debt; initiating investigations or requesting auditor’s reports; liquidating, spinning-off, merging, consolidating, dissolving, or changing our business form or structure.
In accordance with Article 21 of the By-laws, only those holders of Common Shares whose names are inscribed in the Share Register not less than 10 days in advance of a meeting will be entitled to attend shareholders’ meetings and to exercise their rights.
Limitations on the Rights of Nonresident or Foreign Shareholders
There are no limitations in our By-laws or the Peruvian Companies Law on the rights of nonresident or foreign shareholders to own securities or exercise voting rights on our securities.
Change in Control
There are no provisions in our By-laws that would have the effect of delaying, deferring or preventing a change in control.
Disclosure of Share Holdings
There are no provisions in our By-laws governing the ownership threshold above which share ownership must be disclosed. However, according to Regulation No. 009-2006-EF.94.10 of the SMV, which became effective on May 3, 2006, as amended by Regulation No. 020-2006-EF.94.10 and Regulation No. 05-2009-EF-94.01.1 of the SMV, when an individual or financial group acquires, in one act or various successive acts, a significant percentage (more than 25 percent) of the voting shares of a company, as well as upon any person or group increasing its ownership above the 50 percent and 60 percent thresholds, a procedure known asOferta Pública de Adquisición, or Takeover Bid, must be followed. This has the effect of alerting other shareholders and the market that an individual or financial group has acquired a significant percentage of a company’s voting shares, and gives other shareholders the opportunity to sell their shares at the price offered by the purchaser. The purchaser is obliged to launch a Takeover Bid unless it is exempt pursuant to Regulation No. 009-2006-EF.94.10 of the SMV as amended. The purchase of ADRs is exempted from the Takeover Bid unless the holders: (i) exercises the voting rights of the Common Shares underlying the ADSs evidenced by such ADRs, or (ii) requests the delivery of such underlying Common Shares. In addition, the SMV and the Lima Stock Exchange must be notified of any transfer of more than 5 percent of our paid-in capital.
Changes in Capital
Our By-laws do not establish special conditions for increases or reductions of capital that are more stringent than is required by the Peruvian Companies Law. Furthermore, the Peruvian Companies Law forbidssociedades anónimas abiertas, such as us, from including in their by-laws stipulations limiting the transfer of their shares or restraining their trading in other ways. We cannot recognize a shareholders’ agreement that contemplates limitations, restrictions or preferential rights on the transfer of shares, even if such agreement is recorded in our Share Register (matrícula de acciones) or in CAVALI.
C. Material Contracts
On December 2, 2009, Banco de Crédito del Peru, as lessor, executed a financial lease agreement with Conenhua, Huanza, as lessee, and us, as guarantor, in the amount of US$119 million for construction of a hydroelectric power station. The term of the lease is ten years and the interest rate is (i) LIBOR plus 4 percent from the first disbursement until six months after the start of commercial operation of the power station and (ii) LIBOR plus 4.1 percent from six months after the start of commercial operation of the power station until maturity. An English summary of the financial lease agreement is filed as Exhibit 4.2 of our Annual Report on Form 20-F for the year ended December 31, 2010.
D. Exchange Controls
Since August 1990, there have been no exchange controls in Peru and all foreign exchange transactions are based on free market exchange rates. Prior to August 1990, the Peruvian foreign exchange market consisted of several alternative exchange rates. Additionally, during the 1990s, the Peruvian currency has experienced a significant number of large devaluations, and Peru has consequently adopted, and operated under, various exchange rate control practices and exchange rate determination policies, ranging from strict control over exchange rates to market determination of rates. Current Peruvian regulations on foreign investment allow the foreign holders of equity shares of Peruvian companies to receive and repatriate 100 percent of the cash dividends distributed by such companies. Such investors are allowed to purchase foreign exchange at free market currency rates through any member of the Peruvian banking system and transfer such foreign currency outside Peru without restriction.
E. Taxation
The following summarizes the material Peruvian and United States tax consequences under present law of the purchase, ownership and disposition of ADSs or Common Shares. The discussion is not a full description of all tax considerations that may be relevant to a decision to purchase ADSs or Common Shares. In particular, this discussion deals only with holders that hold ADSs or Common Shares as capital assets and that have the U.S. Dollar as their functional currency. The summary does not address the tax treatment of certain investors that may be subject to special tax rules, such as banks, securities dealers, insurance companies, tax-exempt entities, persons that will hold ADSs or Common Shares as a position in a “straddle” or “conversion transaction” for tax purposes and holders of 10 percent or more of our voting shares. This discussion does not address any U.S. state or local taxes, the U.S. federal alternative minimum tax or the U.S. Medicare tax on net investment income. There is no tax treaty currently in effect between Peru and the United States, except for a treaty to exchange tax information. The information to be exchanged is defined in such treaty as any data or declaration that may be relevant or essential to the administration and application of taxes. Accordingly, the discussions below of Peruvian and U.S. tax considerations are based on the domestic law of each of Peru and the United States which are subject to change and possibly with retroactive effect.
As used herein, “Peruvian holder” means an owner of ADSs or Common Shares that is (i) an individual domiciled in Peru, (ii) a business entity created under the laws of Peru, or (iii) a Peruvian branch, agency or permanent establishment of a non-Peruvian individual or entity. “U.S. Holder” means a beneficial owner of ADSs or Common Shares that is (i) a United States citizen or resident, (ii) a domestic corporation or partnership, (iii) a trust subject to the control of a U.S. fiduciary and the primary supervision of a U.S. court or (iv) estate the income of which is subject to United States Federal income taxation regardless of its source.
Peruvian Tax Considerations
Cash Dividends and Other Distributions
Cash dividends paid with respect to Common Shares and amounts distributed with respect to ADSs are currently subject to a Peruvian withholding Income Tax, at a rate of 4.1 percent over the dividend paid, when the dividend is paid to shareholders that are: (i) individuals, whether resident or nonresident in Peru or (ii) nonresident entities. As a general rule, the distribution of additional Common Shares representing profits, distribution of shares which differ from the distribution of earnings or profits, as well as the distribution of preemptive rights with respect to Common Shares, which are carried out as part of a pro rata distribution to all shareholders, will not be subject to Peruvian Income Tax or withholding taxes.
Capital Gains
Pursuant to Article 6 of the Peruvian Income Tax Law, or the ITL, individuals and entities resident in Peru are subject to Peruvian Income Tax on their worldwide income while non-resident individuals or entities are subject to Peruvian Income Tax on their Peruvian source income only.
Furthermore, the ITL states that income deriving from the disposal of securities issued by Peruvian entities is considered Peruvian source income subject to the Income Tax.
With respect to this matter, Article 2 of the ITL, as amended by Legislative Decree 945, defines: (i) capital gains as any revenue deriving from the disposal of capital goods; and (ii) capital goods as those whose purpose is not to be traded in the regular course of a business. Moreover, Article 2 of the ITL states that income deriving from the disposal of shares and similar securities is considered a capital gain.
Accordingly, capital gains deriving from the disposal of securities are considered Peruvian source income subject to Peruvian Income Tax.
Currently, regardless of whether or not the transferor is domiciled in Peru, the ITL establishes that taxable income resulting from the disposal of securities is determined by the difference between the sale price of the securities and its tax basis. However, prior to December 31, 2009, capital gains resulting from the disposal of ADSs or Common Shares issued by legal entities incorporated in Peru were exempt from Peruvian Income Tax if: (i) in the case of non-regular individuals (i.e., individuals who do not frequently trade securities), the transaction was carried out prior to December 31, 2009; and (ii) in the case of shareholders other than individuals, the transaction was carried out on the Lima Stock Exchange (floor session) prior to December 31, 2009.
Effective January 1, 2010, the exemption was repealed and, as such, capital gains resulting from the disposal of ADSs or Common Shares issued by legal entities incorporated in Peru became subject to Peruvian Income Tax. For non-resident entities or individuals, capital gains will be subject to an Income Tax rate of either 5 percent or 30 percent, depending where the transaction takes place. If the transaction is consummated within Peru, the Income Tax rate is 5 percent; if the transaction is consummated outside of Peru, capital gains are taxed at a rate of 30 percent.
The ITL Regulations have defined transactions consummated within Peru to mean that the securities at issue are transferred through the Lima Stock Exchange. In contrast, the transaction is considered to have been consummated abroad when (i) the securities at issue are not registered on the Lima Stock Exchange or (ii) registered securities are not transferred through the Lima Stock Exchange.
ForPrior to December 31, 2012, for nonresident individuals, the first five Tax Units (approximately US$6,800) of capital gains deriving from the transfer of securities are exemptwere exempted from the Income Tax. However, ifEffective January 1, 2013, this exemption was repealed. If the transferor is a resident entity, capital gains deriving from the disposal of securities will be treated as any other taxable income subject to the 30 percent Corporate Income Tax rate.
Furthermore, prior to December 31, 2012, if the transferor iswas a resident individual, the first five Tax Units (approximately US$6,800) of capital gains deriving from the transfer of securities are exemptwere exempted from the Income Tax. The excessEffective January 1, 2013, such exemption was repealed. Any capital gain earned by a resident individual is subject to the 6.25five percent annual Income Tax rate regardless of whether or not the transaction is carried out on the Lima Stock Exchange and regardless of how many transactions are carried out by such individual. In this case, the 6.25five percent Income Tax rate will be applicable over the annual net capital gain, which is calculated by deducting from the annual gross capital gain the following (in the order listed): (i) the non-taxable income of approximately the first US$6,800; (ii) 20 percent of the annual gross capital gain and (iii) annual losses resulting from the disposal of shares during the same fiscal year.
Moreover, if the transferor, either a resident or nonresident individual or entity, acquired the ADSs or Common Shares that were exempt from the Income Tax before January 1, 2010, pursuant to a special provision of the ITL, the tax basis is the higher of: (i) the acquisition cost; (ii) the face or nominal value of the shares or (iii) the stock market value at closing on December 31, 2009.
If the transferor, whether resident or nonresident in Peru, acquires the ADSs or Common Shares on or after January 1, 2010, the tax basis is: (i) for shares purchased by the transferor, the acquisition price paid for the shares; (ii) for shares received by the transferor as a result of a capital stock increase because of a capitalization of net profits, the face or nominal value of such shares; (iii) for other shares received free of any payment, the stock market value of such shares if listed on the Lima Stock Exchange or, if not, the face or nominal value of such shares and (iv) for shares of the same type acquired at different opportunities and at different values, the tax basis will be the weighted average cost.
The aforementioned rules are also applicable to ADSs or Common Shares acquired before January 1, 2010 that were not exempt from the Income Tax as of December 31, 2009.
On December 31, 2010, Law No. 29645 was promulgated and took effect from January 1, 2011. This law states that in any transaction of Peruvian securities through the Lima Stock Exchange, CAVALI (the Peruvian clearing house) will act as withholding agent. As a result of this amendment, the nonresident will no longer have to self-assess and pay its Income Tax liability directly to the Peruvian Tax Administration.
Law No. 29645 has technically been intoin force since January 1, 2011. However, due to the fact that implementingImplementing regulations have not yet beenwere enacted forin July 2011, and CAVALI has not yet begun acting as a withholding agent.agent on November 1, 2011. As a result, with regard to securities transferred though the Lima Stock Exchange by a nonresident transferor subsequent to November 1, 2011, such nonresident transferor must stillis no longer obliged to self-assess and pay its Income Tax liability directly to Peruvian tax authorities within the first 12 working days following the month in which Peruvian source income was earned.
If the purchaser is resident in Peru and the sale is not performed through the Lima Stock Exchange, the purchaser will act as withholding agent.agent, except in cases in which the transferor is a resident individual.
However, if the transferor is a resident entity, such transferor is solely responsible for its Peruvian Income Tax on capital gains resulting from the disposal of ADSs or Common Shares, regardless of whether such securities are listed on the Lima Stock Exchange or elsewhere.
If the transferor is an individual domiciled in Peru and the sale is carried out through the Lima Stock Exchange, according to Law No. 29645, CAVALI will act as withholding agent. However, due to the fact that implementing regulations have not yet been enacted for 2011, CAVALI has not yet begun acting as a withholding agent. As a result, resident individual transferors are still required to pay Income Tax directly to the Peruvian tax authorities.
Other Considerations
No Peruvian estate or gift taxes are imposed on the gratuitous transfer of ADSs or Common Shares. No stamp, transfer or similar tax applies to any transfer of Common Shares, except for commissions payable by seller and buyer to the Lima Stock Exchange (0.15 percent of value sold), fees payable to the SMV (0.05 percent of value sold), brokers’ fees (about 0.05 percent to 1 percent of value sold) and Value Added Tax (at the rate of 18 percent) on commissions and fees. Any investor who sells its Common Shares on the Lima Stock Exchange will incur these fees and taxes upon purchase and sale of the Common Shares.
United States Federal Income Tax Considerations
Assuming the obligations contemplated by the Amended and Restated Deposit Agreement are being performed in accordance with its terms, holders of ADSs (or ADRs evidencing ADSs) generally will be treated for United States federal income tax purposes as the owners of the Common Shares represented by those ADSs.
Cash Dividends and Other Distributions
Cash dividends paid with respect to Common Shares or Common Shares represented by ADSs generally are includible in the gross income of a U.S. Holder as ordinary income. Dividends generally are treated as foreign source income. Dividends paid to a U.S. Holder that is a corporation are not eligible for the dividends received deduction available to corporations. Under current law, a maximum 1520 percent U.S. tax rate is imposed on the dividend income of an individual U.S. holder with respect to dividends paid by a domestic corporation or “qualified foreign corporation” if certain holding period requirements are met. A qualified foreign corporation generally includes a foreign corporation if (i) its shares are readily tradable on an established securities market in the U.S. or (ii) it is eligible for benefits under a comprehensive U.S. income tax treaty. Clause (i) will apply with respect to ADSs if such ADSs are readily tradable on an established securities market in the U.S. The ADSs are traded on the New York Stock Exchange. As a result, we believe that we should be treated as a qualified foreign corporation and, therefore, dividends paid to an individual U.S. holder with respect to ADSs for which the minimum holding period requirement is met should be taxed at a maximum rate of 1520 percent. The maximum 15 percent tax rate is effective with respect to dividends included in income during the period beginning on or after January 1, 2003, and ending December 31, 2012. Dividends paid in Nuevos Soles are includible in a United States dollar amount based on the exchange rate in effect on the date of receipt (which, in the case of ADSs, will be the date of receipt by the Depositary) whether or not the payment is converted into U.S. Dollars at that time. Any gain or loss recognized upon a subsequent sale or conversion of the Nuevos Soles for a different amount of U.S. Dollars will be United States source ordinary income or loss. Distributions to U.S. Holders of additional Common Shares or preemptive rights with respect to Common Shares that are made as part of a pro rata distribution to all of our shareholders generally will not be subject to United States federal income tax but in other circumstances may constitute a taxable dividend.
A U.S. Holder will be entitled to a foreign tax credit for Peruvian taxes imposed by withholding or otherwise, subject to generally applicable limitations and restrictions. In the case of U.S. individuals for whom the reduced rate of tax on dividends applies, such limitations and restrictions will appropriately take into account the rate differential under rules similar to section 904(b)(2)(B) of the Internal Revenue Code. The rules governing foreign tax credits are complex and U.S. Holders should consult their tax advisors regarding their application to the particular circumstances of such holder.
A non-U.S. Holder generally is not subject to United States Federal income or withholding tax on dividends paid with respect to Common Shares or Common Shares represented by ADSs, unless such income is effectively connected with the conduct by the non-U.S. Holder of a trade or business within the United States.
Capital Gains
U.S. Holders will recognize capital gain or loss on the sale or other disposition of ADSs or Common Shares (or preemptive rights with respect to such shares) held by the U.S. Holder or by the Depositary. U.S. Holders will not recognize gain or loss on deposits or withdrawals of Common Shares in exchange for ADSs or on the exercise of preemptive rights. Any gain recognized by a U.S. Holder generally will be treated as United States source income. Consequently, in the case of a disposition of Common Shares or ADSs in a transaction subject to Peruvian tax, the U.S. Holder may not be able to claim the foreign tax credit for any Peruvian tax imposed on the gain unless it has sufficient foreign source income from other sources against which it can apply the credit. Generally, gain or loss will be a long-term capital gain or loss if the U.S. Holder’s holding period for such Common Shares or ADSs exceeds one year. Long-term capital gain for an individual U.S. Holder is generally subject to a reduced rate of tax. With respect to sales occurring on or after May 6, 2003, but before January 1, 2013, the long-term capital gain tax rate for an individual U.S. Holder is 15 percent.
A non-U.S. Holder of ADSs or Common Shares will not be subject to United States income or withholding tax on gain from the sale or other disposition of ADSs or Common Shares unless (i) such gain is effectively connected with the conduct of a trade or business within the United States or (ii) the non-U.S. Holder is an individual who is present in the United States for at least 183 days during the taxable year of the disposition and certain other conditions are met.
Passive Foreign Investment Company
We believe that we are not and will not become a passive foreign investment company for United States Federal income tax purposes. A foreign corporation is a passive foreign investment company, or PFIC, in any taxable year in which, after taking into account the income and assets of certain subsidiaries pursuant to the applicable look-through rules, either (i) at least 75 percent of its gross income is passive income or (ii) at least 50 percent of the average value of its assets is attributable to assets that produce passive income or are held for the production of passive income.
If we were a PFIC in any year during which a U.S. Holder owned ADSs or Common Shares, we would not be treated as a “qualified foreign corporation” for purposes of qualifying dividends paid to a U.S. Holder for the preferential 1520 percent maximum U.S. tax rate noted above and the U.S. Holder would be subject to additional taxes on any excess distributions received from us and any gain realized from the sale or other disposition of ADSs or Common Shares (regardless of whether we continued to be a PFIC). A U.S. Holder has an excess distribution to the extent that distributions on ADSs or Common Shares during a taxable year exceed 125 percent of the average amount received during the three preceding taxable years (or, if shorter, the U.S. Holder’s holding period for the ADSs or Common Shares). To compute the tax on an excess distribution or any gain, (i) the excess distribution or the gain is allocated ratably over the U.S. Holder’s holding period for the ADSs or Common Shares, (ii) the amount allocated to the current taxable year is taxed as ordinary income and (iii) the amount allocated to other taxable years is taxed at the highest applicable marginal rate in effect for each year and an interest charge is imposed to recover the deemed benefit from the deferred payment of the tax attributable to each year.
If we were a PFIC, U.S. holders of interests in a holder of ADSs or Common Shares may be treated as indirect holders of their proportionate share of the ADSs or Common Shares and may be taxed on their proportionate share of any excess distribution or gain attributable to the ADSs or Common Shares. An indirect holder also must treat an appropriate portion of its gain on the sale or disposition of its interest in the actual holder as gain on the sale of the ADSs or Common Shares.
Information Reporting and Backup Withholding
Dividends in respect of the ADSs or Common Shares and the proceeds from the sale, exchange, or redemption of the ADSs or Common Shares may be reported to the United States Internal Revenue Service and a backup withholding tax may apply to such amounts unless the holder (i) is a domestic corporation (which may be required to establish its exemption by carrying its status on U.S. Internal Revenue Service Form W-9), (ii) in the case of a U.S. Holder other than a corporation, provides an accurate taxpayer identification number in the manner required by applicable law, (iii) in the case of a non-U.S. Holder, provides a properly executed U.S. Internal Revenue Service Form W-8BEN;W-8BEN, or other successor Form, or (iv) otherwise establishes a basis for exemption. The amount of any backup withholding from a payment to a U.S. Holder generally will be allowed as a credit against the U.S. Holder’s United States Federal income tax liability.
F. Dividends and Paying Agents
Not applicable.
G. Statement by Experts
Not applicable.
H. Documents on Display
We are subject to the informational requirements of Exchange Act. In accordance with these requirements, we file annual reports and other information to the SEC. These materials, including this Annual Report on Form 20-F and the exhibits hereto, may be inspected and copied at the SEC’s Public Reference Room at 100 F Street, N.E., Washington, D.C. 20549 and at the SEC’s regional offices at 175 W. Jackson Boulevard, Suite 900, Chicago, Illinois 60604, and 3 World Financial Center, Suite 400, New York, New York 10281-1022. Copies of the materials may be obtained from the Public Reference Room of the SEC at 100 F Street, N.E., Washington, D.C. 20549 at prescribed rates. The public may obtain information on the operation of the SEC’s Public Reference Room by calling the SEC in the United States at 1-800-SEC-0330. The SEC also maintains a web site athttp://www.sec.govthat contains reports, proxy statements and other information regarding registrants that file electronically with the SEC. Form 20-F reports and some of the other information submitted by us to the SEC may be accessed through this web site.
I. Subsidiary Information
Not applicable.
| ITEM 11. | Quantitative and Qualitative Disclosures About Market Risk |
The following discussion contains forward-looking statements that are subject to risks and uncertainties, many of which are outside of our control. Our primary market risks are related to fluctuations in the prices of gold, silver, zinc and lead. To a lesser extent, we are subject to market risk related to fluctuations in US$/Nuevo Sol exchange rates and to market risk related to interest rate fluctuation on our cash balances.
Commodity Contracts
Gold, silver, lead and copper hedging and sensitivity to market price
Our revenues and earnings are to a great extent influenced by world market prices for gold, copper, silver, zinc and lead that fluctuate widely and over which we have no control. We and our wholly-owned subsidiaries are completely unhedged as to the price at which our gold and silver will be sold. See “Item 3. Key Information—D. Risk Factors—Factors Relating to the Company—Our financial performance is highly dependent on the prices of gold, silver, copper and other metals.”
As of March 31, 2012,2013, we had no fixed price commitments for the sale of our metals. As of March 31, 2012,2013, we had no silver derivative contracts or gold convertible put option contracts in place.
As of March 31, 2012, all outstanding hedging transactions to which El Brocal is a party were non-delivery zero cost (Asian) option collars. Remaining hedging commitments amount to 18 percent of payable metal during 2012 on the following terms: 4,500 metric tons of copper at an average price range of US$7,500 to US$8,420 per metric ton.
Yanacocha and Cerro Verde have informed us that they have generally not engaged in, and are currently not engaged in, gold or copper price hedging activities, such as forward sales or option contracts, to minimize their exposure to fluctuations in the prices of gold or copper.
Normal Sales
We had no normal sales contracts with fixed or capped prices outstanding as of March 31, 2012.2013.
Foreign currency risk
We buy and sell our products and obtain capital facilities and investment in U.S. Dollars. The assets and liabilities in different currencies from the U.S. Dollar (Nuevos Soles) are not significant. We estimate that the future exchange rate fluctuations of Peruvian currency versus the U.S. Dollar will not significantly affect the results of our future operations.
Interest Rate Sensitivity
We reduce our exposure to the risks due to variations in interest rates by engaging in financial obligations and capital leasing with fixed interest rates. See Note 28 to the Financial Statements. Consequently, we do not use derivative instruments to manage this risk and we do not expect to incur significant losses based on interest risks.
| ITEM 12. | Description of Securities Other Than Equity Securities |
A. Debt Securities
Not applicable.
B. Warrants and Rights
Not applicable.
C. Other Securities
Not applicable.
D. American Depositary Shares
The Depositary collects its fees for delivery and surrender of ADSs directly from investors depositing shares or surrendering ADSs for the purpose of withdrawal or from intermediaries acting for them. The Depositary collects fees for making distributions to investors by deducting those fees from the amounts distributed or by selling a portion of distributable property to pay the fees. The Depositary may collect its annual fee for depositary services by deductions from cash distributions or by directly billing investors or by charging the book-entry system accounts of participants acting for them. The Depositary may generally refuse to provide fee-attracting services until its fees for those services are paid. The following table summarizes the fees and expenses payable by holders of ADSs:
| Persons depositing or withdrawing shares must pay: | For: | |
| US$5.00 (or less) per 100 ADSs (or portion of 100 ADSs) | • Issuance of ADSs, including issuances resulting from a distribution of shares or rights or other property | |
| • Cancellation of ADSs for the purpose of withdrawal, including if the deposit agreement terminates | ||
| A fee equivalent to the fee that would be payable if securities distributed to you had been shares and the shares had been deposited for issuance of ADSs | • Distribution of securities distributed to holders of deposited securities which are distributed by the depositary to ADS registered holders | |
| Registration or transfer fees | • Transfer and registration of shares on our share register to or from the name of the Depositary or its agent when you deposit or withdraw shares | |
| Expenses of the Depositary | • Cable, telex and facsimile transmissions (when expressly provided in the deposit agreement) | |
| • Converting foreign currency to U.S. Dollars | ||
| Taxes and other governmental charges the Depositary or the custodian have to pay on any ADS or share underlying an ADS, for example, stock transfer taxes, stamp duty or withholding taxes | • As necessary | |
| Any charges incurred by the Depositary or its agents for servicing the deposited securities | • As necessary |
Fees Incurred in Past Annual Period
From January 1, 20112012 to March 31, 2012,2013, we received no fees from the Depositary related to our ADR facility, including continuing annual stock exchange listing fees, standard out-of-pocket maintenance costs for the ADRs (consisting of the expenses of postage and envelopes for mailing annual and interim financial reports, printing and distributing dividend checks, electronic filing of U.S. Federal tax information, mailing required tax forms, stationery, postage, facsimile, and telephone calls), any applicable performance indicators relating to the ADR facility, underwriting fees and legal fees.
Fees to be Paid in the Future
The Depositary has agreed to reimburse us for expenses we incur that are related to establishment and maintenance expenses of the ADS program. The Depositary has agreed to reimburse us for our continuing annual stock exchange listing fees. The Depositary has also agreed to pay the standard out-of-pocket maintenance costs for the ADRs, which consist of the expenses of postage and envelopes for mailing annual and interim financial reports, printing and distributing dividend checks, electronic filing of U.S. Federal tax information, mailing required tax forms, stationery, postage, facsimile, and telephone calls. It has also agreed to reimburse us annually for certain investor relationship programs or special investor relations promotional activities. In certain instances, the Depositary has agreed to provide additional payments to us based on any applicable performance indicators relating to the ADR facility. There are limits on the amount of expenses for which the Depositary will reimburse us, but the amount of reimbursement available to us is not necessarily tied to the amount of fees the Depositary collects from investors.
The Depositary collects its fees for delivery and surrender of ADSs directly from investors depositing shares or surrendering ADSs for the purpose of withdrawal or from intermediaries acting for them. The Depositary collects fees for making distributions to investors by deducting those fees from the amounts distributed or by selling a portion of distributable property to pay the fees. The Depositary may collect its annual fee for depositary services by deduction from cash distributions or by directly billing investors or by charging the book-entry system accounts of participants acting for them. The Depositary may generally refuse to provide fee-attracting services until its fees for those services are paid.
PART II
| ITEM 13. | Defaults, Dividend Arrearages and Delinquencies |
Not applicable.
| ITEM 14. | Material Modifications to the Rights of Security Holders and Use of Proceeds |
Not applicable.
| ITEM 15. | Controls and Procedures |
Evaluation of Disclosure Controls and Procedures
As of December 31, 2011,2012, we carried out an evaluation under the supervision and with the participation of our management, including our Chief Executive Officer and Chief Financial Officer, of the effectiveness of the design and operation of our disclosure controls and procedures. There are inherent limitations to the effectiveness of any system of disclosure controls and procedures, including the possibility of human error and the circumvention or overriding of the controls and procedures. Accordingly, even effective disclosure controls and procedures can only provide reasonable assurance of achieving their control objectives. Based upon and as of the date of our evaluation, our Chief Executive Officer and Chief Financial Officer concluded that the disclosure controls and procedures are effective to provide reasonable assurance that information required to be disclosed in the reports we file and submit under the Exchange Act is recorded, processed, summarized and reported as and when required.
Management’s Annual Report on Internal Control over Financial Reporting
Our management is responsible for establishing and maintaining adequate internal control over financial reporting. Internal control over financial reporting is a process designed to provide reasonable assurance regarding the reliability of financial reporting and the preparation of financial statements for external reporting purposes in accordance with generally accepted accounting principles. Because of its inherent limitations, internal control over financial reporting may not prevent or detect misstatements. Our management has assessed the effectiveness of our internal control over financial reporting as of December 31, 2011.2012. In making its assessment, management has utilized the criteria set forth by the Committee of Sponsoring Organizations (COSO) of the Treadway Commission inInternal Control—Integrated Framework.Our management concluded that based on its assessment, our internal control over financial reporting was effective as of December 31, 2011.
2012.
Our independent registered public accounting firm, Medina, Zaldívar, Paredes & Asociados, has issued an attestation report on our internal control over financial reporting, which is included below.
Attestation Report of the Independent Registered Public Accounting Firm
To the Board of Directors and Shareholders ofCompañía de Minas Buenaventura S.A.A.
We have audited Compañía de Minas Buenaventura S.A.A.’s internal control over financial reporting as of December 31, 2011,2012, based on criteria established in Internal Control - Integrated Framework issued by the Committee of Sponsoring Organizations of the Treadway Commission (the COSO criteria). Compañía de Minas Buenaventura S.A.A.’s management is responsible for maintaining effective internal control over financial reporting, and for its assessment of the effectiveness of internal control over financial reporting included in the accompanying Management’s report. Our responsibility is to express an opinion on the company’s internal control over financial reporting based on our audit.
We conducted our audit in accordance with the standards of the Public Company Accounting Oversight Board (United States). Those standards require that we plan and perform the audit to obtain reasonable assurance about whether effective internal control over financial reporting was maintained in all material respects. Our audit included obtaining an understanding of internal control over financial reporting, assessing the risk that a material weakness exists, testing and evaluating the design and operating effectiveness of internal control based on the assessed risk, and performing such other procedures as we considered necessary in the circumstances. We believe that our audit provides a reasonable basis for our opinion.
A company’s internal control over financial reporting is a process designed to provide reasonable assurance regarding the reliability of financial reporting and the preparation of financial statements for external purposes in accordance with generally accepted accounting principles. A company’s internal control over financial reporting includes those policies and procedures that (1) pertain to the maintenance of records that, in reasonable detail, accurately and fairly reflect the transactions and dispositions of the assets of the company; (2) provide reasonable assurance that transactions are recorded as necessary to permit preparation of financial statements in accordance with generally accepted accounting principles, and that receipts and expenditures of the company are being made only in accordance with authorizations of management and directors of the company; and (3) provide reasonable assurance regarding prevention or timely detection of unauthorized acquisition, use, or disposition of the company’s assets that could have a material effect on the financial statements.
Because of its inherent limitations, internal control over financial reporting may not prevent or detect misstatements. Also, projections of any evaluation of effectiveness to future periods are subject to the risk that controls may become inadequate because of changes in conditions, or that the degree of compliance with the policies or procedures may deteriorate.
In our opinion, Compañía de Minas Buenaventura S.A.A. and subsidiaries maintained, in all material respects, effective internal control over financial reporting as of December 31, 2011,2012, based on the COSO criteria.
We also have audited, in accordance with the standards of the Public Company Accounting Oversight Board (United States), the consolidated statement of financial position of Compañía de Minas Buenaventura S.A.A. and subsidiaries as of December 31, 20112012 and 2010,2011, and the related consolidated statements of income, shareholders’ equity, and cash flows for each of the twothree years in the period ended December 31, 20112012 of Compañía de Minas Buenaventura S.A.A. and subsidiaries and our report dated April 30, 2012,2013, expressed an unqualified opinion thereon.
/S/ MEDINA, ZALDIVAR, PAREDES & ASOCIADOS
Countersigned by:
/S/ MARCO ANTONIO ZALDÍVAR
Marco Antonio Zaldívar
C.C.P.A. Register No. 12477
Lima, Peru
April 30, 20122013
Changes in Internal Control Over Financial Reporting
There has been no change in our internal control over financial reporting during 20112012 that has materially affected, or is reasonably likely to materially affect, our internal control over financial reporting.
| ITEM 16A. | Audit Committee Financial Expert |
The Board of Directors has determined that Mr. Luis ColeridgeGerman Suárez is the Audit Committee financial expert as defined in Item 16A of Form 20-F. The Board of Directors has also determined that Mr. Coleridge andSuárezand each of the other members of the Audit Committee are “independent directors” as defined in Section 303A.02 of the NYSE’s Listed Company Manual.
| ITEM 16B. | Code of Ethics |
We have adopted a written code of business conduct and ethics that applies to our principal executive officer, principal financial officer, principal accounting officer and controller, or persons performing similar functions, as well as all other employees. Our code of business conduct and ethics is posted on, and within five days following the date of any amendment or waiver we intend to disclose any amendments to or waivers from our code of business conduct and ethics on, our website, which is located athttp://www.buenaventura.com. The information on our website is not a part of, nor incorporated into, this document.
| ITEM 16C. | Principal Accountant Fees and Services |
The Audit Committee proposed at the General Meeting that Medina, Zaldívar, Paredes & Asociados, a member firm of Ernst & Young Global, be elected as the independent auditor for 2011.2012. Medina, Zaldívar, Paredes & Asociados has served as our independent public accountant for each of the fiscal years in the two-year period ended December 31, 20102011 and 2011,2012, for which audited financial statements appear in this annual report on Form 20-F.
The following table presents the aggregate fees for professional services and other services rendered by Medina, Zaldívar, Paredes & Asociados for 20102011 and 2011.2012.
| Year ended December 31, | Year ended December 31, | |||||||||||||||
| 2010 | 2011 | 2011 | 2012 | |||||||||||||
| Audit Fees | US$ | 906,982 | US$ | 1,124,451 | US$ | 1,124,451 | US$ | 1,002,413 | ||||||||
| Tax Fees | US$ | 214,179 | US$ | 213,764 | US$ | 213,764 | US$ | 362,832 | ||||||||
| Total | US$ | 1,121,161 | US$ | 1,338,215 | US$ | 1,338,215 | US$ | 1,365,245 | ||||||||
Audit Fees. Audit fees in the above table are the aggregate fees billed by Medina, Zaldívar, Paredes & Asociados in connection with the audit of our annual financial statements, the review of our quarterly financial statements and statutory and regulatory audits. In addition, the amounts in the above table includes fees that were incurred in connection with the audit of internal control over financial reporting in 20102011 and 2011.2012.
Tax Fees. Tax fees in the above table are fees billed by Medina, Zaldívar, Paredes & Asociados in connection with review of income tax filings, transfer pricing studies and tax consultations.
Audit Committee Pre-approval Policies and Procedures
Our Audit Committee is responsible for the oversight of the independent auditor. The Audit Committee has adopted a policy regarding pre-approval of audit services provided by our independent auditors, or the Policy. In accordance with the Policy, the Audit Committee must pre-approve the provision of services by our independent auditor for all audit and non-audit services prior to commencement of the specified service. The requests for pre-approval are submitted to the Audit Committee by the Chief Financial Officer and following approval by audit committee members an engagement letter is executed. The Audit Committee approved all audit and tax fees in 2011.2012.
| ITEM 16D. | Exemptions from the Listing Standards for Audit Committees |
Not applicable.
| ITEM 16E. | Purchases of Equity Securities by the Issuer and Affiliated Purchasers |
For the year ended December 31, 2011,2012, neither we nor any person acting on our behalf made any purchase of our Common Shares.
| ITEM 16F. | Change in Registrant’s Certifying Accountant |
None.
| ITEM 16G. | Corporate Governance |
There are significant differences in the corporate governance practices followed by us as compared to those followed by United States domestic companies under the New York Stock Exchange, or NYSE, listing standards. The NYSE listing standards provide that the board of directors of a United States domestic listed company must consist of a majority of independent directors and that certain committees must consist solely of independent directors. Under Peruvian corporate governance practices, a Peruvian company is not required to have a majority of the members of the board of directors be independent.
The listing standards for the NYSE also require that United States domestic companies have an audit committee, a nominating/corporate governance committee and a compensation committee. Each of these committees must consist solely of independent directors and must have a written charter that addresses certain matters specified in the listing standards. Peruvian corporate governance practices permit the Board of Directors of a Peruvian company to form special governance bodies in accordance with the needs of such company and do not require that these special governance bodies be composed partially or entirely of independent directors. We maintain three committees, which include the Audit Committee, the Compensation Committee and the Nominating/Corporate Governance Committee. Our Board of Directors has determined that our Audit Committee is composed entirely of independent directors, as defined in the NYSE’s Listed Company Manual.
The NYSE’s listing standards also require United States domestic companies to adopt and disclose corporate governance guidelines. In July 2002, the SMV and a committee comprised of regulatory agencies and associations prepared and published a list of suggested corporate governance guidelines called “Principles of Good Governance for Peruvian Companies.” These principles are disclosed on the SMV’s website athttp://www.smv.gob.pe. Our code of business conduct and ethics establishes our principles of good corporate governance and, as indicated in “Item 16B. Code of Ethics,” is posted on our website.
| ITEM 16H. | Mine Safety Disclosure |
Not applicable.
PART III
| ITEM 17. | Financial Statements |
Not applicable.
| ITEM 18. | Financial Statements |
Please refer to Item 19. |
| ITEM 19. | Exhibits |
| Page | |||
| (a) | Index to Financial Statements and Schedules | ||
| COMPAÑIA DE MINAS BUENAVENTURA S.A.A. AND SUBSIDIARIES | |||
| MINERA YANACOCHA S.R.L. | |||
| SOCIEDAD MINERA CERRO VERDE S.A.A. | |||
| (b) | Index to Exhibits | ||
| 1.1 | By-Laws (Estatutos) of Compañía de Minas Buenaventura S.A.A., as amended April 30, 2002 (incorporated by reference from Compañía de Minas Buenaventura S.A.A. Annual Report on Form 20-F for the year ended December 31, 2002, filed on June 25, 2003). | ||
| 1.2 | By-Laws (Estatutos) of Minera Yanacocha S.R.L., as amended October 18, 1999 (incorporated by reference from Compañía de Minas Buenaventura S.A.A. Annual Report on Form 20-F for the year ended December 31, 2002, filed on June 25, 2003). | ||
| 4.1 | Shareholders Agreement among SMM Cerro Verde Netherlands B.V., Sumitomo Metal Mining Co., Ltd., Sumitomo Corporation, Summit Global Management B.V., Compañía de Minas Buenaventura S.A.A., Cyprus Climax Metals Company, Phelps Dodge Corporation and Sociedad Minera Cerro Verde S.A.A., dated June 1, 2005 (incorporated by reference from Compañía de Minas Buenaventura S.A.A. Annual Report on Form 20-F for the year ended December 31, 2005, filed on June 6, 2006). | ||
| 4.2 | English Summary of the Financial Lease Agreement (Arrendamiento Financiero), dated as of December 2, 2009, by and among Banco de Crédito del Peru, as lessor, Compañía de Minas Buenaventura S.A.A., as guarantor, Empresa de Generación de Huanza, S.A., as lessee, and Consorcio Energético Huancavelica S.A. (incorporated by reference from Compañía de Minas Buenaventura S.A.A. Annual Report on Form 20-F for the year ended December 31, 2010, filed on June 28, 2011). | ||
| 11 | Code of Conduct and Ethics (incorporated by reference from Compañía de Minas Buenaventura S.A.A. Annual Report on Form 20-F for the year ended December 31, 2002, filed on June 25, 2003). | ||
| 12.1 | Certification of Chief Executive Officer of Compañía de Minas Buenaventura S.A.A. pursuant to Section 302 of the Sarbanes-Oxley Act of 2002.† | ||
| 12.2 | Certification of Chief Financial Officer of Compañía de Minas Buenaventura S.A.A. pursuant to Section 302 of the Sarbanes-Oxley Act of 2002.† | ||
| 13.1 | Certification of Chief Executive Officer of Compañía de Minas Buenaventura S.A.A. pursuant to Section 906 of the Sarbanes-Oxley Act of 2002.† | ||
| 13.2 | Certification of Chief Financial Officer of Compañía de Minas Buenaventura S.A.A. pursuant to Section 906 of the Sarbanes-Oxley Act of 2002.† | ||
† Filed herewith.
SIGNATURE
The registrant hereby certifies that it meets all of the requirements for filing on Form 20-F and that it has duly caused and authorized the undersigned to sign this annual report on its behalf.
| COMPAÑÍA DE MINAS BUENAVENTURA S.A.A. | ||
| By: | /s/ | |
| Carlos E. Gálvez Pinillos | ||
| Chief Financial Officer | ||
Dated: April 30, 20122013
Exhibit Index
| Exhibit No. | Document Description | |
| 1.1 | By-Laws (Estatutos) of Compañía de Minas Buenaventura S.A.A., as amended April 30, 2002 (incorporated by reference from Compañía de Minas Buenaventura S.A.A. Annual Report on Form 20-F for the year ended December 31, 2002, filed on June 25, 2003). | |
| 1.2 | By-Laws (Estatutos) of Minera Yanacocha S.R.L., as amended October 18, 1999 (incorporated by reference from Compañía de Minas Buenaventura S.A.A. Annual Report on Form 20-F for the year ended December 31, 2002, filed on June 25, 2003). | |
| 4.1 | Shareholders Agreement among SMM Cerro Verde Netherlands B.V., Sumitomo Metal Mining Co., Ltd., Sumitomo Corporation, Summit Global Management B.V., | |
| English Summary of the Financial Lease Agreement | ||
| 11 | Code of Conduct and Ethics (incorporated by reference from Compañía de Minas Buenaventura S.A.A. Annual Report on Form 20-F for the year ended December 31, 2002, filed on June 25, 2003). | |
| 12.1 | Certification of Chief Executive Officer of Compañía de Minas Buenaventura S.A.A. pursuant to Section 302 of the Sarbanes-Oxley Act of 2002.† | |
| 12.2 | Certification of Chief Financial Officer of Compañía de Minas Buenaventura S.A.A. pursuant to Section 302 of the Sarbanes-Oxley Act of 2002.† | |
| 13.1 | Certification of Chief Executive Officer of Compañía de Minas Buenaventura S.A.A. pursuant to Section 906 of the Sarbanes-Oxley Act of 2002.† | |
| 13.2 | Certification of Chief Financial Officer of Compañía de Minas Buenaventura S.A.A. pursuant to Section 906 of the Sarbanes-Oxley Act of 2002.† |
† Filed herewith.
Index to the Financial Statements
| Page | ||
| Compañía de Minas Buenaventura S.A.A. and | subsidiaries | |
| Report of Independent Registered Public Accounting Firm | F-3 | |
| Consolidated Statement of Financial Position as of December 31, | ||
| Consolidated Income Statement for the years ended December 31, 2010, 2011 and | ||
| Consolidated Statement of Comprehensive Income for the years ended December 31, 2010, 2011 and | ||
| Consolidated Statement of Changes in Shareholders’ Equity for the years ended December 31, 2010, 2011 and | ||
| Consolidated Statement of Cash Flows for the years ended December 31, 2010, 2011 and | F-10 | |
| Notes to the Consolidated Financial Statements | ||
| Minera Yanacocha S.R.L. | ||
| Report of the Independent Registered and Certified Public Accounting Firm | ||
| Consolidated Statements of Income and Comprehensive Income | ||
| Consolidated Statements of Cash Flows | ||
| Consolidated Balance Sheets | ||
| Consolidated Statements of Changes in Partners’ Equity | ||
| Notes to the Consolidated Financial Statements | ||
| Sociedad Minera Cerro Verde S.A.A. | ||
| Report of Independent Registered Public Accounting Firm | ||
| Statement of Financial Position | ||
| Statements of Comprehensive Income | ||
| Statements of Changes in Equity | F-148 | |
| Statements of Cash Flows | ||
| Notes to the Financial Statements |
| F-1 |
Compañía de Minas Buenaventura S.A.A. and Subsidiaries
Consolidated Financial Statements as of December 31, 2011, 2010 and as of January 1, 2010, together with the Report of Independent Registered Public Accounting Firm
Contents
| Compañía de Minas Buenaventura S.A.A. and Subsidiaries | ||
| Consolidated Financial Statements as of December 31, 2012, 2011 and 2010, together with the Report of Independent Registered Public Accounting Firm | ||
| Contents | ||
| Report of Independent Registered Public Accounting Firm | F-3 | |
| Consolidated Statement of Financial Position as of December 31, 2011 and 2012 | ||
| Consolidated Income Statement for the years ended December 31, 2010, 2011 and 2012 | ||
| Consolidated Statement of Comprehensive Income for the years ended December 31, 2010, 2011 and 2012 | ||
| Consolidated Statement of | ||
| Consolidated Statement of Cash Flows | for the years ended December 31, 2010, 2011 and 2012 | F-10 |
| Notes to the Consolidated Financial Statements | ||
| F-2 |
Report of Independent Registered Public Accounting Firm
| ERNST & YOUNG | Medina, Zaldivar, Paredes | |
| & Asociados Sociedad Civil |
To the Board of Directors and Shareholders of Compañía de Minas Buenaventura S.A.A.
We have audited the accompanying consolidated financial statements of Compañía de Minas Buenaventura S.A.A. (a Peruvian corporation) and Subsidiaries (together the “Company”), which comprise the consolidated statement of financial position as of December 31, 20112012 and 2010 and as of January 1, 2010,2011, and the related consolidated income statement, statement of comprehensive income, statement of changes in shareholders’ equity and statement of cash flows for the years ended December 31, 2012 , 2011 and 2010, and a summary of significant accounting policies and other explanatory notes.2010. These consolidated financial statements are the responsibility of the Company’sCompany's Management. Our responsibility is to express an opinion on these consolidated financial statements based on our audit. We have not audited the financial statements for each of the years ended December 31, 2012, 2011 2010 and 20092010 of Minera Yanacocha S.R.L (an associate in which the Company has a 43.65% interest through its subsidiary, Compañía Minera Condesa S.A.). Those statements were audited by other auditors whose reports were furnished to us and our opinion, insofar as it relates to the amounts included for Minera Yanacocha S.R.L., is based solely on the reports of the other auditors. In the consolidated financial statements of the Company, the investment on the statement of financial position amounts to US$1,312.1, US$1,033.01,585.4 and US$781.01,312.1 million as of December 31, 2011, 20102012 and 2009,2011, respectively; and the share in the net income of this entity amounts to US$272.9, US$279.7, and US$251.5 million for the years ended December 31, 2012, 2011 and 2010, respectively.
We conducted our audits in accordance with the standards of the Public Company Accounting Oversight Board (United States). Those standards require that we plan and perform the audit to obtain reasonable assurance about whether the consolidated financial statements are free fromof material misstatement. An audit includes examining, on a test basis, evidence supporting the amounts and disclosures in the financial statements. An audit also includes assessing the accounting principles used and significant estimates made by management,Management, as well as evaluating the overall financial statement presentation. We believe that our audits and the reports of the other auditors provide a reasonable basis for our opinion.
In our opinion, based on our audit and the reports of other auditors on Minera Yanacocha S.R.L., the consolidated financial statements referred to above present fairly, in all material respects, the consolidated financial position of Compañía de Minas Buenaventura S.A.A. and Subsidiaries as of December 31, 2012 and 2011, their results of operations and 2010 and as of January 1, 2010 and its financial performance and itstheir cash flows for each of the years then ended on December 31, 2012, 2011 and 2010, in accordance with International Financial Reporting Standards as issued by the International Accounting Standards Board (IASB).
We also have audited, in accordance with the standards of the Public Company Accounting Oversight Board (United States), Compañía de Minas Buenaventura S.A.A.’s´s internal control over financial reporting as of December 31, 2011,2012, based on criteria established in Internal Control - Integrated Framework issued by the Committee of Sponsoring Organizations of the Treadway Commission and our report dated April 30, 20122013 expressed an unqualified opinion thereon.
Lima, Peru,
April 30, 20122013
/s/ Medina, Zaldivar, Paredes & Asociados
Countersigned by:
/s/ Marco Antonio Zaldívar
Marco Antonio Zaldívar
C.P.C.A. Register No.12477
Compañía de Minas Buenaventura S.A.A. and Subsidiaries
Consolidated Statement of Financial Position
As of December 31, 2011, 20102012 and as of January 1, 20102011
| As of | ||||||||||||||||
| January 1, | ||||||||||||||||
| Note | 2011 | 2010 | 2010 | |||||||||||||
| US$(000) | US$(000) | US$(000) | ||||||||||||||
| Asset | ||||||||||||||||
| Current asset | ||||||||||||||||
| Cash and cash equivalents | 5(a) | 480,968 | 600,796 | 714,454 | ||||||||||||
| Financial assets at fair value through profit or loss | 6 | 52,178 | 50,154 | - | ||||||||||||
| Trade accounts receivable, net | 7(a) | 172,569 | 160,928 | 122,950 | ||||||||||||
| Other accounts receivable | 8(a) | 48,521 | 42,218 | 20,478 | ||||||||||||
| Accounts receivable from associates | 32(c) | 47,425 | 18,903 | 21,866 | ||||||||||||
| Embedded derivatives for concentrates sales, net | 28(c) | - | 13,645 | 4,546 | ||||||||||||
| Derivative financial instruments | 28(a) | 1,283 | - | - | ||||||||||||
| Inventory, net | 9(a) | 149,108 | 82,332 | 40,354 | ||||||||||||
| Prepaid expenses | 16,234 | 2,990 | 8,236 | |||||||||||||
| Total current asset | 968,286 | 971,966 | 932,884 | |||||||||||||
| Other accounts receivable | 8(a) | 5,570 | 14,425 | 12,244 | ||||||||||||
| Other accounts receivable from associates | 32(c) | 32,262 | 20,736 | - | ||||||||||||
| Long-term inventory | 9(a) | 48,845 | 27,160 | 4,492 | ||||||||||||
| Investment in associates | 10(a) | 1,935,004 | 1,429,678 | 1,151,039 | ||||||||||||
| Mining concessions, development cost and property, plant and equipment, net | 11(a) | 830,997 | 635,236 | 463,857 | ||||||||||||
| Deferred income tax asset, net | 25(a) | 125,538 | 174,050 | 202,331 | ||||||||||||
| Other assets | 7,047 | 6,095 | 5,045 | |||||||||||||
| Total assets | 3,953,549 | 3,279,346 | 2,771,892 | |||||||||||||
| Liabilities and shareholders’ equity, net | ||||||||||||||||
| Current liability | ||||||||||||||||
| Trade accounts payable | 13 | 142,375 | 91,374 | 61,357 | ||||||||||||
| Income tax payable | 36,423 | 27,125 | 20,528 | |||||||||||||
| Other accounts payable | 14 | 41,150 | 50,147 | 32,794 | ||||||||||||
| Provisions | 15 | 91,287 | 65,855 | 51,252 | ||||||||||||
| Other accounts payable to associates | 32(c) | 883 | 1,584 | - | ||||||||||||
| Embedded derivatives for concentrates sales, net | 28(c) | 7,306 | - | - | ||||||||||||
| Derivative financial instruments | 28(a) | - | 16,291 | 1,468 | ||||||||||||
| Financial obligations | 16(a) | 1,042 | 2,018 | 79,452 | ||||||||||||
| Total current liabilities | 320,466 | 254,394 | 246,851 | |||||||||||||
| Other non-current provisions | 15 | 86,528 | 116,214 | 102,008 | ||||||||||||
| Other accounts payable to associates | 32(c) | 1,004 | 1,370 | - | ||||||||||||
| Financial obligations | 16(a) | 105,072 | 55,134 | 150,555 | ||||||||||||
| Derivative financial instruments | 28(a) | - | 6,897 | 5,375 | ||||||||||||
| Total liability | 513,070 | 434,009 | 504,789 | |||||||||||||
| As of | ||||||||||||||||
| January 1, | ||||||||||||||||
| Note | 2011 | 2010 | 2010 | |||||||||||||
| US$(000) | US$(000) | US$(000) | ||||||||||||||
| Shareholders’ equity, net | 17 | |||||||||||||||
| Capital stock, net of treasury shares for US$62,622,000 in 2011, 2010 and as of January 1, 2010 | 750,540 | 750,540 | 750,540 | |||||||||||||
| Investment shares, net of treasury shares for US$142,000 in 2011, 2010 and as of January 1, 2010 | 2,019 | 2,019 | 2,019 | |||||||||||||
| Additional paid-in capital | 225,978 | 225,978 | 225,978 | |||||||||||||
| Legal reserve | 162,639 | 162,633 | 112,363 | |||||||||||||
| Other reserves | 269 | 269 | 269 | |||||||||||||
| Retained earnings | 2,034,768 | 1,471,012 | 974,818 | |||||||||||||
| Cumulative unrealized, gain (loss) | 2,068 | (5,906 | ) | (1,404 | ) | |||||||||||
| 3,178,281 | 2,606,545 | 2,064,583 | ||||||||||||||
| Non-controlling interest | 262,198 | 238,792 | 202,520 | |||||||||||||
| Total shareholders’ equity, net | 3,440,479 | 2,845,337 | 2,267,103 | |||||||||||||
| Total liabilities and shareholders’ equity, net | 3,953,549 | 3,279,346 | 2,771,892 | |||||||||||||
| Note | 2012 | 2011 | ||||||||
| US$(000) | US$(000) | |||||||||
| Asset | ||||||||||
| Current asset | ||||||||||
| Cash and cash equivalents | 4(a) | 186,712 | 480,968 | |||||||
| Financial assets at fair value through profit or loss | 5 | 54,509 | 52,178 | |||||||
| Trade accounts receivable, net | 6(a) | 256,431 | 172,569 | |||||||
| Other accounts receivable | 7 | 108,568 | 48,521 | |||||||
| Accounts receivable from associates | 31(c) | 22,534 | 47,425 | |||||||
| Hedge derivative financial instruments | 27(a) | - | 1,283 | |||||||
| Inventory, net | 8(a) | 163,067 | 149,108 | |||||||
| Prepaid expenses | 11,837 | 16,234 | ||||||||
| Total current asset | 803,658 | 968,286 | ||||||||
| Other accounts receivable | 7 | 6,702 | 5,570 | |||||||
| Accounts receivable from associates | 31(c) | 33,377 | 32,262 | |||||||
| Long-term inventory | 8(a) | 55,937 | 48,845 | |||||||
| Investment in associates | 9(a) | 2,436,237 | 1,935,004 | |||||||
| Mining concessions, development costs, property, plant and equipment, net | 10(a) | 1,134,276 | 830,997 | |||||||
| Deferred income tax asset, net | 24(a) | 113,343 | 125,538 | |||||||
| Other assets | 5,123 | 7,047 | ||||||||
| Total assets | 4,588,653 | 3,953,549 | ||||||||
The accompanying notes are an integral part of this statement.consolidated statement of financial position.
| Note | 2012 | 2011 | ||||||||
| US$(000) | US$(000) | |||||||||
| Liabilities and shareholders’ equity, net | ||||||||||
| Current liability | ||||||||||
| Trade accounts payable | 12 | 199,551 | 142,375 | |||||||
| Accounts payable to associates | 31(c) | 890 | 883 | |||||||
| Other accounts payable | 13 | 59,096 | 41,150 | |||||||
| Provisions | 14 | 71,780 | 91,287 | |||||||
| Embedded derivatives for purchase and sale of concentrates, net | 27(c) | 4,939 | 7,306 | |||||||
| Income tax payable | 7,935 | 36,423 | ||||||||
| Financial obligations | 15(a) | 5,815 | 1,042 | |||||||
| Total current liabilities | 350,006 | 320,466 | ||||||||
| Other non-current provisions | 14 | 100,041 | 86,528 | |||||||
| Accounts payable to associates | 31(c) | 731 | 1,004 | |||||||
| Financial obligations | 15(a) | 173,489 | 105,072 | |||||||
| Total liability | 624,267 | 513,070 | ||||||||
| Shareholders’ equity, net | 16 | |||||||||
| Capital stock, net of treasury shares for US$(000)62,622 | 750,540 | 750,540 | ||||||||
| Investment shares, net of treasury shares for US$(000)762 | 1,399 | 2,019 | ||||||||
| Additional paid-in capital | 219,471 | 225,978 | ||||||||
| Legal reserve | 162,663 | 162,639 | ||||||||
| Other reserves | 269 | 269 | ||||||||
| Retained earnings | 2,566,787 | 2,034,768 | ||||||||
| Other reserves of equity | 925 | 2,068 | ||||||||
| Shareholders’ equity, net attributable to owners of the parent | 3,702,054 | 3,178,281 | ||||||||
| Non-controlling interest | 262,332 | 262,198 | ||||||||
| Total shareholders’ equity, net | 3,964,386 | 3,440,479 | ||||||||
| Total liabilities and shareholders’ equity, net | 4,588,653 | 3,953,549 | ||||||||
The accompanying notes are an integral part of this consolidated statement of financial position.
Compañía de Minas Buenaventura S.A.A. and Subsidiaries
Consolidated Income Statement
For the years ended December 31, 2012, 2011 and 2010
| Note | 2011 | 2010 | Note | 2012 | 2011 | 2010 | ||||||||||||||||||||
| US$(000) | US$(000) | US$(000) | US$(000) | US$(000) | ||||||||||||||||||||||
| Operating income | ||||||||||||||||||||||||||
| Net sales | 19 | 1,493,882 | 1,047,885 | 18 | 1,496,349 | 1,493,882 | 1,047,885 | |||||||||||||||||||
| Royalty income | 32(a) | 62,742 | 55,883 | 31(a) | 67,178 | 62,742 | 55,883 | |||||||||||||||||||
| Total income | 1,556,624 | 1,103,768 | 1,563,527 | 1,556,624 | 1,103,768 | |||||||||||||||||||||
| Operating costs | ||||||||||||||||||||||||||
| Cost of sales, without considering depreciation and amortization | 20 | (446,163 | ) | (347,129 | ) | 19 | (629,492 | ) | (446,163 | ) | (347,129 | ) | ||||||||||||||
| Exploration in units in operation | 21 | (109,355 | ) | (91,441 | ) | 20 | (153,018 | ) | (109,355 | ) | (91,441 | ) | ||||||||||||||
| Depreciation and amortization | (96,381 | ) | (74,864 | ) | (123,043 | ) | (96,381 | ) | (74,864 | ) | ||||||||||||||||
| Royalties | 22 | (60,262 | ) | (52,270 | ) | 21 | (37,667 | ) | (60,262 | ) | (52,270 | ) | ||||||||||||||
| Total operating costs | (712,161 | ) | (565,704 | ) | (943,220 | ) | (712,161 | ) | (565,704 | ) | ||||||||||||||||
| Gross income | 844,463 | 538,064 | 620,307 | 844,463 | 538,064 | |||||||||||||||||||||
| Operating expenses | ||||||||||||||||||||||||||
| Administrative | 23 | (75,170 | ) | (107,237 | ) | |||||||||||||||||||||
| Administrative expenses | 22 | (99,295 | ) | (75,170 | ) | (107,237 | ) | |||||||||||||||||||
| Exploring in non-operating areas | 24 | (49,593 | ) | (36,105 | ) | 23 | (95,491 | ) | (49,593 | ) | (36,105 | ) | ||||||||||||||
| Selling | (11,617 | ) | (9,375 | ) | ||||||||||||||||||||||
| Selling expenses | (18,090 | ) | (11,617 | ) | (9,375 | ) | ||||||||||||||||||||
| Reversal (provision) for impairment of long-lived assets | 11 | (3,617 | ) | - | 13,135 | |||||||||||||||||||||
| Excess of workers’ profit sharing | 15(c) | (6,221 | ) | - | 14(b) | (2,164 | ) | (6,221 | ) | - | ||||||||||||||||
| Reimbursement of exploration expenses on projects | 32(a) | - | 15,013 | - | - | 15,013 | ||||||||||||||||||||
| Reversal for impairment of long-lived assets | 12 | - | 13,135 | |||||||||||||||||||||||
| Other operating income, net | 2,513 | 10,653 | ||||||||||||||||||||||||
| Other, net | 16,584 | 2,513 | 10,653 | |||||||||||||||||||||||
| Total operating expenses | (140,088 | ) | (113,916 | ) | (202,073 | ) | (140,088 | ) | (113,916 | ) | ||||||||||||||||
| Operating income | 704,375 | 424,148 | 418,234 | 704,375 | 424,148 | |||||||||||||||||||||
| Other income (expenses), net | ||||||||||||||||||||||||||
| Share in the results of associates | 10(b) | 468,363 | 428,885 | |||||||||||||||||||||||
| Share in the results of associates under equity method | 9(b) | 464,239 | 468,363 | 428,885 | ||||||||||||||||||||||
| Interest income | 11,827 | 8,203 | 9,486 | 11,827 | 8,203 | |||||||||||||||||||||
| Interest expense | (11,823 | ) | (12,271 | ) | (8,290 | ) | (11,823 | ) | (12,271 | ) | ||||||||||||||||
| Loss from currency exchange difference, net | (675 | ) | (750 | ) | ||||||||||||||||||||||
| Net gain (loss) from currency exchange difference | 1,715 | (675 | ) | (750 | ) | |||||||||||||||||||||
| Total other income, net | 467,692 | 424,067 | 467,150 | 467,692 | 424,067 | |||||||||||||||||||||
| Income before income tax | 1,172,067 | 848,215 | 885,384 | 1,172,067 | 848,215 | |||||||||||||||||||||
| Income tax | 25(b) | (211,589 | ) | (123,326 | ) | 24(b) | (142,594 | ) | (211,589 | ) | (123,326 | ) | ||||||||||||||
| Net income | 960,478 | 724,889 | 742,790 | 960,478 | 724,889 | |||||||||||||||||||||
| Attributable to: | ||||||||||||||||||||||||||
| Owners of the parent | 684,685 | 858,927 | 660,821 | |||||||||||||||||||||||
| Non-controlling interest | 101,551 | 64,068 | 58,105 | 101,551 | 64,068 | |||||||||||||||||||||
| Owners of the parent | 858,927 | 660,821 | ||||||||||||||||||||||||
| 960,478 | 724,889 | 742,790 | 960,478 | 724,889 | ||||||||||||||||||||||
| Basic and diluted earnings per share attributable to owners of the parent, stated in U.S. dollars | 26 | 3.77 | 2.85 | 25 | 2.69 | 3.38 | 2.60 | |||||||||||||||||||
| Weighted average number of shares outstanding (common and investment), in units | 26 | 254,442,328 | 254,442,328 | 25 | 254,232,571 | 254,442,328 | 254,442,328 | |||||||||||||||||||
The accompanying notes are an integral part of this statement.
Compañía de Minas Buenaventura S.A.A. and Subsidiaries
Consolidated Statement of Comprehensive Income
For the years ended December 31, 2012, 2011 and 2010
| Note | 2011 | 2010 | Note | 2012 | 2011 | 2010 | ||||||||||||||||||||
| US$(000) | US$(000) | US$(000) | US$(000) | US$(000) | ||||||||||||||||||||||
| Net income | 960,478 | 724,889 | 742,790 | 960,478 | 724,889 | |||||||||||||||||||||
| Net change in unrealized gain (loss) on hedging derivative financial instruments | 28(b) | 24,471 | (16,345 | ) | ||||||||||||||||||||||
| Income tax for the effect on change in unrealized gain (loss) on hedging derivate financial instruments | 28(b) | (7,395 | ) | 4,903 | ||||||||||||||||||||||
| Net change in unrealized gain (loss) on hedging derivative | 27(b) | (1,283 | ) | 24,471 | (16,345 | ) | ||||||||||||||||||||
| Income tax for the effect on change in unrealized gain (loss) on hedging derivative | 27(b) | 439 | (7,395 | ) | 4,903 | |||||||||||||||||||||
| Net change in unrealized gain (loss) on other investments | (687 | ) | 477 | (715 | ) | (687 | ) | 477 | ||||||||||||||||||
| Other comprehensive income | 16,389 | (10,965 | ) | |||||||||||||||||||||||
| Total comprehensive income | 976,867 | 713,924 | ||||||||||||||||||||||||
| Other comprehensive income, net of taxes | (1,559 | ) | 16,389 | (10,965 | ) | |||||||||||||||||||||
| Total comprehensive income, net of taxes | 741,231 | 976,867 | 713,924 | |||||||||||||||||||||||
| Attributable to: | ||||||||||||||||||||||||||
| Owners of the parent | 866,901 | 656,319 | 683,542 | 866,901 | 656,319 | |||||||||||||||||||||
| Non-controlling interest | 109,966 | 57,605 | 57,689 | 109,966 | 57,605 | |||||||||||||||||||||
| 976,867 | 713,924 | |||||||||||||||||||||||||
| 741,231 | 976,867 | 713,924 | ||||||||||||||||||||||||
The accompanying notes are an integral part of this statement.
Compañía de Minas Buenaventura S.A.A. and Subsidiaries
Consolidated Statements of Changes in Shareholders’ Equity
For the years ended December 31, 2012, 2011 and 2010
| Attributable to owners of the parent | ||||||||||||||||||||||||||||||||||||||||||||
| Capital stock, net of treasury shares | ||||||||||||||||||||||||||||||||||||||||||||
| Number of | Cumulative | Non- | ||||||||||||||||||||||||||||||||||||||||||
| shares | Common | Investment | Additional | Legal | Retained | unrealized, | controlling | |||||||||||||||||||||||||||||||||||||
| outstanding | shares | shares | paid-in capital | reserve | Other reserves | earnings | gain (loss) | Total | interest | Total equity | ||||||||||||||||||||||||||||||||||
| US$(000) | US$(000) | US$(000) | US$(000) | US$(000) | US$(000) | US$(000) | US$(000) | US$(000) | US$(000) | |||||||||||||||||||||||||||||||||||
| Balance as of January 1, 2010 | 253,759,664 | 750,540 | 2,019 | 225,978 | 112,363 | 269 | 974,818 | (1,404 | ) | 2,064,583 | 202,520 | 2,267,103 | ||||||||||||||||||||||||||||||||
| Net income | - | - | - | - | - | - | 660,821 | - | 660,821 | 64,068 | 724,889 | |||||||||||||||||||||||||||||||||
| Net change in unrealized loss on hedging derivative financial instruments held by El Brocal, note 28(b) | - | - | - | - | - | - | - | (4,979 | ) | (4,979 | ) | (6,463 | ) | (11,442 | ) | |||||||||||||||||||||||||||||
| Net change in unrealized gain on other investments | - | - | - | - | - | - | - | 477 | 477 | - | 477 | |||||||||||||||||||||||||||||||||
| Total comprehensive income of the year | - | - | - | - | - | 660,821 | (4,502 | ) | 656,319 | 57,605 | 713,924 | |||||||||||||||||||||||||||||||||
| Dividends declared and paid, note 17(d) | - | - | - | - | - | - | (117,043 | ) | - | (117,043 | ) | (39,176 | ) | (156,219 | ) | |||||||||||||||||||||||||||||
| Expired dividends | - | - | - | - | 27 | - | - | - | 27 | - | 27 | |||||||||||||||||||||||||||||||||
| Capitalization of debt to minority shareholder of La Zanja | - | - | - | - | - | - | - | - | - | 19,634 | 19,634 | |||||||||||||||||||||||||||||||||
| Transfer to legal reserve | - | - | - | - | 50,243 | - | (50,243 | ) | - | - | - | - | ||||||||||||||||||||||||||||||||
| Capitalization of debt to minority shareholder | - | - | - | - | - | - | 2,659 | - | 2,659 | (1,791 | ) | 868 | ||||||||||||||||||||||||||||||||
| Balance as of December 31, 2010 | 253,759,664 | 750,540 | 2,019 | 225,978 | 162,633 | 269 | 1,471,012 | (5,906 | ) | 2,606,545 | 238,792 | 2,845,337 | ||||||||||||||||||||||||||||||||
| Net income | - | - | - | - | - | - | 858,927 | - | 858,927 | 101,551 | 960,478 | |||||||||||||||||||||||||||||||||
| Net change in unrealized gain on hedging derivative financial instruments held by El Brocal, note 28(b) | - | - | - | - | - | - | - | 8,661 | 8,661 | 8,415 | 17,076 | |||||||||||||||||||||||||||||||||
| Net change in unrealized loss on other investments | - | - | - | - | - | - | - | (687 | ) | (687 | ) | - | (687 | ) | ||||||||||||||||||||||||||||||
| Total comprehensive income | - | - | - | - | - | - | 858,927 | 7,974 | 866,901 | 109,966 | 976,867 | |||||||||||||||||||||||||||||||||
| Dividends declared and paid, note 17(d) | - | - | - | - | - | - | (142,488 | ) | - | (142,488 | ) | (66,736 | ) | (209,224 | ) | |||||||||||||||||||||||||||||
| Expired dividends | - | - | - | - | 6 | - | - | - | 6 | - | 6 | |||||||||||||||||||||||||||||||||
| Acquisition of non-controlling interest in El Brocal and Colquijirca, note 1(f) | - | - | - | - | - | - | (141,235 | ) | - | (141,235 | ) | (24,107 | ) | (165,342 | ) | |||||||||||||||||||||||||||||
| Other acquisitions of non-controlling interests | - | - | - | - | - | - | (11,448 | ) | - | (11,448 | ) | 4,283 | (7,165 | ) | ||||||||||||||||||||||||||||||
| Balance as of December 31, 2011 | 253,759,664 | 750,540 | 2,019 | 225,978 | 162,639 | 269 | 2,034,768 | 2,068 | 3,178,281 | 262,198 | 3,440,479 | |||||||||||||||||||||||||||||||||
| Attributable to owners of the parent | ||||||||||||||||||||||||||||||||||||||||||||
| Capital stock, net of treasury shares | ||||||||||||||||||||||||||||||||||||||||||||
| Number of shares outstanding | Common shares | Investment shares | Additional paid-in capital | Legal reserve | Other reserves | Retained earnings | Other reserves of equity | Total | Non- controlling interest | Total equity | ||||||||||||||||||||||||||||||||||
| US$(000) | US$(000) | US$(000) | US$(000) | US$(000) | US$(000) | US$(000) | US$(000) | US$(000) | US$(000) | |||||||||||||||||||||||||||||||||||
| Balance as of January 1, 2010 | 253,759,664 | 750,540 | 2,019 | 225,978 | 112,363 | 269 | 974,818 | (1,404 | ) | 2,064,583 | 202,520 | 2,267,103 | ||||||||||||||||||||||||||||||||
| Net income | - | - | - | - | - | - | 660,821 | - | 660,821 | 64,068 | 724,889 | |||||||||||||||||||||||||||||||||
| Net change in unrealized loss on hedging derivative, net of taxes | - | - | - | - | - | - | - | (4,979 | ) | (4,979 | ) | (6,463 | ) | (11,442 | ) | |||||||||||||||||||||||||||||
| Net change in unrealized gain on other investments | - | - | - | - | - | - | - | 477 | 477 | - | 477 | |||||||||||||||||||||||||||||||||
| Total comprehensive income of the year | - | - | - | - | - | - | 660,821 | (4,502 | ) | 656,319 | 57,605 | 713,924 | ||||||||||||||||||||||||||||||||
| Dividends declared and paid, note 16(d) | - | - | - | - | - | - | (117,043 | ) | - | (117,043 | ) | (39,176 | ) | (156,219 | ) | |||||||||||||||||||||||||||||
| Proceeds of expire dividends | - | - | - | - | 27 | - | - | - | 27 | - | 27 | |||||||||||||||||||||||||||||||||
| Capitalization of debt to minority shareholder of La Zanja | - | - | - | - | - | - | - | - | - | 19,634 | 19,634 | |||||||||||||||||||||||||||||||||
| Transfer to legal reserve | �� | - | - | - | - | 50,243 | - | (50,243 | ) | - | - | - | - | |||||||||||||||||||||||||||||||
| Capitalization of debt to minority shareholder | - | - | - | - | - | - | 2,659 | - | 2,659 | (1,791 | ) | 868 | ||||||||||||||||||||||||||||||||
| Balance as of December 31, 2010 | 253,759,664 | 750,540 | 2,019 | 225,978 | 162,633 | 269 | 1,471,012 | (5,906 | ) | 2,606,545 | 238,792 | 2,845,337 | ||||||||||||||||||||||||||||||||
| Net income | - | - | - | - | - | - | 858,927 | - | 858,927 | 101,551 | 960,478 | |||||||||||||||||||||||||||||||||
| Net change in unrealized gain on hedging derivative, net of taxes | - | - | - | - | - | - | - | 8,661 | 8,661 | 8,415 | 17,076 | |||||||||||||||||||||||||||||||||
The accompanying notes are an integral part of this statement.consolidated statement of financial position.
| Attributable to owners of the parent | ||||||||||||||||||||||||||||||||||||||||||||
| Capital stock, net of treasury shares | ||||||||||||||||||||||||||||||||||||||||||||
| Number of shares outstanding | Common shares | Investment shares | Additional paid-in capital | Legal reserve | Other reserves | Retained earnings | Other reserves of equity | Total | Non- controlling interest | Total equity | ||||||||||||||||||||||||||||||||||
| US$(000) | US$(000) | US$(000) | US$(000) | US$(000) | US$(000) | US$(000) | US$(000) | US$(000) | US$(000) | |||||||||||||||||||||||||||||||||||
| Net change in unrealized loss on other investments | - | - | - | - | - | - | - | (687 | ) | (687 | ) | - | (687 | ) | ||||||||||||||||||||||||||||||
| Total comprehensive income of the year | - | - | - | - | - | - | 858,927 | 7,974 | 866,901 | 109,966 | 976,867 | |||||||||||||||||||||||||||||||||
| Dividends declared and paid, note 16(d) | - | - | - | - | - | - | (142,488 | ) | - | (142,488 | ) | (66,736 | ) | (209,224 | ) | |||||||||||||||||||||||||||||
| Expired dividends | - | - | - | - | 6 | - | - | - | 6 | - | 6 | |||||||||||||||||||||||||||||||||
| Acquisition of non-controlling interest in El Brocal and Colquijirca, note 1(f) | - | - | - | - | - | - | (141,235 | ) | - | (141,235 | ) | (24,107 | ) | (165,342 | ) | |||||||||||||||||||||||||||||
| Other acquisitions of non-controlling interests | - | - | - | - | - | - | (11,448 | ) | - | (11,448 | ) | 4,283 | (7,165 | ) | ||||||||||||||||||||||||||||||
| Balance as of December 31, 2011 | 253,759,664 | 750,540 | 2,019 | 225,978 | 162,639 | 269 | 2,034,768 | 2,068 | 3,178,281 | 262,198 | 3,440,479 | |||||||||||||||||||||||||||||||||
| Net income | - | - | - | - | - | - | 684,685 | - | 684,685 | 58,105 | 742,790 | |||||||||||||||||||||||||||||||||
| Net change in unrealized loss on hedging derivative, net of taxes | - | - | - | - | - | - | - | (428 | ) | (428 | ) | (416 | ) | (844 | ) | |||||||||||||||||||||||||||||
| Net change in unrealized gain on other investments | - | - | - | - | - | - | - | (715 | ) | (715 | ) | - | (715 | ) | ||||||||||||||||||||||||||||||
| Total comprehensive income of the year | - | - | - | - | - | - | 684,685 | (1,143 | ) | 683,542 | 57,689 | 741,231 | ||||||||||||||||||||||||||||||||
| Dividends declared and paid, note 16(d) | - | - | - | - | - | - | (152,666 | ) | - | (152,666 | ) | (44,881 | ) | (197,547 | ) | |||||||||||||||||||||||||||||
| Capitalization of debt to minority shareholder of La Zanja | - | - | - | - | - | - | - | - | - | (12,674 | ) | (12,674 | ) | |||||||||||||||||||||||||||||||
| Treasury shares | - | - | (620 | ) | (6,507 | ) | - | - | - | - | (7,127 | ) | - | (7,127 | ) | |||||||||||||||||||||||||||||
| Expired dividends | - | - | - | - | 24 | - | - | - | 24 | - | 24 | |||||||||||||||||||||||||||||||||
| Balance as of December 31, 2012 | 253,759,664 | 750,540 | 1,399 | 219,471 | 162,663 | 269 | 2,566,787 | 925 | 3,702,054 | 262,332 | 3,964,386 | |||||||||||||||||||||||||||||||||
Las notas a los estados financieros adjuntas son parte integrante de este estado consolidado.
Compañía de Minas Buenaventura S.A.A. and Subsidiaries
Consolidated Statement of Cash Flows
For the years ended December 31, 2012, 2011 and 2010
| 2011 | 2010 | |||||||
| US$(000) | US$(000) | |||||||
| Operating activities | ||||||||
| Proceeds from sales | 1,505,476 | 997,829 | ||||||
| Royalty received | 56,153 | 58,825 | ||||||
| Value added tax (VAT) recovered | 22,585 | 7,480 | ||||||
| Interest received | 8,528 | 8,098 | ||||||
| Dividends received | - | 182,955 | ||||||
| Payments to suppliers and third parties | (701,728 | ) | (473,630 | ) | ||||
| Payments to employees | (135,428 | ) | (126,042 | ) | ||||
| Income tax paid | (111,802 | ) | (56,251 | ) | ||||
| Payments of royalties | (73,776 | ) | (55,265 | ) | ||||
| Payments of interest | (2,543 | ) | (6,377 | ) | ||||
| Net cash and cash equivalents provided by operating activities | 567,465 | 537,622 | ||||||
| Investment activities | ||||||||
| Proceeds from sale of investments | 60,379 | - | ||||||
| Proceeds from sale of mining concessions, development cost and property, plant and equipment | 7,891 | 694 | ||||||
| Decrease (increase) in time deposits | 7,814 | (17,935 | ) | |||||
| Additions to mining concessions, development cost, property, plant and equipment | (317,816 | ) | (253,275 | ) | ||||
| Payments for purchase of investment shares | (277,485 | ) | (19,625 | ) | ||||
| Additions to financial assets at fair value through profit or loss | - | (50,000 | ) | |||||
| Net cash and cash equivalents used in investment activities | (519,217 | ) | (340,141 | ) | ||||
| Financing activities | ||||||||
| Increase in financial obligations | 50,962 | 53,262 | ||||||
| Dividends paid | (142,488 | ) | (117,043 | ) | ||||
| Dividends paid to minority shareholders | (66,736 | ) | (39,176 | ) | ||||
| Payments of financial obligations | (2,000 | ) | (226,117 | ) | ||||
| Net cash and cash equivalents used in financing activities | (160,262 | ) | (329,074 | ) | ||||
| Decrease in cash and cash equivalents for the period, net | (112,014 | ) | (131,593 | ) | ||||
| Cash and cash equivalents at beginning of period | 582,861 | 714,454 | ||||||
| Cash and cash equivalents at the period-end, note 5(a) | 470,847 | 582,861 | ||||||
| 2011 | 2010 | |||||||
| US$(000) | US$(000) | |||||||
| Reconciliation of net income to cash and cash equivalents provided by operating activities | ||||||||
| Net income attributable to owners of the parent | 858,927 | 660,821 | ||||||
| Add (less) | ||||||||
| Depreciation and amortization | 118,322 | 90,021 | ||||||
| Net income attributable to non-controlling interest | 101,551 | 64,068 | ||||||
| Deferred income tax | 42,369 | 34,744 | ||||||
| Provision for estimated fair value of embedded derivatives of concentrate sales and adjustments on open liquidations | 33,889 | (20,500 | ) | |||||
| Accretion expense of the provision for closure of mining units | 9,100 | 6,392 | ||||||
| Net cost of plant and equipment retired and sold | 1,858 | 3,136 | ||||||
| Loss from currency exchange difference | 675 | 750 | ||||||
| Share in the results of associates, net of dividends received in cash | (468,363 | ) | (245,930 | ) | ||||
| Provision for long-term officers’ compensation | (5,982 | ) | 42,425 | |||||
| Provisions | (4,254 | ) | 29,559 | |||||
| Provision for slow moving and obsolescence supplies | (2,038 | ) | 2,025 | |||||
| Net changes in assets and liabilities accounts | ||||||||
| Decrease (increase) in operating assets - | ||||||||
| Trade accounts receivable, net | (11,641 | ) | (37,978 | ) | ||||
| Other accounts receivable | 2,552 | (23,921 | ) | |||||
| Other accounts receivable from associates | (40,048 | ) | (17,773 | ) | ||||
| Inventory, net | (88,461 | ) | (64,646 | ) | ||||
| Prepaid expenses | (13,244 | ) | 5,246 | |||||
| Increase (decrease) in operating liabilities - | ||||||||
| Trade accounts payable | 51,001 | 30,017 | ||||||
| Income tax payable | 9,298 | 6,597 | ||||||
| Other accounts payable | (28,046 | ) | (27,431 | ) | ||||
| Net cash and cash equivalents provided by operating activities | 567,465 | 537,622 | ||||||
| Transactions that did not affect cash flows: | ||||||||
| Increase (decrease) in the book of long-lived assets | 1,571 | (199 | ) | |||||
| 2012 | 2011 | 2010 | ||||||||||
| US$(000) | US$(000) | US$(000) | ||||||||||
| Operating activities | ||||||||||||
| Proceeds from sales | 1,410,120 | 1,505,476 | 997,829 | |||||||||
| Royalty received | 76,106 | 56,153 | 58,825 | |||||||||
| Value added tax (VAT) recovered | 40,940 | 22,585 | 7,480 | |||||||||
| Dividends received | 16,467 | - | 182,955 | |||||||||
| Interest received | 8,606 | 8,528 | 8,098 | |||||||||
| Payments to suppliers and third parties | (838,250 | ) | (672,479 | ) | (473,630 | ) | ||||||
| Payments to employees | (201,494 | ) | (164,677 | ) | (126,042 | ) | ||||||
| Income tax paid | (136,336 | ) | (111,802 | ) | (56,251 | ) | ||||||
| Payments of royalties | (38,985 | ) | (73,776 | ) | (55,265 | ) | ||||||
| Payments of interest | (1,485 | ) | (2,543 | ) | (6,377 | ) | ||||||
| Net cash and cash equivalents provided by operating activities | 335,689 | 567,465 | 537,622 | |||||||||
| Investment activities | ||||||||||||
| Decrease in time deposits | 10,121 | 7,814 | (17,935 | ) | ||||||||
| Proceeds from sale of investment shares | 3,658 | - | - | |||||||||
| Proceeds from sale of mining concessions, development costs, property, plant and equipment | 255 | 7,891 | 694 | |||||||||
| Additions to mining concessions, development costs, property, plant and equipment | (442,927 | ) | (317,816 | ) | (253,275 | ) | ||||||
| Contributions to associates and payments for purchase of investment shares | (58,594 | ) | (52,182 | ) | (19,625 | ) | ||||||
| Additions to financial assets at fair value through profit or loss | - | - | (50,000 | ) | ||||||||
| Net cash and cash equivalents used in investment activities | (487,487 | ) | (354,293 | ) | (340,141 | ) | ||||||
| Financing activities | ||||||||||||
| Increase in financial obligations | 74,258 | 50,962 | 53,262 | |||||||||
| Dividends paid | (152,666 | ) | (142,488 | ) | (117,043 | ) | ||||||
| Dividends paid to non-controlling shareholders | (44,881 | ) | (66,736 | ) | (39,176 | ) | ||||||
| Capital stock reduction paid to non-controlling interest | (7,980 | ) | - | - | ||||||||
| Payments of financial obligations | (1,068 | ) | (2,000 | ) | (226,117 | ) | ||||||
| Proceeds from sale of shares investments | - | 60,379 | - | |||||||||
| Disbursements related to incorporation of non-controlling interests | - | (225,303 | ) | - | ||||||||
| Net cash and cash equivalents used in financing activities | (132,337 | ) | (325,186 | ) | (329,074 | ) | ||||||
| Decrease in cash and cash equivalents for the period, net | (284,135 | ) | (112,014 | ) | (131,593 | ) | ||||||
| 2012 | 2011 | 2010 | ||||||||||
| US$(000) | US$(000) | US$(000) | ||||||||||
| Cash and cash equivalents at beginning of year | 470,847 | 582,861 | 714,454 | |||||||||
| Cash and cash equivalents at the year-end, note 4(a) | 186,712 | 470,847 | 582,861 | |||||||||
| F-11 |
Consolidated Statements of Cash Flows (continued)
| 2012 | 2011 | 2010 | ||||||||||
| US$(000) | US$(000) | US$(000) | ||||||||||
| Reconciliation of net income to cash and cash equivalents provided by operating activities | ||||||||||||
| Net income attributable to owners of the parent | 684,685 | 858,927 | 660,821 | |||||||||
| Add (less) | ||||||||||||
| Depreciation and amortization | 147,449 | 118,322 | 90,021 | |||||||||
| Net income attributable to non-controlling interest | 58,105 | 101,551 | 64,068 | |||||||||
| Deferred income tax, mining royalties and special mining tax | 10,809 | 42,369 | 34,744 | |||||||||
| Changes in the fair value of embedded derivatives of purchase and sale of concentrates and adjustments on open liquidations | (16,592 | ) | 33,889 | (20,500 | ) | |||||||
| Accretion expense of the provision for closure of mining units and exploration projects | 6,812 | 9,100 | 6,392 | |||||||||
| Net cost of plant and equipment retired and sold | 4,120 | 1,858 | 3,136 | |||||||||
| Provision for impairment of long-lived assets | 3,617 | - | - | |||||||||
| Loss (gain) from currency exchange difference | (1,715 | ) | 675 | 750 | ||||||||
| Share in the results of associates under equity method, net of dividends received in cash, note 9(b) | (447,772 | ) | (468,363 | ) | (245,930 | ) | ||||||
| Provisions | (6,200 | ) | (12,274 | ) | 74,009 | |||||||
| Net changes in assets and liabilities accounts | ||||||||||||
| Decrease (increase) in operating assets - | ||||||||||||
| Trade accounts receivable, net | (83,862 | ) | (11,641 | ) | (37,978 | ) | ||||||
| Other accounts receivable | (60,047 | ) | 2,552 | (23,921 | ) | |||||||
| Accounts receivable from associates | 23,776 | (40,048 | ) | (17,773 | ) | |||||||
| Inventory | (21,051 | ) | (88,461 | ) | (64,646 | ) | ||||||
| Prepaid expenses | (4,397 | ) | (13,244 | ) | 5,246 | |||||||
| Increase (decrease) in operating liabilities - | ||||||||||||
| Trade accounts payable | 57,176 | 51,001 | 30,017 | |||||||||
| Other accounts payable | 9,264 | (28,046 | ) | (27,431 | ) | |||||||
| Income tax payable | (28,488 | ) | 9,298 | 6,597 | ||||||||
| Net cash and cash equivalents provided by operating activities | 335,689 | 567,465 | 537,622 | |||||||||
The accompanying notes are an integral part of this statement.
Compañía de Minas Buenaventura S.A.A. and Subsidiaries
Notes to the Consolidated Financial StatementsAs of December 31,
For the years 2012, 2011 2010 and January 1, 2010
| 1. | Identification and business activity of the Company |
| (a) | Identification - |
Compañía de Minas Buenaventura S.A.A. (hereafter “Buenaventura” or “the Company”) is a publicly traded corporation incorporated in 1953. Buenaventura’s stock is traded on the Lima and New York Stock Exchanges through American Depositary Receipts (ADRs), which represent Company shares deposited in the Bank of New York. Buenaventura’s legal domicile is at Carlos Villaran Avenue 790, Santa Catalina, Lima, Peru.
| (b) | Business activity - |
Buenaventura (individually and in association with third parties) is engaged in the exploration, extraction, concentration, smelting and commercialization of polymetallic ores and metals.
Buenaventura directly operates eightnine mining units located in Peru: Uchucchacua, Orcopampa, Poracota, Julcani, Recuperada, Antapite, Ishihuinca Mallay and Ishihuinca.Breapampa. In addition, the Company has a controlling interest in Sociedad Minera El Brocal S.A.A. (hereinafter “El���El Brocal”), which operates the Colquijirca mining unit, Minera La Zanja S.R.L. (hereinafter “La Zanja”), which operates La Zanja mining unit and Compañía de Exploraciones, Desarrollo e Inversiones Mineras S.A.C. (hereinafter “Cedimin”), which operates the Shila - Paula mining unit. The Company also holds interests in a number of other mining companies. The Company also holds interests in a number of other mining companies. The Company also owns an electric power distribution company, an electric power generation company (construction stage), a mining engineering services company, a construction services company and another company which will provide chemical processing to treat concentrates from Uchucchacua.Uchucchacua with high manganese content. See note 1(d)1(h).
| (c) | Approval of consolidated financial statements |
The consolidated financial statements as of December 31, 20112012 and 2010 and the consolidated statement of financial position as of January 1, 2010 (date of transition to IFRS)2011 were approved by Management on April 30, 20122013 and will be presented for the approval of the Board of Directors and the Shareholders within the terms established by law.Law. In Management’s opinion, the accompanying consolidated financial statements will be approved without changes by the Board of Directors and Shareholders’ Meetings.
Notes to the consolidated financial statements (continued)
| (d) | The consolidated financial statements include the financial statements of the following subsidiaries: |
| Ownership percentage as of | Ownership in capital | |||||||||||||||||||||||||||||||
| December 31, 2011 | December 31, 2010 | December 31, 2012 | December 31, 2011 | |||||||||||||||||||||||||||||
| Direct | Indirect | Direct | Indirect | Direct | Indirect | Direct | Indirect | |||||||||||||||||||||||||
| % | % | % | % | % | % | % | % | |||||||||||||||||||||||||
| Investment and mining concessions held, exploration and exploitation of minerals | ||||||||||||||||||||||||||||||||
| Compañía de Exploraciones, Desarrollo e Inversiones Mineras S.A.C. - CEDIMIN (*) | 82.91 | 17.09 | 44.83 | 55.17 | ||||||||||||||||||||||||||||
| Compañía de Exploraciones, Desarrollo e Inversiones Mineras S.A.C. – CEDIMIN | 82.91 | 17.09 | 82.91 | 17.09 | ||||||||||||||||||||||||||||
| Compañía Minera Condesa S.A. | 100.00 | - | 100.00 | - | 100.00 | - | 100.00 | - | ||||||||||||||||||||||||
| Compañía Minera Colquirrumi S.A. | 100.00 | - | 90.00 | - | 100.00 | - | 100.00 | - | ||||||||||||||||||||||||
| Sociedad Minera El Brocal S.A.A. (**) (e), (f) | 2.54 | 48.18 | 4.25 | 39.23 | ||||||||||||||||||||||||||||
| Inversiones Colquijirca S.A. (**) (f) | 99.99 | - | 81.42 | - | ||||||||||||||||||||||||||||
| Sociedad Minera El Brocal S.A.A. (*) (e), (f) | 2.54 | 48.18 | 2.54 | 48.18 | ||||||||||||||||||||||||||||
| Inversiones Colquijirca S.A. (*) (f) | 99.99 | - | 99.99 | - | ||||||||||||||||||||||||||||
| S.M.R.L. Chaupiloma Dos de Cajamarca | 20.00 | 40.00 | 20.00 | 40.00 | 20.00 | 40.00 | 20.00 | 40.00 | ||||||||||||||||||||||||
| Minera La Zanja S.R.L. | 53.06 | - | 53.06 | - | 53.06 | - | 53.06 | - | ||||||||||||||||||||||||
| Minera Julcani S.A. de C.V. | 100.00 | - | 100.00 | - | 100.00 | - | 100.00 | - | ||||||||||||||||||||||||
| Compañía de Minas Buenaventura Chile Ltda. | 100.00 | - | 100.00 | - | 100.00 | - | 100.00 | - | ||||||||||||||||||||||||
| El Molle Verde S.A.C. | 100.00 | - | 100.00 | - | ||||||||||||||||||||||||||||
| Electric power activity | ||||||||||||||||||||||||||||||||
| Consorcio Energético de Huancavelica S.A. | 100.00 | - | 100.00 | - | 100.00 | - | 100.00 | - | ||||||||||||||||||||||||
| Empresa de Generación Huanza S.A. (g) | - | 100.00 | - | 100.00 | - | 100.00 | - | 100.00 | ||||||||||||||||||||||||
| Services | ||||||||||||||||||||||||||||||||
| Buenaventura Ingenieros S.A. | 100.00 | - | 100.00 | - | 100.00 | - | 100.00 | - | ||||||||||||||||||||||||
| BISA Construcción S.A. | - | 100.00 | - | 100.00 | ||||||||||||||||||||||||||||
| Contacto Corredores de Seguros S.A. | - | 100.00 | - | 100.00 | - | 100.00 | - | 100.00 | ||||||||||||||||||||||||
| Industrial activities | ||||||||||||||||||||||||||||||||
| Procesadora Industrial Rio Seco S.A. (h) | 100.00 | - | 100.00 | - | 100.00 | - | 100.00 | - | ||||||||||||||||||||||||
| (*) |
| As of December 31, 2012 and 2011 |
Notes to the consolidated financial statements (continued)
| (e) | Project for the expansion of El Brocal operations |
On August 15, 2008, the Board of Directors of El Brocal approved a project to expand its operations in order to reach a treatment level of 18,000 DMT per DMT/day of ore. This project, will allow processing ore with lower lead–zinc grade from Tajo Norte and copper from Marcapunta, divided in three stages:
| - | First: Optimization of the current plant of 5,000 DMT/day to 7,000 DMT/day. |
| - | Second: New concentrate plant 2,490 DMT/day. |
| - | Third: Expansion of the new plant from 2,490 DMT/day to 11,000 DMT/day. |
AsOptimization Plant No. 1 (first stage) and the new concentrator (second stage) with additional treatment capacity of December 31, 2011, El Brocal concluded the first2,000 DMT/day and second stages of the Project.2,490 DMT/day, respectively started operations in October 2010 and January 2011.
As of December 31, 20112012 and 2010,2011, the works related to the project to expand operations, which costs have been capitalized, considering the project economic feasibility study by El Brocal’s Management criteria, are the following:
| 2011 | 2010 | 2012 | 2011 | |||||||||||||
| US$(000) | US$(000) | US$(000) | US$(000) | |||||||||||||
| Mine development costs | ||||||||||||||||
| Expansion of Tajo Norte – Marcapunta Norte | 16,429 | 16,127 | 16,429 | 16,429 | ||||||||||||
| Mining concessions and property, plant and equipment | ||||||||||||||||
| Expansion of refining plant capacity to 18,000 DMT | 103,337 | 86,189 | ||||||||||||||
| Mining concessions, property, plant and equipment | ||||||||||||||||
| Expansion of refining plant capacity to 18,000 DMT/day | 127,262 | 103,337 | ||||||||||||||
| Optimization of crushing plant and conveyor belt | 17,018 | 13,110 | 53,674 | 17,018 | ||||||||||||
| Huachacaja tailings areas | 38,060 | 7,825 | ||||||||||||||
| New offices and camps | 13,350 | 478 | 16,188 | 13,350 | ||||||||||||
| Expansion of power grid | 7,941 | 7,174 | 14,812 | 7,941 | ||||||||||||
| Construction of Huachacaja tailings areas | 7,825 | 3,217 | ||||||||||||||
| Support area | 3,067 | 1,782 | 4,311 | 3,067 | ||||||||||||
| Program management | 2,476 | 2,327 | 3,852 | 2,476 | ||||||||||||
| Mineral storage | 2,098 | 2,098 | ||||||||||||||
| Borrowing cost | 334 | - | ||||||||||||||
| Other minor activities | 2,857 | 120 | 928 | 759 | ||||||||||||
| 157,871 | 114,397 | |||||||||||||||
| Total expenditures | 174,300 | 130,524 | ||||||||||||||
| Total investment made | 277,948 | 174,300 | ||||||||||||||
Notes to the consolidated financial statements (continued)
| (f) | Changes in the participation of Colquijirca and El Brocal - |
Inversiones Colquijirca S.A.
On July and August of 2011, the Company increased its participation of 81.42 to 99.99 percent in Colquijirca; acquiring shares amounted to US$197,021,000, which was totally paid in cash atas part of the date of consolidated statement of financial position.investment.
According to IFRS (note 2.3(h) and 3.5(e)), theThe difference between price paid and the carrying amount of these shares amounted to US$166,692,000, was recorded in “Retained earnings” caption in the consolidated statement of changes in shareholders’shareholders´ equity.
Sociedad Minera El Brocal S.A.A.
During the year 2011, the Company purchased and sold El Brocal’sBrocal´s shares. The disbursements to acquire 1.38 percent of El Brocal’sBrocal´s shares amounted to US$28,282,000, which was totally paid in cash at the date of consolidated statement of financial position. Revenues from the sale of 3.09 percent of El Brocal’sBrocal´s shares amounted to US$68,142,000.
According to IFRS (note 2.3(h) and 3.5(e)), theThe difference between price paid and the carry amount of these shares and the price received net of cost from shares sold, amounted to US$23,292,000, was recorded in “Retained earnings” caption in the consolidated statement of changes in shareholders’shareholders´ equity.
| (g) | Construction of hydroelectric power station |
In November 2009, the Consorcio EnergeticoEnergético de Huancavelica S.A. Board of Directors approved the construction of the 90.6 MW capacity Huanza Hydroelectric Power Station, located in the Santa Eulalia river valley. This initial investment of US$145,000,000, is in progress since March 2010; its construction is expected to take thirty-three months.2010. This project is being financed with a US$119,000,000 financial leasing agreement executed with Banco de Credito del Peru and with Consorcio EnergeticoEnergético de Huancavelica S.A.’s own resources. The hydroelectric power station will start operations in the third quarter of 2013 and the estimated investment is US$180,000,000.
As of December 31, 2011,2012, the investment in this project amounted to US$177,133,000 (US$119,509,000 (US$63,958,000 as of December 31, 2010).2011), and it is composed as follows:
| 2012 | 2011 | |||||||
| US$(000) | US$(000) | |||||||
| Development costs | ||||||||
| Concessions and other minors | 2,171 | 2,142 | ||||||
| Property, plant and equipment | ||||||||
| Water conductor system | 86,967 | 50,468 | ||||||
| Preliminary work | 38,216 | 41,812 | ||||||
| Borrowing cost | 10,974 | 6,364 | ||||||
| Pallca dam and water intake | 9,977 | 1,564 | ||||||
As of December 31, 2011 and 2010, the work relatedNotes to the construction of Huanza Hydroelectric Power station is the following:consolidated financial statements (continued)
| 2011 | 2010 | |||||||
| US$(000) | US$(000) | |||||||
| Development cost | ||||||||
| Concessions and others | 2,142 | 2,128 | ||||||
| Property, plant and equipment | ||||||||
| Water conductor system | 50,468 | 12,138 | ||||||
| Preliminary work | 41,812 | 35,792 | ||||||
| Borrowing cost | 6,364 | 2,420 | ||||||
| Access road | 6,305 | 5,543 | ||||||
| Round house and yard keys | 3,128 | 95 | ||||||
| Transmission line in 60 KV | 2,766 | 2,682 | ||||||
| Conduction tube line – Conay River | 2,189 | - | ||||||
| Other minor activities | 4,335 | 3,160 | ||||||
| 117,367 | 61,830 | |||||||
| Total included in work in process | 119,509 | 63,958 | ||||||
| 2012 | 2011 | |||||||
| US$(000) | US$(000) | |||||||
| Round house and yard keys | 7,754 | 3,128 | ||||||
| Access road | 7,387 | 6,305 | ||||||
| Conduction tube line – Conay river | 6,445 | 2,189 | ||||||
| Transmition line in 60 KV | 3,293 | 2,766 | ||||||
| Other minor activities | 3,949 | 2,771 | ||||||
| 174,962 | 117,367 | |||||||
| Total included in work in progress | 177,133 | 119,509 | ||||||
| (h) | Construction of washing plant, sulfuric acid and manganese sulfate |
At Board of Directors held on October 28, 2010, agreed the constitution of Procesadora Industrial Rio Seco S.A., in order to carry out the plant for the manganese sulfate project. The project is located in the community of Lomera in Huaral at 102 kilometers from Lima. The main objective of this project is to wash with sulfuric acid, the manganese content in the lead-silver concentrate of Uchucchacua mining unit to reduce chemically the level of manganese and to obtain a higher value added in ore concentrate. This process will also improve and increase recovery of silver reserves. For the treatment of gaseous effluents of the process, a sulfuric acid recovery plant will be installed, that will be used for the acid wash of the concentrate.
The total estimated investment for the construction of the washing plant, the plant of sulfuric acid and manganese sulphate plant amounted to US$80,000,00093,379,000, and it is expected to be completed in the third quarter of 2013. As of December 31, 2012, the investment in this project amounts to US$84,288,000 (US$27,606,000 as of December 31, 2011).
| (i) | Mallay’s mining unit start up - |
On April 2, 2012, the Company obtained the authorization to operate the plant and other services of Mallay mining unit, located 15 kilometers from the Uchucchacua mining unit. The new plant has a treatment capacity of 400 MT / day, and it operates since April 2012. As of December 31, 2012, Mallay mining unit has produced 668,327 ounces of silver. Total investment in fixed assets was US$64,392,000 of which US$19,958,000 were disbursed in 2012.
| (j) | Breapampa’s mining unit start up - |
On November 2012, the Company obtained the authorization of the operation of the processing plant of Breapampa mining unit, located in the district of Chumpi, Parinacochas province, Ayacucho. The new plant has a treatment capacity of 10,000 MT / day, and it operates since November 2012. As of December 31, 2012, Breapampa mining unit has produced 5,922 ounces of gold. Total investment in fixed assets was US$52,125,000 of which US$31,560,000 were disbursed in 2012.
Notes to the consolidated financial statements (continued)
| (k) | Capital reduction of |
On January 26, 2012, the Shareholder’s meeting agreed to reduce the capital stock of La Zanja by US$27,000,000, returning cash contributions. This agreement was registered in the public records on March 30, 2012. The amount of the refund to the non-controlling interest amounted to US$4,694,000 (US$12,674,000 net disbursements of US$7,980,000).
| 2. | Significant accounting principles |
| Basis of preparation - |
Statement of compliance -
These consolidated financial statements have been prepared in accordance with International Financial Reporting Standards (hereinafter “IFRS”), as issued by the International Accounting Standards Board (hereinafter “IASB”) and its interpretations issued by the IFRS Interpretations Committee (hereinafter “IFRS”), effective as of December 31, 2011.2012.
Measurement basis -
The consolidated financial statements have been prepared on a historical cost basis from the Company records, except for financial assets and liabilities at fair value through profit or loss which include the derivative financial instruments and the liability for stock appreciation rights that have been measured at fair value. The consolidated financial statements are presented in U.S. dollars and all values are rounded to the nearest thousand, (US$ thousand), except when otherwise indicated, see note 2.3.(a)2.3(a).
Basis of consolidation -
The consolidated financial statements comprise Buenaventura’s financial statements and its subsidiaries in which Buenaventura controls, which generally is represented by more than 50 percent equity participation and/or exercises control. All significant inter-company balances and transactions have been eliminated.
See note 1(d) for a list of the companies included in the consolidated financial statements.
The financial statements of the subsidiaries are prepared for the same reporting period as the parent company, using accounting consistent principles and policies.
The shareholders’ equity attributable to the non-controlling interest is shown in the consolidated statement of financial position. Earnings attributable to the non-controlling interest are shown separately in the consolidated income statement.
Notes to the consolidated financial statements (continued)
The Company changed the ownership interest of its subsidiaries, without a loss of control. Consequently, they are accounted for as an equity transaction.
| Significant |
The preparation of consolidated financial statements in conformity with IFRS requires Management to make judgments, estimates and assumptions that affect the reported amounts of assets, liabilities and the disclosure of contingent assets and liabilities at the date of consolidated financial statements, and reported amounts of revenues and expenses to be reported for the years ended December 31, 2012, 2011 and 2010. In Management’sManagement´s opinion, these estimates were made on the basis of their best knowledge of the relevant facts and circumstances at the date of preparation of consolidated financial statements; however, the actualuncertainty about these assumptions and estimates could result in outcomes that can differ from these estimates.the estimates included in the consolidated financial statement. The Company’s Management does not expect that these changes would have a significant effect on the consolidated financial statements.
Company’sCompany´s Management considers the following significant estimates to prepare the consolidated financial statements:
| (a) | Provision for closure of mining units – (note |
The Company assesses its provision for closure of mining units annually. Significant estimates and assumptions are made in determining this provision, as there are numerous factors that will affect the ultimate liability payable. These factors include estimates of the extent and costs of rehabilitation activities, technological changes, regulations changes, costs increases as compared to the inflation rates and changes in the discount rates. These uncertainties may result in future actual expenditure differing from the amounts currently provided. The provision at reporting date represents Management’sManagement´s best estimate of the present value of future rehabilitation costs required.
| (b) | Determination of mineral reserves and resources - |
The Company computes its reserves using methods generally applied by the mining industry in accordance with international guidelines. All reserves computed which are audited by an independent third party (Algon Investment S.R.L.), represent the estimated amounts of proved and probable ore that can be processed economically under the present conditions.
The process of estimating the amount of reserves is complex and requires making subjective decisions at the time of evaluating all the geologic, geophysical, engineering and economic information that is available. Revisions could occur in estimated reserves due to, among other things, revisions of the geologic data or assumptions, changes in assumed prices, production costs and the results of exploration activities.
Notes to the consolidated financial statements (continued)
Changes in estimated reserves could affect mainly the depreciation of fixed assets related directly to mining activity, provision for mine closure, assessment of the deferred asset’s recoverability and the amortization period for development costs.
| (c) | Unit-of-production depreciation - (note |
Reserves are used in determining the depreciation and amortization of mine specific assets. This results in a depreciation or amortization charge proportional to the depletion of the anticipated remaining life of mine production. Each item’s life, which is assessed annually, has regarded to: i) physical life limitations, and ii) present assessments of economically recoverable reserves of the mine property. These calculations require the use of estimates and assumptions, including the amount of recoverable reserves. Changes are recorded prospectively.
| (d) |
The application of the Company’s accounting policy for exploration and mine development costs requires judgment in determining whether it is likely that future economic benefits are likely either from future exploitation. The determination of reserves and mineral resources is a complex estimation that requires varying degrees of uncertainty depending on sub-classification and these estimates directly impact the point of deferral of exploration and mine development costs and its amortization method for development cost.costs. The deferral policy requires Management to make certain estimates and assumptions about future events or circumstances, in particular whether an economically viable extraction, operation and sale of mineral can be established. Estimates and assumptions made may change if new information becomes available. If, after expenditure is capitalized, information becomes available suggesting that the recovery of expenditure is unlikely, the amount capitalized is written off in profit or loss in the period when the new information becomes available.
| (e) | Share-based payment transactions |
The Company measures the cost of cash-settled transactions withshare-based payments to employees by reference to the fair value of the equity instruments at the date at which they are granted. Estimating fair value for share-based payment transactions requires determining the most appropriate valuation model, which is dependent on the terms and conditions of the grant. This estimate also requires determining the most appropriate inputs to the valuation model including the expected life of the share option, volatility and dividend yield and making assumptions about them. The assumptions and models used for estimating fair value for share-based payment transactions are disclosed in note 15(b)14(c).
Notes to the consolidated financial statements (continued)
| (f) | Impairment of non-financial assets |
The Company has determined that the operations of each mining unit are cash generating units, considering each mining unit operation independently.
The Company assesses at each reporting date whether there is an indication that an asset may be impaired. If any such indication exists, the Company makes a formal estimate of the asset’s recoverable amount. An asset’s recoverable amount is the higher of an asset’s fair value less costs to sell and its value in use and is determined for an individual asset (cash-generating unit) unless the asset does not generate cash inflows that are clearly independent of those from other assets or groups of assets. These assessments require the use of estimates and assumptions such as long-term commodity prices, discount rates, operating costs, and others.
In assessing value in use, the estimated future cash flows are discounted to their present value using a discount rate that reflects current market assessments of the time value of money and the risks specific to the asset.
| (g) | Contingencies |
By their nature, contingencies will only be resolved when one or more future events do or do not occur. Determining contingencies inherently involves the exercise of judgment and estimates of the outcome of future events.
| (h) | Fair value of financial instruments |
Where the fair value of financial assets and financial liabilities recorded in the consolidated statement of financial position cannot be derived from active markets, their fair value is determined using valuation techniques including the discounted cash flow model. The inputs to these models are taken from observable markets where possible. Where this is not feasible, a degree of judgment is required in establishing fair values. The judgments include considerations of inputs such as liquidity risk, credit risk and volatility. Changes in assumptions about these factors could affect the reported fair value of financial instruments.
| (i) | Production start date |
The Company assesses the stage of each mine under development to determine when a mine moves into the production stage. The criteria used to assess the start date are determined based on the nature of each mining project, the complexity of a plant and its location. The Company considers various relevant criteria for assessing when the mine is substantially complete and ready for its planned use. Some of the criteria used will include, but are not limited to, the following:
Notes to the consolidated financial statements (continued)
| - | Level of capital expenditure incurred compared to the original construction cost estimates. |
| - | Completion of a reasonable period of testing of the mine plant and equipment. |
| - | Ability to produce metal in saleable form (within specifications). |
| - | Ability to sustain ongoing production of metal. |
When a mine development project moves into the production stage, the capitalization of certain mine development costs ceases and costs are either regarded as forming part of the cost of inventory or expensed, except for costs that qualify for capitalization relating(relating to mining asset additions or improvements,improvements), underground mine development or mineable reserve development. It is also at this point that depreciation or amortization commences.
| (j) | Recovery of deferred tax assets |
An assessment is required to determine whether deferred tax assets should be recognized in the consolidated statement of financial position. Deferred tax assets, including those resulting from unused tax losses, require Management to assess the likelihood that the Company would generate taxable earnings in future periods to apply the deferred tax assets. Estimated future taxable income is based on projections of cash flows from operations and application of the tax law existing in each jurisdiction. To the extent to which future cash flows and taxable income differ significantly from those estimated; they could have an impact on the Company’s capability to realize the deferred tax assets posted as of the reporting date.
Additionally, future changes in tax law in the jurisdictions in which the Company operates could limit the Company’s ability to obtain tax deductions in future periods.
| (k) | Inventories |
Inventories are classified in short and long-term according to the period of time in which Management estimates will begin the production stage of concentrate extracted of each mining unit.
Net realizable value tests are performed at least annually and represent the estimated future sales price of the product based on prevailing spot metals prices at the reporting date, less estimated costs to complete production and bring the product to sale. Additionally, in calculating the net realizable value of the Company’s long-term inventories, Management also considers the time value of money.
| F-22 |
Notes to the consolidated financial statements (continued)
StockpilesClassified mineral inventories –
Classified mineral contain lower grade ore than the average of the mineral treated, which have been removed from the pit of Colquijirca mining unit, and that are available to continue in the process of recovery of mineral and concentrates.
Because it is generally impracticable to determine the mineral contained in the classified mineral located in the deposit field near to the Tajo Norte by physical count, reasonable estimation method are employed. The quantity of mineral delivered to classified mineral is based on surveyed volumes of mined material and daily production records. Sampling and assaying of blasthole cuttings determine the estimated copper, lead and zinc grades of material delivered to classified mineral.
Mineral outside leach platforms inventories –
Finished and in-progress goods are measured by estimating the number of tonnes added and removed from the stockpile.removed. The contentnumber of contained gold ounces and activated coal is calculated based on assay data, and the estimated recovery percentage according tois based on the expected processing method.
Stockpile tonnages Tonnages and ounces of mineral are verified by periodic surveys.
Mineral inside leach platforms inventories –
For determiningBecause it is generally impracticable to determine the quantity of mineral contained in the products in process the Management uses aleach platforms by physical count, reasonable methodologyestimation method are employed. The quantity of material delivered to estimate the mineral content that is treated at the dateleach platforms based on surveyed volumes of the consolidated financial statement. The amount of mineral added in the products in process is determined by the sampling of mill volumesmined material and the daily production records. The samplingSampling and assaysassaying of blasthole cuttings determine the head gradeestimated ore grades of the mineral addedmaterial delivered to the products in process.leach platforms.
TheRecovery rates determination –
Expected ore recovery rates of the products in processfor leach platforms are determined by metallurgical sampling. The mineral recoverability of the productsore in process,leach platforms, once entered into the production process, begins, can be reasonable estimated. The rate is determined using small scales of laboratory tests, historic trendsproduced into mineral and others factors.concentrate almost immediately.
TheEstimated ore recovery rates are determined using laboratory tests, historical trends and estimatesother factors. Ultimate recovery of ore contained in leach platforms can vary significantly depending on several variables, including type of ore recovery, mineralogy and the size of the rocks. Processes and recovery rates are monitored continuously, and recovery rates are adjusted periodically.periodically as additional information becomes available and as related technology changes.
| F-23 |
Notes to the consolidated financial statements (continued)
| Deferred stripping costs - (note 10) - |
The costs of waste removal or overburden to access the ore body (waste removal) in an open pit drilling, incurred by the Company before the operation of the mining project begins are capitalized as deferred stripping cost and are included in ¨Mining rights, development costs and property, plant and equipment, net¨ caption in the consolidated statement of financial position. Such costs will be amortized since the project is completed, using units of production method based on proven and probable reserves.
The stripping costs incurred during the production phase of its operations are recognized as an operating expense when they are incurred. These costs of production are included as part of the cost of the inventories extracted during the period in which the stripping cost was incurred.
| 2.3. | Summary of significant accounting principles and policies |
| (a) | Foreign currency translation - |
Functional and presentation currency
Financial statements are presented in U.S. dollars, which is the Company’s functional and presentation currency.
Transactions and balances in foreign currency -
Transactions in foreign currency (any currency different from the functional currency) are initially recorded at the functional currency rate in force at the date of the transaction. The exchange rates issued by the Superintendencia de Banca y Seguros y AFP (SBS) are used in translating foreign currency. Monetary assets and liabilities denominated in foreign currencies are translated at the functional currency rate of exchange ruling at the consolidated statement of financial position. Exchange differences resulting from the settlement of the transactions in foreign currencies and from the translation of the monetary assets and liabilities at the exchange rates at year-end are recognized in the consolidated income statement.
Non-monetary items that are measured in terms of historical cost in a foreign currency are translated using the exchange rates as of the dates of the initial transactions.
Notes to the consolidated financial statements (continued)
| (b) | Financial assets - |
Initial recognition and measurement -
Financial assets within the scope of IAS 39 are classified as financialas: assets at fair value through profit or loss, loans and receivables, held-to-maturity investments, available-for-sale financial assets, or as derivatives designated as hedging instruments. When financial assets are recognized initially, they are measured at fair value.value directly attributable transaction costs, except in the case of financial assets recorded at fair value through profit or loss which does not include transaction costs. The Company determines the classification of its financial assets after initial recognition and, where allowed and appropriate, re-evaluates this designation at each financial year end.
All financial assets are recognized initially at fair value plus, the direct costs initially attributed to the transaction, except for financial assets at fair value, for which any transaction costs derived are recognized in results.
Purchases or sales of financial assets that require delivery of assets within a time frame established by regulation or convention in the marketplace (conventional transactions) are recognized on the date of the transaction, that is to say, on the date on which the Company commits to sell the asset.
The Company’s financial assets include cash and cash equivalents, financial assets at fair value through profit or loss, trade accounts receivable, embedded derivatives for purchase and sale of concentrates, other accounts receivable, accountsand account receivable from associates and embedded derivatives for concentrates sales.associate.
Subsequent measurement -
The subsequent measurementsubsequentmeasurement of financial assets depends on their classification, as detailed below:
Financial assets at fair value through profit or loss -
Financial assets at fair value through profit or loss includes financial assets held for trading and financial assets designated upon initial recognition as at fair value through profit or loss. Derivatives are also classified as held for trading unless they are designated as effective hedging instruments. Assets within this category are classified as current assets if they are held for trading or it is expected to realize them within the next twelve months counted as from the consolidated statement of financial position date. Gain or losses on investments held for trading are recognized in profit and loss. The Company has classified as financial assets at fair value through profit or loss its mutual funds of variable income, see note 6 and embedded derivates, see note 28(c).5.
The Company evaluates its financial assets held for trading, other than derivatives, to determine whether the intention to sell them in the near term is still appropriate. When the Company is unable to trade these financial assets due to inactive markets and Management’s intention to sell them in the foreseeable future significantly changes, the Company may elect to reclassify these financial assets in rare circumstances. The reclassification to loans and receivables, available-for-sale or held to maturity depends on the nature of the asset. This evaluation does not affect any financial assets designated at fair value through profit or loss using the fair value option at designation.
Notes to the consolidated financial statements (continued)
Any embedded derivatives contained in commercial contracts are recorded as separated derivatives and posted at their fair value if the directly associated economic features and risks are not related to the commercial contract and the contract has not been classified as a negotiable financial asset or at fair value with a charge to results. Any gains or losses from changes in the fair value of embedded derivatives are posted in the consolidated income statement.
Loans and receivables -
The Company has the following accounts: cash and cash equivalents, trade accounts receivable, accounts receivable from associates and other accounts receivable, in this category; they are stated at the transaction value, net of an allowance for doubtful accounts when applicable.
All such instruments are non-derivative financial assets with fixed or determinable payments that are not quoted in an active market. After initial measurement loans and receivables are subsequently carried at amortized cost using the effective interest method less any provision for impairment.
The Company assesses whetheras of the date of its consolidated financial statements, there is objective evidence of an impairment in the value of financial assets (such as the debtor’s probability of insolvency, significant financial difficulties, failure to pay principal or interest or any observable evidence indicating that the estimated future flows associated with the loans or accounts receivable have decreased.decreased). The amount of the impairment is measured as the difference between the book value of the assets and the present value of the estimated future cash flows, discounted at anthe original effective interest rate if it’s a fixed rate or one applicable for similar transactions.transactions if it’s a variable rate. The carrying amount of the receivable is reduced by means of an allowance account. The amount of the loss must be recognized in the consolidated income statement. Impaired accounts receivable or loans are written off when they are considered uncollectible.
If the amount of the loss should decrease in a subsequent period, the Company reverses it with a credit entry to the consolidated income statement.
Held-to-maturity investments -
Held-to-maturity investments are non-derivative financial assets with fixed or determinable payments and fixed maturities that the Company’s Management has the positive intention and ability to hold to maturity. After initial recognition the Company measures their held-to-maturity investments at amortized cost using the effective interest method. Gains and losses are recognized in the consolidated income statement when the investment is disposed, had impairment or through amortization. The Company did not maintain any held-to-maturity investment as of December 31, 20112012 and 2010 neither January 1, 2010.2011.
Notes to the consolidated financial statements (continued)
Available-for-sale financial investments -
Available-for-sale financial assets are those non-derivative financial assets that are designated as available-for-sale or are not classified in any of the other categories. After initial measurement, available for sale financial assets are measured at fair value with unrealized gains or losses being recognized directly in equity. When the investment is disposed of, the cumulative gain or loss previously recorded in equity is recognized in the consolidated income statement. The Company did not maintain any significant available-for-sale financial investment as of December 31, 20112012 and 2010 neither January 1, 2010.2011.
Derecognition of financial assets -
A financial asset is derecognisedderecognized when:
| - | The rights to receive cash flows from such asset have expired. |
| - | The Company has transferred its rights to receive cash flows from the asset or has assumed an obligation to pay the received cash flows to a third party under a pass-through arrangement; and |
| (i) | The Company has transferred substantially all of the risks and rewards of the asset or; |
| (ii) | Not having transferred or retained substantially all of the risks and rewards of the asset, it has transferred its control. |
In the event that the Company transfers its rights to receive cash flows from an asset or has entered into a pass-through arrangement, but has not transferred substantially all the risks and rewards and still maintains control over of the asset, it must recognize the liabilities associated. Assets transferred and the liabilities associated are measured on a basis that reflects the rights and obligations that the Company has retained.
Impairment of financial assets -
The Company assesses at each reporting date whether there is any objective evidence that a financial asset or a group of financial assets is impaired.
A financial asset or a group of financial assets is deemed to be impaired if, and only if, there is objective evidence of impairment as a result of one or more events that has occurred after the initial recognition of the asset (an incurred ‘loss event’) and if loss event has an impact on the estimated future cash flows of the financial asset or the group of financial assets that can be reliably estimated. Evidence of impairment may include indications that the debtors or a group of debtors are experiencing significant financial difficulty, default or delinquency in interest or principal payments, the probability that they will enter bankruptcy or other financial reorganisationreorganization and where observable data indicate that there is a measurable decrease in the estimated future cash flows, such as changes in arrears or economic conditions that correlate with unpaid counts.
| F-27 |
Notes to the consolidated financial statements (continued)
Offsetting of financial instruments -
Financial assets and liabilities are offset and the net amount reported in the consolidated statement of financial position, if (i) there is a currently enforceable legal right to offset the recognized amounts and (ii) there is an intention to settle on a net basis, or to realize the assets and settle the liability simultaneously.
Fair value of financial instruments -
The fair value of financial instruments that are traded in active markets is determined on each reporting date by reference to quoted market prices or dealer price quotations (bid price for long positions and ask price for short positions), without any deduction for transaction costs.
In the case of financial instruments that are not traded in an active market, fair value is determined using appropriate valuation techniques. Such techniques may include using recent arm’sarm´s length market transactions; reference to the current fair value of another instrument that is substantially same, an analysis of the adjusted flow of funds or other valuation models.
An analysis of fair values of financial instruments and further details as to how they are measured are provided in note 30.29.
| (c) | Cash and cash |
The cash“Cash and cash equivalentsequivalents” caption presented in the Company’s consolidated statement of financial position includes all cash on hand and deposited in banks, including time deposits whose maturities are three months or more.
Furthermore, this caption presented in the Company’s consolidated statements of cash flows includes cash on hand, time deposits and highly liquid investments with original maturities of three months or less.
| (d) | Business combinations and goodwill - |
Business combinations are accounted for using the acquisition method. The cost of an acquisition is measured as the aggregate of the consideration transferred, measured at acquisition date fair value and the amount of any non-controlling interest in the acquiree. For each business combination, the Company elects whether it measures the non-controlling interest in the acquiree either at fair value or at the proportionate share of the acquiree’s identifiable net assets. Acquisition costs incurred are expensed and included in administrative expenses.“Administrative expenses” caption.
Notes to the consolidated financial statements (continued)
When the Company acquires a business, it assesses the financial assets and liabilities assumed for appropriate classification and designation in accordance with the contractual terms, economic circumstances and pertinent conditions as at the acquisition date. This includes the separation of embedded derivatives in host contracts by the acquiree.
If the business combination is achieved in stages, the acquisition date fair value of the acquirer’s previously held equity interest in the acquiree is remeasured to fair value at the acquisition date through profit or loss.
Any contingent consideration to be transferred by the acquirer will be recognisedrecognized at fair value at the acquisition date. Subsequent changes in the fair value of the contingent consideration which is deemed to be an asset or liability will be recognisedrecognized in accordance with IAS 39 either in profit or loss or as a change to other comprehensive income. If the contingent consideration is classified as equity, it will not be remeasured. Subsequent settlement is accounted for within equity. In instances where the contingent consideration does not fall within the scope of IAS 39, it is measured in accordance with the appropriate IFRS.
In order to calculate goodwill,Difference between price and the carrying amount is initially measured at cost, being the excess of the aggregate of the consideration transferred and the amount paid is compared with the amount recognisedrecognized for non-controlling interest over the fair value of the identifiable net identifiable assets acquired and liabilities assumed. If this consideration is lower than the fair value of the identifiable net assets acquired is in excess of the subsidiary acquired,aggregate consideration transferred, the differencegain is recognisedrecognized in profit or loss.
After initial recognition, goodwilldifference between price and the carrying amount is measured at cost less any accumulated impairment losses. For the purpose of impairment testing, goodwillthis difference is allocate to each of the Company’s cash-generating units that are expected to benefit from the combination, irrespective of whether other assets or liabilities of the acquiree are assigned to those units.
Where goodwillthis difference forms part of a cash-generating unit and part of the operation within that unit is disposed of, the goodwilldifference associated with the operation disposed of is included in the carrying amount of the operation when determining the gain or loss on disposal of the operation. GoodwillDifference disposed of in this circumstance is measured based on the relative values of the operation disposed of and the portion of the cash-generating unit retained.
Notes to the consolidated financial statements (continued)
| (e) | Investments in associates - |
Investments in entities in which the Company’s ownership is greater than 20 percent or exercise significant influence are accounted for using the equity method. Under this method, the investment in the associateis carried in the consolidated statement of financial position at cost plus acquisition changes in the Company’s share of net assets of the associate. The amount paid in excess of the fair value of the share of net assets of the associate is included in the carrying amount of the investment and is neither amortisedamortized nor individually tested for impairment.
The consolidated income statement reflects the share of the results of operations of the associate. When there has been a change recognisedrecognized directly in the equity of the associate, the Company recognisesrecognizes its share of any changes and discloses this, when applicable, in the consolidated statements of changes in shareholders’shareholders´ equity. UnrealisedUnrealized gains and losses resulting from transactions between the Company and the associate are eliminated to the extent of the interest in the associate.
Company’s share of profit of an associate is shown on the face of the consolidated income statement. This is the profit attributable to equity holders of the associate and, therefore it is profit after tax and non-controlling interests in the subsidiaries of the associate.
The reporting dates of the associates and the Company are identical and the associates’ accounting policies are consistent with those used by the Company for like transactions and events in similar circumstances. The functional and presentation currency of the associates Yanacocha (through its subsidiary, Compañía Minera Condesa S.A.) and Cerro Verde is the U.S. dollar.
After the application of the equity method, the Company determines whether it is necessary to recognize an additional impairment loss of the Company’s investment in associates. The Company determines at each consolidated statement of financial position date whether there is any objective evidence that the investment in associate is impaired. If this is the case, the Company calculates the amount of impairment as being the difference between the fair value of the associate and the acquisition cost and recognizes the amount in the consolidated income statement.
Upon loss of significant influence over the associate, the Company measures and recognisesrecognizes any retaining investment at its fair value. Any difference between the carrying amount of the associate upon loss of significant influence and the fair value of the retaining investment and proceeds from disposal is recognized in profit or loss.the consolidated income statement.
Notes to the consolidated financial statements (continued)
| (f) | Inventories - |
Dore bars, goldFinished goods and silver ounces, lead-zinc and copperproducts in concentrate, classified mineral and activated carbonprocess are statedvalued at the lower of average cost or net realizable value. Net realizable value is defined as the estimated future sales price obtainable in the ordinary course of business, less estimated costs of completionto complete production and bring the estimated costs necessaryproduct to make the sale.
Cost is determined by using the weighted averageweighted-average method and comprises direct purchase costs and an appropriate portion of fixed and variable overhead costs, including depreciation and amortization, incurred in converting materials into finished goods.
The accrual for obsolescence for spare parts and supplies are based on an item-by-item analysis completed by the Company’s Management and related amounts are charged to expense in the period in which the obsolescence is deemed to have occurred.
Products in process -
Products in process represent mineral that are currently accumulated to be treated in the production of concentrate (including classifiedand mineral content of low grade ore)gold and silver deposited in the leach platforms, whose recovery is accomplished through exposure to sulfuric acid (leaching). Conversion processes for mining operations vary depending on the nature of the mineral and the specific mining operation.
Products in process material is measured based on assays of gold and silver in the material includedminerals deposited in these processesthe platforms and concentrates recoveries.daily production records.
Stockpiles of low grade ore (classified mineral) -
Classified mineral
Low grade ore are placed in stockpiles to be processed in mid term (3 years)midterm until the project to expand El Brocal’sBrocal´s operations will be concluded (see note 1(e)). In this sense, low grade ore that is stockpiled with the expectation that is will be processed in the future is accounted for in the same way as high grade ore.minerals and concentrates.
WhenAccording to the Company decides to processmine planning, classified mineral will be treated on the stockpiles of low grade ore in the future,next three years. As consequence, the ore is accounted for as non-current inventory and measured at the lower of cost and net realizable value. Annually, the Company’s Management assess the net realizable value of its non-current inventory based on the cash-flow projections obtained by the production and sales of the low grade ore stockpiled considering to: (i) the forward copper price at the year that to be expected to process the low grade ore, (ii) the future costs of processing (considering inflation rates, technological changes and other significant aspects would change), and (iii) the discount rate.
Notes to the consolidated financial statements (continued)
| (g) | Property, plant and equipment - |
The “Mining rights, development cost and property, plant and equipment, net” caption is stated at cost, net of accumulated depreciation and accumulated impairment in value. The initial cost of an asset comprises its purchase price or construction cost, including customs duties and non-reimbursable taxes, as well as any expense necessary to put such asset into operation, the initial estimates of any rehabilitation obligation and, in the case of qualifying assets, the cost of debt and any expense directly attributable to bringing the asset into operation. The capitalized value of leasing is included in the “Mining rights, development cost and property, plant and equipment, net”this caption.
Depreciation -
Unit-of-production method
Depreciation and amortization of assets whose useful life is higher than the life of mine, is calculated base on a unit-of-production basis over the economically recoverable reserves of the mine, except in the case of assets whose useful life is shorter, in which case the straight-line method is applied.
The units of production are measured in recoverable metric tons of concentrate. The unit-of-production rate for the depreciation and amortization takes into account expenditures incurred to date.
Straight-line method
Depreciation of assets whose useful life is less than the mining unit life is calculated under the straight-line method of accounting considering the lower of estimated useful lives of the asset or estimated reservesuseful life of the mining unit. The useful lives are the following:
| Years | ||||
| Buildings, construction and other | Between 6 and 20 | |||
| Machinery and equipment | Between 5 and 10 | |||
| Transportation units | 5 | |||
| Furniture and fixtures | 10 | |||
| Computer equipment | 4 |
An item of property, plant and equipment is derecognized upon disposal or when no future economic benefits are expected from its use or disposal. Any gain or loss arising from derecognizing an asset (calculated as the difference between the proceeds from the sale and the book value of the asset) is included in the consolidated income statement in the year the asset is derecognized.
The asset’s residual value, useful lives and methods of depreciation are reviewed, and adjusted if appropriate, at each financial year end.
Notes to the consolidated financial statements (continued)
Major maintenance and repairs -
Expenses on major maintenance refits or repairs comprise the cost of replacement assets or parts of assets and overhaul costs. The expense is capitalized when an asset or part of an asset that was depreciated separately is replaced and eliminated from the books and it is probable that the future economic benefits associated with such asset or part of an asset will flow to the Company during an additional period of useful life.
When the replaced part of the assets was not considered separately as a component, replacement value is used in order to estimate the book value of the assets replaced, which is immediately written off.
| (h) | Mining rights and concessions - |
Mining rights are presented as part of the “Mining rights, development costs, property, plant and equipment, net” correspond to the mineral reserves and acquisitions of mining concessions allocated as part of the cost of non controlling interest acquisition that took place before transition date to IFRS. See note 3.5(e). Mining rights are presented as part of the “Mining rights, development cost and property, plant and equipment, net” caption, and represent the Company’s ownership of mining properties that contain the mineral reserves acquired. Those mining rights related to mineral reserves are amortized following the units-of-production method based on proven and probable reserves.
Mining concessions correspond to exploration rights in areas of interest to the Company allocated as part of the cost of non controlling interest acquisition that took place before transition date to IFRS. See note 3.5.(e). Mining concessions are capitalized in the consolidated statement of financial position, and represent the Company’s ownership of mining properties of geologic interest. that contain the mineral reserves acquired.
Mining concessions are depreciated starting from the production phase following the units-of-production method based on proven and probable reserves. In the event that the Company abandons these concessions, the costs associated are written off in the consolidated income statement.
At the end of each year, the Company assesses each mining unit to see whether there is any indication of that the value of its mining rights has been impaired. If such indication exists, the Company estimates the recoverable amount of the assets. See note 2.2.(d)2.2(f).
| (i) | Exploration and mine development costs - |
Exploration costs are charged to expense as incurred. These costs primarily include costs for material and fuels used in exploration, costs of topographical surveys, drilling costs and payments made to contractors. When the Company determines that a mineral property can be economically developed by establishing the existence of proved and probable reserves, the costs incurred to develop the property, including the costs incurred to further delineate the ore body and remove topsoil, rocks and other mineral waste to initially expose the ore body are capitalized. Mine development costs are amortized using the units-of-production method, based on proven and probable reserves.
Disbursements related toDevelopment costs that are exploratory in nature that are incurred after proven and probable reserves have been establishedat the production phase are charged to expense as incurred.
Notes to the consolidated financial statements (continued)
| (j) | Deferred stripping costs - |
Stripping costs incurred in the development of a mine before production commences are capitalized as part of the cost of constructing the mine and subsequently amortisedamortized over the life of the mine on a units-of-production basis.
Where a mine operates several open pits that are regarded as separate operations for the purpose of mine planning, stripping costs are accounted for separately by reference to the ore from each separate pit. If, however, the pits are highly integrated for the purpose of the mine planning, the second and subsequent pits are regarded as extensions of the first pit in accounting for stripping costs. In such cases, the initial stripping, (i.e. overburden and other waste removal) of the second and subsequent pits is considered to be production phase stripping relating to the combined operation.
Deferred stripping cost is included in “Mining rights, development cost andcosts, property, plant and equipment, net” caption in the consolidated statement of financial position. These form part of the total investment in the relevant cash generating units, which are reviewed for impairment if events or changes of circumstances indicate that the carrying value may not be recoverable.
| (k) | Financial liabilities - |
The stripping costs incurred during production phase are recognized as an operating expense when they are incurred.
(k) Financial liabilities -
Initial recognition and measurement -
Financial liabilities within the scope of IAS 39 are classified as: financial liabilities at fair value through profit or loss, loans or as derivatives designated as hedging instruments, as relevant.
The Company determines the classification of its financial liabilities at initial recognition. All financial liabilities are recognized initially at fair value, plus directly attributable transaction costs, except in the case of loans, which are recognized initially at the fair value of the cash received, less any costs directly attributable to the transaction.
The Company’s financial liabilities include trade accounts payable, other liabilities, financial obligations, derivative financial instruments, financial obligation and embedded derivative for concentrates sales.purchase and sale of concentrates.
Subsequent measurement -
The subsequent measurementsubsequentmeasurement of financial liabilities depends on their classification, as detailed below:
Notes to the consolidated financial statements (continued)
Financial liabilities at fair value through profit or loss -
Financial liabilities at fair value through profit or loss include financial liabilities held for trading and financial liabilities designated upon initial recognition as at fair value through profit or loss. Financial liabilities are classified as held for trading if they are acquired for the purpose of selling in the near term. This category includes derivative financial instruments entered into by the Company that are not designated as hedging instruments as defined in IAS 39. Separated embedded derivatives are also classified as held for trading unless they are designated as cash-flow hedging instruments. Any gains or losses on liabilities held for trading are recognized in the consolidated income statement. TheExcept for the embedded derivative for sales of concentrates, the Company has not designated any financial liability at fair value through profit or loss.
Interest-bearing loans and borrowing -
After their initial recognition, interest-bearing loans and borrowings are subsequently measured at amortized cost using the effective interest rate (EIR) method. Any profit or loss is recognized in the consolidated income statement when the liability is terminated, as well as through the process of amortizing the effective interest rate. Amortized costs are calculated taking into account any discount or premium on acquisition and fees or costs that are an integral part of the effective interest rate. Amortization of the effective interest rate is included in financial cost in the consolidated income statement.
Derecognition of financial liabilities -
A financial liability is derecognized when the obligation under the liability is discharged or cancelled or expired. When an existing financial liability is replaced by another one from the same lender on substantially different terms, or the terms are substantially modified, such replacement or amendment is treated as a derecognition ofderecognitionof the original liability and the recognition of a new liability, and the difference in the respective carrying amount is recognized in the consolidated income statement.
(l) Leases -
| (l) | Leases - |
The determination of whether an arrangement is, or contains, a lease is based on the substance of the agreement on its inception date. It requires consideration as to whether the fulfillment of the arrangement is dependent on the use of a specific asset or assets or the arrangement conveys a right to use the asset. A reassessment is made after inception of the lease if one of the following applies:
| (i) | There is a change in the contractual terms, other than a renewal or extension of the arrangement. |
| (ii) | A renewal option is exercised or extension granted, unless the term of the renewal or extension was initially included in the lease term. |
| (iii) | There is a change in the determination of whether fulfillment is dependent on a specific asset; or |
Notes to the consolidated financial statements (continued)
| (iv) | There is a substantial change to the asset. |
Where a reassessment is made, lease accounting shall commence or cease starting from the date when the change of circumstances gives rise to reassessment for scenarios (i), (iii) or (iv), and at the date of the renewal or extension period for scenario (ii).
Embedded leases -
All take-or-pay contracts are reviewed for indicators of a lease on inception.
(m) Share-based payments -
| (m) | Share-based payments - |
Senior executives of the Company are granted share appreciation rights, which can only be settled in cash. The liability for these transactions is measured at each reporting date until settlement.
According to IFRS 2 “Share-Based Payments”, the cost of cash-settled transactions is measured initially at fair value at the grant date using a binomial model (see more details in note 15(b)14(c)). This fair value is expensed over the period until vesting with recognition of a corresponding liability. The liability is re-measured at each consolidated statement of financial position date up to and including the settlement date with changes in fair value recognized in profit and loss.the consolidated income statement.
| (n) | Provisions - |
(n) Provisions -
General -
Provisions are recognized when the Company has a present obligation (legal or constructive) as a result of a past event, it is probable that an outflow of resources embodying economic benefits will be required to settle the obligation and a reliable estimate can be made of the amount of the obligation. Provisions are reviewed periodically and are adjusted to reflect the best estimate available as of the date of the consolidated statement of financial position. The expense relating to any provision is presented in the consolidated income statement. When they are significant, provisions are discounted using a current rate that reflects, where appropriate, the risks specific to the liability. When discounting is used, the increase in the provision due to the passage of time is recognized as a financial expense.
Loss contingencies are recorded in the consolidated financial statements when it is probable their occurrence and they can be reasonably estimated. In other case, they are only disclosed in notes to the consolidated financial statements.
Notes to the consolidated financial statements (continued)
Contingent assets are not recognized in the consolidated financial statements; however, they are disclosed in notes to the consolidated financial statements if it is probable that such contingent assets will be realized.
Provision for closure of mining units -
On initially entering the liability for this obligation, it is posted at its fair value, offset by a greater a book value for long-lived assets related to development costs and fixed assets.
The liability is subsequently increased in each period to reflect the cost of interest considered in the initial estimate of fair value and, in addition, the capitalized cost is depreciated or amortized based on the useful life of the related asset. When eliminating the liability, the Company posts any resulting gain or loss. Changes in the fair value of the obligation or the useful life of the related asset that arise from review of the initial estimates are recognized as an increase or decrease in the book value of the obligation and the related assets in accordance with IAS 16 Property,“Property, Plant and Equipment.Equipment”. Any reduction in a mine closure liability and, therefore, any reduction of the related asset, may not exceed the book value of such asset. If so, any excess over book value is immediately transferred to the consolidated income statement.
If a change in estimate results in an increase in the closure liability and, therefore, an addition to the asset’s book value, the Company must consider whether or not this is an indication of impairment of the asset as a whole, and conduct impairment testing pursuant to IAS 36.36 “Impairment of assets”. Furthermore, in the case of mature mines, if the revised mining assets net of the closure provisions exceed the recoverable value, such portion of the increase is charged directly to expense. In the case of mines already closed, changes in estimated costs are recognized immediately in the consolidated income statement. Likewise, any closure liability that arises as a result of a mine’s production phase must be included in expenses when incurred.
(o) Treasury shares -
| (o) | Treasury shares - |
The Company, through a subsidiary, has treasury shares (common and investment shares). The nominal values of these shares are presented net of the capital stock and investment shares amounts.
The effect of the dividends income arising from the treasury shares held by the subsidiary are excluded for calculating the share’sshare in subsidiary and associates income and are presented net from declared a paid dividends in the consolidated statements of changes in shareholders’shareholders´ equity.
(p) Revenue recognition –Notes to the consolidated financial statements (continued)
| (p) | Revenue recognition - |
Revenue is recognized to the extent that it is probable that the economic benefits will flow to the Company. Revenue is measured at the fair value of the consideration received, excluding discounts. The following specific recognition criteria must also be met before revenue is recognized:
Sales of concentrates, gold and silver -
Revenues from sales of concentrates, gold and silver are recognized when the significant risks and rewards of ownership are transferred to the buyer, and selling price are known or can be reasonably estimated.
As far as the measurement of revenues from the sale of concentrate, the Company assigns a provisional value to these sales, since they are subject to a final price adjustment at the end of a contractually-set period, which normally ranges between 30 and 180 days after delivery of the concentrate to the customer. Exposure to changes in metals price generatesis considered to contain an embedded derivative that mustwhich is required to be separated from the host commercial contract.contract for accounting purposes. At the close of each period, the sale price used initially is adjusted in accordance with the future price for the quotation period stipulated in the contract. Adjustment of the provisional sale value is posted as an increase or decrease in net sales.
Interest received -
Financial income is recognized as interest accrues.
Income for engineering service rendered -
Income for engineering service rendered by Buenaventura Ingenieros S.A., a subsidiary of the Company, is recognized based on the progress of the current service contracts.
(q) Borrowing costs -Income for construction services –
When the outcome of a contract can be estimated reliably, contract revenue associated with the construction contract shall be recognized by reference to the stage of completion of the contract activity at the end of the reporting period.
Notes to the consolidated financial statements (continued)
| (q) | Borrowing costs - |
Borrowing costs directly relating to the acquisition, construction or production of a qualifying asset are capitalized, and added to the project’s cost until such time as the assets are considered substantially ready for their planned use, that is to say, when they are capable of generating commercial production. A qualifying asset is which value is higher than US$5,000,0005 million and its substantial period is greater than 12 months. Where funds are borrowed specifically to finance a project, the amount capitalized represents the actual borrowing costs incurred. Where surplus funds are available for a short term out of money borrowed specifically to finance a project, the income generated from the temporary investment of such amounts is also capitalized and deducted from the total capitalized borrowing cost. Where the funds used to finance a project form part of general borrowings, the amount capitalized is calculated using a weighted average of rates applicable to relevant general borrowings of the Company during the period. All other borrowing costs are recognized in the consolidated income statement in the period in which they are incurred.
| (r) | Income tax – |
(r) Current taxes –
Income tax -
Current portion of the income tax -
Income Tax for the current period are measured based on the separate financial statements of the CompanyBuenaventura and each subsidiary in Nuevos Soles and for the amount expected to be paid to the tax authorities. The rates and laws used to compute the amount are those in force as of the date of the consolidated statement of financial position.
Current income tax relating to items recognized directly in other comprehensive income or equity is recognized in other comprehensive income or equity and not in the profit or loss.consolidated income statement. Management periodically evaluates positions taken in the tax returns with respect to situations in which applicable tax regulations are subject to interpretation and establishes provisions where appropriate.
Mining Royalties and Special Mining Tax
Mining Royalties and Special Mining Tax are accounted for under IAS 12 “Income tax” when they have the characteristics of an income tax. This is considered to be the case when they are imposed under government authority and the amount payable is based on revenues less expenses after adjustments for temporary differences, rather than based on quantity produced or as a percentage of revenue. Tax rates and tax laws used to compute the amount are those that have been enacted by the end of the reporting period as of the date of the consolidated statement of financial position.
| Therefore, payments made by the Company to government authority as Mining Royalties and Special Mining Tax are in the scope of IAS 12 and be considered as income tax. Both, Mining Royalties and Special Mining Tax generated deferred assets and liabilities which should be measured using average rates that have to be applied to operating income in those quarters in which the Company expects to reverse the temporary differences. |
Notes to the consolidated financial statements (continued)
Deferred portion of income tax -
The income tax, mining royalties and special mining tax for future periods are recognized using the liability method, considering the temporary differences between the taxtaxes and accounting bases of assets and liabilities as of the date of the consolidated statement of financial position.
Deferred income tax liabilities are recognized for all taxable temporary differences, except for taxable temporary differences associated with investments in subsidiaries and associates where the timing of the reversal of the temporary differences can be controlled and it is probable that the temporary differences will reverse in the foreseeable future.
All deductible temporary differences and loss carryforwards generate the recognition of deferred assets to the extent that it is probable that they can be used in calculating taxable income in future years. Deferred income tax liabilities are recognized for all deductible temporary differences and tax loss carry-forwards, to the extent that is probable that taxable profit will be available against which the deductible temporary differences and unused tax losses can be utilized.
The carrying amount of the deferred income tax assets is reviewed at each consolidated statement of financial position date and reduced to the extent that it is no longer probable that sufficient taxable profit will be available to allow all or part of the deferred asset to be utilized. Unrecognized deferred assets are reassessed at each consolidated statement of financial position date.
Deferred tax relating to items recognized outside profit or loss is recognized outside profit and loss. Deferred tax items are recognized in correlation to the underlying transaction either in other comprehensive income or directly in equity.
Deferred assets and liabilities are offset if there is a legal right to set them off and the taxes deferred relate to the same entity and the same tax authority.
| (s) | Derivative financial instruments - |
Mining Royalties and Special Mining Tax -
Mining Royalties and Special Mining Tax are accounted for under IAS 12 when they have the characteristics of an income tax. This is considered to be the case when they are imposed under government authority and the amount payable is based on net amount (revenues less expenses after temporary differences adjustments), rather than based on quantity produced or as a percentage of income.
Therefore, payments made by the Company to government authority as Mining Royalties and Special Mining Tax are in the scope of IAS 12 and be considered as income tax. Both, Mining Royalties and Special Mining Tax generated deferred assets and liabilities which should be measured using average rates that have to be applied to operating income in those quarters in which the Company expects to reverse the temporary differences.
(s) Derivative financial instruments -
Derivatives not designated as hedging instruments -
Embedded derivative
Derivatives embedded in host contracts are accounted for as separate derivatives and recorded at fair value if their economic characteristics and risks are not closely related to those of the host contracts and the host contracts are not held for trading or designated at fair value though profit or loss. These embedded derivatives are measured at fair value with changes in fair value recognisedrecognized in profit or loss.
Notes to the consolidated financial statements (continued)
Derivatives designated as hedging instruments -
The El Brocal subsidiary uses derivative instruments to manage its exposure to changes in metals prices. In order to manage special risks, El Brocal applies hedge accounting for those transactions that meet the specific criteria applicable.
At the inception date of the hedge relation, the subsidiary El Brocal formally documents the relationship between the item hedged and the hedging instrument, including the nature of the risk, the objective and the strategy to be taken to carry out the hedging, and the method to be used to estimate the effectiveness of the hedge relation.
A formal assessment is made upon beginning the hedge relation, to assure that the hedging instrument is highly effective in offsetting the risk designated in the item hedged. Hedges are formally assessed every half. A hedge is considered as highly effective if it is expected that the changes in cash flow attributed to the risk hedged during the period for which the hedge is designated are offset within a range from 80 to 125 percent.
As of December 31, 2011, 2010 and January 1, 2010, El Brocal subsidiary had contracted derivative instruments on metals quotes underAll the Asian swap and collar option modes that qualifyhedges maintained by the Company classifies as cash-flow hedging instruments.
For those cash flow hedges, that qualify as such,consequence, any gain or loss from the effective portion of the hedging instrument is initially recognized in the consolidated statement of changes in shareholders’ equity in the “Unrealized gain (loss) on valuation“Other reserves of derivative financial instruments for hedging, net”equity” caption. Any gain or loss from the ineffective portion of the hedging instrument is initially recognized in the consolidated income statement in the “Interest expenses” caption. WhenAmounts recognized as equity transaction are transferred to the cash flow hedged affects the consolidated income statement any gainwhen the hedge transaction affects profit or loss, from the hedging instrumentsuch as when a forecast sale occurs and is posted in the “Net sales” caption of the consolidated income statement.
As of December 31, 2011, El Brocal subsidiary had contracted derivative instruments on metals quotes under the Asian swap and collar option modes that qualify as cash-flow hedging instruments. As of December 31, 2012, El Brocal does not have hedging financial instruments.
Current versus non-current classification –
-
Derivative instruments that are not designated as hedging instruments are classified as current or non-current, or are separated into a current and a non-current portion based on an assessment of the facts and circumstances (for example, the underlying cash flows).
Notes to the consolidated financial statements (continued)
Embedded derivatives that are not closely related to the main contract are classified consistently with the cash flows of the host contract.
Derivative instruments designated as hedging instruments are classified in accordance with the classification of the underlying element hedged. The derivative instrument is separated into a current and a non-current portion only if a reliable allocation can be made.
(t) ImpairmentAs of non financialDecember 31, 2012, the Company has not have instruments -that qualify as hedging. As of December 31, 2011, the Company held those instruments (see note 27).
| (t) | Impairment of non financial instruments - |
The Company assesses at each reporting date whether there is an indication that an asset, determined by each individual asset (cash-generating unit) may be impaired.
A cash-generating unit is the smallest identifiable group of assets, denominated a mining unit, that generates cash inflows from continuing use that are independent of the cash inflow generated by other assets or groups of assets. In order to determine cash-generating units, the Company has determined whether there is an active market for the minerals and metals produced by a mining unit.
Impairment losses are recognized in the consolidated statement of income in those expense categories consistent with the function of the impaired asset. A previously recognized impairment loss is reversed only if there has been a change in the estimates used to determine the asset’s recoverable amount since the last impairment loss was recognized. The increased amount cannot exceed the carrying amount that would have been determined, net of depreciation, had no impairment loss been recognized for the asset in prior years. Such reversal is recognized in the consolidated statement of income.income statement.
| (u) | Basic and diluted earnings per share - |
(u) Basic and diluted earnings per share –
Basic and diluted earnings per share have been calculated based on the weighted average number of common and investment shares outstanding at the date of the consolidated statement of financial position; treasury shares have been excluded from the calculation. When the number of shares is modified as a result of capitalization of retained earnings, share splits or share grouping, the net income per basic and diluted shares is adjusted retroactively for all of the periods reported. If the change occurs after the date of the consolidated financial statements, but before the financial statement are authorized for issue, the calculation of net income per basic and diluted share for all of the reported periods must be based on the new number of shares, see note 26.25.
Notes to the consolidated financial statements (continued)
(v) Workers’ profit sharing -
| (v) | Workers’ profit sharing - |
The workers’ profit sharing is calculated according to law in force at today (Legislative Decree No. 892) over the same taxable net basis used to calculate the income tax. For the Company’s case, the workers’ profit sharing rate is 8% over the taxable net base of current year. According to Peruvian Law the limit in the workers’ profit sharing that an employee would receive is equivalent to 18 monthly wages. According to the article 3 of Law No. 28756 (and its regulation law), it has been established that excess amounts above such limit will be transferred to the “National Found for Employment’s Promotion and Training (“FONDOEMPLEO”, by its Spanish acronym)”. Such funds are used for workers training, employment promotion and public investment projects. The excess amount is retained and paid by the Company to the Peruvian government entities (FONDO EMPLEO and regional government).
The Company recognizes the current portion of workers’ profit sharing paid directly to them according to the IAS 19 “Employees Benefits” approach, considering them as benefits are all forms of consideration given by an entity in exchange for service rendered by employees. As a consequence, the Company recognized the workers’ profit sharing as cost or expenses, according to their duties or function.
In the periods in which the excess over the 18 wages limit arises, the Company considers this as part to the contributions made by the Company to the Government (FONDOEMPLEO) related to the workers’ profit sharing. This is classified as operating expenses in the consolidated income statement.
| (w) | Segments – |
| An operating segment is a component of |
| 2.4. | Reclassifications to the consolidated financial statements of prior years - |
(w) Segments -As of December 31, 2012, the Company made the following reclassifications in its consolidated financial statements for the year ended on December 31, 2011:
An operating segment is a component of an entity: (i) that engages in business activities from which it may earn revenues and incur expenses (including revenues and expenses relatingNotes to transactions with other components of the same entity), (ii) whose operating results are regularly reviewed by the Company’s Management to make decisions about resources to be allocated to the segment and assess its performance, and (iii) for which discrete financial information is available. See note 27.
2.4 New International Financial Reporting Standards (IFRS) internationally issued but not effective on the issuance date of the consolidated financial statements (continued)
| - | In the consolidated statement of cash flows, US$164,924,000 from the net sale of investment shares to non-controlling interest (see note 1 (f)), was reclassified from cash flows related to investment activities to cash flows related financing activities. |
| 2.5. | New International Financial Reporting Standards (IFRS) internationally issued but not effective on the issuance date of the consolidated financial statements - |
Improvements and interpretations issued as of December 31, 2012, include the following:
Standards issued but not yet effective upEffective the year 2012 –
There were no new standards and interpretations that were applicable to the date of issuance of the Company’s consolidated financial statements and the Company reasonably expects to have an impact on disclosures, financial position or performance when applied at a future date are:for 2012.
Effective as from January 1, 2013 -
| - | IAS 1, Presentation of Financial |
| - | IAS 27, Separate Financial Statements |
| - | IAS 28, Investments in |
| - | IFRS |
| - | IFRS 10, |
| - | IFRS 11, |
Notes to the consolidated financial statements (continued)
| - | IFRS 12, |
| - | IFRS 13, |
| - | IFRIC 20, |
The Company is still assessing the impact, if any, of adopting this amendments and new International Financial Reporting Standards (IFRS) issued which are not effective at the date of consolidated financial statements.
3. First time adoption of International Financial Reporting Standards (“IFRS”)
As part of the first adoption of the International Financial Reporting Standards (IFRS) in Peru, as of October 14, 2010, through Resolution N°102-2010-EF/94.01.1, the Superintendence of Securities Market (“SMV”, before CONASEV), required to all legal entities under its supervision to adopt IFRS since the year 2011.
For periods up to and including the year ended December 31, 2010, the Company prepared its financial statements in accordance with Generally Accepted Accounting Principles in Peru (Peru GAAP). These consolidated financial statements, for the year ended December 31, 2011, are the first the Company has prepared in accordance with IFRS, in which the Company has applied IFRS 1 “First Time Adoption of International Financial Reporting Standard” in the opening balance as of January 1, 2010, transition date to IFRS. The IFRS 1 application implies that all the standards are apply retrospectively at the transition date, including certain mandatory exceptions and voluntary exemptions defined in the standard.
In this sense, the Company had decided to apply the following exception accordingAnnual improvements to IFRS 1 Non-controlling interest, which allows that an entity that adopt for the first time the IFRS applied certain requirements of IAS 27 (amended(issued in 2008) prospectively from the date of transition to IFRS. The Company will record prospectively from transition date to IFRS (January 1, 2010) the amount paid in excess of the acquisition cost and the non-controlling interest over the acquirer’s identifiable assets and liabilities assumed in the business purchased as transactions in equity, according with the exception (b) mentioned in IFRS 1 Appendix B – B7. It means that changes in a parent’s ownership interest in a subsidiary that do not result in a loss of control are accounted for as equity transactions by the Company since January 1, 2010 and not for previous periods. Peruvian GAAP changed in 2010 and there is no difference for this item after the transition date.
Moreover, the exemptions mentioned in IFRS 1 that the Company had decided to apply in the adoption to IFRS process are the following:May 2012) -
Additionally, the exemption refers to business combinations in paragraph C5 also mention that will be applicable to past acquisitions of investments in associates and joint ventures, for which the Company had decided not to apply retrospectively the IFRS in acquisition of investments in associated occurred before transition date.
| - | IAS 32, Financial Instruments: Presentation, clarifies that income taxes arising from distributions to |
Estimates -Such improvements are effective for annual periods beginning on or after January 1, 2013.
The estimates at January 1, 2010, December 31, 2010 and 2011 are consistent with those made forAlthough Management does not believe the same dates in accordance with Generally Accepted Accounting Principles in Peru.
The estimates used bynew pronouncements will have a significant impact on the Company, to prepare itsManagement is currently evaluating their impact, if any, on the Company’s consolidated financial statements are according to IFRS and disclose its best knowledge of relevant facts and circumstances as of January 1, 2010, transition date and as of December 31, 2010.
The following tables and explanatory notes included in notes 3.1., 3.2., 3.3., 3.4. and 3.5., give a detail description of the principal differences between the Generally Accepted Accounting Principles in Peru and the International Financial Reporting Standard (IFRS) applied by the Company, and their impact over the shareholders’ equity as of December 31, 2010 and January 1, 2010, and over the net income for the year ended December 31, 2010.
3.1 Reconciliation of the consolidated statement of financial situation –2013.
| Note | As of January 1, 2010 under Peru GAAP | Re measurements | As of January 1, 2010 under IFRS | |||||||||||||
| US$(000) | US$(000) | US$(000) | ||||||||||||||
| Assets | ||||||||||||||||
| Current assets | ||||||||||||||||
| Cash and cash equivalents | 714,454 | - | 714,454 | |||||||||||||
| Financial assets at fair value through profit or loss | - | - | - | |||||||||||||
| Trade accounts receivable, net | 122,950 | - | 122,950 | |||||||||||||
| Other accounts receivable | 20,478 | - | 20,478 | |||||||||||||
| Accounts receivable from associates | 21,866 | - | 21,866 | |||||||||||||
| Embedded derivatives for concentrates sales, net | 4,546 | - | 4,546 | |||||||||||||
| Inventory, net | 40,385 | (31 | ) | 40,354 | ||||||||||||
| Prepaid expenses | 8,236 | - | 8,236 | |||||||||||||
| 932,915 | (31 | ) | 932,884 | |||||||||||||
| Non-current assets | ||||||||||||||||
| Other accounts receivable | 12,244 | - | 12,244 | |||||||||||||
| Long-term inventory | 4,602 | (110 | ) | 4,492 | ||||||||||||
| Investment in associates | 3.5.(e) | 1,126,167 | 24,872 | 1,151,039 | ||||||||||||
| Mining concessions development cost and property, plant and equipment, net | 3.5.(a) | 443,417 | 20,440 | 463,857 | ||||||||||||
| Deferred income tax asset, net | 3.5.(b), (d) | 243,719 | (41,388 | ) | 202,331 | |||||||||||
| Other assets | 5,045 | - | 5,045 | |||||||||||||
| Total assets | 2,768,109 | 3,783 | 2,771,892 | |||||||||||||
| Note | As of January 1, 2010 under Peru GAAP | Re measurements | As of January 1, 2010 under IFRS | |||||||||||||
| Liabilities and shareholders’ equity, net | ||||||||||||||||
| Current liabilities | ||||||||||||||||
| Trade accounts payable | $ | 61,357 | - | $ | 61,357 | |||||||||||
| Income tax payable | 20,528 | - | 20,528 | |||||||||||||
| Other accounts payable | 32,794 | - | 32,794 | |||||||||||||
| Provisions | 51,252 | - | 51,252 | |||||||||||||
| Derivative financial instruments liability | 1,468 | - | 1,468 | |||||||||||||
| Financial obligations | 79,452 | - | 79,452 | |||||||||||||
| 246,851 | - | 246,851 | ||||||||||||||
| Non-current liabilities | ||||||||||||||||
| Other non-current provisions | 102,008 | - | 102,008 | |||||||||||||
| Financial obligations | 150,555 | - | 150,555 | |||||||||||||
| Derivative financial instruments liability | 5,375 | - | 5,375 | |||||||||||||
| Total liabilities | 504,789 | 504,789 | ||||||||||||||
| Shareholders’ equity, net | ||||||||||||||||
| Capital stock, net of treasury shares for US$62,622,000 as of January 1, 2010 | 750,540 | - | 750,540 | |||||||||||||
| Investment shares, net of treasury shares for US$142,000 as of January 1, 2010 | 2,019 | - | 2,019 | |||||||||||||
| Additional paid-in capital | 225,978 | - | 225,978 | |||||||||||||
| Legal reserve | 112,363 | - | 112,363 | |||||||||||||
| Other reserves | 269 | - | 269 | |||||||||||||
| Retained earnings | 1,011,077 | (36,259 | ) | 974,818 | ||||||||||||
| Cumulative translation loss | 3.5.(c) | (34,075 | ) | 34,075 | - | |||||||||||
| Cumulative unrealized, gain (loss) | (3,916 | ) | 2,512 | (1,404 | ) | |||||||||||
| Shareholders’ equity attributable to owners of the parent | 2,064,255 | 328 | 2,064,583 | |||||||||||||
| Non-current interest | 199,065 | 3,455 | 202,520 | |||||||||||||
| Total shareholders’ equity, net | 2,263,320 | 3,783 | 2,267,103 | |||||||||||||
| Total liabilities and shareholders’ equity, net | 2,768,109 | 3,783 | 2,771,892 | |||||||||||||
(b) Additionally, a reconciliation between the consolidated statements of financial situation as of December 31, 2010 is provided below:
| Note | As of December 31, 2010 under Peru GAAP | Re measurements | As of December 31, 2010 under IFRS | |||||||||||
| US$(000) | US$(000) | US$(000) | ||||||||||||
| Assets | ||||||||||||||
| Current assets | ||||||||||||||
| Cash and cash equivalents | 600,796 | - | 600,796 | |||||||||||
| Financial assets at fair value through profit or loss | 50,154 | - | 50,154 | |||||||||||
| Note | As of December 31, 2010 under Peru GAAP | Re measurements | As of December 31, 2010 under IFRS | |||||||||||||
| Trade accounts receivable, net | 160,928 | - | 160,928 | |||||||||||||
| Other accounts receivable | 42,218 | - | 42,218 | |||||||||||||
| Accounts receivable from associates | 18,903 | - | 18,903 | |||||||||||||
| Embedded derivatives for concentrates sales, net | 13,645 | - | 13,645 | |||||||||||||
| Inventory, net | 82,081 | 251 | 82,332 | |||||||||||||
| Prepaid expenses | 2,990 | - | 2,990 | |||||||||||||
| 971,715 | 251 | 971,966 | ||||||||||||||
| Non-current assets | ||||||||||||||||
| Other accounts receivable | 14,425 | - | 14,425 | |||||||||||||
| Other accounts receivable from associates | 20,736 | - | 20,736 | |||||||||||||
| Long-term inventory | 27,104 | 56 | 27,160 | |||||||||||||
| Investment in associates | 3.5.( | e) | 1,404,659 | 25,019 | 1,429,678 | |||||||||||
| Mining concessions, development cost and property plant and equipment, net | 3.5.( | a) | 618,917 | 16,319 | 635,236 | |||||||||||
| Deferred income tax asset, net | 3.5.(b), ( | d) | 213,693 | (39,643 | ) | 174,050 | ||||||||||
| Other assets | 6,095 | - | 6,095 | |||||||||||||
| Total assets | 3,277,344 | 2,002 | 3,279,346 | |||||||||||||
| Liabilities and shareholders’ equity, net | ||||||||||||||||
| Current liabilities | ||||||||||||||||
| Trade accounts payable | 91,374 | - | 91,374 | |||||||||||||
| Income tax payable | 26,538 | 587 | 27,125 | |||||||||||||
| Other accounts payable | 49,983 | 164 | 50,147 | |||||||||||||
| Provisions | 65,855 | - | 65,855 | |||||||||||||
| Other accounts payable to associates | 1,584 | - | 1,584 | |||||||||||||
| Derivative financial instruments liability | 16,291 | - | 16,291 | |||||||||||||
| Financial obligations | 2,018 | - | 2,018 | |||||||||||||
| 253,643 | 751 | 254,394 | ||||||||||||||
| Non-current liabilities | ||||||||||||||||
| Other non-current provisions | 116,214 | - | 116,214 | |||||||||||||
| Other accounts payable to associates | 1,370 | - | 1,370 | |||||||||||||
| Financial obligations | 55,134 | - | 55,134 | |||||||||||||
| Derivative financial instruments liability | 6,897 | - | 6,897 | |||||||||||||
| Total liabilities | 433,258 | 751 | 434,009 | |||||||||||||
| Shareholders’ equity, net | 3.6.( | e) | ||||||||||||||
| Capital stock, net of treasury shares for US$62,622,000 in the year 2010 | 750,540 | - | 750,540 | |||||||||||||
| Investment shares, net of treasury shares for US$142,000 in the year 2010 | 2,019 | - | 2,019 | |||||||||||||
| Additional paid-in capital | 225,978 | - | 225,978 | |||||||||||||
| Legal reserve | 162,633 | - | 162,633 | |||||||||||||
| Other reserves | 269 | - | 269 | |||||||||||||
| Retained earnings | 1,506,725 | (35,713 | ) | 1,471,012 | ||||||||||||
| Cumulative translation loss | 3.6.( | c) | (34,075 | ) | 34,075 | - | ||||||||||
| Accumulative unrealized, gain (loss) | (6,233 | ) | 327 | (5,906 | ) | |||||||||||
| Note | As of December 31, 2010 under Peru GAAP | Re measurements | As of December 31, 2010 under IFRS | ||||||||||
| Shareholders’ equity attributable to owners of the parent | 2,607,856 | (1,311 | ) | 2,606,545 | |||||||||
| Non-controlling interest | 236,230 | 2,562 | 238,792 | ||||||||||
| Total shareholders’ equity | 2,844,086 | 1,251 | 2,845,337 | ||||||||||
| Total liabilities and shareholders’ equity | 3,277,344 | 2,002 | 3,279,346 | ||||||||||
3.2 Reconciliation of the consolidated income statement –
Reconciliation between the income statement under the Generally Accepted Accounting PrinciplesTransactions in Peru and IFRS for the year 2010 is provided below:
| Note | For the year ended as of December 31, 2010 under Peru GAAP | Re measurements | For the year ended as of December 31, 2010 under IFRS | |||||||||||||
| US$(000) | US$(000) | US$(000) | ||||||||||||||
| Operating income | ||||||||||||||||
| Net sales | 1,047,885 | - | 1,047,885 | |||||||||||||
| Royalty income | 55,883 | - | 55,883 | |||||||||||||
| Total income | 1,103,768 | - | 1,103,768 | |||||||||||||
| Operating costs | ||||||||||||||||
| Cost of sales, without considering depreciation and amortization | 3.5.( | b) | (340,840 | ) | (6,289 | ) | (347,129 | ) | ||||||||
| Exploration in units in operation | (91,441 | ) | - | (91,441 | ) | |||||||||||
| Depreciation and amortization | 3.5.( | a) | (71,694 | ) | (3,170 | ) | (74,864 | ) | ||||||||
| Royalties | (52,270 | ) | - | (52,270 | ) | |||||||||||
| Total operating costs | (556,245 | ) | (9,459 | ) | (565,704 | ) | ||||||||||
| Gross income | 547,523 | (9,459 | ) | 538,064 | ||||||||||||
| Operating expenses | ||||||||||||||||
| Administrative | 3.5.( | b) | (92,606 | ) | (14,631 | ) | (107,237 | ) | ||||||||
| Exploring in non-operating areas | (36,105 | ) | - | (36,105 | ) | |||||||||||
| Selling | (9,375 | ) | - | (9,375 | ) | |||||||||||
| Reimbursement of exploration expenses on projects | 15,013 | - | 15,013 | |||||||||||||
| Reversal (provision) for impairment of long-lived assets | 13,135 | - | 13,135 | |||||||||||||
| Other, net | 10,915 | (262 | ) | 10,653 | ||||||||||||
| Total operating expenses | (99,023 | ) | (14,893 | ) | (113,916 | ) | ||||||||||
| Note | For the year ended as of December 31, 2010 under Peru GAAP | Re measurements | For the year ended as of December 31, 2010 under IFRS | |||||||||||||
| Operating income | 448,500 | (24,352) | 424,148 | |||||||||||||
| Other income (expenses), net | ||||||||||||||||
| Share in the results of associates | 428,742 | 143 | 428,885 | |||||||||||||
| Interest income | 8,203 | - | 8,203 | |||||||||||||
| Interest expense | (12,271 | ) | - | (12,271 | ) | |||||||||||
| Gain (loss) from currency exchange difference, net | (750 | ) | - | (750 | ) | |||||||||||
| Total other income, net | 423,924 | 143 | 424,067 | |||||||||||||
| Income before income tax and non-controlling interest | 872,424 | (24,209 | ) | 848,215 | ||||||||||||
| Worker’s profit sharing | 3.5.( | b) | (28,724 | ) | 28,724 | - | ||||||||||
| Income tax | 3.5.( | b) | (116,327 | ) | (6,999 | ) | (123,326 | ) | ||||||||
| 727,373 | (2,484 | ) | 724,889 | |||||||||||||
| Net income attributable to non-controlling interest | 64,439 | (371 | ) | 64,068 | ||||||||||||
| Net income attributable to Buenaventura | 662,934 | (2,113 | ) | 660,821 | ||||||||||||
| 727,373 | (2,484 | ) | 724,889 | |||||||||||||
| Basic and diluted earnings per share attributable to Buenaventura stated in U.S. dollars | 2.60 | 2.85 | ||||||||||||||
| Weighted average number of shares outstanding (common and investment) in units | 254,442,328 | 254,442,328 | ||||||||||||||
3.3 Reconciliation of the consolidated statement of comprehensive income -
Reconciliation between the consolidated statement of comprehensive income under the Generally Accepted Accounting Principles in Peru and IFRS for the year 2010 is provided below:
| Note | For the year ended December 31, 2010 under Peru GAAP | Remeasurements | For the year ended December 31, 2010 under IFRS | |||||||||||||
| US$(000) | US$(000) | US$(000) | ||||||||||||||
| Net income | 727,373 | (2,484 | ) | 724,889 | ||||||||||||
| Net change in unrealized loss on hedging derivative financial instruments | (16,345 | ) | - | (16,345 | ) | |||||||||||
| Income tax for the effect in unrealized loss on hedging derivative financial instruments | 5,819 | (916 | ) | 4,903 | ||||||||||||
| Net change in unrealized gain on other investments | 477 | - | 477 | |||||||||||||
| Total comprehensive income | 717,324 | (3,400 | ) | 713,924 | ||||||||||||
| Attributable to: | ||||||||||||||||
| Owners of the parent | 662,934 | (6,615 | ) | 656,319 | ||||||||||||
| Non-controlling interest | 54,390 | 3,215 | 57,605 | |||||||||||||
| Total comprehensive income | 717,324 | 713,924 | ||||||||||||||
3.4 Reconciliation of the consolidated statement of cash flows -
The IFRS adoption has no significant effects upon the reported cash flows for operating, investment and financing activities.
3.5 Notes to the reconciliation of the consolidated statement of financial situation and income –
Beginning balance –
The beginning balance is based in the consolidated financial statement according to Generally Accepted Accounting Principles in Peru.
Remeasurement –
The IFRS adoption has required adjustments to the existence balance in the previous financial statements under Generally Accepted Accounting Principles in Peru. The main adjustments are:
(a) Property, plant and equipment -
Cost
Generally Accepted Accounting Principles in Peru
Effective January 1, 1994, the Peruvian economy was not considered as hyperinflationary economy according to IAS 29 - “Financial Reporting Hyperinflationary Economies”. Until 2004, Peruvian companies had calculated and recorded adjustments for inflation on no monetary assets. The fixed asset caption had been adjusted by inflation to reflect the effect of the variation of the acquisition power of the Nuevo Sol, even though Peruvian economy has not accomplished the hyperinflation characteristic according to IAS 29. As a result, the carry amount of fixed asset represent the real cost plus the inflation adjustment until 2004.
International Financial Reporting Standard
According to IAS 29, the Company was not permitted to adjust by inflation from January 1, 1994 to December 31, 2004. In order to address this issue, the Company has elected to measure certain items of property, plant and equipment at fair value at the date of transition to IFRS, based on a valuation made by an independent appraiser and uses this value as deemed cost in accordance with the IFRS 1 exemption. The revaluated assets are mainly machinery and equipment of plant and mine.
Accumulated depreciation
Generally Accepted Accounting Principles in Peru
Under Peruvian GAAP was not require entities to account for the residual value of an asset, additionally, it is not required to have a separate depreciation of each part of an item of property, plant and equipment that is significant in relation to the total cost of the item. The normal practice is to depreciate the whole item using a single depreciation rate.
International Financial Reporting Standard
IAS 16 “Property, Plant and Equipment” requires an entity to estimate the residual value of an item of property, plant and equipment in order to determine the depreciable amount. Additionally, IAS 16 requires significant components parts of an item of property, plant and equipment to be depreciated separately.
(b) Workers’ profit sharing –
Generally Accepted Accounting Principles in Peru
Under generally Accepted Accounting Principles in Peru, companies were required to account workers’ profit sharing similar as an income tax in accordance with IAS 12 “Income Taxes”. This treatment resulted in the recognition of the deferred portion of workers’ profit sharing representing the future profit share that will be paid when existing temporary differences reverse, creating a taxable base.
International Financial Reporting Standard
At the November 2010 IFRS IFRIC meeting, the IFRIC concluded that employee profit sharing must be accounted for in accordance with IAS 19 “Employee Benefits” and not according to IAS 12 “Income Taxes”.
As a consequence, the Company is in force to recognize a liability when the employee had rendered a service; therefore, a deferred workers’ profit sharing should not be calculated for temporary differences, because these corresponds to future services that should not be considered as obligations or rights under IAS 19.
(c) Cumulative translation differences –
Generally Accepted Accounting Principles in Peru
The Company had recorded the cumulative translation differences generated by the participation in associates Minera Yanacocha S.R.L. and Sociedad Minera Cerro Verde S.A.A., as a consequence that the associates’ functional currency was U.S. dollars and the Company’s functional currency until 2005 was Nuevo Sol. The translation effect was disclosed in the consolidated statement of changes in shareholders’ equity under Generally Accepted Accounting Principles in Peru (US$34,075,000 as of January 1, 2010 and December 31, 2010).
International Financial Reporting Standard
Under IFRS 1 exemption, the carrying amount related to cumulative translation differences are zero at the date of transition to IFRS, as of January 1, 2010.
(d) Deferred income tax -
The various transitional remeasurements lead to different temporary differences. According to the accounting policies in note 2.3.(r), the Company has to account for such differences. Deferred income tax adjustments are recognized in correlation to underlying transaction in retained earnings in the consolidated statement of change in shareholders’ equity at the date of transition.
(e) Investment -
Investments in associates
Considering that the Company has significant investments (Minera Yanacocha S.R.L. and Sociedad Minera Cerro Verde S.A.A.), the financial statements of these companies had been modified to prepare them according to IFRS. See note 10(d).
4. Foreign currency transactions
Translations to foreign currency (Nuevos Soles)Nuevos Soles are completed using exchange rates published by the Superintendent of Banks, Insurance and AFP. As of December 31, 2011,2012, the exchange rates for U.S. dollars published by this Institution were S/.2.695US$0.3923 for buying and S/.2.697US$0.3920 for selling (S/.2.808(US$0.3711 for buying and S/.2.809US$0.3708 for selling as of December 31, 2010)2011) and have been applied for the assets and liabilities accounts, respectively.
Notes to the consolidated financial statements (continued)
As of December 31, 2012 and 2011, the El Brocal subsidiary has S/.49,000,000 in time deposits (S/.55,000,000 as of December 31, 2010)Company had the following assets and Buenaventura Ingenieros S.A. has S/.13,500,000 in time deposits (they do not have time deposit as of December 31, 2010). There are no significant additional monetary assets or liabilities denominated in Nuevos Soles as of December 31, 2011 and 2010.Soles:
| 2012 | 2011 | |||||||
| S/.(000) | S/.(000) | |||||||
| Asset | ||||||||
| Cash and cash equivalents | 23,744 | 25,085 | ||||||
| Other accounts receivable | 54,331 | 60,721 | ||||||
| Prepaid expenses | 2,484 | - | ||||||
| 80,559 | 85,806 | |||||||
| Liabilities | ||||||||
| Trade accounts payable | (125,601 | ) | (95,098 | ) | ||||
| Other accounts payable | (129,624 | ) | (192,947 | ) | ||||
| Provisions | (40,908 | ) | (24,135 | ) | ||||
| (296,133 | ) | (312,180 | ) | |||||
| Liability position, net | (215,574 | ) | (226,374 | ) | ||||
| 4. | Cash and cash equivalents |
5. Cash and cash equivalents
(a) The table below presents the components of this caption:
| 2011 | 2010 | As of January 1, 2010 | 2012 | 2011 | ||||||||||||||||
| US$(000) | US$(000) | US$(000) | US$(000) | US$(000) | ||||||||||||||||
| Cash | 908 | 696 | 555 | 1,017 | 908 | |||||||||||||||
| Bank accounts | 71,883 | 124,270 | 50,274 | 67,695 | 71,883 | |||||||||||||||
| Time deposits (b) | 398,056 | 457,895 | 663,625 | 118,000 | 398,056 | |||||||||||||||
| Cash balances included in the consolidated statement of cash flows | 470,847 | 582,861 | 714,454 | 186,712 | 470,847 | |||||||||||||||
| Time deposits with original maturity greater than 90 days (c) | 10,121 | 17,935 | - | - | 10,121 | |||||||||||||||
| 480,968 | 600,796 | 714,454 | ||||||||||||||||||
| 186,712 | 480,968 | |||||||||||||||||||
Notes to the consolidated financial statements (continued)
| (b) | The table below presents the components of time deposits as of December 31, 2012: |
| Currency | Original maturities | Annual interest rate | ||||||
| % | US$(000) | |||||||
| U.S. dollars | From 5 to 13 days | From 1.3 to 1.70 | 118,000 | |||||
| 118,000 | ||||||||
(b) The table below presents the components of time deposits as of December 31, 2011:
| Currency | Original maturities | Annual interest rate | ||||||
| % | US$(000) | |||||||
| U.S. dollars | From 5 to 63 days | From 0.50 to 1.42 | 381,000 | |||||
| Nuevos Soles | From 42 to 90 days | From 4.05 to | 17,056 | |||||
The table below presents the components of time deposits as of December 31, 2010:
The table below presents the components of time deposits as of January 1, 2010:
| (c) | As of December 31, 2011, it mainly corresponds to time deposits maintained by El Brocal and Buenaventura Ingenieros S.A.: |
| Currency | Original maturities | Annual interest rate | ||||||
| % | US$(000) | |||||||
| U.S. dollars | From 113 to 168 days | From 0.90 to 1.07 | 4,000 | |||||
| Nuevos Soles | From 104 to 198 days | From 4.10 to 4.48 | 6,121 | |||||
The table below presents the components of time deposits as of December 31, 2010:
6. Financial assets at fair value through profit or loss
| 5. | Financial assets at fair value through profit or loss |
Buenaventura’s Management decided to invest the excess cash in mutual funds of variable income, which had been designated as financial assets at fair value through profit or loss. According to note 2.3.(b), the Company recorded in the year 20112012 an increase in the net investment amounted to US$2,331,000 (US$2,024,000 (US$154,000 in the year 2010)2011), to profit and loss to take this investment at fair value as of December 31, 2011.2012. The table below presents the components of this caption:
| Issuer | 2011 | 2010 | As of January 1, 2010 | |||||||||
| US$(000) | US$(000) | US$(000) | ||||||||||
| Credifondo S.A. SAF | 52,178 | 50,154 | - | |||||||||
| 52,178 | 50,154 | - | ||||||||||
| 2012 | 2011 | |||||||
| US$(000) | US$(000) | |||||||
| Credifondo S.A. SAF | 54,509 | 52,178 | ||||||
| 54,509 | 52,178 | |||||||
Notes to the consolidated financial statements (continued)
This fund is comprised by a portfolio of investments issued by Peruvian Government and financial entities with high reputation in the local market. The outcome of the investment is variable. The fund is considered a low-risk investment. According to Management’s opinion, this fund is highly liquid.
| 6. | Trade accounts receivable, net |
| (a) | The table below presents the components of |
| 2012 | 2011 | |||||||
| US$(000) | US$(000) | |||||||
| Johnson Matthey Limited | 80,214 | 78,520 | ||||||
| Louis Dreyfus Commodities Metals | 48,253 | 19,874 | ||||||
| Glencore Peru S.A. | 45,014 | 32,250 | ||||||
| Doe Run Peru S.R.L. | 16,822 | 16,814 | ||||||
| MCC Non Ferrous Trading Inc. | 16,306 | - | ||||||
| MRI Trading GMBH | 11,805 | - | ||||||
| N.V. Umicore | 8,485 | 12,175 | ||||||
| Consorcio Minero S.A. – CORMIN | 7,340 | 9,108 | ||||||
| Minera Suyamarca S.A. | 5,045 | - | ||||||
| BHL Peru S.A.C. | 4,927 | 4,927 | ||||||
| Sumitomo Corporation of America | 4,367 | - | ||||||
| Rímac Internacional Cia. Seguros y Reaseguros | 4,210 | - | ||||||
| Sudamericana Trading S.R.L. | 3,358 | 4,197 | ||||||
| Werco Trade AG | 2,467 | - | ||||||
| Andina Trade S.A.C. | 2,458 | - | ||||||
| Traxys Peru S.A.C. | 2,002 | 2,452 | ||||||
| MK Metal Trading GMBH | 1,794 | 3,318 | ||||||
| Sinclair Knight Merz S.A.C. | 1,255 | - | ||||||
| Compañía Minera Ares S.A.C. | 1,251 | - | ||||||
| MR Trading AG | 1,080 | 1,478 | ||||||
| Transportadora Callao S.A. | 836 | - | ||||||
| Hudbay Peru S.A. | 695 | - | ||||||
| Empresa Administradora Cerro S.A. | 655 | - | ||||||
| Compañía Minera Antamina S.A. | 294 | 1,207 | ||||||
| Glencore International A.G. | - | 631 | ||||||
| Other minors | 7,239 | 7,359 | ||||||
| 278,172 | 194,310 | |||||||
| Allowance for doubtful accounts (b) | (21,741 | ) | (21,741 | ) | ||||
| 256,431 | 172,569 | |||||||
7. Trade accounts receivable, netNotes to the consolidated financial statements (continued)
(a) The table below presents the components of this caption:
| 2011 | 2010 | As of January 1, 2010 | ||||||||||
| US$(000) | US$(000) | US$(000) | ||||||||||
| Johnson Matthey Limited | 78,520 | 40,736 | 42,110 | |||||||||
| Glencore Perú S.A. | 32,250 | 20,396 | - | |||||||||
| Louis Dreyfus Commodities Metals | 19,874 | 46,893 | 9,016 | |||||||||
| Doe Run Peru S.R.L. | 16,814 | 16,814 | 16,814 | |||||||||
| N.V. Umicore | 12,175 | 15,187 | - | |||||||||
| Consorcio Minero S.A. – CORMIN | 9,108 | 12,538 | 18,954 | |||||||||
| BHL Perú S.A.C. | 4,927 | 4,927 | 4,927 | |||||||||
| Sudamericana Trading S.R.L. | 4,197 | 1,660 | 1,917 | |||||||||
| MK Metal Trading GMBH | 3,318 | - | 130 | |||||||||
| Traxys Perú S.A.C. | 2,452 | 5,347 | - | |||||||||
| MR Trading AG | 1,478 | 347 | 43 | |||||||||
| Compañía Minera Antamina S.A. | 1,207 | 4 | - | |||||||||
| Glencore International A.G. | 631 | 4,166 | 11,144 | |||||||||
| Votorantim Metais Cajamarquilla S.A. | - | 6,402 | 3,306 | |||||||||
| AYS S.A. | - | 1,098 | 30,601 | |||||||||
| MK Metal Trading Peru S.A.C. | - | - | 2,525 | |||||||||
| Other | 7,359 | 6,154 | 3,204 | |||||||||
| 194,310 | 182,669 | 144,691 | ||||||||||
| Allowance for doubtful accounts (b) | (21,741 | ) | (21,741 | ) | (21,741 | ) | ||||||
| 172,569 | 160,928 | 122,950 | ||||||||||
The accounts receivable are denominated in U.S. dollars, have current maturities, do not accrue interest, have no specific guarantees and are unsecured.
The aging of the trade accounts receivable balance was as follows:
| 2011 | 2010 | As of January 1, 2010 | ||||||||||||||||||||||||||||||||||
| Not Impaired | Impaired | Total | Not Impaired | Impaired | Total | Not Impaired | Impaired | Total | ||||||||||||||||||||||||||||
| US$(000) | US$(000) | US$(000) | US$(000) | US$(000) | US$(000) | US$(000) | US$(000) | US$(000) | ||||||||||||||||||||||||||||
| Not due | 170,293 | - | 170,293 | 160,928 | - | 160,928 | 122,595 | - | 122,595 | |||||||||||||||||||||||||||
| Due | ||||||||||||||||||||||||||||||||||||
| From 1 to 30 days | - | - | - | - | - | - | 111 | - | 111 | |||||||||||||||||||||||||||
| From 31 to 60 days | - | - | - | - | - | - | 86 | - | 86 | |||||||||||||||||||||||||||
| From 61 to 120 days | - | - | - | - | - | - | 158 | - | 158 | |||||||||||||||||||||||||||
| More than 120 days | 2,276 | 21,741 | 24,017 | 21,741 | 21,741 | - | 21,741 | 21,741 | ||||||||||||||||||||||||||||
| 172,569 | 21,741 | 194,310 | 160,928 | 21,741 | 182,669 | 122,950 | 21,741 | 144,691 | ||||||||||||||||||||||||||||
As of December 31, 2012:
| Not impaired | Impaired | Total | ||||||||||
| US$(000) | US$(000) | US$(000) | ||||||||||
| Not due | 256,431 | - | 256,431 | |||||||||
| Due | ||||||||||||
| From 1 to 120 days | - | - | - | |||||||||
| More than 120 days | - | 21,741 | 21,741 | |||||||||
| 256,431 | 21,741 | 278,172 | ||||||||||
As of December 31, 2011:
| Not impaired | Impaired | Total | ||||||||||
| US$(000) | US$(000) | US$(000) | ||||||||||
| Not due | 172,569 | - | 172,569 | |||||||||
| Due | ||||||||||||
| From 1 to 120 days | - | - | - | |||||||||
| More than 120 days | - | 21,741 | 21,741 | |||||||||
| 172,569 | 21,741 | 194,310 | ||||||||||
In the process of estimating the allowance for doubtful accounts, the Company’s Management constantly evaluates market conditions, for which it uses analysis of aging and risk-rating reports for commercial operations.
| (b) | The allowance for doubtful accounts had no movement during 2012, 2011 and 2010. In the opinion of the Company’s Management, the allowance for doubtful accounts is sufficient to cover the risk of non-performance as of the consolidated financial position date. |
8. Other accounts receivableNotes to the consolidated financial statements (continued)
| 7. | Other accounts receivable |
(a)
| (a) | The table below presents the components of this caption: |
| 2012 | 2011 | |||||||
| US$(000) | US$(000) | |||||||
| Value added tax credit | 52,655 | 22,235 | ||||||
| Income tax credit | 24,629 | 1,558 | ||||||
| Other accounts receivable to contractors | 16,993 | 10,166 | ||||||
| Advances to suppliers | 13,929 | 7,457 | ||||||
| Loans to employees | 1,421 | 1,025 | ||||||
| Loans to third parties | 725 | 2,966 | ||||||
| Other advances to employees | 662 | 360 | ||||||
| Claims to third parties | 580 | - | ||||||
| Warrant deposits | 363 | 397 | ||||||
| Interest receivable, other | 47 | 1,497 | ||||||
| Mining royalty credit | - | 1,057 | ||||||
| Valued added tax claimed | - | 1,502 | ||||||
| Other accounts receivable | 3,266 | 3,871 | ||||||
| 115,270 | 54,091 | |||||||
| Less – Non current portion | ||||||||
| Value added tax credit | (6,695 | ) | (5,537 | ) | ||||
| Other minors | (7 | ) | (33 | ) | ||||
| (6,702 | ) | (5,570 | ) | |||||
| Current portion | 108,568 | 48,521 | ||||||
| 8. | Inventory, net |
| (a) | The table below presents the components of this caption: |
| 2012 | 2011 | |||||||
| US$(000) | US$(000) | |||||||
| Finished goods | 31,163 | 19,026 | ||||||
| Products in process (b) | 148,533 | 140,775 | ||||||
| Spare parts and supplies | 42,552 | 41,205 | ||||||
| 222,248 | 201,006 | |||||||
| Provision for impairment of value of inventory (f) | (3,244 | ) | (3,053 | ) | ||||
| 219,004 | 197,953 | |||||||
| Less non-current portion (b) | (55,937 | ) | (48,845 | ) | ||||
| Current portion | 163,067 | 149,108 | ||||||
Notes to the consolidated financial statements (continued)
| 2011 | 2010 | As of January 1, 2010 | ||||||||||
| US$(000) | US$(000) | US$(000) | ||||||||||
| Value added tax credit | 22,235 | 27,507 | 13,899 | |||||||||
| Other accounts receivable to contractors | 10,166 | 6,270 | - | |||||||||
| Advances to suppliers | 7,457 | 139 | 2,720 | |||||||||
| Loans to third parties | 2,966 | 12,099 | 3,623 | |||||||||
| Income tax credit | 1,558 | 3,288 | 2,612 | |||||||||
| Valued added tax claimed | 1,502 | 1,483 | 1,402 | |||||||||
| Interest receivable and other | 1,497 | 60 | 270 | |||||||||
| Mining royalty credit | 1,057 | - | - | |||||||||
| Loans to employees | 1,025 | 935 | 984 | |||||||||
| Warrant deposits | 397 | 237 | 171 | |||||||||
| Other advances to employees | 360 | 437 | 408 | |||||||||
| Accounts receivable from Hidroelectrica Marañon | - | - | 1,737 | |||||||||
| Hedge | - | 2,227 | 1,703 | |||||||||
| Other accounts receivable | 3,871 | 1,961 | 3,193 | |||||||||
| 54,091 | 56,643 | 32,722 | ||||||||||
| Less – Non current portion | ||||||||||||
| Value added tax credit | 5,537 | 12,887 | 10,787 | |||||||||
| Valued added tax claimed | - | 1,483 | 1,402 | |||||||||
| Other minors | 33 | 55 | 55 | |||||||||
| 5,570 | 14,425 | 12,244 | ||||||||||
| Current portion | 48,521 | 42,218 | 20,478 | |||||||||
| (b) | The products in process include the following: |
9. Inventory, net
(a) The table below presents the components of this caption:
| 2011 | 2010 | As of January 1, 2010 | ||||||||||
| US$(000) | US$(000) | US$(000) | ||||||||||
| Products in process (b), note 20 | 140,775 | 77,441 | 15,650 | |||||||||
| Spare parts and supplies | 41,205 | 30,392 | 24,684 | |||||||||
| Finished goods, note 20 | 19,026 | 6,750 | 7,578 | |||||||||
| 201,006 | 114,583 | 47,912 | ||||||||||
| Provision for impairment of value of inventory (f) | (3,053 | ) | (5,091 | ) | (3,066 | ) | ||||||
| 197,953 | 109,492 | 44,846 | ||||||||||
| Less non-current portion (b) | (48,845 | ) | (27,160 | ) | (4,492 | ) | ||||||
| Current portion | 149,108 | 82,332 | 40,354 | |||||||||
(b) The products in process include the following:
| 2011 | 2010 | As of January 1, 2010 | 2012 | 2011 | ||||||||||||||||
| US$(000) | US$(000) | US$(000) | US$(000) | US$(000) | ||||||||||||||||
| Classified mineral | 62,052 | 28,559 | 4,492 | 69,149 | 62,052 | |||||||||||||||
| Activated coal (d) | 21,541 | 11,445 | - | |||||||||||||||||
| Leach pad | 19,646 | 18,113 | - | |||||||||||||||||
| Leach platform (d) | 35,885 | 19,646 | ||||||||||||||||||
| Ore cyanidation process | 21,044 | 14,956 | ||||||||||||||||||
| Activated coal (e) | 16,269 | 21,541 | ||||||||||||||||||
| Current mineral | 18,748 | 7,989 | 1,518 | 4,344 | 18,748 | |||||||||||||||
| Ore cyanidation process (c) | 14,956 | 9,992 | 6,942 | |||||||||||||||||
| Other | 3,832 | 1,343 | 2,698 | 1,842 | 3,832 | |||||||||||||||
| 140,775 | 77,441 | 15,650 | ||||||||||||||||||
| 148,533 | 140,775 | |||||||||||||||||||
| Less non-current position (e) | (48,845 | ) | (27,160 | ) | (4,492 | ) | (55,937 | ) | (48,845 | ) | ||||||||||
| Current position | 91,930 | 50,281 | 11,158 | 92,596 | 91,930 | |||||||||||||||
| (c) | The table below presents the detail of long-term inventory which corresponds to classified mineral that is kept in Tajo Norte deposit field by the subsidiary El Brocal: |
| 2012 | 2011 | |||||||||||||||
| US$(000) | DMT | US$(000) | DMT | |||||||||||||
| Classified mineral | ||||||||||||||||
| Type II (copper mineral) | 3,672 | 494,280 | 8,584 | 859,556 | ||||||||||||
| Type III (lead/zinc mineral) | 65,477 | 2,405,266 | 53,468 | 2,828,274 | ||||||||||||
| Total | 69,149 | 2,899,546 | 62,052 | 3,687,830 | ||||||||||||
| Non-current portion | 55,937 | 48,845 | ||||||||||||||
| Current portion | 13,212 | 13,207 | ||||||||||||||
As part of the mining unit preparation to extract and treat mineral to a 18,000 DMT/per day, El Brocal´s Management decided to accumulate the material with metal content in stock nearby to Tajo Norte in order to be treated when the expansion operation plant, which is estimated to be in the first semester of 2013.
El Brocal´s Management assessed the recoverability of its inventories in process based on the cash flow projections obtained by the production and sale of the different minerals. As of December 31, 2012 and 2011 Management has a plan to treat mineral in stock when the expansion operation plan finish, mentioned before, including the future costs of treatment and finishing, based on this plan these products will be recovery through trading.
Notes to the consolidated financial statements (continued)
| (d) | It includes gold content of mineral deposited in leach |
| Activated coal is related to granules of precious metals with crushed coconut shell which are the result of the gold and silver recovery method through cyanide saturated solutions. |
| 2011 | 2010 | As of January 1, 2010 | ||||||||||||||||||||||
| US$(000) | DMT | US$(000) | DMT | US$(000) | DMT | |||||||||||||||||||
| Classified mineral | ||||||||||||||||||||||||
| Type II (copper mineral) | 8,584 | 859,556 | 5,392 | 1,176,898 | 3,310 | 130,310 | ||||||||||||||||||
| Type III (lead/zinc mineral) | 53,468 | 2,828,274 | 23,167 | 2,623,264 | 1,182 | 46,543 | ||||||||||||||||||
| Total | 62,052 | 3,687,830 | 28,559 | 3,800,162 | 4,492 | 176,853 | ||||||||||||||||||
| Non-current portion | 48,845 | 27,160 | 4,492 | |||||||||||||||||||||
| Current portion | 13,207 | 1,399 | - | |||||||||||||||||||||
| (f) | The provision for impairment of value of inventory had the following movement during the years 2012, 2011 and 2010: |
As part of the mining unit preparation to extract and treat mineral to a 18,000 DMT/per day, El Brocal’s Management decided to accumulate the material with metal content in stock nearby to Tajo Norte in order to be treated when the expansion operation plant, which is estimated to be in the first semester of 2013.
| 2012 | 2011 | 2010 | ||||||||||
| US$(000) | US$(000) | US$(000) | ||||||||||
| Opening balance | 3,053 | 5,091 | 3,066 | |||||||||
| Provision for impairment of finished goods, note 19 | 212 | 383 | 1,648 | |||||||||
| Reversal of provision | (21 | ) | (2,413 | ) | (339 | ) | ||||||
| Provision for impairment of spare parts and Supplies | - | - | 716 | |||||||||
| Write-offs | - | (8 | ) | - | ||||||||
| Ending balance | 3,244 | 3,053 | 5,091 | |||||||||
El Brocal’s Management assessed the recoverability of its inventories in process based on the cash flow projections obtained by the production and sale of the different minerals. As of December 31, 2011 and 2010, Management has a plan to treat mineral in stock when the expansion operation plan finish, mentioned before, including the future costs of treatment and finishing, based on this plan these products will be recovery through trading.
(f) The provision for impairment of value of inventory had the following movement:
| 2011 | 2010 | As of January 1, 2010 | ||||||||||
| US$(000) | US$(000) | US$(000) | ||||||||||
| Opening balance | 5,091 | 3,066 | 2,652 | |||||||||
| Provision for impairment of finished goods, note 20 | 383 | 1,648 | 449 | |||||||||
| Provision for impairment of spare parts and supplies | - | 716 | 360 | |||||||||
| Reversal of provision | (2,413 | ) | (339 | ) | (360 | ) | ||||||
| Write-offs | (8 | ) | - | (35 | ) | |||||||
| Ending balance | 3,053 | 5,091 | 3,066 | |||||||||
In the opinion of CompanyCompany’s Management, the provision for impairment of value of inventory adequately covers this risk as of the date of the consolidated statement of financial position.
10.
| 9. | Investments in associates |
| (a) | The table below presents the components of this caption: |
| Share in shareholders’ equity | Amount | |||||||||||||||
| 2012 | 2011 | 2012 | 2011 | |||||||||||||
| % | % | US$(000) | US$(000) | |||||||||||||
| Investments held under the equity method | ||||||||||||||||
| Minera Yanacocha S.R.L. (d) and (e) | 43.65 | 43.65 | 1,585,395 | 1,312,051 | ||||||||||||
Notes to the consolidated financial statements (continued)
(a) The table below presents the components of this caption:
| Share in shareholders’ equity | Amount | |||||||||||||||
| 2012 | 2011 | 2012 | 2011 | |||||||||||||
| Sociedad Minera Cerro Verde S.A.A. (c), (e) and (h) | 19.584 | 19.349 | 783,368 | 602,790 | ||||||||||||
| Canteras del Hallazgo S.A.C. (g) | 49.00 | 49.00 | 32,423 | 5,237 | ||||||||||||
| Compañía Minera Coimolache S.A. (f) | 40.095 | 40.095 | 32,365 | 9,879 | ||||||||||||
| Available-for-sale investments | ||||||||||||||||
| Other | 2,686 | 5,047 | ||||||||||||||
| 2,436,237 | 1,935,004 | |||||||||||||||
| Share in shareholders’ equity | Amount | |||||||||||||||||||||||
| 2011 | 2010 | As of January 1, 2010 | 2011 | 2010 | As of January 1, 2010 | |||||||||||||||||||
| % | % | % | US$(000) | US$(000) | US$(000) | |||||||||||||||||||
| Investments held under the equity method - | ||||||||||||||||||||||||
| Minera Yanacocha S.R.L. (c) | 43.65 | 43.65 | 43.65 | 1,312,051 | 1,032,984 | 780,985 | ||||||||||||||||||
| Sociedad Minera Cerro Verde S.A.A. (c) | 19.349 | 19.258 | 19.258 | 602,790 | 392,675 | 368,720 | ||||||||||||||||||
| Compañía Minera Coimolache S.A. (f) | 40.095 | 40.095 | 40.095 | 9,879 | - | - | ||||||||||||||||||
| Canteras del Hallazgo S.A.C. (g) | 49.00 | 49.00 | 49.00 | 5,237 | 2,700 | 3 | ||||||||||||||||||
| Available-for-sale investments - | - | - | - | |||||||||||||||||||||
| Other | 5,047 | 1,319 | 1,331 | |||||||||||||||||||||
| 1,935,004 | 1,429,678 | 1,151,039 | ||||||||||||||||||||||
| (b) | The table below presents the net share in results of associates: |
| 2012 | 2011 | 2010 | ||||||||||
| US$(000) | US$(000) | US$(000) | ||||||||||
| Minera Yanacocha S.R.L. (c) | 272,851 | 279,726 | 251,497 | |||||||||
| Sociedad Minera Cerro Verde S.A.A. (c) | 151,201 | 208,659 | 206,907 | |||||||||
| Compañía Minera Coimolache S.A.C. (f) | 40,187 | 9,648 | (15,859 | ) | ||||||||
| Canteras del Hallazgo S.A.C. (g) | - | (29,670 | ) | (13,660 | ) | |||||||
| 464,239 | 468,363 | 428,885 | ||||||||||
(b) The table below presents the net share in results of associates:
| 2011 | 2010 | |||||||
| US$(000) | US$(000) | |||||||
| Minera Yanacocha S.R.L. (c) | 279,726 | 251,497 | ||||||
| Sociedad Minera Cerro Verde S.A.A. (c) | 208,659 | 206,907 | ||||||
| Compañía Minera Coimolache S.A.C. (f) | 9,648 | (15,859 | ) | |||||
| Canteras del Hallazgo S.A.C. (g) | (29,670 | ) | (13,660 | ) | ||||
| 468,363 | 428,885 | |||||||
| (c) | The investments held in Yanacocha (a gold mine located in Cajamarca, Peru), through Compañía Minera Condesa S.A., and Cerro Verde (a copper mine located in Arequipa, Peru), represent the Company’s most significant investments. The share in their results has been significant in relation to the Company’s net earnings in 2012, 2011 and 2010. |
| (d) | Yanacocha is developing the Conga project, which consists of two gold-copper porphyry deposits located northeast of the Yanacocha operating area in the provinces of |
Notes to the consolidated financial statements (continued)
| (e) | In order to |
In order to calculate the investment amount and share in the result of Minera Yanacocha S.R.L. (hereinafter “Yanacocha”) and Sociedad Minera Cerro Verde S.A.A. (hereinafter “Cerro Verde”), the Company had used the following information:
(e.1) Yanacocha
Yanacocha issues financial statements under Generally Accepted Accounting Principles in Peru and also under U.S. GAAP for its parent. There were no significant differences between US GAAP and Peruvian GAAP for Yanacocha.
As part of the adoption to IFRS, in 2011, the Company assessed the significant differences in Yanacocha’sYanacocha´s financial statements between U.S. GAAP and IFRS and prepared a reconciliation of equity net as of January 1, 2010 and as of December 31, 20102012, 2011 and as of December 31, 20112010 and the net income in the years 20102012, 2011 and 20112010 prepared under U.S. GAAP and IFRS in order to calculate its investment and participation under IFRS in Yanacocha to these dates.
The table below presents the principal amounts under U.S. GAAP as of January 1, 2010 and as of December 31, 20102012, 2011 and December 31, 2011.2010.
| Yanacocha | Yanacocha | |||||||||||||||||||||||
| 2011 | 2010 | As of January 1, 2010 | 2012 | 2011 | 2010 | |||||||||||||||||||
| US$(000) | US$(000) | US$(000) | US$(000) | US$(000) | US$(000) | |||||||||||||||||||
| Statement of financial position | ||||||||||||||||||||||||
| Total assets | 3,787,235 | 2,936,994 | 2,466,500 | 4,541,535 | 3,787,235 | 2,936,994 | ||||||||||||||||||
| Total liabilities | 844,213 | 634,848 | 755,398 | 970,845 | 844,213 | 634,848 | ||||||||||||||||||
| Shareholders’ equity | 2,943,022 | 2,302,146 | 1,711,102 | 3,570,690 | 2,943,022 | 2,302,146 | ||||||||||||||||||
| Results | ||||||||||||||||||||||||
| Total income | 2,002,602 | 1,778,260 | 2,013,228 | 2,201,815 | 2,002,602 | 1,778,260 | ||||||||||||||||||
| Operating income | 905,001 | 855,309 | 1,062,629 | 982,367 | 905,001 | 855,309 | ||||||||||||||||||
| Net income | 642,387 | 589,894 | 727,076 | 626,540 | 642,387 | 589,894 | ||||||||||||||||||
The table below presents the reconciliation of the shareholders’shareholders´ equity prepared under U.S. GAAP with those prepared under IFRS prepared by the Company’sCompany´s Management as of January 1, 2010 and as of December 31, 20102012 and as of December 31, 2011, and net income as of December 31, 20102012, 2011 and 2011:2010:
Notes to the consolidated financial statements (continued)
| 2011 | 2010 | As of January 1, 2010 | 2012 | 2011 | 2010 | |||||||||||||||||||
| US$(000) | US$(000) | US$(000) | US$(000) | US$(000) | US$(000) | |||||||||||||||||||
| Shareholders’ equity under U.S. GAAP | 2,943,022 | 2,302,146 | 1,711,102 | |||||||||||||||||||||
| Shareholders´equity under U.S. GAAP | 3,570,691 | 2,943,022 | 2,302,146 | |||||||||||||||||||||
| Reversal of deferred workers´ profit sharing | 19,800 | 16,979 | 18,150 | |||||||||||||||||||||
| Deemed cost of property, plant and equipment | 21,084 | 28,069 | 40,510 | 17,130 | 21,084 | 28,069 | ||||||||||||||||||
| Deferred income tax for IFRS adjustments | (9,661 | ) | (10,971 | ) | (11,766 | ) | ||||||||||||||||||
| Valuation of inventories | (1,494 | ) | (7,307 | ) | 719 | (3,123 | ) | (1,494 | ) | (7,307 | ) | |||||||||||||
| Reversal of deferred workers’ profit sharing | 16,979 | 18,150 | 17,164 | |||||||||||||||||||||
| Deferred income tax for IFRS adjustments | (10,971 | ) | (11,766 | ) | (17,521 | ) | ||||||||||||||||||
| Shareholders’ equity under IFRS | 2,968,620 | 2,329,292 | 1,751,974 | |||||||||||||||||||||
| Shareholders´equity under IFRS | 3,594,837 | 2,968,620 | 2,329,292 | |||||||||||||||||||||
| Net income under U.S. GAAP | 626,540 | 642,387 | 589,894 | |||||||||||||||||||||
| Deferred income tax | 4,131 | (376 | ) | 6,742 | ||||||||||||||||||||
| Increased of depreciation for deemed cost of property, plant and equipment | (3,954 | ) | (6,985 | ) | (12,442 | ) | ||||||||||||||||||
| Valuation of inventories | (1,629 | ) | 5,813 | (8,027 | ) | |||||||||||||||||||
| Net income under IFRS | 625,088 | 640,839 | 576,167 | |||||||||||||||||||||
| (e.2) | Cerro Verde |
| 2011 | 2010 | |||||||
| US$(000) | US$(000) | |||||||
| Net income under U.S. GAAP | 642,387 | 589,894 | ||||||
| Increased of depreciation for deemed cost of property, plant and equipment | (6,985 | ) | (12,442 | ) | ||||
| Valuation of inventories | 5,813 | (8,027 | ) | |||||
| Deferred income tax for IFRS adjustments | (376 | ) | 6,742 | |||||
| Net income under IFRS | 640,839 | 576,167 | ||||||
(e.2) Cerro Verde
Up to December 31, 2010, the Company used Cerro Verde’s financial statements under Peru GAAP to calculate its investment and participation in this associate. As part of the adoption to IFRS in Peru, Cerro Verde in the year 2011 presents its financial statements under IFRS, which have been used by the Company to calculate its investment and participation. As of January 1 and December 2010 and as of December 31, 2011 and for the two years ended December 31, 2011 and 2011 the differences in shareholders’ equity and results of operations were not significant.
The table below presents the principal amounts in Cerro Verde as of January 1 and as of December 31, 2012, 2011 and 2010 and 2011 reported under Peru GAAP and IFRS:IFRS.
| Cerro Verde | 2012 | 2011 | 2010 | |||||||||||||||||||||
| 2011 | 2010 | As of January 1. 2010 | US$(000) | US$(000) | US$(000) | |||||||||||||||||||
| US$(000) | US$(000) | US$(000) | ||||||||||||||||||||||
| Statement of financial position | ||||||||||||||||||||||||
| Total assets | 3,196,597 | 2,294,078 | 1,903,750 | 4,042,771 | 3,196,597 | 2,294,078 | ||||||||||||||||||
| Total liabilities | 518,959 | 694,839 | 428,904 | 593,063 | 518,959 | 694,839 | ||||||||||||||||||
| Shareholders’ equity | 2,677,638 | 1,599,239 | 1,474,846 | 3,449,708 | 2,677,638 | 1,599,239 | ||||||||||||||||||
| Income statement | ||||||||||||||||||||||||
| Results | ||||||||||||||||||||||||
| Total income | 2,520,050 | 2,368,988 | 2,127,023 | 2,520,050 | 2,368,988 | |||||||||||||||||||
| Operating income | 1,559,280 | 1,555,834 | 1,217,274 | 1,559,280 | 1,555,834 | |||||||||||||||||||
| Net income | 1,078,399 | 1,074,393 | 772,070 | 1,078,399 | 1,074,393 | |||||||||||||||||||
The table below presents the reconciliation of the shareholders’ equity prepared byOn July 17, 2012, Cerro Verde subscribed a new Agreement of Guarantees and Measures to Promote Investments with the Government of Peru, under the General Mining Law and in connection with the Expansion of operations program. This new agreement will enable the Cerro Verde’s Management as of January 1, 2010to establish a tax system for the expansion and as of December 31, 2010 and netaccording to the management’s option; it will be in force in 2014. According to this agreement, from the time it is in force, the new income as of December 31, 2010:tax rate will be 32 per cent.
Notes to the consolidated financial statements (continued)
| 2010 | As of January 1, 2010 | |||||||
| US$(000) | US$ (000) | |||||||
| Shareholders’ equity under Peru GAAP | 1,550,517 | 1,446,094 | ||||||
| Reversal of deferred workers’ profit sharing | 36,449 | 24,860 | ||||||
| Inventories valuation | 10,221 | - | ||||||
| Deferred income tax | 2,052 | - | ||||||
| Provision for mine closure | - | 3,892 | ||||||
| Shareholders’ equity under IFRS | 1,599,239 | 1,474,846 | ||||||
| (f) | ||||
| Compañía Minera Coimolache S.A.- | ||||
(f) Compañía Minera Coimolache S.A.’s start up –
Compañía Minera Coimolache S.A., hereafter (hereafter “Coimolache”,) is located in the province of Hualgayoc, which includes the districts of Hualgayoc and Chugur in Cajamarca region and has reserves of 658,000528,000 ounces of gold (unaudited). Coimolache started operations in the third quarter of 2011. As December 31, 2011,2012, the production amounted to 50,916139,253 ounces of gold and 914,779 ounces of silver (50,916 ounces of gold and 298,674 ounces of silver. As of December 31, 2011, the shareholders debt contribution amounted to US$97,540,700 (US$45,940,300silver as of December 31, 2010)2011). As of January 1, 2010, there were no contributions for the plant construction.
(g) Canteras del Hallazgo S.A.C.: Chucapaca Project –The table below presents the main figures audited from financial statements of Coimolache, restructured according to Buenaventura’s accounting practices:
| 2012 | 2011 | 2010 | ||||||||||
| US$(000) | US$(000) | US$(000) | ||||||||||
| Statement of financial position | ||||||||||||
| Total assets | 218,380 | 181,372 | 67,948 | |||||||||
| Total liabilities | 137,658 | 156,734 | 80,395 | |||||||||
| Equity, net | 80,722 | 24,638 | (12,447 | ) | ||||||||
| Income Statement | ||||||||||||
| Total income | 262,596 | 79,176 | - | |||||||||
| Net income (loss) | 100,229 | 26,886 | (40,639 | ) | ||||||||
| (g) | Canteras del Hallazgo S.A.C.: Chucapaca Project - |
The mining project is located in Moquegua. There are evidences of gold, copper and silver in Chucapaca project zone, at Canahuire deposit.
As of December 31, 2011,2012, the project is in Feasibility and Environmental Studies, which are expected to be concluded at the end of 20122013 and it continues with exploration works in order to dimension the magnitude of mining field. Based on investment program agreed with the other shareholder, the Company disbursed contributions which allow the project development. As of December 31, 2011,2012, Buenaventura’s contribution amounted to US$153,303,000 (US$97,820,000 (US$33,309,000 as of December 31, 2010)2011). As
Notes to the consolidated financial statements (continued)
The table below presents the main figures audited from financial statements of January 1, 2010, other shareholder was the one who contributes.Canteras del Hallazgo, restructured according to Buenaventura’s accounting practices:
| 2012 | 2011 | 2010 | ||||||||||
| US$(000) | US$(000) | US$(000) | ||||||||||
| Statement of financial position | ||||||||||||
| Total assets | 73,013 | 18,980 | 9,018 | |||||||||
| Total liabilities | 6,842 | 8,292 | 3,468 | |||||||||
| Equity, net | 66,171 | 10,688 | 5,550 | |||||||||
| Income Statement | ||||||||||||
| Total income | - | - | - | |||||||||
| Net income (loss) | - | (59,377 | ) | (32,030 | ) | |||||||
Notes to the consolidated financial statements (continued)
| Mining concessions, development |
| (a) | Below is presented the movement in cost, depreciation and amortization, as well as the provision for accumulated impairment of long-lived assets: |
| As of January 1, 2010 | Additions | Retirements | Sales | Transfers | As of December 31, 2010 | Additions | Retirements | Sales | Transfers | As of December 31, 2011 | As of January 1, 2011 | Additions | Retirements | Sales | Transfers | As of December 31, 2011 | Additions | Retirements | Sales | Transfers | As of December 31, 2012 | |||||||||||||||||||||||||||||||||||||||||||||||||||||||||||||||||||
| US$(000) | US$(000) | US$(000) | US$(000) | US$(000) | US$(000) | US$(000) | US$(000) | US$(000) | US$(000) | US$(000) | US$(000) | US$(000) | US$(000) | US$(000) | US$(000) | US$(000) | US$(000) | US$(000) | US$(000) | US$(000) | US$(000) | |||||||||||||||||||||||||||||||||||||||||||||||||||||||||||||||||||
| Cost | ||||||||||||||||||||||||||||||||||||||||||||||||||||||||||||||||||||||||||||||||||||||||
| Land | 2,668 | - | - | - | - | 2,668 | 359 | - | - | 1,034 | 4,061 | 2,668 | 359 | - | - | 1,034 | 4,061 | 1,968 | - | - | - | 6,029 | ||||||||||||||||||||||||||||||||||||||||||||||||||||||||||||||||||
| Mining land | 7,215 | - | - | - | - | 7,215 | - | - | - | 56,966 | 64,181 | 7,215 | - | - | - | - | 7,215 | - | - | - | - | 7,215 | ||||||||||||||||||||||||||||||||||||||||||||||||||||||||||||||||||
| Mining concessions | 15,000 | - | - | - | - | 15,000 | - | - | - | - | 15,000 | 15,000 | - | - | - | - | 15,000 | - | - | - | - | 15,000 | ||||||||||||||||||||||||||||||||||||||||||||||||||||||||||||||||||
| Mining concessions (b) | 123,881 | - | - | - | - | 123,881 | - | - | - | - | 123,881 | 123,881 | - | - | - | - | 123,881 | - | - | - | - | 123,881 | ||||||||||||||||||||||||||||||||||||||||||||||||||||||||||||||||||
| Development costs (c) | 213,537 | 19,590 | - | - | - | 233,127 | 24,414 | - | - | - | 257,541 | 233,127 | 24,414 | - | - | - | 257,541 | 35,391 | - | - | - | 292,932 | ||||||||||||||||||||||||||||||||||||||||||||||||||||||||||||||||||
| Buildings, construction and other | 186,139 | 4,047 | (1,290 | ) | - | 72,260 | 261,156 | 849 | (1,055 | ) | - | 6,959 | 267,909 | 261,156 | 849 | (1,055 | ) | - | 63,925 | 324,875 | 8,673 | (612 | ) | (12 | ) | 172,825 | 505,749 | |||||||||||||||||||||||||||||||||||||||||||||||||||||||||||||
| Machinery and equipment | 240,577 | 27,579 | (1,420 | ) | (1,013 | ) | 38,585 | 304,308 | 36,024 | (895 | ) | (531 | ) | 27,809 | 366,715 | 304,308 | 36,024 | (895 | ) | (531 | ) | 27,809 | 366,715 | 76,850 | (597 | ) | (8,378 | ) | 25,331 | 459,921 | ||||||||||||||||||||||||||||||||||||||||||||||||||||||||||
| Transportation units | 8,362 | 650 | (57 | ) | (255 | ) | 971 | 9,671 | 1,248 | (118 | ) | (391 | ) | 753 | 11,163 | 9,671 | 1,248 | (118 | ) | (391 | ) | 753 | 11,163 | 742 | (212 | ) | (460 | ) | 734 | 11,967 | ||||||||||||||||||||||||||||||||||||||||||||||||||||||||||
| Furniture and mixtures | 10,177 | 218 | (17 | ) | (9 | ) | 50 | 10,419 | 215 | (37 | ) | - | 175 | 10,772 | 10,419 | 215 | (37 | ) | - | 175 | 10,772 | 785 | - | (82 | ) | 781 | 12,256 | |||||||||||||||||||||||||||||||||||||||||||||||||||||||||||||
| Units in transit | 9,983 | 19,895 | - | - | (20,594 | ) | 9,284 | 106,667 | - | - | (71,625 | ) | 44,326 | 9,284 | 106,667 | - | - | (71,625 | ) | 44,326 | 49,970 | (8 | ) | - | (50,616 | ) | 43,672 | |||||||||||||||||||||||||||||||||||||||||||||||||||||||||||||
| Works in progress | 118,842 | 180,030 | (1,907 | ) | - | (91,272 | ) | 205,693 | 130,212 | - | (1,491 | ) | (22,071 | ) | 312,343 | 205,693 | 130,212 | - | (1,491 | ) | (22,071 | ) | 312,343 | 268,548 | - | - | (149,055 | ) | 431,836 | |||||||||||||||||||||||||||||||||||||||||||||||||||||||||||
| Stripping cost | - | 1,266 | - | - | - | 1,266 | 17,828 | - | - | - | 19,094 | 1,266 | 17,828 | - | - | - | 19,094 | - | - | - | - | 19,094 | ||||||||||||||||||||||||||||||||||||||||||||||||||||||||||||||||||
| Mine closure costs | 32,696 | 958 | - | - | - | 33,654 | 785 | - | - | - | 34,439 | 33,654 | 785 | - | - | - | 34,439 | 21,779 | - | - | – | 56,218 | ||||||||||||||||||||||||||||||||||||||||||||||||||||||||||||||||||
| 969,077 | 254,233 | (4,691 | ) | (1,277 | ) | - | 1,217,342 | 318,601 | (2,105 | ) | (2,413 | ) | - | 1,531,425 | 1,217,342 | 318,601 | (2,105 | ) | (2,413 | ) | - | 1,531,425 | 464,706 | (1,429 | ) | (8,932 | ) | - | 1,985,770 | |||||||||||||||||||||||||||||||||||||||||||||||||||||||||||
| Accumulated depreciation and amortization | ||||||||||||||||||||||||||||||||||||||||||||||||||||||||||||||||||||||||||||||||||||||||
| Mining land | 2,304 | - | - | - | - | 2,304 | - | - | - | - | 2,304 | 2,304 | - | - | - | - | 2,304 | 898 | - | - | - | 3,202 | ||||||||||||||||||||||||||||||||||||||||||||||||||||||||||||||||||
| Mining concessions (b) | 54,899 | 5,044 | - | - | - | 59,943 | 12,269 | - | - | - | 72,212 | 59,943 | 12,269 | - | - | - | 72,212 | 3,643 | - | - | - | 75,855 | ||||||||||||||||||||||||||||||||||||||||||||||||||||||||||||||||||
| Development costs (c) | 112,532 | 31,854 | - | - | - | 144,386 | 35,930 | - | - | - | 180,316 | 144,386 | 35,930 | - | - | - | 180,316 | 40,727 | - | - | - | 221,043 | ||||||||||||||||||||||||||||||||||||||||||||||||||||||||||||||||||
| Buildings, construction and other | 118,347 | 25,163 | (673 | ) | - | - | 142,837 | 29,491 | (1,049 | ) | - | - | 171,279 | 142,837 | 29,491 | (1,049 | ) | - | - | 171,279 | 46,130 | (610 | ) | (2 | ) | - | 216,797 | |||||||||||||||||||||||||||||||||||||||||||||||||||||||||||||
| Machinery and equipment | 168,732 | 26,247 | (927 | ) | (983 | ) | (5 | ) | 193,064 | 38,228 | (863 | ) | (251 | ) | - | 230,178 | 193,064 | 38,228 | (863 | ) | (251 | ) | - | 230,178 | 55,653 | (215 | ) | (4,801 | ) | 4 | 280,819 | |||||||||||||||||||||||||||||||||||||||||||||||||||||||||
| Transportation units | 5,566 | 1,060 | (33 | ) | (192 | ) | 5 | 6,406 | 1,182 | (96 | ) | (365 | ) | - | 7,127 | |||||||||||||||||||||||||||||||||||||||||||||||||||||||||||||||||||||||||
| Furniture and mixtures | 4,121 | 1,001 | (16 | ) | (8 | ) | - | 5,098 | 1,018 | (35 | ) | (1 | ) | - | 6,080 | |||||||||||||||||||||||||||||||||||||||||||||||||||||||||||||||||||||||||
| Stripping cost | - | 223 | - | - | - | 223 | 1,171 | - | - | - | 1,394 | |||||||||||||||||||||||||||||||||||||||||||||||||||||||||||||||||||||||||||||
| Mine closure costs | 16,784 | 2,261 | - | - | - | 19,045 | 1,693 | - | - | - | 20,738 | |||||||||||||||||||||||||||||||||||||||||||||||||||||||||||||||||||||||||||||
| 483,285 | 92,853 | (1,649 | ) | (1,183 | ) | - | 573,306 | 120,982 | (2,043 | ) | (617 | ) | - | 691,628 | ||||||||||||||||||||||||||||||||||||||||||||||||||||||||||||||||||||||||||
| Provision(reversal) for impairment of long-lived assets, note 12 | ||||||||||||||||||||||||||||||||||||||||||||||||||||||||||||||||||||||||||||||||||||||||
| Mining concessions (b) | 2,805 | - | - | - | - | 2,805 | - | - | - | - | 2,805 | |||||||||||||||||||||||||||||||||||||||||||||||||||||||||||||||||||||||||||||
| Property, plant and equipment | 9,758 | 1,338 | (8,664 | ) | - | - | 2,432 | - | - | - | - | 2,432 | ||||||||||||||||||||||||||||||||||||||||||||||||||||||||||||||||||||||||||||
| Development costs (c) | 9,372 | 1,750 | (7,559 | ) | - | - | 3,563 | - | - | - | - | 3,563 | ||||||||||||||||||||||||||||||||||||||||||||||||||||||||||||||||||||||||||||
| 21,935 | 3,088 | (16,223 | ) | - | - | 8,800 | - | - | - | - | 8,800 | |||||||||||||||||||||||||||||||||||||||||||||||||||||||||||||||||||||||||||||
| Net cost | 463,857 | 635,236 | 830,997 | |||||||||||||||||||||||||||||||||||||||||||||||||||||||||||||||||||||||||||||||||||||
Notes to the consolidated financial statements (continued)
| As of January 1, 2011 | Additions | Retirements | Sales | Transfers | As of December 31, 2011 | Additions | Retirements | Sales | Transfers | As of December 31, 2012 | ||||||||||||||||||||||||||||||||||
| US$(000) | US$(000) | US$(000) | US$(000) | US$(000) | US$(000) | US$(000) | US$(000) | US$(000) | US$(000) | US$(000) | ||||||||||||||||||||||||||||||||||
| Transportation units | 6,406 | 1,182 | (96 | ) | (365 | ) | - | 7,127 | 1,228 | (122 | ) | (462 | ) | - | 7,771 | |||||||||||||||||||||||||||||
| Furniture and mixtures | 5,098 | 1,018 | (35 | ) | (1 | ) | - | 6,080 | 1,008 | (1 | ) | (28 | ) | (4 | ) | 7,055 | ||||||||||||||||||||||||||||
| Stripping cost | 223 | 1,171 | - | - | - | 1,394 | 891 | - | - | - | 2,285 | |||||||||||||||||||||||||||||||||
| Mine closure costs | 19,045 | 1,693 | - | - | - | 20,738 | 3,512 | - | - | - | 24,250 | |||||||||||||||||||||||||||||||||
| 573,306 | 120,982 | (2,043 | ) | (617 | ) | - | 691,628 | 153,690 | (948 | ) | (5,293 | ) | - | 839,077 | ||||||||||||||||||||||||||||||
| Provision for impairment of long-lived assets, note 11 | ||||||||||||||||||||||||||||||||||||||||||||
| Mining concessions of Antapite (b) | 2,805 | - | - | - | - | 2,805 | - | - | - | - | 2,805 | |||||||||||||||||||||||||||||||||
| Property, plant and equipment | 2,432 | - | - | - | - | 2,432 | 2,303 | - | - | - | 4,735 | |||||||||||||||||||||||||||||||||
| Development costs (c) | 3,563 | - | - | - | - | 3,563 | 1,314 | - | - | - | 4,877 | |||||||||||||||||||||||||||||||||
| 8,800 | - | - | - | - | 8,800 | 3,617 | - | - | - | 12,417 | ||||||||||||||||||||||||||||||||||
| Net cost | 635,236 | 830,997 | 1,134,276 | |||||||||||||||||||||||||||||||||||||||||
Notes to the consolidated financial statements (continued)
| (b) | Mining concessions - |
The table below presents the movement of the cost and accumulated amortization of the mining:mining concessions for mining units:
| Balance as of January 1, 2010 | Additions | Balance as of December 31, 2010 | Additions | Balance as of December 31, 2011 | As of January 1, 2011 | Additions | As of December 31, 2011 | Additions | As of December 31, 2012 | |||||||||||||||||||||||||||||||
| US$(000) | US$(000) | US$(000) | US$(000) | US$(000) | US$(000) | US$(000) | US$(000) | US$(000) | US$(000) | |||||||||||||||||||||||||||||||
| Cost | ||||||||||||||||||||||||||||||||||||||||
| Compañía de Exploraciones, Desarrollo e Inversiones Mineras S.A.C.- CEDIMIN | 51,138 | - | 51,138 | - | 51,138 | 51,138 | - | 51,138 | - | 51,138 | ||||||||||||||||||||||||||||||
| Inversiones Colquijirca S.A. | 43,103 | - | 43,103 | - | 43,103 | 43,103 | - | 43,103 | - | 43,103 | ||||||||||||||||||||||||||||||
| Sociedad Minera El Brocal S.A.A. | 13,542 | - | 13,542 | - | 13,542 | 13,542 | - | 13,542 | - | 13,542 | ||||||||||||||||||||||||||||||
| Inversiones Mineras del Sur S.A. | 11,662 | - | 11,662 | - | 11,662 | 11,662 | - | 11,662 | - | 11,662 | ||||||||||||||||||||||||||||||
| Minas Poracota S.A. | 2,864 | - | 2,864 | - | 2,864 | 2,864 | - | 2,864 | - | 2,864 | ||||||||||||||||||||||||||||||
| Minera Paula 49 S.A.C. | 1,572 | - | 1,572 | - | 1,572 | 1,572 | - | 1,572 | - | 1,572 | ||||||||||||||||||||||||||||||
| 123,881 | - | 123,881 | - | 123,881 | 123,881 | - | 123,881 | - | 123,881 | |||||||||||||||||||||||||||||||
| Accumulated amortization | ||||||||||||||||||||||||||||||||||||||||
| Compañía de Exploraciones, Desarrollo e Inversiones Mineras S.A.C. – CEDIMIN | 30,994 | 1,904 | 32,898 | 1,277 | 34,175 | 32,898 | 1,277 | 34,175 | 1,352 | 35,527 | ||||||||||||||||||||||||||||||
| Inversiones Colquijirca S.A. | 13,042 | 1,147 | 14,189 | 1,087 | 15,276 | 14,189 | 1,087 | 15,276 | 1,086 | 16,362 | ||||||||||||||||||||||||||||||
| Sociedad Minera El Brocal S.A.A. | 2,245 | 430 | 2,675 | 7,881 | 10,556 | 2,675 | 7,881 | 10,556 | 117 | 10,673 | ||||||||||||||||||||||||||||||
| Inversiones Mineras del Sur S.A. | 5,730 | 700 | 6,430 | 1,387 | 7,817 | 6,430 | 1,387 | 7,817 | 1,040 | 8,857 | ||||||||||||||||||||||||||||||
| Minas Poracota S.A. | 1,405 | 774 | 2,179 | 637 | 2,816 | 2,179 | 637 | 2,816 | 48 | 2,864 | ||||||||||||||||||||||||||||||
| Minera Paula 49 S.A.C. | 1,483 | 89 | 1,572 | 1,572 | 1,572 | - | 1,572 | - | 1,572 | |||||||||||||||||||||||||||||||
| 54,899 | 5,044 | 59,943 | 12,269 | 72,212 | 59,943 | 12,269 | 72,212 | 3,643 | 75,855 | |||||||||||||||||||||||||||||||
| Provision for impairment of mining concessions | ||||||||||||||||||||||||||||||||||||||||
| Inversiones Mineras del Sur S.A., note 12 | 2,805 | - | 2,805 | - | 2,805 | |||||||||||||||||||||||||||||||||||
| Inversiones Mineras del Sur S.A., note 11 | 2,805 | 2,805 | 2,805 | |||||||||||||||||||||||||||||||||||||
Notes to the consolidated financial statements (continued)
| (c) |
The table below presents the movement of the cost, accumulated amortization and provision for impairment of development costs by mining units:impairment:
| Balance as of January 1, 2010 | Additions (deductions) | Balance as of December 31, 2010 | Additions (deductions) | Balance as of December 31, 2011 | As of January 1, 2011 | Additions | As of December 31, 2011 | Additions | As of December 31, 2012 | |||||||||||||||||||||||||||||||
| US$(000) | US$(000) | US$(000) | US$(000) | US$(000) | US$(000) | US$(000) | US$(000) | US$(000) | US$(000) | |||||||||||||||||||||||||||||||
| Cost | ||||||||||||||||||||||||||||||||||||||||
| Orcopampa | 58,882 | 1,450 | 60,332 | 1,445 | 61,777 | 60,332 | 1,445 | 61,777 | 1,442 | 63,219 | ||||||||||||||||||||||||||||||
| Uchucchacua | 43,128 | 4,184 | 47,312 | 5,317 | 52,629 | 47,312 | 5,317 | 52,629 | 767 | 53,396 | ||||||||||||||||||||||||||||||
| Poracota | 32,035 | - | 32,035 | - | 32,035 | 32,035 | - | 32,035 | - | 32,035 | ||||||||||||||||||||||||||||||
| Antapite | 18,999 | - | 18,999 | - | 18,999 | 18,999 | - | 18,999 | - | 18,999 | ||||||||||||||||||||||||||||||
| La Llave, note 1(e) | 15,801 | 326 | 16,127 | 302 | 16,429 | 16,127 | 302 | 16,429 | - | 16,429 | ||||||||||||||||||||||||||||||
| Shila – Paula | 2,628 | 4,317 | 6,945 | 8,388 | 15,333 | 6,945 | 8,388 | 15,333 | - | 15,333 | ||||||||||||||||||||||||||||||
| Recuperada | 8,128 | 2,310 | 10,438 | 413 | 10,851 | 10,438 | 413 | 10,851 | - | 10,851 | ||||||||||||||||||||||||||||||
| Julcani | 4,801 | 3,007 | 7,808 | 2,555 | 10,363 | 7,808 | 2,555 | 10,363 | 2,111 | 12,474 | ||||||||||||||||||||||||||||||
| La Zanja | - | 4,578 | 4,578 | 1,342 | 5,920 | 4,578 | 1,342 | 5,920 | 1,648 | 7,568 | ||||||||||||||||||||||||||||||
| Mallay | - | 575 | 575 | 3,866 | 4,441 | 575 | 3,866 | 4,441 | 4,216 | 8,657 | ||||||||||||||||||||||||||||||
| Ishihuinca | 1,027 | - | 1,027 | - | 1,027 | 1,027 | - | 1,027 | - | 1,027 | ||||||||||||||||||||||||||||||
| Mine closure costs | 28,108 | (1,157 | ) | 26,951 | 786 | 27,737 | 26,951 | 786 | 27,737 | 25,207 | 52,944 | |||||||||||||||||||||||||||||
| 213,537 | 19,590 | 233,127 | 24,414 | 257,541 | 233,127 | 24,414 | 257,541 | 35,391 | 292,932 | |||||||||||||||||||||||||||||||
| Accumulated amortization | ||||||||||||||||||||||||||||||||||||||||
| Orcopampa | 35,694 | 7,695 | 43,389 | 7,152 | 50,541 | 43,389 | 7,152 | 50,541 | 4,108 | 54,649 | ||||||||||||||||||||||||||||||
| Uchucchacua | 29,069 | 3,063 | 32,132 | 3,929 | 36,061 | 32,132 | 3,929 | 36,061 | 4,921 | 40,982 | ||||||||||||||||||||||||||||||
| Poracota | 11,342 | 8,811 | 20,153 | 11,479 | 31,632 | 20,153 | 11,479 | 31,632 | 400 | 32,032 | ||||||||||||||||||||||||||||||
| Antapite | 17,309 | 1,422 | 18,731 | 268 | 18,999 | 18,731 | 268 | 18,999 | - | 18,999 | ||||||||||||||||||||||||||||||
| Shila – Paula | 815 | 2,567 | 3,382 | 7,575 | 10,957 | 3,382 | 7,575 | 10,957 | - | 10,957 | ||||||||||||||||||||||||||||||
| Recuperada | 1,433 | 1,004 | 2,437 | 637 | 3,074 | 2,437 | 637 | 3,074 | 6,897 | 9,971 | ||||||||||||||||||||||||||||||
| Julcani | 622 | 339 | 961 | 256 | 1,217 | 961 | 256 | 1,217 | 695 | 1,912 | ||||||||||||||||||||||||||||||
| La Zanja | - | 4,466 | 4,466 | 1,236 | 5,702 | 4,466 | 1,236 | 5,702 | 3,087 | 8,789 | ||||||||||||||||||||||||||||||
| Ishihuinca | 1,027 | - | 1,027 | - | 1,027 | 1,027 | - | 1,027 | - | 1,027 | ||||||||||||||||||||||||||||||
| Mine closure costs | 15,221 | 2,487 | 17,708 | 3,398 | 21,106 | |||||||||||||||||||||||||||||||||||
| 112,532 | 31,854 | 144,386 | 35,930 | 180,316 | ||||||||||||||||||||||||||||||||||||
| Provision for impairment of mine development costs | ||||||||||||||||||||||||||||||||||||||||
| Shila - Paula | 1,813 | 1,750 | 3,563 | - | 3,563 | |||||||||||||||||||||||||||||||||||
| Antapite | 1,726 | (1,726 | ) | - | - | - | ||||||||||||||||||||||||||||||||||
| Recuperada | 4,748 | (4,748 | ) | - | - | - | ||||||||||||||||||||||||||||||||||
| Poracota | 1,085 | (1,085 | ) | - | - | - | ||||||||||||||||||||||||||||||||||
| 9,372 | (5,809 | ) | 3,563 | - | 3,563 | |||||||||||||||||||||||||||||||||||
Notes to the consolidated financial statements (continued)
| As of January 1, 2011 | Additions | As of December 31, 2011 | Additions | As of December 31, 2012 | ||||||||||||||||
| US$(000) | US$(000) | US$(000) | US$(000) | US$(000) | ||||||||||||||||
| Mallay | - | - | - | 1,431 | 1,431 | |||||||||||||||
| Mine closure costs | 17,708 | 3,398 | 21,106 | 19,188 | 40,294 | |||||||||||||||
| 144,386 | 35,930 | 180,316 | 40,727 | 221,043 | ||||||||||||||||
| Provision for impairment of mine development costs | ||||||||||||||||||||
| Shila - Paula | 3,563 | - | 3,563 | - | 3,563 | |||||||||||||||
| Recuperada | - | - | - | 1,314 | 1,314 | |||||||||||||||
| 3,563 | - | 3,563 | 1,314 | 4,877 | ||||||||||||||||
Notes to the consolidated financial statements (continued)
| (d) | During the year 2009, the Company started the construction of Huanza Hydroelectric plant, which is expected to be completed in August 2012, date in which the asset will be transfer from work in progress to machinery and equipment. The carrying amount of this work in progress amount to US$ |
The carrying value of plant and equipment held under finance leases contracts as of December 31, 20112012 was US$119,000,000 (US$105,042,000 (US$54,127,000 as of December 31, 2010 and US$73,000 as of January 1, 2010)2011). Additions of leasing during the year include US$13,958,000 (US$50,915,000 (US$54,054,000 in 2010)2011) and are disclosed in “Works in progress” caption. Leased assets contracts are pledged as security for the related finance lease.
| Reversal for impairment of long-lived assets and investments in associates |
Mining concessions, property, plant and equipment and development costs -
The table below presents the components and movement of the reversal for impairment of long-lived assets:
| Cash-generating unit | Balance as of January 1, 2010 | Mining concessions and property, plant and equipment | Mine development costs | Total as of December 31, 2010 and 2011 | ||||||||||||||||||||||||
| US$(000) | US$(000) | US$(000) | US$(000) | As of January 1 and December 31, 2011 | Additions | As of December 31, 2012 | ||||||||||||||||||||||
| US$(000) | US$(000) | US$(000) | ||||||||||||||||||||||||||
| Shila - Paula | 2,907 | 1,338 | 1,750 | 5,995 | ||||||||||||||||||||||||
| Mining concessions, property, plant and equipment - | ||||||||||||||||||||||||||||
| Antapite | 11,072 | (6,541 | ) | (1,726 | ) | 2,805 | 2,805 | 743 | 3,548 | |||||||||||||||||||
| Shila-Paula | 2,432 | - | 2,432 | |||||||||||||||||||||||||
| Recuperada | 6,871 | (2,123 | ) | (4,748 | ) | - | - | 810 | 810 | |||||||||||||||||||
| Poracota | 1,085 | - | (1,085 | ) | - | - | 750 | 750 | ||||||||||||||||||||
| 5,237 | 2,303 | 7,540 | ||||||||||||||||||||||||||
| Development costs - | ||||||||||||||||||||||||||||
| Shila-Paula | 3,563 | - | 3,563 | |||||||||||||||||||||||||
| Recuperada | - | 1,314 | 1,314 | |||||||||||||||||||||||||
| 3,563 | 1,314 | 4,877 | ||||||||||||||||||||||||||
| Total | 21,935 | (7,326 | ) | (5,809 | ) | 8,800 | 8,800 | 3,617 | 12,417 | |||||||||||||||||||
Notes to the consolidated financial statements (continued)
DuringAs a result of the decrease in the level and quality of the reserves in some mining units, during the year 2010, as a consequence of positive changes in the assumptions used since the moment that the impairment provision was recorded in order to determine the recovery carrying amount of long-lived assets,2012, the Company’s Management updated its assessment of the recoverability of the book value of its long-lived assets and reversedassets. The provision made in the year 2012 amounts to US$3,617,000.
Assessing the impairment of long-lived assets involves comparing their respective carrying amount with their recoverable values. The recoverable value of assets is the greater of its fair value less the costs of sale or its value in use. The recoverable amount used in assessing the Antapite, Recuperada and Poracota mining units recorded in previous year.unit is the fair value. The impairment reversed as of December 31, 2010 amounted to US$13,135,000 (US$7,326,000 corresponds to property, plant and equipment and US$5,809,000 corresponds to development cost) and are disclosed as operating expense inCompany estimated the consolidated income statement.
As of December 31, 2011 Management assess theuse value in use of its long-lived assets and had no identified anyusing a discounted cash-flow model. Cash flow was projected for the useful life of the mining units based on Management’s expectations. This useful life depends on several variables, including the mineral reserves of each unit.
The following assumptions have been used for calculating the value in use:
| (i) | Production volumes: the production volumes of the Antapite, Recuperada and Poracota units are substantiated by the reserves and resources audited as of December 31, 2012, considering Management’s production plan for the coming years. According to such reserves, the Poracota unit has a production horizon of one year, Antapite of two years and Recuperada of three years. Management believes that there will not be significant changes in estimated production volumes that would result in the present value of long-lived assets exceeding their recoverable value. |
| (ii) | Discount rates: Future cash flows have been adjusted according to the specific risk assigned to this type of asset and discounted at a pre-tax rate of 6.21 per cent. The discount rate used is the Weighted Average Cost of Capital (pre-tax WACC). Management believes that there will not be significant changes in the discount rate that could increase the impairment loss. |
| (iii) | Metals prices: The Company has used future metals prices (forward metal prices) obtained from the average of estimates made by foreign investment banks. |
| (iv) | Operating costs: The Company has projected its operating costs in relation to its cost structure as of the date of the consolidated statement of financial position. Management believes that there will not be significant changes in estimated operating costs considered that could increase the impairment loss. |
In the opinion of the Company’s Management, the provision for impairment indication in itsof long-lived assets.assets covers the risk of impairment at the date of the consolidated statement of financial position.
Notes to the consolidated financial statements (continued)
Investments in associates -
In the case of Yanacocha (investment held through its subsidiary Compañía Minera Condesa S.A.) the Company’s Management concluded that there was no objective evidence of impairment as of the consolidated statement of financial position date derived from internal and external indicators (rising trend in the international price of gold, constant level of reserves and an increase in the annual net profit reported). In addition, in the case of associate Cerro Verde, the Company’s Management compared the investment’s fair value according to market capitalization with the investment’s book value, and determined that there was no impairment as of the consolidated statement of financial position date. On the other hand, in the case of Coimolache, and Canteras del Hallazgo, the Company’sCompany´s Management concluded that there was no objective evidence of impairment as of the consolidated statement of financial position date derived from internal and external indicators. See notes 10(f) 9(f)
and (g).
| Trade accounts payable |
Trade accounts payable arise mainly from the acquisition of material, supplies and spare parts and services provided by third parties. These obligations are mostly denominated in U.S. dollars, have current maturities, do not accrue interest and no specific guarantees have been granted for these obligations. Trade accounts payable amount to US$199,551,000 as of December 31, 2012 (US$142,375,000 as of December 31, 2011 (US$91,374,000 as of December 31, 2010 and US$61,357,000 as of January 1, 2010)2011).
| Other accounts payable |
The table below presents the components of this caption:
| 2011 | 2010 | As of January 1, 2010 | 2012 | 2011 | ||||||||||||||||
| US$(000) | US$(000) | US$(000) | US$(000) | US$(000) | ||||||||||||||||
| Remuneration and similar benefits payable | 19,026 | 10,117 | 9,017 | 17,487 | 19,026 | |||||||||||||||
| Taxes payable | 12,680 | 13,671 | 9,635 | 16,454 | 12,680 | |||||||||||||||
| Royalties payable to the Peruvian State | 3,755 | 3,511 | 2,307 | 7,350 | 3,755 | |||||||||||||||
| Accounts payable to non-controlling interest | 4,694 | - | ||||||||||||||||||
| Dividends payable | 1,052 | 925 | 781 | 1,928 | 1,052 | |||||||||||||||
| Royalties payable to third parties | 633 | - | - | - | 633 | |||||||||||||||
| Interest payable | 3 | - | 502 | |||||||||||||||||
| Loan payable to Newmont | - | 11,906 | - | |||||||||||||||||
| Voluntary mining contribution payable | - | 1,903 | 1,437 | |||||||||||||||||
| Other liabilities | 4,001 | 8,114 | 9,865 | 11,183 | 4,004 | |||||||||||||||
| 41,150 | 50,147 | 33,544 | ||||||||||||||||||
| 59,096 | 41,150 | |||||||||||||||||||
| F-65 |
Notes to the consolidated financial statements (continued)
| Provisions |
The table below presents the components of this caption:
| 2012 | 2011 | |||||||||||||||||||
| 2011 | 2010 | As of January 1, 2010 | US$(000) | US$(000) | ||||||||||||||||
| US$(000) | US$(000) | US$(000) | ||||||||||||||||||
| Provision for closure of mining units and exploration projects (a) | 81,914 | 77,427 | 84,361 | 99,438 | 81,914 | |||||||||||||||
| Stock appreciation rights (b) | 43,188 | 69,380 | 41,131 | |||||||||||||||||
| Workers’ profit sharing payable | 39,157 | 21,442 | 13,975 | 28,427 | 39,157 | |||||||||||||||
| Stock appreciation rights (c) | 28,258 | 43,188 | ||||||||||||||||||
| Provision for labor contingencies | 7,490 | 2,444 | ||||||||||||||||||
| Board of Directors’ participation, note 31(e) | 2,721 | 3,567 | ||||||||||||||||||
| Provision for environmental liabilities | 6,136 | 6,085 | 6,210 | 1,932 | 6,136 | |||||||||||||||
| Board of Directors’ participation | 3,567 | 2,528 | 1,918 | |||||||||||||||||
| Provision for labor contingencies | 2,444 | 3,765 | 4,454 | |||||||||||||||||
| Provision for security contingencies | 1,717 | - | ||||||||||||||||||
| Provision for community contingencies | 1,409 | 1,442 | 1,211 | 1,613 | 1,409 | |||||||||||||||
| Other provisions | 225 | - | ||||||||||||||||||
| 177,815 | 182,069 | 153,260 | ||||||||||||||||||
| 171,821 | 177,815 | |||||||||||||||||||
| Less – Non current portion | ||||||||||||||||||||
| Provision for closure of mining units and exploration projects (a) | (59,132 | ) | (66,496 | ) | (69,219 | ) | ||||||||||||||
| Stock appreciation rights (b) | (26,457 | ) | (49,170 | ) | (26,955 | ) | ||||||||||||||
| Provision for environmental liabilities | (939 | ) | (548 | ) | (5,834 | ) | ||||||||||||||
| (86,528 | ) | (116,214 | ) | (102,008 | ) | |||||||||||||||
| Current portion | 91,287 | 65,855 | 51,252 | |||||||||||||||||
| 2012 | 2011 | |||||||
| US$(000) | US$(000) | |||||||
| Less – Non current portion | ||||||||
| Provision for closure of mining units and exploration projects (a) | (77,665 | ) | (59,132 | ) | ||||
| Stock appreciation rights (b) | (22,203 | ) | (26,457 | ) | ||||
| Provision for environmental liabilities | (173 | ) | (939 | ) | ||||
| (100,041 | ) | (86,528 | ) | |||||
| Current portion | 71,780 | 91,287 | ||||||
| (a) | Provision for closure of mining units and exploration |
The table below presents the movement of the provision for closure of mining units and exploration projects:
| US$(000) | ||||
| Balance as of January 1, | ||||
| 77,427 | ||||
| Disbursements | (13,108 | ) | ||
| Changes in estimates | 1,571 | |||
| Changes in estimates | 6,924 | |||
| 9,100 | ||||
| Balance as of December 31, 2011 | 81,914 | |||
| Disbursements | (22,485 | ) | ||
| F-66 |
Notes to the consolidated financial statements (continued)
| US$(000) | ||||
| Changes in estimates (property, plant and equipment and development costs) | 24,812 | |||
| New mine closure plans (property, plant, equipment and development costs) | 8,897 | |||
| Changes in estimates (income) | (512 | ) | ||
| Increase for accretion expense of the present value of the provision | 6,812 | |||
| Balance as of December 31, 2012 | 99,438 | |||
The provision for closure of mining units and exploration projects represents the present value of the closure costs that are expected to be incurred between the years 20122013 and 2024.2027. Estimates of the costs for closure of mining units are based on studies prepared by independent advisers that meet the environmental regulations in effect. The provision for closure of mining units and exploration projects corresponds mostly to activities that must be carried out for restoring the mining units and areas affected by operation and production activities. The principal works to be performed correspond to earthworks, re-vegetation efforts and dismantling of the plants. Closure budgets are reviewed regularly to take into account any significant change in the studies conducted. Nevertheless, the closure costs of mining units will depend on the market prices for the closure works required, which would reflect future economic conditions. Also, the time when the disbursements will be made depends on the useful life of the mine, which will be based on future metals prices.
As of December 31, 2011,2012, the future value of the provision for closure of mining units and exploration projects was US$127,492,181,250,000, which has been discounted using the annual risk-free rate 4.07 percent, resulting in an updated liability of US$99,438,000 (US$127,492,000 which has been discounted using the annual risk-free rate 4.87 percent, resulting in an updated liability of US$81,914,000 (US$109,131,000, which was discounted using the annual risk-free rate of 5.98 percent, resulting in an updated liability of US$77,427,000 as of December 31, 2010 and US$84,361,000 as of January 1, 2010)2011). The Company believes that this liability is sufficient to meet the current environmental protection laws approved by the Ministry of Energy and Mines.
To dateDuring 2012 and 2011 the Ministry of Energy and Mines has approved the following mine closure plans:
| Project name | Resolution Number | Approval date | ||
| Julcani mining unit (*) | R.D. N° | February 11, 2011 | ||
| Administrative Economic Unit Esperanza 2001 (*) | R.D. N° | |||
| 027-2011-MEM-AAM / R.D. N° | January 27, 2011 / August 19, 2011 |
| F-67 |
Notes to the consolidated financial statements (continued)
| Project name | Resolution Number | Approval date |
| Orcopampa mining unit (*) | R.D. N° | |
| Poracota mining unit (*) | ||
| Angelica Rubio Chico | April | |
| Angelica Rulo project | R.D.N°111-2011-MEM-AAM | April 12, 2011 |
| Trocancha Anchaca project | R.D.N °168-2011-MEM-AAM | June 2, 2011 |
| Pucarumi project | September 26, 2011 | |
| Colquijirca mining unit (*) | R.D.N°243-2012-MEM | August 17, 2012 |
(*) Change to the initial plan.
The Company has constituted letters of credit to Ministry of Energy and Mines for US$46,608,000 (US$39,511,000 as of December 31, 2011) to secure mine closure plans for the above-mentioned units.
| (b) | Workers´profit sharing - |
Legislative Decree N° 892 (L.D. 892), issued in 1996 and which regulates the right of workers to participate in the company’s profits that performs activities generating third categories income, requires companies domiciled in Peru to compute and pay to employees, a share of the profits generated by the companies for which they work.
The worker’ profit sharing is recognized as labor costs in the “Cost of sales, without considering depreciation and amortization” or “Administrative expense” of the consolidated financial statement according to the duties or function of the workers.
According to indicated to note 2.3.(v), the workers’ profit sharing is paid until a limit of 18 wages. The excess is retained by the Company and this is paid to Peruvian Government entities (FONDOEMPLEO and regional government). During the year 2012, the excess between the total amounts of workers’ profit sharing calculated in accordance to L.D. 892 and the limit to pay to employees amounts to US$2,164,000 as of December 31, 2012 (US$6,221,000 as of December 31, 2011), which will be transferred to FONDOEMPLEO within the period established by law. Based on the Company’s accounting policy, such excess is show as operating expenses in the consolidated statement of comprehensive income.
The following table presents the movement of the workers´profit sharing:
| US$(000) | ||||
| Balance as of January 1, 2011 | 21,442 | |||
| Payments | (21,329 | ) | ||
| Changes in estimates | 39,044 | |||
| F-68 |
Notes to the consolidated financial statements (continued)
| US$(000) | ||||
| Balance as of December 31, 2011 | 39,157 | |||
| Payments | (34,014 | ) | ||
| Changes in estimates | 23,284 | |||
| Balance as of December 31, 2012 | 28,427 | |||
| (c) | Stock Appreciation Rights - |
Senior executives of the Company are granted share appreciation rights, which can only be settled in cash, if the executive is working for the Company at each program’s settlement date. These programs are mainly structured in a ten-year term, allocated in several programs with progressive maturities. The settlement of each program is determined based on the variation of the market prices at the maturity date as compared to the price at the date of the grant.grant, over the corresponding number of shares.
The table below presents the principal assumptions used by the Company to estimate the fair value:
| 2011 | 2010 | As of January 1, 2010 | 2012 | 2011 | ||||||||||||||||
| Historical volatility | 49.50 | % | 50.46 | % | 51.24 | % | 48.38 | % | 49.50 | % | ||||||||||
| Risk-free interest rate | 0.00 | % | 0.00 | % | 0.00 | % | ||||||||||||||
| Risk-free interest rate for the remaining period until vesting | 0.16 | % | 0.00 | % | ||||||||||||||||
| Dividend yield | 1.21 | % | 1.20 | % | 1.22 | % | 1.25 | % | 1.21 | % | ||||||||||
| Period covered by the program | 10 years | 10 years | 10 years | 10 years | 10 years | |||||||||||||||
| Market value of the shares at closing | US$38.34 | US$48.96 | US$33.47 | US$ | 35.95 | US$ | 38.34 | |||||||||||||
The expected life of the options is based on historical and recent expectations, and does not necessarily represent patterns that indicate the executions of options that could occur. The expected volatility reflects the assumption that the historical volatility for a period similar life of the options indicates the trend in the future, which may not necessarily be the end result.
The valuation model used by the Company as of December 31, 2011, 20102012 and as of January 1, 20102011 was Turnbull & Wakeman.
| F-69 |
Notes to the consolidated financial statements (continued)
The table below presents the movement of the shares subject to the compensation program for the years 20112012 and 2010:2011:
| Number of shares | ||||||||||||||||
| Number of shares | 2012 | 2011 | ||||||||||||||
| 2011 | 2010 | |||||||||||||||
| Opening balance | 3,133,250 | 2,633,200 | 3,593,733 | 3,133,250 | ||||||||||||
| Granted during the year | 775,000 | 790,000 | 790,000 | 775,000 | ||||||||||||
| Retired during the year | (30,000 | ) | - | (82,000 | ) | (30,000 | ) | |||||||||
| Expired during the year | (284,517 | ) | (289,950 | ) | (332,069 | ) | (284,517 | ) | ||||||||
| Ending balance | 3,593,733 | 3,133,250 | 3,969,664 | 3,593,733 | ||||||||||||
The payment obligationobligations of shares subject to the compensation program per year are as follows: 332,069 in 2012; 467,686are: 454,686 in 2013; 617,532602,532 in 2014; 700,531728,031 in 2015; 530,615611,115 in 2016 and 945,3001,573,300 thereafter.
The average real prices for the programs granted and expiring in the months of January 20122013 and 20112012 were US$40.0434.86 and US$50.8940.04 per share, respectively.
The table below presents the movement of the stock appreciation rights for the years 2012, 2011 and 2010:
| 2011 | 2010 | |||||||
| US$(000) | US$(000) | |||||||
| Opening balance | 69,380 | 41,131 | ||||||
| Valuation (reverse) of the year | (5,982 | ) | 39,988 | |||||
| Valuation (reverse) of shares granted during the year | - | 2,437 | ||||||
| Payments made during the year | (20,210 | ) | (14,176 | ) | ||||
| 43,188 | 69,380 | |||||||
| Less - non-current portion | 26,457 | 49,170 | ||||||
| Current portion | 16,731 | 20,210 | ||||||
The expected life of the SARs is based on historical data and current expectations and is not necessarily indicative of exercise patterns that may occur. The expected volatility reflects the assumption that the historical volatility over a period similar to the life of the SARs is indicative of future trends, which may also not necessarily be the actual outcome.
Legislative Decree N° 892 (L.D. 892), issued in 1996 and which regulates the right of workers to participate in the company’s profits that performs activities generating third categories income, requires companies domiciled in Peru to compute and pay to employees, a share of the profits generated by the companies for which they work.
The worker’ profit sharing is recognized according to the established in the note 2.3.(n), is considered as labor costs in the “Cost of sales, without considering depreciation and amortization” and “Administrative expense” according to their duties or function.
| 2012 | 2011 | 2010 | ||||||||||
| US$(000) | US$(000) | US$(000) | ||||||||||
| Opening balance | 43,188 | 69,380 | 41,131 | |||||||||
| Valuation (reverse) of the year | 1,799 | (5,693 | ) | 42,425 | ||||||||
| Payments made during the year | (16,729 | ) | (20,499 | ) | (14,176 | ) | ||||||
| 28,258 | 43,188 | 69,380 | ||||||||||
| Less - non-current portion | (22,203 | ) | (26,457 | ) | (49,170 | ) | ||||||
| Current portion | 6,055 | 16,731 | 20,210 | |||||||||
| F-70 |
AccordingNotes to indicated to note 2.3.(v), the workers’ profit sharing is paid until a limit of 18 wages. The excess is retained by the Company and this is paid to Peruvian Government entities (FONDOEMPLEO and regional government). During the year 2011, the excess between the total amounts of workers’ profit sharing calculated in accordance to L.D. 892 and the limit to pay to employees amounts to US$6,221,000 which will be transferred to FONDOEMPLEO within the period established by law. Based on the Company’s accounting policy (note 2.3.(v)), such excess is show as operating expenses in the statement of comprehensive income.consolidated financial statements (continued)
The following table presents the movement of the workers’ profit sharing:
| Financial obligations |
| (a) | The table below presents the detail of financial obligations: as of December 31, 2012 and 2011. |
| Original amount | Period | Guarantee | Annual interest rate | Maturities | 2012 | 2011 | ||||||||||||||
| US$(000) | US$(000) | US$(000) | ||||||||||||||||||
| Empresa de Generación Huanza S.A. | ||||||||||||||||||||
| Banco de Credito del Peru - Leasing (c) | 119,000 | 10 years | Leased equipment | Three-month Libor plus 4.00% (4.306% as of December 31, 2012 and 4.581% as of December 31, 2011) | Quarterly maturities to during seven years from capitalization | 119,000 | 105,042 | |||||||||||||
| Sociedad Minera El Brocal S.A.A. | ||||||||||||||||||||
| Banco de Credito del Peru - Loan (b) | 120,000 | 4 years | None | Three-month Libor plus 3% (3.32% as of December 31, 2012) | Quarterly maturities US$2,812 and a payment of US$45,000 at the end of the loan | 60,000 | - | |||||||||||||
| Leasing | 329 | 2 years | Leased equipment | 4.60% | Monthly maturities of US$13,569 from August 2012 to July 2014 | 257 | - | |||||||||||||
| Consorcio Energético de Huancavelica S.A. | ||||||||||||||||||||
| BBVA Banco Continental - Working Capital Loan | 10,000 | 4 years | None | Three-month Libor plus 1.25% | Quarterly maturities of US$500,000 from September 2007 to June 2012 | - | 1,000 | |||||||||||||
| Other minor | 47 | 72 | ||||||||||||||||||
| 179,304 | 106,114 | |||||||||||||||||||
| Non-current portion | (173,489 | ) | (105,072 | ) | ||||||||||||||||
| Current portion | 5,815 | 1,042 | ||||||||||||||||||
| (b) | On September 28, 2012, El Brocal subscribed a medium-term loan contract with Banco de Credito del Peru amounted to US$120,000,000; which was approved by El Brocal ´s Board of Directors on April 23, 2012, with the following terms and conditions: |
| F-71 |
Notes to the consolidated financial statements (continued)
| - | Capital: US$120,000,000. |
| - | Term and annual interest rate: 4 years with a variable rate (Three-month Libor plus 3 points). |
| - | Guarantee: Pledge of 2 contract of sale of concentrate, one of copper and another of lead. |
| - | Amortization: Quarterly constant maturities and a final payment of 25 percent of capital. |
| - | Availability of the loan period: Until May 2013. |
At the same time to obtain the loan described above, El Brocal Management obtained 3 bridge loans amounted to US$44,000,000 in the form of simple notes, which were disbursed on July 18, September 19, and November 14, 2012. The rate for these loans was signed by the same initial loan of US$120,000,000 (three-month Libor + 3 percent, equivalent to 3.32 percent at December 31, 2012). These notes were cancelled in November of 2012 with the first disbursement of US$60,000,000.
| Original amount | Guarantee | Annual interest rate | Maturities | 2011 | 2010 | As of January 1, 2010 | |||||||||
| US$(000) | US$(000) | US$(000) | US$(000) | ||||||||||||
| Empresa de Generación Huanza S.A. | |||||||||||||||
| Leasing(b) | 119,000 | Joint surety | Three-month Libor plus 4.00% (4.581% as of December 31, 2011, 4.303% as of December 31,2010 and 4.31% as of January 1, 2010) | Quarterly maturities to during seven years from capitalization | 105,042 | 54,127 | 865 | ||||||||
| Consorcio Energético de Huancavelica S.A. | |||||||||||||||
| BBVA Banco Continental | 10,000 | None | Three-month Libor plus 1.25% (1.831% as of December 31, 2011, 1.553% as of December 31,2010 and 1.56% as of January 1, 2010) | Quarterly maturities of US$500,000 from June 2009 to June 2012 | 1,000 | 3,000 | 5,000 | ||||||||
| Compañía de Minas Buenaventura S.A.A. | |||||||||||||||
| Syndicated Loan Agreement (d) | 450,000 | None | Three-month Libor plus 2.25% (2.56% as of January 1, 2010) | Quarterly maturities of US$14,667,000 from August 2008 to May 2013. Prepayments may be made on each quarterly due date | - | - | 205,333 | ||||||||
| Banco de Crédito del Perú | 75,000 | Secured interest of US$13,748,000 | Three-month Libor plus 0.85% (1.10% as of January 1, 2010) | Quarterly maturities of US$9,375,000 from September 2008 to June 2010 | - | - | 18,750 | ||||||||
| Other minor | 72 | 25 | 59 | ||||||||||||
| 106,114 | 57,152 | 230,007 | |||||||||||||
| Non-current portion (c) | (105,072 | ) | (55,134 | ) | (150,555 | ) | |||||||||
| Current portion | 1,042 | 2,018 | 79,452 |
The interest expenses related to this loan as of December 31, 2012 amounted to US$334,000, which have been capitalized in “Mining concessions, development costs and property, plant and equipment, net” caption.
| F-72 |
Notes to the consolidated financial statements (continued)
| On December 2, 2010 Banco de Credito |
| The financial obligations held by Buenaventura and its subsidiaries mature as follows: |
| Year | 2011 | 2010 | As of January 1, 2010 | 2012 | 2011 | |||||||||||||||
| US$(000) | US$(000) | US$(000) | US$(000) | US$(000) | ||||||||||||||||
| 2010 | - | - | 79,452 | |||||||||||||||||
| 2011 | - | 2,018 | 61,548 | |||||||||||||||||
| 2012 | 1,042 | 1,007 | 59,674 | - | 1,042 | |||||||||||||||
| 2013 | 15,025 | 7,732 | 29,333 | 5,815 | 15,025 | |||||||||||||||
| 2014 | 15,017 | 7,732 | - | 28,364 | 15,017 | |||||||||||||||
| 2015 thereafter | 75,030 | 38,663 | - | 145,125 | 75,030 | |||||||||||||||
| 106,114 | 57,152 | 230,007 | 179,304 | 106,114 | ||||||||||||||||
| Current portion | 1,042 | 2,018 | 79,452 | (5,815 | ) | (1,042 | ) | |||||||||||||
| Non-current portion | 105,072 | 55,134 | 150,555 | 173,489 | 105,072 | |||||||||||||||
| Shareholders’ equity, net |
| (a) | Capital stock - |
The Company’s share capital is stated in Nuevos Soles (S/.) and consists of common shares with voting rights that represent 100 percent of the Company’s issued capital. The table below presents the components of the capital stock:
| As of December 31, 2011, 2010 and January 1, 2010 | As of December 31, 2012 and 2011 | |||||||||||||||||||||||
| Number of shares | Capital stock | Capital stock | Number of shares | Capital stock | Capital stock | |||||||||||||||||||
| S/.(000) | US$(000) | S/.(000) | US$(000) | |||||||||||||||||||||
| Common shares | 274,889,924 | 2,748,899 | 813,162 | 274,889,924 | 2,748,899 | 813,162 | ||||||||||||||||||
| Treasury shares | (21,130,260 | ) | (211,303 | ) | (62,622 | ) | (21,130,260 | ) | (211,303 | ) | (62,622 | ) | ||||||||||||
| 253,759,664 | 2,537,596 | 750,540 | 253,759,664 | 2,537,596 | 750,540 | |||||||||||||||||||
| F-73 |
Notes to the consolidated financial statements (continued)
The market value of common shares amounted to US$36.06 as of December 31, 2012 (US$37.78 as of December 31, 2011 (US$48.43 as of December 31, 2010 and US$33.34 as of January 1, 2010)2011) and it presented a trading frequency of 98.4197.61 percent (80(98.41 percent as of December 31, 2010 and 95 percent as of January 1, 2010)2011).
| (b) | Investment shares - |
Investment shares do not have voting rights or participate in shareholders’ meetings but do participate in the distribution of dividends. The table below presents the components of investment shares:
| As of December 31, 2011, 2010 and January 1, 2010 | As of December 31, 2012 | |||||||||||||||||||||||
| Number of shares | Investment shares | Investment shares | Number of shares | Investment shares | Investment shares | |||||||||||||||||||
| S/.(000) | US$(000) | S/.(000) | US$(000) | |||||||||||||||||||||
| Investment shares | 744,640 | 7,446 | 2,161 | 744,640 | 6,827 | 2,019 | ||||||||||||||||||
| Treasury investment shares | (61,976 | ) | (619 | ) | (142 | ) | (271,733 | ) | (1,640 | ) | (620 | ) | ||||||||||||
| 682,664 | 6,827 | 2,019 | 472,907 | 5,187 | 1,399 | |||||||||||||||||||
| As of December 31, 2011 | ||||||||||||
| Number of shares | Investment shares | Investment shares | ||||||||||
| S/.(000) | US$(000) | |||||||||||
| Investment shares | 744,640 | 7,446 | 2,161 | |||||||||
| Treasury investment shares | (61,976 | ) | (619 | ) | (142 | ) | ||||||
| 682,664 | 6,827 | 2,019 | ||||||||||
The market value of investment shares amounted to US$29.41 as of December 31, 2012 (US$37.70 as of December 31, 2011 (US$37.39 as of December 31, 2010 and US$29.43 as of January 1, 2010)2011) and it presented a trading frequency of 127.57 percent (25(12 percent as of December 31, 2010 and 30 percent as of January 1, 2010)2011).
| (c) | Legal reserve - |
The Peruvian Corporations Law (Ley General de Sociedades)requires that a minimum of ten percent of the distributable earnings for each period, after deducting the income tax, be transferred to a legal reserve until the latter is equal to 20 percent of the capital stock. This legal reserve can be used to offset losses or may be capitalized, with the obligation, in both cases, to replenish it.
For the yearyears ending December 31, 2012, 2011 Buenaventuraand 2010, the Company had not increased its legal reserve due to its legal reserve reached the limit mentioned before. As of December 31, 2010, the Company sat aside from the net profit US$50,243,000.
| (d) | Dividends declared and paid - |
The table below presents the dividends declared and paid in 2012, 2011 and 2010:
| Meeting | Date | Dividends declared and paid | Dividend per share | |||||||||
| US$ | US$ | |||||||||||
| 2011 Dividends | ||||||||||||
| Mandatory Annual Shareholders’ Meeting | March 25 | 90,959,000 | 0.33 | |||||||||
| Board of Directors’ Meeting | October 27 | 63,396,000 | 0.23 | |||||||||
| Less – Dividends of treasury shares | (11,867,000 | ) | ||||||||||
| 142,488,000 | ||||||||||||
| 2010 Dividends | ||||||||||||
| Mandatory Annual Shareholders’ Meeting | March 26 | 82,690,000 | 0.30 | |||||||||
| Board of Directors’ Meeting | October 28 | 44,101,000 | 0.16 | |||||||||
| Less – Dividends of treasury shares | (9,748,000 | ) | ||||||||||
| 117,043,000 | ||||||||||||
| F-74 |
Notes to the consolidated financial statements (continued)
| Meeting | Date | Dividends declared and paid | Dividend per share | |||||||
| US$ | US$ | |||||||||
| 2012 Dividends | ||||||||||
| Mandatory Annual Shareholders’ Meeting | March 26 | 110,254,000 | 0.40 | |||||||
| Board of Directors’ Meeting | October 30 | 55,126,000 | 0.20 | |||||||
| Less – Dividends of treasury shares | (12,714,000 | ) | ||||||||
| 152,666,000 | ||||||||||
| 2011 Dividends | ||||||||||
| Mandatory Annual Shareholders’ Meeting | March 25 | 90,959,000 | 0.33 | |||||||
| Board of Directors’ Meeting | October 27 | 63,396,000 | 0.23 | |||||||
| Less – Dividends of treasury shares | (11,867,000 | ) | ||||||||
| 142,488,000 | ||||||||||
| 2010 Dividends | ||||||||||
| Mandatory Annual Shareholders’ Meeting | March 26 | 82,690,000 | 0.30 | |||||||
| Board of Directors’ Meeting | October 28 | 44,101,000 | 0.16 | |||||||
| Less – Dividends of treasury shares | (9,748,000 | ) | ||||||||
| 117,043,000 | ||||||||||
The effect of declared and paid dividends by subsidiaries to minority shareholders,non-controlling interest is made up as follows:
| 2011 | 2010 | As of January 1, 2010 | 2012 | 2011 | 2010 | |||||||||||||||||||
| US$(000) | US$(000) | US$(000) | US$(000) | US$(000) | US$(000) | |||||||||||||||||||
| Minera La Zanja S.R.L. | 31,919 | - | - | |||||||||||||||||||||
| Sociedad Minera El Brocal S.A.A. | 17,263 | 19,383 | 11,514 | 19,266 | 17,263 | 19,383 | ||||||||||||||||||
| S.M.R.L. Chaupiloma Dos de Cajamarca | 14,280 | 3,688 | 14,051 | 14,820 | 14,280 | 3,688 | ||||||||||||||||||
| Minera La Zanja S.R.L. | 10,795 | 31,919 | - | |||||||||||||||||||||
| Inversiones Colquijirca S.A. | 3,274 | 16,105 | 2,191 | - | 3,274 | 16,105 | ||||||||||||||||||
| 66,736 | 39,176 | 27,756 | 44,881 | 66,736 | 39,176 | |||||||||||||||||||
| Tax Situation |
| (a) | The Company and its subsidiaries are subject to the Peruvian tax system. As of December 31, |
Legal entities and individuals not domiciled in Peru are subject to an additional tax of 4.1 percent on the dividends received.
Through Law N°29666, published on February 20, 2011, it is restored the 16 percent of Value Added Tax being applicable from March 1, 2011.
Additionally, through Law N°29667, published in the same date, the Financial Transactions Tax is reduced to 0.005%,0.005 percent, being applicable from April 1, 2011.
| F-75 |
Notes to the consolidated financial statements (continued)
| (b) | During the four years following the year of filing tax returns the tax authorities have the power to review and, as applicable, correct the income tax computed by the Company. The Income Tax and Value Added Tax (“IGV” by its Spanish acronym) returns for the following years are open to review by Tax Authorities: |
Entity | Years open to review by Tax | |
| Compañía de Minas Buenaventura S.A.A. | ||
| Buenaventura Ingenieros S.A. | ||
| Compañía de Exploraciones, Desarrollo e Inversiones Mineras S.A.C. – CEDIMIN | ||
| Compañía Minera Condesa S.A. | ||
| Compañía Minera Colquirrumi S.A. | ||
| Consorcio Energético de Huancavelica S.A. | ||
| Contacto Corredores de Seguros S.A. | ||
| Inversiones Colquijirca S.A. | ||
| Sociedad Minera El Brocal S.A.A. | ||
| S.M.R.L. Chaupiloma Dos de Cajamarca | ||
| Minera La Zanja S.R.L. | ||
| El Molle Verde S.A.C. | 2011 and 2012 | |
| Empresa de Generación Huanza S.A. | 2008, 2009, 2010, 2011 and 2012 | |
| Procesadora Industrial Rio Seco S.A. | 2010, 2011 and 2012 |
Due to the possible interpretations that the Tax Authorities may give to legislation in effect, it is not possible to determine whether or not any of the tax audits that will perform will result in increased liabilities for the Company. For that reason any tax or surcharge that could arise from future tax audits would be applied to the income of the period in which it is determined. In Management’s opinion and its legal advisors, any possible additional payment of taxes in the entities mentioned before would not have a material effect on the consolidated financial statements as of December 31, 20112012 and 2010.2011.
Buenaventura -
Buenaventura’s Income Tax Returns for the 2000 and 2003 periods have been audited by Tax Authorities. As a result of the aforesaid, the Tax Administration has issued assessments denying recognition of Buenaventura’s tax-loss carryforwards reported as of December 31, 2000 and 2003 amounting to S/.67,263,000.71,160,000 (equivalent to US$24,940,000)27,895,000) and S/.18,224,000 (equivalent to US$6,757,000). The main objection7,144,000), respectively. In October and November of 2012, the Fiscal Court resolve in favor to the Company the appeal process for the year 2000 and 2003, determining that the dividends should not be considered certain non-taxable income – dividends – as taxable income for the purposepurposes of determining the tax-loss carryforwards. To date,carryforward.
| F-76 |
Notes to the Tax Administration has issued a resolution, on the claim petition filed by the Company, to ratify the assessment made in the audit. In the opinion of Management and its legal advisors, this interpretation has no legal basis, and Buenaventura could obtain a favorable result in the tax claim procedure initiated against the above-mentioned assessments.consolidated financial statements (continued)
During the year 2007, the Tax Administration audited Buenaventura’s Income Tax Returns for the 2004 and 2005 periods. As a consequence of the aforementioned, the Tax Administration issued assessments denying recognition of some tax deductions by S/.77,921,000 (equivalent to US$28,892,000)30,545,000) in 2004 and S/.119,785,000 (equivalent to US$44,414,000)46,956,000) in 2005. The main objection considered as taxable income the reversal of the provision related to commercial contracts, which in that time were not deducted to calculate Income Tax. To date, the Tax Administration has issued a resolution, on the claim petition filed by the Company, to ratify the assessment made in the audit.
In July 2012, the opinionFiscal Court resolved the appeal process of Managementthe year 2005 determining null the resolution related to the reversal of the provision related to commercial contracts. As of the date of the consolidated financial statement, Tax Administration, through resolution, annulled the main objection of considered as taxable income the reversal of the provision related to commercial contracts, calculating a tax debt for S/.9,384,000 (equivalent to US$3,679,000), including fiscal penalty which were appealed. In Management´s opinion and its legal advisors, this interpretation has no legal basis, and Buenaventura couldthe Company should obtain a favorable result in the tax claim procedure initiatedappeal process that the Company has started against the above-mentioned assessments.resolution.
In October 2012, the Fiscal Court resolved the appeal process of the year 2004, determining null the resolution related to the reversal of the provision related to commercial contracts. As of the date of the consolidated financial statement, Tax Administration, through resolution, annulled the main objection of considered as taxable income the reversal of the provision related to commercial contracts, calculating a tax debt for S/.246,000 (equivalent to US$96,000). As of the date of the consolidated financial statement, the debt has been paid.
During the year 2010, the Tax Administration audited Buenaventura’s Income Tax and Value Added Tax for the 2006 period. As a consequence of the aforementioned, the Tax Administration does not recognize some tax deductions made by the Company amounting to S/.184,339,000 (equivalent to US$68,350,000.72,261,000). The main objection considered as taxable income the reversal of the provision related to commercial contracts. Also, the Tax Administration considered the explosive delivery to mining contractors as a transaction subject to Income Tax and Value Added Tax amounting to S/.12,275,000 (equivalent to US$4,551,000)4,812,000). InTo date, the opinion of Management and its legal advisors, this interpretationTax Administration has no legal basis, and Buenaventura could obtainissued a favorable resultresolution, on the claim petition filed by the Company, to ratify the assessment made in the audit.
In July 2012, the Fiscal Court resolved the appeal process of the year 2006, determining null the resolution related to the reversal of the provision related to commercial contracts and annulled the explosive delivery to mining contractors. As of the date of the consolidated financial statement, Tax Administration, through resolution, annulled the main objection of considered as taxable income the reversal of the provision related to commercial contracts, calculating a tax claim procedure initiated againstdebt for S/.3,314,000 (equivalent to US$1,299,000). As of the above-mentioned assessments.date of the consolidated financial statement, the debt has been paid.
| F-77 |
Notes to the consolidated financial statements (continued)
The Income Tax declared by the Company for the years 20072008 to 2011 and Value Added Tax by the periods from December 2007 to2008 and December 20112012, are subject to be audited by tax authorities. It is important to mention that currently the tax authorities areTax Administration is auditing 2007 Income Tax. Furthermore, the Company has been notified by Tax Administration the beginning of the audit of the income tax declare by the Company for the year 2008 and Value Added Tax for the period between January and December 2008, the audit will begin in March 2013.
Due to the possible interpretations that the Tax Authorities may give to legislation in effect, it is not possible to determine whether or not any of the tax audits that will perform will result in increased liabilities for the Company. For that reason any tax or surcharge that could arise from future tax audits would be applied to the income of the period in which it is determined. However, in Management’s opinion and its legal advisors, any possible additional payment of taxes would not have a material effect on the consolidated financial statements as of December 31, 20112012 and 2010.2011.
Cedimin -
Cedimin’sCedimin´s Income Tax Return for the 2002 period has been audited by the Tax Administration. As a result, the Tax Administration has issued assessments modifying the tax-loss carryforward declared by Cedimin. In those periods the principal objection is against having considered Cedimin’sCedimin´s loss of S/.22,041,000 (US$8,172,000)8,640,000) on the sale of Minera Huallanca S.A.C. and Minera Yanaquihua S.A. shares as non-deductible. In the opinion of Cedimin’sCedimin´s Management and its legal advisors, this interpretation has no legal basis, for which reason Cedimin would obtain a favorable result in the tax claim procedure initiated against the above-indicated assessment.
Condesa -
Condesa’sCondesa´s Income Tax Returns for the 2000, 2001 and 2003 periods have been audited by the Tax Administration. As a result of the aforesaid, the Tax Administration has issued assessments reducing the tax-loss carryforwards from previous years, which Condesa had reported in those periods, by S/.31,338,000 (US$11,620,000)12,285,000). For these periods, the principal objection is against having considered non-taxable income (dividends) as taxable for purposes of determining the tax-loss carryforward.
| F-78 |
Notes to the consolidated financial statements (continued)
In October 2011, the Fiscal Court issued the resolutions with favourable result to Condesa. Therefore, tax-loss carryforward reported by Condesa is correctly recognized for 2000, 2001 and 2003.
Sociedad Minera El Brocal S.A.A. -
In 2006 the Tax Administration audited the Sociedad Minera El Brocal S.A.A. (El Brocal) Income tax return for the 2003 period, determining objections of S/.2,292,018 (equivalent to US$849,840)898,478) to net income for the period for under-reporting sales by the improper deduction of freight and insurance on mineral exports, which results in a reduction of the tax-loss carryforwards for the mentioned amount. The penalty resolution issued for this objection amounts to S/.343,803 (equivalent to US$127,476134,772, without penalty interest) and was not accepted by El Brocal, therefore a claim was filed against the penalty. On November 30, 2010, the Tax Administration has issued a resolution No. 0150140009380, which rejected Brocal’sBrocal´s claim. Brocal do not agree with the scope of the resolution and a claim was presented to Fiscal Court on January 10, 2011, in accordance with the deadlines established by the Tax Code.
The Income Tax declared by the Company for the years 2008 to 2012 and Value Added Tax by the periods from December 2008, January 2010 to December 2012, are subject to be audited by tax authorities.
| (c) | As of December 31, |
Buenaventura has decided to recognize a deferred income tax asset insofar as there it is more likely than not that the tax-loss carryforward can be used to offset future taxable net income. See note 25.24.
| (d) | For purposes of determining the Income Tax, |
Notes to the consolidated financial statements (continued)
| (e) | As mentioned in the note 2.3.(r) payments to the Government for mining royalties and special mining tax are under the scope of IAS 12, therefore, they are managed as were income tax, see detail in note |
| On July 9, 2011, Law No. 29741 was enacted, which created the Supplemental Retirement Mining, Metallurgy and Steel Fund as a social security fund for workers of undertakings included in such sectors. Subsequently, dated May 11, 2012, Supreme Decree No. 006-2012-TR was issued, through which approved the regulations of the Law mentioned above. |
According to Article 1 of the Law, the Fund is constituted by the following contributions: (i) 0.5 percent of the annual pre-tax income of mining metallurgical and steel, and (ii) 0.5 percent monthly of gross monthly salary of each worker mining, metallurgical and steel.
| 18. | Net sales |
The Company’s revenues are mostly from sales of gold and precious metals in the form of concentrates, including silver-lead, silver-gold, zinc and lead-gold-copper concentrates and ounces of gold. The table below presents the net sales to customers by geographic region and product type:
| 2011 | 2010 | |||||||
| US$(000) | US$(000) | |||||||
| Net sales by geographic region | ||||||||
| America | 710,729 | 504,648 | ||||||
| Peru | 600,147 | 479,126 | ||||||
| Europe | 132,662 | 35,937 | ||||||
| Asia | 8,321 | 7,944 | ||||||
| 1,451,859 | 1,027,655 | |||||||
| Services rendered | ||||||||
| Peru | 41,225 | 20,230 | ||||||
| Asia | 710 | - | ||||||
| America | 82 | - | ||||||
| Europe | 6 | - | ||||||
| 1,493,882 | 1,047,885 | |||||||
| 2011 | 2010 | |||||||
| US$(000) | US$(000) | |||||||
| Net sales by product | ||||||||
| Gold | 791,387 | 578,582 | ||||||
| Silver | 526,380 | 274,624 | ||||||
| Copper | 193,215 | 129,444 | ||||||
| Zinc | 72,095 | 92,884 | ||||||
| Lead | 36,880 | 46,913 | ||||||
| 1,619,957 | 1,122,447 | |||||||
| Deductions | (127,957 | ) | (112,254 | ) | ||||
| Prior-period settlements | 2,429 | (4,922 | ) | |||||
| 1,494,429 | 1,005,271 | |||||||
| Adjustment to open provisional liquidations | (22,679 | ) | 6,630 | |||||
| Embedded derivatives from sale of concentrate (a) | (11,210 | ) | 13,870 | |||||
| Hedging operations | (8,681 | ) | 1,884 | |||||
| 1,451,859 | 1,027,655 | |||||||
| Sale of services, power and other minor items | 42,023 | 20,230 | ||||||
| 1,493,882 | 1,047,885 | |||||||
| 2012 | 2011 | 2010 | ||||||||||
| US$(000) | US$(000) | US$(000) | ||||||||||
| Sales by geographic region | ||||||||||||
| America | 742,103 | 710,729 | 504,648 | |||||||||
| Peru | 556,407 | 600,147 | 479,126 | |||||||||
| Europe | 98,085 | 132,662 | 35,937 | |||||||||
| Asia | 53,090 | 8,321 | 7,944 | |||||||||
| 1,449,685 | 1,451,859 | 1,027,655 | ||||||||||
| Services rendered | ||||||||||||
| Peru | 46,656 | 41,225 | 20,230 | |||||||||
| America | 8 | 82 | - | |||||||||
| Asia | - | 710 | - | |||||||||
| Europe | - | 6 | - | |||||||||
| 1,496,349 | 1,493,882 | 1,047,885 | ||||||||||
Notes to the consolidated financial statements (continued)
| 2012 | 2011 | 2010 | ||||||||||
| US$(000) | US$(000) | US$(000) | ||||||||||
| Sales by product | ||||||||||||
| Gold | 738,477 | 791,387 | 578,582 | |||||||||
| Silver | 544,947 | 526,380 | 274,624 | |||||||||
| Copper | 177,573 | 193,215 | 129,444 | |||||||||
| Zinc | 82,873 | 72,095 | 92,884 | |||||||||
| Lead | 52,834 | 36,880 | 46,913 | |||||||||
| 1,596,704 | 1,619,957 | 1,122,447 | ||||||||||
| Deductions | (147,930 | ) | (127,957 | ) | (112,254 | ) | ||||||
| Prior-period settlements | (15,609 | ) | 2,429 | (4,922 | ) | |||||||
| 1,433,165 | 1,494,429 | 1,005,271 | ||||||||||
| Adjustment to open provisional liquidations | 14,816 | (22,679 | ) | 6,630 | ||||||||
| Embedded derivatives from sale of concentrate (a) | 1,776 | (11,210 | ) | 13,870 | ||||||||
| Hedging operations | (72 | ) | (8,681 | ) | 1,884 | |||||||
| 1,449,685 | 1,451,859 | 1,027,655 | ||||||||||
| Sale of services, power and other minor items | 46,664 | 42,023 | 20,230 | |||||||||
| 1,496,349 | 1,493,882 | 1,047,885 | ||||||||||
| (a) | Embedded derivative for sales of concentrate - |
The terms of metal in concentrateConcentrates sales contracts with third parties contain provisional pricing arrangements whereby the selling price for metal in concentrate isare based on prevailing spot prices oncommercial contracts, from which a specified future date. The Company’s salesprovisional value based on a provisionalforward quotation. The sales price containadjustments are considered an embedded derivative, which is required to be bifurcatedseparated from the host commercial contract. The hostCommercial contract isare related to the sale of the metals contained in the concentrates at the current spot LME price.quotation prices (London Metal Exchange). The embedded derivative, which does not qualify for hedge accounting, is marked-to-market through earnings each period. At December 31, 2011 and 2010, the Company had consolidated embedded derivatives based on forward prices for the expected settlement dates. Final prices on these sales will be established over the next several months pursuant to terms of sales contracts. The impact of fluctuationstherefore, changes in the forward prices used for these derivatives throughfair value are charge to profit and loss. Final quotations are settled in different months, according to the settlement date is reflected as derivative gains and losses in revenues.commercial contracts.
Concentrate sales includeThe adjustments to the provisional sale value resulting from changesare recorded as an adjustment in the fair value of the embedded derivative.current net sales. These adjustments resulted in higher sales by US$1,776,000, lower sales by US$11,210,00011,210,000; and higher sales by US$13,870,000 in 2012, 2011 and 2010, respectively, as a result of the future behavior of metal prices trade by the Company at the cutoff date. See note 19 and 28(c).
| (b) | Concentration of sales - |
In 2011,2012, the three most important customers represented 58%, 21%48, 15 and 6%8 percent of total sales (49%, 0%(58, 21 and 2%6 percent of total sales in 2010)2011). As of December 31, 2011, 86%2012, 68 percent of the accounts receivable areis related to these customers (34%(86 percent as of December 31, 2010)2011). The Company’s sales of gold and concentrates are delivered to investment banks and national and international well known companies. See note 29(b)28(b). Some have sales contracts that guarantee supplying them the production from the Company’s mines at prices that are based on market quotations.
| F-81 |
Notes to the consolidated financial statements (continued)
| Costs of sales, without considering depreciation and amortization |
The table below presents the components of this caption:
| 2011 | 2010 | 2012 | 2011 | 2010 | ||||||||||||||||
| US$(000) | US$(000) | US$(000) | US$(000) | US$(000) | ||||||||||||||||
| Opening balance of products in process, note 9(a) | 77,441 | 15,650 | ||||||||||||||||||
| Opening balance of finished goods, note 9(a) | 6,750 | 7,578 | ||||||||||||||||||
| Opening balance of products in process, note 8(a) | 140,775 | 77,441 | 15,650 | |||||||||||||||||
| Opening balance of finished goods, note 8(a) | 19,026 | 6,750 | 7,578 | |||||||||||||||||
| 159,801 | 84,191 | 23,228 | ||||||||||||||||||
| Services provided by third parties | 173,162 | 167,510 | 274,100 | 173,162 | 167,510 | |||||||||||||||
| Consumption of materials and supplies | 133,983 | 101,700 | 86,946 | |||||||||||||||||
| Direct labor | 103,313 | �� | 76,666 | 103,828 | 103,313 | 76,666 | ||||||||||||||
| Consumption of materials and supplies | 101,700 | 86,946 | ||||||||||||||||||
| Electricity and water | 35,083 | 20,890 | 29,966 | 35,083 | 20,890 | |||||||||||||||
| Rentals | 24,542 | 6,697 | ||||||||||||||||||
| Cost of concentrate purchase to third parties | 16,917 | 12,741 | 18,563 | 16,917 | 12,741 | |||||||||||||||
| Transport | 13,445 | 10,538 | 16,389 | 13,445 | 10,538 | |||||||||||||||
| Insurance | 9,658 | 7,281 | 11,973 | 9,658 | 7,281 | |||||||||||||||
| Rentals | 9,835 | 24,542 | 6,697 | |||||||||||||||||
| Maintenance and repair | 5,256 | 4,441 | 7,016 | 5,256 | 4,441 | |||||||||||||||
| Provision for impairment of finished goods, note 8(f) | 212 | 383 | 1,648 | |||||||||||||||||
| Other production expenses | 38,314 | 12,734 | 43,522 | 38,314 | 12,734 | |||||||||||||||
| Provision for impairment of finished goods, note 9(f) | 383 | 1,648 | ||||||||||||||||||
| Final balance of products in process, note 9(a) | (140,775 | ) | (77,441 | ) | ||||||||||||||||
| Final balance of finished goods, note 9(a) | (19,026 | ) | (6,750 | ) | ||||||||||||||||
| 649,387 | 521,773 | 408,092 | ||||||||||||||||||
| 446,163 | 347,129 | |||||||||||||||||||
| Final balance of products in process, note 8(a) | (148,533 | ) | (140,775 | ) | (77,441 | ) | ||||||||||||||
| Final balance of finished goods, note 8(a) | (31,163 | ) | (19,026 | ) | (6,750 | ) | ||||||||||||||
| (179,696 | ) | (159,801 | ) | (84,191 | ) | |||||||||||||||
| 629,492 | 446,163 | 347,129 | ||||||||||||||||||
Notes to the consolidated financial statements (continued)
| Exploration in operating units |
The table below presents the components of this caption:
| 2011 | 2010 | 2012 | 2011 | 2010 | ||||||||||||||||
| US$(000) | US$(000) | US$(000) | US$(000) | US$(000) | ||||||||||||||||
| Exploration expenses | ||||||||||||||||||||
| Orcopampa | 33,391 | 28,719 | 49,079 | 33,391 | 28,719 | |||||||||||||||
| Poracota | 30,105 | 18,244 | 18,390 | |||||||||||||||||
| Uchucchacua | 20,223 | 16,683 | 29,306 | 20,223 | 16,683 | |||||||||||||||
| Poracota | 18,244 | 18,390 | ||||||||||||||||||
| Antapite | 12,222 | 7,271 | 6,346 | |||||||||||||||||
| Mallay | 8,018 | - | - | |||||||||||||||||
| Recuperada | 7,476 | 5,847 | 5,246 | |||||||||||||||||
| Julcani | 7,327 | 6,563 | 5,105 | |||||||||||||||||
| Shila - Paula | 15,482 | 10,688 | 6,371 | 15,482 | 10,688 | |||||||||||||||
| Antapite | 7,271 | 6,346 | ||||||||||||||||||
| Julcani | 6,563 | 5,105 | ||||||||||||||||||
| Recuperada | 5,847 | 5,246 | ||||||||||||||||||
| La Zanja | 2,334 | 264 | 2,517 | 2,334 | 264 | |||||||||||||||
| Breapampa | 308 | - | - | |||||||||||||||||
| Caraveli | 236 | - | - | |||||||||||||||||
| Other | 53 | - | - | |||||||||||||||||
| 109,355 | 91,441 | |||||||||||||||||||
| 153,018 | 109,355 | 91,441 | ||||||||||||||||||
| Royalties |
The table below presents the components of this caption:
| 2011 | 2010 | |||||||
| US$(000) | US$(000) | |||||||
| Sindicato Minero de Orcopampa S.A., note 31(b) | 31,882 | 27,572 | ||||||
| Peruvian Government | 28,222 | 24,613 | ||||||
| Minera El Futuro de Ica S.R.L., note 31(b) | 158 | 85 | ||||||
| 60,262 | 52,270 | |||||||
| 2012 | 2011 | 2010 | ||||||||||
| US$(000) | US$(000) | US$(000) | ||||||||||
| Sindicato Minero de Orcopampa S.A., note 30(b) | 34,863 | 31,882 | 27,572 | |||||||||
| Peruvian Goverment | 2,489 | 28,222 | 24,613 | |||||||||
| Minera El Futuro de Ica S.R.L., note 30(b) | 315 | 158 | 85 | |||||||||
| 37,667 | 60,262 | 52,270 | ||||||||||
| Administrative expense |
The table below presents the components of this caption:
| 2011 | 2010 | 2012 | 2011 | 2010 | ||||||||||||||||
| US$(000) | US$(000) | US$(000) | US$(000) | US$(000) | ||||||||||||||||
| Personnel expense | 38,466 | 37,184 | 40,665 | 38,466 | 37,184 | |||||||||||||||
| Other management expenses | 17,969 | 8,815 | 28,796 | 17,969 | 8,815 | |||||||||||||||
| Professional fees | 12,116 | 6,490 | 12,307 | 12,116 | 6,490 | |||||||||||||||
| Rent | 2,653 | 1,248 | ||||||||||||||||||
| Insurance | 2,901 | 726 | 856 | |||||||||||||||||
| Board of Directors’ participation | 2,591 | 2,384 | 2,522 | 2,591 | 2,384 | |||||||||||||||
| Donations | 1,878 | 1,691 | 2,181 | 1,878 | 1,691 | |||||||||||||||
| Rent | 2,058 | 2,653 | 1,248 | |||||||||||||||||
| Travel and mobility | 1,846 | 731 | 608 | |||||||||||||||||
| Valuation (reversed) of stock appreciation right | 1,720 | (5,982 | ) | 42,425 | ||||||||||||||||
| Supplies | 1,162 | 665 | 1,669 | 1,162 | 665 | |||||||||||||||
| Subscription | 976 | 848 | ||||||||||||||||||
| Communications | 783 | 903 | 989 | 783 | 903 | |||||||||||||||
| Insurance | 726 | 856 | ||||||||||||||||||
| Travel and mobility | 731 | 608 | ||||||||||||||||||
| Subscription and quote | 768 | 976 | 848 | |||||||||||||||||
| Maintenance | 729 | 534 | 457 | 729 | 534 | |||||||||||||||
| Canon | 377 | 83 | 83 | |||||||||||||||||
| Amortization of other assets | 239 | 503 | 39 | 239 | 503 | |||||||||||||||
| Canon | 83 | 83 | ||||||||||||||||||
| Allowance for doubtful accounts | 50 | 2,000 | - | 50 | 2,000 | |||||||||||||||
| Valuation (reversed) of stock appreciation right | (5,982 | ) | 42,425 | |||||||||||||||||
| 75,170 | 107,237 | |||||||||||||||||||
| 99,295 | 75,170 | 107,237 | ||||||||||||||||||
Notes to the consolidated financial statements (continued)
| Exploration in non-operating areas |
The expenses incurred in 2011 and 2010 by exploration area are presented below:
| 2011 | 2010 | 2012 | 2011 | 2010 | ||||||||||||||||
| US$(000) | US$(000) | US$(000) | US$(000) | US$(000) | ||||||||||||||||
| Projects outside of mining units | ||||||||||||||||||||
| Trapiche | 16,145 | 4,731 | 1,321 | |||||||||||||||||
| San Gregorio | 11,292 | 3,015 | 2,837 | |||||||||||||||||
| Focus - Chancas | 6,381 | 1,957 | 104 | |||||||||||||||||
| Consolidado de Hualgayoc | 5,704 | 1,937 | 2,126 | |||||||||||||||||
| Breapampa | 5,571 | 5,565 | 1,486 | |||||||||||||||||
| Chiptaj - Chancas | 4,360 | 1,813 | 784 | |||||||||||||||||
| Colquemayo | 3,973 | 4,042 | 2,759 | |||||||||||||||||
| San Pedro Sur | 2,477 | - | 1,940 | |||||||||||||||||
| Chacua (San Francisco) | 2,209 | 1,612 | 105 | |||||||||||||||||
| Mallay | 10,536 | 9,251 | 1,959 | 10,536 | 9,251 | |||||||||||||||
| Breapampa | 5,565 | 1,486 | ||||||||||||||||||
| Trapiche | 4,731 | 1,321 | ||||||||||||||||||
| Colquemayo | 4,042 | 2,759 | ||||||||||||||||||
| Pachuca Norte – México | 3,264 | 203 | ||||||||||||||||||
| San Gregorio | 3,015 | 2,837 | ||||||||||||||||||
| Focus | 1,957 | 104 | ||||||||||||||||||
| Consolidado de Hualgayoc | 1,937 | 2,126 | ||||||||||||||||||
| Chiptaj – Chancas | 1,813 | 784 | ||||||||||||||||||
| Chacua (San Francisco) | 1,612 | 105 | ||||||||||||||||||
| Surichata | 1,088 | - | - | |||||||||||||||||
| El Faique | 916 | 590 | 477 | |||||||||||||||||
| Vacas Heladas | 453 | 736 | - | |||||||||||||||||
| La Joya | 1,577 | 177 | 324 | 1,577 | 177 | |||||||||||||||
| Vacas Heladas | 736 | - | ||||||||||||||||||
| El Faique | 590 | 477 | ||||||||||||||||||
| Anamaray | 159 | 99 | 828 | |||||||||||||||||
| Chaje | 206 | 1,042 | 24 | 206 | 1,042 | |||||||||||||||
| Terciopelo | 133 | 1,230 | 23 | 133 | 1,230 | |||||||||||||||
| Anamaray | 99 | 828 | ||||||||||||||||||
| San Pedro Sur | - | 1,940 | ||||||||||||||||||
| Taguas | - | 540 | ||||||||||||||||||
| Pachuca Norte - Mexico | - | 3,264 | 203 | |||||||||||||||||
| Other minor projects less than US$500,000 | 991 | 5,478 | 10,524 | 991 | 6,018 | |||||||||||||||
| 42,804 | 32,688 | 73,582 | 42,804 | 32,688 | ||||||||||||||||
| Projects in mining units | ||||||||||||||||||||
| Shila | 16,191 | - | - | |||||||||||||||||
| Marcapunta | 6,789 | 3,417 | 3,119 | 6,789 | 3,417 | |||||||||||||||
| Santa Barbara | 2,599 | - | - | |||||||||||||||||
| 49,593 | 36,105 | 95,491 | 49,593 | 36,105 | ||||||||||||||||
Notes to the consolidated financial statements (continued)
| (a) | The Company and its subsidiaries recognize the effects of timing differences between the accounting basis and the tax basis. The table below presents the components of this caption, according to the items that give rise to them: |
| As of January 1, 2010 | Credit (debit) to the consolidated Income statement | Credit (debit) to the consolidated changes in shareholders’ equity | As of December 31, 2010 | Credit (debit) to the consolidated Income statement | Credit (debit) to the consolidated changes in shareholders’ equity | As of December 31, 2011 | As of January 1, 2011 | Credit (debit) to the consolidated Income statement | Credit (debit) to the consolidated changes in shareholders´equity | As of December 31, 2011 | Credit (debit) to the consolidated Income statement | Credit (debit) to the consolidated changes in shareholders´ equity | As of December 31, 2012 | |||||||||||||||||||||||||||||||||||||||||||
| US$(000) | US$(000) | US$(000) | US$(000) | US$(000) | US$(000) | US$(000) | US$(000) | US$(000) | US$(000) | US$(000) | US$(000) | |||||||||||||||||||||||||||||||||||||||||||||
| Deferred asset for income tax included in results | ||||||||||||||||||||||||||||||||||||||||||||||||||||||||
| Difference in depreciation and amortization rates | 19,208 | 8,831 | - | 28,039 | 12,172 | - | 40,211 | |||||||||||||||||||||||||||||||||||||||||||||||||
| Tax – loss carryforward | 161,521 | (36,158 | ) | - | 125,363 | (59,053 | ) | - | 66,310 | 125,363 | (59,053 | ) | - | 66,310 | (33,522 | ) | - | 32,788 | ||||||||||||||||||||||||||||||||||||||
| Difference in depreciation and amortization rates | 13,428 | 5,780 | - | 19,208 | 8,831 | - | 28,039 | |||||||||||||||||||||||||||||||||||||||||||||||||
| Effect of translation to U.S. dollars | 5,930 | 3,130 | - | 9,060 | 7,746 | - | 16,806 | |||||||||||||||||||||||||||||||||||||||||||||||||
| Provision for closure of mining units, net | 14,358 | (584 | ) | - | 13,774 | 1,132 | - | 14,906 | 13,774 | 1,132 | - | 14,906 | 469 | - | 15,375 | |||||||||||||||||||||||||||||||||||||||||
| Stock appreciation rights provision | 12,313 | 8,549 | - | 20,862 | (7,545 | ) | - | 13,317 | 20,862 | (7,545 | ) | - | 13,317 | (4,864 | ) | - | 8,453 | |||||||||||||||||||||||||||||||||||||||
| Loss from translation into U.S. dollars | 4,989 | 941 | - | 5,930 | 3,130 | - | 9,060 | |||||||||||||||||||||||||||||||||||||||||||||||||
| Environmental liability for Mina Santa Barbara | 1,494 | - | - | 1,494 | 127 | - | 1,621 | |||||||||||||||||||||||||||||||||||||||||||||||||
| Embedded derivative from sale of concentrates | - | 1,327 | - | 1,327 | 929 | - | 2,256 | 1,327 | 929 | - | 2,256 | (853 | ) | - | 1,403 | |||||||||||||||||||||||||||||||||||||||||
| Environmental liability for Mina Santa Barbara | 1,494 | - | - | 1,494 | - | - | 1,494 | |||||||||||||||||||||||||||||||||||||||||||||||||
| Impairment of property, plant, machinery and equipment, and development costs | 4,867 | (4,867 | ) | - | - | - | - | - | ||||||||||||||||||||||||||||||||||||||||||||||||
| Other minor | 7,777 | 7 | - | 7,784 | 2,053 | - | 9,837 | 7,784 | 2,053 | - | 9,837 | 5,693 | - | 15,530 | ||||||||||||||||||||||||||||||||||||||||||
| 220,747 | (25,005 | ) | - | 195,742 | (50,523 | ) | - | 145,219 | 195,742 | (50,523 | ) | - | 145,219 | (13,032 | ) | - | 132,187 | |||||||||||||||||||||||||||||||||||||||
| Less – Allowance for deferred asset recoverability | (3,005 | ) | 383 | - | (2,622 | ) | (1,177 | ) | - | (3,799 | ) | (2,622 | ) | (1,177 | ) | - | (3,799 | ) | (1,518 | ) | - | (5,317 | ) | |||||||||||||||||||||||||||||||||
| 193,120 | (51,700 | ) | - | 141,420 | (14,550 | ) | - | 126,870 | ||||||||||||||||||||||||||||||||||||||||||||||||
| 217,742 | (24,622 | ) | - | 193,120 | (51,700 | ) | - | 141,420 | ||||||||||||||||||||||||||||||||||||||||||||||||
| Deferred asset included in retained earnings | ||||||||||||||||||||||||||||||||||||||||||||||||||||||||
| Derivative financial instruments | 2,054 | - | 4,903 | 6,957 | - | (6,468 | ) | 489 | 6,957 | - | (6,468 | ) | 489 | - | (489 | ) | - | |||||||||||||||||||||||||||||||||||||||
| 219,796 | (24,622 | ) | 4,903 | 200,077 | (51,700 | ) | (6,468 | ) | 141,909 | 200,077 | (51,700 | ) | (6,468 | ) | 141,909 | (14,550 | ) | (489 | ) | 126,870 | ||||||||||||||||||||||||||||||||||||
| Deferred assets for mining royalties and special mining tax included in results | ||||||||||||||||||||||||||||||||||||||||||||||||||||||||
| Exploration expenses | - | - | - | - | 2,157 | - | 2,157 | - | 2,157 | - | 2,157 | 1,319 | - | 3,476 | ||||||||||||||||||||||||||||||||||||||||||
| Embedded derivatives from sale of concentrate | - | 335 | - | 335 | (144 | ) | - | 191 | ||||||||||||||||||||||||||||||||||||||||||||||||
| Final price adjustment of open provisional liquidations | - | - | - | - | 828 | - | 828 | - | 828 | - | 828 | (804 | ) | - | 24 | |||||||||||||||||||||||||||||||||||||||||
| Embedded derivatives from sale of concentrate | - | - | - | - | 335 | - | 335 | |||||||||||||||||||||||||||||||||||||||||||||||||
| - | - | - | - | 3,320 | - | 3,320 | - | 3,320 | - | 3,320 | 371 | - | 3,691 | |||||||||||||||||||||||||||||||||||||||||||
| Total deferred asset | 219,796 | (24,622 | ) | 4,903 | 200,077 | (48,380 | ) | (6,468 | ) | 145,229 | 200,077 | (48,380 | ) | (6,468 | ) | 145,229 | (14,179 | ) | (489 | ) | 130,561 | |||||||||||||||||||||||||||||||||||
| Deferred liability for income tax included in results | ||||||||||||||||||||||||||||||||||||||||||||||||||||||||
| Differences in amortization rates for development costs | (13,403 | ) | (4,760 | ) | - | (18,163 | ) | 3,278 | - | (14,885 | ) | |||||||||||||||||||||||||||||||||||||||||||||
| Deemed cost of fixed assets | - | (4,848 | ) | - | (4,848 | ) | 1,469 | - | (3,379 | ) | ||||||||||||||||||||||||||||||||||||||||||||||
| Unrealized loss on hedging derivatives financial instruments | - | - | - | - | (384 | ) | - | (384 | ) | |||||||||||||||||||||||||||||||||||||||||||||||
| Embedded derivatives from sale of concentrate | (1,451 | ) | (1,314 | ) | - | (2,765 | ) | 2,565 | - | (200 | ) | |||||||||||||||||||||||||||||||||||||||||||||
| Other minor | (2,611 | ) | 2,360 | - | (251 | ) | 6 | - | (245 | ) | ||||||||||||||||||||||||||||||||||||||||||||||
| (17,465 | ) | (8,562 | ) | - | (26,027 | ) | 6,934 | - | (19,093 | ) | ||||||||||||||||||||||||||||||||||||||||||||||
| Deferred liability for mining royalties and special mining tax included in results | ||||||||||||||||||||||||||||||||||||||||||||||||||||||||
| Deemed cost of fixed assets | - | - | - | - | (501 | ) | - | (501 | ) | |||||||||||||||||||||||||||||||||||||||||||||||
| Derivative financial instruments | - | - | - | - | (54 | ) | - | (54 | ) | |||||||||||||||||||||||||||||||||||||||||||||||
| Embedded derivatives from sale of concentrate | - | - | - | - | (43 | ) | - | (43 | ) | |||||||||||||||||||||||||||||||||||||||||||||||
| - | - | - | - | (598 | ) | - | (598 | ) | ||||||||||||||||||||||||||||||||||||||||||||||||
| Total deferred liability | (17,465 | ) | (8,562 | ) | - | (26,027 | ) | 6,336 | - | (19,691 | ) | |||||||||||||||||||||||||||||||||||||||||||||
| Deferred asset, net | 202,331 | 174,050 | 125,538 | |||||||||||||||||||||||||||||||||||||||||||||||||||||
Notes to the consolidated financial statements (continued)
| As of January 1, 2011 | Credit (debit) to the consolidated Income statement | Credit (debit) to the consolidated changes in shareholders´equity | As of December 31, 2011 | Credit (debit) to the consolidated Income statement | Credit (debit) to the consolidated changes in shareholders´ equity | As of December 31, 2012 | ||||||||||||||||||||||
| US$(000) | US$(000) | US$(000) | US$(000) | US$(000) | US$(000) | US$(000) | ||||||||||||||||||||||
| Deferred liability for income tax included in results | ||||||||||||||||||||||||||||
| Differences in amortization rates for development costs | (18,163 | ) | 3,278 | - | (14,885 | ) | 1,792 | - | (13,093 | ) | ||||||||||||||||||
| Deemed cost of fixed assets | (4,848 | ) | 1,469 | - | (3,379 | ) | 1,094 | - | (2,285 | ) | ||||||||||||||||||
| Unrealized loss on financial instruments | - | (384 | ) | - | (384 | ) | - | 384 | - | |||||||||||||||||||
| Other minor | (251 | ) | 6 | - | (245 | ) | (1,131 | ) | - | (1,376 | ) | |||||||||||||||||
| Embedded derivatives from sale of concentrate | (2,765 | ) | 2,565 | - | (200 | ) | 171 | - | (29 | ) | ||||||||||||||||||
| (26,027 | ) | 6,934 | - | (19,093 | ) | 1,926 | 384 | (16,783 | ) | |||||||||||||||||||
| Deferred liability for mining royalties and special mining tax | ||||||||||||||||||||||||||||
| Deemed cost of fixed assets | - | (501 | ) | - | (501 | ) | 217 | - | (284 | ) | ||||||||||||||||||
| Adjustment to open provisional liquidations | - | - | - | - | (151 | ) | - | (151 | ) | |||||||||||||||||||
| Derivative financial instruments | - | (54 | ) | - | (54 | ) | - | 54 | - | |||||||||||||||||||
| Embedded derivatives from sale of concentrate | - | (43 | ) | - | (43 | ) | 43 | - | - | |||||||||||||||||||
| - | (598 | ) | - | (598 | ) | 109 | 54 | (435 | ) | |||||||||||||||||||
| Total deferred liability | (26,027 | ) | 6,336 | - | (19,691 | ) | 2,035 | 438 | (17,218 | ) | ||||||||||||||||||
| Deferred asset, net | 174,050 | 125,538 | 113,343 | |||||||||||||||||||||||||
Notes to the consolidated financial statements (continued)
Buenaventura has not recognized deferred income tax liability in relation to the excess of the accounting basis over the tax basis of investments in shares due to the following:
| - | In the case of the Cerro Verde associate, Buenaventura has not recognized a deferred income tax asset for US$ |
| - | In the case of the Yanacocha associate, Buenaventura has not recognized a deferred income tax liability for US$ |
| (b) | The table below presents the current and deferred portions of the provisions for Income Tax shown in the consolidated income statement for the years 2012, 2011 and 2010: |
| 2011 | 2010 | 2012 | 2011 | 2010 | ||||||||||||||||
| US$(000) | US$(000) | US$(000) | US$(000) | US$(000) | ||||||||||||||||
| Income (expense) for income tax purposes | ||||||||||||||||||||
| Income tax - | ||||||||||||||||||||
| Current | ||||||||||||||||||||
| Compañía de Minas Buenaventura S.A.A. | (60,091 | ) | (38,003 | ) | (37,343 | ) | (60,091 | ) | (38,003 | ) | ||||||||||
| Minera La Zanja S.A. | (37,180 | ) | (3,793 | ) | (30,493 | ) | (37,180 | ) | (3,793 | ) | ||||||||||
| Inversiones Colquijirca S.A. | (35,944 | ) | (27,765 | ) | ||||||||||||||||
| S.M.R.L. Chaupiloma Dos de Cajamarca | (18,976 | ) | (16,411 | ) | (20,560 | ) | (18,976 | ) | (16,411 | ) | ||||||||||
| Sociedad Minera El Brocal S.A.A. | (10,400 | ) | (35,944 | ) | (27,765 | ) | ||||||||||||||
| Consorcio Energético de Huancavelica S.A. | (1,404 | ) | (1,364 | ) | (3,029 | ) | (1,404 | ) | (1,364 | ) | ||||||||||
| Other | (4,867 | ) | (1,246 | ) | ||||||||||||||||
| (158,462 | ) | (88,582 | ) | |||||||||||||||||
| Deferred | ||||||||||||||||||||
| Compañía de Minas Buenaventura S.A.A. | (51,544 | ) | (29,519 | ) | ||||||||||||||||
| Inversiones Colquijirca S.A. | 6,335 | (55 | ) | |||||||||||||||||
| Minera La Zanja S.A. | 31 | (5,134 | ) | |||||||||||||||||
| Other | 54 | (36 | ) | |||||||||||||||||
| (45,124 | ) | (34,744 | ) | |||||||||||||||||
| (203,586 | ) | (123,326 | ) | |||||||||||||||||
| Mining royalties and Special Mining Tax | ||||||||||||||||||||
| Current | ||||||||||||||||||||
| Compañía de Minas Buenaventura S.A.A. | (7,371 | ) | - | |||||||||||||||||
| Minera La Zanja S.A. | (2,176 | ) | - | |||||||||||||||||
| Sociedad Minera El Brocal S.A.A. | (1,211 | ) | - | |||||||||||||||||
| (10,758 | ) | - | ||||||||||||||||||
| Deferred | ||||||||||||||||||||
| Minera La Zanja S.A. | 1,634 | - | ||||||||||||||||||
| Compañía de Minas Buenaventura S.A.A. | 1,140 | - | ||||||||||||||||||
| Sociedad Minera El Brocal S.A.A. | 3 | - | ||||||||||||||||||
| Compañía de Exploraciones, Desarrollo e Inversiones Mineras S.A.C. - CEDIMIN | (22 | ) | - | |||||||||||||||||
| 2,755 | - | |||||||||||||||||||
| (8,003 | ) | - | ||||||||||||||||||
| Income tax | (211,589 | ) | (123,326 | ) | ||||||||||||||||
Notes to the consolidated financial statements (continued)
| 2012 | 2011 | 2010 | ||||||||||
| US$(000) | US$(000) | US$(000) | ||||||||||
| Other | (4,984 | ) | (4,867 | ) | (1,246 | ) | ||||||
| (106,809 | ) | (158,462 | ) | (88,582 | ) | |||||||
| Deferred | ||||||||||||
| Compañía de Minas Buenaventura S.A.A. | (27,890 | ) | (51,544 | ) | (29,519 | ) | ||||||
| Minera La Zanja S.A. | 7,463 | 31 | (5,134 | ) | ||||||||
| Sociedad Minera El Brocal S.A.A. | 2,457 | 6,335 | (55 | ) | ||||||||
| Other | 6,723 | 54 | (36 | ) | ||||||||
| (11,247 | ) | (45,124 | ) | (34,744 | ) | |||||||
| (118,056 | ) | (203,586 | ) | (123,326 | ) | |||||||
| Mining royalties and Special Mining Tax - | ||||||||||||
| Current | ||||||||||||
| Compañía de Minas Buenaventura S.A.A. | (16,041 | ) | (7,371 | ) | - | |||||||
| Minera La Zanja S.A. | (5,170 | ) | (2,176 | ) | - | |||||||
| Sociedad Minera El Brocal S.A.A. | (3,765 | ) | (1,211 | ) | - | |||||||
| (24,976 | ) | (10,758 | ) | - | ||||||||
| Deferred | ||||||||||||
| Compañía de Minas Buenaventura S.A.A. | 1,093 | 1,140 | - | |||||||||
| Minera La Zanja S.A. | (330 | ) | 1,634 | - | ||||||||
| Sociedad Minera El Brocal S.A.A. | (282 | ) | 3 | - | ||||||||
| Compañía de Exploraciones, Desarrollo e Inversiones Mineras S.A.C. - CEDIMIN | (43 | ) | (22 | ) | - | |||||||
| 438 | 2,755 | - | ||||||||||
| (24,538 | ) | (8,003 | ) | - | ||||||||
| Total income tax | (142,594 | ) | (211,589 | ) | (123,326 | ) | ||||||
Notes to the consolidated financial statements (continued)
| (c) | During the years 2012, 2011 and 2010 the provisions posted for income tax in the income statement were determined as follows: |
| 2011 | % | 2010 | % | 2012 | % | 2011 | % | 2010 | % | |||||||||||||||||||||||||||||||
| US$(000) | US$(000) | US$(000) | US$(000) | US$(000) | ||||||||||||||||||||||||||||||||||||
| Income before income tax | 1,172,067 | 848,215 | 885,384 | 1,172,067 | 848,215 | |||||||||||||||||||||||||||||||||||
| Share in the results of associates | (468,363 | ) | (428,885 | ) | (464,239 | ) | (468,363 | ) | (428,885 | ) | ||||||||||||||||||||||||||||||
| 703,704 | 100.0 | 419,330 | 100.0 | 421,145 | 100.0 | 703,704 | 100.0 | 419,330 | 100.0 | |||||||||||||||||||||||||||||||
| Income tax | 211,112 | 30.0 | 125,799 | 30.0 | ||||||||||||||||||||||||||||||||||||
| Theoretical income tax | 126,344 | 30.0 | 211,112 | 30.0 | 125,799 | 30.0 | ||||||||||||||||||||||||||||||||||
| Expenses not deductible for tax purposes | 4,856 | 0.7 | 1,963 | 0.5 | 4,578 | 1.1 | 4,856 | 0.7 | 1,963 | 0.5 | ||||||||||||||||||||||||||||||
| Adjustment of provision for closure of mining units and exploration projects | 1,132 | 0.2 | (584 | ) | (0.1 | ) | ||||||||||||||||||||||||||||||||||
| Effect of translation to U.S. dollars | (3,130 | ) | (0.40 | ) | (941 | ) | (0.2 | ) | (11,716 | ) | (2.8 | ) | (3,130 | ) | (0.4 | ) | (941 | ) | (0.2 | ) | ||||||||||||||||||||
| Mining royalties and special mining tax | (5,876 | ) | (1.4 | ) | (3,227 | ) | (0.5 | ) | - | - | ||||||||||||||||||||||||||||||
| Effect from currency exchange difference | (3,794 | ) | (0.9 | ) | (5,027 | ) | (0.7 | ) | - | - | ||||||||||||||||||||||||||||||
| Recovery of exploration expenses in Tantahuatay project | - | - | (4,504 | ) | (1.1 | ) | - | - | - | - | (4,504 | ) | (1.1 | ) | ||||||||||||||||||||||||||
| Reversal of the provision for impairment of long-lived assets | - | - | (4,867 | ) | (1.2 | ) | - | - | - | - | (4,867 | ) | (1.2 | ) | ||||||||||||||||||||||||||
| Financial incomes for exonerated interests | - | - | (379 | ) | (0.1 | ) | ||||||||||||||||||||||||||||||||||
| Royalties and special mining tax | (3,227 | ) | (0.5 | ) | - | - | ||||||||||||||||||||||||||||||||||
| Other permanent items | (7,157 | ) | (1.0 | ) | 6,839 | 1.6 | 8,520 | 2.0 | (998 | ) | (0.1 | ) | 5,876 | 1.4 | ||||||||||||||||||||||||||
| Expense for income tax purposes | 203,586 | 28.9 | 123,326 | 29.4 | 118,056 | 28.0 | 203,586 | 28.9 | 123,326 | 29.4 | ||||||||||||||||||||||||||||||
| Mining royalties and Special Mining Tax | 8,003 | 1.1 | - | - | 24,538 | 5.8 | 8,003 | 1.1 | - | - | ||||||||||||||||||||||||||||||
| Total | 211,589 | 30.0 | 123,326 | 29.4 | 142,594 | 33.9 | 211,589 | 30.1 | 123,326 | 29.4 | ||||||||||||||||||||||||||||||
Notes to the consolidated financial statements (continued)
| (d) |
| Basic and diluted earnings per share |
Basic earnings per share are computed by dividing net earnings for the period by the weighted average number of shares outstanding during the year.
In the table below is the composition of the number of shares outstanding as of December 31, 2012, 2011 and 2010, and the number of shares considered in the calculation of basic and diluted earnings per share:
| Shares outstanding as of December 31, 2012, 2011 and 2010 | Shares (denominator in calculating earnings per share considering treasury shares acquired in 2012) | |||||||||||||||||||||||||||||||
| Common | Investment | Of treasury | Total | Common | Investment | Total | ||||||||||||||||||||||||||
| Common | Investment | |||||||||||||||||||||||||||||||
| Balance at January 1, 2012, 2011 and 2010 | 274,889,924 | 744,640 | (21,130,260 | ) | (61,976 | ) | 254,442,328 | 253,759,664 | 682,664 | 254,442,328 | ||||||||||||||||||||||
| Treasury shares acquired during 2012 | - | - | - | (209,757 | ) | (209,757 | ) | - | (209,757 | ) | (209,757 | ) | ||||||||||||||||||||
| Balance at December 31, 2012, 2011 and 2010 | 274,889,924 | 744,640 | (21,130,260 | ) | (271,733 | ) | 254,232,571 | 253,759,664 | 472,907 | 254,232,571 | ||||||||||||||||||||||
Computation of the earnings per share as of December 31, 2012, 2011 and 2010 is presented below:
| 2011 | 2010 | |||||||
| Net income attributable to Buenaventura (numerator) – US$ | 858,927,000 | 660,821,000 | ||||||
| Common shares, note 17(a) | 253,759,664 | 253,759,664 | ||||||
| Investment shares, note 17(b) | 682,664 | 682,664 | ||||||
| Shares (denominator) | 254,442,328 | 254,442,328 | ||||||
| Basic and diluted earnings per share attributable to Buenaventura – US$ | 3.38 | 2.60 | ||||||
Basic and diluted earnings per share are the same given that there are no instruments that have a dilutive effect on earnings.
| 2012 | 2011 | 2010 | ||||||||||
| Attributable net income attributable to owners of the parent (numerator) – US$ | 684,685,000 | 858,927,000 | 660,821,000 | |||||||||
| Shares (denominator) | 254,232,571 | 254,442,328 | 254,442,328 | |||||||||
| Basic and diluted earnings per share – US$ | 2.69 | 3.38 | 2.60 | |||||||||
| Disclosure of information on segments |
International Financial Reporting Standard (IFRS) 8 – “Operating Segments” requires that corporations present financial information taking into account the information reported that the chief operating decision maker uses internally for evaluating the performance of operating segments and allocating resources to those segments (a “through the eyes of management” approach).
The Company’sCompany´s only reportable segment that meets the threshold for reporting is mining, these activities are executed through thirteen companies. The Company’sCompany´s Management considers that these companies could be combined in one segment (mining) considering the financial performance and similar characteristic related to goods nature, production process nature, type of clients and legal environment. The electric segment, mining consulting and insurance are not significant in order to evaluate business development, reason why the Management considers mining the only reportable segment.
The Board of Directors has been identified as the responsible for approving the Company’s operational decisions. The Board of Directors is responsible for allocating resources and assessing performance as a single operating unit.
| Derivative financial instruments |
Derivative contracts –
Buenaventura
As of December 31, 20112012 and 2010,2011, Buenaventura had no derivative contracts.
El Brocal
El Brocal has a policy of carrying outperformed hedge transactions to hedge metals prices using anyone of the derivative instruments existing in the financial market for up to a term of 3 years, for a total of no more than 25%25 percent of the estimated metal content of its annual production each year. The El Brocal Board of Directors meeting of February 23, 2007 named a Hedging Committee to be responsible for approving all hedging transactions, after their contracting and/or execution. El Brocal maintains lines of credit without margin with brokers on the London Metals Exchange (LME).
| (a) | Mineral |
Hedging contracts: Collar options at zero cost -
DuringAs of December 31, 2012, the agreements related to the price hedge were already settled. These hedging derivatives held force since 2010, with the intention of covering the risk resulting from a fall in metal prices which markets El Brocal, subscribed price-hedging optionso they signed contracts at zero cost to insure future flows originating from its sales for the years 2011 and 2012. The critical terms ofthat qualify as cash flow hedging transactions have been negotiated with the brokers socash, which were recorded as to agree with the terms negotiatedassets or liabilities in the related commercial contracts.
These hedging options establish a maximumstatement of financial position, and a minimum price. Whenpresented at fair value. In the average price forcase hedges were effective to offset future cash flows from the quotation period is above the maximum price established, the purchase option in favorsale of the counterpart is activated, generating a paymentrelated production, changes in fair value are deferred in an equity account. The deferred amounts were reclassified to El Brocal of the difference between the two prices. On the other hand,sales when the average price for the quotation period is below the minimum price established, the sale option in favor of El Brocal is activated, resulting in receipt of the difference between both prices.corresponding production was sold.
Cash-flow hedges operations as of December 31, 20112012 were:
| Metal | Monthly average amount FMT | Volume amount FMT | Fixed average Price per FMT | Periods | Fair value |
| US$ | US$(000) | ||||
| Zero cost collar-option contracts | |||||
| Copper | 250 | 2,750 | 7,500 - 8,415 | February –December 2012 | 638 |
| Copper | 250 | 2,750 | 7,500 - 8,425 | February –December 2012 | 645 |
| Fair value of financial instruments (asset) | 1,283 |
| Metal | Monthly average amount MT | Volume amount MT | Fixed average Price per MT | Periods | Fair value | |||||||||||||||
| US$ | US$(000) | |||||||||||||||||||
| Zero cost collar-option contracts | ||||||||||||||||||||
| Copper | 250 | 2,750 | 7,500 – 8,415 | February – December 2012 | 638 | |||||||||||||||
| Copper | 250 | 2,750 | 7,500 – 8,425 | February – December 2012 | 645 | |||||||||||||||
| Fair value offinancial instruments | 1,283 | |||||||||||||||||||
The fair value ofnet change in the derivative financial instruments heldequity account “Other equity reserves” for the twelve months ended as of December 31, 2010 was2012 amounts to a liability amount toloss of US$23,188,000, which is presented in the “Derivative financial instruments” caption844,000 (gain of the consolidated statement of financial position (US$16,291,000 and US$6,897,000 as current and non-current composition, respectively). The fair value of the derivative financial instruments held as of January 1, 2010 was a liability amount to US$6,843,000, which is presented in the “Derivative financial instruments” caption of the consolidated statement of financial position (US$1,468,000 and US$5,375,000 current and non-current composition, respectively).
The cash-flow hedges for sales to be made in coming years have been assessed by El Brocal Management as highly effective. Effectiveness has been measured by the flow-compensation method, since El Brocal’s Management considers it as the method that best reflects the risk management objective with regard to coverage.
As of December 31, 2011, El Brocal, as a result of the hedging transactions settled17,076,000 as of December 31, 2011 held payable accountsand a loss of US$58,000 from London Metal Exchange brokers, which is presented in “Other accounts payable” caption (US$2,227,000 to11,442,000 as of December 31, 2010 were presented in the “Other accounts receivable” caption of the consolidated statement of financial position)2010).
| (b) | The change in the consolidated statement of comprehensive income related to hedging instruments is as follows: |
| Hedge derivative financial instruments | Income tax | Net change in unrealized gain (loss) on hedging derivative financial instruments | ||||||||||
| US$(000) | US$(000) | US$(000) | ||||||||||
| Balance as of January 1, 2010 | (6,843 | ) | 2,053 | (4,790 | ) | |||||||
| Gain from hedging transactions settled during the period, note 19(a) | (1,884 | ) | 565 | (1,319 | ) | |||||||
| Unrealised gain on hedge derivative financial instruments | (14,461 | ) | 4,338 | (10,123 | ) | |||||||
| Total change in derivative financial instruments for hedging | (16,345 | ) | 4,903 | (11,442 | ) | |||||||
| Balance as of December 31, 2010 | (23,188 | ) | 6,956 | (16,232 | ) | |||||||
| Loss from hedging transactions settled during the period, note 19(a) | 8,681 | (2,604 | ) | 6,077 | ||||||||
| Unrealised gain on hedge derivative financial instruments | 15,790 | (4,791 | ) | 10,999 | ||||||||
| Total change in derivative financial instruments for hedging | 24,471 | (7,395 | ) | 17,076 | ||||||||
| Balance as of December 31, 2011, note 28(a) | 1,283 | (439 | ) | 844 | ||||||||
| Hedge derivative financial instruments | Income tax and mining taxes | Net change in unrealized gain (loss) on hedging derivative financial instruments | ||||||||||
| US$(000) | US$(000) | US$(000) | ||||||||||
| Balance as of January 1, 2010 | (6,843 | ) | 2,053 | (4,790 | ) | |||||||
| Loss from hedging transactions settled during the period, note 18(a) | (1,884 | ) | 565 | (1,319 | ) | |||||||
| Unrealized gain on hedge derivative financial instruments | (14,461 | ) | 4,338 | (10,123 | ) | |||||||
| Total change in derivative financial instruments for hedging | (16,345 | ) | 4,903 | (11,442 | ) | |||||||
| Balance as of December 31, 2010 | (23,188 | ) | 6,956 | (16,232 | ) | |||||||
| Gain from hedging transactions settled during the period, note 18(a) | 8,681 | (2,604 | ) | 6,077 | ||||||||
| Unrealized gain on hedge derivative financial instruments | 15,790 | (4,791 | ) | 10,999 | ||||||||
| Total change in derivative financial instruments for hedging | 24,471 | (7,395 | ) | 17,076 | ||||||||
| Balance as of December 31, 2011 | 1,283 | (439 | ) | 844 | ||||||||
| Loss from hedging transactions settled during the period, note 18(a) | (72 | ) | 20 | (52 | ) | |||||||
| Unrealized gain on hedge derivative financial instruments | (1,211 | ) | 419 | (792 | ) | |||||||
| Total change in derivative financial instruments for hedging | (1,283 | ) | 439 | (844 | ) | |||||||
| Balance as of December 31, 2012 | - | - | - | |||||||||
| (c) | Embedded derivatives from changes in the provisional prices of commercial settlements - |
As of December 31, 20112012 and 20102011 the changes in the fair value of embedded derivatives, were present in the “Net sales” caption of the consolidated income statement. The futures quotes for the dates on which it is expected to settle the open positions as of December 31, 2011, 2010,2012 and January 1, 20102011 are taken from publications of the London Metals Exchange.
Embedded derivatives from sales of concentrate held by Buenaventura and El Brocal as of December 31, 2012:
| Maturity | Quotations | Fair value, | ||||||||||||||||||
| Metal | Amount | 2013 | Provisional | Future | net | |||||||||||||||
| US$ | US$ | US$(000) | ||||||||||||||||||
| Sale of concentrates | ||||||||||||||||||||
| Gold | 37,454 DMT | January | 1,651 - 1,750 | 1,652 - 1,740 | 513 | |||||||||||||||
| Silver | 2,258,731 Oz | January – April | 28.70 – 34.23 | 30.19 – 30.26 | (5,129 | ) | ||||||||||||||
| Gold | 179 DMT | January – March | 1,686 – 1,771 | 1,652 – 1,654 | (9 | ) | ||||||||||||||
| Copper | 36,076 DMT | January – April | 7,491 – 8,193 | 7,912 – 8,067 | (887 | ) | ||||||||||||||
| Zinc | 4,015 DMT | January – February | 1,810 – 2,037 | 1,987 – 2,066 | 68 | |||||||||||||||
| Lead | 4,926 Oz | January – March | 1,895 – 2,275 | 2,290 - 2,315 | 316 | |||||||||||||||
| (5,128 | ) | |||||||||||||||||||
| Purchase of concentrates | ||||||||||||||||||||
| Copper | 1,136 DMT | January | 7,965 | 7,912 | 189 | |||||||||||||||
| Total liability, net | (4,939 | ) | ||||||||||||||||||
Embedded derivatives from sales of concentrate sales held by Buenaventura and El Brocal as of December 31, 2011:
| ||||||||||||||||||||
| Maturity | ||||||||||||||||||||
| Fair value, | ||||||||||||||||||||
| Metal | Amount | 2012 | Provisional | Future | net | |||||||||||||||
| US$ | US$ | US$(000) | ||||||||||||||||||
| Gold | 6,713 DMT | January – March | 1,605.40 - 1,727.90 | 1,617.10 - 1,624.20 | (296 | ) | ||||||||||||||
| Silver | 1,451,655 | January – April | 29.38 – 41.02 | 28.83 - 28.91 | (7,713 | ) | ||||||||||||||
| Copper | 17,898 DMT | January – April | 7,348.00 – 9,040.34 | 7,529.00 - 7,603.00 | 597 | |||||||||||||||
| Lead | 9,273 DMT | January – April | 1,945.00 - 2,457.78 | 1,987.00 - 2,025.00 | (719 | ) | ||||||||||||||
| Zinc | 1,581 DMT | January – March | 1,914.97 - 2,011.75 | 1,821.25 - 1,830.25 | (173 | ) | ||||||||||||||
| Gold | 60,458 | January | 1,606.50 – | 1,640.00 - 1,810.00 | 1,517 | |||||||||||||||
| Other | (519 | ) | ||||||||||||||||||
| Total liability, net |
| |||||||||||||||||||
Embedded derivatives from concentrate sales held by Buenaventura and El Brocal as of December 31, 2010:
Quotations | ||||||
| Metal | Amount | Maturity 2011 | Provisional | Future | Fair value net | |
| US$ | US$ | US$(000) | ||||
| Gold | 4,831 DMT | January - April | 1,389.30 | 1,384.00 | 41 | |
| Silver | 1,296,646 DMT | January - April | 20.30 – 29.18 | 29.49 – 29.52 | 3,641 | |
| Lead | 2,172 DMT | January - April | 2,169.14 – 2,400.26 | 2,594.00 – 2,614.00 | 666 | |
| Zinc | 6,768 DMT | January - April | 2,252.86 – 2,296.55 | 2,396.25 – 2,435.00 | 197 | |
| Copper | 40,826 DMT | January - June | 7,652.58 – 9,167.00 | 9,508.00 – 9,705.00 | 9,008 | |
| Gold | 16,278 Ounces | January | 1,382.92 | 1,388.41 | 92 | |
| Total assets, net | 13,645 | |||||
Embedded derivatives from concentrate sales held by Buenaventura and El Brocal as of January 1, 2010:
| ||||||
| ||||||
| ||||||
| (7,306 | ) |
| Financial – risk management objectives and policies |
The Company’s Management principal financial liabilities, other than derivatives, comprise accounts payable, bank loans and overdrafts and debentures. The main purpose of these financial instruments is to manage short-term cash flow and raise finance for the Company’s capital expenditure programme. The Group has various financial assets such as trade and other receivables and cash and short-term deposits that arise directly from its operations.
The Company’s activities expose itManagement manages its exposure to a varietykey financial risks in accordance with the Company’s financial risk management policy. The objective of the policy is to support the delivery of the Company’s financial risks; the principaltargets while protecting future financial security. The main risks that could adversely affect the Company’sGroup’s financial assets, and liabilities and itsor future cash flows are: exchange-rateare market risks, comprising commodity price risk, cash flow interest rate risk of changes in the prices of minerals, interest-rateand foreign currency risk and liquidity risk and credit risk. The Company’s risk management program deals with minimizing the potential adverse effects on its financial performance.Management reviews and agrees policies for managing each of these risks that are summarized below.
The Company’s Management oversees the management of financial risks. The Group’s senior management is expert assupported by a Financial Risk Committee that advises on financial risks and the appropriate financial risk governance framework for the Group. The Financial Risk Committee provides assurance to the conditions existingGroup’s senior management that the Group’s financial risk-taking activities are governed by appropriate policies and procedures and that financial risks are identified, measured and managed in accordance with the marketGroup’s policies and based on its knowledgerisk objectives. All derivative activities for risk management purposes are carried out by specialist teams that have the appropriate skills, experience and experience, reviews and decides on policies to manage each of these risks, which are described in the following paragraphs. This also includes analyses seeking to reveal sensitivity in the Company’s financial instruments to changes in market variables and show the impact on the consolidated income statement or equity, if necessary.supervision.
Financial instruments that are affected by market risks include accounts receivable, accounts payable, embedded derivatives and hedge derivative financial instruments.
The Board of Directors reviews and approves policies to manage each of these risks, which are described below:
| (a) | Market risk |
Market risk is the risk that the fair value of the future cash flows from financial instruments should fluctuate as a result of changes in market prices. The market risks that apply to the Company include three types of risk: exchange-rate risk, risk of changes in the prices of minerals and interest-rate risk. Financial instruments affected by market risks include loans, deposits and derivative financial instruments.
The sensitivity analysis in this section relates to the positions as of December 31, 20112012 and 2010,2011, and has been prepared considering that the proportion of financial instruments in foreign currency remains constant.
| (a.1) | Exchange-rate risk |
The Company bills the sale of its products (locally and abroad) mostly in United States dollars. Exchange-rate risk arises mainly from deposits and other accounts payable in Nuevos Soles. The Company mitigates the effect of exposure to exchange-rate risk by carrying out almost all of its transactions in its functional currency. Management retains smaller amounts in Nuevos Soles in order to cover its needs (taxes and compensation) in this currency.
As of December 31, 2011,2012, the Company had posted a net loss of US$675,0001,715,000 from exchange differences (in the 2010 period, a(a net loss of US$675,000 and US$750,000 from exchange differences)as of December 31, 2011 and 2010), from the translation of balances in Nuevos Soles to the functional currency.
A table showing the effect on results of a reasonable change in foreign-currency exchange rates is presented below, with all other variables kept constant:
| Exchange-rate increase / decrease | Effect on earnings before income tax | Exchange-rate increase / decrease | Effect on earnings before income tax | |||||||||||||
| US$(000) | US$(000) | |||||||||||||||
| 2012 | ||||||||||||||||
| Exchange rate | +10 | % | 8,854 | |||||||||||||
| Exchange rate | -10 | % | (10,563 | ) | ||||||||||||
| 2011 | ||||||||||||||||
| Exchange rate | +10 | % | 8,638 | +10 | % | 8,638 | ||||||||||
| Exchange rate | -10 | % | (10,333 | ) | -10 | % | (10,333 | ) | ||||||||
| 2010 | ||||||||||||||||
| Exchange rate | +10 | % | 3,032 | +10 | % | 3,032 | ||||||||||
| Exchange rate | -10 | % | (3,617 | ) | -10 | % | (3,617 | ) | ||||||||
| As of January 1, 2010 | ||||||||||||||||
| Exchange rate | +10 | % | 3,683 | |||||||||||||
| Exchange rate | -10 | % | (4,502 | ) | ||||||||||||
| (a.2) | Risk of |
Risk in mineral prices
The internationalInternational price of minerals has an important impact on the results of the Company’s operations. These prices areThe price of the mineral sold by the Company has fluctuated historically and is affected by changes in the global economy. Minerals producers are generally incapable of directly influencing this price; however,numerous factors beyond the Company’s profitability is influenced by meanscontrol. The Company manages this risk through the use of Management’s effective control oversales commitments with customers. The Company does not hedge its costs and the efficiency of its operations.
exposure to price fluctuation.
Buenaventura -
The Company does not have financial hedging instruments for managing this risk.
Embedded derivatives
The Company allocates a provisional sales value to the sales that are subject to future settlement pursuant to the commercial contracts signed with its customers. Exposure to changes in the price of metals generates an embedded derivative that must be separated from the commercial contract. At each period’s closing, the value of provisional sales is adjusted in accordance with the estimated price for the quotation period stipulated in the contract. Adjustment of the provisional sale value is posted as an increase or decrease in net sales. See note 2.3.(p)2.3(p).
The estimated change in the price for sales pending final settlement, which is disclosed within the net sales of embedded derivative to December 31, 2011,2012, amounted to US$11,210,0001,776,000 (note 28(c)27(c)). The estimate corresponding to such settlements as closed in January 2012 were reduced by 10 percent with respect to the actual value settled. In the case of settlements that still maintain their provisional value as of December 31, 2010; their estimate was also reduced by 436 percent due to the drop in metals prices since the month of January.January (liquidations that were closed in January 2012 were increased (greater loss) at 10 percent).
El Brocal -
In order to coverAs of December 31, 2012, the risk resulting from a drop in the prices of metals to be marketed, El Brocal signed derivative contracts that qualify as cash-flow hedges. See note 28(a).
In order to control and follow up on hedges, El Brocal approved aCompany does not hold hedging policy “Policy for Hedging Metals Prices”, which is carried out and enforced together with the Policy for Management of Financial Risks. Likewise, El Brocal has a Hedging Committee with the objective of mitigating the risks associated with the changes and volatility taking place in metals prices produced.
With respect toinstruments. Regarding future prices as of December 31, 2011 2010 and as of January 1, 2010 and the fairmarket value as of those datesat that time of the position inof derivative financial instruments for hedging contracted by Elthe Brocal presents a sensitivity analysis of the position’s fairmarket value is presented consideringof this position on a change on the ordervariation of around 10 percent for the relevant prices, while all other variables remainheld constant:
| Effect on gain (loss) on hedge derivative financial | ||||
| US$(000) | ||||
| 2011 | ||||
| Increase of 10 percent in future quotes | ||||
| Hedges in effect for 2012 | (2,047 | ) | ||
| Decrease of 10 percent in future quotes | ||||
| Hedges in effect for 2012 | 4,661 | |||
| (a.3) | ||||
| Interest-rate risk |
(a.3) Interest-rate risk
The Company is exposure to interest-rate risk change especially by its long-term financial obligations.
In the case, the interest-rate subject to the long-term financial obligation changes on the order of 10 percent for LIBOR rate as of December 31, 20112012 and 2010 and January 1, 2010,2011 respectively, the effect on income before income tax had not been significant. The effect is shown below:
| Increase / decrease in Libor rate | Effect on results | Increase / decrease in Libor rate | ||||||||||||||
| (percentage points) | Assets US$(000) | |||||||||||||||
| 2012 | ||||||||||||||||
| Interest rate | +10.0 | 57 | ||||||||||||||
| Interest rate | -10.0 | (57 | ) | |||||||||||||
| (percentage points) | US$(000) | |||||||||||||||
| 2011 | ||||||||||||||||
| Interest rate | +10.0 | 1 | +10.0 | 1 | ||||||||||||
| Interest rate | -10.0 | (1 | ) | -10.0 | (1 | ) | ||||||||||
| 2010 | ||||||||||||||||
| Interest rate | +10.0 | 1 | ||||||||||||||
| Interest rate | -10.0 | (1 | ) | |||||||||||||
| As of January 1, 2010 | ||||||||||||||||
| Interest rate | +10.0 | 84 | ||||||||||||||
| Interest rate | -10.0 | (84 | ) | |||||||||||||
| (b) | Credit risk - |
The Company’s credit risk arises from the inability of debtors to be able to fulfill their obligations, to the extent to which they are overdue. Therefore, the Company deposits its excess funds in leading financial institutions, establishes conservative credit policies and constantly evaluates conditions of the market in which it is involved, for which it uses risk-rating reports for commercial and credit transactions.
There is concentration-of-credit risk when there are changes in the economic, industrial or geographic factors that equally affect the counterparts related to the Company. The Company’s gold and concentrate sales are made to companies of recognized national and international prestige. Transactions are executed with various counterparts with credit solvency, which mitigates any significant concentration of credit.
Trade accounts receivable are denominated in U.S. dollars; their due dates are the dates of emission on the proof of payment, which amounts becomebecomes cash in days following their due dates. The Company’s sales of the Company are made to domestic and foreign customers; as of December 31, 20112012 it had a portfolio of 1419 customers (11(14 customers as of December 31, 2010)2011). See concentration of sales in note 19(b)18(b). The Company performs an assessment on those debts whose collection is estimated as a variable to determine the allowance for doubtful accounts.
Credit risk is limited to the book value of the financial assets as of the consolidated statement of financial position date. These assets consist mainly of cash and cash equivalents, trade accounts receivable, other accounts receivable and derivative financial instruments.
Collections in January 20122013 amounted to US$148,063,000,175,358,000, which represents 86%68 percent of the balances receivable as of December 31, 2011.2012.
| (c) | Liquidity risk - |
Prudent management of liquidity risk implies maintaining sufficient cash and cash equivalents and the possibility of committing or having financing committed through an adequate number of credit sources. The Company maintains suitable levels of cash and cash equivalents; its shareholders also include companies with economic backing and it has sufficient credit capacity to allow it to have access to lines of credit in leading financial entities.
The Company continually monitors its liquidity reserves based on cash flow projections.
An analysis of the Company’s financial liabilities classified according to their aging is presented below, considering the period from their due date to the consolidated statement of financial position:
| Less than 1 year | Between 1 and 2 years | Between 2 and 5 years | More than 5 years | Total | ||||||||||||||||
| US$(000) | US$(000) | US$(000) | US$(000) | US$(000) | ||||||||||||||||
| As of December 31, 2011 | ||||||||||||||||||||
| Trade accounts payable | 142,375 | - | - | - | 142,375 | |||||||||||||||
| Long-term debt (principal and interest) | 1,085 | 857 | 55,519 | 53,001 | 110,462 | |||||||||||||||
| Embedded derivatives for concentrates sales | 7,519 | - | - | - | 7,519 | |||||||||||||||
| Other accounts payable | 41,150 | - | - | - | 41,150 | |||||||||||||||
| 192,129 | 857 | 55,519 | 53,001 | 301,506 | ||||||||||||||||
| As of December 31, 2010 | ||||||||||||||||||||
| Trade accounts payable | 91,374 | - | - | - | 91,374 | |||||||||||||||
| Long-term debt (principal and interest) | 2,056 | 1,222 | 611 | 54,332 | 58,221 | |||||||||||||||
| Financial hedging instruments | 16,291 | 6,897 | - | - | 23,188 | |||||||||||||||
| Other accounts payable | 50,147 | - | - | - | 50,147 | |||||||||||||||
| Total | 159,868 | 8,119 | 611 | 54,332 | 222,930 | |||||||||||||||
| As of January 1, 2010 | ||||||||||||||||||||
| Trade accounts payable | 61,357 | - | - | - | 61,357 | |||||||||||||||
| Long-term debt (principal and interest) | 84,380 | 64,532 | 90,787 | - | 239,699 | |||||||||||||||
| Financial hedging instruments | 1,468 | 5,375 | - | - | 6,843 | |||||||||||||||
| Embedded derivatives for concentrates sales | 292 | - | - | - | 292 | |||||||||||||||
| Other accounts payable | 32,794 | - | - | - | 32,794 | |||||||||||||||
| Total | 180,291 | 69,907 | 90,787 | - | 340,985 |
| Less than 1 year | Between 1 and 2 years | Between 2 and 5 years | More than 5 years | Total | ||||||||||||||||
| US$(000) | US$(000) | US$(000) | US$(000) | US$(000) | ||||||||||||||||
| As of December 31, 2012 | ||||||||||||||||||||
| Trade accounts payable | 199,551 | - | - | - | 199,551 | |||||||||||||||
| Long-term debt (principal and interest) | 6,116 | 29,832 | 29,712 | 122,925 | 188,585 | |||||||||||||||
| Other accounts payable | 58,603 | - | - | - | 58,603 | |||||||||||||||
| Total | 264,270 | 29,832 | 29,712 | 122,925 | 446,739 | |||||||||||||||
| As of December 31, 2011 | ||||||||||||||||||||
| Trade accounts payable | 142,375 | - | - | - | 142,375 | |||||||||||||||
| Long-term debt (principal and interest) | 1,085 | 857 | 55,519 | 53,001 | 110,462 | |||||||||||||||
| Embedded derivatives for concentrates sales | 7,306 | - | - | - | 7,306 | |||||||||||||||
| Other accounts payable | 41,150 | - | - | - | 41,150 | |||||||||||||||
| 191,916 | 857 | 55,519 | 53,001 | 301,293 | ||||||||||||||||
| (d) | Capital management - |
The objective is to safeguard the Company’s capacity to continue as a going concern for the purpose of providing returns for shareholders, benefits for the stakeholders and maintaining an optimal structure that allows reducing the cost of capital.
The Company manages its capital structure and makes adjustments to confront changes in the market’s economic conditions. The Company’s policy is to finance all its short and long-term projects with its own operating resources. In order to maintain or adapt the capital structure, the Company may amend the policy for dividend payments to shareholders, return capital to its shareholders or issue new shares. There were no changes in objectives, policies or procedures during the years ending December 31, 2011, 20102012 and as of January 1, 2010 (transition date).2011.
30. Fair value of financial instruments
| 29. | Fair value of financial instruments |
Fair value is defined as the amount at which assets would be exchanged or liabilities settled between knowing and willing parties Inin an arm’s length transaction, under the assumption is a going concern entity.
When a financial instrument is traded in a liquid and active market, its price as set in a real market transaction offers the best evidence of its fair value. When no price is set in the market or the latter may not be indicative of the instrument’s fair value, the market value of another substantially similar instrument, the analysis of discounted flows or other applicable techniques may be used to determine this fair value, which is materially affected by the assumptions used. Although Management has used its best judgment in estimating the fair values of its financial instruments, any technique for making these estimates entails a certain level of inherent fragility. As a result, fair value may not be indicative of the net realizable or liquidation value of financial instruments.
Financial instruments whose fair value is similar to their book value –
For financial assets and liabilities which are liquid or have short-term maturity (less than three months), such as cash and cash equivalent, accounts receivable, other accounts receivable, accounts receivable from associates, accounts payable and other current liabilities, it is estimated that their book value is similar to their fair value.
The methods and assumptions used depend uponfair value of embedded derivatives is determined using valuation techniques using information directly observable in the terms and specific risks related to each financial instrument were in order to estimate fair values:
Financial instruments at fixed and variable rates –
The fair value of financial assets and liabilities at fixed and variable ratesvariablerates at amortisedamortized cost is determined by comparing the market interest rates at the time of their initial recognition to the current market rates with regard to similar financial instruments. The estimated fair value of deposits that accrue interest is determined by means of cash flows discounted using the prevailing market interest rates in the currency with similar maturities and credit risks.
Based on the foregoing, there isare no significant differences between book value and fair value of financial instruments (assets and liabilities) as of December 31, 20112012 and 2010 and as of January 1, 2010.2011.
| 2011 | 2010 | As of January 1, 2010 | ||||||||||||||||||||||
| Book value | Fair value | Book value | Fair value | Book value | Fair value | |||||||||||||||||||
| US$(000) | US$(000) | US$(000) | US$(000) | US$(000) | US$(000) | |||||||||||||||||||
| Financial assets | ||||||||||||||||||||||||
| Cash and cash equivalents | 480,968 | 480,968 | 600,796 | 600,796 | 714,454 | 714,454 | ||||||||||||||||||
| Trade accounts receivable, net | 52,178 | 52,178 | 50,154 | 50,154 | - | - | ||||||||||||||||||
| Other accounts receivable | 54,091 | 54,091 | 56,363 | 56,363 | 32,722 | 32,722 | ||||||||||||||||||
| Accounts receivable from associates | 79,687 | 79,687 | 45,278 | 45,278 | 21,866 | 21,866 | ||||||||||||||||||
| Financial liabilities | ||||||||||||||||||||||||
| Trade accounts payable | 142,375 | 142,375 | 91,374 | 91,374 | 61,357 | 61,357 | ||||||||||||||||||
| Other accounts payable | 60,765 | 60,765 | 53,103 | 53,103 | 33,825 | 33,825 | ||||||||||||||||||
| Other accounts payable to associates | 1,887 | 1,887 | 2,954 | 2,954 | - | - | ||||||||||||||||||
| Financial obligations | 106,114 | 110,462 | 57,152 | 58,221 | 230,007 | 239,699 | ||||||||||||||||||
Fair value hierarchy -
The Company uses the following hierarchy for determining and disclosing the fair value of financial instruments which are measured at fair value by valuation technique:
Level 1: Quoted (unadjusted) prices in active markets for identical assets or liabilities.
Level 2: Other techniques for which all inputs which have a significant effect on the recorded fair value are observable, either directly or indirectly.
Level 3: Techniques which use inputs which have a significant effect on the recorded fair value that are not based on observable market data.
| Level 1: | Quoted (unadjusted) prices in active markets for identical assets or liabilities. |
| Level 2: | Other techniques for which all inputs or data different from the quoted price of Level 1 are observable, either directly or indirectly. |
| Level 3: | Techniques which use inputs which have a significant effect on the recorded fair value that are not based on observable market data. |
The financial instruments measured at fair value used by the Company, use level 2 valuation techniques in the periods ended as of December 31, 20112012 and 2010, and as of January 1, 2010.2011. This financial instrument is related to the embedded derivative based on the future price of copper on the expected date of settlement. AtAs of December 31, 20112012 and 2010,2011, the balance of those items was a liability of US$7,306,0004,939,000 and an asset of US$13,645,000, respectively (an asset of US$4,546,000 as of January 1, 2010).7,306,000, respectively.
There has been no transfer between fair value levels during 2011 or 2010.2012 neither 2011.
| Commitments and contingencies |
| (a) | Environmental - |
Buenaventura -
The Company’s exploration and exploitation activities are subject to environmental protection standards.
Law No. 28090 regulates the obligations and procedures that must be met by the holders of mining activities for the preparation, filing and implementation of Mine Closure Plans, as well as the establishment of the corresponding environmental guarantees to secure fulfillment of the investments that this includes, subject to the principles of protection, preservation and recovery of the environment.
Law No. 28271 regulates environmental liabilities in mining activities. This Law has the objectiveobjectives of ruling the identification of mining activity’s environmental liabilities and financing the remediation of the affected areas. According to this law, environmental liabilities refer to the impact caused to the environment by abandoned or inactive mining operations.
In compliance with the above-mentioned laws, the Company presented preliminary environmental studies and Environmental Adaptation and Management Programs (EAMP) for mining units. The Ministry of Energy and Mines has approved the EAMP presented by the Company for its mining units and exploration projects. See detail of plans approved in note 15(b)14(a).
El Brocal -
In July 2012, in compliance with current environmental legislation on the closure of the mining units in operation, El Brocal commissioned a company authorized by the Peruvian government to developed a new closure plan for their production unit Colquijirca.
On July 12, 2012, the Company presented the Update Mine Closure Plan Colquijirca where new obligations include closure caused by the expansion of operations. The main changes are related to the closure update clearing deposits and tailings impoundments, decommissioning and dismantling of the concentrator plant expansion to 5,000 DMT/day to 7,000 DMT/day and 10,500 new concentrator DMT/day. The new Mine Closure Plan was approved by a nominal value of US$52,952,000.
Cerro Verde -
On September 2012, according as established by the current legal regulations, Cerro Verde presented to the Ministry of Energy and Mines an updated mine closure plan, in which the remediation and mine closure budget was updated. As a result and pursuant to the accounting policies of Cerro Verde increased the liability for mine closure remediation at US$72,512,000 and the mine closure asset by the same amount.
The increase presented in the mine closure plan in 2012 was due to the update of costs related to the future closure of platform 4B and additional deposits for clearing. Additionally, as a result of the Expansion Project, the useful life of the mine and exploration time has been significantly reduced. The Company considers that this liability is sufficient to meet the current environmental protection laws approved by the MEM. Cerro Verde has issued letters of credit to Ministry of Energy and Mines amounting to US$12,838,000 to secure mine closure plans for its mining unit.
The Company believes that the liabilities posted areliability recorded is sufficient to comply withmeet the environmental regulationscurrent regulatory environment in effect in Peru. See detail in note 15(b).
| (b) | Leased concessions - |
Sindicato Minero Orcopampa S.A. -
The Company pays 10 percent on the valued production of mineral obtained from the concessions leased by Sindicato Minero Orcopampa S.A. This concession is in force until the year 2043. See note 22.21.
Minera El Futuro de Ica S.R.L. -
Inminsur entered into a contract with Minera El Futuro de Ica S.R.L. to operate leased mining concessions in the department of Arequipa. The contractual terms establish that the lease is subject to payment of a royalty equivalent to seven percent of the monthly value of the sale of concentrates. As part of the merger with Buenaventura, the contract will be in force until the year 2015. See note 22.21.
| (c) | Purchase option contracts |
During the ordinary course of business, the Company executes contracts to undertake exploration works in third-party concessions. Under the terms of these contracts, the Company generally has an option to acquire the concession or to invest in it in order to earn a share in the holding company. In order to exercise these options, the Company must fulfill certain obligations during the contract term. The Company’s failure to perform the obligations established therein is usually grounds for termination of these contracts.
The Company may terminate these contracts at any time during their terms, generally after having performed at least the minimum obligations established. Along this line, the Company constantly analyzes the advisability of whether or not to continue with such contractual relationships.
| (d) | Legal procedures |
Buenaventura –-
Buenaventura is a party in legal procedures that have arisen in the normal course of its activities; nevertheless, in the opinion of Buenaventura’s Management, none of these procedures, in particular or as a whole, could result in material contingencies.
Yanacocha –-
Mercury spill in Choropampa –
In June 2000, a transport contractor of Yanacocha spilled approximately 151 kilograms of elemental mercury near the town of Choropampa, Peru, which is located 53 miles (85 kilometers) southwest of the Yanacocha mine. Elemental mercury is not used in Yanacocha’s operations but is a by-product of gold mining and was sold to a Lima firm for use in medical instruments and industrial applications. A comprehensive health and environmental remediation program was undertaken by Yanacocha in response to the incident. In August 2000, Yanacocha paid under protest a fine of S/.1.7 million (approximately $0.5US$0.5 million) to the Peruvian government.
.
Yanacocha has entered into settlement agreements with a number of individuals impacted by the incident. As compensation for the disruption and inconvenience caused by the incident, Yanacocha entered into agreements with and provided a variety of public works in the three communities impacted by this incident. Yanacocha cannot predict the likelihoodlikehood of additional expenditures related to this matter.
Additional lawsuits relating to the Choropampa incident were filed against Yanacocha in the local courts of Cajamarca, Peru, in May 2002 by over 900 Peruvian citizens. A significant number of the plaintiffs in these lawsuits entered into settlement agreements with Yanacocha prior to filing such claims. In April 2008, the Peruvian Supreme Court upheld the validity of these settlement agreements, which should result in the dismissal of all claims brought by previously settled plaintiffs. Yanacocha has also entered into settlement agreements with approximately 350 additional plaintiffs. The claims asserted by approximately 212 plaintiffs remain. In December 2010, Yanacocha resolved 4 additional claims which should result in the dismissal of all claims brought by previously settled plaintiffs. Yanacocha cannot reasonably predict the final outcome or estimate the possible loss relating to such claims. The maximum additional expense related to these judicial claims is estimated at US$1.5 million.
Baños del Inca
In September 2002006 the Municipality of Baños del Inca issued a declaration designating an area that includes the Carachugo Expansion and San Jose Projects as reserved and protected areas. Based on previous experience and actions taken by the Constitutional Tribunal (Peru Court of lastLast instance for Constitutional issues) in respect of Cerro Quilish in which it was ruled that such declaration did not affect Yanacocha’s mining rights, Yanacocha believes that Baños del Inca’s declaration, should not impact the Yanacocha’s legal rights to exploit these concessions. The legal proceeding is currently pending resolution in Lima’s Court of First Instance.
In March 2008, the Lima Court rejected a Baños del Inca Municipality request which did not recognize Lima’s Jurisdiction. The legal proceeding is currently pending resolution in Lima’s Court of First Instance.
San Pablo
In February 2007 the Municipality of San Pablo issued an ordinance designating an area that includes Las Lagunas and Pozo Seco as reserved and protected areas, where Yanacocha has mining rights. Based on previous experience and actions taken by the Constitutional Tribunal in respect of Cerro Quilish in which it was ruled that such declaration did not affect Yanacocha’s mining rights, Yanacocha believes that San Pablo’s declaration, should not impact Yanacocha’s legal rights to exploit these concessions. Yanacocha has challenged this ordinance on the grounds that, under Peruvian law, local governments lack the authority to create such areas, denying the rights granted by Yanacocha’s mining concessions. The Court in the First Instance rejected the complaint based on formal grounds. The resolution of the Court was appealed before Lima’s Court of Second Instance.
In November 2008, Lima’s Court affirmed the ruling from the First Instance. In December 2011, Constitutional Court accepts the complaint. The process is currently pending resolution.
ClinicaClínica Internacional, Addeco, SDC Security
Workers of three contractors companies (Clinica(Clínica Internacional, Adecco and SDC Security) have initiated judicial proceedings through which they demand their incorporation into Minera Yanacocha’sYanacocha´s payroll. The workers deem they are direct employees of Yanacocha with all the rights, arguing that they receive direct orders from Minera Yanacocha and that most of the equipment they use is given by Yanacocha. All proceedings, which involve a total of 85 workers, are pending First Instance resolution.
| (e) | Tax procedures |
Cerro Verde –
SUNAT has assessed mining royalties on materials processed by Cerro Verde concentrator which commenced operations in late 2006. These assessments cover the period October 2006 to December 2007 and the years 2008 and 2009. SUNAT has issued rulings denying Cerro Verde’s protest of the assessments. Cerro Verde has appealed these decisions and currently has three cases pending before the Peruvian Tax Tribunal. Cerro Verde is challenging these royalties because it believes its stability agreement provides an exemption for all minerals extracted from its mining concession, irrespective of the method used for processing those minerals. Although we believe our interpretation of the stability agreement is correct, if Cerro Verde is ultimately found responsible for these assessments, the amount of royalty and related interest payable would be significant. SUNAT may continue to assess mining royalties annually until this matter is resolved by the Peruvian Tax Tribunal.
| F-105 |
| 31. | Transactions with associates companies |
| (a) | The Company has carried out the following transactions with its associates in the years 2012, 2011 and 2010: |
| 2011 | 2010 | |||||||
| US$(000) | US$(000) | |||||||
| Minera Yanacocha S.R.L. : | ||||||||
| Paid royalties to: | ||||||||
| S.M.R.L. Chaupiloma Dos de Cajamarca | 62,742 | 55,883 | ||||||
| Services received by: | ||||||||
| Buenaventura Ingenieros S.A. (Implementation of specific work orders) | 11,579 | 1,575 | ||||||
| Consorcio Energético de Huancavelica S.A. (Electric power transmission) | 4,279 | 4,788 | ||||||
| Sociedad Minera Cerro Verde S.A.A.: | ||||||||
| Granted dividends to: | ||||||||
| Compañía de Minas Buenaventura S.A.A. | - | 182,955 | ||||||
| Compañía Minera Coimolache S.A.: | ||||||||
| Income for: | ||||||||
| Compañía de Minas Buenaventura S.A.A (Expenses recovery of exploration projects) | - | 15,013 | ||||||
| 2012 | 2011 | 2010 | ||||||||||
| US$(000) | US$(000) | US$(000) | ||||||||||
| Transactions with Minera Yanacocha S.R.L.: | ||||||||||||
| Paid royalties to: | ||||||||||||
| S.M.R.L. Chaupiloma Dos de Cajamarca | 67,178 | 62,742 | 55,883 | |||||||||
| Services received by: | ||||||||||||
| Buenaventura Ingenieros S.A (Implementation of specific work orders) | 4,440 | 11,579 | 1,575 | |||||||||
| Consorcio Energético de Huancavelica S.A. (Electric power transmission) | 1,681 | 4,279 | 4,788 | |||||||||
| Transactions with Compañía Minera Coimolache S.A.: | ||||||||||||
| Received dividends | 16,467 | - | - | |||||||||
| Loan | - | 24,232 | - | |||||||||
| Expenses recovery of exploration projects | - | - | 15,013 | |||||||||
| Contributions made to associates: | ||||||||||||
| Canteras del Hallazgo S.A.C. | 26,410 | 32,208 | 16,358 | |||||||||
| Compañía Minera Coimolache S.A. | - | 5,221 | - | |||||||||
| (b) | Compañía Minera Coimolache S.A. (“Coimolache”) |
On October 18, 2010, the Shareholders’ Shareholders´Meeting of Compañía Minera Coimolache S.A. approved the development program and financial support of Tantahuatay Project; the total budget of the project was estimated in US$110,000,000 and the project financing structure should be: 30% shareholders’30 percent shareholders´s equity and 70%70 percent loans from shareholders. The account receivable to Coimolache has been recovered and generates a calculated interest with a LIBOR interest rate to 6 months plus 3%.
3 percent. During the months of June, August and November 2012, the collections made amounted to US$13,423,000.
| (c) | As a result of the transactions indicated before, the Company had the following accounts receivable from associates: |
| Accounts receivable | 2011 | 2010 | As of January 1, 2010 | |||||||||||||||||
| US$(000) | US$(000) | US$(000) | 2012 | 2011 | ||||||||||||||||
| US$(000) | US$(000) | |||||||||||||||||||
| Accounts receivable | ||||||||||||||||||||
| Compañía Minera Coimolache S.A. | 53,971 | 20,787 | 72 | 39,166 | 53,971 | |||||||||||||||
| Minera Yanacocha S.R.L. | 25,441 | 18,852 | 21,794 | 16,513 | 25,441 | |||||||||||||||
| Other | 275 | - | - | 232 | 275 | |||||||||||||||
| 79,687 | 39,639 | 21,866 | 55,911 | 79,687 | ||||||||||||||||
| Less – non-current portion | ||||||||||||||||||||
| Compañía Minera Coimolache S.A. | (32,262 | ) | (20,736 | ) | - | (33,377 | ) | (32,262 | ) | |||||||||||
| Non current portion | (32,262 | ) | (20,736 | ) | - | |||||||||||||||
| Non-current portion | (33,377 | ) | (32,262 | ) | ||||||||||||||||
| Current portion | 47,425 | 18,903 | 21,866 | 22,534 | 47,425 | |||||||||||||||
| Accounts payable | ||||||||||||||||||||
| Compañía Minera Coimolache S.A. | 1,293 | 1,697 | - | 1,018 | 1,293 | |||||||||||||||
| Minera Yanacocha S.R.L. | 594 | 1,257 | - | 603 | 594 | |||||||||||||||
| 1,887 | 2,954 | - | 1,621 | 1,887 | ||||||||||||||||
| Less – non-current portion | ||||||||||||||||||||
| Compañía Minera Coimolache S.A. | (1,004 | ) | (1,370 | ) | - | (731 | ) | (1,004 | ) | |||||||||||
| Current portion | 883 | 1,584 | - | 890 | 883 | |||||||||||||||
| (d) | As of December 31, |
There are no loans to the Company’s directors and key personnel guaranteed with Buenaventura or any of its Subsidiaries’ shares.
| (e) | The Company’s key executives’ compensation (including the related income taxes assumed by the Company) as of December 31, |
| 2011 | 2010 | As of January 1, 2010 | ||||||||||
| US$(000) | US$(000) | US$(000) | ||||||||||
| Salaries | 4,302 | 3,726 | 4,434 | |||||||||
| Share-based compensation plans, note 15(b) | 43,188 | 69,380 | 41,131 | |||||||||
| Directors’ compensations, note 15 | 3,567 | 2,528 | 1,918 | |||||||||
| Total | 51,057 | 75,634 | 47,483 | |||||||||
| 2012 | 2011 | |||||||
| US$(000) | US$(000) | |||||||
| Accounts payable: | ||||||||
| Share-based compensation plans, note 14(c) | 28,258 | 43,188 | ||||||
| Directors’ compensations, note 14 | 2,721 | 3,567 | ||||||
| Salaries | 1,362 | 4,302 | ||||||
| Total | 32,341 | 51,057 | ||||||
| Disbursements by: | ||||||||
| 2012 | 2011 | |||||||
| US$(000) | US$(000) | |||||||
| Share-based compensation plans, note 14(c) | 16,729 | 20,499 | ||||||
| Salaries | 10,824 | 8,461 | ||||||
| Total | 27,553 | 28,960 | ||||||
MINERA YANACOCHA S.R.L.
CONSOLIDATED FINANCIAL STATEMENTS
DECEMBER 31, 2011
Contents2012
| CONTENTS | Page |
| Report of the Independent Registered and Certified Public Accounting Firm | |
| Consolidated Statements of Income and Comprehensive Income | |
| Consolidated Statements of Cash Flows | |
| Consolidated Balance Sheets | |
| Consolidated Statements of Changes in Partners’ Equity | |
| Notes to the Consolidated Financial Statements | |
REPORT OF THE INDEPENDENT REGISTERED AND CERTIFIED PUBLIC
ACCOUNTING FIRM
To the Partners and the Executive Committee of
Minera Yanacocha S.R.L.
March 8, 201225, 2013
In our opinion, the accompanying consolidatedconsolidated balance sheets and the related consolidatedconsolidated statements of income and comprehensive income, changes in partners’ equity and cash flows, present fairly, in all material respects, the financial position ofMinera Yanacocha S.R.L.at December 31, 20112012 and 2010,2011, and the results of their operations and its cash flows for each of the three years in the period ended December 31, 20112012 in conformity with accounting principles generally accepted in the United States of America. These financial statements are the responsibility of the Company’s management. Our responsibility is to express an opinion on these consolidated financial statements based on our audits. We conducted our audits of these financial statements in accordance with the standards of the Public Company Accounting Oversight Board (United States). Those standards require that we plan and perform the audits to obtain reasonable assurance about whether the financial statements are free of material misstatement. An audit of financial statements includes examining, on a test basis, evidence supporting the amounts and disclosures in the financial statements, assessing the accounting principles used and significant estimates made by management, and evaluating the overall financial statement presentation. We believe that our audits provide a reasonable basis for our opinion.
/s/ Dongo-Soria Gaveglio y Asociados
Countersigned by
| (partner) |
Fernando Gaveglio
Peruvian Certified Public Accountant
Registration No.01-19847
MINERA YANACOCHA S.R.L.
CONSOLIDATED STATEMENTS OF INCOME AND COMPREHENSIVE INCOME
| Years Ended December 31, | Years Ended December 31, | |||||||||||||||||||||||
| 2011 | 2010 | 2009 | 2012 | 2011 | 2010 | |||||||||||||||||||
| (dollars in thousands) | (dollars in thousands) | |||||||||||||||||||||||
| Revenues | $ | 2,002,602 | $ | 1,778,260 | $ | 2,013,228 | $ | 2,201,815 | $ | 2,002,602 | $ | 1,778,260 | ||||||||||||
| Costs and expenses | ||||||||||||||||||||||||
| Costs applicable to sales(1) | 738,336 | 655,007 | 671,055 | 694,146 | 738,336 | 655,007 | ||||||||||||||||||
| Amortization | 231,520 | 160,424 | 166,053 | 252,900 | 231,520 | 160,424 | ||||||||||||||||||
| Reclamation and remediation | 19,135 | 14,632 | 13,016 | 20,090 | 19,135 | 14,632 | ||||||||||||||||||
| Exploration | 23,913 | 10,924 | 11,726 | 39,975 | 23,913 | 10,924 | ||||||||||||||||||
| Write-down of long-lived assets | 17,577 | 1,864 | 312 | |||||||||||||||||||||
| Advanced projects | 42,359 | 23,625 | 11,242 | 81,749 | 42,359 | 23,625 | ||||||||||||||||||
| Other expense, net (Note 3) | 42,338 | 58,314 | 77,055 | 112,995 | 40,474 | 58,002 | ||||||||||||||||||
| 1,097,601 | 922,956 | 950,147 | 1,219,432 | 1,097,601 | 922,956 | |||||||||||||||||||
| Other income (expense) | ||||||||||||||||||||||||
| Other income, net (Note 4) | 30,841 | 7,313 | 3,886 | 6,580 | 30,841 | 7,313 | ||||||||||||||||||
| Interest expense, net of capitalized interest of nil, $4,404 and $4,212, respectively | (417 | ) | (3,050 | ) | (4,598 | ) | ||||||||||||||||||
| Interest expense, net of capitalized interest of nil, and $4,404, respectively | (566 | ) | (417 | ) | (3,050 | ) | ||||||||||||||||||
| 30,424 | 4,263 | (712 | ) | 6,014 | 30,424 | 4,263 | ||||||||||||||||||
| Income before income and mining tax | 935,425 | 859,567 | 1,062,369 | 988,397 | 935,425 | 859,567 | ||||||||||||||||||
| Income and mining tax expense (Note 5) | (293,038 | ) | (269,673 | ) | (335,293 | ) | (361,857 | ) | (293,038 | ) | (269,673 | ) | ||||||||||||
| Net income | 642,387 | 589,894 | 727,076 | 626,540 | 642,387 | 589,894 | ||||||||||||||||||
| Other comprehensive income (loss) | (1,511 | ) | 1,149 | 1,239 | 1,129 | (1,511 | ) | 1,149 | ||||||||||||||||
| Comprehensive income | $ | 640,876 | $ | 591,043 | $ | 728,315 | $ | 627,669 | $ | 640,876 | $ | 591,043 | ||||||||||||
(1)Excludes Amortization and Reclamation and remediation
| (1) | Excludes Amortization and Reclamation and remediation |
The accompanying notes are an integral part of theseconsolidated financial statements.
MINERA YANACOCHA S.R.L.
CONSOLIDATED STATEMENTS OF CASH FLOWS
| Years Ended December 31, | Years Ended December 31, | |||||||||||||||||||||||
| 2011 | 2010 | 2009 | 2012 | 2011 | 2010 | |||||||||||||||||||
| (dollars in thousands) | (dollars in thousands) | |||||||||||||||||||||||
| Operating activities: | ||||||||||||||||||||||||
| Net income | $ | 642,387 | $ | 589,894 | $ | 727,076 | $ | 626,540 | $ | 642,387 | $ | 589,894 | ||||||||||||
| Adjustments to reconcile net income to net cash provided from operating activities: | ||||||||||||||||||||||||
| Amortization | 231,520 | 160,424 | 166,053 | 252,900 | 231,520 | 160,424 | ||||||||||||||||||
| Deferred income tax | (2,854 | ) | 3,932 | 25,413 | 4,648 | (2,854 | ) | 3,932 | ||||||||||||||||
| Deferred workers’ profit participation | (1,170 | ) | 985 | 7,513 | 1,347 | (1,170 | ) | 985 | ||||||||||||||||
| Reclamation and remediation | 19,135 | 14,632 | 13,016 | 20,090 | 19,135 | 14,632 | ||||||||||||||||||
| Write-down fixed assets | 17,550 | - | - | |||||||||||||||||||||
| Other operating adjustments | (1,280 | ) | 762 | 3,060 | 5,279 | (1,280 | ) | 762 | ||||||||||||||||
| Decrease (increase) in operating assets: | ||||||||||||||||||||||||
| Inventories, stockpiles and ore on leach pads | 21,346 | (111,255 | ) | (28,582 | ) | (15,481 | ) | 21,346 | (111,255 | ) | ||||||||||||||
| Other assets | (53,010 | ) | 15,757 | 13,302 | 19,698 | (53,010 | ) | 15,757 | ||||||||||||||||
| Increase (decrease) in operating liabilities: | ||||||||||||||||||||||||
| Accounts payable and other accrued liabilities | 61,369 | (48,562 | ) | 58,548 | 11,752 | 61,369 | (48,562 | ) | ||||||||||||||||
| Reclamation liabilities | (5,882 | ) | (5,191 | ) | (4,091 | ) | (7,661 | ) | (5,882 | ) | (5,191 | ) | ||||||||||||
| Net cash provided from operations | 911,561 | 621,378 | 981,308 | 936,662 | 911,561 | 621,378 | ||||||||||||||||||
| Investing activities: | ||||||||||||||||||||||||
| Additions to property, plant and mine development | (994,440 | ) | (297,257 | ) | (150,262 | ) | (1,147,757 | ) | (994,440 | ) | (297,257 | ) | ||||||||||||
| Investments in marketable debt securities | (3,240 | ) | –– | –– | - | (3,240 | ) | - | ||||||||||||||||
| Proceeds from marketable securities | 3,588 | –– | –– | - | 3,588 | - | ||||||||||||||||||
| Proceeds from sale of assets | 1,593 | 509 | 1,345 | 31,155 | 1,593 | 509 | ||||||||||||||||||
| Net cash used in investing activities | (992,499 | ) | (296,748 | ) | (148,917 | ) | (1,116,602 | ) | (992,499 | ) | (296,748 | ) | ||||||||||||
| Financing activities: | ||||||||||||||||||||||||
| Repayment of debt | (1,959 | ) | (176,377 | ) | (27,282 | ) | - | (1,959 | ) | (176,377 | ) | |||||||||||||
| Distributions to partners | –– | –– | (230,000 | ) | ||||||||||||||||||||
| Net cash used in financing activities | (1,959 | ) | (176,377 | ) | (257,282 | ) | - | (1,959 | ) | (176,377 | ) | |||||||||||||
| Net change in cash and cash equivalents | (82,897 | ) | 148,253 | 575,109 | (179,940 | ) | (82,897 | ) | 148,253 | |||||||||||||||
| Cash and cash equivalents at beginning of the year | 880,888 | 732,635 | 157,526 | 797,991 | 880,888 | 732,635 | ||||||||||||||||||
| Cash and cash equivalents at end of the year | $ | 797,991 | $ | 880,888 | $ | 732,635 | $ | 618,051 | $ | 797,991 | $ | 880,888 | ||||||||||||
See Note 1817 for supplemental cash flow information.
The accompanying notes are an integral part of theseconsolidated financial statements.
MINERA YANACOCHA S.R.L.
CONSOLIDATED BALANCE SHEETS
| At December 31, | At December 31, | |||||||||||||||
| 2011 | 2010 | 2012 | 2011 | |||||||||||||
| (dollars in thousands) | (dollars in thousands) | |||||||||||||||
| ASSETS | ||||||||||||||||
| Cash and cash equivalents | $ | 797,991 | $ | 880,888 | $ | 618,051 | $ | 797,991 | ||||||||
| Accounts receivable (Note 7) | 74,608 | 25,807 | 100,539 | 74,608 | ||||||||||||
| Due from related parties (Note 13) | 1,224 | 1,804 | ||||||||||||||
| Due from related parties (Note 12) | 17,205 | 1,224 | ||||||||||||||
| Inventories (Note 8) | 63,501 | 55,941 | 87,413 | 63,501 | ||||||||||||
| Stockpiles and ore on leach pads (Note 9) | 159,713 | 166,998 | 145,546 | 159,713 | ||||||||||||
| Deferred income tax assets (Note 5) | 8,746 | 8,746 | 4,378 | 8,746 | ||||||||||||
| Other current assets (Note 10) | 21,643 | 14,035 | 22,334 | 21,643 | ||||||||||||
| Current assets | 1,127,426 | 1,154,219 | 995,466 | 1,127,426 | ||||||||||||
| Property, plant and mine development, net (Note 11) | 2,231,212 | 1,437,300 | 3,120,173 | 2,231,212 | ||||||||||||
| Stockpiles and ore on leach pads (Note 9) | 351,942 | 328,874 | 352,086 | 351,942 | ||||||||||||
| Other long-term assets (Note 10) | 76,654 | 16,601 | 73,810 | 76,654 | ||||||||||||
| Total assets | $ | 3,787,234 | $ | 2,936,994 | $ | 4,541,535 | $ | 3,787,234 | ||||||||
| LIABILITIES | ||||||||||||||||
| Debt (Note 12) | $ | - | $ | 1,959 | ||||||||||||
| Accounts payable | 114,407 | 68,299 | $ | 114,803 | $ | 114,407 | ||||||||||
| Due to related parties (Note 13) | 35,316 | 38,083 | ||||||||||||||
| Workers’ profit participation (Note 14) | 42,349 | 48,699 | ||||||||||||||
| Due to related parties (Note 12) | 49,399 | 35,316 | ||||||||||||||
| Workers’ profit participation (Note 13) | 45,225 | 42,349 | ||||||||||||||
| Income tax payable | 19,765 | 1,254 | 13,862 | 19,765 | ||||||||||||
| Other current liabilities (Note 15) | 192,742 | 96,064 | ||||||||||||||
| Other current liabilities (Note 14) | 145,078 | 192,742 | ||||||||||||||
| Current liabilities | 404,579 | 254,358 | 368,367 | 404,579 | ||||||||||||
| Reclamation and remediation liabilities (Note 16) | 343,277 | 280,315 | ||||||||||||||
| Deferred workers’ profit participation (Note 14) | 16,980 | 18,150 | ||||||||||||||
| Reclamation and remediation liabilities (Note 15) | 507,943 | 343,277 | ||||||||||||||
| Deferred workers’ profit participation (Note 13) | 18,327 | 16,980 | ||||||||||||||
| Deferred income tax liabilities (Note 5) | 68,910 | 72,412 | 74,042 | 68,910 | ||||||||||||
| Other long-term liabilities | 10,467 | 9,614 | 2,166 | 10,467 | ||||||||||||
| Total liabilities | 844,213 | 634,849 | $ | 970,845 | $ | 844,213 | ||||||||||
| Commitments and contingencies (Note 20) | ||||||||||||||||
| Commitments and contingencies (Note 19) | ||||||||||||||||
| PARTNERS’ EQUITY | ||||||||||||||||
| Partners’ contributions | 398,216 | 398,216 | 398,216 | 398,216 | ||||||||||||
| Additional contributions | 226 | 226 | 226 | 226 | ||||||||||||
| Accumulated other comprehensive income | 877 | 2,388 | 2,006 | 877 | ||||||||||||
| Retained earnings | 2,543,702 | 1,901,315 | 3,170,242 | 2,543,702 | ||||||||||||
| Total partners’ equity (Note 17) | 2,943,021 | 2,302,145 | ||||||||||||||
| Total partners’ equity (Note 16) | 3,570,690 | 2,943,021 | ||||||||||||||
| Total liabilities and partners’ equity | $ | 3,787,234 | $ | 2,936,994 | $ | 4,541,535 | $ | 3,787,234 | ||||||||
The accompanying notes are an integral part of theseconsolidated financial statements.
MINERA YANACOCHA S.R.L.
CONSOLIDATED STATEMENTS OF CHANGES IN PARTNERS’ EQUITY
Partners’ Contributions | Additional Contributions | Retained Earnings | Accumulated Other Comprehensive Income | Total Partners’ Equity | Partners’ Contributions | Additional Contributions | Retained Earnings | Accumulated Other Comprehensive Income | Total Partners’ Equity | |||||||||||||||||||||||||||||||
| Balance at January 1, 2009 | $ | 398,216 | $ | 226 | $ | 814,345 | $ | –– | $ | 1,212,787 | ||||||||||||||||||||||||||||||
| Distributions of profits to the partners | –– | –– | (230,000 | ) | –– | (230,000 | ) | |||||||||||||||||||||||||||||||||
| Unrealized gain on marketable securities, net of income tax | –– | –– | –– | 1,239 | 1,239 | |||||||||||||||||||||||||||||||||||
| Net income | –– | –– | 727,076 | –– | 727,076 | |||||||||||||||||||||||||||||||||||
| Balance at December 31, 2009 | 398,216 | 226 | 1,311,421 | 1,239 | 1,711,102 | |||||||||||||||||||||||||||||||||||
| Balance at January 1, 2010 | $ | 398,216 | $ | 226 | $ | 1,311,421 | $ | 1,239 | $ | 1,711,102 | ||||||||||||||||||||||||||||||
| Unrealized gain on marketable securities, net of income tax | –– | –– | –– | 1,149 | 1,149 | - | - | - | 1,149 | 1,149 | ||||||||||||||||||||||||||||||
| Net income | –– | –– | 589,894 | –– | 589,894 | - | - | 589,894 | - | 589,894 | ||||||||||||||||||||||||||||||
| Balance at December 31, 2010 | 398,216 | 226 | 1,901,315 | 2,388 | 2,302,145 | $ | 398,216 | $ | 226 | $ | 1,901,315 | $ | 2,388 | $ | 2,302,145 | |||||||||||||||||||||||||
| Unrealized gain on marketable securities, net of income tax | –– | –– | –– | (1,511 | ) | (1,511 | ) | - | - | - | (1,511 | ) | (1,511 | ) | ||||||||||||||||||||||||||
| Net income | –– | –– | 642,387 | –– | 642,387 | - | - | 642,387 | - | 642,387 | ||||||||||||||||||||||||||||||
| Balance at December 31, 2011 | $ | 398,216 | $ | 226 | $ | 2,543,702 | $ | 877 | $ | 2,943,021 | $ | 398,216 | $ | 226 | $ | 2,543,702 | $ | 877 | $ | 2,943,021 | ||||||||||||||||||||
| Unrealized gain on marketable securities, net of income tax | - | - | - | 1,129 | 1,129 | |||||||||||||||||||||||||||||||||||
| Net income | - | - | 626,540 | - | 626,540 | |||||||||||||||||||||||||||||||||||
| Balance at December 31, 2012 | $ | 398,216 | $ | 226 | $ | 3,170,242 | $ | 2,006 | $ | 3,570,690 | ||||||||||||||||||||||||||||||
The accompanying notes are an integral part of these consolidated financial statements.
MINERA YANACOCHA S.R.L.
NOTES TO THE CONSOLIDATED FINANCIAL STATEMENTS
(dollars in thousands unless otherwise stated)
1. BUSINESS ACTIVITIES
| 1. | BUSINESS ACTIVITIES |
Minera Yanacocha S.R.L. (the “Company”), formerly Minera Yanacocha S.A., was incorporated in Peru on January 14, 1992 and commenced operations in 1993. The Company is engaged in the production of gold and exploration and development of gold and copper under the mining concessions it owns or that are owned by S.M.R.L. Chaupiloma Dos de Cajamarca (“Chaupiloma”).
The Company is owned 51.35% by Newmont Second Capital Corporation, a 100% indirectly owned subsidiary of Newmont Mining Corporation (“Newmont”), 43.65% owned by Compañía Minera Condesa S.A., which is 100% owned by Compañía de Minas Buenaventura S.A.A. (“Buenaventura”) and 5% owned by the International Finance Corporation.
The majority Partners of the Company (or their affiliates) also own the majority interest in Chaupiloma. In accordance with a mining lease, amended effective January 1, 1994, the Company pays Chaupiloma a 3% royalty based on quarterly production sold at current market prices, after deducting refinery and transportation costs. The royalty agreement expiresexpired in 2012, but can behowever this was extended at the Company’s option.until 2032.
LocatedThe Company is located in the Cajamarca, province of Peru the Company’s operation consists of three majorand currently has active open pit mines:mines as Cerro Yanacocha, La Quinua (which includes El Tapado Oeste), Chaquicocha, Maqui Maqui, Carachugo and Chaquicocha. However, during the last quarter of 2011 mining operations were reinitiated in sections of the Maqui-MaquiCerro Negro. The Company has four leach pads, three processing facilities, and Carachugo pits.one mill. Gold-bearing ores are transported to one of four leach pads for gold recovery using conventional heap-leaching or milling, followed by Merrill-CroweMerrill - Crowe zinc precipitation and smelting where a final doré product is poured. The doré is then shipped offsite for refining and is sold on the worldwide gold markets.
Gold mining requires the use of specialized facilities and technology. The Company relies heavily on such facilities and technology to maintain production levels. Also, the cash flow and profitability of the Company’s operations are significantly affected by the market price of gold. Gold prices can fluctuate widely and are affected by numerous factors beyond the Company’s control. During 2012, 2011 2010 and 2009,2010, the Company produced 1.35 million, 1.29 million 1.46 million and 2.071.46 million ounces of gold, respectively.
The Conga project consists of two gold-copper porphyry deposits located northeast of the Yanacocha operating area in the provinces of Celendin, Cajamarca and Hualgayoc. The project has proven and probable reserves of 12.6 million ounces (unaudited) of contained gold and 3.3 billion pounds (unaudited) of contained copper at December 31, 2011. Construction activity relating to design, procurement and earthworks for the Conga project has begun.2012.
MINERA YANACOCHA S.R.L.
NOTES TO THE CONSOLIDATED FINANCIAL STATEMENTS
(dollars in thousands unless otherwise stated)
InConstruction activities on our Conga project were suspended on November 30, 2011 construction activities at Conga were suspended at the request of Peru’s central government following increasing protests in Cajamarca by anti-mining activists led by the regional president. At the request of the Peruvian central government, the environmental impact assessment prepared in connection with the project, which was previously approved by the central government in October 2010, will bewas reviewed by independent experts, in an effort to resolve allegations surroundingaround the environmental viability of Conga. ConstructionThis review concluded that the environmental impact assessment complied with international standards and provided some recommendations to improve water management. Yanacocha is currently focusing on the construction of water reservoirs prior to the development of other project facilities. Management is committed to the development of Conga, however, development of Conga is contingent upon generating acceptable project returns and getting local community and government support.
In the second quarter of 2011, Presidential and Congressional elections resulted in a change in government in Peru. The new administration supported mining as a driver for continued growth and future development of Peru in 2012. However, we are unable to predict whether the Central government will remain suspended for the duration of the review, except for sediment control works that are being conductedcontinue to take similar positions in the future. The regional government actively opposed the Conga project area, however, progressin 2012 and continues to reject the viability of its development. We are unable to predict the positions that will be taken in the future and whether such positions or changes in law will affect Yanacocha or Conga. Such changes may include increased labor regulations, environmental and other regulatory requirements, and additional taxes and royalties, as well as future protests, community demands and road blockages. For example, during the third quarter of 2011, the new government enacted four new tax laws. The Company cannot predict future positions of either the Central or regional government on engineeringforeign investment, mining concessions, land tenure or other regulation. Any change in government positions or laws on these issues could adversely affect the assets and procurement work.operations of Yanacocha or Conga, which could have a material adverse effect on our results of operations and financial position. Additionally, any inability to continue to develop the Conga project or operate at Yanacocha could have an adverse impact on our growth if we are not able to replace its expected production.
Total proven and probable reserves (unaudited) contained in three active open pits, other pits to be developed, stockpiles, ore in process on leach pads and the Conga project are approximately 20.318.5 million ounces (unaudited) of contained gold, and 3.3 billion pounds (unaudited) of contained copper and 37.1 million ounces of silver at December 31, 2011.2012.
MINERA YANACOCHA S.R.L.
2. SIGNIFICANT ACCOUNTING POLICIESNOTES TO THE CONSOLIDATED FINANCIAL STATEMENTS
(dollars in thousands unless otherwise stated)
| 2. | SIGNIFICANT ACCOUNTING POLICIES |
Principles of Consolidation
The Consolidated Financial Statements include the accounts of Minera Yanacocha S.R.L and the San José Reservoir Trust (“Trust”). In November 2008, the Company funded the Trust to ensure continuous operation of the San José Reservoir after 2018. The Company transferred $13,000 to the Trust in 2008. No withdrawals are allowed until 2018 and the Company is committed to a $23,000 fund as of such date. This Trust is irrevocable and is a separate legal entity. The grantor is the Company, the trustee is the Banco de Crédito del PerúFiduPerú S.A. Sociedad Fiduciaria and the beneficiary is the Company; therefore, the Company consolidates the Trust in its Consolidated Financial Statements.
Use of Estimates
The Company’s Consolidated Financial Statements have been prepared in accordance with accounting principles generally accepted in the United States of America. The preparation of the Company’s Consolidated Financial Statements requires the Company to make estimates and assumptions that affect the reported amounts of assets and liabilities and the related disclosure of contingent assets and liabilities at the date of the Consolidated Financial Statements and the reported amounts of revenues and expenses during the reporting period. The more significant areas requiring the use of management estimates and assumptions relate to mineral reserves that are the basis for future cash flow estimates utilized in impairment calculations and units-of-production amortization calculations; environmental, reclamation and closure obligations; estimates of recoverable gold and other minerals in stockpile and leach pad inventories; write-downs of inventory, ore on leach pads and stockpiles to net realizable value; employee benefit liabilities; valuation allowances for deferred tax assets; workers’ profit participation; reserves for contingencies and litigation; and the fair value and accounting treatment of financial instruments. The Company bases its estimates on historical experience and on various other assumptions that are believed to be reasonable under the circumstances. Accordingly, actual results may differ significantly from these estimates under different assumptions or conditions.
MINERA YANACOCHA S.R.L.
NOTES TO THE CONSOLIDATED FINANCIAL STATEMENTS
(dollars in thousands unless otherwise stated)
Currency
The Consolidated Financial Statements are stated in U.S. dollars, the Company’s functional currency, as most of its transactions are traded, collected and paid in such currency. Transactions in other currencies are recorded in U.S. dollars based on exchange rates prevailing at the time of such transactions. Monetary assets and liabilities denominated in other currencies are translated into the U.S. dollar at exchange rates prevailing at the balance sheet dates, and any resulting gains or losses are reflected in current earnings.
Cash and Cash Equivalents
Cash and cash equivalents consist of all cash balances and highly liquid investments with an original maturity of three months or less. Because of the short maturity of these balances, the carrying amounts approximate their fair value. Restricted cash is excluded from cash and cash equivalents and is included in other current assets or long-term assets depending on restrictions.
MINERA YANACOCHA S.R.L.
NOTES TO THE CONSOLIDATED FINANCIAL STATEMENTS
(dollars in thousands unless otherwise stated)
Investments
Management determines the appropriate classification of its investments in equity securities at the time of purchase and reevaluates such determinations at each reporting date. The Company accounts for its marketable security investments as available for sale securities in accordance withFASB Accounting Standards Codification (“ASC”) guidance on accounting for certain investments in debt and equity securities. The Company periodically evaluates whether declines in fair values of its investments below the Company’s carrying value are other-than-temporaryother - than - temporary in accordance with guidance for the meaning of other-than-temporary impairment and its application to certain investments.ASC guidance. The Company’s policy is to generally treat a decline in the investment’s quoted market value that has lasted continuously for more than six months as other-than-temporaryother - than - temporary decline in value. The Company also monitors its investments for events or changes in circumstances that have occurred that may have a significant adverse effect on the fair value of the investment and evaluates qualitative and quantitative factors regarding the severity and duration of the unrealized loss and the Company’s ability to hold the investment until a forecasted recovery occurs to determine if the decline in value of an investment is other-than-temporary.other - than - temporary. Declines in fair value below the Company’s carrying value deemed to be other-than-temporaryother - than - temporary are charged to earnings.
MINERA YANACOCHA S.R.L.
NOTES TO THE CONSOLIDATED FINANCIAL STATEMENTS
(dollars in thousands unless otherwise stated)
Stockpiles, Ore on Leach Pads and Inventories
As described below, costs that are incurred in or benefit the productive process are accumulated as stockpiles, ore on leach pads and inventories. Stockpiles, ore on leach pads and inventories are carried at the lower of average cost or net realizable value. Net realizable value represents the estimated future sales price of the product based on current and long-termlong - term metals prices, less the estimated costs to complete production and bring the product to sale. Write-downsWrite - downs of stockpiles, ore on leach pads and inventories to net realizable value are reported as a component ofCosts applicable to sales. The current portion of stockpiles, ore on leach pads and inventories is determined based on the expected amounts to be processed within the next twelve months. Stockpiles, ore on leach pads and inventories not expected to be processed within the next twelve months are classified as long-term.long - term. The major classifications are as follows:
Stockpiles
Stockpiles
Stockpiles represent ore that has been extracted from the mine and is available for further processing. Stockpiles are measured by estimating the number of tons added and removed from the stockpile, the number of contained ounces (based on assay data) and the estimated metallurgical recovery rates (based on the expected processing method). Stockpile ore tonnages are verified by periodic surveys. Costs are allocated to stockpiles based on relative values of material stockpiled and processed using current mining costs incurred up to the point of stockpiling the ore, including applicable overhead and amortization relating to mining operations, and removed at each stockpile’s average cost per recoverable unit.
Ore on Leach Pads
The recovery of gold from certain gold oxide ores is achieved through the heap leaching process. Under this method, ore is placed on leach pads where it is treated with a chemical solution, which dissolves the gold contained in the ore. The resulting gold-bearinggold - bearing solution is further processed in a plant where the gold is recovered. Costs are added to ore on leach pads based on current mining costs, including applicable overhead and amortization relating to mining operations. Costs are removed from ore on leach pads as ounces are recovered based on the average cost per recoverable ounce of gold on the leach pad.
MINERA YANACOCHA S.R.L.
NOTES TO THE CONSOLIDATED FINANCIAL STATEMENTS
(dollars in thousands unless otherwise stated)
The estimates of recoverable gold on the leach pads are calculated from the quantities of ore placed on the pads (measured tons added to the leach pads), the grade of ore placed on the leach pads (based on assay data) and a recovery percentage (based on ore type). In general, the leach pads recover approximately 50% to 95% of the ultimate recoverable ounces in the first year of leaching, declining each year thereafter until the leaching process is complete.
Although the quantities of recoverable gold placed on the leach pads are reconciled by comparing the grades of ore placed on the pads to the quantities of gold actually recovered (metallurgical balancing), the nature of the leaching process inherently limits the ability to precisely monitor inventory levels. As a result, the metallurgical balancing process is constantly monitored and estimates are refined based on actual results over time. Historically, the Company’s operating results have not been materially impacted by variations between the estimated and actual recoverable quantities of gold on its leach pads. Variations between actual and estimated quantities resulting from changes in assumptions and estimates that do not result in write-downswrite - downs to net realizable value are accounted for on a prospective basis.
MINERA YANACOCHA S.R.L.
NOTES TO THE CONSOLIDATED FINANCIAL STATEMENTS
(dollars in thousands unless otherwise stated)
In-process Inventory
In-processIn - process inventories represent materials that are currently in the process of being converted to a saleable product. The conversion processes vary depending on the nature of the ore and the specific processing facility, and include mill in-circuit and leach in-circuit. In-processIn - process material is measured based on assays of the material fed into the process and the projected recoveries of the respective plants. In-processIn - process inventories are valued at the average cost of the material fed into the process attributable to the source material coming from the mines, stockpiles and/or leach pads plus the in-processin - process conversion costs, including applicable amortization relating to the process facilities incurred to that point in the process.
Precious Metals Inventory
Precious metals include gold dorédore and/or gold bullion. Precious metals that result from the Company’s mining, processing and refining activities are valued at the average cost of the respective in-processin - process inventories incurred prior to the refining process, plus applicable refining costs.
Concentrate Inventory
Concentrate inventories represent silver, gold and copper concentrate available for shipment. The Company values concentrate inventory at the average cost, including an allocable portion of support costs and amortization. Costs are added and removed to the concentrate inventory based on tons of concentrate and are valued at the lower of average cost or net realizable value.
| F-119 |
MINERA YANACOCHA S.R.L.
NOTES TO THE CONSOLIDATED FINANCIAL STATEMENTS
(dollars in thousands unless otherwise stated)
Materials and Supplies
Materials and supplies are valued at the lower of average cost or net realizable value. Cost includes applicable taxes and freight.
Property, Plant and Mine Development
Facilities and Equipment
Expenditures for new facilities or equipment and expenditures that extend the useful lives of existing facilities or equipment are capitalized and recorded at cost. The facilities and equipment are amortized using the straight-linestraight - line method at rates sufficient to amortize such costs over the estimated productive lives whichof such facilities. These estimated productive lives do not exceed the related estimated mine lives, of such facilitieswhich are based on proven and probable reserves.
Mine Development
Mine development costs include engineering and metallurgical studies, drilling and other related costs to delineate an ore body, and the removal of overburden to initially expose an ore body at open pit surface mines. Costs incurred before mineralization is classified as proven and probable reserves are expensed and classified asExploration orAdvanced projects expense. Capitalization of mine development project costs, that meet the definition of an asset, begins once mineralization is classified as proven and probable reserves.
MINERA YANACOCHA S.R.L.
NOTES TO THE CONSOLIDATED FINANCIAL STATEMENTS
(dollars in thousands unless otherwise stated)
Drilling and related costs are capitalized for an ore body where proven and probable reserves exist,exist; the activities are directed at obtaining additional information on the ore body or converting non-reservenon - reserve mineralization to proven and probable reserves. All other drilling and related costs are expensed as incurred. Drilling costs incurred during the production phase for operational ore control are allocated to inventory costs and then included as a component ofCosts applicable to sales.
The cost of removing overburden and waste materials to access the ore body at an open pit mine prior to the production phase are referred to as “pre-stripping“pre - stripping costs”. Pre-strippingPre - stripping costs are capitalized during the development of an open pit mine. Where multiple open pits exist at a mining complex utilizing common processing facilities, pre-strippingpre - stripping costs are capitalized at each pit. The removal and production of de minimis saleable materials may occur during development and are recorded asotherOther income, net of incremental mining and processing costs.
MINERA YANACOCHA S.R.L.
NOTES TO THE CONSOLIDATED FINANCIAL STATEMENTS
(dollars in thousands unless otherwise stated)
The production phase of an open pit mine commences when saleable minerals, beyond a de minimis amount, are produced. Stripping costs incurred during the production phase of a mine are variable production costs that are included as a component of inventory to be recognized inCosts applicable to sales in the same period as the revenue from the sale of inventory. The Company’s definition of a mine and the mine’s production phase may differ from that of other companies in the mining industry resulting in incomparable allocations of stripping costs to deferred mine development and production costs. Other mining companies may expense pre-strippingpre - stripping costs associated with subsequent pits within a mining complex. Other mining companies may capitalize stripping costs incurred in connection with the production phase.
Mine development costs are amortized using the units-ofunits - of production (“UOP”) method based on estimated recoverable ounces in proven and probable reserves. To the extent that these costs benefit an entire ore body, they are amortized over the estimated life of the ore body. Costs incurred to access specific ore blocks or areas that only provide benefit over the life of that area are amortized over the estimated life of that specific ore block or area.
Mineral Interests
Mineral interests include acquired interests in production, development and exploration stage properties. The mineral interests are capitalized at their fair value at the acquisition date, either as an individual asset purchase or as part of a business combination.
MINERA YANACOCHA S.R.L.
NOTES TO THE CONSOLIDATED FINANCIAL STATEMENTS
(dollars in thousands unless otherwise stated)
The value of such assets is primarily driven by the nature and amount of mineralized material believed to be contained in such properties. Production stage mineral interests represent interests in operating properties that contain proven and probable reserves. Development stage mineral interests represent interests in properties under development that contain proven and probable reserves. Exploration stage mineral interests represent interests in properties that are believed to potentially contain mineralized material consisting of (i) mineralized material such as inferred material within pits; measured, indicated and inferred material with insufficient drill spacing to qualify as proven and probable reserves; and inferred material in close proximity to proven and probable reserves; (ii) around-minearound - mine exploration potential such as inferred material not immediately adjacent to existing reserves and mineralization, but located within the immediate mine area; (iii) other mine-relatedmine - related exploration potential that is not part of measured, indicated or inferred material and is comprised mainly of material outside of the immediate mine area; (iv) greenfields exploration potential that is not associated with any other production, development or exploration stage property, as described above; or (v) any acquired right to explore or extract a potential mineral deposit. The Company’s mineral rights generally are enforceable regardless of whether proven and probable reserves have been established. The Company has the ability and intent to renew mineral interests where the existing term is not sufficient to recover all identified and valued proven and probable reserves and/or undeveloped mineralized material.
MINERA YANACOCHA S.R.L.
NOTES TO THE CONSOLIDATED FINANCIAL STATEMENTS
(dollars in thousands unless otherwise stated)
Asset Impairment
The Company reviews and evaluates its long-lived assets for impairment when events or changes in circumstances indicate that the related carrying amounts may not be recoverable. An impairment is considered to exist if the total of the assets estimated future cash flows on an undiscounted basis are less than the carrying amount of the assets. An impairment loss is measured and recorded based on discounted estimated future cash flows. Future cash flows are estimated based on quantities of recoverable minerals, expected gold and other commodity prices (considering current and historical prices, trends and related factors), production levels, operating costs, capital requirements and reclamation costs, all based on life-of-mine plans. Existing proven and probable reserves and value beyond proven and probable reserves, including mineralization that is not part of the measured, indicated or inferred resource base, are included when determining the fair value of mine site reporting units at acquisition and, subsequently, in determining whether the assets are impaired. The term “recoverable minerals” refers to the estimated amount of gold or other commodities that will be obtained after taking into account losses during ore processing and treatment. Estimates of recoverable minerals from such exploration stage mineral interests are risk adjusted based on management’s relative confidence in such materials. In estimating future cash flows, assets are grouped at the lowest level for which there are identifiable cash flows that are largely independent of future cash flows from other asset groups. The Company’s estimates of future cash flows are based on numerous assumptions and it is possible that actual future cash flows will be significantly different than the estimates, as actual future quantities of recoverable minerals, gold and other commodity prices, production levels and costs and capital are each subject to significant risks and uncertainties.
Revenue Recognition
Revenue is recognized, net of treatment and refining charges, from a sale when persuasive evidence of an arrangement exists, the price is determinable, the product has been delivered, the title has been transferred to the customer and collection of the sales price is reasonably assured. Revenues from silver and copper sales are credited to Costs applicable to sales as a by-product credit.
MINERA YANACOCHA S.R.L.
NOTES TO THE CONSOLIDATED FINANCIAL STATEMENTS
(dollars in thousands unless otherwise stated)
Income and Mining Taxes and Profit Sharing
The Company accounts for income and mining taxes and legally required profit sharing using the liability method, recognizing certain temporary differences between the financial reporting basis of the Company’s liabilities and assets and the related income tax basis for such liabilities and assets. This method generates a net deferred income tax liability and profit sharing liability or net deferred income tax asset and profit sharing asset for the Company, as measured by the statutory tax and profit sharing rates in effect as enacted. The Company derives its deferred income tax charge or benefit and profit sharing charge or benefit by recording the change in the net deferred income tax liability and profit sharing liability or net deferred income tax asset and profit sharing asset balance for the year, based on Peruvian income and mining tax and profit sharing rates.
MINERA YANACOCHA S.R.L.
NOTES TO THE CONSOLIDATED FINANCIAL STATEMENTS
(dollars in thousands unless otherwise stated)
The Company’s deferred income tax assets include certain future tax benefits. The Company records a valuation allowance against any portion of those deferred income tax assets when it believes, based on the weight of available evidence, it is more likely than not that some portion or all of the deferred income tax asset will not be realized.
Reclamation and Remediation Costs
Asset retirement obligations are recognized when incurred and recorded as liabilities at fair value. The liability is accreted over time through periodic charges to earnings. In addition, the asset retirement cost is capitalized as part of the asset’s carrying value and amortized over the life of the related asset. Reclamation costs are periodically adjusted to reflect changes in the estimated present value resulting from the passage of time and revisions to the estimates of either the timing or amount of the reclamation costs. The estimated retirement obligation is based on when spending for an existing environmental disturbance willis expected to occur. The Company reviews, on an annual basis, unless otherwise deemed necessary, the reclamation obligation at each mine site in accordance with ASC guidance for reclamation obligations.
Future remediation costs for inactive mines are accrued based on management’s best estimate at the end of each period of the costs expected to be incurred at a site. Such cost estimates include, where applicable, ongoing care, maintenance and monitoring costs. Changes in estimates at inactive mines are reflected in earnings in the period an estimate is revised.
Comprehensive Income
In addition toNet income, Comprehensive income (loss) includes all changes in equity during a period, such as cumulative unrecognized changes in fair value of marketable securities available-for-saleavailable - for - sale or other investments, except those resulting from investments by and distributions to owners.
MINERA YANACOCHA S.R.L.
NOTES TO THE CONSOLIDATED FINANCIAL STATEMENTS
(dollars in thousands unless otherwise stated)
Recently Adopted Accounting Pronouncements
Business Combinations
In December 2010, the ASC guidance for business combinations was updated to clarify existing guidance which requires a public entity to disclose pro forma revenue and earnings of the combined entity as though the business combination(s) that occurred during the current year had occurred as of the beginning of the comparable prior annual period only. The update also expands the supplemental pro forma disclosures required to include a description of the nature and amount of material, nonrecurring pro forma adjustments directly attributable to the business combination included in the reported pro forma revenue and earnings. Adoption of the updated guidance, effective for the Company's fiscal year beginning January 1, 2011, had no impact on the Company's consolidated financial position, results of operations or cash flows.
Fair Value Accounting
In January 2010, ASC guidance for fair value measurements and disclosure was updated to require enhanced detail in the level 3 reconciliation. Adoption of the updated guidance, effective for the Company's fiscal year beginning January 1, 2011, had no impact on the Company's consolidated financial position, results of operations or cash flows. Refer to Note 6 for further details regarding the Company's assets and liabilities measured at fair value.
Comprehensive Income
In June 2011, ASC guidance was issued related to comprehensive income. Under the updated guidance, an entity will have the option to present the total of comprehensive income either in a single continuous statement of comprehensive income or in two separate but consecutive statements. In addition, the update requires certain disclosure requirements when reporting other comprehensive income. The update does not change the items reported in other comprehensive income or when an item of other comprehensive income must be reclassified to income. The update is effective for the Company's fiscal year beginning January 1, 2012. The Company adopted the new guidance and its deferral and opted to present comprehensive income in a single continuous statement effective for its fiscal year beginning January 1, 2011. The early adoption had no impact on the Company’s consolidated financial position, results of operations or cash flows.
Recently Issued Accounting Pronouncements
Fair Value Accounting
In May 2011, ASC guidance was issued related to disclosures around fair value accounting. The updated guidance clarifies different components of fair value accounting including the application of the highest and best use and valuation premise concepts, measuring the fair value of an instrument classified in a reporting entity's shareholders'entity’s shareholders’ equity and disclosing quantitative information about the unobservable inputs used in fair value measurements that are categorized in Level 3 of the fair value hierarchy. The Company’s January 1, 2012 adoption of the updated guidance had no impact on the Company’s consolidated financial position, results of operations or cash flows. Refer to note 6 for further details regarding the Company’s assets and liabilities measured at fair value.
MINERA YANACOCHA S.R.L.
NOTES TO THE CONSOLIDATED FINANCIAL STATEMENTS
(dollars in thousands unless otherwise stated)
Comprehensive Income
In June 2011, theASC guidance was issued related to comprehensive income. Under the updated guidance, an entity will have the option to present the total of comprehensive income either in a single continuous statement of comprehensive income or in two separate but consecutive statements. In addition, the update required certain disclosure requirements when reporting other comprehensive income. The update does not change the items reported in other comprehensive income or when an item of other comprehensive income must be reclassified to income. The Company adopted the new guidance and its deferral and opted to present the total of comprehensive income in two separate but consecutive statements effective for its fiscal year beginning January 1, 2011. The early adoption had no impact on the Company’s consolidated financial position, results of operations or cash flows.
Recently Issued Accounting Pronouncements
Reporting of Amounts reclassified out of Accumulated Other Comprehensive Income
In February 2013, ASC guidance was issued related to items reclassified fromAccumulated Other Comprehensive Income. The new standard requires either in a single note or parenthetically on the face of the financial statements:(i) the effect of significant amounts reclassified from each component of accumulated other comprehensive income based on its source and (ii) the income statement line items affected by the reclassification. The update is effective for the Company'sCompany’s fiscal year beginning January 1, 2012.2013 with early adoption permitted. The Company does not expect the updated guidance to have a significant impact on the consolidated financial position, results of operations or cash flows.
Disclosures about Offsetting Assets and Liabilities
In November 2011, ASC guidance was issued related to disclosures about offsetting assets and liabilities. The new standard requires disclosures to allow investors to better compare financial statements prepared under U.S. GAAP with financial statements prepared under IFRS. The update is effective for the Company’s fiscal year beginning January 1, 2013, and interim periods within those annual periods. Retrospective application is required.
MINERA YANACOCHA S.R.L.
NOTES TO THE CONSOLIDATED FINANCIAL STATEMENTS
(dollars in thousands unless otherwise stated)
3. OTHER EXPENSE, NETIn January 2013, ASC guidance was issued to clarify that the disclosure requirements are limited to derivatives, repurchase agreements, and securities lending transactions to the extent that they are (i) offset in the financial statements or (ii) subject to an enforceable master netting arrangement or similar agreement.The Company does not expect the updated guidance to have an impact on the consolidated financial position, results of operations or cash flows.
| 3. | OTHER EXPENSE, NET |
| Years Ended December 31, | Years Ended December 31, | |||||||||||||||||||||||
| 2011 | 2010 | 2009 | 2012 | 2011 | 2010 | |||||||||||||||||||
| Regional administration | $ | 23,341 | $ | 20,725 | $ | 18,477 | ) | $ | 35,026 | $ | 23,341 | $ | 20,725 | |||||||||||
| Community development and external affairs | 17,341 | 16,002 | 21,673 | ) | 30,078 | 17,341 | 16,002 | |||||||||||||||||
| Write-down of long-lived assets | 1,864 | 312 | 2,923 | |||||||||||||||||||||
| World Gold Council dues | 1,281 | 3,824 | 3,602 | ) | 3,021 | 1,281 | 3,824 | |||||||||||||||||
| Choropampa mercury spill (Note 20) | 146 | 119 | 606 | ) | ||||||||||||||||||||
| Negotiated payment | –– | 13,346 | 28,019 | - | - | 13,346 | ||||||||||||||||||
| Employee Severance Program | 40,943 | - | - | |||||||||||||||||||||
| Other | (1,635 | ) | 3,986 | 1,755 | ) | 3,927 | (1,489 | ) | 4,105 | |||||||||||||||
| $ | 42,338 | $ | 58,314 | $ | 77,055 | ) | $ | 112,995 | $ | 40,474 | $ | 58,002 | ||||||||||||
Negotiated Payment
During 2006 mining companies represented by the Sociedad Nacional de Minería, Petróleo y Energía (“SNMPE”) agreed to a mining payment equivalent to 3.75% of Peruvian net income after taxes. This agreement was valid through 2010. The funds are managed by an association designated by the Company. Mining companies contributed these funds to participate in the government efforts to eradicate poverty in Peru in the current favorable economic environment.
In December 2006, the Peruvian Government approved legislation regulating the conditions in which the negotiated payment was paid by Peruvian mining companies. The payment amounted to 3.75% of Peruvian net income after income tax (2.75% paid to a Local Mining Fund and 1% paid to a Regional Mining Fund), payable for 2006 through 2010 if certain conditions were met. The funds are managed by an association designated by the Company. Mining companies contributed these funds to participate in the government efforts to eradicate poverty in Peru in the current favorable economic environment.
4. OTHER INCOME, NETEmployee severance program
| Years Ended December 31, | ||||||||||||
| 2011 | 2010 | 2009 | ||||||||||
| Income of early stage production pits, net | $ | 24,959 | ) | $ | 2,171 | ) | $ | –– | ||||
| Gain (loss) on sale of assets | 1,557 | (208 | ) | 815 | ||||||||
| Interest income | 1,323 | ) | 2,196 | ) | 3,832 | ) | ||||||
| Marketable securities | 348 | ) | –– | –– | ||||||||
| Foreign currency exchange gain (loss) | (745 | ) | 998 | (2,490 | ) | |||||||
| Other | 3,399 | ) | 2,156 | ) | 1,729 | ) | ||||||
| $ | 30,841 | ) | $ | 7,313 | ) | $ | 3,886 | ) | ||||
During 2012, Yanacocha conducted a restructuring program in order to align the Company’s organization with future business needs. In connection therewith, a group of employees signed mutual agreements to terminate their labor contracts in return for severance payments. This program was mainly executed during the month of September 2012 and no liabilities were outstanding at year-end.
MINERA YANACOCHA S.R.L.
NOTES TO THE CONSOLIDATED FINANCIAL STATEMENTS
(dollars in thousands unless otherwise stated)
5. INCOME AND MINING TAXES
| 4. | OTHER INCOME, NET |
| Years Ended December 31, | ||||||||||||
| 2012 | 2011 | 2010 | ||||||||||
| Development projects, net | $ | 10,785 | $ | 24,959 | $ | 2,171 | ||||||
| Gain (loss) on sale of assets | (3,878 | ) | 1,557 | (208 | ) | |||||||
| Interest income | 1,019 | 1,323 | 2,196 | |||||||||
| Gain (loss) on sale of investments | - | 348 | - | |||||||||
| Foreign currency exchange gain (loss) | (1,216 | ) | (745 | ) | 998 | |||||||
| Other | (130 | ) | 3,399 | 2,156 | ||||||||
| 6,580 | $ | 30,841 | $ | 7,313 | ||||||||
| 5. | INCOME AND MINING TAXES |
Tax Stabilization Agreements
The Company has entered into the following tax stability agreements, each with a term of 15 years:
Mine | Effective | Date of the Tax | Tax Regimes in | |||
| Maqui Maqui | January 1, 1997 | September 12, 1994 | May 6, 1994 | |||
| Cerro Yanacocha | January 1, 2000 | September 16, 1998 | May 22, 1997 | |||
| La Quinua | January 1, 2004 | August 25, 2003 | August 25, 2003 |
These agreements guarantee the Company’s use of the tax regimes shown in the table above and permit maintenance of its accounting records in U.S. dollars.
The Carachugo/San JoséMaqui - Maqui tax stability agreement expired on January 1, 2012 and is no longer in effect beginning January 1, 2010, as 15 years has lapsed. The Maqui-Maqui tax stability agreement is no longer in effect since January 1, 2012.effect.
The Company has determineddetermines the taxable income according tobased on its understanding and that of its legal advisors, of the applicable tax legislation. This legislation requires adding to and deductingTaxable income differs from accountingpre-tax income as determined in thedisclosed within these financial statements by those items that the referredapplicable tax legislation recognizes as taxabledeems to be non-taxable or non-deductible and non-taxable, respectively.by certain differences between U.S. and Peruvian generally accepted accounting principles.
For the years ended December 31, 2012, 2011 2010 and 20092010 the income tax rate was 30% except for the La Quinua mine for which the requireda 29% income tax rate applied.
| F-126 |
MINERA YANACOCHA S.R.L.
NOTES TO THE CONSOLIDATED FINANCIAL STATEMENTS
(dollars in thousands unless otherwise stated)
Other Mining Taxes
| a) | Law N° 29788, Mining Royalties |
During the second quarter of 2004, the Peruvian Government enacted legislation to establish a sliding scale mining royalty of up to 3% based on the volume of mine production. The royalty is calculated on revenue from sales of product less certain refining and transportation expenses. While the Peruvian royalty became effective during the second quarter of 2004, it does not apply to those projects that had stabilization agreements prior to the adoption of the royalty law. The Company’s current production is derived from projects that were stabilized prior to the enactment of the royalty legislation withas well as projects where the exception of the Carachugo/San José tax stabilization agreement which was no longer in effect beginning January 1, 2010; thus, during 2010 and for the nine months September 30, 2011, the Company charged toCosts Applicable to Sales $13,481 and $11,087 respectively.agreements have expired. In September 2011, the law was modified to comprise a new mining tax payable to the Peruvian Government for extracting metallic and non-metallicnon - metallic mineral resources from its mining concessions.
MINERA YANACOCHA S.R.L.
NOTES TO THE CONSOLIDATED FINANCIAL STATEMENTS
(dollars in thousands unless otherwise stated)
The new mining royalty is payable quarterly, based on sales and operating profit determined in accordance with Peruvian generally accepted accounting principles. The royalty amount due is the greater of 1% of sales or an amountsales. An additional mining tax due is calculated based on the level of operating profit. Theprofit up to a maximum applicable rate is 12% of operating profit.. This component of the new mining tax only appliedapplies to Carachugo in the fourth quarter ofthose projects that are not covered by a tax stabilization agreement. During 2012 and 2011, $5,102 and $1,146, wasrespectively, were included inCosts applicable to salesbased on 1% of revenue and $2,359 and $132 waswere included inIncome and mining tax expensebased on an average of 3.46% and 3.97% of operating profit. In 2012, Maqui Maqui will also be subject to the new mining royalty.profit, respectively.
| b) | Law N° 29789, Special Mining Tax |
The Special Mining Tax (“IEM”) applies to mines not covered by a tax stabilization agreement. The IEM is payable on a quarterly basis with rates ranging from 2% to 8.4% of operating profit determined, in accordance with Peruviangenerally accepted accounting principles.The rate varies depending on the level of operating profit. The IEM only applied to Carachugo in the fourth quarter ofDuring 2012 and 2011, $6,900 and $1,319, wasrespectively, were included inIncome and mining tax expensedue to the IEM based on average of 3.13% and 3.69% of operating profit. In 2012, Maqui Maqui will also be subject to the IEM.profit, respectively.
| c) | Law N° 29790, Special Mining Charge |
The Special Mining Charge (“GEM”) applies to mines covered by a tax stabilization agreement. The GEMis payable on a quarterly basis with rates ranging from 4% to 13.12% of operating profit, determined in accordance with Peruviangenerally accepted accounting principles. The rate varies depending on the level of operating profit margin. The GEM applied to Maqui Maqui,operations at Cerro Yanacocha and La Quinua operations in 2012 and the fourth quarter of 20112011. This resulted in $68,644 and $19,661, was included inrespectively, of additionalIncome and mining tax expensebased on a 2012 average rate of 6.55% of operating profit and a 2011 average rate of 5.95% of operating profit.
MINERA YANACOCHA S.R.L.
NOTES TO THE CONSOLIDATED FINANCIAL STATEMENTS
(dollars in thousands unless otherwise stated)
| d) | Law N°29471, Supplementary Fund |
The Supplementary Fund for retirement of mining applies to metallurgical and steel workers, affiliated to the National Pension System - SNP and the Private Pension System – PPS; and is applicable since May 11, 2012. This Fund is formed by contributions of employees andemployer which are distributed according to the following detail:
| - | Employers will contribute 0.5% of the annual income before taxes. |
| - | Employees will contribute 0.5% of their monthly gross salary. |
| - | The employer’s contributions are paid before tax; therefore these amounts are deductible expenses for the year. |
The new pension fund tax is payable quarterly in accordance with Peruvian generally accepted accounting principles. During 2012 this amounts were included inIncome and mining tax expense.
Peruvian Income Tax and Workers’ Profit Participation
The current income tax and workers’ profit participation expense (Note 13) was determined as follows:
| Years Ended December 31, | ||||||||||||
| 2012 | 2011 | 2010 | ||||||||||
| Income before workers’ profit participation and income tax in accordance with Peruvian GAAP | $ | 1,074,530 | $ | 988,887 | $ | 931,414 | ||||||
| Plus: | ||||||||||||
| Non-deductible expenses | 27,503 | 26,247 | 33,622 | |||||||||
| Reclamation (environmental) reserve liability | 33,910 | 61,732 | 24,944 | |||||||||
| Advanced projects (prior to operations) | 49,904 | 26,502 | - | |||||||||
| Provision for government mining royalties | 12,552 | 9,201 | 1,608 | |||||||||
| Capitalized interest amortization | 4,357 | 5,363 | 4,879 | |||||||||
| Contingencies and commitments’ accruals | 909 | 1,134 | 1,777 | |||||||||
| Intangible asset road amortization | 2,849 | 2,849 | - | |||||||||
| Leasing benefit | 7,534 | 6,552 | (5,796 | ) | ||||||||
| Provision for obsolescence of inventories | 6,901 | 378 | 1,195 | |||||||||
| Conga Non-deductible expenses | 45,413 | - | - | |||||||||
| Other | 10,915 | 4,297 | 16,649 | |||||||||
| 202,747 | 144,255 | 78,878 | ||||||||||
| Less: | ||||||||||||
| Amortization and mineral interests | (148,995 | ) | (86,752 | ) | (11,211 | ) | ||||||
| Tax amortization rate adjustment | (19,332 | ) | (24,040 | ) | (19,872 | ) | ||||||
| Reclamation (environmental) reserve expense | (7,661 | ) | (5,882 | ) | (5,191 | ) | ||||||
| Accounts receivable write-off | - | (1,293 | ) | 112 | ||||||||
| Other mining taxes | (91,935 | ) | (24,134 | ) | - | |||||||
MINERA YANACOCHA S.R.L.
NOTES TO THE CONSOLIDATED FINANCIAL STATEMENTS
(dollars in thousands unless otherwise stated)
| Years Ended December 31, | ||||||||||||
| 2012 | 2011 | 2010 | ||||||||||
| Capitalized interest | - | - | (4,404 | ) | ||||||||
| Other | - | (2,823 | ) | - | ||||||||
| (267,923 | ) | (144,924 | ) | (40,566 | ) | |||||||
| Base to calculate workers’ profit participation | 1,009,353 | 988,218 | 969,726 | |||||||||
| Workers’ profit participation (8%) | (80,748 | ) | (79,057 | ) | (77,578 | ) | ||||||
| Taxable income | $ | 928,605 | $ | 909,161 | $ | 892,148 | ||||||
| Income tax (30%) | $ | 278,581 | $ | 272,748 | $ | 267,645 | ||||||
| Credit for charitable donations | _ | (928 | ) | (930 | ) | |||||||
| Prior year adjustment | _ | (11,023 | ) | – | ||||||||
| Adjustment due to income tax rate applicable to La Quinua | (1,149 | ) | (1,836 | ) | (1,615 | ) | ||||||
| Current income tax | $ | 277,432 | $ | 258,961 | $ | 265,100 | ||||||
MINERA YANACOCHA S.R.L.
NOTES TO THE CONSOLIDATED FINANCIAL STATEMENTS
(dollars in thousands unless otherwise stated)
Peruvian Income Tax and Workers’ Profit Participation
The current income tax and workers’ profit participation expense (Note 14) was determined as follows:
| Years Ended December 31, | ||||||||||||
| 2011 | 2010 | 2009 | ||||||||||
| Income before workers’ profit participation and income tax in accordance with Peruvian GAAP | $ | 988,887 | $ | 931,414 | $ | 1,130,731 | ) | |||||
| Plus: | ||||||||||||
| Non-deductible expenses | 26,247 | 33,622 | 48,492 | ) | ||||||||
| Reclamation (environmental) reserve liability | 61,732 | 24,944 | 25,429 | ) | ||||||||
| Advanced projects (prior to operations) | 26,502 | –– | –– | |||||||||
| Provision for government mining royalties | 9,201 | 1,608 | –– | |||||||||
| Capitalized interest amortization | 5,363 | 4,879 | 4,850 | ) | ||||||||
| Contingencies and commitments’ accruals | 1,134 | 1,777 | 682 | ) | ||||||||
| Intangible asset road amortization | 2,849 | –– | –– | |||||||||
| Leasing benefit | 6,552 | (5,796 | ) | (4,979 | ) | |||||||
| Provision for obsolescence of inventories | 378 | 1,195 | –– | |||||||||
| Other | 4,297 | 16,649 | 6,423 | ) | ||||||||
| (144,255 | ) | 78,878 | 80,897 | ) | ||||||||
| Less: | ||||||||||||
| Amortization and mineral interests | (86,752 | ) | (11,211 | ) | (1,867 | ) | ||||||
| Tax depreciation rate adjustment | (24,040 | ) | (19,872 | ) | (37,410 | ) | ||||||
| Reclamation (environmental) reserve expense | (5,882 | ) | (5,191 | ) | (4,091 | ) | ||||||
| Accounts receivable write-off | (1,293 | ) | 112 | –– | ||||||||
| Other mining taxes | (24,134 | ) | –– | –– | ||||||||
| Intangible asset road construction tax benefit | –– | –– | (23,423 | ) | ||||||||
| Capitalized interest | –– | (4,404 | ) | (4,212 | ) | |||||||
| Other | (2,823 | ) | - | (6,905 | ) | |||||||
| (144,924 | ) | (40,566 | ) | (77,908 | ) | |||||||
| Base to calculate workers’ profit participation | 988,218 | 969,726 | 1,133,720 | ) | ||||||||
| Workers’ profit participation (8%) | (79,057 | ) | (77,578 | ) | (90,698 | ) | ||||||
| Taxable income | $ | 909,161 | $ | 892,148 | $ | 1,043,022 | ) | |||||
| Income tax (30%) | $ | 272,748 | $ | 267,645 | $ | 312,907 | ||||||
| Credit for charitable donations | (928 | ) | (930 | ) | (936 | ) | ||||||
| Prior year adjustment | (11,023 | ) | –– | –– | ||||||||
| Adjustment due to income tax rate applicable to La Quinua | (1,836 | ) | (1,615 | ) | (1,901 | ) | ||||||
| Current income tax | $ | 258,961 | $ | 265,100 | $ | 310,070 | ||||||
MINERA YANACOCHA S.R.L.
NOTES TO THE CONSOLIDATED FINANCIAL STATEMENTS
(dollars in thousands unless otherwise stated)
Income Tax – Reconciliation from Peru Tax Return to Income Tax Expense and Tax Balance Sheets
The Company’s income tax provision consisted of the following:
| Years Ended December 31, | Years Ended December 31, | |||||||||||||||||||||||
| 2011 | 2010 | 2009 | 2012 | 2011 | 2010 | |||||||||||||||||||
| Current Peru tax return | $ | 258,961 | $ | 265,100 | $ | 310,070 | $ | 277,432 | $ | 258,961 | $ | 265,100 | ||||||||||||
| Royalties and new taxes | 20,980 | –– | –– | |||||||||||||||||||||
| Royalties and mining taxes | 79,383 | 20,980 | - | |||||||||||||||||||||
| Other taxes | 3,153 | –– | –– | 1,157 | 3,153 | - | ||||||||||||||||||
| Income tax prior year adjustments | 12,934 | 505 | (642 | ) | (763 | ) | 12,934 | 505 | ||||||||||||||||
| Current | 296,028 | 265,605 | 309,428 | 357,209 | 296,028 | 265,605 | ||||||||||||||||||
| Deferred | (2,854 | ) | 3,932 | 25,413 | 4,648 | (2,854 | ) | 3,932 | ||||||||||||||||
| Other | (136 | ) | 136 | 452 | - | (136 | ) | 136 | ||||||||||||||||
| Income tax expense | $ | 293,038 | $ | 269,673 | $ | 335,293 | $ | 361,857 | $ | 293,038 | $ | 269,673 | ||||||||||||
Income tax expense differs from the amount computed by applying the statutory Peruvian corporate income tax rate of 30% to pre-tax income as a result of the following:
| Years Ended December 31, | ||||||||||||
| 2011 | 2010 | 2009 | ||||||||||
| Income before tax provision | $ | 909,830 | $ | 853,836 | $ | 1,062,369 | ) | |||||
| Peruvian statutory rate | 30 | % | 30 | % | 30 | % | ||||||
| Income tax at statutory rate | 272,949 | 256,151 | 318,711 | |||||||||
| Adjustment due to income tax rate applicable to La Quinua | (1,836 | ) | (1,615 | ) | (1,901 | ) | ||||||
| Negotiated payment | –– | 4,004 | 8,406 | |||||||||
| Donations | 5,134 | 4,399 | 5,270 | |||||||||
| Other mining taxes | 20,980 | –– | –– | |||||||||
| Other | (4,189 | ) | 6,734 | 4,807 | ||||||||
| Total income tax expense | $ | 293,038 | $ | 269,673 | $ | 335,293 | ||||||
| Years Ended December 31, | ||||||||||||
| 2012 | 2011 | 2010 | ||||||||||
| Income before tax provision | $ | 928,605 | $ | 909,830 | $ | 853,836 | ||||||
| Peruvian statutory rate | 30 | % | 30 | % | 30 | % | ||||||
| Income tax at statutory rate | 278,581 | 272,949 | 256,151 | |||||||||
| Adjustment due to income tax rate applicable to La Quinua | (1,149 | ) | (1,836 | ) | (1,615 | ) | ||||||
| Negotiated payment | - | - | 4,004 | |||||||||
| Donations | - | 5,134 | 4,399 | |||||||||
| Other mining taxes | 79,383 | 20,980 | - | |||||||||
| Other | 5,042 | (4,189 | ) | 6,734 | ||||||||
| Total income tax expense | $ | 361,857 | $ | 293,038 | $ | 269,673 | ||||||
Components of deferred income tax assets (liabilities) are as follows:
| At December 31, | ||||||||
| 2012 | 2011 | |||||||
| Deferred income tax assets: | ||||||||
| Reclamation and remediation | $ | 72,584 | $ | 64,709 | ||||
| Accounts payable and accrued expenses | 30,132 | 12,905 | ||||||
| Deferred workers’ profit participation | 5,498 | 5,094 | ||||||
| Other | 9,620 | 4,252 | ||||||
| 117,834 | 86,960 | |||||||
| Deferred income tax liabilities: | ||||||||
| Property, plant and mine development | (161,471 | ) | (117,778 | ) | ||||
| Inventories | (23,796 | ) | (27,463 | ) | ||||
| Other | (2,231 | ) | (1,883 | ) | ||||
| (187,498 | ) | (147,124 | ) | |||||
| Net deferred income tax liabilities | (69,664 | ) | $ | (60,164 | ) | |||
| Current deferred income tax assets | 4,378 | $ | 8,746 | |||||
MINERA YANACOCHA S.R.L.
NOTES TO THE CONSOLIDATED FINANCIAL STATEMENTS
(dollars in thousands unless otherwise stated)
Components of deferred income tax assets (liabilities) are as follows:
| At December 31, | ||||||||
| 2012 | 2011 | |||||||
| Long-term deferred income tax liabilities | (74,042 | ) | (68,910 | ) | ||||
| Net deferred income tax liabilities | (69,664 | ) | $ | (60,164 | ) | |||
| At December 31, | ||||||||
| 2011 | 2010 | |||||||
| Deferred income tax assets: | ||||||||
| Reclamation and remediation | $ | 64,709 | $ | 33,080 | ||||
| Accounts payable and accrued expenses | 12,905 | 4,587 | ||||||
| Deferred workers’ profit participation | 5,094 | 5,445 | ||||||
| Other | 4,251 | 3,501 | ||||||
| 86,959 | 46,613 | |||||||
| Deferred income tax liabilities: | ||||||||
| Property, plant and mine development | (117,778 | ) | (92,035 | ) | ||||
| Inventories | (27,463 | ) | (17,203 | ) | ||||
| Other | (1,883 | ) | (1,041 | ) | ||||
| (147,124 | ) | (110,279 | ) | |||||
| Net deferred income tax liabilities | $ | (60,165 | ) | $ | (63,666 | ) | ||
| Current deferred income tax assets | $ | 8,746 | $ | 8,746 | ||||
| Long-term deferred income tax liabilities | (68,911 | ) | (72,412 | ) | ||||
| Net deferred income tax liabilities | $ | (60,165 | ) | $ | (63,666 | ) | ||
Unrecognized Tax Benefits
At December 31, 20112012 and 2010,2011, the Company had $1,198 and $5,566, respectively, of total gross unrecognized tax benefits that, if recognized, would impact the Company’s effective income tax rate. The Company’s continuing practice is to recognize interest and/or penalties related to unrecognized tax benefits as part of its income tax expense. The Company files income tax returns with Peruvian taxing authorities and is no longer subject to income tax audits by taxing authorities for years before 2007.2008.
6. FAIR VALUE ACCOUNTING
| 6. | FAIR VALUE ACCOUNTING |
Fair value accounting establishes a fair value hierarchy that prioritizes the inputs to valuation techniques used to measure fair value. The hierarchy gives the highest priority to unadjusted quoted prices in active markets for identical assets or liabilities (Level 1 measurements) and the lowest priority to unobservable inputs (Level 3 measurements). The three levels of the fair value hierarchy are described below:
| Level 1 | Unadjusted quoted prices in active markets that are accessible at the measurement date for identical, unrestricted assets or liabilities; |
| Level 2 | Quoted prices in markets that are not active, or inputs that are observable, either directly or indirectly, for substantially the full term of the asset or liability; and |
| Level 3 | Prices or valuation techniques that require inputs that are both significant to the fair value measurement and unobservable (supported by little or no market activity). |
MINERA YANACOCHA S.R.L.
NOTES TO THE CONSOLIDATED FINANCIAL STATEMENTS
(dollars in thousands unless otherwise stated)
The following table sets forth the Company’s assets measured at fair value on a recurring basis (at least annually) by level within the fair value hierarchy. As required by accounting guidance, assets and liabilities are classified in their entirety based on the lowest level of input that is significant to the fair value measurement.
| Fair Value at December 31, 2011 | Fair Value at December 31, 2012 | |||||||||||||||||||||||||||||||
| Total | Level 1 | Level 2 | Level 3 | Total | Level 1 | Level 2 | Level 3 | |||||||||||||||||||||||||
| Assets: | ||||||||||||||||||||||||||||||||
| San José Reservoir Trust assets | $ | 15,502 | $ | 15,502 | $ | –– | $ | –– | $ | 17,115 | $ | 17,115 | $ | – | $ | – | ||||||||||||||||
| Provisional priced products sales | $ | 34 | $ | 34 | $ | – | $ | – | ||||||||||||||||||||||||
MINERA YANACOCHA S.R.L.
NOTES TO THE CONSOLIDATED FINANCIAL STATEMENTS
(dollars in thousands unless otherwise stated)
The Company’s SanJosé Reservoir Trust assets are made up of marketable equity and debt securities that are valued using quoted market prices in active markets and as such are classified within Level 1 of the fair value hierarchy. The fair value of the marketable equity securities is calculated as the quoted market price of the marketable equity security multiplied by the quantity of shares held by the Company.
The Company’s net trade receivable from provisional silver, gold, carbon fines and copper concentrate sales is valued using quoted market prices based on the forward the COMEX Silver Index, the London Bullion Market Association P.M. fix (“London P.M. fix”) (gold), and the London Metal Exchange (“LME”) (copper), and, as such is classified within Level 1 of the fair value hierarchy.
7. ACCOUNTS RECEIVABLE
| 7. | ACCOUNTS RECEIVABLE |
| At December 31, | ||||||||
| 2011 | 2010 | |||||||
| Value added tax | $ | 67,765 | $ | 11,776 | ||||
| Employee receivables | 307 | 366 | ||||||
| Trade accounts receivable | 1 | 5,524 | ||||||
| Income tax receivable | –– | 5,662 | ||||||
| Other | 6,535 | 2,479 | ||||||
| $ | 74,608 | $ | 25,807 | |||||
8. INVENTORIES
| At December 31, | ||||||||
| 2011 | 2010 | |||||||
| Leach in-process | $ | 17,984 | $ | 4,969 | ||||
| Mill in-circuit | 1,092 | 2,863 | ||||||
| Precious metals | 2 | 803 | ||||||
| Materials and supplies | 44,423 | 47,306 | ||||||
| $ | 63,501 | $ | 55,941 | |||||
Leach in-process inventory included 22,456 ounces and 9,711 ounces at December 31, 2011 and 2010, respectively.
MINERA YANACOCHA S.R.L.
NOTES TO THE CONSOLIDATED FINANCIAL STATEMENTS
(dollars in thousands unless otherwise stated)
9. STOCKPILES AND ORE ON LEACH PADS
| At December 31, | ||||||||
| 2011 | 2010 | |||||||
| Current: | ||||||||
| Stockpiles | $ | 36,384 | $ | 12,333 | ||||
| Ore on leach pads | 123,329 | 154,665 | ||||||
| $ | 159,713 | $ | 166,998 | |||||
| Long-term: | ||||||||
| Stockpiles | $ | 71,474 | $ | 56,859 | ||||
| Ore on leach pads | 280,468 | 272,015 | ||||||
| $ | 351,942 | $ | 328,874 | |||||
10. OTHER ASSETS
| At December 31, | ||||||||
| 2011 | 2010 | |||||||
| Other current assets: | ||||||||
| Prepayments to suppliers and contractors | $ | 11,084 | $ | 2,972 | ||||
| Claims for tax refunds | 4,335 | 4,038 | ||||||
| Restricted cash | 943 | 512 | ||||||
| Prepaid expenses and other | 5,281 | 6,513 | ||||||
| $ | 21,643 | $ | 14,035 | |||||
| Other long-term assets: | ||||||||
| Intangible assets | $ | 59,748 | $ | - | ||||
| San José Reservoir Trust assets | 15,502 | 16,412 | ||||||
| Other | 1,404 | 189 | ||||||
| $ | 76,654 | $ | 16,601 | |||||
As of December 31, 2011,Prepayments to suppliers and contractors is related to the purchase of equipment of $8,974, supplies of $1,948 and other services $162.
Intangible assets relate to the completion of an alternative road to the coast.
MINERA YANACOCHA S.R.L.
NOTES TO THE CONSOLIDATED FINANCIAL STATEMENTS
(dollars in thousands unless otherwise stated)
11. PROPERTY, PLANT AND MINE DEVELOPMENT, NET
| At December 31, 2011 | At December 31, 2010 | |||||||||||||||||||||||
| Cost | Accumulated Amortization | Net Book Value | Cost | Accumulated Amortization | Net Book Value | |||||||||||||||||||
| Land | $ | 76,300 | $ | –– | $ | 76,300 | $ | 52,322 | $ | –– | $ | 52,322 | ||||||||||||
| Facilities and equipment | 2,345,712 | (1,655,887 | ) | 689,825 | 2,198,614 | (1,506,706 | ) | 691,908 | ||||||||||||||||
| Mine development | 673,704 | (323,736 | ) | 349,968 | 478,552 | (241,463 | ) | 237,089 | ||||||||||||||||
| Mineral interests | 69,408 | (7,898 | ) | 61,510 | 69,297 | (7,553 | ) | 61,744 | ||||||||||||||||
| Asset retirement cost | 288,597 | (150,420 | ) | 138,177 | 235,866 | (107,822 | ) | 128,044 | ||||||||||||||||
| Construction-in-progress | 915,432 | –– | 915,432 | 266,193 | –– | 266,193 | ||||||||||||||||||
| $ | 4,369,153 | $ | (2,137,941 | ) | $ | 2,231,212 | $ | 3,300,844 | $ | (1,863,544 | ) | $ | 1,437,300 | |||||||||||
| Leased assets included above in facilities and equipment | $ | 74,710 | $ | (51,314 | ) | $ | 23,396 | $ | 74,367 | $ | (45,363 | ) | $ | 29,004 | ||||||||||
Construction-in-progress for 2011 of $915,432 primarily related to project development costs for Conga and leach pad expansion.
Construction-in-progress for 2010 of $266,193 primarily related project development costs for Conga, surface mine development, the construction of an alternative road to the coast and leach pad expansion.
| At December 31, | ||||||||
| 2012 | 2011 | |||||||
| Value added tax | $ | 71,498 | $ | 67,765 | ||||
| Equipment and fuel receivables | 19,973 | - | ||||||
| Trade accounts receivable | 730 | 1 | ||||||
| Employee receivables | 793 | 307 | ||||||
| Other | 7,545 | 6,535 | ||||||
| $ | 100,539 | $ | 74,608 | |||||
| 8. | ||||
| At December 31, 2011 | At December 31, 2010 | |||||||||||||||||||||||
| Gross Carrying Value | Accumulated Amortization | Net Book Value | Gross Carrying Value | Accumulated Amortization | Net Book Value | |||||||||||||||||||
| Mineral Interest | ||||||||||||||||||||||||
| Production stage | $ | 31,928 | $ | (7,724 | ) | $ | 24,204 | $ | 31,817 | $ | (7,379 | ) | $ | 24,438 | ||||||||||
| Development stage | 20,298 | (174 | ) | 20,124 | 20,298 | (174 | ) | 20,124 | ||||||||||||||||
| Exploration stage | 17,182 | – | 17,182 | 17,182 | – | 17,182 | ||||||||||||||||||
| $ | 69,408 | $ | (7,898 | ) | $ | 61,510 | $ | 69,297 | $ | (7,553 | ) | $ | 61,744 | |||||||||||
| At December 31, | ||||||||
| 2012 | 2011 | |||||||
| Leach in-process | $ | 4,624 | $ | 17,984 | ||||
| Mill in-circuit | 13,620 | 1,092 | ||||||
| Precious metals | 7,942 | 2 | ||||||
| Materials and supplies | 61,227 | 44,423 | ||||||
| $ | 87,413 | $ | 63,501 | |||||
| 9. | STOCKPILES AND ORE ON LEACH PADS |
| At December 31, | ||||||||
| 2012 | 2011 | |||||||
| Current: | ||||||||
| Stockpiles | $ | 30,979 | $ | 36,384 | ||||
| Ore on leach pads | 114,567 | 123,329 | ||||||
| $ | 145,546 | $ | 159,713 | |||||
| Long-term: | ||||||||
| Stockpiles | $ | 88,615 | $ | 71,474 | ||||
| Ore on leach pads | 263,471 | 280,468 | ||||||
| $ | 352,086 | $ | 351,942 | |||||
MINERA YANACOCHA S.R.L.
NOTES TO THE CONSOLIDATED FINANCIAL STATEMENTS
(dollars in thousands unless otherwise stated)
| At December 31, | ||||||||
| 2011 | 2010 | |||||||
| Truck leases | $ | –– | $ | 1,959 | ||||
| At December 31, | ||||||||
| 2012 | 2011 | |||||||
| Other current assets: | ||||||||
| Prepayments to suppliers and contractors | 14,510 | $ | 11,084 | |||||
| Claims for tax refunds | 4,335 | 4,335 | ||||||
| Restricted cash | 1,045 | 943 | ||||||
| Prepaid expenses and other | 2,444 | 5,281 | ||||||
| 22,334 | $ | 21,643 | ||||||
| Other long-term assets: | ||||||||
| Intangible assets, net | 54,549 | $ | 59,748 | |||||
| San José Reservoir Trust assets | 17,127 | 15,502 | ||||||
| Other | 2,134 | 1,404 | ||||||
| $ | 73,810 | $ | 76,654 | |||||
As of December 31, 2012,Truck LeasesPrepayments to suppliers and contractors is related to the purchase of equipment of $3,398, supplies of $91 and other services $11,021.
In 2007,Intangible assets relate to an alternative road to the Company entered into a lease for six haul trucks. During 2011 the lease was fully repaid.coast.
| PROPERTY, PLANT AND MINE DEVELOPMENT, NET |
| At December 31, 2012 | At December 31, 2011 | |||||||||||||||||||||||
| Cost | Accumulated Amortization | Net Book Value | Cost | Accumulated Amortization | Net Book Value | |||||||||||||||||||
| Land | $ | 76,397 | $ | - | $ | 76,397 | $ | 76,300 | $ | - | $ | 76,300 | ||||||||||||
| Facilities and equipment | 2,457,548 | (1,810,348 | ) | 647,200 | 2,345,712 | (1,655,887 | ) | 689,825 | ||||||||||||||||
| Mine development | 930,709 | (408,700 | ) | 522,009 | 673,704 | (323,736 | ) | 349,968 | ||||||||||||||||
| Mineral interests | 69,779 | (8,934 | ) | 60,845 | 69,408 | (7,898 | ) | 61,510 | ||||||||||||||||
| Asset retirement cost | 451,647 | (164,240 | ) | 287,407 | 288,597 | (150,420 | ) | 138,177 | ||||||||||||||||
| Construction-in-progress | 1,526,315 | - | 1,526,315 | 915,432 | - | 915,432 | ||||||||||||||||||
| $ | 5,512,395 | $ | (2,392,222 | ) | $ | 3,120,173 | $ | 4,369,153 | $ | (2,137,941 | ) | $ | 2,231,212 | |||||||||||
Construction - in - progress for 2012 of $1,526,315 related primarily to leach pad development, surface development and Conga reservoir engineering and procurement activities.
Construction - in - progress for 2011 of $915,432 primarily related to project development costs for Conga and leach pad expansion.
| Method | Depreciable Life (in years) | |||||
| Facilities and equipment: | Straight line | 8 to 25 | ||||
| Facilities | 8 to 25 | |||||
| Leach pads | 5 | |||||
| Equipment | 2.5 to 10.5 | |||||
MINERA YANACOCHA S.R.L.
NOTES TO THE CONSOLIDATED FINANCIAL STATEMENTS
(dollars in thousands unless otherwise stated)
| Method | Depreciable Life (in years) | |||||
| Other | 5 | |||||
| Mine development | UOP based on ounces mined | 8 to 21 | ||||
| Mineral interests | UOP for producing property | 12 | ||||
| Asset retirement cost | Related asset | 5 to 15 | ||||
| At December 31, 2012 | At December 31, 2011 | |||||||||||||||||||||||
| Gross Carrying Value | Accumulated Amortization | Net Book Value | Gross Carrying Value | Accumulated Amortization | Net Book Value | |||||||||||||||||||
| Mineral Interest | ||||||||||||||||||||||||
| Production stage | $ | 32,299 | $ | (8,760) | $ | 23,539 | $ | 31,928 | $ | (7,724 | ) | $ | 24,204 | |||||||||||
| Development stage | 20,298 | (174 | ) | 20,124 | 20,298 | (174 | ) | 20,124 | ||||||||||||||||
| Exploration stage | 17,182 | - | 17,182 | 17,182 | - | 17,182 | ||||||||||||||||||
| $ | 69,779 | $ | (8,934) | $ | 60,845 | $ | 69,408 | $ | (7,898 | ) | $ | 61,510 | ||||||||||||
| 12. | DUE TO/FROM RELATED PARTIES |
The Company has the following amounts due from and to related parties:
| At December 31, | At December 31, | |||||||||||||||
| 2011 | 2010 | 2012 | 2011 | |||||||||||||
| Due from related parties: | ||||||||||||||||
| Newmont Boddington Gold Pty Ltd | $ | 6,466 | $ | - | ||||||||||||
| Newmont USA Limited | 4,988 | - | ||||||||||||||
| Newmont International Service Limited | 2,592 | - | ||||||||||||||
| Newmont Insurance Limited | $ | 1,000 | $ | 1,000 | 1,000 | 1,000 | ||||||||||
| Suriname Gold | 132 | 583 | 374 | 132 | ||||||||||||
| Newmont Peru S.R.L. | 148 | - | ||||||||||||||
| Newmont Santa Fe Pacific Chile | 92 | 31 | 26 | 92 | ||||||||||||
| Newmont Peru S.R.L. | –– | 174 | ||||||||||||||
| Newmont USA Limited | –– | 16 | ||||||||||||||
| Newmont (Other) | 1,611 | - | ||||||||||||||
| $ | 1,224 | $ | 1,804 | $ | 17,205 | $ | 1,224 | |||||||||
| At December 31, | At December 31, | |||||||||||||||
| 2011 | 2010 | 2012 | 2011 | |||||||||||||
| Due to related parties: | ||||||||||||||||
| Newmont USA Limited | $ | 17,161 | $ | 6,392 | ||||||||||||
| S.M.R.L. Chaupiloma Dos de Cajamarca | $ | 17,368 | $ | 14,414 | 12,557 | 17,368 | ||||||||||
| Newmont Technologies Limited | 6,687 | 2,199 | ||||||||||||||
| Newmont International Service Limited | 5,865 | - | ||||||||||||||
| Newmont Peru S.R.L. | 8,393 | 11,621 | 5,193 | 8,393 | ||||||||||||
| Newmont USA Limited | 6,392 | 5,871 | ||||||||||||||
| Newmont Technologies Limited | 2,199 | 5,162 | ||||||||||||||
| Newmont Santa Fe Pacific Chile | 964 | 1,015 | 315 | 964 | ||||||||||||
| Newmont (Other) | 1,621 | - | ||||||||||||||
| $ | 35,316 | $ | 38,083 | $ | 49, 399 | $ | 35,316 | |||||||||
MINERA YANACOCHA S.R.L.
NOTES TO THE CONSOLIDATED FINANCIAL STATEMENTS
(dollars in thousands unless otherwise stated)
Management, exploration, mine development, engineering and employment services are providedreceived pursuant to contracts with affiliates. The corresponding charges totaled $88,476 and $66,506 in 2012 and $65,115 in 2011, and 2010, respectively.
As described in Note 1, the Company pays to Chaupiloma a 3% royalty based on quarterly production sold at current market prices, after deducting refinery and transportation costs. Royalty expense totaled $66,586, $60,816 and $55,765 in 2012, 2011 and $62,317 in 2011, 2010, and 2009, respectively and is included inCosts applicable to sales.
| WORKERS’ PROFIT PARTICIPATION |
In accordance with Peruvian legislation, the Company maintains an employee profit sharing plan equal to 8% of annual taxable income. Distributions to employees under the plan are based 50% on the number of days that each employee worked during the preceding year and 50% on proportionate annual salary levels.
MINERA YANACOCHA S.R.L.
NOTES TO THE CONSOLIDATED FINANCIAL STATEMENTS
(dollars in thousands unless otherwise stated)
In 2012, 2011 2010 and 2009,2010, the current expense portion of workers’ profit participation amounted to $80,748, $79,057 $77,578 and $90,698,$77,578, respectively, which was included inCosts applicable to sales. For each of the years 2011 and 2010, the excess over the amount to be paid to the employees was $136 and was classified asIncome tax expense.
Peruvian law limits payments of annual profit sharing per employee to eighteen months salary but continues to base total profit sharing on 8% of taxable income, notwithstanding the per employee limitation. Supreme Decree N°009-98-TR, published on August 6, 1998, provides that the excess of total profit sharing for the year over aggregate profit sharing payable to all employees be paid to the Fondo Nacional de Capacitación Laboral y de Promoción del Empleo (“FONDOEMPLEO”).Law 28464 published in January 2005, which modified art. 3art.3 of Law Decree 892, provides that the excess of total profit sharing for the year over aggregate profit sharing payable to all employees be applied to training of employees and construction of public facilities. Supreme Decree N° 002-2005-TR, published in May 6, 2005, establishes a limit of 2,200 UIT (inflation measurement unit, of S/.3,650 new Peruvian sol per unit at December 31, 2011)2012) in the contributions to FONDOEMPLEO indicating that the difference goes to the Regional Government.
| OTHER CURRENT LIABILITIES |
| At December 31, | At December 31, | |||||||||||||||
| 2011 | 2010 | 2012 | 2011 | |||||||||||||
| Accrued capital expenditures | $ | 111,438 | $ | 24,400 | $ | 56,296 | $ | 111,438 | ||||||||
| Contractors fund retention guarantee | 23,980 | 9,005 | 32,524 | 23,980 | ||||||||||||
| Accrued operating costs | 17,051 | 16,823 | 18,686 | 17,051 | ||||||||||||
| Reclamation and remediation | 10,598 | 7,575 | 21,411 | 10,598 | ||||||||||||
| Payroll and other benefits | 10,425 | 8,457 | 9,053 | 10,425 | ||||||||||||
| Taxes other than income and mining | 8,025 | 5,655 | 2,194 | 8,025 | ||||||||||||
| Income tax withholding | 5,832 | 5,731 | 3,222 | 5,832 | ||||||||||||
| Deferred revenues | 4,270 | 3,627 | 660 | 4,270 | ||||||||||||
| Interest | 96 | 96 | ||||||||||||||
| Negotiated payment | –– | 13,346 | ||||||||||||||
| Other | 1,027 | 1,349 | 1,032 | 1,123 | ||||||||||||
| $ | 192,742 | $ | 96,064 | $ | 145,078 | $ | 192,742 | |||||||||
MINERA YANACOCHA S.R.L.
NOTES TO THE CONSOLIDATED FINANCIAL STATEMENTS
(dollars in thousands unless otherwise stated)
Accrued capital projects are mainly related to Conga, Western Oxides, Carachugo Water Treatment and other minor projects.
| RECLAMATION AND REMEDIATION |
The Company’s mining and exploration activities are subject to various laws and regulations governing the protection of the environment. These laws and regulations are continually changing and are generally becoming more restrictive. The Company conducts its operations so as to protect the public health and environment and believes its operations are in compliance with all applicable laws and regulations in all material respects. The Company has made, and expects to make in the future, expenditures to comply with such laws and regulations, but cannot predict the amount of such future expenditures. Estimated future reclamation costs are based principally on legal and regulatory requirements.
MINERA YANACOCHA S.R.L.
NOTES TO THE CONSOLIDATED FINANCIAL STATEMENTS
(dollars in thousands unless otherwise stated)
The liability corresponds primarily to activities to be performed in the reclamation and remediation of mining activities once the gold extraction process has been finished. These activities include reclamation of the mine sites, operating water treatment plants, revegetation and earthworks.
The following is a reconciliation of reclamation and remediation liabilities:
| Balance January 1, 2010 | $ | 191,435 | ||
| Additions, change in estimates and other | 87,182 | |||
| Liabilities settled | (5,191 | ) | ||
| Accretion expense | 14,464 | |||
| Balance December 31, 2010 | $ | 287,890 | ||
| Additions, change in estimates and other | 52,732 | |||
| Liabilities settled | (5,882 | ) | ||
| Accretion expense | 19,135 | |||
| Balance December 31, 2011 | $ | 353,875 |
| Years Ended December 31, | ||||||||||||
| 2012 | 2011 | 2010 | ||||||||||
| Balance at beginning of year | $ | 353,875 | $ | 287,890 | $ | 191,435 | ||||||
| Addtions change in estimates and other settled | 163,050 | 52,732 | 87,182 | |||||||||
| Liabilities settled | (7,661 | ) | (5,882 | ) | (5,191 | ) | ||||||
| Accretion expense | 20,090 | 19,135 | 14,464 | |||||||||
| Balance at end of year | $ | 529,354 | $ | 353,875 | $ | 287,890 | ||||||
The current portion ofReclamation and remediationof $10,598$21,411 and $7,575$10,598 at December 31, 20112012 and 2010,2011, respectively, are included inOther current liabilities.
The increase in the asset retirement obligation in 20112012 relates to the net effect of the increase in the projectadditional remediation and reclamation requirements caused by the impact of mining activities during 2012, additional costs for La Quinua, Cerro Yanacochawaste rock reclamation and Cerro Negro;new Peruvian regulatory requirements that extended the inclusion of activities related to Conga for $8,350;water treatment and the decreasemonitoring requirements more than 20 years.
MINERA YANACOCHA S.R.L.
NOTES TO THE CONSOLIDATED FINANCIAL STATEMENTS
(dollars in unit costs related to Maqui Maqui and Carachugo areas.thousands unless otherwise stated)
| PARTNERS’ EQUITY |
Partners’ Contributions
Partners’ contributionsrepresent 1,278,451,304 common partnership interests with a par value of one Peruvian Nuevo sol each, fully subscribed and paid. Such partnership interest includes 720,407,310 that are owned by foreign investors.
Under current Peruvian regulations, there is no restriction on remittance of dividends or repatriation of foreign investment, except as discussed in sections below.
The legal structure of the Company is that of a Limited Liability Partnership. The main characteristics of such structure are: (i) the number of Partners cannot exceed 20, (ii) the capital is represented by partnership interests, and (iii) there is no obligation to create a legal reserve.
Retained Earnings
Effective January 1, 2003, distribution of earnings for Partners other than legal entities domiciled in Peru is subject to a withholding tax of 4.1%.
MINERA YANACOCHA S.R.L.
NOTES TO THE CONSOLIDATED FINANCIAL STATEMENTS
(dollars in thousands unless otherwise stated)
Accumulated Other Comprehensive Income
| At December 31, | ||||||||
| 2011 | 2010 | |||||||
| Unrealized gain on marketable securities, net of $376 and $1,178 tax expense, respectively | $ | 877 | $ | 2,388 | ||||
| $ | 877 | $ | 2,388 | |||||
| At December 31, | ||||||||
| 2012 | 2011 | |||||||
| Unrealized gain on marketable securities, net of taxes | $ | 2,006 | $ | 877 | ||||
| $ | 2,006 | $ | 877 | |||||
| SUPPLEMENTAL CASH FLOW INFORMATION |
Net cash provided from operations includes the following cash payments:
| Years Ended December 31, | Years Ended December 31, | |||||||||||||||||||||||
| 2011 | 2010 | 2009 | 2012 | 2011 | 2010 | |||||||||||||||||||
| Income and mining taxes paid | $ | 276,740 | $ | 332,954 | $ | 265,529 | $ | 392,741 | $ | 276,740 | $ | 332,954 | ||||||||||||
| Interest paid, net of amounts capitalized | $ | 24 | $ | 1,737 | $ | 8,925 | $ | - | $ | 24 | $ | 1,737 | ||||||||||||
| MAJOR CUSTOMERS AND EXPORT SALES |
The Company is not economically dependent on a limited number of customers for the sale of its product because gold can be sold through various commodity market traders worldwide. In 2012, sales to one customer accounted for $1,580 which represented 72% of total annual sales. In 2011, sales to one customer accounted for $1,419,109 which represented 71% of total annual sales. In 2010, sales to one customer accounted for $1,326,000 which represented 75% of total annual sales. In 2009, sales to one customer accounted for $1,489,000 which represented 74% of total annual sales. All gold sales were made outside of Peru.
MINERA YANACOCHA S.R.L.
NOTES TO THE CONSOLIDATED FINANCIAL STATEMENTS
(dollars in thousands unless otherwise stated)
| COMMITMENTS AND CONTINGENCIES |
Income and Mining Tax Contingencies
Income and mining tax contingencies are provided for under ASC guidance (see Notes 2 and 5).
Unitization of Properties
In December 2000, as a result of the unitization plan carried out by the Partners, the Company signed several asset transfer and mining lease agreements with related entities. The main conditions are:
| · | The Company must pay to Chaupiloma, 3% of the quarterly net sales, according to the lease agreement. The mining rights subject to this 3% royalty are those identified in the lease agreement as part of the “Area of Influence of Chaupiloma”. Some of these mining rights are in exploitation and the rest of them in exploration. |
| · | The Company must pay to S.M.R.L. Coshuro (“Coshuro”) and Buenaventura, 3% of the quarterly net sales, according to the transfer agreement. The mining rights subject to this 3% royalty are those identified in the transfer agreement, and are located out of the “Area of Influence of Chaupiloma” and within the “Area of Influence of the Joint Venture”. These mining rights are currently under exploration. |
MINERA YANACOCHA S.R.L.
NOTES TO THE CONSOLIDATED FINANCIAL STATEMENTS
(dollars in thousands unless otherwise stated)
| · | The Company must pay to Los Tapados S.A., 3% of the quarterly net sales proceeds of mineral extracted from the transferred and leased concessions of Los Tapados S.A. The transferred and leased concessions of Los Tapados S.A. are also subject to a previously existing royalty on the minerals. These mining rights are currently under exploration. |
Legal Proceedings
Choropampa (mercury spill)
In June 2000, a transport contractor of Yanacocha spilled approximately 151 kilograms of elemental mercury near the town of Choropampa, Peru, which is located 53 miles (85 kilometers) southwest of the Yanacocha mine. Elemental mercury is not used in Yanacocha’s operations but is a by-product of gold mining and was sold to a Lima firm for use in medical instruments and industrial applications. A comprehensive health and environmental remediation program was undertaken by Yanacocha in response to the incident. In August 2000, Yanacocha paid under protest a fine of 1,740,000 Peruvian soles (approximately $0.5) to the Peruvian government. Yanacocha has entered into settlement agreements with a number of individuals impacted by the incident. As compensation for the disruption and inconvenience caused by the incident, Yanacocha entered into agreements with and provided a variety of public works in the three communities impacted by this incident. Yanacocha cannot predict the likelihood of additional expenditures related to this matter.
MINERA YANACOCHA S.R.L.
NOTES TO THE CONSOLIDATED FINANCIAL STATEMENTS
(dollars in thousands unless otherwise stated)
Additional lawsuits relating to the Choropampa incident were filed against Yanacocha in the local courts of Cajamarca, Peru, in May 2002 by over 900 Peruvian citizens. A significant number of the plaintiffs in these lawsuits entered into settlement agreements with Yanacocha prior to filing such claims. In April 2008, the Peruvian Supreme Court upheld the validity of these settlement agreements, which the Company expects to result in the dismissal of all claims brought by previously settled plaintiffs. Yanacocha has also entered into settlement agreements with approximately 350 additional plaintiffs. The claims asserted by approximately 200 plaintiffs remain. In 2011, Yanacocha was served with 22 complaints alleging grounds to nullify the settlements entered between Yanacocha and the plaintiffs. Yanacocha has answered the complaints and will continue to vigorously defend its position. Neither the Company nor Yanacocha can reasonably estimate the ultimate loss relating to such claims.
Since December 2010 to date, 23 new claims involving 29 plaintiffs were received by Yanacocha. In this claim, plaintiffs are requesting the Judge to (i) declare void the compensation agreement signed with Yanacocha and to (ii) award them with new compensation amounts. 2 of these new claims involving 2 plaintiffs were dismissed as they did not comply with formal requirements.
In 19 of these cases, the initial presiding judge admitted a motion to dismiss based on prescription of the actions and dismissing the processes. Plaintiffs appealed this decision, and Superior Court confirmed it in 18 cases. In 8 of these cases, plaintiffs have challenged this decision in front of the Supreme Court, but to date one of them has already been dismissed.
In one of the claims, a different presiding judge accepted the Company’s motion to dismiss the claim regarding a new award but it has rejected it regarding the compensation agreement, this decision was confirmed by Superior Court, so this claim continues in first instance.
Both request (i) and (ii) were prescribed according to the terms in Peruvian legislation, so those claims should be dismissed.
MINERA YANACOCHA S.R.L.
NOTES TO THE CONSOLIDATED FINANCIAL STATEMENTS
(dollars in thousands unless otherwise stated)
Baños del Inca
In September 2006, the Municipality of Baños del Inca issued a declaration designating an area that includes the Carachugo Expansion and San José Projects as reserved and protected areas. Based on previous experience and actions taken by the Constitutional Tribunal (Peru Court of lastLast instance for Constitutional issues) in respect of Cerro Quilish in which it was ruled that such declaration did not affect the Company’s mining rights, the Company believes that Baños del Inca’s declaration, should not impact the Company’s legal rights to exploit these concessions.
MINERA YANACOCHA S.R.L.
NOTES TO THE CONSOLIDATED FINANCIAL STATEMENTS
(dollars in thousands unless otherwise stated)
In March 2008, the company filed an Action for Constitutional Relief (Amparo) against the Municipality of Baños del Inca seeking that the referred ordinance be declared inapplicable. The Court of first instance of Lima rejected the claim lodged by the Municipality of Baños del Inca regarding the jurisdiction of such court to hear this case. On March 14, 2011 the Court of first instance of Lima served the ruling it had issued declaring the complaint inadmissible. The judgment was appealed by Yanacocha. By a resolution served on August 15, 2011, the first Civil Courtroom of the Superior Court of Lima declared void the judgment of first instance, ordering the Judge to issue a new ruling. On September 07, 2012 Yanacocha request to the Civil Courtroom decides to issue a judgment due to its constitutional rights is seriously threat by the Municipality of Baños del Inca. The action is pending new judgment to be issued by the Court of first instance.instance with no judgment as of date.
San Pablo
In February 2007 the Municipality of San Pablo issued an Ordinance declaring Las Lagunas and Pozo Seco, where the company holds concession rights, as reserved and protected areas. According to past experience and actions taken by the Constitutional Court with regard to Cerro Quilish, where it was ruled that such declaration did not affect the company'scompany’s mining rights, the Company believes that init this case, the declaration issued by the Municipality of San Pablo should not impact the legal rights it has to exploit these concessions. The company filed an Action for Constitutional Relief (Amparo) challenging the Ordinance on the grounds that, under Peruvian law, local governments are not empowered to create such areas, denying the rights granted by the Peruvian mining concessions. The Court of first instance rejected the complaint on grounds of form. Thus, the corresponding appeal was lodged.
On November 19, 2008 the second Civil Courtroom of the Superior Court of Lima confirmed the first instance ruling rejecting the action for relief, which led to the filing of an extraordinary appeal with the Constitutional Court.
By a ruling dated December 10, 2010 the Constitutional Court revoked the resolution issued by the second Civil Courtroom of the Superior Court of Lima and ordered that the complaint be admitted for processing.
By resolution served on March 25, 2011, the Court of First Instance admitted the complaint for processing and that it beis served to the Provincial Municipality of San Pablo. The Municipality of San Pablo answered the complaint asserting the expiration of the statute of limitations of the action for relief. Yanacocha has requested the rejection of the expiration of the statute of limitations asserted on the grounds that the complaint for constitutional relief was timely filed.
MINERA YANACOCHA S.R.L.
NOTES TO THE CONSOLIDATED FINANCIAL STATEMENTS
(dollars in thousands unless otherwise stated)
On October 31, 2012 the defendant formulates allegation and presents new evidentiary. By resolution served on December 10, 2012, the Courts resolve to confirm the Resolution N°26 which declares unfunded the exception of prescription of the case. The Court ruling on the statute of limitations is pending.
Conga Project
Regional Ordinance No. 036-2011-GR.CAJ-CR dated December 5, 2011 issued by the Regional Government of Cajamarca (hereinafter the Regional Ordinance) was published in the Official Gazette "El Peruano"“El Peruano” on December 28, 2011.
MINERA YANACOCHA S.R.L.
NOTES TO THE CONSOLIDATED FINANCIAL STATEMENTS
(dollars in thousands unless otherwise stated)
The Regional Ordinance, among other things, declares the unworkability of the implementation of the Conga Project in the headwaters of the basin where the following lakes are found: el Perol District(District of Sorochuco;Sorochuco); Azul and Cortada District(District of Huasmín;n); Mamacocha District(District of BambamarcaBambamarca) and all those located in the area of influence of the Conga Project on the grounds of the existence of technical - legal inconsistencies in the Environmental Impact Assessment approved by DirectoralDirectorial Resolution No. 351-2010-MEM/No.351 - 2010 - MEM/AAM, dated October 27, 2010, and also on the grounds that it contravenes constitutional norms and international treaties. Furthermore, it declares the invalidity of any legal rule that contravenes the referred Regional Ordinance.
There is Constitutional Court jurisprudence establishing that large scale mining projects fall under the exclusive jurisdiction of the Executive Power, not of the Regional Governments or Municipalities.
The Attorney General filedfilled an unconstitutionality action with the Constitutional Court seeking that this regional ordinance be declared unconstitutional and void. The complaint has already been admitted for processing by the Constitutional Court. Yanacocha intends to appear in this
On April 17, 2012, Constitutional Court granted the action withbrought by Attorney General and declared unconstitutional the argument that, while the Constitution does not authorize it to lodge this type of complaint, it is entitled to interveneRegional Ordinance. This final ruling was published in the proceedings due to the fact that it is the party directly affected by the regional ordinance as owner of the Conga Project.Official Gazette “El Peruano” on April 27, 2012.
At the same time, Yanacocha initiated an action for constitutional relief to declare the inapplicability of Regional Ordinance No. 036-2011-GR.CAJ-CR. This complaint has been forwarded (byAs the General Filing Deskruling by Constitutional Court declared unconstitutional the Regional Ordinance, this action is no longer needed.
MINERA YANACOCHA S.R.L.
NOTES TO THE CONSOLIDATED FINANCIAL STATEMENTS
(dollars in thousands unless otherwise stated)
Action for Constitutional Relief against Conga Project Exploitation
On October 19, 2012, Marco Antonio Arana Zegarra initiated an action for constitutional relief against the Mines and Energy Ministry and Yanacocha requesting that Court orders to cease any threats of violation to live in an adequate and balanced environment; so that Court declare the suspension of the Alzamora Building) to the First Constitutional Courtexploitation of Lima, presided by David Suarez Burgos, Esq. Since he isConga Project and avoid Directorial Resolution No. 351-2010-MEM/AM dated on vacation leave, this court is in charge of Roxana Rea Lao, Esq.October 27, 2010 that approved Conga Environmental Impact Assessment.
By Court resolution No. 1 dated on October 23, 2012 the action was dismissed. On November 5, 2012, resolution No. 1 was appealed by plaintiff and the hearing at Superior Court will be held on March 4, 2013 at 12:15 p.m.
Clínica Internacional, Addeco,International, Adecco, SGC Security
Employees belonging to three contractors (Clínica Internacional,(Clinica International, Adecco, SCG Seguridad) have filed legal actions claiming to be included in Minera Yanacocha'sYanacocha’s payroll. These workers claim that for all practical effects they are employees of the Company and therefore are entitled to all the rights attached thereto, arguing that they receive direct orders from Yanacocha and that most of the infrastructure and equipment used in the performance of their duties is also provided by the Company. All of these proceedings involve a total of 97 workers. However, sinceThe cases are detail as follow:
Regarding to Adecco employees, the complaint included 77 plaintiffs. This complaint was declared groundless in the first instance and confirmed by the Civil Courtroom. Thus, the plaintiffs filed an appeal for reversal. As of February 2013, the records were forwarded to the Standing Constitutional and Social Courtroom of the Supreme Court of Justice of the Republic, but complaint was not accepted. Also during this time some workers abandonedof the proceedings alongplaintiffs desisted from the way, currently only 85 workers are involved. Forclaim, so to date this complaint is finished, as no plaintiffs is remaining in the process.
Regarding to Clinica Internacional workers there are three (03) case files:International employees, the complaint included 14 plaintiffs. In cases: 254-2008 2008-253 and 255-2008. The first two253-2008 are pending the issuance of judgment in the first instance, since the Civil Courtroom declared the previous judgment null, on the grounds that the judge made a mistake by having unduly matched the terms material resources and own equipment, since the former is one of the requirements for the valid existence of outsourcing, and the latter is a contributory element, as provided in Article 4 of Supreme Decree No. 003-2002-TR, amended by Supreme Decree No. 020-2007-TR. Case File No. 255 - 2008 also is pending judgment in the first instance.
In the case of SGC Security workers, the complaint included 6 plaintiffs. The issuance of judgment in the first instance is pending, since the previous judgment was declared null by the Civil Courtroom.
MINERA YANACOCHA S.R.L.
NOTES TO THE CONSOLIDATED FINANCIAL STATEMENTS
(dollars in thousands unless otherwise stated)
In the caseLetters of ADECCO employees, the complaint was declared groundless in the first instance and confirmed by the Civil Courtroom. Thus, the plaintiff has filed an appeal for reversal. On February first of this year the records were forwarded to the Standing Constitutional and Social Courtroom of the Supreme Court of Justice of the Republic.Guarantee
InOn January 17, 2010, the caseCompany signed a Letter of SGC Security workers,Guarantee of US$85 million with Banco de Credito del Peru (BCP) in accordance with the issuanceMine Closure Regulation approved by Supreme Decree No.033-2005 of judgment inThe Ministry of Energy and Mines. This letter of guarantee has a renewal for one more year since January 18, 2012. For the first instance is pending, sinceperiod 2013 the previous judgment was declared null by the Civil Courtroom. (Still pending is the presentationletter has an amount of allegationsUS$105.9 million and oral report.)shall have an effective term of one additional year extended to January 18th, 2014.
InOn January 13, 2012, the opinionCompany signed an additional letter of Legal Management there is diversityguarantee for US$45 million with BBVA Continental which have extended to January 18th, 2013 in accordance with the Mine Closure Regulations. This letter of criteria on this matter so it is not feasibleguarantee has a renewal for US$71.7 million for the period 2013 and shall have an effective term of one additional year extended to issueJanuary 18th, 2014.
On January 18, 2013, the Company signed an opinion onadditional letter of guarantee for US$30 million with Interbank which have extended to January 18th, 2014, in accordance with the outcome of the process.Mine Closure Regulations.
These three letters of guarantee shall come into force if the Company fails to execute in whole or in part the Mine Closure Plan.
Dictamen de los auditores independientes (continuación)
Sociedad Minera Cerro Verde S.A.A.
Financial Statements as of December 31, 2012, 2011 and 2010 and as of January 1, 2010, together with the Report of Independent Registered Public Accounting Firm
Contents
| Report of Independent Registered Public Accounting Firm | |
| Statement of Financial Position | |
| Statements of Comprehensive Income | |
| Statements of Changes in Equity | F-148 |
| Statements of Cash Flows | |
| Notes to the Financial Statements |
Report of Independent Registered Public Accounting Firm
| ERNST & YOUNG | Medina, Zaldivar, Paredes |
| & Asociados Sociedad Civil |
To the Board of Directors and Shareholders of Sociedad Minera Cerro Verde S.A.A.
We have audited the accompanying financial statements of Sociedad Minera Cerro Verde S.A.A. (a Peruvian company, subsidiary of Freeport-McMoRan Copper & Gold Inc.), which comprise the statement of financial position as of December 31, 20112012 and 2010, and as of January 1, 2010,2011, and the related statements of comprehensive income, statements of changes in equity and statements of cash flows for each of the three years ended December 31, 2012, 2011 and 2010. These financial statements are the responsibility of the Company’sCompany's management. Our responsibility is to express an opinion on these financial statements based on our audits.
We conducted our audits in accordance with the auditing standards of the Public Company Accounting Oversight Board (United States). Those standards require that we plan and perform the audit to obtain reasonable assurance about whether the financial statements are free of material misstatement. We were not engaged to perform an audit of the Company’s internal control over financial reporting. Our audits included consideration of internal control over financial reporting as a basis of designing audit procedures that are appropriate in the circumstances, but not for the purpose of expressing an opinion on the effectiveness of the Company’s internal control over financial reporting. Accordingly, we express no such opinion. An audit also includes examining, on a test basis, evidence supporting the amounts and disclosures in the financial statements. An audit also includes assessing the accounting principles used and significant estimates made by management, as well as evaluating the overall financial statement presentation. We believe that our audits provide a reasonable basis for our opinion.
In our opinion, the financial statements referred to above present fairly, in all material respects, the financial position of Sociedad Minera Cerro Verde S.A.A.S.A.A. as of December 31, 20112012 and 2010, and as of January 1, 2010,2011, and the results of its operations and its cash flows for each of the three years ended December 31, 2012, 2011 and 2010, in conformity with International Financial Reporting Standards (IFRS) as issued by the International Accounting Standards Board (“IASB”).
Lima, Peru,
April 30, 20122013
/s/ Medina, Zaldivar, Paredes & Asociados
Countersigned by:
/s/ Marco Antonio Zaldívar__
Marco Antonio Zaldívar
C.P.C.C. Register No.12477
Sociedad Minera Cerro Verde S.A.A.
Statement of Financial Position
As of December 31, 20112012 and 2010, as of January 1, 20102011
| Note | December 31, 2011 | December 31, 2010 | January 1, 2010 | |||||||||||
| US$(000) | US$(000) | US$(000) | ||||||||||||
| Assets | ||||||||||||||
| Current assets | ||||||||||||||
| Cash and cash equivalents | 4 | 1,383,636 | 388,113 | 203,391 | ||||||||||
| Trade accounts receivable | 5 | 44,053 | 27,593 | 24,792 | ||||||||||
| Trade accounts receivable from affiliates | 18(f) | 199,331 | 290,709 | 216,562 | ||||||||||
| Embedded derivative | 20 | - | 133,217 | 64,760 | ||||||||||
| Value added tax credit | 7,285 | 7,219 | 4,228 | |||||||||||
| Other accounts receivable | 11,569 | 14,974 | 6,335 | |||||||||||
| Inventories, net | 6 | 175,837 | 170,225 | 156,319 | ||||||||||
| Prepaid expenses | 7,105 | 6,056 | 4,178 | |||||||||||
| Total current assets | 1,828,816 | 1,038,106 | 680,565 | |||||||||||
| Other long-term assets | 17(b) | - | 19,002 | 49,535 | ||||||||||
| Long-term inventories | 6 | 140,671 | 120,176 | 91,235 | ||||||||||
| Property, plant and equipment, net | 7 | 1,220,591 | 1,108,645 | 1,072,636 | ||||||||||
| Intangible assets, net | 17(c) | 6,519 | 8,149 | 9,779 | ||||||||||
| Total assets | 3,196,597 | 2,294,078 | 1,903,750 | |||||||||||
| Liabilities and equity, net | ||||||||||||||
| Current liabilities | ||||||||||||||
| Trade accounts payable | 8 | 55,950 | 67,376 | 39,798 | ||||||||||
| Trade accounts payable to affiliates | 18(f) | 3,415 | 3,851 | 2,719 | ||||||||||
| Embedded derivative | 20 | 75,257 | - | - | ||||||||||
| Income tax payable | 56,920 | 174,275 | 83,792 | |||||||||||
| Workers’ profit sharing payable | 9(a) | 119,711 | 110,065 | 48,254 | ||||||||||
| Other accounts payable | 9(a) | 24,675 | 133,057 | 76,516 | ||||||||||
| Total current liabilities | 335,928 | 488,624 | 251,079 | |||||||||||
| Non-current portion of other accounts payable | 9(a) | 1,298 | 2,204 | 39,310 | ||||||||||
| Provision for remediation and mine closure | 17(a) | 7,061 | 3,487 | 3,667 | ||||||||||
| Deferred income tax | 10(a) | 174,672 | 200,524 | 134,848 | ||||||||||
| Total liabilities | 518,959 | 694,839 | 428,904 | |||||||||||
| Equity, net | 11 | |||||||||||||
| Capital stock | 990,659 | 990,659 | 990,659 | |||||||||||
| Legal reserve | 198,132 | 198,132 | 198,132 | |||||||||||
| Retained earnings | 1,488,847 | 410,448 | 286,055 | |||||||||||
| Total equity, net | 2,677,638 | 1,599,239 | 1,474,846 | |||||||||||
| Total liabilities and equity, net | 3,196,597 | 2,294,078 | 1,903,750 | |||||||||||
Sociedad Minera Cerro Verde S.A.A.
Statements of Comprehensive Income
For the years ended December 31, 2011 and 2010
| Note | 2011 | 2010 | ||||||||
| US$(000) | US$(000) | |||||||||
| Sales of goods | 13 | 2,520,050 | 2,368,988 | |||||||
| Cost of sales of goods | 14 | (824,700 | ) | (645,959 | ) | |||||
| Gross profit | 1,695,350 | 1,723,029 | ||||||||
| Operating expenses | ||||||||||
| Selling expenses | 15 | (83,612 | ) | (76,638 | ) | |||||
| Excess of workers’ profit sharing | 9(c) | (21,923 | ) | (34,427 | ) | |||||
| Provision for water plant | 17(b) | (13,670 | ) | (4,300 | ) | |||||
| Voluntary contribution | 17(d) | - | (41,081 | ) | ||||||
| Other operating expenses | (16,865 | ) | (10,749 | ) | ||||||
| (136,070 | ) | (167,195 | ) | |||||||
| Operating profit | 1,559,280 | 1,555,834 | ||||||||
| Other income (expenses) | ||||||||||
| Financial income | 16 | 1,078 | 1,261 | |||||||
| Financial expenses | 16 | (165 | ) | (101 | ) | |||||
| Gain net from exchange differences | 1,924 | 669 | ||||||||
| Profit before income tax | 1,562,117 | 1,557,663 | ||||||||
| Income tax | 10(b, c) | (483,718 | ) | (483,270 | ) | |||||
| Profit for the year | 1,078,399 | 1,074,393 | ||||||||
| Basic and diluted earnings per share (stated in US dollars) | 19 | 3.08 | 3.07 | |||||||
| Weighted average number of shares outstanding | 19 | 350,056,012 | 350,056,012 | |||||||
| Note | 2012 | 2011 | ||||||||
| US$(000) | US$(000) | |||||||||
| Assets | ||||||||||
| Current assets | ||||||||||
| Cash and cash equivalents | 3 | 1,427,528 | 1,383,636 | |||||||
| Trade accounts receivable | 4 | 4,054 | 44,053 | |||||||
| Trade accounts receivable from related parties | 17(f) | 318,562 | 199,331 | |||||||
| Embedded derivative | 19 | 11,569 | - | |||||||
| Other accounts receivable | 28,408 | 25,959 | ||||||||
| Inventories, net | 6 | 194,909 | 175,837 | |||||||
| Total current assets | 1,985,030 | 1,828,816 | ||||||||
| Other long – term accounts receivable | 5 | 63,964 | - | |||||||
| Long-term inventories | 6 | 188,990 | 140,671 | |||||||
| Property, plant and equipment, net | 7 | 1,799,709 | 1,220,591 | |||||||
| Intangible assets, net | 16(d) | 5,078 | 6,519 | |||||||
| Total assets | 4,042,771 | 3,196,597 | ||||||||
| Liabilities and equity, net | ||||||||||
| Current liabilities | ||||||||||
| Trade accounts payable | 8 | 146,354 | 55,950 | |||||||
| Trade accounts payable to related parties | 17(f) | 8,081 | 3,415 | |||||||
| Embedded derivative | 19 | - | 75,257 | |||||||
| Income tax liability | 21,187 | 56,920 | ||||||||
| Workers’ profit sharing payable | 9 | 75,991 | 119,711 | |||||||
| Other accounts payable | 20,855 | 24,675 | ||||||||
| Total current liabilities | 272,468 | 335,928 | ||||||||
| Non-current portion of other accounts payable | 540 | 1,298 | ||||||||
| Provision for remediation and mine closure | 16(a) | 79,812 | 7,061 | |||||||
| Deferred income tax liability | 10(a) | 240,243 | 174,672 | |||||||
| Total liabilities | 593,063 | 518,959 | ||||||||
| Equity, net | 11 | |||||||||
| Issued capital | 990,659 | 990,659 | ||||||||
| Other capital reserves | 198,132 | 198,132 | ||||||||
| Retained earnings | 2,260,917 | 1,488,847 | ||||||||
| Total equity, net | 3,449,708 | 2,677,638 | ||||||||
| Total liabilities and equity, net | 4,042,771 | 3,196,597 | ||||||||
The accompanying notes are an integral part of this financial statement.
Sociedad Minera Cerro Verde S.A.A.
Statements of changes in equityComprehensive Income
For the years ended December 31, 2012, 2011 and 2010
| Capital stock | Legal reserve | Retained earnings | Total | |||||||||||||
| US$(000) | US$(000) | US$(000) | US$(000) | |||||||||||||
| Balance as of January 1, 2010 | 990,659 | 198,132 | 286,055 | 1,474,846 | ||||||||||||
| Profit for the year | - | - | 1,074,393 | 1,074,393 | ||||||||||||
| Dividend distributions, note 11(d) | - | - | (950,000 | ) | (950,000 | ) | ||||||||||
| Balance as of December 31, 2010 | 990,659 | 198,132 | 410,448 | 1,599,239 | ||||||||||||
| Profit for the year | - | - | 1,078,399 | 1,078,399 | ||||||||||||
| Balance as of December 31, 2011 | 990,659 | 198,132 | 1,488,847 | 2,677,638 | ||||||||||||
| Note | 2012 | 2011 | 2010 | |||||||||||
| US$(000) | US$(000) | US$(000) | ||||||||||||
| Sales of goods | 13 | 2,127,023 | 2,520,050 | 2,368,988 | ||||||||||
| Cost of sales of goods | 14 | (801,571 | ) | (824,700 | ) | (645,959 | ) | |||||||
| Gross profit | 1,325,452 | 1,695,350 | 1,723,029 | |||||||||||
| Operating expenses | ||||||||||||||
| Selling expenses | 15 | (78,674 | ) | (83,612 | ) | (76,638 | ) | |||||||
| Expense related to water plant | 16(b) | (19,606 | ) | (13,670 | ) | (4,300 | ) | |||||||
| Excess of workers’ profit sharing | 9(b) | - | (21,923 | ) | (34,427 | ) | ||||||||
| Voluntary contribution | 16(e) | - | - | (41,081 | ) | |||||||||
| Other operating expenses | (9,898 | ) | (16,865 | ) | (10,749 | ) | ||||||||
| (108,178 | ) | (136,070 | ) | (167,195 | ) | |||||||||
| Operating profit | 1,217,274 | 1,559,280 | 1,555,834 | |||||||||||
| Other income (expenses) | ||||||||||||||
| Financial income | 1,886 | 1,078 | 1,261 | |||||||||||
| Financial expenses | (6,951 | ) | (165 | ) | (101 | ) | ||||||||
| Gain net from exchange differences | 20(a) | 3,149 | 1,924 | 669 | ||||||||||
| Profit before income tax | 1,215,358 | 1,562,117 | 1,557,663 | |||||||||||
| Income tax expense | 10(c, d) | (443,288 | ) | (483,718 | ) | (483,270 | ) | |||||||
| Profit for the year | 772,070 | 1,078,399 | 1,074,393 | |||||||||||
| Basic and diluted earnings per share (stated in US dollars) | 18 | 2.21 | 3.08 | 3.07 | ||||||||||
| Weighted average number of shares outstanding | 18 | 350,056,012 | 350,056,012 | 350,056,012 | ||||||||||
Sociedad Minera Cerro Verde S.A.A.
The accompanying notes are an integral partStatements of this financial statement.Changes in Equity
For the years ended December 31, 2012, 2011 and 2010
| Issued capital | Other capital reserves | Retained earnings | Total | |||||||||||||
| US$(000) | US$(000) | US$(000) | US$(000) | |||||||||||||
| Balance as of January 1, 2010 | 990,659 | 198,132 | 286,055 | 1,474,846 | ||||||||||||
| Profit for the year | - | - | 1,074,393 | 1,074,393 | ||||||||||||
| Dividend distribution, note 11(d) | - | - | (950,000 | ) | (950,000 | ) | ||||||||||
| Balance as of December 31, 2010 | 990,659 | 198,132 | 410,448 | 1,599,239 | ||||||||||||
| Profit for the year | - | - | 1,078,399 | 1,078,399 | ||||||||||||
| Balance as of December 31, 2011 | 990,659 | 198,132 | 1,488,847 | 2,677,638 | ||||||||||||
| Profit for the year | - | - | 772,070 | 772,070 | ||||||||||||
| Balance as of December 31, 2012 | 990,659 | 198,132 | 2,260,917 | 3,449,708 | ||||||||||||
Sociedad Minera Cerro Verde S.A.A.
Statements of Cash Flows
For the years ended December 31, 2012, 2011 and 2010
| 2011 | 2010 | 2012 | 2011 | 2010 | ||||||||||||||||
| US$(000) | US$(000) | US$(000) | US$(000) | US$(000) | ||||||||||||||||
| Operating activities | ||||||||||||||||||||
| Profit before tax | 1,562,117 | 1,557,663 | ||||||||||||||||||
| Profit before income tax | 1,215,358 | 1,562,117 | 1,557,663 | |||||||||||||||||
| Adjustments to profit for the year that do not affect net cash flow from operating activities | ||||||||||||||||||||
| Depreciation of property, plant and equipment | 82,431 | 86,056 | 94,242 | 82,431 | 86,056 | |||||||||||||||
| Amortization of intangible assets | 1,630 | 1,630 | 1,630 | 1,630 | 1,630 | |||||||||||||||
| Unwinding of discount provision for remediation and mine closure | 358 | 180 | 239 | 358 | 180 | |||||||||||||||
| Provision (recovery of provision) for inventory obsolescence | 203 | (525 | ) | 778 | 203 | (525 | ) | |||||||||||||
| Loss from disposal/sale of property, plant and equipment | 4,062 | 153 | ||||||||||||||||||
| Net loss from disposal/sale of property, plant and equipment | 24 | 4,062 | 153 | |||||||||||||||||
| Other adjustments | - | (360 | ) | - | - | (360 | ) | |||||||||||||
| Net changes in operating assets and liabilities accounts | ||||||||||||||||||||
| Net decrease (increase) in operating assets | ||||||||||||||||||||
| Trade accounts receivable | (16,460 | ) | (2,801 | ) | 40,261 | (16,460 | ) | (2,801 | ) | |||||||||||
| Trade accounts receivable from affiliates | 91,378 | (74,147 | ) | |||||||||||||||||
| Trade accounts receivable from related parties | (119,231 | ) | 91,378 | (74,147 | ) | |||||||||||||||
| Embedded derivative | 208,474 | (68,457 | ) | (11,569 | ) | 208,474 | (68,457 | ) | ||||||||||||
| Value added tax credit | (66 | ) | (2,991 | ) | ||||||||||||||||
| Other accounts receivable | 3,405 | (8,639 | ) | (2,449 | ) | 2,290 | (13,508 | ) | ||||||||||||
| Inventories | (26,310 | ) | (42,322 | ) | (19,850 | ) | (5,612 | ) | (13,381 | ) | ||||||||||
| Prepaid expenses | (1,049 | ) | (1,878 | ) | ||||||||||||||||
| Other assets | 19,002 | 30,533 | ||||||||||||||||||
| Other long-term accounts receivable | (12,119 | ) | 19,002 | 30,533 | ||||||||||||||||
| Long-term inventories | (48,319 | ) | (20,698 | ) | (28,941 | ) | ||||||||||||||
| Net increase (decrease) in operating liabilities | ||||||||||||||||||||
| Trade accounts payable | (11,426 | ) | 27,578 | 90,404 | (11,426 | ) | 27,578 | |||||||||||||
| Trade accounts payable to affiliates | (436 | ) | 1,132 | |||||||||||||||||
| Accounts payable to related parties | 4,666 | (436 | ) | 1,132 | ||||||||||||||||
| Embedded derivative | (75,257 | ) | - | - | ||||||||||||||||
| Workers’ profit sharing payable | 9,646 | 61,811 | (43,720 | ) | 9,646 | 61,811 | ||||||||||||||
| Other accounts payable | (109,289 | ) | 19,436 | (3,820 | ) | (109,289 | ) | 56,542 | ||||||||||||
| Non-current portion of other accounts payable | (758 | ) | - | (37,106 | ) | |||||||||||||||
| Income tax paid | (626,925 | ) | (327,111 | ) | (465,819 | ) | (626,925 | ) | (327,111 | ) | ||||||||||
| Net cash and cash equivalents provided by operating activities | 1,190,745 | 1,256,941 | 644,691 | 1,190,745 | 1,256,941 | |||||||||||||||
Statements of Cash Flows(continued)
| 2012 | 2011 | 2010 | ||||||||||
| US$(000) | US$(000) | US$(000) | ||||||||||
| Investing activities | ||||||||||||
| Collection from the sale of property, plant and equipment | 262 | - | ||||||||||
| Purchase of property, plant and equipment | (600,872 | ) | (195,222 | ) | (122,256 | ) | ||||||
| Purchase of intangibles | (189 | ) | - | 37 | ||||||||
| Net cash and cash equivalents used in investing activities | (600,799 | ) | (195,222 | ) | (122,219 | ) | ||||||
| Financing activities | ||||||||||||
| Payment of dividends | - | - | (950,000 | ) | ||||||||
| Net cash and cash equivalents used in financing activities | - | - | (950,000 | ) | ||||||||
| Net increase in cash and cash equivalents during the year | 43,892 | 995,523 | 184,722 | |||||||||
| Cash and cash equivalents at beginning of year | 1,383,636 | 388,113 | 203,391 | |||||||||
| Cash and cash equivalents at year-end | 1,427,528 | 1,383,636 | 388,113 | |||||||||
| Transactions with no effects in cash flows: | ||||||||||||
| Increase in the provision for remediation and mine closure estimate | 72,512 | 3,217 | (360 | ) | ||||||||
The accompanying notes are an integral part of this financial statement.
Statements of cash flows (continued)
| 2011 | 2010 | |||||||
| US$(000) | US$(000) | |||||||
| Investing activities | ||||||||
| Purchase of property, plant and equipment | (195,222 | ) | (122,256 | ) | ||||
| Proceeds from sale of plant and equipment | - | 37 | ||||||
| Net cash and cash equivalents used in investing activities | (195,222 | ) | (122,219 | ) | ||||
| Financing activities | ||||||||
| Payment of dividends | - | (950,000 | ) | |||||
| Net cash and cash equivalents used in financing activities | - | (950,000 | ) | |||||
| Net increase in cash and cash equivalents during the year | 995,523 | 184,722 | ||||||
| Cash and cash equivalents at beginning of year | 388,113 | 203,391 | ||||||
| Cash and cash equivalents at year-end | 1,383,636 | 388,113 | ||||||
The accompanying notes are an integral part of this financial statement.
Sociedad Minera Cerro Verde S.A.A.
Notes to the Financial Statements
As of December 31, 2012, 2011 and 2010, and as of January 1, 2010
| 1. | Identification and business activity of the Company |
| (a) | Identification - |
Sociedad Minera Cerro Verde S.A.A. (hereinafter “the Company”) was incorporated in Peru on August 20, 1993, as a result of the privatization process of certain mining units carried out by the Peruvian State in that year. The Company has listed its shares on the Lima Stock Exchange since November 14, 2000.
Through its subsidiary Cyprus Climax Metals Company, Freeport-McMoRan Corporation (“FMC” – formerly Phelps Dodge Corporation), a wholly owned subsidiary of Freeport-McMoRan Copper & Gold Inc. (“Freeport”), owns 53.56% of the voting shares of the Company. Additionally, SMM Cerro Verde Netherlands B.V. (a subsidiary of Sumitomo Metal Mining Company Ltd.) owns 21% of the voting share of the Company, Compañía de Minas Buenaventura S.A.A. owns 19.35%19.58%, and the minority stakeholders own the remaining 6.09%5.86%.
| The Company’s legal address is Asiento Minero Cerro Verde S/N Uchumayo – Arequipa. The ore deposits are located southwest of the city of Arequipa. |
| (b) | Business activity - |
The Company’s activities are regulated by the Peruvian General Mining Law and comprise the extraction, production and sale of copper cathodes and concentrates.
During 2010, theExpansion of operations
The Company completed its concentrator plant expansion for the treatment of copper concentrate from 108,000 to 120,000 metric tons per day (“mtpd”). During the second half of 2011, the Company completed the feasibility study foris engaged in a majorlarge-scale expansion of its concentrator and leaching facilities.Cerro Verde´s production unit. The approximate US$4.04.4 billion project will expand the processing capacity from 120,000 mtpdmetric tons per day of ore to 360,000 mtpd,metric tons per day, targeting incremental annual production of approximately 600 million pounds of copper and 15 million of molybdenum beginning in 2016. In December 2011,2012, the Company has submittedreceived approval of the environmental impact study toEnvironmental Impact Study from the Peruvian Authorities for reviewMinistry of Energy and approval.Mines. Detailed engineering and procurement of long-lead items are in progress. The Company expects to begin construction in 2013.
| (c) | Financial statements approval |
The financial statements as of December 31, 2011 (adoption date for IFRS),2012 and 2010 and the statement of financial position as of January 1, 2010 (date of transition for IFRS)2011 were approved by Company´s Management on February 7, 20128, 2013 and will be presented for the approval of the Board of Directors and the Shareholders within the terms established by law. In Management’s opinion, the accompanying financial statements will be approved without changes by the Board of Directors and Shareholders’ Meetings that will be held in the first quarter of 2012.2013.
Notes to the financial statementsFinancial Statements(continued)
| 2. | Significant accounting principles and policies |
| 2.1 | Basis of preparation - |
The financial statements of the Company have been prepared in accordance with International Financial Reporting Standards (“IFRS”), as issued by the International Accounting Standards Board (“IASB”) and interpretations issued by the IFRS Interpretations Committee (“IFRIC”).
As further discussed in note 3, the Company adopted IFRS effective January 1, 2010. The rules for adoption of IFRS for the first time are presented under IFRS 1, “First-time Adoption of International Financial Reporting Standards”.
The financial statements have been prepared based on historical cost, except for accounts receivable and/or payable related to embedded derivatives, which have been measured at fair value.
The financial statements are presented in United States (“US”) dollars and include the years ended December 31, 2012, 2011 and 2010. Unless otherwise indicated, all values have been rounded to the nearest thousand.
| 2.2 |
The preparation of the financial statements according to IFRS requires that Management make judgments, estimates and assumptions that affect the amounts of the assets and liabilities reported, and the disclosure of contingent assets and liabilities at the date of the financial statements, and the reported amounts of revenues and expenses for the years ended December 31, 2012, 2011 and 2010.
Estimates and assumptions are continuously evaluated and are based on the experience of Management and other factors, including expectations of future events that are reasonable under current circumstances; however, actual results could differ from these estimates.
Information about significant areas of estimationestimations and uncertaintyjudgements taken into account by Management in the preparation of the financial statements follows:
| (a) | Estimates of ore reserves and resources - |
Ore reserves are estimates of the ore quantity that can be economically and leallylegally extracted from the mine properties. The Company estimates its ore reserves based on information compliedcompiled by individuals qualified in reference to geological data about the size, depth and form of the ore body, whichand requires complexof geological judgments in order to interpret the data.
Notes to the financial statements(continued)
The estimation of recoverable reserves is based on factors such as estimated exchange rates, commodity prices, future requirements of capital and production costs, together with geological hypothesis and judgments made when estimating the size and quality of ore. Revisions in reserve or resource estimates may have an impact on the value of mining properties, property, plant and equipment, provisions for cost of mine closure, recognition of assets for deferred taxes and depreciation and amortization of assets.
Notes to the Financial Statements(continued)
| (b) | Units-of-production (“UOP”) depreciation - |
Estimates of recoverable reserves are used in determining the depreciation and amortization of mine assets. This results in a depreciation/amortization charge proportional to the depletion of the anticipated remaining life of mine production. Each item’s life, which is assessed annually, takes into account its physical life limitations and the present assessments of economically recoverable reserves. These calculations require the use of estimates and assumptions, including the amount of recoverable reserves that may be recovered.
| (c) | Asset impairment – |
The Company has determined that the Cerro Verde operation consists of one cash generating unit, which isconsidering the operation as a whole. Therefore, the Cerro Verde operation is evaluated annually in order to determine if there are any impairment indicators. If any such indication exists, the Company makes an estimate of the recoverable amount, which is the greater of the fair value less costs to sell and the value in use. These assessments require the use of estimates and assumptions, such as long-term commodity prices, discount rates, operating costs, and others.
Fair value is defined as the amount that would be obtained from the sale of the asset in an arm’s length transaction between willing and knowledgeable parties. The fair value of assets is generally determined as the current value of future cash flows derived from the continuous use of the asset, which includes estimates, such as the cost of future expansion plans and eventual disposal, while applying assumptions that an independent market participant may take into account. The cash flows are discounted by applying a discount rate that reflects current market, the time value of money and the risks specific to the asset.
| (d) | Mine closure provision- |
The Company assesses its mine closure provision annually. It is necessary to make estimates and assumptions in determining this provision, including cost estimates of activities that are necessary for the rehabilitation of the site, technological and regulatory changes, interest rates and inflation rates. As discussed in note 2.3(h), estimated changes in the fair value of the mine closure provision or the useful life of the related assets are recognized as an increase or decrease in the book value of the provision and related asset retirement cost (ARC) in accordance with IAS 16, “Property, Plant and Equipment”. If any change in the estimate results in an increase to the mine closure and related ARC, the Company shall consider whether or not this is an indicator of impairment of the assets and will apply impairment tests in accordance with IAS 36, “Impairments of Assets”.
Notes to the financial statementsFinancial Statements(continued)
| (e) | Inventories - |
Net realizable value tests are performed at least annually and represent the estimated future sales price of the product based on prevailing spot metals prices, less estimated costs to complete production and bring the inventory to sale. Additionally, in calculating the net realizable value of the Company’s long-term stockpiles, Management also considers the time value of money.
Mill and leach stockpiles generally contain lower grade ores that have been extracted from the ore body and are available for copper recovery. For mill stockpiles, recovery is through milling and concentrating. For leach stockpiles, recovery is through exposure to acidic solutions that dissolve copper and deliverdelivery it in solution to extraction processing facilities.
Because it is generally impracticable to determine copper contained in mill and leach stockpiles by physical count, reasonable estimation methodsmethod are employed. The quantity of material delivered to mill and leach stockpiles is based on surveyed volumes of mined material and daily production records. Sampling and assaying of blasthole cuttings determine the estimated copper grades of material delivered to mill and leach stockpiles.
Expected copper recovery rates for mill stockpiles are determined by metallurgical sampling. The recoverablerecoverability of copper in mill stockpiles, once entered into the production process, can be produced into copper concentrate almost immediately.
Estimated copper recovery rates for leach stockpiles are determined using small-scale laboratory tests, historical trends and other factors. Ultimate recovery of copper contained in leach stockpiles can vary significantly depending on several variables, including type of copper recovery, mineralogy and particlethe size of the rock.rocks. Processes and recovery rates are monitored continuously, and recovery rates are adjusted periodically as additional information becomes available and as related technology changes.
| (f) | Contingencies - |
By their nature, contingencies will only be resolved when one or more future events do or do not occur. Determining contingencies inherently involves the exercise of judgment and calculation of the estimated results of future events.
Notes to the financial statements(continued)
| 2.3. | Summary of significant accounting policies and practices - |
| (a) | Currency - |
The financial statements are presented in US dollars; which is also the Company’s functional currency.
Notes to the Financial Statements(continued)
Foreign currency transactions are considered to be those which are carried out in a currency that is other than the function currency. Foreign currency transactions are translated into the functional currency by applying the exchange rate in force on the date the transaction takes place. Monetary assets and liabilities denominated in foreign currencies are converted using the functional currency spot rate in force at the reporting date.
Gains and losses as a result of the difference in the exchange rate when currency items are liquidated or when converting currency items at exchange rates that are different from those used for their initial recognition are recognized in the statements of comprehensive income for the year.
The Company uses exchange rates published by the Superintendent of Banks, Insurance and AFP. As of December 31, 2011,2012, the published exchange rates were S/.2.695.2.594 for US$1 for buying and S/.2.697.2.551 for US$1 for selling (S/.2.808.2.695 for US$1 and S/. 2.8092.697 for US$1, as of December 31, 2010,2011, respectively). These rates have been applied to the appropriate asset and liability accounts. As of December 31, 20112012 and 2010, and January 1, 20102011, the Company haddid not maintained othermaintain significant assets or liabilities in Nuevos Soles.
| (b) | Financial assets - |
The Company determines the classification of its financial assets at initial recognition in accordance with IAS 39, “Financial Instruments: Recognition and Measurement”.
Financial assets are recognized initially at fair value plus the direct costs attributable to the transaction. The Company’s financial assets include cash and cash equivalents, accounts receivable and embedded derivatives.
Cash and cash equivalents -
Cash and cash equivalents are financial assets that may be liquidated immediately, such as bank checking accounts, and other liquid investments with original maturities of three months or less.
Receivables -
The Company’s receivables include trade accounts receivables to affiliatesrelated parties and third parties and other accounts receivable. These receivables are stated at their transaction value, net of an allowance for doubtful accounts.
Notes to the financial statements(continued)
Receivables are non-derivative financial assets with fixed or determinable payments that are not quoted in an active market. After initial measurement, receivables are subsequently carried at amortized cost using the effective interest method less any provision for impairment (i.e. allowance for doubtful accounts).
Notes to the Financial Statements(continued)
The Company assesses whether, as of the date of the financial statements, there is objective evidence of impairment in the value of the receivable. Any resulting impairment is measured as the difference between the book value of the receivable and the present value of the estimated future cash flows, discounted at an original effective interest rate or one applicable to a similar transaction. The carrying amount of the receivable is reduced by means of an allowance account and recognized in the statements of comprehensive income.
Embedded derivatives -
The Company’s copper sales are provisionally priced at the time of shipment. The provisional prices are finalized in a specified future month based on quoted London Metal Exchange (LME) monthly average prices. The Company receives market prices based on prices in the specified future month, which results in price fluctuations recorded through revenues until the date of settlement. The Company records revenues and commercial invoices customers at the time of shipment based on then-currentthe current LME prices, which resultsresult in an embedded derivative that is required to be separated from the main contract.
The Company’s embedded derivatives from sales are measured at fair value (based on LME spot copper prices) with subsequent changes recognized in the statements of comprehensive income until the month of settlement.
| (c) | Inventories – |
Inventories are stated at the lower of cost or the net realizable value. Inventory of materials and supplies, as well as saleablefinished products are determined using the weighted-average cost method. The cost of finished goods and in - process inventory (i.e., stockpiles) includes labor and benefits, supplies, energy and other costs related to mining and processing of minerals. Net realizable value is the estimated future sales price based on forward metal prices (at the year that are expected to be expected to process)processed), less estimated costs to complete production and bring the inventory to sale; and the discount rate.
Provision for obsolescence -
Obsolescence allowances are established based on an item-by-item analysis by Management. Any amount of obsolescence identified is charged to the statements of comprehensive income in the year it is deemed to have occurred.
Notes to the financial statements(continued)
| (d) | Property, plant and equipment - |
Property, plant and equipment are valued at historical cost, including costs that are directly attributed to the construction or acquisition, net of accumulated depreciation, amortization and impairment.
Notes to the Financial Statements(continued)
Repairs and/or improvements of an asset that is depreciated separately and is required to be discharged or replaced, creating an increase of economic life of property and for which it is probable that there will be future economic benefit to the Company, are recorded as assets. All other maintenance costs are charged to expense as incurred.
Land acquired for the development of administrative activities or business supports areis not depreciated. Depreciation of assets directly related to the useful life of the mine is calculated using the UOP method based on the mine’s proven and probable reserves. Other assets are depreciated using the straight-line method based on the following estimated useful lives:
| Years | ||
| Buildings and other constructions | Between 10 and 30 | |
| Machinery and equipment | Between 3 and 25 | |
| Transportation units | 7 | |
| Furniture and fixtures | 7 | |
| Other equipment | Between 3 and 25 |
Critical spare parts and those which are directly identified with machinery or equipment are included in property, plant and equipment, and the economic life assigned is in referencewill be related to the main asset with which they are identified.
An item of property, plant and equipment is retired at the time of its disposal or when no future economic benefits are expected from its use or subsequent disposition. Any gain or loss arising at the time of retirement is calculated as the difference between the proceeds from the sale and the book value of the asset and is included in the statements of comprehensive income in the year the asset is retired.
The residual value and useful economic lives of the Company’s property, plant and equipment are reviewed, and adjusted if appropriate, at each year end. The Company also assesses, at the end of each period, whether there is an indication that its property, plant and equipment may be impaired.
Notes to the financial statements(continued)
| (e) | Exploration, development and stripping costs – |
Exploration costs -
Mineral exploration costs, as well as drilling and other costs incurred for the purpose of converting mineral resources to proven and probable reserves, or identifying new mineral resources at development or production stage properties, are charged to the statements of comprehensive income as incurred.
Development costs -
Development costs are capitalized based on the judgment of Management,Management´s judgement, when the economic and technological feasibility of the project is confirmed, which is generally when the development or expansion project has reached a milestone in accordance with a model established by Management.Company.
Notes to the Financial Statements(continued)
Stripping cost -
The Company records the cost of stripping incurred during the mine’s production stage as a variable production cost and includes them in the cost of inventory produced during the period when such stripping costs were incurred. Stripping costs incurred in the development of a mine (i.e., before production commences) are capitalized until the production stage is initiated and subsequently amortized using the UOP method.
| (f) | Intangible assets - |
The intangible assets acquired are recorded at cost less accumulated amortization. As indicated in note 17(c)16(c), the Company has recorded an intangible asset for the future benefit of electrical energy at a fixed price, which is being amortized over the nine year lifeterm of the contract, which expires December 31, 2015. The Company assesses at the end of each period, whether there is an indication that its intangible asset may be impaired.
| (g) | Impairment - |
At each reporting date, the Company evaluates if there is any indication that an asset could be impaired. If such an indication exists, the Company estimates the recoverable amount of the asset. The recoverable amount of an asset is the greater of its fair value less costs to sell or its value in use and is determined for the assets of the mine as a whole, since there are no assets that generate cash revenues independently.
When the book value of an asset exceeds its recoverable amount, the asset is considered impaired and is reduced to its recoverable amount. When evaluating the value in use, the future estimated cash flows are discounted to their present value using a discount rate before taxes that reflects current market evaluations of the time value of money and the specific risks to the asset.
Notes to the financial statements(continued)
Losses resulting from the impairment of assets are recognized in the statements of comprehensive income under the categories of expenses consistent with the function of the impaired asset. A previously recognized impairment loss is reversed only if there has been a change in the estimates used to determine the asset’s recoverable amount since the last impairment loss was recognized. The revised valuation cannot exceed the book value that would have been determined, net of depreciation, if an impairment loss for the asset had not been recognized in a previous period. Such a reversal is recognized in the statements of comprehensive income.
Notes to the Financial Statements(continued)
There was no indication of impairment of the Company’s assets atas of December 31, 20112012 and December 31, 2010.2011.
| (h) | Provisions - |
General -
A provision is recognized when the Company has a present obligation (legal or constructive) as a result of a past event, it is probable that resources of the Company will be required to settle the obligation, and an estimate of the amount of the obligation can be calculated. The expense relating to any provision is presented in the statements of comprehensive income, net of any reimbursement, in the period the provision is established.
If the effect of the time value of money is significant, provisions are discounted by applying a discount rate that reflects, where applicable, the risks specific to the liability. When discounting is used, the increase in the provision due to the passage of time is recognized as a financial expense in the statements of comprehensive income.
Mine closure provision -
The Company records a mine closure provision when a contractually or legally enforceable obligation arises. The Company estimates the present value of its future obligation for mine closure and increases the carrying amount of the related ARC, which is included in property, plant and equipment. Subsequently, the mine closure provision is accreted to full value over time and recognized as an interest cost considered in the initial fair value estimate. The related ARC is depreciated using the units-of-production method during the economic life of the mine.
The Company evaluates its mine closure provision annually and makes adjustments to estimates and assumptions, including scope, future costs and discount rates, as applicable. Changes in the fair value of the mine closure provision or the useful life of the related asset are recognized as an increase or decrease in the book value of the provision and the related ARC in accordance with IAS 16. Any decrease in the mine closure provision and related ARC cannot exceed the current book value of the asset; amounts over the current book value will be recorded in the statements of comprehensive income.
Notes to the financial statements(continued)
| (i) | Revenue recognition - |
The Company primarily sells copper cathodes and concentrates in accordance with sales contracts entered into with its customers. Revenues comprise the fair value of the sale of goods, net of related general sales taxes. The Company recognizes revenue when the amount can be reliably measured, it is probable that future economic benefits will flow to the Company and all significant risks (including title and insurance risk) and rewards of ownership have transferred to the customer. Revenue is not considered reliably measured until all contingencies relating to the sale have been resolved.
Notes to the Financial Statements(continued)
Sales of copper cathodes and copper concentrates –
Local sales of copper cathodes are recognized when the Company has delivered the goods to the shipping company designated by the customer. Revenue associated with foreign sales of copper cathodes and copper concentrates is recognized when all significant risks and rewards of ownership have transferred to the customer, which is typically when the inventory has passed over the vessel’s rail at the port of loading.
As described in note 2.3(b), the Company’s copper sales are provisionally priced at the time of shipment. The provisional prices are finalized in a specified future month in accordance with the terms specified in the related sales contract and based on quoted LME monthly average prices. The Company receives market prices in the specified future month, and these sales result in changes recorded to revenues until the specified future month. The Company records revenues and commercial invoices customers at the time of shipment based on then-currentthe current LME prices, which resultsresult in an embedded derivative that is bifurcated from the host contract.
| (j) | Income taxes, deferred taxes and other taxes- |
Income taxes-
Income tax assets and liabilities are measured at the amounts expected to be paid to or recovered from the tax authorities. The tax rates and tax laws that are applied to compute the amounts are those that are enacted or substantially enacted at the end of the year. The Company calculates the provision for income tax in accordance with the Peruvian tax legislation in force. The income tax rate in Peru was 30% as of December 31, 20112012 and 2010.
Notes to the financial statements(continued)2011.
Deferred taxes -
Deferred taxes areThe deferred income tax is presented using the liability method for differences between the tax bases of assets and liabilities and their book valuevalues for financial reporting purposes. Deferred tax liabilities are recognized for all taxabletemporary differences. Deferred tax assets are recorded for all deductible temporary differences when there is a probability that there could be future taxable earnings against which the deductible differencetemporary differences could be applied.
The book value of the deferred tax assetsasset is reviewed at the end of each period and reduced to an amount that is more likely than not to be realized against taxable earnings. Deferred tax assets that are not recognized are reassessed at each period and are recognized when it is more likely than not that future taxable earnings will allow for the deferred tax asset to be recovered.
Notes to the Financial Statements(continued)
Deferred tax assets and liabilities are measured at tax rates that are expected to be applicable during the year when the assets are realized or the liabilities are liquidated, based on the tax rates (and tax laws) that have been enacted at the end of the period. Deferred tax assets and liabilities are offset if there is a legally enforceable right to offset tax assets against tax liabilities and the deferred tax is related to the same entity and the same tax authority.
Mining Taxes -
On September 29, 2011, Law 29788 (which amended Law 28528) was enacted creating a new mining tax and royalty regime in Peru. Under the new regime, companies that do not have stability agreements will be subject to a revised royalty and a special mining tax. Cerro Verde operates under a stability agreement and therefore is not subject to the revised royalty and special mining tax until its stability agreement expires on December 31, 2013. The Peruvian government has also created a special mining burden that companies with tax stability agreements can elect to pay. The special mining burden is based on a sliding scale of 4% to 13%, with a maximum effective tax rate of 8.79%. Cerro Verde will elect to pay this special mining burden during the remaining term of its stability agreement.
| (k) | Workers’ profit sharing - |
The Company recognizes worker’s profit sharing In accordance with IAS 19, “Employees Benefits"Benefits”. Workers’ profit sharing is calculated in accordance with Peruvian laws (Legislative Decree No. 892), and the Company’s workers’ profit sharing rate is 8% over the taxable net base of current year. According to Peruvian law the limit in the workers’ profit sharing that an employee could receive is equivalent to 18 months of wages, and any excess above such limit will be transferred to the Regional Government and “National FundFound for Employment’s Promotion and Training” (“FONDOEMPLEO”). The Company’s workers’ profit sharesharing is recognized as a liability in the statement of financial position and as an operating expensesexpense in the statements of comprehensive income.
Notes to the financial statements(continued)
| (l) | Basic and dilutedearningsper share - |
Basic and diluted earnings per share have been calculated based on the weighted average number of common shares outstandingheld during the period. When the number of shares is modified as a result of capitalization of retained earnings, the net income per basic and diluted sharesshare is adjusted retroactively for all of the periods reported. For the years ended as of December 31, 2012, 2011 and 2010, the Company did not have any financial instrument with dilutive effects; as a result, the basic and diluted shares are the same in all years presented.
Notes to the Financial Statements(continued)
| 2.4. | New IFRS and IFRIC – |
Improvements and amendments to IFRS issued, buteffective in 2012 and also those which are not yet effective, include the following:
Effective in 2012.-
There are no new or amended standards and interpretations effective in 2012 that impact either the financial position, financial results, disclosure or stated accounting policies of the Company.
Effective in 2013.-
| - | IAS 1, Presentation of Financial Statements, effective for annual periods beginning on July 1, 2012. The amendments to IAS 1 change the grouping of items presented in the statement of comprehensive income. |
| - | IAS 27, Separate Financial Statements (revised in 2011), effective for annual periods beginning on January 1, 2013. As a consequence of the new IFRS 10 and IFRS 12, what remains in IAS 27 is limited to accounting for subsidiaries, joint arrangements and associates in separate financial statements. |
| - | IAS 28, Investments in associates and joint ventures (revised in 2011), effective for annual periods beginning on January 1, 2013. As a consequence of the new IFRS 11 and IFRS 12, IAS 28 Investments in Associates and Joint Ventures, describes the application of the equity method to investments in joint ventures in addition to associates. |
| - | IAS 19, “Employee Benefits (Amendment)”, effective January 1, 2013, amends the recognition and disclosure requirements for defined benefit plans. |
| - | IFRS 9, “Financial Instruments”, effective January 1, 2015, modifies the treatment and classification of financial assets established by IAS 39, “Financial Instruments: Recognition and Measurement”. |
| - | IFRS 10, “Consolidated Financial Statements”, effective January 1, 2013, replaces the consolidation requirements in SIC-12, “Consolidation—Special Purpose Entities” and IAS 27, “Consolidated and Separate Financial Statements”. |
| - | IFRS 11, “Joint Arrangement”, effective January 1, 2013, addresses inconsistencies in the reporting of joint arrangements by requiring a single method to account for interests in jointly controlled entities. The guidance focuses on the rights and obligations of the joint arrangement, rather than its legal form (as is currently the case). |
Notes to the Financial Statements(continued)
| - | IFRS 12, “Disclosure of Interests in Other Entities”, effective January 1, 2013, is a new and comprehensive standard on disclosure requirements for all forms of interests in other entities, including subsidiaries, joint arrangements, associates and unconsolidated structured entities. |
Notes to the financial statements(continued)
| - | IFRS 13, “Fair Value Measurement”, effective January 1, 2013, defines fair value, sets out a framework for measuring fair value and requires disclosures about fair value measurements. |
| - | IFRIC 20, “Stripping Costs in the Production Phase of a Surface Mine”, effective January 1, 2013, clarifies when the stripping cost in the production |
Other than IFRIC 20, the implementation of these standards and interpretations is not expectedAnnual improvements to have a material effectIFRS (issued in May 2012) -
| - | IAS 1, Presentation of Financial Statements, clarifies the difference between voluntary annual comparative information and the minimum required of comparative period is the previous period. |
| - | IAS 16, Property, Plant and Equipment, clarifies that major spare parts and servicing equipments that meet the definition of property, plant and equipment are not inventories. |
| - | IAS 32, Financial Instruments: Presentation, clarifies that income taxes arising from distributions to equity holders are accounted for in accordance with IAS 12. |
Such improvements are effective for annual periods beginning on the Company’s financial reporting and disclosures. or after January 1, 2013.
Management is currently evaluating the impact IFRIC 20 will haveof the new pronouncements described above on the Company’s financial reporting and disclosures and expectfor the implementation of this interpretation may result in a changeyear 2013.
Notes to its accounting for stripping costs as described in note 2.3(e).the Financial Statements(continued)
| 3. |
On October 14, 2010, through Resolution N°102-2010-EF/94.01.1, CONASEV authorized full adoption of IFRS for all legal entities under its supervision beginning in the year 2011.
The financial statements for the year ended December 31, 2011, are the first the Company has prepared in accordance with IFRS. For periods up to and including the year ended December 31, 2010, the Company prepared its financial statements in accordance with generally accounting principles accepted in Peru (“Peru GAAP”). Accordingly, the Company has prepared financial statements which comply with IFRS for the year ended December 31, 2011, together with the comparative period data for the year ended December 31, 2010, as described in the accounting policies. In preparing these financial statements, the Company’s opening statement of financial position was prepared as of January 1, 2010, the Company’s date of transition to IFRS.
Exemptions applied -
Initial application of IFRS generally requires the complete retrospective application of the regulations and interpretations in force on the date of the first issuance of financial statements. However, IFRS 1, “First-Time Adoption of International Financial Reporting Standards” allows first-time adopters certain exemptions from the general requirements to apply IFRS at the date of transition.
Notes to the financial statements(continued)
The Company has elected to apply the exemption from full retrospective application of decommissioning provisions (i.e., mine closure provisions). Accordingly, the Company re-measured its mine closure provision at January 1, 2010, under IAS 37, “Provisions, Contingent Liabilities and Contingent Assets” and estimated the amount to be included in the cost of the related asset by discounting the liability to the date at which the liability first arose. The Company did this by using its best estimate of the historical risk-adjusted discount rates, and recalculated accumulated depreciation, depletion and amortization under IFRS up to the transition date.
Estimates -
The estimates used by the Company to present these amounts in accordance with IFRS reflect conditions at January 1, 2010, the date of transition to IFRS, and as of December 31, 2010, and are consistent with those made for the same dates in accordance with Peru GAAP (after adjustments to reflect any differences in accounting policies).
| Note | As of January 1, 2010 (Peru GAAP) | Remeasurements | As of January 1, 2010 (IFRS) | |||||||||||
| US$(000) | US$(000) | US$(000) | ||||||||||||
| Assets | ||||||||||||||
| Current Assets | ||||||||||||||
| Cash and cash equivalents | 203,391 | - | 203,391 | |||||||||||
| Trade accounts receivable | 24,792 | - | 24,792 | |||||||||||
| Trade accounts receivable from affiliates | 216,562 | - | 216,562 | |||||||||||
| Embedded derivative | 64,760 | - | 64,760 | |||||||||||
| Value added tax credit | 4,228 | - | 4,228 | |||||||||||
| Other accounts receivable | 6,335 | - | 6,335 | |||||||||||
| Inventories, net | 156,319 | - | 156,319 | |||||||||||
| Prepaid expenses | 4,178 | - | 4,178 | |||||||||||
| Total current assets | 680,565 | - | 680,565 | |||||||||||
| Other long-term assets | 49,535 | - | 49,535 | |||||||||||
| Long-term inventories | 91,235 | - | 91,235 | |||||||||||
| Property, plant and equipment, net | 3.4(c) | 1,082,051 | (9,415 | ) | 1,072,636 | |||||||||
| Intangible assets, net | 9,779 | - | 9,779 | |||||||||||
| Total assets | 1,913,165 | (9,415 | ) | 1,903,750 | ||||||||||
| Liabilities and equity, net | ||||||||||||||
| Current liabilities | ||||||||||||||
| Trade accounts payable | 39,798 | - | 39,798 | |||||||||||
| Trade accounts payable to affiliates | 2,719 | - | 2,719 | |||||||||||
| Income tax payable | 83,792 | - | 83,792 | |||||||||||
| Workers’ profit sharing payable | 48,254 | - | 48,254 | |||||||||||
| Other accounts payable | 76,516 | - | 76,516 | |||||||||||
| Total current liabilities | 251,079 | - | 251,079 | |||||||||||
| Provision for remediation and mine closure | 3.4(c) | 18,642 | (14,975 | ) | 3,667 | |||||||||
| Deferred income tax and workers’ profit sharing liability | 3.4(a,d) | 158,040 | (23,192 | ) | 134,848 | |||||||||
| Non-current portion of other accounts payable | 39,310 | - | 39,310 | |||||||||||
| Total liabilities | 467,071 | (38,167 | ) | 428,904 | ||||||||||
| Equity, net | ||||||||||||||
| Capital stock | 990,659 | - | 990,659 | |||||||||||
| Legal reserve | 198,132 | - | 198,132 | |||||||||||
| Retained earnings | 257,303 | 28,752 | 286,055 | |||||||||||
| Total equity, net | 1,446,094 | 28,752 | 1,474,846 | |||||||||||
| Total liabilities and equity, net | 1,913,165 | (9,415 | ) | 1,903,750 | ||||||||||
Notes to the financial statements(continued)
| Note | As of December 31, 2010 (Peru GAAP) | Remeasurements | As of December 31, 2010 (IFRS) | |||||||||||||
| US$(000) | US$(000) | US$(000) | ||||||||||||||
| Assets | ||||||||||||||||
| Current Assets | ||||||||||||||||
| Cash and cash equivalents | 388,113 | - | 388,113 | |||||||||||||
| Trade accounts receivable | 27,593 | - | 27,593 | |||||||||||||
| Trade accounts receivable from affiliates | 290,709 | - | 290,709 | |||||||||||||
| Embedded derivative | 133,217 | - | 133,217 | |||||||||||||
| Value added tax credit | 7,219 | - | 7,219 | |||||||||||||
| Other accounts receivable | 14,974 | - | 14,974 | |||||||||||||
| Inventories, net | 3.4(a, b) | 165,094 | 5,131 | 170,225 | ||||||||||||
| Prepaid expenses | 6,056 | - | 6,056 | |||||||||||||
| Total current assets | 1,032,975 | 5,131 | 1,038,106 | |||||||||||||
| Other long-term assets | 19,002 | - | 19,002 | |||||||||||||
| Long-term inventories | 3.4(a, b) | 115,086 | 5,090 | 120,176 | ||||||||||||
| Property, plant and equipment, net | 3.4 (c) | 1,109,953 | (1,308 | ) | 1,108,645 | |||||||||||
| Intangible assets, net | 8,149 | - | 8,149 | |||||||||||||
| Total assets | 2,285,165 | 8,913 | 2,294,078 | |||||||||||||
| Liabilities and equity, net | ||||||||||||||||
| Current liabilities | ||||||||||||||||
| Trade accounts payable | 67,376 | - | 67,376 | |||||||||||||
| Trade accounts payable to affiliates | 3,851 | - | 3,851 | |||||||||||||
| Income tax payable | 174,275 | - | 174,275 | |||||||||||||
| Workers’ profit sharing payable | 110,065 | - | 110,065 | |||||||||||||
| Other accounts payable | 133,057 | - | 133,057 | |||||||||||||
| Total current liabilities | 488,624 | - | 488,624 | |||||||||||||
| Provision for remediation and mine closure | 3.4(c) | 12,106 | (8,619 | ) | 3,487 | |||||||||||
| Deferred income tax and workers’ profit sharing liability | 3.4(a, d) | 231,714 | (31,190 | ) | 200,524 | |||||||||||
| Non-current portion of other accounts payable | 2,204 | - | 2,204 | |||||||||||||
| Total liabilities | 734,648 | (39,809 | ) | 694,839 | ||||||||||||
| Equity, net | ||||||||||||||||
| Capital stock | 990,659 | - | 990,659 | |||||||||||||
| Legal reserve | 198,132 | - | 198,132 | |||||||||||||
| Retained earnings | 361,726 | 48,722 | 410,448 | |||||||||||||
| Total equity, net | 1,550,517 | 48,722 | 1,599,239 | |||||||||||||
| Total liabilities and equity, net | 2,285,165 | 8,913 | 2,294,078 | |||||||||||||
Notes to the financial statements(continued)
A reconciliation of the Company’s statements of comprehensive income for the year ended December 31, 2010, under Peru GAAP to IFRS is provided below:
| Note | For the year ended as of December 31, 2010 (Peru GAAP) | Remeasurements | For the year ended as of December 31, 2010 (IFRS) | |||||||||||
| US$(000) | US$(000) | US$(000) | ||||||||||||
| Sales of goods | 2,368,988 | - | 2,368,988 | |||||||||||
| Cost of sales of goods | 3.4(a, b, c) | (571,363 | ) | (74,596 | ) | (645,959 | ) | |||||||
| Gross profit | 1,797,625 | (74,596 | ) | 1,723,029 | ||||||||||
| Operating expenses | ||||||||||||||
| Selling expenses | (76,638 | ) | - | (76,638 | ) | |||||||||
| Voluntary contribution | (41,081 | ) | - | (41,081 | ) | |||||||||
| Excess of worker’s profit sharing | 3.4(a) | - | (34,427 | ) | (34,427 | ) | ||||||||
| Other operating expenses | (15,049 | ) | - | (15,049 | ) | |||||||||
| Operating profit | 1,664,857 | (109,023 | ) | 1,555,834 | ||||||||||
| Other income (expenses) | ||||||||||||||
| Financial income | 1,261 | - | 1,261 | |||||||||||
| Financial expenses | (101 | ) | - | (101 | ) | |||||||||
| Gain net from exchange differences | 669 | - | 669 | |||||||||||
| Profit before income tax | 1,666,686 | (109,023 | ) | 1,557,663 | ||||||||||
| Workers’ profit sharing | ||||||||||||||
| Current | 3.4(a) | (120,995 | ) | 120,995 | - | |||||||||
| Deferred | 3.4(a) | (16,556 | ) | 16,556 | - | |||||||||
| Income tax | ||||||||||||||
| Current | (417,594 | ) | - | (417,594 | ) | |||||||||
| Deferred | 3.4(d) | (57,118 | ) | (8,558 | ) | (65,676 | ) | |||||||
| Profit for the year | 1,054,423 | 19,970 | 1,074,393 | |||||||||||
Notes to the financial statements(continued)
The adoption of IFRS did not have a significant effect on amounts reported in the Company’s statement of cash flows for the year ended December 31, 2010.
The IFRS adoption required adjustments to the balances in the previous financial statements under generally accepted accounting principles in Peru:
Prior to the adoption of IFRS, the Company’s historical practice was to account for workers’ profit sharing as an income tax in accordance with IAS 12. At the November 2010 IFRIC meeting, it was concluded that employee profit sharing should be accounted for in accordance with IAS 19 and not according to IAS 12. Consequently, an entity is only required to recognize a liability when an employee has provided service and deferred profit sharing should not be recorded for timing differences because this is a future service that cannot be considered an obligation or right under IAS 19. In Peru, the historical practice was to calculate and record deferred profit sharing in the financial statements. In accordance with this requirement, the Company reduced its deferred profit sharing liability in the amount of US$35,514,000 January 1, 2010 (US$52,070,000 at December 31, 2010).
Notes to the financial statements(continued)
Up to December 31, 2010, the cost of the finished goods and in-process inventory was determined using the first-in, first-out (“FIFO”) method. Beginning January 1, 2011, the Company elected to use the weighted average cost method (including the current workers’ profit sharing cost as party of inventory cost) to value its inventories. The change in the Company’s inventory valuation methodology generated a total increase in short and long-term metals inventory of US$10,221,000 as of December 31, 2010.
The Company recalculated the corresponding assets and liabilities for mine closure costs as of the date of transition, which generated a decrease of US$14,975,000 in the provision for mine closure at January 1, 2010 (US$8,619,000 at December 31, 2010), and a decrease in the related ARC, which is included in property, plant and equipment, of US$9,415,000 at January 1, 2010 (US$1,308,000 at December 31, 2010).
The Company recomputed the assets and liabilities for all of the transitional adjustments described above, which generated an increase in deferred income taxes of US$12,322,000 at January 1, 2010 (US$20,880,000 at December 31, 2010).
| Cash and cash equivalents |
| (a) | This item is made up us follows: |
| December 31, 2011 | December 31, 2010 | January 1, 2010 | 2012 | 2011 | ||||||||||||||||
| US$(000) | US$(000) | US$(000) | US$(000) | US$(000) | ||||||||||||||||
| Cash equivalents (b) | 1,376,818 | 382,853 | 199,855 | 1,421,955 | 1,376,818 | |||||||||||||||
| Cash in banks | 6,818 | 5,260 | 3,536 | 5,573 | 6,818 | |||||||||||||||
| 1,383,636 | 388,113 | 203,391 | 1,427,528 | 1,383,636 | ||||||||||||||||
| (b) | Cash equivalents comprises a portfolio of investments in |
Notes to the financial statements(continued)
| Trade accounts receivable |
Trade accounts receivable are generated primarily from the Company’s concentratecathode and cathodecopper concentrate sales, are denominated in US dollars, have current maturities, do not bear interest and have no specific guarantees (see note 18(f) forguarantees.
| 5. | Other long-term accounts receivable |
Correspond to additional disbursements made by the Company related to the monthly pre payments of income tax which might be offset with future tax debts or be recovered by a summaryrequest of trade accounts receivable from affiliates).refund to the Tax authority. As of December 31, 2012, these overpayments amounted to US$63,964,000 and are presented as non-current assets in the statement of financial position.
Notes to the Financial Statements(continued)
| 6. | Inventories, net |
| (a) | This item is made up as follows: |
| December 31, 2011 | December 31, 2010 | As of January 1, 2010 | 2012 | 2011 | ||||||||||||||||
| US$(000) | US$(000) | US$(000) | US$(000) | US$(000) | ||||||||||||||||
| Finished goods: | ||||||||||||||||||||
| Copper cathodes | 7,565 | 6,682 | 3,767 | 7,481 | 7,565 | |||||||||||||||
| Copper concentrate | 6,079 | 8,956 | 1,281 | 12,728 | 6,079 | |||||||||||||||
| Molybdenum concentrate | 1,264 | 867 | 808 | 1,467 | 1,264 | |||||||||||||||
| Balance of finished goods, see note 14 | 21,676 | 14,908 | ||||||||||||||||||
| Work-in-process (b) | 165,635 | 146,514 | 118,274 | 213,734 | 165,635 | |||||||||||||||
| Materials and supplies | 137,137 | 125,118 | 124,683 | 149,874 | 137,137 | |||||||||||||||
| Materials and supplies in transit | 761 | 3,994 | 996 | 1,326 | 761 | |||||||||||||||
| Less: Provision for obsolescence of materials and supplies | (1,933 | ) | (1,730 | ) | (2,255 | ) | ||||||||||||||
| Less - Provision for obsolescence of materials and supplies | (2,711 | ) | (1,933 | ) | ||||||||||||||||
| Total Inventories | 316,508 | 290,401 | 247,554 | 383,899 | 316,508 | |||||||||||||||
| Less: Long-term inventories (b) | (140,671 | ) | (120,176 | ) | (91,235 | ) | ||||||||||||||
| Less - Long-term inventories (b) | (188,990 | ) | (140,671 | ) | ||||||||||||||||
| Current inventories, net | 175,837 | 170,225 | 156,319 | 194,909 | 175,837 | |||||||||||||||
| (b) | Work in process inventories represent mill and leach stockpiles which generally contain lower grade ores that have been extracted from the ore body and are available for copper recovery. For mill stockpiles, recovery is through milling and concentrating. For leach stockpiles, recovery is through exposure to acidic solutions that dissolve copper and deliver it in solution to the extraction processing facilities |
Notes to the financial statementsFinancial Statements(continued)
| 7. | Property, plant and equipment, net |
| (a) | The |
| January 1, 2010 | Additions | Retirements and disposals | Transfers | December 31, 2010 | Additions | Retirements and disposals | Transfers | December 31, 2011 | January 1, 2011 | Additions | Retirements and disposals | Transfers | December 31, 2011 | Additions | Retirements and disposals | Transfers | December 31, 2012 | |||||||||||||||||||||||||||||||||||||||||||||||||||||||
| US$(000) | US$(000) | US$(000) | US$(000) | US$(000) | US$(000) | US$(000) | US$(000) | US$(000) | US$(000) | US$(000) | US$(000) | US$(000) | US$(000) | US$(000) | US$(000) | US$(000) | US$(000) | |||||||||||||||||||||||||||||||||||||||||||||||||||||||
| Cost | ||||||||||||||||||||||||||||||||||||||||||||||||||||||||||||||||||||||||
| Land | 1,497 | - | - | - | 1,497 | - | - | - | 1,497 | 1,497 | - | - | - | 1,497 | - | - | - | 1,497 | ||||||||||||||||||||||||||||||||||||||||||||||||||||||
| Buildings and other constructions | 100,115 | - | (11,557 | ) | 2,484 | 91,042 | - | - | 13,046 | 104,088 | 91,042 | - | - | 13,046 | 104,088 | - | (20 | ) | 25,061 | 129,129 | ||||||||||||||||||||||||||||||||||||||||||||||||||||
| Machinery and equipment | 1,340,344 | - | 11,566 | 95,166 | 1,447,076 | - | (4,667 | ) | 67,916 | 1,510,325 | 1,447,076 | - | (4,667 | ) | 67,916 | 1,510,325 | - | (101 | ) | 240,006 | 1,750,230 | |||||||||||||||||||||||||||||||||||||||||||||||||||
| Transportation units | 8,415 | - | (283 | ) | 717 | 8,849 | - | - | 2,433 | 11,282 | 8,849 | - | - | 2,433 | 11,282 | - | (767 | ) | 1,655 | 12,170 | ||||||||||||||||||||||||||||||||||||||||||||||||||||
| Furniture and fixtures | 786 | - | - | - | 786 | - | - | - | 786 | 786 | - | - | - | 786 | - | - | - | 786 | ||||||||||||||||||||||||||||||||||||||||||||||||||||||
| Other equipment | 9,761 | - | (890 | ) | 2,991 | 11,862 | - | (129 | ) | 737 | 12,470 | 11,862 | - | (129 | ) | 737 | 12,470 | - | (1,046 | ) | 10,283 | 21,707 | ||||||||||||||||||||||||||||||||||||||||||||||||||
| Work in progress and transit units | 48,903 | 122,256 | - | (101,358 | ) | 69,801 | 195,222 | - | (84,132 | ) | 180,891 | |||||||||||||||||||||||||||||||||||||||||||||||||||||||||||||
| Remediation and mine closure costs, note 17(a) | 3,666 | - | - | - | 3,666 | 3,217 | - | - | 6,883 | |||||||||||||||||||||||||||||||||||||||||||||||||||||||||||||||
| Work in progress and transit units (b) | 69,801 | 195,222 | - | (84,132 | ) | 180,891 | 600,872 | - | (277,005 | ) | 504,758 | |||||||||||||||||||||||||||||||||||||||||||||||||||||||||||||
| Remediation and mine closure costs, note 16(a) | 3,666 | 3,217 | - | - | 6,883 | 72,512 | - | - | 79,395 | |||||||||||||||||||||||||||||||||||||||||||||||||||||||||||||||
| 1,513,487 | 122,256 | (1,164 | ) | - | 1,634,579 | 198,439 | (4,796 | ) | - | 1,828,222 | 1,634,579 | 198,439 | (4,796 | ) | - | 1,828,222 | 673,384 | (1,934 | ) | - | 2,499,672 | |||||||||||||||||||||||||||||||||||||||||||||||||||
| Accumulated depreciation | ||||||||||||||||||||||||||||||||||||||||||||||||||||||||||||||||||||||||
| Buildings and other constructions | 23,307 | 2,712 | - | - | 26,019 | 2,786 | - | - | 28,805 | 26,019 | 2,786 | - | - | 28,805 | 2,675 | (17 | ) | - | 31,463 | |||||||||||||||||||||||||||||||||||||||||||||||||||||
| Machinery and equipment | 402,181 | 81,747 | (250 | ) | - | 483,678 | 77,593 | (605 | ) | - | 560,666 | 483,678 | 77,593 | (605 | ) | - | 560,666 | 88,346 | (68 | ) | - | 648,944 | ||||||||||||||||||||||||||||||||||||||||||||||||||
| Transportation units | 6,213 | 619 | (99 | ) | - | 6,733 | 714 | - | - | 7,447 | 6,733 | 714 | - | - | 7,447 | 933 | (767 | ) | - | 7,613 | ||||||||||||||||||||||||||||||||||||||||||||||||||||
| Furniture and fixtures | 437 | 95 | - | - | 532 | 94 | - | - | 626 | 532 | 94 | - | - | 626 | 87 | - | - | 713 | ||||||||||||||||||||||||||||||||||||||||||||||||||||||
| Other equipment | 6,201 | 851 | (624 | ) | - | 6,428 | 1,055 | (129 | ) | - | 7,354 | 6,428 | 1,055 | (129 | ) | - | 7,354 | 1,820 | (1,058 | ) | - | 8,116 | ||||||||||||||||||||||||||||||||||||||||||||||||||
| Remediation and mine closure costs | 2,512 | 32 | - | - | 2,544 | 189 | - | - | 2,733 | 2,544 | 189 | - | - | 2,733 | 381 | - | - | 3,114 | ||||||||||||||||||||||||||||||||||||||||||||||||||||||
| 440,851 | 86,056 | (973 | ) | - | 525,934 | 82,431 | (734 | ) | - | 607,631 | ||||||||||||||||||||||||||||||||||||||||||||||||||||||||||||||
| 525,934 | 82,431 | (734 | ) | - | 607,631 | 94,242 | (1,910 | ) | - | 699,963 | ||||||||||||||||||||||||||||||||||||||||||||||||||||||||||||||
| Net cost | 1,072,636 | 1,108,645 | 1,220,591 | 1,108,645 | 1,220,591 | 1,799,709 | ||||||||||||||||||||||||||||||||||||||||||||||||||||||||||||||||||
| (b) | As of December 31, |
| (c) | The Company maintains insurance on its principal assets in accordance with Management’s policies. |
Notes to the financial statementsFinancial Statements(continued)
| 8. | Trade accounts payable |
Trade accounts payable are mainly originated by the acquisition of materials, supplies and spare parts for the Company’s mining activitiesactivities. As of December 31, 2012, payable balances are related to the Company.Mine Expansion Project, see note 1(b). These obligations are mainly denominated in US dollars, have current maturities and do not accrue interest. No guarantees have been granted (see note 18(f) for a summary of trade accounts payable to affiliates).granted.
| 9. | Workers’ profit sharing |
| (a) |
| December 31, 2011 | December 31, 2010 | January 1, 2010 | ||||||||||
| US$(000) | US$(000) | US$(000) | ||||||||||
| Other accounts payable: | ||||||||||||
| Provision for water plant, see note 17(b) | 5,522 | 56,960 | 73,560 | |||||||||
| Fund in advance received from third parties | 2,204 | 3,184 | 4,001 | |||||||||
| Fund in advance received from clients | - | 22,126 | - | |||||||||
| Voluntary contribution, see note 17(d) | - | 41,081 | 27,608 | |||||||||
| Other (b) | 18,247 | 11,910 | 10,657 | |||||||||
| 25,973 | 135,261 | 115,826 | ||||||||||
| Less: non-current portion of other accounts payable | (1,298 | ) | (2,204 | ) | (39,310 | ) | ||||||
| Other accounts payable, current | 24,675 | 133,057 | 76,516 | |||||||||
| Workers’ profit sharing (c) | 119,711 | 110,065 | 48,254 | |||||||||
| The Legislative Decree N° 892 (L.D. 892), issued in 1996, regulates the right of workers to participate in the company’s profits that |
As described in note 2.3(k), workers’ profit sharing is recognized as operating expense in the statements of comprehensive income. The amount of workers’ profit sharing paid to employees for the years 2011 and 2010 are recognized in cost of sales of goods (see note 14). Additionally, the excess between the Company’s total workers’ profit sharing liability and the amount paid or due to employees for the year amounted to US$21,923,000 for the year 2011 (US$34,427,000 for the year 2010). These amounts have been included in operating expenses in the statements of comprehensive income and will be paid to the Regional Government and FONDOEMPLEO within the period established by law.
| (b) | As described in note 2.3(k), workers’ profit sharing is recognized as an operating expense in the statements of comprehensive income. The amount of workers’ profit sharing paid to employees for the years 2012 and 2011 are recognized as a cost of sales of goods (see note 14). Additionally, the excess between the Company’s total workers’ profit sharing liability and the amount paid or due to employees for the years 2011 and 2010 amounted to US$21,923,000 and US$34,427,000, respectively (in 2012, no excess of worker´s profit sharing was calculated). The amounts for 2011 and 2010 were included as operating expenses in the statements of comprehensive income and were paid to the Regional Government and FONDOEMPLEO within the periods established by law. |
Notes to the financial statementsFinancial Statements(continued)
| 10. | Deferred Income tax |
| (a) | The Company recognizes the effect of temporary differences between the |
| January 1, 2010 | Debit (credit) to the statements of comprehensive income | December 31, 2010 | Debit (credit) to the statements of comprehensive income | December 31, 2011 | ||||||||||||||||||||||||||||||||||||
| US$(000) | US$(000) | US$(000) | US$(000) | US$(000) | January 1, 2011 | Debit (credit) to the statements of comprehensive income | December 31, 2011 | Debit (credit) to the statements of comprehensive income | December 31, 2012 | |||||||||||||||||||||||||||||||
| US$(000) | US$(000) | US$(000) | US$(000) | US$(000) | ||||||||||||||||||||||||||||||||||||
| Income tax | ||||||||||||||||||||||||||||||||||||||||
| Asset | ||||||||||||||||||||||||||||||||||||||||
| Provision for water plant construction | 22,828 | 1,309 | 24,137 | 3,342 | 27,479 | 24,137 | 3,342 | 27,479 | (27,479 | ) | - | |||||||||||||||||||||||||||||
| Price adjustment of copper cathodes and concentrates | - | - | - | 22,577 | 22,577 | |||||||||||||||||||||||||||||||||||
| Price adjustment of cathodes and copper concentrates | - | 22,577 | 22,577 | (22,577 | ) | - | ||||||||||||||||||||||||||||||||||
| Difference in valuation of inventories | 2,707 | (838 | ) | 1,869 | 1,086 | 2,955 | 1,869 | 1,086 | 2,955 | (1,339 | ) | 1,616 | ||||||||||||||||||||||||||||
| Provision for remediation and mine closure | 754 | (44 | ) | 710 | 163 | 873 | 710 | 163 | 873 | 238 | 1,111 | |||||||||||||||||||||||||||||
| Deferred stripping costs | 838 | (107 | ) | 731 | (76 | ) | 655 | 731 | (76 | ) | 655 | (34 | ) | 621 | ||||||||||||||||||||||||||
| Provision generated by the special mining burden | - | - | - | 6,356 | 6,356 | |||||||||||||||||||||||||||||||||||
| Other provisions | 1,829 | (655 | ) | 1,174 | (5,355 | ) | (4,181 | ) | 1,174 | (5,355 | ) | (4,181 | ) | 4,267 | 86 | |||||||||||||||||||||||||
| 28,956 | (335 | ) | 28,621 | 21,737 | 50,358 | 28,621 | 21,737 | 50,358 | (40,568 | ) | 9,790 | |||||||||||||||||||||||||||||
| Liability | ||||||||||||||||||||||||||||||||||||||||
| Difference in depreciation method | 144,376 | 44,804 | 189,180 | 39,677 | 228,857 | 189,180 | 39,677 | 228,857 | 17,681 | 246,538 | ||||||||||||||||||||||||||||||
| Price adjustment of copper cathodes and concentrates | 19,428 | 20,537 | 39,965 | (39,965 | ) | - | ||||||||||||||||||||||||||||||||||
| Price adjustment of cathodes and copper concentrates | 39,965 | (39,965 | ) | - | 3,471 | 3,471 | ||||||||||||||||||||||||||||||||||
| 163,804 | 65,341 | 229,145 | (288 | ) | 228,857 | 229,145 | (288 | ) | 228,857 | 21,152 | 250,009 | |||||||||||||||||||||||||||||
| Deferred liabilities, net | 134,848 | 65,676 | 200,524 | (22,025 | ) | 178,499 | 200,524 | (22,025 | ) | 178,499 | 61,720 | 240,219 | ||||||||||||||||||||||||||||
| Mining taxes, note 12(e) | ||||||||||||||||||||||||||||||||||||||||
| Mining taxes, note 12(d) | ||||||||||||||||||||||||||||||||||||||||
| Deferred asset | ||||||||||||||||||||||||||||||||||||||||
| Price adjustment of copper cathodes and concentrates | - | - | - | (3,637 | ) | (3,637 | ) | |||||||||||||||||||||||||||||||||
| Price adjustment of cathodes and copper concentrates | - | (3,637 | ) | (3,637 | ) | 4,153 | 516 | |||||||||||||||||||||||||||||||||
| Exploration expenses | - | - | - | (190 | ) | (190 | ) | - | (190 | ) | (190 | ) | (302 | ) | (492 | ) | ||||||||||||||||||||||||
| Deferred asset | - | - | - | (3,827 | ) | (3,827 | ) | - | (3,827 | ) | (3,827 | ) | 3,851 | 24 | ||||||||||||||||||||||||||
| Total debited (credited) to the statements of comprehensive income | - | 65,676 | - | (25,852 | ) | - | ||||||||||||||||||||||||||||||||||
| Total deferred income tax liability | 134,848 | 200,524 | 174,672 | |||||||||||||||||||||||||||||||||||||
Notes to the financial statements(continued)
| January 1, 2011 | Debit (credit) to the statements of comprehensive income | December 31, 2011 | Debit (credit) to the statements of comprehensive income | December 31, 2012 | ||||||||||||||||
| US$(000) | US$(000) | US$(000) | US$(000) | US$(000) | ||||||||||||||||
| Total debited (credited) to the statements of comprehensive income | - | (25,852 | ) | - | 65,571 | (b) | - | |||||||||||||
| Total deferred income tax liability | 200,524 | 174,672 | 240,243 | |||||||||||||||||
Notes to the financial statements(continued)
| (b) | For the years ended December 31, 2012, 2011 and 2010, the income tax expense recorded differs from the result of apply the legal rate to the income before income tax of the Company, as |
| 2011 | 2010 | 2012 | 2011 | 2010 | ||||||||||||||||
| US$(000) | US$(000) | US$(000) | US$(000) | US$(000) | ||||||||||||||||
| Income before income tax | 1,562,117 | 1,557,663 | ||||||||||||||||||
| Profit before income tax | 1,215,358 | 1,562,117 | 1,557,663 | |||||||||||||||||
| Income tax rate | 30 | % | 30 | % | 30 | % | 30 | % | 30 | % | ||||||||||
| Income tax expected expense | 468,635 | 467,299 | 364,607 | 468,635 | 467,299 | |||||||||||||||
| Tax effect of expenses that are not deductible in determining taxable profit: | ||||||||||||||||||||
| Effect of change in income tax rate to 32% due to Tax Stability Agreement effective since 2014, note 12(a) | 11,583 | - | - | |||||||||||||||||
| Non deductible expenses | 11,845 | 5,298 | 3,647 | |||||||||||||||||
| Special mining burden (current and deferred) | (28,823 | ) | - | - | ||||||||||||||||
| Voluntary contribution | - | 12,324 | - | - | 12,324 | |||||||||||||||
| Non-deductible expenses | 5,298 | 3,647 | ||||||||||||||||||
| Others | (2,242 | ) | - | - | ||||||||||||||||
| Current and deferred income tax charges to results | 473,933 | 483,270 | 356,970 | 473,933 | 483,270 | |||||||||||||||
| Mining taxes charge to results | 9,785 | - | 86,318 | 9,785 | - | |||||||||||||||
| 483,718 | 483,270 | |||||||||||||||||||
| 443,288 | 483,718 | 483,270 | ||||||||||||||||||
| Effective income tax | 30.97 | % | 31.03 | % | 36.47 | % | 30.97 | % | 31.03 | % | ||||||||||
| (c) | The income tax expenses (benefit) for the years ended December 31, |
| 2011 | 2010 | |||||||||||||||||||
| US$(000) | US$(000) | 2012 | 2011 | 2010 | ||||||||||||||||
| US$(000) | US$(000) | US$(000) | ||||||||||||||||||
| Income tax | ||||||||||||||||||||
| Current | 495,958 | 417,594 | 295,250 | 495,958 | 417,594 | |||||||||||||||
| Deferred | (22,025 | ) | 65,676 | 61,720 | (22,025 | ) | 65,676 | |||||||||||||
| 473,933 | 483,270 | |||||||||||||||||||
| 356,970 | 473,933 | 483,270 | ||||||||||||||||||
| Mining taxes | ||||||||||||||||||||
| Current | 13,612 | - | 82,467 | 13,612 | - | |||||||||||||||
| Deferred | (3,827 | ) | - | 3,851 | (3,827 | ) | - | |||||||||||||
| 9,785 | 483,270 | |||||||||||||||||||
| 86,318 | 9,785 | - | ||||||||||||||||||
| Income tax expense reported in the statements of comprehensive income | 483,718 | 483,270 | 443,288 | 483,718 | 483,270 | |||||||||||||||
Notes to the financial statements(continued)
| 11. | Equity, net |
| (a) |
As of December 31, 2012, 2011 and 2010, the authorized, subscribed and paid-up capital in accordance with the Company’s by-laws and its related modifications was 350,056,012 common shares.
Notes to the financial statements(continued)
According to the shareholders agreement of July 11, 2003, the nominal value of the shares was denominated in US dollars and amount to US$0.54 each. As a consequence of the capitalization of restricted earnings associated with tax benefit (reinvestment credit), in December 2009, the nominal value of the share was increased to US$2.83 each.
As of December 31, 20112012 the quoted price of these shares iswas US$36.0038.00 per share (US$36.00 and US$54.10 per share as of December 31, 2010)2011 and 2010, respectively) and their frequency of trading is daily, as in 2011 and 2010.
As of December 31, 20112012, the Company’s capital stock structure is as follows:
| Percentage of individual interest in capital | Number of shareholders | Total percentage interest | Number of shareholders | Total percentage interest | ||||||||||||
| Up to 1.00 | 3,881 | 6.09 | 3,121 | 5.86 | ||||||||||||
| From 1.01 to 20.00 | 1 | 19.35 | 1 | 19.58 | ||||||||||||
| From 20.01 to 30.00 | 1 | 21.00 | 1 | 21.00 | ||||||||||||
| From 30.01 to 60.00 | 1 | 53.56 | 1 | 53.56 | ||||||||||||
| 3,884 | 100.00 | |||||||||||||||
| 3,124 | 100.00 | |||||||||||||||
| (b) |
In accordance with the Peruvian Companies Act, this reserve is created through the transfer of 10% of the earnings for the year up to a maximum of 20% of the paid-in capital. The legal reserve must be used to compensate for losses, in the absence of non-distributed earnings or non-restricted reserves, and transfers made to compensate for losses must be replaced with future earnings. This reserve may also be used to increase capital stock but the balance must be restored from future earnings.
| (c) | Retained earnings - |
In accordance with the mining stability agreement entered into with the Peruvian Government (see note 12(a)), the Company is authorized to distribute, without any restrictions, all capital invested (except for the retained earnings capitalized in 2009 and dividends), infor US$800,030,000). In addition, dividends and any other form of capital distribution to domestic entities are tax exempt. Since 2003, dividends paid to shareholders, other than domiciled legal entities, are subject to a 4.1% income tax which is withheld and paid by the Company.
Notes to the financial statements(continued)
| (d) | Dividend distribution - |
During 2012 and 2011, the Company did not paidpay dividends.
Notes to the financial statements(continued)
At the Directors’ meeting held on June 15, 2010, it was agreed to pay a dividend of US$400,000,000 (US$1.1427 per common share). Of this amount, US$257,303 corresponds to the retained earnings as of December 31, 2009, and US$142,697,000 was applied to earnings for the year 2010. This dividend was paid to shareholders of record aton July 19, 2010.
At the Directors’ meeting held on November 8, 2010, it was agreed to approve the payment of dividends amounting to US$550,000,000 (US$1.5712 per common share). The total amount of this dividend was applied to retained earnings as of October 31, 2010, and earnings for the year 2010 related to the dividend related to the 2010 period. This dividend was paid to the shareholders inon December 10, 2010.
| 12. | Tax situation |
| (a) | On February 13, 1998, the Company signed an Agreement of Guarantees and Measures to Promote Investments with the Government of Peru, under the Peruvian General Mining Law. Upon approval of the agreement, the Company is subject to the tax regulations in force at May 6, 1996. In addition, the Company has tax stability for a period of fifteen years beginning January 1, 1999 and with a maturity date of December 31, 2013. |
On July 17, 2012, the Company subscribed a new Agreement of Guarantees and Measures to Promote Investments with the Government of Peru, under the General Mining Law and in connection with the Expansion of Cerro Verde´s production mining unit Project, see note 1(b). According to the management´s option, it will be in force in 2014. According to this agreement, from the time it is in force, the new income tax rate will be 32%.
| (b) | The income tax rate applicable to the Company is 30% |
| 2011 | 2010 | |||||||
| US$(000) | US$(000) | |||||||
| Profit before income tax and workers’ profit sharing | 1,705,388 | 1,666,686 | ||||||
| Plus | ||||||||
| Price adjustment of copper cathodes and concentrates | 133,217 | 64,760 | ||||||
| Water plant, Bamputañe dam and voluntary contribution | 13,723 | 45,379 | ||||||
| Price adjustment of copper cathodes and concentrates | 75,257 | - | ||||||
| Non-deductible expenses | 5,502 | 4,354 | ||||||
| Adjustment of inventory in process and finished goods | 3,708 | 11,030 | ||||||
| Other additions, net | 2,999 | 2,867 | ||||||
| 234,406 | 128,390 | |||||||
| Less | ||||||||
| Deduction for recalculate of depreciation at an annual rate of 20% | (147,902 | ) | (149,722 | ) | ||||
| Price adjustment of copper cathodes and concentrates | - | (133,217 | ) | |||||
| (147,902 | ) | (282,939 | ) | |||||
| Sub-total | 1,791,892 | 1,512,137 | ||||||
| Workers’ profit sharing (8%) | (143,351 | ) | (120,971 | ) | ||||
| Net profit | 1,648,541 | 1,391,166 | ||||||
| Income tax (30%) | (494,562 | ) | (417,350 | ) | ||||
| Prior years income taxes | (1,396 | ) | (244 | ) | ||||
| Total current income taxes charged to results, note 10(c) (does not include Special Mining Burden ) | 495,958 | 417,594 | ||||||
Notes to the financial statements(continued)
On September 3 and October 25, 2004; the Company submitted for approval by the MEM, a Reinvestment Program in the amount of US$800,030,000 related to the construction of a sulfide processing facility to be executed in the period between October 2004 and February 2007. On December 9, 2004 through the Ministerial Resolution No. 510-2004-MEM/DM, the MEM approved the Company’s Reinvestment Program application.
Under the terms of the Reinvestment Program, the Company reinvested the earnings obtained in the years 2004 through 2007, totalling approximately US$800,000,000 which resulted in lower income tax expense of approximately US$240,000,000 during those years. According to the requirement of Article N°7 of the Supreme Decree N°07-94-EM, the Company has successfully documented the reinvestment before the MEM.
On October 30, 2009 through Resolution No. 213-2009/MEM-DGM, the MEM approved the execution of the Reinvestment Program from non-distributed earnings of the years 2004, 2005, 2006 and 2007 for an amount of US$800,030,000, after which, according to the requirements of the General Mining Law, the Company capitalized that amount.
Notes to the financial statements(continued)
| 2012 | 2011 | 2010 | ||||||||||
| US$(000) | US$(000) | US$(000) | ||||||||||
| Profit before income tax | 1,215,358 | 1,562,117 | 1,557,663 | |||||||||
| Worker´s profit sharing | 81,708 | 143,271 | 109,023 | |||||||||
| 1,297,066 | 1,705,388 | 1,666,686 | ||||||||||
| Less: | ||||||||||||
| Reversal of price adjustment of copper cathodes and concentrates | (75,257 | ) | 133,217 | 64,760 | ||||||||
| Water treatment plant and voluntary contribution | (91,686 | ) | 13,723 | 45,379 | ||||||||
| Price adjustment of copper cathodes and concentrates | (11,569 | ) | 75,257 | (133,217 | ) | |||||||
| Non deductible expenses | 39,484 | 5,502 | 4,354 | |||||||||
| Special mining burden | (74,891 | ) | - | - | ||||||||
| Adjustment of inventory in process and finished goods | (15,752 | ) | 3,708 | 11,030 | ||||||||
| Deduction to recalculate depreciation at an annual rate of 20% | (5,564 | ) | (147,902 | ) | (149,722 | ) | ||||||
| Other additions, net | (1,478 | ) | 2,999 | 2,867 | ||||||||
| (236,713 | ) | 86,504 | (154,549 | ) | ||||||||
| Sub-total | 1,060,353 | 1,791,892 | 1,512,137 | |||||||||
| Workers’ profit sharing (8%) | (84,828 | ) | (143,351 | ) | (120,971 | ) | ||||||
| Net profit | 975,525 | 1,648,541 | 1,391,166 | |||||||||
| Income tax (30%) | (292,657 | ) | (494,562 | ) | (417,350 | ) | ||||||
| Prior years income taxes | (2,593 | ) | (1,396 | ) | (244 | ) | ||||||
| Total current income taxes charged to results, note 10(c) (does not include Special Mining Burden) | 295,250 | 495,958 | 417,594 | |||||||||
| Peruvian Tax Authorities (SUNAT) have the right to examine, and, if necessary, amend the income tax as determined by the Company during the last four years, calculated from the year following that in which the tax returns are filed. The income tax filings for the years 2002 through |
Notes to the financial statements(continued)
For the periods pending to examine, and due to the many possible interpretations of current legislation, it is not possible to determine whether or not future reviews will result in tax liabilities for the Company. In the event that additional taxes are payable, including interest and surcharges, as a result of the Tax Authority reviews, they will be charged to expense in the period assessed and paid.assessed. However, Inin Management’s and legal advisors’ opinion, any additional tax assessment would not be significant to the financial statements.
| Mining taxes - |
As described in note 2.3(j), Law 29788 was enacted creating a new mining tax and royalty regime in Peru. Because the Company operates under a stability agreement, it is not subject to the revised royalty and special mining tax until its stability agreement expires on December 13, 2013. However, the Company will electelected to pay the special mining tax during the remaining term of its stability agreement. For the yearyears ended December 31, 2012 and 2011, the Company recorded a tax provision of US$82,467,000 and US$13,612,000, respectively,related to the special mining burden. Likewise,Thethe Company has also recognized a relatedan expense and income deferred tax asset amounting to US$3,827,000.3,851,000 and US$3,827,000 during the years 2012 and 2011, respectively.
| On June 23, 2004, Law No.28258 - Mining Royalty Law was approved, and requires the holder of a mineral concession to pay a royalty in return for the exploitation of metallic and non metallic minerals, which is calculated using rates from one to three percent of the value of concentrate or its equivalent according to the international price of the commodity published by the Ministry of Energy and Mines. |
Based on the stability contract described in the literal (a) above, the payment of the mining royalties is not applicable to the Company, because this Law was approved after the Company signed the stability contract with the Peruvian Government. |
Notes to the financial statements(continued)
SUNAT has assessed mining royalties on materials processed by the CompanyCompany´s concentrator plant which commenced operations in late 2006. These assessments cover the period October 2006 to December 2007 and the years 2008 and 2009. SUNAT has issued rulingsresolutions denying the Company’s protest of the assessments.claims. The Company has appealed these decisions and currently has three cases pending before the Peruvian Tax Tribunal. The Company is challenging these royalties because it believes its stability agreement provides an exemption for all minerals extracted from its mining concession, irrespective of the method used for processing those minerals. Although we believe our interpretation of the stability agreement is correct, if the Company is ultimately found responsible for these assessments, the amount of royalty and related interest payable would be significant. SUNAT may continue to assess mining royalties annually until this matter is resolved by the Peruvian Tax Tribunal.
Notes to the financial statements(continued)
| 13. | Sales of goods |
| (a) | For the years ended December 31, 2012, 2011 and 2010, sales of goods are made up of the following: |
| 2011 | 2010 | 2012 | 2011 | 2010 | ||||||||||||||||||||||||||||||||||||
| Pounds(000) | US$(000) | Pounds(000) | US$(000) | Pounds(000) | US$(000) | Pounds(000) | US$(000) | Pounds(000) | US$(000) | |||||||||||||||||||||||||||||||
| (Unaudited) | (Unaudited) | (Unaudited) | (Unaudited) | (Unaudited) | ||||||||||||||||||||||||||||||||||||
| Copper concentrates (b) | 489,314 | 1,637,841 | 472,497 | 1,607,815 | 469,644 | 1,544,647 | 489,314 | 1,637,841 | 472,497 | 1,607,815 | ||||||||||||||||||||||||||||||
| Copper cathodes (b) | 167,562 | 673,956 | 181,885 | 625,827 | 119,077 | 434,290 | 167,562 | 673,956 | 181,885 | 625,827 | ||||||||||||||||||||||||||||||
| Other (primarily silver and molybdenum concentrates) | - | 208,253 | - | 135,346 | - | 148,086 | - | 208,253 | 135,346 | |||||||||||||||||||||||||||||||
| 2,520,050 | 2,368,988 | 2,127,023 | 2,520,050 | 2,368,988 | ||||||||||||||||||||||||||||||||||||
Sales to affiliates totaledrelated parties amounted to US$1,876,906,0001,631,221,000 for the year ended December 31, 20112012 (US$1,876,906,000 and US$1,868,233,000 for the yearyears ended December 31, 2010)2011 and 2010, respectively), which are summarized in note 18(b)17(b).
| (b) | As described in note 2.3(b), the Company’s copper sales are provisionally priced at |
| (c) | The following table shows sales of goods by geographic region based |
| 2011 | 2010 | |||||||
| US$(000) | US$(000) | |||||||
| Asia | 1,351,762 | 1,374,467 | ||||||
| North America | 209,241 | 219,320 | ||||||
| Europe | 513,933 | 483,208 | ||||||
| Peru | 445,114 | 291,993 | ||||||
| 2,520,050 | 2,368,988 | |||||||
| 2012 | 2011 | 2010 | ||||||||||
| US$(000) | US$(000) | US$(000) | ||||||||||
| Asia | 1,267,407 | 1,351,762 | 1,374,467 | |||||||||
| South America (mainly Peru) | 389,613 | 445,114 | 291,993 | |||||||||
| Europe | 378,144 | 513,933 | 483,208 | |||||||||
Notes to the financial statements(continued)
| 2012 | 2011 | 2010 | ||||||||||
| US$(000) | US$(000) | US$(000) | ||||||||||
| North America | 91,859 | 209,241 | 219,320 | |||||||||
| 2,127,023 | 2,520,050 | 2,368,988 | ||||||||||
| (d) | Concentration of sales - |
For the year 2011, 74%2012, 77% of the Company’s sales were to affiliatedrelated entities (Freeport-McMoRan Corporation (“FMC”), Sumitomo Metal Mining Company and Climax Molybdenum, which is a wholly owned subsidiary of FMC) and the rest, with international third parties. For the yearyears 2011 and 2010, 74% and 79% of the Company’s sales were to these affiliatedrelated entities.
For the years ended December 31, 2011 and 2010, cost of sales of goods is made up of the following:
| 2011 | 2010 | |||||||
| US$(000) | US$(000) | |||||||
| Opening balance of finished goods (see note 6) | 16,505 | 5,856 | ||||||
| Materials and supplies | 315,518 | 276,297 | ||||||
| Labor | 134,813 | 79,914 | ||||||
| Worker’s profit sharing | 121,347 | 86,568 | ||||||
| Depreciation and amortization | 84,061 | 87,686 | ||||||
| Energy | 69,259 | 53,001 | ||||||
| Third parties services | 74,202 | 69,350 | ||||||
| Other costs | 43,024 | 32,032 | ||||||
| Variation of inventories in process | (19,121 | ) | (28,240 | ) | ||||
| Ending balance of finished goods (see note 6) | (14,908 | ) | (16,505 | ) | ||||
| 824,700 | 645,959 | |||||||
For the years ended December 31, 2011 and 2010, selling expenses are made up of the following:
| 2011 | 2010 | |||||||
| US$(000) | US$(000) | |||||||
| Concentrate’s freight | 71,397 | 62,789 | ||||||
| Uploading / handling | 7,129 | 6,842 | ||||||
| Commissions and other sale expenses | 3,606 | 3,996 | ||||||
| Cathode’s freight | 1,480 | 3,011 | ||||||
| 83,612 | 76,638 | |||||||
Notes to the financial statements(continued)
For the years ended December 31, 2012, 2011 and 2010, financial incomethe cost of sales of goods is made up of the following:
| 2012 | 2011 | 2010 | ||||||||||
| US$(000) | US$(000) | US$(000) | ||||||||||
| Opening balance of finished goods (see note 6(a)) | 14,908 | 16,505 | 5,856 | |||||||||
| Materials and supplies | 362,382 | 315,518 | 276,297 | |||||||||
| Labor | 110,156 | 134,813 | 79,914 | |||||||||
| Worker’s profit sharing | 81,737 | 121,347 | 86,568 | |||||||||
| Depreciation and amortization | 95,872 | 84,061 | 87,686 | |||||||||
| Energy | 73,136 | 69,259 | 53,001 | |||||||||
| Third parties services | 88,489 | 74,202 | 69,350 | |||||||||
| Management fees (see note 17(a)) | 18,210 | 20,003 | 17,850 | |||||||||
| Other costs | 26,456 | 23,021 | 14,182 | |||||||||
| Variation of inventories in process | (48,099 | ) | (19,121 | ) | (28,240 | ) | ||||||
| Ending balance of finished goods (see note 6(a)) | (21,676 | ) | (14,908 | ) | (16,505 | ) | ||||||
| 801,571 | 824,700 | 645,959 | ||||||||||
| 15. | Selling expenses |
For the years ended December 31, 2012, 2011 and 2010, selling expenses are made up of the following:
| 2011 | 2010 | |||||||
| US$(000) | US$(000) | |||||||
| Financial expenses | ||||||||
| Other financial expenses | 165 | 101 | ||||||
| Financial income | ||||||||
| Gain on fair value of cash equivalents, note 4 | 1,078 | 1,261 | ||||||
| 2012 | 2011 | 2010 | ||||||||||
| US$(000) | US$(000) | US$(000) | ||||||||||
| Concentrate’s freight | 74,816 | 79,097 | 69,631 | |||||||||
| Commissions | 2,759 | 3,035 | 3,996 | |||||||||
| Cathode’s freight | 1,099 | 1,480 | 3,011 | |||||||||
| 78,674 | 83,612 | 76,638 | ||||||||||
| Commitments and contingencies |
| (a) | Environmental matters - |
The Company’s mining and exploration activities are subject to environmental protection standards. In order to comply with these standards, the Company has obtained the approval for the Environment Adequacy Program (“PAMA”) and of the Environmental Impact Studies (EIA), required for the operation of Cerro Verde’s production unit.
Notes to the financial statements(continued)
On October 14, 2003, lawLaw N°28090 was enacted, which regulates the commitments and procedures that entities involved in mining activities must follow in order to prepare, file and implement a mine site closing plan, as well as the respective environmental guarantees that assure compliance with the plan in accordance with protection, conservation and restoration of the environment. On August 15, 2005, the regulations regarding this law were approved. During 2006, in compliance with the mentioned law, the Company completed the closing plans for its mine site. On October 5, 2009 the MEM issued Resolution N°203-2009 MEM – AAA, approving the mine closure plan of the Company.
On September 2012, the company presented to the Ministry of Energy and Mines an updated mine closure plan. Based on this new closure plan, the Company recalculated its mine closure provision (adjustment of US$ 72,512,000 to the asset and liability of the mine closure provision as of this date). See Note 7.
The estimate of remediation and mine closing costs is based on studies prepared by independent consultants, who comply with the current environmental regulations. This provision corresponds mainly to the activities to be performed in order to restore the areas affected by mining activities. The main tasks to be performed include ground removal, revegetation labor and dismantling of plant and equipment.
Notes to the financial statements(continued)
The table below presents the changes in the provision for remediation and mine closure:
| US$(000) | ||||
| Balance as of January 1, 2010 | 3,667 | |||
| Accretion expense | 180 | |||
| Other adjustments | (360 | ) | ||
| Balance as of December 31, 2010 | 3,487 | |||
| Accretion expense | ||||
| Balance as of December 31, 2011 | 7,061 | |||
| Accretion expense | 239 | |||
| Changes in the estimates | 72,512 | |||
| Balance as of December 31, 2012 | 79,812 | |||
According to the Company’s accounting policies, the provision for remediation and mine closure represents the present value of the costs that are expected to be incurred in the closure period of the operating activities of the Company. Closure budgets are reviewed regularly to take into account any significant change in the studies conducted. Nevertheless, the closure costs of mining units will depend on the market prices for the closure works required, which would reflect future economic conditions. Also, the time when the disbursements will be made depends on the useful life of the mine, which will be based on future metals prices.
Notes to the financial statements(continued)
As of December 31, 2012, the future value of the provision for closure of mining units and environmental liabilities was US$145,881,000, which was discounted using the annual risk-free rate of 4.65%, resulting in an updated liability of US$79,812,000 (as of December 31, 2011, the future value of the provision for closure of mining units and environmental liabilities was US$100,481,000 which has beenand was discounted using thean annual risk-free rate of 6.19%, resultingwhich resulted in an updated liability for US$7,061,000). The increase presented in the mine closure plan in 2012 was due to the update of US$7,061,000.costs related to the future closure of PAD 4B and additional deposits for clearing. Additionally, as a result of the Expansion Project, the useful life of the mine and exploration time has been significantly reduced. The Company believesconsiders that this liability is sufficient to meet the current environmental protection laws approved by the MEM.
The Company has issued letters of credit to Ministry of Energy and Mines totalingamounting to US$9,043,00012,838,000 to secure mine closure plans for its mining unit.
| (b) | Water treatment plant - |
On August 2, 2006, the Company and a committee comprised of the civil society and authorities of Arequipa (“the Committee”) signed an agreement by means of which the Company agreed to finance and implement the technical studies and plans necessary to construct a fresh water treatment plant in Alto Cayma and a waste water treatment plant. The agreement established that the costs to be incurred in the construction of the drinking water treatment plant will be assumed by the Company and those of the waste water treatment plant by the municipalities of the province of Arequipa. However, to total cost of both plants will be determined at the end of the construction projects and a final settlement will be required such that each party incurs 50% of the total cost.
Notes to the financial statements(continued)
On September 18, 2009, the Company contracted with Consorcio Alto Cayma (comprised of the following companies: Befesa, Graña y Montero and Aguas de Sevilla) for the design, construction and commissioning of the water treatment plant.
AsOn July 26, 2012, through Municipal Agreement 104-2012, the Company formally transferred the water treatment plant (“PTAP II”) to the Municipality of December 31,the province of Arequipa as a public infrastructure project.
| (c) | Construction of the Waste Water Treatment Plant |
During 2011, the Company estimatescompleted the feasibility study for a total costmajor expansion of approximately US$184,280,000 to construct both plants, of whichits concentrator and leaching facilities (see note 1(b)). As a result, the Company is responsible for 50%, or US$92,140,000. The net present valuedetermined that the project will require the use of this amount as of December 31, 2011 is US$91,570,000, of which US$13,670,000 was recognized in operating expensesadditional water resources apart from those currently used in the statementsconcentrator plant. In order to carry out the project, the Company has offered, to the authorities of comprehensive income for the year 2011 (US$4,300,000 for the year 2010). As of December 31, 2011, US$86,048,000 has been spent on this project.
AsArequipa as part of the obligation assumed byExpansion Project, to finance the Company and as a way to guarantee construction of the plant,waste water treatment plant.
Notes to the financial statements(continued)
In September 2011, the Company established a guaranteed deposit in a local bank forreached an amountagreement with the Regional Government and the Service of S/.150,000,000 (equivalentPotable Water and Serewage of Arequipa S.A. (SEDAPAR), to US$50,000,000finance as part of the deposit date in September 2008). In April 2009, the soles deposit was replaced with US dollar funds. As of December 31, 2010, and January 1, 2010, the balance of this account was US$19,002,000 and US$49,535,000 respectively, which was recorded in other assets in the statement of financial position. During 2011, the balance of this account was fully spent and the Company has not maintained additional guarantees relating to this commitment as the majority of disbursements have been made.
Refer to note 17(e) below for further discussion of the Company’s agreement to financeexpansion project, the engineering and construction of athe waste water treatment plant should it proceed with its large-scaleof Arequipa, which will be used by the Company to supplement existing water supplies to support the potential concentrator expansion. In December 2012, the Company received approval of the Environmental Impact Study from the Peruvian Ministry of Energy and Mines.
| Construction of Bamputañe Dam - |
On December 29, 2004, the Company signed an electric power supply agreement with Empresa de Generación Eléctrica de Arequipa S.A. (“EGASA”) for attending part of its mining operations. Under this agreement, EGASA committed to supply electricity at a fixed commodity price for the period January 1, 2007 to December 31, 2015, and the Company committed to construct the Bamputañe Dam located in the Santa Lucía district, in the province of Lampa, in the department of Puno, Peru. At that date, the construction budget related to the project was estimated to be US$5,000,000. On June 11, 2008, EGASA and the Company signed an addendum to the contract for the construction of the Bamputañe Dam, in which the parties recognized and declared that the Bamputañe Dam construction budget would be significantly higher than amount estimated initially. The updated construction budget was estimated at approximately US$14,000,000.
Notes to the financial statements(continued)
On December 1, 2009, the Company formally transferred the Bamputañe Dam to EGASA, and the final cost of the dam totaledamounted to US$11,390,000. This agreement allows the Company to obtain electrical energy at a fixed rate during a period of nine years. Accordingly, the Company recognized a future economic benefit and disbursements forrelated to the construction of the Bamputañe Dam as an intangible asset in the statement of financial position, which is being amortized over the nine year term of the contract.
As of December 31, 2011,2012, the Company’s intangible asset, net of its amortization, for the future benefit of the supply of electrical energy at fixed prices is US$4,890,000 (US$6,519,000 (US$8,149,000 as of December 31, 20102011. During years 2012 and US$9,779,000 as of January 1, 2010). During each of the years 2011, and 2010, the Company recognized an amount of US$1,630,000 for each year related to the amortization in the statements of comprehensive income.
| Voluntary contribution of 3.75% of net income - |
On December 21, 2006, the Peruvian Government released Supreme Decree 071-2006-EM regulating the terms and conditions under which a voluntary contribution would be paid annually by mining companies in Peru. Under this regulation, the Peruvian government established the requirements for the agreements that would be negotiated individually by the mining companies. This regulation established that the contribution:
Notes to the financial statements(continued)
| (i) | Was equivalent to 3.75% of net income, |
| (ii) | Was paid for 2006 and the subsequent four years, dependent on the level of international metal prices, and |
| (iii) | Was not tax deductible. |
The rate of the voluntary contribution was broken down as follows:
| - | 2.75% for the Local Mining Fund |
| - | 1.00% for the Regional Mining Fund |
On November 8, 2007 the Company signed the contract of voluntary contribution with the Peruvian State, which complied with the requirements described previously and covered the five year period from 2006 through 2010. Total voluntary contributions paid by the company under this contract were US$146,859,000 (which included contributions of US$41,081,000 for the year 2010 which has been reflected in operating expenses in the statements of comprehensive income).
As of December 31, 2011, throughThrough Supreme Decree 071-2006-ME, this contract has expired, and, therefore the Company did not recognize any voluntary contributions expense for the yearyears 2012 and 2011. In Management’s opinion, the Company has met all requirements set in the mentioned Supreme Decree 071-2006-ME and has no further obligations or commitments.
Notes to the financial statements(continued)
In September 2011, the Company reached agreement with the Regional and Central Government, the Service of Potable Water and Sewerage of Arequipa S.A.(“SEDAPAR”), other governmental officials, which allows the Company to finance the engineering and construction of the waste water treatment plant of Arequipa, should the Company proceed with the expansion project. Once the Company obtains a license for the treated water, it would be used by the Company to supplement existing water supplies to support the potential concentrator expansion.
| Transactions with |
| (a) | On June 1, 2005, the Company and Minera Freeport–McMoRan South America S.A.C. |
Notes to the financial statements(continued)
| (b) | During the years ended December 31, 2012, 2011 and 2010, the Company recognized the following sales of goods to |
| 2011 | 2010 | 2012 | 2011 | 2010 | ||||||||||||||||
| US$(000) | US$(000) | US$(000) | US$(000) | US$(000) | ||||||||||||||||
| Sales of goods to affiliates | ||||||||||||||||||||
| Sales of goods to related parties | ||||||||||||||||||||
| Freeport-McMoRan Corporation (c) | 1,004,362 | 1,044,811 | 845,417 | 1,004,362 | 1,044,811 | |||||||||||||||
| Sumitomo Metal Mining Company, Ltd. (d) | 729,446 | 716,740 | 693,945 | 729,446 | 716,740 | |||||||||||||||
| Climax Molybdenum Marketing Corporation (e) | 143,098 | 106,682 | 91,859 | 143,098 | 106,682 | |||||||||||||||
| Total revenues | 1,876,906 | 1,868,233 | 1,631,221 | 1,876,906 | 1,868,233 | |||||||||||||||
| (c) | On October 15, 2006, the Company signed a long-term contract with FMC through in which it committed to sell 20% of its annual copper concentrate production from its primary |
NotesThe Company also sells copper cathodes based on availability. According to the financial statements(continued)terms of the sales of copper cathodes to FMC, agreements are made for each shipment. For the year 2012, sales of copper cathodes to FMC amounted to US$98,696,000 (US$314,549,000 and US$318,948,000 in 2011 and 2010, respectively).
| (d) | On June 1, 2005, the Company signed a long-term agreement with Sumitomo Metal Mining Company Ltd., |
| (e) | On October 1, 2006, the Company signed a long-term agreement with Climax Molybdenum Marketing Corporation, a wholly owned subsidiary of FMC, |
| (f) | As a result of sales of goods to |
| December 31, 2011 | December 31, 2010 | January 1, 2010 | ||||||||||
| US$(000) | US$(000) | US$(000) | ||||||||||
| Accounts receivable from affiliates | ||||||||||||
| Sumitomo Metal Mining Company, Ltd. | 104,581 | 86,691 | 114,061 | |||||||||
| Freeport - McMoRan Corporation | 91,582 | 195,250 | 98,615 | |||||||||
| Climax Molybdenum Marketing Corporation | 3,168 | 8,767 | 3,886 | |||||||||
| Minera Phelps Dodge S.A.C. | - | 1 | - | |||||||||
| 199,331 | 290,709 | 216,562 | ||||||||||
| Accounts payable to affiliates | ||||||||||||
| Freeport - McMoRan Sales Company | 1,424 | 1,530 | 1,279 | |||||||||
| Minera Freeport – McMoRan South America S.A.C. | 1,103 | 1,679 | 1,386 | |||||||||
| Freeport - McMoRan Corporation | 871 | 641 | 42 | |||||||||
| Freeport McMoRan South America Inc. Agencia en Chile | 17 | 1 | - | |||||||||
| Compañía Contractual Minera Candelaria | - | - | 12 | |||||||||
| 3,415 | 3,851 | 2,719 | ||||||||||
Notes to the financial statements(continued)
| 2012 | 2011 | |||||||
| US$(000) | US$(000) | |||||||
| Accounts receivable from related parties | ||||||||
| Freeport - McMoRan Corporation | 203,644 | 91,582 | ||||||
| Sumitomo Metal Mining Company, Ltd. | 108,507 | 104,581 | ||||||
| Climax Molybdenum Marketing Corporation | 6,411 | 3,168 | ||||||
| 318,562 | 199,331 | |||||||
| Accounts payable to related parties | ||||||||
| Freeport - McMoRan Corporation | 3,844 | 871 | ||||||
| Minera Freeport – McMoRan South America S.A.C. | 2,795 | 1,103 | ||||||
| Freeport - McMoRan Sales Company | 1,442 | 1,424 | ||||||
| Freeport McMoRan South America Inc. Chilean Agency | - | 17 | ||||||
| 8,081 | 3,415 | |||||||
Terms and transaction with related parties -
Transactions with related parties are made at normal market prices.Outstanding balances at year-end are unsecured, interest free and settlement occurs in cash. There have been no guarantees providedreceived or receivedprovided for any accounts receivables from affiliates.receivable or payable to related parties.As of December 31, 20112012 and 2010, and January 1, 2010,2011,the Company had not recorded any impairment of accounts receivables from affiliates.related parties.
| Earnings per share |
Basic earnings per share are computed by dividing net earnings for the period by the weighted average number of shares outstanding during the year. Basic and diluted earnings per common share have been determined as follows:
| 2011 | 2010 | 2012 | 2011 | 2010 | ||||||||||||||||
| Profit for the year | 1,078,399,000 | 1,074,393,000 | ||||||||||||||||||
| Net profit for the year | US$772,070,000 | US$1,078,399,000 | US$1,074,393,000 | |||||||||||||||||
| Weighted average number of shares outstanding | 350,056,012 | 350,056,012 | 350,056,012 | 350,056,012 | 350,056,012 | |||||||||||||||
| Basic and diluted earnings per share | US$ | 3.08 | US$ | 3.07 | US$2.21 | US$3.08 | US$3.07 | |||||||||||||
Basic and diluted earnings per share are calculated by dividing earningsthe net profit of the period by the weighted-average number of outstanding shares for the year.
Notes to the financial statements(continued)
| Embedded derivative |
As is indicated in note 2.3 (b), the exposure to the risk of changes in the market prices of copper and molybdenum is considered as an embedded derivative and it is related to market contracts signed with the customers.commercial contracts. As of December 31, 20112012 and 2010, and January 1, 2010,2011, provisional prices of the estimated future prices (in copper and molybdenum pounds) and their final maturity periods were as follow:
| As of December 31, 2012 | ||||||||||||||||||||||||||||||
| As of December 31, 2011 | Pounds payable (000) | Maturity | Provisional pricing | Forward pricing | Fair value | |||||||||||||||||||||||||
| Pounds payable (000) | Maturity | Provisional pricing | Forward pricing | Fair value | US$ | US$ | US$(000) | |||||||||||||||||||||||
| US$ | US$ | US$(000) | ||||||||||||||||||||||||||||
| Copper: | ||||||||||||||||||||||||||||||
| Concentrate | 234,084 | January - April 2012 | Between 3.156 and 4.410 | Between 3.156 and 3.449 | (68,638 | ) | 218,571 | January – May 2013 | Between 3.398 and 3.611 | Between 3.589 and 3.602 | 11,583 | |||||||||||||||||||
| Cathode | 4,247 | January 2012 | Between 3.449 and 3.489 | Between 3.445 and 3.447 | 11 | |||||||||||||||||||||||||
| Molybdenum | 6,381 | January – February 2012 | Between 12.159 and 15.501 | Between 12.182 and 15.501 | (6,630 | ) | 3,125 | January – February 2013 | Between 10.853 and 13.222 | Between 10.963 and 11.800 | (14 | ) | ||||||||||||||||||
| (75,257 | ) | 11,569 | ||||||||||||||||||||||||||||
| As of December 31, 2010 | ||||||||||||||
| Pounds payable (000) | Maturity | Provisional pricing | Forward pricing | Fair Value | ||||||||||
| US$ | US$ | US$(000) | ||||||||||||
| Copper: | ||||||||||||||
| Concentrate | 210,349 | January – April 2011 | Between 3.50 and 4.07 | Between 4.35 and 4.37 | 127,220 | |||||||||
| Cathode | 7,715 | January 2011 | 4.11 | 4.37 | 3,297 | |||||||||
| Molybdenum | 4,645 | January – February 2011 | Up to 14.94 | 16.40 | 2,700 | |||||||||
| 133,217 | ||||||||||||||
| As of December 31, 2011 | ||||||||||||||||||||||||||||||
| As of January 1, 2010 | Pounds payable (000) | Maturity | Provisional pricing | Forward pricing | Fair value | |||||||||||||||||||||||||
| Pounds payable (000) | Maturity | Provisional pricing | Forward pricing | Fair Value | US$ | US$ | US$(000) | |||||||||||||||||||||||
| US$ | US$ | US$(000) | ||||||||||||||||||||||||||||
| Copper: | ||||||||||||||||||||||||||||||
| Concentrate | 141,112 | January – May 2010 | Between 2.83 and 3.17 | Between 3.34 and 3.35 | 61,914 | 234,084 | January - April 2012 | Between 3.156 and 4.410 | Between 3.156 and 3.449 | (68,638 | ) | |||||||||||||||||||
| Cathode | 14,329 | January 2010 | 3.14 | 3.33 | 2,787 | 4,247 | January 2012 | Between 3.449 and 3.489 | Between 3.445 and 3.447 | 11 | ||||||||||||||||||||
| Molybdenum | 389 | January 2010 | 10.97 | 11.75 | 59 | 6,381 | January – February 2012 | Between 12.159 and 15.501 | Between 12.182 and 15.501 | (6,630 | ) | |||||||||||||||||||
| 64,760 | (75,257 | ) | ||||||||||||||||||||||||||||
The final pricing thatestimated by the Company estimated as of December 31, 20112012 and 2010, and as of January 1, 20102011 were based on LME information.
Notes to the financial statements(continued)
| Financial risk management |
The Company’s activities are exposed to different financial risks, the main risks that could adversely affect the Company’s financial assets and liabilities or future cash flows are: the risk arising from changes in market prices of minerals, interest rate risk, liquidity risk, credit risk and capital risk. The Company’s financial risk management program focuses on mitigating potential adverse effects on its financial performance.
Management knows the conditions prevailing in the market and based on its knowledge and experience, reviews and manages the risks which are summarized below. Board of Directors reviews and approves the policies to manage each of these risks.
| (a) | Market risk - |
Commodity price risk -
The international prices of copper and molybdenum have a significant impact on the Company’s operating results. The price of copper and molybdenum has fluctuated historically and is affected by numerous factors beyond the Company’s control. The Company manages this risk through the use of sales commitments with customers. The Company does not hedge its exposure to price fluctuation.
Embedded derivative –
As described in note 2.3 (b), the Company has price risk through its provisionally priced sales contracts, which provide final pricing in a specified future month (generally three months from the shipmentarrival date) based primarily on quoted LME monthly average prices. The Company receives market prices based on prices in the specified future period, which results in price fluctuations recorded through revenues until the date of settlement. The Company records revenues and invoices customerscommercial at the time of shipment, based on then-currentthe current LME prices, which results in an embedded derivative on the provisionally priced contractcontracts that isare adjusted to fair value through revenues each period, using the period-end forward prices, until the date of final pricing. To the extent that final prices are higher or lower than what was recorded on a provisional basis, an increase or decrease toin revenues is recorded at each reporting period until the date of final pricing.
The table below summarizes the effect on profit before income tax and workers’ profit sharing caused by changes in the copper and molybdenum price. This analysis is based on the assumption that the copper price has increased or decreased by 10% while all other variables are held constant. The 20112012 positive scenario uses prices between US$/pound 3.783.95 to 3.803.96 (US$/pound 4.793.78 to US$/pound 4.813.80 in the year 2010)2011); whereas the negative scenario uses prices between US$/Lb 3.093.23 to 3.113.24 (US$/Lb 3.92pound 3.09 to US$/pound 3.943.11 in the year 2010)2011).
Notes to the financial statements(continued)
| Effect on profit before income tax | ||||
| US$(000) | ||||
| December 31, | ||||
| Increase in copper and molybdenum international quotes | ||||
| Decrease in copper and molybdenum international quotes | ( | ) | ||
Exchange rate risk –
As described in note 2.3(a), the Company’s financial statements are presented in US dollars, which is the functional and presentation currency of the Company. The Company exchange-rate risk arises mainly from deposits, taxes, compensation and other accounts payable in currencies other than the US dollar, principallymainly Nuevos Soles. The Company mitigates its exposure to exchange-rate risk by carrying out almost all of its transactions in its functional currency and Management maintains only small amounts in Nuevos Soles to cover its immediate needs in this currency (i.e., taxes and compensation) in this currency..
During 2011,2012, the Company has recorded net gains net from exchange differences of US$1,9243,149,000 (net gaingains of US$6691,924,000 and US$669,000 during the year 2010)years 2011 and 2010, respectively), from the translation of balances in Nuevos Soles to the US dollar.dollars.
| (b) | Liquidity risk - |
Liquidity risk arises from situations in which cash might not be available to pay obligations when they become due. The Company maintains adequate liquidity by properly managing the maturities of assets and liabilities in such way that allows the Company to maintain a structural liquidity position (cash available) enabling it to meet liquidity requirements properly. Cerro Verde sells cathode and copper and molybdenum concentrates to recognized companies in the mining sector worldwide. In addition, the Company currently has the possibility to obtain funds from financial institutions if it is required to meet its contractual obligations.
Notes to the financial statements(continued)
The following tables show the expected aging of maturity of the Company’s obligations atas of December 31, 2012 and 2011:
| On demand | Less than 3 months | 3 to 12 months | 1 to 5 years | Total | ||||||||||||||||
| US$(000) | US$(000) | US$(000) | US$(000) | US$(000) | ||||||||||||||||
| As of December 31, 2011 | ||||||||||||||||||||
| Trade accounts payable | - | 44,177 | 11,773 | - | 55,950 | |||||||||||||||
| Embedded derivate | - | 74,370 | 887 | - | 75,257 | |||||||||||||||
| Other accounts payable | - | 18,239 | 9,851 | 1,298 | 29,388 | |||||||||||||||
| Total | - | 136,786 | 22,511 | 1,298 | 160,595 | |||||||||||||||
| On demand | Less than 3 months | 3 to 12 months | 1 to 5 years | Total | ||||||||||||||||
| US$(000) | US$(000) | US$(000) | US$(000) | US$(000) | ||||||||||||||||
| As of December 31, 2010 | ||||||||||||||||||||
| Trade accounts payable | - | 55,489 | 11,887 | - | 67,376 | |||||||||||||||
| Other accounts payable | - | 34,597 | 102,311 | 2,204 | 139,112 | |||||||||||||||
| Total | - | 90,086 | 114,198 | 2,204 | 206,488 | |||||||||||||||
| On demand | Less than 3 months | 3 to 12 months | 1 to 5 years | Total | ||||||||||||||||
| US$(000) | US$(000) | US$(000) | US$(000) | US$(000) | ||||||||||||||||
| As of January 1, 2010 | ||||||||||||||||||||
| Trade accounts payable | - | 38,167 | 1,631 | - | 39,798 | |||||||||||||||
| Other accounts payable | - | 10,532 | 68,703 | 39,310 | 118,545 | |||||||||||||||
| Total | - | 48,699 | 70,334 | 39,310 | 158,343 | |||||||||||||||
| On demand | Less than 3 months | 3 to 12 months | 1 to 5 years | Total | ||||||||||||||||
| US$(000) | US$(000) | US$(000) | US$(000) | US$(000) | ||||||||||||||||
| As of December 31, 2012 | ||||||||||||||||||||
| Trade accounts payable | - | 146,354 | - | - | 146,354 | |||||||||||||||
| Other accounts payable | - | 27,671 | 1,265 | 540 | 29,476 | |||||||||||||||
| Total | - | 174,025 | 1,265 | 540 | 175,830 | |||||||||||||||
| As of December 31, 2011 | ||||||||||||||||||||
| Trade accounts payable | - | 44,177 | 11,773 | - | 55,950 | |||||||||||||||
| Embedded derivate | - | 74,370 | 887 | - | 75,257 | |||||||||||||||
| Other accounts payable | - | 18,239 | 9,851 | 1,298 | 29,388 | |||||||||||||||
| Total | - | 136,786 | 22,511 | 1,298 | 160,595 | |||||||||||||||
Notes to the financial statements(continued)
| (c) | Credit Risk - |
The Company’s exposure to credit risk arises from a customer’s inability to pay amounts in full when they are due and the failure of third parties in transactions of cash and cash equivalent transactions, which is limited to balances deposited in banks and financial institutions and for trade accounts receivable at the date of the statement of financial position. To manage this risk, the Company has an established treasury policy, which only allows the deposit of surplus funds in highly rated institutions, by establishing conservative credit policies and through a constant evaluation of market conditions. Consequently, the Company does not expect to incur in losses on accounts involving potential credit risks.
The concentration of credit risk also exists when economic changes occur, in industry or geography that affects third parties in the same way. The Company’s customer portfolio is primarily three customers, which are related companies with solid financial structures.
The credit risk is limited to the book value of financial assets on the statement of financial position date, which consists primarilymainly of cash and cash equivalents, trade accounts receivable from third parties and trade accounts receivable from affiliates.related parties. The Company hasdoes not hedgeduse derivative instruments to hedge its exposure to credit risk.
| (d) | Capital management - |
The objective is to safeguard the Company’s ability to continue as a going concern in order to provide returns for shareholders and benefits for stakeholders and maintain an optimal structure that would reduce the cost of capital.
The Company manages its capital structure and makes adjustments to it, in light of changes in economic conditions. To maintain or adjust the capital structure, the Company controls dividend payments to shareholders, the return of capital to shareholders and the issue of new shares. No changes were made in the objectives, policies or processes during the years ended December 31, 20112012 and 2010.2011.
| Mineral reserves (unaudited) |
As of December 31, 20112012 and 2010,2011, the Company’s proven and probable mineral reserves were:
| MT (000) | Grade | |||||||||||||||
| December 31, 2011 | December 31, 2010 | December 31, 2011 | December 31, 2010 | |||||||||||||
| Mineral for leaching | 224,541 | 243,213 | 0.40 | 0.41 | ||||||||||||
| Mineral for milling | 3,752,670 | 3,328,318 | 0.39 | 0.40 | ||||||||||||
| MT (000) | Grade | |||||||||||||||
| 2012 | 2011 | 2012 | 2011 | |||||||||||||
| Mineral for leaching | 202,153 | 224,541 | 0.34 | 0.40 | ||||||||||||
| Mineral for milling | 3,992,384 | 3,752,670 | 0.38 | 0.39 | ||||||||||||
Notes to the financial statements(continued)
Copper production in thousands of recoverable pounds for the years ended December 31, 20112012 and 20102011 was as follow:
| 2011 | 2010 | 2012 | 2011 | |||||||||||||
| Cathodes | 166,017 | 183,426 | 118,703 | 166,017 | ||||||||||||
| Concentrate | 481,217 | 483,937 | ||||||||||||||
| Concentrates | 475,771 | 481,217 | ||||||||||||||
Average LME price per metric ton of copper for the yearyears ended December 31, 20112012 and 2010,2011, was as follows:
| 2011 | 2010 | |||||||
| US$/MT | US$/MT | |||||||
| Copper | 8,821 | 7,539 | ||||||
| 2012 | 2011 | |||||||
| US$/MT | US$/MT | |||||||
| Copper | 7,950 | 8,821 | ||||||