UNITED STATES
SECURITIES AND EXCHANGE COMMISSION
WASHINGTON, D.C. 20549
FORM 20-F
(Mark One)
| ¨ | REGISTRATION STATEMENT PURSUANT TO SECTION 12(b) OR (g) OF THE SECURITIES EXCHANGE ACT OF 1934 |
OR
| x | ANNUAL REPORT PURSUANT TO SECTION 13 OR 15(d) OF THE SECURITIES EXCHANGE ACT OF 1934 |
For the fiscal year ended June 30, 20122014
OR
| ¨ | TRANSITION REPORT PURSUANT TO SECTION 13 OR 15(d) OF THE SECURITIES EXCHANGE ACT OF 1934 |
For the transition periodfrom ___________ to ___________.___________.
OR
| ¨ | SHELL COMPANY REPORT PURSUANT TO SECTION 13 OR 15(d) OF THE SECURITIES EXCHANGE ACT OF 1934 |
Date of event requiring this shell company report _________________________
Commission file number:001-33602
HOLLYSYS AUTOMATION TECHNOLOGIES LTD.
(Exact name of Registrant as specified in its charter)
Not Applicable
(Translation of Registrant’s name into English)
British Virgin Islands
(Jurisdiction of incorporation or organization)
No. 2 Disheng Middle Road,
Beijing Economic-Technological Development Area,
Beijing, P. R. China 100176
(Address of principal executive offices)
Jennifer Zhang, Tel: (86 10) 5898 1386, Email:zhangqiuju@hollysys.com
Address: No. 2 Disheng Middle Road, Beijing Economic-Technological Development Area, Beijing, P.R. China 100176
(Name, Telephone, E-mail and/or Facsimile number and Address of Company Contact Person)
Securities registered or to be registered pursuant to Section 12(b) of the Act.
| Title of each class | Name of each exchange on which registered | |
| Ordinary Shares, $0.001 par value per share | The NASDAQ Global Select Market |
Securities registered or to be registered pursuant to Section 12(g) of the Act.
None
(Title of Class)
Securities for which there is a reporting obligation pursuant to Section 15(d) of the Act.
None
Indicate the number of outstanding shares of each of the issuer’s classes of capital or ordinary shares as of the close of the period covered by the annual report (June 30, 2012)2014): 55,998,917[57,554,824] ordinary shares.
Indicate by check mark if the registrant is a well-known seasoned issuer, as defined in Rule 405 of the Securities Act. xYes ¨YesxNo
If this report is an annual or transition report, indicate by check mark if the registrant is not required to file reports pursuant to Section 13 or 15(d) of the Securities Exchange Act of 1934. ¨Yesx No
Indicate by check mark whether the registrant (1) has filed all reports required to be filed by Section 13 or 15(d) of the Securities Exchange Act of 1934 during the preceding 12 months (or for such shorter period that the registrant was required to file such reports), and (2) has been subject to such filing requirements for the past 90 days.xYes¨ No
Indicate by check mark whether the registrant has submitted electronically and posted on its corporate Web site, if any, every Interactive Data File required to be submitted and posted pursuant to Rule 405 of Regulation S-T (§232.405 of this chapter) during the preceding 12 months (or for such shorter period that the registrant was required to submit and post such files).x Yes ¨ No
Indicate by check mark whether the registrant is a large accelerated filer, an accelerated filer, or a non-accelerated filer.
Large accelerated filer¨x Accelerated filerx¨ Non-accelerated filer¨
Indicate by check mark which basis of accounting the registrant has used to prepare the financial statements included in this filing:
| U.S. GAAPx | International Financial Reporting Standards as issued by the International Accounting Standards Board¨ | Other¨ |
If “Other” has been checked in response to the previous question, indicate by check mark which financial statement item the registrant has elected to follow.
¨ Item 17 ¨ Item 18
If this is an annual report, indicate by check mark whether the registrant is a shell company (as defined in Rule 12b-2 of the Exchange Act).¨Yes x No
HOLLYSYS AUTOMATION TECHNOLOGIES LTD.
ANNUAL REPORT ON FORM 20-F
FOR THE FISCAL YEAR ENDED JUNE 30, 20122014
TABLE OF CONTENTS
| ITEM 16F. | CHANGE IN REGISTRANT’S CERTIFYING ACCOUNTANT | 91 |
| ITEM | ||
| ITEM | ||
| PART III | ||
| FINANCIAL STATEMENTS | 92 | |
| ITEM | FINANCIAL STATEMENTS | |
| ITEM 19. | EXHIBITS | |
USE OF CERTAIN DEFINED TERMS
Except as otherwise indicated by the context, references in this annual report to:
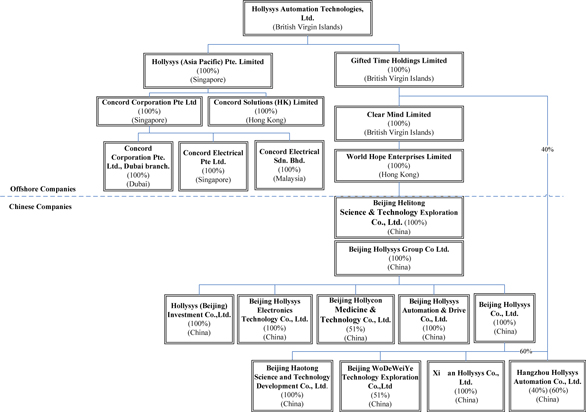
| · | “Hollysys” “we,” “us,” or “our,” and the “Company,” are references to the combined business of Hollysys Automation Technologies Ltd., a BVI company, and its consolidated subsidiaries, HI, HAP, HAIP, Bond, Concord, CSHK, CDME, GTH, Clear Mind, World Hope, Helitong, |
| · | “HI” are references to Hollysys International Pte. Limited, a Singapore company; |
| · | “HAP” are references to Hollysys (Asia Pacific) Pte. Limited, a Singapore company; |
| · | “HAIP” are references to Hollysys Automation India Private Limited, an India Company; |
| · | “Concord” are references to a group of our Singapore |
| · | “CSHK” are references to |
| · | “CMDE” are references to Concord M Design and Engineering Company Limited, a Macau company; |
| · | “Bond” are references to a group of our Southeastern Asia subsidiaries, including Bond Corporation Pte. Ltd., a Singapore company (“BCPL”), Bond M&E Pte. Ltd., a Singapore Company (“BMSG”), Bond M&E Sdn. Bhd., a Malaysia company (“BMJB”), and Bond M&E (K.L.) Sdn. Bhd.,a Malaysia company (“BMKL”); |
| · | “GTH” are references to Gifted Time Holdings Limited, a BVI company; |
| · | “Clear Mind” are references to Clear Mind Limited, a BVI company; |
| · | “World Hope” are references to World Hope Enterprises Limited, a Hong Kong company; |
| · | “Helitong” are references Beijing Helitong Science & Technology Exploration Co., Ltd.; |
| · | “ |
| · | “Hangzhou Hollysys” are references to Hangzhou Hollysys Automation Co., Ltd. |
| · | “Hangzhou System” are references to Hangzhou Hollysys System Engineering Co., Ltd., a PRC company; |
| · | “Hollysys A&D” are references to Beijing Hollysys Automation & Drive Co., Ltd. |
| · | “Beijing Hollysys” are references to Beijing Hollysys Co., Ltd. |
| · | “Hollysys Electronics” are references to Beijing Hollysys Electronics Technology Co., Ltd. |
| · | “Hollycon” are references to Beijing Hollycon Medicine & Technology. Co., Ltd. |
| · | “Haotong” are references to Beijing Haotong Science and Technology Development Co., Ltd. |
| · | “Xi’an Hollysys” are references to Xi’an Hollysys Co., |
| · | “Hollysys Investment” are references to Hollysys (Beijing) Investment Co., Ltd. |
| · | “ |
| · | “BVI” are references to the British Virgin Islands; |
| · | “China” and “PRC” are references to the People’s Republic of |
| · | “Hong Kong” are references to the Hong Kong Special Administrative Region of China; |
| · | “Macau” are references to the Macau Special Administrative Region of China; |
| · | “Exchange Act” are references to the Securities Exchange Act of 1934, as amended; and |
| · | “Securities Act,” are references to the Securities Act of 1933, as amended. |
FORWARD-LOOKING INFORMATION
This annual report contains forward-looking statements and information relating to us that are based on the current beliefs, expectations, assumptions, estimates and projections of our management regarding our company and industry. When used in this annual report, the words “may”, “will”, “anticipate”, “believe”, “estimate”, “expect”, “intend”, “plan” and similar expressions, as they relate to us or our management, are intended to identify forward-looking statements. These statements reflect management's current view of us concerning future events and are subject to certain risks, uncertainties and assumptions, including among many others: our potential inability to achieve similar growth in future periods as we did historically, a decrease in the availability of our raw materials, the emergence of additional competing technologies, changes in domestic and foreign laws, regulations and taxes, changes in economic conditions, uncertainties related to China’s legal system and economic, political and social events in China, the volatility of the securities markets, and other risks and uncertainties which are generally set forth under the heading, “Key information — Risk Factors” and elsewhere in this annual report. Should any of these risks or uncertainties materialize, or should the underlying assumptions about our business and the commercial markets in which we operate prove incorrect, actual results may vary materially from those described as anticipated, estimated or expected in this annual report.
All forward-looking statements included herein attributable to us or other parties or any person acting on our behalf are expressly qualified in their entirety by the cautionary statements contained or referred to in this section. Except to the extent required by applicable laws and regulations, we undertake no obligations to update these forward-looking statements to reflect events or circumstances after the date of this annual report or to reflect the occurrence of unanticipated events.
| ITEM 1. | IDENTITY OF DIRECTORS, SENIOR MANAGEMENT AND ADVISERS |
Not applicable.
| ITEM 2. | OFFER STATISTICS AND EXPECTED TIMETABLE |
Not applicable.
| ITEM 3. | KEY INFORMATION |
A. Selected Consolidated Financial Data
The following table presents selected financial data regarding our business. It should be read in conjunction with our consolidated financial statements and related notes contained elsewhere in this annual report and the information under Item 5, “Operating and Financial Review and Prospects.” The selected consolidated statement of comprehensive income data for the fiscal years ended June 30, 2010, 20112012, 2013 and 20122014 and the consolidated balance sheet data as of June 30, 20112013 and 20122014 have been derived from the audited consolidated financial statements of Hollysys that are included in this annual report beginning on page F-1. The selected statement of comprehensive income data for the fiscal years ended June 30, 20082010 and 2009,2011, and balance sheet data as of June 30, 2008, 20092010, 2011 and 20102012 have been derived from our audited financial statements that are not included in this annual report.
The audited consolidated financial statements for the years ended June 30, 2010, 20112012, 2013 and 20122014 are prepared and presented in accordance with generally accepted accounting principles in the United States, or US GAAP. The selected financial data information is only a summary and should be read in conjunction with the historical consolidated financial statements and related notes of Hollysys contained elsewhere herein. The financial statements contained elsewhere fully represent our financial condition and operations; however, they are not indicative of our future performance.
Financial information in this report is reported in United States dollars, the reporting currency of the Company.
| Years Ended June 30, | ||||||||||||||||||||
| 2008 | 2009 | 2010 | 2011 | 2012 | ||||||||||||||||
| Statement of Income Data | ||||||||||||||||||||
| Revenue | 121,498,752 | 157,502,067 | 174,089,196 | 262,841,886 | 321,703,932 | |||||||||||||||
| Operating income (loss) | 5,844,538 | (5,550,479 | ) | 32,547,400 | 44,690,766 | 65,438,184 | ||||||||||||||
| Income (loss) before income taxes | 2,248,419 | (5,603,121 | ) | 35,219,424 | 47,909,081 | 66,926,065 | ||||||||||||||
| Net loss (income) attributable to Hollysys | (1,677,178 | ) | (13,851,064 | ) | 25,704,538 | 41,469,998 | 56,221,847 | |||||||||||||
| Add: Amortization of discount and interest on notes payable related to bridge loan | 3,244,434 | - | - | - | - | |||||||||||||||
| Share based compensation costs | 17,084,473 | 39,559,026 | 524,076 | 551,966 | 1,139,368 | |||||||||||||||
| Non-GAAP net income attributable to Hollysys | 18,651,729 | 25,707,962 | 26,228,614 | 42,021,964 | 57,361,215 | |||||||||||||||
| Weighted average ordinary shares | 37,658,437 | 44,950,883 | 51,243,667 | 54,564,842 | 55,659,765 | |||||||||||||||
| Weighted average number of diluted ordinary shares | 37,658,437 | 44,950,883 | 51,838,294 | 54,949,280 | 55,828,361 | |||||||||||||||
| Basic earnings (loss) per share | (0.04 | ) | (0.31 | ) | 0.50 | 0.76 | 1.01 | |||||||||||||
| Diluted earnings (loss) per share | (0.04 | ) | (0.31 | ) | 0.50 | 0.75 | 1.01 | |||||||||||||
| Non-GAAP basic earnings per share | 0.50 | 0.57 | 0.51 | 0.77 | 1.03 | |||||||||||||||
| Non-GAAP diluted earnings per share | 0.48 | 0.51 | 0.51 | 0.76 | 1.03 | |||||||||||||||
| Balance Sheet Data | ||||||||||||||||||||
| Total current assets | 214,320,514 | 283,971,473 | 301,359,086 | 362,411,956 | 437,672,433 | |||||||||||||||
| Total assets | 252,734,095 | 345,443,522 | 384,730,251 | 458,583,944 | 552,754,975 | |||||||||||||||
| Total current liabilities | 71,028,772 | 101,121,574 | 135,917,248 | 161,038,804 | 188,828,622 | |||||||||||||||
| Total liabilities | 87,794,820 | 149,424,388 | 171,258,661 | 192,715,669 | 213,469,996 | |||||||||||||||
| Noncontrolling interests | 17,645,377 | 22,479,241 | 774,865 | 810,618 | 1,183,864 | |||||||||||||||
| Stockholders’ equity | 147,293,898 | 173,539,893 | 212,696,725 | 265,057,657 | 338,101,115 | |||||||||||||||
| Years Ended June 30, | ||||||||||||||||||||
| 2010 | 2011 | 2012 | 2013 | 2014 | ||||||||||||||||
| Statement of Comprehensive Income Data | ||||||||||||||||||||
| Revenue | 174,089,196 | 262,841,886 | 321,703,932 | 349,055,002 | 521,331,846 | |||||||||||||||
| Operating income | 32,547,400 | 44,690,766 | 65,438,184 | 57,702,105 | 98,407,029 | |||||||||||||||
| Income before income taxes | 35,219,424 | 47,909,081 | 66,926,065 | 60,617,681 | 91,311,475 | |||||||||||||||
| Net income attributable to Hollysys | 25,704,538 | 41,469,998 | 56,221,847 | 51,994,402 | 69,619,583 | |||||||||||||||
| Add: Share-based compensation costs | 524,076 | 551,966 | 1,139,368 | 1,599,496 | 2,986,192 | |||||||||||||||
| Amortization of acquired intangible assets | - | - | - | 2,847,773 | 5,412,766 | |||||||||||||||
| Acquisition-related consideration fair value adjustments | - | - | - | 1,163,179 | 8,919,629 | |||||||||||||||
| Non-GAAP net income attributable to Hollysys | 26,228,614 | 42,021,964 | 57,361,215 | 57,604,850 | 86,938,170 | |||||||||||||||
| Weighted average ordinary shares: | ||||||||||||||||||||
| Basic | 51,243,667 | 54,564,842 | 55,659,765 | 56,167,592 | 57,926,333 | |||||||||||||||
| Diluted | 51,838,294 | 54,949,280 | 55,828,361 | 56,412,469 | 58,426,642 | |||||||||||||||
| Earnings per share: | ||||||||||||||||||||
| Basic | 0.50 | 0.76 | 1.01 | 0.93 | 1.20 | |||||||||||||||
| Diluted | 0.50 | 0.75 | 1.01 | 0.92 | 1.19 | |||||||||||||||
| Non-GAAP earnings per share: | ||||||||||||||||||||
| Basic | 0.51 | 0.77 | 1.03 | 1.03 | 1.50 | |||||||||||||||
| Diluted | 0.51 | 0.76 | 1.03 | 1.02 | 1.49 | |||||||||||||||
| Balance Sheet Data | ||||||||||||||||||||
| Total current assets | 301,359,086 | 362,411,956 | 437,672,433 | 546,448,188 | 729,892,656 | |||||||||||||||
| Total assets | 384,730,251 | 458,583,944 | 552,754,975 | 744,632,926 | 926,694,505 | |||||||||||||||
| Total current liabilities | 135,917,248 | 161,038,804 | 188,828,622 | 268,452,183 | 398,891,030 | |||||||||||||||
| Total liabilities | 171,258,661 | 192,715,669 | 213,469,996 | 329,157,931 | 434,636,627 | |||||||||||||||
| Net assets | 213,471,590 | 265,868,275 | 339,284,979 | 415,474,995 | 492,057,878 | |||||||||||||||
| Noncontrolling interest | 774,865 | 810,618 | 1,183,864 | 1,746,707 | 3,583,331 | |||||||||||||||
| Stockholders’ equity | 212,696,725 | 265,057,657 | 338,101,115 | 413,728,288 | 488,474,547 | |||||||||||||||
In evaluating our results, the non-GAAP measures of “Non-GAAP Generalgeneral and Administrative Expenses (hereafter “Gadministrative expenses (“Non-GAAP G&A Expenses”expenses”)”,“Non-GAAP cost of integrated contracts”, “Non-GAAP Income (loss) from Operations”other income (expenses), net”, “Non-GAAP interest expenses”, “Non-GAAP net income attributable to Hollysys” and “Non-GAAP Net income (loss) and Earnings (loss)earnings per share” serve as additional indicators of our operating performance and not as a replacement for other measures in accordance with US GAAP. We believe these non-GAAP measures are useful to investors as they excludeexclude: 1) share-based compensation expenses, 2) amortization of discountacquired intangible assets and interest on notes payable related to the bridge loan and share based compensation costs. The amortization3) acquisition-related consideration adjustments. All of discount and interest on notes payable related to bridge loan is non-recurring and non-operation-related in nature. The share based compensation is calculated based on, among others, the number of shares/options granted and the stock price as of the grant date. Itabove will not result in any operating cash inflows or outflows. We believe that using non-GAAP measures help our shareholders to have a better understanding of our operating results and growth prospects. In addition, given the business nature of Hollysys, it has been a common practice for investors and analysts to use such non-GAAP measures to evaluate the Company.Company.Specifically, the non-GAAP measuresexcluded the following items:
1) Share-based compensation expenses,which is calculated based on the number of shares or options granted and the fair value as of grant date.
2) Amortization of acquired intangible assets, which is a non-cash expense relating primarily to acquisitions. At the time of an acquisition, the identifiable definite-lived intangible assets of the acquired company, such as customer relationships and order backlog, are valued and amortized over their estimated lives. Value is also assigned to acquired indefinite-lived intangible assets, which comprise goodwill that are not subject to amortization.
3) Acquisition-related consideration adjustmentsare accounting adjustments to report contingent share consideration liabilities at fair value and cash consideration at present value.These adjustments can be highly variable and are excluded from our assessment of performance because they are considered non-operational in nature and, therefore, are not indicative of current or future performance or ongoing costs of doing business.
The following table provides a reconciliation of U.S. GAAP measures to the non-GAAP measures for the periods indicated:
| Years ended June 30, | ||||||||||||||||||||
| 2008 | 2009 | 2010 | 2011 | 2012 | ||||||||||||||||
| G&A Expenses | 26,588,771 | 48,981,078 | 13,914,091 | 16,671,448 | 26,025,459 | |||||||||||||||
| Minus: Share based compensation costs | 17,084,473 | 39,559,026 | 524,076 | 551,966 | 1,139,368 | |||||||||||||||
| Non-GAAP G&A Expenses | 9,504,298 | 9,422,052 | 13,390,015 | 16,119,482 | 24,886,091 | |||||||||||||||
| Net income (loss) attributable to Hollysys | (1,677,178 | ) | (13,851,064 | ) | 25,704,538 | 41,469,998 | 56,221,847 | |||||||||||||
| Add: Amortization of discount and interest on notes payable related to bridge loan | 3,244,434 | - | - | - | - | |||||||||||||||
| Add: Share based compensation costs | 17,084,473 | 39,559,026 | 524,076 | 551,966 | 1,139,368 | |||||||||||||||
| Non-GAAP net income attributable to Hollysys | 18,651,729 | 25,707,962 | 26,228,614 | 42,021,964 | 57,361,215 | |||||||||||||||
| Weighted average ordinary shares | 37,658,437 | 44,950,883 | 51,243,667 | 54,564,842 | 55,659,765 | |||||||||||||||
| Weighted average number of diluted ordinary shares | 38,664,032 | 50,015,536 | 51,838,294 | 54,949,280 | 55,828,361 | |||||||||||||||
| Non-GAAP basic earnings per share | 0.50 | 0.57 | 0.51 | 0.77 | 1.03 | |||||||||||||||
| Non-GAAP diluted earnings per share | 0.48 | 0.51 | 0.51 | 0.76 | 1.03 | |||||||||||||||
| Years ended June 30, | ||||||||||||||||||||
| 2010 | 2011 | 2012 | 2013 | 2014 | ||||||||||||||||
| Cost of integrated contracts | 110,268,475 | 165,354,157 | 189,152,826 | 218,586,778 | 330,038,563 | |||||||||||||||
| Less: amortization of acquired intangibles | - | - | - | 2,847,773 | 5,412,766 | |||||||||||||||
| Non-GAAP cost of integrated contracts | 110,268,475 | 165,354,157 | 189,152,826 | 215,739,005 | 324,625,797 | |||||||||||||||
| G&A expenses | 13,914,091 | 16,671,448 | 26,025,459 | 29,647,665 | 39,716,156 | |||||||||||||||
| Less: share-based compensation costs | 524,076 | 551,966 | 1,139,368 | 1,599,496 | 2,986,192 | |||||||||||||||
| Non-GAAP G&A expenses | 13,390,015 | 16,119,482 | 24,886,091 | 28,048,169 | 36,729,964 | |||||||||||||||
| Other (expenses) income, net | (215,277 | ) | (208,093 | ) | 792,817 | 879,427 | (5,658,524 | ) | ||||||||||||
| Add: acquisition-related incentive share contingent consideration fair value adjustments | - | - | - | 854,549 | 7,988,640 | |||||||||||||||
| Non-GAAP other (expenses) income, net | (215,277 | ) | (208,093 | ) | 792,817 | 1,733,976 | 2,330,116 | |||||||||||||
| Interest expenses | (2,220,467 | ) | (2,680,141 | ) | (3,097,754 | ) | (2,169,667 | ) | (1,998,311 | ) | ||||||||||
| Add: acquisition-related cash consideration adjustments | - | - | - | 308,630 | 930,988 | |||||||||||||||
| Non-GAAP interest expenses | (2,220,467 | ) | (2,680,141 | ) | (3,097,754 | ) | (1,861,037 | ) | (1,067,323 | ) | ||||||||||
| Net income attributable to Hollysys | 25,704,538 | 41,469,998 | 56,221,847 | 51,994,402 | 69,619,583 | |||||||||||||||
| Add: share-based compensation costs | 524,076 | 551,966 | 1,139,368 | 1,599,496 | 2,986,192 | |||||||||||||||
| Amortization of acquired intangible assets | - | - | - | 2,847,773 | 5,412,766 | |||||||||||||||
| Acquisition-related consideration adjustments | - | - | - | 1,163,179 | 8,919,629 | |||||||||||||||
| Non-GAAP net income attributable to Hollysys | 26,228,614 | 42,021,964 | 57,361,215 | 57,604,850 | 86,938,170 | |||||||||||||||
| Weighted average number of ordinary shares outstanding used in computation: | ||||||||||||||||||||
| Basic | 51,243,667 | 54,564,842 | 55,659,765 | 56,167,592 | 57,926,333 | |||||||||||||||
| Diluted | 51,838,294 | 54,949,280 | 55,828,361 | 56,412,469 | 58,426,642 | |||||||||||||||
| Non-GAAP earnings per share: | ||||||||||||||||||||
| Basic | 0.51 | 0.77 | 1.03 | 1.03 | 1.50 | |||||||||||||||
| Diluted | 0.51 | 0.76 | 1.03 | 1.02 | 1.49 | |||||||||||||||
Exchange Rate Information
A majority of our business is conducted in China. We also operate in Singapore and Malaysia through HAP, and Concord, Bond, and several other jurisdictions in Asia and the Middle East. We use US dollars as our reporting currency in our financial statements and in this annual report. For entities whose functional currencies are not US dollars, balance sheet items are translated into US dollars at the rates of exchange as of the balance sheet date; equity accounts are translated at historical exchange rates and revenues, expenses, gains and losses are translated using the average rate for the year as published by the Federal Reserve Bank of New York and the Federal Reserve Board. Translation adjustments are reported as cumulative translation adjustments and are shown as a separate component of other comprehensive income in the consolidated statement of comprehensive income and changes in equity. Transactions and amounts in other parts of this annual report in foreign currencies recorded at the rates of exchange prevailing when the transactions occurred. With respect to amounts not recorded in our consolidated financial statements but included elsewhere in this annual report, all transactions fromconversion between Renminbi intoand US dollars and from US dollars to Renminbi in this annual report on Form 20-F were made at a rate of RMB6.3249RMB 6.1468 to $1.00, and all transactions fromconversion between Singapore dollars intoand US dollars and from US dollars to Singapore dollars in this annual report on Form 20-F were made at a rate of SGD 1.27371.2602 to $1.00, as set forth by the Federal Reserve Bank of New York. We make no representation of any kind that any Renminbi, Singapore dollar, US dollar or any other currency amountsreferenced in this report could have been, or could be, converted into the other stated currencies at any particular rate, the rates stated below, any particular rate, or at all. The Chinese government imposes control over its foreign-currency reserves in part through both direct regulation of theconcerns conversion of Renminbi into foreign exchange and through restrictions on foreign trade. On August 31, 2012,September 19, 2014, the closing buying rate wasfor using RMB 6.3542 to $1.00, and SGD 1.2491 to $1.00,buy 1.00 USD was 6.1403 and 1.2662 respectively, as set forth by the Federal Reserve Board.
The following table sets forth information concerning exchange rates between the Renminbi, Singapore dollars and the US dollar for the periods indicated. These rates are provided solely for your convenience and are not necessarily the exchange rates that we used in this annual report on Form 20-F or will use in the preparation of our periodic reports or any other information to be provided to you.
| Exchange Rate between RMB and US$ | Exchange Rate between SGD and US$ | |||||||||||||||||||||||||||||||
| Period | Period End | Average | Low | High | Period End | Average | Low | High | ||||||||||||||||||||||||
| Calendar year 2007 | 7.2946 | 7.5806 | 7.8127 | 7.2946 | 1.436 | 1.5065 | 1.5439 | 1.436 | ||||||||||||||||||||||||
| Calendar year 2008 | 6.8225 | 6.9193 | 7.2946 | 6.78 | 1.4377 | 1.414 | 1.531 | 1.3472 | ||||||||||||||||||||||||
| Calendar year 2009 | 6.8259 | 6.8295 | 6.847 | 6.8176 | 1.4035 | 1.4543 | 1.5565 | 1.3795 | ||||||||||||||||||||||||
| Calendar year 2010 | 6.6 | 6.4356 | 6.7861 | 6.7503 | 1.2885 | 1.3629 | 1.4228 | 1.2824 | ||||||||||||||||||||||||
| Calendar year 2011 | 6.2939 | 6.463 | 6.6364 | 6.2939 | 1.2948 | 1.2565 | 1.3135 | 1.2007 | ||||||||||||||||||||||||
| January 31, 2012 | 6.308 | 6.3119 | 6.333 | 6.294 | 1.2576 | 1.2777 | 1.2973 | 1.2526 | ||||||||||||||||||||||||
| February 29, 2012 | 6.2935 | 6.2997 | 6.312 | 6.2935 | 1.2474 | 1.2535 | 1.2646 | 1.2424 | ||||||||||||||||||||||||
| March 30, 2012 | 6.2975 | 6.3125 | 6.3315 | 6.2975 | 1.2573 | 1.259 | 1.2686 | 1.2474 | ||||||||||||||||||||||||
| April 30, 2012 | 6.279 | 6.3043 | 6.315 | 6.279 | 1.2368 | 1.251 | 1.2627 | 1.2368 | ||||||||||||||||||||||||
| May 31, 2012 | 6.3684 | 6.3242 | 6.3684 | 6.3052 | 1.2888 | 1.262 | 1.2888 | 1.2355 | ||||||||||||||||||||||||
| June 29, 2012 | 6.353 | 6.3632 | 6.3703 | 6.353 | 1.2673 | 1.2784 | 1.2918 | 1.2654 | ||||||||||||||||||||||||
| July 31, 2012 | 6.361 | 6.3714 | 6.3879 | 6.3487 | 1.2437 | 1.2603 | 1.2729 | 1.2437 | ||||||||||||||||||||||||
| August 31, 2012 | 6.3484 | 6.3593 | 6.3738 | 6.3484 | 1.2477 | 1.248 | 1.2537 | 1.2403 | ||||||||||||||||||||||||
| Exchange Rate between RMB and US$ | Exchange Rate between SGD and US$ | |||||||||||||||||||||||||||||||
| Period | Period End | Average | Low | High | Period End | Average | Low | High | ||||||||||||||||||||||||
| Calendar year 2009 | 6.8259 | 6.8295 | 6.8470 | 6.8176 | 1.4035 | 1.4543 | 1.5565 | 1.3795 | ||||||||||||||||||||||||
| Calendar year 2010 | 6.6000 | 6.4356 | 6.7861 | 6.7503 | 1.2885 | 1.3629 | 1.4228 | 1.2824 | ||||||||||||||||||||||||
| Calendar year 2011 | 6.2939 | 6.4630 | 6.6364 | 6.2939 | 1.2948 | 1.2565 | 1.3135 | 1.2007 | ||||||||||||||||||||||||
| Calendar year 2012 | 6.2301 | 6.2990 | 6.3879 | 6.2221 | 1.2214 | 1.2492 | 1.2973 | 1.2159 | ||||||||||||||||||||||||
| Calendar year 2013 | 6.0537 | 6.1478 | 6.0537 | 6.2438 | 1.2622 | 1.2511 | 1.2203 | 1.2831 | ||||||||||||||||||||||||
| January 31, 2014 | 6.0590 | 6.0509 | 6.0402 | 6.0600 | 1.2772 | 1.2726 | 1.2647 | 1.2792 | ||||||||||||||||||||||||
| February 28, 2014 | 6.1448 | 6.0816 | 6.0591 | 6.1448 | 1.2669 | 1.2659 | 1.2602 | 1.2755 | ||||||||||||||||||||||||
| March 31, 2014 | 6.2164 | 6.1729 | 6.1183 | 6.2273 | 1.2583 | 1.2672 | 1.2583 | 1.2774 | ||||||||||||||||||||||||
| April 30, 2014 | 6.2591 | 6.2246 | 6.1966 | 6.2591 | 1.2553 | 1.2548 | 1.2473 | 1.2633 | ||||||||||||||||||||||||
| May 30, 2014 | 6.2471 | 6.2380 | 6.2255 | 6.2591 | 1.2543 | 1.2514 | 1.2460 | 1.2564 | ||||||||||||||||||||||||
| June 28, 2014 | 6.2036 | 6.2306 | 6.2036 | 6.2548 | 1.2465 | 1.2512 | 1.2465 | 1.2572 | ||||||||||||||||||||||||
| July 31, 2014 | 6.1737 | 6.1984 | 6.1712 | 6.2115 | 1.2466 | 1.2427 | 1.2376 | 1.2472 | ||||||||||||||||||||||||
| August 29, 2014 | 6.1430 | 6.1541 | 6.1395 | 6.1793 | 1.2485 | 1.2484 | 1.2444 | 1.2514 | ||||||||||||||||||||||||
| September 19, 2014 | 6.1403 | 6.1387 | 6.1284 | 6.1480 | 1.2662 | 1.2603 | 1.2522 | 1.2678 | ||||||||||||||||||||||||
B. Capitalization and Indebtedness
Not applicable.
C. Reasons for the Offer and Use of Proceeds
Not applicable.
D. Risk Factors
An investment in our capital stock involves a high degree of risk. You should carefully consider the risks described below, together with all of the other information included in this annual report, before making an investment decision. If any of the following risks actually occurs, our business, prospects, financial condition or results of operations could suffer. In that case, the trading price of our capital stock could decline, and you may lose all or part of your investment.
RISKS RELATED TO OUR BUSINESS
We will need to commit greatersubstantial resources to new product and service development and acquisition opportunities in order to stay competitive and grow our business, and we may fail to offset the increased cost of such developmentinvestment with a sufficient increase in net sales or margins.
The success of our business depends in great measure on our ability to keep pace with, or even lead, changes that occur in our industry and expand our product and service offerings. Traditionally, the automation and control systems business was relatively stable and slow moving. Successive generations of products offered only marginal improvements in terms of functionality and reliability. However, the emergence of computers, computer networks and electronic components as key elements of the systems that we design and build has accelerated the pace of change in our industry. Where there was formerly as much as a decade or more between successive generations of automation systems, the time between generations is now as little as two to three years. Technological advances and the introduction of new products, new designs and new manufacturing techniques by our competitors could adversely affect our business unless we are able to respond with similar advances. To remain competitive, we must continue to incur significant costs in product development, equipment and facilities and to make capital investments.investments and seek complementary acquisitions. These costs may increase, resulting in greater fixed costs and operating expenses than we have incurred to date. As a result, we could be required to expend substantial funds for and commit significant resources to the following:
| · | Research and development activities on existing and potential product solutions; |
| · | Additional engineering and other technical personnel; |
| · | Advanced design, production and test equipment; |
| · | Manufacturing services that meet changing customer needs; |
| · | Technological changes in manufacturing processes; |
| · | Expansion of manufacturing capacity; and |
| · | Acquiring technology through licensing and acquisitions. |
Our future operating results will depend to a significant extent on our ability to continue providing new product and service solutions that compare favorably on the basis of time to market, cost and performance, with competing third-party suppliers and technologies. Our failure to increase net sales sufficiently to offset the increased costs needed to achieve those advances would adversely affect our operating results.
We may experience trade barriers in expanding to our targeted emerging markets and may be subject to tariffs and taxes that will result in significant additional costs for our business and products.
We may experience barriers to conducting business and trade in our planned expansion to emerging markets. These barriers may be in the form of delayed customs clearances, customs duties or tariffs. In addition, we may be subject to repatriation taxes levied upon the exchange of income from local currency into foreign currency, substantial taxes of profits, revenues, assets and payroll, as well as value-added tax. The markets into which we may expand may impose onerous and unpredictable duties, tariffs and taxes on our business and products. These barriers or expenses could have an adverse effect on our operations and financial results.
To the extent we acquire businesses and technologies from others, we will need to integrate these into our business, which if not successful will adversely impact our business and increase our financial expenses.
As we develop our business, oneOne important aspect of our expansion has been and will be the use of acquisitions, which may include acquiring an operating business or specific assets. One such example wasExamples of this strategy have been the acquisitionacquisitions of Concord.Concordin 2011 and Bond in 2013. As with any acquisition, we will have to integrate the business with our operations so as to achieve the value of our investment. Accommodating different business cultures, operating systems and product lines, as well as understanding and implementing different regulatory issues, often takes time and can result in unexpected expenses. Acquisitions are not always successful, resulting in unintended expenses and write-downs.
As we expand our business outside of China, we will encounter the increasing need for international certifications and compliance with the regulation of different governments, which if not obtained and complied with may adversely impact our business.
We are expanding our business outside of China, including seeking business opportunities in Hong Kong SAR, Singapore, Malaysia and the Middle East. For our marketing both withinin China and in other jurisdictions, we seek international certifications and have obtained certificates such as the European Safety Standard Certification Level 4. As we operate in jurisdictions other than China, we will have to comply with local law, some of which relate to various safety and quality requirements for the kinds of products we provide. The failure to have any necessary or beneficial certifications and the failure to comply with local law will have an adverse impact on our marketing and business, and may result in additional costs and expenses.
During our expansion into overseas market, a lack of qualified local engineers and the inability to relocate enough China’s experienced engineers to overseas could delay our international projects’ execution and lose potential business opportunities.
In our international business expansion to Southeast Asia and the Middle East, we may not be able to find adequate and qualified local engineers to bid and complete sizable rail transportation orders and industrial automation projects, and because of the visa problems, we may have difficulties to relocate adequate engineers from China to various foreign countries and have them stay there long enough to finish the projects, which could cause adverse impact on our international business expansion.
We do not have long-term purchase commitments from our customers, so our customers are free to choose products from our competitors, which increases our marketing expenses to continually find new clients and win new contracts.
We are engaged in the design, production and installation of automation and process control systems. As a result, our revenues result from numerous individual contracts that are nonrecurring in nature. Furthermore, customers may change or delay or terminate orders for products and services without notice for any number of reasons unrelated to us, including lack of market acceptance for the products to be produced by the process that our system was designed to control. As a result, in order to maintain and expand our business, we must expend increasing amounts on marketing to identify clients and win contracts so as to be able to replenish the orders in our pipeline on a continuous basis. Increased marketing expenses and the inability to continue with current contracts or win new sources of revenue will result in a decline in revenues and profitability.
The success of our business depends, in part, on securing a steady stream of new customers.
Other than our contracts to supply products, systems and services to our rail, power plant and building retrofit customers, our average integrated solutions contract is worth approximately $150,000. While some of those contracts are for upgrades and additions to existing control systems, most of them are for new installations. In order for our business to continue to succeed and grow, we need to secure contracts with new customers on a regular basis. We may not be successful in securing new contracts, which would impact our revenues and profitability.
Although we do not have a concentration of business with any customer at this time, recently our business has become more dependent on a few significant customers.
We have developed significant customer relationships with the several local subway providers and the Ministry of Railways and local railway bureausauthorities in respect of the high speed train system in China. We currently also have significant contracts with the MTR Corporation Ltd. of Hong Kong.Kong, and SMRT Corporation Ltd. and Thales Solutions Asia Pte. Ltd. of Singapore. We expect that these relationships will continue to grow, and we will win more contracts with them over time. We also are expanding into the businessestablished a joint venture with China General Nuclear Power Corporation which has about 60% of control systemsChina’s nuclear market share, to secure us for conventional and nuclear plants and building retrofitting which may develop into a significant customer basemarket share for the automation and control products providing for the nuclear power plants in the future.China. To the extent that these customer groups or specific customers with a group represent an increasing proportion of our business, we will become more dependent on them for our revenues and business growth. In that case, our cash flowflows also will become more dependent on those customers’ payment practices and overall public funding policies, including the lengthening of collection times under contracts that have been performed. Therefore, the loss of one or more of these customers or market groups as customers would have a material adverse impact on our revenues and our business operations and development.
We have a substantial backlog of contracts.contracts, the execution of the unfinished contracts in the backlog may be lengthened due to various external reasons, and the increase of backlog may not necessarily reflect our business expansion.
To date, our backlog has been a reflection of our ability to sell our products and services and increase our business. This represents an amount of unrealized revenue to be earned from contracts secured by the Company. Backlog, however, can also reflect upon our abilityinability to perform our contracts on a timely basis. Therefore, when evaluating our backlog, analysis should be made ofas to whether or not it is a reflection of an expanding business, successful marketing and increasing acceptance of our products and services in the marketplacemarket place or problems in our contract performance and acceptance.
A lack of adequate engineering resources could cause our business to have diminished profitability and lose potential business prospects.
Among the competitive advantages and key business advantages that we enjoy are the plentiful supply of engineering talent in China and the comparatively lower cost of our engineering staff compared to those of our Western and Japan-based competitors. Recently, however, our costs for these persons has been subject to increased wage pressures due to the economic growth of China and certain inflationary pressures and additional employment related taxation. If the available supply of engineers were to be absorbed by competing demands, or otherwise not as plentiful as we have experienced to date, then the costs of hiring, training and retaining capable engineers would likely increase. ThisIf we are unable to pass any additional costs through to our customers, this could result in a reduction in our profitability, and the inability to have qualified and trained persons could adversely affect our business prospects or could even cause a change in our business strategy.
Our products may contain design or manufacturing defects, which could result in reduced demand for our products or services, customer claims and uninsured liabilities.
Our products are very complex, integrated systems, often with elements designed specifically for the particular situation of a customer, which may have undetected design or manufacturing issues or defects until put into actual use. Also, we manufacture spare parts for maintenance and replacement purposes after completion of integrated solution contracts. While there have been no significant issues or defects identified so far, any issues or defects in the design, manufacture and spare parts we provide may result in returns, claims, delayed shipments to customers or reduced or cancelled customer orders and other forms of damages asserted against the company. If these issues or defects occur, we will incur additional costs, and if they occur in large quantity or frequency, we may sustain a permanent increase in costs, a loss of business reputation and legal liability. Moreover, we are increasingly active in the conventional and nuclear power generation and railway control systems sectors. Each of these sectors poses a substantially higher risk of liability in the event of a system failure, than was present in the industrial process controls markets in which we traditionally compete.
We generally do not havecarry large amounts of insurance, now, and in the future we may not be able to obtain adequate insurance coverage, to protect us against the risks associated with our business.coverage. The typical practice of the industries with which we are involved is for the customers to obtain insurance to protect their own operational risks. As a practice, we do not carry insurance coverage to protect against the risks related to product failure. It is possible that customers could assert claims against us for any damages caused by a failure in one of our systems, and as a result, the failure of any of our designs, manufacture and installation of our products could result in a liability that would seriously impair our financial condition or even force us out of business.
Our failure to adequately protect our intellectual property rights may undermine our competitive position, and litigation to protect our intellectual property rights may be costly.
Our business is based on a number of proprietary products and systems, some of which are patented and others of which we protect as trade secrets. We strive to strengthen and differentiate our product portfolio by developing new and innovative products and product improvements. As a result, we believe that the protection of our intellectual property will become increasingly important to our business as the functionality of automation systems increases to meet customer demand and as we try to open new markets for our products.
Currently, we hold 80 PRC utility patents that relate to various product configurations and product components and 95 software copyrights and have 45 pending PRC patent applications. We will continue to rely on a combination of patents, trade secrets, trademarks and copyrights to provide protection in this regard, but this protection may be inadequate.
Our pending or future patent applications may not be approved or, if allowed, they may not be of sufficient strength or scope. As a result, third parties may use the technologies and proprietary processes that we have developed and compete with us, which could negatively affect any competitive advantage we enjoy, dilute our brand and harm our operating results.
In addition, policing the unauthorized use of our proprietary technology can be difficult and expensive. Litigation may be necessary to enforce our intellectual property rights. Protection of intellectual property and proprietary rights in China may not be as effective as in other countries. Given the fact that the majority of our intellectual property rights are in China and under Chinese law, the relative unpredictability of China’s legal system and potential difficulties of enforcing a court judgment in China may result in an outcome that is unfavorable to us when we assert intellectual property ownership in a particular situation. Furthermore, any litigation may be costly and may divert management attention away from our business operations. An adverse determination in any lawsuit involving our intellectual property is likely to jeopardize our business prospects and reputation and result in additional expense for penalties, licensing and redesign. We have no insurance coverage against litigation costs so we would be forced to bear all litigation costs if we cannot recover them from other parties. All of the foregoing factors could harm our business and financial condition.
As we are going to sell more of our proprietarily developed products and systems to foreign countries, we may not continue to have the protection of our patents and software copyright in foreign countries for some of our proprietary products, which could negatively impact our competitive position and our business expansion in overseas.
We may develop new products that do not gain market acceptance, which would result in the failure to recover the significant costs for design and manufacturing services for new product solutions, thus adversely affecting operating results.
We operate in an industry characterized by increasingly frequent and rapid technological advances, product introductions and new design and manufacturing improvements. As a result, we must expend funds and commit resources to research and development activities, possibly requiring additional engineering and other technical personnel; purchasing new design, production, and test equipment; and enhancing our design and manufacturing processes and techniques. We may invest in equipment employing new production techniques for existing products and new equipment in support of new technologies that fail to generate adequate returns on the investment due to insufficient productivity, functionality or market acceptance of the products for which the equipment may be used. We could, therefore, incur significant costs for design and manufacturing services for new product solutions that do not generate a sufficient return on that investment, which would adversely affect our future operating results. Our future operating results will depend significantly on our ability to provide timely design and manufacturing services for new products that compete favorably with design and manufacturing capabilities of third party suppliers.
Although the Company’s goodwill outstanding as at June 30, 2014 was assessed not impaired, it may be impaired in the future depending on the future market development and the outcome of the tendering of local mechanical and electrical engineering contracts in Singapore, Malaysia and Middle East.
The goodwill outstanding as at June 30, 2014 was related to the acquisition of Concord in 2012 and Bond in 2013. Based on our quantitative assessment the goodwill was not impaired as at June 30, 2014. However, the fair value of Concord calculated using discounted cash flow method was only 9.1% higher than its carrying value as at June 30, 2014. The fair value of Concord is highly dependent on the future market development and the outcome of its tendering of local mechanical and electrical engineering contracts in Singapore, Malaysia and Middle East. Slow down in mechanical and electrical engineering sector, or fewer than expected contract awards to Concord may result in goodwill impairment in the future.
RISKS RELATING TO THE INDUSTRY IN WHICH WE OPERATE
The plans for growth rely oncompany mainly operates in the industrial and manufacturing automation sectors, and the high-speed rail, subway and nuclear power automation sectors; in some industry verticals within the industrial automation sector, we may experience slowerthe inconstant growth or decrease in growthrate from time to time, which may present fewervariation of business opportunities; the contracts for high-speed rail, subway and nuclear power are substantially larger which may result in a greater dependence on a particular customer or business sector, and could cause significant fluctuations in our revenues.
The principal focus of our business until recently has been to provide Distributed Control Systems, Programmable Logic Controller and related industrial automation and control software and hardware devices to industrial and manufacturing companies. Even though there are enormous opportunities in the industrial automation arena, some industry verticals may experience slower growth or decreased growth that will provide us with fewer opportunities and contract awards from the industry and manufacturing sectors. Both high-speed rail and nuclear power sectors have one or few customers and are closely related to the national development policies, and the contract size for these two sectors is usually much larger, and as a result, there could be severe fluctuation of these sectors’ growth, which may affect our business and revenues. The competition of SCADA (Surveillance Control and Data Acquisition) in the subway sector is substantial; therefore we may not be able to sustain our position in the market and achieve new contract wins, resulting in a decrease of our revenue within this sector.
To the extent that we devote more of our marketing and business capacities to the larger customer, our revenues and business development will be more dependent on our being able to service their needs. To the extent that the nuclear industry and high speed railway in China may experience slower growth, we would expect that there would be a slowing of our expansion into these business areas.
Although China is committed to expanding its energy production with nuclear power and building a high speed railway network, both these industries have experienced various setbacks due to higher than expected accidents for various reasons. To the extent that the government slows their development and expansion withinreasons years ago. The future growth rate of these two industriessectors may not be as fast as the market previously expected but on which we are becominga more reliant, we may experience a slowing of our business growth due the inability to win contracts or our ability to win contracts for smaller amounts than previously experiencedsustainable and anticipated. If we are unable to generate the revenues that we seek and we are unable to replace the revenues in our traditional markets or other new markets, thensafer basis, thus we will, likely experience slower annual growth or possibly even a reduction in these sectors’ revenues.
To the extent that our business is more dependent on large contracts and contracts from a few customers, our revenues, cash flow and profits will be influenced by this type of contracting and the timely payment for our products and services.
As we develop our business with the entities responsible for building municipal subway systems and railroads, power plants and larger system contract customers, such as building retrofits, we will be entering into contracts for larger sized projects than in the past, which will be for significantly greater contract value. These contracts will require us to commit greater operating resources to a more limited number of customers and contract fulfillment. Therefore, our revenues, cash flow and profit will become increasingly dependent on our ability to perform these contracts and collect the payments due on a timely basis. As manySome of the entities that are ultimately responsible for the funding of these types ofinfrastructure projects are governmental authorities or ministries, our contract requirements and collections will become subject to these entities being able to adequately budget and have the revenues to timely pay for our products and services. We expect a long collection period in some of our business. To some extent, we may become subject to delays and reductions in scope of project due to changes in the policies, objectives and budgeting of any of the public entities which control the projects on which we are contracting. We will also become increasingly subject to government contract requirements in the performance of contracts that are ultimately the responsibility of public bodies.
At this time, contracting with the entities that provide the subway and rail systems and power plants for which we provide control systems is similar to contracting with the customers we have sold to in the past. Therefore, our contracts are written on a similar basis as before, and we expect that we will be operating under these contracts and accounting for their revenues in a similar manner as before.
Many of our competitors have substantially greater resources than we do, allowing them to be able to reduce their prices, which would force us to reduce our prices.compete on an advantageous basis.
We operate in a very competitive environment with many major international and domestic companies, such as Honeywell, General Electric, ABB, Siemens, Emerson, Yokogawa and Hitachi. Many of our competitors are much better established and more experienced than we are, have substantially greater financial resources, operate in many international markets and are much more diversified than we are. As a result, they are in a strong position to compete effectively with us by, for example, reducing their prices, which could force us to reduce our prices.us. These large competitors are also in a better position than we are to weather any extended weaknesses in the market for automation and control systems. Other emerging companies or companies in related industries may also increase their participation in our market, which would add to the competitive pressures that we face.
A decrease in the rate of growth in Chinese industryChina’s industrial activity and the Chinese economy in general may lead to a slower growth or decrease in our revenues because industrial companies in China are the principal current sourcesignificant sources of revenues for us.
Industrial companies operating in China are the principal current sourcesignificant sources of revenues for us. Our business benefited in the past from the rapid expansion of China’s industrial activity, which has created additional demand from existing companies and led to the formation of numerous additional companies that have need for our products and services. We have also benefited from the infrastructure projects of the different governmental authorities of China, such as power production and transportation systems. China’s industrial and infrastructure expansion has been fueled in large measure by international demand for the low-cost goods that China is able to produce due to labor advantages and other comparative advantages, such as governmental subsidies to offset research and development expenses and taxes and reduced land use/facilities costs for targeted industries. The Chinese economy may not be able to sustain this rate of growth in the future and any reduction in the rate of China’s industrial growth or a shrinking of China’s industrial base could adversely affect our revenues. We may also be impacted as major infrastructure projects are completed. The resulting increase in competition for customers might also cause erosion of profit margins that we have been able to achieve historically.
Our efforts to operate in the international automation market may not prove successful, and we may expend capital resources without achieving value and needlessly divert management’s time and attention from our principal market.
We are penetrating international markets, emphasizing Southeast Asia and the Middle East.East with the objective of diversifying our products, clients and places of operations and growing our overall business. Our expansion is likely to use substantial resources, including substantial amounts of capital and equity and deploy meaningful amounts of management time and attention. Our products and our overall approach to the automation and controls system business may not be accepted in other markets to the extent needed to make that effort profitable. In addition, the additional demands on our management from these activities may detract from our efforts in the domestic Chinese market and market of surrounding countries, causing the operating results in our principal markets to be adversely affected.
We depend heavily on key personnel, and loss of key employees and senior management could harm our business.
Our future business and results of operations depend in significant part upon the continued contributions of our key technical and senior management personnel, including Dr. Changli Wang, our Chairman and Chief Executive Officer. Wepersonnel. The company also will depend in significant part upon its ability to attract and retain additional qualified senior executives and management, technical, marketing and sales and support personnel for our operations. If we lose a key employee, if a key employee fails to perform in his or her current position or if we are not able to attract and retain skilled employees as needed, our business could suffer. Turnover in our senior management could significantly deplete institutional knowledge held by our existing senior management team and impair our operations.
In addition, if any of these key personnel joins a competitor or forms a competing company, we may lose some of our customers. We have entered into confidentiality and non-competition agreements with key personnel. However, if any disputes arise between these key personnel and us, it is not clear, in light of uncertainties associated with the PRC legal system, what the court decisions will be and the extent to which these court decisions could be enforced in China, where all of these key personnel reside and hold some of their assets.
Our control systems are used in infrastructure projects such as subway systems, surface railways and nuclear plants; to the extent that our systems do not perform as designed, we could be found responsible for the damage resulting from that failure.
We face potential responsibility for the failure of our control systems in performing the various functions for which they are designed and the damages resulting from any such problem. To the extent that we contract to provide control systems in larger scale projects, the level of damages for which we may be held responsible is likely to increase. To the extent that any of our installed control systems do not perform as designed for their intended purposes, and we are held responsible for the consequences of those performance failures and resulting damages, there may be an adverse impact on our business, business reputation, revenues and profits. To date, we do believe our control systems have performed as designed, and there are no claims asserted against us based on any significant, non-performance event. Notwithstanding our record, no assurance can be given that no claims will be sought in the future based on the design and performance of our control systems.
We may be exposed to potential risks relating to our internal controls over financial reporting and our ability to have those controls positively attested to by our independent auditors.
As directed by Section 404 of the Sarbanes-Oxley Act of 2002, the SEC adopted rules requiring public companies to include a report of management on the Company’s internal controls over financial reporting in their annual reports and the independent registered public accounting firm auditing a company’s financial statements to attest to and report on the operating effectiveness of such company’s internal controls. Although our independent auditorNo material weakness has provided a positive attestationbeen identified as of June 30, 2012, we can provide no assurance that we will comply with all of the requirements imposed thereby and we will receive a positive attestation from our independent auditors in the future.2014. In the event we identify material weaknesses in our internal controls that we cannot remediate in a timely manner or we are unable to receive a positive attestation from our independent auditors with respect to our internal controls, investors and others may lose confidence in the reliability of our financial statements.
| 15 |
Our auditor, like other independent registered public accounting firms operating in China, is not permitted to be subject to inspection by the Public Company Accounting Oversight Board, and as such, investors may be deprived of the benefits of such inspection.
TheOur independent registered public accounting firm that issues the audit reports included in our annual report filed with the SEC, as an auditor of companies that are traded publicly in the United States and a firm registered with the Public Company Accounting Oversight Board (United States), or the PCAOB, is required by the laws of the United States to undergo regular inspections by the PCAOB to assess its compliance with the laws of the United States and professional standards. Because our auditor is located in China, a jurisdiction where the PCAOB is currently unable to conduct inspections without the approval of the PRC authorities like other independent registered public accounting firms operating in China, our auditor is currently not inspected by the PCAOB.
Inspections of other firms that the PCAOB has conducted have identified deficiencies in those firms’ audit procedures and quality control procedures, which may be addressed as part of the inspection process to improve future audit quality. The inability of the PCAOB to conduct inspections of independent registered public accounting firms operating in China makes it more difficult to evaluate the effectiveness of our auditor’s audit procedures or quality control procedures. As a result, investors may be deprived of the benefits of the PCAOB inspections.
Proceedings instituted by the SEC against five PRC-based accounting firms, including our independent registered public accounting firm, could result in financial statements being determined to be not in compliance with the requirements of the Securities Exchange Act of 1934.
In December 2012, the SEC instituted proceedings under Rule 102(e)(1)(iii) of the SEC’s Rules of Practice against five PRC-based accounting firms, including our independent registered public accounting firm, alleging that these firms had violated U.S. securities laws and the SEC’s rules and regulations thereunder by failing to provide to the SEC the firms’ work papers related to their audits of certain PRC-based companies that are publicly traded in the United States. Rule 102(e)(1)(iii) grants to the SEC the authority to deny to any person, temporarily or permanently, the ability to practice before the SEC who is found by the SEC, after notice and opportunity for a hearing, to have willfully violated, or willfully aided and abetted the violation of, any such laws or rules and regulations. On January 22, 2014, an initial administrative law discuss was issued, sanctioning four of these accounting firms and suspending them from practicing before the SEC for a period of six months. The sanction will not take effect until there is an order of effectiveness issued by the SEC. The accounting firms involved have appealed and the sanction will not become effective until after a full appeal process is concluded and a final decision is issued by the SEC. While we cannot predict the outcome of the SEC’s proceedings, if our independent registered public accounting firm is denied, temporarily or permanently, the ability to practice before the SEC, and we are unable to find in a timely manner another registered public accounting firm which can audit and issue a report on our financial statements, our financial statements could be determined to not be in compliance with the requirements for financial statements of public companies with a class of securities registered under the Securities Exchange Act of 1934, as amended, or the Exchange Act. Such a determination could ultimately lead to the SEC’s revocation of the registration of our ordinary shares under the Exchange Act, which would cause the immediate delisting of our ordinary shares from the NASDAQ Global Select Market, and the effective termination of the trading market for our ordinary shares in the United States, which would likely have a significant adverse effect on the value of our ordinary shares. In addition, because the issues raised in the SEC proceedings would likely extend to all independent public accounting firms in the PRC that currently are authorized to practice before the SEC, it may not be possible for us to attempt to address this issue by changing our independent registered public accounting firm.
RISKS RELATED TO DOING BUSINESS IN CHINA
The majority
A significant portion of our operating assets are located in China and the majoritya substantial portion of our revenue will be derived from our operations in China so our business, results of operations and prospects are subject to the economic, political and legal policies, developments and conditions in China.
Because the majoritya substantial portion of our business is conducted in China, despite the significant operations in Singapore and other SouthSoutheast Asian and Middle Eastern jurisdictions, the PRC’s economic, political and social conditions, as well as government policies, will have a tremendous influence on our business currently and in the nearer future.business. The PRC economy differs from the economies of most developed countries in many respects. China’s GDP has grown consistently since 1978 (National Bureau of Statistics of China). However, we cannot assure you that such growth will be sustained in the future. If, in the future, China’s economy experiences a downturn or grows at a slower rate than expected, there may be less demand for spending in certain industries. A decrease in demand for spending in certain industries could impair our ability to remain profitable. The PRC’s economic growth has been uneven, both geographically and among various sectors of the economy. The PRC government has implemented various measures to encourage economic growth and guide the allocation of resources. Some of these measures benefit the overall PRC economy, but may have a negative effect on us. For example, our financial condition and results of operations may be hindered by PRC government control over capital investments or changes in tax regulations.
The PRC economy has been transitioning from a planned economy to a more market-oriented economy. Although in recent years the PRC government has implemented measures emphasizing the use of market forces for economic reform, the reduction of state ownership of productive assets and the establishment of sound corporate governance in business enterprises, a substantial portion of productive assets in China is still owned by the PRC government. In addition, the PRC government continues to play a significant role in regulating industry development by imposing industrial policies. It also exercises significant control over PRC economic growth through the allocation of resources, controlling payment of foreign currency-denominated obligations, setting monetary policy and providing preferential treatment to particular industries or companies.
If the China Securities Regulatory Commission, or CSRC, or another PRC regulatory agency, determines that CSRC approval of our initial merger was required or if other regulatory obligations are imposed upon us, we may incur sanctions, penalties or additional costs which would damage our business.
On August 8, 2006, six PRC regulatory agencies, including the CSRC, promulgated the Regulations on Mergers and Acquisitions of Domestic Companies by Foreign Investors, or the M&A Regulations, which became effective on September 8, 2006. Under these regulations, the prior approval of the CSRC is required for the overseas listing of offshore special purpose vehicles that are directly or indirectly controlled by PRC companies or individuals and used for the purpose of listing PRC onshore interests on an overseas stock exchange.
On September 20, 2007, we completed a merger transaction with Chardan North China Acquisition Corporation, or Chardan, which resulted in our current ownership and corporate structure. We believe that CSRC approval was not required for our merger transaction or for the listing and trading of our securities on a trading market because we are not an offshore special purpose vehicle that is directly or indirectly controlled by PRC companies or individuals. Although the M&A Regulations provide specific requirements and procedures, there are still many ambiguities in the meaning of many provisions. Further regulations are anticipated in the future, but until there has been clarification either by pronouncements, regulation or practice, there is some uncertainty in the scope of the regulations and the regulators have wide latitude in the enforcement of the regulations and approval of transactions. If the CSRC or another PRC regulatory agency subsequently determines that the CSRC’s approval was required, we may face sanctions by the CSRC or another PRC regulatory agency. If this happens, these regulatory agencies may impose fines and penalties on our operations in China, limit our operating privileges in China, restrict or prohibit payment or remittance of dividends paid by Hollysys, or take other actions that could damage our business, financial condition, results of operations, reputation and prospects, as well as the trading price of our securities.
We anticipate that the PRC will experience inflation in the near term, which may have an adverse effect on our cost of operations and profitability.
The PRC economy is experiencing general inflationary pressures due to a number of factors which overall will effect Hollysys. If we are unable to increase the value of our contracts commensurate with increases in our operating expenses, we will experience a reduction in our profit margins. If we raise our contract prices, we may not win the kind and amount of contracts that will permit us to operate profitably and grow our business.
If the PRC imposes restrictions designed to reduce inflation, future economic growth in the PRC could be severely curtailed which could hurt our business and profitability.
While the economy of the PRC has experienced rapid growth, this growth has been uneven among various sectors of the economy and in different geographical areas of the country. Rapid economic growth often can lead to growth in the supply of money and rising inflation. In order to control inflation in the past, the PRC has imposed controls on bank credits, limits on loans for fixed assets and restrictions on state bank lending. Imposition of similar restrictions may lead to a slowing of economic growth, a decrease in demand for our products and generally damage our business and profitability.
Fluctuations in exchange rates could harm our business and the value of our securities.
The value of our securities will be indirectly affected by the foreign exchange rate between US dollars and RMB and between those currencies and other currencies in which our sales may be denominated. Because substantially mosta large portion of our earnings and cash assets are denominated in RMB, Singapore Dollar and Malaysian Ringgit, and our financial results are reported in US dollars, fluctuations in the exchange rate between the US dollar and the RMB will affect our balance sheet and our earnings per share as stated in US dollars. In addition, appreciation or depreciation in the value of the RMB relative to the US dollar would affect our financial results reported in US dollar terms without giving effect to any underlying change in our business or results of operations. Fluctuations in the exchange rate will also affect the relative value of any dividend we issue that will be exchanged into US dollars as well as earnings from, and the value of, any US dollar-denominated investments we make in the future. Since July 2005, the RMB has no longer been pegged to the US dollar. Although the People’s Bank of China regularly intervenes in the foreign exchange market to prevent significant short-term fluctuations in the exchange rate, the RMB may appreciate or depreciate significantly in value against the US dollar in the medium to long term. Moreover, it is possible that in the future PRC authorities may lift restrictions on fluctuations in the RMB exchange rate and lessen intervention in the foreign exchange market.
Very limited hedging transactions are available in China to reduce our exposure to exchange rate fluctuations. To date, we have not entered into any hedging transactions. While we may enter into hedging transactions in the future, the availability and effectiveness of these transactions may be limited, and we may not be able to successfully hedge our exposure at all. In addition, our foreign currency exchange losses may be magnified by PRC exchange control regulations that restrict our ability to convert RMB into foreign currencies.
Exchange controls that exist in the PRC may limit our ability to utilize our cash flow effectively.
We are subject to the PRC’s rules and regulations on currency conversion. In the PRC, the State Administration for Foreign Exchange, or SAFE, regulates the conversion of the RMB into foreign currencies. Currently, foreign investment enterprises, or FIEs, are required to apply to the SAFE for “Foreign Exchange Registration Certificates for FIEs.” We believe Beijing Helitong is an FIE. With such registration certificates, which need to be renewed annually, FIEs are allowed to open foreign currency accounts including a “basic account” and “capital account.” Currency conversion within the scope of the “basic account,” such as remittance of foreign currencies for payment of dividends, can be effected without requiring the approval of the SAFE. However, conversion of currency in the “capital account,” including capital items such as direct investment, loans and securities, still require approval of the SAFE. We cannot assure you that the PRC regulatory authorities will not impose further restrictions on the convertibility of the RMB. Any future restrictions on currency exchanges may limit our ability to use our cash flow for the distribution of dividends to our shareholders or to fund operations it may have outside of the PRC.
APRC regulations relating to the establishment of offshore special purpose companies by PRC residents may subject our PRC resident beneficial owners or our company to liabilities or penalties, limit our ability to contribute capital to our PRC subsidiaries, limit the ability of our PRC subsidiaries to increase their registered capital or distribute profits to us, or otherwise materially and adversely affect us.
On July 14, 2014, the SAFE issued the Circular Relating to Foreign Exchange Administration of Offshore Investment, Financing and Roundtrip Investment by Domestic Residents Through Special Purpose Vehicles, or Circular 37. Circular 37 repeals and replaces the Notice Concerning Foreign Exchange Controls on Domestic Residents’ Financing and Roundtrip Investment Through Offshore Special Purpose Vehicles, or Circular 75. Under Circular 37, PRC residents are required to register with the SAFE or its local branches prior to establishing, or acquiring control of, an offshore company for the purpose of investment or financing that offshore company with equity interests in, or assets of, a PRC enterprise or with offshore equity interest or assets legally held by such PRC resident. In addition, PRC residents are required to amend their registrations with the SAFE and its local branches to reflect any material changes with respect to such PRC resident’s investment in such offshore company, including changes to basic information of such PRC resident, increase or decrease in capital, share transfer or share swap, merger or division. In the event that a PRC shareholder fails to make the required registration or update the previously filed registration, the PRC subsidiaries of that offshore special purpose vehicle may be prohibited from distributing their profits and the proceeds from any reduction in capital, share transfer or liquidation to their offshore parent company, and the offshore parent company may also be prohibited from contributing additional capital into its PRC subsidiaries. Furthermore, failure byto comply with the various foreign exchange registration requirements described above could result in liability under the PRC laws for evasion of applicable foreign exchange restrictions.
We do not have control over our shareholders orbeneficial owners and cannot assure you that all of our PRC resident beneficial owners will comply with SAFE regulations. The failure of our beneficial owners who are PRC citizens or residents in China to comply with certainthese SAFE registrations may subject such beneficial owners or our PRC foreign exchange regulations could restrict our abilitysubsidiaries to distribute profits, restrict our overseasfines and legal sanctions. Furthermore, since Circular 37 was recently promulgated and it is unclear how this regulation, and any future regulation concerning offshore or cross-border investment activities or subject us to liability under PRC laws.
SAFE Circular No. 75 effective from November 2005transactions, will be interpreted, amended and a series of implementation rules and guidance issuedimplemented by SAFE, including the most recent circular relating to operating procedures that came into effect as of July 1, 2011, require approvals from, and registrations with,relevant PRC government authorities, in connection with direct or indirect offshore investment activities by PRC residents and PRC corporate entities. The SAFE regulations require retroactive approval and registration of direct or indirect investments previously made by PRC residents in offshore companies.
As it is uncertain how the SAFE regulations described above will be interpreted or implemented, we cannot predict how these regulations will affect our business operations or future strategy. In the event that a PRC shareholderFailure to register or comply with a direct or indirect stake in an offshore parent company failsrelevant requirements may also limit our ability to obtain the required SAFE approval and make the required registration, thecontribute additional capital to our PRC subsidiaries and limit our PRC subsidiaries’ ability to distribute dividends to our company. These risks may have a material adverse effect on our business, financial condition and results of such offshore parent company may be prohibited from making distributions of profit to the offshore parent and from paying the offshore parent proceeds from any reduction in capital, share transfer or liquidation in respect of the PRC subsidiaries. Further, failure to comply with the various SAFE approval and registration requirements described above, as currently drafted, could result in liability under PRC law for foreign exchange evasion.
operations.
Because Chinese law governs many of our material agreements, we may not be able to enforce our rights within the PRC or elsewhere, which could result in a significant loss of business, business opportunities or capital.
Chinese law governs many of our material agreements, some of which may be with Chinese governmental agencies. We cannot assure you that we will be able to enforce any of our material agreements or that remedies will be available outside of the PRC. The system of laws and the enforcement of existing laws and contracts in the PRC may not be as certain in implementation and interpretation as in the United States. The Chinese judiciary is relatively inexperienced in enforcing corporate and commercial law, leading to a higher than usual degree of uncertainty as to the outcome of any litigation. The inability to enforce or obtain a remedy under any of our future agreements could result in a significant loss of business, business opportunities or capital.
The ability of our Chinese operating subsidiary to pay certain foreign currency obligations, including dividends, is subject to restrictions.
Our ability to pay dividends may be restricted due to the foreign exchange control policies and availability of cash balances. Since most of our operations are conducted in China and a majority of our revenues are generated in China, a significant portion of our revenue earned and currency received are denominated in RMB. The Chinese government imposes controls on the convertibility of RMB into foreign currencies and, in certain cases, the remittance of currency out of China. RMB is currently not a freely convertible currency. Shortages in the availability of foreign currency may restrict our ability to remit sufficient foreign currency to pay dividends, if any, on our ordinary shares or otherwise satisfy foreign currency denominated obligations. Under existing Chinese foreign exchange regulations, payments of current account items, including profit distributions, interest payments and expenditures from the transaction, can be made in foreign currencies without prior approval from the State Administration of Foreign Exchange by complying with certain procedural requirements. However, approval from appropriate governmental authorities is required where RMB is to be converted into foreign currency and remitted out of China to pay capital expenses such as the repayment of bank loans denominated in foreign currencies. The Chinese government may also at its discretion restrict access in the future to foreign currencies for current account transactions. If the foreign exchange control system prevents us from obtaining sufficient foreign currency to satisfy our currency demands, we may not be able to pay certain of our expenses as they come due. In addition, current regulations in China permit Chinese subsidiaries to pay dividends to us only out of their accumulated distributable profits, if any, determined in accordance with Chinese accounting standards and regulations. In addition, Chinese subsidiaries are required to set aside at least 10% of its after-tax profits each year to the statutory reserved fund until such fund has reached 50% of their respective registered capital. Such reserve account may not be distributed as cash dividends.
If any dividend is declared in the future and paid in a foreign currency, you may be taxed on a larger amount in US dollars than the US dollar amount that you will actually ultimately receive.
If you are a U.S. holder, you will be taxed on the US dollar value of your dividends at the time you receive them, even if you actually receive a smaller amount of US dollars when the payment is in fact converted into US dollars. Specifically, if a dividend is declared and paid in a foreign currency, the amount of the dividend distribution that you must include in your income as a U.S. holder will be the US dollar value of the payments made in the foreign currency, determined at the conversion rate of the foreign currency to the US dollar on the date the dividend distribution is includible in your income, regardless of whether the payment is in fact converted into US dollars. Thus, if the value of the foreign currency decreases before you actually convert the currency into US dollars, you will be taxed on a larger amount in US dollars than the US dollar amount that you will actually ultimately receive.
PRC laws and other conditions
Legal regulations may limit our ability to make dividend payments to our shareholders.
We are a holding company in the British Virgin Islands, or the BVI. We generally rely on our PRC subsidiaries to provide us with cash flow and to meet our other obligations. Additionally, to the extent that the board determines that the company should pay dividends, it will likely have to rely on ourFor PRC subsidiaries, to provide the cash to be able to make the payments. Relevantrelevant PRC laws and regulations permit payment of dividends by a PRC subsidiary only from accumulated distributable profits, if any, determined in accordance with PRC accounting standards and regulations, and only after setting aside at least 10% of its current year profits (up to an aggregate amount equal to half of its registered capital). The PRC tax authorities may initiate changes in determining income of our PRC subsidiaries that would further limit their ability to pay dividends and make other distributions to us. It is therefore possible that our PRC subsidiaries will not have any distributable profit to pay us, even if they are profitable under U.S. GAAP.
The ability, as well as the decision, to declare dividends will also be influenced by the withholding taxes imposed on payments by companies in one jurisdiction to a company in another jurisdiction. For example, there is a 10% withholding tax imposed on a PRC company paying dividends to a company located in the BVI. This will reduce the value of any potential dividend to the ultimate shareholders, and therefore the board may determine that it would be a more prudent use of funds to reinvest funds that could be available for dividends into the business or acquire other businesses and assets.
Based on the articles of association and the Companies Act in Singapore and Malaysia, no dividend shall be payable except out of the profits of the companies. There is no limit to the number of dividend payable as long as there are sufficient profits. There is no withholding tax imposed on a Singapore and Malaysia company paying dividends to a company located outside of Singapore and Malaysia upon remittance.
Our business could be severely harmed if the Chinese government changes its policies, laws, regulations, tax structure or its current interpretations of its laws, rules and regulations relating to our operations in China.
Our principal manufacturing facility is located in China and the majority of our assets are located in China. We generate our most of our sales revenue from customers located in China. Therefore, our results of operations, financial state of affairs and future growth are, to a significant degree, subject to China’s economic, political and legal development and related uncertainties. Our operations and results could be materially affected by a number of factors, including, but not limited to
| · | Changes in policies by the Chinese government resulting in changes in laws or regulations or the interpretation of laws or regulations, |
| · |
| · |
| · |
| · |
| · |
Over the past several years, the Chinese government has pursued economic reform policies including the encouragement of private economic activities and greater economic decentralization. If the Chinese government does not continue to pursue its present policies that encourage foreign investment and operations in China, or if these policies are either not successful or are significantly altered, then our business could be harmed. Following the Chinese government’s policy of privatizing many state-owned enterprises, the ChineseThe China government has attempted to augment its revenues through increased tax collection. It also exercises significant control over China’s economic growth through the allocation of resources, controlling payment of foreign currency-denominated obligations, setting monetary policy and providing preferential treatment to particular industries or companies. Continued efforts to increase tax revenues could result in increased taxation expenses being incurred by us. Economic development may be limited as well by the imposition of austerity measures intended to reduce inflation, the inadequate development of infrastructure and the potential unavailability of adequate power and water supplies, transportation and communications. In addition, the Chinese government continues to play a significant role in regulating industry by imposing industrial policies.
The Chinese laws and regulations which govern our current business operations are sometimes vague and uncertain and may be changed in a way that hurts our business.
China’s legal system is a civil law system based on written statutes, in which system decided legal cases have less value as precedents, unlike the common law system prevalent in the United States or the BVI. There are substantial uncertainties regarding the interpretation and application of Chinese laws and regulations, including but not limited to the laws and regulations governing our business, or the enforcement and performance of our arrangements with customers in the event of the imposition of statutory liens, death, bankruptcy and criminal proceedings. The Chinese government has been developing a comprehensive system of commercial laws, and considerable progress has been made in introducing laws and regulations dealing with economic matters such as foreign investment, corporate organization and governance, commerce, taxation and trade. However, because these laws and regulations are relatively new, and because of the limited volume of published cases and judicial interpretation and their lack of force as precedents, interpretation and enforcement of these laws and regulations involve significant uncertainties. New laws and regulations that affect existing and proposed future businesses may also be applied retroactively. We are considered an FIE under Chinese laws, and as a result, we must comply with Chinese laws and regulations. We cannot predict what effect the interpretation of existing or new Chinese laws or regulations may have on our business. If the relevant authorities find us to be in violation of Chinese laws or regulations, they would have broad discretion in dealing with such a violation, including, without limitation: levying fines; revoking our business and other licenses; requiring that we restructure our ownership or operations; and requiring that we discontinue any portion or all of our business.
A slowdown or other adverse developments in the Chinese economy may materially and adversely affect our customers’ demand for our services and our business.
The majorityA substantial portion of our operations are conducted in China and much of our revenues are generated from sales to businesses operating in China. Although the Chinese economy has grown significantly in recent years, such growth may not continue. Currently, some sectors of the economy are experiencing a slowdown in business activity.activity, the economic slowdown is having a negative impact on the middle-end and low-end of the industrial automation market in China. We do not know how sensitive we might be to a slowdown in general economic growth or other adverse changes in Chinese economy which may affect demand for our products and services. A slowdown in overall economic growth, an economic downturn or recession or other adverse economic developments in China may materially reduce the demand for our products and services and, in turn, reduce our results of operations.
The implementation of PRC employment law is likely to result in increased labor costs in China, which may effectaffect our business and profitability.
The Labor Contract Law, which became effective on January 1, 2008, imposes on employersemployers’ requirements to enter into fixed-term employment contracts, and effects the recruitment of temporary employees and dismissal of employees. In addition, under the Regulations on Paid Annual Leave for Employees, which also became effective on January 1, 2008, employees who have worked continuously for more than one year are entitled to paid vacation time ranging from 5 to 15 days, depending on the length of the employee’s service. Employees who waive such vacation entitlements at the request of the employer will be compensated for three times their normal daily salaries for each vacation day so waived. On July 1, 2011, China promulgated the Social Insurance Law to unify pervious scattered laws relating to social insurance matters. The law clarifies that the social insurance system in China includes pension insurance, medical insurance, unemployment insurance, work-related injury insurance and maternity insurance, all of which are mandatory benefits for employees of companies operating in China. Employers are required to make contributions under these insurance schemes, which although local in rates, are overall expected to increase employee expense over time. There is no assurance that disputes, work stoppages or strikes will not arise in the future over these and other matters. Increases in the labor costs or future disputes with our employees could damage our business, financial condition or operating results.
The Security Review Rules may make it more difficult for us to make future acquisitions or dispositions of our business operations or assets in China.
The Security Review Rules, effective as of September 1, 2011, provides that when deciding whether a specific merger or acquisition of a domestic enterprise by foreign investors is subject to the national security review by MOFCOM, the principle of substance-over-form should be applied and foreign investors are prohibited from circumventing the national security review requirement by structuring transactions through proxies, trusts, indirect investments, leases, loans, control through contractual arrangements or offshore transactions. If the business of any target company that we plan to acquire falls within the scope subject to national security review, we may not be able to successfully acquire such company by equity or asset acquisition, capital increase or even through any contractual arrangement.
We face uncertainty from China’s Circular on Strengthening the Administration of Enterprise Income Tax on Nonresident Enterprises’ Share Transfer that was released in December 2009 with retroactive effect from January 1, 2008.
The Chinese State Administration of Taxation, or SAT, released a circular on December 15, 2009 that addresses the transfer of shares by nonresident companies, generally referred to as Circular 698. Circular 698, which is effective retroactively to January 1, 2008, may have a significant impact on many companies that use offshore holding companies to invest in China.
Circular 698, which provides parties with a short period of time to comply with its requirements, indirectly taxes foreign companies on gains derived from the indirect sale of a Chinese company. Where a foreign investor indirectly transfers equity interests in a Chinese resident enterprise by selling the shares in an offshore holding company, and the latter is located in a country or jurisdiction where the effective tax burden is less than 12.5% or where the offshore income of his, her, or its residents is not taxable, the foreign investor is required to provide the tax authority in charge of that Chinese resident enterprise with the relevant information within 30 days of the transfers. Moreover, where a foreign investor indirectly transfers equity interests in a Chinese resident enterprise through an abuse of form of organization and there are no reasonable commercial purposes such that the corporate income tax liability is avoided, the PRC tax authority will have the power to re-assess the nature of the equity transfer in accordance with PRC’s “substance-over-form” principle and deny the existence of the offshore holding company that is used for tax planning purposes. There is uncertainty as to the application of Circular 698. For example, while the term “indirectly transfer” is not defined, it is understood that the relevant PRC tax authorities have jurisdiction regarding requests for information over a wide range of foreign entities having no direct contact with China. Moreover, the relevant authority has not yet promulgated any formal provisions or formally declared or stated how to calculate the effective tax in the country or jurisdiction and to what extent and the process of the disclosure to the tax authority in charge of that Chinese resident enterprise. In addition, there are not any formal declarations with regard to how to decide “abuse of form of organization” and “reasonable commercial purpose,” which can be utilized by us to balance if our Company complies with the Circular 698. As a result, we may become at risk of being taxed under Circular 698 and we may be required to expend valuable resources to comply with Circular 698 or to establish that we should not be taxed under Circular 698, which could have a material adverse effect on our financial condition and results of operations.
Under the EIT Law, we may be classified as a “resident enterprise” of China. Such classification will likely result in unfavorable tax consequences to us and our non-PRC shareholders.
Under the Enterprise Income Tax Law, or the EIT Law, and implementing rules, both of which became effective on January 1, 2008, an enterprise established outside of China with “de facto management bodies” within China is considered a “resident enterprise,” meaning that it can be treated in a manner similar to a Chinese domestic enterprise for enterprise income tax purposes. The implementing rules of the EIT Law define de facto management as “substantial and overall management and control over the production and operations, personnel, accounting, and properties” of the enterprise.
On April 22, 2009, the State Administration of Taxation issued the Notice Concerning Relevant Issues Regarding Cognizance of Chinese Investment Controlled Enterprises Incorporated Offshore as Resident Enterprises pursuant to Criteria of de facto Management Bodies, or the Notice, further interpreting the application of the EIT Law and its implementation for non-Chinese enterprises or group controlled offshore entities. Pursuant to the Notice, an enterprise incorporated in an offshore jurisdiction and controlled by a Chinese enterprise or group will be classified as a “non-domestically incorporated resident enterprise” if (i) its senior management in charge of daily operations reside or perform their duties mainly in China; (ii) its financial or personnel decisions are made or approved by bodies or persons in China; (iii) substantial assets and properties, accounting books, corporate chops, board and shareholder minutes are kept in China; and (iv) at least half of its directors with voting rights or senior management often resident in China. A resident enterprise would be subject to an enterprise income tax rate of 25% on its worldwide income and must pay a withholding tax at a rate of 10% when paying dividends to its non-PRC shareholders. However, it remains unclear as to whether the Notice is applicable to an offshore enterprise incorporated by a Chinese natural person. Nor are detailed measures on imposition of tax from non-domestically incorporated resident enterprises are available. Therefore, it is unclear how tax authorities will determine tax residency based on the facts of each case.
We may be deemed to be a resident enterprise by Chinese tax authorities. If the PRC tax authorities determine that Hollysys is a “resident enterprise” for PRC enterprise income tax purposes, a number of unfavorable PRC tax consequences could follow. First, we may be subject to the enterprise income tax at a rate of 25% on our worldwide taxable income as well as PRC enterprise income tax reporting obligations. In our case, this would mean that income such as interest on financing proceeds and non-China source income would be subject to PRC enterprise income tax at a rate of 25%. Second, although under the EIT Law and its implementing rules, dividends paid to us from our PRC subsidiaries would qualify as “tax-exempt income,” we cannot guarantee that such dividends will not be subject to a 10% withholding tax, as the PRC foreign exchange control authorities, which enforce the withholding tax, have not yet issued guidance with respect to the processing of outbound remittances to entities that are treated as resident enterprises for PRC enterprise income tax purposes. Finally, it is possible that future guidance issued with respect to the new “resident enterprise” classification could result in a situation in which a 10% withholding tax is imposed on dividends we pay to our non-PRC shareholders and with respect to gains derived by our non-PRC shareholders from transferring our shares.
We may be exposed to liabilities under the Foreign Corrupt Practices Act and Chinese anti-corruption laws, and any determination that we violated these laws could have a material adverse effect on our business.
We are subject to the Foreign Corrupt Practice Act, or FCPA, and other laws that prohibit improper payments or offers of payments to foreign governments and their officials and political parties by U.S. persons and issuers as defined by the statute, for the purpose of obtaining or retaining business. We have operations, agreements with third parties, and make most of our sales in China. The PRC also strictly prohibits bribery of government officials. Our activities in China create the risk of unauthorized payments or offers of payments by the employees, consultants, sales agents, or distributors of our Company, even though they may not always be subject to our control. It is our policy to implement safeguards to discourage these practices by our employees. However, our existing safeguards and any future improvements may prove to be less than effective, and the employees, consultants, sales agents, or distributors of our Company may engage in conduct for which we might be held responsible. Violations of the FCPA or Chinese anti-corruption laws may result in severe criminal or civil sanctions, and we may be subject to other liabilities, which could negatively affect our business, operating results and financial condition. In addition, the U.S. government may seek to hold our Company liable for successor liability FCPA violations committed by companies in which we invest or that we acquire.
If we become directly subject to the recent scrutiny, criticism and negative publicity involving U.S.-listed Chinese companies, we may have to expend significant resources to investigate and resolve the matter which could harm our business operations, stock price and reputation and could result in a loss of your investment in our stock, especially if such matter cannot be addressed and resolved favorably.
Recently, U.S. public companies that have substantially all of their operations in China, particularly companies like us which have completed so-called reverse merger transactions, have been the subject of intense scrutiny, criticism and negative publicity by investors, financial commentators and regulatory agencies, such as the SEC. Much of the scrutiny, criticism and negative publicity has centered around financial and accounting irregularities and mistakes, a lack of effective internal controls over financial accounting, inadequate corporate governance policies or a lack of adherence thereto and, in many cases, allegations of fraud. As a result of the scrutiny, criticism and negative publicity, the publicly traded stock of many U.S. listed Chinese companies has sharply decreased in value and, in some cases, has become virtually worthless. Many of these companies are now subject to shareholder lawsuits and SEC enforcement actions and are conducting internal and external investigations into the allegations. It is not clear what effect this sector-wide scrutiny, criticism and negative publicity will have on our Company, our business and our stock price. If we become the subject of any unfavorable allegations, whether such allegations are proven to be true or untrue, we will have to expend significant resources to investigate such allegations and/or defend our company. This situation will be costly and time consuming and distract our management from growing our company.
The disclosures in our reports and other filings with the SEC and our other public pronouncements are not subject to the scrutiny of any regulatory bodies in the PRC. Accordingly, our public disclosure should be reviewed in light of the fact that no governmental agency that is located in China where substantially all of our operations and business are located have conducted any due diligence on our operations or reviewed or cleared any of our disclosure.
We are regulated by the SEC and our reports and other filings with the SEC are subject to SEC review in accordance with the rules and regulations promulgated by the SEC under the Securities Act and the Exchange Act. Unlike public reporting companies whose operations are located primarily in the United States, however, substantially all of our operations are located in China. Since substantially all of our operations and business takes place in China, it may be more difficult for the staff of the SEC to overcome the geographic and cultural obstacles that are present when reviewing our disclosure. These same obstacles are not present for similar companies whose operations or business take place entirely or primarily in the United States. Furthermore, our SEC reports and other disclosure and public pronouncements are not subject to the review or scrutiny of any PRC regulatory authority. For example, the disclosure in our SEC reports and other filings are not subject to the review of the China Securities Regulatory Commission, a PRC regulator that is tasked with oversight of the capital markets in China. Accordingly, you should review our SEC reports, filings and our other public pronouncements with the understanding that no local regulator has done any due diligence on our company and with the understanding that none of our SEC reports, other filings or any of our other public pronouncements has been reviewed or otherwise been scrutinized by any local regulator.
RISKS RELATED TO OUR SHARES
The market price of our ordinary shares is volatile, leading to the possibility of its value being depressed at a time when you want to sell your holdings.
The market price of our ordinary shares is volatile, and this volatility may continue. Numerous factors, many of which are beyond our control, may cause the market price of our ordinary shares to fluctuate significantly. These factors include:
| · | our earnings releases, actual or anticipated changes in our earnings, fluctuations in our operating results or our failure to meet the expectations of financial market analysts and investors; |
| · | changes in financial estimates by us or by any securities analysts who might cover our stock; |
| · | speculation about our business in the press or the investment community; |
| · | significant developments relating to our relationships with our customers or suppliers; |
| · | stock market price and volume fluctuations of other publicly traded companies and, in particular, those that are in the same industry as we are; |
| · | customer demand for our products; |
| · | investor perceptions of the automation and control industry in general and our company in particular; |
| · | the operating and stock performance of comparable companies; |
| · | general economic conditions and trends; |
| · | major catastrophic events; |
| · | announcements by us or our competitors of new products, significant acquisitions, strategic partnerships or divestitures; |
| · | changes in accounting standards, policies, guidance, interpretation or principles; |
| · | loss of external funding sources; |
| · | failure to maintain compliance with |
| · | sales of our ordinary shares, including sales by our directors, officers or significant shareholders; and |
| · | additions or departures of key personnel. |
Securities class action litigation is often instituted against companies following periods of volatility in their stock price. This type of litigation could result in substantial costs to us and divert our management’s attention and resources.
Moreover, securities markets may from time to time experience significant price and volume fluctuations for reasons unrelated to operating performance of particular companies. For example, from October 2008 until June 2009, securities markets in the United States, China and throughout the world experienced a historically large decline in share price. These market fluctuations may adversely affect the price of our ordinary shares and other interests in our company at a time when you want to sell your interest in us.
We are a “foreign private issuer,” and have disclosure obligations that are different than those of other U.S. domestic reporting companies so you should not expect to receive the same information about us at the same time as a U.S. domestic reporting company may provide.Furthermore, if we lose our status as a foreign private issuer, we would be required to comply fully with the reporting requirements of the Exchange Act applicable to U.S. domestic issuers and would incur significant operational, administrative, legal and accounting costs that we would not incur as a foreign private issuer.
We are a foreign private issuer and, as a result, we are not subject to certain of the requirements imposed upon U.S. domestic issuers by the SEC. For example, we are not required to issue quarterly reports or proxy statements. Also, we are allowed four months to file our annual report with the SEC. We are not required to disclose certain detailed information regarding executive compensation that is required from U.S. domestic issuers. Further, our directors and executive officers are not required to report equity holdings and transactions in our equity under Section 16 of the Securities Act. As a foreign private issuer, we are also exempt from the requirements of Regulation FD (Fair Disclosure) which, generally, are meant to ensure that select groups of investors are not privy to specific information about an issuer before other investors. We are, however, still subject to the anti-fraud and anti-manipulation rules of the SEC, such as Rule 10b-5. Since many of the disclosure obligations required of us as a foreign private issuer are different than those required by other U.S. domestic reporting companies, our shareholders should not expect to receive information about us in the same amount and at the same time as information is received from, or provided by, other U.S. domestic reporting companies. We are liable for violations of the rules and regulations of the SEC which do apply to us as a foreign private issuer. Violations of these rules could affect our business, results of operations and financial condition.
If we lose our status as a foreign private issuer at some future time, we will be required to comply fully with the reporting requirements of the Exchange Act applicable to U.S. domestic issuers and would incur significant operational, administrative, legal and accounting costs that it would not incur as a foreign private issuer.
The payment of cash dividends depends on the decision of the Board of Directors and the cash and legal requirements of our company.
The Board of Directors decides if and when the company will pay cash dividends. The decision to pay dividends will depend on many factors from time to time, including the cash needs of the company and its subsidiaries, the legal requirements of Chinese companies to maintain stated capital amounts, and the tax policies of the various jurisdictions in which we operate. There can be no assurance that there will be regular cash dividends.
You may have difficulty enforcing judgments obtained against us.
We are a BVI company and substantially all of our assets are located outside of the United States. The majorityVirtually all of our assets and a substantial portion of our current business operations are conducted in the PRC. In addition, almost all of our directors and officers are nationals and residents of countries other than the United States. TheA substantial portion of the assets of these persons are located mostly outside the United States. As a result, it may be difficult for you to effect service of process within the United States upon these persons. It may also may be difficult for you to enforce in U.S. courts judgments obtained in U.S. courts including judgments based on the civil liability provisions of the U.S. federal securities laws against us and our officers and directors.directors, many of whom are not residents in the United States and whose assets are located in significant part outside of the United States. The courts of the BVI would recognize as a valid judgment, a final and conclusive judgment in personam obtained in the federal or state courts in the United States against the Company under which a sum of money is payable (other than a sum of money payable in respect of multiple damages, taxes or other charges of a like nature or in respect of a fine or other penalty) and would give a judgment based thereon provided that (a) such courts had proper jurisdiction over the parties subject to such judgment, (b) such courts did not contravene the rules of natural justice of the BVI, (c) such judgment was not obtained by fraud, (d) the enforcement of the judgment would not be contrary to the public policy of the BVI, (e) no new admissible evidence relevant to the action is submitted prior to the rendering of the judgment by the courts of the BVI and (f) there is due compliance with the correct procedures under the laws of the BVI. In addition, there is uncertainty as to whether the courts of the British Virgin IslandsBVI or the PRC, respectively, would recognize or enforce judgments of U.S. courts against us or such persons predicated upon the civil liability provisions of the securities laws of the United States or any state. ItIn addition, it is uncertain whether such British Virgin IslandsBVI or PRC courts would be competent to hearentertain original actions brought in the courts of the BVI or the PRC, against us or such persons basedpredicated upon the securities laws of the United States or any state thereof.state.
Because we are incorporated under the laws of the BVI, it may be more difficult for our shareholders to protect their rights than it would be for a shareholder of a corporation incorporated in another jurisdiction.
Our corporate affairs are governed by our Memorandum and Articles of Association and by the BVI Business Companies Act, 2004 of the BVI. Principles of law relating to such matters as the validity of corporate procedures, the fiduciary duties of management and the rights of our shareholders differ from those that would apply if we were incorporated in the United States or another jurisdiction. The rights of shareholders under BVI law are not as clearly established as are the rights of shareholders in many other jurisdictions. Under the laws of most jurisdictions in the United States, majority and controlling shareholders generally have certain fiduciary responsibilities to the minority shareholders. Shareholder action must be taken in good faith, and actions by controlling shareholders which are obviously unreasonable may be declared null and void. BVI law protecting the interests of minority shareholders may not be as protective in all circumstances as the law protecting minority shareholders in US jurisdictions. In addition, the circumstances in which a shareholder of a BVI company may sue the company derivatively, and the procedures and defenses that may be available to the company, may result in the rights of shareholders of a BVI company being more limited than those of shareholders of a company organized in the US. Furthermore, our directors have the power to take certain actions without shareholder approval which would require shareholder approval under the laws of most US jurisdictions. The directors of a BVI corporation, subject in certain cases to court approval but without shareholder approval, may implement a reorganization, merger or consolidation, the sale of any assets, property, part of the business, or securities of the corporation. The ability of our board of directors to create new classes or series of shares and the rights attached by amending our Memorandum of Association and Articles of Association without shareholder approval could have the effect of delaying, deterring or preventing a change in our control without any further action by the shareholders, including a tender offer to purchase our ordinary shares at a premium over then current market prices. Thus, our shareholders may have more difficulty protecting their interests in the face of actions by our board of directors or our controlling shareholders than they would have as shareholders of a corporation incorporated in another jurisdiction.
We may be classified as a passive foreign investment company, which could result in adverse United States federal income tax consequences to U.S. shareholders.
We believe that we are not considered a “passive foreign investment company,” or PFIC, for United States federal income tax purposes for our tax year ended June 30, 2012.2014. However, each year we must make a separate determination as to whether we are a PFIC. We cannot assure you that we will not be a PFIC for our tax year ending June 30, 20132015 or any following tax year. If a non-U.S. corporation either (i) has at least 75% of its gross income is passive income for a tax year or (ii) has at least 50% of the value of its assets (based on an average of the quarterly values of the assets during a tax year) attributable to assets that produce or are held for the production of passive income, then the non-U.S. corporation will be deemed a PFIC. The market value of our assets may be determined to a large extent by the market price of our ordinary shares. If we are treated as a PFIC for any tax year during which U.S. shareholders hold ordinary shares, certain adverse United States federal income tax consequences could apply to such U.S. holders.
Our Shareholder Rights Plan and charter documents may hinder or prevent change of control transactions.
Our shareholder rights plan and provisions contained in our Memorandum and Articles of Association may discourage transactions involving an actual or potential change in our ownership. In addition, our Memorandum and Articles of Association authorizes our board of directors to issue up to 90,000,000 shares of preferred stock without any further action by the stockholders. Please see Item 10, Additional Information for more information regarding our shareholder rights plan. Such restrictions and issuances could make it more difficult, delay, discourage, prevent or make it more costly to acquire or effect a change-in-control, which in turn could prevent our stockholders from recognizing a gain in the event that a favorable offer is extended and could materially and negatively affect the market price of our ordinary shares, even if you or our other stockholders believe that such actions are in the best interests of us and our stockholders.
| ITEM 4. | INFORMATION ON THE COMPANY |
A. History and Development of the Company
| A. | History and Development of the Company |
We were established under the laws of the BVI on February 6, 2006, as HLS Systems International, Ltd., in order to merge with Chardan North China Acquisition Corporation (“Chardan”), a Delaware special purpose acquisition company, originally established on March 10, 2005, with the primary purpose of effecting a business combination with an unidentified operating business that has its primary operating facilities located in China, in any city or province north of Yangtze River. On September 20, 2007, we acquired all of the issued and outstanding ordinary shares of GTH, a BVI company. Simultaneously with the acquisition, Chardan merged with and into us, all of the common stock of Chardan was converted intoOn August 1, 2008, our ordinary shares started trading on a one-to-one basis, and we assumed the then outstanding Chardan warrants. As a result of the foregoing transactions, we acquired a controlling interest in Beijing Hollysys and Hangzhou Hollysys, and an indirect interest in their majority and minority owned subsidiaries, and the consolidated financial statements of Beijing Hollysys and Hangzhou Hollysys became our historical financial statements for accounting and reporting purposes.NASDAQ Global Market. On July 17, 2009, we changed our name to Hollysys Automation Technologies Ltd. to more accurately reflect our core value of leveraging proprietary technologies to provide state-of-the-art automation and control solutions for our clients.
GTH and Subsidiaries
GTH was established under the laws of the BVI on September 21, 2005, as a holding company for our indirect PRC subsidiaries, Beijing Hollysys and Hangzhou Hollysys.
Beijing Hollysys was established in September 1996 as a domestic Chinese company based in Beijing, China. From inception, Beijing Hollysys has been engaged in designing, developing and manufacturing automation control systems for customers throughout China. Beijing Hollysys offers integrated automation solutions for many industries, including electric power generation, transmission and distribution, manufacturing (including metallurgy, construction materials, petrochemical and pharmaceutical industries), and railroad transportation. Beijing Hollysys’ integrated automation systems and solutions have enabled customers to improve the safety, reliability and efficiency of their manufacturing processes and significantly enhance the customers’ overall profitability. Hangzhou Hollysys was established as an equity joint venture under Chinese laws in September 2003. The operations of Hangzhou Hollysys focus on industrial automation and integrated solutions.
During the period from December 2007 to March 2008, we established a series of wholly owned subsidiaries, including (i) Beijing Hollysys Group, a Chinese domestic enterprise which acquired the original shareholders’ 74.11% equity interest in Beijing Hollysys; (ii) Helitong, a wholly foreign owned enterprise in China which acquired the original shareholders’ 100% equity interest in Beijing Hollysys Group; (iii) World Hope, a Hong Kong company which acquired the original shareholders’ 100% equity interest in Helitong; and (iv) Clear Mind, a BVI company which acquired the original shareholders’ 100% equity interest in World Hope. Through this series of ownership arrangement, we obtained the 74.11% legal ownership of Beijing Hollysys instead of through consignment agreements. However, there can be no assurance that the PRC authorities will not, in the future, challenge the appropriateness of the procedures of the transferring of the ownership of the PRC subsidiaries as the Company did not directly go through the procedures required by the M&A Regulations.
On July 1, 2009,2011, we completed the acquisition of 1.78% equity interest in Beijing Hollysys from the noncontrolling interest holder for a consideration of RMB 18 million (approximately $2,638,793), and held 75.89% equity interest of Beijing Hollysys upon the completion of the acquisition.
On December 23, 2009, we entered into a share sale and purchase agreement, or the Share Purchase Agreement, with Unionway Resources Limited, a business company incorporated in the BVI, or the Seller, pursuant to which, among other things, the Company acquired 24.11% equity interests of Beijing Hollysys. As the consideration for the acquisition of the equity interest, we agreed to:
1) issue 4,413,948 ordinary shares, or the Shares, to the Seller, and
2) pay cash RMB 67,634,366.25 (approximately$9,917,063) to the Seller.
The Shares were issued to the Seller and its designee on March 16, 2010. As a result of the acquisition of the equity interest, we indirectly ownpurchased 100% of Beijing Hollysys.
On September 1, 2009, Beijing Hollysys entered into an agreement with two equity owners of WoDeWeiYe to acquire 51% equity interest in of WoDeWeiYe for a cash consideration of RMB 2 million (approximately $294,477). Upon the acquisition, WoDeWeiYe became a subsidiary of the Company,CEPL, CCPL, CESB and the operating result of WoDeWeiYe was included in the Hollysys’s consolidated financial statements effective from September 1, 2009. We acquired WoDeWeiYe to engage in the intelligent electric meter business and to further build up our foothold in subway automation sector.
On June 4, 2010, Beijing Hollysys Group invested RMB 10 million (approximately $1,464,536) to establish a wholly owned subsidiary, Beijing Hollysys Electronics, which engages in the business of automation equipment manufacturing and assembly.
On June 4, 2010, Beijing Hollysys Group invested RMB 5.10 million (approximately $746,913) to establish a subsidiary, Hollycon, which engages in the medical automation equipment manufacturing business.
OnMarch 9, 2011,Beijing Hollysys invested RMB 10 million (approximately $1,520,751) to establish a subsidiary, Xi’an Hollysys, which engages in the research and development business.
On April 15, 2011, Beijing Hollysys Group invested RMB 10 million (approximately $1,528,585) to establish a subsidiary, Hollysys Investments, which engages in the investment management and consulting business.
HAP and Subsidiaries
On November 19, 2007, we entered into a sales and purchase agreement with Fulbond Systems Pte. Ltd., or Fulbond Systems, a Singapore based company partially owned by Mr. Kiam Fee Yau, an ex-director of the company, to acquire a 100% interest of Fulbond Systems for a price of SGD$1,066,234 (approximately $744,596). Pursuant to the sales and purchase agreement, the closing day of this acquisition was November 30, 2007 and after the ownership transfer, we changed the name of Fulbond Systems to “Hollysys (Asia Pacific) Pte. Limited,” or HAP. The purchase price was paid in cash on December 11, 2007. As a result of the transaction, HAP becomes our wholly owned subsidiary and the its operating results are included in our consolidated financial statements, effective from December 1, 2007. We acquired HAP to serve as our Asia Pacific headquarters to market our automation products within the region as well as in other overseas countries.
On May 18, 2011, we entered into a stock purchase agreement with the stockholders of Concord, a Singapore headquartered electrification related service provider to rail and industrials in South-East Asia and the Middle East, to acquire a 100% interest of Concord, including Concord Corporation Pte. Ltd., and its subsidiaries Concord Electrical Pte. Ltd., Concord Electrical Sdn. Bhd. incorporated in Malasia, and Concord Corporation Pte. Ltd. Dubai Branch.CCPL Dubai. The consideration iswas a combination of cash and stock, with a total value of approximately $42.9 million which, consisted of:
| 1) | SGD 41.5 million cash (approximately $33,789,285), which was paid in two equal installments of SGD 20.75 million |
| 2) | 1,006,788 ordinary shares of Hollysys, with a market value of approximately $9,121,499 as of July 1, 2011, the closing date, which were issued to the seller on September 2, 2011. |
Concord provides electric solutions with end-to-end design, engraving, engineering, procurement, project management, construction and commissioning, and maintenance, active in the rail industry in Singapore, UAE and Saudi Kingdom and the building retrofit market in Singapore. Through the acquisition, the Company seeks to expand the existing distribution and marketing channels to cross sell the Company’s existing product lines in rail and industrial segments to fast growing South-East Asia and the Middle East markets. The effective dateoperating results of the acquisition of Concord was July 1, 2011, at which time it became a wholly owned subsidiary of the Company, and its operation results are included in our consolidated financial statements effective from July 1, 2011.
On May 9, 2012, HAP invested HKD 10,000 (approximately $1,288)April 1, 2013, we purchased 100% of the equity of Bond for a purchase price of approximately US$73 million, payable 50% in cash and 50% in ordinary shares of Hollysys. The stock will be issued to establishthe Bond shareholders in three installments over three years, 60% of which are incentive shares and will be based on certain performance targets for calendar years 2013 and 2014. Additional ordinary shares, as a subsidiary, CSHK, which engagespremium on performance, will be issuable to the Bond shareholders, if Bond outperforms the established targets, but the premium will not exceed 15% of the total incentive shares in developing the automation businessany case. The operating results of Bond have been included in Hong Kong.our consolidated financial statements effective from April 1, 2013. Bond provides complete mechanical and electrical solutions with end to end capabilities in design, engineering, procurement, project management, construction and commissioning, and maintenance to a wide array of industries, including factories, data centers, banks, hospitals, airports, power stations, gas and instrumentation plants, hotels, commercial centers, residential buildings and infrastructure works. We seek to take advantage of Bond’s strong presence and brand name in Southeast Asia and to strengthen our Southeast Asian business.
B. Business Overview
| B. | Business Overview |
We are a leading provider of automation and control technologies and applicationsproducts in China and increasingly in Southeast Asia and the Middle East that enable our diversified industry and utility customers to improve operating safety, reliability, and efficiency. Founded in 1993, we have approximately 3,5003,600 employees with a nationwide China presence in overaround 50 cities in China and with subsidiaries and offices in SingaporeSoutheast Asia and the Middle East. We serve over 4,000approximately 5,000 customers in the industrial, building retrofit, railway, subway, and nuclear power, and mechanical and electronic industries in China, Southeast Asia, and Southeast Asia.the Middle East. Our proprietary technologies are applied through our industrial automation solution suite, including the DCS (Distributed Control System), PLC (Programmable Logic Controller), RMIS (Real-time Management Information System), HAMS (HolliAS Asset Management System), OTS (Operator Training System), HolliAS BATCH (Batch Application Package), HolliAS APC Suite (Advanced Process Control Package), SIS (Safety Instrumentation System), high-speed railway signaling system of TCC (Train Control Center), ATP (Automatic Train Protection), Subway Supervisory and Control platform, SCADA (Surveillance Control and Data Acquisition), nuclear conventional islandpower non-safety automation and control system HolliAs-NMS DCS and other products.
We historically focused our efforts on the area of DCS, which are networks of controllers, sensors, actuators and other devices that can be programmed to control outputs based on input conditions and/or algorithms, which are mainly used to control continuous manufacturing processes. Our DCS have been widely used in the industries involving continuous flow of material handling, such as power generation, petro-chemical, chemical, cement manufacturing, paper mills, and waste water recycling. We have also entered the PLC market, which is mainly used in discreet control applied to a wide array of industries. PLCs are usually integrated together into machines providing control at the machinery level. With more of our proprietary products introduced into the market and the behavioral change of customers’ purchasing practice, we gradually have changed our market and sales positioning from being a single DCS/PLC product provider, to being a total solution provider encompassing third-party hardware-centric products such as instrumentation and actuators, our proprietary DCS/PLC products, and valued-added software packages such as AMS (Asset Management System), MES (Manufacturing Execution System), APC (Advanced Process Control), OTS Simulation (Operator Training System),and others.. The safety system SIS (Safety Instrumentation System), certified under European safety standards and newly introduced to the market in July 2012 will further round out our proprietary product suite in the industrial automation segment.
We also branched out from the industrial automation domain into the subway and surface rail businesses, leveraging on our core competency and strong research and development capabilities, and have already established a leading position in the high-speed rail signaling market and subway SCADA (Surveillance Control and Data Acquisition) market. We also command a position in China’s nuclear power automation and control market as the only proven local automation and control product provider to the non-safety control for both nuclear island and conventional island of nuclear power reactors in nuclear power stations. Through our joint venture established with China GuangdongGeneral Nuclear Power Holdings Co., Ltd.,Corporation in 2005, China Techenergy Co., Ltd., we have access to all the nuclear reactors being contracted to our joint venture partner, which is currently holding roughly 60% of China’s nuclear market share. Through Concord, we are able to provide end-to-end complete electrification related services in rail, power, semi-conductor, pharmaceutical, petrochemical and other industrial sectors by working with multinational corporations and Hollysys. We believe that our present leadership position in the high-growth segments is attributable to our vision, execution, and strong research and development capabilities.
We have a substantial reputation in the industry for our comprehensive capabilities in the PRC domestic industrial automation marketindustry for our comprehensive capabilities and have concentrated our focusfocused on the development of this market. We carry out integrated solution projects for, render automation services to, or sell our products and services to, or carry out engineering projects for, national or multi-provincial companies with subsidiaries located across 30 provinces in China. To date, we have served more than 4,0005,000 industrial enterprise customers including state-owned enterprises, multinational corporations and local private companies and have undertaken over 10,00019,000 projects. We believe that the quality of our systems is unsurpassed by local Chinese competitors and is comparable to high-end foreign suppliers of DCS and the history of our projects supports that view. For example, after three years of review and analysis, BASF, a large multi-national company, has designated us as a potential qualified DCS vendor for the company, a distinction shared with large multinationals such as ABB and Emerson.
We have also entered the PLC market, which is mainly used in discreet control applied to a wide array of industries. PLCs are usually integrated together into machines providing control at the machinery level. With more of our proprietary products introduced into the market and the behavioral change of customers’ purchasing practice, we gradually changed our market and sales positioning from a single DCS/PLC product provider, to a total solution provider encompassing third-party hardware-centric products such as instrumentation and actuators, our proprietary DCS/PLC products, and valued-added software packages such as AMS (Asset Management System), MES (Manufacturing Execution System), APC (Advanced Process Control), OTS Simulation (Operator Training System), and others. The safety system SIS (Safety Instrumentation System), certified under European safety standards and newly introduced to the market in July 2012 will further round out our proprietary product suite in the industrial automation segment.
We have branched out from the industrial automation domain into the subway and surface rail businesses, leveraging on our core competency and strong research and development capabilities, and have already established a leading position in the high-speed rail signaling market and subway SCADA (Supervisory Control and Data Acquisition) market. Besides, we have developed our proprietary high-speed rail signaling system and subway signaling system, and certified both according to European Safety Standard Certification Level 4.
Internationally, we have a strong presence through Concord and Bond in Southeast Asia and increasingincreasingly in the Middle East and through Hollysys marketing efforts in Hong Kong SAR. Through these acquisitions, we are expanding and deepening our ability to offer mechanical and electrical solutions in design, engineering, procurement, project management, construction and commissioning, and maintenance to a wide range of industries, such as manufacturing, banks, hospitals, airports, power plants, commercial centers, hotels, and infrastructure works. We believe that our present leadership position in the high-growth segments is attributable to our vision, execution, and strong research and development capabilities.
During the past yearseveral years we have achieved a number of significant contract wins, including (i) contracts with MTR Corporation of Hong Kong SAR to provide a complete suite of high-speed rail signaling systems to Guangzhou-Shenzen-HongGuangzhou-Shenzhen-Hong Kong Express Rail Hong Kong Section, andSection; (ii) a contract with Sendan International Co.,SMRT Trains Ltd. in Singapore to provide design, electrification and installation for station renovations on North-South and East-West lines and a contract with Thales Solutions Asia Pte. Ltd. to provide electrical, instrumentationdesign, installation, testing and control installation workscommission for Rabigh Power Plant IIreplacing the existing signaling systems for the North-South and East-West lines and install new signaling systems for the Tuas West Extension line in Rabigh, Saudi Arabia, which is powered by natural gas and oil. OurSingapore; (iii) a contract with Land Transport Authority in Singapore to provide the Integrated Supervisory Control System for the Thomson & Eastern Region Lines in Singapore. We believe that our international stature will be further enhanced by our obtaining international certifications such as the European Safety Standard Certification Level 4 which relates tofor our proprietary high-speed rail signaling and subway signaling systems.
Our revenue increased from approximately $157.5$262.8 million in fiscal year 2009,2011, to approximately $321.7$521.3 million in fiscal year 2012,2014, representing a compounded annual growth rate (CAGR) of approximately 26.9%25.6% for the past three years. During the same period, our non-GAAP net income attributable to Hollysys increased by a CAGR of 30.7%.approximately 27.4% from $42.0 million in fiscal year 2011 to $86.9 million in fiscal year 2014. These significant increases reflect our success in exploring new business areas and our increasing market penetration. We continually seek to broaden our market reach by introducing new products and improving our profit margin through new business areas such as railway control systems and nuclear power plant control, while exploring international market to fulfill our mission of sustainable and high growth.
Strategy
OurThe goal for Hollysys is to become one of the world's leadingwell-known automation and control technology and product providers. To meet this goal we plan to enhance the core competencies that have made us a leading domestic automation and control technology and applicationsolutions provider in China, the only Chinese company qualified to design and manufacture non-safety control systems of nuclear power stations, and a leader in the industrial automation and in the high-speed rail and subway sectors. The principal elements of our core business strategies are as follows:
| · | To further establish our leadership position as a dominant automation and control |
| · | To continuously enhance our leadership position in technology – We have long been recognized as a pioneer in the development of industrial automation and control technology and applications in China. We are continuously seeking ways to improve our existing product lines while being committed to the development of new applications, platforms, and products. In order to maintain our leadership in technology, we have devoted |
| · | To actively explore and prepare for international market |
The high-speed rail signaling system set includes the onboardon-board ATP (automatic train protection)(Automatic Train Protection) system with SIL 4 certification for high-speed rail and subway that areis used to protect the train from travelling at excessive speeds, the ground based TCC (train control center) with SIL 4 certification(Train Control Center) for ground safety control of trains, the CBI (computer based interlocking)system with SIL 4 certification for both high speed rail and subways, the ATS (automatic train supervision) system with SIL 2 certification for metro ATC systems, and other auxiliary interfacing products. Based on our own technologies, we are able to customize our system platforms to meet every level of requirements from conventional rail signaling systems to the most state-of-the-art, high-speed rail applications, not only for the Chinese market but also for the international market.
WeBecause the China Railway Corporation employs its own administrative admission system to allow or disallow use of products and entry of system providers to supply the China’s national rail industry, our high-speed rail signaling products that are currently deployed in China’s high-speed rail lines have not needed and do not have European safety standard certification, which is a prerequisite for the rail market outside of China. To satisfy international requirements, we have redesigned the whole set of our high-speed rail signaling systems, based wholly on our own proprietary technologies, and passed European Safety Standards SIL 4 certification (Safety Integrity Level 4) including ATP (Automatic Train Protection), TCC (Train Control Center), LEU (Line-Side Electronic Unit), BTM (Balise Transmission Module), TSRS (Temporary Speed Restriction Server), HVC (Hollysys Vital Computer), and Interlocking system according to international standards and have passed the Safety Integrity Level 4 (SIL4) certification forin the high-speed rail sector.
In the subway sector, the proprietary ATS (Automatic Train Supervision) and CBI (Computer Based Interlocking) have passed SIL2 and SIL4 certification respectively. Other products, includingrespectively in 2011. And in early 2013, we finished the ATO (Automatic Train Operation)development and certified ZC (Zone Controller), LEU (Line-side Electronic Unit) and Balise for subway signaling system according to SIL4 requirements. The ATP (Automatic Train Protection) for subway signaling was developed and ZC (Zone Controller), we expect to passpassed SIL4 certification byin the end of calendar year 2012.2013, thus all subway signaling products have been certified according to SIL4.
| 29 |
In conclusion, the international certification of both high-speed rail signaling system and subway signaling system will enhance our competitiveness and accelerate international expansion
Products and Services
As a leading provider of automation and control technology and applications in China, and increasingly in Southeast Asia, we provide our customers with our standard and customized products and corresponding services based on each client’s specific requirements. We are committed to providing reliable, advanced and cost-effective solutions to help customers optimize their processes to achieve higher quality, greater reliability and better productivity and profitability.
Industrial Automation:
Our principal offering is a comprehensive suite of automation systems for a wide spectrum of industrial market clientele, ranging from petrochemical, thermal power industries, to cement production and paper making industries. Our comprehensive suite of automation solution consists of third-party hardware-centric products such as instrumentation and actuators, our proprietary software-centric DCS/PLC, and valued-added software packages such as RMIS (Real-time Management Information System), HAMS (HolliAS Asset Management System), OTS (Operator Training System), HolliAS BATCH (Batch Application Package), HolliAS APC Suite (Advanced Process Control Package), and SIS (Safety Instrumentation System). The Safety Instrumentation System which was certified under European safety standards and was introduced to the market in July 2012, further round out our proprietary product suite in the industrial automation segment. The two mainstream products for this market segment are our DCS products and our PLC. DCS are a network of controllers, sensors, actuators and other devices that can be programmed to control outputs based on input conditions through logic calculations. In an automated production line, sensors or so-called “instrumentations” are distributed across the production facility to monitor sub-systems like the robots, CNC machines, and logistic tools. These sensors are like human eyes, which monitor the process, and detect any abnormal situations. The information collected from those sensors is then transmitted to the DCS for centralized data processing through communication networks. The central computer (brain) processes information and generates commands, based on sophisticated algorithmic and pre-set parameters. These commands are then sent to actuators (muscles/bones) through communication devices to execute the orders and maintain production flow. PLCs are small computer devices installed on machines or equipment, for example, on a factory assembly line, for manufacturing automation.
As the only proven domestic automation control systems provider to the nuclear power industry in China, we provide our HOLLiAS-NMS DCS product to China’s nuclear power industry. In a nuclear power station, the nuclear island operates to transform nuclear energy to heat energy, and pass on the steam generated by the steam generator to the conventional island, where steam drives the turbine to generate the electricity, and pass on to the transformer for loading onto the grid. Our HOLLiAS-NMS proprietary control systems are now used for non-safety operation control. The know-how was accumulated from our industrial DCS applications in high-end, conventional energy power plants, with much more sophisticated software and hardware specifications, and more stringent production and quality assurance process. Our nuclear joint venture with China General Nuclear Power Corporation, China Techenergy Co., Ltd., has already successfully completed developing its proprietary safety nuclear power automation and control system and has started to commercialize such technology. Specifically, in April 2013, we successfully applied our proprietary HOLLiAS-N Distributed Control System to Unit 1 of Ningde Nuclear Power Plant; In June 2013, we successfully applied our proprietary HOLLiAS-N DCS to Unit 1 of Hongyanhe Nuclear Power station.
We have successfully provided our industrial automation products to overseas countries mainly in South and Southeast Asia through our Singapore subsidiary HAP.
High-speed Rail:Rail Transportation:
Over the years, Hollysys has successfully scaled its automation application from industrial manufacturing to rail and subway industry, with proprietary product lines including, TCC (Train Control Center) and ATP (Automation Train Protection). An ATP essentially acts as the train over-speed protection mechanism, which collects real-time information like speed limit ahead, train operation status, line data, instructions from train control center, then combines that information with the train parameters to produce train protection curves. In case of any human errors, like driver’s negligence at the red light, it applies emergency brakes automatically. TCCs are an on-ground control center at railway stations or equipment stations which monitors route condition, track status, train schedules, distance between trains, and the working status of other essential function devices, and then through logic calculation, generates control instructions and commands. The command information from the TCC is then transmitted to the ATP located on the locomotives/trains, through track circuits and electronic beacons located at various points along the railway line, or wireless.
Nuclear Automation and Control: As the only proven domestic automation control systems provider to the nuclear power industry in China, we provide our HOLLiAS NMS product to China’s nuclear power industry. In a nuclear station, the nuclear island operates to transform nuclear energy to heat energy, and pass on the steam generated by the steam generator to the conventional island, where steam drives the turbine to generate the electricity, and pass on to the transformer for loading onto the grid. Our HOLLiAS NMS proprietary control systems are now used for non-safety operation control. The know-how was accumulated from our industrial DCS applications in high-end, conventional energy power plants, with much more sophisticated software and hardware specifications, and more stringent production and quality assurance process. Our nuclear joint venture China Techenergy Co., Ltd. has already successfully completed developing its proprietary safety nuclear power automation and control system, which is expected to be commercialized in 2012 or 2013, when the total automation and control for nuclear power stations will be fully localized for China.
Subway Automation: We have provided our SCADA system to China’s subway market for many years, including the Beijing Subway, Guangzhou Metro, Shenzhen Metro, and Dalian Metro and etc.Metro. SCADA is an open software platform to enable integrated and unified monitoring of all necessary sub-systems of the subway, including the Power Supervisory Control and Data Acquisition System, Building Automatic System, Fire Alarm System, Platform Screen Door System, Access Control System, Closed Circuit Television, Passenger Information System, Passenger Train Information System, and Alarm System. Given the exponential growth in China’s subway market and the continued growth expected for the decades to come, Hollysys is developinghas developed its proprietary Subway Signaling System, based on its strong research and development capability and technical know-how of signaling application accumulated from high-speed rail. Currently the development and certification according to the European safety standards are basically finished. The current subway signaling market is predominantly occupied by multi-national corporations, such as Siemens.Siemens, Alstom.
We are supplying the entire high-speed rail signaling system to Shenzhen-Hong Kong high-speed rail line for the Hong Kong MTR, which marked our breakthrough to the international high-speed rail signaling market. Besides, in May 2014, we signed a contract with Land Transport Authority ("LTA") in Singapore to provide our proprietary Integrated Supervisory Control System for Thomson & Eastern Region Lines in Singapore.
Mechanical and electrical:
We established a stronger foot-hold in Southeast Asia through two acquisitions of Concord and Bond in 2011 and 2013 respectively. Concord and Bond mainly provide mechanical and electrical solutions, including design, engineering, procurement, project management, construction and commissioning, and maintenance related services, Concord mainly focuses on Singapore, UAE and Saudi Kingdom markets, and Bond mainly focuses on factories, data centers, banks, hospitals, airports, power stations, gas and instrumentation plants, hotels, commercial centers, residential buildings and infrastructure works in Malaysia. Through the acquisitions, the Company seeks to expand the existing distribution and marketing channels to cross sell the Company’s existing product lines to the fast growing South-East Asia and the Middle East markets.
Project Implementation:
We establish a project group for each potential customer, which has a team of systems engineers and managers to provide total integrated solutions to our customers to meet their specific requirements. Each project group is staffed with a dedicated team of sales engineers, technical engineers and project management professionals. The sales engineers and technical engineers work together to offer the best customized solutions as a result of their understanding of the customer’s detailed requirements through on-site studies. The technical engineers are responsible for hardware assembly, software configuration, testing and installation, commissioning and trial operation, and start-up and training; while the project management professionals oversee budgetary matters, coordinate the work force, ensure adequacy of resources and monitor progress and quality to ensure the timely completion of each project. Our integrated solutions projects involve one or more of the following activities:
| · | Solution planning – We provide our customers with strategic and tactical reviews of their current operations and future requirements. The planning includes defining client business requirements, developing appropriate hardware and software, and selecting preferred technology. |
| · | Solution design – We detail the industry specifications and implementation tactics necessary to achieve our customer’s objectives. Hollysys also considers how the new technology will integrate hardware and software integrated in the solution with the customer’s existing hardware and software and how it will be managed on an ongoing basis. Examples of these services include defining functional requirements for the system and our components, developing integration plans and designing of customer-specific system and services applications. |
| · | Solution implementation – We install the recommended systems and provide essential services throughout the whole solution implementation process, to better meet our customers' specific requirements. Key activities include project management, hardware procurement and production, software development, configuration and field installation and testing, and development of customized system and services management applications. |
Our integrated solutions based on our proprietary technology and products create value for and improve the competitive strengths of our customers by:
| · | Generating synergy and improving efficiency of our customers through integrating communications, marketing and service functions; |
| · | Utilizing our industry and process knowledge to develop customized solutions that improve the efficiency of our customers; |
| · | Providing a software platform for the optimization of management operations, which provides real-time automation and information solutions throughout a business; and |
| · | Offering maintenance and training services to our customers, which help to cut costs and improve operating efficiency. |
We customize our floor plans based on careful on-site studies, build design-specific network systems using our advanced DCS technology and proprietary software, and offer manufacturing execution system services to ensure that real-time management control is available to our customers in a streamlined and easy-to-use manner.
We believe that our product design and applications that are integrated in the solutions are unmatched among our domestic competitors. We also believe that the sophistication and quality of our products rival those of the multi-national automation and control product suppliers, while our ability to understand and meet the needs of our Chinese customers gives it a leading edge over foreign competitors. The value of this combination is reflected in our strong revenue and profit growth over the years.
Market for Automation and Controls Solutions
Markets
DCSIndustrial Automation Market
According to the ARC Advisory Group, or ARC, an industry research group, the DCS market in Asia, as measured by revenue, exceeded $4,592.6US$5,307.5 million in 20092012 and will grow at a compounded annual growth rate of approximately 7.7%4.7% through 2014.ARC further projects that the DCS market, as measured by revenue, will exceed $6,654.2 million by 2014 in Asia.2017.
We agreeThe industrial automation and control industry is a healthily growing market with ARC’s assessmenthuge potential. China is facing a shortage of labor and increased labor cost because of demographic change. To solve this problem and improve manufacturing efficiency, manufacturers begin to adopt or consider adopting automation and control technologies and devices to replace labor and more scientifically manage the whole manufacturing process. China is undergoing industrial upgrading, and as a result automation and control technologies innovation and application will play an important role in that “China, in contrast to most other countries, provides robust growth prospectsprocess. Besides, the consciousness and trend for the DCS suppliers. With new investments continuing to take place in its core process industry sector, the market has excellent growth potential in both the nearenvironmental protection and long-term. Almost a quarter of a billion people with their growing disposable income are generating an explodingwaste material emission treatment and recycling will bring the demand for a wide range of products. Domesticautomation and global manufacturers, lured by this opportunity, have created new, world-class production facilities in almost all vertical industries. They are going beyond the near term opportunity for obtaining low cost labor. They are pursuing the best available control system technology and attaining a sustainable competitive advantage.”applications as well.
Currently, the vast majority of the global automation market is still controlled by a handful of multi-national companies, most of them with western roots. Our competition includes some very recognizable names: Honeywell (US); Siemens (Germany); Emerson (US); ABB (Sweden); Rockwell (US); Westinghouse (US);Yokogawa (Japan) and Hitachi (Japan). The western roots of automation are not surprising, as that is also where industrialization began and progressed the farthest during the 19th and 20th centuries. However, a new focus of the automation market is China and increasingly Southeast Asia, where the tremendous growth in industrialization is by now a very familiar story. Manufacturing jobs in the US and other western economies over the past two decades have steadily decreased, while the industrial base in China, Southeast Asia and the Middle East has expanded. In particular, China’s shift from a developing country to one of the world’s leading manufacturers of industrial equipment and consumer goods has created a substantial and growing demand for the automation systems that help to make those manufacturing processes more efficient, reliable and safe.
We believe China’s industrial automation growth rate will continue to be significant. We see China is enjoying a healthy growth rate given its relative current lower penetration rate and the rising cost of labor. To date, we have implemented over 10,000 projects, with over 4,000 customers. ThisThe client base includes large state-owned enterprises, multi-national companies, and other domestic companies. Our main competitors in this field are global players such as ABB, Siemens, and Emerson, as well as Supcon from China. We believe that the Hollysys brand recognition and market reputation and our strong research and development capabilities will enable us to enter and penetrate high-margin market segments currently dominated by foreign companies, and will ensure our revenue from this industrial market to grow at a rate continuously exceeding the industry average.
We are well-positioned to benefit from China’s nuclear power development. At present, China’s nuclear power sector is relatively underdeveloped, with the vast majority of power generated by coal-fired power plants. According to figures announced by China Nuclear Energy Association, by the end of December 31, 2013 there were 17 nuclear reactors in commercial operation in China, providing approximately 14.83 GW of power, in comparison to the total electricity-generating capacity in China of approximately 1,247.38 GW. This represents approximately 1.19% of the total installed gross capacity of power generation. In terms of electricity generated watt per hour, the nuclear electricity generated in 2013 was 110.7 billion kwh, the national electricity generated in 2013 was 5,245.1 billion kwh. China has 2.11% electricity generated from nuclear power, lagging far behind the world average of 15%, with France being the highest with 70% of its power generated from nuclear power plants. Driven by clean energy initiatives and China’s commitment of reducing its carbon emission by 45% per GDP unit by 2020, China’s installed nuclear power generating capacity is expected to reach 70GW-80 GW by 2020. Typically, one nuclear reactor generates 1GW electricity.
We are penetrating into international markets with primary focus on Singapore, Malaysia, Indonesia, India and the Middle East, all of which are largely developing areas. The strong growth of infrastructure and increased demand for automation technologies will benefit us in these areas. According to the ARC Advisory Group, or ARC, an industry research group, the DCS market in Asia as measured by revenue, exceeded US$5,307.5 million in 2012 and will grow at a compounded annual growth rate of approximately 4.7% through 2017; the DCS market in EMEA as measured by revenue, exceeded US$6,020.3 million in 2012 and will grow at a compounded annual growth rate of approximately 3.7% through 2017.
High-Speed Rail and SubwayTransportation Market
Another important end-market for Hollysys is the high-speed rail market in China, where we command a leading position in providing high-speed rail signaling systems to ensure the safety of passenger train movement. High-speed rail development is a relatively new developmentstill in its early stage in China. The Ministry of Railways of China developed a national high-speed rail signaling technological standard, the China Train Control System, or the CTCS. Under the CTCS, the standard governing the 200-250km/hour speed category is called C2, while C3 governs the 300-350km/hour category. These standards are different from the international standards propounded by European organizations or Japan. There are more than 9,000km of high-speed rail tracks in operation in China, with more than 16,000km high-speed rail tracks in construction, according to the Ministry of Railways. The majority of operational high-speed lines are in 200-250km/hour, with only a few operational lines in 300-350km/hour, which include Beijing-Shanghai line, Wuhan-Guangzhou line, Zhengzhou-Xian line, Shanghai-Nanjing line, Shanghai-Hangzhou line and Guangzhou-Shenzhen line, of which the signaling system of Zhengzhou-Xian line and Guangzhou-Shenzhen line were supplied by Hollysys.
According to China’s 12th Five Year Plan and the official announcement from the Ministry of Railways,recent industry estimate, China is planning to have 20,000build up to around 18,000 kilometers length of high-speed railways in operationrailway lines by the end of 2015, with an estimated capital budget of approximately 2.8 trillion RMB. According to China’s Ministry of Railways, the2015. China’s high-speed rail network construction will consist of the current building artery lines and future planning inter-city lines. The artery lines are “the Four Horizontals and the Four Verticals” referring to their positions on the map of China. The Four Vertical lines include the Beijing-Guangzhou line, Beijing–Shanghai line, Harbin-Dalian-Shenyang-Beijing line, and Shanghai-Hangzhou-Shenzhen line. The Four Horizontal lines include the Lanzhou-Xian-Zhengzhou-Lianyungang line, Shanghai-Wuhan-Chongqing-Chengdu line, Hangzhou-Changsha-Kunming line, and Taiyuan-Shijiazhuang-Qingdao line. The inter-city high-speed lines are mainly planned for economically well-developed regions with high densities of population, such as Zhu Jiang River Delta (Guangzhou-Shenzhen region), Yangtze River Delta (Shanghai-Hangzhou region), and Beijing-Tianjin-Tangshan region. As one of the three high-speed rail signaling products providers admitted by the Ministry of Railways in the C2 category in China, and one of the only two high-speed rail signaling products providers to the C3 segment, we believe that Hollysys is well positioned to benefit from this unprecedented, world leading high-speed railway build-out.
We also provide our proprietary software platform and solutions of SCADA to the subway market. China’s subway market is expected to receive significant government investment due to urbanization and environmental concerns. AccordingIt is estimated that China is going to China’s Ministrybuild up to around 4,600 km of Housingsubway lines by 2016 and Urban-Rural Development, the Chinaapproximately 8,300 km of subway market will grow from 776 kilometers in 2008 to 4,189 kilometers in 2015, with government estimated investment amounting to $129 billion in the period.lines by 2020. Leveraging on our know-how from high-speed surface rail signaling technology and our well-recognized brand name, we are developinghave finished the development of our proprietary signaling products for the subway market, and hoping to replace foreign platforms currently dominating the China’s subway signaling marketsystem, and to export our proprietaryare preparing for bidding subway signaling products to overseas countries.projects both in China and abroad. We believe it will present a better value positioning to our subway customers by bundling our proprietary subway SCADA system with our proprietary signaling system, whenin this way we will seeare also expecting our market share and gross margin expansion.expansion in this business sector.
In the Southeast Asia, there are also extensive subway lines construction and subway signaling system reconstruction projects due to the operation safety and efficiency concern in high population density areas such as Hong Kong, Singapore and Malaysia. There are several subway lines in construction in Hong Kong and Southeast Asia, including Hong Kong Shatin to Central Link, South Island Line East, Kwun Tong Line Extension and West Island Line in Hong Kong, and Thomson Line (TSL) in Singapore and MRT Line No. 2 in Kuala Lumpur, Malaysia. Besides, the reconstruction of subway signaling systems will be a huge opportunity, like the North-South and East-West lines which Hollysys has participated in the signaling reconstruction in Singapore. As more and more subway signaling systems in developed countries approach their over mature period, which will offer continuous opportunities for Hollysys to be the subway signaling system replacement and upgrading provider.
NuclearMechanical and Electrical Solutions Market
We are well-positioned to benefit from China’s nuclear power development. At present, China’s nuclear power sector is relatively underdeveloped, with the vast majority of power generated by coal-fired power plants. There are currently 15 nuclear reactorsoffer mechanical and electrical solutions (M&E) through Concord and Bond in operation, providing approximately 12.6 GW of power, in comparison to the total electricity-generating capacity in China of approximately 700 GW. This represents approximately 1.8%Southeast Asia, Middle East and Hong Kong. Through acquisitions of the total electricity generated by nuclear energy, lagging far behind the world averageabove entities, we are expanding and deepening our ability to offer mechanical and electrical solutions in design, engineering, procurement, project management, construction and commissioning, and maintenance to a wide range of 15%industries, such as manufacturing, banks, hospitals, airports, power generated from the nuclear energy, with France being the highest with 70% of its power generated from nuclear.plants, commercial and residential buildings, hotels, and railway and subway lines.
Driven by cleanExtensive constructions in infrastructure in Southeast Asia and Middle East result in significant demands for M&E solutions. Taking Malaysia for example, the estimated total gross development value (GDV) in Iskandar development area is around USD118 billion, where estimated M&E sector potential worth is USD23.56 billion in the areas such as education, commercial, residential, factories and theme park project; the estimated total GDV in Sabah development area is around USD32.3 billion, where estimated M&E potential worth is USD6.5 billion including residential, resorts, commercial, oil & gas projects; the estimated total GDV of Sarawak Corridor is around USD102.7 billion, where estimated M&E potential worth is USD20.5 billion including renewable energy initiatives& energy resources, residential, commercial, factories projects.
In the rail transportation field, there are several subway lines under construction in Hong Kong and China’s commitmentSoutheast Asia, including, among others, Hong Kong Shatin to Central Link, South Island Line East, Kwun Tong Line Extension and West Island Line in Hong Kong, and Thomson Line (TSL) in Singapore and MRT Line No. 2 in Kuala Lumpur, Malaysia. Concord participated in the Singapore North-South and East-West subway lines signaling reconstruction project cooperating with Thales in 2012, Concord was responsible for design, installation, testing & commission for replacement of reducing its carbon emission by 45% per GDP unit by 2020, China’s installed nuclear power generating capacity is expected to reach 70GW-80 GW by 2020. Approximately, it is believed that one nuclear reactor generates 1GW electricity. Duringexisting signaling systems. Bond and Concord will actively explore the year 2005, we formed a joint venture, China Techenergy Co., Ltd.,M&E opportunities, and cooperate with China’s leading nuclear station operator, China Guangdong Nuclear Power Holdings Co., Ltd., to provide its proprietary non-safetyHollysys for the installation and implementation works for industrial automation and control products torailway transportation total solution works in South East Asia and the nuclear stations constructed by China Guangdong Nuclear Power Holdings Corporation. We believe this strategic alliance position us to be the dominant nuclear automation system provider in China. China Guangdong Nuclear Power Holdings Co., Ltd. currently has approximately 60% of China’s nuclear market share.Middle East.
| 34 |
Integrated Contracts
The main channel through which we get our automation system business is the procurement bidding process. Customers seeking bids propose their requirements and specifications in legal bidding documents and those companies that are interested in obtaining these contracts make a bid in written form. If we win the bid, we finalize an integrated contract. We derive over 90% of our total consolidated revenues from the integrated contracts that we win through the bid process. In addition, we have aalso generate revenue stream through the salefrom products sales of spare parts and component products to customers for maintenance and replacement purposes after the completion of the integrated solution contract, and from provision of service such as maintenance and training which tends to provide a recurring revenue stream, even though this revenue is not in the form of multiple-year contracts.stream.
The purpose of an integrated contract is to furnish an automation system that provides the customer with a total solution for the automation or process control requirement being addressed. The automation system and total solution that we offer consists of hardware, software and services, all of which are customized to meet the particular needs and technical specifications of our customers. None of the hardware, software and service has independent functionality, and therefore cannot be sold separately to customers.
The major terms of an integrated solution contract include solution planning and design, system installation, customer acceptance, payment milestones and warranty. The process of fulfilling an integrated contract consists of the following four stages:
| · | Solution planning and design - We provide customers with a customized plan for achieving the required solution by establishing a project group for each contract. The project group includes system engineers who propose and discuss and agree on the system design and implementation plan with the technical personnel of the |
| · | System manufacturing and installation - Based on the design and implementation plan, and in accordance with the project schedule, we enter into the process of purchasing the necessary hardware, manufacturing components for the hardware, developing software platform, re-configuring the software embedded in the hardware, and fabricating the integrated hardware into cabinets, on-site installation and testing, and training customer’s personnel about how to use the automation and total solution. |
| · | Customer acceptance - The procedures for customer inspection and acceptance of the system are typically contained in the contracts. The initial inspection usually occurs when the hardware is delivered to the customer’s site for the purpose of detecting any obvious physical damage during shipping and to confirm that the entire order was delivered. A final acceptance will be performed upon the satisfaction of integrated solution testing. |
| · | Warranty period - The integrated solution contracts customarily provide our customers with a one-year warranty (although sometimes the warranty period may be more than one year depending on the customer and the negotiations for the contract), which runs from the date of the final customer acceptance. The end of the warranty period represents fulfillment of the entire contract. |
Because of the nature of customized integrated contracts, a customer does not have the right to return the products that we deliver, so long as such products conform and perform to the customer’s specification. Prior to delivering our products to a customer’s site, we perform an internal test to ensure that the automation system works as intended. After installing the products on a customer’s site, any problems are solved during trial runs. Once the testing requirements have been satisfied, a customer will sign and dateexecute a customer acceptance document, which beginsmarks the beginning of the warranty period. Due to the nature of this process, many companies in the automation systems business generally do not carry product liability insurance.
The size of an integrated contract is determined by a customer’s needs in terms of the amount of equipment needed and the complexity of the integrated solution. The size of an integrated contract drives the revenues generated by the contract. Because certain contracts will require working periods longer than one year, the best way to measure the contract revenue realized is to use the percentage-of-completion method. Ultimately, our revenue stream will be driven by the average price of an integrated contract and how many integrated contracts have started in each reporting period.
Our backlog of contracts presents the amount of unrealized revenue to be earned from the contracts that we have won. Accordingly, any increase or decrease in new contracts won by us, or any change of scheduled delivery dates will have a future impact on our future revenue streams. In the event of a delay ofin the delivery schedule, then the time of inspection, installation, trial run and customer acceptance will be delayed accordingly, all of which will affect our revenue recognition. If the delay of delivering the specified automation systems was a result of our inability to deliver the system on a timely basis, then we will be held responsible for this delay, in accordance with the terms specified in the respective integrated contracts.
Competition
We compete with various domestic and international corporations offering automation and control systems. We believe that our proprietary technology and products provide us with a strong competitive advantage over our domestic Chinese competitors. However, a number of multinational companies, some of whom have substantially greater financial and other resources than we currently have, have been offering first rate automation systems in competition with us. We believe that our primary competitors in the industrial automation market in China for our products are multi-national corporations, such as ABB, Honeywell, Emerson and Siemens, and the local company Supcon, a private company affiliated with Zhejiang University. In the Southeast Asian and Middle Eastern markets, our principal competitors for industrial automation are the multinational corporations such as ABB, Siemens, Emerson, Yokogawa and Honeywell.
In the PRC high-speed rail business, as China’s Ministry of Railwaysthe China Railway Corporation employs an administrative admission system and China establisheshas established its national rail technology standard, the China Train Control Standard (CTCS), we believe that competition from multi-national companies will decrease or be eliminated.gradually. Currently, Hollysys is one of only three entities granted admission tothat supply signaling products to China’s 200-250km/h segment of the high-speed rail market. The other two are the China Rail Signal & Communication Corp. (CRSC) and the China Academy of Railway Science. Hollysys is one of the only two permitted signaling product providers to China’s 300-350km/h segment of the high-speed rail market. The other provider is CRSC. In the subway business and the SCADA market, we mainly compete with Nanjing Automation Research Institute (NARI). In nuclear automation segment, we mainly compete with multi-national corporations such as Siemens, Areva, and Invensys.
In the Southeast Asian and Middle Eastern markets, our principal competitors for industrial automation are the multinational corporations such as ABB, Siemens, Emerson and Honeywell. The major competitors in the international rail and subway signaling markets are Bombardier and Alston.Alstom.
For the mechanical and electrical solutions business, the main competitors for Concord and Bond include Bintai Kinden Corporation Berhad, PJI Holding Berhad, and LFE Corporation Berhad, Kurihara, Sanyo, Bintai KDK and Gammon Construction.
When compared to our competitors, apart from satisfying certain Chinalocal based criteria, we believe that our key competitive edge is the provision of better value for money to our customers with the following distinctive attributes:
| · | Emphasis on Engineering. Engineers are a critical element of effective design of both hardware and software components of automation equipment and systems. For western companies, they are also a very costly element of the process. Even the largest western companies face constraints in the size of their engineering staff due to the high salaries and attendant costs. One of our competitive advantages is the lower cost of engineers in China relative to those in the Western nations. Applying high levels of engineering effort to each product enables us to provide a solution that is tailored not only to the industry in which the customer operates, but also to the customer’s specific needs. That custom solution is provided at a cost that is typically lower than the generic products of our competitors. |
| · | Industry Process Knowledge. We devote substantial time and effort to |
| 36 |
| · | Integration Services. Western automation system companies are principally system platform suppliers and the role of integrating the systems into the customer’s overall management information system is generally left to independent firms. While such firms are widespread in western countries, China |
| · | Core Technologies. Although we deliver tailored systems, our systems are based on basic modules of automation technology that are common across a broad array of industries and applications. Using these modules as a starting point, development of an industry and customer-specific product is both more efficient and produces a better result than starting from scratch each time. That means, |
| · | Use of Engineering Sales Personnel. The use of trained engineers in product and system design is complemented by the use of engineers in the sales process as well. With engineers included in the sales process, we provide the ability to understand from the beginning the needs of the customer and how to address their issues and the ability to convey that information to the team that will ultimately develop the system to be installed. |
| · |
| · | Pace of Product Development. Another way that we keep ahead of our competitors is by our pace of development. |
Manufacturing and Raw Materials
We design and manufacture the hardware of our products in house,Beijing and Hangzhou facilities, and in rare cases we outsource the production depending on special circumstances and delivery requirements. The core part of the hardware of our products is the printed circuit board. We manufacture the printed circuit boards in our SMT (Surface Mounting Technology) lines and plug-in mounting lines, and assemble them into various types of modules and then form the modules into the final products. The raw materials which we procure mainly include bare printed circuit boards from vendors based on our requirements and design considerations, and electronic components, chips, cabinets and cables among other factors. Our products are subjected to rigorous testing in our facilities prior to shipment.
Several subsidiaries of the Company, including Beijing Hollysys, Hangzhou Hollysys, Hollysys A&D, and Hollysys Electronics, and etc, have passed several or all of the GB/T 19001/ISO 9001 international quality management system certification, GB/T 24001/ISO 14001 environmental management system certification, and GB/T 28001 occupational health and safety management system certification.
The GB/T 19001/ISO 9001 international quality management system certificate is valid for production, and technical service of industrial automatic control system equipment. theThe other two certificates are valid for production, technical service and related management activities of industrial automatic control system equipment.
Seasonality
Like many other Chinese companies operating in China and Southeast Asia, our businesses tends to be slower in the quarter that includes the month of March and tends to be to be stronger in the quarter that includes December due to the Chinese New Year factor and tends to be stronger in the December quarter because the budgeting practice that is based on a calendar basisyear adopted by government agencies and most of Chinese private enterprises.
Regulation
PRC.We operate a significant portion of our business in China under a legal regime that consists, at the national level, of the State Council, which is the highest authority of the executive branch of the PRC central government, and several ministries and agencies under its leadership, including: the Ministry of Agriculture and its local authorities; the Ministry of Commerce and its local authorities; SAFE and its local authorities; the State Administration of Industry and Commence and its local authorities; and the State Administration of Taxation, and the Local Taxation Bureau. The following sets forth a summary of significant regulations or requirements that affect our business activities in China and our shareholders’ right to receive dividends and other distributions from us.
| · | Foreign Currency Regulations. We are subject to the PRC’s foreign currency regulations. The PRC government has control over RMB reserves through, among other things, direct regulation of the conversion of RMB into other foreign currencies. Although foreign currencies which are required for “current account” transactions can be bought freely at authorized Chinese banks, the proper procedural requirements prescribed by Chinese law must be met. At the same time, Chinese companies are also required to sell their foreign exchange earnings to authorized Chinese banks and the purchase of foreign currencies for capital account transactions still requires prior approval of the Chinese |
| · | Taxation. The EIT Law, as further clarified by the Implementation Rules of the EIT Law and the Notice on Implementation of Enterprise Income Tax Transition Preferential Policy under the EIT Law, applies a unified enterprise income tax, or EIT, rate at 25% to both FIEs and domestic invested enterprises. The EIT rate applicable to the enterprises established before March 16, 2007 those were eligible for preferential tax rate according to |
| · | Dividend Distribution. Under PRC law, FIEs in China, |
The foregoing summary does not purport to be complete and is qualified by reference to the relevant provisions of applicable law in the jurisdictions in which we operate. We believe that we are currently in compliance with all applicable laws and regulations relating to our business.
Southeast Asia. The kinds of currency regulation, taxation regimes and dividend restrictions imposed in China are not replicated in Singapore, Malaysia, and other Southeast Asian markets in which we operate. Generally these markets are free-trade based economies, with no direct or indirect currency and similar operational barriers.
Marketing, Sales and Customer Support
Our marketing and sales activities are focused on the development of and addressing the growing demand for automation and control products, systems and services in the Chinese domestic market and the Southeast Asian and Middle Eastern markets. Our basic strategy is to build cooperative relationships with our customers, educating them about technological developments and reflecting their needs in our products and services.
Our sales teams consist of a complementary group of sales personnel and hardware and software engineers from a variety of disciplines to tailor products to specific customer needs. Employing a pool of skilled personnel in the early stage of a project accelerates the design and the subsequent production of a particular customized solution, typically exceeding that of our competitors. Our sales teams possess significant hands-on, industry-specific experience which permit them to do on-site process analyses, which in turn, makes the design and implementation of upgrades simpler. The result is an automation system that is more effective, efficient and reliable, which in turn leads to a truly satisfied customer.
Our sales force is organized into three principal groups, (i) regional sales, to provide business consulting, promote pre-sale activity and serve as customer contacts, (ii) customer service, to manage relations with contracted customers and improve customer satisfaction by coordinating responses to the client’s information requests, sale of supplemental parts or components and make customer visits, and (iii) market planning, to facilitate strategic cooperation with certain specialized manufacturers, to expand the specific fields for our products.
We identify and target market segments and select target sales opportunities within our markets and conduct sales opportunity studies to ensure that adequate sales resources are available. Sales quotas are assigned to all sales personnel according to annual sales plans. We classify market segments and target opportunities on national and regional levels. Segmentation of our markets helps us to determine our primary sales targets and to prepare monthly and quarterly sales forecasts. The sales team approves target projects, develops detailed sales promotion strategies and prepares reports on order forecasts, technical evaluation, sales budgeting expense, schedules and competition analysis. After the report has been approved, a marketing group is appointed, consisting of sales personnel and engineers. We employ marketing personnel to conduct market research, to analyze user requirements and to organize marketing communications.
Our marketing team engages in a variety of marketing activities, including:
| · | publishing internal research reports and customer newsletters; |
| · | conducting seminars and conferences; |
| · | conducting ongoing public relations programs; and |
| · | creating and placing |
We actively participate in technology-related conferences and demonstrate our products at trade shows or at exhibitions targeted at our existing and potential customers. We also evaluate a range of joint-marketing strategies and programs with our business partners in order to take advantage of their strategic relationships and resources. We also support our customers by offering field services such as maintenance and training services, which help customers to cut their costs and improve their operating efficiency.
As of June 30, 2012,2014, we employed 816726 direct sales personnel through our Chinese subsidiaries in China, and through Concord in SingaporeSoutheast Asia, and the Middle East. TheIn China, sales staffs were assigned to three business areas: industrial automation, rail transportation and overseas sales. Sales activities for industrial automation are widely distributed across China in overaround 50 cities; the rail transportation sales activities are mainly centralized at our Beijing headquarters; and for overseas regions, sales activities are mainly developed and guided from our offices in SingaporeSoutheast Asia and the Middle East.
C. Organizational Structure
| C. | Organizational Structure |
The following diagram illustrates our corporate structure as of the date of this annual report. We are a holding company with no operations of our own. We conduct our operations in China mainly through our Chinese operating companies, Beijing Hollysys, Hangzhou Hollysys and Hollysys A&D, and doconduct our operations in southeast Asia and the Middle East mainly through Concord.Concord and Bond.
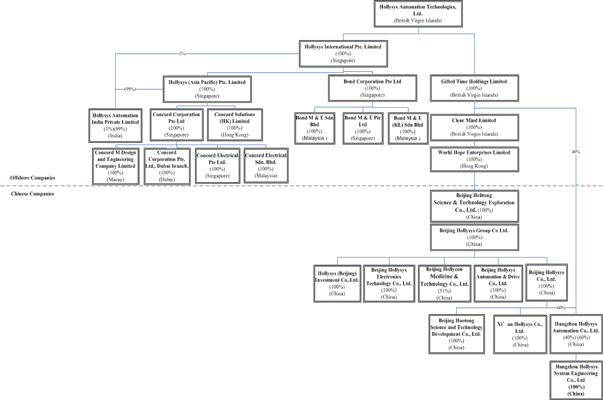
Our corporate headquarters are located at No. 2 Disheng Middle Road, Beijing Economic-Technological Development Area, Beijing, 100176, China. Our telephone number is (+86) 10 58981386. We maintain a website athttp://www.Hollysys.com that contains information about our company, but that information is not a part of this annual report.
D. Property, Plant and Equipment
| D. | Property, Plant and Equipment |
Since 2010, our principal executive offices have been located at No. 2 Disheng Middle Road, Beijing Economic-Technological Development Area, Beijing, 100176, China. At this location in Beijing, we have ample room for substantial expansion, as our needs require. We own the prepaid land leases to the properties at the following principal locations, each of which contains principal administrative offices, sales and marketing offices, research and development facilities, and manufacturing facilities:
| Location | Approximate Sq. Meters | |||
| Beijing | 120,000 | |||
| Hangzhou | 25,000 | |||
| Singapore | 1,200 | |||
| Malaysia | 3,000 | |||
The manufacturing facilities at the aboveBeijing and Hangzhou locations are used for the system integration production, including hardware testing instruments, auxiliary material processing, packaging and shipping, and for self-made product integration production, including inspection and testing. As of June 30, 2014, the Company has completed the construction of phase II of the Yizhuang facility in Beijing.
| ITEM 4A. | UNRESOLVED STAFF COMMENTS |
There are no unresolved staff comments.
| ITEM 5. | OPERATING AND FINANCIAL REVIEW AND PROSPECTS |
You should read the following discussion and analysis of our financial condition and results of operations in conjunction with our consolidated financial statements and the related notes included elsewhere in this annual report on Form 20-F. This discussion may contain forward-looking statements based upon current expectations that involve risks and uncertainties. Our actual results may differ materially from those anticipated in these forward-looking statements as a result of various factors, including the risk factors and the discussion of our business set forth in other parts of this annual report on Form 20-F.
Overview
Through our operating subsidiaries, we are one of the leading automation systemssolutions providers in China, developing a number of core technologies and completing numerous projects utilizing a wide array of automation products. With our philosophy of sincere concern for customers and our technical innovation capabilities, we specialize in the research, development, production, sale and distribution of industrial automation for digital railway signals and information systems, e-government, motor drive transmissions and safety controls for nuclear power reactors.
The main channel through which we obtain our automation system business is the procurement bidding process. Customers seeking bids propose their requirements and specifications in legally binding bid documentation, to which the companies interested in obtaining the contract respond with an appropriate bid.
We derive our revenue mainly from thethree operating segments, industrial automation, railway transportation and mechanical and electrical solutions. More than 90% of our total consolidated revenues derived from integrated contracts we have won through the bid process, which accounts for approximately 95% of our total consolidated revenue. An additional source ofprocess. In addition, we also generate revenue although small in percentage terms, is the salefrom products sales of spare parts and component products to customers for maintenance and replacement purposes after the completion of the integrated solution contract.contract, and from services provision of maintenance and training. after the warranty period to customers for efficiency improvement or environment protection purpose; which tends to provide a recurring revenue stream. Spare part and component sales and services provision are not part of the integrated solutions contracts.
The purpose of an integrated solutions contract is to furnish an automation system that provides the customer with a total solution for the automation or process control requirement being addressed. The automation system and total solution we offer, consisting of hardware, software and services, is customized to meet the customer’s particular needs and technical specifications. None of the hardware, software and services has independent functionality, and therefore, cannot beare not sold separately to customers. The following table sets forth the information regarding the contracts we won during the last three fiscal years and backlog at the dates indicated:
| Years Ended June 30, | Years Ended June 30, | |||||||||||||||||||||||
| 2010 | 2011 | 2012 | 2012 | 2013 | 2014 | |||||||||||||||||||
| Number of new contracts won during the year | 1,800 | 2,401 | 3,046 | 3,046 | 3,281 | 3,362 | ||||||||||||||||||
| Total amount of new contracts (million) | $ | 267.2 | $ | 331.0 | $ | 430.2 | $ | 430.2 | $ | 481.5 | $ | 635.1 | ||||||||||||
| Average price per contract | $ | 148,428 | $ | 137,841 | $ | 141,225 | $ | 141,225 | $ | 146,742 | $ | 188,899 | ||||||||||||
| Years Ended June 30, | Years Ended June 30, | |||||||||||||||||||||||
| Backlog Situation: | 2010 | 2011 | 2012 | 2012 | 2013 | 2014 | ||||||||||||||||||
| Contracts newly entered and unfinished (million) | $ | 145.9 | $ | 146.9 | $ | 242.4 | $ | 242.4 | $ | 290.1 | $ | 257.5 | ||||||||||||
| Contracts entered in the prior year and unfinished (million) | $ | 107.0 | $ | 149.5 | $ | 147.5 | $ | 147.5 | $ | 198.6 | $ | 297.6 | ||||||||||||
| Total amount of backlog (million) | $ | 252.9 | $ | 296.4 | $ | 389.8 | $ | 389.7 | $ | 488.7 | $ | 555.1 | ||||||||||||
As indicated above, both the amount of new contracts won and the amount of backlog have been increasing steadily during the past three years. Generally, the backlog represents increasing sales and increasing size of contracts which might take more time to perform. The significant growth clearly validates our dedicated industry expert total solution and sales network expansion strategies. Our established brand recognition, strong track record of customization, quality and service, efficient R&D and implementation together with customer-orientated flexibility give us a significant competitive advantage over domestic and international competitors. We made substantial progress in our strategy of international market expansion through our successfully acquired company – Concord. Concord has been actively working on a few international bids and projects in the rail and industrial automation sectors. The acquisition of Concord provided a synergy with the rest of the company, successfully combining our proprietary technology and Concord’s international resources.
As a growing company, we have achieved significant progress in the past three years. Our total consolidated revenues for the fiscal year ended June 30, 2012 was approximately $321.7 million, compared to approximately $262.8$349.1 million for the prior fiscal year,2013, representing an increase of 22.4%8.5%, followed by a growth of 50.9% from49.4% to approximately $174.1$521.3 million in fiscal 2010.2014.
Recent Developments
In order
On May 30, 2014, the Company entered into a convertible loan agreement with International Finance Corporation (“IFC”), an international organization established by Articles of Agreement among its member countries including the British Virgin Islands, under which the Company will borrow $20,000,000 from IFC (the “IFC Loan”) with an interest rate of 2.1% per annum and commitment fee of 0.5% per annum paid in rear semi-annually. The Company received the loan disbursement on August 30, 2014, and the loan interest started accumulating since then.
The IFC Loan has both voluntary and mandatory conversion terms. IFC may at its option convert, in US$1,000,000 increments, the Loan in whole or in part, into the Company’s ordinary shares at any time on or prior to subdivide the specializationmaturity date at a conversion rate and a conversion price in effect at such time. The initial conversion rate at the time of our industrial automation businessthe agreement is 38 ordinary shares per $1,000, and spur a rapid expansionthe initial conversion price is $26.35 per share. The initial conversion rate and conversion price is subject to subsequent adjustments with events that may dilute the unit price per share. 50% of our business, Hangzhou Hollysys invested RMB 50 million (approximately $7,912,895) to establish a subsidiary, Hangzhou Hollysys System Engineering Co., Ltd (“Hangzhou Engineering” thereafter) on June 8, 2012. The financial resultsthe principal amount of Hangzhou Engineeringthe IFC Loan then outstanding will be includedmandatorily converted into ordinary shares at the conversion rate and conversion price then in effect if at any time, with respect to the period of 30 consecutive trading days ending at such time, the volume weighted average price for 20 trading days or more in such 30 consecutive trading day period is equal to or more than 150% of the conversion price in effect at such time. 100% of the principal amount of the IFC Loan then outstanding will be mandatorily converted into ordinary shares at the conversion rate and conversion price then in effect if at any time, with respect to the period of 30 consecutive trading days ending at such time, the volume weighted average price for 20 trading days or more in such 30 consecutive trading day period is equal to or more than 200% of the conversion price in effect at such time.
The Company is subject to both affirmative and negative covenants. The outstanding principle, interests and fees need to be repaid to IFC in case the covenants are not fulfilled. The Company is assessing the financial and internal control effects of the IFC Loan which will be reflected in the Company’s consolidatedfirst quarter financial statements, effectivestatements.
In addition, the Company paid a one-time front-end fee of $200,000 according to the agreement on July 3, 2014. A portfolio supervision fee of $5,000 per annum is charged to the Company by IFC for its effort of monitoring the convertible loan. The term of the IFC Loan is five years starting from the registration date July 24, 2012.of Company’s receipts of the loan.
Rights Plan
On August 27, 2010, our Board of Directors adopted a Rights Plan, or the 2010 Rights Plan. In connection with the 2010 Rights Plan, the Board of Directors declared a dividend distribution of one “Right” for each outstanding ordinary share to shareholders of record at the close of business on August 27, 2010, effective as of September 27, 2010. Each Right entitles the shareholder to buy one share of our Class A Preferred Stock at a price of $160.
The Rights will become exercisable if a person or group announces an acquisition of 20% or more of our outstanding ordinary shares, or announces commencement of a tender offer for 20% or more of the ordinary shares. In that event, the Rights permit shareholders, other than the acquiring person, to purchase our ordinary shares having a market value of twice the exercise price of the Rights, in lieu of the Class A Preferred Stock. In addition, in the event of certain business combinations, the Rights permit the purchase of the ordinary shares of an acquiring person at a 50% discount. Rights held by the acquiring person become null and void in each case. Unless terminated earlier by our Board of Directors, the 2010 Rights Plan will expire on September 27, 2020.
Key Factors Affecting Our Growth, Operating Results and Financial Condition
Our future growth, operating results and financial condition will be affected by a number of factors including:
| · | The ability in developing and acquiring new products and systems in order to improve competitiveness, which can increase both sales revenue and margins. The success of our business depends in great measure on our ability to keep pace with or even lead changes that occur in our industry. |
| · | The success in expanding our business in targeted emerging markets and overseas markets, which may require us to overcome domestic competition and trade barriers. |
| · | Our ability to retain our existing customers and to obtain additional business opportunities. Since we do not have long-term purchase commitments from customers, our customers can shift to other competitors for future projects. It is important to maintain our customer base in order to sustain and expand our business. |
| · | The success of our business also depends on securing a steady stream of new customers. In order for our business to continue to succeed and grow, it is vital to secure contracts with new customers on a regular basis. |
| · | The ability to secure adequate engineering resources and relatively low cost engineering staff can increase our profitability and potential business prospects. One of the competitive advantages that we enjoy is the access to lower cost engineering staff as compared to those of our Western and Japan-based competitors. The plentiful supply of affordable engineering talent in China is a key element of our overall business strategy. |
| · | Further improvement in product design and maintaining high standard of quality control, which can reduce or avoid product defects. Any product defects will result in additional costs and cause damage to our business reputation. |
| · | The ability to secure and protect our intellectual property rights is critical, as our business is based on a number of proprietary products and systems, and we strive to strengthen and differentiate our product portfolio by developing new and innovative products and product improvements. |
| · | The success in penetrating into the railway, |
| · | The ability to obtain greater financial resources to match or even exceed our major competitors, in order to compete effectively with them, and to weather any extended weaknesses in the automation and control market. |
| · | The continued growth in the Chinese |
| · | The ability to maintain key personnel and senior management, who will have significant impact and contribution to our future business. The ability to attract and retain additional qualified management, technical, sales and marketing personnel will be vital. |
| · | The continuation of the preferential tax treatment and subsidies currently available to our PRC subsidiaries will be critical to our future operating results. If governmental subsidies were reduced or eliminated, our after-tax income would be adversely affected. |
| · | The |
Critical Accounting Policies
Business combinations
The Company accounts for its business combinations using the purchase method of accounting in accordance with Accounting Standards Codification (“ASC”) Topic 805,Business Combinations (“ASC 805”). The purchase method accounting requires that the consideration transferred to be allocated to the assets, including separately identifiable assets and liabilities the Company acquired based on their estimated fair values. The consideration transferred of an acquisition is measured as the aggregate of the fair values at the date of exchange of the assets given, liabilities incurred, and equity instruments issued as well as the contingent considerationsconsideration and all contractual contingencies as of the acquisition date. Identifiable assets, liabilities and contingent liabilities acquired or assumed are measured separately at their fair value as of the acquisition date, irrespective of the extent of any noncontrolling interests. The excess of (i) the total cost of the acquisition, fair value of the noncontrolling interests and acquisition date fair value of any previously held equity interest in the acquiree over (ii) the fair value of the identifiable net assets of the acquiree, is recorded as goodwill. If the cost of acquisition is less than the fair value of the net assets of the subsidiary acquired, the difference is recognized directly in the statements of comprehensive income.
The determination and allocation of fair values to the identifiable assets acquired, liabilities assumed and noncontrolling interests is based on various assumptions and valuation methodologies requiring considerable management judgment. The most significant variables in these valuations are discount rates, terminal values, the number of years on which to base the cash flow projections, as well as the assumptions and estimates used to determine the cash inflows and outflows. The Company determines discount rates to be used based on the risk inherent in the related activity’s current business model and industry comparisons. Terminal values are based on the expected life of assets forecasted life cycle and forecasted cash flows over that period.
Acquisition-related costs are recognized as general and administrative expenses in the statements of comprehensive income as incurred.
Revenue recognition
Integrated solutions contracts
Revenues generated from designing, building, and delivering customized integrated industrial automation systems are recognized over the contractual terms based on the percentage of completion method. The contracts for designing, building, and delivering customized integrated industrial automation systems are legally enforceable binding agreements between the Company and customers. The duration of contracts depends on the contract size and ranges from 6 months to 5 years excluding the warranty period. The majority of the contract duration is longer than one year.
Revenue generated from mechanical and electrical solution contracts for the construction or renovation of buildings, rail or infrastructure facilities are also recognized over the contractual terms based on the percentage of completion method. The contracts for mechanical and electrical solution services are legally enforceable binding agreements between the Company and customers. The duration of contracts depends on the contract size and the complexity of the construction work and ranges from 6 months to 3 years excluding the warranty period. The majority of the contract duration is longer than one year.
In accordance with ASC Subtopic 605-35,Revenue Recognition - Construction-Type and Production-Type Contracts(“ASC 605-35”), recognition is based on an estimate of the income earned to date, less income recognized in earlier periods. Revisions in the estimated total costs of integrated contracts are made in the period in which the circumstances requiring the revision become known. Provisions, if any, are made currently forin the period when anticipated losslosses are expected on the uncompleted contracts.
The Company reviews and updates the estimated total costs of integrated solution contracts at least semi-annually. The Company accounts for revisions to contract revenue and estimated total costs of integrated solution contracts, including the impact due to approved change orders, in the period in which the facts that cause the revision become known as changes in estimates. Unapproved change orders are considered claims. Claims are recognized only when it has been awarded by customers. Excluding the impact of change orders, if the estimated total costs of integrated solution contracts, which arewere revised during the yearyears ended June 30, 2012, 2013 and 2014, had been used as a basis of recognition of integrated contract revenue since the contract commencement, net income for the yearyears ended June 30, 2012, 2013 and 2014 would have been decreased by $13,109,779, $11,252,708, and $4,435,843, respectively; basic net income per share for years ended June 30, 2012, 2013, and 2014 would have been decreased by $0.24, $0.20, and $0.08, respectively; and diluted net income per share for the years ended June 30, 2012, 2013 and 2014, would have decreased by $13,109,779.$0.23, $0.20 and $0.08, respectively. Revisions to the estimated total costs for the yearyears ended June 30, 2012, 2013 and 2014 were made in the ordinary course of business.
The Company combines a group of contracts as one project if they are closely related and are, in substance, parts of a single project with an overall profit margin. Whereas, theThe Company segments a contract into several projects, when they are of different business substance, for example, with different business negotiation, solutions, implementation plans margins, etc.and margins.
Revenue in excess of billings on the contracts is recorded as costs and estimated earnings in excess of billings. Billings in excess of revenues recognized on the contracts are recorded as deferred revenue until the above revenue recognition criteria are met.
The Company generally recognizes 100% of the contractual revenue upon receipt ofwhen the customer acceptance as the Company estimates thathas been obtained, and no further major costs willare estimated to be incurred, under a contract, a signed customer acceptance document has been obtained, andnormally this is also when the warranty period commences. Revenues are presented net of taxes collected on behalf of the government.
Product sales
Revenue generated from sales of products is recognized when the following four revenue recognition criteria are metmet: (i) persuasive evidence of an arrangement exists, (ii) delivery has occurred, (iii) the selling price is fixed or determinable, and (iv) collectability is reasonably assured.
Service rendered
During the year ended June 30, 2014, the Company extended its service offerings as described below. Previously, service revenue was insignificant. The Company mainly provides two types of services:
Revenue from one-off services: the Company provides different types of one-off services, including on-site maintenance service and training services. Revenue is recognized when the Company has completed all the respective services described in the contracts, there is persuasive evidence of an arrangement, the fee is fixed or determinable and collection is reasonably assured.
Revenue from services covering a period of time: the Company also separately sells extended warranties to their integrated solution customers for a certain period. During the period, the Company is responsible for fixing problems related to its own systems provided to the customers. Part replacement is not covered in such service; rather, the customers need to purchase the parts to be replaced separately. The Company recognizes revenue on a pro-rata basis over the contractual term.
Revenue from services was not presented separately in the consolidated statement of comprehensive income in 2012 and 2013 as the amounts were inconsequential.
Inventories
Inventories are composed of raw materials, work in progress, purchased and manufactured finished goods and low value consumables. Inventories are accounted for on the “first-in, first-out basis”, and stated at the lower of cost or market.
The Company assesses the lower of cost or market for non-saleable, excess or obsolete inventories based on its periodic review of inventory quantities on hand and the latest forecasts of product demand and production requirements from its customers. The Company writes down inventories for non-saleable, excess or obsolete raw materials, work-in-process and finished goods by charging such write-downs to cost of integrated contracts and/or costs of products sold.
Costs incurred for a specific anticipated contract are included in inventory when the recoverability is evaluated to be probable. Costs included in inventory in anticipation of a contract are included in contract costs upon the receipt of the anticipated contract.
Warranties
Warranties represent a major term under an integrated contract, which will last, in general, for one to three years or otherwise specified in the terms of the contract. The Company accrues warranty liabilities under an integrated contract as a percentage of revenue recognized, which is derived from its historical experience, in order to recognize the warranty cost for an integrated contract throughout the contract period. In addition, the Company estimates whether or not the accrued warranty liabilities are adequate by considering specific conditions that may arise and the number of contracts under warranty period at each reporting date. The Company adjusts the accrued warranty liabilities in line with the results of its assessment.
Accounts receivable and costs and estimated earnings in excess of billings
Performance of the integrated contracts will often will extend over long periods and the Company’s right to receive payments depends on its performance in accordance with the contractual agreements. BillingsThere are different billing practices in the PRC and overseas operating subsidiaries including Concord and Bond. In the PRC, billings are rendered based on agreed milestones included independing on the contracts terms with customers. There are different milestones amount the contracts the Company has won. In general, there are four milestones: 1) project commencement, 2) system manufacturing and delivery, 3) installation, trial-run and customer acceptance, and 4) expiration of the warranty period. The amounts to be billed when each of the specified milestones is reached are specified in the contracts. All contracts have the first milestone, but not all contracts have a prepayment.require prepayments. Each interval of two continuous billings under an integrated contract varies depending on the duration of the contract (under certain contracts, the interval of two continuous billings is longer than one year) and the last billing to be issued for an integrated solution contract is at the end of a warranty period. For Concord and Bond, billing claims are rendered subject to the approval and certification by the customers or their designated consultants. Payments are made to Concord or Bond based on the certified billings according to the payment terms as mutually agreed between the customers and Concord or Bond. Certain amounts are retained by the customer and payable to Concord and Bond upon satisfaction of final quality inspection or at the end of the warranty period. The retained amounts for the three years ended June 30, 2012, 2013 and 2014 were $2,091,805, $6,549,418 and $9,653,052, respectively. Prepayments received are recorded as deferred revenue. The deferred revenue will be recognized as revenue under the percentage of completion method along with the progress of a contract. If no prepayment is received by the Company, revenue will be recognized through costcosts and estimated earnings in excess of billings.
The Company does not require collateral from its customers. Based on the prevailing collection practices in China, it is a reasonable expectation for the enterprises in the automation industry to take over one year to collect the accounts receivable in full.
The Company does not charge interest for late payments by its customers. The Company periodically reviews the status of contracts and decides how much of an allowance for doubtful accounts should be made based on factors surrounding the credit risk of customers and its historical experience. The Company sets up a doubtful account for an individuala customer based on the aging of the outstanding amount as well as the customer’s credit worthiness.
Goodwill
Goodwill represents the excess of the purchase price over the estimated fair value of net tangible and identifiable intangible assets acquired. The Company’s goodwill outstanding at June 30, 2014 was related to the acquisition of Concord and Bond (see note 3). In accordance with ASC 350,Intangibles, Goodwill and Other(“ASC 350”), goodwill is not amortized, but rather is tested for impairment at least annually or more frequently if there are indicators of impairment present.
Goodwill is tested for impairment on June 30 in each year. The Company performs a qualitative assessment to determine if it is more likely than not that the fair value of each identified reporting unit is less than its carrying amount. If this is the case, the Company is not required to calculate the fair value of its reporting unit(s) and perform the two-step impairment test. However, if the Company concludes otherwise, the first step of the two-step impairment test is performed by comparing the carrying value of its reporting unit to its fair value. If the carrying value of the reporting unit is greater than its fair value, the second step is performed, where the implied fair value of goodwill is compared to its carrying value. The Company recognizes an impairment charge for the amount by which the carrying amount of goodwill exceeds its implied fair value.
There was no impairment loss for the periods presented.
Impairment of long-lived assets other than goodwill
The Company evaluates its long-lived assets or asset group including acquired intangibles with finite lives for impairment whenever events or changes in circumstances (such as a significant adverse change to market conditions that will impact the future use of the assets) indicate that the carrying amount of a group of long-lived assets may not be fully recoverable. When these events occur, the Company evaluates the impairment by comparing the carrying amount of the assets to future undiscounted cash flows expected to result from the use of the assets and their eventual disposition. If the sum of the expected undiscounted cash flows is less than the carrying amount of the assets, the Company recognizes an impairment loss based on the excess of the carrying amount of the asset group over its fair value, generally based upon discounted cash flows or quoted market prices.
TheThere was no impairment loss on long-lived assets for each of the years ended June 30, 2010, 2011 and 2012 were $715,246, $23,711 and nil respectively, included in the general and administrative expenses, which represented impairment loss on property, plant and equipment.periods presented.
Income taxes
The Company follows the liability method of accounting for income taxes. Under this method, deferred tax assets and liabilities are determined based on the differencedifferences between the financial reporting and tax bases of assets and liabilities using enacted tax rates that will be in effect in the period in which the differences are expected to reverse. The Company records a valuation allowance to offset deferred tax assets if based on the weight of available evidence, it is more-likely-than-not that some portion, or all, of the deferred tax assets will not be realized. The effect on deferred taxes of a change in tax rate is recognized in tax expense in the period that includes the enactment date of the change in tax rate.
The Company adopted ASC 740,Income Taxes (“ASC 740”),which clarifies the accounting and disclosure for uncertainty in income taxes. Interests and penalties arising from underpayment of income taxes shall be computed in accordance with the related tax laws. The amount of interest expense is computed by applying the applicable statutory rate of interest to the difference between the tax position recognized and the amount previously taken or expected to be taken in a tax return. Interests and penalties recognized in accordance with ASC 740 are classified in the financial statements as a component of income tax expense. In accordance with the provisions of ASC 740, the Company recognizes in its financial statements the impact of a tax position if a tax return position or future tax position is “more likely than not” to prevail based on the facts and technical merits of the position. Tax positions that meet the “more likely than not” recognition threshold are measured at the largest amount of tax benefit that has a greater than fifty percent likelihood of being realized upon settlement. The Company’s estimated liability for unrecognized tax positions which is included in the accrued liabilities is periodically assessed for adequacy and may be affected by changing interpretations of laws, rulings by tax authorities, changes and/or developments with respect to tax audits, and expiration of the statute of limitations. The outcome for a particular audit cannot be determined with certainty prior to the conclusion of the audit and, in some cases, appeal or litigation process. The actual benefits ultimately realized may differ from the Company’s estimates. As each audit is concluded, adjustments, if any, are recorded in the Company’s financial statements. Additionally, in future periods, changes in facts, circumstances, and new information may require the Company to adjust the recognition and measurement estimates with regard to individual tax positions. Changes in recognition and measurement estimates are recognized in the period in which the changes occur.
Share-based compensation
The Company accounts for share-based compensation in accordance with ASC 718,Compensation-Stock Compensation (“ASC 718”). The Company recognizes compensation cost for an award with only service conditions that has a graded vesting schedule on a straight-line basis over the requisite service period for the entire award. The compensation cost for each vesting tranche in an award subject to performance vesting is recognized ratably from the service inception date to the vesting date for each tranche. To the extent the required vestingservice and performance conditions are not met resulting in the forfeiture of the share-based awards, previously recognized compensation expense relating to those awards arereversed. ASC 718 requires forfeitures to be estimated at the time of grant and revised, if necessary, in subsequent period if actual forfeitures differ from initial estimates.
Fair value measurements
The Company has adopted ASC 820,Fair Value Measurements and Disclosures(“ASC 820”), which defines fair value, establishes a framework for measuring fair value in GAAP, and expands disclosures about fair value measurements. It does not require any new fair value measurements, but provides guidance on how to measure fair value by providing a fair value hierarchy used to classify the source of the information. It establishes a three-level valuation hierarchy of valuation techniques based on observable and unobservable inputs, which may be used to measure fair value and include the following:
| Level 1 | - | Quoted prices in active markets for identical assets or liabilities. |
| Level 2 | - | Inputs other than Level 1 that are observable, either directly or indirectly, such as quoted prices for similar assets or liabilities; quoted prices in markets that are not active; or other inputs that are observable or can be corroborated by observable market data for substantially the full term of the assets or liabilities. |
| Level 3 | - | Unobservable inputs that are supported by little or no market activity and that are significant to the fair value of the assets or liabilities. |
Classification within the hierarchy is determined based on the lowest level of input that is significant to the fair value measurement.
ASC 820 describes three main approaches to measuring the fair value of assets and liabilities: (1) market approach; (2) income approach and (3) cost approach. The market approach uses prices and other relevant information generated from market transactions involving identical or comparable assets or liabilities. The income approach uses valuation techniques to convert future amounts to a single present value amount. The measurement is based on the value indicated by current market expectations about those future amounts. The cost approach is based on the amount that would currently be required to replace an asset.
Recent Accounting Pronouncements
In May 2011,April 2014, the Financial Accounting Standards BoardFASB issued ASU No. 2014-08,Reporting Discontinued Operations (“FASB”) issued Accounting Standard Update (“ASU”) 2011-04, Fair Value Measurement (“Topic 820”ASU 2014-08”), Amendments to Achieve Common Fair Value Measurement and Disclosure Requirements in U.S. GAAP and IFRSs (“ASU 2011-04”) which amends the fair value measurement guidance and includes some enhanced disclosure requirements. The most significant change in disclosures isaffects an expansionentity that has either of the information requiredfollowing: (1) A component of an entity that either is disposed of or meets the criteria to be classified as held for Level 3 measurements basedsale; and (2) A business or nonprofit activity that, on unobservable inputs.acquisition, meets the criteria to be classified as held for sale. The standardamendments in this Update change the requirements for reporting discontinued operations in ASC 205, Presentation of Financial Statements (“ASC 205”). A discontinued operation may include a component of an entity or a group of components of an entity, or a business or nonprofit activity. The update is effective for fiscal years beginning after December 15, 2011.2014. Early adoption is permitted. The Company will adopt ASU 2014-08 on July 1, 2014 and does not expect the adoption of this standard to have a material effect on its consolidated financial statements.
In May 2014, the FASB issued ASU No. 2014-09Revenue from Contracts with Customers (Topic 606) (“ASU 2014-09”). ASU 2014-09 affects any entity that either enters into contracts with customers to transfer goods or services or enters into contracts for the transfer of nonfinancial assets unless those contracts are within the scope of other standards (for example, insurance contracts or lease contracts). The core principle of the guidance is that an entity should recognize revenue to depict the transfer of promised goods or services to customers in an amount that reflects the consideration to which the entity expects to be entitled in exchange for those goods or services. To achieve that core principle, an entity should apply the following steps: (1) Identify the contract(s) with a customer; (2) Identify the performance obligations in the contract; (3) Determine the transaction price; (4) Allocate the transaction price to the performance obligations in the contract; (5) Recognize revenue when (or as) the entity satisfies a performance obligation. For a public entity, ASU 2014-09 is effective for annual reporting periods beginning after December 15, 2016, including interim periods within that reporting period. Early adoption is not permitted. The Company does not expectis currently evaluating the impact of the adoption of ASU 2011-04 will have a material impact on its consolidated financial statements.
In June 2011, the FASB issued ASU 2011-05, Presentation of Comprehensive Income (“ASU 2011-05”). ASU 2011-05 eliminates the option to report other comprehensive income and its components in the statement of changes in shareholders’ equity and requires an entity to present the total of comprehensive income, the components of net income and the components of other comprehensive income either in a single continuous statement or in two separate but consecutive statements. This pronouncement is effective for fiscal years, and interim periods within those years, beginning after December 15, 2011. In December 2011, the FASB issued ASU 2011-12, Deferral of the Effective Date for Amendments to the Presentation of Reclassifications of Items Out of Accumulated Other Comprehensive Income in Accounting Standards Update No. 2011-05 (“ASU 2011-12”). ASU 2011-12 defers the requirement in ASU 2011-05 that entities present reclassification adjustments for each component of accumulated other comprehensive income in both net income and other comprehensive income on the face of the financial statements. ASU 2011-12 requires entities to continue to present amounts reclassified out of accumulated other comprehensive income on the face of the financial statements or disclose those amounts in the notes to the financial statements. The effective date of ASU 2011-12 is consistent with ASU 2011-05, which is effective for fiscal years and interim periods beginning after December 15, 2011 for public entities. Retrospective application is required and early adoption is permitted. The Company has opted to early adopt ASU 2011-05. The provision of ASU 2011-12 did not have a material impact on the presentation of the Company’s financial statements.
this standard.
Financial Position
The following are some financial highlights for the fiscal year ended June 30, 2012:2014:
| · | Total assets increased by approximately |
| · | Cash and cash equivalents increased by |
| · | Accounts receivable at June 30, |
| · | Cost and estimated earnings in excess of billings as of June 30, |
| · | Inventory |
| · | Property, plant and equipment and prepaid land leases increased by approximately |
| · | Assets held for sale |
However, during the year ended June 30, 2012, due to the state macro-control on the real estate market in the PRC, the Company decided not to dispose of the previous headquarters in Beijing Xisanqi, and reclassified them from assets held for sale to prepaid land lease and property, plant and equipment as of June 30, 2012, respectively. Upon reclassification, each asset was recorded at the carrying amount before it was classified as held for sale, adjusted for any amortization or depreciation that would have been recognized had the asset been continuously classified as held and used, which was lower than its fair value. The effect on the results of operations related to amortization and depreciation charges for the year ended June 30, 2012 amounted to $281,270.
| · | Investments in equity investees decreased by approximately |
| · | Total liabilities |
| · | Short-term bank loans decreased by approximately |
| · | Accounts payable increased by approximately |
| · | Deferred revenue increased by approximately |
| · | Based on the Company’s historical operating results and order backlog, the Company believes that it is more than likely that the deferred tax assets net of valuation allowance would be realized. |
| A. | Operating Results |
Comparison of Fiscal Years Ended June 30, 20122014 and 20112013
Revenues: For the fiscal year ended June 30, 2012,2014, total revenues amounted to approximately $321.7$521.3 million, an increase of approximately $58.9$172.3 million, compared to approximately $262.8$349.1 million for the prior fiscal year, representing a significantan increase of 22.4%49.4%.
Integrated contract revenue accounted for approximately $305.0$478.3 million of total revenues, an increase of approximately $56.4$149.7 million or 22.7%45.6%, compared to approximately $248.6$328.6 million for the prior fiscal year. The increase in integrated revenues was mainly attributable to an increase of approximately $50.1$12.7 million or 6.0% in industrial automation projects, an increase of $24.2approximately $95.8 million or 116.3% in overseas sales, whichrail transportation, and an increase of approximately $72.7 million or 201.3% in mechanical and electrical solutions business. The revenue increase was generatedslightly offset by Concord, and a decrease of $16.4$8.9 million in rail transportation.miscellaneous segment.
Approximately $16.7$31.9 million of total revenues related towas generated from product revenue,sales, an increase of approximately $2.4$11.4 million, or 17.3%55.7%, compared to approximately $14.3$20.5 million in product revenue for the prior year. Product revenue depends on overall demand for the Company’s spare parts for customers’ maintenance and replacement purposes.
Approximately $11.1 million of total revenue was generated from service rendered, compared to nil from last year. The Company allocated more resources to the service sector in fiscal 2014 which led to the increase of the revenue.
The Company’s total revenue by segments was as follows:
| Fiscal year ended June 30, | ||||||||||||||||
| 2014 | 2013 | |||||||||||||||
| $ | % to Total Revenue | $ | % to Total Revenue | |||||||||||||
| Industrial Automation (“IA”) | 224.4 | 43.0 | % | 211.7 | 60.7 | % | ||||||||||
| Rail Transportation (“Rail”) | 178.1 | 34.2 | % | 82.3 | 23.6 | % | ||||||||||
| Mechanical and Electrical Solutions (“M&E”) | 108.8 | 20.9 | % | 36.1 | 10.4 | % | ||||||||||
| Miscellaneous | 10.0 | 1.9 | % | 18.9 | 5.3 | % | ||||||||||
| Total | 521.3 | 100.0 | % | 349.1 | 100.0 | % | ||||||||||
Revenue Backlog: An important measure of the stability and growth of the Company’s business is the size of its backlog, which represents the total amount of unrecognized revenue associated with existing contracts. Our backlog as of June 30, 2014, amounted to approximately $555.1 million, representing an increase of approximately $66.4 million, or 13.6%, compared to approximately $488.7 million as of June 30, 2013.
Of the total backlog as of June 30, 2014, the unrecognized revenue associated with new contracts signed in the fiscal year 2014 was approximately $257.5 million and the amount brought forward from prior periods was approximately $297.6 million, comparing to the total backlog as of June 30, 2013 of approximately $290.1 million from new contracts signed in fiscal year 2013, and approximately $198.6 million from contracts carried forward from prior year.
Cost of revenues: Cost of revenues can be divided into cost of integrated contracts and cost of products sold which matches with the categories of revenues. For the fiscal year ended June 30, 2014, the total cost of revenues amounted to approximately $345.7 million, an increase of approximately $120.3 million, or 53.4%, compared to approximately $225.4 million for the prior fiscal year. The increase was due to an approximate $111.5 million increase in the cost of integrated contracts.
The cost of integrated contract revenue consists primarily of three components: cost of equipment and materials, labor costs and other manufacturing expenses such as detecting expense, technology service fee and so on incurred from designing, building and delivering customized automation solutions to customers. The total cost of integrated contracts was approximately $330.0 million for the fiscal year ended June 30, 2014, compared to approximately $218.6 million for the prior fiscal year, representing an increase of approximately $111.5 million, or 51.0%. The increase was primarily due to an increase of approximately $88.8 million in cost of equipment and materials, an increase of approximately $13.0 million in labor cost, and an increase of approximately $9.7 million in manufacturing expenses. Of the total cost of integrated contract revenue, cost of equipment and materials accounted for approximately $232.5 million, compared to approximately $143.7 million for the prior fiscal year; labor cost accounted for approximately $56.2 million for the fiscal year 2014, compared to approximately $43.3 million for the prior fiscal year; and other manufacturing expenses accounted for approximately $41.3 million, compared to approximately $31.6 million for the prior fiscal year. Of the total integrated contract revenue, cost of equipment and materials accounted for 48.2%, compared to 43.7% for the prior fiscal year; labor cost accounted for 11.6% for the 2014 period, compared to 13.2% for the prior fiscal year; and other manufacturing expenses accounted for 8.6%, compared to 9.6% for the prior fiscal year. The cost components of integrated contracts were determined and varied according to requirements of different customers.
Sales of products represent sales of spare parts (either company manufactured or purchased from outside vendors) to customers for maintenance and replacement purposes. The products purchased from outside vendors have different functions and capabilities from our self-made products. We decide whether or not to purchase from outside vendors or make the necessary products ourselves, based on the needs and preferences of different customers and efficiency considerations. Therefore, as a percentage of the cost of products sold, the self-made products and outsourced products have varied significantly from time to time. The cost of products sold for the fiscal year ended June 30, 2014 was approximately $11.6 million, an increase of approximately $4.8 million, compared to approximately $6.8 million for the prior fiscal year.
The majority of the cost of the service revenue is labor cost. Our employees spend time and incur expenses while they are with the customers. From time to time, we will also need to incur materials costs related to the service, especially for providing extended warranty services. The cost of service revenue for fiscal year ended Jun 30, 2014 was approximately $4.1 million.
Gross margin: For the fiscal year ended June 30, 2014, as a percentage of total revenues, the overall gross margin was 33.7%, compared to 35.4% for the prior fiscal year. The gross margin for integrated contracts was 31.0% for the year ended June 30, 2014, compared to 33.5% for the prior year. The decrease in gross margin for integrated contracts was mainly due to our different sales mix during the fiscal year 2014. The gross margin for products sold was 63.7% for the fiscal year ended June 30, 2014, compared to 66.8% for the prior fiscal year. The gross margin for service provided was 63.3% for the fiscal year ended June 30, 2014.
Selling expenses: Selling expenses mainly consist of compensation, traveling and administrative expenses related to marketing, sales and promotion activities of the Company’s marketing departments. Selling expenses were approximately $28.3 million for the fiscal year ended June 30, 2014, an increase of 5.5%, or approximately $1.5 million, compared to approximately $26.8 million for the prior fiscal year. As a percentage of total revenues, selling expenses accounted for 5.4% and 7.7% for the fiscal year ended June 30, 2014 and 2013, respectively. The Company has established guidelines that specifically tailored for different industries and regions to monitor and evaluate sales performance, and to control selling expenses.
General and administrative expenses: General and administrative expenses mainly include compensation, traveling and other administrative expenses of non-sales-related departments, such as the finance department, information systems department and human resources department. General and administrative expenses amounted to approximately $39.7 million for the fiscal year ended June 30, 2014, representing an increase of approximately $10.1 million, or 34%, compared to approximately $29.6 million for the prior fiscal year, mainly due to an increase of approximately $3.7 million contributed by the newly acquired subsidiaries; and an increase of approximately $4.2 million in allowance for doubtful accounts. As a percentage of total revenues, G&A expenses were 7.6% and 8.5% for the fiscal years ended June 30, 2014 and 2013, respectively.
Research and development expenses: Research and development expenses comprise mostly employee compensation, materials consumed and experiment expenses that related to specific new product research and development, as well as any expenses incurred for basic research on advanced technologies. For the fiscal year ended June 30, 2014, research and development expenses were approximately $36.5 million, compared to approximately $32.5 million for the prior fiscal year. The approximate $4.0 million, or 12.2%, increase was mainly due to increased research and development activities during the fiscal year 2014. As a percentage of total revenues, research and development expenses were 7.0% and 9.3% for the fiscal years ended June 30, 2014 and 2013, respectively.
VAT refunds and government subsidies: The state tax bureaus in Beijing and Hangzhou provide financial subsidies out of the value added tax they collect in order to encourage the research and development efforts of certain enterprises. Some of our Beijing and Hangzhou subsidiaries received such refunds. All VAT refunds, that have no further conditions to be met, are recognized in the statements as comprehensive income when cash or approval from the tax bureaus is received. For the fiscal year ended June 30, 2014, VAT refunds were approximately $22.1 million, compared to approximately $18.1 million for the prior fiscal year, increasing by approximately $4.0 million, or 22.3%. As a percentage of total revenues, VAT refunds were 4.2% and 5.2% for the fiscal years ended June 30, 2014 and 2013, respectively.
The local governments in Beijing, Hangzhou and Xi’an also provide financial subsidies to encourage development of certain enterprises. Some of our subsidiaries received such subsidies. For the government subsidies that have no further conditions to be met, the funds received are recognized in the statements as comprehensive income; for the subsidies that have certain operating conditions yet to be met, they are recorded as liabilities when received and will be released to income when the conditions are met.Gross subsidy income received from the government amounted to approximately $5.1 million and $4.9 million for the fiscal years ended June 30, 2014 and 2013, respectively, an increase of approximately $0.2 million, or 4.6%.
Income from operations: Income from operations increased by approximately $40.7 million, from approximately $57.7 million for the fiscal year ended June 30, 2013 to approximately $98.4 million for the fiscal year ended June 30, 2014. We were able to maintain the overall margin at the same level compared to last year; meanwhile, the revenue from all three contract types experienced a sizable growth during fiscal year 2014 which contributed the income from operations growth.
Interest income: For the fiscal year ended June 30, 2014, interest income increased by approximately $0.2 million, or 5.8% from approximately $3.1 million for the prior year, to approximately $3.3 million for the current period. As a percentage of total revenue, interest income accounted for 0.6% and 0.9% for the fiscal years ended June 30, 2014 and 2013, respectively. The interest income was mainly earned from time deposits with maturities over three months.
Interest expenses: For the fiscal year ended June 30, 2014, interest expenses decreased by approximately $0.2 million, or 7.9% from approximately $2.2 million for the prior year, to approximately $2.0 million for the current period. As a percentage of total revenue, interest expenses accounted for 0.4% and 0.6% for the fiscal years ended June 30, 2014 and 2013, respectively. The interest expenses were incurred by the short-term and long-term loan we had.
Other income (expenses), net: For the fiscal year ended June 30, 2014, the other income (expense), net decreased by approximately $6.6 million from approximately $0.1 million income for the prior year, to approximately $6.5 million expenses for the current period. The decrease was mainly due to the fact that we experienced approximately $8.0 million loss from the fluctuation of fair value of the contingent consideration related to the acquisition of Bond which is significantly higher than last year’s $0.9 million loss.
Income tax expenses: For the year ended June 30, 2014, the Company’s income tax expense was approximately $19.9 million for financial reporting purposes, an increase of approximately $11.8 million, as compared to $8.1 million for the prior year. Of the $19.9 million expenses for the current year, $1.4 million was accrued and withheld for the expected profits distribution from PRC to overseas. The remaining retained earnings of the Company’s PRC entities are expected to be permanently reinvested for its operations. Excluding the withholding tax impact, the effective tax rate for the current year is 20.2%. Beijing Hollysys & Hang Zhou Hollysys are now in the process of renewing their HNTE certification, which would grant the Company a preferential tax rate of 15%, for calendar years 2014 to 2016. For the period from January to June 2014, the Company used the statutory tax rate of 25% to calculate the current and deferred tax from a conservative stand point.
Net income attributable to noncontrolling interest: The noncontrolling interests of the Company include noncontrolling shareholders’ interests in each subsidiary. For fiscal 2014, the noncontrolling interest is the ownership interests of 49% in Hollycon. The net income attributable to noncontrolling interest for the fiscal year ended June 30, 2014 was $1.8 million, an increase of approximately $1.3 million, from approximately $0.5 million for the prior year.
Net income and earnings per share attributable to Hollysys: For the fiscal year ended June 30, 2014, net income attributable to Hollysys amounted to approximately $69.6 million, representing an increase of approximately $17.6 million, as compared to approximately $52.0 million for the prior year. The basic and diluted earnings per share were $1.20 and $1.19 for the year ended June 30, 2014, as compared to $0.93 and $0.92 for the prior year, representing an increase of $0.28 and $0.27, respectively. The increase was primarily due to the higher net income attributable to the Company which increased $17.6 million compared to fiscal 2013.
Comparison of Fiscal Years Ended June 30, 2013 and 2012
Revenues: For the fiscal year ended June 30, 2013, total revenues amounted to approximately $349.1 million, an increase of approximately $27.4 million, compared to approximately $321.7 million for fiscal year 2012, representing a significant increase of 8.5%.
Integrated contract revenue accounted for approximately $328.6 million of total revenues, an increase of approximately $23.6 million, or 7.7%, compared to approximately $305.0 million for fiscal year 2012. The increase in integrated revenues was mainly attributable to an increase of approximately $15.2 million in industrial automation projects and an increase of $34.2 million in M&E projects. The increase was partially offset by the revenue decrease of $19.0 million in rail transportation and $6.8 million in rail transportation and miscellaneous projects.
Approximately $20.5 million of total revenues related to product revenue, an increase of approximately $3.8 million, or 22.5%, compared to approximately $16.7 million in product revenue for fiscal year 2012. Product revenue depends on overall demand for the Company’s spare parts for customers’ maintenance and replacement purposes.
The Company’s total revenue by segment was as follows:
| Fiscal year ended June 30, | ||||||||||||||||
| 2013 | 2012 | |||||||||||||||
| $ | % to Total Revenue | $ | % to Total Revenue | |||||||||||||
| Industrial Automation | 211.7 | 60.6 | % | 190.3 | 59.1 | % | ||||||||||
| Rail Transportation | 82.3 | 23.6 | % | 100.9 | 31.4 | % | ||||||||||
| Mechanical and Electrical Solutions | 36.2 | 10.4 | % | 2.0 | 0.6 | % | ||||||||||
| Miscellaneous | 18.9 | 5.4 | % | 28.5 | 8.9 | % | ||||||||||
| Total | 349.1 | 100.0 | % | 321.7 | 100.0 | % | ||||||||||
Revenue Backlog: An important measure of the stability and growth of the Company’s business is the size of its backlog, which represents the total amount of unrecognized revenue associated with existing contracts. Our backlog as of June 30, 2012,2013, amounted to approximately $389.8$488.7 million, representing an increase of approximately $93.4$98.9 million, or 31.5%25.4%, compared to approximately $296.4$389.8 million as of June 30, 2011.2012.
Of the total backlog as of June 30, 2012,2013, the unrecognized revenue associated with new contracts signed in the fiscal 20122013 period was approximately $242.4$290.1 million and the amount brought forward from prior periods was approximately $147.5$198.6 million. The total backlog as of June 30, 20112012 comprised of approximately $146.9$242.4 million from new contracts signed in fiscal year 2011,2012, and approximately $149.5$147.5 million from contracts carried forward from prior year.
Cost of revenues: Cost of revenues can be divided into cost of integrated contracts and cost of products sold, in line with the categories of revenues. For the fiscal year ended June 30, 2012,2013, the total cost of revenues amounted to approximately $195.4$225.4 million, an increase of approximately $23.6$30.0 million, or 13.8%15.4%, compared to approximately $171.7$195.4 million for the prior fiscal year. The increase was due to an approximate $23.8$29.4 million increase in the cost of integrated contracts, and an approximate $0.2$0.6 million year-over-year decreaseincrease in the cost of products sold.
The cost of integrated contract revenue consists primarily of three components: cost of equipment and materials, labor costs and other manufacturing expenses such as detecting expense, technology service fee and so on incurred from designing, building and delivering customized automation solutions to customers. The total cost of integrated contracts was approximately $189.2$218.6 million for the fiscal year ended June 30, 2012,2013, compared to approximately $165.4$189.2 million for the prior fiscal year, representing an increase of approximately $23.8$29.4 million, or 14.4%15.6%. The increase was primarily due to an increase of approximately $17.0$17.5 million in labor cost because of the higher labor cost of Concord, an increase of approximately $8.4 million in cost of equipment and materials, and an increase of approximately $6.3$3.5 million in manufacturing expenses. Of the total cost of integrated contract revenue, labor cost accounted for 13.6%approximately $43.3 million for the fiscal 20122013 period, compared to 5.3%approximately $25.8 million for the prior fiscal year; cost of equipment and materials accounted for 71.5%,approximately $143.7 million, compared to 81.5%approximately $135.3 million for the prior fiscal year; and other manufacturing expenses accounted for 14.9%,approximately $31.6 million, compared to 13.2%approximately $28.1 million for the prior fiscal year. Of the total integrated contract revenue, labor cost accounted for 8.5%13.2% for the 20122013 period, compared to 3.5%8.5% for the prior fiscal year; cost of equipment and materials accounted for 44.4%43.7%, compared to 53.8%44.4% for the prior fiscal year; and other manufacturing expenses accounted for 9.2%9.6%, compared to 8.7%9.2% for the prior fiscal year. The cost components of integrated contracts were determined and varied according to requirements of different customers.
Sales of products represent sales of spare parts (either company manufactured or purchased from outside vendors) to customers for maintenance and replacement purposes. The products purchased from outside vendors have different functions and capabilities from our self-made products. We decide whether or not to purchase from outside vendors or make the necessary products ourselves, based on the needs and preferences of different customers and efficiency considerations. Therefore, as a percentage of the cost of products sold, the self-made products and outsourced products have varied significantly from time to time. As our self-made products generally contribute higher margins than products purchased from outside vendors, sales of a greater portion of self-made products generally result in lower costs of products sold. The cost of products sold for the fiscal year ended June 30, 20122013 was approximately $6.2$6.8 million, a decreasean increase of approximately $0.2$0.6 million, compared to approximately $6.4$6.2 million for the prior fiscal year.
Gross margin: For the fiscal year ended June 30, 2012,2013, as a percentage of total revenues, the overall gross margin was 39.3%35.4%, compared 34.7%39.3% for the prior fiscal year. The gross margin for integrated contracts was 38.0%33.5% for the year ended June 30, 2012,2013, compared to 33.5%38.0% for the prior year. The increase in gross margin fluctuation for integrated contracts was mainly due mainly to our different sales mix during the fiscal 20122013 period. The gross margin for products sold was 62.9%66.8% for the fiscal year ended June 30, 2012,2013, compared to 55.4%62.9% for the prior fiscal year.
Selling expenses: Selling expenses mainly consist of compensation, traveling and administrative expenses related to marketing and sales and promotion activities of the Company’s marketing departments. Selling expenses were approximately $27.6$26.8 million for the fiscal year ended June 30, 2012, an increase2013, a decrease of 35.2%3.1%, or approximately $7.2$0.8 million, compared to approximately $20.4$27.6 million for the prior fiscal year, mainly duethanks to the Company’s expanded sales networkefforts the company made to monitor and increased sales activities.control its selling expenses. As a percentage of total revenues, selling expenses accounted for 8.6%7.7% and 7.8%8.6% for the fiscal year ended June 30, 2013 and 2012, and 2011, respectively. The Company has established guidelines to monitor and evaluate sales performance for its products to customers in different industries and regions to control selling expenses..
General and administrative expenses: General and administrative expenses mainly include compensation, traveling and other administrative expenses of non-sales-related departments, such as the planning and finance department, information systems department and human resources department. General and administrative expenses amounted to approximately $26.0$29.6 million for the fiscal year ended June 30, 2012,2013, representing an increase of approximately $9.3$3.6 million, or 56.1%13.9%, compared to approximately $16.7$26.0 million for the prior fiscal year, mainly due to an increase of $4.9approximately $1.4 million contributed by the newly acquired subsidiaries; and an increase of $1.6approximately$1.9 million in allowance for doubtful accounts. As a percentage of total revenues, G&A expenses were 8.2%8.5% and 6.1%8.1% for the fiscal years ended June 30, 20122013 and 2011,2012, respectively.
Research and development expenses: Research and development expenses comprise mostly employee compensation, materials consumed and experiment expenses for specific new product research and development, and any expenses incurred for basic research on advanced technologies. For the fiscal year ended June 30, 2012,2013, research and development expenses were approximately $25.6$32.5 million, compared to approximately $20.1$25.6 million for the prior fiscal year. The approximate $5.5$6.9 million, or 26.9%27.2%, increase was mainly due to increased research and development activities during the 20122013 period. As a percentage of total revenues, research and development expenses were 7.9%9.3% and 7.7%7.9% for the fiscal years ended June 30, 2013 and 2012, and 2011, respectively.
VAT refunds and government subsidies: The state tax bureaus in Beijing and Hangzhou provide financial subsidies out of the value added tax they collect in order to encourage the research and development efforts of certain enterprises. Beijing Hollysys and Hangzhou Hollysys both received such refunds. All VAT refunds, that have no further conditions to be met, are recognized in the statements of comprehensive income when cash or approval from the tax bureaus is received. For the fiscal year ended June 30, 2012,2013, VAT refunds were approximately $15.0$18.1 million, compared to approximately $9.0$15.0 million for the prior fiscal year, increasing by approximately $6.0$3.1 million, or 67.0%, mainly due to the PRC government approving a VAT refund of $5.3 million in fiscal 2012 related to sales generated during January to June 2011.20.6%. As a percentage of total revenues, VAT refunds were 4.7%5.2% and 3.4%4.7% for the fiscal years ended June 30, 20122013 and 2011,2012, respectively.
The local governments in Beijing, Hangzhou and HangzhouXi’an also provide financial subsidies to encourage development of certain enterprises. Beijing Hollysys and Hangzhou Hollysys bothSome of our subsidiaries received such subsidies. For the government subsidies that have no further conditions to be met, the amounts are recognized in the statements of comprehensive income when received; for the amounts with certain operating conditions, the government subsidies are recorded as liabilities when received and will be released to income when the conditions are met. Gross subsidy income received from the government amounted to approximately $3.3$4.9 million and $1.8$3.3 million for the fiscal yearyears ended June 30, 20122013 and 2011,2012, respectively, an increase of approximately $1.5$1.6 million, or 80.6%48.1%.
Income from operations: Income from operations increaseddecreased by approximately $20.7$7.7 million, from approximately $44.7 million for the fiscal year ended June 30, 2011 to approximately $65.4 million for the fiscal year ended June 30, 2012.2012 to approximately $57.7 million for the fiscal year ended June 30, 2013. The increasedecrease in income from operations was primarily due to the increasedecrease in revenuegross profit and gross margins.
Gains on disposal of shares of equityDividend income from cost investees: The gains on disposal of shares of equity investees amounted to $2.0Dividend income increased by approximately $0.8 million for the fiscal year 2012, whichended June 30, 2013, from nil for the fiscal year ended June 30, 2012. All of the dividend income was mainly contributed by the Company disposing of a 10% equity interest in China Techenergyreceived from Heilongjiang Ruixing Technology Co., Ltd. for consideration, a cost method investee of RMB 27.8 million (approximately $4.4 million), and recognizing a disposal gain of $2.0 million during this year. After this transaction, the Company continues to hold a 40% equity interest in China Techenergy.Company.
Interest expenses, netincome: For the fiscal year ended June 30, 2012, net2013, interest expenses decreasedincome increased by approximately $0.3$1.3 million, or 14.7%,75.5% from approximately $1.6$1.8 million for the prior year, to approximately $1.3$3.1 million for the current period. The increase was mainly due to the increased cash and cash equivalents and time deposits. As a percentage of total revenue, net interest expenseincome accounted for 0.4%0.9% and 0.6%0.5% for the fiscal years ended June 30, 2013 and 2012, respectively.
Interest expenses: For the fiscal year ended June 30, 2013, interest expenses decreased by approximately $0.9 million, or 30.0% from approximately $3.1 million for the prior year, to approximately $2.2 million for the current period. The decrease was mainly due to the decreased long-term bank loans. As a percentage of total revenue, interest expenses accounted for 0.6% and 2011,1.0% for the fiscal years ended June 30, 2013 and 2012, respectively.
Income tax expenses: For the year ended June 30, 2012,2013, the Company’s income tax expense was approximately $10.4$8.1 million for financial reporting purposes, an increasea decrease of approximately $4.0$2.3 million, as compared to $6.4$10.4 million for the prior year. The largelower income tax expense for this year was mainly due to during this year, Beijing Hollysys, one of our subsidiaries, was certified as a Key Software Enterprise for calendar year 2011 and 2012, and applied to a preferential income tax rate of 10% retroactively from January 2011 to December 2012. The Company thus recognized an income tax credit of $2.7 million during this year. Excluding this impact, the income tax expense of $4.4and the effective tax rate were $10.8 million related to certain expenses incurred duringand 17.8% for the fiscal year that were determined not to be deductible for tax purposes. As2013.As a percentage of income before income taxes, the effective tax rate was 15.5%13.4% and 13.5%15.5% for the years ended June 30, 20122013 and 2011,2012, respectively.
Net income attributable to noncontrolling interests: The noncontrolling interests of the Company include noncontrolling shareholders’ interests in each subsidiary. For fiscal 2012 and 2011,2013, the noncontrolling interests are the ownership interests of 49% in WoDeWeiYe and Hollycon, respectively. The net income attributable to noncontrolling interest for the fiscal year ended June 30, 20122013 was $0.4$0.5 million, an increase of $0.4approximately $0.1 million, from a net loss of $4.9 thousandapproximately $0.4 million for the prior year, primarily due to the increased net income of WoDeWeiYe and Hollycon for fiscal 2012.year.
Net income and earnings per share attributable to Hollysys: For the fiscal year ended June 30, 2012,2013, net income attributable to Hollysys amounted to approximately $56.2million,$52.0 million, representing an increasea decrease of approximately $14.7$4.2 million, as compared to approximately $41.5$56.2 million for the prior year. The basic and diluted earnings per share were $1.01$0.93 and $1.01$0.92 for the year ended June 30, 2012,2013, as compared to $0.76$1.01 and $0.75$1.01 for the prior year, representing an increasea decrease of $0.25$0.08 and $0.26,$0.09, respectively. Such increasedecrease was primarily due to an increase of approximately $35.1 million in gross profit.
Comparison of Fiscal Years Ended June 30, 2011 and 2010
Operating Revenues: For the fiscal year ended June 30, 2011, total revenues amounted to approximately $262.8 million, an increase of approximately $88.7 million, compared to approximately $174.1million for the prior fiscal year, representing a significant increase of 51.0%.
Integrated contract revenue accounted for approximately $248.6 million of total revenues, an increase of approximately $84.5 million, or 51.5%, compared to approximately $164.1 million for the prior fiscal year. The increase in revenues was mainly attributable to an increase of approximately $32.8 million in industrial automation projects and $55.5 million of revenues generated from rail transportation business.
Approximately $14.3 million of total revenues related to product revenue, an increase of approximately $4.3 million, or 43.1%, compared to approximately $10.0 million in product revenue for the prior year. Product revenue depends on overall demand for the Company’s spare parts for customers’ maintenance and replacement purposesduring the 2011 fiscal year.
Revenue Backlog: An important measure of the stability and growth of the Company’s business is the size of its backlog, which represents the total amount of unrecognized revenue associated with existing contracts..Our backlog as of June 30, 2011, amounted to approximately $296.4 million, representing an increase of approximately $43.5 million, or 17.2%, compared to approximately $252.9 million as of June 30, 2010.
Of the total backlog as of June 30, 2011, the unrecognized revenue associated with new contracts signed in the fiscal 2011 period was approximately $146.9 million and the amount brought forward from prior periods was approximately $149.5 million. The total backlog as of June 30, 2010 comprised of approximately $145.9 million from new contracts signed in fiscal year 2010, and approximately $107.0 million from contracts carried forward from prior year.
Cost of Revenues: Cost of revenues can be divided into cost of integrated contracts and cost of products sold, in line with the categories of revenues. For the fiscal year ended June 30, 2011, the total cost of revenues amounted to approximately $171.7 million, an increase of approximately $57.8 million, or 50.7%, compared to approximately $113.9 million for the prior fiscal year. The increase was due to an approximate $55.1 million increase in the cost of integrated contracts, and an approximately $2.7 million year-over-year increase in the cost of products sold.
The cost of integrated contract revenue consists primarily of three components: cost of equipment and materials, labor costs and other manufacturingadditional amortization expenses incurred from designing, building and delivering customized automation solutions to customers. The total cost of integrated contracts was approximately $165.4 million for the fiscal year ended June 30, 2011, compared to approximately $110.3 million for the prior fiscal year, representing an increase of approximately $55.1 million, or 50.0%. The increase was primarily due to an increase of approximately $51.0 million in the cost of equipment and materials, and approximately $3.1 million in labor cost. Of the total cost of integrated contract revenue, labor cost accounted for 5.3% for the fiscal 2011 period, compared to 5.1% for the prior fiscal year; cost of equipment and materials accounted for 81.5%, compared to 76.0% for the prior fiscal year; and other manufacturing expenses accounted for 13.2%, compared to 18.9% for the prior fiscal year. Of the total integrated contract revenue, labor cost accounted for 3.5%for the 2011 period, compared to 3.8% for the prior fiscal year; cost of equipment and materials accounted for 53.8%, compared to 56.1% for the prior fiscal year; and other manufacturing expenses accounted for 8.7%, compared to 14.0% for the prior fiscal year. The cost components of integrated contracts were determined and varied according to requirements of different customers.
Sales of products represent sales of spare parts (either self-made or purchased from outside vendors) to customers for maintenance and replacement purposes. The products purchased from outside vendors have different functions and capabilities from our self-made products. We decide whether or not to purchase from outside vendors or make the necessary products ourselves, based on the needs and preferences of different customers and efficiency considerations. Therefore, as a percentage of the cost of products sold, the self-made products and outsourced products have varied significantly from time to time. As our self-made products generally contribute higher margins than products purchased from outside vendors, sales of a greater portion of self-made products generally result in lower costs of products sold. The cost of products sold for fiscal year ended June 30, 2011 was approximately $6.4 million, an increase of approximately $2.7 million, compared to approximately $3.7 million for the prior fiscal year.
Gross Margin: For the fiscal year ended June 30, 2011, as a percentage of total revenues, the overall gross margin was 34.7%, compared to 34.6% for the prior fiscal year. The gross margin for integrated contracts was 33.5% for the year ended June 30, 2011, compared to 32.8% for the prior year. The increase in gross margin for integrated contracts was due mainly to our different sales mix during the fiscal 2011 period. The gross margin for products sold was 55.4% for the fiscal year ended June 30, 2011, compared to 63.2% for the prior fiscal year.
Selling Expenses: Selling expenses mainly consist of compensation, traveling and administrative expenses related to marketing and sales and promotion activities of the Company’s marketing departments. Selling expenses were approximately $20.5 million for the fiscal year ended June 30, 2011, an increase of 68.3%, or approximately $8.3 million, compared to approximately $12.2 million for the prior fiscal year, mainly due to the Company’s expanded sales network and increased selling staffs. As a percentage of total revenues, selling expenses accounted for 7.8% and 7.0% for the fiscal year ended June 30, 2011 and 2010, respectively. The Company has established guidelines to monitor and evaluate sales performance for its products to customers in different industries and regions to control selling expenses.
General and administrative expenses: General and administrative expenses mainly include compensation, traveling and other administrative expenses of non-sales-related departments, such as the planning and finance department, information systems department and human resources department. General and administrative expenses amounted to approximately $16.7 million for the fiscal year ended June 30, 2011, representing an increase of approximately $2.8 million, or 19.8%, compared to approximately $13.9 million for the prior fiscal year, mainly due to increased labor cost. As a percentage of total revenues, G&A expenses were 6.1% and 7.7% for the fiscal year 2011 and 2010, respectively.
Research and Development Expenses: Research and development expenses comprise mostly employee compensation, materials consumed and experiment expenses for specific new product research and development, and any expenses incurred for basic research on advanced technologies. For the fiscal year ended June 30, 2011, research and development expenses were approximately $20.1 million, compared to approximately $13.1 million for the prior fiscal year. The approximate $7.1 million, or 54.0%, increase was mainly due to increased research and development activities during the 2011 period. As a percentage of total revenues, research and development expenses were 7.7% and 7.5% for the fiscal years ended June 30, 2011 and 2010, respectively.
VAT Refunds and Government Subsidies: The state tax bureaus in Beijing and Hangzhou provide financial subsidies out of the value added tax they collect in order to encourage the research and development efforts of certain enterprises. Beijing Hollysys and Hangzhou Hollysys both received such refunds. All VAT refunds are with no further conditions to be met, and are recognized in income statement when cash or approval from tax bureaus is received. For the fiscal year ended June 30, 2011, VAT refunds were approximately $9.0 million, compared to approximately $9.0 million for the prior fiscal year, increased by approximately $0.02 million, or 0.2%. As a percentage of total revenues, VAT refunds were 3.4% and 5.2% for the fiscal years ended June 30, 2011 and 2010, respectively.
The local governments in Beijing and Hangzhou also provide financial subsidies to encourage development of certain enterprises. Beijing Hollysys and Hangzhou Hollysys both received such subsidies. For the government subsidies that with no further conditions to be met, the amounts are recognized in income statement when received; for the amounts with certain operating conditions, the government subsidies are recorded as liabilities when received and will be released to income statement when the conditions are metGross subsidy income receivedarising from the government amountedacquired intangible assets and consideration fair value adjustments amounting to approximately $1.8 million and approximately $2.6 million for the fiscal year ended June 30, 2011 and 2010, respectively, a decrease of approximately $0.8 million, or 28.9%.
Income from Operations: Income from operations increased by approximately $12.1 million, from approximately $32.6 million for the fiscal year ended June 30, 2010, to approximately $ 44.7 million for the fiscal year ended June 30, 2011. The increase in income from operations was primarily due to the increased revenue.
Gains on disposal of shares of equity investees: The gains on disposal of shares of equity investees amounted to $1.4 million for fiscal year 2011, which was mainly contributed by the gain on disposal of a 29% interest in Hollysys Information Technology Co. Ltd. which Hollysys will continue to own 20% after the transaction.
Gain in earnings for the issuance of shares by an equity investee: The gain in earnings for the issuance of shares by an equity investee was $0.8 million for the year ended June 30, 2011, which was from the issuance of shares by IPE Biotechnology Co., Ltd (hereafter “IPE”). In April 2011, a third party company injected $4.5 million to IPE, of which $0.9 million was recognized as the paid in capital, and the remaining $3.6 million was recognized as capital premium. As a result of this capital increment, Hollysys’ equity interest in IPE was diluted from 28.04% to 23.39%, and recognized a gain of $0.8 million from this dilution.
Interest Expenses, Net: For the year ended June 30, 2011, net interest expenses increased by approximately $0.5 million, or 47.4%, from approximately $1.1 million for the prior year, to approximately $1.6 million for the current period. As a percentage of total revenue, net interest expense accounted for 0.6% and 0.6% for the fiscal years ended June 30, 2011 and 2010, respectively.
Income Tax Expenses: For the year ended June 30, 2011, the Company’s income tax expense was approximately $6.4 million for financial reporting purposes, a decrease of approximately $1.3 million, as compared to $7.7 million for the prior year. In fiscal 2011, Hangzhou Hollysys declared a cash dividend of $26.9 million, of which $10.8 million was to be paid to Gifted Time Holdings Limited, a BVI company. According to the tax treaty between China and the BVI, the Company recognized a 10% withholding tax of $1.1$4.0 million. Excluding the withholding tax related to the dividends declaration for fiscal 2011, and a one-time tax expense of $4.5 million related to Hollysys’ group re-organization recorded in the prior year, as discussed below. The effective tax rate was 11.2% and 9.1% for the year ended June 30, 2011 and 2010, respectively.
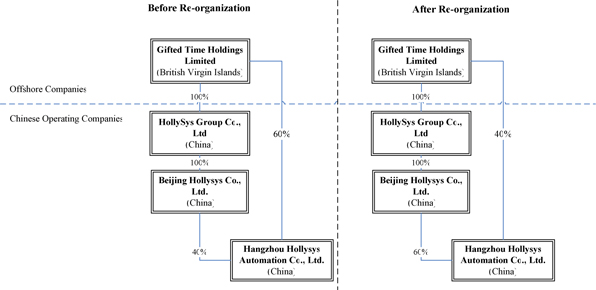
Net income attributable to noncontrolling interests: The noncontrolling interests of the Company includes other parties’ interests in each subsidiary. For fiscal 2011 and 2010, the noncontrolling interests is ownership interests of 49% in WodeWeiYe and Hollycon, respectively. The net loss attributable to noncontrolling interests for the fiscal year ended June 30, 2011 was $5 thousand, a decrease of $1.9 million, from a net income of $1.9 million for the prior year, primarily due to the decrease in noncontrolling interests after the acquisition of the remaining 24.11% interest of Beijing Hollysys by the Company during fiscal 2010.
Net income and Earnings per share attributable to Hollysys: For the fiscal year ended June 30, 2011, net income attributable to Hollysys amounted to approximately $41.5 million, representing an increase of approximately $15.8 million, as compared to approximately $25.7 million for the prior year. The basic and diluted earnings per share were $0.76 and $0.75 for the year ended June 30, 2011, as compared to $0.50 and $0.50 for the prior year, representing an increase of $0.26 and $0.25, respectively. Such increase was primarily due to an increase of approximately $31.0 million in gross profit.
B. Liquidity and Capital Resources
We believe our working capital is sufficient to meet our present requirements. We may, however, require additional cash due to changing business conditions or other future developments, including any investments or acquisitions we may decide to pursue. In the long-term, we intend to rely primarily on cash flow from operations and additional borrowings from banks to meet our anticipated cash needs. If our anticipated cash flow and borrowing capacity is insufficient to meet our requirements, we may also seek to sell additional equity, debt or equity-linked securities. We cannot assure you that any financing will be available in the amounts we need or on terms acceptable to us, if at all.
In line with the industry practice, we typically have a long receivable collection cycle. As a result, our cash provided by our operations in any given year may not be sufficient to fully meet our operating cash requirements in that year. We will use available financing means, including bank loans, to provide sufficient cash inflows to balance timing differences in our cash flows.
We estimate our liquidity needs for investing and financing activities for 2013fiscal 2015 will be approximately $30$35.0 million, which will be primarily related to the repayment of bank borrowings, and the capital expenditures, mainly consistand cash consideration payment for the acquisition of cash payments for phase II of Yizhuang facility construction.Bond. Our future working capital requirements will depend on many factors, including, among others, the rate of our revenue growth, the timing and extent of expansion of our sales and marketing activities, the timing of introductions of new products and/or enhancements to existing products, and the timing and extent of expansion of our manufacturing capacity.
Our long-term liquidity needs will relate primarily to working capital to pay our suppliers, and third-party manufacturers, as well as any increases in manufacturing capacity or acquisitions of third party businesses that we may seek in the future. We expect to meet these requirements primarily through our current cash holdings, revolving short-term bank borrowings, as well as our cash flow from operations. For fiscal year 2013,2015, we expect a $20$14.6 million cash consideration payment for the acquisition of Bond, and a $7.3 million capital expenditure program, mainly related to the cash payments for phase II of the Yizhuang facility construction. We currently do not have any plan to incur significant capital and investing expenditures for the foreseeable future beyond 2013.2015.
Cash Flow and Working Capital
As of June 30, 2011 and 2012, we had approximately $90.7 million and $96.3 million, respectively, in cash and cash equivalents. As of June 30, 2012,2014, we had total assets of $552.8approximately $926.7 million, of which cash and cash equivalents amounted to $96.3$162.2 million, time deposits with original maturities over three months amounted to $21.6$28.3 million, accounts receivable amounted to $136.6$258.9 million and inventories amounted to $26.7$35.1 million. While working capital was approximately $248.8$331.0 million, equity amounted to $338.1$492.1 million and our current ratio was approximately 2.3.1.83.
See Item 8, Financial Information, A. Consolidated Statements and Other Financial Information, Dividend Policy, for information on the ability of certain of our subsidiaries in China to make dividends to their respective parent companies.
The following table shows our cash flows with respect to operating activities, investing activities and financing activities for the fiscal years ended June 30, 2010, 20112012, 2013 and 2012:2014:
| Cash Flow Item | Fiscal Years Ended June 30 | Fiscal Years Ended June 30 | ||||||||||||||||||||||
| 2010 | 2011 | 2012 | 2012 | 2013 | 2014 | |||||||||||||||||||
| Net cash provided by (used in) operating activities | $ | 30,145,816 | $ | (1,793,491 | ) | $ | 57,179,212 | |||||||||||||||||
| Net cash provided by operating activities | $ | 57,179,212 | $ | 30,677,386 | $ | 83,278,019 | ||||||||||||||||||
| Net cash used in investing activities | $ | (21,478,441 | ) | $ | (29,071,216 | ) | $ | (27,892,165 | ) | $ | (27,892,165 | ) | $ | (12,101,087 | ) | $ | (25,229,808 | ) | ||||||
| Net cash used in financing activities | $ | (19,184,238 | ) | $ | (2,760,031 | ) | $ | (25,335,120 | ) | $ | (25,335,120 | ) | $ | (3,715,454 | ) | $ | (8,327,401 | ) | ||||||
| Effect of exchange rate changes on cash and cash equivalents | $ | 1,136,142 | $ | 4,791,852 | $ | 1,711,976 | $ | 1,711,976 | $ | 1,034,773 | $ | 209,709 | ||||||||||||
| Net (decrease) increase in cash and cash equivalents | $ | (9,380,721 | ) | $ | (28,832,886 | ) | $ | 5,663,903 | ||||||||||||||||
| Net increase in cash and cash equivalents | $ | 5,663,903 | $ | 15,895,617 | $ | 49,930,519 | ||||||||||||||||||
| Cash and cash equivalents, beginning of year | $ | 128,882,666 | $ | 119,501,945 | $ | 90,669,059 | $ | 90,669,059 | $ | 96,332,962 | $ | 112,228,579 | ||||||||||||
| Cash and cash equivalents, end of year | $ | 119,501,945 | $ | 90,669,059 | $ | 96,332,962 | $ | 96,332,962 | $ | 112,228,579 | $ | 162,159,098 | ||||||||||||
Operating Activities
For the fiscal year ended June 30, 2014, net cash provided by operating activities was approximately $83.3 million, compared to approximately $30.7 million for prior fiscal year 2013. The net cash inflow of operating activities in fiscal year 2014 was primarily due to net income of approximately $71.5 million, and changes in working capital attributable to an increase in deferred revenue of approximately $63.3 million, an increase in accounts payable of approximately $24.2 million and a combined increase in income tax payable and other tax payable of $12.3 million , all of which were partially offset by an increase in accounts receivable of approximately $88.6 million, and an increase in cost and estimated earnings in excess of billings of approximately $38.9 million.
For the fiscal year ended June 30, 2013, net cash provided by operating activities was approximately $30.7 million, compared to approximately $57.2 million for prior fiscal year 2012. The net cash inflow of operating activities in fiscal year 2013 was primarily due to net income of approximately $52.5 million, and changes in working capital attributable to an increase in accruals and other payables of approximately $11.0 million, an increase in accounts payable of approximately $22.4 million, all of which were partially offset by an increase in accounts receivable of approximately $33.4 million, and an increase in cost and estimated earnings in excess of billings of approximately $20.0 million.
For the fiscal year ended June 30, 2012, net cash provided byinflow of operating activities was approximately $57.2 million, compared to net cash used by operating activities of approximately $1.8 million for prior fiscal year 2011.
The net cash inflow of operating activities in fiscal year 2012 was primarily due to net income of approximately $56.6 million, and changes in working capital attributable to an increase in deferred revenue of approximately $14.4 million, an increase in accounts payable of approximately $8.8 million, all of which were partially offset by an increase in accounts receivable of approximately $16.9 million, and an increase in cost and estimated earnings in excess of billings of approximately $24.7 million.
For the fiscal year ended June 30, 2011, net cash used in operating activities was approximately $1.8 million, compared to a net cash inflow of approximately $30.2 million for prior fiscal year 2010. The net cash outflow of operating activities in fiscal year 2011 was primarily due to changes in working capital attributable to an increase in cost and estimated earnings in excess of billings of approximately $42.6 million, an increase in accounts receivable of approximately $30.2 million, and an increase of inventories of approximately $3.5 million, all of which were partially offset by the net income of approximately $41.5 million, an increase in deferred revenue of approximately $8.0 million, an increase in accruals and other payables of approximately $2.1 million, an increase of accounts payable of approximately $18.5 million.
For the fiscal year ended June 30, 2010, net cash provided by operating activities was approximately $30.2 million, compared to approximately $40.1 million for prior fiscal year 2009. The net cash inflow from operating activities in fiscal year 2010 was primarily due to the net income of approximately $27.6 million, and changes in working capital attributable to an increase in deferred revenue of approximately $12.5 million, an increase in accruals and other payables of approximately $6.0 million, an increase of accounts payable of approximately $5.0 million, and an increase of $5.0 million in income tax payable, all of which were partially offset by an increase in cost and estimated earnings in excess of billings of approximately $10.2 million, an increase in accounts receivable of approximately $10.1 million, and an increase of inventories of approximately $6.0 million.
Investing Activities
For the fiscal years ended June 30, 2012 and 2011,2014, net cash used in investing activities was approximately $25.2 million, compared to approximately $12.1 million for prior fiscal year 2013. The net cash used in investing activities in fiscal year 2014 consisted mainly of a cash outflow of approximately $5.5 million paid for acquisition of Bond, net of cash acquired, a cash outflow of approximately $8.4 million for capital expenditures, a cash outflow of approximately $18.9 million transferred from current accounts to time deposits in banks with original maturities between six months and one year, and a cash inflow of approximately $11.6 million from maturity of time deposits.
For the fiscal years ended June 30, 2013, net cash used in investing activities was approximately $12.1 million, compared to approximately $27.9 million for prior fiscal year 2012. The net cash used in investing activities in fiscal year 2013 consisted mainly of a cash outflow of approximately $11.9 million paid for acquisition of Bond, net of cash acquired, a cash outflow of approximately $9.1 million for capital expenditures, and a cash inflow of approximately $29.1$8.5 million respectively. from maturity of time deposits.
The net cash used in investing activities for the fiscal year 2012 was approximately $27.9 million, consisted mainly of a cash outflow of approximately $21.6 million transferred from current accounts to time deposits in banks with original maturities between six months and one year, a cash outflow of approximately $5.3 million paid for the acquisition of Concord, net of cash acquired, a cash outflow of approximately $5.0 million for capital expenditures, and a cash inflow of approximately $4.4 million related to disposal of shares of equity investees.
The net cash used in investing activities for the fiscal year 2011 consisted mainly of a cash outflow of approximately $16.9 million for prepayment for acquisition of Concord Group, a cash outflow of approximately $16.1 million for capital expenditure.Financing Activities
The net cash used in investing activities for the fiscal year 2010 consisted mainly of a cash outflow of approximately $20.9 million for the construction of our new facility.
Financing Activities
For fiscal year ended June 30, 2012,2014, net cash used in financing activities was approximately $25.3$8.3 million, as compared to approximately $2.8$3.7 million for the prior year. The net cash used in financing activities in fiscal year 2014 consisted mainly of a repayment of long-term bank loans of approximately $9.2 million, a repayment of short-term bank loans of approximately $13.8 million, and proceeds of short-term loans of approximately $14.6 million.
For fiscal year ended June 30, 2013, net cash used in financing activities was approximately $3.7 million, as compared to approximately $25.3 million for the prior year. The net cash used in financing activities in fiscal year 2013 consisted mainly of a repayment of long-term bank loans of approximately $8.2 million, a repayment of short-term bank loans of approximately $4.6 million, the proceeds from the exercise of options of approximately $1.0 million, and proceeds of short-term loans of approximately $7.5 million.
The net cash outflow for fiscal year 2012 iswas $25.3 million, mainly composed of a repayment of short-term bank loans of approximately $12.3 million, a repayment of amount due to the former shareholders of subsidiaries of approximately $8.2 million, a repayment of long-term bank loans of approximately $6.0 million, the proceeds from the exercise of options of approximately $0.7 million, and proceeds of short-term loans of approximately $0.6 million.
The net cash outflow for fiscal year 2011 is composed of a repayment of bonds payable of approximately $12.1 million, a repayment of short-term bank loans of approximately $5.9 million, a repayment of long-term bank loans of approximately $1.51 million, the proceeds of short-term loans of approximately $15.7 million, and proceeds from the exercise of options of approximately $1.1 million.
For fiscal year ended June 30, 2010, net cash used in financing activities was approximately $19.2 million, as compared to approximately $35.9 million cash provided by financing activities for the prior year. The net cash outflow for fiscal year 2010 is composed of a cash outflow of $10.4 million in the acquisition of equity interest from noncontrolling interest, a repayment of short-term bank loans of approximately $4.4 million, a repayment of long-term bank loans of approximately $5.1 million, and a capital injection from noncontrolling interest of $0.7 million.
| C. | Research and Development, Patents and Licenses |
On March 31, 2009, the Company entered into a seven-year bank loan for RMB 250 million from Industrial and Commercial Bank of China, which is due on March 30, 2016, with an annual interest rate of 6.44%. The borrowing was secured by a pledge of the new headquarters facility in Beijing, comprised of prepaid land leases and buildings with an aggregate carrying value of $37.8 million and $41.1 million as of June 30, 2011 and 2012, respectively. Principal amount of $7.1 million was due and repaid before June 30, 2012, and the scheduled principal payments for the outstanding balance on June 30, 2012 are as follows:
| Year Ending June 30, | ||||
| 2013 | $ | 7,905,263 | ||
| 2014 | 7,905,263 | |||
| 2015 | 7,905,263 | |||
| 2016 | 8,695,791 | |||
| $ | 32,411,580 | |||
C. Research and Development, Patents and Licenses, Etc.
Research and Development Efforts
As a high-technology company, our business and long-term development rely highly on our research and development capabilities. Our research and development process is based on Capability Maturity Model Integration Level 2&3 and can be classified into the following seven phases:
· Study phase
· Requirement phase
· Designing phase
· Implementation phase
· Testing phase
· Inspection phase
· Maintaining phase
We use standard project development life cycle models, including the waterfall model, increment model, iterative model and prototype. As a technology leader we continually develop and patent new automation technologies. We also continually review and evaluate technological changes affecting the automation and integrated system industries and invest substantially in application-based research and development. We currently employ over 750797 staff in the research and development department or engaged in research and development work.
Our core technologies achieved from our research and development efforts include:
· Large scale software platform architecture design;
· Proprietary network design and development technologies;
· Safety computer platform design and manufacturing;
· Efficient I/O (Input /Output) signal processing design technology; and
· Embedded system design and manufacturing.
We are committed to incorporating the latest advances in electronics and information system technology into its products and, whenever possible, developing state-of-the-art proprietary products based on its extensive internal expertise and research efforts. We currently spend approximately 7-8%7-9% of our annual revenues on research and development. Because part of our research and development efforts are paid for by government subsidies that aim to encourage research and development efforts of certain enterprises, the amount of our research and development spending shown on our financial statements (the total amount of spending less the amount of these subsidies) is only a portion of our total spending on research and development. Our recent major research and development focuses include:
· Transportation Automation;
· Manufacturing Automation; and
· Process Automation.
Our research and development efforts have led to the invention of several proprietary systems in the fields of DCS, PLC and transportation automation systems. In July 2012, we completed the development of and released our 5th generation DCS (Distributed Control System), which represents higher reliability, stability, better safety protection and user-friendliness with advanced system architecture, hardware, software designs and industry expert solutions. In the same month we completed the development and certified our SIS (Safety Instrumented System) –HiaGuard with SIL3 (Safety Integrity Level 3) in compliance with international standards. HiaGuard is the first domestically developed SIS technology and breaks the monopoly held by foreign systems in China in this product. Hollysys’ HiaGuard can be applied for ESD (Emergency Shutdown System), PSD (Process Shutdown System), and FGS (Fire and Gas Systems) used in various industries. We also invented several series of PLC (Programmable Logic Controller) products, and the most successful applications include the mining safety protection systems and Traditional Chinese Medicine manufacturing and packaging machine and dispensing machine. Our core technologies provide a platform that is designed to enable the rapid and efficient development of our technologies for specific applications that are quickly, efficiently and affordably tailored to particular industries and to the needs of our customers. Our software development tools enable us to custom program our systems rapidly, allowing us to apply digital technologies that take advantage of the tremendous advances in electronics and information technology to improve quality and reliability while reducing cost. The market for our products includes, not only the large number of factories that are continually under construction in China’s rapidly expanding industrial base, but also extends to the replacement and upgrading of outdated legacy systems to bring a higher degree of control and efficiency to the automation of processes, delivering increasing benefits to customers as they meet increased competition. In the future we expect that the market for our products will extend tofurther into South Asia and the Middle East.
We already have our proprietary high-speed rail signaling system including ATP (Automatic Train Protection), TCC (Train Control Center), LEU (Line-Side Electronic Unit), BTM (Balise Transmission Module), TSRS (Temporary Speed Restriction Server), HVC (Hollysys Vital Computer) and Interlocking system been certified according to international standards and have passed the Safety Integrity Level 4 (SIL4) certification. For the subway signaling system, the proprietary ATS (Automatic Train Supervision) and CBI (Computer Based Interlocking) have passed SIL2 and SIL4 certification respectively by the end of 2011. And in March 2013 we finished the development and certified ZC (Zone Controller), LEU (Line-side Electronic Unit) and Balise according to SIL4 (Safety Integrity Level 4) requirements in compliance of international standards, the certification of ATP (Automatic Train Protection) for subway signaling system was finished in the end of calendar year 2013. For both of the signaling systems, Hollysys is one of the earliest domestic companies in developing and certifying the signaling systems according to the international standards. Hollysys will be one of the few companies in the world which command the most leading and safety critical technologies of rail signaling system and we will compete with multinational companies such as Siemens, Alston and Bombardier in domestic and world arena. We believe our research and development efficiency, latest technology, strong customization and better value for money proposition will give us an unparalleled advantage in the high-speed rail and subway signaling markets.
For the fiscal years 2012, 2011,2014, 2013, and 2010,2012, aggregate annual research and development expenses were approximately $25.6$36.5 million, $20.1$32.5 million, and $13.1$25.6 million, respectively.
Intellectual Property Rights
We rely on a combination of copyright, patent, trademark and other intellectual property laws, nondisclosure agreements and other protective measures to protect our proprietary rights. We also utilize unpatented proprietary know-how and trade secrets and employ various methods to protect our trade secrets and know-how. As of June 30, 2012,2014, we held 95157 software copyrights, 8051 authorized patents, 45179 patent applications and 214 registered trademarks. Our earliest software copyrights will expire in 2048. Our invention patents have terms of 20 years (with the(the first expiration will be in 2020 and the next issued patent expiringsecond will be in fiscal year 2013 and 2025),2025 and our utility patents and design patents have terms of 10 years (with both of the first(we are expecting one utility patents expire in 2016 and the next issued utilitytwo design patent expiringexpires in fiscal year 2015 and the first and the next issued design patent due to expire in fiscal year 2016 and 2017 respectively.)years 2016)
Although we employ a variety of intellectual property in the development and manufacturing of products, we believe that only a few of our intellectual property rights are critical to our current operations. However, when taken as a whole, we believe that our intellectual property rights are significant and that the loss of all or a substantial portion of such rights could have a material adverse effect on our results of operations. Also, from time to time, we may desire or be required to renew or to obtain licenses from others in order to further develop and manufacture commercially viable products effectively.
We market our DCS products mainly under the brand name of “HOLLiAS”. Our brand name is well-established and is recognized as associated with high quality and reliable products by industry participants and customers. We have obtained trademark protection for our brand name “HOLLiAS” in the PRC as well as in other countries in the world. In addition, we have also registered or applied for a series of trademarks including brand names for us and our products. The trademarks are issued for 10-year periods (and may be renewed prior to expiration).
D. Trend Information
| D. | Trend Information |
Other than as disclosed in the foregoing disclosures and elsewhere in this annual report, we are not aware of any trends, uncertainties, demands, commitments or events for the fiscal year 20122014 that are reasonably likely to have a material adverse effect on our net revenues, income, profitability, liquidity or capital resources, or that caused the disclosed financial information to be not necessarily indicative of future operating results or financial conditions.
E. Off-Balance Sheet Arrangements
| E. | Off-Balance Sheet Arrangements |
We do not believe that there are any off-balance sheet arrangements that have or are reasonably likely to have a material effect on our financial condition, changes in financial condition, revenues or expenses, results of operations, liquidity, capital expenditures or capital resources.
F. Tabular Disclosure of Contractual Obligations
| F. | Tabular Disclosure of Contractual Obligations |
The following table sets forth our contractual obligations, including long-term and short-term loans and operating leases and capital and operational commitments as of June 30, 2012.2014.
| Total | Less than 1 year | 1-3 years | 3-5 years | More than 5 years | ||||||||||||||||
| Long-Term Bank Loans | ||||||||||||||||||||
| - Principals | 32,556,042 | 7,914,668 | 15,831,392 | 8,719,735 | 90,247 | |||||||||||||||
| -Interests | 7,585,591 | 2,790,884 | 3,491,209 | 1,284,193 | 19,305 | |||||||||||||||
| Operating Lease Obligations(1) | 2,411,019 | 920,563 | 1,168,251 | 322,205 | - | |||||||||||||||
| Purchase Obligations(2) | 140,230,168 | 140,230,168 | - | - | - | |||||||||||||||
| Capital Obligations(3) | 13,039,435 | 13,039,435 | - | - | - | |||||||||||||||
| Performance Guarantees(4) | 40,166,821 | 18,912,311 | 17,198,894 | 4,055,616 | - | |||||||||||||||
| Total | 235,989,076 | 183,808,029 | 37,689,746 | 14,381,749 | 109,552 | |||||||||||||||
| Total | Less than 1 year | 1-3 years | 3-5 years | More than 5 years | ||||||||||||||||
| Long-Term Bank Loans | ||||||||||||||||||||
| - Principal | 23,495,525 | 8,517,269 | 14,524,671 | 394,606 | 58,979 | |||||||||||||||
| -Interest | 3,132,957 | 1,701,687 | 1,401,235 | 22,427 | 7,608 | |||||||||||||||
| Operating Lease Obligations(1) | 1,759,849 | 1,228,098 | 456,828 | 69,160 | 5,763 | |||||||||||||||
| Purchase Obligations(2) | 233,451,992 | 233,451,992 | - | - | - | |||||||||||||||
| Capital Obligations(3) | 3,552,588 | 3,552,588 | - | - | - | |||||||||||||||
| Standby letters of credit(4) | 82,042 | 82,042 | - | - | - | |||||||||||||||
| Performance Guarantees(5) | 47,185,650 | 25,391,017 | 20,858,512 | 936,121 | - | |||||||||||||||
| Total | 312,660,603 | 273,924,693 | 37,241,246 | 1,422,314 | 72,350 | |||||||||||||||
| (1) | Operating lease obligations |
It represents the future minimum payments under non-cancelable operating leases.
| (2) | Purchase obligations |
As of June 30, 2012,2014, the Company had approximately $140.2$233.5 million in purchase obligations for the coming fiscal year, for purchases of equipment,inventories, mainly for fulfillment of in-process or newly entered contracts resulting from the expansion of our operations.
| (3) | Capital obligations |
As of June 30, 2012,2014, the Company had approximately $13.0$3.6 million in capital obligations for the coming fiscal year, mainly for the phase II of the construction of the Company’s headquarters in Beijing, PRC.
| (4) | Standby letters of credit |
We have issued letters of credit to our suppliers, to insure our payments upon delivery of the goods by the suppliers. When a letter of credit is issued, a proportion of the total amount covered by the letter of credit may be required to be deposited in the bank, and is not available until the payment has been settled or the letter of credit has expired. As of June 30, 2014, we had approximately $82.0 thousand in standby letters of credit obligations.
| (5) | Performance guarantees |
We have provided performance bondsguarantees to our customers, to insure our performance of the contractual obligations. When a performance bondguarantee is issued, a proportion of the total guarantee amount may be required to be deposited in the bank, and is not available until the bondguarantee is expired. As of June 30, 2012,2014, we had approximately $5.5$47.2 million performance guarantees obligation, with $10.0 million of restricted cash deposited in banks for performance guarantees.
Other than the contractual obligations and commercial commitments set forth above, we did not have any other long-term debt obligations, operating lease obligations, capital commitments, purchase obligations or other long-term liabilities as of June 30, 2012.2014.
G. Safe Harbor
| G. | Safe Harbor |
All information included in Item 5.E of this Item is deemed to be a “forward looking statement” as that term is defined in the statutory safe harbors, except for historical facts. The safe harbor provided in Section 27A of the Securities Act and Section 21E of the Exchange Act shall apply to all forward-looking information provided in Item 5.E and F of this Item.
| ITEM 6. | DIRECTORS, SENIOR MANAGEMENT AND EMPLOYEES |
A. Directors and Senior Management
| A. | Directors and Senior Management |
The following table sets forth certain information regarding our directors and senior management as of the date of this annual report.June 30, 2014.
| Name | Age | Position | ||
| Chairman of Board of Directors | ||||
| Baiqing Shao | 46 | Chief Executive Officer and | ||
| Herriet Qu | Chief Financial Officer | |||
| Colin Sung | Director | |||
| Jerry Zhang | Director | |||
| Jianyun Chai | Director | |||
| Qingtai Chen | Director |
Dr. Changli Wang,Jianfeng He, has been our directorserved as the Chairman since November 30, 2013. Prior to that, Dr. He served as the Chief Operating Officer from 2012 to 2013. He also served as Chairman of Hollysys Group since December 2013. From 2010 to 2013, he served as General Manager of Hollysys Group, Chairman of Hangzhou Hollysys and Chairman of Beijing Hollysys. From 2008 to 2010, Dr. He was Vice President and President of Beijing Hollysys. From 2004 to 2008, he served as Deputy General Manager and General Manager of Hangzhou Hollysys. Dr. He holds a PhD Degree from South China University of Technology in automation and control theory and application.
Mr. Baiqing Shao, one of the main founders of the company, has served as Chief Executive Officer since September 2007November 30, 2013. He was the former Senior Vice President, Business Development of the Company from February 2012 to November 2013. Since 2010, Mr. Shao also served as Vice General Manager of Hollysys Group and has been our Chairman since May 2010. Since 1999, Dr. Wang has also been the Chief Executive Officer and Vice Chairman of our subsidiary, Beijing Hollysys. PriorHollysys A&D. From 2002 to founding2010, he served as the General Manager of Beijing Hollysys in 1993, Dr. Wang workedInformation Technology Co., Ltd. (currently known as “Shenhua Hollysys Information Technology Co., Ltd.”), one of our indirectly equity investees. Mr. Shao has served the Company for more than eighteen years as one of the No. 6founding group of engineers. Mr. Shao holds a Master Degree of Computer Science from the 6th Research Institute of Electronic Industry Department, the predecessor of Beijing Hollysys. Dr. Wang also has been the Vice Chairman of the Chinese Automation Association since 2003. Dr. Wang received his Bachelor’sChina Electronics Corporation and an MBA degree in Automation from Tianjin University in 1984 and his PhD in Automation from Lancaster University in 1988.Peking University.
Ms. Herriet Qu,has been ourserved as the Company’s Chief Financial Officer since February 2012. Prior to being appointed to the position of Chief Financial Officer,that, Ms. Qu workedserved as the Financial Controller of the Company from October 2007 to January 2012. Prior to Ms. Qu joining the Company, she worked as Chief Financial Officer of Beijing Chum Investment Corporation Ltd. from January 2002 to September 2007. Ms. Qu holds an MBA degree from Oklahoma City University and a Bachelor’s degree from Tianjin University of Finance & Economics.
Mr. Jianfeng HeColin Sung,, has been our Chief Operating Officer since February 2012. Mr. He has been with Hollysys and its subsidiaries for more than fourteen years, most recentlyserved as the Chief Executive Officer of Beijing Hollysys Group Corporation, a subsidiary of Hollysys. Mr. He has a PhD from South China University of Technology.
Mr. Baiqing Shao, has been our Senior Vice President, Business Development since February2012. Prior to being appointed as Senior VP, Business Development, he was in charge of merger and acquisitions and new business exploration. Mr. Shao was Vice President of Beijing Hollysys Group Corporation prior to his current position. Mr. Shao has been with Company for more than eighteen years as onemember of the founding groupBoard of engineers. He holds a MastersDirectors and Chairman of Computer Science from the 6th Research Institute of China Electronics Corporation and an MBA from Peking University.
Mr. Colin Sung, has been our director and the Chair of our Audit Committee of Board of Directors since February 2008. Mr. Sung is the Chief Financial Officer for eHi Auto Services Limited since April 2013. Mr. Sung also has beenserved as adviser of NeWorld Education Group, Inc. since August 2012 and wasserved as Chief Financial Officer of NeWorld Education Group since August 2011. Prior to joining NeWorld, he was the CFO of Lighting the Box from March 2011. Mr. Sung served as the deputy Chief Executive Officer and the Chief Financial Officer of Linktone Ltd., a NASDAQ-listed wireless interactive entertainment service provider in China, from 2009 to 2011. From 2008 to 2009, he served as the Chief Financial Officer and President of China Cablecom Holdings, Ltd. From 2005 to 2008, he was the Chief Financial Officer of Linktone Ltd., where he also served as the acting Chief Executive Officer in 2006 and as its director of board from 2007 to 2008. From 2004 to 2005, Mr. Sung was the Corporate Controller of UTI, United States, Inc., a subsidiary of International Freight Forwarder (NASDAQ: UTIW), and from 2001 to 2004, was a Vice President of finance and Corporate Controller of USF Worldwide, Inc., a subsidiary of US Freightways. From 1997 to 2001, Mr. Sung was Vice President and Corporate Controller for US Operation of Panalpina Welttransport Holding, (PWTN.SW). Mr. Sung received his bachelor’s degree in accounting from William Paterson University in 1992 and his MBA degree from American InterContinental University in 2004. Mr. Sung is a Certified Public Accountant and Certified Global Management Accountant.
Ms. Jerry Zhang,has been our directorserved as a member of the Board of Directors since September 2007. Ms. Jerry Zhang is currently the HeadExecutive Vice Chairman & Chief Executive Officer of Financial Institutions, Standard Chartered Bank (China) Limited. She leads a groupHer key focuses are strategic planning, business development and corporate governance of professional bankers, who are responsible for providing banking solutions to banks and non-bank financial institutions (including government, NGOs, etc.) present and doing businessthe Bank’s operations in China. ShePrior to this role, Ms. Zhang has held a variety of senior roles at Standard Chartered China, and she enjoys a strong track record in setting up good relationship with clients and creating value both for the bank and the clients. In her recent position as Head of Financial Institutions, Ms. Zhang has led to achieve frog leap developments of the Bank’s FI business, which has become the biggest FI business amongst all foreign banks in China in almost all aspects. Ms. Zhang joined Standard Chartered in 1994, and has accumulated rich implementation and management experiences in wholesale banking business. She has successfully established non-banking financial institutions business in China for the Bank. In 2009, she has left the Bank in 1994. For years she holdfor a short duration, and taken the role of the Head of Investors & Intermediaries, responsible for relationship management of broker dealers, insurance companies, fund managers, development organizations, finance/trust companies and professional firms throughout China. Prior to re-joining the Bank in April 2009, she was aas Chief Representative of Fidelity International Asset Management Co. Beijing Representative Office. Ms. Zhang received her Bachelor’sMBA degree in electronic and mechanical engineering and obtained an MBA from Lancaster University in the United Kingdom in 2000.
University.
Dr. Jianyun Chai, has been our directorserved as a member of the Board of Directors since June 2, 2008. Dr. Chai is currently a professor and the head of the Institute of Power Electronic and Electrical Machine System at Tsinghua University in China. Before he joined Tsinghua University as an Associate Professor in 1999, Dr. Chai spent eight years working in the motor and information industries in Japan. Dr. Chai is also a member of various societies and organizations, including the China Renewable Energy Society, the Chinese Society for Electrical Engineering, and the Chinese Wind Energy Association. Dr. Chai received a Bachelor’s degree and a PhD in Electrical Engineering from Tsinghua University in 1984 and 1989, respectively.1989.
Mr. Qingtai Chen has been our director since, served as a member of Board of Director between June 2, 2008.2008 and August 2014. Mr. Chen has worked for the Dong Feng Motor Group for over 22 years and served as its General Manager prior to joining the Company. While employed by the Dong Feng Motor Group, Mr. Chen also served in various positions, including as a member of the First Session of the Monetary Policy Committee of the People’s Bank of China, as a deputy director of the State Council Economic and Trade Office, as a deputy director of the State Economic and Trade Commission, and as a deputy director of the Development Research Center of the State Council. Mr. Chen also served from 2000 to 2006 as an independent director of Sinopec Corp. Mr.from 2000 to 2006.Mr. Chen received his BachelorsBachelor of Science degree in power and dynamics engineering from Tsinghua University and has been recognized as a National Excellent Entrepreneur and National Economic Reform Talent in China. Mr. Chen currently serves as a standing member of National Committee of the Chinese People’s Political Consultative Conference and as the Dean of the School of Public Policy and Management at Tsinghua University. He also serves as an independent director for the Bank of Communications, which is listed on both Shanghai Stock Exchange and Hong Kong Stock Exchange, and as an independent director of Mindray Medical International Limited, which is listed on New York Stock Exchange.
10b5-1 Trading PlansMr. Qingtai Chen resigned as a director the Company for personal reasons on August 13, 2014.
Our Insider Trading Policy allows directors, officers and other employees covered under the policy to establish, under limited circumstances contemplated by Rule 10b5-1 under the Securities Exchange Act of 1934, written programs that permit automatic trading of our stock or trading of our stock by an independent person (such as an investment bank) who is not aware of material inside information at the time of the trade. From time to time, certain of our directors, executive officers and employees have adopted Rule 10b5-1 trading plans. Currently, three of our officers and directors have entered into purchase plans under Rule 10b5-1.
B. Compensation
| B. | Compensation |
Executive Compensation
The aggregate cash compensation paid to our executive officers as a group was $810,806$956,903 for the fiscal year ended June 30, 2012. In2014. We granted no stock options to our senior executives in the fiscal year ended June 30, 2012, we granted stock options for a total of 1,476,000 ordinary shares under the long-term incentive plan of the company to 9 individuals, including options for 801,000 ordinary shares to the senior executives listed in the table above under Part A of this section.2014. The current outstanding awards have vesting periods of up to four years depending on the person’s position and all of the grants have specific performance milestones. Additionally, the outstanding awards have a provision that if in certain instances the milestones are exceeded by specified targets, then additional ordinary shares will vest for the related period. The exercise periods for the options are five years from the date of grant, February 20, 2012. As of June 30, 2014, 112,200 options granted to the above-mentioned executive officers were vested, and none of them was exercised.
Director Compensation
We pay each of our independent directors who are not employees a monthly fee as compensation for the services to be provided by them as independent directors. We payDuring fiscal 2014, we paid $4,000 a month to Colin Sung, $3,000 to Jerry Zhang, $2,000 to Jianyun Chai, and $2,000 to each of other independent directors.Qingtai Chen. We also reimburse our independent directors for out-of-pocket expenses incurred in attending meetings.
As additional consideration, in 2008 we granted to each of the independent directors an option to purchase a certain amount of shares of the Company’s ordinary shares, which vest in equal installments on a quarterly basis over a three-year period beginning on the grant date. Specifically, we granted a stock option to Colin Sung for the purchase of 45,000 shares of our ordinary shares, Jerry Zhang for the purchase of 36,000 shares of our ordinary shares and each of Dr. Jianyun Chai and Mr. Qingtai Chen for the purchase of 30,000 shares of our ordinary shares. Additionally, we grantshares in 2008, all the options granted as director compensation have been exercised as of June 30, 2014.
In 2011, as the compensation for their continuous service on the Board, Hollysys granted to each of the independent directordirectors restricted shares ( “2011 restricted shares”), which will vest in equal installments on a quarterly basis over a three-year period beginning on the grant date. Specifically, we granteddate, which included 22,500 restricted shares granted to Colin Sung, and 15,000 restricted shares to each of Jerry Zhang, Jianyun Chai and Qingtai Chen. As of June 30, 2014, all the 2011 restricted shares were vested and 10,000 restricted shares granted to Colin Sung were issued.
In 2014, as the compensation for their continuous service on the Board, Hollysys granted to each of the independent directors restricted shares (“2014 restricted shares”), which will vest in equal installments on a quarterly basis over a three-year period beginning on the service inception date, which included 22,500 restricted shares granted to Colin Sung, and 15,000 restricted shares to each of Jerry Zhang and Jianyun Chai, respectively. As of June 30, 2014, 3,125 shares of the 2014 restricted shares were vested and none were issued.
For the fiscal year ended June 30, 2012,2014, the aggregate cash compensation paid to our directors as a group was approximately $132,000.
2006 Stock Plan
On September 7, 2007, our stockholders approved the 2006 Stock Plan, or the Plan. The Plan was assumed by us as of the closing of the merger of Chardan with and into us. The Plan provided for 3,000,000 ordinary shares for issuance in accordance with the Plan’s terms .Asterms. As of the date of this report, there are 2,460,000708,000 shares available under the Plan, of which 1,696,5002,292,000 have been allocated to outstanding awards that have not vested or been exercised. A description of the Plan is set forth in the Proxy Statement/Prospectus of our Registration Statement on Form S-4 (No. 333-132826), under the heading “2006 Equity Plan”, and is incorporated herein by reference. The tables below set forth the outstanding options and the restricted shares granted to our current and former directors and executive officers pursuant to the Plan:
Options I:
| Name | Number of Ordinary Shares Issuable upon Exercise of Options | Number of Outstanding Ordinary Shares Issuable upon Exercise of Options | Exercise Price per Ordinary Share | Date of Grant | Date of Expiration | |||||||||||||||
| Yau Kiam Fee | 30,000 | 30,000 | $ | 7.9 | 2008-2-1 | 2012-12-31 | ||||||||||||||
| Jerry Zhang | 36,000 | 3,000 | $ | 7.9 | 2008-2-1 | 2012-12-31 | ||||||||||||||
| Colin Sung | 45,000 | 45,000 | $ | 7.9 | 2008-2-1 | 2013-1-31 | ||||||||||||||
| Qingtai Chen | 30,000 | 30,000 | $ | 5.85 | 2008-6-2 | 2013-6-1 | ||||||||||||||
| Jianyun Chai | 30,000 | 30,000 | $ | 5.85 | 2008-6-2 | 2013-6-1 | ||||||||||||||
The above options vest quarterly over a period of 3 years from their respective grant date.
Options II:2012 Performance options:
The following table sets forth options issued on February 20, 2012 to the named directors and officers in the table of Directors and Senior Management in Item 6, Section A above.
| Name | Number of Ordinary Shares Issuable upon Exercise of Options | Number of Ordinary Shares Vested | Exercise Price | Date of Grant | Date of Expiration | |||||||||||||||
| Changli Wang1 | 240,000 | - | $ | 9.29 | 2012-2-20 | 2017-2-19 | ||||||||||||||
| Herriet Qu2 | 198,000 | - | $ | 9.29 | 2012-2-20 | 2017-2-19 | ||||||||||||||
| Jianfeng He3 | 198,000 | - | $ | 9.29 | 2012-2-20 | 2017-2-19 | ||||||||||||||
| Baiqing Shao4 | 165,000 | - | $ | 9.29 | 2012-2-20 | 2017-2-19 | ||||||||||||||
| Name | Number of Ordinary Shares Issuable upon Exercise of Options | Number of Ordinary Shares Vested | Exercise Price | Date of Grant | Date of Expiration | |||||||||||
| Jianfeng He1 | 198,000 | 39,600 | $ | 9.29 | 2012-2-20 | 2017-2-19 | ||||||||||
| Herriet Qu2 | 198,000 | 39,600 | $ | 9.29 | 2012-2-20 | 2017-2-19 | ||||||||||
| Baiqing Shao3 | 165,000 | 33,000 | $ | 9.29 | 2012-2-20 | 2017-2-19 | ||||||||||
1 160,000132,000 options vest on the 24, 36 and 48 month anniversaries of the date of grant if the CAGR of the Non-GAAP diluted EPS form fiscal year 2011 to fiscal year 2014 exceed stated thresholds on those dates, an additional 40,00033,000 vest on the basis48 month anniversaries of the June 30, 2011 to June 30, 2014 Non-GAAP diluted EPS exceeds certain thresholdsdate of grant if an additional threshold is exceeded, and an additional 40,00033,000 vest on the 48 month anniversaries of the date of grant if the foregoing thresholds arethreshold is exceeded.
2 132,000 options vest on the 24, 36 and 48 month anniversaries of the date of grant if the CAGR of the Non-GAAP diluted EPS form fiscal year 2011 to fiscal year 2014 exceed stated thresholds on those dates, an additional 33,000 vest on the basis48 month anniversaries of the June 30, 2011 to June 30, 2014 Non-GAAP diluted EPS exceeds certain thresholdsdate of grant if an additional threshold is exceeded, and an additional 33,000 vest if the foregoing thresholds are exceeded.
3 132,000 options vest on the 24, 36 and 48 month anniversaries of the date of grant if the CAGR of the Non-GAAP diluted EPS exceed stated thresholds on those dates, an additional 33,000 vest on the basis of the June 30, 2011 to June 30, 2014 Non-GAAP diluted EPS exceeds certain thresholds and an additional 33,000 vest if the foregoing thresholds arethreshold is exceeded.
43 110,000 options vest on the 24, 36 and 48 month anniversaries of the date of grant if the CAGR of the Non-GAAP diluted EPS form fiscal year 2011 to fiscal year 2014 exceed stated thresholds on those dates, an additional 27,500 vest on the basis48 month anniversaries of the June 30, 2011 to June 30, 2014 Non-GAAP diluted EPS exceeds certain thresholdsdate of grant if an additional threshold is exceeded, and an additional 27,500 vest on the 48 month anniversaries of the date of grant if the foregoing thresholds arethreshold is exceeded.
These options were part of an aggregate of 1,476,000 ordinary shares underlying options issued to senior management issued on February 20, 2012, all with similar vesting provisions.
The above options vest annually over a period of four years from their grant date, subject to different performance conditions and are exercisable once vested for up to five years from the date of grant. As of June 30, 2014, 112,200 of the performance options have vested.
2011 Restricted shares:
| Name | Number of Restricted Shares Granted | Date of Grant | Number of Restricted Shares Vested | Number of Restricted Shares Issued | ||||||||||
| Jerry Zhang | 15,000 | 2011-1-1 | 15,000 | - | ||||||||||
| Colin Sung | 22,500 | 2011-2-1 | 22,500 | 10,000 | ||||||||||
| Jianyun Chai | 15,000 | 2011-6-2 | 15,000 | - | ||||||||||
| Qingtai Chen | 15,000 | 2011-6-2 | 15,000 | - | ||||||||||
The restricted shares set forth in the table above vest quarterly over a period of 3 years from their respective grant date. As of June 30, 2014, all the 2011 restricted shares were vested, and 10,000 of them have been issued to Colin Sung.
2014 Restricted shares:
| Name | Number of Restricted Shares Granted | Date of Grant | Number of Restricted Shares Vested | Number of Restricted Shares Issued | ||||||||||
| Jerry Zhang | 15,000 | 2014-6-23 | 1,250 | - | ||||||||||
| Colin Sung | 22,500 | 2014-6-23 | 1,875 | - | ||||||||||
| Jianyun Chai | 15,000 | 2014-6-23 | - | - | ||||||||||
The restricted shares set forth in the table above vest quarterly over a period of 3 years from their respective service inception date. As of June 30, 2014, 3,125 restricted shares were vested, and none of them have been issued.
Employment Agreements
We entered into a three-year employment agreement with our Chief Executive Officer,Chairman, Dr. Changli WangJianfeng He on June 6, 2010.November 30, 2013. Dr. WangHe is entitled to insurance benefits, five weeks’ vacation, a car and reimbursement of business expenses and, if necessary, relocation expenses. The agreement is terminable by us for death, disability and cause. Dr. WangHe may terminate the employment agreement for good reason, which includes our breach; the executive’s not being a member of the board of directors, and change of control. The agreements contain provisions for the protection of confidential information and a three-year-after employment non-competition period within China.
We entered into a three-year employment agreement with our Chief Executive Officer, Mr. Baiqing Shao on November 30, 2013. Mr. Shao is entitled to insurance benefits, four weeks’ vacation, and reimbursement of business expenses and, if necessary, relocation expenses. The agreement is terminable by us for death, disability and cause. Mr. Shao may terminate the employment agreement for any good reason at any time. The agreements contain provisions for the protection of confidential information and a three-year-after employment non-competition period within China.
We entered into a three-year employment agreement with our Chief Financial Officer, Ms. Herriet Qu on February 1, 2012. Ms. Qu is entitled to insurance benefits, four weeks’ vacation, and reimbursement of business expenses and, if necessary, relocation expenses. The agreement is terminable by us for death, disability and cause. Ms. Qu may terminate the employment agreement for any good reason at any time. The agreements contain provisions for the protection of confidential information and a three-year-after employment non-competition period within China.
| C. | Board Practices |
We entered into a three-year employment agreement with our Chief Operating Officer, Mr. Jianfeng He on February 1, 2012. Mr. He is entitled to insurance benefits, four weeks’ vacation, a car and reimbursement of business expenses and, if necessary, relocation expenses. The agreement is terminable by us for death, disability and cause. Mr. He may terminate the employment agreement for any good reason at any time. The agreements contain provisions for the protection of confidential information and a three-year-after employment non-competition period within China.
We entered into a three-year employment agreement with our Senior VP, business development, Mr. Baiqing Shao on February 1, 2012. Mr. Shao is entitled to insurance benefits, four weeks’ vacation, and reimbursement of business expenses and, if necessary, relocation expenses. The agreement is terminable by us for death, disability and cause. Mr. Shao may terminate the employment agreement for any good reason at any time. The agreements contain provisions for the protection of confidential information and a three-year-after employment non-competition period within China.
C. Board Practices
Terms of Directors and Executive Officers
Our board consistsconsisted of six directors for fiscal year 2014. Due to Mr. Qingtai Chen’s resignation in August 2014, currently we have five directors. Our directors are not subject to a term of office limitation, and hold office until the next annual meeting of members or until such director’s earlier resignation, removal from office, death or incapacity. Any vacancy on our board resulting from death, resignation, removal or other cause, and any newly created directorship resulting from any increase in the authorized number of directors between meetings of members, may be filled either by the affirmative vote of a majority of all the directors then in office (even if less than a quorum) or by a resolution of members. In addition, the service agreement between us and the directors do not provide benefits upon termination of their services. In connection with the adoption of the 2010 Rights Plan, we amended our Memorandum and Articles of Association to provide that directors may only be removed by shareholders for cause.
Our executive officers are appointed by our board. The executive officers shall hold office until their successors are duly elected and qualified, but any officer elected or appointed by the directors may be removed at any time, with or without cause, by resolution of directors. Any vacancy occurring in any office may be filled by resolution of directors.
Independence of Directors
We have elected to follow the rules of NASDAQ to determine whether a director is independent. Our board will also consult with counsel to ensure that our board’s determinations are consistent with those rules and all relevant securities and other laws and regulations regarding the independence of directors. Rule 5605(a)(2) of Listing Rules of The Nasdaq Stock Market, Inc., or the Nasdaq Listing Rules, defines an “independent director” generally as a person, other than an officer of the Company, who does not have a relationship with the Company that would interfere with the director’s exercise of independent judgment. Consistent with these considerations, our board has affirmatively determined that, Messrs.Mr. Colin Sung, Jerry Zhang,Mr. Jianyun Chai and Ms. Jerry Zhang are our current independent directors. Mr. Qingtai Chen arewas also our independent directors.director before his resignation in August 2014.
Board Committees
Our board has established an audit committee, a compensation committee and a corporate governance and nominating committee. Each committee is comprised solely of independent directors within the meaning of Rule 5605(a)(2) of the Nasdaq Listing Rules, and meet the criteria for independence set forth in Rule 10A-3(b)(1) of the Exchange Act.
Audit Committee
Our audit committee consists of Messrs.Mr. Colin Sung, Qingtai Chen andMs. Jerry Zhang, who are also the members of the board,and Mr. Jianyun Chai, with Mr. Colin Sung serving as the Chair. Our board has determined that all of our audit committee members are independent directors within the meaning of applicable NASDAQ listing rules, and meet the criteria for independence set forth in Rule 10A-3(b)(1) of the Exchange Act.
Our board has determined that each of Messrs. Sung Chen and Chai and Ms. Zhang has an understanding of generally accepted accounting principles and financial statements, the ability to assess the general application of such principles in connection with our financial statements, including estimates, accruals and reserves, experience in analyzing or evaluating financial statements of similar breadth and complexity as our financial statements, an understanding of internal controls and procedures for financial reporting, and an understanding of audit committee functions.
Our board believes that Mr. Sung qualifies as an “audit committee financial expert” within the meaning of all applicable rules. Our board believes that Mr. Sung has financial expertise from his degrees in business, his activities as a chief executive officer and chief financial officer of various companies, and his consulting activities in the areas of accounting, corporate finance, capital formation and corporate financial analysis.
We adopted an audit committee charter under which the committee is responsible for reviewing the scope, planning and staffing of the audit and preparation of the financial statements. This includes consultation with management, the auditors and other consultants and professionals involved in the preparation of the financial statements and reports. The committee is responsible for performing oversight of the relationship with our independent auditors. The committee also has a general compliance oversight role in assuring that our directors, officers and management comply with our code of ethics, reviewing and approving of related party transactions, dealing with complaints regarding accounting, internal controls and auditing matters, and complying with accounting and legal requirements applicable to us.
Pursuant to the terms of its charter, the audit committee’s responsibilities include, among other things:
| · | selecting our independent auditors and pre-approving all auditing and non-auditing services permitted to be performed by our independent auditors; |
| · | reviewing with our independent auditors any audit problems or difficulties and management’s response; |
| · | reviewing and approving all proposed related-party transactions; |
| · | discussing the annual audited financial statements with management and our independent auditors; |
| · | reviewing major issues as to the adequacy of our internal controls and any special audit steps adopted in light of significant internal control deficiencies; |
| · | annually reviewing and reassessing the adequacy of our audit committee charter; |
| · | such other matters that are specifically delegated to our audit committee by our board of directors from time to time; |
| · | meeting separately and periodically with management and our internal and independent auditors; and |
| · | reporting regularly to the full board of directors. |
Compensation Committee
Our compensation committee consists of Messrs.Ms. Jerry Zhang and Mr. Jianyun Chai and Mr. Colin Sung, with Ms. Jerry Zhang serving as its Chair. Our board has determined that all of our compensation committee members are independent directors within the meaning of applicable NASDAQ listing rules, and meet the criteria for independence set forth in Rule 10A-3(b)(1) of the Exchange Act.
Our compensation committee assists the board in reviewing and approving the compensation structure of our executive officers, including all forms of compensation to be provided to our executive officers. Our chief executive officer may not be present at any committee meeting during which his compensation is deliberated. The Compensation Committee is responsible for, among other things:
| · | approving and overseeing the compensation package for our chief executive officer and the other senior executive officers; |
| · | reviewing and approving corporate goals and objectives relevant to the compensation of our chief executive officer, evaluating the performance of our chief executive officer in light of those goals and objectives, and setting the compensation level of our chief executive officer based on this evaluation; |
| · | reviewing and making recommendations in respect of director compensation; |
| · | engaging and overseeing compensation consultants; |
| · | reviewing periodically and making recommendations to the Board regarding any long-term incentive compensation or equity plans, programs or similar arrangements, annual bonuses, employee pension and welfare benefit plans and the administration of those plans; and |
| · | reviewing and making recommendations to the Board regarding succession plans for the chief executive officer and other senior officers. |
Corporate Governance and Nominating Committee
Our corporate governance and nominating committee consists of Messrs.Ms. Jerry Zhang and Mr. Jianyun Chai and Mr. Colin Sun,Sung, each of whom is “independent” as that term is defined under the NASDAQ listing standards. The corporate governance and nominating committee assists the board of directors in identifying individuals qualified to become our directors and in determining the composition of the board and its committees. The corporate governance and nominating committee is responsible for, among other things:
| · | identifying and recommending to the Board nominees for election or re-election to the board, or for appointment to fill any vacancy; |
| · | reviewing annually with the board the current composition of the board in light of the characteristics of independence, age, skills, experience and availability of service to us; |
| · | identifying and recommending to the board the directors to serve as members of the board’s committees; and |
| · | monitoring compliance with our Corporate Governance |
D. Employees
| D. | Employees |
We had 3,527, 3,1063,575, 3,813 and 2,1853,527 employees as of June 30, 2012, 2011,2014, 2013, and 2010,2012 respectively. As of June 30, 2012,2014, there were 3,2913,086 employees located in China and 236489 employees outside China. The following table sets forth our employees as of June 30, 20122014 based on their functional areaareas within the Company:
| Number of Employees | Number of Employees | |||||||||||||||||||||||
| Category | In China | Overseas | Total | In China | Overseas | Total | ||||||||||||||||||
| Sales & Marketing | 802 | 14 | 816 | 638 | 8 | 646 | ||||||||||||||||||
| Research and development | 751 | 5 | 756 | 784 | 13 | 797 | ||||||||||||||||||
| Engineering | 979 | 196 | 1,175 | 867 | 353 | 1,220 | ||||||||||||||||||
| Production | 389 | - | 389 | 462 | - | 462 | ||||||||||||||||||
| Management | 370 | 21 | 391 | 335 | 115 | 450 | ||||||||||||||||||
| Total | 3,291 | 236 | 3,527 | 3,086 | 489 | 3,575 | ||||||||||||||||||
We believe that our relationship with our employees is good. The remuneration payable to employees includes basic salaries and bonuses. We have not experienced any significant problems or disruption to our operations due to labor disputes, nor have we experienced any difficulties in recruitment and retention of experienced staff. As required by applicable Chinese laws of China, Singapore, Malaysia, Hong Kong, Dubai, Saudi Arabia and India we have entered into employment contracts with all of our officers, managers and employees.
Our employees in China participate in a state pension scheme organized by Chinese municipal and provincial governments. We also contribute to social insurance for our employees each month, which includes pension, medical insurance, unemployment insurance, occupational injuries insurance and housing providence fund in accordance with PRC regulations.
E. Share OwnershipOur employees in Singapore, who are Singapore citizens and Singapore permanent residents, participate in monthly statutory contribution requirements into the Central Provident Fund organised by the Central Provident Fund Board, a statutory board under the Ministry of Manpower. It is a comprehensive social security system that enables the qualified to set aside funds for retirement, healthcare, home ownership, family protection and asset enhancement.
Our employees in Malaysia participate in contributing into an Employee’s Provident Fund, a monthly mandatory saving and retirement plan organized by the Employee’s Provident Fund Board, a Malaysian government agency under the Ministry of Finance. We also contribute to social insurance for our employees each month, which include medical and cash benefits, provision of artificial aids and rehabilitation to employees in order to provide financial guarantees and protection to the family in accordance to Malaysia regulations.
| E. | Share Ownership |
The following table sets forth information, as of September 30, 2012,August 29, 2014, with respect to the beneficial ownership of our ordinary shares (i) by each of our officers and directors; (ii) by each person who is known by us to beneficially own more than 5% of our ordinary shares; The table does not include any preferred shares or ordinary shares that may be issued under the Rights Plan of the company. The address of each of the persons set forth below is in care of Hollysys Automation Technologies Ltd., No. 2 Disheng Middle Road, Beijing Economic-Technological Development Area, Beijing, P. R. China 100176.
| Name & Address of Beneficial Owner | Office, if Any | Title of Class | Amount & Nature of Beneficial Ownership (1) | Percent of Class (2) | Office, if Any | Title of Class | Amount & Nature of Beneficial Ownership (1) | Percent of Class (2) | ||||||||||||||
| Officers and Directors | Officers and Directors | |||||||||||||||||||||
| Changli Wang | CEO and Chairman | Ordinary Shares | 9,422,708 | (3) | 16.83 | % | ||||||||||||||||
| Herriet Qu | Chief Financial Officer | Ordinary Shares | - | (4) | - | |||||||||||||||||
| Jianfeng He | Chief Operation Officer | Ordinary Shares | - | (5) | - | Chairman | Ordinary Shares | 39,600 | (3) | - | ||||||||||||
| Baiqing Shao | Senior VP, Vice President of Business Development | Ordinary Shares | - | (6) | - | Chief Executive Officer | Ordinary Shares | 33,000 | (4) | - | ||||||||||||
| Herriet Qu | Chief Financial Officer | Ordinary Shares | 39,600 | (5) | - | |||||||||||||||||
| Colin Sung | Director | Ordinary Shares | 58,125 | (7) | * | Director | Ordinary Shares | 26,250 | (6) | - | ||||||||||||
| Jerry Zhang | Director | Ordinary Shares | 11,750 | (8) | * | Director | Ordinary Shares | 18,750 | (7) | - | ||||||||||||
| Jianyun Chai | Director | Ordinary Shares | 36,250 | (9) | * | Director | Ordinary Shares | 16,250 | (8) | - | ||||||||||||
| Qingtai Chen | Director | Ordinary Shares | 36,250 | (10) | * | |||||||||||||||||
| 5% Securities Holder | 5% Securities Holder | |||||||||||||||||||||
| Changli Wang | CEO and Chairman | Ordinary Shares | 9,422,708 | (3) | 16.83 | % | Founder | Ordinary Shares | 9,051,982 | (9) | 15.67 | % | ||||||||||
| An Luo | Ordinary Shares | 6,057,303 | (11) | 10.82 | % | |||||||||||||||||
| Wenfu Wang | Ordinary Shares | 4,113,948 | (12) | 7.35 | % | |||||||||||||||||
| Unionway Resources Limited | Investor | Ordinary Shares | 4,113,948 | (10) | 7.12 | % | ||||||||||||||||
| Prudential PLC | Investor | Ordinary Shares | 4,079,600 | 7.06 | % | |||||||||||||||||
* Less than 1%.
| (1) | Beneficial Ownership is determined in accordance with the rules of the Securities and Exchange Commission and generally includes voting or investment power with respect to securities. Except as otherwise indicated, each of the beneficial owners listed above has direct ownership of and sole voting power and investment power with respect to our ordinary shares. |
| (2) | A total of |
| (3) | The securities reported as held by Mr. Jianfeng He include options to purchase 39,600 ordinary shares that are vested, and does not include options to purchase 158,400 ordinary shares that are not yet vested and will not be vested within 60 days. |
| (4) | The securities reported as held by Mr. Baiqing Shao include options to purchase 33,000 ordinary shares that are vested, and does not include options to purchase 132,000 ordinary shares that are not yet vested and will not be vested within 60 days. |
| (5) | The securities reported as held by Ms. Herriet Qu include options to purchase 39,600 ordinary shares that are vested, and does not include options to purchase 158,400 ordinary shares granted in 2012 that are not yet vested and do not vest within 60 days. |
| (6) | The securities reported as held by Mr. Colin Sung include 10,000 ordinary shares that were the exercise of vested restricted shares, 16,250 restricted shares vested but not issued, and nil restricted shares to be vested within 60 days; and does not include 18,750 restricted shares that are not yet vested nor to be vested within 60 days. |
| (7) | The securities reported as held by Ms. Jerry Zhang include 17,500 restricted shares vested but not issued, and 1,250 restricted shares to be vested within 60 days; and does not include 11,250 restricted shares that are not yet vested nor to be vested within 60 days. |
| (8) | The securities reported as held by Mr. Jianyun Chai includes 15,000 restricted shares vested but not issued, and 1,250 restricted shares to be vested within 60 days; and does not include 13,750 restricted shares that are not yet vested nor to be vested within 60 days.. |
| (9) | The securities reported as held by Dr. Wang include 4,144,223 shares of our ordinary shares held indirectly through Ace Lead Profits Limited, 681,471 shares held indirectly through Billion Bright International Limited, 1,362,942 shares held indirectly through Excellent Link Enterprises Limited, 681,471 held indirectly through Golden Result Enterprises Limited, 850,000 held indirectly through Long Result Limited, 1,283,875 held indirectly through Sure Grow Profits |
| (10) |
| Represents shares held by Unionway Resources Limited which is controlled by Mr. Wenfu Wang and therefore, Mr. Wang may be deemed to be the beneficial owner of the ordinary shares held by Unionway Resources Limited. |
None of our major shareholders have different voting rights from other shareholders. We are not aware of any arrangement that may, at a subsequent date, result in a change of control of our company.the Company.
| ITEM 7. | MAJOR SHAREHOLDERS AND RELATED PARTY TRANSACTIONS |
A. Major Shareholders
| A. | Major Shareholders |
Please refer to Item 6.E “Directors, Senior Management and Employees — Share Ownership.”
B.
| B. | Related Party Transactions |
The related party relationships and related party transactions are listed as follows:
Related Party Relationshipsparty relationships
| Name of related parties | Relationship with the Company | |
| Shenhua Hollysys Information Technology Co., Ltd. ("Shenhua Information") | 20% owned by Beijing Hollysys | |
| New Huake Electronic Technology Co., Ltd. ("New Huake") | 37.5% owned by Beijing Hollysys | |
| China Techenergy Co., Ltd. ("China Techenergy") | 40% owned by Beijing Hollysys | |
| Beijing Hollysys Electric Motor Co., | 40% owned by Beijing Hollysys | |
| Zhejiang | 6% owned by Hangzhou Hollysys | |
| Beijing Hollysys Machine Automation Co., Ltd. ("Hollysys Machine") | 30% owned by Hollysys Investment | |
| Southcon Development Sdn. Bhd. (“Southcon”) | 30% owned by BMJB | |
| Heilongjiang Ruixing Technology Co., Ltd.("Ruixing") | 8.31% owned by Beijing Hollysys | |
| Swee Yong Chim | Shareholder of the Company and former shareholder of Concord | |
| Yoon Fah Chim | Shareholder of the Company and former shareholder of Concord |
Due from related parties
| June 30, | ||||||||
| 2011 | 2012 | |||||||
| China Techenergy | $ | 10,837,123 | $ | 14,850,375 | ||||
| Shenhua Information | 1,333,534 | 1,183,660 | ||||||
| Hollysys Machine | - | 297,622 | ||||||
| Hollysys Equipment | 4,790 | 4,901 | ||||||
| $ | 12,175,447 | $ | 16,336,558 | |||||
| June 30, | ||||||||
| 2013 | 2014 | |||||||
| China Techenergy | $ | 23,391,167 | $ | 19,038,908 | ||||
| Shenhua Information | 2,157,094 | 3,832,574 | ||||||
| Hollysys Machine | 352,119 | 848,188 | ||||||
| Electric Motor | 462 | - | ||||||
| Zhejiang Sanxing | 10,304 | - | ||||||
| Ruixing | 199,045 | - | ||||||
| Swee Yong Chim | 200,631 | - | ||||||
| Yoon Fah Chim | 200,632 | - | ||||||
| $ | 26,511,454 | $ | 23,719,670 | |||||
The Company’s management believes that the collection of amounts due from related parties is reasonably assured and accordingly, no provision had been made for these balances.
Due to related parties
| June 30, | ||||||||
| 2011 | 2012 | |||||||
| Shenhua Information | $ | 2,725,059 | $ | 1,544,464 | ||||
| China Techenergy | 536,125 | 401,719 | ||||||
| Electric Motor | 17,396 | 16,224 | ||||||
| Hollysys Equipment | 1,780 | 1,821 | ||||||
| Hollysys Machine | - | 45 | ||||||
| New Huake | 58,203 | 2 | ||||||
| $ | 3,338,563 | $ | 1,964,275 | |||||
| June 30, | ||||||||
| 2013 | 2014 | |||||||
| Shenhua Information | $ | 1,351,199 | $ | 1,591,858 | ||||
| China Techenergy | 691,360 | 2,266,900 | ||||||
| Electric Motor | 27,393 | 47,790 | ||||||
| Hollysys Machine | 10,915 | 81,858 | ||||||
| New Huake | 2 | 2 | ||||||
| $ | 2,080,869 | $ | 3,988,408 | |||||
Transactions with related parties
| Purchases of goods and services from: | ||||||||||||
| Year ended June 30, | ||||||||||||
| 2012 | 2013 | 2014 | ||||||||||
| Electric Motor | $ | 31,729 | $ | 68,336 | $ | 14,022 | ||||||
| Shenhua Information | 41,045 | 364,537 | 323,099 | |||||||||
| Hollysys Machine | - | 972,508 | 1,980,146 | |||||||||
| New Huake | - | 69,768 | - | |||||||||
| $ | 72,774 | $ | 1,475,149 | $ | 2,317,267 | |||||||
Purchases
| Sales of goods and integrated solutions to: | ||||||||||||
| Year ended June 30, | ||||||||||||
| 2012 | 2013 | 2014 | ||||||||||
| China Techenergy | $ | 3,657,215 | $ | 17,059,714 | $ | 3,135,991 | ||||||
| Shenhua Information | 1,411,274 | 1,936,273 | 2,726,358 | |||||||||
| Hollysys Machine | 296,523 | 557,243 | 920,961 | |||||||||
| Electric Motor | 1,775 | 3,893 | 1,804 | |||||||||
| $ | 5,366,787 | $ | 19,557,123 | $ | 6,785,114 | |||||||
| Operating lease income from: | ||||||||||||
| Year ended June 30, | ||||||||||||
| 2012 | 2013 | 2014 | ||||||||||
| Hollysys Machine | $ | 45,475 | $ | 65,926 | $ | 65,227 | ||||||
| $ | 45,475 | $ | 65,926 | $ | 65,227 | |||||||
The Company sells automation control systems to China Techenergy which is used for non-safety operations control in the nuclear power industry. China Techenergy incorporates the Company’s non-safety automation control systems with their proprietary safety automated control systems to provide an overall automation and control system for nuclear power stations in China. The Company is not a party to the integrated sales contracts executed between China Techenergy and their customers. Our pro rata shares of goodsthe intercompany profits and services from:losses are eliminated until realized through a sale to outside (unrelated) parties in arm’s-length transactions, as if China Techenergy were a consolidated subsidiary.
| Year ended June 30, | ||||||||||||
| 2010 | 2011 | 2012 | ||||||||||
| Electric Motor | $ | 41,757 | $ | 34,085 | $ | 31,729 | ||||||
| China Techenergy | 70,368 | - | - | |||||||||
| Shenhua Information | 4,857,416 | 2,151,391 | 41,045 | |||||||||
| New Huake | 493,203 | 879,111 | - | |||||||||
| $ | 5,462,744 | $ | 3,064,587 | $ | 72,774 | |||||||
The Company sells automation control systems to Shenhua Information which is used for operations control in the information automation industry. Shenhua Information incorporates the Company’s automation control systems with their proprietary automated remote control systems to provide an overall automation and control system to its customers. The Company is not a party to the integrated sales contracts executed between Shenhua Information and their customers. Our pro rata shares of the intercompany profits and losses are eliminated until realized through a sale to outside (unrelated) parties in arm’s-length transactions, as if Shenhua Information were a consolidated subsidiary.
PurchaseThe Company engages Hollysys Machine to sell the Company’s products to the end customers. The Company pays commissions to Hollysys Machine in exchange for its services. The amount of building from:
| Year ended June 30, | ||||||||||||
| 2010 | 2011 | 2012 | ||||||||||
| Shenhua Information | $ | - | $ | 3,608,675 | $ | - | ||||||
| $ | - | $ | 3,608,675 | $ | - | |||||||
��
Operating lease expenses paid to:
| Year ended June 30, | ||||||||||||
| 2010 | 2011 | 2012 | ||||||||||
| Shenhua Information | $ | 32,069 | $ | - | $ | - | ||||||
| $ | 32,069 | $ | - | $ | - | |||||||
Salesthe commission payable is determined based on the value of goods and integrated solutions to:the products sold by Hollysys Machine during the year.
| Year ended June 30, | ||||||||||||
| 2010 | 2011 | 2012 | ||||||||||
| China Techenergy | $ | 4,189,366 | $ | 3,557,125 | $ | 3,657,215 | ||||||
| Shenhua Information | 2,184,844 | 727,460 | 1,411,274 | |||||||||
| Hollysys Machine | - | - | 296,523 | |||||||||
| Electric Motor | 11,038 | 13,478 | 1,775 | |||||||||
| Zhejiang Sanxin | 8,337 | - | - | |||||||||
| Hollysys Equipment | 1,385 | - | - | |||||||||
| $ | 6,394,970 | $ | 4,298,063 | $ | 5,366,787 | |||||||
Operating lease income from:
| Year ended June 30, | ||||||||||||
| 2010 | 2011 | 2012 | ||||||||||
| Hollysys Machine | $ | - | $ | - | $ | 45,475 | ||||||
| $ | - | $ | - | $ | 45,475 | |||||||
Amounts due from and due to the related parties relating to the above transactions are unsecured, non-interest bearing and repayable on demand.
Except as set forth in our discussion above, none of our directors, director nominees or executive officers has been involved in any transactions with us or any of our directors, executive officers, affiliates or associates which are required to be disclosed herein.
C. Interests of Experts and Counsel
| C. | Interests of Experts and Counsel |
Not applicable.
| ITEM 8. | FINANCIAL INFORMATION |
A. Consolidated Statements and Other Financial Information
| A. | Consolidated Statements and Other Financial Information |
We have appended consolidated financial statements filed as part of this Annual Report. See Item 18 “Financial Statements.”
Legal Proceedings
We are currently not a party to any material legal or administrative proceedings, and we are not aware of threatened material legal or administrative proceedings against us. We may from time to time become a party to various legal or administrative proceedings arising in the ordinary course of our business.
Dividend Policy
We anticipate thatHistorically we will retain all ofhave retained our future earnings if any, for use in the expansion and operation of our business and do not anticipate paying cash dividends in the foreseeable future.business. Any future determination relating to our dividend policy will be made at the discretion of our board of directors, based on our financial condition, results of operations, earnings, contractual restrictions, capital requirements, business prospects and other factors our board of directors may deem relevant. The company intends to pay a dividend of $0.40 for each of its outstanding ordinary shares, which has been approved by the board of directors on August 13, 2014. However, the board directors have not set up the record date or the payment date. We expect that the payment date will be prior to June 30, 2015.
Notwithstanding the understanding that earnings will be accumulated, our ability to pay dividends depends substantially on the receipt of dividends to us by our PRC and overseas subsidiaries. Each of our
For the PRC subsidiaries, each of them may pay dividends only out of its accumulated distributable profits, if any, determined in accordance with its articles of association and the accounting standards and regulations in China. Pursuant to applicable PRC laws and regulations, 10% of after-tax profits of each of our consolidated PRC entities are required to be set aside in a statutory surplus reserve fund annually until the reserve balance reaches 50% of such PRC entity’s registered capital. Allocations from these statutory surplus reserves may only be used for specific purposes and are not distributable to us in the form of loans, advances, or cash dividends.
Under the New EIT Law and its implementation rules issued by the PRC State Council, both of which became effective on January 1, 2008, dividends from our PRC subsidiaries to us may be subject to a withholding tax at the rate of 10% if the dividend is derived from profits generated after January 1, 2008. If we are deemed to be a PRC resident enterprise, the withholding tax may be exempted, but in such a case we will be subject to a 25% tax on our global income, and our non-PRC investors may be subject to PRC income tax withholding. For a more detailed discussion of the New EIT Law, see Item 10 - Additional Information, Subpart E, Taxation in China of this Form 20-F.
B. For the Singapore and Malaysia subsidiaries, each of them may pay dividends only out of its profits based on the articles of association and the Companies Act in Singapore and Malaysia. There is no limit to the amount of dividend payable as long as there are sufficient profits. There is no withholding tax imposed on a Singapore and Malaysia company paying dividends to a company located outside of Singapore and Malaysia upon remittance.
| B. | Significant Changes |
None.
| ITEM 9. | THE OFFER AND LISTING |
| A. | Offer and Listing Details |
A. Offer and Listing Details
The common stock, warrants and units of Chardan, our predecessor, were quoted on the Over-the-Counter Bulletin Board maintained by the National Association of Securities Dealers, under the symbols of CNCA, CNCAW and CNCAU, respectively. Chardan units commenced public trading on August 3, 2005 and common stock and warrants commenced public trading on August 31, 2005. On September 20, 2007, we merged with and into Chardan simultaneously with our acquisition of Gifted Time. From September 20, 2007 to July 31, 2008, our ordinary shares were quoted on the OTCBB under the symbol “HLSYF.OB.” On August 1, 2008, our ordinary shares were approved to be listed on the NASDAQ Global Select Market, under the symbol “HOLI”.
The following table provides the high and low trading prices for our ordinary shares and the historical prices for our common stock/ordinary shares, warrants and units prior to the merger, for the periods indicated below.
| The OTCBB Price per Common Stock /Ordinary Shares | The OTCBB Price per Warrant | The OTCBB Price per Unit | Nasdaq(2) Price per Share | |||||||||||||||||||||||||||||
| High | Low | High | Low | High | Low | High | Low | |||||||||||||||||||||||||
| Annual Market Prices(3) | ||||||||||||||||||||||||||||||||
| Year 2007 (until September 20, 2007) | $ | 8.7 | 7.2 | $ | 3.65 | 2.46 | $ | 15.85 | 12.29 | N/A | N/A | |||||||||||||||||||||
| Year 2008 (from September 21, 2007 through June 30, 2008)(1) | N/A | N/A | N/A | N/A | N/A | N/A | N/A | N/A | ||||||||||||||||||||||||
| Year 2009 | N/A | N/A | N/A | N/A | N/A | N/A | $ | 7.3 | 2.03 | |||||||||||||||||||||||
| Year 2010 | N/A | N/A | N/A | N/A | N/A | N/A | $ | 13.09 | 5.52 | |||||||||||||||||||||||
| Year 2011 | N/A | N/A | N/A | N/A | N/A | N/A | $ | 17.43 | 4.54 | |||||||||||||||||||||||
| Quarterly Market Prices | ||||||||||||||||||||||||||||||||
| First Quarter 2011 ended September 30, 2010 | N/A | N/A | N/A | N/A | N/A | N/A | $ | 11.19 | 8.33 | |||||||||||||||||||||||
| Second Quarter 2011 ended December 31, 2010 | N/A | N/A | N/A | N/A | N/A | N/A | $ | 15.99 | 11.03 | |||||||||||||||||||||||
| Third Quarter 2011 ended March 31, 2011 | N/A | N/A | N/A | N/A | N/A | N/A | $ | 18.15 | 11.56 | |||||||||||||||||||||||
| Fourth Quarter 2011 ended June 30, 2011 | N/A | N/A | N/A | N/A | N/A | N/A | $ | 14.41 | 7.59 | |||||||||||||||||||||||
| First Quarter 2012 ended September 30, 2011 | N/A | N/A | N/A | N/A | N/A | N/A | $ | 11.54 | 4.54 | |||||||||||||||||||||||
| Second Quarter 2012 ended December 31, 2011 | N/A | N/A | N/A | N/A | N/A | N/A | $ | 9.47 | 5.202 | |||||||||||||||||||||||
| Third Quarter 2012 ended March 31, 2012 | N/A | N/A | N/A | N/A | N/A | N/A | $ | 11.35 | 8.04 | |||||||||||||||||||||||
| Fourth Quarter 2012 ended June 30, 2012 | N/A | N/A | N/A | N/A | N/A | N/A | $ | 11.25 | 7.96 | |||||||||||||||||||||||
| Monthly Market Prices | ||||||||||||||||||||||||||||||||
| March 2012 | N/A | N/A | N/A | N/A | N/A | N/A | $ | 11 | 8.92 | |||||||||||||||||||||||
| April 2012 | N/A | N/A | N/A | N/A | N/A | N/A | $ | 11.19 | 9.52 | |||||||||||||||||||||||
| May 2012 | N/A | N/A | N/A | N/A | N/A | N/A | $ | 10.12 | 8.21 | |||||||||||||||||||||||
| June 2012 | N/A | N/A | N/A | N/A | N/A | N/A | $ | 9.08 | 7.96 | |||||||||||||||||||||||
| July 2012 | N/A | N/A | N/A | N/A | N/A | N/A | $ | 8.85 | 7.3 | |||||||||||||||||||||||
| August 2012 | N/A | N/A | N/A | N/A | N/A | N/A | $ | 10.03 | 7.3 | |||||||||||||||||||||||
| September 2012 (through September 14, 2012) | N/A | N/A | N/A | N/A | N/A | N/A | $ | 10.04 | 9.03 | |||||||||||||||||||||||
| Nasdaq(1)Price per Share | ||||||||
| High | Low | |||||||
| Annual Market Prices(2) | ||||||||
| Year 2010 | $ | 13.09 | 5.52 | |||||
| Year 2011 | $ | 17.43 | 4.54 | |||||
| Year 2012 | $ | 12.2 | 7.3 | |||||
| Year 2013 | $ | 13.96 | 7.33 | |||||
| Year 2014 | $ | 24.49 | 11.79 | |||||
| Quarterly Market Prices | ||||||||
| First Quarter 2013 ended September 30, 2012 | $ | 10.03 | 7.33 | |||||
| Second Quarter 2013 ended December 31, 2012 | $ | 11.89 | 8.94 | |||||
| Third Quarter 2013 ended March 31, 2013 | $ | 13.96 | 12.01 | |||||
| Fourth Quarter 2013 ended June 30, 2013 | $ | 12.48 | 11.12 | |||||
| First Quarter 2014 ended September 30, 2013 | $ | 15.41 | 11.79 | |||||
| Second Quarter 2014 ended December 31, 2013 | $ | 18.99 | 14.71 | |||||
| Third Quarter 2014 ended March 31, 2014 | $ | 21.54 | 15.53 | |||||
| Fourth Quarter 2014 ended June 30, 2014 | $ | 24.49 | 18.85 | |||||
| Monthly Market Prices | ||||||||
| March 2014 | $ | 21.54 | 18.71 | |||||
| April 2014 | $ | 23.48 | 19.93 | |||||
| May 2014 | $ | 22.36 | 18.85 | |||||
| June 2014 | $ | 24.49 | 21.37 | |||||
| July 2014 | $ | 24.15 | 21.79 | |||||
| August 2014 | $ | 23.39 | 21.79 | |||||
| September 2014, (through September 22, 2014) | $ | 22.76 | 21.56 | |||||
(1) On September 20, 2007, we changed our fiscal year end from December 31 to June 30, in connection with the acquisition of Gifted Time and our re-domestication to the BVI.
(2) Since August 1, 2008, our ordinary shares have been traded on the NASDAQ Global Select Market. The above table sets forth the range of high and low closing prices per share of our ordinary shares as reported bywww.quotemedia.com for the periods indicated.
(3)(2) All periods end June 30 of the stated year, unless otherwise noted.
B. Plan of Distribution
| B. | Plan of Distribution |
Not applicable
C. Markets
| C. | Markets |
See our disclosures under “Item 9. A. Offer and Listing.”
D. Selling Shareholders
| D. | Selling Shareholders |
Not Applicable
E. Dilution
| E. | Dilution |
Not Applicable
F. Expenses of Issue
| F. | Expenses of Issue |
Not Applicable
| ITEM 10. | ADDITIONAL INFORMATION |
A. Share Capital
| A. | Share Capital |
Not applicable
B. Memorandum and Articles of Association
| B. | Memorandum and Articles of Association |
The following represents a summary of certain key provisions of the Company’s amended and restated memorandum and articles of association. The summary does not purport to be a summary of all of the provisions of our memorandum and articles of association and of all relevant provisions of BVI law governing the management and regulation of BVI companies.
Register
The Company was incorporated in the BVI on February 6, 2006 under the BVI Business Companies Act, 2004, or the 2004 Act. The Company filed a Certificate of Change of Name to change its name from HLS Systems International, Inc. to Hollysys Automation Technologies Ltd. on July 17, 2009. The Company’s memorandum of association authorizes the issuance of up to 100,000,000 ordinary shares of $0.001 par value, and (ii) 90,000,000 preferred shares of $0.001 par value.
Objects and Purposes
The Company’s memorandum of association grants the Company full power and capacity to carry on or undertake any business or activity and do any act or enter into any transaction not prohibited by the 2004 Act or any other BVI legislation.
Directors
A director must, immediately after becoming aware of the fact that he is interested in a transaction entered into or to be entered into by us, disclose such interest to the board of directors, unless (i) the transaction or proposed transaction is between the director and (ii) the transaction or proposed transaction is or is to be entered into in the ordinary course of our business and on usual terms and conditions. The director who is interested in a transaction entered into or to be entered into by the Company may (i) vote on a matter relating to the transaction; (ii) attend a meeting of directors at which a matter relating to the transaction arises and be included in the quorum; and (iii) sign a document on behalf of the company, or do any other thing in his capacity as a director, that relates to the transaction.
The directors may fix their compensation for services rendered to us.
By a resolution of directors, the directors may exercise all our powers to borrow money, mortgage or charge our undertakings and property, issue debentures, denture stock and other securities whenever money is borrowed or as security for any debt, liability or obligation occurred by us or of any third party.
Each director holds office until his successor takes office or until his earlier death, resignation or removal by the members or a resolution passed by the majority of the remaining directors.
A director shall not require a share qualification.
Directors may only be removed for cause by the shareholders.
To the fullest extent permitted by the 2004 Act, none of our directors shall be personally liable to the Company or its shareholders for or with respect to any acts or omissions in the performance of his or her duties as a director of the Company.
Rights and Obligations of Shareholders
Dividends
Subject to the 2004 Act, the directors may, by resolution of directors, declare dividends and distributions by the Company to members and authorize payment on the dividends or distributions so long as that immediately after the distribution, the value of the Company’s assets exceeds its liabilities and the Company is able to pay its debts as they fall due. Any distribution payable in respect of a share which has remained unclaimed for three years from the date when it became due for payment shall, if the board of the directors so resolves, be forfeited and cease to remain owing by the Company. The directors may, before authorizing any distribution, set aside out of the profits of the Company such sum as they think proper as a reserve fund, and may invest the sum so set apart as a reserve fund upon such securities as they may select.
The holder of each ordinary share has the right to an equal share in any distribution paid by the Company.
Voting Rights
Each ordinary share confers on the shareholder the right to one vote at a meeting of the members or on any resolution of members on all matters before the shareholders of the Company.
Rights in the event of winding up
The holder of each ordinary share is entitled to an equal share in the distribution of the surplus assets of the Company on a winding up.
Redemption
The Company may purchase, redeem or otherwise acquire and hold its own shares with the consent of members whose shares are to be purchased, redeemed or otherwise acquired unless the Company is permitted by the 2004 Act or any provision of the amended and restated memorandum of association or the amended and restated articles of association to purchase, redeem or otherwise acquire the shares without their consent.
The Company may purchase, deem or otherwise acquire its shares at a price lower than the fair value if permitted by, and then only in accordance with, the terms of the amended and restated memorandum of association or the amended and restated articles of association or a written agreement for the subscription for the shares to be purchased, redeemed or otherwise acquired.
Changes in the rights of shareholders
The directors are authorized to issue new classes or series of shares and the rights attached thereto. However, the rights attached to any class or series of shares (unless otherwise provided by the terms of issue of the shares of that class or series), whether or not the Company is being wound-up, must be varied with the consent in writing of all the holders of the issued shares of that class or series or with the sanction of a resolution passed by a majority of the votes cast at a separate meeting of the holders of the shares of the class or series.
Meetings
An annual meeting of members must be held each year at such date and time as may be determined by the directors and if requested to do so by members holding at least 30% of the voting rights in respect of the matter for which the meeting is being held. No less than ten days and not more than sixty daysdays’ notice of meetings is required to be given to members.
A meeting of members is properly constituted if at the commencement of the meeting there are two members present in person or by proxy or (in the case of a member being a corporation) by its duly authorized representative representing not less than one third of the votes of the shares or class or series of shares entitled to vote on resolutions of members to be considered at the meeting.
A member shall be deemed to be present at the meeting if he participates by telephone or other electronic means and all members participating in the meeting are able to hear each other.
An ordinary resolution of members may be approved at a duly constituted meeting of members by the affirmative vote of a simple majority of the votes of those members entitled to vote and voting on the resolution.
A special resolution of members may be approved at a duly constituted meeting of members by a vote of not less than two-thirds of votes of those members entitled to vote.
A meeting of members convened to consider a special resolution (other than an annual general meeting) may be called on short notice if members holding not less than 90% of the total number of shares entitled to attend the meeting and vote on all matters to be considered at the meeting waive the required notice for the meeting. Attendance at the meeting is deemed to constitute waiver.
The inadvertent failure of the directors to give notice of a meeting to a member, or the fact that a member has not received notice, does not invalidate the meeting.
A member may be represented at a meeting of members by a proxy who may speak and vote on behalf of the member. A written instrument giving the proxy such authority must be produced at the place appointed for the meeting before the time for holding the meeting at which such person proposes to vote.
Limitations on Ownership of Securities
There are no limitations on the right of non-residents or foreign persons to own the Company’s securities imposed by BVI law or by the Company’s amended and restated memorandum of association and articles of association.
Change in Control of Company
While directors of the Company may be appointed by the members or directors for such terms as may be determined at the time of such appointment, and may be removed by resolution of directors with or without cause, directors may not be removed by the members except for cause.
A special resolution of members is required for the Company to issue shares of the Company or securities convertible into shares of the Company resulting in a change of control of the Company. Additionally, the board of directors has the power to issue preferred shares with such rights attaching to them as they decide and that this power could be used in a manner that would delay, defer of prevent a change of control of our company.
Ownership Threshold
There are no provisions governing the ownership threshold above which shareholder ownership must be disclosed.
Changes in Capital
Subject to the provisions of the 2004 Act, we may, by a resolution of directors or members, amend the Company’s memorandum and articles of association to increase or decrease the number of shares authorized to be issued. The directors of the Company may, by resolution, authorize a distribution (including a capital distribution) by the Company at a time, of an amount, and to any members they think fit if they are satisfied, on reasonable grounds, that the Company will, immediately after the distribution, satisfy the solvency test. The solvency test is satisfied if the value of the Company’s assets exceeds its liabilities, and the Company is able to pay its debts as they fall due.
Differences in Corporate Law
The company law of the BVI differs from laws applicable to U.S. corporations and their shareholders. Set forth below is a summary of the significant differences between the provisions of the companies law applicable to us and the laws applicable to companies incorporated in the United States and their shareholders.
Protection for minority shareholders
Under the laws of most U.S. jurisdictions, majority and controlling shareholders of a company generally have certain “fiduciary” responsibilities to the minority shareholders. Corporate actions taken by majority and controlling shareholders that are unreasonable and materially detrimental to the interests of minority shareholders may be declared null and void. Minority shareholders may have less protection for their rights under BVI law than they would have under U.S. law.
Powers of directors
Unlike most U.S. jurisdictions, the directors of a BVI company, subject in certain cases to court’s approvals but without shareholders’ approval, may implement the sale, transfer, exchange or disposition of any asset, property, part of the business, or securities of the company, with the exception that shareholder approval is required for the disposition of over 50% in the value of the total assets of the company.
Conflict of interests
Similar to the laws of most U.S. jurisdictions, when a director becomes aware of the fact that he has an interest in a transaction which the company iswe are to enter into, he must disclose it to our board. However, with sufficient disclosure of interest in relation to that transaction, the director who is interested in a transaction entered into or to be entered into by the Company may (i) vote on a matter relating to the transaction; (ii) attend a meeting of directors at which a matter relating to the transaction arises and be included in the quorum; and (iii) sign a document on behalf of the company,us, or do any other thing in his capacity as a director, that relates to the transaction.
Written consent and cumulative voting
Similar to the laws of most U.S. jurisdictions, under the BVI law, shareholders are permitted to approve matters by way of written resolution in place of a formal meeting. BVI law does not make a specific reference to cumulative voting, and our current Memorandum and Articles of Association have no provision authorizing cumulative voting.
Independent directors
There is no requirement for a majority of the directors of the company to be independent as a matter of BVI law.
Redemption
Our ordinary shares are not redeemable at a shareholder’s option. We may redeem our shares only with the consent of the shareholders whose shares are to be redeemed, except that the consent from the shareholders is not needed under the circumstances of compulsory redemption, which occurs at the request of the shareholders holding 90% of the votes of the outstanding ordinary shares entitled to vote, of the remaining issued shares.
Takeover provisions
On August 27, 2010, our Board of Directors adopted the 2010 Rights Plan. In connection with the 2010 Rights Plan, the Board of Directors declared a dividend distribution of one “Right” for each outstanding ordinary share to shareholders of record at the close of business on August 27, 2010, effective as of September 27, 2010. Each Right entitles the shareholder to buy one share of our Class A Preferred Stock at a price of $160. Unless terminated earlier by our Board of Directors, the 2010 Rights Plan will expire on September 27, 2020.
Initially, the Rights will be attached to all certificates representing ordinary shares then outstanding, and no separate Rights certificates or stock statements will be distributed or provided. The Rights will separate from the ordinary shares and become exercisable if a person or group announces an acquisition of 20% or more of our outstanding ordinary shares, or announces commencement of a tender offer for 20% or more of the ordinary shares. In that event, the Rights permit shareholders, other than the acquiring person, to purchase our ordinary shares having a market value of twice the exercise price of the Rights, in lieu of the Class A Preferred Stock. In addition, in the event of certain business combinations, the Rights permit the purchase of the ordinary shares of an acquiring person at a 50% discount. Rights held by the acquiring person become null and void in each case.
The 2010 Rights Plan is designed to ensure that all of our shareholders receive fair and equal treatment in the event of any proposed takeover of us and to guard against partial tender offers, open market accumulations and other abusive or coercive tactics to gain control of us without paying all shareholders a control premium. The Rights will cause substantial dilution to a person or group that acquires 20% or more of our stock on terms not approved by the our Board of Directors, but the Rights should not interfere with any merger or other business combination approved by the Board of Directors at any time prior to the first date that a person or group has become an acquiring person.
Shareholder’s access to corporate records
A shareholder is entitled, on giving written notice to the Company, to inspect the Company’s (i) Memorandum and Articles of Association; (ii) register of members; (iii) register of directors; and (iv) minutes of meetings and resolutions of members and of those classes of members of which the shareholder is a member.
The directors may, if they are satisfied that it would be contrary to the company’s interests to allow a member to inspect any document listed above (or any part thereof), refuse the member to inspect the document or limit the inspection of the document. Our board may also authorize a member to review the company account if requested.
Indemnification
Under our Memorandum and Articles of Association, we must indemnify our directors or any person who is or was, at the request of the Company, serving as a director of, or in any other capacity is or was acting for, another body corporate or a partnership, joint venture, trust or other enterprise against expenses (including legal fees), judgments, fines and amounts paid in settlement actually and reasonably incurred by such persons in connection with legal, administrative or investigative proceedings to which they are a party or are threatened to be made a party by reason of their acting as our directors or agents. To be entitled to indemnification, these persons must have acted honestly and in good faith and in what he believes to be the best interest of the Company, and they must have had no reasonable cause to believe their conduct was unlawful.
Insofar as indemnification for liabilities arising under the Securities Act may be permitted to directors, officers or persons controlling us under the foregoing provisions, we have been advised that in the opinion of the SEC, such indemnification is against public policy as expressed in the Securities Act and is therefore unenforceable.
Mergers and similar arrangements
Under the laws of the BVI, two or more companies may merge or consolidate in accordance with Section 170 of the 2004 Act. A merger means the merging of two or more constituent companies into one of the constituent companies, and a consolidation means the uniting of two or more constituent companies into a new company. In order to merge or consolidate, the directors of each constituent company must approve a written plan of merger or consolidation which must be authorized by a resolution of shareholders.
While a director may vote on the plan even if he has a financial interest in the plan of merger of consolidation, in order for the resolution to be valid, the interest must have been disclosed to our board forthwith upon him becoming aware of such interest. The transaction will not be avoidable if the shareholders approve or ratify it.
Shareholders not otherwise entitled to vote on the merger or consolidation may still acquire the right to vote if the plan of merger or consolidation contains any provision which, if proposed as an amendment to the memorandum or articles of association, would entitle them to vote as a class or series on the proposed amendment. In any event, all shareholders must be given a copy of the plan of merger or consolidation irrespective of whether they are entitled to vote at the meeting or consent to the written resolution to approve the plan of merger or consolidation.
The shareholders of the constituent companies are not required to receive shares of the surviving or consolidated company, but may receive debt obligations or other securities of the surviving or consolidated company, or other assets, or a combination thereof. Furthermore, some or all of the shares of a class or series may be converted into a kind of asset while the other shares of the same class or series may receive a different kind of asset. As such, not all the shares of a class or series must receive the same kind of consideration.
After the plan of merger or consolidation has been approved by the directors and authorized by a resolution of the shareholders, articles of merger or consolidation are executed by each company and filed with the Registrar of Corporate Affairs in the BVI.
A shareholder may dissent from a mandatory redemption of his shares, an arrangement (if permitted by the court), a merger (unless the shareholder was a shareholder of the surviving company prior to the merger and continues to hold the same or similar shares after the merger) and a consolidation. A shareholder properly exercising his dissent rights is entitled to payment of the fair value of their shares.
A shareholder dissenting from a merger or consolidation must object in writing to the merger or consolidation before the vote by the shareholders on the merger or consolidation, unless notice of the meeting was not given to the shareholder. If the merger or consolidation is approved by the shareholders, the company must within 20 days give notice of this fact to each shareholder who gave written objection, and to each shareholder who did not receive notice of the meeting. Such shareholders then have 20 days to give to the company their written election in the form specified by the BVI Business Companies Act to dissent from the merger or consolidation, provided that in the case of a merger, the 20 days starts when the plan of merger is delivered to the shareholder.
Upon giving notice of his election to dissent, a shareholder ceases to have any rights of a shareholder except the right to be paid the fair value of his shares. As such, the merger or consolidation may proceed in the ordinary course notwithstanding the dissent.
Within seven days of the later of the delivery of the notice of election to dissent and the effective date of the merger or consolidation, the company must make a written offer to each dissenting shareholder to purchase his shares at a specified price that the company determines to be their fair value. The company and the shareholders then have 30 days to agree upon the price. If the company and a shareholder fail to agree on the price within the 30 days, then the company and the shareholder shall each designate an appraiser and these two appraisers shall designate a third appraiser. These three appraisers shall fix the fair value of the shares as of the close of business on the day before the shareholders approved the transaction without taking into account any change in value as a result of the transaction.
Shareholders’ suits
Similar to the laws of most U.S. jurisdictions, BVI law permits derivative actions against its directors. However, the circumstances under which such actions may be brought, and the procedures and defenses available may result in the rights of shareholders of a BVI company being more limited than those of shareholders of a company incorporated and/or existing in the United States.
The court of the BVI may, on the application of a shareholder of a company, grant leave to that shareholder to bring proceedings in the name and on behalf of that company, or intervene in proceedings to which the company is a party for the purpose of continuing, defending or discontinuing the proceedings on behalf of the company. In determining whether to grant leave, the High Court of the BVI must take into account (i) whether the shareholder is acting in good faith; (ii) whether the derivative action is in the interests of the company taking account of the views of the company’s directors on commercial matters; (iii) whether the proceedings are likely to succeed; (iv) the costs of the proceedings in relation to the relief likely to be obtained; and (v) whether an alternative remedy to the derivative claim is available.
Leave to bring or intervene in proceedings may be granted only if the High Court of the BVI is satisfied that (i) the company does not intend to bring, diligently continue or defend, or discontinue the proceedings, as the case may be; or (ii) it is in the interests of the company that the conduct of the proceedings should not be left to the directors or to the determination of the shareholders as a whole.
In determining whether to grant leave to a shareholder in these circumstances, the BVI Court must take the following matters into account:
(a) whether the member is acting in good faith;
(b) whether the derivative action is in the interests of the company taking account of the views of the company’s directors on commercial matters;
(c) whether the proceedings are likely to succeed;
(d) the costs of the proceedings in relation to the relief likely to be obtained; and
(e) whether an alternative remedy to the derivative claim is available.
C. Material Contracts
| C. | Material Contracts |
Except for the following, we have not entered into any material contracts other than in the ordinary course of business and other than those described in Item 4, “Information on the Company,” Item 7, “Major Shareholders and Related Party Transactions,” or Item 5. Operating And Financial Review And Prospects – Contractual Obligations,” or elsewhere in this annual report.
On December 23, 2009, we entered into the Share Purchase Agreement with Unionway Resources Limited, a business company incorporated in the BVI, or the Seller, pursuant to which, among other things, we acquired 100% equity interest in Maypower Limited, a business company incorporated in the BVI and owned 24.11% of Beijing Hollysys, from the Seller. As the consideration for the acquisition of the equity interest, we agreed to:
1) issue 4,413,948 ordinary shares, or the Shares, to the Seller, and
2) pay cash US$9,917,062.5, or RMB 67,634,366.25 to the Seller.
The Shares were issued to the Seller and its designee on March 16, 2010. As a result of the acquisition of the equity interest, we indirectly own 100% of Beijing Hollysys.
On May 18, 2011, the Company entered into a stock purchase agreement (the “SPA”) to acquire 100% ownership of Concord which is engaged in the provision of electrical works and infrastructure engineering services in South East Asia and the Middle East. The total consideration of the acquisition consisted of cash consideration of SGD$41.5 million (approximately $33,789,285), and 1,006,788 ordinary shares of the Company.
Through the acquisition, the Company seeks to expand the existing distribution and marketing channels to cross sell the Company’s existing product lines in rail and industrial segments to fast growing South-East Asia and the Middle East markets. The effective date of the acquisition of Concord was July 1, 2011, at which time it became a wholly owned subsidiary of the Company, and its operation results are included in our consolidated financial statements effective from July 1, 2011.2011.
In addition, the Company iswas obligated to issue an aggregate of 1,510,181 ordinary shares of the Company (“Incentive Shares”) to the management of the Concord, if the Concord’s net income equals or exceeds $10 million and $11.5 million for the fiscal years endingended June 30, 2012 and 2013, respectively (“Targeted Net Income Threshold”), in accordance with the SPA. The Company shallwould issue 50% of Incentive Shares to the management of the Concord on an all or none basis per year when the Targeted Net Income Threshold is achieved. The Incentive Shares arewere granted with service conditions such that if the granteesrecipients terminate thetheir employment agreements within two years after the acquisition, the Incentive Shares will be forfeited. Because the Targeted Net Income Thresholds were not achieved for either of the two fiscal years, no Incentive Shares were issued.
On March 6, 2013, the Company signed a stock purchase agreement, referred to as the “Bond SPA”, to acquire 100% ownership of Bond. The total purchase price for the acquisition is a combination of cash and stock, aggregating an equivalent of approximately $73.0 million, including a two-year incentive program payable in ordinary shares and additional incentive shares if Bond meets certain performance targets. Pursuant to the Bond SPA, the Company paid$16.4 million within one month after signing the Bond SPA as a deposit, an additional $5.5 million upon closing, and $14.6 million to be paid within 18 months after signing the Bond SPA, respectively.
D. Exchange ControlsAfter the closing, the Company issued 1,407,907 ordinary shares to the shareholders of Bond on May 30, 2013, which were worth $14.6 million (40% of total share purchase price). The Bond shareholders also are entitled to Company ordinary shares worth $11.0 million (30% of total share purchase price) as incentive shares in each of the next two fiscal years if Bond’s US GAAP audited net income equals or exceeds $8.8 million and $10.6 million for calendar year 2013 and calendar year 2014, respectively. Additional ordinary shares, as a premium on performance, will be issued to the Bond shareholders if Bond outperforms the targets mentioned above, but the premium will not exceed 15% of the total incentive shares in any case. The Company and Bond have also agreed upon the compensation and incentives to be given to the management team of Bond to maintain the team stability after the acquisition. The performance target for calendar year 2013 was achieved and 648,697 shares were issuable as of June 30, 2014.
On April 3, 2013, Beijing Hollysys entered into an operating lease agreement to lease out one of its buildings located in Beijing. The lease term is 10 years from September 1, 2013 to August 31, 2023. The annual minimum lease payment receivable after five years are subject to renegotiation in case the Chinese consumer price index published by the government exceeds 5%.
On May 30, 2014, the Company entered into a convertible loan agreement with International Finance Corporation, an international organization established by Articles of Agreement among its member countries including the British Virgin Islands ("IFC"), under which the Company will borrow $20,000,000 from IFC (the “IFC Loan”) with an interest rate of 2.1% per annum and commitment fee of 0.5% per annum paid in rear semi-annually. The Company received the loan disbursement on August 30, 2014, and the loan interest started accumulating since then.
The IFC Loan has both voluntary and mandatory conversion terms. IFC may at its option convert, in US$1,000,000 increments, the Loan in whole or in part, into the Company’s ordinary shares at any time on or prior to the maturity date at a conversion rate and a conversion price in effect at such time. The initial conversion rate at the time of the agreement is 38 ordinary shares per $1,000, and the initial conversion price is $26.35 per share. The initial conversion rate and conversion price is subject to subsequent adjustments with events that may dilute the unit price per share. 50% of the principal amount of the Loan then outstanding will be mandatorily converted into Ordinary Shares at the conversion rate and conversion price then in effect if at any time, with respect to the period of 30 consecutive trading days ending at such time, the volume weighted average prices for 20 trading days or more in such 30 consecutive trading day period is equal to or more than 150% of the conversion price in effect at such time. 100% of the principal amount of the IFC Loan then outstanding will be mandatorily converted into Ordinary Shares at the conversion rate and conversion price then in effect if at any time, with respect to the period of 30 consecutive trading days ending at such time, the volume weighted average prices for 20 trading days or more in such 30 consecutive trading day period is equal to or more than 200% of the Conversion Price in effect at such time. The Company is subject to both affirmative and negative covenants. The outstanding principle, interests and fees need to be repaid to IFC in case the covenants were not fulfilled. The Company is assessing the financial and internal control effects of the IFC Loan which will be reflected in the Company’s first quarter financial statements.
In addition, the Company paid a one-time front-end fee of $200,000 according to the agreement on July, 2014. A portfolio supervision fee of $5,000 per annum is charged to the company by IFC for its effort of monitoring the convertible loan. The term of the IFC Loan is 5 years starting from the date of Company’s receipt of the loan.
| D. | Exchange Controls |
BVI Exchange Controls
There are no material exchange controls restrictions on payment of dividends, interest or other payments to the holders of our ordinary or preferred shares or on the conduct of our operations in the BVI, where we were incorporated. There are no material BVI laws that impose any material exchange controls on us or that affect the payment of dividends, interest or other payments to nonresident holders of our ordinary or preferred shares. BVI law and our Amended and Restated Memorandum and Articles of Association do not impose any material limitations on the right of non-residents or foreign owners to hold or vote our ordinary or preferred shares.
Exchange Controls in China
Under the Foreign Currency Administration Rules promulgated in 1996 and revised in 1997, and various regulations issued by State Administration of Foreign Exchange, or SAFE, and other relevant PRC government authorities, RMB is convertible into other currencies without prior approval from SAFE only to the extent of current account items, such as trade related receipts and payments, interest and dividends and after complying with certain procedural requirements. The conversion of RMB into other currencies and remittance of the converted foreign currency outside PRC for the purpose of capital account items, such as direct equity investments, loans and repatriation of investment, requires the prior approval from SAFE or its local office. Payments for transactions that take place within China must be made in RMB. Unless otherwise approved, PRC companies must repatriate foreign currency payments received from abroad. Foreign-invested enterprises may retain foreign exchange in accounts with designated foreign exchange banks subject to a cap set by SAFE or its local office. Unless otherwise approved, domestic enterprises must convert all of their foreign currency proceeds into RMB.
On October 21, 2005, SAFE issued the Notice on Issues Relating to the Administration of Foreign Exchange in Fund-raising and Reverse Investment Activities of Domestic Residents Conducted via Offshore Special Purpose Companies, which became effective as of November 1, 2005. According to the notice, a special purpose company, or SPV, refers to an offshore company established or indirectly controlled by PRC residents for the special purpose of carrying out financing of their assets or equity interest in PRC domestic enterprises. Prior to establishing or assuming control of an SPV, each PRC resident, whether a natural or legal person, must complete the overseas investment foreign exchange registration procedures with the relevant local SAFE branch. The notice applies retroactively. As a result, PRC residents who have established or acquired control of these SPVs that previously made onshore investments in China were required to complete the relevant overseas investment foreign exchange registration procedures by March 31, 2006. These PRC residents must also amend the registration with the relevant SAFE branch in the following circumstances: (i) the PRC residents have completed the injection of equity investment or assets of a domestic company into the SPV; (ii) the overseas funding of the SPV has been completed; (iii) there is a material change in the capital of the SPV. Under the rules, failure to comply with the foreign exchange registration procedures may result in restrictions being imposed on the foreign exchange activities of the violator, including restrictions on the payment of dividends and other distributions to its offshore parent company, and may also subject the violators to penalties under the PRC foreign exchange administration regulations.
E. TaxationOn August 29, 2008, SAFE promulgated Notice 142 which regulates the conversion by a foreign-funded enterprise of foreign currency into RMB by restricting how the converted RMB may be used. Notice 142 requires that RMB funds converted from the foreign currency capital of a foreign-funded enterprise may only be used for purposes within the business scope approved by the applicable governmental authority and may not be used for equity investments within the PRC unless specifically provided for otherwise. In addition, SAFE strengthened its supervision over the flow and use of RMB funds converted from the foreign currency capital of a foreign-funded enterprise. The use of such RMB capital may not be changed without SAFE’s approval, and may not, in any case, be used to repay or prepay RMB loans if such loans are outstanding. Violations of Notice 142 will result in severe penalties, such as heavy fines as set out in the relevant foreign exchange control regulations.
| E. | Taxation |
The following is a general summary of certain material BVI, China and U.S. federal income tax considerations. The discussion is not intended to be, nor should it be construed as, legal or tax advice to any particular prospective shareholder. The discussion is based on laws and relevant interpretations thereof in effect as of the date hereof, all of which are subject to change or different interpretations, possibly with retroactive effect.
BVI Taxation
The BVI does not impose a withholding tax on dividends paid by us to holders of our ordinary shares, nor does the BVI levy any capital gains or income taxes on us. Further, a holder of our ordinary shares who is not a resident of the BVI is exempt from the BVI income tax on dividends paid with respect to the ordinary shares. Holders of ordinary shares are not subject to the BVI income tax on gains realized on the sale or disposition of the ordinary shares.
Our ordinary shares are not subject to transfer taxes, stamp duties or similar charges in the BVI. However, as a business company incorporated under the 2004 Act, we are required to pay the BVI government an annual license fee based on the number of shares we are authorized to issue.
There is no income tax treaty or convention currently in effect between the United States and the BVI.
Taxation in China
TaxationWe are a holding company incorporated in China
In 2007, the BVI, which indirectly holds our equity interests in our PRC government promulgated the Enterprise Income Tax Law, or EIT Law, and the relevant implementation rules, which became effective on January 1, 2008. Under theoperating subsidiaries. The EIT Law and its implementation rules, all domestic and foreign investment companies will beboth of which became effective as of January 1, 2008, provide that a PRC enterprise is subject to a uniform enterprisestandard income tax at the rate of 25% and China-sourced income of foreign enterprises, such as dividends frompaid by a PRC subsidiary to its overseas parent, will normally be subject to PRC withholding tax at a rate of 10%, unless there are applicable treaties between the overseas parent’s jurisdiction of incorporation and China to reduce such rate.
Under the Arrangement between the Mainland and the Hong Kong Special Administrative Region for the Avoidance of Double Taxation and the Prevention of Fiscal Evasion with respect to Taxes on Income, or the Double Taxation Arrangement, effective as of January 1, 2007, such dividend withholding tax rate is reduced to 5% if a Hong Kong resident enterprise owns over 25% of the PRC company distributing the dividends. Under the aforesaid arrangement, any dividends that our PRC operating subsidiaries pay to their non-PRC shareholders willHong Kong holding companies may be subject to a withholding tax at athe rate of 20%, which is further reduced to 10% by the implementation rules,5% if the non-PRC shareholder isthey are not considered to be a non-PRC tax resident enterprise without any establishment or place within China orPRC “resident enterprise” as described below. However, if the Hong Kong holdings companies are not considered to be the “beneficial owner” of such dividends payableunder the Notice Regarding Interpretation and Recognition of Beneficial Owners under Tax Treaties promulgated by the State Administration of Taxation on October 27, 2009 (and not a PRC “resident enterprise”), such dividends would be subject to the withholding tax rate of 10%. The withholding tax rate of 5% or 10% applicable will have a significant impact on the amount of dividends to be received by us and ultimately by shareholders.
According to the Notice Regarding Interpretation and Recognition of Beneficial Owners under Tax Treaties, the term “beneficial owner” refers to a person who has no connection with the non-PRC shareholder’s establishmentright to own and dispose of the income and the rights or place within China, unlessproperties generated from the said income. The “beneficial owner” may be an individual, a company or any other organization which is usually engaged in substantial business operations. A conduit company is not a “beneficial owner.” The term “conduit company” refers to a company which is usually established for purposes of dodging or reducing taxes, and transferring or accumulating profits. Such a company is only registered in the country of domicile to satisfy the organizational form as required by law, but it does not engage in such non-PRC shareholder’s jurisdiction of incorporation has a tax treaty with China that provides for a different withholding arrangement. substantial business operations as manufacturing, distribution and management.
In addition pursuant to the changes to the current tax structure, under the EIT Law, enterprisesan enterprise established under the lawsoutside of non-PRC jurisdictions, but whoseChina with “de facto management body”bodies” within China is locatedconsidered a resident enterprise and will normally be subject to an EIT of 25% on its global income. The implementing rules define the term “de facto management bodies” as “an establishment that exercises, in substance, overall management and control over the production, business, personnel, accounting, etc., of a Chinese enterprise.”
It remains unclear whether the PRC shouldtax authorities would require or permit our overseas registered entities to be treated as PRC resident enterprises. We do not currently consider our company to be a PRC resident enterprise. However, if the PRC tax authorities determine that we are a “resident enterprise” for PRC enterprise income tax purposes, a number of unfavorable PRC tax consequences could follow. First, we may be subject to the enterprise income tax at a rate of 25% on our worldwide taxable income as well as PRC enterprise income tax reporting obligations. In our case, this would mean that income such as interest on offering proceeds and non-China source income would be subject to PRC enterprise income tax at a rate of 25%. Second, although under the EIT Law and its implementing rules dividends paid to us from our PRC subsidiaries would qualify as “tax-exempt income,” we cannot guarantee that such dividends will not be subject to a 10% withholding tax, as the PRC foreign exchange control authorities, which enforce the withholding tax, have not yet issued guidance with respect to the processing of outbound remittances to entities that are treated as resident enterprises for PRC enterprise income tax purposes. However,Finally, it is currently uncertain whether we may be deemed a resident enterprise, or howpossible that future guidance issued with respect to interpret whether any income or gain is derived from sources within China. See “Risk Factors - Under the EIT Law, we may be classified as anew “resident enterprise” of China. Such classification will likelycould result in unfavorablea situation in which a 10% withholding tax consequencesis imposed on dividends we pay to us and our non-PRC shareholders.” If we, as a BVI companyshareholders and with substantially all ofrespect to gains derived by our management located in China, were treated as a resident enterprise for PRC tax purposes, we will be subject to PRC tax onnon-PRC shareholders from transferring our worldwide income at the 25% uniform tax rate, which would have an impact on our effective tax rate.shares.
United States Federal Taxation
The following is a discussion of thecertain material U.S. federal income tax consequences of the acquisition, ownership and disposition of our ordinary shares by U.S. Holdersholders (as describeddefined below). It does not purport to be a comprehensive description of all of the tax considerations that may be relevant to a particular person’s situation. The discussion applies only to investors in sharesU.S. holders that hold thetheir ordinary shares as capital assets (generally property held for U.S. federal income tax purposes and it does not describe allinvestment) within the meaning of Section 1221 of the tax consequences that may be relevant to holders subject to special rules, such as:
PROSPECTIVE PURCHASERS ARE URGED TO CONSULT THEIR TAX ADVISORS ABOUT THE APPLICATION OF THE U.S. FEDERAL TAX RULES TO THEIR PARTICULAR CIRCUMSTANCES AS WELL AS THE STATE, LOCAL AND FOREIGN TAX CONSEQUENCES TO THEM OF THE PURCHASE, OWNERSHIP AND DISPOSITION OF ORDINARY SHARES.
This discussion is based on the U.S. Internal Revenue Code of 1986, as amended, or the Code. This discussion is based on the Code, administrative pronouncements,income tax regulations promulgated thereunder, judicial decisionspositions, published positions of the Internal Revenue Service, or the IRS, and final, temporary and proposed Treasury regulations,other applicable authorities, all as in effect as of the date hereof. These lawshereof and all of which are subject to change, possibly with retroactive effect. This discussion is general in nature and can change on a retroactive basis. “U.S. Holder” means a beneficial owneris not exhaustive of shares that, forall possible tax considerations, nor does the discussion address any state, local or foreign tax considerations or any U.S. tax considerations (e.g., estate or gift tax) other than U.S. federal income tax considerations, that may be applicable to particular holders.
This discussion does not address all aspects of U.S. federal income taxation that may be relevant in light of particular circumstances, nor does it address the U.S. federal income tax consequences to persons who are subject to special rules under U.S. federal income tax law, including:
| · | banks, insurance companies or other financial institutions; |
| · | persons subject to the alternative minimum tax; |
| · | tax-exempt organizations; |
| · | controlled foreign corporations, passive foreign investment companies and corporations that accumulate earnings to avoid United States federal income tax; |
| · | certain former citizens or long-term residents of the United States; |
| · | dealers in securities or currencies; |
| · | traders in securities that elect to use a mark-to-market method of accounting for their securities holdings; |
| · | persons that own, or are deemed to own, more than five percent of our capital stock; |
| · | holders who acquired our stock as compensation or pursuant to the exercise of a stock option; |
| · | persons who hold our common stock as a position in a hedging transaction, “straddle,” or other risk reduction transaction; or |
| · | persons who do not hold our ordinary shares as a capital asset (within the meaning of Section 1221 of the Code). |
For purposes is:of this discussion, a U.S. holder is (i) an individual who is a citizen or resident of the United States;States for U.S. federal income tax purposes; (ii) a corporation, or other entity taxabletreated as a corporation for U.S. federal income tax purposes, created or organized in or under the laws of the United States (or treated as such under applicable U.S. tax laws), any state thereof, or any political subdivision thereof; orthe District of Columbia; (iii) an estate or trust the income of which is subject to U.S. federal income taxation,tax regardless of its source. This discussion assumessource; or (iv) a trust if (a) a U.S. court is able to exercise primary supervision over the administration of the trust and one or more U.S. persons have the authority to control all substantial decisions of the trust, or (b) it has a valid election in effect under applicable law and regulations to be treated as a U.S. person for U.S. federal income tax purposes. A non-U.S. holder is a holder that we are not, and will not become,is neither a passive foreign investment company,U.S. holder nor a partnership or other entity classified as a PFIC,partnership for U.S. federal income tax purposes.
In the case of a partnership or entity classified as a partnership for U.S. federal income tax purposes, as described below.
Taxation of Dividends
The gross amount of any distributions paid with respect to shares, other than certain pro rata distributions of shares, generally will be treated as foreign source dividend income forthe U.S. federal income tax purposes.treatment of a partner generally will depend on the status of the partner and the activities of the partnership. Partners of partnerships should consult their tax advisors regarding the U.S. Holders willfederal income tax consequences to them of the merger or of the ownership and disposition of our ordinary shares.
Distributions
We do not be entitled to claim a dividends-received deduction with respect tocurrently anticipate paying distributions on our ordinary shares. In the event that distributions are paid, by us. Dividendshowever, the gross amount of such distributions will be included in athe gross income of the U.S. Holder’sholder as dividend income on the date of suchreceipt to the extent that the distribution is paid out of current or accumulated earnings and profits, as determined under U.S. Holder’s receipt of the dividend.
If you are a non-corporate U.S. Holder, subject to applicable limitations, you mayfederal income tax principles. Such dividends will be eligible for the dividends-received deduction allowed to be taxed at a maximum rate of 15%corporations in respect of dividends received in taxable years beginning before January 1, 2011. Please consult your tax advisors to determine whether you are subject to any special rules that limit your ability to be taxed at this favorable rate.
In the event that we are deemed to be a Chinese “resident enterprise” under PRC tax law, youfrom other U.S. corporations. Dividends received by non-corporate U.S. holders, including individuals, may be subject to reduced rates of taxation under current law. A U.S. holder may be eligible to claim a foreign tax credit with respect to any PRC withholding taxestax imposed on dividends paid to you with respect to the ordinary shares. In addition, subject to certain conditions and limitations, PRC withholding taxes on dividends not in excess of the rate allowed under the income tax treaty between the United States and the PRC, or the Treaty, if applicable, may be treated as foreign taxes eligible for credit against your U.S. federal income tax liability. The rules governingby us. However, the foreign tax credit rules are complex. You are urgedcomplex, and their application in connection with Section 7874 of the Code and the Agreement Between the Government of the United States of America and the Government of the People’s Republic of China for the Avoidance of Double Taxation and the Prevention of Tax Evasion with Respect to Taxes on Income, or the U.S.-PRC Tax Treaty, is not entirely clear at this time. U.S. holders should consult yourtheir own tax advisors regarding the availability ofwith respect to any benefits they may be entitled to under the foreign tax credit in light of your particular circumstances.rules and the U.S.-PRC Tax Treaty.
TaxationTo the extent that dividends paid on our ordinary shares exceed current and accumulated earnings and profits, the distributions will be treated first as a tax-free return of Capital Gainstax basis on our ordinary shares, and to the extent that the amount of the distribution exceeds tax basis, the excess will be treated as gain from the disposition of those ordinary shares.
UponSale or Other Disposition
U.S. holders of our ordinary shares will recognize taxable gain or loss on any sale, exchange, or other taxable disposition of ordinary shares equal to the difference between the amount realized for the ordinary shares and the U.S. holder’s tax basis in the ordinary shares. This gain or loss generally will be capital gain or loss. Under current law, non-corporate U.S. holders, including individuals, are eligible for reduced tax rates if the ordinary shares have been held for more than one year. The deductibility of capital losses is subject to limitations. A U.S. holder may be eligible to claim a foreign tax credit with respect to any PRC withholding tax imposed on gain from the sale or other disposition of the ordinary shares, a U.S. Holder will generally recognize capital gain or loss for U.S. federal income tax purposes in an amount equal to the difference between such holder’s tax basis in the shares sold or disposed of and the amount realized on the sale or other disposition. Such gain or loss will be long-term capital gain or loss if the U.S. Holder has held the shares for more than one year and will generally be U.S. source gain or loss for foreign tax credit purposes.shares. However, if we are deemed to be a Chinese “resident enterprise” under PRC tax law, gains on disposal may be subject to PRC tax. In that event, a U.S. Holder may be eligible for the benefits of the Treaty. Under the Treaty, if any PRC tax were to be imposed on any gain from the disposition of the shares, the gain would be treated as PRC source income. We urge you to consult your tax advisors regarding the tax consequences if a foreign tax is imposed on gain on a disposition of our shares, including the availability of the foreign tax credit rules are complex, and their application in lightconnection with Section 7874 of your particular circumstances.the Code and the U.S.-PRC Tax Treaty is not entirely clear at this time. U.S. holders should consult their own tax advisors with respect to any benefits they may be entitled to under the foreign tax credit rules and the U.S.-PRC Tax Treaty.
Passive Foreign Investment Company Rules (PFIC)Unearned Income Medicare Contribution
We believe that we were not a PFIC for United States federal incomeCertain U.S. holders who are individuals, trusts or estates are required to pay an additional 3.8% Medicare tax purposes for our taxable year ended June 30, 2012. However, since PFIC status depends upon the composition of a company’s incomeon, among other things, dividends on and assets and the market value of its assets (including goodwill)capital gains from time to time, there can be no assurance that we will not be a PFIC for any taxable year.
In general, if we were a PFIC for any taxable year during which a U.S. Holder held shares, gain recognized by such U.S. Holder on a sale or other disposition (including certain pledges) of the shares would be allocated ratably over the U.S. Holder’s holding period for the shares. The amounts allocated to the taxable year of the sale or other disposition and to any year before we became a PFIC would be taxed as ordinary income. The amount allocated to each other taxable year would be subject to tax at the highest rate in effect for individuals or corporations, as appropriate, for such taxable year, and an interest charge would be imposed on the amount allocated to such taxable year. Similar rules would apply to any distribution in respect of shares in excess of 125%stock for taxable years beginning after December 31, 2013. U.S. holders should consult their own advisors regarding the effect, if any, of this legislation on their ownership and disposition of our ordinary shares.
Foreign Account Tax Compliance
The Foreign Account Tax Compliance provisions of the average of the annual distributions on shares received byHiring Incentives to Restore Employment Act (generally referred to as “FATCA”), when applicable, will impose a U.S. Holder duringfederal withholding tax of 30% on certain “withholdable payments” (generally certain U.S.-source income, including dividends, and the preceding three yearsgross proceeds from the sale or such holder’s holding period, whicheverother disposition of assets producing U.S. source dividends or interest ) to foreign financial institutions and other non-U.S. entities that fail to comply with certain certification and information reporting (generally relating to ownership by U.S persons of interests in or accounts with those entities). The obligation to withhold under FATCA applies to, among other items, (i) U.S.-source dividend income that is shorter. Certain elections may be availablepaid on or after July 1, 2014 and (ii) to gross proceeds from the disposition of property that would result in alternative treatments (such as a mark-to-market treatment) of the shares. U.S. Holderscan produce U.S.-source dividends paid on or after January 1, 2017. Non-U.S. holders should consult their tax advisersadvisors concerning application of FATCA to determine whether such elections are available and, if so, what the consequences of the alternative treatments would beour ordinary shares in those holders'their particular circumstances.
| 86 |
Information Reporting and Backup Withholding
PaymentPayments of dividends and salesor of proceeds that areon the disposition of stock made within the United States or through certain U.S.-related financial intermediaries generally areto a holder of our ordinary shares may be subject to information reporting and to backup withholding at a current rate of 28% unless (i) the U.S. Holder is a corporation or other exempt recipient or (ii) in the case of backup withholding, the U.S. Holdersuch holder provides a correct taxpayer identification number and certifies thaton IRS Form W-9 (or other appropriate withholding form) or establishes an exemption from backup withholding, does not apply.for example by properly certifying the holder’s non-U.S. status on a Form W-8BEN or another appropriate version of IRS Form W-8. Payments of dividends to holders must generally be reported annually to the IRS, along with the name and address of the holder and the amount of tax withheld, if any. A similar report is sent to the holder. Pursuant to applicable income tax treaties or other agreements, the IRS may make these reports available to tax authorities in the holder’s country of residence.
The amount of any backupBackup withholding from a payment to a U.S. Holder will be allowed as a credit againstis not an additional tax; rather, the U.S. Holder’s U.S. federal income tax liability andof persons subject to backup withholding will be reduced by the amount of tax withheld. If withholding results in an overpayment of taxes, a refund or credit may entitlegenerally be obtained from the U.S. Holder to a refund,IRS, provided that the required information is furnished to the Internal Revenue Service.IRS in a timely manner.
F. Dividends and Paying Agents
| F. | Dividends and Paying Agents |
Not applicableapplicable.
G. Statement by Expert
| G. | Statement by Expert |
Not applicableapplicable.
H. Documents on Display
| H. | Documents on Display |
We have filed this Annual Report on Form 20-F with the SEC under the Exchange Act. Statements made in this Annual Report as to the contents of any document referred to are not necessarily complete. With respect to each such document filed as an exhibit to this Annual Report, reference is made to the exhibit for a more complete description of the matter involved, and each such statement shall be deemed qualified in its entirety by such reference.
We are subject to the informational requirements of the Exchange Act as a foreign private issuer and file reports and other information with the SEC. Reports and other information filed by us with the SEC, including this Annual Report on Form 20-F, may be inspected and copied at the public reference room of the SEC at 100 F. Street, N.E., Washington D.C. 20549. You can also obtain copies of this Annual Report on Form 20-F by mail from the Public Reference Section of the SEC, 100 F. Street, N.E., Washington D.C. 20549, at prescribed rates. Additionally, copies of this material may be obtained from the SEC’s Internet site athttp://www.sec.gov. The SEC’s telephone number is 1-800-SEC-0330.
As a foreign private issuer, we are exempt from the rules under the Exchange Act prescribing the furnishing and content of quarterly reports and proxy statements, and officers, directors and principal shareholders are exempt from the reporting and short-swing profit recovery provisions contained in Section 16 of the Exchange Act.
I. Subsidiary Information
| I. | Subsidiary Information |
For a listing of our subsidiaries, see “Item 4. Information on the Company – C. Organizational Structure”.Not applicable.
| ITEM 11. | QUANTITATIVE AND QUALITATIVE DISCLOSURES ABOUT MARKET RISK |
ITEM 11. QUANTITATIVE AND QUALITATIVE DISCLOSURES ABOUT MARKET RISK
Interest Rate Risk
We are exposed to interest rate risk primarily with respect to our bank loans. A hypothetical 1.0% increase in the annual interest rates for all of our credit facilities under which we had outstanding borrowings as of June 30, 2012,2014, would decrease income before income taxes by approximately $0.3 million for the fiscal year ended June 30, 2012.2014. Management monitors the banks’ prime rates in conjunction with our cash requirements to determine the appropriate level of debt balances relative to other sources of funds. We have not entered into any hedging transactions in an effort to reduce our exposure to interest rate risk.
Foreign Exchange Risk
While our reporting currency is the U.S. dollar, more than 90%78.6% of our consolidated revenues and consolidated costs and expenses are denominated in RMB, and more than 95%93.5% of our assets are denominated in RMB, and the remaining are mainly denominated in SGD. As a result, we are exposed to foreign exchange risk as our revenues and results of operations may be affected by fluctuations in the exchange rate betweenrates of the U.S. dollars,dollar, RMB and SGD. If the RMB or SGD depreciates against the U.S. dollar, the value of our RMB or SGD revenues, earnings and assets as expressed in our U.S. dollar financial statements will decline. Assets and liabilities are translated at exchange rates at the balance sheet dates and revenue and expenses are translated at the average exchange rates and shareholders’ equity is translated at historical exchange rates. Any resulting translation adjustments are not included in determining net income but are included in determining other comprehensive income, a component of shareholders’ equity. An average appreciation (depreciation) of the RMB or SGD against the US dollar of 5% would increase (decrease) our comprehensive income by $1.5 million or $63 thousand, respectively,$1,611,780, and an average appreciation (depreciation) of the SGD against the US dollar of 5% would decrease (increase) our comprehensive income by $17,742, based on our outstanding revenues, costs and expenses, assets, and liabilities denominated in RMB or SGD as of June 30, 2012.2014.
Very limited hedging transactions are available in China to reduce our exposure to exchange rate fluctuations.fluctuations for the RMB. To date, we have not entered into any hedging transactions in an effort to reduce our exposure to foreign currency exchange risk.risk in any of the currencies in which we operate. While we may enter into hedging transactions in the future, the availability and effectiveness of these transactions may be limited, and it may not be able to successfully hedge our exposure at all. In addition, our foreign currency exchange losses may be magnified by PRC exchange control regulations that restrict its ability to convert RMB into foreign currencies.
Inflation
Inflation in China and the other regions in which we operate has not materially impacted our results of operations. According to the National Bureau of Statistics of China, the annual average percent changes in the consumer price index in China for 2009, 2010 and 2011 were a decrease of 0.7%, an increase of 3.3% and an increase of 5.4%, respectively. The year-over-year percent changes in the consumer price index for January 2010, 2011 and 2012 were increases of 1.5%, 4.9% and 4.5%, respectively. Although we have not been materially affected by inflation in the past, we can provide no assurance that we will not be affected in the future by higher rates of inflation. To the extent that we operate in a more diverse range of countries and regions, the risk of inflation on our operations is minimized. If inflation were a significant factor in China. For example,our financial performance, then certain operating costs and expenses, such as employee compensation and office operating expenses may increase as a result of higher inflation.increase. Additionally, because a substantial portion of our assets from time to time consists of cash and cash equivalents and time deposits with original maturities over three months, high inflation could significantly reduce the value and purchasing power of these assets. We are not able to hedge our exposure to higher inflation in China.
ITEM 12. DESCRIPTION OF SECURITIES OTHER THAN EQUITY SECURITIES
| ITEM 12. | DESCRIPTION OF SECURITIES OTHER THAN EQUITY SECURITIES |
Not applicable.
ITEM 13. DEFAULTS, DIVIDEND ARREARAGES AND DELINQUENCIES
| ITEM 13. | DEFAULTS, DIVIDEND ARREARAGES AND DELINQUENCIES |
None.
ITEM 14. MATERIAL MODIFICATIONS TO THE RIGHTS OF SECURITIES HOLDERS AND USE OF PROCEEDS
| ITEM 14. | MATERIAL MODIFICATIONS TO THE RIGHTS OF SECURITIES HOLDERS AND USE OF PROCEEDS |
In August 2010 our Board of Directors adopted the 2010 Rights Plan. The 2010 Rights Plan provides for a dividend distribution of one preferred share purchase Right, for each outstanding ordinary share. Each Right entitles the shareholder to buy 1 share of our Class A Preferred Stock at an exercise price of $160. The Rights will become exercisable if a person or group announces an acquisition of 20% or more of our outstanding ordinary shares, or announces commencement of a tender offer for 20% or more of the ordinary shares. In that event, the Rights permit shareholders, other than the acquiring person, to purchase our ordinary shares having a market value of twice the exercise price of the Rights, in lieu of the Class A Preferred Stock. In addition, in the event of certain business combinations, the Rights permit the purchase of the ordinary shares of an acquiring person at a 50% discount. Rights held by the acquiring person become null and void in each case. Unless terminated earlier by our Board of Directors, the 2010 Rights Plan will expire on September 27, 2020.
In connection with the adoption of the 2010 Rights Plan, we amended our Memorandum and Articles of Association to increase our authorized shares of Class A Preferred Stock from 10,000,000 shares to 90,000,000 shares, and to provide that directors may only be removed by shareholders for cause.
ITEM 15. CONTROLS AND PROCEDURES
| ITEM 15. | CONTROLS AND PROCEDURES |
Disclosure Controls and Procedures
As required by Rule 13a-15(e) and 15d-15(e) under the Securities Exchange Act, our management has carried out an evaluation, with the participation and under the supervision of our chief executive officer and chief financial officer, of the effectiveness of the design and operation of our disclosure controls and procedures as of June 30, 2012.2014.
Disclosure controls and procedures refer to controls and other procedures designed to ensure that information required to be disclosed in the reports we file or submit under the Securities Exchange Act is recorded, processed, summarized and reported within the time periods specified in the rules and forms of the SEC and that such information is accumulated and communicated to our management, including our chief executive officer and chief financial officer, as appropriate, to allow timely decisions regarding required disclosure. In designing and evaluating our disclosure controls and procedures, management recognizes that any controls and procedures, no matter how well designed and operated, can provide only reasonable assurance of achieving the desired control objectives, and management is required to apply its judgment in evaluating and implementing possible controls and procedures.
Management conducted its evaluation of disclosure controls and procedures under the supervision of our chief executive officer and our chief financial officer. Based upon, and as of the date of this evaluation, our chief executive officer and chief financial officer concluded that our disclosure controls and procedures were effective as of June 30, 2012.2014.
Management’s Annual Report on Internal Control over Financial Reporting
Our management is responsible for establishing and maintaining adequate internal control over financial reporting, as such term is defined in Rules 13a-15(f) and 15d-15(f) under the Exchange Act for our company. Internal control over financial reporting is a process designed to provide reasonable assurance regarding the reliability of financial reporting and the preparation of consolidated financial statements in accordance with generally accepted accounting principles and includes those policies and procedures that (1) pertain to the maintenance of records that, in reasonable detail, accurately and fairly reflect the transactions and dispositions of a company’s assets, (2) provide reasonable assurance that transactions are recorded as necessary to permit preparation of consolidated financial statements in accordance with generally accepted accounting principles, and that a company’s receipts and expenditures are being made only in accordance with authorizations of a company’s management and directors and (3) provide reasonable assurance regarding prevention or timely detection of unauthorized acquisition, use or disposition of a company’s assets that could have a material effect on the consolidated financial statements.
Because of its inherent limitations, a system of internal control over financial reporting can provide only reasonable assurance with respect to consolidated financial statement preparation and presentation and may not prevent or detect misstatements. Also, projections of any evaluation of effectiveness to future periods are subject to the risk that controls may become inadequate because of changes in conditions, or that the degree of compliance with the policies and procedures may deteriorate.
Our management assessed the effectiveness of our internal control over financial reporting as of June 30, 2012.2014. In making this assessment, our management used the criteria set forth by the Committee of Sponsoring Organizations of the Treadway Commission (COSO) in Internal Control-Integrated Framework. Our management’s assessment of and conclusion on the effectiveness of internal control over financial reporting did not include the internal controls of Concord, which is included in the Company’s 2012 consolidated financial statements, and constituted $54.5 million and $43.7 million of total and net assets, respectively, as of June 30, 2012, and $24.2 million and $1.9 million of net revenues and net income, respectively.Framework (1992 framework). Based on our assessment, management believes that, as of June 30, 2012,2014, our internal control over financial reporting was effective based on those criteria.
Our independent registered public accounting firm has audited our internal control over financial reporting as of June 30, 20122014 and has issued an attestation report,, which appears on F-3 of this annual report on Form 20-F.
Changes in Internal Control over Financial Reporting
Except for the controls that are being implemented in Concord which was acquired effective as of July 1, 2011,there
There has been no change in our internal control procedure over financial reporting during the year ended June 30, 2012,2014 that has materially affected, or is reasonably likely to materially affect, our internal control over financial reporting. In respectThe Company is now in the process of Concord, duringimplementing a SAP enterprise resource planning (“ERP”) system and is evaluating the fiscalimpact on the internal control over financial reporting for the year ended June 30, 2012, management has implemented and is continuing to implement changes in2015, arising from the controls over financial reporting to enable management to assess their effectiveness inapplication of the future under the criteria of COSO. Additional controls are being implemented at the parent level so as to be able to monitor and assess the internal controls over financial reporting of Concord.new system.
| ITEM 16A. | AUDIT COMMITTEE FINANCIAL EXPERT |
ITEM 16A. AUDIT COMMITTEE FINANCIAL EXPERT
Our board of directors has determined that Mr. Colin Sung, one of our independent directors, meets the criteria for an “audit committee financial expert,” as established by the SEC. Mr. Sung will not be deemed an “expert” for any other purpose, including, without limitation, for purposes of Section 11 of the Securities Act, as a result of being designated or identified as an audit committee financial expert. The designation or identification of Mr. Sung as an audit committee financial expert does not impose on him any duties, obligations or liability that are greater than the duties, obligations and liability imposed on him as a member of our Audit Committee and board of directors in the absence of such designation or identification.
ITEM 16B. CODE OF ETHICS
| ITEM 16B. | CODE OF ETHICS |
In March 2006, our board of directors adopted a code of conduct, or Code of Conduct, which applies to all of our directors, officers and employees, including our principal executive officer, principal financial officer, and principal accounting officer. Our Code of Conduct addresses, among other things, honesty and ethical conduct, conflicts of interest, compliance with laws, regulations and policies, confidentiality, and reporting of violations of the code. A copy of the Code of EthicsConduct was filed as Annex G to our registration statement on Form S-4 filed with the SEC on March 30, 2006 and is incorporated herein by reference. Our Code of Conduct is also posted on the corporate governance page of our website atwww.hollysys.com. During the fiscal year ended June 30, 2014, there were no waivers from a provision of our Code of Conduct granted to our directors, officers or employees.
| ITEM 16C. |
ITEM 16C.
Audit Fees
Audit Fees
TheErnst &Young Hua Ming LLP was our principal accountantsaccountant for the fiscal years ended June 30, 20122014 and 2011, wereErnst &Young Hua Ming LLP and BDO Limited, respectively.2013. The aggregate fees billed for each of the fiscal years ended June 30, 20122014 and 20112013 for professional services rendered by the principal accountant for the audit of our annual financial statements or services that are normally provided by the accountant in connection with statutory and regulatory filings or engagements for the fiscal years ended June 30, 20122014 and 20112013 were $830,000 $470,000,$935,446 and $843,868, respectively.
Audit-Related Fees
The fees for procedures ofrelated to our quarterly financial information infor the fiscal year ended June 30, 20122014 and 2011,2013 were $100,000$154,552 and $ 80,000,$100,309, respectively, paid to BDO Limited.Ernst &Young Hua Ming LLP.
Tax Fees
The aggregate fees billed in each of the fiscal years ended June 30, 20122014 and 20112013 for professional services rendered by the principal accountant for tax compliance, tax advice and tax planning were $6,917$47,504 and nil,$16,042, respectively.
All Other Fees
The aggregate fees billed in each of the fiscal years ended June 30, 20122014 and 20112013 for products and services provided by the principal accountant, other than the services reported above under other captions of this Item 16C arewere nil and nil,$359,520, respectively. The other fees for fiscal year 2013 consist of: (i) a service fee of $160,494 for financial and tax due diligence service for the acquisition of Bond, (ii) a service fee of $159,220 for review and report on the consolidated balance sheet of Bond as of April 1, 2013, and (iii) a service fee of $39,805 for XBRL related service for the Company’s XBRL exhibit for fiscal year 2013.
Audit Committee Pre-Approval Policies and Procedures
Our Audit Committee pre-approves all auditing services and permitted non-audit services to be performed for us by our independent auditor, including the fees and terms thereof (subject to the de minimums exceptions for non-audit services described in Section 10A(i)(l)(B) of the Exchange Act that are approved by our Audit Committee prior to the completion of the audit).
ITEM 16D. EXEMPTIONS FROM THE LISTING STANDARDS FOR AUDIT COMMITTEES
| ITEM 16D. | EXEMPTIONS FROM THE LISTING STANDARDS FOR AUDIT COMMITTEES |
We have applied andnot asked for, nor have we been granted, an exemption from the applicable listing standards for following our corporate home country rule of the British Virgin Islands with respect to shareholder meeting’s time and interval with NASDAQ. Under our home country rule, we are not required to hold annual shareholder meeting unless there are issues requiring approval of general shareholder meeting.Audit Committee.
ITEM 16E. PURCHASES OF EQUITY SECURITIES BY THE ISSUER AND AFFILIATED PURCHASERS
| ITEM 16E. | PURCHASES OF EQUITY SECURITIES BY THE ISSUER AND AFFILIATED PURCHASERS |
There were no purchases of equity securities by us or by any of our affiliates during the period covered by this Annual Report.
ITEM 16F.
| ITEM 16F. | CHANGE IN REGISTRANT’S CERTIFYING ACCOUNTANT |
None.
On June 27, 2012, the Company engaged the accounting firm Ernst & Young Hua Ming LLP (“E&Y”), to replace BDO Limited (“BDO”). The resignation of BDO and the appointment of E&Y were approved by the Company’s Board of Directors (the “Board”) following approval by the Company’s Audit Committee.
BDO audited the Company’s financial statements for each of the two years ended June 30, 2011 and 2010. BDO’s reports on the Company’s financial statements for each of the two years ended June 30, 2011 and 2010 did not contain an adverse opinion or disclaimer of opinion, nor were they qualified or modified as to uncertainty, audit scope or accounting principles.
The audit reports of BDO on the effectiveness of internal control over financial reporting as of June 30, 2011 and 2010 did not contain any adverse opinion or disclaimer of opinion, nor was it qualified or modified as to uncertainty, audit scope, or accounting principles.
In connection with the audits of the Company’s consolidated financial statements for each of the two years in the period ended June 30, 2011, and in the subsequent interim period through June 27, 2012, the date of BDO’s resignation, there were no disagreements with BDO on any matter of accounting principles or practices, financial statement disclosure, or auditing scope or procedure, which disagreements if not resolved to the satisfaction of BDO would have caused them to make reference thereto in any reports on the financial statements for such period, nor have there been any reportable events (as defined in Form 20-F Item 16F(a)(1)(v)) that would require disclosure.
| ITEM 16G. | CORPORATE GOVERNANCE |
We filed a Current Reportare incorporated in the BVI and our corporate governance practices are governed by applicable BVI law as well as our memorandum and articles of association. In addition, because our ordinary shares are listed on Form 6-K with SEC on June 27, 2012,NASDAQ, we are subject to announceNASDAQ's corporate governance requirements.
NASDAQ Listing Rule 5620(a) requires each issuer to hold an annual meeting of shareholders no later than one year after the change of principal accountant, as disclosed above, and provided a copyend of the above-mentioned Form 6-Kissuer's fiscal year end. However, NASDAQ Listing Rule 5615(a)(3) permits a foreign private issuer like us to BDO and requestedfollow home country practices in lieu of certain requirements of Listing Rule 5600, provided that BDO furnish a letter addressed to the SEC stating whether it agrees with the above statements, and if not, stating the respectssuch foreign private issuer discloses in which it does not agree. A copy of the letter from BDO addressed to the SEC, dated June 27, 2012, was filed as an exhibit to the above-mentioned Form 6-Kits annual report filed with the SEC on June 27, 2012.
For each requirement of Rule 5600 that it does not follow and describes the two yearshome country practice followed in the period ended June 30, 2011, and the subsequent period prior to the appointmentlieu of E&Y as the Company’s independent registered public accountants, neither we nor any person on our behalf consulted with E&Y regarding either (i) the application of accounting principles to a specific completed or contemplated transaction, or the type of audit opinion that might be rendered on our financial statements and no written or oral advice was provided by E&Y was an important factor considered by us in reaching a decision as to any accounting, auditing or financial reporting issue, or (ii) any matter that was the subject of a disagreement (as defined in Form 20-F Item 16F(a)(1)(iv) and the related instructions to such Item) or a reportable event (as described in Form 20-F Item 16F(a)(1)(v)).
ITEM 16G. CORPORATE GOVERNANCE
Our corporate governance practices have generally followed the requirements of NASDAQ listing rulesrequirement. We follow home country practice with respect to corporate governance.annual meetings and did not hold an annual shareholder meeting in fiscal 2014. Our BVI counsel, Maples and Calder, has provided a letter to NASDAQ certifying that under BVI law, we are not required to hold annual shareholder meetings. We may, however, hold annual shareholder meetings in the future if there are significant issues that require shareholders’ approvals.
| ITEM 16H. | MINE SAFETY DISCLOSURE |
Not applicable.
| ITEM 17. | FINANCIAL STATEMENTS |
We have elected to provide financial statements pursuant to Item 18.
| ITEM 18. | FINANCIAL STATEMENTS |
Our Audited Financial Statements for the Years Ended June 30, 2012, 20112014, 2013 and 20102012 are included at the end of this annual report.
| ITEM 19. | EXHIBITS |
| Number | Description | |
| 1.1 | Memorandum of Association of Registrant (Incorporated by reference to Annex B of the Proxy Statement/Prospectus contained in Registration Statement S-4 (file no. 333-132826) filed with the Securities and Exchange Commission on March 30, 2006). | |
| 1.2 | Articles of Association of Registrant (Incorporated by reference to Annex C of the Proxy Statement/Prospectus contained in Registration Statement S-4 (file no. 333-132826) filed with the Securities and Exchange Commission on March 30, 2006). | |
| 1.3 | Certificate of Change of Name (Incorporated by reference to Exhibit 1.3 of the Form 20-F filed with the Securities and Exchange Commission on September 30, 2009). | |
| 1.4 | Amendment to Memorandum and Articles of Association of Hollysys Automation Technologies Ltd. (Incorporated by reference to Exhibit 1.1 of the Form 6-K filed with the Securities and Exchange Commission on September 21, 2010). | |
| 2.1 | Rights Agreement, dated as of August 27, 2010, between Hollysys Automation Technologies Ltd. and Continental Stock Transfer & Trust Company, which includes the Form of Right Certificate as Exhibit A and the Summary of Rights to Purchase Preferred Shares as Exhibit B (Incorporated by reference to Exhibit 2.1 of the Form 6-K filed with the Securities and Exchange Commission on September 21, 2010). |
| Chardan North China Acquisition Corporation 2006 Stock Plan (Incorporated by reference to Exhibit 4.1 of the Registration Statement on Form S-8 (file no. 333-170811) filed with the Securities and Exchange Commission on November 24, 2010). | ||
| Form of Stock Consignment Agreement (Incorporated by reference to Exhibit 10.2 of the Registration Statement S-4/A (file no. 333-132826) filed with the Securities and Exchange Commission on June 28, 2006). | ||
| Share Sale and Purchase Agreement, by Unionway Resources Limited and the Company, dated December 23, 2009. ((Incorporated by reference to Exhibit 4.20 of the Report on Form 20-F for the fiscal year ended June 30, 2010 filed with the Securities and Exchange Commission on December 22, 2010). |
| 4.4 | Retrofit Contract between Concord Corporation Pte. Led. and Shaw Brothers Limited (Incorporated by reference to Exhibit 99.1 of the Form 6-K filed with the Securities and Exchange Commission on March 7, 2012). | |
| 8.1* | List of | |
| 11.1 | Code of Ethics (included as Annex G to the Proxy Statement/Prospectus contained in Registration Statement 333-132826 and incorporated by reference herein) | |
| 12.1* | CEO Certification Pursuant to Rule 13a-14(a) (17 CFR 240.13a-14(a)) (17 CFR 240.13a-14(a)) or Rule 15d-1(a) (17 CFR 240.15d-14(a)) | |
| 12.2* | CFO Certification Pursuant to Rule 13a-14(a) (17 CFR 240.13a-14(a)) or Rule 15d-1(a) (17 CFR 240.15d-14(a)) | |
| 13.1* | CEO Certification Pursuant to Section 906 of the Sarbanes-Oxley Act of 2002 | |
| 13.2* | CFO Certification Pursuant to Section 906 of the Sarbanes-Oxley Act of 2002 | |
| Consent of Ernst and Young Hua Ming | ||
| 101.INS* | XBRL Instant Document | |
| 101.SCH* | XBRL Taxonomy Extension Schema Document | |
| 101.CAL* | XBLR Taxonomy Extension Calculation Linkbase Document | |
| 101.DEF* | XBRL Taxonomy Extension Definition Linkbase | |
| 101.LAB* | XBRL Taxonomy Extension Label Linkbase | |
| 101.PRE* | XBRL Taxonomy Extension Presentation Linkbase |
* Filed with this annual report on Form 20-F
SIGNATURE
The registrant hereby certifies that it meets all of the requirements for filing on Form 20-F and that it has duly caused and authorized the undersigned to sign this amended annual report on its behalf.
| HOLLYSYS AUTOMATION TECHNOLOGIES LTD. | |
| / | |
| Date: | Chief Executive Officer |
| 94 |
HOLLYSYS AUTOMATION TECHNOLOGIES LTD.
Index to Consolidated Financial Statements
| Page | |
| Reports of Independent Registered Public Accounting | F-2 |
| Consolidated Balance Sheets as of June 30, | F-4 |
| Consolidated Statements of Comprehensive Income for the years ended June 30, 2012, 2013 and 2014 | F-5 |
| Consolidated Statements of | F-6 |
| Consolidated Statements of Stockholders’ Equity for the years ended June 30, 2012, 2013 and 2014 | F-7 |
| Notes to Consolidated Financial Statements |
REPORTOF INDEPENDENT REGISTERED PUBLIC ACCOUNTING FIRM
The Board of Directors and Shareholders of Hollysys Automation Technologies Ltd.
We have audited the accompanying consolidated balance sheetsheets of Hollysys Automation Technologies Ltd. (the “Company”) as of June 30, 2012,2014 and 2013, and the related consolidated statements of comprehensive income, stockholders’ equity, and cash flows for each of the yearthree years in the period ended June 30, 2012.2014. These financial statements are the responsibility of the Company’s management. Our responsibility is to express an opinion on these financial statements based on our audit.audits.
We conducted our auditaudits in accordance with the standards of the Public Company Accounting Oversight Board (United States). Those standards require that we plan and perform the audit to obtain reasonable assurance about whether the financial statements are free of material misstatement. An audit includes examining, on a test basis, evidence supporting the amounts and disclosures in the financial statements. An audit also includes assessing the accounting principles used and significant estimates made by management, as well as evaluating the overall financial statement presentation. We believe that our audit providesaudits provide a reasonable basis for our opinion.
In our opinion, the financial statements referred to above present fairly, in all material respects, the consolidated financial position of Hollysys Automation Technologies Ltd. at June 30, 2012,2014 and 2013, and the consolidated results of its operations and its cash flows for each of the yearthree years in the period ended June 30, 2012,2014, in conformity with U.S. generally accepted accounting principles.
We also have audited, in accordance with the standards of the Public Company Accounting Oversight Board (United States), Hollysys Automation Technologies Ltd.’s internal control over financial reporting as of June 30, 2012,2014, based on criteria established in Internal Control - Integrated Framework issued by the Committee of Sponsoring Organizations of the Treadway Commission (1992 framework) and our report dated October 12, 2012September 29, 2014, expressed an unqualified opinion thereon.
/S/s/ Ernst & Young Hua Ming LLP
Beijing, the People’s Republic of China
October 12, 2012
September 29, 2014
REPORTOF INDEPENDENT REGISTERED PUBLIC ACCOUNTING FIRM
The Board of Directors and Shareholders of Hollysys Automation Technologies Ltd.
We have audited Hollysys Automation Technologies Ltd.’s internal control over financial reporting as of June 30, 2012,2014, based on criteria established in Internal Control - Integrated Framework issued by the Committee of Sponsoring Organizations of the Treadway Commission (1992 framework) (the “COSO criteria”). Hollysys Automation Technologies Ltd.’s management is responsible for maintaining effective internal control over financial reporting, and for its assessment of the effectiveness of internal control over financial reporting included in the accompanying Management’s Annual Report on Internal Control over Financial Reporting. Our responsibility is to express an opinion on the company’sCompany’s internal control over financial reporting based on our audit.
We conducted our audit in accordance with the standards of the Public Company Accounting Oversight Board (United States). Those standards require that we plan and perform the audit to obtain reasonable assurance about whether effective internal control over financial reporting was maintained in all material respects. Our audit included obtaining an understanding of internal control over financial reporting, assessing the risk that a material weakness exists, testing and evaluating the design and operating effectiveness of internal control based on the assessed risk, and performing such other procedures as we considered necessary in the circumstances. We believe that our audit provides a reasonable basis for our opinion.
A company’s internal control over financial reporting is a process designed to provide reasonable assurance regarding the reliability of financial reporting and the preparation of financial statements for external purposes in accordance with generally accepted accounting principles. A company’s internal control over financial reporting includes those policies and procedures that (1) pertain to the maintenance of records that, in reasonable detail, accurately and fairly reflect the transactions and dispositions of the assets of the company; (2) provide reasonable assurance that transactions are recorded as necessary to permit preparation of financial statements in accordance with generally accepted accounting principles, and that receipts and expenditures of the company are being made only in accordance with authorizations of management and directors of the company; and (3) provide reasonable assurance regarding prevention or timely detection of unauthorized acquisition, use, or disposition of the company’s assets that could have a material effect on the financial statements.
Because of its inherent limitations, internal control over financial reporting may not prevent or detect misstatements. Also, projections of any evaluation of effectiveness to future periods are subject to the risk that controls may become inadequate because of changes in conditions, or that the degree of compliance with the policies or procedures may deteriorate.
As indicated in the accompanying Management’s Annual Report on Internal Control over Financial Reporting, management’s assessment of and conclusion on the effectiveness of internal control over financial reporting did not include the internal controls of Concord Corporation Pte. Ltd. which is included in the 2012 consolidated financial statements of Hollysys Automation Technologies Ltd. and constituted USD54.5 million and USD43.7 million of total and net assets, respectively, as of June 30, 2012, and USD24.2 million and USD1.9 million of net revenues and net income, respectively, for the year then ended. Our audit of internal control over financial reporting of Hollysys Automation Technologies Ltd. also did not include an evaluation of the internal control over financial reporting of Concord Corporation Pte. Ltd..
In our opinion, Hollysys Automation Technologies Ltd. maintained, in all material respects, effective internal control over financial reporting as of June 30, 2012,2014, based on the COSO criteria.
We also have audited, in accordance with the standards of the Public Company Accounting Oversight Board (United States), the consolidated balance sheetsheets of Hollysys Automation Technologies Ltd. as of June 30, 2012,2014 and 2013, and the related consolidated statements of comprehensive income, stockholders’ equity, and cash flows for each of the yearthree years in the period ended June 30, 20122014 of Hollysys Automation Technologies, Ltd. and our report dated October 12, 2012September 29, 2014 expressed an unqualified opinion thereon.
/S/s/ Ernst & Young Hua Ming LLP
Beijing, the People’s Republic of China
October 12, 2012
September 29, 2014
REPORT OF INDEPENDENT REGISTERED PUBLIC ACCOUNTING FIRM
To the Board of Directors and Stockholders of
Hollysys Automation Technologies Limited
We have audited the accompanying consolidated balance sheet of Hollysys Automation Technologies Ltd. and subsidiaries (the “Company”) as of June 30, 2011, and the related consolidated statements of comprehensive income, stockholders' equity and cash flows for the years ended June 30, 2010 and 2011. These financial statements are the responsibility of the Company's management. Our responsibility is to express an opinion on these financial statements based on our audits.
We conducted our audits in accordance with the standards of the Public Company Accounting Oversight Board (United States). Those standards require that we plan and perform the audit to obtain reasonable assurance about whether the financial statements are free of material misstatement. An audit includes examining, on a test basis, evidence supporting the amounts and disclosures in the financial statements, assessing the accounting principles used and significant estimates made by management, as well as evaluating the overall financial statement presentation. We believe that our audits provide a reasonable basis for our opinion.
In our opinion, the consolidated financial statements referred to above present fairly, in all material respects, the financial position of Hollysys Automation Technologies Ltd. and subsidiaries as of June 30, 2011, and the consolidated results of their operations and their cash flows for the years ended June 30, 2010 and 2011, in conformity with accounting principles generally accepted in the United States of America.
/S/ BDO Limited
Hong Kong
September 21, 2011
HOLLYSYS AUTOMATION TECHNOLOGIES LTD.
CONSOLIDATED BALANCE SHEETS
(In US dollars except for number of shares and per share data)
| June 30, | ||||||||||||
| Notes | 2011 | 2012 | ||||||||||
| ASSETS | ||||||||||||
| Current assets: | ||||||||||||
| Cash and cash equivalents | $ | 90,669,059 | $ | 96,332,962 | ||||||||
| Time deposits with original maturities over three months | - | 21,586,896 | ||||||||||
| Restricted cash | 4,115,733 | 5,544,273 | ||||||||||
| Accounts receivable, net of allowance for doubtful accounts of $10,691,810 and $14,287,361 as of June 30, 2011 and 2012, respectively | 5 | 98,002,235 | 136,589,994 | |||||||||
| Costs and estimated earnings in excess of billings,net of allowance for doubtful accounts of $1,232,813 and $1,890,108 as of June 30, 2011 and 2012, respectively | 6 | 103,515,659 | 115,161,236 | |||||||||
| Other receivables, net of allowance for doubtful accounts of $249,052 and $344,978 as of June 30, 2011 and 2012, respectively | 5,057,899 | 7,287,214 | ||||||||||
| Advances to suppliers | 7,818,493 | 10,300,182 | ||||||||||
| Amounts due from related parties | 22 | 12,175,447 | 16,336,558 | |||||||||
| Inventories | 4 | 27,972,600 | 26,745,225 | |||||||||
| Prepaid expenses | 1,018,841 | 876,363 | ||||||||||
| Income tax recoverable | 1,098,806 | 139,469 | ||||||||||
| Deferred tax assets | 20 | 2,021,466 | 772,061 | |||||||||
| Assets held for sale | 9 | 8,945,718 | - | |||||||||
| Total current assets | 362,411,956 | 437,672,433 | ||||||||||
| Non-current assets: | ||||||||||||
| Property, plant and equipment, net | 7 | 53,581,313 | 63,536,646 | |||||||||
| Prepaid land leases | 8 | 6,171,879 | 6,870,076 | |||||||||
| Acquired intangible assets, net | 10 | - | 594,971 | |||||||||
| Advance payment for acquisition of a subsidiary | 16,856,148 | - | ||||||||||
| Investments in equity investees | 12 | 15,596,090 | 13,080,929 | |||||||||
| Investments in cost investees | 12 | 2,975,062 | 2,996,638 | |||||||||
| Goodwill | 11 | - | 27,588,883 | |||||||||
| Deferred tax assets | 20 | 991,496 | 414,399 | |||||||||
| Total non-current assets | 96,171,988 | 115,082,542 | ||||||||||
| TOTAL ASSETS | $ | 458,583,944 | $ | 552,754,975 | ||||||||
| June 30, | ||||||||||
| Notes | 2013 | 2014 | ||||||||
| ASSETS | ||||||||||
| Current assets: | ||||||||||
| Cash and cash equivalents | $ | 112,228,579 | $ | 162,159,098 | ||||||
| Time deposits with maturities over three months | 20,858,840 | 28,334,126 | ||||||||
| Restricted cash | 3,390,144 | 8,359,000 | ||||||||
| Accounts receivable, net of allowance for doubtful accounts of $20,102,808 and $25,690,771 as of June 30, 2013 and 2014, respectively | 5 | 176,598,496 | 258,885,135 | |||||||
| Costs and estimated earnings in excess of billings, net of allowance for doubtful accounts of $2,361,880 and $5,839,403 as of June 30, 2013 and 2014, respectively | 6 | 143,752,978 | 179,688,181 | |||||||
| Other receivables, net of allowance for doubtful accounts of $322,218 and $333,562 as of June 30, 2013 and 2014, respectively | 11,722,535 | 11,039,350 | ||||||||
| Advances to suppliers | 8,593,175 | 11,588,354 | ||||||||
| Amounts due from related parties | 22 | 26,511,454 | 23,719,670 | |||||||
| Inventories | 4 | 34,104,057 | 35,053,243 | |||||||
| Prepaid expenses | 1,073,655 | 866,429 | ||||||||
| Income tax recoverable | 1,704,290 | 666,377 | ||||||||
| Deferred tax assets | 20 | 3,033,931 | 6,686,685 | |||||||
| Assets held for sale | 9 | 2,876,054 | 2,847,008 | |||||||
| Total current assets | 546,448,188 | �� | 729,892,656 | |||||||
| Non-current assets: | ||||||||||
| Restricted cash | 6,754,117 | 7,498,485 | ||||||||
| Prepaid expenses | 425,936 | 108,082 | ||||||||
| Property, plant and equipment, net | 7 | 79,496,315 | 82,344,825 | |||||||
| Prepaid land leases, net | 8 | 12,629,664 | 12,396,624 | |||||||
| Acquired intangible assets, net | 10 | 11,817,596 | 6,509,571 | |||||||
| Investments in equity investees | 12 | 16,063,731 | 15,062,054 | |||||||
| Investments in cost investees | 12 | 3,715,808 | 4,435,858 | |||||||
| Goodwill | 11 | 65,787,020 | 66,640,303 | |||||||
| Deferred tax assets | 20 | 1,494,551 | 1,806,047 | |||||||
| Total non-current assets | 198,184,738 | 196,801,849 | ||||||||
| Total assets | $ | 744,632,926 | $ | 926,694,505 | ||||||
| LIABILITIES AND STOCKHOLDERS’ EQUITY | ||||||||||
| Current liabilities: | ||||||||||
| Short-term bank loans | 14 | $ | 8,329,263 | $ | 4,493,846 | |||||
| Current portion of long-term bank loans | 15 | 8,671,080 | 8,517,268 | |||||||
| Accounts payable | 111,052,268 | 135,669,331 | ||||||||
| Construction costs payable | 5,872,553 | 4,902,651 | ||||||||
| Deferred revenue | 67,066,822 | 130,696,303 | ||||||||
| Accrued payroll and related expenses | 8,966,026 | 10,601,265 | ||||||||
| Income tax payable | 20 | 6,296,759 | 12,040,206 | |||||||
| Warranty liabilities | 13 | 1,865,784 | 4,013,521 | |||||||
| Other tax payables | 22,048,392 | 27,631,113 | ||||||||
| Accrued liabilities | 18,580,398 | 24,424,491 | ||||||||
| Amounts due to related parties | 22 | 2,080,869 | 3,988,408 | |||||||
| Deferred tax liabilities | 20 | 2,186,518 | 1,627,149 | |||||||
| Current portion of acquisition-related consideration | 5,435,451 | 30,285,478 | ||||||||
| Total current liabilities | 268,452,183 | 398,891,030 | ||||||||
| Long-term bank loans | 15 | 19,104,733 | 14,978,257 | |||||||
| Deferred tax liabilities | 20 | 3,272,698 | 2,371,468 | |||||||
| Warranty liabilities | 13 | 2,094,857 | 3,602,810 | |||||||
| Non-current portion of acquisition-related consideration | 36,233,460 | 14,793,062 | ||||||||
| Total non-current liabilities | 60,705,748 | 35,745,597 | ||||||||
| Total liabilities | 329,157,931 | 434,636,627 | ||||||||
| Commitments and contingencies | 23 | - | - | |||||||
| Stockholders’ equity: | ||||||||||
| Ordinary shares, par value $0.001 per share, 100,000,000 shares authorized and 57,554,824 shares issued and outstanding | 17 | 57,555 | 57,555 | |||||||
| Additional paid-in capital | 170,779,250 | 173,765,442 | ||||||||
| Statutory reserves | 23,146,671 | 23,288,778 | ||||||||
| Retained earnings | 182,873,145 | 252,350,621 | ||||||||
| Accumulated other comprehensive income | 36,871,667 | 39,012,151 | ||||||||
| Total Hollysys Automation Technologies Ltd. stockholder’s equity | 413,728,288 | 488,474,547 | ||||||||
| Noncontrolling interest | 1,746,707 | 3,583,331 | ||||||||
| Total equity | 415,474,995 | 492,057,878 | ||||||||
| Total liabilities and equity | $ | 744,632,926 | $ | 926,694,505 | ||||||
See accompanying notes to consolidated financial statements
HOLLYSYS AUTOMATION TECHNOLOGIES LTD.
CONSOLIDATED BALANCE SHEETS-ContinuedSTATEMENTS OF COMPREHENSIVE INCOME
(In US dollars except for number of shares and per share data)
| June 30, | ||||||||||||
| Notes | 2011 | 2012 | ||||||||||
| LIABILITIES AND EQUITY | ||||||||||||
| Current liabilities: | ||||||||||||
| Short-term bank loans | 14 | $ | 11,528,465 | $ | - | |||||||
| Current portion of long-term bank loans | 15 | 5,408,245 | 7,914,668 | |||||||||
| Accounts payable | 63,397,616 | 78,761,476 | ||||||||||
| Construction costs payable | 1,882,872 | 923,205 | ||||||||||
| Deferred revenue | 43,202,760 | 59,293,745 | ||||||||||
| Accrued payroll and related expenses | 6,181,626 | 6,448,623 | ||||||||||
| Income tax payable | 5,060,131 | 3,605,030 | ||||||||||
| Warranty liabilities | 13 | 2,798,800 | 3,575,920 | |||||||||
| Other tax payables | 12,547,517 | 18,225,344 | ||||||||||
| Accrued liabilities | 5,692,209 | 7,746,036 | ||||||||||
| Amounts due to related parties | 22 | 3,338,563 | 1,964,275 | |||||||||
| Deferred tax liabilities | 20 | - | 370,300 | |||||||||
| Total current liabilities | 161,038,804 | 188,828,622 | ||||||||||
| Non-current liabilities: | ||||||||||||
| Long-term bank loans | 15 | 31,676,865 | 24,641,374 | |||||||||
| Total non-current liabilities | 31,676,865 | 24,641,374 | ||||||||||
| Total liabilities | 192,715,669 | 213,469,996 | ||||||||||
| Commitments and contingencies | 23 | |||||||||||
| Equity: | ||||||||||||
| Ordinary shares, par value $0.001 per share, 100,000,000 shares authorized; 54,692,129 and 55,998,917 shares issued and outstanding as of June 30, 2011 and 2012, respectively | 17 | 54,693 | 55,999 | |||||||||
| Additional paid-in capital | 140,373,585 | 151,305,146 | ||||||||||
| Statutory reserves | 23,061,779 | 23,091,072 | ||||||||||
| Retained earnings | 74,741,788 | 130,934,342 | ||||||||||
| Accumulated other comprehensive income | 26,825,812 | 32,714,556 | ||||||||||
| Total Hollysys Automation Technologies Ltd. stockholders’ equity | 265,057,657 | 338,101,115 | ||||||||||
| Noncontrolling interests | 810,618 | 1,183,864 | ||||||||||
| Total equity | 265,868,275 | 339,284,979 | ||||||||||
| TOTAL LIABILITIES AND EQUITY | $ | 458,583,944 | $ | 552,754,975 | ||||||||
| Year ended June 30, | ||||||||||||||
| Notes | 2012 | 2013 | 2014 | |||||||||||
| Net revenues | ||||||||||||||
| Integrated contract revenue (including revenue from related parties of $5,256,870, $18,473,320 and $4,659,063 for the years ended June 30, 2012, 2013 and 2014, respectively) | $ | 304,967,477 | $ | 328,551,083 | $ | 478,261,196 | ||||||||
| Product sales (including revenue from related parties of $109,917, $1,083,803 and $1,628,661 for the years ended June 30, 2012, 2013 and 2014, respectively) | 16,736,455 | 20,503,919 | 31,921,551 | |||||||||||
| Revenue from services (including revenue from related parties of nil, nil and $497,390 for the years ended June 30, 2012, 2013 and 2014, respectively) | - | - | 11,149,099 | |||||||||||
| Total net revenues | 321,703,932 | 349,055,002 | 521,331,846 | |||||||||||
| Costs of integrated contracts (including purchases from related parties of $72,774, $526,588 and $363,991 for the years ended June 30, 2012, 2013 and 2014 respectively) | 189,152,826 | 218,586,778 | 330,038,563 | |||||||||||
| Costs of products sold | 6,204,356 | 6,799,536 | 11,580,031 | |||||||||||
| Costs of services rendered | - | - | 4,090,340 | |||||||||||
| Gross profit | 126,346,750 | 123,668,688 | 175,622,912 | |||||||||||
| Operating expenses | ||||||||||||||
| Selling (including expenses from related parties of nil, 948,561, and $1,953,276 for the years ended June 30, 2012, 2013 and 2014 respectively) | 27,636,866 | 26,793,752 | 28,257,497 | |||||||||||
| General and administrative | 26,025,459 | 29,647,665 | 39,716,156 | |||||||||||
| Research and development | 25,552,297 | 32,507,314 | 36,486,074 | |||||||||||
| VAT refunds and government subsidies | (18,306,056 | ) | (22,982,148 | ) | (27,243,844 | ) | ||||||||
| Total operating expenses | 60,908,566 | 65,966,583 | 77,215,883 | |||||||||||
| Income from operations | 65,438,184 | 57,702,105 | 98,407,029 | |||||||||||
| Other income (expenses), net (including other income from related parties of $45,475, $65,926 and $65,227 for the years ended June 30, 2012, 2013 and 2014, respectively) | 1,068,158 | 79,818 | (6,452,434 | ) | ||||||||||
| Foreign exchange gain (loss) | (275,341 | ) | 799,609 | 793,910 | ||||||||||
| Gain on disposal of long term investments | 2,043,977 | - | - | |||||||||||
| Share of net (loss) income of equity investees | (3,141 | ) | 297,177 | (2,692,052 | ) | |||||||||
| Interest income | 1,751,982 | 3,075,072 | 3,253,333 | |||||||||||
| Interest expenses | (3,097,754 | ) | (2,169,667 | ) | (1,998,311 | ) | ||||||||
| Dividend income from cost investees | - | 833,567 | - | |||||||||||
| Income before income taxes | 66,926,065 | 60,617,681 | 91,311,475 | |||||||||||
| Income tax expenses | 20 | 10,352,318 | 8,096,798 | 19,860,835 | ||||||||||
| Net income | 56,573,747 | 52,520,883 | 71,450,640 | |||||||||||
| Less: net income attributable to noncontrolling interest | 351,900 | 526,481 | 1,831,057 | |||||||||||
| Net income attributable to Hollysys Automation Technologies Ltd. | $ | 56,221,847 | $ | 51,994,402 | $ | 69,619,583 | ||||||||
| Other comprehensive income, net of tax of nil | ||||||||||||||
| Translation adjustments | $ | 5,910,090 | $ | 4,193,473 | $ | 2,146,051 | ||||||||
| Comprehensive income | 62,483,837 | 56,714,356 | 73,596,691 | |||||||||||
| Less: comprehensive income attributable to noncontrolling interest | 373,246 | 562,843 | 1,836,624 | |||||||||||
| Comprehensive income attributable to Hollysys Automation Technologies Ltd. | $ | 62,110,591 | $ | 56,151,513 | $ | 71,760,067 | ||||||||
| Net income per share: | �� | |||||||||||||
| Basic | 21 | $ | 1.01 | $ | 0.93 | $ | 1.20 | |||||||
| Diluted | 21 | $ | 1.01 | $ | 0.92 | $ | 1.19 | |||||||
| Shares used in income per share computation: | ||||||||||||||
| Weighted average number of ordinary shares | 55,659,765 | 56,167,592 | 57,926,333 | |||||||||||
| Weighted average number of diluted ordinary shares | 55,828,361 | 56,412,469 | 58,426,642 | |||||||||||
See accompanying notes to consolidated financial statements
HOLLYSYS AUTOMATION TECHNOLOGIES LTD.
CONSOLIDATED STATEMENTS OF COMPREHENSIVE INCOME
(In US dollars except for number of shares and per share data)
| Year Ended June 30, | ||||||||||||||||
| Notes | 2010 | 2011 | 2012 | |||||||||||||
| Net revenues | ||||||||||||||||
| Integrated contract revenue (including revenue from related parties of $6,360,381, $3,717,358 and $5,256,870 for the years ended June 30, 2010, 2011 and 2012, respectively) | $ | 164,118,183 | $ | 248,576,098 | $ | 304,967,477 | ||||||||||
| Products sales (including revenue from related parties of $34,589, $580,705, and $109,917 for the years ended June 30, 2010, 2011 and 2012, respectively) | 9,971,013 | 14,265,788 | 16,736,455 | |||||||||||||
| Total net revenues | 174,089,196 | 262,841,886 | 321,703,932 | |||||||||||||
| Costs of integrated contracts (including purchase from related parties of $5,462,744, $3,064,587, and $72,774 for the years ended June 30, 2010, 2011 and 2012 respectively) | 110,268,475 | 165,354,157 | 189,152,826 | |||||||||||||
| Costs of products sold | 3,668,899 | 6,359,013 | 6,204,356 | |||||||||||||
| Gross profit | 60,151,822 | 91,128,716 | 126,346,750 | |||||||||||||
| Operating expenses | ||||||||||||||||
| Selling | 12,152,019 | 20,445,846 | 27,636,866 | |||||||||||||
| General and administrative (including operating lease expense paid to a related party of $32,069, nil, and nil for the years ended June 30, 2010, 2011 and 2012, respectively) | 13,914,091 | 16,671,448 | 26,025,459 | |||||||||||||
| Research and development | 13,071,318 | 20,132,575 | 25,552,297 | |||||||||||||
| VAT refunds and government subsidies | (11,533,006 | ) | (10,811,919 | ) | (18,306,056 | ) | ||||||||||
| Total operating expenses | 27,604,422 | 46,437,950 | 60,908,566 | |||||||||||||
| Income from operations | 32,547,400 | 44,690,766 | 65,438,184 | |||||||||||||
| Other (expense) income, net (including other income from related parties of nil, nil, and $45,475 for the years ended June 30, 2010, 2011 and 2012, respectively) | (215,277 | ) | (208,093 | ) | 792,817 | |||||||||||
| Gain on disposal of investments in equity investees | - | 1,400,533 | 2,043,977 | |||||||||||||
| Gain in earnings for the issuance of shares by an equity investee | - | 756,619 | - | |||||||||||||
| Share of net income (loss) of equity investees | 3,958,073 | 2,847,866 | (3,141 | ) | ||||||||||||
| Interest income | 1,149,695 | 1,101,531 | 1,751,982 | |||||||||||||
| Interest expenses | (2,220,467 | ) | (2,680,141 | ) | (3,097,754 | ) | ||||||||||
| Income before income taxes | 35,219,424 | 47,909,081 | 66,926,065 | |||||||||||||
| Income tax expenses | 20 | 7,663,433 | 6,443,967 | 10,352,318 | ||||||||||||
| Net income | 27,555,991 | 41,465,114 | 56,573,747 | |||||||||||||
| Less: net income (loss) attributable to noncontrolling interests | 1,851,453 | (4,884 | ) | 351,900 | ||||||||||||
| Net income attributable to Hollysys Automation Technologies Ltd. stockholders | $ | 25,704,538 | $ | 41,469,998 | $ | 56,221,847 | ||||||||||
| Net income per ordinary share: | ||||||||||||||||
| Basic | 21 | $ | 0.50 | $ | 0.76 | $ | 1.01 | |||||||||
| Diluted | 21 | $ | 0.50 | $ | 0.75 | $ | 1.01 | |||||||||
| Weighted average ordinary shares used in income per share computation: | ||||||||||||||||
| Basic | 51,243,667 | 54,564,842 | 55,659,765 | |||||||||||||
| Diluted | 51,838,294 | 54,949,280 | 55,828,361 | |||||||||||||
| Other comprehensive income, net of tax | ||||||||||||||||
| Foreign currency translation adjustments, net of nil tax | $ | 1,219,809 | $ | 9,308,905 | $ | 5,910,090 | ||||||||||
| Comprehensive income | 28,775,800 | 50,774,019 | 62,483,837 | |||||||||||||
| Less: comprehensive income attributable to non-controlling interests | 1,876,297 | 35,753 | 373,246 | |||||||||||||
| Comprehensive income attributable to Hollysys Automation Technologies Ltd. stockholders | $ | 26,899,503 | $ | 50,738,266 | $ | 62,110,591 | ||||||||||
See accompanying notes to consolidated financial statements
HOLLYSYS AUTOMATION TECHNOLOGIES LTD.
CONSOLIDATED STATEMENTS OF CASH FLOWS
(In US dollars)
| Year ended June 30, | ||||||||||||
| 2010 | 2011 | 2012 | ||||||||||
| Cash flows from operating activities: | ||||||||||||
| Net income | $ | 27,555,991 | $ | 41,465,114 | $ | 56,573,747 | ||||||
| Adjustments to reconcile net income to net cash provided by (used in) operating activities: | ||||||||||||
| Depreciation of property, plant and equipment | 2,538,048 | 4,334,113 | 6,054,199 | |||||||||
| Amortization of prepaid land leases | 144,994 | 134,479 | 171,204 | |||||||||
| Amortization of intangible assets | - | - | 1,362,282 | |||||||||
| Allowance for doubtful accounts | 2,790,078 | 2,816,320 | 4,434,129 | |||||||||
| Loss (gain) on disposal of property, plant and equipment | 14,112 | (166,177 | ) | 196,117 | ||||||||
| Impairment loss on goodwill | 286,610 | - | - | |||||||||
| Impairment loss on property, plant and equipment | 715,246 | 23,711 | - | |||||||||
| Impairment loss on investment in an equity investee | 152,732 | - | - | |||||||||
| Impairment loss on investment in a cost investee | - | 165,948 | - | |||||||||
| Share of net (income) loss from equity investees | (3,958,073 | ) | (2,847,866 | ) | 3,141 | |||||||
| Gain on disposal of investments in equity investees | - | (1,400,533 | ) | (2,043,977 | ) | |||||||
| Gain in earnings for the issuance of shares by an equity investee | - | (756,619 | ) | - | ||||||||
| Amortization of expenses accrued for bond payable | 61,281 | 31,531 | - | |||||||||
| Share based compensation expenses | 524,076 | 551,966 | 1,139,368 | |||||||||
| Deferred income tax (benefit) expenses | (885,014 | ) | (1,297,968 | ) | 1,713,253 | |||||||
| Changes in operating assets and liabilities: | ||||||||||||
| Accounts receivable | (10,131,840 | ) | (30,227,617 | ) | (29,288,766 | ) | ||||||
| Costs and estimated earnings in excess of billings | (10,191,299 | ) | (42,587,603 | ) | (12,302,872 | ) | ||||||
| Inventories | (4,716,959 | ) | (3,256,130 | ) | 2,412,298 | |||||||
| Advances to suppliers | (2,598,327 | ) | 3,384,430 | (1,814,764 | ) | |||||||
| Other receivables | (93,051 | ) | (685,398 | ) | 4,132,144 | |||||||
| Deposits and other assets | 1,497,584 | 506,365 | (1,118,873 | ) | ||||||||
| Due from related parties | (3,143,615 | ) | (336,128 | ) | (2,871,070 | ) | ||||||
| Accounts payable | 5,032,941 | 18,481,215 | 8,838,803 | |||||||||
| Deferred revenue | 12,480,428 | 7,994,334 | 14,392,486 | |||||||||
| Accruals and other payable | 5,953,753 | 2,113,829 | 2,966,928 | |||||||||
| Due to related parties | 1,145,916 | (457,800 | ) | (344,006 | ) | |||||||
| Income tax payable | 3,489,790 | (1,167,314 | ) | (2,871,713 | ) | |||||||
| Other tax payables | 1,480,414 | 1,390,307 | 5,445,154 | |||||||||
| Net cash provided by (used in) operating activities | $ | 30,145,816 | $ | (1,793,491 | ) | $ | 57,179,212 | |||||
| Cash flows from investing activities: | ||||||||||||
| Time deposits placed with banks | - | - | (39,012,896 | ) | ||||||||
| Purchases of property, plant and equipment | (20,918,968 | ) | (16,045,183 | ) | (8,250,146 | ) | ||||||
| Maturity of time deposits | - | - | 17,426,000 | |||||||||
| Proceeds from disposal of property, plant and equipment | 9,251 | 12,574 | 3,276,341 | |||||||||
| Proceeds from disposal of investments in equity investees | - | 3,726,997 | 4,439,707 | |||||||||
| Receipts from collection of advances to equity investees | 653,325 | 27 | - | |||||||||
| Investment of an equity investee | - | - | (474,316 | ) | ||||||||
| Investment of a cost investee | (1,001,569 | ) | - | - | ||||||||
| Dividends from equity investees | 58,640 | 90,517 | - | |||||||||
| Acquisition of a subsidiary, net of cash acquired | (279,120 | ) | - | (5,296,855 | ) | |||||||
| Cash prepaid for acquisition of a subsidiary | - | (16,856,148 | ) | - | ||||||||
| Net cash used in investing activities | (21,478,441 | ) | (29,071,216 | ) | (27,892,165 | ) | ||||||
| Cash flows from financing activities: | ||||||||||||
| Repayments of bonds payable | $ | - | $ | (12,068,913 | ) | $ | - | |||||
| Proceeds from short-term bank loans | 1,465,996 | 15,671,580 | 563,736 | |||||||||
| Repayments of short-term bank loans | (5,863,985 | ) | (5,924,784 | ) | (12,314,261 | ) | ||||||
| Repayments of long-term bank loans | (5,130,987 | ) | (1,508,614 | ) | (6,012,895 | ) | ||||||
| Cash injected by noncontrolling interests | 718,338 | - | - | |||||||||
| Acquisition of equity interests from noncontrolling interests | (10,373,600 | ) | - | - | ||||||||
| Proceeds from exercise of share options | - | 1,070,700 | 672,000 | |||||||||
| Repayment of amounts due to the former shareholders of a subsidiary | - | - | (8,243,700 | ) | ||||||||
| Net cash used in financing activities | (19,184,238 | ) | (2,760,031 | ) | (25,335,120 | ) | ||||||
| Effect of foreign exchange rate changes | 1,136,142 | 4,791,852 | 1,711,976 | |||||||||
| Net (decrease) increase in cash and cash equivalents | $ | (9,380,721 | ) | $ | (28,832,886 | ) | $ | 5,663,903 | ||||
| Cash and cash equivalents, beginning of year | 128,882,666 | 119,501,945 | 90,669,059 | |||||||||
| Cash and cash equivalents, end of year | $ | 119,501,945 | $ | 90,669,059 | $ | 96,332,962 | ||||||
| Supplementary disclosures of cash flow information: | ||||||||||||
| Cash paid during the year for: | ||||||||||||
| Interest | $ | 2,227,667 | $ | 2,680,141 | $ | 3,031,593 | ||||||
| Income tax | $ | 5,074,938 | $ | 7,109,057 | $ | 11,144,407 | ||||||
| Supplementary disclosures of significant non-cash transactions: | ||||||||||||
| Acquisition of property, plant and equipment included in construction costs payable and accrued liabilities | $ | - | $ | - | $ | 8,010,950 | ||||||
| Issuance of ordinary shares in connection with the acquisition of equity interests in a subsidiary from noncontrolling interests | $ | 53,011,515 | $ | - | $ | - | ||||||
| Issuance of ordinary shares as purchase consideration in connection with a business combination | $ | - | $ | - | $ | 9,121,499 | ||||||
| Issuance of ordinary shares upon exercise of Unit Purchase Options (“UPO”) | $ | 93 | $ | - | $ | - | ||||||
| Year ended June 30, | ||||||||||||
| 2012 | 2013 | 2014 | ||||||||||
| Cash flows from operating activities: | ||||||||||||
| Net income | $ | 56,573,747 | $ | 52,520,883 | $ | 71,450,640 | ||||||
| Adjustments to reconcile net income to net cash provided by operating activities: | ||||||||||||
| Depreciation of property, plant and equipment | 6,054,199 | 6,223,644 | 7,050,577 | |||||||||
| Amortization of prepaid land leases | 171,204 | 157,504 | 244,948 | |||||||||
| Amortization of intangible assets | 1,362,282 | 2,847,773 | 5,412,766 | |||||||||
| Allowance for doubtful accounts | 4,434,129 | 6,341,873 | 10,545,263 | |||||||||
| Loss (gain) on disposal of property, plant and equipment | 196,117 | (97,449 | ) | (131,632 | ) | |||||||
| Impairment loss on a cost investment | - | - | 325,373 | |||||||||
| Share of net loss (income) from equity investees | 3,141 | (297,177 | ) | 2,692,052 | ||||||||
| Dividends income from cost investees | - | (833,567 | ) | - | ||||||||
| Gain on disposal of long term investments | (2,043,977 | ) | - | - | ||||||||
| Gain on disposal of a subsidiary | - | (6,478 | ) | - | ||||||||
| Share-based compensation expenses | 1,139,368 | 1,599,496 | 2,986,192 | |||||||||
| Deferred income tax expenses (benefit) | 1,713,253 | (1,955,829 | ) | (5,427,366 | ) | |||||||
| Acquisition-related consideration adjustments | - | 1,163,179 | 8,919,629 | |||||||||
| Changes in operating assets and liabilities: | ||||||||||||
| Accounts receivable | (29,288,766 | ) | (33,422,591 | ) | (88,592,672 | ) | ||||||
| Costs and estimated earnings in excess of billings | (12,302,872 | ) | (19,956,215 | ) | (38,810,335 | ) | ||||||
| Inventories | 2,412,298 | (6,673,261 | ) | (805,998 | ) | |||||||
| Advances to suppliers | (1,814,764 | ) | 2,054,370 | (2,959,070 | ) | |||||||
| Other receivables | 4,132,144 | (3,432,599 | ) | 696,744 | ||||||||
| Deposits and other assets | (1,118,873 | ) | (4,856,915 | ) | (5,141,709 | ) | ||||||
| Due from related parties | (2,871,070 | ) | (11,672,808 | ) | 2,775,626 | |||||||
| Accounts payable | 8,838,803 | 22,435,049 | 24,160,888 | |||||||||
| Deferred revenue | 14,392,486 | 4,140,209 | 63,348,056 | |||||||||
| Accruals and other payable | 2,966,928 | 11,040,307 | 7,978,760 | |||||||||
| Cash dividends received from equity investees | - | - | 2,407,757 | |||||||||
| Due to related parties | (344,006 | ) | 57,762 | 1,898,780 | ||||||||
| Income tax payable | (2,871,713 | ) | 53,799 | 6,762,941 | ||||||||
| Other tax payables | 5,445,154 | 3,246,426 | 5,489,809 | |||||||||
| Net cash provided by operating activities | $ | 57,179,212 | $ | 30,677,385 | $ | 83,278,019 | ||||||
| Cash flows from investing activities: | ||||||||||||
| Time deposits placed with banks | (39,012,896 | ) | (19,592,169 | ) | (18,881,389 | ) | ||||||
| Purchases of property, plant and equipment | (8,250,146 | ) | (9,087,583 | ) | (8,359,115 | ) | ||||||
| Maturity of time deposits | 17,426,000 | 28,068,557 | 11,589,142 | |||||||||
| Proceeds from disposal of property, plant and equipment | 3,276,341 | 333,810 | 866,494 | |||||||||
| Proceeds from disposal of shares of equity investees | 4,439,707 | - | - | |||||||||
| Acquisition of shares of an equity investee | (474,316 | ) | - | - | ||||||||
| Cash contributions to an equity investee | (3,904,471 | ) | ||||||||||
| Cash contributions to a cost investee | - | - | (1,030,469 | ) | ||||||||
| Acquisition of a subsidiary, net of cash acquired | (5,296,855 | ) | (11,936,376 | ) | (5,510,000 | ) | ||||||
| Proceeds from disposal of a subsidiary | - | 112,674 | - | |||||||||
| Net cash used in investing activities | (27,892,165 | ) | (12,101,087 | ) | (25,229,808 | ) | ||||||
| Cash flows from financing activities: | ||||||||||||
| Proceeds from short-term bank loans | $ | 563,736 | $ | 7,499,136 | $ | 14,582,047 | ||||||
| Repayments of short-term bank loans | (12,314,261 | ) | (4,555,348 | ) | (13,826,110 | ) | ||||||
| Proceeds from long-term bank loans | - | 610,588 | 108,317 | |||||||||
| Repayments of long-term bank loans | (6,012,895 | ) | (8,237,030 | ) | (9,191,655 | ) | ||||||
| Proceeds from exercise of options | 672,000 | 967,200 | - | |||||||||
| Repayment of amounts due to the former shareholders of a subsidiary | (8,243,700 | ) | - | - | ||||||||
| Net cash used in financing activities | (25,335,120 | ) | (3,715,454 | ) | (8,327,401 | ) | ||||||
| Effect of foreign exchange rate changes | 1,711,976 | 1,034,773 | 209,709 | |||||||||
| Net increase in cash and cash equivalents | $ | 5,663,903 | $ | 15,895,617 | $ | 49,930,519 | ||||||
| Cash and cash equivalents, beginning of year | 90,669,059 | 96,332,962 | 112,228,579 | |||||||||
| Cash and cash equivalents, end of year | $ | 96,332,962 | $ | 112,228,579 | $ | 162,159,098 | ||||||
| Supplementary disclosures of cash flow information: | ||||||||||||
| Cash paid during the year for: | ||||||||||||
| Interest | $ | 3,031,593 | $ | 2,087,170 | $ | 1,842,372 | ||||||
| Income tax | $ | 11,144,407 | $ | 10,024,263 | $ | 17,612,883 | ||||||
| Supplementary disclosures of significant non-cash transactions: | ||||||||||||
| Acquisition of property, plant and equipment included in construction costs payable and accrued liabilities | $ | 8,010,950 | $ | 6,763,643 | $ | 1,988,759 | ||||||
| Issuance of ordinary shares as purchase consideration in connection with the acquisition of Concord | $ | 9,121,499 | $ | - | $ | - | ||||||
| Issuance of ordinary shares as purchase consideration in connection with the acquisition of Bond | $ | - | $ | 16,908,964 | $ | - | ||||||
See accompanying notes to consolidated financial statements.
HOLLYSYS AUTOMATION TECHNOLOGIES LTD.
CONSOLIDATED STATEMENTS OF STOCKHOLDERS’ EQUITY
(In US dollars except for number of shares)
| Ordinary shares | Additional paid-in capital | Statutory reserves | Retained earnings | Accumulated other comprehensive income | Total Hollysys Automation Technologies Ltd. stockholders’ equity | Noncontrolling interests | Total equity | |||||||||||||||||||||||||||||
| Shares | Amount | |||||||||||||||||||||||||||||||||||
| Balance at June 30, 2009 | 49,942,614 | $ | 49,943 | $ | 131,220,209 | $ | 15,135,442 | $ | 13,232,254 | $ | 13,902,045 | $ | 173,539,893 | $ | 22,479,241 | $ | 196,019,134 | |||||||||||||||||||
| Share based compensation expenses | - | - | 524,076 | - | - | - | 524,076 | - | 524,076 | |||||||||||||||||||||||||||
| Acquisition of additional equity interest in a subsidiary from noncontrolling interests | 4,413,948 | 4,414 | 7,006,970 | 2,261,335 | - | 2,460,534 | 11,733,253 | (24,305,847 | ) | (12,572,594 | ) | |||||||||||||||||||||||||
| Acquisition of a subsidiary | - | - | - | - | - | - | - | 7,548 | 7,548 | |||||||||||||||||||||||||||
| Capital contribution from noncontrolling interests | - | - | - | - | - | - | - | 717,626 | 717,626 | |||||||||||||||||||||||||||
| Issuance of ordinary shares upon exercise of UPO | 92,567 | 93 | (93 | ) | - | - | - | - | - | - | ||||||||||||||||||||||||||
| Net income | - | - | - | - | 25,704,538 | - | 25,704,538 | 1,851,453 | 27,555,991 | |||||||||||||||||||||||||||
| Foreign currency translation adjustments | - | - | - | - | - | 1,194,965 | 1,194,965 | 24,844 | 1,219,809 | |||||||||||||||||||||||||||
| Balance at June 30, 2010 | 54,449,129 | $ | 54,450 | $ | 138,751,162 | $ | 17,396,777 | $ | 38,936,792 | $ | 17,557,544 | $ | 212,696,725 | $ | 774,865 | $ | 213,471,590 | |||||||||||||||||||
| Share based compensation expenses | - | - | 551,966 | - | - | - | 551,966 | - | 551,966 | |||||||||||||||||||||||||||
| Issuance of ordinary shares upon exercise of options | 243,000 | 243 | 1,070,457 | - | - | - | 1,070,700 | - | 1,070,700 | |||||||||||||||||||||||||||
| Net income | - | - | - | - | 41,469,998 | - | 41,469,998 | (4,884 | ) | 41,465,114 | ||||||||||||||||||||||||||
| Appropriations to statutory reserves | - | - | - | 5,665,002 | (5,665,002 | ) | - | - | - | - | ||||||||||||||||||||||||||
| Foreign currency translation adjustments | - | - | - | - | - | 9,268,268 | 9,268,268 | 40,637 | 9,308,905 | |||||||||||||||||||||||||||
| Balance at June 30, 2011 | 54,692,129 | $ | 54,693 | $ | 140,373,585 | $ | 23,061,779 | $ | 74,741,788 | $ | 26,825,812 | $ | 265,057,657 | $ | 810,618 | $ | 265,868,275 | |||||||||||||||||||
| Ordinary shares | Additional paid-in capital | Statutory reserves | Retained earnings | Accumulated other comprehensive income | Total Hollysys Automation Technologies Ltd. stockholders’ equity | Noncontrolling interest | Total equity | |||||||||||||||||||||||||||||
| Shares | Amount | |||||||||||||||||||||||||||||||||||
| Balance at July 1, 2011 | 54,692,129 | $ | 54,693 | $ | 140,373,585 | $ | 23,061,779 | $ | 74,741,788 | $ | 26,825,812 | $ | 265,057,657 | $ | 810,618 | $ | 265,868,275 | |||||||||||||||||||
| Share-based compensation | - | - | 1,139,368 | - | - | - | 1,139,368 | - | 1,139,368 | |||||||||||||||||||||||||||
| Issuance of ordinary shares upon exercise of options | 300,000 | 300 | 671,700 | - | - | - | 672,000 | - | 672,000 | |||||||||||||||||||||||||||
| Acquisition of a subsidiary | 1,006,788 | 1,006 | 9,120,493 | - | - | - | 9,121,499 | - | 9,121,499 | |||||||||||||||||||||||||||
| Net income for the year | - | - | - | - | 56,221,847 | - | 56,221,847 | 351,900 | 56,573,747 | |||||||||||||||||||||||||||
| Appropriations to statutory reserves | - | - | - | 29,293 | (29,293 | ) | - | - | - | - | ||||||||||||||||||||||||||
| Translation adjustments | - | - | - | - | - | 5,888,744 | 5,888,744 | 21,346 | 5,910,090 | |||||||||||||||||||||||||||
| Balance at June 30, 2012 | 55,998,917 | $ | 55,999 | $ | 151,305,146 | $ | 23,091,072 | $ | 130,934,342 | $ | 32,714,556 | $ | 338,101,115 | $ | 1,183,864 | $ | 339,284,979 | |||||||||||||||||||
| Share-based compensation | - | - | 1,599,496 | - | - | - | 1,599,496 | - | 1,599,496 | |||||||||||||||||||||||||||
| Issuance of ordinary shares upon exercise of options | 138,000 | 138 | 967,062 | - | - | - | 967,200 | - | 967,200 | |||||||||||||||||||||||||||
| Exercise of share-based compensation on restricted shares issued to directors | 10,000 | 10 | (10 | ) | - | - | - | - | - | - | ||||||||||||||||||||||||||
| Acquisition of a subsidiary | 1,407,907 | 1,408 | 16,907,556 | - | - | - | 16,908,964 | - | 16,908,964 | |||||||||||||||||||||||||||
| Net income for the year | - | - | - | - | 51,994,402 | - | 51,994,402 | 526,481 | 52,520,883 | |||||||||||||||||||||||||||
| Appropriations to statutory reserves | - | - | - | 55,599 | (55,599 | ) | - | - | - | - | ||||||||||||||||||||||||||
| Translation adjustments | - | - | - | - | - | 4,157,111 | 4,157,111 | 36,362 | 4,193,473 | |||||||||||||||||||||||||||
| Balance at June 30, 2013 | 57,554,824 | $ | 57,555 | $ | 170,779,250 | $ | 23,146,671 | $ | 182,873,145 | $ | 36,871,667 | $ | 413,728,288 | $ | 1,746,707 | $ | 415,474,995 | |||||||||||||||||||
| Share-based compensation | - | - | 2,986,192 | - | - | - | 2,986,192 | - | 2,986,192 | |||||||||||||||||||||||||||
| Net income for the year | - | - | - | - | 69,619,583 | - | 69,619,583 | 1,831,057 | 71,450,640 | |||||||||||||||||||||||||||
| Appropriations to statutory reserves | - | - | - | 142,107 | (142,107 | ) | - | - | - | - | ||||||||||||||||||||||||||
| Translation adjustments | - | - | - | - | - | 2,140,484 | 2,140,484 | 5,567 | 2,146,051 | |||||||||||||||||||||||||||
| Balance at June 30, 2014 | 57,554,824 | $ | 57,555 | $ | 173,765,442 | $ | 23,288,778 | $ | 252,350,621 | $ | 39,012,151 | $ | 488,474,547 | $ | 3,583,331 | $ | 492,057,878 | |||||||||||||||||||
HOLLYSYS AUTOMATION TECHNOLOGIES LTD.CONSOLIDATED STATEMENTS OF STOCKHOLDERS’ EQUITY - Continued(In US dollars except for number of shares)
| Ordinary shares | Additional paid-in capital | Statutory reserves | Retained earnings | Accumulated other comprehensive income | Total Hollysys Automation Technologies Ltd. stockholders’ equity |
Noncontrolling interests | Total equity | |||||||||||||||||||||||||||||
| Shares | Amount | |||||||||||||||||||||||||||||||||||
| Balance at June 30, 2011 | 54,692,129 | $ | 54,693 | $ | 140,373,585 | $ | 23,061,779 | $ | 74,741,788 | $ | 26,825,812 | $ | 265,057,657 | $ | 810,618 | $ | 265,868,275 | |||||||||||||||||||
| Share based compensation expenses | - | - | 1,139,368 | - | - | - | 1,139,368 | - | 1,139,368 | |||||||||||||||||||||||||||
| Issuance of ordinary shares upon exercise of options | 300,000 | 300 | 671,700 | - | - | - | 672,000 | - | 672,000 | |||||||||||||||||||||||||||
| Acquisition of a subsidiary | 1,006,788 | 1,006 | 9,120,493 | - | - | - | 9,121,499 | - | 9,121,499 | |||||||||||||||||||||||||||
| Net income | - | - | - | - | 56,221,847 | - | 56,221,847 | 351,900 | 56,573,747 | |||||||||||||||||||||||||||
| Appropriations to statutory reserves | - | - | - | 29,293 | (29,293 | ) | - | - | - | - | ||||||||||||||||||||||||||
| Foreign currency translation adjustments | - | - | - | - | - | 5,888,744 | 5,888,744 | 21,346 | 5,910,090 | |||||||||||||||||||||||||||
| Balance at June 30, 2012 | 55,998,917 | $ | 55,999 | $ | 151,305,146 | $ | 23,091,072 | $ | 130,934,342 | $ | 32,714,556 | $ | 338,101,115 | $ | 1,183,864 | $ | 339,284,979 | |||||||||||||||||||
See accompanying notes to consolidated financial statements.
| NOTE 1 - | ORGANIZATION AND BUSINESS BACKGROUND |
NOTE 1 - ORGANIZATION AND BUSINESS BACKGROUND
Hollysys Automation Technologies Ltd. (“Hollysys” or the “Company”), formerly known as HLS Systems International Ltd., was established under the laws of the British Virgin Islands (“BVI”) on February 6, 2006, for the purpose of merging with Chardan North China Acquisition Corporation (“Chardan”), a blank check company incorporated in Deleware,Delaware, United States of America, and to hold 100% interest in Gifted Time Holdings Limited (“GTH”) upon the completion of a share exchange transaction (the “Share Exchange Transaction”). GTH was established under the laws of the BVI on September 21, 2005 and was the holding company of Beijing Hollysys Co., LtdLtd. (“Beijing Hollysys”) (74.11%) and Hangzhou Hollysys Automation Co., Ltd. (“Hangzhou Hollysys”) (60%) through a reorganization arrangement.arrangement with equity interests of 74.11% and 60%, respectively.
On September 7, 2007, the shareholders of Chardan approved the Share Exchange Transaction. As a result, Chardan merged with and into Hollysys finishingto complete the re-domestication merger and Hollysys consummated the Share Exchange Transaction with GTH. Upon completion of the Share Exchange Transaction, Hollysys owned 100% interest in GTH, which held 74.11% beneficiaryequity interest of Beijing Hollysysand 60% equity interest of Hangzhou Hollysys. Beijing Hollysys held the remaining 40% equity interest of Hangzhou Hollysys.
On July 1, 2009, the Company acquired 1.78% equity interest in Beijing Hollysys from the noncontrolling shareholders for a consideration of RMB 18,000,000RMB18,000,000 (approximately $2,638,793). Upon completion of the acquisition, the Company held a 75.89% equity interest in Beijing Hollysys.
On December 23, 2009, the Company entered into a share sale and purchase agreement with Unionway Resources Limited (the “Seller”(“Unionway”), a business company incorporated in the BVI, pursuant to which, among other things, the Company acquired 24.11% equity interest of Beijing Hollysys. As the consideration for the acquisition, the Company paid RMB 67,634,366 (approximately $9,917,063)RMB67,634,366 ($9,917,063) in cash and issued 4,413,948 ordinary shares, with total fair value of $53,011,515, to the SellerUnionway on March 16, 2010. Upon completion of the acquisition, the Company indirectly owns 100% of Beijing Hollysys.
On July 1, 2011, the Company acquired 100% equity interest of Concord Corporation Pte. Ltd. (including Concord Corporation Pte. Ltd., Dubai branch) and its subsidiaries, Concord Electrical Pte. Ltd., and Concord Electrical Sdn. Bhd. (collectively, “Concord”). Concord is a Singapore headquartered integrated construction and installation services provider to rail and industrial companies in Southeast Asia and the Middle East.
On May 9, 2012, Concord Solution (HK) Limited was established to provide integrated automation products and services. It is 100% indirectly owned by the Company with a registered capital of HKD10,000.
On July 24, 2012, Hangzhou Hollysys System Engineering Co., Ltd. was established to provide integrated automation products and services. It is 100% indirectly owned by the Company with a registered capital of RMB50,000,000.
In December 2012, the Company disposed of its 51% equity interest in Beijing WoDeWeiYe Technology Exploration Co., Ltd. (“WoDeWeiYe”) for a consideration of $112,674. WoDeWeiYe was insignificant to the Company and thus the results of WoDeWeiYe were not presented as discontinued operations. The net revenues and net income (loss) of WoDeWeiYe included in the consolidated financial statements of the Company were as follows:
| Year ended June 30, | ||||||||
| 2012 | 2013 | |||||||
| Net revenues | $ | 726,193 | $ | 48,826 | ||||
| Net income (loss) | $ | 84,147 | $ | (32,763 | ) | |||
On January 10, 2013, Hollysys International Pte. Ltd. was established under the law of Singapore for the purpose of acquiring Bond Corporation Pte. Ltd. It is 100% owned by the Company with a registered capital of SGD20,000,000.
On February 21, 2013, Concord M Design and Engineering Company Limited were established to undertake potential projects in Macau. It is 100% indirectly owned by the Company with a registered capital of 25,000 Macau Pataca.
On April 1, 2013, the Company acquired 100% equity interest of Bond Corporation Pte. Ltd. and its subsidiaries, Bond M & E Sdn. Bhd., Bond M & E (KL) Sdn. Bhd. and Bond M & E Pte. Ltd. (collectively, “Bond”). Bond is a Singapore headquartered mechanical and electrical solutions service provider for building construction and renovation projects in Malaysia and Singapore.
On March 31, 2014, Hollysys Automation India Private Limited (“HAIP”) was established as part of the effort the Company made to increase its presence and explore the market in India. HAIP mainly provides integrated solution products to the customers.
As of June 30, 2012,2014, details of the Company’s subsidiaries are as follows:
| Name of company | Place of
| Date of incorporation | Percentage of interest
| Principal activities | ||||||||||
| Directly | Indirectly | |||||||||||||
| Gifted Time Holdings Limited | BVI | September 21, 2005 | 100 | % | - | Investment holding | ||||||||
| Clear Mind Limited | BVI | November 29, 2007 | - | 100 | % | Investment holding | ||||||||
| World Hope Enterprises Limited | Hong Kong | September 17, 2007 | - | 100 | % | Investment holding | ||||||||
| Beijing Helitong Science & Technology Exploration Co., Ltd. | The People’s Republic of China (“PRC”) | January 25, 2008 | - | 100 | % | Investment holding | ||||||||
| Hollysys Group Co., Ltd. | PRC | December 17, 2007 | - | 100 | % | Investment holding | ||||||||
| Hollysys (Beijing) Investment Co., Ltd. | PRC | April 15, 2011 | - | 100 | % | Investment management | ||||||||
| Beijing Hollysys Automation & Drive Co., Ltd. | PRC | May 13, 2008 | - | 100 | % | Provision of integrated automation products and services | ||||||||
| Hangzhou Hollysys Automation Co., Ltd. | PRC | September 24, 2003 | - | 100 | % | Provision of integrated automation products and services | ||||||||
| Hangzhou Hollysys System Engineering Co., Ltd. (“Hangzhou System”) | PRC | July 24, 2012 | 100 | % | Provision of integrated automation products and services | |||||||||
| Beijing Hollysys Electronics Technology Co., Ltd. | PRC | June 4, 2010 | - | 100 | % | Manufacture components of automation products for | ||||||||
| Beijing Hollycon Medicine & Technology Co., Ltd. | PRC | June 4, 2010 | - | 51 | % | Manufacture and sale of medical automation equipment | ||||||||
| Beijing Hollysys Co., Ltd. | PRC | September 25, 1996 | - | 100 | % | Provision of integrated automation products and services | ||||||||
| Beijing Haotong Science and Technology Development Co., Ltd. | PRC | October 26, 2000 | - | 100 | % | Dormant | ||||||||
| Xi’an Hollysys Co., Ltd. | PRC | March 9, 2011 | - | 100 | % | Research and development | ||||||||
| Hollysys | Singapore | 100 | % | - | Investment | |||||||||
| Singapore | - | 100 | % | Provision of integrated | ||||||||||
| - | 100 | % | Provision of | |||||||||||
| Concord Corporation Pte. Ltd. | - | 100 | % | Provision of | ||||||||||
| Concord Electrical Pte. Ltd. (“CEPL”) | Singapore | May 25, 1984 | - | 100 | % | Provision of mechanical and electrical solutions and installation services | ||||||||
| Concord Electrical Sdn. Bhd. (“CESB”) | Malaysia | May 13, 1994 | - | 100 | % | Provision of mechanical and electrical solutions and installation services | ||||||||
| Concord Solution (HK) Limited | Hong Kong | May 9, 2012 | - | 100 | % | Provision of | ||||||||
| Concord M Design and Engineering Company Limited (“CMDE”) | Macau | February 21, 2013 | - | 100 | % | Provision of mechanical and electrical solutions and installation services | ||||||||
| Bond Corporation Pte. Ltd. (“BCPL”) | Singapore | November 1, 2012 | - | 100 | % | Investment holding | ||||||||
| Bond M & E Pte. Ltd. (“BMSG”) | Singapore | March 6, 1981 | - | 100 | % | Provision of mechanical and electrical solutions and installation services | ||||||||
| Bond M & E Sdn. Bhd. (“BMJB”) | Malaysia | October 25, 1983 | - | 100 | % | Provision of mechanical and electrical solutions and installation services | ||||||||
| Bond M & E (KL) Sdn. Bhd. (“BMKL”) | Malaysia | October 24, 1989 | - | 100 | % | Provision of mechanical and electrical solutions and installation services |
The Company is principally engaged in the manufacture, sale and provision of integrated automation systems and services, in the PRC mainly through the PRC operating subsidiaries,mechanical and engaged in the provision of integrated constructionelectrical solution services and installation services in the PRC, Hong Kong, Southeast Asia and the Middle East through its Singaporeoperating subsidiaries.
NOTE 2 - SUMMARY OF SIGNIFICANT ACCOUNTING POLICIES
| NOTE 2 - | SUMMARY OF SIGNIFICANT ACCOUNTING POLICIES |
Principles of consolidation and basis of presentation
The consolidated financial statements include the financial statements of the Company and its subsidiaries. All significant inter-company transactions and balances are eliminated upon consolidation. The consolidated financial statements have been prepared in accordance with the accounting principles generally accepted in the United States of America (“USU.S. GAAP”).
Use of estimates
The preparation of financial statements in conformity with US GAAP requires management to make estimates and assumptions that affect the reported amounts of assets and liabilities and disclosures of contingent assets and liabilities at the date of the financial statements and the reported amounts of revenues and expenses during the reporting period. Management evaluates estimates, including those related to the expected total costs of integrated contracts, expected gross margins of integrated solution contracts, allowance for doubtful accounts, fair values of share options, the purchase price allocation and contingent consideration with respect to business combinations, warranties, valuation allowance of deferred tax assets and impairment of goodwill and other long-lived assets. Management bases the estimates on historical experience and on various other assumptions that are believed to be reasonable, the results of which form the basis for making judgments about the carrying values of assets and liabilities. Actual results could differ materially from those estimates.
Foreign currency translations and transactions
The Company, GTH, Clear Mind, World Hope, and World Hope’sHI’s functional and reporting currency is the United States dollars (“US dollars” or “$”); whereas the Company’s subsidiaries use the primary currency of the economic environment in which their operations are conducted as their functional currency. Basically, Renminbi (“RMB”) is determined to be the functional currency of all PRC subsidiaries; Singapore dollar (“SGD”) is determined to be the functional currency of HAP, CCPL, CEPL, BCPL and CEPL;BMSG; Malaysian Ringgit (“MYR”) is determined to be the functional currency of CESB, BMJB and BMKL; and United Arab Emirates Dirham (“AED”), the Malaysian Ringgit (“MYR”), and Hong Kong dollar (“HKD”), Macau Pataca (“MOP”) and Indian Rupee (“INR”) are the functional currencies of CCPL Dubai, CESB,CSHK, CMDE, and CSHK,HAIP respectively. The Company uses the US dollars as its reporting currency.
The Company translates the assets and liabilities into US dollars using the rate of exchange prevailing at the balance sheet date, and the statements of comprehensive income are translated at average rates during the reporting period. Adjustments resulting from the translation of financial statements from the functional currency into US dollars are recorded in stockholders’ equity as part of accumulated other comprehensive income. Gains or losses resulting from transactionsTransactions dominated in currencies other than the functional currency are translated into functional currency at the exchange rates prevailing on the transaction dates, and the exchange gains or losses are reflected in the consolidated statements of comprehensive income for the reporting period.
Transactions denominated in foreign currencies are re-measured into the functional currency at the exchange rates prevailing on the transaction dates. Foreign currency denominated financial assets and liabilities are re-measured at the exchange rates prevailing at the balance sheet date. Exchange gains and losses are included in earnings.
For the yearyears ended June 30, 2010, 20112012, 2013 and 2012,2014, the Company recorded foreign exchange gain (loss), net of $86,641, $1,326,011$(275,341), $799,609 and ($275,341),$793,910, respectively.
Business combinations
The Company accounts for its business combinations using the purchase method of accounting in accordance with Accounting Standards Codification (“ASC”) Topic 805,Business Combinations (“ASC 805”). The purchase method accounting requires that the consideration transferred to be allocated to the assets, including separately identifiable assets and liabilities the Company acquired based on their estimated fair values. The consideration transferred of an acquisition is measured as the aggregate of the fair values at the date of exchange of the assets given, liabilities incurred, and equity instruments issued as well as the contingent considerations and all contractual contingencies as of the acquisition date. Identifiable assets, liabilities and contingent liabilities acquired or assumed are measured separately at their fair value as of the acquisition date, irrespective of the extent of any noncontrolling interests. The excess of (i) the total cost of the acquisition, fair value of the noncontrolling interests and acquisition date fair value of any previously held equity interest in the acquiree over (ii) the fair value of the identifiable net assets of the acquiree, is recorded as goodwill. If the cost of acquisition is less than the fair value of the net assets of the subsidiary acquired, the difference is recognized directly in the statements of comprehensive income.
The determination and allocation of fair values to the identifiable assets acquired, liabilities assumed and noncontrolling interests is based on various assumptions and valuation methodologies requiring considerable management judgment. The most significant variables in these valuations are discount rates, terminal values, the number of years on which to base the cash flow projections, as well as the assumptions and estimates used to determine the cash inflows and outflows. The Company determines discount rates to be used based on the risk inherent in the related activity’s current business model and industry comparisons. Terminal values are based on the expected life of assets forecasted life cycle and forecasted cash flows over that period.
Acquisition-related costs are recognized as general and administrative expenses in the statements of comprehensive income as incurred.
Cash and cash equivalents
Cash and cash equivalents consist of cash on hand and bank deposits, which are unrestricted as to withdrawal and use. All highly liquid investments that are readily convertible to known amounts of cash with original stated maturities of three months or less are classified as cash equivalents.
Time deposits with original maturities over three months
Time deposits with original maturities over three months consist of deposits placed with financial institutions with original maturity terms of six months or one year. As of June 30, 2014, $17,100,178 and $11,233,948 of time deposits with original maturities over three months were placed in financial institutions in the PRC and Malaysia, respectively. As of June 30, 2013, $14,016,821 and $6,842,019 time deposits with original maturities over three months were placed in financial institutions in the PRC and Malaysia, respectively.
Restricted cash
Restricted cash mainly consists of the cash deposited in banks pledged for performance guarantees, and isor bank loans. These cash balances are not available for use until these guarantees are expired or cancelled.cancelled, or the loans are repaid.
Revenue recognition
Integrated solutions contracts
Revenues generated from designing, building, and delivering customized integrated industrial automation systems are recognized over the contractual terms based on the percentage of completion method. The contracts for designing, building, and delivering customized integrated industrial automation systems are legally enforceable binding agreements between the Company and customers. The duration of contracts depends on the contract size and ranges from 6 months to 5 years excluding the warranty period. The majority of the contract duration is longer than one year.
Revenue generated from mechanical and electrical solution contracts for the construction or renovation of buildings, rail or infrastructure facilities are also recognized over the contractual terms based on the percentage of completion method. The contracts for mechanical and electrical solution services are legally enforceable binding agreements between the Company and customers. The duration of contracts depends on the contract size and the complexity of the construction work and ranges from 6 months to 3 years excluding the warranty period. The majority of the contract duration is longer than one year.
In accordance with ASC Subtopic 605-35,Revenue Recognition - Construction-Type and Production-Type Contracts(“ASC 605-35”), recognition is based on an estimate of the income earned to date, less income recognized in earlier periods. Revisions in the estimated total costs of integrated contracts are made in the period in which the circumstances requiring the revision become known. Provisions, if any, are made currently forin the period when anticipated losslosses are expected on the uncompleted contracts.
The Company reviews and updates the estimated total costs of integrated solution contracts at least semi-annually. The Company accounts for revisions to contract revenue and estimated total costs of integrated solution contracts, including the impact due to approved change orders, in the period in which the facts that cause the revision become known as changes in estimates. Unapproved change orders are considered claims. Claims are recognized only when it has been awarded by customers. Excluding the impact of change orders, if the estimated total costs of integrated solution contracts, which arewere revised during the yearyears ended June 30, 2012, 2013 and 2014, had been used as a basis of recognition of integrated contract revenue since the contract commencement, net income for the years ended June 30, 2012, 2013 and 2014 would have been decreased by $13,109,779, $11,252,708, and $4,435,843, respectively; basic net income per share for years ended June 30, 2012, 2013, and 2014 would have been decreased by $0.24, $0.20, and $0.08, respectively; and diluted net income per share for the yearyears ended June 30, 2012, 2013 and 2014, would have decreased by $13,109,779, $0.24,$0.23, $0.20 and $0.23,$0.08, respectively. Revisions to the estimated total costs for the yearyears ended June 30, 2012, 2013 and 2014 were made in the ordinary course of business.
The Company combines a group of contracts as one project if they are closely related and are, in substance, parts of a single project with an overall profit margin. Whereas, theThe Company segments a contract into several projects, when they are of different business substance, for example, with different business negotiation, solutions, implementation plans margins, etc.and margins.
Revenue in excess of billings on the contracts is recorded as costs and estimated earnings in excess of billings. Billings in excess of revenues recognized on the contracts are recorded as deferred revenue until the above revenue recognition criteria are met.
The Company generally recognizes 100% of the contractual revenue upon receipt ofwhen the customer acceptance as the Company estimates thathas been obtained, and no further major costs willare estimated to be incurred, under a contract, a signed customer acceptance document has been obtained, andnormally this is also when the warranty period commences. Revenues are presented net of taxes collected on behalf of the government.
Product sales
Revenue generated from sales of products is recognized when the following four revenue recognition criteria are metmet: (i) persuasive evidence of an arrangement exists, (ii) delivery has occurred, (iii) the selling price is fixed or determinable, and (iv) collectability is reasonably assured.
Service rendered
During the year ended June 30, 2014, the Company extended its service offerings as described below. Previously, service revenue was insignificant. The Company mainly provides two types of services:
Revenue from one-off services: the Company provides different types of one-off services, including on-site maintenance service and training services which are generally completed on site within a few working days. Revenue is recognized when the Company has completed all the respective services described in the contracts, there is persuasive evidence of an arrangement, the fee is fixed or determinable and collection is reasonably assured.
Revenue from services covering a period of time: the Company also separately sells extended warranties to their integrated solution customers for a fixed period. Such arrangements are negotiated separately from the corresponding integrated solution system and are usually entered into upon the expiration of the warranty period attached to the integrated solution contract. During the extended warranty period, the Company is responsible for addressing issues related to the system. Part replacement is not covered in such services. The Company recognizes revenue on a pro-rata basis over the contractual term.
Revenue from services was not presented separately in the consolidated statement of comprehensive income for the years ended 2012 and 2013 as the amounts were inconsequential.
Inventories
Inventories are composed of raw materials, work in progress, purchased and manufactured finished goods and low value consumables. Inventories are accounted for on the “first-in, first-out basis”, and stated at the lower of cost or market.
The Company assesses the lower of cost or market for non-saleable, excess or obsolete inventories based on its periodic review of inventory quantities on hand and the latest forecasts of product demand and production requirements from its customers. The Company writes down inventories for non-saleable, excess or obsolete raw materials, work-in-process and finished goods by charging such write-downs to cost of integrated contracts and/or costs of products sold.
Warranties
Warranties represent a major term under an integrated contract, which will last, in general, for one to three years or otherwise specified in the terms of the contract. The Company accrues warranty liabilities under an integrated contract as a percentage of revenue recognized, which is derived from its historical experience, in order to recognize the warranty cost for an integrated contract throughout the contract period. In addition, the Company estimates whether or not the accrued warranty liabilities are adequate by considering specific conditions that may arise and the number of contracts under warranty period at each reporting date. The Company adjusts the accrued warranty liabilities in line with the results of its assessment.
Accounts receivable and costs and estimated earnings in excess of billings
Performance of the integrated contracts will often will extend over long periods and the Company’s right to receive payments depends on its performance in accordance with the contractual agreements. BillingsThere are different billing practices in the PRC and overseas operating subsidiaries including Concord and Bond. In the PRC, billings are rendered based on agreed milestones included independing on the contracts terms with customers. There are different milestones amount in the contracts the Company has won. In general, there are four milestones: 1) project commencement, 2) system manufacturing and delivery, 3) installation, trial-run and customer acceptance, and 4) expiration of the warranty period. The amounts to be billed when each of the specified milestones is reached are specified in the contracts. All contracts have the first milestone, but not all contracts have a prepayment.require prepayments. Each interval of two continuous billings under an integrated contract varies depending on the duration of the contract (under certain contracts, the interval of two continuous billings is longer than one year) and the last billing to be issued for an integrated solution contract is at the end of a warranty period. For Concord and Bond, billing claims are rendered subject to the approval and certification by the customers or their designated consultants. Payments are made to Concord or Bond based on the certified billings according to the payment terms as mutually agreed between the customers and Concord or Bond. Certain amounts are retained by the customer and payable to Concord and Bond upon satisfaction of final quality inspection or at the end of the warranty period. The retained amounts for the three years ended June 30, 2012, 2013 and 2014 were $2,091,805, $6,549,418 and $9,653,052, respectively. Prepayments received are recorded as deferred revenue. The deferred revenue will be recognized as revenue under the percentage of completion method along with the progress of a contract. If no prepayment is received by the Company, revenue will be recognized through costcosts and estimated earnings in excess of billings.
The Company does not require collateral from its customers. Based on the prevailing collection practices in China, it is a reasonable expectation for the enterprises in the automation industry to take over one year to collect the accounts receivable in full.
The Company does not charge interest for late payments by its customers. The Company periodically reviews the status of contracts and decides how much of an allowance for doubtful accounts should be made based on factors surrounding the credit risk of customers and its historical experience. The Company sets up a doubtful account for an individuala customer based on the aging of the outstanding amount as well as the customer’s credit worthiness.
Property, plant and equipment, net
Property, plant and equipment, other than construction in progress, are recorded at cost and are stated net of accumulated depreciation.depreciation and impairment, if any. Depreciation expense is determined using the straight-line method over the estimated useful lives of the assets as follows:
| Buildings | 30 - 50 years |
| Machinery | 5 - 10 years |
| Software | 3 - 5 years |
| Vehicles | 5 - 6 years |
| Electronic and other equipment |
Construction in progress represents uncompleted construction work of certain facilities which, upon completion, management intends to hold for production purposes. In addition to costs under construction contracts, externalother costs directly related to the construction of such facilities, including duty and tariff, equipment installation and shipping costs, and borrowing costs are capitalized. Depreciation commences when the asset is placed in service.
Maintenance and repairs are charged directly to expense as incurred, whereas betterment and renewals are capitalized in their respective accounts. When an item is retired or otherwise disposed of, the cost and applicable accumulated depreciation are removed and the resulting gain or loss is recognized for the reporting period.
Prepaid land leases, net
Prepaid land lease payments, for the land use right of three parcels of land in the PRC, three parcels of leasehold land in Malaysia and one parcel of leasehold land in Singapore, are initially stated at cost and are subsequently amortized on a straight-line basis over the lease terms of 49 to 5088 years.
Acquired intangible assets, net
Acquired intangible assets are carried at cost less accumulated amortization and any impairment. Intangible assets acquired in a business combination are recognized initially at fair value at the date of acquisition. Intangible assets, except for which are estimated to have an indefinite useful life, are amortized using a straight-line method. Intangible assets estimated to have an indefinite useful life are not amortized but tested for impairment annually or more frequently when indicators of impairment exist.
These amortization methods reflect the estimated pattern in which the economic benefits of the respective acquired intangible assets are to be consumed. The estimated useful lives for the acquired intangible assets are as follows:
| Category | Estimated useful life | |
| Customer relationship | ||
| Order backlog |
Residual values are considered nil.
Goodwill
Goodwill represents the excess of the purchase price over the estimated fair value of net tangible and identifiable intangible assets acquired. The Company’s goodwill outstanding at June 30, 20122014 was related to the acquisition of Concord Corporation Pte. Ltd. (“CCPL”) and its subsidiaries Concord Electrical Pte. Ltd. (“CEPL”), Concord Electrical Sdn. Bhd. (“CESB”) and Concord Corporation Pte. Ltd, Dubai Branch (“CCPL Dubai”) (collectively, “Concord”)Bond (see notesnote 3). In accordance with ASC 350,Intangibles, Goodwill and Other goodwill(“ASC 350”), goodwill is not amortized, but rather is tested for impairment at least annually or more frequently if there are indicators of impairment present.
Goodwill is tested for impairment on June 30 in each year. The goodwill testing utilizesCompany performs a qualitative assessment to determine if it is more likely than not that the fair value of each identified reporting unit is less than its carrying amount. If this is the case, the Company is not required to calculate the fair value of its reporting unit(s) and perform the two-step impairment analysis, wherebytest. However, if the Company comparesconcludes otherwise, the first step of the two-step impairment test is performed by comparing the carrying value of each identifiedits reporting unit to its fair value. If the carrying value of the reporting unit is greater than its fair value, the second step is performed, where the implied fair value of goodwill is compared to its carrying value. The Company recognizes an impairment charge for the amount by which the carrying amount of goodwill exceeds its implied fair value.
For each of the years ended June 30, 2010, 2011 and 2012, thereThere was anno impairment loss of $286,610, nil, and nil respectively, included in general and administrative expenses. The impairment charge was related tofor the acquisition of Beijing WoDeWeiYe Technology Limited (see note 3).periods presented.
Impairment of long-lived assets other than goodwill
The Company evaluates its long-lived assets or asset group including acquired intangibles with finite lives for impairment whenever events or changes in circumstances (such as a significant adverse change to market conditions that will impact the future use of the assets) indicate that the carrying amount of a group of long-lived assets may not be fully recoverable. When these events occur, the Company evaluates the impairment by comparing the carrying amount of the assets to future undiscounted cash flows expected to result from the use of the assets and their eventual disposition. If the sum of the expected undiscounted cash flows is less than the carrying amount of the assets, the Company recognizes an impairment loss based on the excess of the carrying amount of the asset group over its fair value, generally based upon discounted cash flows or quoted market prices.
TheThere was no impairment loss on long-lived assets for each of the years ended June 30, 2010, 2011 and 2012 were $715,246, $23,711 and nil respectively, included in the general and administrative expenses, which represented impairment loss on property, plant and equipment.periods presented.
Shipping and handling costs
All shipping and handling fees charged to customers are included in net revenue, and shipping and handling costs for goods shipped by the Company to customers are included in cost of integrated contracts and/or costs of products sold.
Income taxes
The Company follows the liability method of accounting for income taxes. Under this method, deferred tax assets and liabilities are determined based on the differencedifferences between the financial reporting and tax bases of assets and liabilities using enacted tax rates that will be in effect in the period in which the differences are expected to reverse. The Company records a valuation allowance to offset deferred tax assets if based on the weight of available evidence, it is more-likely-than-not that some portion, or all, of the deferred tax assets will not be realized. The effect on deferred taxes of a change in tax rate is recognized in tax expense in the period that includes the enactment date of the change in tax rate.
The Company adopted ASC 740,Income Taxes (“ASC 740”),which clarifies the accounting and disclosure for uncertainty in income taxes. Interests and penalties arising from underpayment of income taxes shall be computed in accordance with the related tax laws. The amount of interest expense is computed by applying the applicable statutory rate of interest to the difference between the tax position recognized and the amount previously taken or expected to be taken in a tax return. Interests and penalties recognized in accordance with ASC 740 are classified in the financial statements as a component of income tax expense. In accordance with the provisions of ASC 740, the Company recognizes in its financial statements the impact of a tax position if a tax return position or future tax position is “more likely than not” to prevail based on the facts and technical merits of the position. Tax positions that meet the “more likely than not” recognition threshold are measured at the largest amount of tax benefit that has a greater than fifty percent likelihood of being realized upon settlement. The Company’s estimated liability for unrecognized tax positions which is included in the accrued liabilities is periodically assessed for adequacy and may be affected by changing interpretations of laws, rulings by tax authorities, changes and/or developments with respect to tax audits, and expiration of the statute of limitations. The outcome for a particular audit cannot be determined with certainty prior to the conclusion of the audit and, in some cases, appeal or litigation process. The actual benefits ultimately realized may differ from the Company’s estimates. As each audit is concluded, adjustments, if any, are recorded in the Company’s financial statements. Additionally, in future periods, changes in facts, circumstances, and new information may require the Company to adjust the recognition and measurement estimates with regard to individual tax positions. Changes in recognition and measurement estimates are recognized in the period in which the changes occur.
Research and development costs
Research and development costs consist primarily of staff costs, which include salaries, bonuses and benefits for research and development personnel. Research and development costs also include travel expenses of research and development personnel as well as depreciation of hardware equipment and software tools and other materials used in research and development activities. Research and development costs are expensed as incurred. Software development costs are also expensed as incurred as the costs qualifying for capitalization have been insignificant.
VAT refunds and government subsidies
Pursuant to the laws and regulations of the PRC, the Company remits 17% of its sales as VAT,valued added tax (“VAT”), and then is entitled to a refund of the 14%portion that the Company’s actual VAT burden exceeding 3% levied on all sales containing internally developed software products. VAT refunds are recognized in the statements of comprehensive income when cash refunds or the necessary approval from the tax authority has been received. Certain subsidiaries of the Company located in the PRC receive government subsidies from local PRC government agencies. Government subsidies are recognized in the statement of comprehensive income when the attached conditions have been met. VAT refundsGovernment grants received for the years ended June 30, 2012, 2013 and government subsidies are2014 amounted to $5,408,210, $11,322,147 and $5,791,961 respectively, of which $3,294,511, $4,877,720 and $5,103,218 were included as a credit to operating expenses in the statements of comprehensive income.income for the years ended June 30, 2012, 2013 and 2014, respectively.
Appropriations to statutory reserve
Under the corporate law and relevant regulations in the PRC, all of the subsidiaries of the Company located in the PRC are required to appropriate a portion of its retained earnings to statutory reserve. All subsidiaries located in the PRC are required to appropriate 10% of its annual after-tax income each year to the statutory reserve until the statutory reserve balance reaches 50% of the registered capital. In general, the statutory reserve shall not be used for dividend distribution purposes.
Use of estimates
The preparation of financial statements in conformity with US GAAP requires management to make estimates and assumptions that affect the reported amounts of assets and liabilities and disclosures of contingent assets and liabilities at the date of the financial statements and the reported amounts of revenues and expenses during the reporting period. Management evaluates estimates, including those related to the expected total costs of integrated contracts, expected gross margins of integrated solution contracts, allowance for doubtful accounts, fair values of share options, the purchase price allocation with respect to business combinations, warranties, valuation allowance of deferred tax assets and impairment of goodwill and other long-lived assets. Management bases the estimates on historical experience and on various other assumptions that are believed to be reasonable, the results of which form the basis for making judgments about the carrying values of assets and liabilities. Actual results could differ materially from those estimates.
Segment reporting
In accordance with ASC 280,Segment reporting(“ASC 280”), segment reporting is determined based on how the Company’s chief operating decision maker reviewsmakers review operating results to make decisions about allocating resources and assessing performance of the Company. According to management’s approach, the Company organizes its internal financial reporting structure based on its main product and service offerings. The Company operates in twothree principal business segments from 2012,in the financial reporting structure and their management report, namely industrial automation, rail transportation and rail transportation.mechanical and electrical solutions. The Company does not allocate any assets to the twothree segments as management does not use the information to measure the performance of the reportable segments.
Comprehensive income
Comprehensive income is defined as the changes in equity of the Company during a period from transactions and other events and circumstances excluding transactions resulting from investments by owners and distributions to owners. In accordance with ASC 220,Comprehensive Income (“ASC 220”), the Company presents components of net income and other comprehensive income in one continuous statement.
Investments in equitycost and costequity investees
The Company accounts for its equity investments under either the cost method or the equity method in accordance with its equity interest holding percentage.considering if the Company has the right and is able to exercise significant influence over the investees. Under the cost method, investments are initially carried at cost. The Company recognizes an impairment charge, equal to the difference between the cost basis and the fair value of the investment, when a decline in the fair value of its investments below the cost basis is judged to be other-than-temporary. A variety of factors are considered when determining if a decline in fair value below carrying value is other than temporary, including, among others, the financial condition and prospects of the investee.
The investments in entities over which the Company has the ability to exercise significant influence are accounted for using the equity method. Significant influence is generally considered to exist when the Company has an ownership interest in the voting stock of the investee between 20% and 50%. Other factors, such as representation on the investee’s Board of Directors and the impact of commercial arrangements, are also considered in determining whether the equity method of accounting is appropriate.
Under the equity method, original investments are recorded at cost and adjusted by the Company'sCompany’s share of undistributed earnings or losses of these entities, by the amortization of any basis difference between the amount of the Company's investment and its share of the net assets of the investee, and by dividend distributions or subsequent investments. Unrealized inter-company profits and losses with equity investees are eliminated. An impairment charge, being the difference between the carrying amount and the fair value of the equity investee, is recognized in the consolidated statements of comprehensive income when the decline in value is considered other than temporary.
The impairment loss on investment in cost investees for the years ended June 30, 2010, 20112012, 2013 and 20122014 were nil, $165,948,nil and nil,$325,373 respectively. TheThere was no impairment loss on investments in equity investees for the years ended June 30, 2010, 20112012, 2013 and 2012 were $152,732, nil, and nil2014, respectively.
Capitalization of interest
Interest incurred on borrowings for the Company’s construction of facilities and assembly line projects during the active construction period are capitalized. The capitalization of interest ceases once a project is substantially complete. The amount to be capitalized is determined by applying the weighted-average interest rate of the Company’s outstanding borrowings to the average amount of accumulated capital expenditures for assets under construction during the year and is added to the cost of the underlying assets and amortized over their respective useful lives.
Income per share
Income per share is computed in accordance with ASC 260,Earnings Per Share (“ASC 260”). Basic income per ordinary share is computed by dividing income (loss) attributable to holders of ordinary shares by the weighted average number of ordinary shares outstanding during the period. Diluted income per ordinary share reflects the potential dilution that could occur if securities or other contracts to issue ordinary shares were exercised or converted into ordinary shares.
Share-based compensation
The Company accounts for share-based compensation in accordance with ASC 718,Compensation-Stock Compensation (“ASC 718”). The Company recognizes compensation cost for an award with only service conditions that has a graded vesting schedule on a straight-line basis over the requisite service period for the entire award. The compensation cost for each vesting tranche in an award subject to performance vesting is recognized ratably from the service inception date to the vesting date for each tranche. To the extent the required service and performance conditions are not met resulting in the forfeiture of the share-based awards, previously recognized compensation expense relating to those awards arereversed. ASC 718 requires forfeitures to be estimated at the time of grant and revised, if necessary, in subsequent period if actual forfeitures differ from initial estimates.
Fair value measurements
The Company has adopted ASC 820, (“ASC 820”),Fair Value Measurements and Disclosures(“ASC 820”), which defines fair value, establishes a framework for measuring fair value in GAAP, and expands disclosures about fair value measurements. It does not require any new fair value measurements, but provides guidance on how to measure fair value by providing a fair value hierarchy used to classify the source of the information. It establishes a three-level valuation hierarchy of valuation techniques based on observable and unobservable inputs, which may be used to measure fair value and include the following:
| Level 1 | - | Quoted prices in active markets for identical assets or liabilities. |
| Level 2 | - | Inputs other than Level 1 that are observable, either directly or indirectly, such as quoted prices for similar assets or liabilities; quoted prices in markets that are not active; or other inputs that are observable or can be corroborated by observable market data for substantially the full term of the assets or liabilities. |
| Level 3 | - | Unobservable inputs that are supported by little or no market activity and that are significant to the fair value of the assets or liabilities. |
Classification within the hierarchy is determined based on the lowest level of input that is significant to the fair value measurement.
ASC 820 describes three main approaches to measuring the fair value of assets and liabilities: (1) market approach; (2) income approach and (3) cost approach. The market approach uses prices and other relevant information generated from market transactions involving identical or comparable assets or liabilities. The income approach uses valuation techniques to convert future amounts to a single present value amount. The measurement is based on the value indicated by current market expectations about those future amounts. The cost approach is based on the amount that would currently be required to replace an asset.
The carryingLeases
Leases have been classified as either capital or operating leases. Leases that transfer substantially all the benefits and risks incidental to the ownership of assets are accounted for as if there was an acquisition of an asset and incurrence of an obligation at the inception of the lease. All other leases are accounted for as operating leases wherein rental payments are expensed as incurred.
Accounting for Lessor
Minimum contractual rental from leases are recognized on a straight-line basis over the non-cancelable term of the lease. With respect to a particular lease, actual amounts billed in accordance with the lease during any given period may be higher or lower than the amount of cash and cash equivalents, time deposits with original maturities over three months, restricted cash, accounts receivable, other receivables, amount due to or from related parties, and accounts payable are reasonable estimates of their fair value becauserental revenue recognized for the period. Straight-line rental revenue commences when the customer assumes control of the short maturity of these items. The carryingleased premises. Accrued straight-line rents receivable represents the amount ofby which straight-line rental revenue exceeds rents currently billed in accordance with lease agreements. Contingent rental revenue is accrued when the Company’s long term bank loan approximates its fair value as the long term bank loancontingency is subject to a floating interest rate.
Reclassifications
The consolidated financial statements for prior years reflect certain reclassifications, which have no effect on previously reported results, to conform to the current year presentation. The item reclassified includes prepaid land leases amounting to $6,171,879 which were previously included in property, plant and equipment in the consolidated balance sheet as at June 30, 2011, and is presented as a separate line in the consolidated balance sheet as at June 30, 2012.removed.
Concentration of risks
Concentration of credit risk
Assets that potentially subject the Company to significant concentration of credit risk primarily consist of cash and cash equivalents, time deposits with original maturities over three months, restricted cash, accounts receivable, other receivables and other receivables.amounts due from related parties. The maximum exposure of such assets to credit risk is their carrying amounts as of the balance sheet dates.date. As of June 30, 2012,2014, substantially all of the Company’s cash and cash equivalents and time deposits with original maturities exceeding three months were managed by financial institutions located in the PRC, Singapore, Malaysia and Singapore,Dubai, which management believes are of high credit quality. Accounts receivable, other receivables and amounts due from related parties are typically unsecured and the risk with respect to accounts receivable is mitigated by credit evaluations the Company performs on its customers and its ongoing monitoring process of outstanding balances.
The Company has no customer that individually comprised 10% or more of the outstanding balance of accounts receivable as of June 30, 20112013 and 2012.
2014.
Concentration of business and economic risk
A majority of the Company’s net revenue and net income are derived in the PRC. The Company’s operations may be adversely affected by significant political, economic and social uncertainties in the PRC. Although the PRC government has been pursuing economic reform policies for more than 20 years, no assurance can be given that the PRC government will continue to pursue such policies or that such policies may not be significantly altered, especially in the event of a change in leadership, social or political disruption or unforeseen circumstances affecting the PRC’s political, economic and social conditions. There is also no guarantee that the PRC government’s pursuit of economic reforms will be consistent or effective.
Concentration of currency convertibility risk
A majority of the Company’s businesses are transacted in RMB, which is not freely convertible into foreign currencies. All foreign exchange transactions take place either through the People’s Bank of China or other banks authorized to buy and sell foreign currencies at the exchange rates quoted by the People’s Bank of China. Approval of foreign currency payments by the People’s Bank of China or other regulatory institutions requires submitting a payment application form together with suppliers’ invoices, shipping documents and signed contracts.
Concentration of foreign currency exchange rate risk
The Company’s exposure to foreign currency exchange rate risk primarily relates to cash and cash equivalents and time deposits with original maturities over three months denominatedmonetary assets or liabilities held in foreign currencies. Since July 21, 2005, the RMB has been permitted to fluctuate within a narrow and managed band against a basket of certain foreign currencies. On June 19, 2010, the People’s Bank of China announced the end of the RMB’s de facto peg to USD, a policy which was instituted in late 2008 in the face of the global financial crisis, to further reform the RMB exchange rate regime and to enhance the RMB’s exchange rate flexibility. The exchange rate floating bands will remain the same as previously announced in the inter-bank foreign exchange market. The depreciation of the US dollars against RMB was approximately 0.61%2.22%, 4.64%2.31% and 2.22%0.42% for the years ended June 30, 2010, 20112012, 2013 and 20122014 respectively. Any significant revaluation of RMB may materially and adversely affect the Company’s cash flows, revenues, earnings and financial position, and the value of its shares in US dollars. An appreciation of RMB against the US dollar would result in foreign currency translation losses when translating the net assets of the Company from RMB into US dollar.
For the years ended June 30, 2012, 2013 and 2014, the net foreign currency translation gains resulting from the translation of RMB and SGD functional currencies to the U.S. dollar reporting currency recorded in other comprehensive income was $5,910,090, $4,193,473 and $2,146,051 respectively.
Recent accounting pronouncements
In May 2011,April 2014, the Financial Accounting Standards BoardFASB issued ASU No. 2014-08,Reporting Discontinued Operations (“FASB”) issued Accounting Standard Update (“ASU”) 2011-04, Fair Value Measurement (“Topic 820”ASU 2014-08”), Amendments to Achieve Common Fair Value Measurement and Disclosure Requirements in U.S. GAAP and IFRSs (“ASU 2011-04”) which amends the fair value measurement guidance and includes some enhanced disclosure requirements. The most significant change in disclosures isaffects an expansionentity that has either of the information requiredfollowing: (1) A component of an entity that either is disposed of or meets the criteria to be classified as held for Level 3 measurements basedsale; and (2) A business or nonprofit activity that, on unobservable inputs.acquisition, meets the criteria to be classified as held for sale. The standardamendments in this Update change the requirements for reporting discontinued operations in ASC 205, Presentation of Financial Statements (“ASC 205”). A discontinued operation may include a component of an entity or a group of components of an entity, or a business or nonprofit activity. The update is effective for fiscal years beginning after December 15, 2011.2014. Early adoption is permitted. The Company will adopt ASU 2014-08 on July 1, 2014 and does not expect the adoption of this standard to have a material effect on its consolidated financial statements.
In May 2014, the FASB issued ASU No. 2014-09Revenue from Contracts with Customers (Topic 606) (“ASU 2014-09”). ASU 2014-09 affects any entity that either enters into contracts with customers to transfer goods or services or enters into contracts for the transfer of nonfinancial assets unless those contracts are within the scope of other standards (for example, insurance contracts or lease contracts). The core principle of the guidance is that an entity should recognize revenue to depict the transfer of promised goods or services to customers in an amount that reflects the consideration to which the entity expects to be entitled in exchange for those goods or services. To achieve that core principle, an entity should apply the following steps: (1) Identify the contract(s) with a customer; (2) Identify the performance obligations in the contract; (3) Determine the transaction price; (4) Allocate the transaction price to the performance obligations in the contract; (5) Recognize revenue when (or as) the entity satisfies a performance obligation. For a public entity, ASU 2014-09 is effective for annual reporting periods beginning after December 15, 2016, including interim periods within that reporting period. Early adoption is not permitted. The Company does not expectis currently evaluating the impact of the adoption of ASU 2011-04 will have a material impact on its consolidated financial statements.this standard.
In June 2011, the FASB issued ASU 2011-05, Presentation of Comprehensive Income (“ASU 2011-05”). ASU 2011-05 eliminates the option to report other comprehensive income and its components in the statement of changes in shareholders’ equity and requires an entity to present the total of comprehensive income, the components of net income and the components of other comprehensive income either in a single continuous statement or in two separate but consecutive statements. This pronouncement is effective for fiscal years, and interim periods within those years, beginning after December 15, 2011. In December 2011, the FASB issued ASU 2011-12, Deferral of the Effective Date for Amendments to the Presentation of Reclassifications of Items Out of Accumulated Other Comprehensive Income in Accounting Standards Update No. 2011-05 (“ASU 2011-12”). ASU 2011-12 defers the requirement in ASU 2011-05 that entities present reclassification adjustments for each component of accumulated other comprehensive income in both net income and other comprehensive income on the face of the financial statements. ASU 2011-12 requires entities to continue to present amounts reclassified out of accumulated other comprehensive income on the face of the financial statements or disclose those amounts in the notes to the financial statements. The effective date of ASU 2011-12 is consistent with ASU 2011-05, which is effective for fiscal years and interim periods beginning after December 15, 2011 for public entities. Retrospective application is required and early adoption is permitted. The Company has opted to early adopt ASU 2011-05. The provision of ASU 2011-12 did not have a material impact on the presentation of the Company’s financial statements.
NOTE 3 - BUSINESS COMBINATION
| NOTE 3 - | BUSINESS COMBINATIONS |
Acquisition of WoDeWeiYeBond
On SeptemberApril 1, 2009, Beijing Hollysys2013, the Company acquired 51%100% equity interest of Beijing WoDeWeiYe Technology Limited (WoDeWeiYe”the Bond Group, a Singapore headquartered mechanical and electrical solutions service contractor of residential, commercial or industrial building construction and renovation projects in Malaysia and Singapore. The nominal purchase price was $73,000,000, combined of cash and ordinary shares, with a total fair value of approximately $73,804,695 as of the acquisition date, which consisted of:
| 1) | Cash consideration of $36,500,000, of which $16,390,000 was paid in April 2013, $5,510,000 was paid in September 2013, and $14,600,000 was paid in September 2014;the cash consideration installments due in September 2013 and September 2014 had present values of $5,383,270 and $13,286,000, respectively as of the acquisition date; |
| 2) | Share consideration consisting of 1,407,907 ordinary shares with a market value of $16,908,964 on April 1, 2013, which were issued and transferred by the Company on May 30, 2013; |
| 3) | Incentive shares issuable to the selling shareholders (“Incentive Shares for Bond”) in two equal installments with fair values of $10,940,893 and $10,895,568, respectively. Issuance of Incentive Shares for Bond is subject to Bond achieving pre-determined net income performance targets. The Incentive Shares for Bond, if earned, are to be issued within 30 days after the filing of the Company’s annual report on Form 20-F for the fiscal years 2014 and 2015, respectively. The net income performance targets for the Incentive Shares for Bond are as follows: |
| First installment | Second installment | |||||||
| Basis of performance target | Net income for the year ending December 31, 2013 | Net income for the year ending December 31, 2014 | ||||||
| Target net income | $ | 8,806,044 | $ | 10,567,252 | ||||
| Nominal value of shares | $ | 10,950,000 | $ | 10,950,000 | ||||
| Referencing share price to achieve the nominal value of shares | Average closing price of the Company’s shares during the trading days from October 1 to December 31, 2013 | Average closing price of the Company’s shares during the trading days from October 1 to December 31, 2014 | ||||||
| 4) | Premium shares issuable to the selling shareholders (“Premium Shares for Bond”) are capped at 15% of the total Incentive Shares for Bond, or $3.3 million, which are subject to Bond achieving a pre-determined compound annual growth rate (“CAGR”) performance target of more than 20% for the two-year period from January 1, 2013 to December 31, 2014. The Premium Shares for Bond, if earned, are to be delivered within 30 days after the filing of the Company’s annual report on Form 20-F for the fiscal year 2015. The CAGR performance targets for the Premium Shares for Bond for the two-year period are as follows: |
| CAGR performance target | Premium shares issuable | |
| 21% | 3% of Incentive Shares for Bond | |
| 22% | 6% of Incentive Shares for Bond | |
| 23% | 9% of Incentive Shares for Bond | |
| 24% | 12% of Incentive Shares for Bond | |
| 25% and above | 15% of Incentive Shares for Bond |
As the Incentive Shares for Bond and Premium Shares for Bond are not subject to any service condition of the selling shareholders, they were determined to be within the scope of ASC 820 (note 16). In accordance with ASC 815, “Derivatives and Hedging.”(“ASC 815”), the Incentive Shares for Bond and the Premium shares for Bond are not considered fixed-for-fixed and therefore, are classified as liabilities as at June 30, 2013 and 2014. Until the contingency is resolved, the change in fair value of the Incentive Shares for Bond and Premium Shares for Bond are recognized in earnings. As of acquisition date, the fair value of the contingent consideration ranges from $21,836,461 to $25,111,930, depending on whether the 20% - 25% CAGR performance targets disclosed above are achievable.
The acquisition date fair value of the considerations as at the acquisition date is summarized in the below table:
| Considerations | Fair value as at April 1, 2013 | |||
| 1) Cash consideration (i) | $ | 35,059,270 | ||
| 2) Ordinary shares | 16,908,964 | |||
| 3) Incentive Shares for Bond (ii) | 21,836,461 | |||
| 4) Premium Shares for Bond (iii) | - | |||
| Total consideration | $ | 73,804,695 | ||
(i) The cash installments due in September 2013 and September 2014 had present values of $5,435,451 and $13,542,450, and were recorded as current portion of acquisition-related consideration liabilities, and non-current portion of the acquisition-related consideration liabilities, respectively, as at June 30, 2013. The cash consideration installment due in September 2014 had a present value of $14,398,889, and was recorded as current portion of the acquisition-related consideration liabilities, as at June 30, 2014.
(ii) The fair value of the Incentive Shares for Bond was $22,691,010 as at June 30, 2013, and was recorded as non-current portion of acquisition-related consideration liabilities. The first and second installments of the Incentive Shares for Bond had fair values of $15,886,590 and $10,791,372 respectively as at June 30, 2014, which was principally engaged in intelligent electric meter business, for cashrecorded as current portion of acquisition-related consideration of RMB 2,000,000 (equivalent to $294,422), to further build up its foothold in the subway automation sector. The identifiable net assetsliabilities, and non-current portion of the acquiree were insignificant and goodwill of $286,610, comprisedacquisition-related consideration liabilities, respectively, as at June 30, 2014. For the first installment of the Incentive Shares for Bond, the performance target was achieved and 648,697 shares were issuable as of June 30, 2014.
(iii) The probability of achieving the growth rate performance target set for Premium Shares for Bond was assessed to be not more than likely as at June 30, 2013. Based on the reassessment of Bond’s performance as at June 30, 2014, the probability of achieving the growth rate performance target of 25% CAGR was assessed to be more than likely. The correspondent premium shares for Bond’s achieving 25% CAGR is 15% of Incentive Shares for Bond, or 163,401 shares. The fair value of the premium incentive shares was $4,001,690 at June 30, 2014, and was recorded as non-current portion of acquisition-related consideration liabilities. The change in assessment of growth rate performance in 2014 resulted in higher fair value of Premium Shares for Bond to be paid to the selling shareholders, which caused reduction of net income, basic earnings per share, and diluted earnings per share by $4,001,690, $0.07 and $0.07, respectively.
The following table summarizes the estimated fair values of the assets acquired and liabilities assumed as of the date of acquisition:
| April 1, 2013 | ||||
| Cash and cash equivalents | $ | 4,460,439 | ||
| Time deposits with original maturities over three months | 7,486,463 | |||
| Restricted cash | 242,088 | |||
| Accounts receivable | 9,966,206 | |||
| Cost and estimated earnings in excess of billings | 6,340,396 | |||
| Other receivables | 883,441 | |||
| Advances to suppliers | 110,285 | |||
| Inventories | 133,450 | |||
| Deferred tax assets | 104,522 | |||
| Assets held for sale | 2,951,017 | |||
| Property, plant and equipment | 4,891,482 | |||
| Prepaid land leases | 5,884,196 | |||
| Intangible assets | 14,359,346 | |||
| Investments in equity investees | 260,611 | |||
| Total identifiable assets acquired | 58,073,942 | |||
| Short-term bank loans | 5,532,205 | |||
| Accounts payable | 8,654,868 | |||
| Deferred revenue | 2,315,102 | |||
| Income tax payable | 1,015,081 | |||
| Other tax payable | 141,731 | |||
| Accrued liabilities | 314,071 | |||
| Deferred tax liabilities | 3,790,788 | |||
| Long-term bank loans | 2,256,524 | |||
| Total liabilities assumed | 24,020,370 | |||
| Net identifiable assets acquired | 34,053,572 | |||
| Goodwill | 39,751,123 | |||
| Net assets acquired | $ | 73,804,695 | ||
The fair value of accounts receivable acquired was $9,966,206. Gross contractual accounts receivable acquired totaled $10,720,334 and the Company’s best estimate of the contractual cash flows not expected synergy arisingto be collected at acquisition date totaled $754,128.
The identified intangible assets include acquired customer relationship of $2,900,056, with an estimated useful life of 57 months, and acquired order backlog of $11,459,290, with an estimated useful life of 21 to 33 months. Intangible assets were valued using the multi-period excess earnings method.
The goodwill, which is not tax deductible, is primarily attributable to synergies expected to be achieved from the acquisition, and was recognized. assigned to the mechanical and electrical solutions segment.
The total net cash paidCompany recognized $547,529 of acquisition-related cost in this acquisition was $279,120. The amounts of WoDeWeiYe’s revenuegeneral and earnings includedadministrative expenses in the Company’s consolidated statement of comprehensive income for the year ended June 30, 2010 were insignificant2013.
For the year ended June 30, 2013, Bond contributed approximately $22,794,659 to the Company’s resulttotal net revenues, and approximately $1,791,123 to the Company’s net income.
The following unaudited pro forma consolidated financial information reflects the results of operations.the operations of the Company for the years ended June 30, 2012 and 2013, as if the acquisition of Bond described above had been completed as of July 1, 2011. The pro forma results have been prepared for comparative purposes only and do not purport to be indicative of what operating results would have been had the acquisition of Bond actually taken place on the date indicated and may not be indicative of future operating results. These amounts have been calculated after applying the Company's accounting policies and the pro forma adjustments are based upon available information and certain assumptions that management believes are reasonable.
| Year ended June 30, | ||||||||
| 2012 | 2013 | |||||||
| (Unaudited) | (Unaudited) | |||||||
| Total revenues | $ | 364,217,246 | $ | 392,481,505 | ||||
| Net income attributable to Hollysys Automation Technologies Ltd. | 60,108,836 | 57,813,313 | ||||||
| Net income per share: | ||||||||
| Basic | 1.08 | 1.03 | ||||||
| Diluted | $ | 1.08 | $ | 1.02 | ||||
Acquisition of Concord
Effective onOn July 1, 2011, the Company acquired 100% interestsequity interest of Concord, a Singapore headquartered electrification related system and service provider to rail and industrial companies in Southeast Asia and the Middle East. The consideration was a combination of cash and ordinary shares, with a total value of approximately $42,910,784, which consisted of:
| 1) | Cash of SGD 41,500,000 |
| 2) | 1,006,788 ordinary shares of the Company, with |
The Company also granted an aggregate of 1,510,181 incentive shares (“Incentive Shares for Concord”) to the two selling shareholders of Concord which arewere subject to service conditions and Concord achieving pre-determined net income performance targets. As the Incentive Shares for Concord are subject to service conditions, they were determined to be within the scope of ASC 718 (see note 18).
Through the acquisition, the Company seeks to expand the existing distribution and marketing channels to cross-sell the Company’s existing product lines in rail and industrial segments to the growing Southeast Asia and the Middle East markets. As a result of the transaction, Concord becomes the Company’s wholly owned subsidiaries.
The following table summarizes the fair value of the assets acquired and liabilities assumed at the date of acquisition on July 1, 2011.
| July 1, 2011 | July 1, 2011 | |||||||
| Cash and cash equivalents | $ | 11,597,787 | $ | 11,597,787 | ||||
| Accounts receivable | 8,325,504 | 8,325,504 | ||||||
| Other receivables | 486,028 | 486,028 | ||||||
| Advances to suppliers | 485,583 | 485,583 | ||||||
| Inventories | 536,125 | 536,125 | ||||||
| Prepaid expenses | 48,098 | 48,098 | ||||||
| Property, plant and equipment | 4,009,933 | 4,009,933 | ||||||
| Intangible assets | 1,957,253 | 1,957,253 | ||||||
| Total identifiable assets acquired | 27,446,311 | 27,446,311 | ||||||
| Accounts payable | 4,379,465 | 4,379,465 | ||||||
| Deferred revenue | 696,452 | 696,452 | ||||||
| Accrued payroll and related expense | 329,946 | |||||||
| Accrued payroll and related expenses | 329,946 | |||||||
| Income tax payable | 2,284,070 | 2,284,070 | ||||||
| Accrued liabilities | 3,236,106 | 3,236,106 | ||||||
| Deferred tax liabilities | 553,432 | 553,432 | ||||||
| Long-term bank loans | 644,939 | 644,939 | ||||||
| Total liabilities assumed | 12,124,410 | 12,124,410 | ||||||
| Net identifiable assets acquired | 15,321,901 | 15,321,901 | ||||||
| Goodwill | 27,588,883 | 27,588,883 | ||||||
| Net assets acquired | $ | 42,910,784 | $ | 42,910,784 | ||||
The fair value of accounts receivable acquired was $8,325,504, the same as the gross contractual accounts receivable acquired.
The identified intangible assets include acquired customer relationshipsrelationship of $529,162, with an estimated useful life of 5 years, and acquired order backlogs of $1,428,091, with an estimated useful life of 2 years. Intangible assets were valued using the multi-period excess earnings method.
The goodwill, which is not tax deductible, is primarily attributable to synergies expected to be achieved from the acquisition.acquisition, and was assigned to the mechanical and electrical solutions segment.
The Company recognized $351,836 of acquisition-related cost in general and administrative expenses in the statementsstatement of comprehensive income for the year ended June 30, 2012.
The following unaudited pro forma consolidated financial information reflects the results of the operations of the Company for the years ended June 30, 2010 and 2011, as if the acquisition of Concord described above had been completed as of July 1, 2009. The pro forma results have been prepared for comparative purposes only and do not purport to be indicative of what operating results would have been had the acquisition of Concord actually taken place on the date indicated and may not be indicative of future operating results. These amounts have been calculated after applying the Company's accounting policies and the pro forma adjustments are based upon available information and certain assumptions that management believes are reasonable.
| Year Ended June 30, | ||||||||
| 2010 | 2011 | |||||||
| (Unaudited) | (Unaudited) | |||||||
| Total revenues | $ | 199,341,604 | $ | 295,966,559 | ||||
| Net income attributable to Hollysys Automation Technologies Ltd. stockholders | 33,225,194 | 48,967,621 | ||||||
| Net income per ordinary share: | ||||||||
| Basic | 0.65 | 0.90 | ||||||
| Diluted | $ | 0.64 | $ | 0.89 | ||||
For the year ended June 30, 2012, Concord contributed approximately $24,237,402 to the Company’s total net revenues, and approximately $1,936,780 to the Company’s net income.
NOTE 4 - INVENTORIES
| NOTE 4 - | INVENTORIES |
Components of inventories are as follows:
| June 30, | ||||||||
| 2013 | 2014 | |||||||
| Raw materials | $ | 5,621,541 | $ | 8,045,675 | ||||
| Work in progress | 14,338,216 | 12,187,230 | ||||||
| Finished goods | 14,125,203 | 14,792,936 | ||||||
| Low value consumables | 19,097 | 27,402 | ||||||
| $ | 34,104,057 | $ | 35,053,243 | |||||
| June 30, | ||||||||
| 2011 | 2012 | |||||||
| Raw materials | $ | 8,470,007 | $ | 7,630,420 | ||||
| Work in progress | 4,776,610 | 5,242,369 | ||||||
| Finished goods | 14,660,932 | 13,869,692 | ||||||
| Low value consumables | 65,051 | 2,744 | ||||||
| $ | 27,972,600 | $ | 26,745,225 | |||||
| NOTE 5 - | ACCOUNTS RECEIVABLE |
NOTE 5 - ACCOUNTS RECEIVABLE
| June 30 | ||||||||
| 2011 | 2012 | |||||||
| Accounts receivable | $ | 108,694,045 | $ | 150,877,355 | ||||
| Allowance for doubtful accounts | (10,691,810 | ) | (14,287,361 | ) | ||||
| $ | 98,002,235 | $ | 136,589,994 | |||||
Of the total accounts receivable, $6,767,705 and nil as of June 30, 2011 and 2012, respectively, were pledged for short-term bank loans (note 14).
| June 30, | ||||||||
| 2013 | 2014 | |||||||
| Accounts receivable | $ | 196,701,304 | $ | 284,575,906 | ||||
| Allowance for doubtful accounts | (20,102,808 | ) | (25,690,771 | ) | ||||
| $ | 176,598,496 | $ | 258,885,135 | |||||
The movements in allowance for doubtful accounts are as follows:
| June 30, | June 30, | |||||||||||||||||||||||
| 2010 | 2011 | 2012 | 2012 | 2013 | 2014 | |||||||||||||||||||
| Balance at beginning of year | $ | 6,276,670 | $ | 8,408,318 | $ | 10,691,810 | $ | 10,691,810 | $ | 14,287,361 | $ | 20,102,808 | ||||||||||||
| Additions | 2,438,328 | 2,731,820 | 3,744,986 | 3,744,986 | 5,944,536 | 7,604,157 | ||||||||||||||||||
| Written off | (341,917 | ) | (903,768 | ) | (408,848 | ) | (408,848 | ) | (556,024 | ) | (2,103,547 | ) | ||||||||||||
| Exchange difference | 35,237 | 455,440 | 259,413 | 259,413 | 426,935 | 87,353 | ||||||||||||||||||
| Balance at end of year | $ | 8,408,318 | $ | 10,691,810 | $ | 14,287,361 | $ | 14,287,361 | $ | 20,102,808 | $ | 25,690,771 | ||||||||||||
| NOTE 6 - | COSTS AND ESTIMATED EARNINGS IN EXCESS OF BILLINGS |
| June, 30 | ||||||||
| 2013 | 2014 | |||||||
| Contracts costs incurred plus estimated earnings | $ | 754,514,008 | $ | 890,760,608 | ||||
| Less: Progress billings | (608,399,150 | ) | (705,233,024 | ) | ||||
| Cost and estimated earnings in excess of billings | 146,114,858 | 185,527,584 | ||||||
| Less: Allowance for doubtful accounts | (2,361,880 | ) | (5,839,403 | ) | ||||
| $ | 143,752,978 | $ | 179,688,181 | |||||
NOTE 6 - COSTS AND ESTIMATED EARNINGS IN EXCESS OF BILLINGS
| June, 30 | ||||||||
| 2011 | 2012 | |||||||
| Contract costs incurred plus estimated earnings | $ | 389,676,454 | $ | 573,517,664 | ||||
| Less: progress billings | (286,160,795 | ) | (458,356,428 | ) | ||||
| $ | 103,515,659 | $ | 115,161,236 | |||||
As of June 30, 20112013 and 2012,2014, balances of $11,351,985$16,548,951 and $16,762,243,$16,442,345 respectively, were related to contracts which arehave been completed but arewere still within the warranty period, included the amounts of $2,301,449which, $694,786 and $676,318$989,360, respectively, was expected to be collected after one year.
The movements in allowance for doubtful accounts are as follows:
| June, 30 | ||||||||||||
| 2012 | 2013 | 2014 | ||||||||||
| Balance at beginning of year | $ | 1,232,813 | $ | 1,890,108 | $ | 2,361,880 | ||||||
| Additions | 598,994 | 420,120 | 3,470,966 | |||||||||
| Exchange difference | 58,301 | 51,652 | 6,557 | |||||||||
| Balance at the end of the year | $ | 1,890,108 | $ | 2,361,880 | $ | 5,839,403 | ||||||
| NOTE 7 - | PROPERTY, PLANT AND EQUIPMENT |
NOTE 7 - PROPERTY, PLANT AND EQUIPMENT
A summary of property, plant and equipment is as follows:
| June 30, | ||||||||
| 2011 | 2012 | |||||||
| Buildings | $ | 41,388,443 | $ | 53,018,610 | ||||
| Machinery | 4,434,365 | 4,758,477 | ||||||
| Software | 2,798,335 | 3,573,146 | ||||||
| Vehicles | 1,282,623 | 1,607,261 | ||||||
| Electronic and other equipment | 16,218,118 | 16,991,624 | ||||||
| Construction in progress | 757,390 | 3,648,878 | ||||||
| 66,879,274 | 83,597,996 | |||||||
| Less: Accumulated depreciation | (13,297,961 | ) | (20,061,350 | ) | ||||
| $ | 53,581,313 | $ | 63,536,646 | |||||
| June 30, | ||||||||
| 2013 | 2014 | |||||||
| Buildings | $ | 57,745,469 | $ | 76,779,119 | ||||
| Machinery | 5,364,308 | 6,375,372 | ||||||
| Software | 3,143,292 | 3,717,526 | ||||||
| Vehicles | 3,240,058 | 4,122,134 | ||||||
| Electronic and other equipment | 18,630,226 | 20,681,622 | ||||||
| Construction in progress | 16,598,819 | 1,996,568 | ||||||
| 104,722,172 | 113,672,341 | |||||||
| Less: Accumulated depreciation | (25,225,857 | ) | (31,327,516 | ) | ||||
| $ | 79,496,315 | $ | 82,344,825 | |||||
Of the total
Total property, plant and equipment $32,504,272with carrying values of $1,125,846 and $35,819,745$3,880,946 were pledged to secure short-term bank loans (note 14) as of June 30, 20112013 and 2012, respectively, are2014, respectively.
Buildings and vehicles with a total carrying value of $39,651,261 and $35,113,985 were pledged for theto secure long-term bank loans as of June 30, 2013 and 2014, respectively (note 15).
Construction in progress consists of 1) capital expenditures and capitalized interest charges relating to the construction of facilities and assembly lines projects.projects, 2) expenditures related to the newly purchased SAP system in 2014. The related implementation of SAP system was still in process as at June 30, 2014. Interest of $1,102,772, $310,551,$102,577, $418,715 and $102,577$793,343 during the period of construction for the years ended June 30, 2010, 20112012, 2013 and 2012,2014, respectively, have been capitalized.
The depreciation expenses for the years ended June 30, 2010, 20112012, 2013 and 20122014 were $2,538,048, $4,334,113,$6,054,199, $6,223,644 and $6,054,199,$7,050,577, respectively.
Assets leased to others under operating leases
The Company has entered into an operating lease contract with a third party with respect to certain buildings with the carrying amount as shown below:
| June 30, | ||||||||
| 2013 | 2014 | |||||||
| Buildings at cost | $ | 10,846,090 | $ | 10,891,746 | ||||
| Less: accumulated depreciation | (3,193,260 | ) | (3,547,372 | ) | ||||
| Buildings, net | 7,652,830 | 7,344,374 | ||||||
At June 30, 2014, scheduled minimum rental payments to be received for buildings leased to others were:
| Year ending June 30, | ||||
| 2015 | $ | 1,490,150 | ||
| 2016 | 1,534,855 | |||
| 2017 | 1,580,900 | |||
| 2018 | 1,628,327 | |||
| 2019 and onwards | 9,223,624 | |||
| $ | 15,457,856 | |||
NOTE 8 - PREPAID LAND LEASES
| NOTE 8 - | PREPAID LAND LEASES |
A summary of prepaid land leases is as follows:
| June 30, | June 30, | |||||||||||||||
| 2011 | 2012 | 2013 | 2014 | |||||||||||||
| Prepaid land leases | $ | 6,734,503 | $ | 7,818,674 | $ | 13,768,644 | $ | 13,844,389 | ||||||||
| Less: Accumulated amortization | (562,624 | ) | (948,598 | ) | ||||||||||||
| Less: accumulated amortization | (1,138,980 | ) | (1,447,765 | ) | ||||||||||||
| $ | 6,171,879 | $ | 6,870,076 | $ | 12,629,664 | $ | 12,396,624 | |||||||||
The amortization for the years ended June 30, 2010, 20112012, 2013 and 20122014 were $144,994, $134,479,$171,204, $157,504 and $171,204,$244,948, respectively.
Of the total prepaid land leases, $5,285,678$2,118,147 and $5,291,525nil as of June 30, 20112013 and 2012,2014 respectively, are pledged forto secure the short-term bank loans (note 14); $10,803,737 and $6,517,385 as of June 30, 2013 and 2014, respectively, are pledged to secure the long-term bank loans (note 15).
The annual amortization of prepaid land leases for each of the five succeeding years as follows:
| Year ending June 30, | ||||
| 2015 | $ | 289,917 | ||
| 2016 | 289,917 | |||
| 2017 | 289,917 | |||
| 2018 | 289,917 | |||
| 2019 | 289,917 | |||
| $ | 1,449,585 |
| NOTE 9 - | ASSETS HELD FOR SALE |
NOTE 9 - ASSETS HELD FOR SALE
UponThe assets held for sale were $2,876,054 and $2,847,008 as at June 30, 2013 and 2014, respectively. The assets held for sale represented residential apartments located in Malaysia acquired through the completionacquisition of the new facilities in Beijing Economic-Technological Development Area, theBond. The Company relocated its headquarters to the new facilities in August 2010, and intendedentered into several agreements to dispose eight apartments held for sale amounting to $400,466 The Company was in the process of transferring the previous headquarters in Beijing Xisanqi, which was comprisedtitles of a prepaid land lease and buildings, with an aggregate carrying amount of $8,945,718these properties as of June 30, 2011.2014 and expects the transactions to be consummated within the next twelve months. The previous headquarters were recognized as assets heldCompany has engaged another real estate agent to market the remaining apartments for sale as of June 30, 2011.sale.
However, during the year ended June 30, 2012, due to the state macro-control on the real estate market in the PRC, the Company decided not to dispose of the previous headquarters in Beijing Xisanqi, and reclassified them from assets held for sale to prepaid land lease and property, plant and equipment as of June 30, 2012, respectively. Upon reclassification, each asset was recorded at the carrying amount before it was classified as held for sale, adjusted for any amortization or depreciation that would have been recognized had the asset been continuously classified as held and used, which was lower than its fair value. The effect on the results of operations related to amortization and depreciation charges for the year ended June 30, 2012 amounted to $281,270.
| NOTE 10 - | ACQUIRED INTANGIBLE ASSETS, NET |
NOTE 10 - ACQUIRED INTANGIBLE ASSETS, NET
| June 30, | June 30, | |||||||||||||||||||||||||||||||||||||||||||||||
| 2011 | 2012 | 2013 | 2014 | |||||||||||||||||||||||||||||||||||||||||||||
| Gross carrying value | Accumulated amortization | Net carrying value | Gross carrying value | Accumulated amortization | Net carrying value | Gross carrying value | Accumulated amortization | Net carrying value | Gross carrying value | Accumulated amortization | Net carrying value | |||||||||||||||||||||||||||||||||||||
| Customer relationships | $ | - | - | - | $ | 529,162 | (105,832 | ) | 423,330 | $ | 3,359,877 | (355,274 | ) | 3,004,603 | $ | 3,403,455 | (1,070,921 | ) | 2,332,534 | |||||||||||||||||||||||||||||
| Order backlog | - | - | - | 1,428,091 | (1,256,450 | ) | 171,641 | 12,632,770 | (3,819,777 | ) | 8,812,993 | 12,796,622 | (8,619,585 | ) | 4,177,037 | |||||||||||||||||||||||||||||||||
| $ | - | - | - | $ | 1,957,253 | (1,362,282 | ) | 594,971 | ||||||||||||||||||||||||||||||||||||||||
| $ | 15,992,647 | (4,175,051 | ) | 11,817,596 | $ | 16,200,077 | (9,690,506 | ) | 6,509,571 | |||||||||||||||||||||||||||||||||||||||
The intangible assetscustomer relationship and order backlog were related to Concord and Bond, which waswere acquired on July 1, 2011.2011 and April 1, 2013, respectively. The amortization for the years ended June 30, 2010, 20112012, 2013 and 20122014 were nil, nil,$1,362,282, $2,847,773 and $1,362,282,$5,412,766, respectively. EstimatedThe weighted-average remaining amortization periods for customer relationships, order backlog and total intangible assets are 2.24, 1.00 and 1.44 years as of June 30, 2014.
The annual amortization expense relating to the existing intangible assets for each of next five succeeding years is as follows:
| Year ending June 30, | ||||
| 2013 | $ | 277,473 | ||
| 2014 | 105,832 | |||
| 2015 | 105,832 | |||
| 2016 | 105,834 | |||
| 2017 | - | |||
| $ | 594,971 | |||
| Year ending June 30, | ||||
| 2015 | $ | 4,880,305 | ||
| 2016 | 703,268 | |||
| 2017 | 599,198 | |||
| 2018 | 326,800 | |||
| $ | 6,509,571 |
NOTE 11 - GOODWILL
| NOTE 11 - | GOODWILL |
The changes in the carrying amount of goodwill are as follows:
| June 30, | ||||||||
| 2013 | 2014 | |||||||
| Balance at beginning of year | $ | 27,588,883 | $ | 65,787,020 | ||||
| Goodwill acquired (note 3) | 39,751,123 | - | ||||||
| Translation adjustments | (1,552,986 | ) | 853,283 | |||||
| $ | 65,787,020 | $ | 66,640,303 | |||||
As of June 30, 2014, the fair value of Concord is estimated to be $47,594,075, which represents a $3,984,788 or 9.1% headroom compared to the carrying amount of $43,609,287. There are several key assumptions adopted in the fair value evaluation process including the weighted average cost of capital (“WACC”) rate and long-term growth (“LTG”) rate. If the LTG rate adopted increased or decreased by 1.0%, the fair value of Concord would increase or decrease by $1,759,808 and $1,523,619, respectively. If the WACC rate adopted increased or decreased by 1.0%, the fair value of Concord would decrease or increase by $5,967,174 and $3,688,551, respectively.
| June 30, | ||||||||
| 2011 | 2012 | |||||||
| Balance at beginning of year | $ | - | $ | - | ||||
| Goodwill acquired (note 3) | - | 27,588,883 | ||||||
| Impairment losses | - | - | ||||||
| Balance at end of year | $ | - | $ | 27,588,883 | ||||
NOTE 12 - INVESTMENTS IN EQUITY AND COST INVESTEES
| NOTE 12 - | INVESTMENTS IN EQUITY AND COST INVESTEES |
The following long-term investments were accounted for under either the equity method or cost method.
| June 30, 2012 | Interest held | Long-term investment, at cost, less impairment | Share of undistributed profits | Advance to investee company | Total | |||||||||||||||
| Equity method | ||||||||||||||||||||
| China Techenergy Co., Ltd. | 40.00 | % | $ | 5,691,790 | $ | 943,733 | $ | 46,610 | $ | 6,682,133 | ||||||||||
| Beijing Hollysys Electric Motor Co., Ltd. | 40.00 | % | 837,348 | 2,421,214 | - | 3,258,562 | ||||||||||||||
| Beijing IPE Biotechnology Co., Ltd. (“IPE”) | 23.39 | % | 1,559,290 | 1,354,973 | - | 2,914,263 | ||||||||||||||
| New Huake Electric Technology Co., Ltd. | 37.50 | % | 237,158 | (237,158 | ) | - | - | |||||||||||||
| Beijing Hollysys Machine Automation Co., Ltd. | 30.00 | % | 474,316 | (248,345 | ) | - | 225,971 | |||||||||||||
| $ | 8,799,902 | $ | 4,234,417 | $ | 46,610 | $ | 13,080,929 | |||||||||||||
| Cost method | ||||||||||||||||||||
| Shenhua Hollysys Information Technology Co., Ltd. | 20.00 | % | $ | 1,505,385 | $ | - | $ | - | $ | 1,505,385 | ||||||||||
| Zhongjijing Investment Consulting Co., Ltd. | 5.00 | % | 316,211 | - | - | 316,211 | ||||||||||||||
| Heilongjiang Ruixing Technology Co., Ltd. | 8.31 | % | 1,080,179 | - | - | 1,080,179 | ||||||||||||||
| Zhejiang Sanxin Engineering Co., Ltd. | 6.00 | % | 94,863 | - | - | 94,863 | ||||||||||||||
| $ | 2,996,638 | $ | - | $ | - | $ | 2,996,638 | |||||||||||||
| June 30, 2011 | Interest held | Long-term investment, at cost, less impairment | Share of undistributed profits | Advance to investee company | Total | |||||||||||||||
| Equity method | ||||||||||||||||||||
| China Techenergy Co., Ltd. | 50.00 | % | $ | 6,953,458 | $ | 2,994,512 | $ | 45,554 | $ | 9,993,524 | ||||||||||
| Beijing Hollysys Electric Motor Co., Ltd. | 40.00 | % | 818,367 | 2,020,888 | - | 2,839,255 | ||||||||||||||
| New Huake Electric Technology Co., Ltd. | 37.50 | % | 231,782 | (92,350 | ) | - | 139,432 | |||||||||||||
| Beijing IPE Biotechnology Co., Ltd. | 23.39 | % | 1,523,944 | 1,099,935 | - | 2,623,879 | ||||||||||||||
| $ | 9,527,551 | $ | 6,022,985 | $ | 45,554 | $ | 15,596,090 | |||||||||||||
| Cost method | ||||||||||||||||||||
| Shenhua Hollysys Information Technology Co., Ltd. | 20.00 | % | $ | 1,471,261 | $ | - | $ | - | $ | 1,471,261 | ||||||||||
| Hollysys Equipment Technology Co., Ltd. | 20.00 | % | 46,356 | - | - | 46,356 | ||||||||||||||
| Zhejiang Sanxin Engineering Co., Ltd. | 6.00 | % | 92,713 | - | - | 92,713 | ||||||||||||||
| Zhongjijing Investment Consulting Co., Ltd. | 5.00 | % | 309,043 | - | - | 309,043 | ||||||||||||||
| Heilongjiang Ruixing Technology Co., Ltd. | 8.31 | % | 1,055,689 | - | - | 1,055,689 | ||||||||||||||
| $ | 2,975,062 | $ | - | $ | - | $ | 2,975,062 | |||||||||||||
In July 2010, the Company entered into an agreement to dispose of 29% of its 49% equity interest in Shenhua Hollysys Information Technology Co., Ltd.(“Shenhua Information”, formerly known as Hollysys Information Technology Co., Ltd.) to the other equity interest owner, for a cash consideration of RMB 23,377,700 (equivalent to $3,526,793), and a gain of $1,443,994 was recognized in the consolidated statements of comprehensive income for the year ended June 30, 2011. Upon the disposal, the Company held a 20% equity interest of Shenhua Information, and lost the ability to exercise significant influence in Shenhua Information. The Company discontinued accruing its share of the earnings or losses of Hollysys Information and adopted the cost method to account for the remaining 20% equity interest of Shenhua Information upon the partial disposal of Shenhua Information.as indicated:
| June 30, 2014 | Interest held | Long-term investment, at cost, less impairment | Share of undistributed profits | Advance to investee company | Total | |||||||||||||||
| Equity method | ||||||||||||||||||||
| China Techenergy Co., Ltd. | 40.00 | % | $ | 9,751,658 | (2,570,575 | ) | 47,913 | 7,228,996 | ||||||||||||
| Beijing Hollysys Electric Motor Co., Ltd. | 40.00 | % | 860,770 | 3,144,435 | - | 4,005,205 | ||||||||||||||
| Beijing IPE Biotechnology Co., Ltd. | 23.39 | % | 1,602,905 | 1,926,062 | - | 3,528,967 | ||||||||||||||
| New Huake Electronic Technology Co., Ltd. | 37.50 | % | 243,791 | (243,791 | ) | - | - | |||||||||||||
| Beijing Hollysys Machine Automation Co., Ltd. | 30.00 | % | 487,583 | (441,182 | ) | - | 46,401 | |||||||||||||
| Southcon Development Sdn. Bhd. | 30.00 | % | 280,227 | (27,742 | ) | - | 252,485 | |||||||||||||
| $ | 13,226,934 | 1,787,207 | 47,913 | 15,062,054 | ||||||||||||||||
| Cost method | ||||||||||||||||||||
| Shenhua Hollysys Information Technology Co., Ltd. | 20.00 | % | $ | 2,576,955 | - | - | 2,576,955 | |||||||||||||
| Heilongjiang Ruixing Technology Co., Ltd. | 8.31 | % | 1,761,386 | - | - | 1,761,386 | ||||||||||||||
| Zhongjijing Investment Consulting Co., Ltd. | 5.00 | % | - | - | - | - | ||||||||||||||
| Zhejiang Sanxing Technology Co., Ltd. | 6.00 | % | 97,517 | - | - | 97,517 | ||||||||||||||
| $ | 4,435,858 | - | - | 4,435,858 | ||||||||||||||||
| June 30, 2013 | Interest held | Long-term investment, at cost, less impairment | Share of undistributed profits | Advance to investee company | Total | |||||||||||||||
| Equity method | ||||||||||||||||||||
| China Techenergy Co., Ltd. | 40.00 | % | $ | 5,826,468 | 2,917,828 | 47,713 | 8,792,009 | |||||||||||||
| Beijing Hollysys Electric Motor Co., Ltd. | 40.00 | % | 857,161 | 2,863,374 | - | 3,720,535 | ||||||||||||||
| Beijing IPE Biotechnology Co., Ltd. | 23.39 | % | 1,596,186 | 1,666,155 | - | 3,262,341 | ||||||||||||||
| New Huake Electronic Technology Co., Ltd. | 37.50 | % | 242,770 | (242,770 | ) | - | - | |||||||||||||
| Beijing Hollysys Machine Automation Co., Ltd. | 30.00 | % | 485,539 | (450,675 | ) | - | 34,864 | |||||||||||||
| Southcon Development Sdn. Bhd. | 30.00 | % | 283,117 | (29,135 | ) | - | 253,982 | |||||||||||||
| $ | 9,291,241 | 6,724,777 | 47,713 | 16,063,731 | ||||||||||||||||
| Cost method | ||||||||||||||||||||
| Shenhua Hollysys Information Technology Co., Ltd. | 20.00 | % | $ | 1,541,005 | - | - | 1,541,005 | |||||||||||||
| Heilongjiang Ruixing Technology Co., Ltd. | 8.31 | % | 1,754,003 | - | - | 1,754,003 | ||||||||||||||
| Zhongjijing Investment Consulting Co., Ltd. | 5.00 | % | 323,693 | - | - | 323,693 | ||||||||||||||
| Zhejiang Sanxin Technology Co., Ltd. | 6.00 | % | 97,107 | - | - | 97,107 | ||||||||||||||
| $ | 3,715,808 | - | - | 3,715,808 | ||||||||||||||||
In December 2010, the Company disposed of all its investment in Zhejiang Sanxin Technology Co., Ltd at cost with nil gain or loss recognized.
In November 2010, the Company entered into an agreement to dispose of 3.115% of its 31.15% equity interest in IPE to a third party, for a cash consideration of RMB 934,500 (equivalent to $140,980), and a loss of $43,461 was recognized in the consolidated statements of comprehensive income for the year ended June 30, 2011. The Company continued to hold a 28.035% equity interest in IPE after the disposal.
In April 2011, a third party invested RMB 30,000,000 (equivalent to $4,525,843) into IPE. As a result, the Company’s equity interest in IPE was diluted from 28.035% to 23.39%, while the share of net assets from IPE increased by $756,619. This increase in share of net assets from IPE was recognized as gain in earnings for the issuance of shares by an equity investee in the consolidated statements of comprehensive income during the year ended June 30, 2011.
In August 2011, the Company entered into an agreement to dispose all of its 20% interest in Hollysys Equipment Technology Co., Ltd., for a cash consideration of RMB 280,700RMB280,700 (equivalent to $44,381), and a loss of $3,039 was recognized in gain on disposal of long term investments in equity investees in the consolidated statements of comprehensive income for the year ended June 30, 2012.
In November 2011, the Company entered into an agreement to dispose of 10% of its existing 50% equity interest in China Techenergy Co., Ltd. (“China Techenergy”) to the other equity interest owner, for a cash consideration of RMB 27,800,000RMB27,800,000 (equivalent to $4,395,326), and a gain of $2,047,016 was recognized in gain on disposal of investments in equity investeeslong term investment in the consolidated statements of comprehensive income for the year ended June 30, 2012. Upon the disposal, the Company held a 40% equity interest of China Techenergy Co., Ltd.Techenergy.
In February 2012, Beijing Hollysys Machine Automation Co., Ltd. (“Hollysys Machine”) was established with a registered capital of RMB 10,000,000RMB10,000,000 (equivalent to $1,588,310), of which RMB 3,000,000RMB3,000,000 (equivalent to $476,493) was injected by the Company. Therefore, theThe Company held a 30% interestsinterest in Hollysys Machine, and accounted for it under the equity method. Hollysys Machine mainly engages in sales of Programmable Logic Controllerprogrammable logic controller products.
In April 2013, the Company acquired a 30% equity interest of Southcon Development Sdn. Bhd., as a result of the acquisition of Bond.
For the year ended June 30, 2013, the Company recorded dividend income of $833,567 from Heilongjiang Ruixing Technology Co., Ltd., an investee which is accounted for by the Company under the cost method, out of which $195,816 was received during the year ended June 30, 2014.
For the year ended June 30, 2014, the Company received dividend of $2,407,757 from China Techenergy Co., Ltd, an investee which is accounted for by the Company under the equity method.
In December 2013, the Company made an additional cash injection of RMB 24,000,000 (equivalent to $3,900,663) into China Techenergy which increased the investment cost in China Techenergy to RMB 60,000,000 (equivalent to $9,751,658). The other investor has also made additional cash injection that corresponds with their portion of the investment in China Techenergy, therefore the Company’s percentage of interest in China Techenergy remains the same at 40% and the Company continues to use equity method to account for the investment.
For the year ended June 30, 2014, the Company recognized an impairment loss of RMB2,000,000 (equivalent to $325,373) against the investment in Zhongjijing Investment Consulting Co., Ltd (“Zhongjijing”). As a result, the balance of investment in Zhongjijing was reduced to nil as of June 30, 2014. Zhongjijing has ceased operations and the Company expected that the recoverable amount of the investment in Zhongjijing to be nil.
The Company holds a 20% equity interest of Shenhua Hollysys Information Technology Co. Ltd. (“Shenhua Information”), but uses the cost method to account for the investment because:
1) Only one out of the five board representatives is elected by the Company and the remaining 80% equity interest is held by a large state-owned company which, in the view of the management, operates Shenhua Information without regards to the views of the Company;
2) Key management of Shenhua Information including the chief executive officer, chief financial officer, chief operating officer and head of accounting are all appointed by the other shareholder.
3) Based on the articles of association of Shenhua Information, there are no matters that require unanimous approval of all shareholders and there are no participating rights for noncontrolling shareholders.
| NOTE 13 - | WARRANTY LIABILITIES |
NOTE 13 - WARRANTY LIABILITIES
| June 30, | ||||||||
| 2013 | 2014 | |||||||
| Beginning balance | $ | 3,575,920 | $ | 3,960,641 | ||||
| Expense accrued | 1,502,131 | 7,433,104 | ||||||
| Expense incurred | (1,206,893 | ) | (3,790,594 | ) | ||||
| Exchange difference | 89,483 | 13,180 | ||||||
| $ | 3,960,641 | $ | 7,616,331 | |||||
| Less: current portion of warranty liabilities | (1,865,784 | ) | (4,013,521 | ) | ||||
| Long-term warranty liabilities | $ | 2,094,857 | $ | 3,602,810 | ||||
| June 30, | ||||||||
| 2011 | 2012 | |||||||
| Beginning balance | $ | 1,916,654 | $ | 2,798,800 | ||||
| Expense accrued | 1,912,880 | 3,031,835 | ||||||
| Expense incurred | (1,143,953 | ) | (2,319,630 | ) | ||||
| Exchange difference | 113,219 | 64,915 | ||||||
| $ | 2,798,800 | $ | 3,575,920 | |||||
NOTE 14 - SHORT-TERM BANK LOANS
| NOTE 14 - | SHORT-TERM BANK LOANS |
On June 30, 2011,2013, the Company’s short-term bank borrowings consisted of revolving bank loans of $11,528,465$8,329,263 from several banks. The short-term bank loans were fully repaid during the year ended June 30, 2012.
As of June 30, 2011, the short-term borrowings of $11,528,465banks, which were subject to annual interest rates ranging from 5.85%2.84% to 8.1765%5.97%, with a weighted average interest rate of 7.37%4.07%, of which $6,767,705$4,645,907 was collateralized by a pledge of certain accounts receivable,guarantee amounting to $6,767,705.$4,855,390 with restricted cash of the same amount deposited in the bank. The remaining borrowings were without any guarantee orare secured by the pledge of assets.guarantee amounting to $1,334,025 with restricted cash, building and prepaid land leases with carrying values of $1,125,846 and $2,118,147 as of June 30, 2013, respectively.
On June 30, 2014, the Company’s short-term bank borrowings consisted of revolving bank loans of $4,493,846 from several banks, which were subject to annual interest rates ranging from 0.24% to 1.32%, with a weighted average interest rate of 1.11%. The short-term loan are secured by the pledge of guarantee amounting to $5,384,628 with restricted cash and buildings with carrying values of $1,503,683 and $3,880,946 as of June 30, 2014, respectively.
For the years ended June 30, 2010, 2011,2012, 2013, and 2012,2014, interest expenses on short-term bank loans amounted to $91,076, $117,507$557,333, $391,785 and $557,333,$5,057 respectively.
As of June 30, 2013, the Company had available lines of credit from various banks in the PRC and Malaysia amounting to $173,032,443, of which $21,325,707 was utilized and $151,706,736 is available for use. These line of credit were secured by a pledge restricted cashes and buildings amounting to $7,003,594.
As of June 30, 2014, the Company had available lines of credit from various banks in the PRC and Malaysia amounting to $173,669,721, of which $34,337,337 was utilized and $139,332,384 is available for use. These line of credit were secured by a pledge restricted cashes and buildings amounting to $7,940,641.
| NOTE 15 - | LONG-TERM BANK LOANS |
NOTE 15 - LONG-TERM BANK LOANS
| June 30, | ||||||||||||||||||||||
| 2011 | 2012 | June 30, | ||||||||||||||||||||
| 2013 | 2014 | |||||||||||||||||||||
| RMB-denominated loan | (i) | $ | 37,085,110 | $ | 32,411,580 | (i) | $ | 25,086,183 | $ | 17,065,401 | ||||||||||||
| USD-denominated loan | (ii) | - | 4,663,143 | |||||||||||||||||||
| SGD denominated loan | (iii) | 562,646 | 53,802 | |||||||||||||||||||
| MYR-denominated loan | (ii) | - | 144,462 | (iiii) | 2,126,984 | 1,713,179 | ||||||||||||||||
| 37,085,110 | 32,556,042 | |||||||||||||||||||||
| 27,775,813 | 23,495,525 | |||||||||||||||||||||
| Less: current portion | (5,408,245 | ) | (7,914,668 | ) | (8,671,080 | ) | (8,517,268 | ) | ||||||||||||||
| $ | 19,104,733 | $ | 14,978,257 | |||||||||||||||||||
| $ | 31,676,865 | $ | 24,641,374 | |||||||||||||||||||
| The RMB denominated loan is repayable |
| ii. | The USD denominated loan is repayable in one installment by July 31, 2015. It carries an annual interest rate of 3.03%. The loan is secured by restricted cash amounting to $5,103,368 as of June 30, 2014. |
| The |
| iv. | The MYR denominated loans are repayable in two to 104 installments with the last installment due on February 28, 2023. For the year ended June 30, 2014, the effective interest rates ranged from 4.17% to 8.6% per annum. The borrowings are secured by the mortgages of buildings, vehicles, and prepaid land leases in Malaysia, with a total carrying value of |
Scheduled principal payments for all outstanding long-term borrowings onas of June 30, 20122014 are as follows:
| Year ending June 30, | ||||||||
| 2013 | $ | 7,914,668 | ||||||
| 2014 | 7,915,337 | |||||||
| 2015 | 7,916,055 | $ | 8,517,268 | |||||
| 2016 | 8,707,351 | 14,148,589 | ||||||
| 2017 | 12,384 | 376,085 | ||||||
| 2018 and onwards | 90,247 | |||||||
| 2018 | 361,788 | |||||||
| 2019 | 32,818 | |||||||
| 2020 and onwards | 58,977 | |||||||
| $ | 32,556,042 | $ | 23,495,525 | |||||
For the years ended June 30, 2010, 2011,2012, 2013, and 2012,2014, interest of $2,398,459, $2,396,133$2,642,998, $2,196,597 and $2,642,998$2,791,654 was incurred;incurred, of which $1,295,687, $2,085,582$2,540,421, $1,777,882 and $2,540,421$1,998,311 was charged to interest expenses, and $1,102,772, $310,551,$102,577, $418,715 and $102,577$793,343 was capitalized as construction in progress, respectively.
| NOTE 16 - | FAIR VALUE MEASUREMENT |
NOTE 16 - LONG-TERM BOND PAYABLE
In December 2007, Beijing HollysysFinancial instruments include cash and cash equivalents, time deposits with maturities over three independent thirdmonths, accounts receivable, other receivables, amounts due to or from related parties, entered into an agreement with the underwritersaccounts payable, short-term bank loans and long-term bank loans. The carrying values of these financial instruments, other than long-term bank loans approximate their fair values due to issue bonds to institutional and public investors in the PRC with an aggregate principal amount of RMB 305,000,000 (equivalent to $44,466,475). Pursuant to the agreement, Beijing Hollysys issued RMB 80,000,000 (equivalent to $11,663,338) of bond (the “Bond”) for the purpose of technology improvement and industrial implementation of certain technology.their short-term maturities. The Bond carried interest at a rate of 6.68% per annum, which was payable semi-annually and matured in December 2010. Related to the Bond, Beijing Zhongguancun Science and Technology Guaranty Co., Ltd. undertook joint and several guarantee liabilities in full in favor of Beijing Hollysys. Concurrently, the China Development Bank authorized its business department to undertake general guarantee liability in respectcarrying value of the guaranteeCompany’s long-term bank loan approximates its fair value as the long-term bank loans are subject to floating interest rates. These assets and liabilities, of Beijing Zhongguancun Scienceexcluding cash and Technology Guaranty Co., Ltd. The Bond issuing costs were RMB 1,254,054 (equivalent to $183,559). Such issuing costs were amortized during the three-year termcash equivalents (which fall into level 1 of the Bond and any unamortized issuing cost was presented as long-term deferred expenses onfair value hierarchy), fall into level 2 of the balance sheet. The long term bond was fully repaid in December 2010.fair value hierarchy.
For the year ended June 30, 2010, 2011,2014, the Company recognized an impairment loss of RMB2,000,000 (equivalent to $325,373) against the investment in Zhongjijing. As a result, the balance of investment in Zhongjijing was reduced to nil as of June 30, 2014. Zhongjijing has ceased and 2012, the related interest expense amountedCompany expected that the recoverable amount of the investment in Zhongjijing to $792,510, $342,684,be nil.
Liabilities measured or disclosed at fair value as of June 30, 2013, and nil, respectively.2014 are stated below:
| June 30, 2013 | ||||||||||||||||
| Quoted prices in active markets for identical assets | Significant other observable inputs | Significant unobservable inputs | ||||||||||||||
| (Level 1) | (Level 2) | (Level 3) | Total | |||||||||||||
| Liabilities: | ||||||||||||||||
| Acquisition-related consideration(i) | $ | - | $ | - | $ | 22,691,011 | $ | 22,691,011 | ||||||||
| June 30, 2014 | ||||||||||||||||
| Quoted prices in active markets for identical assets | Significant other observable inputs | Significant unobservable inputs | ||||||||||||||
| (Level 1) | (Level 2) | (Level 3) | Total | |||||||||||||
| Liabilities: | ||||||||||||||||
| Acquisition-related consideration(i) | $ | - | $ | - | $ | 30,679,651 | $ | 30,679,651 | ||||||||
| (i) | Acquisition-related consideration represents the fair value of Incentive Shares for Bond (note 3). The fair value of thecontingent consideration in connection with the acquisition was estimated using probability-weighted discounted cash flow models. Key assumptions include discount rate, a percent weighted-probability of Bond achieving net income performance targets and a percent weighted-probability of Bond achieving CAGR performance targets. The significant unobservable inputs used in the fair value measurement of the acquisition-related consideration includethe average future share price from October 1 to December 31, 2014, probability weighting of forecasted future net income performance and forecasted future CAGR performance of Bond, which are based on assumptions developed by management. The forecasted achievement of CAGR of Bond net income is 25%. The average future share price from October 1 to December 31, 2014 is estimated using Monte Carlo model stimulation. Significant changes in forecasted net income and forecasted CAGR of Bond and the average future share price from October 1 to December 31, 2014 would result in a significantly higher or lower fair value measurement. As of June 30, 2013 and June 30, 2014, the fair value of theacquisition-related consideration in connection with Bond totaled $22,691,010 and $30,679,651, respectively. The changes in fair value ofacquisition-related consideration in connection with the Bond acquisition is shown in the following table: |
| Fair value measurements as of June 30, 2014 using significant unobservable inputs | ||||
| (Level 3) | ||||
| Contingent consideration in connection with Bond acquisition | ||||
| Initial recognition as at acquisition date of April 1, 2013 | $ | 21,836,462 | ||
| Change in fair-value (included within other expenses, net) | 854,549 | |||
| Balance as at June 30, 2013 | $ | 22,691,011 | ||
| Change in fair-value (included within other expenses, net) | 7,988,640 | |||
| Balance as at June 30, 2014 | $ | 30,679,651 | ||
NOTE 17 - STOCKHOLDERS’ EQUITY
On July 1, 2009, the Company acquired 1.78% equity interest of Beijing Hollysys from the noncontrolling stockholders for cash consideration of RMB 18,000,000 (equivalent to $2,638,793).
On December 23, 2009, the Company entered into a Share Purchase Agreement with a noncontrolling stockholder, Unionway Resources Limited, to acquire further 24.11% equity interest of Beijing Hollysys, by issuing 4,413,948 ordinary shares of the Company with a fair value of $53,011,515 and making a cash payment of RMB 67,634,366 (equivalent to $9,936,203). The 4,413,948 shares were issued on March 16, 2010.
According to ASC 810,Consolidation, these noncontrolling interest acquisitions were recognized as equity transactions, and the difference between the consideration paid and the carrying amount of the 1.78% and 24.11% equity interest in Beijing Hollysys amounting approximately to $1,414,108, and $44,586,023, respectively, was recognized as additional paid in capital during the year ended June 30, 2010.
| STOCKHOLDERS’ EQUITY |
The Company issued a unit purchase option to the representative of the underwriters of the Company’s August 2005 initial public offering, or the UPO. The UPO is exercisable for 250,000 units, comprised of 250,000 of the Company’s ordinary shares and 500,000 warrants, each warrant to purchase one ordinary share. The part of underlying warrants expired in 2009 pursuant to the terms of the UPO.In April 2010, the holders of the Unit Purchase Options (“UPO”) exercised 250,000 of the UPO on a cashless basis, and 92,567 ordinary shares were issued to the UPO holders on June 3, 2010. There were no UPO outstanding after the exercise.
In August 2010, the Board of Directors adopted the 2010 Rights Plan. The 2010 Rights Plan provides for a dividend distribution of one preferred share purchase (the “Right”), for each outstanding ordinary share.share. Each Right entitles the shareholder to buy one share of the Class A Preferred Stock at an exercise price of $160. The Right will become exercisable if a person or group announces an acquisition of 20% or more of the outstanding ordinary shares of the Company, or announces commencement of a tender offer for 20% or more of the ordinary shares. In that event, the Rights permitRight permits shareholders, other than the acquiring person,to purchasethe Company’s ordinary shares having a market value of twice the exerciseexercise price of the Rights,Right, in lieu of the Class A Preferred Stock. In addition, in the event of certain business combinations, the Rights permitRight permits the purchase of the ordinary shares of an acquiring person at a 50% discount. RightsRight held by the acquiring person becomebecomes null and void in each case. Unless terminated earlier by the Board of Directors, the 2010 Rights Plan will expire on September 27, 2020. There is no accounting impact related to the Right.
On May 30, 2013, pursuant to the terms of the acquisition of Bond, the Company issued 1,407,907 ordinary shares as partial consideration during the year ended June 30, 2013 (note 3).
NOTE 18 - SHARE BASED COMPENSATION EXPENSES
| NOTE 18 - | SHARE-BASED COMPENSATION EXPENSES |
On September 20, 2007, the Company adopted the “2006 Stock Plan” (the “Plan”) which allows the Company to offer a variety of incentive awards to employees, officers, directors and consultants. Options to purchase 3,000,000 ordinary shares are authorized under the Plan. The Company issues new shares to employees, officers, directors and consultants upon share option exercise or share unit conversion.
Share options
On February 1,The Company granted 696,000 share options in 2008 and June 2, 2008, options to purchase 186,000 and 60,000 ordinary shares were granted to directors of the Company2009 under the terms ofPlan. All the Plan. 186,000 and 60,000 options were granted with exercise prices of $7.90 and $5.85 per share respectively, of which 231,000 options had an expiry period of five years from the date of grantbeen vested and vested over a period of three years,exercised by June 30, 2013, and 15,000 options had an expiry period of one year from the date of grant with immediate vesting. The 15,000 options were not exercised and have expired.
On January 20, 2009, options to purchase 450,000 ordinary shares were granted to one employee under the terms of the Plan. They were granted with an exercise price of $2.24 per share, with an expiry period of 10 years from the date of grant and vest over a period of 3 years.
A summary of thethere was no share option activity under the Plan for the year ended June 30, 2012 is as follows:2014.
| Share Options | Number of shares | Weighted average exercise price | Weighted average remaining contractual life (years) | Aggregate intrinsic value | ||||||||||||
| Outstanding at June 30, 2011 | 438,000 | $ | 3.74 | 5.75 | $ | 2,444,040 | ||||||||||
| Exercised | (300,000 | ) | 2.24 | 7.08 | 1,860,782 | |||||||||||
| Outstanding at June 30, 2012 | 138,000 | $ | 7.01 | 0.73 | $ | 208,380 | ||||||||||
| Vested and expected to vest at June 30, 2012 | 138,000 | $ | 7.01 | 0.73 | $ | 208,380 | ||||||||||
| Exercisable at June 30, 2012 | 138,000 | $ | 7.01 | 0.73 | $ | 208,380 | ||||||||||
The total intrinsic value of share options exercised during the years ended June 30, 2010, 20112012, 2013 and 2014 was $1,860,782, $663,330 and nil, respectively. The fair value of share options vested during the years ended June 30, 2012, 2013 and 2014 was $2,496,360, nil $2,640,820 and $1,860,782,nil, respectively. No share options were exercised during the year ended June 30, 2014.
The Company recorded share basedshare-based compensation expense relating to share options of $524,076, $456,628,$202,125, nil and $202,125,nil which is included in general and administrative expenses, for the years ended June 30, 2010, 20112012, 2013 and 2012,2014, respectively. As of June 30, 2012,2014, there iswas no unrecognized share basedshare-based compensation expense to be recognized for the above share options.
Performance options
On February 20, 2012, performance share options to purchase 1,476,000 ordinary shares were granted to certain employees of the Company under the terms of the Plan. They were granted with an exercise price of $9.29 per share, had an expiry period of five years from the date of grant, and would vest subject to the service and performance conditions shown below:
| · | For 60,000 options, if the Company’s Price/Earnings Ratio (“P/E”) achieves |
| · | For 1,416,000 options, if the compound average growth rate of the Company’s Non-GAAP diluted earnings per share as defined in the Plan from the year ended June 30, 2011 to the year ended June 30, 2014 (the “EPS |
| EPS Threshold | Number of vested options | Months after the grant date | ||||||||||||
| 24 months | 36 months | 48 months | ||||||||||||
| Over 15% but below 20% | 944,000 | 283,200 | 283,200 | 377,600 | ||||||||||
| Equal or over 20% but below 25% | Additional 236,000 | - | - | 236,000 | ||||||||||
| 25% or above | Additional 236,000 | - | - | 236,000 | ||||||||||
| Total | 283,200 | 283,200 | 849,600 | |||||||||||
The options will remain exercisable from the vesting date until the 60 month anniversary of the grant date. For the years ended June 30, 2012 and 2013, the Company estimated that the additional 472,000 options (related to the EPS threshold at or above 20%) were not expected to vest. However, given the Company’s performance achieved in the year ended June 30, 2014, the performance target was met and all of the 1,416,000 options will vest. As a result, share-based compensation expenses of $1,221,705 were recorded in the year ended June 30, 2014. The additional share-based compensation expenses due to the change in the Company’s performance estimates resulted in reductions of net income, basic earnings per share, and diluted earnings per share by $1,221,705, $0.02 and $0.02, respectively.
A summary of the performance share option activity under the Plan for the year ended June 30, 20122014 is as follows:
| Performance options | Number of shares | Weighted average exercise price | Weighted average remaining contractual life (years) | Aggregate intrinsic value | ||||||||||||
| Outstanding at June 30, 2011 | - | $ | - | - | $ | - | ||||||||||
| Granted | 1,476,000 | 9.29 | 5 | - | ||||||||||||
| Exercised | - | - | - | - | ||||||||||||
| Forfeited or expired | - | - | - | - | ||||||||||||
| Outstanding at June 30, 2012 | 1,476,000 | $ | 9.29 | 4.64 | $ | - | ||||||||||
| Vested and expected to vest at June 30, 2012 | 1,180,000 | $ | 9.29 | 4.64 | $ | - | ||||||||||
| Exercisable at June 30, 2012 | - | $ | - | - | $ | - | ||||||||||
| Performance options | Number of shares | Weighted average exercise price | Weighted average remaining contractual life (years) | Aggregate intrinsic value | ||||||||||||
| Outstanding at June 30, 2013 | 1,476,000 | $ | 9.29 | 3.64 | $ | 4,605,120 | ||||||||||
| Outstanding at June 30, 2014 | 1,476,000 | $ | 9.29 | 2.64 | $ | 22,435,200 | ||||||||||
| Vested and expected to vest at June 30, 2014 | 1,476,000 | $ | 9.29 | 2.64 | $ | 22,435,200 | ||||||||||
| Exercisable at June 30, 2014 | 283,200 | $ | 9.29 | 2.64 | $ | 4,304,640 | ||||||||||
The weighted average grant-date fair value of the performance share options was nil,were $4.39, nil, and $9.15nil for the years ended June 30, 2010, 20112012, 2013, and 2014, respectively. The fair value of the performance options vested during the years ended June 30, 2012, 2013 and 2014 was nil, nil and 1,243,248, respectively. ThereNo performance options were no performance share optionsgranted or exercised duringin the year ended June 30, 2012. No options have been2014. Total fair value of shares vested as at June 30, 2012.during the year is $5,479,920.
The Company recorded share basedshare-based compensation expense relating to performance share options of nil, nil,$654,318, $1,316,572 and $654,318,$2,653,905 which is included in general and administrative expenses, for the years ended June 30, 2010, 20112012, 2013 and 2012,2014, respectively. As of June 30, 2012,2014, total unrecognized share basedshare-based compensation expense of $4,525,881$1,853,044 related to performance share options is expected to be recognized over a weighted average vesting period of 2.921.6 years.
The fair value of each performance share option granted is estimated on the date of grant using the Black-Scholes Option Pricing Model. The following table presents the assumptions used to estimate the fair values of the share options granted in the periods presented:
| For options granted on February 20, 2012 | ||||
| Risk-free rate of return | 0.71 | % | ||
| Expected life (in years) | 4.17 | |||
| Weighted average expected volatility | 62.64 | % | ||
| Expected dividends | - | |||
Weighted average risk-free rate of return for periods within the contractual life of the option is based on the U.S. Treasurytreasury yield curve in effect at the time of grant. Expected option life is estimated based on historical options exercise pattern in accordance with ASC Topic 718Share-based Compensation..Expected volatility is estimated based on historical volatility of the Company’s stock. Dividend yield is estimated by the Company at zero for the expected option life.
Restricted shares
During the year ended June 30, 2011, the Company granted 67,500 restricted ordinary shares to certain directors under the Plan, of which 15,000 shares were granted on January 1, 2011, 22,500 shares were granted on February 1, 2011, and the remaining 30,000 were granted on June 2, 2011. These restricted shares vest quarterly over a three year period starting from the grant date. Fair value of the restricted shares was determined with reference to the market closing price at grant date.
During the year ended June 30, 2014, the Company granted 52,500 restricted ordinary shares to certain directors under the Plan. All shares were granted on June 23, 2014. These restricted shares vest quarterly over a three year period starting from the directors’ respective service inception date. Fair value of the restricted shares was determined with reference to the market closing price at grant date.
A summary of the restricted share activity for the year ended June 30, 20122014 is as follows:
| Number of restricted shares | Weighted average grant date fair value | |||||||
| Nonvested at June 30, 2011 | 61,041 | $ | 12.34 | |||||
| Vested | 20,416 | 12.52 | ||||||
| Nonvested at June 30, 2012 | 40,625 | $ | 12.25 | |||||
| Number of restricted shares | Weighted average grant date fair value | |||||||
| Un-vested at June 30, 2013 | 18,125 | $ | 11.86 | |||||
| Granted | 52,500 | 23.95 | ||||||
| Vested | (21,250 | ) | 13.63 | |||||
| Un-vested at June 30, 2014 | 49,375 | $ | 23.95 | |||||
The total fair value of restricted shares vested during the years ended June 30, 2010, 20112012, 2013 and 20122014 were nil, $95,335,$255,621, $282,925 and $255,621,$289,738 respectively. The aggregate intrinsic value of all the outstanding restricted shares as of June 30, 2012 was $629,100. The Company recorded restricted share compensation expense of nil, $95,338$282,924, $282,924 and $282,924,$289,738 included in general and administrative expenses, for the yearyears ended June 30, 2010, 20112012, 2013 and 2012,2014, respectively. As of June 30, 2012,2014, total unrecognized compensation expense of $470,515$1,112,677 related to the restricted shares is expected to be recognized over a weighted-average vesting period of 1.74 years.2.66 year.
Incentive shares
The Company granted 1,510,181 Incentive Shares to the two selling shareholders offor Concord which were subject to a service period of two years commencing from July 1, 2011, and Concord achieving the net income performance targets of $10,000,000 and $11,500,000 for the years ended June 30, 2012 and 2013, respectively (“Targeted(the “Targeted Net Income Thresholds”). Upon achieving the Targeted Net Income Thresholds for the years endingended June 30, 2012 and 2013, 755,091 and 755,090 ordinary shares will be issued, respectively.
The weighted average grant date fair value of the Incentive Shares for Concord was $9.06 per share based on the closing price of the Company’s ordinary shares on the grant date.
For the yearyears ended June 30, 2012, 2013 and 2014, no share basedshare-based compensation expenseexpenses relating to the Incentive Shares wasfor Concord were recorded because the Company did not expect the performance conditions to be met for both years and the Targeted Net Income Threshold for the yearyears ended June 30, 2012 wasand 2013 were not met.
| NOTE 19 - | EMPLOYEE BENEFITS |
NOTE 19 - EMPLOYEE BENEFITS
The Company contributes to a state pension scheme run by the Chinese government in respect of its employees in China, and a central provision fund run by the Singapore government in respect of its employees in Singapore.Singapore, and an employment provident fund in respect of its employees in Malaysia. The expenses related to these plans were $6,378,917, $8,661,442$11,980,634, $15,031,361 and $11,980,634$16,150,214 for the years ended June 30, 2010, 20112012, 2013 and 2012,2014, respectively. These schemes were accounted for as defined contribution plans.
| INCOME TAX |
NOTE 20 - INCOME TAX
BVI
Hollysys, and its subsidiaries, GTH and Clear Mind, are incorporated in the BVI and are not subject to income tax under the relevant jurisdiction.
Singapore
HI, HAP, CCPL, CEPL, BCPL and CEPL,BMSG, the Company’s wholly owned subsidiaries incorporated in Singapore, are subject to Singapore corporate tax rate of 17% on the assessable profits arising from Singapore.
Malaysia
CESB, BMJB, and BMKL, the Company’s wholly owned subsidiarysubsidiaries incorporated in Malaysia, isare subject to Malaysia corporate income tax rate of 25% on the assessable profits arising from Malaysia.
Dubai
CCPL Dubai, the Company’sbranch of the Company's wholly owned subsidiary, CCPL, is a tax exempt company incorporated in Dubai, and no tax provision has been made for the yearyears ended June 30, 2012.2012, 2013 and 2014, respectively.
Hong Kong
World Hope and CSHK, the Company’s wholly owned subsidiaries incorporated in Hong Kong, are subject to Hong Kong corporate incomeprofits tax at a rate of 16.5% on the assessable profits arising from Hong Kong. No provision for Hong Kong profits tax has been made in the statements of comprehensive income as there were no assessable profits arising from Hong Kong for the yearyears ended June 30, 2012.2012, 2013 and 2014, respectively.
Macau
CMDE, the Company’s wholly owned subsidiary incorporated in Macau, is subject to the Macau corporate income tax rate of 12% on the assessable profits arising from Macau, with an exemption up to MOP 300,000. No provision for Macau profits tax has been made in the statements of comprehensive income as there were no assessable profits arising from Macau for the years ended June 30, 2012, 2013 and 2014, respectively.
India
HAIP, the Company’s wholly owned subsidiary incorporated in India, is subject to India corporate tax rate of 30% on its worldwide income. No provision for India profits tax has been made in the statements of comprehensive income as there were no taxable profits arising for the years ended June 30, 2012, 2013 and 2014, respectively.
PRC
The Company’s subsidiaries incorporated in PRC are subject to PRC enterprise income tax (“EIT”) on the taxable income as adjusted in accordance with relevant PRC income tax laws. The standard statutory tax rate of PRC EIT is 25% effective from calendar year ended December 31, 2008. All PRC subsidiaries appliedare subject to the standard statutory tax rate except for the following subsidiaries.subsidiaries:
Beijing Hollysys
Beijing Hollysys was certified as a High and New Technology Enterprise (“HNTE”) for the three years commencing January 1, 2008, and for another three years commencing January 1, 2011. Pursuant to PRC EIT law, an enterprise certified as a HNTE enjoys a preferential EIT rate of 15%. Therefore, the EIT tax rate applicable to Beijing Hollysys is 15% for the calendar years ended December 31, 2008 to December 31, 2013. Beijing Hollysys is in the process of reapplying the HNTE certification. Upon reapplication, Beijing Hollysys will be qualified for the preferential EIT rate of 15% for calendar years ended December 31, 2014 to December 31, 2016.
HangzhouIn February 2013, Beijing Hollysys
Hangzhou Hollysys was certified as a received the “Qualified Software Development Enterprise” certificate which entitles Beijing Hollysys an EIT rate of 10% for the calendar years ended December 31, 20092011 and 2010,2012. An income tax recoverable of $1,634,171 was recorded in Beijing Hollysys in 2013 since it paid its EIT based on a 15% tax rate for the calendar years ended December 31, 2011 and was entitled to a concessionary EIT rate of 10% which was granted by relevant authorities discretionarily on an annual basis. 2012.
Hangzhou Hollysys
In 2011, Hangzhou Hollysys was certified as a HNTE for the three years commencing January 1, 2011. Pursuant to PRC EIT law, an enterprise certified as a HNTE enjoys a preferential EIT rate of 15%. Therefore, the EIT tax rate applicable to Hangzhou Hollysys was 10% for the calendar years ended December 31, 2008, 2009, and 2010, and 15% for the calendar years ended December 31, 2011, 2012 and 2013.
Hangzhou Hollysys A&D
is in the process of reapplying the HNTE certification. Upon the approval of the reapplication, Hangzhou Hollysys A&D is registered in a high-technology zone located in Beijing and was certified as a “Software Enterprise”will be qualified for the preferential EIT rate of 15% for calendar years ended December 31, 2009 and 2010. Therefore, Hollysys A&D was entitled2014 to tax holidays of 100% exemption of income tax for two years followed by 50% exemption of income tax for the next three years after the first profitable calendar year, which was the calendar year ended December 31, 2010, provided the successful renewal of the “Software Enterprise” certificate. In accordance with the EIT law, the EIT tax rate applicable to Hollysys A&D for the calendar years ended December 31, 2009 and 2010 is therefore 25% and 0% respectively. For the calendar years ended December 31, 2011, and 2012, Hollysys A&D didn’t get the certification of “Software Enterprise” or any other certifications with any tax preference, and applies the standard statutory tax rate of 25%.2016.
The Company’s income before income taxes consists of:
| Year Ended June 30, | Year ended June 30, | |||||||||||||||||||||||
| 2010 | 2011 | 2012 | 2012 | 2013 | 2014 | |||||||||||||||||||
| PRC | $ | 37,710,514 | $ | 49,016,069 | $ | 70,490,625 | $ | 70,490,625 | $ | 67,927,931 | $ | 97,930,915 | ||||||||||||
| Non-PRC | (2,491,090 | ) | (1,106,988 | ) | (3,564,560 | ) | (3,564,560 | ) | (7,310,250 | ) | (6,619,440 | ) | ||||||||||||
| $ | 35,219,424 | $ | 47,909,081 | $ | 66,926,065 | $ | 66,926,065 | $ | 60,617,681 | $ | 91,311,475 | |||||||||||||
Income tax expense, most of which is incurred in the PRC, consists of:
| Year Ended June 30, | Year ended June 30, | |||||||||||||||||||||||
| 2010 | 2011 | 2012 | 2012 | 2013 | 2014 | |||||||||||||||||||
| Current income tax expense | $ | 8,540,774 | $ | 7,634,494 | $ | 8,828,453 | $ | 8,828,453 | $ | 10,052,627 | $ | 26,649,690 | ||||||||||||
| Deferred income tax (benefit) expense | (877,341 | ) | (1,190,527 | ) | 1,523,865 | |||||||||||||||||||
| Deferred income tax expense (benefit) | 1,523,865 | (1,955,829 | ) | (6,788,855 | ) | |||||||||||||||||||
| $ | 7,663,433 | $ | 6,443,967 | $ | 10,352,318 | $ | 10,352,318 | $ | 8,096,798 | $ | 19,860,835 | |||||||||||||
The reconciliation of tax computed by applying the statutory tax rate in PRC of 25% to the income before income taxes is as follows:
| Year Ended June 30, | Year ended June 30, | |||||||||||||||||||||||
| 2010 | 2011 | 2012 | 2012 | 2013 | 2014 | |||||||||||||||||||
| Income before income taxes | $ | 35,219,424 | $ | 47,909,081 | $ | 66,926,065 | $ | 66,926,065 | $ | 60,617,681 | $ | 91,311,475 | ||||||||||||
| Expected income tax expense at statutory tax rate in PRC | 8,804,856 | 11,977,270 | 16,731,517 | 16,731,517 | 15,154,420 | 22,827,868 | ||||||||||||||||||
| Effect of different tax rates in various jurisdictions | 15,555 | 15,070 | 417,565 | 417,565 | 897,861 | 2,709,028 | ||||||||||||||||||
| Effect of preferential tax treatment | (4,989,382 | ) | (5,768,020 | ) | (6,551,269 | ) | (6,551,269 | ) | (5,993,792 | ) | (5,027,460 | ) | ||||||||||||
| Effect of income for which no income tax is chargeable | (1,394,901 | ) | (1,792,868 | ) | (3,705,244 | ) | ||||||||||||||||||
| Effect of additional deductible research and development expense | (197,472 | ) | (860,736 | ) | (1,690,928 | ) | ||||||||||||||||||
| Effect of non-taxable income | (3,705,244 | ) | (5,006,072 | ) | (5,747,086 | ) | ||||||||||||||||||
| Effect of additional deductible research and development expenses | (1,690,928 | ) | (2,743,444 | ) | (2,604,227 | ) | ||||||||||||||||||
| Effect of non-deductible expenses | 883,415 | 882,370 | 4,399,717 | 4,399,717 | 6,435,577 | 6,379,416 | ||||||||||||||||||
| Under/(over) provision of income tax in previous years | (86,171 | ) | 792,662 | (400,446 | ) | (400,446 | ) | (2,968,007 | ) | - | ||||||||||||||
| Change in valuation allowance | 63,397 | 149,420 | - | - | 2,232,838 | 2,075,069 | ||||||||||||||||||
| Utilization of tax loss previously not recognized | - | (40,019 | ) | - | ||||||||||||||||||||
| Effect of deemed profit arisen in re-organization | 1,372,299 | - | - | |||||||||||||||||||||
| Withholding tax on capital repayment | 3,082,100 | 1,077,377 | - | |||||||||||||||||||||
| Share of net gains of equity investees | - | - | 1,222,667 | |||||||||||||||||||||
| Tax rate differential on deferred tax items | - | (699,417 | ) | (2,192,962 | ) | |||||||||||||||||||
| Withholding tax on dividend paid by subsidiary | - | 1,248,355 | 1,381,485 | |||||||||||||||||||||
| Recognition of temporary difference not recognized in previous years | 1,222,667 | (286,776 | ) | 283,716 | ||||||||||||||||||||
| Others | 109,737 | 11,441 | (71,261 | ) | (71,261 | ) | (174,745 | ) | (224,012 | ) | ||||||||||||||
| Income tax expenses | $ | 7,663,433 | $ | 6,443,967 | $ | 10,352,318 | $ | 10,352,318 | $ | 8,096,798 | $ | 19,860,835 | ||||||||||||
Had all the above preferential tax holidays and concessionstreatment not been available, the tax charge would have been higherincreased by $4,989,382, $5,768,020,$6,551,269, $5,993,792 and $6,551,269$5,027,460 and the basic net income per share would have been lowerreduced by $0.10,$0.12, $0.11 and $0.12$0.09 for the years ended June 30, 2010, 20112012, 2013 and 20122014, respectively, and diluted net income per share for the years ended June 30, 2010, 20112012, 2013 and 20122014 would have been lowerreduced by $0.10, $0.10$0.12, $0.11 and $0.12,$0.08, respectively.
In February 2010, Hollysys re-organized the group structure of its PRC wholly owned subsidiaries (the “Group Re-organization”). GTH and Beijing Hollysys, each held 60% and 40% equity interest of Hangzhou Hollysys respectively, transferred the equity interest of 20% and 40% of their equity interest of Hangzhou Hollysys, respectively to Hollysys Group on February 3, 2010. As a result, GTH and Beijing S&T held 40% and 60% equity interest of Hangzhou, without any change in the effective interest held by the Company before and after the equity transfer.
Prior to the equity transfer, on February 1, 2010, the board of directors of Hangzhou Hollysys approved the resolution of a dividend declaration amounting to RMB 513,273,305 (equivalent to $75,242,672), on a one-off basis, among which RMB 205,309,322 (equivalent to 30,098,269) was distributable to Beijing Hollysys, and RMB 307,963,983 (equivalent to $45,147,403) distributable to GTH.
Pursuant to the EIT Law, Hangzhou Hollysys, a foreign investment enterprise, is obligated to withhold income tax on dividends paid-out to GTH, a foreign enterprise and non-resident, for earnings retained after January 1, 2008. Out of the total dividends of RMB 307,963,983 (equivalent to $45,147,403) distributable to GTH, RMB 210,239,304 (equivalent to $30,821,002) was retained after January 1, 2008. As a result, Hangzhou Hollysys withheld RMB 21,023,930 (equivalent to $3,082,100) of income tax for the dividends distributable to GTH based on a tax rate of 10% in accordance with the PRC EIT for the year ended June 30, 2010.
Hangzhou Hollysys is also obligated to withhold the income tax for the gain on disposal of equity interest. Pursuant to PRC EIT Law, the consideration for the equity transfer should be based on fair value for taxation purposes. The Company engaged a third party valuer, to value the equity interest of Hangzhou Hollysys as of February 3, 2010, the date of transfer. The fair value of the equity interest in Hangzhou was determined to be RMB 236,230,997 (equivalent to $34,901,237).
As a result, Hangzhou Hollysys withheld RMB 2,326,420 (equivalent to $341,052) of income tax for GTH in respect of the gain on disposal of equity interest based on a tax rate of 10% in accordance with the PRC EIT law. Beijing Hollysys accrued RMB 7,020,648 (equivalent to $1,029,224) of income tax in respect of the gain on disposal of equity interest based on Beijing Hollysys’ applicable EIT rate. Total income tax expense for the deemed profit arising from the Group Re-organization of $1,372,299 was incurred during the year ended June 30, 2010.
In January 2011, the Company determined to carry out another group re-structuring, where Hollysys Group transferred the equity interest of 60% equity interest of Hangzhou Hollysys to Beijing Hollysys. Before the execution of the equity transfer, the board of directors of Hangzhou Hollysys approved a resolution to declare a dividend of RMB 178,537,603 (equivalent to $26,934,436), on a one-time basis, of which RMB 107,122,562 (equivalent to $16,160,662) was distributable to Hollysys Group, and RMB 71,415,041 (equivalent to $10,773,774) was distributable to GTH. As a result, Hangzhou Hollysys withheld RMB 7,141,504 (equivalent to $1,077,377) in income tax for the dividends distributable to GTH based on the tax rate of 10% in accordance with the PRC EIT law for the year ended June 30, 2011.
The temporary differences that have given rise to the deferred tax liabilitiesassets consist of the following:
| June 30, | June 30, | |||||||||||||||
| 2011 | 2012 | 2013 | 2014 | |||||||||||||
| Deferred tax assets-current | ||||||||||||||||
| Deferred tax assets, current | ||||||||||||||||
| Allowance for doubtful accounts | $ | 1,811,353 | $ | 2,477,942 | $ | 4,577,626 | $ | 7,798,545 | ||||||||
| Inventory provision | 242,891 | 404,846 | 217,864 | 209,826 | ||||||||||||
| Provision for contract loss | 332,547 | 868,806 | ||||||||||||||
| Long-term assets | 154,208 | 74,169 | 45,577 | 17,857 | ||||||||||||
| Deferred revenue | 3,818,665 | 3,315,688 | 4,096,415 | 10,627,732 | ||||||||||||
| Deferred subsidies | 786,545 | 1,079,333 | ||||||||||||||
| Warranty liabilities | 416,429 | 539,189 | 376,780 | 1,901,623 | ||||||||||||
| Recognition of intangible assets | 257,225 | 326,552 | 389,967 | 473,413 | ||||||||||||
| Accrued payroll | 802,344 | 511,593 | 726,286 | 1,041,511 | ||||||||||||
| Net operating loss carry forward | 684,085 | 700,979 | 2,788,042 | 4,559,569 | ||||||||||||
| Less: Valuation allowances | (631,775 | ) | - | |||||||||||||
| Total deferred tax assets-current | 7,555,425 | 8,350,958 | ||||||||||||||
| Valuation allowance | (2,232,838 | ) | (4,559,569 | ) | ||||||||||||
| Total deferred tax assets, current | $ | 12,104,811 | $ | 24,018,646 | ||||||||||||
| Deferred tax liabilities-current | ||||||||||||||||
| Cost and estimated earnings in excess of billings | (5,533,959 | ) | (7,590,901 | ) | ||||||||||||
| Deferred tax liabilities, current | ||||||||||||||||
| Costs and estimated earnings in excess of billings | $ | (11,230,330 | ) | $ | (17,517,667 | ) | ||||||||||
| Withholding tax on capital repayment | - | (1,381,485 | ) | |||||||||||||
| Others | - | (358,296 | ) | (27,068 | ) | (59,958 | ) | |||||||||
| Total deferred tax liabilities-current | (5,533,959 | ) | (7,949,197 | ) | ||||||||||||
| Total deferred tax liabilities, current | $ | (11,257,398 | ) | $ | (18,959,110 | ) | ||||||||||
| Net deferred tax assets-current | 2,021,466 | 772,061 | ||||||||||||||
| Net deferred tax liabilities-current | $ | - | $ | (370,300 | ) | |||||||||||
| Net deferred tax assets, current | $ | 3,033,931 | $ | 6,686,685 | ||||||||||||
| Net deferred tax liabilities, current | $ | (2,186,518 | ) | $ | (1,627,149 | ) | ||||||||||
| Deferred tax assets, non-current | ||||||||||||||||
| Long-term assets | 302,998 | 495,865 | $ | 477,000 | $ | 482,697 | ||||||||||
| Deferred revenue | 231,030 | 381,596 | ||||||||||||||
| Deferred subsidies | 1,762,664 | 1,850,614 | ||||||||||||||
| Recognition of intangible assets | 457,468 | 573,710 | 446,413 | 271,462 | ||||||||||||
| Total deferred tax assets-non-current | $ | 991,496 | $ | 1,451,171 | ||||||||||||
| Warranty liabilities | 523,714 | - | ||||||||||||||
| Total deferred tax assets, non-current | $ | 3,209,791 | $ | 2,604,773 | ||||||||||||
| Deferred tax liabilities-non-current | ||||||||||||||||
| Deferred tax liabilities, non-current | ||||||||||||||||
| Share of net gains of equity investees | - | (1,036,772 | ) | $ | (1,715,240 | ) | $ | (477,764 | ) | |||||||
| Total deferred tax liabilities-non-current | $ | - | $ | (1,036,772 | ) | |||||||||||
| Property, plant and equipment | (306,183 | ) | - | |||||||||||||
| Intangible assets | (2,966,515 | ) | (2,692,430 | ) | ||||||||||||
| Total deferred tax liabilities, non-current | $ | (4,987,938 | ) | $ | (3,170,194 | ) | ||||||||||
| Net deferred tax assets-non-current | $ | 991,496 | $ | 414,399 | $ | 1,494,551 | $ | 1,806,047 | ||||||||
| Net deferred tax liabilities-non-current | $ | (3,272,698 | ) | $ | (2,371,468 | ) | ||||||||||
As of June 30, 2012,2014, the Company had netdid not have any operating losses of approximately $2,803,916loss which can be carried forward to offset future net profit for income tax purposes. The net operating loss will expire in 2017 if not utilized.
The Company operates mainly through the PRC subsidiaries and the valuation allowance is considered on anindividual entity basis. Where a valuation allowance was not recorded, the Company expects to generate sufficient taxable income in the future.
Under the EIT Law and the implementation rules, profits of the Company’s PRC subsidiaries earned on or after January 1, 2008 and distributed by the PRC subsidiaries to a foreign holding company are subject to a withholding tax at a rate of 10% unless reduced by tax treaty. At June 30, 20112013 and 2012,2014, aggregate undistributed earnings of the Company’s subsidiaries located in the PRC that are available for distribution to the Company of approximately RMB 862,112,3641,351,472,614 (equivalent to $133,214,717)$197,739,789) and RMB 1,186,002,4551,836,127,087 (equivalent to $187,513,234)$276,586,424), respectively. The Company expects to distribute a portion of the earnings (approximately RMB 150,000,000 or $24,379,144) accumulated by the Company’s PRC subsidiaries as of June 30, 2014 to a holding companies located outside mainland China, and has accrued a withholding tax of $1,381,485 in the year ended June 30, 2014. The remaining undistributed earnings of the Company’s PRC subsidiaries are intended to be permanently reinvested, and accordingly, no deferred taxes have been provided for the PRC dividend withholding taxes that would be payable upon the distribution of those amounts to the Company. Distributions made out of pre-January 1, 2008 retained earnings will not be subject to withholding taxes.
In accordance with ASC 740,The Chinese tax law grants the Company’s liabilitytax authorities the rights to further inspect companies’ tax returns retroactively in a three year period (up to five years under certain special conditions), which means theoretically the tax authorities can still review our PRC subsidiaries' tax returns for income taxes includes the liability for unrecognizedyears ended December 31, 2009 through 2013. The tax benefits,law also stated that the companies will be liable to additional tax, interest charges and penalties which relateif errors are found in their tax returns and such errors have led to tax years still subject to review by taxing authorities.an underpayment of tax.
Determining income tax provisions involves judgment on the future tax treatment of certain transactions. The Company performed a self-assessment and concluded that there was no significant uncertain tax position requiring recognition in its financial statements. The tax treatment of such transactions is reconsidered periodically to take into account all changes in tax legislations. Where the final tax outcome of these transactions is different from the amounts that were initially recorded, such difference will impact the income tax and deferred tax provisions in the year in which such determination is made.
There were no material interest or penalties incurred for the years ended June 30, 2010, 20112012, 2013 and 2012.2014, respectively.
| NOTE 21 - | INCOME PER SHARE |
NOTE 21 - INCOME PER SHARE
The following table sets forth the computation of basic and diluted net income per share attributable to Hollysys for the years indicated:
| Year Ended June 30, | ||||||||||||
| 2010 | 2011 | 2012 | ||||||||||
| Numerator: | ||||||||||||
| Net income attributable to Hollysys Automation Technologies Ltd | $ | 25,704,538 | $ | 41,469,998 | $ | 56,221,847 | ||||||
| Denominator: | ||||||||||||
| Weighted average ordinary shares outstanding used in computing basic income per share | 51,243,667 | 54,564,842 | 55,659,765 | |||||||||
| Effect of dilutive securities | ||||||||||||
| Share options | 251,062 | 382,070 | 148,139 | |||||||||
| UPO | 343,565 | - | - | |||||||||
| Restricted shares | - | 2,368 | 20,457 | |||||||||
| Weighted average ordinary shares outstanding used in computing diluted income per share | 51,838,294 | 54,949,280 | 55,828,361 | |||||||||
| Income per share – basic | $ | 0.50 | $ | 0.76 | $ | 1.01 | ||||||
| Income per share – diluted | $ | 0.50 | $ | 0.75 | $ | 1.01 | ||||||
| Year ended June 30, | ||||||||||||
| 2012 | 2013 | 2014 | ||||||||||
| Numerator: | ||||||||||||
| Net income attributable to the Company - basic and diluted | $ | 56,221,847 | $ | 51,994,402 | $ | 69,619,583 | ||||||
| Denominator: | ||||||||||||
| Weighted average ordinary shares outstanding used in computing basic income per share | 55,659,765 | 56,167,592 | 57,926,333 | |||||||||
| Effect of dilutive securities | ||||||||||||
| Share options | 148,139 | 206,506 | 482,623 | |||||||||
| Restricted shares | 20,457 | 38,371 | 17,686 | |||||||||
| Weighted average ordinary shares outstanding used in computing diluted income per share | 55,828,361 | 56,412,469 | 58,426,642 | |||||||||
| Income per share - basic | $ | 1.01 | 0.93 | 1.20 | ||||||||
| Income per share - diluted | $ | 1.01 | 0.92 | 1.19 | ||||||||
The effects of the performance share options have been excluded from the computation of diluted income per share for the yearyears ended June 30, 2012 as the effect would be antidilutive. anti-dilutive. Vested and unissued restricted shares of 26,875, 39,375 and 60,625 shares as at June 30, 2012, 2013 and 2014, respectively, has been included in the computation of basic and diluted income per share for the years ended June 30, 2012, 2013 and 2014, respectively.
The impact of the Incentive Shares hasfor Concord, the Incentive Shares for Bond and Premium Shares for Bond have also been excluded from the computation of diluted income per share for the year ended June 30, 20122013, respectively, because the contingently issuable ordinary shares would not be issued under the terms of the arrangement if the end of the reporting period were the end of the contingency period. For the year ended June 30, 2014, as the performance target was achieved for the first instalment of the Incentive Shares for Bond and 648,697 shares were issuable as of June 30, 2014, these shares are included in the computation of basic and diluted income per share. However, the second installment of Incentive Shares for Bond and Premium Shares for Bond has been excluded from the computation of diluted income per share because the contingently issuable common shares would not be issued under the terms of the arrangement if the end of the reporting period were the end of the contingency period.
NOTE 22 -
| NOTE 22 - | RELATED PARTY TRANSACTIONS |
The related party relationships and related party transactions are listed as follows:
Related party relationships
| Name of related parties | Relationship with the Company | |
| Shenhua Hollysys Information Technology Co., Ltd. | 20% owned by Beijing Hollysys | |
| New Huake Electronic Technology Co., Ltd. | 37.5% owned by Beijing Hollysys | |
| China Techenergy Co., Ltd. | 40% owned by Beijing Hollysys | |
| Beijing Hollysys Electric Motor Co., Ltd | 40% owned by Beijing Hollysys | |
| Zhejiang | 6% owned by Hangzhou Hollysys | |
| Beijing Hollysys Machine Automation Co., Ltd. | 30% owned by Hollysys Investment | |
| Southcon Development Sdn. Bhd. (“Southcon”) | 30% owned by BMJB | |
| Heilongjiang Ruixing Technology Co., Ltd.(“Ruixing”) | 8.31% owned by Beijing Hollysys | |
| Swee Yong Chim | Shareholder of the Company and former shareholder of Concord | |
| Yoon Fah Chim | Shareholder of the Company and former shareholder of Concord |
Due from related parties
| June 30, | ||||||||
| 2011 | 2012 | |||||||
| China Techenergy | $ | 10,837,123 | $ | 14,850,375 | ||||
| Shenhua Information | 1,333,534 | 1,183,660 | ||||||
| Hollysys Machine | - | 297,622 | ||||||
| Hollysys Equipment | 4,790 | 4,901 | ||||||
| $ | 12,175,447 | $ | 16,336,558 | |||||
| June 30, | ||||||||
| 2013 | 2014 | |||||||
| China Techenergy | $ | 23,391,167 | $ | 19,038,908 | ||||
| Shenhua Information | 2,157,094 | 3,832,574 | ||||||
| Hollysys Machine | 352,119 | 848,188 | ||||||
| Electric Motor | 462 | - | ||||||
| Zhejiang Sanxing | 10,304 | - | ||||||
| Ruixing | 199,045 | - | ||||||
| Swee Yong Chim | 200,631 | - | ||||||
| Yoon Fah Chim | 200,632 | - | ||||||
| $ | 26,511,454 | $ | 23,719,670 | |||||
The Company’s management believes that the collection of amounts due from related parties is reasonably assured and accordingly, no provision had been made for these balances.
Due to related parties
| June 30, | ||||||||
| 2013 | 2014 | |||||||
| Shenhua Information | $ | 1,351,199 | $ | 1,591,858 | ||||
| China Techenergy | 691,360 | 2,266,900 | ||||||
| Electric Motor | 27,393 | 47,790 | ||||||
| Hollysys Machine | 10,915 | 81,858 | ||||||
| New Huake | 2 | 2 | ||||||
| $ | 2,080,869 | $ | 3,988,408 | |||||
Due to related parties
| June 30, | ||||||||
| 2011 | 2012 | |||||||
| Shenhua Information | $ | 2,725,059 | $ | 1,544,464 | ||||
| China Techenergy | 536,125 | 401,719 | ||||||
| Electric Motor | 17,396 | 16,224 | ||||||
| Hollysys Equipment | 1,780 | 1,821 | ||||||
| Hollysys Machine | - | 45 | ||||||
| New Huake | 58,203 | 2 | ||||||
| $ | 3,338,563 | $ | 1,964,275 | |||||
Transactions with related parties
Purchases of goods and services from:
| Purchases of goods and services from: | ||||||||||||
| Year ended June 30, | ||||||||||||
| 2012 | 2013 | 2014 | ||||||||||
| Electric Motor | $ | 31,729 | $ | 68,336 | $ | 14,022 | ||||||
| Shenhua Information | 41,045 | 364,537 | 323,099 | |||||||||
| Hollysys Machine | - | 972,508 | 1,980,146 | |||||||||
| New Huake | - | 69,768 | - | |||||||||
| $ | 72,774 | $ | 1,475,149 | $ | 2,317,267 | |||||||
Sales of goods and integrated solutions, and providing services to: | ||||||||||||||||||||||||
| Year ended June 30, | Year ended June 30, | |||||||||||||||||||||||
| 2010 | 2011 | 2012 | 2012 | 2013 | 2014 | |||||||||||||||||||
| Electric Motor | $ | 41,757 | $ | 34,085 | $ | 31,729 | ||||||||||||||||||
| China Techenergy | 70,368 | - | - | $ | 3,657,215 | $ | 17,059,714 | $ | 3,135,991 | |||||||||||||||
| Shenhua Information | 4,857,416 | 2,151,391 | 41,045 | 1,411,274 | 1,936,273 | 2,726,358 | ||||||||||||||||||
| New Huake | 493,203 | 879,111 | - | |||||||||||||||||||||
| Hollysys Machine | 296,523 | 557,243 | 920,961 | |||||||||||||||||||||
| Electric Motor | 1,775 | 3,893 | 1,804 | |||||||||||||||||||||
| $ | 5,462,744 | $ | 3,064,587 | $ | 72,774 | $ | 5,366,787 | $ | 19,557,123 | $ | 6,785,114 | |||||||||||||
| Operating lease income from: | ||||||||||||
| Year ended June 30, | ||||||||||||
| 2012 | 2013 | 2014 | ||||||||||
| Hollysys Machine | $ | 45,475 | $ | 65,926 | $ | 65,227 | ||||||
| $ | 45,475 | $ | 65,926 | $ | 65,227 | |||||||
Purchase of building from:
| Year ended June 30, | ||||||||||||
| 2010 | 2011 | 2012 | ||||||||||
| Shenhua Information | $ | - | $ | 3,608,675 | $ | - | ||||||
| $ | - | $ | 3,608,675 | $ | - | |||||||
Operating lease expenses paid to:
| Year ended June 30, | ||||||||||||
| 2010 | 2011 | 2012 | ||||||||||
| Shenhua Information | $ | 32,069 | $ | - | $ | - | ||||||
| $ | 32,069 | $ | - | $ | - | |||||||
Sales of goods and integrated solutions to:
| Year ended June 30, | ||||||||||||
| 2010 | 2011 | 2012 | ||||||||||
| China Techenergy | $ | 4,189,366 | $ | 3,557,125 | $ | 3,657,215 | ||||||
| Shenhua Information | 2,184,844 | 727,460 | 1,411,274 | |||||||||
| Hollysys Machine | - | - | 296,523 | |||||||||
| Electric Motor | 11,038 | 13,478 | 1,775 | |||||||||
| Zhejiang Sanxin | 8,337 | - | - | |||||||||
| Hollysys Equipment | 1,385 | - | - | |||||||||
| $ | 6,394,970 | $ | 4,298,063 | $ | 5,366,787 | |||||||
Operating lease income from:
| Year ended June 30, | ||||||||||||
| 2010 | 2011 | 2012 | ||||||||||
| Hollysys Machine | $ | - | $ | - | $ | 45,475 | ||||||
| $ | - | $ | - | $ | 45,475 | |||||||
The Company sells automation control systems to China Techenergy which is used for non-safety operationoperations control in the nuclear power industry. China Techenergy incorporates the Company’s non-safety automation control systems with their proprietary safety automated control systems to provide an overall automation and control system for nuclear power stations in China. The Company is not a party to the integrated sales contracts executed between China Techenergy and their customers. IntercompanyThe Company’s pro rata shares of the intercompany profits and losses are eliminated until realized by the Company or China Techenergythrough a sale to outside parties, as if the China Techenergy were a consolidated subsidiary.
The Company sells automation control systems to Shenhua Information which is used for operationoperations control in the information automation industry. Shenhua Information incorporates the Company’s automation control systems with their proprietary automated remote control systems to provide an overall automation and control system to its customers. The Company is not a party to the integrated sales contracts executed between Shenhua Information and their customers. The Company’s pro rata shares of the intercompany profits and losses are eliminated until realized through a sale to an outside party as if Shenhua Information were a consolidated subsidiary.
The Company engages Hollysys Machine to sell the Company’s products to end customers. The Company pays commission to Hollysys Machine in exchange for its services. The amount of the commission is determined based on the value of the products sold by Hollysys Machine during the year.
Amounts due from and due to the related parties relating to the above transactions are unsecured, non-interest bearing and repayable on demand.
NOTE 23 -
| NOTE 23 - | COMMITMENTS AND CONTINGENCIES |
Operating lease commitments
The Company leases premises under various operating leases. Rental expenses under operating leases included in the consolidated statements of comprehensive income were $1,002,666, $1,053,907$1,570,900, $1,908,921 and $1,570,900$2,067,416 for the years ended June 30, 2010, 20112012, 2013 and 2012,2014, respectively.
Future minimum lease payments under non-cancelable operating leases with initial terms of one year or more consist of the following:
| Year ended June 30, | Minimum lease payments | |||||||
| Years ending June 30, | Minimum lease payments | |||||||
| 2013 | $ | 920,563 | ||||||
| 2014 | 681,270 | |||||||
| 2015 | 486,981 | $ | 1,228,098 | |||||
| 2016 | 322,205 | 378,127 | ||||||
| 2017 | - | 78,701 | ||||||
| 2018 | 34,580 | |||||||
| 2019 and onwards | 40,343 | |||||||
| Total minimum lease payments | $ | 2,411,019 | $ | 1,759,849 | ||||
There was a capital commitment of $13,039,435 asThe Company’s lease arrangements have no renewal or purchase options, rent escalation clauses, restriction or contingent rents and are all conducted with third parties.
Capital commitments
As of June 30, 2012, related to2014, the Company had capital commitments of $3,552,588 which is due in less than one year,mainly for the phase II of the construction of the Company’s headquarters in Beijing, PRC.
Purchase obligation
As of June 30, 2014, the Company had $233,451,992 in purchase obligations for the coming fiscal year, for purchases of inventories, mainly for fulfillment of in-process or newly entered contracts resulting from the expansion of our operations
Performance guarantee and standby letters of credit
The Company had stand-by letters of credit of $82,042 and outstanding performance guarantees of $40,166,821$47,185,650 as of June 30, 2012,2014, with a restricted cash of $5,544,273$10,038,856 pledged to banks. The purpose of the standby letter of credit and performance guarantees is to guarantee that the performance of the Company’s deliveries reach the pre-agreed requirements specified in the integrated solutions sales contracts. The guarantee is to ensure the functionality of the Company’s own work. The disclosed amount of stand-by letters of credit and outstanding performance guarantees represent the maximum potential amount of future payments the Company could be required to make under such guarantee.
The Company accounts for performance guarantees and stand-by letters of credit in accordance with ASC topic 460 (“ASC 460”),Guarantees.Accordingly, the Company evaluates its guarantees to determine whether (a) the guarantee is specifically excluded from the scope of ASC 460, (b) the guarantee is subject to ASC 460 disclosure requirement only, but not subject to the initial recognition and measurement provisions, or (c) the guarantee is required to be recorded in the financial statements at fair value.
Both the performance guarantees and the stand-by letters of credit are for the Company’s commitment of its own future performance, and the outcome of which is within its own control. As a result, performance guarantees and stand-by letters of credit are subject to ASC 460 disclosure requirements only.
| NOTE 24 - | OPERATING LEASES AS LESSOR |
On April 3, 2013, Beijing Hollysys entered into an operating lease agreement to lease out one of its buildings located in Beijing. The lease term is 10 years from September 1, 2013 to August 31, 2023. The minimum lease payments to be received in the next five years consist of the following:
| Year ended June 30, | Minimum lease payments | |||
| 2015 | 1,490,150 | |||
| 2016 | 1,534,855 | |||
| 2017 | 1,580,900 | |||
| 2018 | 1,628,327 | |||
| 2019 | 1,612,940 | |||
| Total minimum lease payments to be received in the next five years | $ | 7,847,172 | ||
The minimum lease payment receivable after five years is $7,610,684.
NOTE 2425 - SEGMENT REPORTING
The chief operating decision-makersdecision makers have been identified as the Chairman, Chief Executive Officer Chief Financial Officer and Chief OperatingFinancial Officer of the Company. To better assess the Company’s performanceThe Company organizes its internal financial reporting structure based on its main product and allocate resources, the chief operating decision-makers revised the management report for their review effective from 2012.service offerings.
Based on the criteria established by ASC Topic 280,Segment Reporting (“ASC 280”), the Company has determined that the businessreportable segments of the Company consist of (1) industrial automation (“IA”), (2) rail transportation (“Rail”), (3) mechanical and (3)electrical solutions (“M&E”) and (4) miscellaneous, in accordance with the Company’s organization and internal financial reporting structure. The chief operating decision-makers accessdecision makers assess the performance of the operating segments based on the measures of revenue, costrevenues, costs and gross profit. Other than the information provided below, the chief operating decision-makersdecision makers do not use any other measures by segment.segments.
Summarized information by segmentsegments for the years ended June 30, 2012, 2013, and 2014 is as follows:
| Year ended June 30, 2012 | Year ended June 30, 2012 | |||||||||||||||||||||||||||||||||||
| Industrial Automation | Rail Transportation | Miscellaneous | Consolidated | IA | Rail | M&E | Miscellaneous | Consolidated | ||||||||||||||||||||||||||||
| Revenues from external customers | $ | 190,251,683 | $ | 100,946,417 | $ | 30,505,832 | $ | 321,703,932 | $ | 190,251,683 | $ | 100,946,417 | $ | 1,967,767 | $ | 28,538,065 | $ | 321,703,932 | ||||||||||||||||||
| Costs of revenue | 120,646,668 | 51,682,038 | 23,028,476 | 195,357,182 | 120,646,668 | 51,682,038 | 1,476,104 | 21,552,372 | 195,357,182 | |||||||||||||||||||||||||||
| Gross profit | $ | 69,605,015 | $ | 49,264,379 | $ | 7,477,356 | $ | 126,346,750 | $ | 69,605,015 | $ | 49,264,379 | $ | 491,663 | $ | 6,985,693 | $ | 126,346,750 | ||||||||||||||||||
| Year ended June 30, 2011 | Year ended June 30, 2013 | |||||||||||||||||||||||||||||||||||
| Industrial Automation | Rail Transportation | Miscellaneous | Consolidated | IA | Rail | M&E | Miscellaneous | Consolidated | ||||||||||||||||||||||||||||
| Revenues from external customers | $ | 142,323,167 | $ | 116,492,723 | $ | 4,025,996 | $ | 262,841,886 | $ | 211,713,204 | $ | 82,343,769 | $ | 36,131,813 | $ | 18,866,216 | $ | 349,055,002 | ||||||||||||||||||
| Costs of revenue | 92,080,943 | 76,645,781 | 2,986,446 | 171,713,170 | 131,443,757 | 46,826,268 | 30,362,317 | 16,753,972 | 225,386,314 | |||||||||||||||||||||||||||
| Gross profit | $ | 50,242,224 | $ | 39,846,942 | $ | 1,039,550 | $ | 91,128,716 | $ | 80,269,447 | $ | 35,517,501 | $ | 5,769,496 | $ | 2,112,244 | $ | 123,668,688 | ||||||||||||||||||
| Year ended June 30, 2010 | Year ended June 30, 2014 | |||||||||||||||||||||||||||||||||||
| Industrial Automation | Rail Transportation | Miscellaneous | Consolidated | IA | Rail | M&E | Miscellaneous | Consolidated | ||||||||||||||||||||||||||||
| Revenues from external customers | $ | 106,665,862 | $ | 62,444,732 | $ | 4,978,602 | $ | 174,089,196 | $ | 224,365,987 | $ | 178,133,849 | $ | 108,846,044 | $ | 9,985,966 | $ | 521,331,846 | ||||||||||||||||||
| Costs of revenue | 67,731,823 | 41,097,636 | 5,107,915 | 113,937,374 | 143,645,421 | 104,055,425 | 93,458,694 | 4,549,394 | 345,708,934 | |||||||||||||||||||||||||||
| Gross profit | $ | 38,934,039 | $ | 21,347,096 | $ | (129,313 | ) | $ | 60,151,822 | $ | 80,720,566 | $ | 74,078,424 | $ | 15,387,350 | $ | 5,436,572 | $ | 175,622,912 | |||||||||||||||||
The Company’s assets are shared among the segments thus no assets have been designated to specific segments.
The majority of the Company’s revenues and long-lived assets other than goodwill and acquired intangible assets are derived from and located in PRC. The following table sets forth the revenues by geographical area:
| Year ended June 30, | Year ended June 30, | |||||||||||||||||||||||
| 2010 | 2011 | 2012 | 2012 | 2013 | 2014 | |||||||||||||||||||
| Revenues: | $ | |||||||||||||||||||||||
| PRC | 173,533,701 | 262,212,528 | 297,154,293 | $ | 297,154,293 | $ | 285,978,231 | $ | 393,595,606 | |||||||||||||||
| Non-PRC (including Hong Kong) | 555,495 | 629,358 | 24,549,639 | 24,549,639 | 63,076,771 | 127,736,240 | ||||||||||||||||||
| $ | 174,089,196 | 262,841,886 | 321,703,932 | $ | 321,703,932 | $ | 349,055,002 | $ | 521,331,846 | |||||||||||||||
The following table sets forth the long-lived assets other than goodwill and acquired intangible assets by geographical area:
| June 30, | June 30, | |||||||||||||||
| 2011 | 2012 | 2013 | 2014 | |||||||||||||
| Long-lived assets other than goodwill: | $ | $ | ||||||||||||||
| Long-lived assets other than goodwill and acquired intangible assets: | ||||||||||||||||
| PRC | 78,314,521 | 85,990,556 | $ | 98,992,331 | $ | 102,180,639 | ||||||||||
| Non-PRC (including Hong Kong) | 9,823 | 1,088,704 | 12,913,187 | 12,058,722 | ||||||||||||
| $ | 78,324,344 | $ | 87,079,260 | $ | 111,905,518 | $ | 114,239,361 | |||||||||
| SUBSEQUENT EVENTS |
IFC Loan
On May 30, 2014, the Company entered into a convertible loan agreement with International Finance Corporation (“IFC”), an international organization established by Articles of Agreement among its member countries including the British Virgin Islands, under which the Company will borrow $20,000,000 from IFC (the “IFC Loan”) with an interest rate of 2.1% per annum and commitment fee of 0.5% per annum paid in rear semi-annually. The Company received the loan disbursement on August 30, 2014, and the loan interest started accumulating since then.
The IFC Loan has both voluntary and mandatory conversion terms. IFC may at its option convert, in US$1,000,000 increments, the Loan in whole or in part, into the Company’s ordinary shares at any time on or prior to the maturity date at a conversion rate and a conversion price in effect at such time. The initial conversion rate at the time of the agreement is 38 ordinary shares per $1,000, and the initial conversion price is $26.35 per share. The initial conversion rate and conversion price is subject to subsequent adjustments with events that may dilute the unit price per share. 50% of the principal amount of the IFC Loan then outstanding will be mandatorily converted into ordinary shares at the conversion rate and conversion price then in effect if at any time, with respect to the period of 30 consecutive trading days ending at such time, the volume weighted average price for 20 trading days or more in such 30 consecutive trading day period is equal to or more than 150% of the conversion price in effect at such time. 100% of the principal amount of the IFC Loan then outstanding will be mandatorily converted into ordinary shares at the conversion rate and conversion price then in effect if at any time, with respect to the period of 30 consecutive trading days ending at such time, the volume weighted average price for 20 trading days or more in such 30 consecutive trading day period is equal to or more than 200% of the conversion price in effect at such time.
The Company is subject to both affirmative and negative covenants. The outstanding principle, interests and fees need to be repaid to IFC in case the covenants are not fulfilled. The Company is assessing the financial and internal control effects of the IFC Loan which will be reflected in the Company’s first quarter financial statements.
In addition, the Company paid a one-time front-end fee of $200,000 according to the agreement on July 3, 2014. A portfolio supervision fee of $5,000 per annum is charged to the Company by IFC for its effort of monitoring the convertible loan. The term of the IFC Loan is five years starting from the date of Company’s receipts of the loan.
Dividend Pay-out
The Company’s Board of Directors approved on August 13, 2014 to pay a dividend of $0.40 for each of its outstanding ordinary shares. The Board of Directors has not fixed the record date and the payment date. It is expected that the dividends will be paid no later than June 30, 2015.
| NOTE 27 - | ENDORSEMENT OF NOTE RECEIVABLES |
The Company endorsed bank acceptance bills to its suppliers as a way of settling accounts payable. The total endorsed but not yet due bank acceptance bills amounted to $19,818,431 and $43,420,641 as at June 30, 2013 and 2014, respectively. The endorsement of bank acceptance bills qualify as deemed sales of financial assets according to ASC 860,Transfer and Servicing(“ASC 860”) because the bank acceptance bills have been isolated from the Company upon transfer, the transferee of the bank acceptance bills have the rights to pledge or exchange, and the Company has no control over the bank acceptance bills upon endorsement. As a result, bank acceptance bills are derecognized at the time of endorsement.
| NOTE 28 - | CONDENSED FINANCIAL INFORMATION OF THE PARENT COMPANY |
NOTE 25 - CONDENSED FINANCIAL INFORMATION OF THE PARENT COMPANY
Under PRC laws and regulations, the Company'sCompany’s PRC subsidiaries are restricted in their ability to transfer certain of their net assets to the Company in the form of dividend payments, loans, or advances. The amount restricted was RMB 1,292,468,929RMB1,628,593,835 (equivalent to $199,713,970)$230,290,670) and RMB 1,292,655,096RMB2,116,640,412 (equivalent to $204,375,578)$309,735,684) as of June 30, 2011,2013, and 2012,2014, respectively. The amount restricted related to unconsolidated subsidiaries was RMB97,683,702 (equivalent to $15,809,749) and RMB91,120,307 (equivalent to $14,809,568) as of June 30, 2013 and 2014, respectively. The amount restricted related to consolidated subsidiaries was RMB1,530,910,133 (equivalent to $214,480,921) and RMB2,025,520,105 (equivalent to $294,926,116) as of June 30, 2013 and June 30, 2014, respectively.
The following represents condensed unconsolidated financial information of the parent company only:
CONDENSED BALANCE SHEETS
| CONDENSED BALANCE SHEETS |
| (In US dollars) |
| June 30, | ||||||||
| 2013 | 2014 | |||||||
| ASSETS | ||||||||
| Current assets: | ||||||||
| Amounts due from subsidiaries | $ | 115,549,945 | $ | 147,975,367 | ||||
| Prepaid expenses | 67,400 | 56,000 | ||||||
| Total current assets | 115,617,345 | 148,031,367 | ||||||
| Investments in subsidiaries | 298,462,924 | 373,681,658 | ||||||
| Total assets | $ | 414,080,269 | $ | 521,713,025 | ||||
| LIABILITIES AND STOCKHOLDERS’ EQUITY | ||||||||
| Current liabilities: | ||||||||
| Accrued payroll and related expense | $ | 36,000 | $ | 11,000 | ||||
| Accrued liabilities | 315,981 | 896 | ||||||
| Amounts due to subsidiaries | - | 33,226,582 | ||||||
| Total current liabilities | 351,981 | 33,238,478 | ||||||
| Equity: | ||||||||
| Ordinary shares, par value $0.001 per share, 100,000,000 shares authorized, and 57,554,824 shares issued and outstanding | 57,555 | 57,555 | ||||||
| Additional paid-in capital | 170,779,250 | 173,765,442 | ||||||
| Retained earnings | 206,019,816 | 275,639,399 | ||||||
| Accumulated other comprehensive income | 36,871,667 | 39,012,151 | ||||||
| Total equity | 413,728,288 | 488,474,547 | ||||||
| Total liabilities and equity | $ | 414,080,269 | $ | 521,713,025 | ||||
| June 30, | ||||||||
| 2011 | 2012 | |||||||
| ASSETS | ||||||||
| Current assets: | ||||||||
| Amounts due from subsidiaries | $ | 55,146,317 | $ | 109,290,207 | ||||
| Prepaid expenses | 50,712 | 71,150 | ||||||
| Total current assets | 55,197,029 | 109,361,357 | ||||||
| Advance payment for acquisition of a subsidiary | 16,856,148 | - | ||||||
| Investments in subsidiaries | 193,809,983 | 229,258,171 | ||||||
| Total assets | $ | 265,863,160 | $ | 338,619,528 | ||||
| LIABILITIES AND STOCKHOLDERS’ EQUITY | ||||||||
| Current liabilities: | ||||||||
| Accrued payroll and related expense | $ | 43,984 | $ | 39,000 | ||||
| Accrued liabilities | 761,519 | 479,413 | ||||||
| Total current liabilities | 805,503 | 518,413 | ||||||
| Equity: | ||||||||
| Ordinary shares, par value $0.001 per share, 100,000,000 shares authorized 54,692,129 and 55,998,917 shares issued and outstanding as of June 30, 2011 and 2012, respectively | 54,693 | 55,999 | ||||||
| Additional paid-in capital | 167,128,921 | 178,060,482 | ||||||
| Retained earnings | 71,048,231 | 127,270,078 | ||||||
| Accumulated other comprehensive income | 26,825,812 | 32,714,556 | ||||||
| Total equity | 265,057,657 | 338,101,115 | ||||||
| Total liabilities and equity | $ | 265,863,160 | $ | 338,619,528 | ||||
| CONDENSED STATEMENTS OF COMPREHENSIVE INCOME |
| (In US dollars) |
CONDENSED STATEMENTS OF COMPREHENSIVE INCOME
| Year ended June 30, | ||||||||||||
| 2012 | 2013 | 2014 | ||||||||||
| General and administrative expenses | $ | 2,805,380 | 2,824,293 | 3,721,299 | ||||||||
| Loss from operations | (2,805,380 | ) | (2,824,293 | ) | (3,721,299 | ) | ||||||
| Other income, net | - | 217,471 | - | |||||||||
| Foreign exchange gain | - | 1,620,422 | 262,633 | |||||||||
| Equity in profit of subsidiaries | $ | 59,027,227 | $ | 52,980,802 | $ | 73,078,249 | ||||||
| Income before income taxes | 56,221,847 | 51,994,402 | 69,619,583 | |||||||||
| Income tax expenses | - | - | - | |||||||||
| Net income | 56,221,847 | 51,994,402 | 69,619,583 | |||||||||
| Other comprehensive income, net of tax of nil | ||||||||||||
| Translation adjustments | 5,888,744 | 4,157,111 | 2,140,484 | |||||||||
| Comprehensive income | $ | 62,110,591 | $ | 56,151,513 | $ | 71,760,067 | ||||||
(In US dollars)
| Year Ended June 30, | ||||||||||||
| 2010 | 2011 | 2012 | ||||||||||
| General and administrative expenses | 2,289,941 | 1,962,495 | 2,805,380 | |||||||||
| Loss from operations | (2,289,941 | ) | (1,962,495 | ) | (2,805,380 | ) | ||||||
| Equity in profit of subsidiaries | $ | 27,994,479 | $ | 43,432,493 | $ | 59,027,227 | ||||||
| Income before income taxes | 25,704,538 | 41,469,998 | 56,221,847 | |||||||||
| Income tax expenses | - | - | - | |||||||||
| Net income | 25,704,538 | 41,469,998 | 56,221,847 | |||||||||
| Other comprehensive income, net of tax | ||||||||||||
| Foreign currency translation adjustments | (656,488 | ) | 9,273,152 | 5,888,744 | ||||||||
| Comprehensive income | $ | 25,048,050 | $ | 50,743,150 | $ | 62,110,591 | ||||||
There were no cash flows related to operating, investing or financing activities for fiscal years ended June 30, 2012, 2013 or 2014, respectively.
CONDENSED STATEMENTS OF CASH FLOWS
(In US dollars)
| Year ended June 30, | ||||||||||||
| 2010 | 2011 | 2012 | ||||||||||
| Net cash used in operating activities, representing net decrease in cash and cash equivalents | $ | (70,942 | ) | $ | - | $ | - | |||||
| Cash and cash equivalents, beginning of year | $ | 70,942 | $ | - | $ | - | ||||||
| Cash and cash equivalents, end of year | $ | - | $ | - | $ | - | ||||||
Basis of presentation
For the presentation of the parent company only condensed financial information, the Company records its investment in subsidiaries under the equity method of accounting as prescribed in ASC 323,Investments—Equity Method and Joint Ventures(“ASC 323”). Such investment is presented on the balance sheets as “Investment in subsidiaries” and the subsidiariessubsidiaries’ profit as “Equity in profit of subsidiaries” on the statements of comprehensive income. The parent company only financial statements should be read in conjunction with the Company’s consolidated financial statements.