UNITED STATES
SECURITIES AND EXCHANGE COMMISSION
Washington, D.C. 20549
FORM 20-F
| ¨ | REGISTRATION STATEMENT PURSUANT TO SECTION 12(b) OR (g) OF THE SECURITIES EXCHANGE ACT OF 1934 |
ANNUAL REPORT PURSUANT TO SECTION 13 OR 15(D)
OF THE SECURITIES EXCHANGE ACT OF 1934
| x | ANNUAL REPORT PURSUANT TO SECTION 13 OR 15(d) OF THE SECURITIES EXCHANGE ACT OF 1934 |
For the fiscal year ended December 31, 20122013
OR
| ¨ | TRANSITION REPORT PURSUANT TO SECTION 13 OR 15(d) OF THE SECURITIES EXCHANGE ACT OF 1934 |
For the transition period from ____ to ______
OR
| ¨ | SHELL COMPANY REPORT PURSUANT TO SECTION 13 OR 15(d) OF THE SECURITIES EXCHANGE ACT OF 1934 |
Date of event requiring this shell company report:
Commission file number: 001-35124
LONCOR RESOURCES INC.
(Exact Name of Registrant as Specified in Its Charter)
Ontario
(State or Other Jurisdiction of Incorporation of Organization)
1 First Canadian Place, 100 King Street West, Suite 7070, Toronto, Ontario, M5X 1E3, Canada
(Address of Principal Executive Offices, including Zip Code)
Contact: Geoffrey G. Farr; Phone: (416) 366-2221; Fax: (416) 366-7722; Address: 1 First Canadian Place, 100 King Street West, Suite 7070, Toronto, Ontario, M5X 1E3, Canada
(Name, Telephone, E-mail and/or Facsimile Number and Address of Company Contact Person)
Securities registered pursuant to Section 12(b) of the Act:
| Title of Each Class | Name of Exchange on Which Registered | |
| Common Shares | NYSE MKT LLC |
Securities registered pursuant to Section 12(g) of the Act:
None
Securities for which there is a reporting obligation pursuant to Section 15(d) of the Act.
None
Indicate the number of outstanding shares of each of the issuer's classes of capital or common stock as of December 31, 2012:2013:
73,439,732 common shares
Indicate by check mark if the registrant is a well-known seasoned issuer, as defined in Rule 405 of the Securities Act.
Yes¨Nox
Indicate by check mark if the registrant is not required to file reports pursuant to Section 13 or Section 15(d) of the Act.
Yes¨Nox
Indicate by check mark whether the registrant: (1) has filed all reports required to be filed by Section 13 or 15(d) of the Securities Exchange Act of 1934 during the preceding 12 months (or for such shorter period that the registrant was required to file such reports), and (2) has been subject to such filing requirements for the past 90 days.
YesxNo¨
Indicate by check mark whether the registrant has submitted electronically and posted on its corporate Web site, if any, every Interactive Data File required to be submitted and posted pursuant to Rule 405 of Regulation S-T during the preceding 12 months (or for such shorter period that the registrant was required to submit and post such files).
Yes¨No¨
Indicate by check mark whether the registrant is a large accelerated filer, an accelerated filer, or a non-accelerated filer. See definition of "accelerated filer and large accelerated filer" in Rule 12b-2 of the Exchange Act. (Check one):
| Large accelerated filer | Accelerated filer | Non-accelerated filer x |
Indicate by check mark which basis of accounting the registrant has used to prepare the financial statements included in this filing:
| U.S. GAAP | ||||||
| Accounting Standards Board | x | Other | |
If "Other" has been checked in response to the previous question, indicate by check mark which financial statement item the registrant has elected to follow:
¨Item 17¨ Item 18
If this is an annual report, indicate by check mark whether the registrant is a shell company (as defined in Rule 12b-2 of the Act).
Yes¨ Nox
LONCOR RESOURCES INC. - FORM 20-F
Table of Contents
| Page | |
| CAUTIONARY STATEMENT REGARDING FORWARD-LOOKING STATEMENTS | 1 |
| CAUTIONARY NOTE TO U.S. INVESTORS REGARDING RESOURCE ESTIMATES | 2 |
| CURRENCY | |
| PART 1 | |
| Item 1. Identity of Directors, Senior Management and Advisors | |
| Item 2. Offer Statistics and Expected Timetable | |
| Item 3. Key Information | |
| A. Selected Financial Data | |
| B. Capitalization and Indebtedness | |
| C. Reason for the Offer and Use of Proceeds | |
| D. Risk Factors | |
| Item 4. Information on the Company | |
| A. History and Development of the Company | |
| B. Business Overview | |
| C. Organizational Structure | |
| D. Property, Plants and Equipment | 21 |
| Item 4A. Unresolved Staff Comments | |
| Item 5. Operating and Financial Review and Prospects | |
| A. Operating Results | |
| B. Liquidity and Capital | |
| C. Research and Development, Patents and Licenses, | |
| D. Trend Information | |
| E. Off-Balance Sheet | |
| F. Tabular Disclosure of Contractual Obligations | |
| G. Safe Harbor | |
| Item 6. Directors, Senior Management and Employees | |
| A. Directors and Senior Management | |
| B. Compensation | |
| C. Board Practices | |
| D. Employees | |
| E. Share Ownership | |
| Item 7. Major Shareholders and Related Party Transactions | |
| A. Major Shareholders | |
| B. Related Party Transactions | |
| C. Interests of Experts and Counsel | |
| Item 8. Financial Information | |
| A. Consolidated Statements and Other Financial Information | |
| B. Significant Changes |
Table of Contents
(continued)
| Page | |
| Item 9. The Offer and Listing | |
| A. Offer and Listing Details | |
| B. Plan of Distribution | |
| C. Markets | |
| D. Selling Shareholder | |
| E. Dilution | |
| F. Expenses of the Issue | |
| Item 10. Additional Information | |
| A. Share Capital | |
| B. Memorandum and Articles of Association | |
| C. Material Contracts | |
| D. Exchange Controls | |
| E. Certain United States Federal Income Tax Considerations | |
| F. Dividends and Paying Agents | |
| G. Statement By Experts | |
| H. Documents on Display | |
| I. Subsidiary Information | |
| Item 11. Quantitative and Qualitative Disclosures About Market | |
| Item 12. Descriptions of Securities Other than Equity Securities | |
| PART II | |
| Item 13. Defaults, Dividend Arrearages and | |
| Item 14. Material Modifications to the Rights of Security Holders and Use of | |
| 14.A.-D. Modifications to the Rights of Security Holders | |
| 14.E. Use of Proceeds | |
| Item 15. Controls and | |
| Item 16.A. Audit Committee Financial Expert | |
| Item 16.B. Code of | |
| Item 16.C. Principal Accountant Fees and Services | |
| Item 16.D. Exemptions from the Listing Standards for Audit Committees | |
| Item 16.E. Purchase of Equity Securities by the Issuer and Affiliated Purchasers | |
| Item 16.F. Change in Registrant's Certifying Accountant | |
| Item 16.G. Corporate Governance | |
| PART III | |
| Item 17. Financial Statements | |
| Item 18. Financial Statements | |
| Item 19. Exhibits |
CAUTIONARY STATEMENT REGARDING FORWARD-LOOKING STATEMENTS
This Form 20-F and the documents incorporated by reference herein contains "forward-looking statements" within the meaning of the United States Private Securities Litigation Reform Actof 1995 and "forward-looking information" within the meaning of Canadian provincial securities laws (such forward-looking statements and forward-looking information are referred to herein as "forward-looking statements"). Forward-looking statements are necessarily based on a number of estimates and assumptions that are inherently subject to significant business, economic and competitive uncertainties and contingencies. All statements, other than statements which are reporting results as well as statements of historical fact, that address activities, events or developments that Loncor Resources Inc. (the "Company" or "Loncor") believes, expects or anticipates will or may occur in the future (including, without limitation, statements regarding mineral resource estimates, drilling and other exploration results, potential mineralization, potential mineral resources, and the Company's exploration and development plans and objectives with respect to its projects) are forward-looking statements. These forward-looking statements reflect the current expectations or beliefs of the Company based on information currently available to the Company. Forward-looking statements are subject to a number of risks and uncertainties that may cause the actual events or results of the Company to differ materially from those discussed in the forward-looking statements, and even if such actual events or results are realized or substantially realized, there can be no assurance that they will have the expected consequences to, or effects on, the Company. Factors that could cause actual results or events to differ materially from current expectations include, among other things: uncertainties relating to the availability and costs of financing in the future; risks related to the exploration stage of the Company's properties; the possibility that future exploration results will not be consistent with the Company's expectations; failure to establish estimated mineral resources or mineral reserves; fluctuations in gold prices and currency exchange rates; inflation; rules adopted by the U.S. Securities and Exchange Commission that may affect mining operations in the Democratic Republic of the Congo; gold recoveries being less than those indicated by the metallurgical testwork carried out to date (there(there can be no assurance that gold recoveries in small scale laboratory tests will be duplicated in large tests under on-site conditions or during production); changes in equity markets; political developments in the Democratic Republic of the Congo; lack of infrastructure; failure to procure or maintain, or delays in procuring or maintaining, permits and approvals; lack of availability at a reasonable cost or at all, of plants, equipment or labour; inability to attract and retain key management and personnel; changes to regulations or policies affecting the Company's activities; the uncertainties involved in interpreting drilling results and other geological data; the Company's history of losses and expectation of future losses; the Company's ability to acquire additional commercially mineable mineral rights; risks related to the integration of any new acquisitions into the Company's existing operations; increased competition in the mining industry; and the other risks disclosed under the heading "Risk Factors" in this Form 20-F.
Any forward-looking statement speaks only as of the date on which it is made and, except as may be required by applicable securities laws, the Company disclaims any intent or obligation to update any forward-looking statement, whether as a result of new information, future events or results or otherwise. Although the Company believes that the assumptions inherent in the forward-looking statements are reasonable, forward-looking statements are not guarantees of future performance and accordingly undue reliance should not be put on such statements due to the inherent uncertainty therein.
The mineral resource figures referred to in this Form 20-F are estimates and no assurances can be given that the indicated levels of gold will be produced. Such estimates are expressions of judgment based on knowledge, mining experience, analysis of drilling results and industry practices. Valid estimates made at a given time may significantly change when new information becomes available. While the Company believes that the resource estimates included in this Form 20-F are well established, by their nature, resource estimates are imprecise and depend, to a certain extent, upon statistical inferences which may ultimately prove unreliable. If such estimates are inaccurate or are reduced in the future, this could have a material adverse impact on the Company.
Due to the uncertainty that may be attached to inferred mineral resources, it cannot be assumed that all or any part of an inferred mineral resource will be upgraded to an indicated or measured mineral resource as a result of continued exploration. Confidence in the estimate is insufficient to allow meaningful application of the technical and economic parameters to enable an evaluation of economic viability sufficient for public disclosure, except in certain limited circumstances. Inferred mineral resources are excluded from estimates forming the basis of a feasibility study.
Statements concerning actual mineral resource estimates are also deemed to constitute forward-looking statements to the extent that they involve estimates of the mineralization that will be encountered if the relevant project or property is developed. Mineral resources that are not mineral reserves do not have demonstrated economic viability. There is no certainty that mineral resources can be upgraded to mineral reserves through continued exploration.
CAUTIONARY NOTE TO U.S. INVESTORS REGARDING RESOURCE ESTIMATES
This Form 20-F, including the documents incorporated by reference herein, has been prepared in accordance with the requirements of securities laws in effect in Canada, which differ from the requirements of U.S. securities laws. Without limiting the foregoing, this Form 20-F, including the documents incorporated by reference herein, uses the terms "measured", "indicated" and "inferred" resources. U.S. investors are advised that, while such terms are recognized and required by Canadian securities laws, the U.S. Securities and Exchange Commission (the "SEC") does not recognize them. Under U.S. standards, mineralization may not be classified as a "reserve" unless the determination has been made that the mineralization could be economically and legally produced or extracted at the time the reserve determination is made. U.S. investors are cautioned not to assume that all or any part of measured or indicated resources will ever be converted into reserves. Further, "inferred resources" have a great amount of uncertainty as to their existence and as to whether they can be mined legally or economically. It cannot be assumed that all or any part of the "inferred resources" will ever be upgraded to a higher category. Therefore, U.S. investors are also cautioned not to assume that all or any part of the inferred resources exist, or that they can be mined legally or economically. Disclosure of "contained ounces" is permitted disclosure under Canadian regulations, however, the SEC normally only permits issuers to report mineral deposits that do not constitute "reserves" as in place tonnage and grade without reference to unit measures. Accordingly, information concerning descriptions of mineralization and resources contained in this Form 20-F or in the documents incorporated by reference, may not be comparable to information made public by U.S. companies subject to the reporting and disclosure requirements of the SEC.
National Instrument 43-101 -Standards of Disclosure for Mineral Projects("NI 43-101") is a rule of the Canadian Securities Administrators which establishes standards for all public disclosure an issuer makes of scientific and technical information concerning mineral projects. Unless otherwise indicated, all resource estimates contained in or incorporated by reference in this Form 20-F have been prepared in accordance with NI 43-101 and the Canadian Institute of Mining, Metallurgy and Petroleum Classification System. These standards differ significantly from the requirements of the SEC, and resource information contained herein and incorporated by reference herein may not be comparable to similar information disclosed by U.S. companies. One consequence of these differences is that "reserves" calculated in accordance with Canadian standards may not be "reserves" under the SEC standards.
U.S. investors are urged to consider closely the disclosure in the Company's Form 40-F Registration Statement, File No. 001-35124, which may be secured from the Company, or from the SEC's website at http://www.sec.gov.
CURRENCY
Unless stated otherwise or the context otherwise requires, all references in this Form 20-F to "US$" are to United States dollars and all references in this Form 20-F to "Cdn$" are to Canadian dollars.
PART 1
Item 1. Identity of Directors, Senior Management and Advisors
This Form 20-F is being filed as an annual report under the United StatesSecurities Exchange Act of 1934, as amended, (the "U.S. Exchange Act") and, as such, there is no requirement to provide any information under this item.
Item 2. Offer Statistics and Expected Timetable
This Form 20-F is being filed as an annual report under the U.S. Exchange Act and, as such, there is no requirement to provide any information under this item.
Item 3. Key Information
A. Selected Financial Data
The selected consolidated financial information set forth below for each of the threefour years ended December 31, 2013, 2012, 2011 and 2010, which is expressed in United States dollars (the Company prepares its financial statements in United States dollars), has been derived from the Company's audited consolidated financial statements as at and for the financial years ended December 31, 2013, 2012, 2011 and 2010filed as part of thisForm 20-F under Item 18.2010. Theseconsolidated financial statements have been prepared in accordance with International Financial Reporting Standards ("IFRS") issued by the International Accounting Standards Board,which differ in certain respects from the principles the Company would have followed had its consolidated financial statements been prepared in accordance with generally accepted accounting principles in the United States ("United States GAAP").The selected consolidated financial information should be read in conjunction with the discussion in Item 5 of this Form 20-F and the said consolidated financial statements and related notes thereto.thereto filed as part of this Form 20-F under Item 18. Historical results from any prior period are not necessarily indicative of results to be expected for any future period.
| (in $000 except share data) | (in $000 except share data) | |||||||||||||||||||||||||||
| IFRS | 2012 | 2011 | 2010 | 2013 | 2012 | 2011 | 2010 | |||||||||||||||||||||
| Revenue | $ | - | $ | - | $ | - | $ | - | $ | - | $ | - | $ | - | ||||||||||||||
| Net income (loss) from operations | (2,027 | ) | 726 | (5,872 | ) | (28,038 | ) | (2,027 | ) | 726 | (5,872 | ) | ||||||||||||||||
| Net income (loss) for the year | (2,082 | ) | 533 | (5,990 | ) | (27,224 | ) | (2,081 | ) | 533 | (5,990 | ) | ||||||||||||||||
| Basic net income (loss) per share | (0.03 | ) | 0.01 | (0.14 | ) | |||||||||||||||||||||||
| Basic and diluted net income (loss) per share | (0.37 | ) | (0.03 | ) | 0.01 | (0.14 | ) | |||||||||||||||||||||
| Current assets | 11,270 | 14,931 | 10,635 | 844 | 11,270 | 14,931 | 10,635 | |||||||||||||||||||||
| Exploration and evaluation expenditures | 48,255 | 30,090 | 12,658 | 30,893 | 48,255 | 30,090 | 12,658 | |||||||||||||||||||||
| Total assets | 60,274 | 45,800 | 23,841 | 32,182 | 60,274 | 45,800 | 23,841 | |||||||||||||||||||||
| Total liabilities | 2,488 | 2,464 | 7,383 | 1,203 | 2,488 | 2,464 | 7,383 | |||||||||||||||||||||
| Net assets | 57,786 | 43,336 | 16,459 | 30,979 | 57,786 | 43,336 | 16,459 | |||||||||||||||||||||
| Share capital | 75,715 | 60,045 | 37,035 | 75,715 | 75,715 | 60,045 | 37,035 | |||||||||||||||||||||
| Shareholders' equity | 57,786 | 43,336 | 16,459 | 30,979 | 57,786 | 43,336 | 16,459 | |||||||||||||||||||||
| Weighted average common shares outstanding | 62,396 | 57,056 | 41,558 | 73,440 | 62,396 | 57,056 | 41,558 | |||||||||||||||||||||
The selected consolidated financial information set forth in the first table below for each of the two yearsyear ended December 31, 2009, and 2008, which is expressed in United States dollars (the Company prepares its financial statements in United States dollars), has been derived from the Company's audited consolidated financial statements as at and for the financial yearsyear ended December 31, 2009 and 2008.2009. Theseconsolidated financial statements were prepared in accordance with generally accepted accounting principles in Canada ("Canadian GAAP"),which differ in certain respects from the principles the Company would have followed had its consolidated financial statements been prepared in accordance with United States GAAP.
Historical results from any prior period are not necessarily indicative of results to be expected for any future period.
Since November 28, 2008 when the Company completed the acquisition of all of the outstanding shares of the private company,Loncor Resources Inc.,the Company's activities have consisted primarily of the exploration of mineral properties.Prior to this acquisition, the Company was named Nevada Bob’s International Inc. and was in the business of licensing the right to use certain trademarks.
If the Company had followed United States GAAP in respect of the two yearsyear ended December 31, 2009, and 2008, certain items in the consolidated financial statements would have been reported as set forth in the second table below.
The selected consolidated financial information in the IFRS chart above should not be compared to the information in the Canadian GAAP or United States GAAP charts below as the information was prepared using difference financial reporting standards.
| (in $000 except share data) | ||||||||
| Canadian GAAP | 2009 | 2008 | ||||||
| Revenue | $ | 1 | $ | 166 | ||||
| Net income (loss) from operations | (1,010 | ) | (406 | ) | ||||
| Net income (loss) for the year | (1,011 | ) | (371 | ) | ||||
| Basic net income (loss) per share | (0.04 | ) | (0.01 | ) | ||||
| Current assets | 1,638 | 1,633 | ||||||
| Exploration and evaluation expenditures | 4,954 | 3,958 | ||||||
| Total assets | 6,620 | 5,649 | ||||||
| Total liabilities | 3,429 | 3,788 | ||||||
| Net assets | 3,190 | 1,861 | ||||||
| Share capital | 20,341 | 18,317 | ||||||
| Shareholders' equity | 3,190 | 1,861 | ||||||
| Weighted average common shares outstanding | 28,559 | 24,712 | ||||||
(in $000 except share data)
| Canadian GAAP | 2009 | |||
| Revenue | $ | 1 | ||
| Net income (loss) from operations | (1,010 | ) | ||
| Net income (loss) for the year | (1,011 | ) | ||
| Basic net income (loss) per share | (0.04 | ) | ||
| Current assets | 1,638 | |||
| Exploration and evaluation expenditures | 4,954 | |||
| Total assets | 6,620 | |||
| Total liabilities | 3,429 | |||
| Net assets | 3,190 | |||
| Share capital | 20,341 | |||
| Shareholders' equity | 3,190 | |||
| Weighted average common shares outstanding | 28,559 | |||
(in $000 except share data)
| (in $000 except share data) | ||||||||||||
| United States GAAP | 2009 | 2008 | 2009 | |||||||||
| Revenue | $ | 1 | $ | 166 | $ | 1 | ||||||
| Net income (loss) from operations | (2,007 | ) | (2,276 | ) | (2,007 | ) | ||||||
| Net income (loss) for the year | (2,007 | ) | (2,241 | ) | (2,007 | ) | ||||||
| Basic net income (loss) per share | (0.07 | ) | (0.09 | ) | (0.07 | ) | ||||||
| Current assets | 1,638 | 1,633 | 1,638 | |||||||||
| Exploration and evaluation expenditures | - | - | - | |||||||||
| Total assets | 1,665 | 1,691 | 1,665 | |||||||||
| Total liabilities | 3,007 | 3,365 | 3,007 | |||||||||
| Net assets | (1,341 | ) | (2,097 | ) | (1,341 | ) | ||||||
| Share capital | 20,341 | 18,317 | 20,341 | |||||||||
| Shareholders' equity | (1,341 | ) | (2,097 | ) | (1,341 | ) | ||||||
| Weighted average common shares outstanding | 28,559 | 24,712 | 28,559 | |||||||||
Exchange Rates
On March 22, 2013,21, 2014, the buying rate in New York City for cable transfers in Canadian dollars, as certified for customs purposes by the Federal Reserve Bank of New York, was Cdn$US$1.00 = US$0.9781.Cdn$1.1191. The following table sets forth, for each of the years or, as applicable, months indicated, additional information with respect to the noon buying rate for Cdn$1.00. Such rates are set forth as U.S.US$1.00 in Canadian dollars per Cdn$1.00 and are based upon the rates quoted by the Federal Reserve Bank of New York.
| Rate | 2012 | 2011 | 2010 | 2009 | 2008 | 2013 | 2012 | 2011 | 2010 | 2009 | ||||||||||||||||||||||||||||||
| Average(1) | 1.0008 | 1.0144 | 0.9659 | 0.8793 | 0.9335 | 1.03467 | 0.9996 | 0.9858 | 1.0353 | 1.1373 | ||||||||||||||||||||||||||||||
(1) The average rate means the average of the exchange rates on the last day of each month during the year.
Canadian/United States Dollar Exchange Rates for the Previous Six Months
| Rate | October 2012 | November 2012 | December 2012 | January 2013 | February 2013 | March 2013(1) | October 2013 | November 2013 | December 2013 | January 2014 | February 2014 | March 2014(1) | ||||||||||||||||||||||||||||||||||||
| High | 1.0243 | 1.0074 | 1.0162 | 1.0164 | 1.0041 | 0.9802 | 1.0454 | 1.0597 | 1.0697 | 1.1171 | 1.1137 | 1.1251 | ||||||||||||||||||||||||||||||||||||
| Low | 0.9997 | 0.9971 | 1.0042 | 0.9923 | 0.9722 | 0.9696 | 1.0282 | 1.0442 | 1.0577 | 1.0612 | 1.0952 | 1.0965 | ||||||||||||||||||||||||||||||||||||
(1) Provided for the period from March 1, 20132014 to March 22, 2013.21, 2014.
B. Capitalization and Indebtedness
This Form 20-F is being filed as an annual report under the U.S. Exchange Act and, as such, there is no requirement to provide any information under this item.
C. Reason for the Offer and Use of Proceeds
This Form 20-F is being filed as an annual report under the U.S. Exchange Act and, as such, there is no requirement to provide any information under this item.
D. Risk Factors
There are a number of risks that may have a material and adverse impact on the future operating and financial performance of Loncor and could cause the Company's operating and financial performance to differ materially from the estimates described in forward-looking statements relating to the Company. These include widespread risks associated with any form of business and specific risks associated with Loncor's business and its involvement in the gold exploration industry.
An investment in theCompany's common shares is considered speculative and involves a high degree of risk due to, among other things, the nature of Loncor's business (which is the exploration of mineral properties), the present stage of its development and the location of Loncor's projects in the Democratic Republic of the Congo (the "DRC"). In addition to the other information presented in this Form 20-F, a prospective investor should carefully consider the risk factors set out belowand the other information thatLoncor files with the U.S. Securities and Exchange Commission (the "SEC") and with Canadian securities regulators before investing in the Company's common shares.shares. The Company has identified the following non-exhaustive list of inherent risks and uncertainties that it considers to be relevant to its operations and business plans. Such risk factors could materially affect the Company's future operating results and could cause actual events to differ materially from those described in forward-looking statements relating to the Company. As well, additionaladditional risks that the Company is unaware of or that are currently believed to be immaterial may become important factors that affect the Company's business.
The Company has not generated revenues from operations, does not have a history of mining operations, and there is no assurance that it will produce revenue, operate profitably or provide a return on investment in the future.
The Company has not generated revenues from operations and there is no assurance that it will produce revenue, operate profitably or provide a return on investment in the future. The Company has only incurred operating losses, and the development of its projects is at an early stage. The Company produced a loss of US$27,224,451 for the year ended December 31, 2013, and, as of that date, the Company’s deficit was US$52,771,536 which casts substantial doubt on the Company’s ability to continue as a going concern. The Company is subject to the risks and challenges experienced by other companies at a comparable stage. These risks include, but are not limited to, continuing losses and the ability to secure adequate financing or to complete corporate transactions to meet the minimum capital required to successfully complete its projects and fund other operating expenses.
The Company's ability to continue as a going concern is dependent upon its ability to obtain the necessary financing to meet its obligations and repay liabilities arising from normal business operations when they come due. Development of the Company’s current projects to the production stage will require significant financing. Given the current economic climate, the ability to raise funds may prove difficult. The Company has no revenues and is wholly reliant upon external financing to fund such plans. There can be no assurance that such financing will be available to the Company or, if it is, that it will be offered on acceptable terms. If additional financing is raised through the issuance of equity or convertible debt securities of the Company, the interests of the Company's shareholders in the net assets of the Company may be diluted. Any failure of the Company to obtain required financing on acceptable terms could have a material adverse effect on the Company's financial condition, results of operations, liquidity, and its ability to continue as a going concern, and may require the Company to cancel or postpone planned capital investments.
The auditor’s report issued in respect of the Company’s 2013 annual consolidated financial statements contains an "Emphasis of Matter" which includes the following statement:
"Without qualifying our opinion, we draw attention to Note 2 in the consolidated financial statements which indicates the Company produced a net loss of $27,224,451 for the year ended December 31, 2013 and as of that date the Company’s accumulated deficit was $52,771,536. These conditions, along with other matters as set forth in Note 2, indicate the existence of a material uncertainty that casts substantial doubt on the Company’s ability to continue as a going concern."
The assets and operations of Loncor are subject to political, economic and other uncertainties as a result of being located in the DRC.
Loncor's projects are located in the DRC. The assets and operations of the Company are therefore subject to various political, economic and other uncertainties, including, among other things, the risks of war and civil unrest, expropriation, nationalization, renegotiation or nullification of existing licenses, permits, approvals and contracts, taxation policies, foreign exchange and repatriation restrictions, changing political conditions, international monetary fluctuations, currency controls and foreign governmental regulations that favour or require the awarding of contracts to local contractors or require foreign contractors to employ citizens of, or purchase supplies from, a particular jurisdiction. Changes, if any, in mining or investment policies or shifts in political climate in the DRC may adversely affect Loncor's operations or profitability. Operations may be affected in varying degrees by government regulations with respect to, but not limited to, restrictions on production, price controls, export controls, currency remittance, income taxes, foreign investment, maintenance of claims, environmental legislation, land use, land claims of local people, water use and mine safety. Failure to comply strictly with applicable laws, regulations and local practices relating to mineral rights, could result in loss, reduction or expropriation of entitlements. In addition, in the event of a dispute arising from operations in the DRC, the Company may be subject to the exclusive jurisdiction of foreign courts or may not be successful in subjecting foreign persons to the jurisdiction of courts in Canada. The Company also may be hindered or prevented from enforcing its rights with respect to a governmental instrumentality because of the doctrine of sovereign immunity. It is not possible for the Company to accurately predict such developments or changes in laws or policy or to what extent any such developments or changes may have a material adverse effect on the Company's operations. Should the Company's rights or its titles not be honoured or become unenforceable for any reason, or if any material term of these agreements is arbitrarily changed by the government of the DRC, the Company's business, financial condition and prospects will be materially adversely affected.
Some or all of the Company's properties are located in regions where political instability and violence is ongoing (for example, in November 2012, the M23 rebel group took over the city of Goma (Loncor's operations are located about 420 kilometres northwest of Goma and were unaffected by the M23 situation), but subsequently withdrew from Goma under international pressure). Some or all of the Company's properties are inhabited by artisanal miners. These conditions may interfere with work on the Company's properties and present a potential security threat to the Company's employees. There is a risk that activities at the Company’s properties may be delayed or interfered with, due to the conditions of political instability, violence or the inhabitation of the properties by artisanal miners. The Company uses its best efforts to maintain good relations with the local communities in order to minimize such risks.
The DRC is a developing nation emerging from a period of civil war and conflict. Physical and institutional infrastructure throughout the DRC is in a debilitated condition. The DRC is in transition from a largely state controlled economy to one based on free market principles, and from a non-democratic political system with a centralized ethnic power base, to one based on more democratic principles. There can be no assurance that these changes will be effected or that the achievement of these objectives will not have material adverse consequences for Loncor and its operations. The DRC continues to experience instability in parts of the country due to certain militia and criminal elements. While the government and United Nations forces are working to support the extension of central government authority throughout the country, there can be no assurance that such efforts will be successful.
No assurance can be given that the Company will be able to maintain effective security in connection with its assets or personnel in the DRC where civil war and conflict have disrupted exploration and mining activities in the past and may affect the Company's operations or plans in the future.
HIV/AIDS, malaria and other diseases represent a serious threat to maintaining a skilled workforce in the mining industry in the DRC. HIV/AIDS is a major healthcare challenge faced by the Company's operations in the country. There can be no assurance that the Company will not lose members of its workforce or workforce man-hours or incur increased medical costs, which may have a material adverse effect on the Company's operations.
The DRC has historically experienced relatively high rates of inflation.
The Company’s properties are in the exploration stage, and there can be no assurance that the Company’s exploration activities will result in discoveries that are commercially viable.
The Company's properties are in the exploration stage. The future development of properties found to be economically feasible will require board approval, the construction and operation of mines, processing plants and related infrastructure. As a result, Loncor is subject to all of the risks associated with establishing new mining operations and business enterprises including: the timing and cost, which can be considerable, of the construction of mining and processing facilities; the availability and costs of skilled labour and mining equipment; the availability and costs of appropriate smelting and/or refining arrangements; the need to obtain necessary environmental and other governmental approvals and permits, and the timing of those approvals and permits; and, the availability of funds to finance construction and development activities. The costs, timing and complexities of mine construction and development are increased by the remote location of the Company's properties. It is common in new mining operations to experience unexpected problems and delays during construction, development, and mine start-up. In addition, delays in the commencement of mineral production often occur. Accordingly, there are no assurances that the Company's activities will result in profitable mining operations or that the Company will successfully establish mining operations or profitably produce gold at any of its properties.
The Company does not have a history of mining operations, and there is no assurance that it will produce revenue, operate profitably or provide a return on investment in the future.
The Company has only incurred operating losses, and the development of its projects is at an early stage. The Company's ability to continue as a going concern is dependent upon its ability to obtain the necessary financing to meet its obligations and repay liabilities arising from normal business operations when they come due.
The Company will require significant financing in order to carry out plans to develop its projects. The Company has no revenues and is wholly reliant upon external financing to fund such plans. There can be no assurance that such financing will be available to the Company or, if it is, that it will be offered on acceptable terms. If additional financing is raised through the issuance of equity or convertible debt securities of the Company, the interests of the Company's shareholders in the net assets of the Company may be diluted. Any failure of the Company to obtain required financing on acceptable terms could have a material adverse effect on the Company's financial condition, results of operations, liquidity, and its ability to continue as a going concern, and may require the Company to cancel or postpone planned capital investments.
The Company may be adversely affected by fluctuations in gold prices.
The future price of gold will significantly affect the development of Loncor's projects. Gold prices are subject to significant fluctuation and are affected by a number of factors which are beyond Loncor's control. Such factors include, but are not limited to, interest rates, inflation or deflation, fluctuation in the value of the United States dollar and foreign currencies, global and regional supply and demand, and the political and economic conditions of major gold-producing countries throughout the world. The price of gold has fluctuated widely in recent years, and future serious price declines could cause development of and commercial production from Loncor's mineral interests to be impracticable. If the price of gold decreases, projected cash flow from planned mining operations may not be sufficient to justify ongoing operations and Loncor could be forced to discontinue development and sell its projects. Future production from Loncor's projects is dependent on gold prices that are adequate to make these projects economic.
The Company has substantially reduced exploration efforts at its projects, and there is no assurance that they will be recommenced.
As a result of the sharp decline in gold prices in 2013 and the difficult financing prospects for gold exploration companies in general and the Company in particular, the Company has substantially reduced exploration efforts at its projects in order to conserve cash. It is unlikely that the reduced exploration efforts can identify additional resources or make other substantial progress in advancing the projects. There can be no assurance that exploration will be significantly increased at the projects in the foreseeable future. Failure to conduct significant exploration activities would result in the inability to identify further development potential of the projects and could render financing more difficult to obtain, which would materially and adversely affect the Company’s financial condition.
The Company’s activities are subject to various laws and government approvals and no assurance can be given that the Company will be successful in obtaining or maintaining such approvals or that it will successfully comply with all applicable laws.
Loncor's mineral exploration activities are subject to various laws governing prospecting, mining, development, production, taxes, labour standards and occupational health, mine safety, toxic substances, land use, water use, land claims of local people and other matters. Although Loncor's exploration activities are currently carried out in accordance with all applicable rules and regulations, no assurance can be given that new rules and regulations will not be enacted or that existing rules and regulations will not be applied in a manner which could limit or curtail development.
Many of Loncor's mineral rights and interests are subject to government approvals, licenses and permits. Such approvals, licenses and permits are, as a practical matter, subject to the discretion of the DRC government. No assurance can be given that Loncor will be successful in maintaining any or all of the various approvals, licenses and permits in full force and effect without modification or revocation. To the extent such approvals are not maintained, Loncor may be delayed, curtailed or prohibited from continuing or proceeding with planned exploration of mineral properties.
Failure to comply with applicable laws, regulations and permitting requirements may result in enforcement actions thereunder, including orders issued by regulatory or judicial authorities causing operations to cease or be delayed or curtailed, and may include corrective measures requiring capital expenditures, installation of additional equipment, or remedial actions. Parties engaged in the exploration or development of mineral properties may be required to compensate those suffering loss or damage by reason of the activities and may have civil or criminal fines or penalties imposed for violations of applicable laws or regulations.
Amendments to current laws and regulations governing operations or more stringent implementation thereof could have a substantial adverse impact on Loncor and cause increases in exploration expenses, capital expenditures or require abandonment or delays in development of mineral interests.
Exploration, development and mining involve a high degree of risk.
All of the Company's properties are in the exploration stage only. The exploration for and development of mineral deposits involves significant risks that even a combination of careful evaluation, experience and knowledge may not eliminate. While the discovery of an ore body may result in substantial rewards, few properties that are explored are ultimately developed into producing mines. Major expenditures may be required to locate and establish mineral reserves, to develop metallurgical processes and to construct mining and processing facilities at a particular site. Whether a mineral deposit, once discovered, will be commercially viable depends on a number of factors, some of which are: the particular attributes of the deposit, such as size, grade and proximity to infrastructure; metal prices which are highly cyclical; and government regulations, including regulations relating to prices, taxes, royalties, land tenure, land use, importing and exporting of minerals and environmental protection. The exact effect of these factors cannot be accurately predicted, but the combination of these factors may result in Loncor not receiving an adequate return on invested capital.
There is no certainty that the expenditures made by Loncor towards the search for and evaluation of mineral deposits will result in discoveries that are commercially viable. In addition, assuming discovery of a commercial ore-body, depending on the type of mining operation involved, several years can elapse from the initial phase of drilling until commercial operations are commenced.
Mining operations generally involve a high degree of risk. Such operations are subject to all the hazards and risks normally encountered in the exploration for, and development and production of gold and other precious or base metals, including unusual and unexpected geologic formations, seismic activity, rock bursts, fires, cave-ins, flooding and other conditions involved in the drilling and removal of material as well as industrial accidents, labour force disruptions, fall of ground accidents in underground operations, unanticipated increases in gold lock-up and inventory levels at heap-leach operations and force majeure factors, any of which could result in damage to, or destruction of, mines and other producing facilities, damage to person or property, environmental damage, delays, increased production costs, monetary losses and possible legal liability. Milling operations are subject to hazards such as equipment failure or failure of mining pit slopes and retaining dams around tailings disposal areas, which may result in environmental pollution and consequent liability. The Company may not be able to obtain insurance to cover these risks at economically feasible premiums. Insurance against certain environmental risks, including potential liability for pollution or other hazards as a result of the disposal of waste products occurring from production, is not generally available to the Company or to other companies within the mining industry. The Company may suffer a material adverse effect on its business if it incurs losses related to any significant events that are not covered by insurance policies.
There can be no assurance that an active market for the Company’s securities will be sustained.
The market price of the Company's securities may fluctuate significantly based on a number of factors, some of which are unrelated to the financial performance or prospects of the Company. These factors include macroeconomic developments in North America and globally, market perceptions of the attractiveness of particular industries, short-term changes in commodity prices, other precious metal prices, the attractiveness of alternative investments, currency exchange fluctuation, the political environment in the DRC and the Company's financial condition or results of operations as reflected in its financial statements. Other factors unrelated to the performance of the Company that may have an effect on the price of the securities of the Company include the following: the extent of analytical coverage available to investors concerning the business of the Company may be limited if investment banks with research capabilities do not follow the Company's securities; lessening in trading volume and general market interest in the Company's securities may affect an investor's ability to trade significant numbers of securities of the Company; the size of the Company's public float may limit the ability of some institutions to invest in the Company's securities; the Company's operating performance and the performance of competitors and other similar companies; the public's reaction to the Company's press releases, other public announcements and the Company's filings with the various securities regulatory authorities; changes in estimates or recommendations by research analysts who track the Company's securities or the shares of other companies in the resource sector; the arrival or departure of key personnel; acquisitions, strategic alliances or joint ventures involving the Company or its competitors; the factors listed in this Form 20-F under the heading "Cautionary Statement Regarding Forward-Looking Statements"; and a substantial decline in the price of the securities of the Company that persists for a significant period of time could cause the Company's securities to be delisted from any exchange on which they are listed at that time, further reducing market liquidity. If there is no active market for the securities of the Company, the liquidity of an investor's investment may be limited and the price of the securities of the Company may decline. If such a market does not develop, investors may lose their entire investment in the Company's securities.
The Company expects that it will be considered a passive foreign investment company or "PFIC".
Holders of common sharesof the Company that are U.S. taxpayers should be aware that, due to the nature of the Company's assets and the income that it expects to generate, the Company expects to be a "passive foreign investment company" ("PFIC") for the current year, and may be a PFIC in subsequent taxable years. Whether the Company will be a PFIC for the current or future taxable year will depend on the Company's assets and income over the course of each such taxable year and, as a result, cannot be predicted with certainty as of the date of this Form 20-F. Accordingly, there can be no assurance that the IRS will not challenge the determination made by the Company concerning its PFIC status for any taxable year. U.S. federal income tax laws contain rules which result in materially adverse tax consequences to U.S. taxpayers that own shares of a corporation which has been classified as a PFIC during any taxable year of such holder's holding period. A U.S. taxpayer who holds stock in a foreign corporation during any year in which such corporation qualifies as a PFIC may mitigate such negative tax consequences by making certain U.S. federal income tax elections, which are subject to numerous restrictions and limitations. Holders of the Company's common sharesare urged to consult their tax advisors regarding the acquisition, ownership, and disposition of the Company's common shares. This paragraph is only a brief summary of the PFIC rules, and is qualified in its entirety by the section below entitled "Certain United States Federal Income Tax Considerations".
The Company has a history of losses and may never achieve revenues or profitability.
The Company has incurred losses from operations since it became a mineral exploration company in November 2008 and the Company expects to incur losses from operations for the foreseeable future.
The Company had an accumulated deficit of US$25.547 million52,771,536 as of December 31, 2012.2013. The losses do not include capitalized mineral property exploration costs.
The Company expects to continue to incur losses unless and until such time as one or more of its properties enter into commercial production and generate sufficient revenues to fund continuing operations. The development of the Company's properties will require the commitment of substantial financial resources. The amount and timing of expenditures will depend on a number of factors, including the progress of ongoing exploration and development, the results of consultants' analysis and recommendations, the rate at which operating losses are incurred, and the Company's acquisition of additional properties, some of which are beyond the Company's control. There can be no assurance that the Company will ever achieve profitability.
In order to develop any of its projects the Company will need to establish the facilities and material necessary to support operations in the remote locations in which they are situated, which lack basic infrastructure.
The Company's projects are located in remote areas of the DRC, which lack basic infrastructure, including sources of power, water, housing, food and transport. In order to develop any of its projects Loncor will need to establish the facilities and material necessary to support operations in the remote locations in which they are situated. The remoteness of each project will affect the potential viability of mining operations, as Loncor will also need to establish substantially greater sources of power, water, physical plant and transport infrastructure than are currently present in the area. The transportation of equipment and supplies into the DRC and the transportation of resources out of the DRC may also be subject to delays that adversely affect the ability of the Company to proceed with its mineral projects in the country in a timely manner. Shortages of the supply of diesel, mechanical parts and other items required for the Company's operations could have an adverse effect on the Company's business, operating results and financial condition. The lack of availability of such sources may adversely affect mining feasibility and will, in any event, require Loncor to arrange significant financing, locate adequate supplies and obtain necessary approvals from national, provincial and regional governments, none of which can be assured. The Company's interests in the DRC are accessed over lands that may also be subject to the interests of third parties which may result in further delays and disputes in the carrying out of the Company's operational activities.
There is uncertainty in the estimation of mineral resources.
The mineral resource figures referred to in thisForm 20-F and in the Company's filings with the SEC and applicable Canadian securities regulatory authorities, press releases and other public statements that may be made from time to time are estimates. These estimates are imprecise and depend upon geological interpretation and statistical inferences drawn from drilling and sampling analysis, which may prove to be unreliable. There can be no assurance that these estimates will be accurate or that this mineralization could be mined or processed profitably.
The Company has not commenced commercial production on any of its properties, and has not defined or delineated any proven or probable reserves on any of its properties. Mineralization estimates for the Company's properties may require adjustments or downward revisions based upon further exploration or development work or actual production experience. In addition, the grade of ore ultimately mined, if any, may differ from that indicated by drilling results. There can be no assurance that minerals recovered in small scale tests will be duplicated in large scale tests under on-site conditions or in production scale.
The resource estimates referred to in thisForm 20-F have been determined and valued based on assumed future prices, cut-off grades and operating costs that may prove to be inaccurate. Extended declines in the market price for gold may render portions of the Company's mineralization uneconomic and result in reduced reported mineralization. Any material reductions in estimates of mineralization, or of the Company's ability to extract this mineralization, could have a material adverse effect on the Company's results of operations or financial condition.
The Company has not established the presence of any proven or probable reserves at any of its properties. There can be no assurance that subsequent testing or future studies will establish proven and probable reserves on such properties. The failure to establish proven and probable reserves on such properties could severely restrict the Company's ability to successfully implement its strategies for long-term growth.
There is uncertainty relating to inferred mineral resources.
There is a risk that the inferred mineral resources referred to in thisForm 20-F cannot be converted into mineral reserves as the ability to assess geological continuity is not sufficient to demonstrate economic viability. Due to the uncertainty that may attach to inferred mineral resources, there is no assurance that inferred mineral resources will be upgraded to resources with sufficient geological continuity to constitute proven and probable mineral reserves as a result of continued exploration.
The Company is exposed to a heightened degree of risk due to the lack of property diversification.
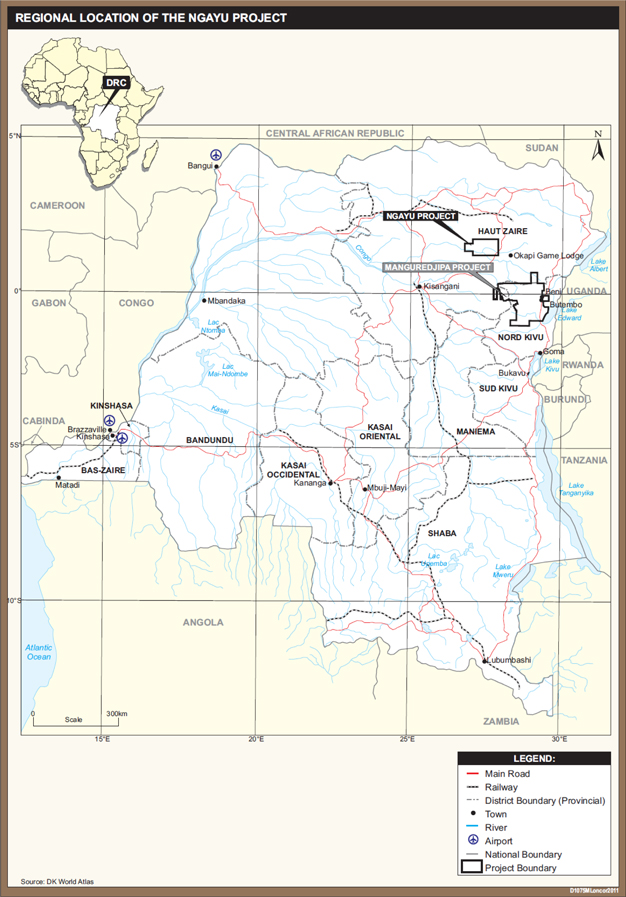
The Ngayu and North Kivu projects account for all of the Company's mineral properties. Any adverse development affecting the progress of either of these projects may have a material adverse effect on the Company's financial performance and results of operations.
Negative market perception of junior mineral exploration companies could adversely affect the Company.
Market perception of junior mineral exploration companies such as the Company may shift such that these companies are viewed less favourably. This factor could impact the value of investors' holdings and the ability of the Company to raise further funds, which could have a material adverse effect on the Company's business, financial condition and prospects.
The SEC has adopted rules that may affect mining operations in the DRC.
The Company’s business is subject to evolving corporate governance and public disclosure regulations that have increased both the Company’s compliance costs and the risk of noncompliance, which could have an adverse effect on the Company’s stock price.
The Company is subject to changing rules and regulations promulgated by a number of United States and Canadian governmental and self-regulated organizations, including the SEC, the Canadian Securities Administrators, the New York Stock Exchange, the Toronto Stock Exchange, and the International Accounting Standards Board. These rules and regulations continue to evolve in scope and complexity and many new requirements have been created in response to laws enacted by the United States Congress, making compliance more difficult and uncertain. For example, on July 21, 2010, the United States Congress passed the Dodd-Frank Wall Street Reform and Consumer Protection Act, which resultedis expected to result in the SEC adopting rules that will require the Company to disclose on an annual basis, beginning in 2014, certain payments made by the Company, its subsidiaries or entities controlled by it, to the U.S. government and foreign governments, including sub-national governments. The SEC has also adopted rules under the Dodd Frank Act that will require a company filing reports with the SEC to disclose on an annual basis, beginning in 2014, whether certain “conflict minerals” necessary to the functionality or production of a product manufactured by such company originated in the DRC or any adjoining country. The Company currently holds properties located in the DRC. It is possible that the new SEC rules regarding conflict minerals could adversely affect the value of the minerals mined in the DRC, which may impact the value of the Company’s interests in those properties. The Company’s efforts to comply with the Dodd-Frank Act, the rules and regulations promulgated thereunder, and other new rules and regulations have resulted in, and are likely to continue to result in, increased general and administration expenses and a diversion of management time and attention from revenue-generating activities to compliance activities.
The Company is not insured to cover all potential risks.
Although the Company maintains directors and officers insurance and insurance on its premises in Toronto, Canada, its insurance does not cover all the potential risks associated with its operations, including industrial accidents, damages to equipment and facilities, labour disputes, pollution, unusual or unexpected geological conditions, rock bursts, ground or slope failures, cave-ins, fires, changes in the regulatory environment and natural phenomena such as inclement weather conditions, floods, earthquakes and other environmental occurrences. In addition, Loncor may elect not to obtain coverage against these risks because of premium costs or other reasons, and where coverage is maintained, losses may exceed policy limits. Losses from these events may cause Loncor to incur significant costs that could have a material adverse effect upon its financial performance and results of operations.
The Company’s operations may be adversely affected by environmental hazards on the properties and related environmental regulations.
All phases of Loncor's operations are subject to environmental regulation. These regulations mandate, among other things, the maintenance of air and water quality standards and land reclamation. They also set forth limitations on the generation, transportation, storage and disposal of solid and hazardous waste. Environmental legislation is evolving in a manner which will require stricter standards and enforcement, increased fines and penalties for non-compliance, more stringent environmental assessments of proposed projects and a heightened degree of responsibility for companies and their officers, directors and employees. Compliance with environmental laws and regulations may require significant capital outlays on behalf of the Company and may cause material changes or delays in the Company's intended activities. There is no assurance that future changes in environmental regulation, if any, will not adversely affect Loncor's operations. Environmental hazards may exist on the properties on which Loncor holds interests which are unknown to Loncor at present and which have been caused by previous owners or operators of the properties. Reclamation costs are uncertain and planned expenditures may differ from the actual expenditures required.
The Company is a foreign corporation and all of the Company’s directors and officers except one director are outside the United States, which makes enforcement of civil liabilities difficult.
The Company is organized under the laws of the Province of Ontario in Canada, and its principal executive office is located in Toronto, Canada. All of the Company's directors and officers except one director, and all of the experts referred to in this Form 20-F, reside outside of the United States, and all or a substantial portion of their assets, and a substantial portion of the Company's assets, are located outside of the United States. As a result, it may be difficult for investors in the United States or otherwise outside of Canada to bring an action against directors, officers or experts who are not resident in the United States or in other jurisdictions outside Canada. It may also be difficult for an investor to enforce a judgment obtained in a United States court or a court of another jurisdiction of residence predicated upon the civil liability provisions of federal securities laws or other laws of the United States or any state thereof or the equivalent laws of other jurisdictions outside Canada against those persons or the Company.
The Company’s business depends on its ability to identify and acquire commercially mineable mineral rights, and there can be no assurances that it will be successful in such efforts.
Most exploration projects do not result in the discovery of commercially mineable ore deposits and no assurance can be given that any anticipated level of recovery of ore reserves will be realized or that any identified mineral deposit will ever qualify as a commercially mineable (or viable) ore body which can be legally and economically exploited. Estimates of reserves, resources, mineral deposits and production costs can also be affected by such factors as environmental permitting regulations and requirements, weather, environmental factors, unforeseen technical difficulties, unusual or unexpected geological formations and work interruptions. Material changes in ore reserves, grades, stripping ratios or recovery rates may affect the economic viability of any project.
Loncor's future growth and productivity will depend, in part, on its ability to identify and acquire additional commercially mineable mineral rights, and on the costs and results of continued exploration and development programs. Mineral exploration is highly speculative in nature and is frequently non-productive. Substantial expenditures are required to: establish ore reserves through drilling and metallurgical and other testing techniques; determine metal content and metallurgical recovery processes to extract metal from the ore; and construct, renovate or expand mining and processing facilities.
In addition, if the Company discovers ore, it would take several years from the initial phases of exploration until production is possible. During this time, the economic feasibility of production may change. As a result of these uncertainties, there can be no assurance that the Company will successfully acquire additional commercially mineable (or viable) mineral rights.
Litigation may adversely affect the Company’s financial position, results of operations or the Company’s project development operations.
The Company may from time to time be involved in various legal proceedings. While the Company believes it is unlikely that the final outcome of any such proceedings will have a material adverse effect on the Company's financial position or results of operation, defence and settlement costs can be substantial, even with respect to claims that have no merit. Due to the inherent uncertainty of the litigation process, there can be no assurance that the resolution of any particular legal matter will not have a material adverse effect on the Company's future cash flow, results of operations or financial condition.
Future hedging activities may result in selling products at a price lower than could have otherwise been received.
The Company has not entered into forward contracts or other derivative instruments to sell gold that it might produce in the future. Although the Company has no near term plans to enter such transactions, it may do so in the future if required for project financing. Forward contracts obligate the holder to sell hedged production at a price set when the holder enters into the contract, regardless of what the price is when the product is actually mined. Accordingly, there is a risk that the price of the product is higher at the time it is mined than when the Company entered into the contracts, so that the product must be sold at a price lower than could have been received if the contract was not entered. There is also the risk that the Company may have insufficient gold production to deliver into forward sales positions. The Company may enter into option contracts for gold to mitigate the effects of such hedging.
Increased sales of the Company’s common shares by shareholders could lower the marketplace of the shares.
Sales of a large number of the Company's common shares in the public markets, or the potential for such sales, could decrease the trading price of such shares and could impair Loncor's ability to raise capital through future sales of common shares. Loncor has previously completed private placements at prices per share which are lower than the current market price of its common shares. Accordingly, a number of the Company's shareholders have an investment profit in the Company's common shares that they may seek to liquidate.
Fluctuations in currency could have a material impact on the Company’s financial statements.
The Company uses the United States dollar as its functional currency. Fluctuations in the value of the United States dollar relative to other currencies (including the Canadian dollar) could have a material impact on the Company's consolidated financial statements by creating gains or losses. No currency hedge policies are in place or are presently contemplated.
The loss of key management personnel or the inability to recruit additional qualified personnel may adversely affect the Company’s business.
The success of the Company depends on the good faith, experience and judgment of the Company's management and advisors in supervising and providing for the effective management of the business and the operations of the Company. The Company is dependent on a relatively small number of key personnel, the loss of any one of whom could have an adverse effect on the Company. The Company currently does not have key person insurance on these individuals. The Company may need to recruit additional qualified personnel to supplement existing management and there is no assurance that the Company will be able to attract such personnel.
The Company may not be able to compete with current and potential exploration companies, some of whom have greater resources and technical facilities.
The natural resource industry is intensely competitive in all of its phases. Significant competition exists for the acquisition of properties producing, or capable of producing, gold or other metals. The Company competes with many companies possessing greater financial resources and technical facilities than itself. The Company may also encounter increasing competition from other mining companies in its efforts to hire experienced mining professionals. CompetitionAs well, there is competition for exploration resources at all levels, is currently very intense, particularly affecting the availability of manpower, drill rigs and helicopters. Increased competition could also adversely affect the Company's ability to attract necessary capital funding or acquire suitable producing properties or prospects for mineral exploration in the future.
Certain directors and officers may be in a position of conflict of interest with respect to the Company due to their relationship with other resource companies.
A number of directors and officers of the Company also serve as directors and/or officers of other companies involved in the exploration and development of natural resource properties. As a result, conflicts may arise between the obligations of these individuals to the Company and to such other companies.
The Company has never paid and has no plans to pay dividends.
The Company has not paid out any cash dividends to date and has no plans to do so in the immediate future. As a result, an investor’s return on investment in the Company’s common shares will be solely determined by his or her ability to sell such shares in the secondary market.
The Company may not be able to maintain its listing on the NYSE MKT LLC (the “NYSE MKT”).
The Company received a notification from the NYSE MKT LLC ("NYSE MKT") in March 2014 that it is no longer in compliance with certain NYSE MKT listing standards (reference is made to the Company’s press release dated March 10, 2014). The Company has until April 2, 2014 to submit a plan to regain compliance. The Company may choose not to submit a plan, but if a plan is submitted, there is no guarantee that the plan will be accepted or if the Company will be able to comply with the plan and regain compliance. If the plan is accepted and the Company is not in compliance with the continued listing standards at the end of the plan period or the Company does not make progress consistent with the plan during the period, then the NYSE MKT may initiate delisting proceedings. If the Company’s common shares are delisted from the NYSE MKT, shareholders will not be able to trade its common shares on NYSE MKT and certain federal and state securities law exemptions for its common shares would no longer be available. Consequently, the trading market for the Company’s securities in the United States will be limited.
Item 4. Information on the Company
A. History and Development of the Company
The Company is a corporation governed bywhich was formed under the Ontario Business Corporations Act. on August 24, 1993. The head office and registered office of the Company is located at 1 First Canadian Place, Suite 7070, 100 King Street West, Toronto, Ontario, M5X 1E3, Canada. The telephone number of such office is (416) 366-2221.
On November 28, 2008, the Company completed the acquisition (the "Acquisition") of all of the outstanding shares of the private company,Loncor Resources Inc. ("Old Loncor"). Also onNovember 28, 2008, immediately following this acquisition, the Company amalgamated with Old Loncor and, pursuant to the amalgamation, changed its name from Nevada Bob's International Inc. to Loncor Resources Inc. As a result of this acquisition, thethe business of theCompany is the exploration of mineral properties in the DRC. Prior tothis acquisition,, theCompany was in the business of licensing the right to use (a) the Nevada Bob's trademarks in connection with operating retail golf stores internationally, excluding the United Kingdom, Europe, Canada and the United States, and (b) certain other golf-related, non-Nevada Bob's trademarks internationally, including the United Kingdom, Europe, Canada and the United States.
In September 2009, the Company completed a non-brokered private placement of 3,000,000 common shares at a price of Cdn$0.75 per share for proceeds to the Company of Cdn$2,250,000.
In October 2009, the Company announced the appointment of Peter Cowley as President and Chief Executive Officer of the Company. Mr. Cowley was also appointed to the board of directors of the Company. Kevin Baker stepped down as President and Chief Executive Officer, but remainsremained a non-executive director of the Company.Company until March 2014. Arnold Kondrat was appointed Executive Vice President of the Company and relinquished the title of Chairman of the Board of the Company. In connection with Mr. Cowley's appointment as a director of the Company, Geoffrey Farr stepped down as a director of the Company but remains Corporate Secretary of the Company.
In February 2010, the Company completed a brokered private placement financing involving the issuance of 8,166,500 units of the Company at a price of Cdn$1.25 per unit for aggregate gross proceeds of Cdn$10,208,125. Each such unit was comprised of one common share of the Company and one-half of one common share purchase warrant of the Company, with each full warrant entitling the holder to purchase one common share of the Company at a price of Cdn$1.45 for a period of 24 months. GMP Securities L.P. as lead agent, together with CI Capital Markets Inc. and Salman Partners Inc., acted as the Company's agents in connection with this financing.
Also in February 2010, the Company completed a non-brokered private placement financing involving the issuance toan affiliate(" ("Newmont") of Newmont Mining Corporation of 4,000,000 units of the Company at a price of Cdn$1.25 per unit for aggregate gross proceeds of Cdn$5,000,000. The units issued under this financing had the same terms as the units issued under the February 2010 brokered private placement.In December 2010, Newmont exercised the 2,000,000 warrants that it had acquired under the said February 2010 non-brokered private placement, resulting in the issuance by the Company to Newmont of 2,000,000 common shares of the Company at a price of Cdn$1.45 per share for gross proceeds to the Company of Cdn$2,900,000.
The Company established the main Ngayu exploration camp in early 2010 at the Yindi prospect, located in the southwest corner of the Ngayu gold project area.
In June 2010, the Company announced initial assay results from the Makapela prospect at the Company's Ngayu gold project. A core drilling program at Makapela commenced in November 2010 with the objective of testing along strike and at depth the sub vertical, vein mineralized system being exploited by the artisanal miners at the Main, North and Sele Sele pits which returned significant results from channel sampling. Drill results at Makapela have since been announced by the Company via a number of press releases in 2011 and 2012.
Exploration at the Itali prospect at the Company's Ngayu gold project commenced during the third quarter of 2010 and continued during 2011.2010. The Itali prospect is located about 10 kilometres south of Makapela. In January 2012, the Company announced the results of its first drill hole at the Itali prospect. Additional drill results at the Itali prospect were announced by the Company in October 2012.
In December 2010, the Company completed a non-brokered private placement with Newmont involving the issuance by the Company to Newmont of 2,000,000 units of the Company at a price of Cdn$1.95 per unit for aggregate gross proceeds of Cdn$3,900,000. Each such unit was comprised of one common share of the Company and one-half of one common share purchase warrant of the Company. Each full warrant was exercisable into one additional common share of the Company at a price of Cdn$2.30 until December 2012 (these warrants expired in December 2012 without being exercised).
In February 2011, the Company and Newmont entered into a technology consultation services agreement pursuant to which Newmont agreed to make available to Loncor, at Loncor’s reasonable request, exploration consultation services to assist Loncor in the exploration of Loncor's Ngayu gold project.
Also in February 2011, the Company completed concurrent brokered and non-brokered private placement equity financings. Pursuant to a “bought deal” private placement financing conducted by a syndicate of investment dealers, the Company issued 8,500,000 common shares of the Company at a price of Cdn$2.35 per share, resulting in aggregate gross proceeds of Cdn$19,975,000. The Company also issued, by way of non-brokered private placement, to Newmont, 1,700,000 common shares of the Company at a price of Cdn$2.35 per share for aggregate proceeds of Cdn$3,995,000.
In April 2011, the Company’s common shares commenced trading on the NYSE MKT LLC (formerly called NYSE Amex LLC). The Company retained its primary listing on the TSX Venture Exchange.
In December 2011, the Company announced the results of the regional assessment of its Ngayu gold project. The targets were outlined by assessing the results of two regional BLEG (Bulk Leach Extractable Gold) geochemical surveys conducted during 2011 as part of the technology consultation services agreement between Loncor and Newmont. In accordance with this agreement, Loncor is able to utilize advanced exploration assessment techniques developed by Newmont. As part of this evaluation program, the BLEG results were assessed in conjunction with a detailed geophysical magnetic interpretation of the Ngayu Greenstone belt also undertaken by senior Newmont geophysicists to define the target areas. The initial BLEG survey commenced in March 2011 and comprised the collection of 418 stream sediment samples, at an average sample density of one sample per 10 square kilometres. A second round of infill BLEG sampling was undertaken in September 2011 consisting of 185 samples at an average sample density of one sample per four square kilometres. Samples were sent to Newmont's proprietary geochemical laboratory in Perth, Australia for preparation and analysis. From these results, six high priority targets have beenwere delineated together with seven medium priority targets for follow up.
In January 2012, the Company announced initial bottle roll metallurgical testwork results for the Makapela prospect at the Company's Ngayu gold project. Bottle roll is a preliminary metallurgical test to determine how much and how easily gold may be liberated from an ore using cyanide.
In May 2012, the Companyannounced a maiden mineral resource estimate for the Company's Makapela prospect, of 4.10 million tonnes grading 7.59 g/t Au (using a 2.75 g/t Au cut-off) for an inferred mineral resource of 1.0 million ounces. The Company also announced that this mineral resource was outlined down to a maximum vertical depth 500 metres below surface with gold mineralization open at depth, and that there was significant potential to grow the resource further at depth and in sub-parallel veins.
depth.
In June 2012, the Company announced an exploration update on its regional target follow-up at its Ngayu gold project, reporting that initial groundwork on the priority regional targets has delineated significant mineralized gold trends at Nagasa (4.5 kilometres), Matete (2.0 kilometres) and Mondarabe (1.5 kilometres) in the Imva Fold area. The Company also reported that it has commenced a preliminary economic assessment of the Makapela prospect.
In October 2012, the Company completed two financings concurrently, raising total gross proceeds of Cdn$14,799,750. The first financing involved the issuance of 9,245,000 common shares of the Company at a price of Cdn$1.05 per share for aggregate gross proceeds of Cdn$9,707,250. This offering was conducted by a syndicate of investment dealers and was made by way of a short form prospectus filed with securities regulatory authorities in all of the provinces of Canada (other than Québec). The said shares were also offered on a private placement basis in certain jurisdictions outside of Canada. The second financing involved a non-brokered private placement to Newmont of 4,850,000 common shares of the Company at a price of Cdn$1.05 per share for aggregate gross proceeds of Cdn$5,092,500. As of the date of this Form 20-F, Newmont now holds 14,550,000 (representing 19.81%) of the outstanding common shares of the Company.
In April 2013, the Company announced updated mineral resource estimates for the Company's Makapela prospect, of an indicated mineral resource of 0.61 million ounces (2.20 million tonnes grading at 8.66 g/t Au) and an inferred mineral resource of 0.55 million ounces (3.22 million tonnes grading at 5.30 g/t Au).
In April 2013, the Company announced results of IP surveys at the Company's Nagasa prospect at the Ngayu project, which surveys identified three well-defined, open-ended anomalous zones. The Company had acquired IP equipment in January 2013 with the objectives of: (a) locating potentially mineralized zones in areas covered by transported overburden where soil geochemistry is problematic, such as at Nagasa, and (b) testing for “blind” ore bodies where mineralization does not reach surface.
The Company’s common shares began trading on the Toronto Stock Exchange effective April 26, 2013 and were delisted from the TSX Venture Exchange at the same time.
In July 2013, the Company updated exploration activities at its Ngayu project including announcing drilling results. The Company also reported that, as a result of the sharp decrease in the gold price, the Company will be reducing its exploration effort and overhead costs until market conditions improve. The Company further reported that, in terms of the Makapela preliminary economic assessment, due to the sharply lower gold price, it was decided to not incur any further expenditure on the study until the gold market improves.
As a result of the sharp decline in gold prices in 2013 and the difficult financing prospects for gold exploration companies in general and the Company in particular, the Company has substantially reduced exploration efforts at its projects in order to conserve cash. Since the end of September 2013 and to the date of this Form 20-F, the Company has been undertaking mainly assessment of exploration work undertaken earlier in 2013 at Ngayu and selecting prospects at Ngayu requiring further investigation. In addition, new historical data has been obtained and is being assessed for the North Kivu project in order to select target areas for follow up.
B. Business Overview
General
Loncor is a Canadian gold exploration company focused on two projects in the DRC, the Ngayu and North Kivu projects. The Company has exclusive gold rights to an areaNgayu project comprises 13 exploration permits (which permits are held by the Company’s wholly-owned DRC subsidiary) totaling 2,077 square kilometres that coverscover most of the Ngayu Archaean greenstone belt in Orientale province in the northeast portion of the DRC. Loncor also owns or controls 53The North Kivu project comprises 51 exploration permits owned or controlled by Loncor, covering an area of 13,251 square kilometres in North Kivu province covering 14,344 square kilometres, located west of the city of Butembo. Both areasprojects have historic gold production. Led by a team of senior exploration professionals with extensive African experience, Loncor's strategy includes an aggressive drilling program to follow up on initial known targets as well as covering the entire greenstone belt with regional geochemical and geophysical surveys. Additional information with respect to the Company's projects and the exploration of such projects by the Company can be found below under "Loncor Mineral Properties".
The Loncor Foundation
In early 2010, the Company established the Loncor Foundation, a registered charity in the DRC, funded by the Company with the goal of improving the quality of life and opportunities for communities near the Company's exploration projects. In meetings and discussions with community representatives, it was determined that the Loncor Foundation would focus primarily on health and education projects. Based on this advice, the Loncor Foundation initiated a number of community projects near the Yindi and Makapela prospects at the Ngayu project and the Manguredjipa prospect at the North Kivu project. These included the construction of a new primary school for 400 students at Yindi, which has now been completed with 700 students currently attending. The Loncor Foundation also donated text and exercise books for teachers and students in 2011 and 2012 and made a donation of 40 hospital beds to two medical clinics in the Yindi area. Loncor Foundation projects at Manguredjipa have included financial support for a community electrification project and the construction of six showers and latrines at the Manguredjipa General Hospital, as well as the donation of a motorbike for use by medical staff at the hospital.
The primary focus of the Loncor Foundation in 2011 and 2012 was the construction of the Bole Bole medical clinic at Makapela, which has now been completed. Also in 2012, the Foundation initiated a program to fund the salaries of 12 teachers at the Yindi primary school, eliminating the need for parents to pay tuition costs and increasing enrollment at the school. During 2013, the Loncor Foundation repaired bridges on the road between Yindi and Makapela and continued to fund teachers’ salaries at the Yindi primary school and partially fund operations at the Bole Bole medical clinic.
Additional information with respect to the Loncor Foundation can be found on the Company's web site at www.loncor.com.www.loncor.com.
Exploration Permits and Exploitation Permits under DRC Mining Law
As described below under "Loncor’s Mineral Properties", Loncor holds or has rights incontrols a number of exploration permits covering ground in the DRC being explored by the Company. Under DRC mining law, an exploration permit entitles the holder thereof to the exclusive right, within the perimeter over which it is granted and for the term of its validity, to carry out mineral exploration work for mineral substances, substances for which the licence is granted and associated substances if an extension of the permit is obtained. However, the holder of an exploration permit cannot commence work on the property without obtaining approval in advance of its mitigation and rehabilitation plan. An exploration permit also entitles its holder to the right to obtain an exploitation permit for all or part of the mineral substances and associated substances, if applicable, to which the exploration permit or any extension thereto applies if the holder discovers a deposit which can be economically exploited.
Under DRC mining law, an exploitation permit entitles the holder thereof to the exclusive right to carry out, within the perimeter over which it is granted and during its term of validity, exploration, development, construction and exploitation works in connection with the mineral substances for which the permit has been granted and associated substances if the holder has obtained an extension of the permit. In addition, an exploitation permit entitles the holder to: (a) enter the exploitation perimeter to conduct mining operations; (b) build the installations and infrastructures required for mining exploitation; (c) use the water and wood within the mining perimeter for the requirements of the mining exploitation, provided that the requirements set forth in the environmental impact study and the environmental management plan of the project are complied with; (d) use, transport and freely sell the holder's products originating from within the exploitation perimeter; (e) proceed with concentration, metallurgical or technical treatment operations, as well as the transformation of the mineral substances extracted from the exploitation perimeter; and (f) proceed to carry out works to extend the mine. Without an exploitation permit, the holder of an exploration permit may not conduct exploitation work on the perimeter covered by the exploration permit. So long as a perimeter is covered by an exploitation permit, no other application for a mining or quarry right for all or part of the same perimeter can be processed.
C. Organizational Structure
Loncor does not have any material subsidiaries, other than Loncor Resources Congo Sprl, which is wholly owned by Loncor and was incorporated in the DRC.
D. Property, Plants and Equipment
The Company does not have any material tangible fixed assets.
Loncor’s Mineral Properties
Loncor’s exploration activities are focused on two projects in the DRC, the Ngayu and North Kivu projects.
Ngayu Project
Certain of the following disclosure relating to the Company’s Ngayu gold project is derived from the independent technical report (the "Ngayu Technical Report") dated May 29, 2012 and entitled "Updated National Instrument 43-101 Independent Technical Report on the Ngayu Gold Project, Orientale Province, Democratic Republic of the Congo" prepared for Loncor by Venmyn Rand (Pty) Ltd ("Venmyn"). A copy of the Ngayu Technical Report can be obtained from SEDAR at www.sedar.com and EDGAR atwww.sec.gov.
Property Description and Location
The Ngayu gold project is situated approximately 300 kilometres northeast of Kisangani and 70 kilometres to the west of the Okapi Game Reserve in the Orientale Province of the DRC (see Figure 1)1 below). The project is located 470 kilometres and 400 kilometres north-northwest of Bukavu and Goma, respectively and is situated 130 kilometres northwest of the Manguredjipa project of Loncor.Loncor’s North Kivu project. It is made up of a total of 13exploration permits (or"PRs"), held by the Company through its wholly-owned DRC subsidiary, which cover an area of approximately 208,700ha.2,077 square kilometres.
Figure 1
Before 1961, during colonial times, a total of 13 gold deposits were identified within the Ngayu greenstone belt and six of them are found within the Ngayu project as shown in Figure 2. This greenstone belt envelops the Yindi gold deposit and borders the Adumbi gold deposit which is located within the Kilo Gold Mines PRs. The most obvious prospect identified by Loncor to date is the Makapela prospect located in the northern portion of the Ngayu Project. This has been the focus of exploration in 2011and the first half of 2012.
Legal Aspects and Tenure
The Ngayu project consists of PR number13 PRs numbered 1793 to 1807, excluding 1795 and 1799, issued to Rio Tinto Exploration RDC Orientale Sprl ("PermitCo"), a subsidiary of Rio Tinto operating inheld by the Orientale Province, DRC.Company’s wholly-owned DRC subsidiary. The Ngayu project PRs were renewed on February 10, 2012 and will expire on February 9, 2017. Figure 2 below shows the PR boundaries in relation to the airborne magnetic, workings and prospects of the Ngayu greenstone belt. The PR details are shown in Table 1 below.
Loncor has entered into an option agreement (the "Option Agreement") with PermitCo dated January 26, 2010, which Option Agreement allows Loncor to exploreTable 1: License Details for gold on these particular PR areas. PermitCo’s exploration is focused on iron ore, such that the Option Agreement stipulates that Loncor has permission to explore for gold provided that this exploration does not disturb or interfere with the iron ore exploration rights. Additional termsPRs of the Option Agreement are as follows:
Figure 1Ngayu Project

| PR NO. | LICENCE NO. | HOLDER | DATE OF ISSUE | DATE OF EXPIRY | MINERALS | AREA (ha) | ||||||
| 1793 | NO° CAMI/CR/3169/2007 | Loncor Resources Congo Sprl | 10-Feb-2007 | 09-Feb-2017 | Fe,Au, Sn, Cu, Pt, Ag, W, Co, Nb and Ta | 19,454 | ||||||
| 1794 | NO° CAMI/CR/3170/2007 | Loncor Resources Congo Sprl | 10-Feb-2007 | 09-Feb-2017 | Fe,Au, Sn, Cu, Pt, Ag, W, Co, Nb and Ta | 19,709 | ||||||
| 1796 | NO° CAMI/CR/3172/2007 | Loncor Resources Congo Sprl | 10-Feb-2007 | 09-Feb-2017 | Fe,Au,Sn, Cu, Pt, Ag, W, Co, Nb and Ta | 16,056 | ||||||
| 1797 | NO° CAMI/CR/3173/2007 | Loncor Resources Congo Sprl | 10-Feb-2007 | 09-Feb-2017 | Fe,Au,Sn, Cu, Pt, Ag, W, Co, Nb and Ta | 15,631 | ||||||
| 1798 | NO° CAMI/CR/3174/2007 | Loncor Resources Congo Sprl | 10-Feb-2007 | 09-Feb-2017 | Fe,Au,Sn, Cu, Pt, Ag, W, Co, Nb and Ta | 18,435 | ||||||
| 1800 | NO° CAMI/CR/3176/2007 | Loncor Resources Congo Sprl | 10-Feb-2007 | 09-Feb-2017 | Fe,Au,Sn, Cu, Pt, Ag, W, Co, Nb and Ta | 16,736 | ||||||
| 1801 | NO° CAMI/CR/3177/2007 | Loncor Resources Congo Sprl | 10-Feb-2007 | 09-Feb-2017 | Fe,Au,Sn, Cu, Pt, Ag, W, Co, Nb and Ta | 17,160 | ||||||
| 1802 | NO° CAMI/CR/3178/2007 | Loncor Resources Congo Sprl | 10-Feb-2007 | 09-Feb-2017 | Fe,Au,Sn, Cu, Pt, Ag, W, Co, Nb and Ta | 16,226 | ||||||
| 1803 | NO° CAMI/CR/3179/2007 | Loncor Resources Congo Sprl | 10-Feb-2007 | 09-Feb-2017 | Fe,Au,Sn, Cu, Pt, Ag, W, Co, Nb and Ta | 18,180 | ||||||
| 1804 | NO° CAMI/CR/3180/2007 | Loncor Resources Congo Sprl | 10-Feb-2007 | 09-Feb-2017 | Fe,Au, Sn, Cu, Pt, Ag, W, Co, Nb and Ta | 12,318 | ||||||
| 1805 | NO° CAMI/CR/3181/2007 | Loncor Resources Congo Sprl | 10-Feb-2007 | 09-Feb-2017 | Fe,Au, Sn, Cu, Pt, Ag, W, Co, Nb and Ta | 17,415 | ||||||
| 1806 | NO° CAMI/CR/3182/2007 | Loncor Resources Congo Sprl | 10-Feb-2007 | 09-Feb-2017 | Fe,Au, Sn, Cu, Pt, Ag, W, Co, Nb and Ta | 8,580 | ||||||
| 1807 | NO° CAMI/CR/3184/2007 | Loncor Resources Congo Sprl | 10-Feb-2007 | 09-Feb-2017 | Fe,Au,Sn, Cu, Pt, Ag, W, Co, Nb and Ta | 11,808 |
Surface Rights Owners
According to the DRC laws, the surface rights and the mineral rights pertaining to one property are not separated. Loncor therefore has access to both the surface and gold rights to the Ngayu project.
Table 1: License Details for the PRs of the Ngayu Project
| PR NO. | LICENCE NO. | ISSUED TO | DATE OF ISSUE | DATE OF EXPIRY | MINERALS | AREA (ha) | ||||||||||
| 1793 | NO°CAMI/CR/3169/2007 | Rio Tinto Exploration RDC Orientale | 10-Feb-2007 | 09-Feb-2017 | Fe,Au, Sn, Cu, Pt, Ag, W, Co, Nb and Ta | 19,454 | ||||||||||
| 1794 | NO°CAMI/CR/3170/2007 | Rio Tinto Exploration RDC Orientale | 10-Feb-2007 | 09-Feb-2017 | Fe,Au, Sn, Cu, Pt, Ag, W, Co, Nb and Ta | 19,709 | ||||||||||
| 1796 | NO°CAMI/CR/3172/2007 | Rio Tinto Exploration RDC Orientale | 10-Feb-2007 | 09-Feb-2017 | Fe,Au,Sn, Cu, Pt, Ag, W, Co, Nb and Ta | 16,056 | ||||||||||
| 1797 | NO°CAMI/CR/3173/2007 | Rio Tinto Exploration RDC Orientale | 10-Feb-2007 | 09-Feb-2017 | Fe,Au,Sn, Cu, Pt, Ag, W, Co, Nb and Ta | 15,631 | ||||||||||
| 1798 | NO°CAMI/CR/3174/2007 | Rio Tinto Exploration RDC Orientale | 10-Feb-2007 | 09-Feb-2017 | Fe,Au,Sn, Cu, Pt, Ag, W, Co, Nb and Ta | 18,435 | ||||||||||
| 1800 | NO°CAMI/CR/3176/2007 | Rio Tinto Exploration RDC Orientale | 10-Feb-2007 | 09-Feb-2017 | Fe,Au,Sn, Cu, Pt, Ag, W, Co, Nb and Ta | 16,736 | ||||||||||
| 1801 | NO°CAMI/CR/3177/2007 | Rio Tinto Exploration RDC Orientale | 10-Feb-2007 | 09-Feb-2017 | Fe,Au,Sn, Cu, Pt, Ag, W, Co, Nb and Ta | 17,160 | ||||||||||
| 1802 | NO°CAMI/CR/3178/2007 | Rio Tinto Exploration RDC Orientale | 10-Feb-2007 | 09-Feb-2017 | Fe,Au,Sn, Cu, Pt, Ag, W, Co, Nb and Ta | 16,226 | ||||||||||
| 1803 | NO°CAMI/CR/3179/2007 | Rio Tinto Exploration RDC Orientale | 10-Feb-2007 | 09-Feb-2017 | Fe,Au,Sn, Cu, Pt, Ag, W, Co, Nb and Ta | 18,180 | ||||||||||
| 1804 | NO°CAMI/CR/3180/2007 | Rio Tinto Exploration RDC Orientale | 10-Feb-2007 | 09-Feb-2017 | Fe,Au, Sn, Cu, Pt, Ag, W, Co, Nb and Ta | 12,318 | ||||||||||
| 1805 | NO°CAMI/CR/3181/2007 | Rio Tinto Exploration RDC Orientale | 10-Feb-2007 | 09-Feb-2017 | Fe,Au, Sn, Cu, Pt, Ag, W, Co, Nb and Ta | 17,415 | ||||||||||
| 1806 | NO°CAMI/CR/3182/2007 | Rio Tinto Exploration RDC Orientale | 10-Feb-2007 | 09-Feb-2017 | Fe,Au, Sn, Cu, Pt, Ag, W, Co, Nb and Ta | 8,580 | ||||||||||
| 1807 | NO°CAMI/CR/3184/2007 | Rio Tinto Exploration RDC Orientale | 10-Feb-2007 | 09-Feb-2017 | Fe,Au,Sn, Cu, Pt, Ag, W, Co, Nb and Ta | 11,808 | ||||||||||
Surface Fees and Provincial Taxes
In order to maintain a PR in good standing under DRC law the title holder is required to make annual surface fee and surface tax payments to the State Treasury and the Provincial Tax authorities, respectively. Table 2 below summarizes the surface fee and surface tax payment schedule for which CAMI has established an 8 year surface fee payment schedule for precious stones and a 15 year schedule for all other mineral substances (including gold and base metals).
Table 2: Summary of Fees and Taxes due for PRs perCarré
| TYPE OF TAX | YEAR | ||||||||||||||||||||||||||||||
| 1 | 2 | 3 | 4 | 5 | 6 | 7 | 8 | 9 | 10 | 11 | 12 | 13 | 14 | 15 | |||||||||||||||||
| Surface Fee for Precious Stones (USD) | 3.07 | 31.69 | 52.10 | 149.22 | Title Expires | ||||||||||||||||||||||||||
| Surface Fee for All Other Mineral Substances (USD) | 3.07 | 31.69 | 52.10 | 149.22 | |||||||||||||||||||||||||||
| Surface Tax (USD) | 2.05 | 3.07 | 3.58 | 4.09 | |||||||||||||||||||||||||||
| TYPE OF TAX | YEAR | ||||||||||||||
| 1 | 2 | 3 | 4 | 5 | 6 | 7 | 8 | 9 | 10 | 11 | 12 | 13 | 14 | 15 | |
| Surface Fee for Precious Stones (USD) | 3.07 | 31.69 | 52.10 | 149.22 | Title Expires | ||||||||||
| Surface Fee for All Other Mineral Substances (USD) | 3.07 | 31.69 | 52.10 | 149.22 | |||||||||||
| Surface Tax (USD) | 2.05 | 3.07 | 3.58 | 4.09 | |||||||||||
To qualify for permit renewal the applicant must demonstrate that it has paid all surface fees and provincial taxes and has complied with environmental obligations. All surface fees and provincial taxes for the Ngayu project PRs have been paid and the PRs are currently in good standing.
| 23 |
Table 3 below summarizes the surface fee and provincial tax payments which were made for 2010 and 2011 in order to keep the MgayuNgayu project PRs in good standing. In 2012, amounts of US$126,728.86 and US$18,193.96 were paid for surface fees and provincial taxes respectively. In 2013, amounts of US$309,900 and US$27,018 were paid for surface fees and provincial taxes respectively.
Table 3: Summary of Fees and Taxes due for the Ngayu Project (2010-2011)
| SURFACE FEES (USD) | PROVINCIAL AL TAXES (USD) | |||||||||||||||||
| PR NO. | LICENCE NO. | 2010 | 2011 | 2010 | 2011 | |||||||||||||
| 1793 | NO° CAMI/CR/3169/2007 | 14,736 | 12,401 | 1,665 | 1,900 | |||||||||||||
| 1794 | NO° CAMI/CR/3170/2007 | 14,736 | 12,401 | 1,665 | 1,900 | |||||||||||||
| 1796 | NO° CAMI/CR/3172/2007 | 12,042 | 10,134 | 1,325 | 1,553 | |||||||||||||
| 1797 | NO° CAMI/CR3173/2007 | 11,725 | 9,867 | 1,325 | 1,512 | |||||||||||||
| 1798 | NO° CAMI/CR/3174/2007 | 13,785 | 11,601 | 1,557 | 1,778 | |||||||||||||
| 1800 | NO° CAMI/CR/3176/2007 | 12,518 | 10,534 | 1,414 | 1,614 | |||||||||||||
| 1801 | NO° CAMI/CR3177/2007 | 12,803 | 10,774 | 1,446 | 1,651 | |||||||||||||
| 1802 | NO° CAMI/CR/3178/2007 | 12,422 | 10,454 | 1,403 | 1,602 | |||||||||||||
| 1803 | NO° CAMI/CR3179/2007 | 13,595 | 11,441 | 1,536 | 1,753 | |||||||||||||
| 1804 | NO° CAMI/CR/3180/2007 | 9,222 | 7,760 | 1,042 | 1,189 | |||||||||||||
| 1805 | NO° CAMI/CR3181/2007 | 13,025 | 10,961 | 1,471 | 1,679 | |||||||||||||
| 1806 | NO° CAMI/CR/3182/2007 | 6,433 | 5,414 | 727 | 830 | |||||||||||||
| 1807 | NO° CAMI/CR3184/2007 | 8,842 | 7,440 | 999 | 1,140 | |||||||||||||
Should exploration lead to the discovery of an economic deposit the PR holder has the right to apply for aPermit d’Expoitation ("PE") or exploitation permit. The PE gives the title holder the right to carry out exploration, development, construction and exploitation works for a specific mineral. This includes the right to conduct mining operations, process and sell the mineral extracted. PEs are valid for 30 years, renewable for 15-year periods until the end of the mine’s life.
Table 3: Summary of Fees and Taxes due for the Ngayu Project (2010-2011)
| SURFACE FEES (USD) | PROVINCIAL AL TAXES (USD) | |||||||||||||||||||
| PR NO. | LICENCE NO. | 2010 | 2011 | 2010 | 2011 | |||||||||||||||
| 1793 | NO° CAMI/CR/3169/2007 | 14,736 | 12,401 | 1,665 | 1,900 | |||||||||||||||
| 1794 | NO° CAMI/CR/3170/2007 | 14,736 | 12,401 | 1,665 | 1,900 | |||||||||||||||
| 1796 | NO° CAMI/CR/3172/2007 | 12,042 | 10,134 | 1,325 | 1,553 | |||||||||||||||
| 1797 | NO° CAMI/CR3173/2007 | 11,725 | 9,867 | 1,325 | 1,512 | |||||||||||||||
| 1798 | NO° CAMI/CR/3174/2007 | 13,785 | 11,601 | 1,557 | 1,778 | |||||||||||||||
| 1800 | NO° CAMI/CR/3176/2007 | 12,518 | 10,534 | 1,414 | 1,614 | |||||||||||||||
| 1801 | NO° CAMI/CR3177/2007 | 12,803 | 10,774 | 1,446 | 1,651 | |||||||||||||||
| 1802 | NO° CAMI/CR/3178/2007 | 12,422 | 10,454 | 1,403 | 1,602 | |||||||||||||||
| 1803 | NO° CAMI/CR3179/2007 | 13,595 | 11,441 | 1,536 | 1,753 | |||||||||||||||
| 1804 | NO° CAMI/CR/3180/2007 | 9,222 | 7,760 | 1,042 | 1,189 | |||||||||||||||
| 1805 | NO° CAMI/CR3181/2007 | 13,025 | 10,961 | 1,471 | 1,679 | |||||||||||||||
| 1806 | NO° CAMI/CR/3182/2007 | 6,433 | 5,414 | 727 | 830 | |||||||||||||||
| 1807 | NO° CAMI/CR3184/2007 | 8,842 | 7,440 | 999 | 1,140 | |||||||||||||||
The DRC Mining Code levies a 4% royalty on production of precious stones and 2.5% on precious metals. Furthermore, the DRC Mining Code stipulates that a 5% free-carried interest be awarded to a Congolese State owned company at no charge. Surface fees for PEs are US$6 per hectare (approximately US$511 per carre), irrespective of commodity.
According to DRC law there is no export duty on marketable products, but a 30% corporate tax rate is applied on corporate profits. Apart from the Option Agreement between PermitCo and Loncor, Loncor has not entered into any other agreements which could have a material impact on the Ngayu project.
Environmental Liabilities
Loncor currently has no environmental liabilities or penalties pending for the Ngayu project. At this phase of exploration, very little damage has been done to the environment. In future exploration activities, access will be gained via existing roads and tracks. Trenches dug for sampling purposes will be rehabilitated fully once the sampling process has been completed. The exploration camp is built utilising an abandoned site or with as little clearance as possible. Should the project be abandoned for any reason, the locals will be able to use the camp for residential purposes. Loncor does not foresee any significant environmental expenditure at this stage of the project.
Accessibility, Climate, Local Resources, Infrastructure and Physiography
Altitude within the Ngayu project area ranges from 550 metres above mean sea level to 950 metres above mean sea level. The topography is made up of gently rolling hills and slightly incised valleys. The vegetation is typical dense forest. The region is drained by the Ituri River. The major tributaries within the Ituri River basin in this region include the Neopoko, Ngayu and Imbo rivers.
Access to the Ngayu project is by poorly maintained dirt tracks. These tracks converge towards a 760 kilometre well-maintained network of gravel roads that connect the towns of Kisangani, Nia-Nia and Butembo. The track between Bomili and Isiro is in extremely poor condition and only accessible by motor bike. The track between Nia-Nia, Wamba and Isiro is also in poor condition, but upgrade plans by the local authorities are in place. Kisangani has a tarred air strip and regularly receives flights from Kinshasa. There is a grass airstrip at Nia Nia and Isiro also has a gravel air strip and receives flights from Kisangani. There is a railway running through the town of Isiro, but this is no longer in service.
Towns located around the Ngayu project include Bomili and Yindi within the project area, Nia-Nia, Wamba, Isiro and Kisangani outside the project boundaries. The mode of transport on the poor quality dirt roads in and around the project area is either motorbike or foot but on the better quality gravel roads, trucks, buses and utility vehicles operate. The area can be accessed by means of a helicopter. Although no designated landing strips are available, there are flat-lying areas suitable for a helicopter landing.
Loncor has erected exploration camps in the Ngayu project in the vicinity of the Yindi and Makapela prospects. The Yindi camp is a self-sustaining camp, with its own power, water and road infrastructure. Potable water is sourced from a tributary of the Ngayu river and filtered on site. Supplies are driven in from various developed towns. The camp consists of an office, tents sheltered by corrugated iron, a dining hall, core shed, a clinic and a helicopter pad and yard. The Makapela camp consists of tented accommodation, offices and kitchen facilities. Power is supplied by a diesel generator at both the Yindi and Makapela camps.
The climate in the eastern DRC is tropical. It is hot and humid in the equatorial river basin and cooler and wetter in the eastern highlands. The wet season takes place from April to October and the dry season from December to February north of the equator. South of the equator the wet season is from November to March and the dry season from April to October. The climate facilitates exploration and mining activities all year round. Exploration is more challenging during the wet season, as roads become muddy and slippery, pits are rapidly filled by water and field mapping is more difficult.
Figure 2
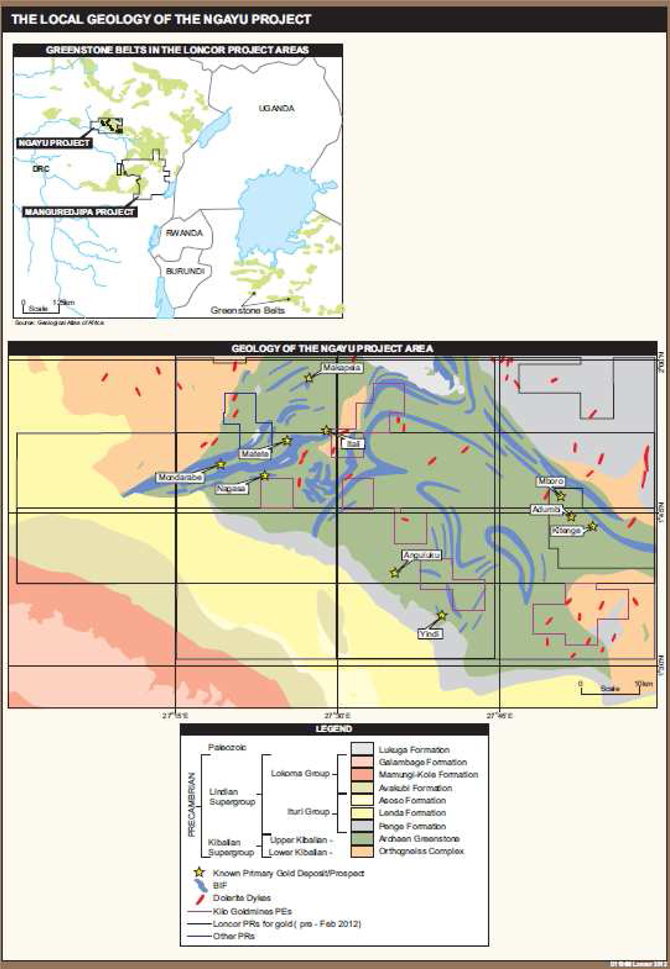
The land around the Ngayu project is mainly equatorial rain forest, with very tall trees and grass. A few small villages exist around the project area. Some wild animals exist in and around the area but most have been hunted out by the local population. Natural water sources are abundant. Groundwater potential has not been investigated. No electricity is available in the area except in the Yindi and Makapela camps. The closest hydro-electric power station is situated near Kisangani. The towns of Yindi, Bomili, Wamba and Nia-Nia are potential sources of a workforce.
History
The details of historical exploration for the Ngayu project are poorly recorded and not very clear. Gold was first prospected for in the Ngayu region by Belgian prospectors in 1909. The Societe Internationale Forestiere et Miniere du Congo (FORMINIERE) obtained exploration rights in the area and had evaluated the most important prospects by 1925. FORMINIERE then obtained exploitation rights for its subsidiary company, La Societe Miniere de la Tele. No further information about the two companies is available. The Ngayu project was owned by Société Minière de l’Aruwimi – Ituri and was exploited between 1929 and 1955. No further information on historical ownership of the project is available.
The database of the Central African Museum of Tervueren notes 13 occurrences of gold in the Ngayu greenstone belt, six of which are hosted within the Ngayu project area as shown in Figure 2.
area. The Tervuren database recorded historical gold production for some of the deposits occurring within the Ngayu greenstone belt. The largest hardrock gold mining operation in the Ngayu greenstone belt was at Adumbi which is not on Loncor’s PRs. It is evident that mostly alluvial deposits were exploited, perhaps due to the ease of mining and due to the fact that it was mostly mined on a small scale.
Geological Setting and Mineralization
Regional Geology
Most of the Orientale Province is underlain by an Archaean Basement, called the Upper-Congo Granitoid Complex or Bomu Craton, formerly known as the Upper-Zaïre Granitoid Massif. This basement is covered by Lower and Upper Kibalian rocks, NeoArchaean in age that consist of volcano-sedimentary formations with intercalations of quartzites and itabirites. The Kibalian rocks have been metamorphosed to greenschist facies and in the project area constitute the greenstone belt. The Neoproterozoic Lindian Supergroup occurs to the south of the area and consists of a sedimentary sequence with a thickness of more than 2,500 metres. The rock types in the sequence are mainly arkoses, sandstones, quartzites, shales and conglomerates.
The Upper Congo Granitoid Complex constitutes, together with associated metasediments and volcanics, the western part of the Nyanza-Kibali granite-greenstone terrain, which extends from northern Tanzania into Central African Republic. The greenstone terrain is hosted within the Kibalian series, which outcrops in numerous zones surrounded by granitoids, the most important (i.e. Moto, Kilo, Mambasa, Ngayu and Isiro) are more than 100 kilometres in strike length. They can be distinguished both by their shape and their lithological composition. Some of these zones constitute narrow belts (less than 10 kilometres wide, 30-60 kilometres in length) made up of units which are isoclinally folded along subvertical axial planes and sub-horizontal fold axes. Others are more or less isometric and show a synclinorial tectonic style. The former possesses a metavolcanic/metasediment volumetric ratio (v/s) of about 1 that of the latter exceeds three (up to 10).
An Upper Kibalian (v/s about 1) overlies a Lower Kibalian (v/s high) in the zones of Moto and Ngayu. Extrapolating this relationship to other zones it can be concluded that two generations of greenstones exist, the one forming narrow bands, rich in sedimentary rocks, belonging to the younger of the two generations. This distinction is also supported by geochronology. The Lower Kibalian of Ngayu and Moto is intruded by 2.8Ga old tonalities and the Upper Kibalian by 2.45Ga old granites. Most volcanics of the Lower Kibalian are akin to oceanic tholeiites while those from the upper division contain distinct andesitic members together with less typical tholeiites. Nowhere has the Lower Kibalian series been observed to be associated with high-grade gneissic rocks likely to represent their basement. The upper KiablianUpper Kibalian series, on the other hand, is typically associated both with the tonalite-Lower Kibalian association and with gneissic series (i.e. the West-Nile gneissic Complex) suggesting a different geodynamic setting for the two series.
The Ruwenzori tectonic episode (ca. 2Ga old) strongly affected the southern flank of the Upper Congo Granitoid Complex, which resulted in the formation of shear belts cutting through the Kibalian zones, and in the cataclasis of the associated granitoids.
In the region bodering the Western Rift, NNE-SSW trending shear belts, ca. 950Ma old, strongly reactivated parts of the West-Nile gneissic Complex. Parallel trending belts cutting through the Kibalian zone of Kilo are probably linked to the same event. The tectonic episodes of ca. 790Ma and 700Ma affected the northern flank of the Upper Congo Granitoid Complex and consequently the Kibalian zone of Moto. By reactivating the late-Archaean suture between the West-Nile Complex and the Congo Granitoid Complex, these episodes contributed to the present shape of the Moto zone.
Local Geology
The Ngayu project is located in a Precambrian greenstone belt enclosing folded and fractured volcano-sedimentary series and BIF as shown in Figure 2.series. In the project area, both the Upper and Lower Kibalian Groups are present. The Lower Kibalian is represented by the orthogneiss complex, which is a sequence of metamorphosed granites and gneiss intruded by diorites. The Upper Kibalian represents the greenstone belt made up of metasediments and metavolcanics of greenschist facies.
facies including prominent banded ironstone units (BIF) which form prominent ridges throughout the Ngayu greenstone belt.
The Kibalian Supergroup is overlain by the early Proterozoic Lindian Supergroup, which is composed of the Penge Formation (arkoses, conglomerates and quartzites), Lenda Formation (carbonaceous sediments), Asoso Formation (intercalated schists and quartzite), Avakubi Formation (sandstones, arkoses and conglomerates), Mamungi-Kole Formation (schists, with lenses of sandstone and dolomite) and Galamboge Formation (quartzite, sandstone and arkose). World class examples of gold deposits in similar geological settingsettings to the Ngayu project include Kilo-Moto and Geita in Tanzania. Fractured zones marked by quartz veins cross-cutting the Kibalian (including the BIF) throughout the prospect are first targets. Also of interest are fractured contact zones including cataclastic breccias between the Kibalian series and the Lindian cover deposits.
Property Geology
The Ngayu project covers most of the Ngayu greenstone belt and consists of three main Pre-cambrian lithological units, namely basement granite, metamorphic and sedimentary units. The granite-gneiss sequence forms the basement in the project area. The Upper-Congo granitoid complex, composed of undifferentiated Kibalian and pre-Kibalian rocks, occupies a zone in the eastern-central and in the northwestern part of the concession. Different rock types can be distinguished in the area, namely, granitoids with porphorytic texture, diorites, orthogneisses, and magmatic and anatectic rocks.
The metamorphic Kibalian rocks overlying the basement are composed of paragneissic Lower Kibalian, not identified in the project area, and of Upper Kibalian occupying the northeastern border of the concession with scattered outcrops. The greenschist facies consists of a pelitic-psammitic series with intercalations of quartzites, itabirites, para-amphibolites, metavolcanics and accessory carbonate rocks. Towards the base, quartzophyllades, micaschists and gneisses can be found. The granitic and metamorphic rocks may also be intruded by pegmatites, aplites, undifferentiated amphibolites, mafic rocks, diorites and quartz diorites as well as quartz veins and quartz veins with tourmaline.
The overlying sedimentary Lindian Supergroup is found to the southwestern part of the concession. It is composed of the Ituri Group (Penge, Lenda, Asoso Formations) and the lower part of the Lokoma Group (Avakubi Formation). The sedimentary units in the project area comprise mainly clastic sediments. Different faults cross-cut the three lithological units. Several folds have been observed in the field but no detailed structural study of this region is available.
A detailed geological map has been compiled for the Makapela prospect. The geology consists of BIF and basalt comprising the volcano-sedimentary package which has been intruded into by co-magmatic dolerite and quartz feldspar porphyry with a quartz-dioritic to tonalitic composition. Quartz veining occurs in all lithologies. The gold mineralization is hosted within the BIF and quartz vein lithologies. Three distinct orebodies have been identified, namely Reef 1, Reef 2 and Reef 3.
Location of Mineralised Zones
The locations of previously identified gold occurrences within the Ngayu project are shown in Figure 2. Some of the gold deposits that have been identified within the Ngayu project were observed during the site visit and included Makapela, Marekessa, Mambati, Imva, Bayberu, Itali and Yindi.2 below. The majority of these deposits are located close to the contact of BIF with the greenstone belts.(Banded Ironstone Formation). Historically, only two deposits were exploited on a large-scale by previous owners, namely Yindi and Adumbi. Adumbi falls out of the project area.area in the east. Remnant mining infrastructure from previous operations at Yindi includeincludes the old laboratory, plant and camp but are derelict. Makapela is currentlya relatively new artisanal site which was developed by artisanal miners within the priority mineralised target for Loncor. It was discovered by the Loncor team through a large artisanal pit in the northern sectionlast ten years and has been one of the property.foci of the Company’s exploration activities.
Mineralization
The mineralization withinGold is the only commodity to have been extracted commercially in the Ngayu project has not been entirely definedbelt. A few years ago Rio Tinto assessed the BIF as yet,a potential source of iron ore, but previous experts have contributed substantially toalthough haematite-rich zones of good grade were reportedly drilled, tonnage was below the understandingeconomic requirement. Diamonds are recovered by artisanal miners from the Ngayu River; the source of the ore types and mineralization styles withinstones is unknown, but is probably outside the project and the greater Ngayu greenstone belt. Thesearea under discussion. No other mineral occurrences of potential significance are describedknown.
Gold was discovered in the sub-sections that follow. The mineralization styles for every deposit hosted withinNgayu belt by Belgian prospectors in the Ngayu greenstone belt are listed1920s, and commercial production took place from both primary and secondary sources until the mid-1950s. A summary of the historical production is given in Table 4 below. It is apparent from this table thatbelow, although production records are incomplete and sketchy and the dominantfigures quoted represent only an approximation.
Table 4: Historical Gold Production for the Ngayu Belt (1925 – 1955)
| Deposit | Primary Au (oz) | Secondary Au (oz) | Total Au (oz) | |||||||||
| Adumbi Area | 208,000 | 83,000 | 291,000 | |||||||||
| Imva Fold Area | N/A | 200,700 | 200,700 | |||||||||
| Yindi | 45,200 | 21,000 | 66,200 | |||||||||
| Northern Ngayu Belt | N/A | 60,800 | 60,800 | |||||||||
| Anguluku | 5,700 | N/A | 5,700 | |||||||||
| Totals | 258,900 | 365,500 | 624,400 | |||||||||
The most prolific area for alluvial mining was the Imva Fold area, where extensive artisanal mining continues today, and where several areas of primary gold mineralization types(Matete, Nagasa, Anguluku and Itali) are currently under investigation by Loncor.
Several styles of gold mineralization have been identified in the Ngayu projectbelt and are alluvial, eluvial and quartz veins, and that all the deposits that have been mined economicallysummarised below:
Shear-zone hosted gold:
| Ø | Mineralization of shears within BIF, or on the BIF contacts, leading to quartz veining and sulphidation of the BIF and immediate wall-rock, e.g. Adumbi, Makapela Reef 2. |
| Ø | Mineralization of shears within basalts and schists (and to a much lesser extent intermediate intrusives) resulting in discrete auriferous quartz veins with limited wall-rock mineralization, e.g. Makapela Reef 1, and the Yindi vein field. |
Disseminated mineralization in the past contain quartz veins.BIF:
| Ø | Sulphidation of BIF by fluids utilizing nearby cross-cutting and parallel structures, such as thrusts and shears e.g. Yindi BIF-hosted mineralization and Nagasa Anomaly 1. This style of mineralization has the potential to form deposits of very large size, e.g. Geita in Tanzania. |
Table 4: DepositsSheeted veins:
| Ø | Shear zones resulting in auriferous sheeted quartz veins and veinlets developing mainly parallel to the foliation and forming packages over widths of up to 40 metres, often with disseminated mineralization between the veins, e.g. Itali, Mondarabe. |
Elluvial/Colluvial deposits:
| Ø | Artisanal mining of weathered gold mineralization preserved as elluvial or colluvial material, is widespread throughout the belt, particularly in the Imva Fold area and Anguluku. |
Alluvial deposits:
| Ø | Palaeoalluvial deposits are locally exploited by artisanals by digging pits to the basal gravel layer of old river channels, e.g. Nagasa, Mondarabe, Matete. |
| Ø | Exploitation of modern alluvium is widespread throughout the Ngayu belt, and is particularly common in the Imva Fold area. |
Prospect-Scale Mineralization Styles inControls
BIF (Banded Ironstone Formation)
Within the Ngayu Greenstone Beltbelt there is a strong association between gold mineralization and the presence of BIF, the BIF either constituting the host rock (e.g. Adumbi, Yindi, Makapela, Nagasa) or forming a significant part of the local stratigraphy (e.g. Mondarabe, Itali, Anguluku). BIF forms both physical and chemical traps for mineralizing hydrothermal fluids as follows:
| · |
| · |
| · |
| · | ||
Source: Central African Tervueren Museum Database.
Note: Highlighted deposits occur within the Ngayu project
Eluvial Deposits
In the Ngayu greenstone belt, most of the eluvial production has been obtained from rocks softened by weathering by the method of hydraulic mining. Altered rocks, enriched through supergene processes have been mined profitably at Subani (north of Moto greenstone belt) notwithstanding their low grade.
Vein Deposits
Vein deposits have been mined from two sectors within the Ngayu belt, namely Yindi-Angukuluku and Kitenge-Adumbi. At Yindi, 1,400kg of gold was reportedly recovered from a series of veins in which more than 1,400 veins have been recorded, but only 20 contained economic mineralization. Their thickness was less than 1 metre and their gold content varied between 1 and 344g/t with an average of 3.6g/t. Only 70% of the gold was recoverable, sulphides being generally present.
The vein field of Yindi is within a sequence of metasediments, metatuffs and BIF. Veins and veinlets in Yindi appear to be parallel to bedding. No outcrop of granitoid rock is known in this sector. The length of the veins may be extensive (up to 1,300 metres in places) and their thickness varies between 0 and 200cm. This type of mineralization is also found in Makapela, where mineralization is confined within quartz veins hosted in basalt and BIF. Country rocks are sporadically mineralised from 5cm to 20cm from the vein with a grade similar to that of the vein. The entire vein field measured 400 metres x 1,200 metres. The overall structure of the field and its relation with the country rock shows best at Angukuluku where a small but similar vein field has given 170kg of gold in the past. The bedding, marked by units of BIF, is cut at the fold-hinges indicating that the veins are emplaced parallel to the regional foliation.
The Kitenge-Adumbi group of mines are situated near the northern edge of the Kibalian zone, not far from its contact with the granitoid envelope. This group belongs to a NW-SE lineament running close, and parallel to, a tightly folded belt of epimetamorphic volcanics and sediments. A swarm of parallel quartz veins gives rise to the Kitenge and Adumbi inselbergs. Some 20 veins have been worked in this area, with two of them responsible for most of the 5t gold produced by the two mines. The veins vary in thickness and are orientated in an en echelon manner, slightly oblique to the elongation of the hills. Gold content was apparently constant around 10g/t.
Makapela consists of three mineralised zones which have been named Reef 1, Reef 2 and Reef 3. Reef 1 is a steeply dipping (regional average 86°), massive quartz veins in basalt, which cross-cut the stratigraphy. Reefs 2 and 3 are associated with highly sheared and altered BIF. Gold is present at micro and macro scale, the visible gold reportedly making up the majority of gold mined by artisanal miners.
Disseminated and Stratabound Deposits
Disseminated deposits in the project area, excluding the Ngayu area, are hosted within sericite-chlorite-ankerite schists with quartz and albite, and with hardly recognizable volcano-intrusive features. Among the most mafic types, the series shows some volcanic agglomerates and pillowed lavas, while more acid types are represented by andesites and dacites. Sedimentary rock types are represented by quartzites, quartz-carbonate (Fe, Mg)-rocks and itabirites. The lithostratigraphic marker is a basaltic rock metamorphosed to a calcified chloritoschist, commonly referred to as Gorumbwa. No granitoids have been recorded in the vicinity of the mineralised area. A common characteristic of disseminated deposits is the lack of quartz veins as exclusive ore bodies (i.e. when present, they are not the only orebodies).
The stratabound character of the mineralization was apparent at Yindi, where some 200kg of gold were extracted from ferruginous quartzites, at a grade of 2g/t. Disseminated sulphide associated gold mineralization occurs within the BIF and adjacent metatuffs and metapelites. Similar styles of mineralization are expected at Anguluku and the Imva Fold. Greenschists containing about 2g/t have been mined at Adumbi and Angukuluku on the flank of the hills, but the enrichment appears to have been supergene. Reefs 2 and 3 of Makapela are associated with BIF but the gold occurs in a pyritic quartz-sulphide assemblage which has completely replaced the highly sheared BIF. The BIF occurs with quartz veins and quartz-feldspar porphyries.
Deposit Types
It is well known amongst prospectors in the northeastern DRC that gold is often associated with BIF, and this is supported by occurrences in other parts of the world, for example the multi-million ounce gold deposit at Geita in Tanzania. Four different types of gold deposits are encountered in the Ngayu greenstone belt, namely placer, eluvial, vein and disseminated deposits. Placer deposits result from weathering of greenstone belts and transportation of gold mineralization away from the source by gravity or streams. Placer deposits are often located within short distances of their primary deposit.
The exceptional thickness of the alteration cover resulting from the equatorial climatic conditions has resulted in the formation of eluvial gold deposits in the area, where greenstone belts have weathered to liberate gold mineralization which later concentrated in the thick eluvial cover. The majority of the primary gold produced in northeastern DRC is hosted in quartz veins. In the Kilo zone, deposits of this type are located along four belts, three of which are subparallel with an ENE-WSW strike, the fourth trends NS. The veins that trend ENE-WSW are seldom more than 2 metres thick, they are subvertical and nearly concordant with the foliation of the country rocks.
In regions where the lithology has undergone more than one transpression event, quartz accumulated in the fold hinges to form saddle reefs. Disseminated or stratabound deposits usually occur either within or close to BIF units. The common characteristic of these deposits is the lack of quartz veins as exclusive ore bodies (i.e. when present), they are not the only gold-carrier.
Exploration (2009-2013)
Exploration by Loncor commenced in late 2009 and initially included desktop research, primarily utilising data from the Royal Museum for Central Africa in Terveuren, Belgium and preliminary interpretation of airborne geophysical data, acquired by Rio Tinto in 2007, and a three day reconnaissance site visit in December 2009.2007. A base camp was established on the property at Yindi in March 2010, and2010. At the beginning of Loncor’s Ngayu project, it was decided to divide the exploration has continued uninterrupted since then. The work to date has involvedinto two phases run in parallel:concurrent programs:
| · |
| · |
Desktop ResearchRegional Programs
The Tervuren database provided information regarding areas of historical mining and prospecting, past-production estimates and limited data on local geology and mineralization styles. Table 5 below summarises certain of the information acquired on the main historical prospects.Aeromagnetic Surveys
Table 5: Deposit Information from the Terveuren Database
| OCCURRENCE NAME | ALLUVIAL GOLD PRODUCTION (kg) | PRIMARY GOLD PRODUCTION (kg) | MINERALIZATION STYLE | |||||||
| Marekessa | 985 | NA | Alluvial, eluvial and quartz veins. | |||||||
| Mambati | NA | NA | Alluvial | |||||||
| Imva | 1,304 | NA | Alluvial, eluvial and quartz veins. | |||||||
| Mokepa | 999 | NA | Alluvial | |||||||
| Kitenge | 59 | 2,249 | Alluvial, eluvial and 57 quartz veins (schlieren). | |||||||
| Anguluku | NA | 177 | Alluvial, eluvial and quartz veins. | |||||||
| Babeyru | 2,953 | NA | Alluvial, eluvial and quartz veins. Association with galena and sphalerite. | |||||||
| Yindi | 652 | 1,407 | Alluvial, eluvial and quartz veins. Association with galena and sphalerite. | |||||||
Source: Central African Tervueren Museum Database.
Geophysical Interpretation
An airborneRio Tinto commissioned heliborne magnetic and radiometric surveys over the Ngayu belt in July and August 2008, as part of its iron ore exploration programme. Loncor was provided with this data in 2009, under the then terms of the agreement between the two companies. The survey was flown over a large portion of the Ngayu project area by New Resolution Geophysics, in Julyon 200 metre-spaced lines orientated north-south. The average sensor terrain clearance was 32 metres, and August 2008. The survey parameters are shown in Table 6 below.tie lines were flown every 2,000 metres. All the greenstone terrain covered by Loncor’s properties was included, with only the areas to the northeast and southwest, which are underlain by granitoids and Lindian cover respectively, excluded from the survey.
Table 6: Airborne Magnetic and Radiometric Survey Parameters
Digital Terrain Model (DTM)
The DTM shows a gently rolling relief over most of the property with higher ground tending to form strike-parallel ridges coincident with the more resistant BIF units, particularly to the northeast of the area. The relatively low lying terrain in the southwest is underlain by the Lindian lithologies.
Radiometric Survey and Aeromagnetic Survey
Radiometric surveys measure the spatial distribution of three radioactive elements, namely, Potassium (K), Thorium (Th) and Uranium (U), in the top 30-45 kilometres of the earth’s crust. Measuring the abundance of these elements gives an indication of the content of these elements in the bedrock. The typical contents of these elements in various rock types are known, thereby providing a tool for postulating the type of source rock. The radiometricaeromagnetic data have proved highly effective in mapping the major geological units in the area, and have been incorporated into the integrated geophysical interpretation described in more detail below. Geological units which are clearly defined include mafic volcanics, granitoid basement and intrusive, and Lindian sediments and recent alluvium.
All airborne geophysical data have been analysed in detail by specialist geophysicists employedwere interpreted by Newmont in Perth, Australia. The objectives of2011, under the interpretation were to prepare acompanies’ technology consultation services agreement, and the resulting lithostructural map showing the distribution and structural relationships of the different lithologiesis shown in the project area, and to identify and prioritise target areas for gold mineralization.Figure 2 below. Four areas have beenwere prioritised as being lithologically and structurally favourable for gold mineralization, and are as follows:
In order to interpret the most prospective areas of the concession inDuring 2012, Loncor undertook more detail, four areas totalling 187 square kilometres were resurveyed by New Resolution Geophysics on a line spacing of 50 metres in October 2012. This higher resolution magneticdetailed aeromagnetic and radiometric data is currently being assessed by Newmont’s geophysicists.surveys over priority target areas (ie Imva Fold area).
Figure 2: Aeromagnetic Interpretation for Ngayu and Location of Geophysical Target Areas

BLEG Sampling
BLEG (Bulk Leach Extractable Gold) sampling is a stream sediment sampling technique employed by Newmont worldwide in theirits regional gold exploration programmes. It provides a relatively fast and reliable way of assessing large tracts of land, and has been particularly effective in defining targets within the Ngayu area. The sampling methodology and analytical techniques are proprietary to Newmont, and as such, cannot be detailed herein. Following successful orientation surveys in the Yindi and Makapela areas in 2010, in which 32 samples were collected, three phases of BLEG sampling were carried out as follows:
| · | phase 1, carried out in March 2011, in which 418 samples were taken over the whole concession area, at an average sampling density of one sample per 10 km2; |
| · | phase 2 was completed in September 2011, with the objective of more closely defining the anomalies outlined in Phase 1. A total of 192 samples were collected representing an average sampling density of one sample per 4 km2; and |
| · | phase 3 was implemented in November 2011 in order to further delineate the sources of gold anomalism in selected target areas. A total of 129 samples were collected. | |
The results for phases 1 and 2 are shown in Figure 3 below. Six high priority (H1-H6), seven medium priority (M1-M7) and four lower priority targets (L1-L4) have been defined based on the BLEG data and the geophysical interpretation. The rationale for selecting these targets is as follows:
| · | targets H1, H2, H3 and M1 in Imva Fold area: BIF occurs on the limbs of an WSW-ENE trending fold over a strike length of 25 kilometres. More complex zones of folding locally occur on the limbs of this regional structure, which together with the presence of strike-parallel faulting, form structurally favourable sites for gold mineralization. Clusters of strong BLEG anomalies of up to 1,136 ppb Au are present (compared with background values of <3ppb Au for the general area); |
| · | targets H4 and M2 (Makapela area): |
| · | targets H5, M3 and M4 (Bole Bole Area): |
| · | target H6 (Anguluku Area): |
| · | targets M5, M6 and L1 (Adumbi Trend): |
| · | target L3 includes the Yindi mineralization. However, the southeastern anomalous catchment has not yet been investigated, and will be followed up probably by extending the soil grid; and |
| · | targets L2 and L4 are relatively small and isolated BLEG anomalies. They will be confirmed by additional BLEG sampling before decisions on follow-up work are made. |
Field duplicates were taken at a frequency of one in twenty samples and the results rigorously assessed by Newmont’s senior geochemists in Perth.Perth, Australia. It was concluded that the quality of the sampling was excellent, and that the results of the survey are reliable. Analytical duplicates and blanks were also included as part of Newmont’s internal quality control procedures. Groundwork aimed at defining drilling sites within the above target areas commenced in January 2012. This entailed soil sampling (initially on lines 320 metres apart, with in-fill to 160 metres and 80 metres where warranted), geological mapping and rock chip sampling, regolith mapping (utilizing remote sensing techniques and Newmont’s in-house expertise), and trenching and/or mechanical augering of soil anomalies. In addition, the programmeprogram provides for geophysical surveys to more closely define the location of potentially mineralized zones. There is good correlation between the target areas derived from the aeromagnetic interpretation and the BLEG surveys.
Figure 3

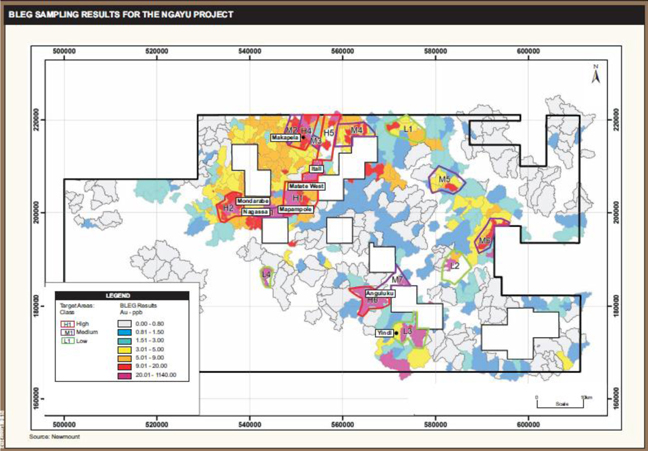
Soil SamplingProspect Exploration
Soil sampling gridsGrids have been established at the Yindi, Makapela, Itali, Matete, Nagasa, Mondarabe, Anguluku and ItaliAdumbi West prospects with airborne magnetic and regionalradiometric surveys, geological mapping, stream sediment sampling, soil and rock sampling, traverses have been carried out over the Imva Fold Area. A total of 23,959 soil samples have been collected at Ngayu to date as shown in Table 7 below.trenching, augering, ground geophysical surveys (Induced Polarisation) and core drilling being undertaken.
Table 7: Exploration Summary5 below summarises the exploration statistics for the Ngayu work program for the period 2010 – 2013.
Prospects within the Ngayu Project (as at December 2012)
| EXPLORATION TYPE | NO. OF SAMPLES | |||||||||||||||||||||||||||||||||||||||
| YEAR | GRIDDING (km) | TRENCHING (m) | ADIT MAPPING (m) | OTHER CHANNELS (m) | STREAM | SOIL | ROCK | ADIT CHANNEL | TRENCH CHANNEL | OTHER CHANNEL | ||||||||||||||||||||||||||||||
| 2010 | 219 | 962 | 324 | 680 | 32 | 5,562 | 363 | 345 | 1,024 | 738 | ||||||||||||||||||||||||||||||
| 2011 | 149 | 19 | 15 | 82 | 739 | 4,365 | 284 | 22 | 16 | 144 | ||||||||||||||||||||||||||||||
| 2012 | 527 | 1842 | 88 | 1126 | 0 | 14032 | 1003 | 88 | 1841 | 1396 | ||||||||||||||||||||||||||||||
| TOTAL | 895 | 2823 | 427 | 1888 | 771 | 23959 | 1650 | 455 | 2881 | 2278 | ||||||||||||||||||||||||||||||
The Yindi Grid
The Yindi grid covers an area of 12.6 km2 and was initially sampled at a line spacing of 160 metres, and samples taken at 40 metre intervals along the lines. Infill lines at 80 metre spacing were subsequently sampled in anomalous areas. A total of 2,362 samples were collected and analysed for gold. The results show a well-defined, strike-parallel anomaly defined over an area of 3 x 0.75 kilometres using the 50ppb Au contour, and 1.2 x 0.3 kilometres using the 200ppb contour. Together with the results of rock chip sampling and channel sampling, the soil data were used to plan auger drilling and diamond drilling programmes.
The Makapela Grid
The Makapela grid covers an area of 21.3 km2 and was initially sampled on 160 x 40 metre spacing, with infill sampling on 80 metre lines in anomalous areas. A total of 4,103 samples were analysed for gold. Values above 200ppb Au occur over a strike of 3 kilometres from the area of the Main pit to north of Sele Sele. A separate anomaly occurs in the Bamako area, with a strike of approximately 2 kilometres. Together with rock chip and channel sampling, the soil anomaly has been used to plan auger and diamond drilling.
The Itali Grid
The Itali grid is 2 x 1 kilometres in extent, and was sampled on 160 x 40 metre spacing. A total of 396 samples were analysed for gold. The +200ppb Au anomaly has a strike of about 1 kilometre, and is coincident with an east-west trending zone of colonial and artisanal workings.
The Imva Fold Area
During 2012, extensive soil sampling was carried out over 115 square kilometres, covering all BLEG targets in the Imva Fold Area. Sampling was initially carried out on lines 320 metres apart, with infill on 160 metre lines in anomalous areas. A total of 17,098 samples were collected. Soil anomalies were detected in all BLEG targets, which are being further assessed by detailed mapping, rock chip sampling, auger drilling and trenching, with the objective of defining diamond drilling targets for 2013.
Mapping
Mapping and systematic field reconnaissance for Ngayu commenced in March 2010 and is ongoing. Due to the forest cover and deep tropical weathering, natural exposures are generally poor and infrequent. Most of the mapping data has been obtained from old workings and artisanal mining sites. Loncor uses standard logging forms to record lithological information (rock name, colour, fabric, grain size, oxidation and hydrothermal alteration) and structural information (strike and dips of planar structures and direction and plunge of linear features). Mapping is systematically carried out along all soil sampling lines at a scale of 1:5,000, and this information is combined with subsequent auger drilling and diamond drilling data to provide prospect-scale geological maps for Yindi, Makapela and Itali.
Rock Chip Sampling
Rock chip samples are routinely taken for gold analysis during geological mapping, with a focus on samples showing evidence of hydrothermal alteration. The assay data are used in conjunction with soil sampling results when prioritising areas for follow-up trenching, augering and diamond drilling.
Channel Sampling
Channel sampling has been carried out in old adits (427 samples), trenches (2,823 samples) and colonial and artisanal open-pit workings (1,396 samples). Channel sampling enables the widths and average grades of mineralization to be calculated, and provides a more reliable assessment of the mineralization potential than rock chip sampling. Channel sampling was of particular importance at Makapela by confirming the potential for high grade quartz vein mineralization and guiding the preliminary diamond drilling programme.
Drilling
Diamond Drilling
Yindi Prospect
Yindi is the site of an old Belgian mining operation which ceased production before independence, and which produced approximately 45,000 ounces and 21,000 ounces of gold from primary and secondary sources respectively. The Belgians primarily exploited discrete high grade quartz veins by means of adits and narrow open-pits, and limited open-pitting was also carried out on mineralized BIF. Since operations ceased in the mid-1950s, the veins have been targeted by artisanal miners.
Table 5: Exploration Statistics for the Ngayu Work Program (2010-2013)
| Activity | Samples | |||||||||||||||||||||||||||||||||||||||||||||||||||||||||||||||||||||||||||
| Other | Diamond | |||||||||||||||||||||||||||||||||||||||||||||||||||||||||||||||||||||||||||
| Gridding | IP | Trenching | AditMapping | Channel | Auger Drilling | Drilling | Stream | Adit | Trench | Other | Thin | |||||||||||||||||||||||||||||||||||||||||||||||||||||||||||||||||
| Prospects | (km) | (km) | (m) | (m) | (m) | Holes | (m) | Holes | (m) | BLEG | Sediment | Soils | Rock | Channel | Channel | Channel | Auger | DD | Section | |||||||||||||||||||||||||||||||||||||||||||||||||||||||||
| Yindi | 94.16 | 23 | 486.49 | 208.30 | 388.70 | 133 | 566.90 | 18 | 3302.24 | 16 | 0 | 2362 | 189 | 227 | 525 | 424 | 558 | 3526 | 11 | |||||||||||||||||||||||||||||||||||||||||||||||||||||||||
| Makapela | 189.68 | 0 | 0 | 0 | 242.46 | 797 | 4537.12 | 84 | 24058 | 12 | 659 | 4826 | 197 | 0 | 0 | 287 | 3381 | 6201 | 58 | |||||||||||||||||||||||||||||||||||||||||||||||||||||||||
| Itali | 48.20 | 0 | 691.10 | 29.00 | 170.45 | 170 | 938.55 | 5 | 1195.43 | 0 | 0 | 1234 | 169 | 31 | 751 | 196 | 649 | 1450 | 8 | |||||||||||||||||||||||||||||||||||||||||||||||||||||||||
| Anguluku | 101.28 | 47.5 | 439.85 | 173.00 | 165.93 | 126 | 381.35 | 0 | 0 | 0 | 560 | 2549 | 274 | 175 | 454 | 227 | 481 | 0 | 1 | |||||||||||||||||||||||||||||||||||||||||||||||||||||||||
| Adumbi | 68.80 | 0 | 13.00 | 0 | 141.90 | 0 | 0 | 0 | 0 | 0 | 0 | 1787 | 138 | 0 | 20 | 197 | 0 | 0 | 0 | |||||||||||||||||||||||||||||||||||||||||||||||||||||||||
| Nagassa | 147.68 | 125.9 | 432.85 | 26.70 | 253.55 | 750 | 3489.39 | 9 | 2620.65 | 0 | 3815 | 373 | 34 | 481 | 309 | 3277 | 1880 | 11 | ||||||||||||||||||||||||||||||||||||||||||||||||||||||||||
| Mondarabe | 157.36 | 0 | 375.21 | 0 | 489.60 | 135 | 542.70 | 7 | 1220.50 | 0 | 0 | 4047 | 362 | 0 | 385 | 580 | 561 | 1533 | 7 | |||||||||||||||||||||||||||||||||||||||||||||||||||||||||
| Matete | 148.84 | 89 | 989.20 | 0 | 239.39 | 256 | 1079.25 | 0 | 0 | 0 | 0 | 3856 | 401 | 0 | 1062 | 330 | 1110 | 0 | 8 | |||||||||||||||||||||||||||||||||||||||||||||||||||||||||
| Andagbowa | 3.04 | 0 | 0 | 0 | 21.90 | 0 | 0 | 0 | 0 | 0 | 91 | 89 | 34 | 0 | 0 | 30 | 0 | 0 | 0 | |||||||||||||||||||||||||||||||||||||||||||||||||||||||||
| Bleg | 0 | 0 | 0 | 0 | 0 | 0 | 0 | 0 | 0 | 711 | 0 | 0 | 71 | 0 | 0 | 0 | 0 | 0 | 0 | |||||||||||||||||||||||||||||||||||||||||||||||||||||||||
| PROJECT TOTAL | 959 | 285.4 | 3428 | 437 | 2114 | 2367 | 11535 | 123 | 32397 | * | 739 | 1310 | 24565 | 2208 | 467 | 3678 | 2580 | 10017 | 14590 | 104 | ||||||||||||||||||||||||||||||||||||||||||||||||||||||||
Exploration at Yindi commenced in March 2010 with the establishment of a 2 x 6 kilometre soil sampling grid, coincident with a well-defined magnetic anomaly, and covering the area of old mining activity. Soil sampling lines were originally at a spacing of 160 metres, with infill to 80 metres in anomalous areas. All soil sampling lines were geologically mapped.
Channel sampling of accessible old adits and open-pits was undertaken, and several old trenches were re-excavated and channel sampled. Mechanical auger drilling was carried out to test for saprolite mineralization below soil anomalies.
Diamond drilling commenced at Yindi in September 2010 with the objectiveand 18 holes (3,274 metres) were completed before drilling was stopped in March 2011. The drilling focussed on an area of following upBIF-hosted gold mineralization which was identified from soil and rock chip anomalies and testing the down-dip continuity of channel sampling, intersections in old open pits and near-surface adits. A total of 18 drill holes with a length of 3,274 metres were completed over a strike of 1.1 kilometres, downwhich had been mined to a limited extent during colonial times. Holes ranged from 134 metres to 290 metres in depth (i.e. a maximum vertical depth of 160262 metres vertically below surface).
IP surveys were carried out in March 2013, and comprised a 1 x 1 kilometre gradient array survey, followed by two lines of pole-dipole. The objectives of this work were: (a) to assess the IP response of mineralized BIF as shownan orientation for surveys elsewhere in Figure 4. the concession, (b) to assist in determining the geometry and plunge of the BIF-hosted mineralization at Yindi, and (c) to detect possible additional mineralized zones.
The drilled rocks mainly comprise fine grained schists, which petrographic studies show were originally pellitic sediments and tuffs, now metamorphosed to lower greenschist facies. Several units of BIF up to about 15 metres in thickness are interlayered with the schists. The sequence has a consistent NW-SE strike and southwesterly dip of about 75°. Gold mineralization occurs both within the BIF and within the schist near the BIF contacts, and is associated with:
| · | pyritisation of magnetite bands in the BIF; |
| · | massive pyritisation of the BIF; |
| · | disseminated pyrite in the schist; and |
| · | quartz veining within both lithologies. |
All significant mineralized intersections are shown in Figure 4.4 below. The better grades and widths occur in the central part, in drill holes NYDD001, NYDD003, NYDD004, NYDD005, NYDD007, NYDD008, NYDD012 and NYDD014. In these holes the mineralization associated with the main BIF horizon has an average width of 12.90 metres (10.96 metres true width) at an average grade of 2.20 g/t.t Au.
Additional drilling is warranted at Yindi in order to determine a mineral resource.
Makapela Prospect
Exploration atBelgian workers carried out alluvial mining in streams draining from the Makapela is focusing on a quartz vein system within a sequence of basalts, thin units of banded iron formation, and dolerite sills. Porphyry dykes and sills of quartz-diorite to tonalitic compositionarea during the colonial era, but no production figures are also present. The veins, or reefs, are being exploitedavailable. Primary mineralization was discovered by artisanal miners in 2006, and within four years mining was taking place in three large pits (Main, North and Sele Sele) whichto a maximum depth of about 20 metres. The pits are each between 170 metres and 290190 metres in length and are located along a strike of 2.2 kilometres. Exploration by Loncor at Makapela commenced in May 2010, with a 7 x 2 kilometre soil sampling grid covering the area of artisanal activity, and extending southwestwards over stream sediment anomalies depicted on old maps from the colonial era. Lines were at 160 metre intervals, with infill to 80 metres where warranted. The results indicated the possible continuation of mineralization between the Main, North and Sele Sele pits, over a strike of 3 kilometres. A separate soil geochemical results indicate thatanomaly was identified over a strike of 2 kilometres in the Bamako area, to the southeast of the Main pit. Channel sampling was carried out in the artisanal workings, and based on the encouraging grades and widths returned, a preliminary drilling program of five holes was planned to test the mineralization continues between these three artisanal workings underat depth below the Main, North and Makapela pits. This program was expanded to outline the strike extent of the mineralized zones, following which a thick soil cover. Loncor commenced diamonddecision was made to drill sufficient intersections to provide an inferred resource. The resource drilling aimed to intersect the mineralization on sections 80 metres apart along strike, at Makapeladepths of 80 metres, 160 metres and 240 metres; intersections at 320 metres and 400 metres depths were drilled on sections 160 metres apart. A total of 56 holes (18,091 metres) were completed in November 2010the vicinity of the Main and by July 2012 had completed 71 drillNorth pits, and 15 holes on the main mineralised horizons with a maximum of four rigs. The diamond drilling database is included in Appendix 6 to the Ngayu Technical Report, and comprises the first 58 drill holes, which were used for resource calculations. During this programme, Reef 1, Reef 2 and the Sele Sele reef(3,594 metres) were drilled at an 80 metre x 80 metre spacingSele Sele. In addition to the above resource drilling program, a depthtotal of 240 metres,12 holes (1,560 metres) were drilled to locate potential extensions to the known reefs and new mineralized structures indicated by soil, rock chip and auger sampling.
The Makapela area is underlain by a series of basalts which strike NNE-WSW and dip to the WNW at an 160 metre x 160 metre spacing from 240average of 85°. A mineralogically similar rock with a coarser texture is also common, and has been given the field name “dolerite”. However, it has gradational contacts with the fine-grained basalt, and is interpreted to represent the central parts of thick flows, rather than intrusive sills. Several units of BIF are interlayered with the basalts, and range up to 13 metres in thickness, although the width is generally less than 6 meters. Quartz porphyry and quartz-feldspar porphyry dykes and sills are also present, and petrographic examination shows that they are quartz-dioritic to tonalitic in composition. In the vicinity of the mineralized zones, these intrusives are generally no more than a few metres in width, and are probably apophyses off a larger porphyry body located about 200 metres to 400 metres depth.the NW.
Figure 4 Significant Gold Drill Intersections at Yindi Prospect
Main and North Pit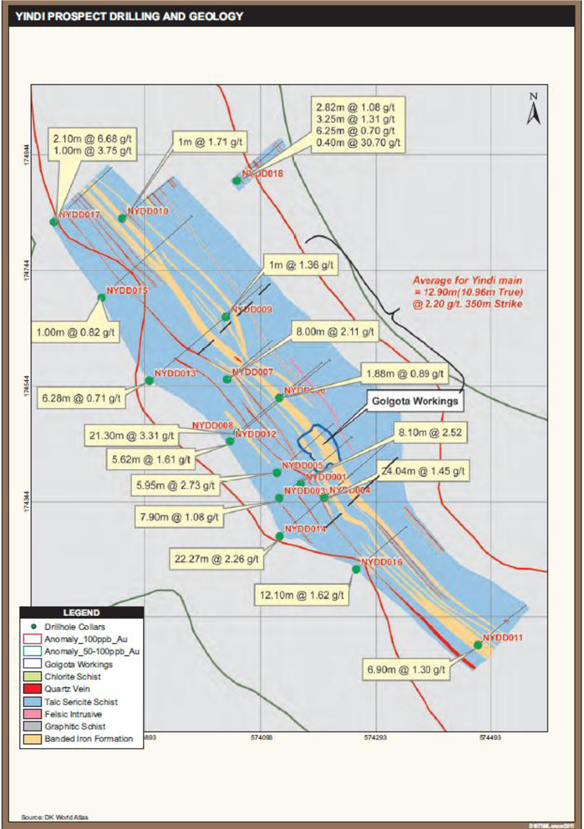
Three styles of mineralization are present at Makapela:
Two main(a) Quartz veins have been identifiedemplaced into shear zones within the basalt sequence, which are either parallel to strike or cross-cut the lithological strike at acute angles. The best developed and economically significant vein (Reef 1) is exploited in this area.the Main pit, and consists of white quartz with irregularly distributed pyrite as disseminations and blebs averaging about 3%. Visible gold is quite common, occurring in 28% of the intersections as isolated specks and small aggregates up to 2 mm across. Reef 1 has been intersected on the Main pit trend over a potential strike length of 480 metres downand to a maximum vertical depth of 480 metres, (openand dips to the WNW at depth and along strike)80 - 90°. TheIt has an average true width and grade of 2.15 metres @ 11.15 g/t Au.
A characteristic of Reef 1 intersectedis the good geological continuity between drill sections; although the width and grade is variable, the vein was present in almost all holes, in approximately the expected position. The basalt hosting Reef 1 shows intense hydrothermal alteration for several metres into the hangingwall and footwall. The alteration consists mainly of pervasive chlorite with abundant finely disseminated pyrite.
(b) Strike-parallel mineralization up to 6 metres in width, closely associated with shearing within and on the margins of BIF units. The most important zone (Reef 2) is exploited in the holes drilled to dateNorth pit. The alteration assemblage frequently obliterates all traces of the original rock fabric, and consists of smoky grey, brecciated quartz and chlorite with common disseminations and stringers of pyrite (Plate 8). The sulphide content is 2.15 metres with an average gradevariable and averages about 8%. In some intersections, remnant magnetite is present as isolated grains and fragmented bands within the quartz, whilst relatively unaltered BIF locally occurs in the immediate footwall of 11.15 g/t Au. Reef 1 tends to have a glassy, white massive texture and pyritethe alteration. Visible gold is much less common than in Reef 2. The vein is hosted by basalt and dolerite, crosscuts the lithologic strike and is possibly a splay off Reef 2. 1 occurring in 5% of intersections.
Reef 2 has been intersected on the North pit trend over a strike length of 800 metres, the most significant grades occurring in the northern section over a potential strike length of 480 metres. In this northern area, which has so far been drilled les to a maximum vertical depth of 312418 metres, the mineralization has an average true width of 3.52 metres with an average grade of 8.44 g/t Au. Several metres of pervasive chlorite and finely disseminated pyrite occur as an alteration halo to Reef 2, hassimilar to Reef 1. As with Reef 1, Reef 2 shows excellent geological continuity, the altered BIF horizon being intersected in all holes in the expected position. The better developed part of Reef 2 occurs at relatively shallow depths with a smokey grey, brecciated texture with common disseminations and stringersplunge of pyrite and local pyrrhotite. The vein appearsabout 10 ° to have followedthe NNE, before assuming a shear zone within and onvery steep plunge to the marginsSSW. It is possible that the Reef 2 mineralization represents the lower part of a 2-4 metre thick unitsigmoidal structure, the upper “tail” of banded iron formation, and is parallel to the lithological strike. Mineralized intersections are summarised in Figure 5.which has been lost by erosion.
Sele SeleA minor zone of mineralized BIF (Reef 3) occurs 70 – 170 metres in the footwall of Reef 2. It is thinner, more irregularly mineralized and has a much shorter strike than Reef 2, and has little economic significance.
Approximately 2,000 metres toMineralization in the northSele Sele pit, 2 kilometres NNE of the North pit, has similar characteristics to Reef 2, and is interpreted to be on the probable continuationsame BIF unit, based on continuity of the soil anomaly, augering and limited diamond drilling between the two pits. However, the Sele Sele zone is generally wider and lower grade than in the North pit area, the best intersection drilled being 15.68 metres @ 5.35 g/t Au. Pyrrhotite is commonly associated with the pyrite in the Sele Sele area, and is locally the dominant sulphide phase. The mineralization plunges to the SSE at about 40°
.
A third area of Reef 2 atstyle mineralization occurs in the Sele Sele pit has been intersected by diamond drilling over a potential strike lengthBamako area where channel sampling returned an intersection of 480 metres.4.60 metres @ 11.42 g/t Au. The mineralization is generally wider, but lower grade than onassociated with a 2 kilometre long soil anomaly, and although the North pit trend. The best intersection drilledfrom preliminary drilling was of relatively low grade (3.60 metres @ 4.43 g/t Au) further work is 15.68 metres (true thickness) with an average grade of 5.35 g/t Au. Mineralized intersections are summarised in Figure 6.warranted.
Potential new veinsFigures 5 and vein extensions have been identified by Loncor’s soil, auger6 below highlight the drill intersections on Makapela Main to North area and rock-chip sampling programmes, and drill testing of these targets has commenced. Seven drill holes had been completedSele Sele area respectively.
Figure 5 Makapela Main to the date of the Ngayu Technical Report, and results for the first four holes had been received. The most significant intersection of 3.60 metres at a grade of 4.43 g/t is on the Bamako trend, located 1 kilometre SSE of the Main pit. This geochemically anomalous zone, supported by rock chips of up to 18.8 g/t Au, has a strike of about 1.5 kilometres, and additional drilling is planned to further assess its potential.North Drill Intersections
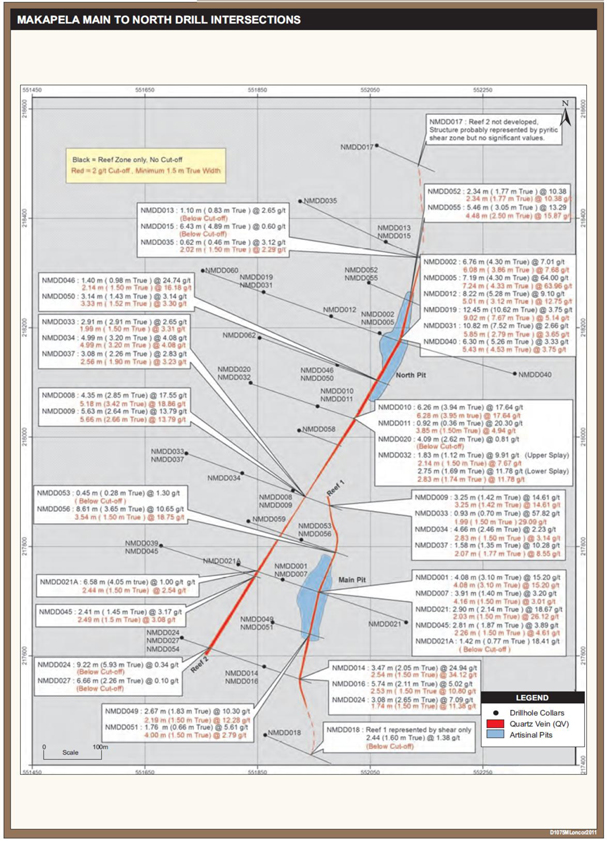
Figure 6 Makapela Sele Sele Drill Intersections

Itali Prospect
The Itali prospect is located at the eastern end of the Imva Fold structure, which comprises40 kilometres to the north-west of Yindi and 10 kilometres south of Makapela. Lithologies comprise an interbedded sequence of BIF, basaltic volcanics and metasedimentary schist. Post-deformation, dioritic intrusives occur within and on the flanks of the fold. Extensive strike-parallel faults have been interpreted from aeromagnetic data, and are possibly thrusts that formed during the NNW-SSE compression and folding event. Five drill holes have been completed at Itali. The first hole was drilled to test a trench intersection of 42.50 metres at 2.11g/t. The drill hole was 161.85 metres in length and inclined at -50 degrees to the south, and was drilled parallel to and immediately below the trench.
Figure 4
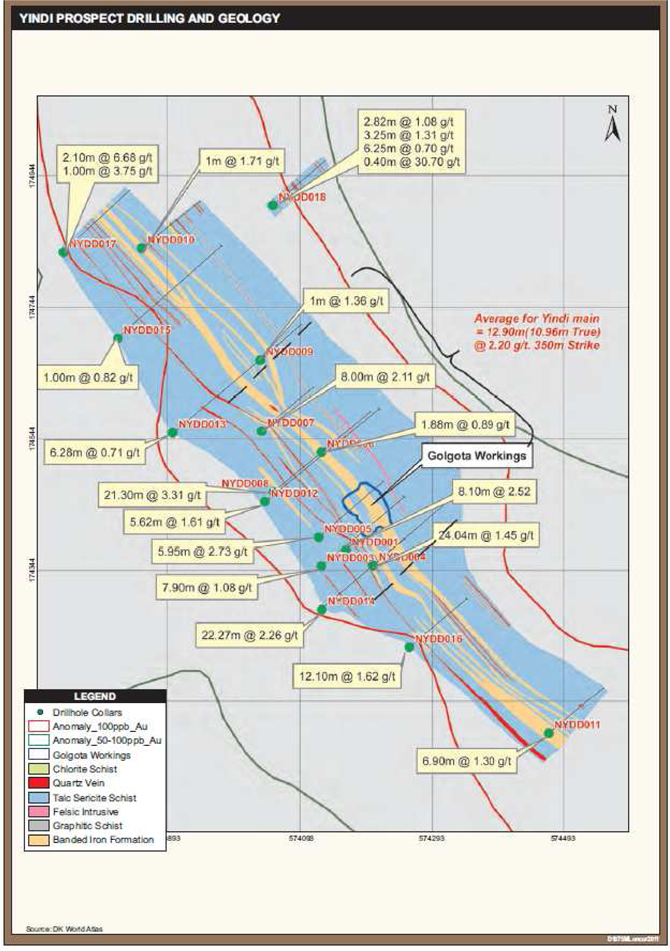
The main mineralized zone consists of quartz veins and veinlets within basalt, overlain by graphitic schist. Two lower-grade zones occur in the vicinity of the basalt/schist contact. The main mineralized zone of 38.82 metres at 2.66 g/t Au, dips at 52° to the north, strikes east-west, and correlates closely with the trench intersection. The rock is completely oxidised to a vertical depth of 110 metres below surface.
Intersections in the subsequent holes, drilled to test the mineralized zone down dip and along strike, include: 21.20 metres @ 0.68 g/t Au (Hole 2), 10.15 metres @ 1.07 g/t Au (Hole 3), 14.70 metres @ 1.68 g/t Au and 3.95 metres @ 19.5 g/t Au (Hole 4).
Auger Drilling
Mechanical auger Ground geophysics and further ground geophysics and drilling using an Atlas Copco percussion hammerwill be required to determine the strike potential, and window sampling barrels, has been extensively employed atto identify the Yindi, Makapela and Itali prospects. The technique provides an intersection of the whole soil profile, and can penetrate the upper saprolite if this is within 7 metres of the surface, the maximum depth that the auger can reach. The method is used to test for bedrock mineralization below soil anomalies, as a prelude to diamond drilling. Even in areas where the saprolite is deeper than 7 metres, the more restricted gold dispersion in the deeperhigher-grade parts of the soil profile provide a more precise estimatemineralized package.
Mondarabe Prospect
Soil sampling and rock chip sampling at Mondarabe delineated two anomalous areas: one to the north in the vicinity of the locationMondarabe artisanal workings, where +100 ppb values (maximum of mineralization, allowing2,350 ppb Au) occur over a strike length of 960 metres; and one in the southern part of the grid, on a hill associated with folded BIF. Five diamond drill holes have been completed on the northern anomaly where gold mineralization is associated mainly with foliation-parallel quartz veins and veinlets within a series of metapelites, intruded by sills of dolerite and minor quartz porphyry. Shearing has preferentially affected the dolerite, and hydrothermal fluids have mineralized the shear zones to varying degrees. The most significant mineralized intersections included 10.46 metres grading 2.01 g/t Au, 2.14 metres grading 31.1 g/t Au and 0.66 metres grading 148 g/t Au.
Two drill holes were completed on the southern soil anomaly area which is associated with folded BIF. Both holes intersected significant widths of BIF with individual units of up to 96 metres, interbedded with sericite schist. The BIF is locally quartz-veined and pyritized, the sulphide occurring as disseminated crystals, massive bands and patches. Despite the fairly widespread hydrothermal alteration, the mineralized zones intersected were relatively narrow, the best intersections in holes 6 and 7 being 3.23 metres grading 3.78 g/t Au and 1.23 metres grading 9.46 g/t Au respectively. Additional ground geophysics (I.P. surveys) and drilling is required to fully assess this prospect.
Nagasa Prospect
The Nagasa prospect is located on the southern limb of the Imva Fold, and is underlain by schists containing several BIF horizons which strike east-west and dip steeply to the north. Strike-parallel faults, probably thrusts, are interpreted from the aeromagnetic data. A prominent BLEG anomaly is found at Nagasa.
The area is characterized by a relatively complex regolith cover, comprising a colluvial layer up to 3 metres thick containing abundant quartz clasts, overlain by a fine grained silty clay layer, interpreted to be optimally sited. 1.818 augerpalaeo-alluvium. The matrix of the colluvium is auriferous and is extensively pitted by artisanal miners, soil anomalies occurring where the colluvial material has been brought to surface. A +100 ppb soil anomaly with a strike of 3.5 kilometres is present in the eastern half of the grid, with values of up to 4,070 ppb Au. A second soil anomaly with a strike of about 1 kilometre occurs in the west.
Due to the overburden (regolith) covering much of Nagasa, it was decided to undertake geophysical IP ground surveys with the objective of detecting mineralized units below the regolith cover. IP surveys were conducted over an initial 2 kilometre x 2 kilometre block at Nagasa, and three well-defined anomalies were delineated. Additional IP surveys were subsequently carried out to the east and west to determine the strike potential of the anomalies. The southernmost Anomaly (Anomaly 1) has a strike length of at least 6 kilometres, and is associated with zones of colluvial workings and with localized remnants of colonial mining activity. Pole-Dipole IP arrays were also undertaken to produce pseudo cross sections which indicated that the higher chargeability anomalies were located at depth.
Two diamond drill holes, totalling 9,392with a strike separation of 2,800 metres, hadwere drilled to test Anomaly 1. IP Anomaly 2 was defined over a 2.9 kilometre strike and is located 500 metres north of, and parallel to Anomaly 1. Two wide spaced holes, 500 metres apart, were drilled into Anomaly 2. Again the higher chargeability anomalies from the Pole-Dipole sections appeared to be more prominent at depth and did not come to surface. One core hole was also drilled into the 5 delineated 1.6 kilometre IP Anomaly 3 which is located about 1 kilometre north of Anomaly 2, and occurs on a topographic high associated with the main BIF unit. Four other shallower diamond drill holes have also been completed at Ngayu by the endCompany at Nagasa. No significant mineralized zones were drilled at IP Anomaly 2 and Anomaly 3 although broad zones of 2012.hydrothermal alteration were intersected while at Anomaly 1, the most significant intersections were 3.72 metres grading 3.17 g/t Au, 2.00 metres grading 2.22 g/t Au and 0.41 metres grading 27.4 g/t Au. Further closer spaced drilling is required to delineate discrete mineralization within the broad hydrothermally altered zones at Nagasa.
Matete and Anguluku Prospects
Ground geophysical IP surveys were undertaken during 2013 at the Matete and Anguluku prospects where the surface expression of mineralization may be masked by the presence of transported overburden. Both prospects were initially identified as high priority BLEG targets and the airborne magnetic data indicated structurally favourable (folded and faulted) BIF. At both Matete and Anguluku, gradient array and pole-dipole IP surveys delineated a number of IP anomalies that require follow up core drilling.
Sample Preparation, Analyses and Security
Section 10 of the Ngayu Technical Report (which section is entitled “Sample Preparation, Analyses and Security”) is incorporated by reference into,and forms part of,this Form 20-F. A copy of the Ngayu Technical Report can be obtained from SEDAR atwww.sedar.com and EDGAR atwww.sec.gov.
Data Verification
Section 11 of the Ngayu Technical Report (which section is entitled “Data Verification”) is incorporated by reference into,and forms part of,this Form 20-F. A copy of the Ngayu Technical Report can be obtained from SEDAR atwww.sedar.com and EDGAR atwww.sec.gov.
Mineral Processing and Metallurgical TestingData Verification
Section 11 of the Ngayu Technical Report (which section is entitled “Data Verification”) is incorporated by reference into, and forms part of, this Form 20-F. A copy of the Ngayu Technical Report can be obtained from SEDAR atSpecific Gravity Measurementswww.sedar.com and EDGAR atwww.sec.gov.
| 40 |
At Makapela, a total of 1,304 core samples were taken to determine the specific gravity of the various reefs and oxide, transitional and fresh rock components. Measurements were taken at 25 cm intervals throughout the reef horizons. Within the hangingwall and footwall, measurements were taken at 2 metre intervals above and below the reef horizon, generating 324 measurements. A summary of the Specific Gravity (SG) for each reef is presented in Table 8 below.
Table 8: SG (g/cm3) for the Makapela Prospect Reefs
| ZONE | REEF 1 | REEF 2 | REEF 3 | SELE-SELE | ||||||||||||
| Oxide | 2.30 | 2.32 | 2.99 | 2.51 | ||||||||||||
| Transition | 2.47 | 2.52 | 3.00 | 2.58 | ||||||||||||
| Fresh | 2.73 | 2.85 | 3.07 | 2.85 | ||||||||||||
Figure 5
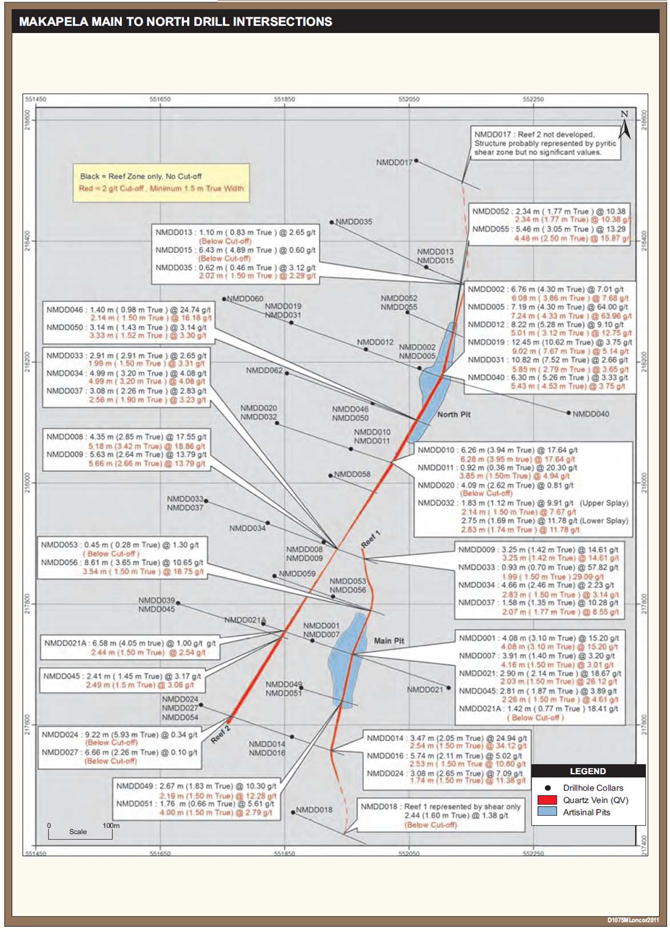
Figure 6
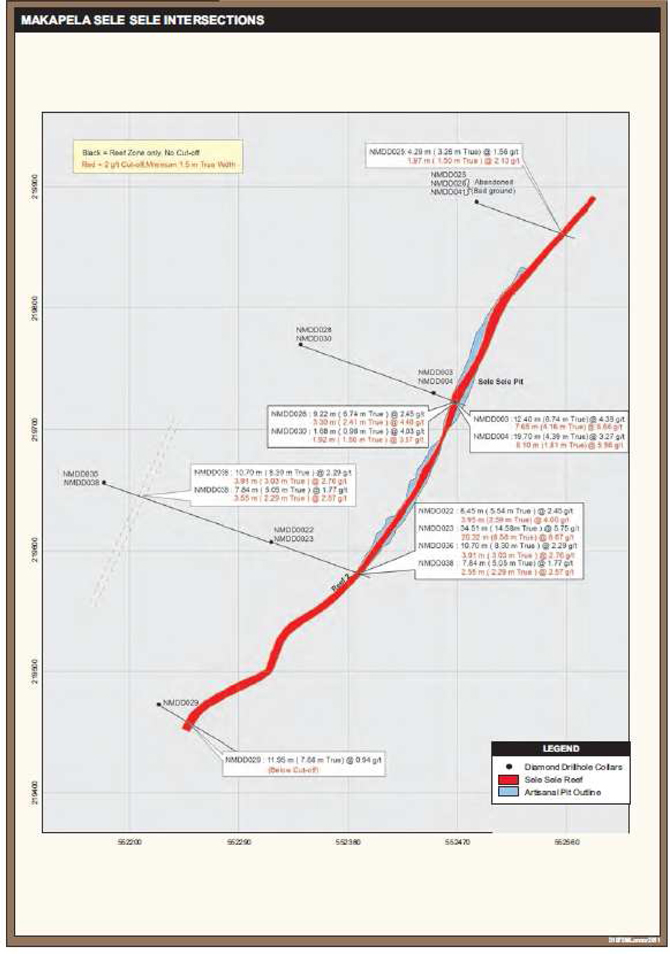
Metallurgical Testing
Initial bottle roll metallurgical testwork for the Makapela prospect has been completedwere undertaken in 2012 in order to obtain preliminary indications of gold recovery from the mineralized zones. Bottle roll is a preliminary metallurgical test to determine how much and how easily gold may be liberated from an ore using cyanide. Samples from Reef 1, Reef 2 and Sele Sele were selected for bottle roll tests at SGS in Mwanza. For Reef 1, ten core samples from two boreholes with grades from 2.50 g/t to 59.03 g/t Au (average grade 19.6 g/t Au) were used for the testwork and for Vein 2, 15 core samples from two boreholes with grades from 1.29 g/t to 76.33 g/t Au (average grade 15.24 g/t) were utilised. From the Sele Sele area, 14 core samples from one borehole grading 2.54 g/t to 18.17 g/t Au (average grade 7.30 g/t Au) were used.
For the bottle roll testwork, each core sample was crushed down to minus 2mm and pulverized down to 90% passing 75microns. Triplicate samples were analysed by fire assay to determine the average head grade of each sample. A 1.5 kg pulverised sample was then bottle rolled for 24 hours in a diluted cyanide solution to extract the gold. Gold analyses were then undertaken on the total gold in cyanide solution and the grade in the sample tails to arrive at the amount of gold extracted by the cyanide solution and the gold remaining in the leached tails. The results are summarised in Table 96 below.
Table 9:6: Bottle Roll Metallurgical Testwork Results
| VEIN | NO. OF SAMPLES | MIN. MET RECOVERY(%) | MAX. MET RECOVERY(%) | AVG MET RECOVERY (%) | NO. OF SAMPLES | MIN. MET RECOVERY(%) | MAX. MET RECOVERY(%) | AVG MET RECOVERY (%) | ||||||||||||||||||||||||
| 1 | 10 | 70.8 | 97.6 | 84 | 10 | 70.8 | 97.6 | 84 | ||||||||||||||||||||||||
| 2 | 15 | 50.6 | 100 | 80.6 | 15 | 50.6 | 100 | 80.6 | ||||||||||||||||||||||||
| Sele Sele | 14 | 16.1 | 93.5 | 55 | 14 | 16.1 | 93.5 | 55 | ||||||||||||||||||||||||
The results indicate that Veins 1 and 2 are not refractory and have good metallurgical recoveries. Sele Sele requires further mineralogical and leaching testwork to investigate the wide variability on results to define leach characteristics and so the recoveries can be optimised.
Additional metallurgical testwork was initiated in 2013 but were not completed.
Mineral Resource Estimates
Mineral Resource EstimationIn April 2013, the Company announced increases and Modelling Techniques
Datamine Studio 3TM was used to model theupgrades of mineral resourceresources at the Makapela Prospect. Venmyn validatedprospect compared to the entire modelling process. Borehole data are captured electronicallymaiden mineral resources announced by the Company in Microsoft Excel, imported into Datamine and "desurveyed" to combine position, grade and descriptive data intoMay 2012. The updated mineral resources incorporated an additional 13 core holes from the master file of drillhole traces. Error-checking is performed in Datamine at the time of desurveying and corrected at source. Venmyn verified that the Datamine master drillhole file correctly represents the data.initial, inferred-only maiden resource.
The mineral resource occurs over a length of 830 metres east to west and 2,420 metres north to south. The mineral resource occurs from surface and the model has been constrained at a depth of 500 metres below the surface.
A 3D (three-dimensional) closed wireframe model has been constructed of the mineralization, interpreted with a 2 g/t sample cut-off. The model has been segregated into four zones, namely Zone 1, 2, 3Tables 7 and 8 representing Reef 1, 2, 3below summarise the current indicated and Sele Sele, with segregation based on reef occurrence. The Sele Sele region in the north is thought to be a continuation of Reef 2 but it has been modelled as a separate zone to reflect the absence of above-cut-off sampling detected in the central region. Loncor has interpreted non-intersection at expected intersection depths to be due to a major fault along strike of the reef. It has been assumed that the fault extends north along the extent of the reef. This is based on limited data from only 10 boreholes.
The Reefs have been identified on the database on the basis of lithology but the mineral resource wireframe does not necessarily follow the lithological contacts. Instead, the orebody is defined as a high-grade structure with a nominal cut-off of 2 g/t. At the same time, another constraint is applied: a minimum horizontal width of 1.5 metres. Consequently the mineral resource wireframe can appear as contained entirely within the lithological units in some places or project beyond it in others. Venmyn confirmed that the wireframe conforms to these principles.
A two-dimensional (2D) surface wireframe or (Digital Terrain Model) DTM truncates the closed wireframe at the topographic surface. Venmyn found that the original topographic surface did not correspond to the positions of the borehole collars. Loncor created a new DTM with positions from the collars supplemented by coordinates of soil samples. Venmyn is satisfied that this is as accurate a representation as can be obtained from currently available data. The closed wireframe extends at least down to RL 200 metres but is truncated 500 metres below surface to fulfill the requirement that the resource has a reasonable prospect of mining using a decline. Venmyn is in agreement with this working definition.
DTMs were also constructed to define the alteration surfaces BOCO (Bottom Of Complete Oxidation) and TOFR (Top Of Fresh Rock), interpreted between boreholes. Venmyn has checked the application of these surfaces to the segregation of the block model into oxidised, transition and fresh ore.
Data within the target zones were selected and composited to 1 metre intervals, thereby creating a uniform support size for statistical modelling. Loncor has composited globally to 1 metre interval. This is representative of core logging as a whole, but Venmyn notes that the dominant (mode) length of samples in the mineralized lithologies is significantly shorter at 0.67 metres.
Statistical and Geostatistical Analysis of Data
Statistical Analysis
Classic statistics were carried out on the data acquired in order to investigate its validity. Table 10 below shows the summary of the statistical analysis. The statistics show high variances and ranges, especially for Zones 1 and 2. This could be indicative of the limited data collected or of the nugget effect that is inherent in gold deposits. More meaningful statistics are anticipated as more samples per zone are collected and analysed.
Table 10: Summary Statistics on the Makapela Data
| ZONE | FIELD | NSAMPLES | MIN | MAX | RANGE | MEAN | VARIANCE | STANDDEV | ||||||||||||||||||||||||
| 1 | 131 | 0 | 121.3 | 121.3 | 6.7 | 196.6 | 14 | |||||||||||||||||||||||||
| 2 | AU | 170 | 0 | 371.1 | 371.1 | 8.3 | 887.7 | 29.8 | ||||||||||||||||||||||||
| 3 | 15 | 0.2 | 26.1 | 25.9 | 5.2 | 47.4 | 6.9 | |||||||||||||||||||||||||
| 8 | 89 | 0.1 | 17.6 | 17.6 | 4.4 | 14.6 | 3.8 | |||||||||||||||||||||||||
Variography
Grade interpolation was effected using ordinary kriging and Datamine’s dynamic anisotropy option was employed using sample data located within the 2.0 g/t cut-off interpreted boundaries. No capping was applied to the samples prior to grade interpolation. The search ellipse dimensions were set at 90 metres along the strike of the structure, 50 metres down-dip and 9 metres in the cross-structure directions. Dip and dip directions were calculated from wireframes using Datamine’s Anisoang command and later interpolated into the individual blocks using Datamine’s Estima process. Grade interpolation was effected separately for the individual zones and Datamine’s dynamic anisotropy process was employed to ensure that the search distances were controlled by the orientation and axes of the search volume and grades were interpolated primarily into parent cell. The down-dip extrapolation was restricted to three times the down dip variogram range from the last drillhole used in the interpolation. The model was trimmed off at a maximum depth of 500 metres below surface for reporting.
Analysis of the Grade-Tonnage Curve
A grade-tonnage curve (see Figure 7 below) was compiled from the block listing data acquired from the modelling process. This includes all blocks that contributed to the mineral resource estimate and as such represent the total mineral resource for the Makapela prospect. When a Au grade cut-off of 2.75 g/t is applied on the curve, then 4.1Mt inferred mineral resourceresources at 7.6 g/t is indicated. This concurs with the mineral resource reported, which validates the results achieved.
Figure 7: Grade-Tonnage Curve for Makapela Prospect
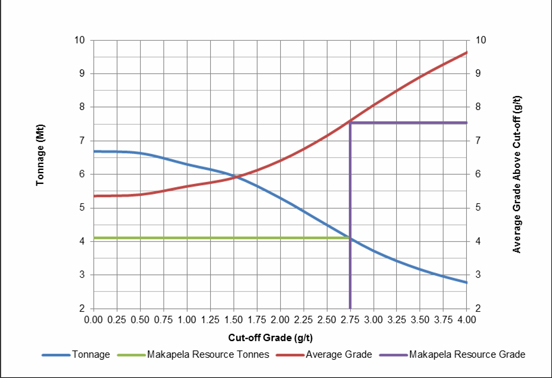
Mineral Resource Estimate
A 3D block model was created in Datamine for the purposes of mineral resource estimation. Block sizes of 5 metres (east-west, approximately across strike) x 10 metres (north-south, within 20° of strike) x 10 metres (vertical) were used. Composite data were then divided into domains for grade estimation purposes. Dynamic anisotropy was used in estimating grade. The same variogram model was used for all the zones, but the application of Datamine’s proprietary “dynamic anisotropy” enabled it to be adjusted to the different orientations of theusing various reefs, thereby improving sample selection and calculation of kriging weights. The technique of subcelling was employed to estimate the actual volume of reef contained within each parent cell. Following that, tonnages above specified cut-offs were calculated. Estimates and data selected have been confined to the zone of 2 g/t cut-off. In this regard no structural features are highlighted.
The entire resource is classified in the inferred category. Although geological confidence is high, grade interpolation confidence is low, due to the inherent irratic nature of grade in gold deposits. Acut-off grades including a base case economic cut-off grade of 2.75 g/t Au that used a US$1,500/ounce gold price and appropriate cost parameter assumptions and metallurgical recoveries. Core drilling began at Makapela in October 2010 and has focused on a quartz vein system within a sequence of basalts, thin units of banded iron formation and dolerite sills of Archaean age. A total of 71 core holes totalling 21,635 metres (including deflections) have been used to estimate these indicated and inferred mineral resources at Makapela. Drilling has been selectedfocused on three main veins: Reef 1, Reef 2, and Sele Sele that occur over a total strike length of 2.2 kilometres. Core drilling was undertaken on an approximate grid pattern of 80 by 80 metres down to a vertical depth of 240 metres and then on a 160 by 80 metre grid pattern down to a maximum depth of 480 metres.
Table 7: Makapela Indicated Mineral Resources (with an effective date of April 9, 2013)
| Cut-off Grade (g/t Au) | Average Grade (g/t Au) | Tonnes (Mt) | Gold Content (Ounces) | |||||||||||
| 1.00 | 7.45 | 2.683 | 643,000 | |||||||||||
| 2.00 | 8.14 | 2.407 | 629,700 | |||||||||||
| 2.75 | * | 8.66 | 2.205 | 614,200 | ||||||||||
| 3.00 | 8.87 | 2.130 | 607,200 | |||||||||||
| 4.00 | 9.97 | 1.764 | 565,500 | |||||||||||
Minimum mining true thickness of 1.5 metres. *Cut-off grade estimated using a US$1,500/ounce gold price with appropriate cost parameter assumptions for mining and other economic factors.
Table 8: Makapela Inferred Mineral Resources (with an effective date of April 9, 2013)
| Cut-off Grade (g/t Au) | Average Grade (g/t Au) | Tonnes (Mt) | Gold Content (Ounces) | |||||||||||
| 1.00 | 3.49 | 6.944 | 779,800 | |||||||||||
| 2.00 | 4.29 | 4.900 | 675,900 | |||||||||||
| 2.75 | * | 5.30 | 3.223 | 549,600 | ||||||||||
| 3.00 | 5.69 | 2.781 | 508,700 | |||||||||||
| 4.00 | 7.26 | 1.640 | 382,600 | |||||||||||
Minimum mining true thickness of 1.5 metres. *Cut-off grade estimated using a US$1,500/ounce gold price with appropriate cost parameter assumptions for mining and other economic factors.
In terms of material type, approximately 9% of the purpose of resource reporting. This cut-off grade was inferred from similar projects world-wide and the anticipated underground mining method. Thetotal mineral resources statement for Makapela prospect is providedare in Table 11 below.oxides, 6% in transitional and 85% in fresh rock.
Table 11: Inferred Mineral Resource Estimate for Makapela ProspectThese mineral resource estimates were prepared by independent consultants Venmyn Deloitte ("Venmyn"). The geology and drilling information was analysed, interpreted and estimated by Andrew Clay of Venmyn, who is a "qualified person" as such term is defined in National Instrument 43-101. Mr. Clay visited the site to review data collection procedures, geological interpretations and modelling, and estimation using geostatistical techniques. Venmyn also reviewed the geological and grade continuity to supplement the review of data quality in order to confer mineral resource classification categories to reflect the variable sample coverage. Venmyn is satisfied that all drilling, sampling, database and geological modelling protocols comply with an Effective Date of April 11, 2012the standards prescribed by National Instrument 43-101.
| REEF 1 | REEF 2 | REEF 3 | SELE SELE | ZONE TOTAL/AVE | ||||||||||||||||||||||||||||||||||||||||||||||||||||||||
| ZONE | ORE (Mt) | GRADE (g/t) | Au (Moz) | ORE (Mt) | GRADE (g/t) | Au (Moz) | ORE (Mt) | GRADE (g/t) | Au (Moz) | ORE (Mt) | GRADE (g/t) | Au (Moz) | ORE (Mt) | GRADE (g/t) | Au (Moz) | |||||||||||||||||||||||||||||||||||||||||||||
| Oxide | 0.14 | 10.73 | 0.05 | 0.16 | 11.51 | 0.06 | 0.01 | 7.62 | 0.002 | 0.15 | 6.49 | 0.0318 | 0.45 | 9.50 | 0.14 | |||||||||||||||||||||||||||||||||||||||||||||
| Transition | 0.04 | 8.43 | 0.01 | 0.11 | 10.49 | 0.04 | 0.00 | 6.72 | 0.001 | 0.05 | 5.19 | 0.0083 | 0.20 | 8.67 | 0.06 | |||||||||||||||||||||||||||||||||||||||||||||
| Fresh | 0.78 | 11.33 | 0.29 | 1.54 | 7.21 | 0.36 | 0.16 | 6.74 | 0.034 | 0.97 | 4.15 | 0.1288 | 3.45 | 7.27 | 0.81 | |||||||||||||||||||||||||||||||||||||||||||||
| TOTAL/ AVE | 0.96 | 11.12 | 0.34 | 1.80 | 7.79 | 0.45 | 0.17 | 6.79 | 0.04 | 1.17 | 4.49 | 0.17 | 4.10 | 7.59 | 1.00 | |||||||||||||||||||||||||||||||||||||||||||||
The following key assumptions, parameters and methodologies were used to estimate the mineral resources:
Notes:
| · | The mineralization models were constrained within the wireframe with primary block dimensions of 10 metres N-S (along strike), 5 metres E-W (cross strike direction) and 10 metres in the vertical direction. |
| · | Grade interpolation was |
| · | The down dip extrapolations were restricted to three times the variogram range from the last drillhole used in the interpolation and the model was trimmed off at a maximum depth of 500 metres from the surface for reporting purposes. |
| · | Portions of the resource have been re-classified from Inferred to Indicated based on increased geological confidence and grade continuity due to data quality and data density following infill drilling. Criteria for Indicated are sufficient samples within one variogram range to achieve valid local estimates, in respect of positive kriging efficiency. |
Drill cores for assaying were taken at a maximum of one metre intervals and were cut with a diamond saw with one-half of the core placed in sealed bags by Company geologists and sent to the SGS Laboratory (which is independent of the Company) in Mwanza, Tanzania. The resources are classified accordingcore samples were then crushed down to alteration typeminus 2 mm, and reef. Althoughsplit with one half of the geology is well understoodsample pulverized down to 90% passing 75 microns. Gold analyses were carried out on 50g aliquots by fire assay. In addition, checks assays were also carried out by the screen fire assay method to verify high grade sample assays obtained by fire assay. Internationally recognized standards and it is reasonableblanks were inserted as part of the Company's internal QA/QC analytical procedures.
A total of 2,614 core samples were taken to assume geological continuity, there is insufficient grade data and spatial correlation of grades is insufficiently modelled, to permit any classification other than inferred. The total mineral resourcesdetermine relative density measurements for the Makapela prospect are demonstrated at different cut-off grades in Table 12 below.various reefs and oxide, transitional and fresh rock components.
Table 12: Inferred Mineral Resource Estimates for Makapela Prospect with an Effective Date of April 11, 2012 at Various Gold Grade Cut-Offs
| CUT-OFF GRADE (g/t) | AVERAGE GRADE (g/t) | ORE (Mt) | Au (Moz) | |||||||||||
| 1.00 | 5.65 | 6.30 | 1.14 | |||||||||||
| 2.00 | 6.41 | 5.30 | 1.09 | |||||||||||
| 2.75 | 7.59 | 4.10 | 1.00 | |||||||||||
| 3.00 | 8.07 | 3.72 | 0.97 | |||||||||||
| 4.00 | 9.64 | 2.78 | 0.86 | |||||||||||
Notes:
2013 Exploration Plans at Ngayu
The main operational objectivesstatus of exploration, exploration potential and recommended programs are summarised for the 2013various prospects at Ngayu exploration program areas follows, subject to (a) completesufficient funding being available for the preliminary economic assessment of the Makapela prospect (which commenced in the fourth quarter of 2012) by May 2013, and to plan the next phase of the project, (b) complete follow up on all targets defined by the BLEG and geophysics surveys and to carry out sufficient drilling to demonstrate the potential for at least one significant gold deposit.
Makapela
The preliminary economic assessment of the Makapela prospect is being managed by SENET of South Africa. The results of the study will determine the extent and direction of further work at Makapela.
Imva Fold Area
The Imva Fold area will be the Company’s main focus during 2013, and is planned to involve the following:
Anguluku
The program at Anguluku for 2013 is planned to entail the following:Company:
| Prospect | Exploration Potential | Next Steps | ||||
| Makapela | Indicated and inferred mineral resources summarized in the tables above. | Main Zones: Considered unlikely that all the mineralized bodies are outcropping, and good potential for locating blind mineralized shoots along well-defined structures with an aggregate strike of Other: Possible mineralization associated with a quartz-porphyry intrusion overlain by transported overburden. | Main Zones: 1. IP (pole dipole) testwork over known mineralization, followed by systematic pole-dipole lines along strike. 2. Drill testing of anomalies. 3. Completion of preliminary economic assessment. Other: IP to locate possible mineralized parts of the quartz-porphyry, followed by auger drilling and | |||
| Yindi | Outline drilling on main soil anomaly (18 holes) demonstrates potential for delineation of a mineral resource. | Drilled zone is open-ended to SE. Two adjacent IP anomalies not drill tested. Kputuka adit (10.30 metres @ 4.12 g/t Au) not drill tested. Possibility of disseminated & stockwork mineralization in La Grace area. | Additional drilling on main zone for inferred resources and to close off in SE. Drill test IP targets and Kputuka adit. IP surveys in La Grace area. |
| Prospect | Exploration Potential | Next Steps | ||||
| Nagasa | Preliminary drilling of 3.72 metres @ 3.17 g/t Au 0.76 metres @ 9.03 g/t Au 0.41 metres @ 27.40 g/t Au | The Anomaly 1 structure has an open-ended strike of >6 kilometres, with gold mineralization indicated by rock chip sampling, widespread auriferous colluvium, and drilling. Only three widely-spaced lines drilled; all have strong hydrothermal alteration, and two have Au mineralization. | Systematic pole-dipole IP to define the more highly altered sections of the 6 kilometre zone (possible use of 3D IP). Wider-spaced IP to test strike extensions. Outline drilling of IP anomalies. | |||
| Mondarabe | Preliminary drilling of 2 soil anomalies (7 holes). Intersections include: 10.46 metres @ 2.01 g/t Au 3.52 metres @ 3.54 g/t Au 2.14 metres @ 31.15 g/t Au | 1. Northern anomaly: two zones of workings with a combined strike of 1.6 kilometres, only one of which has been drilled on two lines. Possible strike extensions under transported cover. 2. Southern anomaly: underlain by S-fold in BIF. Two southerly limbs of the fold covered by colluvium and not yet drill tested. | Additional drilling on the northern anomaly. IP to test for strike extensions under cover. Drilling on the southern part of the S-folded BIF. | |||
| Itali | Preliminary drilling over a strike of 480 metres (5 holes on 3 lines). Intersections include: 38.82 metres @ 2.66 g/t Au 21.20 metres @ 0.68 g/t Au 14.70 metres @ 1.68 g/t Au 3.95 metres @ 19.50 g/t Au | Mineralization open-ended to E, with 340 metres of potential strike before Kilogold boundary. Also possibly open-ended to W, under transported cover | IP to cover potential strike extensions. Additional drilling to test | |||
| Matete | Soil geochemistry, rock chip sampling, augering, trenching in N and E. IP over lithostructurally favourable areas with transported overburden in SW. | 7 drill targets proposed by Newmont based on IP anomalies. Extensive alluvial mining in E with source not yet located. | Prioritise and drill test IP anomalies in SW Additional IP in E. | |||
| Anguluku | Detailed stream sediment sampling. Soil geochemistry, rock chip sampling, augering, trenching (but problems with transported overburden). IP in geochemically anomalous areas. | Strong stream sediment anomalies associated with NW structure. Disseminated mineralization sampled within schists (e.g. trench with 5 metres @ 5.5 g/t Au). Well-defined IP chargeability anomalies associated with E-W structures and | Drill test IP anomalies. |
Adumbi West
Exploration at Adumbi West will be based on the results of soil, rock chip and channel sampling programs completed in in the fourth quarter of 2012, complemented by the detailed geophysics data. It is expected that infill soil sampling, auger drilling, and possibly trenching, will be employed to generate initial drilling targets.
Itali
In order to optimize future drilling at Itali, IP surveys will be carried out with the objectives of (a) testing the possible westward extension of mineralization under the thick, transported overburden, and (b) locating potential zones of higher grade mineralization within the drilled package. This work is scheduled for the latter part of 2013, following the higher-priority IP surveys in the Imva Fold area and at Anguluku.
Other Targets
Ground follow-up of the remaining BLEG targets is planned to be undertaken during 2013, with priority given to targets M2, M5 and L1. Reconnaissance will be undertaken to confirm the regolith types interpreted from radiometric data. In areas with residual soil, preliminary work will entail soil sampling on 320 metre-spaced lines. For areas with transported overburden, detailed BLEG is planned in order to delineate the source areas of the anomalies as closely as possible, with follow-up by augering, pitting and trenching.
North Kivu Project
Loncor owns or controls a contiguous block of 5351 exploration permits (or "PRs") covering an area of approximately 14,34413,251 square kilometers to the northwest of Lake Edward in the North Kivu province in the DRC. TheseThe areas covered by these PRs are located between the two major gold belt terrains of the DRC: the Twangiza-Namoya gold belt, owned by Banro Corporation, and the Kilo-Moto gold belt, previously controlled by Moto Gold and now owned by Randgold and Anglogold Ashanti. In addition to gold, there are a number of alluvial platinum occurrences in the project area, including the type locality for the platinum selenide mineral luberoite near Lubero. To date, no primary source has been found for the alluvial platinum occurrences. AlthoughDue to the priority is gold and platinum,security situation, all but two of the North Kivu project also has a numberPRs are currently under force majeure.
Historical data was compiled from the colonial period of niobium, rare earths, tantalum, copper, ironalluvial gold mining and diamond occurrences.exploration which outlined ten gold prospects for follow-up, the most prospective being the Manguredjipa prospect where 300,000 ounces of alluvial gold was reportedly mined during the colonial period up to 1960. Other gold prospects warranting follow up included Lutunguru, Lubero, Makwasu, Lutela, Bilolo, Manzia, Mohanga and Ludjulu.
The Company’s most advancedexplored gold prospect area within the North Kivu project area ishas been Manguredjipa.
Manguredjipa
Certain of the following disclosure relating to the Manguredjipa prospect is derived from the independent technical report (herein referred to as, the "Manguredjipa Technical Report") dated February 29, 2012 and entitled "National Instrument 43-101 Independent Technical Report on the Manguredjipa Gold Project, North Kivu Province, Democratic Republic of the Congo" prepared for Loncor by Venmyn. A copy of the Manguredjipa Technical Report can be obtained from SEDAR atwww.sedar.com and EDGAR atwww.sec.gov.
Property Description and Location
The Manguredjipa projectarea is a gold project located in the North Kivu Province of the DRC, approximately 80 kilometres northwest of Lake Edward, as shown in Figure 1. Manguredjipa forms part of Loncor’s extensive North Kivu property, extending over an area of approximately 77,000ha.project area. The project was delineated from Loncor’s exploration program of historical records commissioned in 2008 as one of the primary targets to pursue and conduct further studies on. The project consists of four PRs 1380, 1381, 1718 and 1719, two of which (1380 and 1381) are owned by Loncor through its wholly-owned DRC subsidiary, while the other two are under option. The project has beenwas delineated into three prospective targets, namely Durba, Manguredjipa West and Muhanga.
Manguredjipa is situated approximately 4060 kilometres (95 kilometres by road) northwest of Butembo and occupies an area of approximately 77,000ha. It is located approximately 6080 kilometres west of Beni and 370395 kilometres west of Kisangani. Manguredjipa is situated approximately 220 kilometres northwest of Goma and 275 kilometres northwest of Kigali in Rwanda. The Manguredjipa area is regionally served by primitive infrastructure and serviced by a gravel road from Butembo.
The renewal date for PRs 1380 and 1381 was October 10, 2012 and, as per the mining regulations, renewal applications for these two PRs were submitted on July 10, 2012 to the Mining Registry. During the latter half of 2012, these 2 PRs were under force majeure due to the security situation. For PRs 1718 and 1719, these were due for renewal in February 2012 but due to force majeure, the Mining Registry extended the expiry dates of both PRs to December 27, 2012.
The Manguredjipa project PRs are renewable twice for five years. Upon each renewal, the PR area must be reduced by at least 50%.
According to DRC law, the surface rights and the mineral rights pertaining to one property are not separated. Loncor therefore owns or has option rights to the licences to both the surface and mineral rights to the Manguredjipa project.
In order to maintain a PR in good standing the title holder is required to make annual surface fee and surface tax payments to the State Treasury and the Provincial Tax authorities, respectively. All surface fees and provincial taxes for the Manguredjipa project have been paid and the permits are currently in good standing. Table 13 below summarizesstanding except for the surface fee and provincial tax payments which were made for 2011 and 2010.
Table 13: Summary of Fees and Taxes due by Loncor (2010-2013)
| PR | SURFACE FEES (USD) | PROVISIONAL TAXES (USD) | ||||||||||||||||||||||||||||||||
| NO. | LICENCE NO. | 2010 | 2011 | 2012 | 2013 | 2010 | 2011 | 2012 | 2013 | |||||||||||||||||||||||||
| 1380 | NO° CAMI/CR/10 3/2003 | 10,395 | 10,237 | FM | FM | 1,155 | 1,320 | FM | FM | |||||||||||||||||||||||||
| 1381 | NO° CAMI/CR/102/2 003 | FM | FM | FM | FM | FM | FM | FM | FM | |||||||||||||||||||||||||
| 1718 | NO° CAMI/CR/28 99/2007 | 411 | 5,629 | FM | FM | 479 | 697 | FM | FM | |||||||||||||||||||||||||
| 1719 | NO° CAMI/CR/2900/2007 | 755 | 8,632 | FM | FM | 880 | 1,069 | FM | FM | |||||||||||||||||||||||||
FM: Force MajeurePRs under force majeure where no fees or taxes are payable during the force majeure period.
Accessibility, Climate, Local Resources, Infrastructure and Physiography
The Manguredjipa project area occurs to the south of the Mobissio and Mutumbi highland ridge which trends northwest-southeast across the region. This elevated ridge forms the main watershed of the region. Topographically the area is hilly with deeply incised valleys with an average elevation of 1,000 mamsl, ranging from 700 mamsl to 1,500 mamsl. The hilltops rise more than 50 metres above the surrounding drainage basins and in the western Lenda-Biaboy basins the hills are steeply sided with slope angles of up to 35°. The hills in the southern Eohe basin are less steeply sided, with slopes of 15°.
The area is covered by equatorial rain forests and thick grassy hilltops. Scattered rubber and palm tree plantations date from the colonial era.
Access to the project area is primarily by gravel road from Butembo. TheIn the past, the area can be reached by light aircraft due to the existence of an airstrip near the old Manguredjipa camp. Other usable airstrips are situated in Butembo, Lubero and Beni. An 800 metre unused airstrip is located at Etaetu approximately 58 kilometres west of Manguredjipa.Manguredjipa but this airstrip is now covered by vegetation. The main road north from Goma to Beni also provides access to the towns of Lubero and Butembo. Existing infrastructure is best developed and therefore concentrated along the main road between Goma in the south and Beni in the north.
The nearest village to the site is Mangazi village, situated a few kilometres south of the main artisanal workings. The Manguredjipa property lies within the Lubero Territory under thecollectivitéof Bapere. The indigenous people are Bapiri and their main source of income is through subsistence farming and artisanal mining. Goma, Butembo and Beni are the principal commercial centres in the northeastern DRC. Loncor has constructed an exploration camp close to the project which houses the exploration team (see Figure 8).
In relation to the existing infrastructure of the North Kivu Province, the Manguredjipa project is well placed. The mode of transport for the general population is mainly trucks and buses on the road to Butembo, which has deteriorated since exploration began in 2008, but is constantly maintained by Loncor for ease of passage. The project’s exploration team utilises mainly utility vehicles and, where there are no roads, they travel onis by foot. In some cases a helicopter canhas be utilised to gain access to remote areas.
The climate in the eastern DRC is tropical. It is hot and humid in the equatorial river basin and cooler and wetter in the eastern highlands. The wet season takes place in April to October and the dry season from December to February north of the equator. South of the equator the wet season is from November to March and the dry season from April to October. The climate facilitates exploration and mining activities all year round. Exploration is more challenging during the wet season, as roads become muddy and slippery, pits are rapidly filled by water and work in the field becomes difficult.
The land around the Manguredjipa project is mainly equatorial rain forest, with very tall trees and grass. Natural water sources are abundant. Groundwater potential has not been investigated. The Mangazi village is a potential source for manpower and a node for development. The surrounding community carries out some subsistence farming for their own needs and for trade in nearby towns. At this stage the electricity supply at the base camp in Manguredjipa is through a 5kVA petrol generator.
HistoryHistorical Exploration
A number of exploration companies have operated withinDuring the North Kivu area. Exact details of ownership have not been properly recorded butcolonial period up until 1960, the following comments are relevant. The Belgians explored the DRC extensively from the late 1800s through to 1960. The Belgians sampled every riverrivers and tributarytributaries using sluices for gold and diamonds, recording their findings onto detailed plans held at the Tervuren Museum in Brussels. The North Kivu area was historically a significant producer of alluvial gold and platinum. Exploration and mining took place from 1923 to 1960 when low gold prices and civil unrest caused the cessation of activities. Throughout this period, a total of 2,000 kg of gold combined with platinum was produced.
Historical Exploration
Alluvial gold was first reported in the North Kivu region in 1913 and reports of gold discoveries continued into the 1920s. Regional infrastructure to support the mining industry was established from the 1930s with the town of Butembo becoming the main mining centre in the region. Intense exploration for alluvial and primary precious metals was conducted over a period of about fifty years. Exploration was primarily for platinum in river drainages, as shown in Figure 7, from 1930 to 1972. Exploration included both surface and underground investigations using systematic sampling, pitting and trenching.
Historic exploration and production on the Manguredjipa project area was from the Lenda drainage (Figure 7) which was explored and exploited for alluvial gold from 1925 to 1960. The term “Division Lenda” in various reports, has been noted as referring to the entire goldfield including Manguredjipa, Motokolea, Mabea, Makwasu, Eohe and Biaboy (Figure 7).
The summary of the past exploration serves to indicate that areas of primary mineralisation exist, both as disseminated ore bodies and quartz veins and these areas are situated on the following drainage systems as noted in Figure 7:
• Manguredjipa drainage at D1, D2, D3, D4 (plus Gite A) to D7;
• source of Mabea River D5 and D6;
• Mabea D2;
• source of Potopoto and D1; and
• Makwasu D6, D3 and G4.
Figure 8
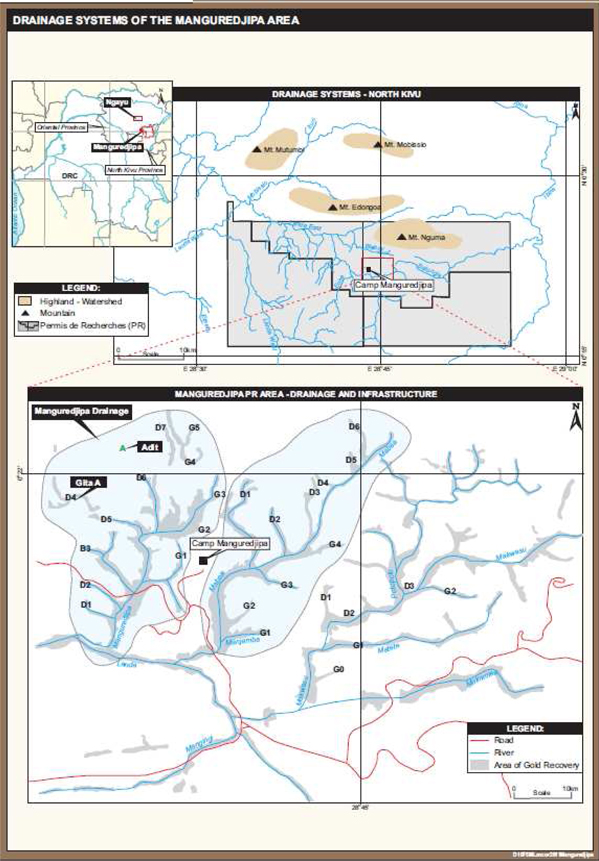
Geology and Mineralisation
The regional geological history of the DRC is directly relevant to the prospectivity of the North Kivu region. Several broad geological terrains occur in the North Kivu and South Kivu districts with specific, genetically related metallogenic provinces. The northern area consists of an Archaean greenstone belt and granite-gneiss basement (3.5-3.2Ga), while the central and southern parts are comprised of Mesoproterozoic (1.6Ga-950Ma) mobile belts formed during the Kibaran orogeny dated at 1,400-950Ma.
The deposit occurs within the Kibaran orogenic belt which contains renowned metallogenic provinces genetically related to the protracted history of tectonism, volcanism and metamorphism of the belt. The local geology of the Manguredjipa project area consists of E-W trending sequences of arkoses, conglomeratic arkose, schists and basic intrusive, as determined from literature studies.
The primary mineralisation appears to be typical of that associated with greenstone and mobile belts, where syngenetic gold has been mobilised during tectonism and complex structural and chemical controls. Concentration and re-deposition of ore minerals has occurred in veins and disseminated mineralisation along structural or chemical features.
These processes are consistent with the complex and protracted geological and tectonic history of the Kibaran Belt and the genetic model is further complicated by magmatic intrusive events that introduced epithermal fluids, heat sources and additional metallic elements. The areas are considered highly prospective as only limited exploration has taken place using modern exploration techniques.
Loncor Exploration up(2008 to 20122012)
At this point, Loncor is concentrating on areas of known gold recovery, i.e. artisanal mining sites, to generate its targets. This, supported by the previous study by Venmyn on gold grade distribution and its association with the drainage patterns and combined geophysical survey interpretation, forms the basis of Loncor’s exploration concept. It is believed that the alluvial gold was mobilised by the drainage systems from the point source (i.e. greenstone belts) and that primary gold can be found within hydrothermal quartz veins or sugar-textured quartzite layers.
Exploration by Loncor commenced in 2008 with the interpretation of airborne magnetic and radiometric surveys which were flown over a large portion of the Loncor owned PRs by New Resolution Geophysics (NRG) in July and August 2007. The area covered by the survey is located 390 kilometres east of Kisangani and 230 kilometres north of Goma. The Manguredjipa licence area covers almost the entire southern half of the geophysical survey area. The combined geophysical survey identified 14 potential exploration targets.
In addition, historical data during colonial times was evaluated from the Tervuren Museum in Brussels from which a number of priority gold targets were outlined including Lutunguru, Lubero, Makwasu, Lutela, Bilolo, Manzia, Muhanga and Ludjulu.
During 2008, Venmyn carried out an analysis on historical stream sediment sampling data from the Manguredjipa project. This analysis was graphically presented utilising Surfer® software to create a grade model of the Manguredjipa and surrounding environs. The Surfer® model of gold grade distribution for Manguredjipa showed a clear zone of anomalously high gold grades developed across the area trending in a southwest-northeast direction. The background gold grades range between 0.2 to 1.0g/m3and the anomalous areas reach a maximum of 4.2g/m3.
Since August 2009, Loncor has embarked on a geochemical stream sediment, soil and rock sampling programprograms based on the combined results from the geophysical interpretation and the stream sediment grade distribution models. A onekilometre by twokilometre grid was designed initially for a target area, near the Durba adit, north of the base camp at Manguredjipa. A total of 1,190 samples had been collected by November 2009 and the results were received by the end of January 2010. A number of anomalous zones were identified on the sampling block, but no conclusive remarks can be made with regard to the results thus far. However, this work has enabled Loncor to define a new exploration work program with a defined budget and objectives.
From 2010 until October 2011, the focus was on the Durba, Manguredjipa West and Muhanga prospects. Another prominent artisanal adit, named the Mont Blue Adit, was discovered within the Muhanga prospect. The following was carried out during this period:
In the same period, the following samples were collected:
No drilling has taken place to date. Drilling will only be considered once positive results from the soil and rock chip sampling exercises are achieved.
2012 Exploration Activitiesat Manguredjipa
Exploration continued in the Manguredjipa area until early June 2012, when activities were suspended to conserve funds for the priority Ngayu project. The field camp at Manguredjipa is currently under care and maintenance. Field work focused mainly on the Muhanga prospect. In order to better assess continuity of the mineralization, a channel sampling program at the Muhanga prospect commenced in late 2011 and was completed in the first quarter of 2012. A total of 780 metres were sampled by means of a mechanical rock cutter, in two phases: (a) channels orientated N-S, i.e. normal to the lithological strike and long-axis of the rock chip anomaly, and (b) channels orientated E-W, normal to the dominant quartz vein direction. The rock sample results indicateindicated that the mineralization is patchy and the potential to generate a significant tonnage is low.
Due to the current security situation in North Kivu province, the four PRs comprising theManguredjipa project are now subject to Force Majeure.mineral resource was low and did not warrant follow up drilling.
2013 Exploration Plans Activitiesat Manguredjipa
No exploration was undertaken on the North Kivu project due to the force majeure situation on most of the PRs and in order to focus exploration and funds on the priority Ngayu project.
Exploration Plans for the North Kivu Project
It is proposed to extend the Technical Services Agreement with Newmont to coverExploration on the North Kivu project. This would enable the area to be covered by BLEG sampling, so that exploration targets can be reliably and cost-effectively identified and prioritized. The program would be carried out by ground-based sampling teams (rather than by helicopter) and coverage of the northern half of the project area (about 700 samples representing 7,000 km2) would be completed in four to six months. Implementation of the program in 2013 will be dependent on the security situationlifting of force majeure on the priority PRs so that groundwork can commence and the duration of the Force Majeure.on sufficient funding being available for exploration. The priority area would be Lutunguru prospect where extensive gold artisanal activity including hardrock mining is currently being undertaken.
| 48 |
Qualified Person
ThePeter N. Cowley, the Company’s President and Chief Executive Officer and a "qualified person" (asas such term is defined in National Instrument 43-101) who oversees the Company's exploration programs is Dr. Howard Fall. Dr. Fall, who is the Company'sExploration Manager,43-101, has reviewed has reviewed and approved the technical information in this Form 20-F relating to the Company’s mineral projects.
Item 4A. Unresolved Staff Comments
Not applicable.
Item 5. Operating and Financial Review and Prospects
See the management's discussion and analysis of the Company for the year ended December 31, 20122013 incorporated by reference into this Form 20-F as Exhibit 15.1.
A. Operating Results
See the management's discussion and analysis of the Company for the year ended December 31, 20122013 incorporated by reference into this Form 20-F as Exhibit 15.1.
B. Liquidity and Capital Resources.
See the management's discussion and analysis of the Company for the year ended December 31, 20122013 incorporated by reference into this Form 20-F as Exhibit 15.1.
C. Research and Development, Patents and Licenses, etc.
Not applicable.
D. Trend Information
None of the Company's assets are currently in production or generate revenue. However, the cyclical nature of the prices of metals, particularly the price of gold, is reasonably likely to have an effect on the Company's liquidity and capital resources. If the price of gold or the worldwide demand for gold decreases, there would likely be an adverse effect on the Company’s ability to raise additional funding and attract exploration partners for its projects.Recently, junior mineral exploration companies have experienced difficulties raising new money, and capital raising activities completed by such companies have often resulted in substantial dilution to existing shareholders.
E. Off-Balance Sheet Arrangements.
The Company does not have any off-balance sheet arrangements.
F. Tabular Disclosure of Contractual Obligations
The following information is as of December 31, 20122013 and in United States dollars:
| Payments due by period | Payments due by period | |||||||||||||||||||||||||||||||||||||||
| Less | More | Less | More | |||||||||||||||||||||||||||||||||||||
| Contractual | than | 1-3 | 3-5 | than | than | 1-3 | 3-5 | than | ||||||||||||||||||||||||||||||||
| Obligations | Total | 1 year | years | years | 5 years | Total | 1 year | years | years | 5 years | ||||||||||||||||||||||||||||||
| Long-term debt | - | - | - | - | - | - | - | - | - | - | ||||||||||||||||||||||||||||||
| Capital (finance) lease obligations | - | - | - | - | - | - | - | - | - | - | ||||||||||||||||||||||||||||||
| Operating lease obligations | $ | 338,428 | $ | 212,411 | $ | 126,017 | - | - | $ | 126,018 | $ | 75,611 | $ | 50,407 | - | - | ||||||||||||||||||||||||
| Purchase obligations | - | - | - | - | - | - | - | - | - | - | ||||||||||||||||||||||||||||||
| Other long-term liabilities | - | - | - | - | - | - | - | - | - | - | ||||||||||||||||||||||||||||||
| Total | $ | 338,428 | $ | 212,411 | $ | 126,017 | - | - | $ | 126,018 | $ | 75,611 | $ | 50,407 | - | - | ||||||||||||||||||||||||
G. Safe Harbor
Not applicable.
Item 6. Directors, Senior Management and Employees
A. Directors and Senior Management
The directors and officers of the Company, their ages and term of continuous service are as follows:
| Name | Age | Current Position(s)
| Served as a Director
| |||||
| Peter N. Cowley | 66 | President, Chief Executive Officer and a director | October 26, 2009 (director) November 1, 2009 (officer) | |||||
| Howard Fall | 58 | Exploration Manager | May 1, 2010 | |||||
| Arnold T. Kondrat | 61 | Executive Vice President and a director | August 24, 1993 (director) August 24, 1993 (officer) | |||||
| Donat K. Madilo | 52 | Chief Financial Officer | May 1998 | |||||
| Naomi Nemeth | 53 | Vice President, Investor Relations | September 1, 2012 | |||||
| Geoffrey G. Farr | 47 | General Counsel and Corporate Secretary | November 28, 2008 | |||||
| 71 | Director | March 31, 2011 | ||||||
| Richard J. Lachcik (1) (2) | ||||||||
| 56 | Director | June 29, 1998 | ||||||
| William R. Wilson(1) (2) | 71 | Director | July 15, 1997 |
| (1) | Member of the audit committee of the board of directors of the Company. |
| (2) | Member of the compensation committee of the board of directors of the |
Peter N. Cowley – Mr. Cowley is a geologist with 40 years international experience in the minerals industry, mainly in Africa. From June 2004 until September 2007, Mr. Cowley was Chief Executive Officer of Banro Corporation ("("Banro") and from June 2004 until March 2008 he was President of Banro, where he led the exploration program over Banro’s gold properties in the eastern DRC. He has a B.Sc. (Honours) degree in Geology from Bedford College (University of London), a M.Sc. in Mineral Exploration from the Royal School of Mines and a M.B.A. from the Strathclyde Business School. Mr Cowley is also a Fellow of the Institute of Materials, Minerals and Mining. From 1989 to 1996, Mr Cowley was Technical Director of Cluff Resources and during this period was directly responsible for the discovery and development of the Ayanfuri mine in Ghana and the Geita mine in Tanzania. In 1996, with the acquisition of Cluff Resources PLC by Ashanti Goldfields Company Limited, Mr. Cowley was appointed Managing Director of Ashanti Exploration, where he managed the exploration activities of Ashanti Goldfields Company Limited throughout Africa. He was Managing Director of Ashanti Exploration until the end of May 2004 when he joined Banro. Peter is currently a director of Amara Mining plc, Cluff Natural Resources plc and Banro.
Howard Fall - Dr. Fall is a professional geologist with more than 30 years of experience in various countries in Africa. Previous to his role with Loncor, he served as Exploration Manager for Banro, Corporation, AngloGold Ashanti and Gencor. Dr. Fall also led the exploration team which discovered the Ahafo and Akym gold deposits in Ghana, West Africa. He has a Ph.D. from Sheffield University in the UK.
Arnold T. Kondrat - Mr. Kondrat is the Company's principal founder and has over 25 years of management experience in the resource exploration industry. During this time he has been an officer and director of a number of publicly-traded resource exploration companies, in both Canada and the United States. Mr. Kondrat is the principal founder, and Executive Vice President and a director, of Banro (a gold mining company listed on the Toronto Stock Exchange and the NYSE MKT LLC with projects in the eastern DRC). He is also the principal founder, and Executive Vice President and a director, of Gentor Resources Inc. (a mineral exploration company listed on the TSX Venture Exchange), a consultant to and director of Delrand Resources Limited (a mineral exploration company listed on the Toronto Stock Exchange and the JSE) and President of Sterling Portfolio Securities Inc. (a private venture capital firm based in Toronto).
Donat K. Madilo – Mr. Madilo has over 2324 years of experience in accounting, administration and finance in the DRC and North America. He is Chief Financial Officer of each of Banro and Gentor Resources Inc. and Treasurer of Delrand Resources Limited. Mr. Madilo’s previous experience includes director of finance of Coocec-ceaz (a credit union chain in the DRC) and senior advisor at Conseil Permanent de la Comptabilité au Congo, the accounting regulation board in the DRC. He holds a Bachelor of Commerce (Honours) degree from Institut Supérieur de Commerce de Kinshasa, a B.Sc. (Licence) in Applied Economics from University of Kinshasa and a Masters of Science in Accounting (Honours) from Roosevelt University in Chicago.
Naomi Nemeth - Ms. Nemeth is a seasoned investor relations professional with more than 25 years' experience, the majority of which has been focused on the mining industry with companies such as Desert Sun Mining (acquired by Yamana Gold), Wolfden Resources (acquired by Zinifex), African Copper, Homeland Energy and Continental Gold. Ms. Nemeth began her career as a geologist working in the Yukon, Northwest Territories and Ontario and has an undergraduate degree in geology and biology from Brock University and a Master's degree in journalism from the University of Western Ontario.
Geoffrey G. Farr– From February 2011 to present, Mr. Farr has been Vice President, General Counsel of Banro, and General Counsel to each of Loncor, Gentor Resources Inc. and Delrand Resources Limited. He is also currently Corporate Secretary of each of Banro and Gentor Resources Inc., and Corporate Secretary and a director of Delrand Resources Limited. Prior to February 2011, Mr. Farr practised corporate and securities law in Toronto for 17 years, which included extensive experience in representing public companies. He holds a LL.B. from the University of Ottawa and a B.Comm. from Queen’s University.
Kevin R. Baker – Mr. Baker is President and Managing Director of Baycor Capital Inc., a private merchant bank based in Calgary, Alberta. Mr. Baker has over 37 years’ experience in the corporate securities industry and was a founder and director of a number of oil and gas, oilfield service, technology and real estate companies. Baycor Capital Inc. has or has had a number of investments in Canada and the United States in the oil and gas, oilfield service, technology and real estate businesses. Mr. Baker is or has been a director of a number of private and public companies in Canada and the United States. He holds a B.Arts Economics and a Bachelor of Laws from the University of Alberta. Mr. Baker is a member of the Law Society of Alberta, past President of the Calgary Bar Association and was appointed Queen's Counsel in 1993. He was Chief Executive Officer and President of the Company from September 2000 to November 2009.
Maurice J. Colson– Mr. Colson has worked in the investment industry for more than 36 years and was for many years managing director for a major Canadian investment dealer in the United Kingdom. He is actively involved in providing strategic counsel and assistance with financing to emerging private and public companies in Canada and to Canadian companies operating in China, Africa and South America. He sits onis a director, and a member of the board of directorsaudit committee, of several Toronto Stock Exchange and TSX Venture Exchange listed companies, and is the former President and Chief Executive Officer of the TSX Venture-listed company, Lithium One Resources. Mr. Colson holds a Masters of Business Administration degree.degree from McGill University in Montreal.
Richard J. Lachcik- Mr. Lachcik is a partner of the law firm Norton Rose Fulbright Canadallp, which acts as counsel to the Company. He has been practising corporate and securities law in Toronto, Canada for over 29 years. Mr. Lachcik has extensive experience in representing public companies and has also actsacted for a number of investment dealers. He has been an officer and director of a number of Canadian public resource companies.
William R. Wilson– Mr. Wilson is Director, Executive Vice President and Chief Financial Officer of ARNEVUT Resources, Inc., a private precious metals exploration company based in Colorado with properties in Nevada and Utah. He has created and managed 11 mining companies over 25 years with properties in the U.S., Canada, Russia, the DRC and Ukraine. Mr. Wilson is a member of the Mining and Metallurgical Society of America, the Canadian Institute of Mining and the Society of Mining, Metallurgy and Exploration. He has a degree in Metallurgical Engineering from the Colorado School of Mines and an MBAa Masters of Business Administration degree from the University of Southern California. Mr. Wilson has been involved in the mining industry for 35 years. He has been a director and senior officer of a number of public companies in both Canada and the United States, and has been a member of the audit committee of several of these companies.
There are no family relationships among any of the Company's directors or senior management.
There is no arrangement or understanding with major shareholders, customers, suppliers or others, pursuant to which any person referred to above was selected as a director or officer of the Company.
The following directorsof the Company are presently directors of other issuers that are public companies:
| Name of Director | Names of Other Issuers | |
| Maurice J. Colson | Lithium One Inc. | |
| Hornby Bay Mineral Exploration Ltd. | ||
| Alexis Minerals Corporation | ||
| Stetson Oil & Gas Ltd. | ||
| China Goldcorp Ltd. | ||
| Delrand Resources Limited | ||
| Sagittarius Capital Corporation | ||
| Sagres Energy Inc. |
| Name of Director | Names of Other Issuers | |
| Peter N. Cowley | Banro Corporation | |
| Amara Mining plc | ||
| Cluff Natural Resources plc | ||
| Arnold T. Kondrat | Banro Corporation | |
| Delrand Resources Limited | ||
| Gentor Resources Inc. | ||
| Richard J. Lachcik | Banro Corporation | |
| Cerro Grande Mining Corporation | ||
| William R. Wilson | Delrand Resources Limited |
Other than the board of directors, the Company does not have an administrative, supervisory or management body.
B. Compensation
Executive Officers
Summary Compensation Table
The following table sets forth certain information with respect to compensation paid to the executive officers of the Company for the financial year ended December 31, 2012.2013.
| Name and Principal Position | Year | Salary(1) ($) | Share-based awards ($) | Option-based awards(2) ($) | Non-equity incentive plan compensation - Annual Incentive Plan ($) | All other Compensation ($) | Total Compensation ($) | |||||||||||||||||||
| Peter N. Cowley(1) Chief Executive Officer and President | 2012 | $ | 350,425 | N/A | $ | 79,063 | Nil | $ | 40,437 | (3) | $ | 469,925 | ||||||||||||||
| Donat K. Madilo Chief Financial Officer | 2012 | $ | 100,080 | N/A | $ | 31,625 | Nil | $ | 8.340 | (4) | $ | 140,045 | ||||||||||||||
| Arnold T. Kondrat Executive Vice President | 2012 | $ | 132,106 | N/A | $ | 79,063 | Nil | $ | 11,009 | (4) | $ | 222,178 | ||||||||||||||
| Howard Fall Exploration Manager | 2012 | $ | 216,000 | N/A | $ | 39,532 | $ | 21,600 | $ | 27,543 | (5) | $ | 304,675 | |||||||||||||
| Geoffrey G. Farr General Counsel and Corporate Secretary | 2012 | $ | 99,977 | N/A | $ | 31,625 | Nil | $ | 8,331 | (4) | $ | 139,933 | ||||||||||||||
| Name and Principal Position | Year | Salary (1) (US$) | Share-based awards (US$) | Option-based awards (2) (US$) | Non-equity incentive plan compensation - Annual Incentive Plan (US$) | All other Compensation (US$) | Total Compensation (US$) | |||||||||||||||||||
Peter N. Cowley(1) Chief Executive Officer | 2013 | $ | 346,797 | N/A | N/A | Nil | $ | 36,390 | (3) | $ | 383,187 | |||||||||||||||
| Donat K. Madilo Chief Financial Officer | 2013 | $ | 97,110 | N/A | N/A | Nil | $ | 8,093 | (4) | $ | 105,203 | |||||||||||||||
| Arnold T. Kondrat Executive Vice President | 2013 | $ | 128,185 | N/A | N/A | Nil | $ | 10,682 | (4) | $ | 138,867 | |||||||||||||||
| Howard Fall Exploration Manager | 2013 | $ | 176,400 | N/A | N/A | Nil | $ | 22,856 | (5) | $ | 199,256 | |||||||||||||||
| Geoffrey G. Farr General Counsel and Corporate Secretary | 2013 | $ | 99,776 | N/A | N/A | Nil | $ | 8,315 | (4) | $ | 108,091 | |||||||||||||||
| (1) | The salary for Mr. Cowley is paid in United Kingdom pounds. The U.S. dollar amount set out in the above table for the salary of Mr. Cowley was calculated using an average exchange rate for |
| (2) |
| (3) | This amount represents life and medical insurance premiums paid by the Company and the accrued “Retention Allowance” (as such term is defined below). The breakdown of such items is as follows: life and medical insurance premiums: |
| (4) | These amounts represent the accrued Retention Allowance. |
| (5) | This amount represents life and medical insurance premiums paid by the Company and the accrued Retention Allowance. The breakdown of such items is as follows: life and medical insurance premiums: |
Loncor employees are entitled to receive a retention allowance (the "Retention Allowance") on termination of their employment with the Company, provided the employee has been with the Company for a minimum of two years and provided that termination is not due to misconduct (in the case of misconduct, the Retention Allowance is forfeited). The amount of the Retention Allowance is equal to the employee's monthly base salary multiplied by the number of years the employee was with the Company (up to a maximum of 10 years), with any partial year being recognized on a pro rata basis.
Incentive Plan Awards
The following table provides details regarding outstanding option and share-based awards held by the executive officers of the Company as at December 31, 2012:2013:
Outstanding share-based awards and option-based awards
| Option-based Awards | Share-based Awards | ||||||||||||||||||||||
| Name | Option grant date | Number of (#) | Option exercise price(2) ($) | Option expiration date | value of | Number of shares or units that have not vested (#) | Market or payout value of based awards that have not vested | ||||||||||||||||
| Peter N. Cowley | Dec. 12, 2012 | 250,000 | Cdn$1.05 (US$ | Dec. 12, 2017 | Nil | N/A | N/A | ||||||||||||||||
| Jan. 28, 2011 | 150,000 | Cdn$2.69 (US$ | Jan. 28, 2016 | Nil | |||||||||||||||||||
| Oct. 26, 2009 | 750,000 | Cdn$1.00 (US$ | Oct. 26, 2014 | Nil | |||||||||||||||||||
| Donat K. Madilo | Dec. 12, 2012 | 100,000 | Cdn$1.05 (US$ | Dec. 12, 2017 | Nil | N/A | N/A | ||||||||||||||||
| Jan. 28, 2011 | 50,000 | Cdn$2.69 (US$ | Jan. 28, 2016 | Nil | |||||||||||||||||||
| Mar. 11, 2010 | 50,000 | Cdn$1.25 (US$ | Mar. 11, 2015 | Nil | |||||||||||||||||||
| Sept. 30, 2009 | 100,000 | Cdn$1.20 (US$ | Sept. 30, 2014 | Nil | |||||||||||||||||||
Outstanding share-based awards and option-based awards
| Option-based Awards | Share-based Awards | |||||||||||||||||||
| Name | Option grant date | Number of securities underlying unexercised options(1) (#) | Option exercise price(2) ($) | Option expiration date | Aggregate value of unexercised in-the-money options(3) (US$) | Number of shares or units that have not vested (#) | Market or payout value of share- based awards that have not vested (US$) | |||||||||||||
| Arnold T. Kondrat | Dec. 12, 2012 | 250,000 | Cdn$1.05 (US$ | Dec. 12, 2017 | Nil | N/A | N/A | |||||||||||||
| Jan. 28, 2011 | 150,000 | Cdn$2.69 (US$ | Jan. 28, 2016 | Nil | ||||||||||||||||
| Sept. 30, 2009 | 300,000 | Cdn$1.20 (US$ | Sept. 30, 2014 | Nil | ||||||||||||||||
| Howard Fall | Dec. 12, 2012 | 125,000 | Cdn$1.05 (US$ | Dec. 12, 2017 | Nil | N/A | N/A | |||||||||||||
| Jan. 28, 2011 | 60,000 | Cdn$2.69 (US$ | Jan. 28, 2016 | Nil | ||||||||||||||||
| Mar. 11, 2010 | 120,000 | Cdn$1.25 (US$ | Mar. 11, 2015 | Nil | ||||||||||||||||
| Sept. 30, 2009 | 25,000 | Cdn$1.20 (US$ | Sept. 30, 2014 | Nil | ||||||||||||||||
| Geoffrey G. Farr | Dec. 12, 2012 | 100,000 | Cdn$1.05 (US$ | Dec. 12, 2017 | Nil | N/A | N/A | |||||||||||||
| Jan. 11, 2011 | 100,000 | Cdn$2.45 (US$ | Jan. 11, 2016 | Nil | ||||||||||||||||
| Mar. 11, 2010 | 50,000 | Cdn$1.25 (US$ | Mar. 11, 2015 | Nil | ||||||||||||||||
| Sept. 30, 2009 | 50,000 | Cdn$1.20 (US$ | Sept. 30, 2014 | Nil | ||||||||||||||||
| (1) | 1/4 of the stock options granted to each optionee vest on each of the 6 month, 12 month, 18 month and 24 month anniversaries of the grant date. |
| (2) | The exercise price of each of the stock options held by the officers is in Canadian dollars. The U.S. dollar figures set out in this column of the table were calculated using the noon exchange rate on December 31, |
| (3) | This is based on (a) the last closing sale price per share of the Company’s common shares as at December 31, |
The following table provides details regarding outstanding option-based awards, share-based awards and non-equity incentive plan compensation held by the executive officers of the Company, which vested and/or were earned during the year ended December 31, 2012:2013:
Incentive plan awards - value vested or earned during the year
| Name | Option-based awards - Value vested during the year (1) (US$) | Share-based awards - Value vested during the year (US$) | Non-equity incentive plan compensation – Value earned during the year (US$) | |||
| Peter N. Cowley | Nil | N/A | N/A | |||
| Donat K. Madilo | Nil | N/A | N/A | |||
| Arnold T. Kondrat | Nil | N/A | N/A |
| Name | Option-based awards - (US$) | Share-based awards - Value vested during the year ($) | Non-equity incentive plan compensation – Value earned during the year ($) | ||||
| Peter N. Cowley | Nil | N/A | N/A | ||||
| Donat K. Madilo | $ | 2,250 | N/A | N/A | |||
| Arnold T. Kondrat | Nil | N/A | N/A | ||||
| Howard Fall | $ | 5,400 | N/A | N/A | |||
| Geoffrey G. Farr | $ | 2,250 | N/A | N/A | |||
Incentive plan awards - value vested or earned during the year
| Name | Option-based awards - Value vested during the year (1) (US$) | Share-based awards - Value vested during the year ($) | Non-equity incentive plan compensation – Value earned during the year ($) | |||
| Howard Fall | Nil | N/A | N/A | |||
| Geoffrey G. Farr | Nil | N/A | N/A |
| (1) | Identifies the aggregate dollar value that would have been realized by the officer if the officer had exercised all options exercisable under the option-based award on the vesting date(s) thereof. |
Non-Executive Directors
The directors of the Company were not paid any fees by the Company during the financial year ended December 31, 20122013 for their services in their capacity as directors, other than as set out in the table below under "Director Summary Compensation Table". The Company's directors are entitled to receive stock option grants under the Company's Stock Option Plan, as recommended by the Compensation Committee and determined by the board of directors of the Company (the"Board"). The exercise price of such stock options is determined by the Board, but shall in no event be less than the last closing price of the Company’s common shares on the TSX VentureToronto Stock Exchange prior to the date the stock options are granted.
During the financial year ended December 31, 2012,2013, the Company incurred legal expenses (and related costs) of Cdn$227,63534,045.39 (or US$227,81733,058.07 based on an average exchange rate for 20122013 of Cdn$1.00 = US$1.0008)0.9711) to Norton Rose Fulbright Canadallp(which acts as legal counsel to the Company). Richard J. Lachcik, a director of the Company, is a partner of Norton Rose Fulbright Canadallp.
All directors receive reimbursement for reasonable out-of-pocket expenses related to their attendance at meetings or other expenses incurred for Company purposes.
Director Summary Compensation Table
The following compensation table sets out the compensation paid to each of the Company's directors in the year ended December 31, 2012,2013, other than Messrs. Cowley and Kondrat. See "Executive Officers - Summary Compensation Table" above for a details regarding the compensation paid to Messrs. Cowley and Kondrat in respect of services rendered during 2012.2013.
| Name | Fees earned ($) | Share-based awards ($) | Option-based awards(1) ($) | Non-equity incentive plan compensation ($) | All other Compensation ($) | Total ($) | ||||||||||||||||
| Kevin R. Baker | $ | 30,000 | N/A | $ | 15,813 | N/A | Nil | $ | 45,813 | |||||||||||||
| Maurice J. Colson | $ | 30,000 | N/A | $ | 15,813 | N/A | Nil | $ | 45,813 | |||||||||||||
| Richard J. Lachcik | $ | 30,000 | N/A | $ | 15,813 | N/A | Nil | (2) | $ | 45,813 | ||||||||||||
| Simon F.W. Village(3) | $ | 0 | N/A | $ | 15,813 | N/A | $ | 120,096 | (4) | $ | 135,909 | |||||||||||
| William R. Wilson | $ | 30,000 | N/A | $ | 15,813 | N/A | Nil | $ | 45,813 | |||||||||||||
| Name | Fees earned (US$) | Share-based awards (US$) | Option-based awards (2) (US$) | Non-equity incentive plan compensation (US$) | All other Compensation (US$) | Total (US$) | ||||||||||||||
| Kevin R. Baker(1) | $ | 14,974 | N/A | N/A | N/A | Nil | $ | 14,974 | ||||||||||||
| Maurice J. Colson | $ | 14,974 | N/A | N/A | N/A | Nil | $ | 14,974 | ||||||||||||
| Richard J. Lachcik | $ | 14,974 | N/A | N/A | N/A | Nil(3) | $ | 14,974 | ||||||||||||
| Simon F.W. Village(4) | Nil | N/A | N/A | N/A | $19,422 (5) | $ | 19,422 | |||||||||||||
| William R. Wilson | $ | 22,294 | N/A | N/A | N/A | Nil | $ | 22,294 | ||||||||||||
| (1) |
| (2) | No stock options were granted by the Company in 2013. |
| (3) | See the disclosure above under |
| Mr. Village resigned as a director of the Company |
| This amount represents consulting fees, which were paid in Canadian dollars. The U.S. dollar amount set out in the above table for such amount was calculated using an average exchange rate for |
Incentive Plan Awards
The following table provides details regarding the outstanding option and share based awards held as at December 31, 20122013 by the directors of the Company other than Messrs. Cowley and Kondrat. See "Executive Officers - Incentive Plan Awards" above for details regarding the outstanding stock options held by Messrs. Cowley and Kondrat as at December 31, 2012.2013.
Outstanding share-based awards and option-based awards
| Option-based Awards | Share-based Awards | ||||||||||||||||||||
| Name | Option grant date | Number of securities underlying unexercised options (1) (#) | Option exercise price(2) ($) | Option expiration date | in-the-money options(3) (US$) | units of | Market or payout value of share- based awards that have not vested | ||||||||||||||
| Kevin R. Baker | Dec. 12, 2012 | 50,000 | Cdn$1.05 (US$ | Dec. 12, 2017 | Nil | ||||||||||||||||
Outstanding share-based awards and option-based awards
| N/A | N/A | |||||||||||||||||||
| Jan. 28, 2011 | 50,000 | Cdn$2.69 (US$ | Jan. 28, 2016 | Nil | ||||||||||||||||
| Sept. 30, 2009 | 300,000 | Cdn$1.20 (US$1.13) | Sept. 30, 2014 | Nil | ||||||||||||||||
| Maurice J. Colson | Dec. 12, 2012 | 50,000 | Cdn$1.05 (US$0.99) | Dec. 12, 2017 | Nil | N/A | N/A | |||||||||||||
| April 6, 2011 | 50,000 | Cdn$2.69 (US$2.53) | April 6, 2016 | Nil | ||||||||||||||||
| Sept. 30, 2009 | 100,000 | Cdn$1.20 (US$1.13) | Sept. 30, 2014 | Nil | ||||||||||||||||
| Richard J. Lachcik | Dec. 12, 2012 | 50,000 | Cdn$1.05 (US$0.99) | Dec. 12, 2017 | Nil | N/A | N/A | |||||||||||||
| Jan. 28, 2011 | 50,000 | Cdn$2.69 (US$2.53) | Jan. 28, 2016 | Nil | ||||||||||||||||
| Sept. 30, 2009 | 50,000 | Cdn$1.20 (US$ | Sept. 30, 2014 | Nil | ||||||||||||||||
| William R. Wilson | Dec. 12, 2012 | 50,000 | Cdn$1.05 (US$ | Dec. 12, 2017 | Nil | N/A | N/A | |||||||||||||
| Jan. 28, 2011 | 50,000 | Cdn$2.69 (US$ | Jan. 28, 2016 | Nil | ||||||||||||||||
| Sept. 30, 2009 | 50,000 | Cdn$1.20 (US$ | Sept. 30, 2014 | Nil | ||||||||||||||||
| (1) | 1/4 of the stock options granted to each optionee vest on each of the 6 month, 12 month, 18 month and 24 month anniversaries of the grant date. |
| (2) | The exercise price of each of the stock options held by the directors is in Canadian dollars. The U.S. dollar figures set out in this column of the table were calculated using the noon exchange rate on December 31, |
| (3) | This is based on (a) the last closing sale price per share of the Company’s common shares as at December 31, |
The following table provides details regarding outstanding option-based awards, share-based awards and non-equity incentive plan compensation in respect of the directors of the Company other than Messrs. Cowley and Kondrat, which vested and/or were earned during the year ended December 31, 2012.2013. See "Executive Officers - Incentive Plan Awards" above for details regarding the outstanding option-based awards, share-based awards and non-equity incentive plan compensation in respect of Messrs. Cowley and Kondrat, which vested and/or were earned during the year ended December 31, 2012.2013.
Incentive plan awards - value vested or earned during the year
| Name | Option-based awards - Value vested during the year(1) (US$) | Share-based awards vested during the year | Non-equity incentive plan compensation – Value earned during the year | |||
| Kevin R. Baker | Nil | N/A | N/A | |||
| Maurice J. Colson | Nil | N/A | N/A |
Incentive plan awards - value vested or earned during the year
| Richard J. Lachcik | ||||||
| Nil | N/A | N/A | ||||
| William R. Wilson | Nil | N/A | N/A |
| (1) | Identifies the aggregate dollar value that would have been realized by the director if the director had exercised all options exercisable under the option-based award on the vesting date(s) thereof. |
Other Information
The Company maintains directors' and officers' liability insurance for the benefit of directors and officers of the Company carrying coverage in the amount of Cdn$5,000,0001,000,000 as an aggregate limit of liability in each policy year. The total annual premium payable by the Company for the policy is Cdn$14,58019,500 and there is no deductible.
Neither the Company nor its subsidiaries provides pension, retirement or similar benefits.
C. Board Practices
Each director of the Company holds office until the close of the next annual meeting of shareholders of the Company following his election or appointment, unless his office is earlier vacated in accordance with the by-law of the Company. See Item 6.A. of this Form 20-F for the dates the directors of the Company were first elected or appointed to the Company's board of directors.
Employment Contracts with Executive Officers – Termination Benefits
There is no contract, agreement, plan or arrangement that provides for payments to an executive officer of the Company at, following or in connection with any termination (whether voluntary, involuntary or constructive), resignation, retirement, a change in control of the Corporation or a change in an executive officer's responsibilities, other than the Retention Allowance discussed above and other than as set out below. However, the board of directors of the Company (the "Board") may, in its sole discretion, accelerate the vesting of currently outstanding stock options granted under the Company’s Stock Option Plan in the event a take-over bid is made for the common shares of the Company, any change of control of the Company occurs or any other transaction involving the Company occurs (see "Executive Officers - Incentive Plan Awards" under Item 6.B. of this Form 20-F with respect to the stock options of the Company held by the executive officers of the Company; see also "Incentive Stock Option Plan" under Item 6.E. of this Form 20-F regarding the terms of the Company’s Stock Option Plan).
The Company and Mr. Cowley have entered into an employment contract (the "Cowley Agreement") which sets out the terms upon which Mr. Cowley performs the services of Chief Executive Officer and President of the Company. Under the Cowley Agreement, Mr. Cowley is currently paid an annual salary of 200,000 United Kingdom pounds, and the Company may, in the sole discretion of the Board, pay to Mr. Cowley a bonus in respect of each financial year of the Company during which Mr. Cowley's employment subsists. The term of the Cowley Agreement expiresexpired on November 1, 2012, but may be renewed for a further period by agreement between the Company and Mr. Cowley (in 2011, the expiry of the term of the Cowley Agreement was extended from November 1, 2011 to November 1, 2012). The Company may terminate the Cowley Agreement at any time for cause (as specified in the Cowley Agreement) without notice and without any payment in lieu of notice.Cowley. The Cowley Agreement further provides as follows:that: (a) in the event of a "change of control" (as such term is defined in the Cowley Agreement) of the Company, Mr. Cowley has the right to terminate the Cowley Agreement and is entitled to be paid by the Company an amount equal to two times his annual salary; and (b) if immediately prior to such termination Mr. Cowley holds stock options of the Company, Mr. Cowley shall, subject to any restrictions imposed by or resulting from any applicable law or stock exchange rule or policy, be entitled to exercise all such stock options (vested and unvested) at any time during the period of time commencing upon such termination and ending on the expiry date of such stock options. The Cowley Agreement also provides as follows: (i) upon the occurrence of the "constructive dismissal" (as such term is defined in the Cowley Agreement) of Mr. Cowley, Mr. Cowley has the right to terminate the Cowley Agreement; (ii) Mr. Cowley may also terminate the Cowley Agreement upon the breach by the Company of any of the covenants of the Cowley Agreement if any such breach is not rectified by the Company within 30 days after written notice of such breach has been given to the Company; and (iii) upon termination pursuant to items (i) or (ii), Mr. Cowley is entitled to be paid by the Company the salary that would otherwise have been payable to Mr. Cowley over the balance of the term of the Cowley Agreement had Mr. Cowley not terminated the Cowley Agreement.
Audit Committee
The board of directors of the CompanyBoard has an audit committee (the "Audit Committee"), the members of which are Kevin R. Baker, Maurice J. Colson, Richard J. Lachcik and William R. Wilson. Each of Mr. Colson and Mr. Wilson is independent within the meaning of Canadian National Instrument 52-110 - Audit Committees ("NI 52-110") and Section 803A of the NYSE MKT Company Guide. Mr. Lachcik is not "independent" within the meaning of NI 52-110 or Section 803A of the NYSE MKT Company Guide, as he is a partner of Norton Rose Fulbright Canadallp which acts as legal counsel to the Company. The Company is currently relying on the exemption in section 3.5 of NI 52-110 (Death, Disability or Resignation of Member). At no time since the commencement of the Company's financial year ended December 31, 2013 was a recommendation of the Audit Committee to nominate or compensate an external auditor not adopted by the Board. Each member of the Audit Committee is independent"financially literate" within the meaning of both the applicable Canadian and U.S. requirements.NI 52-110. The Audit Committee's charter isincorporated by reference into thisForm 20-Fas Exhibit 1.3.1.3.
Compensation Committee
The board of directors of the Company (the "Board") has a compensation committee, the members of which are Kevin R. Baker, Maurice J. Colson, Richard J. Lachcik and William R. Wilson. Each memberSee the discussion above under "Audit Committee" with respect to the independence or, as applicable, non-independence of the members of the compensation committee is independent for the purposes of the applicable Canadian and U.S. rules.committee. The primary function of the compensation committee is to assist the Board in fulfilling its oversight responsibilities with respect to: (a) human resources policies; and (b) executive compensation. To carry out its oversight responsibilities, the compensation committee's duties include the following:
| 1. | review and recommend for approval to the Board, the Company's key human resources policies; |
| 2. | review and recommend for approval to the Board the compensation and benefits policy and plans (including incentive compensation plans) for the Company; |
| 3. | review and recommend to the Board the employment agreements of the Company's executive officers; |
| 4. |
| 5. |
| 6. | review annually and recommend to the Board the annual salaries (or percentage change in salaries) for the Company's non-executive staff; |
| 7. | review annually and recommend to the Board the adequacy and form of the compensation of the Company's directors and be satisfied the compensation realistically reflects the responsibilities and risk involved in being such a director; |
| 8. | review annually and recommend for approval to the Board the executive compensation disclosure of the Company in its information circular, and be satisfied that the overall compensation philosophy and policy for senior officers is adequately disclosed and describes in sufficient detail the rationale for salary levels, incentive payments, share options and all other components of executive compensation as prescribed by applicable securities laws; |
| 9. | determine grants of options to purchase shares of the Company under the Company's Stock Option Plan and recommend same to the Board for approval; |
| 10. | engage, at the Company's expense, any external professional or other advisors which it determines necessary in order to carry out its duties hereunder; and |
| 11. | perform any other activities consistent with this mandate as the compensation committee or the Board deems necessary or appropriate. |
D. Employees
The following sets out the number of employees which the Company and its subsidiaries had as at December 31, 2012,2013, December 31, 20112012 and December 31, 2010,2011, providing a breakdown of these employees by location:
| Location | Dec. 31, 2012 | Dec. 31, 2011 | Dec. 31, 2010 | Dec. 31, 2013 | Dec. 31, 2012 | Dec. 31, 2011 | ||||||||||||||||||
| Loncor office in Toronto, Canada | 7 | 7 | 3 | 7 | 7 | 7 | ||||||||||||||||||
| Loncor office in Beni, DRC | 18 | 31 | 20 | 6 | 18 | 31 | ||||||||||||||||||
| Loncor office in Kinshasa, DRC | 6 | 5 | 4 | 4 | 6 | 5 | ||||||||||||||||||
| Ngayu project | 64 | 53 | 31 | 23 | 64 | 53 | ||||||||||||||||||
| North Kivu project | - | 11 | 7 | - | - | 11 | ||||||||||||||||||
| Totals: | 95 | 107 | 65 | 40 | 95 | 107 | ||||||||||||||||||
Neither the Company nor any of its subsidiaries has any unionized employees.
Neither the Company nor any of its subsidiaries employ a significant number of temporary employees.
E. Share Ownership
The following table sets out the number of common shares of the Company held by the Company's directors and executive officers as of March 22, 201325, 2014 (including the percentage of the Company's outstanding common shares represented by such shares).See Item 6.B. of this Form 20-F for information regarding the stock options of the Company held by the Company's directors and executive officers as of March 22, 2013.officers.
| Name | Number of Common Shares Owned | Percentage of Outstanding Common Shares | Number of Common Shares Owned | Percentage of Outstanding Common Shares | ||||||||||||
| Kevin R. Baker | 7,164,331 | 9.76 | % | |||||||||||||
| Maurice J. Colson | Nil | Nil | Nil | Nil | ||||||||||||
| Peter N. Cowley | 120,000 | 0.16 | % | 120,000 | 0.16 | % | ||||||||||
| Howard Fall | Nil | Nil | Nil | Nil | ||||||||||||
| Geoffrey G. Farr | 105,000 | 0.14 | % | 105,000 | 0.14 | % | ||||||||||
| Arnold T. Kondrat | 10,208,418 | 13.90 | % | 10,300,818 | 14.03 | % | ||||||||||
| Richard J. Lachcik | 11,666 | 0.02 | % | 11,666 | 0.02 | % | ||||||||||
| Donat K. Madilo | 100,000 | 0.14 | % | 100,000 | 0.14 | % | ||||||||||
| Naomi Nemeth | Nil | Nil | Nil | Nil | ||||||||||||
| William R. Wilson | 3,333 | 0.01 | % | 3,333 | 0.01 | % | ||||||||||
Incentive Stock Option Plan
The Company has a Stock Option Plan (the "Option Plan"), the principal purposes of which are: (A) to retain and attract qualified directors, officers, employees and consultants which the Company and its subsidiaries require; (B) to promote a proprietary interest in the Company and its subsidiaries; (C) to provide an incentive element in compensation; and (D) to promote the development of the Company and its subsidiaries. The following summarizes the terms of the Option Plan:
| (a) | Stock options may be granted from time to time by the Board to such directors, officers, employees and consultants of the Company or a subsidiary of the Company, and in such numbers, as are determined by the Board at the time of the granting of the stock options. |
| (b) | The number of common shares of the Company reserved from time to time for issuance to optionees pursuant to stock options granted under the |
| (c) | The exercise price of each stock option shall be determined in the discretion of the Board at the time of the granting of the stock option, provided that the exercise price shall not be lower than the "Market Price". "Market Price" means the last closing price of the common shares of the Company on the |
| (d) |
| (e) | The total number of common shares of the Company issuable to "insiders" (as such term is defined under the Ontario Securities Act) of the Company, at any time, under all "security based compensation arrangements" (within the meaning of the rules of the Toronto Stock Exchange) of the Company shall not exceed 10% of the total number of outstanding common shares of the Company. |
| (f) | All stock options shall be for a term determined in the discretion of the Board at the time of the granting of thestock options, provided that no stock option shall have a term exceeding five years and, unless the Board at any time makes a specific determination otherwise (but subject to the terms of the |
| Unless otherwise determined by the Board at the time of the granting of the stock options, one-quarter of the stock optionsgranted to an optionee vest on each of the 6 month, 12 month, 18 month and 24 month anniversaries of the grant date. |
| Except in limitedcircumstancesin the case of the death of an optionee, stock options shall not be assignable or transferable. |
| Disinterested shareholder approval is required prior to any reduction in the exercise price of a stock option if the optionee holding such stock option is an insider of the Company. |
| The Company may amend from time to time the terms and conditions of the |
| The Board has full and final discretion to interpret the provisions of the |
| The |
The Board may, in its sole discretion, accelerate the vesting of currently outstanding stock options granted under the Option Plan in the event a take-over bid is made for the common shares of the Company, any change of control of the Company occurs or any other transaction involving the Company occurs.
A copy of the Option Plan isincorporated by reference into thisForm 20-Fas Exhibit 4.1.4.1.
Item 7. Major Shareholders and Related Party Transactions
A. Major Shareholders
To thethe knowledge of management of the Company, based on a review of publicly available filings, the following are the only persons or companies who beneficially own 5% or more of the outstanding common shares of the Company.
| Name of Shareholder | Number of Common Shares Owned(1) | Percentage of Outstanding Common Shares | ||||||
| Newmont Canada FN Holdings ULC(2) | 14,550,000 | 19.81 | % | |||||
| Arnold T. Kondrat(3) | 10,208,418 | 13.90 | % | |||||
| Kevin R. Baker(4) | 7,164,331 | 9.76 | % | |||||
| JPMorgan Chase & Co.(5) | 5,146,300 | 7.01 | % | |||||
| RBC Global Asset Management Inc.(6) | 4,527,838 | 6.17 | % | |||||
| Name of Shareholder | Number of Common Shares Owned (1) | Percentage of Outstanding Common Shares | ||||||
| Newmont Canada FN Holdings ULC (2) | 14,550,000 | 19.81 | % | |||||
| Arnold T. Kondrat (3) | 10,300,818 | 14.03 | % | |||||
| Geologic Resource Partners LLC | 6,474,562 | 8.82 | % | |||||
| Kevin R. Baker (4) | 6,164,331 | 8.39 | % | |||||
| JPMorgan Chase & Co. (5) | 5,111,081 | 6.96 | % | |||||
| RBC Global Asset Management Inc. (6) | 4,526,738 | 6.16 | % | |||||
| (1) | The information in this column of the table is as at March |
| (2) | See Item 4A. of this Form 20-F ("History and Development of the Company") which sets out the transactions pursuant to which Newmont Canada FN Holdings ULC acquired the common shares of the Company currently held by it as reflected in the above table. |
| (3) | Mr. Kondrat is Executive Vice President and a director of the Company. As at March 22, 2013, Mr. Kondrat held 10,208,418 (or 13.90%) of the outstanding common shares of the Company. As at March 23, 2012, Mr. Kondrat held 9,446,018 (or 15.92%) of the outstanding common shares of the Company. |
| (4) | Mr. Baker |
| (5) | Based on publicly available filings, it appears that JPMorgan Chase & Co. first became the beneficial owner of 5% or more of the outstanding common shares of the Company during 2012. As at December 31, 2012, JPMorgan Chase & Co. held 5,146,300 (or 7.01%) of the outstanding common shares of the Company. |
| (6) | Based on publicly available filings, it appears that RBC Global Asset Management Inc. first became the beneficial owner of 5% or more of the outstanding common shares of the Company during 2011. As at December 31, 2011, RBC Global Asset Management Inc. held 5,404,938 (or 9.11%) of the outstanding common shares of the Company. As at December 31, 2012, RBC Global Asset Management Inc. held 4,527,838 (or 6.17%) of the outstanding common shares of the Company. |
None of the shareholders disclosed above have any voting rights with respect to their respective common shares of the Company that are different from any other holder of common shares of the Company.
As of March 22, 2013,20, 2014, based on the Company’s shareholders’ register, there were 83 shareholders of record of the Company’s common shares in the United States, holding 8.5% of the outstanding common shares of the Company.
Control by Foreign Government or Other Persons
To the best of the knowledge of management of the Company, the Company is not directly or indirectly owned or controlled by another corporation, any foreign government, or any other natural or legal person, severally or jointly.
Change of Control
As of the date of this Form 20-F, there are no arrangements known to the Company which may at a subsequent date result in a change in control of the Company.
B. Related Party Transactions
In February 2011, the Company completed concurrent brokered and non-brokered private placement equity financings. Pursuant to the brokered private placement financing, the Company issued a total of 8,500,000 common shares at a price of Cdn$2.35 per share, resulting in total gross proceeds of Cdn$19,975,000. Pursuant to the non-brokered private placement financing, the Company issued to Newmont 1,700,000 common shares of the Company at a price of Cdn$2.35 per share for total gross proceeds of Cdn$3,995,000.
In February 2011, the Company and Newmont entered into a technology consultation services agreement pursuant to which Newmont agreed to make available to Loncor, at Loncor’s reasonable request, exploration consultation services to assist Loncor in the exploration of Loncor's Ngayu gold project in the DRC. The scope of such services provided from time to time and the compensation for such services are to be set out in a work order agreed to and executed by both parties from time to time.
In October 2012, the Company completed two financings concurrently, raising total gross proceeds of Cdn$14,799,750. The first financing was conducted by a syndicate of investment dealers and involved the issuance of 9,245,000 common shares of the Company at a price of Cdn$1.05 per share for aggregate gross proceeds of Cdn$9,707,250. The second financing involved a non-brokered private placement to Newmont of 4,850,000 common shares of the Company at a price of Cdn$1.05 per share for aggregate gross proceeds of Cdn$5,092,500.
Newmont is currently the Company’s largest shareholder, holding 14,550,000, or 19.81%, of the outstanding common shares of the Company.
C. Interests of Experts and Counsel
This Form 20-F is being filed as an annual report under the U.S. Exchange Act and, as such, there is no requirement to provide any information under this item.
Item 8. Financial Information
A. Consolidated Statements and Other Financial Information
Consolidated Financial Statements
The consolidated financial statements of the Companyare filed as part of this annual report under Item 18.
Legal or Arbitration Proceedings
The Company is not aware of any current or pending material legal or arbitration proceeding to which it is or is likely to be a party or of which any of its properties are or are likely to be the subject.
The Company is not aware of any material proceeding in which any director, member of senior management or affiliate of the Company is either a party adverse to the Company or any of its subsidiaries or has a material interest adverse to the Company or any of its subsidiaries.
Dividend Policy
The Company has not paid any dividend or made any other distribution in respect of its outstanding shares and management does not anticipate that the Company will pay dividends or make any other distribution in respect on its shares in the foreseeable future. The Company's Board, from time to time, and on the basis of any earnings and the Company's financial requirements or any other relevant factor, will determine the future dividend or distribution policy of the Company with respect to its shares.
B. Significant Changes
There have been no significant changes in the affairs of the Company since the date of the audited annual consolidated financial statements of the Company as at and for the year ended December 31, 2012,2013, other than as discussed in thisForm 20-F.20-F.
Item 9. The Offer and Listing
A. Offer and Listing Details
The Company's common shares are listed for trading on the Toronto Stock Exchange (the "TSX Venture Exchange") under the symbol "LN" and on the NYSE MKT LLC under the symbol "LON".
The Company's common shares commenced trading on the TSX on April 26, 2013. Prior to April 26, 2013, such shares traded on the TSX Venture Exchange ("TSX-V"(the "TSX-V").
Toronto Stock Exchange/TSX Venture Exchange
The following table discloses the annual high and low sales prices in Canadian dollars for the common shares of the Company for the five most recent financial years of the Company as traded on the TSX-V.TSX and TSX-V, as applicable.
On November 28, 2008, the Company completed the acquisition of all of the outstanding shares ofOld Loncor and, as result of this acquisition, commenced its current business. Prior to this acquisition, the Company was named Nevada Bob’s International Inc., traded under the symbol"NBI.U"and was in the business of licensing the right to use certain trademarks. The following table includes trading information prior toNovember 28, 2008, which information therefore relates toNevada Bob’s International Inc.
| Year | High (Cdn$) | Low (Cdn$) | ||||||
| 2013 | $ | 0.82 | $ | 0.10 | ||||
| 2012 | $ | 1.91 | $ | 0.69 | ||||
| 2011 | $ | 3.75 | $ | 1.18 | ||||
| 2010 | $ | 2.18 | $ | 0.65 | ||||
| 2009 | $ | 1.60 | $ | 0.15 | ||||
The following table discloses the high and low sales prices in Canadian dollars for the common shares of the Company for each quarterly period within the two most recent financial years of the Company as traded on the TSX-V:TSX and TSX-V, as applicable:
| Quarter Ended | High (Cdn$) | Low (Cdn$) | High (Cdn$) | Low (Cdn$) | ||||||||||||
| December 31, 2013 | $ | 0.25 | $ | 0.10 | ||||||||||||
| September 30, 2013 | $ | 0.22 | $ | 0.14 | ||||||||||||
| June 30, 2013 | $ | 0.46 | $ | 0.17 | ||||||||||||
| March 31, 2013 | $ | 0.82 | $ | 0.355 | ||||||||||||
| December 31, 2012 | $ | 1.13 | $ | 0.69 | $ | 1.13 | $ | 0.69 | ||||||||
| September 30, 2012 | $ | 1.25 | $ | 0.95 | $ | 1.25 | $ | 0.95 | ||||||||
| June 30, 2012 | $ | 1.42 | $ | 0.99 | $ | 1.42 | $ | 0.99 | ||||||||
| March 31, 2012 | $ | 1.91 | $ | 1.31 | $ | 1.91 | $ | 1.31 | ||||||||
| December 31, 2011 | $ | 1.99 | $ | 1.18 | ||||||||||||
| September 30, 2011 | $ | 3.20 | $ | 1.80 | ||||||||||||
| June 30, 2011 | $ | 3.37 | $ | 2.30 | ||||||||||||
| March 31, 2011 | $ | 3.75 | $ | 2.10 | ||||||||||||
The following table discloses the monthly high and low sales prices in Canadian dollars for the common shares of the Company for the most recent six months as traded on the TSX-V:TSX:
| Month | High (Cdn$) | Low (Cdn$) | ||||||
| March 2013 (to March 22) | $ | 0.55 | $ | 0.355 | ||||
| February 2013 | $ | 0.68 | $ | 0.55 | ||||
| January 2013 | $ | 0.82 | $ | 0.65 | ||||
| December 2012 | $ | 0.90 | $ | 0.69 | ||||
| November 2012 | $ | 1.00 | $ | 0.86 | ||||
| October 2012 | $ | 1.13 | $ | 0.96 | ||||
| September 2012 | $ | 1.25 | $ | 1.02 | ||||
| Month | High (Cdn$) | Low (Cdn$) | ||||||
| March 2014 (to March 25) | $ | 0.265 | $ | 0.14 | ||||
| February 2014 | $ | 0.27 | $ | 0.145 | ||||
| January 2014 | $ | 0.17 | $ | 0.11 | ||||
| December 2013 | $ | 0.14 | $ | 0.10 | ||||
| November 2013 | $ | 0.20 | $ | 0.125 | ||||
| October 2013 | $ | 0.25 | $ | 0.15 | ||||
| September 2013 | $ | 0.20 | $ | 0.155 | ||||
NYSE MKT LLC (the "NYSE MKT")
The following table discloses the annual high and low sales prices in United States dollars for the common shares of the Company for the twothree most recent financial yearyears of the Company as traded on the NYSE MKT. The Company's common shares commenced trading on the NYSE MKT on April 27, 2011.
| Year | High (US$) | Low (US$) | ||||||
| 2012 | $ | 1.99 | $ | 0.68 | ||||
| 2011 | $ | 3.82 | $ | 0.93 | ||||
| Year | High (US$) | Low (US$) | ||||||
| 2013 | $ | 0.87 | $ | 0.08 | ||||
| 2012 | $ | 1.99 | $ | 0.68 | ||||
| 2011 | $ | 3.82 | $ | 0.93 | ||||
The following table discloses the high and low sales prices in United States dollars for the common shares of the Company for each quarterly period within the two most recent financial years of the Company as traded on the NYSE MKT. The Company's common shares commenced trading on the NYSE MKT on April 27, 2011.
| Quarter Ended | High (US$) | Low (US$) | High (US$) | Low (US$) | ||||||||||||
| December 31, 2013 | $ | 0.24 | $ | 0.08 | ||||||||||||
| September 30, 2013 | $ | 0.37 | $ | 0.10 | �� | |||||||||||
| June 30, 2013 | $ | 0.44 | $ | 0.17 | ||||||||||||
| March 31, 2013 | $ | 0.87 | $ | 0.43 | ||||||||||||
| December 31, 2012 | $ | 1.16 | $ | 0.68 | $ | 1.16 | $ | 0.68 | ||||||||
| September 30, 2012 | $ | 1.45 | $ | 0.73 | $ | 1.45 | $ | 0.73 | ||||||||
| June 30, 2012 | $ | 1.50 | $ | 0.74 | $ | 1.50 | $ | 0.74 | ||||||||
| March 31, 2012 | $ | 1.99 | $ | 1.34 | $ | 1.99 | $ | 1.34 | ||||||||
| December 31, 2011 | $ | 1.95 | $ | 0.93 | ||||||||||||
| September 30, 2011 | $ | 3.65 | $ | 1.78 | ||||||||||||
| June 30, 2011 | $ | 3.52 | $ | 2.37 | ||||||||||||
The following table discloses the monthly high and low sales prices in United States dollars for the common shares of the Company for the most recent six months as traded on the NYSE MKT:
| Month | High (US$) | Low (US$) | ||||||
| March 2013 (to March 22) | $ | 0.55 | $ | 0.43 | ||||
| February 2013 | $ | 0.68 | $ | 0.55 | ||||
| January 2013 | $ | 0.87 | $ | 0.69 | ||||
| December 2012 | $ | 0.91 | $ | 0.68 | ||||
| November 2012 | $ | 0.99 | $ | 0.85 | ||||
| October 2012 | $ | 1.16 | $ | 0.97 | ||||
| September 2012 | $ | 1.45 | $ | 1.08 | ||||
| Month | High (US$) | Low (US$) | ||||||
| March 2014 (to March 25) | $ | 0.27 | $ | 0.13 | ||||
| February 2014 | $ | 0.27 | $ | 0.13 | ||||
| January 2014 | $ | 0.18 | $ | 0.09 | ||||
| December 2013 | $ | 0.14 | $ | 0.08 | ||||
| November 2013 | $ | 0.23 | $ | 0.13 | ||||
| October 2013 | $ | 0.24 | $ | 0.14 | ||||
| September 2013 | $ | 0.22 | $ | 0.14 | ||||
B. Plan of Distribution
This Form 20-F is being filed as an annual report under the U.S. Exchange Act and, as such, there is no requirement to provide any information under this item.
C. Markets
The Company's outstanding common shares are listed on both the TSX-VTSX and the NYSE MKT.
The Company received a notification from the NYSE MKT in March 2014 that it is no longer in compliance with certain NYSE MKT listing standards (reference is made to the Company’s press release dated March 10, 2014). The Company has until April 2, 2014 to submit a plan to regain compliance. If a plan is submitted, there is no guarantee that the plan will be accepted or if the Company will be able to comply with the plan and regain compliance. If the plan is accepted and the Company is not in compliance with the continued listing standards at the end of the plan period or the Company does not make progress consistent with the plan during the period, then the NYSE MKT may initiate delisting proceedings.
D. Selling Shareholder
This Form 20-F is being filed as an annual report under the U.S. Exchange Act and, as such, there is no requirement to provide any information under this item.
E. Dilution
This Form 20-F is being filed as an annual report under the U.S. Exchange Act and, as such, there is no requirement to provide any information under this item.
F. Expenses of the Issue
This Form 20-F is being filed as an annual report under the U.S. Exchange Act and, as such, there is no requirement to provide any information under this item.
Item 10. Additional Information
A. Share Capital
This Form 20-F is being filed as an annual report under the U.S. Exchange Act and, as such, there is no requirement to provide any information under this item.
B. Memorandum and Articles of Association
A copy of the Company's articles of amalgamation isincorporated by reference into thisForm 20-Fas Exhibit 1.1.The Company's general by-law isincorporated by reference into thisForm 20-Fas Exhibit 1.2.
The Company is a corporation governed by the OntarioBusiness Corporations Act (the "OBCA"). Under the OBCA, the articles of the Company may, by "special resolution" (see below for definition), be amended to add, change or remove any rights, privileges, restrictions and conditions, including rights to accrued dividends, in respect of all or any of its shares, whether issued or unissued. Under the OBCA, "special resolution" means a resolution passed by a majority of not less than two-thirds of the votes cast by the shareholders who voted in respect of that resolution or signed by all the shareholders entitled to vote on that resolution.
The Company’s articles provide that there are no restrictions on the business the Company may carry on and there are no restrictions on the powers the Company may exercise.
The Company's authorized share capital consists of an unlimited number of common shares and an unlimited number of preference shares, issuable in series, of which 73,439,732 common shares and no preference shares were issued and outstanding as of March 22, 2013.25, 2014. The following is a summary of the material provisions attaching to the common shares and preference shares.
Common Shares - The holders of the common shares are entitled to receive notice of and to attend all meetings of the shareholders of the Company and shall have one vote for each common share held at all meetings of the shareholders of the Company, except for meetings at which only holders of another specified class or series of shares are entitled to vote separately as a class or series. Subject to the prior rights of the holders of the preference shares or any other shares ranking senior to the common shares, the holders of the common shares are entitled to (a) receive any dividends as and when declared by the Board, out of the assets of the Company properly applicable to the payment of dividends, in such amount and in such form as the board of directors may from time to time determine, and (b) receive the remaining property of the Company in the event of any liquidation, dissolution or winding-up of the Company.
Preference Shares - The Board may issue the preferences shares at any time and from time to time in one or more series, each series of which shall have the designations, rights, privileges, restrictions and conditions fixed by the directors. The preference shares of each series shall rank on a parity with the preference shares of every other series, and shall be entitled to priority over the common shares and any other shares of the Company ranking junior to the preference shares, with respect to priority in the payment of dividends and the return of capital and the distribution of assets of the Company in the event of the liquidation, dissolution or winding-up of the Company.
Under the Company's general by-law, a director of the Company who is a party to, or who is a director or officer of a party to, or has a material interest in any person who is a party to, a material contract or material transaction or proposed material contract or proposed material transaction with the Company, must disclose the nature and extent of their interest at the time and in the manner provided by the OBCA and such material interest must be entered in the minutes of the meetings of directors or otherwise noted in the records of the Company. Any such material contract or material transaction or proposed material contract or proposed material transaction must be referred to the Board or shareholders for approval even if such contract is one that in the ordinary course of the Company's business would not require approval by the Board or shareholders. Such a director must not vote on any resolution to approve the same except as provided by the OBCA.
Also under the Company's general by-law, the Company's directors may be paid such remuneration for their services as the Board may from time to time determine. The directors are also entitled to be reimbursed for travelling and other expenses properly incurred by them in attending meetings of the Board or any committee thereof.
With respect to borrowing powers, the Company's general by-law provides that, without limiting the borrowing powers of the Company as set forth in the OBCA, the Board may from time to time on behalf of the Company, without authorization of the shareholders:
| (a) | borrow money upon the credit of the Company; |
| (b) | issue, reissue, sell or pledge debt obligations of the Company; |
| (c) | subject to the OBCA, give a guarantee on behalf of the Company to secure performance of an obligation to any person; and |
| (d) | mortgage, hypothecate, pledge, or otherwise create a security interest in all or any property of the Company, owned or subsequently owned, to secure any obligation of the Company. |
A director of the Company need not be a shareholder of the Company. There is no age limit requirement for a director of the Company.
The annual meeting of shareholders of the Company is held at such time in each year (but not later than 15 months after holding the last preceding annual meeting of shareholders) and at such place as the Board may from time to time determine. The Board has the power to call a special meeting of shareholders of the Company at any time.
The only persons entitled to be present at a meeting of shareholders are those entitled to vote thereat, the directors and auditor of the Company and others who, although not entitled to vote, are entitled or required under any provision of the OBCA or the articles or by-laws to be present at the meeting. Any other person may be admitted only on the invitation of the chairperson of the meeting or with the consent of the meeting.
A quorum for the transaction of business at any meeting of shareholders is two persons present in person, each being a shareholder entitled to vote thereat or a duly appointed proxyholder or representative for a shareholder so entitled.
Disclosure of Share Ownership
In general, under applicable securities regulation in Canada, a person or company who beneficially owns, directly or indirectly, voting securities of an issuer or who exercises control or direction over voting securities of an issuer or a combination of both, carrying more than 10% of the voting rights attached to all the issuer's outstanding voting securities is an insider and must, within 10 days of becoming an insider, file a report in the required form effective the date on which the person became an insider. The report must disclose any direct or indirect beneficial ownership of, or control or direction over, securities of the reporting issuer. Additionally, securities regulation in Canada provides for the filing of a report by an insider of a reporting issuer whose holdings change, which report must be filed within five days from the day on which the change takes place.
The rules in the U.S. governing the ownership threshold above which shareholder ownership must be disclosed are more stringent than those discussed above. Section 13 of the U.S. Exchange Act imposes reporting requirements on persons who acquire beneficial ownership (as such term is defined in Rule 13d-3 under the U.S. Exchange Act) of more than 5% of a class of an equity security registered under Section 12 of the U.S. Exchange Act. In general, such persons must file, within 10 days after such acquisition, a report of beneficial ownership with the SEC containing the information prescribed by the regulations under Section 13 of the U.S. Exchange Act. This information is also required to be sent to the issuer of the securities and to each exchange where the securities are traded.
C. Material Contracts
Except for contracts entered into in the ordinary course of business and other than as disclosed elsewhere in this Form 20-F, there are no material contracts to which the Company is currently a party that were entered into by the Company or any of its subsidiaries during the two years immediately preceding the date of this Form 20-F.
20-F.
D. Exchange Controls
There are no governmental laws, decrees, regulations or other legislation, including foreign exchange controls, in Canada which may affect the export or import of capital or that may affect the remittance of dividends, interest or other payments to non-resident holders of the Company's securities. Any remittances of dividends to United States residents, however, are subject to a withholding tax pursuant to the Income Tax Act (Canada) and the Canada-U.S. Income Tax Convention (1980), each as amended. Remittances of interest to U.S. residents entitled to the benefits of such Convention are generally not subject to withholding taxes except in limited circumstances involving participating interest payments. Certain other types of remittances, such as royalties paid to U.S. residents, may be subject to a withholding tax depending on all of the circumstances.
Restrictions on Share Ownership by Non-Canadians
There are no limitations under the laws of Canada or in the organizational documents of the Company on the right of foreigners to hold or vote securities of the Company, except that theInvestment Canada Act(the "ICA") may require review and approval by the Minister of Industry (Canada) of certain acquisitions of "control" of the Company by a "non-Canadian". The threshold for acquisitions is generally defined as being one-third or more of the voting shares of the Company. "Non-Canadian" generally means an individual who is not a Canadian citizen, or a corporation, partnership, trust or joint venture that is ultimately controlled by non-Canadians.
Under the ICA, transactions exceeding certain financial thresholds, and which involve the acquisition of control of a Canadian business by a non-Canadian, are subject to review and cannot be implemented unless the Minister of Industry and/or, in the case of a Canadian business engaged in cultural activities, the Minister of Canadian Heritage, are satisfied that the transaction is likely to be of "net benefit to Canada". If a transaction is subject to review (a "Reviewable Transaction"), an application for review must be filed with the Investment Review Division of Industry Canada and/or the Department of Canadian Heritage prior to the implementation of the Reviewable Transaction. The responsible Minister is then required to determine whether the Reviewable Transaction is likely to be of net benefit to Canada, taking into account, among other things, certain factors specified in the ICA and any written undertakings that may have been given by the applicant. The ICA contemplates an initial review period of up to 45 days after filing; however, if the responsible Minister has not completed the review by that date, he may unilaterally extend the review period by up to 30 days (or such longer period as may be agreed to by the applicant and the Minister) to permit completion of the review. If the responsible Minister is not satisfied that the investment is likely to be of net benefit to Canada, he may prohibit the investment or order a divestiture (if the investment has already been completed).
Even if the transaction is not reviewable because it does not meet or exceed the applicable financial threshold, the non-Canadian investor must still give notice to Industry Canada and, in the case of a Canadian business engaged in cultural activities, Canadian Heritage, of its acquisition of control of a Canadian business within 30 days of the implementation of the investment.
Furthermore, under the ICA, every investment in, or acquisition of control of, a Canadian business by a non-Canadian is subject to a "national security" review which examines whether the transaction could be injurious to Canada’s national security. There is no minimum threshold for the size of transaction potentially subject to such review. If the Minister of Industry, after consultation with the Minister of Public Safety and Emergency Preparedness and the investor, is satisfiedconsiders that the investment wouldcould be injurious to national security, the Minister refers the matter to the Governor in Council. Following its review, if the Governor in Council may denytake any measures in respect of the investment askthat it considers advisable to protect national security, including denying the investment, asking for undertakings, provideimposing terms or conditions for the investment or orderordering a divestiture (if the investment has already been completed).
E. Certain United States Federal Income Tax Considerations
The following is a general summary of certain material U.S. federal income tax considerations applicable to a U.S. Holder (as defined below) arising from and relating to the acquisition, ownership and disposition of common shares of the Company ("Common Shares").
This summary is for general information purposes only and does not purport to be a complete analysis or listing of all potential U.S. federal income tax considerations that may apply to a U.S. Holder arising from and relating to the acquisition, ownership and disposition of Common Shares. In addition, this summary does not take into account the individual facts and circumstances of any particular U.S. Holder that may affect the U.S. federal income tax consequences to such U.S. Holder, including specific tax consequences to a U.S. Holder under an applicable tax treaty. Accordingly, this summary is not intended to be, and should not be construed as, legal or U.S. federal income tax advice with respect to any U.S. Holder. Except as specifically set forth below, this summary does not discuss applicable tax reporting requirements. This summary does not address the U.S. federal alternative minimum, U.S. federal estate and gift, U.S. state and local, and foreign tax consequences to U.S. Holders of the acquisition, ownership and disposition of Common Shares. Each prospective U.S. Holder should consult its own tax advisor regarding the U.S. federal, U.S. federal alternative minimum, U.S. federal estate and gift, U.S. state and local, and foreign tax consequences relating to the acquisition, ownership and disposition of Common Shares.
No legal opinion from U.S. legal counsel or ruling from the Internal Revenue Service (the "IRS") has been requested, or will be obtained, regarding the U.S. federal income tax consequences of the acquisition, ownership and disposition of Common Shares. This summary is not binding on the IRS, and the IRS is not precluded from taking a position that is different from, and contrary to, the positions taken in this summary. In addition, because the authorities on which this summary is based are subject to various interpretations, the IRS and the U.S. courts could disagree with one or more of the conclusions described in this summary.
Scope of this Summary
Authorities
This summary is based on theInternal Revenue Code of 1986, as amended (the "Code"), Treasury Regulations (whether final, temporary, or proposed), published rulings of the IRS, published administrative positions of the IRS, the Convention Between Canada and the United States of America with Respect to Taxes on Income and on Capital, signed September 26, 1980, as amended (the "Canada-U.S. Tax Convention"), and U.S. court decisions that are applicable and, in each case, as in effect and available, as of the date of this document. Any of the authorities on which this summary is based could be changed in a material and adverse manner at any time, and any such change could be applied on a retroactive or prospective basis which could affect the U.S. federal income tax considerations described in this summary. This summary does not discuss the potential effects, whether adverse or beneficial, of any proposed legislation that, if enacted, could be applied on a retroactive or prospective basis.
U.S. Holders
For purposes of this summary, the term "U.S. Holder" means a beneficial owner of Common Shares that is for U.S. federal income tax purposes:
| · | an individual who is a citizen or resident of the U.S.; |
| · | a corporation (or other entity taxable as a corporation for U.S. federal income tax purposes) organized under the laws of the U.S., any state thereof or the District of Columbia; |
| · | an estate whose income is subject to U.S. federal income taxation regardless of its source; or |
| · | a trust that (1) is subject to the primary supervision of a court within the U.S. and the control of one or more U.S. persons for all substantial decisions or (2) has a valid election in effect under applicable Treasury Regulations to be treated as a U.S. person. |
Non-U.S. Holders
For purposes of this summary, a "non-U.S. Holder" is a beneficial owner of Common Shares that is not a U.S. Holder. This summary does not address the U.S. federal income tax consequences to non-U.S. Holders arising from and relating to the acquisition, ownership and disposition of Common Shares. Accordingly, a non-U.S. Holder should consult its own tax advisor regarding the U.S. federal, U.S. federal alternative minimum, U.S. federal estate and gift, U.S. state and local, and foreign tax consequences (including the potential application of and operation of any income tax treaties) relating to the acquisition, ownership and disposition of Common Shares.
U.S. Holders Subject to Special U.S. Federal Income Tax Rules Not Addressed
This summary does not address the U.S. federal income tax considerations applicable to U.S. Holders that are subject to special provisions under the Code, including, but not limited to, the following:following U.S. Holders: (a) U.S. Holders that are tax-exempt organizations, qualified retirement plans, individual retirement accounts, or other tax-deferred accounts; (b) U.S. Holders that are financial institutions, underwriters, insurance companies, real estate investment trusts, or regulated investment companies; (c) U.S. Holders that are broker-dealers, dealers, or traders in securities or currencies that elect to apply a mark-to-market accounting method; (d) U.S. Holders that have a “functional currency” other than the U.S. dollar; (e) U.S. Holders that own Common Shares as part of a straddle, hedging transaction, conversion transaction, constructive sale, or other arrangement involving more than one position; (f) U.S. Holders that acquired Common Shares in connection with the exercise of employee stock options or otherwise as compensation for services; (g) U.S. Holders that hold Common Shares other than as a capital asset within the meaning of Section 1221 of the Code (generally, property held for investment purposes); or (h) U.S. Holders that own, or have owned or will own (directly, indirectly, or by attribution) 10% or more of the total combined voting power of the outstanding shares of the Company. This summary also does not address the U.S. federal income tax considerations applicable to U.S. Holders who are: (a) U.S. expatriates or former long-term residents of the U.S.; (b) persons that have been, are, or will be a resident or deemed to be a resident in Canada for purposes of the Income Tax Act (Canada) (the "Tax Act"); (c) persons that use or hold, will use or hold, or that are or will be deemed to use or hold Common Shares in connection with carrying on a business in Canada; (d) persons whose Common Shares constitute “taxable Canadian property” under the Tax Act; or (e) persons that have a permanent establishment in Canada for the purposes of the Canada-U.S. Tax Convention. U.S. Holders that are subject to special provisions under the Code, including, but not limited to, U.S. Holders described immediately above, should consult their own tax advisor regarding the U.S. federal, U.S. federal alternative minimum, U.S. federal estate and gift, U.S. state and local, and foreign tax consequences relating to the acquisition, ownership and disposition of Common Shares.
If an entity or arrangement that is classified as a partnership (or other “pass-through” entity) for U.S. federal income tax purposes holds Common Shares, the U.S. federal income tax consequences to such entity and the partners (or other owners) of such entity generally will depend on the activities of the entity and the status of such partners (or owners). This summary does not address the tax consequences to any such owner. Partners (or other owners) of entities or arrangements that are classified as partnerships or as “pass-through” entities for U.S. federal income tax purposes should consult their own tax advisors regarding the U.S. federal income tax consequences arising from and relating to the acquisition, ownership and disposition of Common Shares.
Passive Foreign Investment Company Rules
If the Company were to constitute a “passive foreign investment company” under the meaning of Section 1297 of the Code (a “PFIC”, as defined below) for any year during a U.S. Holder’s holding period, then certain potentially adverse rules will affect the U.S. federal income tax consequences to a U.S. Holder resulting from the acquisition, ownership and disposition of Common Shares. The Company believes that it was classified as a PFIC during the tax year ended December 31, 2012,2013, and due to the nature of the Company’s assets and the income that the Company expects to generate, the Company expects to be a PFIC for its current tax year and may be a PFIC in subsequent tax years. The determination of whether any corporation was, or will be, a PFIC for a tax year depends, in part, on the application of complex U.S. federal income tax rules, which are subject to differing interpretations. In addition, whether any corporation will be a PFIC for any tax year depends on the assets and income of such corporation over the course of each such tax year and, as a result, cannot be predicted with certainty as of the date of this document. Accordingly, there can be no assurance that the IRS will not challenge any determination made by the Company (or any subsidiary of the Company) concerning its PFIC status. Each U.S. Holder should consult its own tax advisor regarding the PFIC status of the Company and any subsidiary of the Company.
In addition, in any year in which the Company is classified as a PFIC, such holder may be required to file an annual report with the IRS containing such information as Treasury Regulations and/or other IRS guidance may require. U.S.A failure to satisfy such reporting requirements may result in an extension of the time period during which the IRS can assess a tax.U.S. Holders should consult their own tax advisors regarding the requirements of filing such information returns under these rules, including the requirement to file a IRS Form 8621.
The Company generally will be a PFIC if, for a tax year, (a) 75% or more of the gross income of the Company is passive income (the "income test") or (b) 50% or more of the value of the Company’s assets either produce passive income or are held for the production of passive income, based on the quarterly average of the fair market value of such assets (the "asset test"). “Gross income” generally includes all sales revenues less the cost of goods sold, plus income from investments and from incidental or outside operations or sources, and “passive income” generally includes, for example, dividends, interest, certain rents and royalties, certain gains from the sale of stock and securities, and certain gains from commodities transactions.
Active business gains arising from the sale of commodities generally are excluded from passive income if substantially all (85% or more) of a foreign corporation’s commodities are stock in trade or inventory, depreciable property used in a trade or business, or supplies regularly used or consumed in a trade or business and certain other requirements are satisfied.
For purposes of the PFIC income test and asset test described above, if the Company owns, directly or indirectly, 25% or more of the total value of the outstanding shares of another corporation, the Company will be treated as if it (a) held a proportionate share of the assets of such other corporation and (b) received directly a proportionate share of the income of such other corporation. In addition, for purposes of the PFIC income test and asset test described above, and assuming certain other requirements are met, “passive income” does not include certain interest, dividends, rents, or royalties that are received or accrued by the Company from certain “related persons” (as defined in Section 954(d)(3) of the Code), to the extent such items are properly allocable to the income of such related person that is not passive income.
Under certain attribution rules, if the Company is a PFIC, U.S. Holders will generally be deemed to own their proportionate share of the Company’s direct or indirect equity interest in any company that is also a PFIC (a "Subsidiary PFIC"), and will be subject to U.S. federal income tax on their proportionate share of (a) any “excess distributions,” as described below, on the stock of a Subsidiary PFIC and (b) a disposition or deemed disposition of the stock of a Subsidiary PFIC by the Company or another Subsidiary PFIC, both as if such U.S. Holders directly held the shares of such Subsidiary PFIC. In addition, U.S. Holders may be subject to U.S. federal income tax on any indirect gain realized on the stock of a Subsidiary PFIC on the sale or disposition of Common Shares. Accordingly, U.S. Holders should be aware that they could be subject to tax even if no distributions are received and no redemptions or other dispositions of Common Shares are made.
Default PFIC Rules Under Section 1291 of the Code
If the Company is a PFIC for any tax year during which a U.S. Holder owns Common Shares, the U.S. federal income tax consequences to such U.S. Holder of the acquisition, ownership and disposition of Common Shares will depend on whether and when such U.S. Holder makes an election to treat the Company and each Subsidiary PFIC, if any, as a “qualified electing fund” or “QEF” under Section 1295 of the Code (a "QEF Election") or makes a mark-to-market election under Section 1296 of the Code (a "Mark-to-Market Election"). A U.S. Holder that does not make either a QEF Election or a Mark-to-Market Election will be referred to in this summary as a "Non-Electing U.S. Holder".
A Non-Electing U.S. Holder will be subject to the rules of Section 1291 of the Code (described below) with respect to (a) any gain recognized on the sale or other taxable disposition of Common Shares and (b) any excess distribution received on the Common Shares. A distribution generally will be an “excess distribution” to the extent that such distribution (together with all other distributions received in the current tax year) exceeds 125% of the average distributions received during the three preceding tax years (or during a U.S. Holder’s holding period for the Common Shares, if shorter).
Under Section 1291 of the Code, any gain recognized on the sale or other taxable disposition of Common Shares (including an indirect disposition of the stock of any Subsidiary PFIC), and any “excess distribution” received on Common Shares or with respect to the stock of a Subsidiary PFIC, must be ratably allocated to each day in a Non-Electing U.S. Holder’s holding period for the respective Common Shares. The amount of any such gain or excess distribution allocated to the tax year of disposition or distribution of the excess distribution and to years before the entity became a PFIC, if any, would be taxed as ordinary income. The amounts allocated to any other tax year would be subject to U.S. federal income tax at the highest tax rate applicable to ordinary income in each such year, and an interest charge would be imposed on the tax liability for each such year, calculated as if such tax liability had been due in each such year. A Non-Electing U.S. Holder that is not a corporation must treat any such interest paid as “personal interest,” which is not deductible.
If the Company is a PFIC for any tax year during which a Non-Electing U.S. Holder holds Common Shares, the Company will continue to be treated as a PFIC with respect to such Non-Electing U.S. Holder, regardless of whether the Company ceases to be a PFIC in one or more subsequent tax years. A Non-Electing U.S. Holder may terminate this deemed PFIC status by electing to recognize gain (which will be taxed under the rules of Section 1291 of the Code discussed above), but not loss, as if such Common Shares were sold on the last day of the last tax year for which the Company was a PFIC.
QEF Election
A U.S. Holder that makes a timely and effective QEF Election for the first tax year in which its holding period of its Common Shares begins generally will not be subject to the rules of Section 1291 of the Code discussed above with respect to its Common Shares. A U.S. Holder that makes a timely and effective QEF Election will be subject to U.S. federal income tax on such U.S. Holder’s pro rata share of (a) the net capital gain of the Company, which will be taxed as long-term capital gain to such U.S. Holder, and (b) the ordinary earnings of the Company, which will be taxed as ordinary income to such U.S. Holder. Generally, “net capital gain” is the excess of (a) net long-term capital gain over (b) net short-term capital loss, and “ordinary earnings” are the excess of (a) “earnings and profits” over (b) net capital gain. A U.S. Holder that makes a QEF Election will be subject to U.S. federal income tax on such amounts for each tax year in which the Company is a PFIC, regardless of whether such amounts are actually distributed to such U.S. Holder by the Company. However, for any tax year in which the Company is a PFIC and has no net income or gain, U.S. Holders that have made a QEF Election would not have any income inclusions as a result of the QEF Election. If a U.S. Holder that made a QEF Election has an income inclusion, such a U.S. Holder may, subject to certain limitations, elect to defer payment of current U.S. federal income tax on such amounts, subject to an interest charge. If such U.S. Holder is not a corporation, any such interest paid will be treated as “personal interest,” which is not deductible.
A U.S. Holder that makes a timely and effective QEF Election with respect to the Company generally (a) may receive a tax-free distribution from the Company to the extent that such distribution represents “earnings and profits” of the Company that were previously included in income by the U.S. Holder because of such QEF Election and (b) will adjust such U.S. Holder’s tax basis in the Common Shares to reflect the amount included in income or allowed as a tax-free distribution because of such QEF Election. In addition, a U.S. Holder that makes a QEF Election generally will recognize capital gain or loss on the sale or other taxable disposition of Common Shares.
The procedure for making a QEF Election, and the U.S. federal income tax consequences of making a QEF Election, will depend on whether such QEF Election is timely. A QEF Election will be treated as “timely” if such QEF Election is made for the first year in the U.S. Holder’s holding period for the Common Shares in which the Company was a PFIC. A U.S. Holder may make a timely QEF Election by filing the appropriate QEF Election documents at the time such U.S. Holder files a U.S. federal income tax return for such year. If a U.S. Holder does not make a timely and effective QEF Election for the first year in the U.S. Holder’s holding period for the Common Shares, the U.S. Holder may still be able to make a timely and effective QEF Election in a subsequent year if such U.S. Holder meets certain requirements and makes a “purging” election to recognize gain (which will be taxed under the rules of Section 1291 of the Code discussed above) as if such Common Shares were sold for their fair market value on the day the QEF Election is effective. If a U.S. Holder owns PFIC stock indirectly through another PFIC, separate QEF Elections must be made for the PFIC in which the U.S. Holder is a direct shareholder and the Subsidiary PFIC for the QEF rules to apply to both PFICs.
A QEF Election will apply to the tax year for which such QEF Election is timely made and to all subsequent tax years, unless such QEF Election is invalidated or terminated or the IRS consents to revocation of such QEF Election. If a U.S. Holder makes a QEF Election and, in a subsequent tax year, the Company ceases to be a PFIC, the QEF Election will remain in effect (although it will not be applicable) during those tax years in which the Company is not a PFIC. Accordingly, if the Company becomes a PFIC in another subsequent tax year, the QEF Election will be effective and the U.S. Holder will be subject to the QEF rules described above during any subsequent tax year in which the Company qualifies as a PFIC.
U.S. Holders should be aware that there can be no assurances that the Company will satisfy the record keeping requirements that apply to a QEF, or that the Company will supply U.S. Holders with information that such U.S. Holders are required to report under the QEF rules, in the event that the Company is a PFIC. Thus, U.S. Holders may not be able to make a QEF Election with respect to their Common Shares. Each U.S. Holder should consult its own tax advisor regarding the availability of, and procedure for making, a QEF Election.
A U.S. Holder makes a QEF Election by attaching a completed IRS Form 8621, including a PFIC Annual Information Statement, to a timely filed United States federal income tax return. However, if the Company cannot provide the required information with regard to the Company or any of its Subsidiary PFICs, U.S. Holders will not be able to make a QEF Election for such entity and will continue to be subject to the rules discussed above that apply to Non-Electing U.S. Holders with respect to the taxation of gains and excess distributions.
Mark-to-Market Election
A U.S. Holder may make a Mark-to-Market Election only if the Common Shares are marketable stock. The Common Shares generally will be “marketable stock” if the Common Shares are regularly traded on (a) a national securities exchange that is registered with the U.S. Securities and Exchange Commission, (b) the national market system established pursuant to section 11A of theSecurities and Exchange Act of 1934, or (c) a foreign securities exchange that is regulated or supervised by a governmental authority of the country in which the market is located, provided that (i) such foreign exchange has trading volume, listing, financial disclosure, and surveillance requirements, and meets other requirements and the laws of the country in which such foreign exchange is located, together with the rules of such foreign exchange, ensure that such requirements are actually enforced and (ii) the rules of such foreign exchange effectively promote active trading of listed stocks. If such stock is traded on such a qualified exchange or other market, such stock generally will be “regularly traded” for any calendar year during which such stock is traded, other than in de minimis quantities, on at least 15 days during each calendar quarter.
A U.S. Holder that makes a Mark-to-Market Election with respect to its Common Shares generally will not be subject to the rules of Section 1291 of the Code discussed above with respect to such Common Shares. However, if a U.S. Holder does not make a Mark-to-Market Election beginning in the first tax year of such U.S. Holder’s holding period for the Common Shares or such U.S. Holder has not made a timely QEF Election, the rules of Section 1291 of the Code discussed above will apply to certain dispositions of, and distributions on, the Common Shares.
A U.S. Holder that makes a Mark-to-Market Election will include in ordinary income, for each tax year in which the Company is a PFIC, an amount equal to the excess, if any, of (a) the fair market value of the Common Shares, as of the close of such tax year over (b) such U.S. Holder’s tax basis in such Common Shares. A U.S. Holder that makes a Mark-to-Market Election will be allowed a deduction in an amount equal to the excess, if any, of (a) such U.S. Holder’s adjusted tax basis in the Common Shares, over (b) the fair market value of such Common Shares (but only to the extent of the net amount of previously included income as a result of the Mark-to-Market Election for prior tax years).
A U.S. Holder that makes a Mark-to-Market Election generally also will adjust such U.S. Holder’s tax basis in the Common Shares to reflect the amount included in gross income or allowed as a deduction because of such Mark-to-Market Election. In addition, upon a sale or other taxable disposition of Common Shares, a U.S. Holder that makes a Mark-to-Market Election will recognize ordinary income or ordinary loss (not to exceed the excess, if any, of (a) the amount included in ordinary income because of such Mark-to-Market Election for prior tax years over (b) the amount allowed as a deduction because of such Mark-to-Market Election for prior tax years). Losses that exceed this limitation are subject to the rules generally applicable to losses provided in the Code and Treasury Regulations.
A Mark-to-Market Election applies to the tax year in which such Mark-to-Market Election is made and to each subsequent tax year, unless the Common Shares cease to be “marketable stock” or the IRS consents to revocation of such election. Each U.S. Holder should consult its own tax advisor regarding the availability of, and procedure for making, a Mark-to-Market Election.
Although a U.S. Holder may be eligible to make a Mark-to-Market Election with respect to the Common Shares, no such election may be made with respect to the stock of any Subsidiary PFIC that a U.S. Holder is treated as owning, because such stock is not marketable. Hence, the Mark-to-Market Election will not be effective to eliminate the application of the default rules of Section 1291 of the Code described above with respect to deemed dispositions of Subsidiary PFIC stock or excess distributions from a Subsidiary PFIC.
Other PFIC Rules
Under Section 1291(f) of the Code, the IRS has issued proposed Treasury Regulations that, subject to certain exceptions, would cause a U.S. Holder that had not made a timely QEF Election to recognize gain (but not loss) upon certain transfers of Common Shares that would otherwise be tax-deferred (e.g., gifts and exchanges pursuant to corporate reorganizations). However, the specific U.S. federal income tax consequences to a U.S. Holder may vary based on the manner in which Common Shares are transferred.
Certain additional adverse rules may apply with respect to a U.S. Holder if the Company is a PFIC, regardless of whether such U.S. Holder makes a QEF Election. For example, under Section 1298(b)(6) of the Code, a U.S. Holder that uses Common Shares as security for a loan will, except as may be provided in Treasury Regulations, be treated as having made a taxable disposition of such Common Shares.
Special rules also apply to the amount of foreign tax credit that a U.S. Holder may claim on a distribution from a PFIC. Subject to such special rules, foreign taxes paid with respect to any distribution in respect of stock in a PFIC are generally eligible for the foreign tax credit. The rules relating to distributions by a PFIC and their eligibility for the foreign tax credit are complicated, and a U.S. Holder should consult with its own tax advisor regarding the availability of the foreign tax credit with respect to distributions by a PFIC.
The PFIC rules are complex, and each U.S. Holder should consult its own tax advisor regarding the PFIC rules and how the PFIC rules may affect the U.S. federal income tax consequences of the acquisition, ownership and disposition of Common Shares.
Ownership and Disposition of Common Shares to the Extent that the PFIC Rules do not Apply
The following discussion is subject to the rules described above under the heading “Passive Foreign Investment Company Rules.”
Distributions on Common Shares
A U.S. Holder that receives a distribution, including a constructive distribution, with respect to a Common Share will be required to include the amount of such distribution in gross income as a dividend (without reduction for any Canadian income tax withheld from such distribution) to the extent of the current or accumulated “earnings and profits” of the Company, as computed for U.S. federal income tax purposes. A dividend generally will be taxed to a U.S. Holder at ordinary income tax rates if the Company is a PFIC. To the extent that a distribution exceeds the current and accumulated “earnings and profits” of the Company, such distribution will be treated first as a tax-free return of capital to the extent of a U.S. Holder's tax basis in the Common Shares and thereafter as gain from the sale or exchange of such Common Shares. (See “ Sale or Other Taxable Disposition of Common Shares” below). However, the Company may not maintain the calculations of earnings and profits in accordance with U.S. federal income tax principles, and each U.S. Holder should therefore assume that any distribution by the Company with respect to the Common Shares will constitute ordinary dividend income. Dividends received on Common Shares generally will not be eligible for the “dividends received deduction”. Subject to applicable limitations and provided the Company is eligible for the benefits of the Canada-U.S. Tax Convention, dividends paid by the Company to non-corporate U.S. Holders, including individuals, generally will be eligible for the preferential tax rates applicable to long-term capital gains for dividends, provided certain holding period and other conditions are satisfied, including that the Company not be classified as a PFIC in the tax year of distribution or in the preceding tax year. The dividend rules are complex, and each U.S. Holder should consult its own tax advisor regarding the application of such rules.
Sale or Other Taxable Disposition of Common Shares
Upon the sale or other taxable disposition of Common Shares, a U.S. Holder generally will recognize capital gain or loss in an amount equal to the difference between the U.S. dollar value of cash received plus the fair market value of any property received and such U.S. Holder's tax basis in such Common Shares sold or otherwise disposed of. A U.S. Holder’s tax basis in Common Shares generally will be such holder’s U.S. dollar cost for such Common Shares. Gain or loss recognized on such sale or other disposition generally will be long-term capital gain or loss if, at the time of the sale or other disposition, the Common Shares have been held for more than one year.
Preferential tax rates currently apply to long-term capital gain of a U.S. Holder that is an individual, estate, or trust. There are currently no preferential tax rates for long-term capital gain of a U.S. Holder that is a corporation. Deductions for capital losses are subject to significant limitations under the Code.
Additional Considerations
Additional Tax on Passive Income
Individuals, estates and certain trusts whose income exceeds certain thresholds will be required to pay a 3.8% Medicare surtax on “net investment income” including, among other things, dividends and net gain from dispositions of property (other than property held in a tradecertain trades or business)businesses). U.S. Holders should consult with their own tax advisors regarding the effect, if any, of this tax on their ownership and disposition of Common Shares.
Receipt of Foreign Currency
The amount of any distribution paid to a U.S. Holder in foreign currency, or on the sale, exchange or other taxable disposition of Common Shares, generally will be equal to the U.S. dollar value of such foreign currency based on the exchange rate applicable on the date of receipt (regardless of whether such foreign currency is converted into U.S. dollars at that time). A U.S. Holder will have a basis in the foreign currency equal to its U.S. dollar value on the date of receipt. Any U.S. Holder who converts or otherwise disposes of the foreign currency after the date of receipt may have a foreign currency exchange gain or loss that would be treated as ordinary income or loss, and generally will be U.S. source income or loss for foreign tax credit purposes. Each U.S. Holder should consult its own U.S. tax advisor regarding the U.S. federal income tax consequences of receiving, owning, and disposing of foreign currency.
Foreign Tax Credit
Subject to the PFIC rules discussed above, a U.S. Holder that pays (whether directly or through withholding) Canadian income tax with respect to dividends paid on the Common Shares generally will be entitled, at the election of such U.S. Holder, to receive either a deduction or a credit for such Canadian income tax. Generally, a credit will reduce a U.S. Holder’s U.S. federal income tax liability on a dollar-for-dollar basis, whereas a deduction will reduce a U.S. Holder’s income subject to U.S. federal income tax. This election is made on a year-by-year basis and applies to all foreign taxes paid (whether directly or through withholding) by a U.S. Holder during a year.
Complex limitations apply to the foreign tax credit, including the general limitation that the credit cannot exceed the proportionate share of a U.S. Holder’s U.S. federal income tax liability that such U.S. Holder’s “foreign source” taxable income bears to such U.S. Holder’s worldwide taxable income. In applying this limitation, a U.S. Holder’s various items of income and deduction must be classified, under complex rules, as either “foreign source” or “U.S. source.” Generally, dividends paid by a foreign corporation should be treated as foreign source for this purpose, and gains recognized on the sale of stock of a foreign corporation by a U.S. Holder should be treated as U.S. source for this purpose, except as otherwise provided in an applicable income tax treaty, and if an election is properly made under the Code. However, the amount of a distribution with respect to the Common Shares that is treated as a “dividend” may be lower for U.S. federal income tax purposes than it is for Canadian federal income tax purposes, resulting in a reduced foreign tax credit allowance to a U.S. Holder. In addition, this limitation is calculated separately with respect to specific categories of income. The foreign tax credit rules are complex, and each U.S. Holder should consult its own U.S. tax advisor regarding the foreign tax credit rules.
Backup Withholding and Information Reporting
Under U.S. federal income tax law and Treasury Regulations, certain categories of U.S. Holders must file information returns with respect to their investment in, or involvement in, a foreign corporation. For example, recently enacted legislation generally imposes new U.S. return disclosure obligations (and related penalties) are imposed on individuals who are U.S. Holders that hold certain specified foreign financial assets in excess of certain threshold amounts. The definition of specified foreign financial assets includes not only financial accounts maintained in foreign financial institutions, but also, unless held in accounts maintained by a financial institution, any stock or security issued by a non-U.S. person, any financial instrument or contract held for investment that has an issuer or counterparty other than a U.S. person and any interest in a foreign entity. U.S. Holders may be subject to these reporting requirements unless their Common Shares are held in an account at certain financial institutions. Penalties for failure to file certain of these information returns are substantial. U.S. Holders should consult with their own tax advisors regarding the requirements of filing information returns, including the requirement to file an IRS Form 8938.
Payments made within the U.S. or by a U.S. payor or U.S. middleman, of dividends on, and proceeds arising from the sale or other taxable disposition of, Common Shares will generally be subject to information reporting and backup withholding tax, at the rate of 28%, if a U.S. Holder (a) fails to furnish such U.S. Holder’s correct U.S. taxpayer identification number (generally on Form W-9), (b) furnishes an incorrect U.S. taxpayer identification number, (c) is notified by the IRS that such U.S. Holder has previously failed to properly report items subject to backup withholding tax, or (d) fails to certify, under penalty of perjury, that such U.S. Holder has furnished its correct U.S. taxpayer identification number and that the IRS has not notified such U.S. Holder that it is subject to backup withholding tax. However, certain exempt persons generally are excluded from these information reporting and backup withholding rules. Backup withholding is not an additional tax. Any amounts withheld under the U.S. backup withholding tax rules will be allowed as a credit against a U.S. Holder’s U.S. federal income tax liability, if any, or will be refunded, if such U.S. Holder furnishes required information to the IRS in a timely manner. Each U.S. Holder should consult its own tax advisor regarding the information reporting and backup withholding rules.
F.Dividends and Paying Agents
This Form 20-F is being filed as an annual report under the U.S. Exchange Act and, as such, there is no requirement to provide any information under this item.
G. Statement By Experts
This Form 20-F is being filed as an annual report under the U.S. Exchange Act and, as such, there is no requirement to provide any information under this item.
H. Documents on Display
The documents referred to and/or incorporated by reference in this Form 20-F can be viewed at the office of the Company at 1 First Canadian Place, 100 King Street West, Suite 7070, Toronto, Ontario, M5X 1E3, Canada. The Company is required to file financial statements and other information with the securities regulatory authorities in each of the Canadian provinces (other than Quebec), electronically through the Canadian System for Electronic Document Analysis and Retrieval (SEDAR), which can be viewed atwww.sedar.com.The Company is subject to the informational requirements of the U.S. Exchange Act and files reports and other information with the SEC. You may read and copy any of the Company’s reports and other information at, and obtain copies upon payment of prescribed fees from, the Public Reference Room maintained by the SEC at 100 F Street, N.E., Washington, D.C., U.S., 20549. In addition, the SEC maintains a website that contains reports, proxy and information statements and other information regarding registrants that file electronically with the SEC at http://www.sec.gov. The public may obtain information on the operation of the Public Reference Room by calling the SEC at 1-800-SEC-0330.
I. Subsidiary Information
Not applicable.
Item 11. Quantitative and Qualitative Disclosures About Market Risk.
See Note 15 to the Company's audited consolidated financial statements as at and for the financial years ended December 31, 2013, 2012 and 2011 and 2010filed as part of thisForm 20-F under Item 18.18.
Item 12. Descriptions of Securities Other than Equity Securities
Not applicable.
PART II
Item 13. Defaults, Dividend Arrearages and Delinquencies.
Not applicable.
Item 14. Material Modifications to the Rights of Security Holders and Use of Proceeds.
14.A.-D. Modifications to the Rights of Security Holders
The Company was formed under the OBCA on August 24, 1993 by articles of amalgamation. The name of the Company upon amalgamation was Taylor Rand Incorporated. On June 25, 1996, pursuant to the filing of articles of amendment, the Company changed its name from Taylor Rand Incorporated to Sheridan Reserve Incorporated and consolidated its outstanding common shares. Articles of amendment were filed by the Company on January 28, 1997 to consolidate its outstanding series of preference shares. The Company changed its name from Sheridan Reserve Incorporated to Nevadabobs.com Inc. on August 4, 2000 pursuant to the filing of articles of amendment. The Company changed its name from Nevadabobs.com Inc. to Nevada Bob’s International Inc. on August 24, 2001 pursuant to articles of amendment. Articles of amendment were filed by the Company on May 6, 2002 to consolidate its outstanding common shares. Articles of amendment were filed by the Company on April 30, 2003 to create a series of preference shares. On November 28, 2008, immediately following the acquisition by the Company of Old Loncor, the Company filed articles of amalgamation which amalgamated the Company with Old Loncor and changed the Company’s name from Nevada Bob's International Inc. to Loncor Resources Inc.
14.E. Use of Proceeds
Not applicable.
Item 15. Controls and Procedures.
Disclosure Controls and Procedures
Under the supervision and with the participation of the Company's management, including its Chief Executive Officer and Chief Financial Officer, the Company evaluated the effectiveness of the design and operation of its disclosure controls and procedures (as defined in Rule 13a-15(e) or 15d-15(e) under the U.S. Exchange Act) for the year ended December 31, 2012.2013. Based upon that evaluation, the Chief Executive Officer and Chief Financial Officer concluded that, as of the end of the period covered by this report, the Company's disclosure controls and procedures were adequately designed and are effective to ensure that information required to be disclosed by the Company in the reports it files or submits under the U.S. Exchange Act is recorded, processed, summarized and reported within the time periods specified in applicable rules and forms.
In addition, the Company's Chief Executive Officer and Chief Financial Officer have determined that the disclosure controls and procedures are effective to ensure that information required to be disclosed in the reports that are filed under the U.S. Exchange Act is accumulated and communicated to management, including the Chief Executive Officer and Chief Financial Officer, to allow timely decisions regarding required disclosure.
Management’s Annual Report on Internal Control over Financial Reporting
The Company's management is responsible for establishing and maintaining adequate internal control over financial reporting as defined in Rules 13a-15(f) and 15d-15(f) under the U.S. Exchange Act. The Company's management has employed a framework consistent with U.S. Exchange Act Rule 13a-15(c), to evaluate the Company's internal control over financial reporting described below. The Company's internal control over financial reporting is a process designed to provide reasonable assurance regarding the reliability of financial reporting and the preparation and fair presentation of financial statements for external purposes in accordance with generally accepted accounting principals.
IFRS.
Because of its inherent limitations, internal control over financial reporting may not prevent or detect misstatements. Projections of any evaluation of effectiveness to future periods are subject to the risk that controls may become inadequate because of changes in conditions, or that the degree of compliance with the policies or procedures may deteriorate.
Management conducted an evaluation of the design and operation of the Company's internal control over financial reporting as of December 31, 20122013 based on the criteria set forth in Internal Control - Integrated Framework (1992) issued by the Committee of Sponsoring Organizations of the Treadway Commission. This evaluation included review of the documentation of controls, evaluation of the design effectiveness of controls, testing of the operating effectiveness of controls and a conclusion on this evaluation. Based on this evaluation, management has concluded that the Company's internal control over financial reporting was effective as of December 31, 20122013 and no material weaknesses were discovered.
Attestation Report of the Registered Public Accounting Firm
This annual report on Form 20-F does not include an attestation report of the Company’s registered public accounting firm regarding internal control over financial reporting.
Under theJumpstart Our Business Startups Act (“(“JOBS Act”Act”), emerging growth companies are exempt from Section 404(b) of theSarbanes-Oxley Act, which generally requires public companies to provide an independent auditor attestation of management’s assessment of the effectiveness of their internal control over financial reporting. The Company qualifies as an emerging growth company under the JOBS Act and therefore has not included an independent auditor attestation of management’s assessment of the effectiveness of its internal control over financial reporting.
Changes in Internal Control over Financial Reporting
There were no changes in the Company’s internal control over financial reporting during the year ended December 31, 2012,2013, that management believes have materially affected, or are reasonably likely to materially affect, the Company’s internal control over financial reporting.
The Company's management, including the Chief Executive Officer and Chief Financial Officer, does not expect that its disclosure controls and procedures or internal controls and procedures will prevent all error and all fraud. A control system, no matter how well conceived and operated, can provide only reasonable, not absolute, assurance that the objectives of the control system are met. Further, the design of a control system must reflect the fact that there are resource constraints, and the benefits of controls must be considered relative to their costs. Because of the inherent limitations in all control systems, no evaluation of controls can provide absolute assurance that all control issues and instances of fraud, if any, within the Company have been detected. These inherent limitations include the realities that judgments in decision-making can be faulty, and that breakdowns can occur because of simple error or mistake. Additionally, controls can be circumvented by the individual acts of some persons, by collusion of two or more people, or by management override of the control. The design of any system of controls also is based in part upon certain assumptions about the likelihood of future events, and there can be no assurance that any design will succeed in achieving its stated goals under all potential future conditions; over time, control may become inadequate because of changes in conditions, or the degree of compliance with the policies or procedures may deteriorate. Because of the inherent limitations in a cost-effective control system, misstatements due to error or fraud may occur and not be detected.
Item 16.A. Audit Committee Financial Expert
The Company's Board has determined that KevinWilliam R. BakerWilson satisfies the requirements as an audit committee financial expert, in that he has an understanding of generally accepted accounting principlesIFRS and financial statements; is able to assess the general application of such principles in connection with the accounting for estimates, accruals and reserves; has experience preparing, auditing, analyzing or evaluating financial statements that present a breadth and level of complexity of accounting issues that can reasonably be expected to be raised by the Company's financial statements (or experience actively supervising one or more persons engaged in such activities); has an understanding of internal controls over financial reporting; and has an understanding of audit committee functions.
Mr. BakerWilson is also independent within the meaning of Section 803 of the NYSE MKT Company Guide.
Item 16.B. Code of Ethics.
The Company has adopted a code of business conduct and ethics for directors, officers and employees (including the Company’s principal executive officer, principal financial officer and principal accounting officer) (the "Code"). A copy of the Code isincorporated by reference into this Form 20-F as Exhibit 1.4. A copy of the Code may also be obtained free of charge from the Chief Financial Officer of the Company at (416) 366-2221 and is also available on SEDAR atwww.sedar.com, EDGAR atwww.sec.gov and the Company's website atwww.loncor.com. Each director, officer and employee of the Company is provided with a copy of the Code and is required to confirm annually that he or she has complied with the Code. Any observed breaches of the Code must be reported to the Company's Chief Executive Officer.
No amendment was made to the Code during the Company's most recently completed financial year and no waiver from a provision of the Code was granted by the Company during the Company's most recently completed financial year.
In accordance with the OBCA(the Company's governing corporate legislation), directors of the Company who are a party to, or are a director or an officer of or have a material interest in a party to, a material contract or material transaction or a proposed material contract or proposed material transaction, are required to disclose the nature and extent of their interest and not to vote on any resolution to approve the contract or transaction. In addition, in certain cases, an independent committee of the Company's Board may be formed to deliberate on such matters in the absence of the interested party.
The Company has also adopted a "whistleblower" policy which provides employees, consultants, officers and directors with the ability to report, on a confidential and anonymous basis, violations within the Company's organization including, (but not limited to), questionable accounting practices, disclosure of fraudulent or misleading financial information, instances of corporate fraud, or harassment. The Company believes that providing a forum for such individuals to raise concerns about ethical conduct and treating all complaints with the appropriate level of seriousness fosters a culture of ethical business conduct. The Company has also adopted an insider trading policy to encourage and promote a culture of ethical business conduct.
Item 16.C. Principal Accountant Fees and Services
The following summarizes the total fees billed by the external auditors of the Company (BDO(BDO Canadallp) in for each of the years ended December 31, 20122013 and, December 31, 2011.2012. All dollar amounts are exclusive of applicable taxes.
| 2012 | 2011 | |||||||
| Audit Fees | US$ | 153,213 | US$ | 182,375 | ||||
| Audit-Related Fees | Nil | Nil | ||||||
| Tax Fees | US$ | 1,851 | (1) | US$ | 2,199 | (1) | ||
| All Other Fees | Nil | Nil |
| 2013 | 2012 | |||||||
| Audit Fees | US$65,000 | US$153,213 | ||||||
| Audit-Related Fees | Nil | Nil | ||||||
| Tax Fees | US$2,000 | (1) | US$1,851 | (1) | ||||
| All Other Fees | Nil | Nil |
| (1) | The services comprising these fees related to the preparation of the Company's Canadian tax return. |
In accordance with existing Audit Committee policy and the requirements of the Sarbanes-Oxley Act, all services to be provided by BDO Canadallpare subject to pre-approval by the Audit Committee. This includes audit services, audit-related services, tax services and other services. In some cases, pre-approval is provided by the full Audit Committee for up to a year, and relates to a particular category or group of services and is subject to a specific budget. All of the fees listed above have been approved by the Audit Committee.
Item 16.D. Exemptions from the Listing Standards for Audit Committees
Not applicable.
Item 16.E. Purchase of Equity Securities by the Issuer and Affiliated Purchasers
The Company did not purchase any of its common shares during the financial year ended December 31, 2012.2013.
Item 16.F. Change in Registrant's Certifying Accountant
Not applicable.
Item 16.G. Corporate Governance
The Company's common shares are listed on the NYSE MKT. The NYSE MKT Company Guide permits the NYSE MKT to consider the laws, customs and practices of foreign issuers in relaxing certain NYSE MKT listing criteria, and to grant exemptions from NYSE MKT listing criteria based on these considerations. A company seeking relief under these provisions is required to provide written certification from independent local counsel that the non-complying practice is not prohibited by home country law. A description of the significant ways in which the Company's governance practices differ from those followed by U.S. domestic companies pursuant to the NYSE MKT standards is as follows:
Shareholder Meeting Quorum Requirement: NYSE MKT minimum quorum requirement for a shareholder meeting is one-third of the outstanding shares of common stock. In addition, a company listed on NYSE MKT is required to state its quorum requirement in its by-law. The Company's quorum requirement is set forth in its by-law, which provides that a quorum for the transaction of business at any meeting of shareholders shall be two persons present in person, each being a shareholder entitled to vote thereat or a duly appointed proxy holder or representative for a shareholder so entitled.
Proxy Delivery Requirement:NYSE MKT requires the solicitation of proxies and delivery of proxy statements for all shareholder meetings, and requires that these proxies be solicited pursuant to a proxy statement that conforms to the proxy rules of the SEC. The Company is a "foreign private issuer" as defined in Rule 3b-4 under the U.S. Exchange Act and the equity securities of the Company are accordingly exempt from the proxy rules set forth in Sections 14(a), 14(b), 14(c) and 14(f) of the U.S. Exchange Act. The Company solicits proxies in accordance with applicable rules and regulations in Canada.
Independence of Directors:NYSE MKT requires that the majority of a company's directors be independent. The Company does not have a majority of independent directors, but does satisfy the requirements of applicable Canadian laws with respect to the composition of its Board.
Nominating Process: NYSE MKT requires that director nominations must be either selected or recommended to the board by either a nominating committee or a majority of independent directors. In addition, NYSE MKT requires a formal written charter or board resolution addressing the nominations process. Under applicable Canadian laws, the Company's director nominations are not required to be selected or recommended to the Board by either a nominating committee or a majority of independent directors and the Company is not required to adopt a formal written charter or board resolution addressing the nominations process.
Executive Compensation:Independence of Directors on the Compensation Committee: The NYSE MKT requires executive compensation to be decided by athat all members of the Company’s compensation committee comprised entirely of independent directors or a majority ofbe independent directors. UnderThe Company does not have a fully independent compensation committee, but does satisfy the requirements of applicable Canadian laws with respect to the composition of its compensation committee.The Company intends on relying on the exemption set forth in Section 110 of the NYSE MKT Company Guide.
The foregoing are consistent with the laws, customs and practices in Canada.
In addition, the Company may from time-to-time seek relief from the NYSE MKT corporate governance requirements on specific transactions under Section 110 of the NYSE MKT Company Guide by providing written certification from independent local counsel that the non-complying practice is not prohibited by the Company’s home country law, in which case, the Company shall make the disclosure of such transactions available on our website atwww.loncor.com. Information contained on the Company’s website is not part of this annual report.
Compensation Committee Independence. The Company has elected not to adopt Section 805(c) of the NYSE MKT Company Guide applicable to charters and independence of compensation committees of U.S. domestic issuers. As a foreign private issuer, the Company is not required to have a compensation committee comprised entirely of independent directors or to have executive compensation determined by a majority of independent directors.comply with these rules.
Item 16.H.
Not applicable.
PART III
Item 17. Financial Statements
Not applicable.
Item 18. Financial Statements
The financial statements appear on pages F-1 through F-33.F-29.
Item 19. Exhibits
The following exhibits are filed as part of this Form 20-F:
| EXHIBIT | ||
| NUMBER | DESCRIPTION | |
| Constating Documents | ||
| 1.1 | Company's articles of amalgamation(1) | |
| 1.2 | Company's general by-law(1) | |
| 1.3 | Audit Committee's charter(1) | |
| 1.4 | Company's Business Conduct Policy(1) | |
| Material Contracts | ||
| 4.1 | Company's stock option plan(1) | |
| Subsidiaries | ||
| 8.1 | List of subsidiaries of the Company(1) | |
| Certifications | ||
| 12.1 | Certification of the President and Chief Executive Officer of the Company pursuant to Section 302 of Sarbanes-Oxley Act of 2002 | |
| 12.2 | Certification of the Chief Financial Officer of the Company pursuant to Section 302 of Sarbanes-Oxley Act of 2002 | |
| 13.1 | Certification of the President and Chief Executive Officer of the Company pursuant to Section 906 of the Sarbanes-Oxley Act of 2002 | |
| 13.2 | Certification of the Chief Financial Officer of the Company pursuant to Section 906 of the Sarbanes-Oxley Act of 2002 | |
| Other Exhibits | ||
| 15.1 | Management's discussion and analysis of the Company for the year ended December 31, | |
| 15.2 | Sections 10 and 11 of the Ngayu Technical Report(2) |
Note:Notes:
| (1) | Previously filed as an exhibit to the Company’s annual report on Form 20-F filed with the |
| (2) | Previously filed as exhibit 99.1 to the Company’s current report on Form 6-K filed with the SEC on July 13, 2012. |
SIGNATURES
The registrant hereby certifies that it meets all of the requirements for filing on Form 20-F and that it has duly caused and authorized the undersigned to sign this annual report on its behalf.
Date: March 28, 2013
| Date: March 31, 2014 | ||
| LONCOR RESOURCES INC. | ||
| (Registrant) | ||
| By: | ||
| Peter N. Cowley | ||
President and Chief Executive Officer |


Consolidated Financial Statements
December 31, 20122013
(Expressed in U.S. dollars)
Contents
| Management’s Report | ||
| F-3 | ||
| Independent Auditor’s Report | F-4 | |
| CONSOLIDATED FINANCIAL STATEMENTS | ||
| Consolidated Statements of Financial Position | ||
| F-5 | ||
| Consolidated Statements of Comprehensive (Loss) Income | ||
| F-6 | ||
| Consolidated Statements of Changes in Equity | ||
| F-7 | ||
| Consolidated Statements of Cash Flows | F-8 |
| NOTES TO CONSOLIDATED FINANCIAL STATEMENTS | |||
| 1. | Corporate Information | F-9 | |
| 2. | Basis of Preparation | F-9 | |
| 3. | Summary of Significant Accounting Policies | F-10 | |
| 4. | Subsidiaries | F-18 | |
| 5. | Advances receivable | F-18 | |
| 6. | Related party transactions | F-18 | |
| 7. | Property, Plant and Equipment | F-19 | |
| 8. | Exploration and Evaluation Assets | F-20 | |
| 9. | Intangible Assets | F-20 | |
| 10. | Segmented Reporting | F-21 | |
| 11. | Accounts Payable | F-21 | |
| 12. | Share Capital | F-21 | |
| 13. | Share-Based Payments | F-22 | |
| 14. | Commitments | F-24 | |
| 15. | Financial risk management objectives and policies | F-24 | |
| 16. | Supplemental cash flow information | F-27 | |
| 17. | Employee retention allowance | F-27 | |
| 18. Income taxes |
Management's Report
Management’s Responsibility for Financial Statements
The consolidated financial statements and the notes thereto and other financial information contained in the Management’s Discussion and Analysis have been prepared in accordance with International Financial Reporting Standards and are the responsibility of the management of Loncor Resources Inc. (the “Company”). The financial information presented elsewhere in the Management’s Discussion and Analysis is consistent with the data that is contained in the consolidated financial statements. The consolidated financial statements, where necessary, include amounts which are based on the best estimates and judgments of management.
In order to discharge management’s responsibility for the integrity of the consolidated financial statements, the Company maintains a system of internal controls. These controls are designed to provide reasonable assurance that the Company’s assets are safeguarded, transactions are executed and recorded in accordance with management’s authorization, proper records are maintained and relevant and reliable information is produced. These controls include maintaining quality standards in hiring and training of employees, policies and procedures manuals, a corporate code of conduct and ensuring that there is proper accountability for performance within appropriate and well-defined areas of responsibility. The system of internal controls is further supported by a compliance function, which is designed to ensure that we and our employees comply with securities legislation and conflict of interest rules.
The Board of Directors is responsible for overseeing management’s performance of its responsibilities for financial reporting and internal control. The Audit Committee, which is composed of non-executive directors, meets with management as well as the external auditors to ensure that management is properly fulfilling its financial reporting responsibilities to the Directors who approve the consolidated financial statements. The external auditors have full and unrestricted access to the Audit Committee to discuss the scope of their audits, the adequacy of the system of internal controls and review reporting issues.
The consolidated financial statements for the year ended December 31, 20122013 have been audited by BDO Canada LLP, chartered accountants and licensed public accountants, in accordance with Canadian generally accepted auditing standards and the standards of the Public Company Accounting Oversight Board (United States).
| (Signed)“Peter N. Cowley” | (Signed) “Donat K. Madilo” | |
| Peter N. Cowley | Donat K. Madilo | |
| President and Chief Executive Officer | Chief Financial Officer |
Toronto, Canada
March 26, 201331, 2014
Independent Auditor’s Report
To the Shareholders of Loncor Resources Inc.
We have audited the accompanying consolidated financial statements of Loncor Resources Inc., which comprise the consolidated statements of financial position as at December 31, 20122013 and 20112012 and the consolidated statements of comprehensive (loss) income, changes in equity, and cash flows for each of the years ended December 31, 2012,2013, December 31, 20112012, and December 31, 2010, 2011,and a summary of significant accounting policies and other explanatory information.
Management's Responsibility for the Consolidated Financial Statements
Management is responsible for the preparation and fair presentation of these consolidated financial statements in accordance with International Financial Reporting Standards as issued by the International Accounting Standards Board, and for such internal control as management determines is necessary to enable the preparation of consolidated financial statements that are free from material misstatement, whether due to fraud or error.
Auditor's Responsibility
Our responsibility is to express an opinion on these consolidated financial statements based on our audits. We conducted our audits in accordance with Canadian generally accepted auditing standards and the standards of the Public Company Accounting Oversight Board (United States). Those standards require that we comply with ethical requirements and plan and perform the audit to obtain reasonable assurance about whether the consolidated financial statements are free from material misstatement.
An audit involves performing procedures to obtain audit evidence about the amounts and disclosures in the consolidated financial statements. The procedures selected depend on the auditor's judgment, including the assessment of the risks of material misstatement of the consolidated financial statements, whether due to fraud or error. In making those risk assessments, the auditor considers internal control relevant to the entity's preparation and fair presentation of the consolidated financial statements in order to design audit procedures that are appropriate in the circumstances, but not for the purpose of expressing an opinion on the effectiveness of the Company’s internal controls. An audit also includes evaluating the appropriateness of accounting policies used and the reasonableness of accounting estimates made by management, as well as evaluating the overall presentation of the consolidated financial statements.
We believe that the audit evidence we have obtained in our audits is sufficient and appropriate to provide a basis for our audit opinion.
Opinion
In our opinion, the consolidated financial statements present fairly, in all material respects, the financial position of Loncor Resources Inc. as at December 31, 20122013 and 20112012 and its financial performance and its cash flows for the years ended December 31, 2012,2013, December 31, 20112012 and December 31, 20102011 in accordance with International Financial Reporting Standards as issued by the International Accounting Standards Board.
/s/ BDO Canada LLPEmphasis of Matter
Chartered Accountants,
Licensed Public AccountantsWithout qualifying our opinion, we draw attention to Note 2 in the consolidated financial statements which indicates the Company produced a net loss of $27,224,451 for the year ended December 31, 2013 and as of that date the Company’s accumulated deficit was $52,771,536. These conditions, along with other matters as set forth in Note 2, indicate the existence of a material uncertainty that casts substantial doubt on the Company’s ability to continue as a going concern. Management’s plans in regard to these matters are also described in Note 2. The consolidated financial statements do not include any adjustments that might result from the outcome of this uncertainty.
Toronto, Canada
March 26, 2013
| /s/ BDO Canada LLP | |
| Chartered Accountants, | |
| Licensed Public Accountants | |
| Toronto, Canada | |
| March 31, 2014 |
| Loncor Resources Inc. |
| Consolidated Statements of Financial Position |
| (Expressed in U.S. dollars) |
| Notes | December 31, 2012 | December 31, 2011 | Notes | December 31, 2013 | December 31, 2012 | |||||||||||||||||
| $ | $ | $ | $ | |||||||||||||||||||
| Assets | ||||||||||||||||||||||
| Current Assets | ||||||||||||||||||||||
| Cash and cash equivalents | 10,741,699 | 14,667,658 | 324,928 | 10,741,699 | ||||||||||||||||||
| Advances receivable | 5 | 152,022 | 130,441 | 5 | 388,763 | 152,022 | ||||||||||||||||
| Due from related parties | 6 | 17,760 | - | 6 | 41,946 | 17,760 | ||||||||||||||||
| Prepaid expenses and deposits | 358,309 | 132,593 | 88,560 | 358,309 | ||||||||||||||||||
| Total Current Assets | 11,269,790 | 14,930,692 | 844,197 | 11,269,790 | ||||||||||||||||||
| Non-Current Assets | ||||||||||||||||||||||
| Property, plant and equipment | 7 | 749,243 | 778,955 | 7 | 444,486 | 749,243 | ||||||||||||||||
| Exploration and evaluation assets | 8 | 48,255,201 | 30,090,363 | 8 | 30,893,458 | 48,255,201 | ||||||||||||||||
| Intangibles | 9 | 1 | 1 | |||||||||||||||||||
| Intangible assets | 9 | 1 | 1 | |||||||||||||||||||
| Total Non-Current Assets | 49,004,445 | 30,869,319 | 31,337,945 | 49,004,445 | ||||||||||||||||||
| Total Assets | 60,274,235 | 45,800,011 | 32,182,142 | 60,274,235 | ||||||||||||||||||
| Liabilities and Shareholders' Equity | ||||||||||||||||||||||
| Current Liabilities | ||||||||||||||||||||||
| Accounts payable | 11 | 976,542 | 238,327 | 11 | 261,299 | 976,542 | ||||||||||||||||
| Accrued liabilities | 208,143 | 152,907 | 307,535 | 208,143 | ||||||||||||||||||
| Due to related parties | 6 | - | 152,833 | 6 | 5,088 | - | ||||||||||||||||
| Employee retention allowance | 17 | 490,280 | 335,720 | 17 | 629,554 | 490,280 | ||||||||||||||||
| Total Current Liabilities | 1,674,965 | 879,787 | 1,203,476 | 1,674,965 | ||||||||||||||||||
| Common share purchase warrants | 12b | - | 826,862 | |||||||||||||||||||
| Deferred taxes | 18 | 813,138 | 757,815 | 18 | - | 813,138 | ||||||||||||||||
| Total Liabilities | 2,488,103 | 2,464,464 | 1,203,476 | 2,488,103 | ||||||||||||||||||
| Commitments | 14 | 14 | ||||||||||||||||||||
| Shareholders' Equity | ||||||||||||||||||||||
| Share capital | 12 | 75,715,014 | 60,044,719 | 12 | 75,715,014 | 75,715,014 | ||||||||||||||||
| Reserves | 7,618,203 | 6,756,090 | 8,035,188 | 7,618,203 | ||||||||||||||||||
| Deficit | (25,547,085 | ) | (23,465,262 | ) | (52,771,536 | ) | (25,547,085 | ) | ||||||||||||||
| Total Shareholders' Equity | 57,786,132 | 43,335,547 | 30,978,666 | 57,786,132 | ||||||||||||||||||
| Total Liabilities and Shareholders' Equity | 60,274,235 | 45,800,011 | 32,182,142 | 60,274,235 | ||||||||||||||||||
| Common shares | ||||||||||||||||||||||
| Authorized | Unlimited | Unlimited | Unlimited | Unlimited | ||||||||||||||||||
| Issued and outstanding | 73,439,732 | 58,172,735 | 73,439,732 | 73,439,732 | ||||||||||||||||||
The accompanying notes are an integral part of these consolidated financial statements.
Approved and authorized for issue by the Board of Directors on March 26, 2013.
24, 2014. Signed on behalf of the Board of Directors by:
| /s/ Peter N. Cowley | /s/ Arnold T. Kondrat | |
| Peter N. Cowley | Arnold T. Kondrat | |
| Director | Director |
| Loncor Resources Inc. |
| Consolidated Statements of Comprehensive (Loss) Income |
| (Expressed in U.S. dollars) |
| For the years ended | For the years ended | |||||||||||||||||||||||||||||
| Notes | December 31, 2012 | December 31, 2011 | December 31, 2010 | Notes | December 31, 2013 | December 31, 2012 | December 31, 2011 | |||||||||||||||||||||||
| $ | $ | $ | $ | $ | $ | |||||||||||||||||||||||||
| Expenses | ||||||||||||||||||||||||||||||
| Consulting, management and professional fees | 673,277 | 1,191,315 | 817,576 | 233,092 | 673,277 | 1,191,315 | ||||||||||||||||||||||||
| Employee benefits | 993,835 | 1,015,040 | 585,543 | 1,054,627 | 993,835 | 1,015,040 | ||||||||||||||||||||||||
| Office and sundry | 281,997 | 375,835 | 78,023 | 366,713 | 281,997 | 375,835 | ||||||||||||||||||||||||
| Compensation expense-share-based payment | 13 | 484,897 | 1,671,475 | 1,211,529 | 13 | 259,559 | 484,897 | 1,671,475 | ||||||||||||||||||||||
| Travel and promotion | 226,310 | 328,439 | 154,519 | 73,037 | 226,310 | 328,439 | ||||||||||||||||||||||||
| Depreciation | 30,517 | 13,508 | 851 | 35,193 | 30,517 | 13,508 | ||||||||||||||||||||||||
| Interest and bank expenses | 1,156 | 1,066 | 1,231 | 3,185 | 1,156 | 1,066 | ||||||||||||||||||||||||
| Impairment loss | - | - | 957,318 | |||||||||||||||||||||||||||
| Foreign exchange loss (gain) | 185,099 | 1,896 | (307,662 | ) | ||||||||||||||||||||||||||
| Impairment of exploration and evaluation assets | 8 | 25,801,443 | - | - | ||||||||||||||||||||||||||
| Foreign exchange loss | 252,111 | 185,099 | 1,896 | |||||||||||||||||||||||||||
| (2,877,088 | ) | (4,598,574 | ) | (3,498,928 | ) | (28,078,960 | ) | (2,877,088 | ) | (4,598,574 | ) | |||||||||||||||||||
| Interest income | 82,324 | 109,697 | 32,798 | 41,371 | 82,324 | 109,697 | ||||||||||||||||||||||||
| Gain (loss) on derivative financial instruments | 12b | 768,264 | 5,215,060 | (2,405,857 | ) | |||||||||||||||||||||||||
| Gain on derivative financial instruments | 12b | - | 768,264 | 5,215,060 | ||||||||||||||||||||||||||
| (Loss) income before tax | (2,026,500 | ) | 726,183 | (5,871,987 | ) | |||||||||||||||||||||||||
| (Loss) Income before income tax | (28,037,589 | ) | (2,026,500 | ) | 726,183 | |||||||||||||||||||||||||
| Income tax expense | (55,323 | ) | (193,023 | ) | (118,041 | ) | ||||||||||||||||||||||||
| Income tax recovery (expense) | 813,138 | (55,323 | ) | (193,023 | ) | |||||||||||||||||||||||||
| Comprehensive (loss) income for the year | (2,081,823 | ) | 533,160 | (5,990,028 | ) | (27,224,451 | ) | (2,081,823 | ) | 533,160 | ||||||||||||||||||||
| (Loss) earnings per share, basic and diluted | $ | (0.03 | ) | $ | 0.01 | $ | (0.14 | ) | 12c | (0.37 | ) | (0.03 | ) | 0.01 | ||||||||||||||||
The accompanying notes are an integral part of these consolidated financial statements.
| Loncor Resources Inc. |
| Consolidated Statements of Changes in Equity |
| (Expressed in U.S. dollars) |
| Common shares | ||||||||||||||||||||||||
| Notes | Number of shares | Amount | Reserves | Deficit | Total Shareholders' equity | |||||||||||||||||||
| Balance at January 1, 2010 | 30,753,247 | $ | 20,341,246 | $ | 872,795 | $ | (18,008,394 | ) | $ | 3,205,647 | ||||||||||||||
| Loss for the year | - | - | - | (5,990,028 | ) | (5,990,028 | ) | |||||||||||||||||
| Issued share capital | 14,166,500 | 16,700,129 | - | - | 16,700,129 | |||||||||||||||||||
| Warrants exercised | 2,400,000 | 3,462,577 | - | - | 3,462,577 | |||||||||||||||||||
| Compensation option exercises | 97,998 | 132,007 | - | - | 132,007 | |||||||||||||||||||
| Share based compensation | - | - | 2,548,890 | - | 2,548,890 | |||||||||||||||||||
| Common share purchase warrants | - | (3,600,465 | ) | - | - | (3,600,465 | ) | |||||||||||||||||
| Balance at December 31, 2010 | 47,417,745 | 37,035,494 | 3,421,685 | (23,998,422 | ) | 16,458,757 | ||||||||||||||||||
| Income for the year | - | - | - | 533,160 | 533,160 | |||||||||||||||||||
| Issued share capital | 10,200,000 | 24,159,362 | - | - | 24,159,362 | |||||||||||||||||||
| Issuance costs | - | (1,444,127 | ) | - | - | (1,444,127 | ) | |||||||||||||||||
| Compensation option exercises | 343,994 | 596,614 | (383,990 | ) | - | 212,624 | ||||||||||||||||||
| Warrants issued | - | (835,811 | ) | 835,811 | - | - | ||||||||||||||||||
| Share-based payments | - | - | 2,882,584 | - | 2,882,584 | |||||||||||||||||||
| Warrants exercised | 210,996 | 533,187 | - | - | 533,187 | |||||||||||||||||||
| Balance at December 31, 2011 | 58,172,735 | 60,044,719 | 6,756,090 | (23,465,262 | ) | 43,335,547 | ||||||||||||||||||
| Loss for the year | - | - | - | (2,081,823 | ) | (2,081,823 | ) | |||||||||||||||||
| Issued share capital | 12a | 14,095,000 | 15,135,704 | - | - | 15,135,704 | ||||||||||||||||||
| Issuance costs | - | (1,106,212 | ) | - | - | (1,106,212 | ) | |||||||||||||||||
| Compensation option exercises | 12a | 47,998 | 100,531 | (41,699 | ) | - | 58,832 | |||||||||||||||||
| Warrants issued | 12b | - | (159,409 | ) | 159,409 | - | - | |||||||||||||||||
| Share-based payments | 13 | - | - | 744,403 | - | 744,403 | ||||||||||||||||||
| Warrants exercised | 12b | 1,123,999 | 1,699,681 | - | - | 1,699,681 | ||||||||||||||||||
| Balance at December 31, 2012 | 73,439,732 | $ | 75,715,014 | $ | 7,618,203 | $ | (25,547,085 | ) | $ | 57,786,132 | ||||||||||||||
| Common shares | ||||||||||||||||||||||
| Number of | Total Shareholders' | |||||||||||||||||||||
| Notes | shares | Amount | Reserves | Deficit | equity | |||||||||||||||||
| Balance at January 1, 2011 | 47,417,745 | $ | 37,035,494 | $ | 3,421,685 | $ | (23,998,422 | ) | $ | 16,458,757 | ||||||||||||
| Income for the year | - | - | - | 533,160 | 533,160 | |||||||||||||||||
| Issued share capital | 10,200,000 | 24,159,362 | - | - | 24,159,362 | |||||||||||||||||
| Issuance costs | - | (1,444,127 | ) | - | - | (1,444,127 | ) | |||||||||||||||
| Compensation option exercises | 343,994 | 596,614 | (383,990 | ) | - | 212,624 | ||||||||||||||||
| Warrants issued | - | (835,811 | ) | 835,811 | - | - | ||||||||||||||||
| Share-based payments | 13 | - | - | 2,882,584 | - | 2,882,584 | ||||||||||||||||
| Warrants exercised | 210,996 | 533,187 | - | - | 533,187 | |||||||||||||||||
| Balance at December 31, 2011 | 58,172,735 | $ | 60,044,719 | $ | 6,756,090 | $ | (23,465,262 | ) | $ | 43,335,547 | ||||||||||||
| Loss for the year | - | - | - | (2,081,823 | ) | (2,081,823 | ) | |||||||||||||||
| Issued share capital | 12a | 14,095,000 | 15,135,704 | - | - | 15,135,704 | ||||||||||||||||
| Issuance costs | - | (1,106,212 | ) | - | - | (1,106,212 | ) | |||||||||||||||
| Compensation option exercises | 12a | 47,998 | 100,531 | (41,699 | ) | - | 58,832 | |||||||||||||||
| Warrants issued | 12b | - | (159,409 | ) | 159,409 | - | - | |||||||||||||||
| Share-based payments | 13 | - | - | 744,403 | - | 744,403 | ||||||||||||||||
| Warrants exercised | 12a | 1,123,999 | 1,699,681 | - | - | 1,699,681 | ||||||||||||||||
| Balance at December 31, 2012 | 73,439,732 | $ | 75,715,014 | $ | 7,618,203 | $ | (25,547,085 | ) | $ | 57,786,132 | ||||||||||||
| Loss for the period | - | - | - | (27,224,451 | ) | (27,224,451 | ) | |||||||||||||||
| Share-based payments | 13 | - | - | 416,985 | - | 416,985 | ||||||||||||||||
| Balance at December 31, 2013 | 73,439,732 | $ | 75,715,014 | $ | 8,035,188 | $ | (52,771,536 | ) | $ | 30,978,666 | ||||||||||||
The accompanying notes are an integral part of these consolidated financial statements.
| F-7 |
| Loncor Resources Inc. |
| Consolidated Statements of Cash Flows |
| (Expressed in U.S. dollars) |
| For the years ended | For the years ended | |||||||||||||||||||||||||||||
| Notes | December 31, 2012 | December 31, 2011 | December 31, 2010 | Notes | December 31, 2013 | December 31, 2012 | December 31, 2011 | |||||||||||||||||||||||
| $ | $ | $ | $ | $ | $ | |||||||||||||||||||||||||
| Cash flows from operating activities | ||||||||||||||||||||||||||||||
| (Loss) income for the year | (2,081,823 | ) | 533,160 | (5,990,028 | ) | (27,224,451 | ) | (2,081,823 | ) | 533,160 | ||||||||||||||||||||
| Adjustments to reconcile (loss) income to net cash used in operating activities | ||||||||||||||||||||||||||||||
| Depreciation | 30,517 | 13,508 | 851 | 35,193 | 30,517 | 13,508 | ||||||||||||||||||||||||
| Share-based payments - employee compensation | 13 | 484,897 | 1,671,475 | 1,211,529 | 13 | 259,559 | 484,897 | 1,671,475 | ||||||||||||||||||||||
| Share-based payments - consultant fees | 13 | 75,098 | 567,699 | 235,046 | 13 | 2,393 | 75,098 | 567,699 | ||||||||||||||||||||||
| Employee retention allowance | 17 | 72,560 | 73,996 | 210,036 | 17 | 76,316 | 72,560 | 73,996 | ||||||||||||||||||||||
| Impairment loss | - | - | 957,318 | |||||||||||||||||||||||||||
| Income tax expense | 55,323 | 193,023 | 118,041 | |||||||||||||||||||||||||||
| Impairment of exploration and evaluation assets | 8 | 25,801,443 | - | - | ||||||||||||||||||||||||||
| Income tax (recovery) expense | (813,138 | ) | 55,323 | 193,023 | ||||||||||||||||||||||||||
| (Gain) Loss on disposition of capital assets | 7 | (1,237 | ) | |||||||||||||||||||||||||||
| (Gain) Loss on derivative financial instruments | (768,264 | ) | (5,215,060 | ) | 2,405,857 | - | (768,264 | ) | (5,215,060 | ) | ||||||||||||||||||||
| Changes in non-cash working capital | ||||||||||||||||||||||||||||||
| Advances receivable | (21,581 | ) | (84,152 | ) | (43,491 | ) | (111,285 | ) | (21,581 | ) | (84,152 | ) | ||||||||||||||||||
| Prepaid expenses and deposits | (225,389 | ) | 4,003 | (37,933 | ) | 269,749 | (225,389 | ) | 4,003 | |||||||||||||||||||||
| Due to/from related parties | (17,760 | ) | 2,346 | 83,692 | ||||||||||||||||||||||||||
| Due (from) to related parties | (24,186 | ) | (17,760 | ) | 2,346 | |||||||||||||||||||||||||
| Accounts payable | 55,500 | (170,635 | ) | 364,186 | (223,921 | ) | 55,500 | (170,635 | ) | |||||||||||||||||||||
| Accrued liabilities | (26,243 | ) | 79,043 | 26,289 | 183,889 | (26,243 | ) | 79,043 | ||||||||||||||||||||||
| Net cash used in operating activities | (2,367,165 | ) | (2,331,594 | ) | (458,607 | ) | (1,769,676 | ) | (2,367,165 | ) | (2,331,594 | ) | ||||||||||||||||||
| Cash flows from investing activities | ||||||||||||||||||||||||||||||
| Acquisition of property, plant, and equipment | (327,343 | ) | (498,864 | ) | (647,553 | ) | (197,626 | ) | (327,343 | ) | (498,864 | ) | ||||||||||||||||||
| Disposition of capital assets | 300 | - | - | |||||||||||||||||||||||||||
| Expenditures on exploration and evaluation assets | (16,963,931 | ) | (16,482,374 | ) | (7,818,987 | ) | (8,454,857 | ) | (16,963,931 | ) | (16,482,374 | ) | ||||||||||||||||||
| Net cash used in investing activities | (17,291,274 | ) | (16,981,238 | ) | (8,466,540 | ) | (8,652,183 | ) | (17,291,274 | ) | (16,981,238 | ) | ||||||||||||||||||
| Cash flows from financing activities | ||||||||||||||||||||||||||||||
| Proceeds from share issuance, net of issuance costs | 14,185,399 | 22,715,237 | 20,720,403 | - | 14,185,399 | 22,715,237 | ||||||||||||||||||||||||
| Repayment of notes | - | - | (2,403,508 | ) | ||||||||||||||||||||||||||
| Due (from) to related parties | (152,833 | ) | 34,068 | (478,140 | ) | |||||||||||||||||||||||||
| Due to (from) related parties | 5,088 | (152,833 | ) | 34,068 | ||||||||||||||||||||||||||
| Proceeds from exercise of compensation options | 64,571 | 305,602 | - | - | 64,571 | 305,602 | ||||||||||||||||||||||||
| Proceeds from exercise of warrants | 1,635,343 | 475,809 | - | - | 1,635,343 | 475,809 | ||||||||||||||||||||||||
| Net cash provided from financing activities | 15,732,480 | 23,530,716 | 17,838,755 | 5,088 | 15,732,480 | 23,530,716 | ||||||||||||||||||||||||
| Net (decrease) increase in cash during the year | (3,925,959 | ) | 4,217,884 | 8,913,608 | (10,416,771 | ) | (3,925,959 | ) | 4,217,884 | |||||||||||||||||||||
| Cash and cash equivalents, beginning of the year | 14,667,658 | 10,449,774 | 1,536,166 | 10,741,699 | 14,667,658 | 10,449,774 | ||||||||||||||||||||||||
| Cash and cash equivalents, end of the year | 10,741,699 | 14,667,658 | 10,449,774 | 324,928 | 10,741,699 | 14,667,658 | ||||||||||||||||||||||||
Supplemental cash flow information (Note 16)
The accompanying notes are an integral part of these consolidated financial statements.
| Loncor Resources Inc. |
| Notes to Consolidated Financial Statements |
| (Expressed in U.S. dollars, except for per share |
| 1. | Corporate Information |
Loncor Resources Inc. (the "Company") is a corporation governed by the OntarioBusiness Corporations Act. The Company changed its name from Nevada Bob’s International Inc. on November 28, 2008 upon completion of the acquisition by the Company of Loncor Resources Inc. The principal business of the Company is the acquisition and exploration of mineral properties.
These consolidated financial statements as at December 31, 20122013 and 2011December 31, 2012, and for the years ended December 31, 2013, 2012, 2011 and 20102011 include the accounts of the Company and of its wholly owned subsidiaries in the Democratic Republic of the Congo (the “Congo”), Loncor Resources Congo Sprl, and in the U.S., Nevada Bob’s Franchising, Inc., respectively.
The Company is a publicly traded company whose outstanding common shares are listed for trading on the TSX VentureToronto Stock Exchange and on the NYSE MKT LLC. The head office and principal place of business of the Company is located at 1 First Canadian Place, 100 King St. West, Suite 7070, Toronto, Ontario, M5X 1E3, Canada.
| 2. | Basis of Preparation |
These consolidated financial statements are prepared on a going concern basis, which assumes that the Company will continue in operation for a reasonable period of time and will be able to realize its assets and discharge its liabilities in the normal course of operations. The Company has not generated revenues from operations. The Company produced a net loss of $2,081,823$27,224,451 for the year ended December 31, 2012,2013, and, as of that date, the Company’s accumulated deficit was $25,547,085. However,$52,771,536 which casts substantial doubt on the Company has sufficient cash resourcesCompany’s ability to meet its obligations for at least twelve months from the end of the reporting period.continue as a going concern. The Company is insubject to the development stagerisks and is dependent on itschallenges experienced by other companies at a comparable stage. These risks include, but are not limited to, continuing losses and the ability to secure adequate financing or to complete corporate transactions to meet the minimum capital required to successfully raise additional financing for developmentcomplete its projects and fund other operating expenses. Development of the mineral properties. AlthoughCompany’s current projects to the Company has been successful inproduction stage will require significant financing. Given the past in obtaining financing, there is no assurancecurrent economic climate, the ability to raise funds may prove difficult. The consolidated financial statements do not reflect adjustments to the carrying amount of assets and liabilities and the reported expenses and financial position classifications that it willwould be able to obtain adequate financing innecessary should the future or that such financing willgoing concern assumption not be available on acceptable terms.appropriate.
| a) | Statement of compliance |
These consolidated financial statements as at December 31, 2013 and 2012 and for the yearyears ended December 31, 2013, 2012 and 2011 have been prepared in accordance with International Financial Reporting Standards (“IFRS”) as issued by the International Accounting Standards Board (“IASB”).
The accompanying financial information as ofat December 31, 2013 and 2012 and for years ended December 31, 2013, 2012 2011 and 2010,2011, have been prepared in accordance with those IASB standards and IFRS Interpretations Committee (“IFRIC”) interpretations issued and effective, or issued and early-adopted, at December 31, 2012.2013.
The date the Company’s Board of Directors approved these consolidated financial statements was March 26, 2013.24, 2014.
| Loncor Resources Inc. |
| Notes to Consolidated Financial Statements |
| (Expressed in U.S. dollars, except for per share |
| b) | Basis of measurement |
These consolidated financial statements have been prepared on the historical cost basis, except for certain financial assets which are presented at fair value, as explained in the accounting policies set out in Note 3.
| 3. | Summary of Significant Accounting Policies |
The accounting policies set out below have been applied consistently by all group entities and to all periods presented in these consolidated financial statements, unless otherwise indicated. The accounting policies have been applied consistently by all group entities and for all periods presented.
| a) | Basis of Consolidation |
| i. | Subsidiaries |
Subsidiaries are entities controlled by the Company. Control exists when the Company has the power, directly or indirectly, to govern the financial and operating policies of an entity so as to obtain benefits from its activities. This control is generally evidenced through owning more than 50% of the voting rights or currently exercisable potential voting rights of a company’s share capital. The financial statements of subsidiaries are included in the consolidated financial statements of the Company from the date that control commences until the date that control ceases. Consolidation accounting is applied for all of the Company’s wholly-owned subsidiaries (see note 4).
| ii. | Transactions eliminated on consolidation |
Inter-company balances, transactions, and any unrealized income and expenses, are eliminated in preparing the consolidated financial statements.
Unrealized gains arising from transactions with associates are eliminated against the investment to the extent of the Company’s interest in the investee. Unrealized losses are eliminated in the same way as unrealized gains, but only to the extent that there is no evidence of impairment.
| b) | Use of Estimates and Judgments |
The preparation of these consolidated financial statements in conformity with IFRS requires management to make judgments, estimates and assumptions that affect the application of accounting policies and the reported amounts of assets, liabilities, income and expenses. Actual results may differ from these estimates.
Estimates and underlying assumptions are reviewed on an ongoing basis. Revisions to accounting estimates are recognized in the period in which the estimates are revised and in any future periods affected. Information about critical judgments in applying accounting policies and estimates that have the most significant effect on the amounts recognized in these consolidated financial statements is included in the following notes:
Estimates:
| i. | Impairment |
Assets, including property, plant and equipment, and exploration and evaluation assets, are reviewed for impairment whenever events or changes in circumstances indicate that their carrying amounts exceed their recoverable amounts. The assessment of the fair value often requires estimates and assumptions such as discount rates, exchange rates, commodity prices, rehabilitation and restoration costs, future capital requirements and future operating performance. Changes in such estimates could impact recoverable values of these assets. Estimates are reviewed regularly by management.
| Loncor Resources Inc. |
| Notes to Consolidated Financial Statements |
| (Expressed in U.S. dollars, except for per share |
| ii. | Share-based payment transactions |
The Company measures the cost of equity-settled transactions with employees by reference to the fair value of the equity instruments at the date at which they are granted. Estimating fair value for share-based payment transactions requires determining the most appropriate valuation model, which is dependent on the terms and conditions of the grant. This estimate also requires determining the most appropriate inputs to the valuation model including the expected life of the stock option, volatility and dividend yield and making assumptions about them. The assumptions and models used for estimating fair value for share-based payment transactions are disclosed in Note 13.
| iii. |
The Company measures the cost of common share purchase warrants by reference to the fair value of the liability at the date at which they are granted and subsequent reporting date. Estimating fair value for common share purchase warrants requires determining the most appropriate valuation model, which is dependent on the terms and conditions of the grant. This estimate also requires determining the most appropriate inputs to the valuation model including the expected life of the warrant, volatility and dividend yield and making assumptions about them. The assumptions and models used for estimating fair value for common share purchase warrants are disclosed in Note 12b.
Judgments:
The amount recognized as provision, including legal, contractual, constructive and other exposures or obligations, is the best estimate of the consideration required to settle the related liability, including any related interest charges, taking into account the risks and uncertainties surrounding the obligation. In addition, contingencies will only be resolved when one or more future events occur or fail to occur. Therefore assessment of contingencies inherently involves the exercise of significant judgment and estimates of the outcome of future events. The Company assesses its liabilities and contingencies based upon the best information available, relevant tax laws and other appropriate requirements.
| Exploration and evaluation expenditure |
The application of the Company’s accounting policy for exploration and evaluation expenditure requires judgment in determining whether it is likely that future economic benefits will flow to the Company, which may be based on assumptions about future events or circumstances. Estimates and assumptions made may change if new information becomes available. There are a few circumstances that would warrant a test for impairment, which include: the expiry of the right to explore, substantive expenditure on further exploration is not planned, exploration for and evaluation of the mineral resources in the area have not led to discovery of commercially viable quantities, and/or sufficient data exists to show that the carrying amount of the asset is unlikely to be recovered in full from successful development or by sale. If information becomes available suggesting impairment, the amount capitalized is written off in the statement of comprehensive (loss) income during the period the new information becomes available.
Judgments:
| Provisions and contingencies |
The amount recognized as provision, including legal, contractual, constructive and other exposures or obligations, is the best estimate of the consideration required to settle the related liability, including any related interest charges, taking into account the risks and uncertainties surrounding the obligation. In addition, contingencies will only be resolved when one or more future events occur or fail to occur. Therefore assessment of contingencies inherently involves the exercise of significant judgment and estimates of the outcome of future events. The Company assesses its liabilities and contingencies based upon the best information available, relevant tax laws and other appropriate requirements.
| ii. | Income taxes |
The Company is subject to income taxes in various jurisdictions and subject to various rates and rules of taxation. Significant judgment is required in determining the provision for income taxes. There are many transactions and calculations undertaken during the ordinary course of business for which the ultimate tax determination is uncertain. The Company recognizes liabilities for anticipated tax audit issues based on the Company’s current understanding of the tax law. Where the final tax outcome of these matters is different from the amounts that were initially recorded, such differences will impact the current and deferred tax provisions in the period in which such determination is made.
In addition, the Company has recognized deferred tax assets relating to tax losses carried forward to the extent it is probable that there iswill be sufficient taxable income relating to the same taxation authority and the same subsidiary against which the unused tax losses can be utilized. However, future realization of the tax losses also depends on the ability of the entity to satisfy certain tests at the time the losses are recouped, including current and future economic conditions, production rates and production costs.
| Title to |
Although the Company has taken steps to verify title to mineral properties in which it has an interest, these procedures do not guarantee the Company’s title. Such properties may be subject to prior agreements or transfers and title may be affected by undetected defects.
| Loncor Resources Inc. |
| Notes to Consolidated Financial Statements |
| As at and for the years ended December 31, 2013 and 2012 |
| (Expressed in U.S. dollars, except for per share amount) |
| c) | Foreign Currency Translation |
| i. | Functional and presentation currency |
These consolidated financial statements are presented in United States dollars (“$”), which is the Company’s functional and presentation currency. References to Cdn$ represent Canadian dollars.
| ii. | Foreign currency transactions |
The functional currency for each of the Company’s subsidiaries and any associates is the currency of the primary economic environment in which the entity operates. Transactions entered into by the Company’s subsidiaries and any associates in a currency other than the currency of the primary economic environment in which they operate (their "functional currency") are recorded at the rates ruling when the transactions occur except depreciation and amortization which are translated at the rates of exchange applicable to the related assets, with any gains or losses recognized in the consolidated statements of comprehensive (loss) income. Foreign currency monetary assets and liabilities are translated at current rates of exchange with the resulting gain or losses recognized in the consolidated statements of comprehensive (loss) income. Exchange differences arising on the retranslation of unsettled monetary assets and liabilities are recognized immediately in profit or loss. Non-monetary assets and liabilities are translated using the historical exchange rates. Non-monetary assets and liabilities measured at fair value in a foreign currency are translated using the exchange rates at the date when the fair value is determined.
| d) | Cash and Cash Equivalents |
Cash and cash equivalents includes cash on hand, deposits held at call with financial institutions, and other short-term, highly liquid investments with original maturities of three months or less that are readily convertible to known amounts.
| e) | Financial Assets |
A financial asset is classified as either financial assets at fair value through profit or loss (“FVTPL”), loans and receivables, held to maturity investments (“HTM”), or available for sale financial assets (“AFS”), as appropriate at initial recognition and, except in very limited circumstances, the classification is not changed subsequently. The classification is determined at initial recognition and depends on the nature and purpose of the financial asset. A financial asset is derecognized when contractual rights to the asset’s cash flows expire or if substantially all the risks and rewards of the asset are transferred.
| i. | Financial assets at FVTPL |
A financial asset is classified as FVTPL when the financial asset is held for trading or it is designated upon initial recognition as an FVTPL. A financial asset is classified as held for trading if (1) it has been acquired principally for the purpose of selling or repurchasing in the near term; (2) it is part of an identified portfolio of financial instruments that the Company manages and has an actual pattern of short term profit taking; or (3) it is a derivative that is not designated and effective as a hedging instrument. Financial assets at FVTPL are carried in the consolidated statements of financial position at fair value with changes in fair value recognized in profit or loss. Transaction costs are expensed as incurred.
The Company has classified cash and cash equivalents as FVTPL.
| ii. | Loans and receivables |
Trade receivables, loans and other receivables that have fixed or determinable payments that are not quoted in an active market are classified as loans and receivables.
Loans and receivables are initially recognized at fair value plus transaction costs that are directly attributable to their acquisition or issue, and are subsequently carried at amortized cost less losses for impairment. The impairment loss of receivables is based on a review of all outstanding amounts at period end. Bad debts are written off during the period in which they are identified.Amortized cost is calculated taking into account any discount or premium on acquisition and includes fees that are an integral part of the effective interest rate and transaction costs. Gains and losses are recognized in the statements of comprehensive (loss) income when the loans and receivables are derecognized or impaired, as well as through the amortization process. The Company has classified advances receivable and balances due from related parties as loans and receivables.
| Loncor Resources Inc. |
| Notes to Consolidated Financial Statements |
| As at and for the years ended December 31, 2013 and 2012 |
| (Expressed in U.S. dollars, except for per share amount) |
| iii. | AFS financial assets |
Non-derivative financial assets not included in the above categories are classified as AFS financial assets. They are carried at fair value with changes in fair value generally recognized in other comprehensive loss and accumulated in the AFS reserve. Impairment losses are recognized in profit or loss. Purchases and sales of AFS financial assets are recognized on settlement date with any change in fair value between trade date and settlement date being recognized in the AFS reserve. On sale, the cumulative gain or loss recognized in other comprehensive income is reclassified from the AFS reserve to profit or loss. The Company has not designated any of its financial assets as AFS.
| iv. | Impairment of financial assets |
The Company assesses at each reporting date whether a financial asset or a group of financial assets is impaired. A financial asset or group of financial assets is deemed to be impaired, if, and only if, there is objective evidence of impairment as a result of one or more events that has occurred after the initial recognition of the asset and that event has an impact on the estimated future cash flows of the financial asset or the group of financial assets that can be reliably estimated.
For financial assets carried at amortized cost, the amount of the impairment is the difference between the asset’s carrying amount and the present value of estimated future cash flows, discounted at the asset’s original effective rate.
The carrying amount of all financial assets is directly reduced by the impairment loss. The carrying amount of trade receivables is reduced through the use of an allowance account. Associated allowances are written off when there is no realistic prospect of future recovery and all collateral has been realized or has been transferred to the Company. Subsequent recoveries of amounts previously written off are credited against the allowance account. Changes in the carrying amount of the allowance account are recognized in the statement of comprehensive (loss) income. A provision for impairment is made in relation to advances receivable, and an impairment loss is recognized in profit and loss when there is objective evidence that the Company will not be able to collect all of the amounts due under the original terms. The carrying amount of the receivable is reduced through use of an allowance account.
With the exception of AFS equity instruments, if in a subsequent period the amount of impairment loss decreases and the decrease relates to an event occurring after the impairment was recognized, the previously recognized impairment loss is reversed through profit or loss. On the date of impairment reversal, the carrying amount of the financial asset cannot exceed its amortized cost had the impairment not been recognized. Reversal for AFS equity instruments are not recognized in profit or loss.
| v. | Effective interest method |
The effective interest method calculates the amortized cost of a financial instrument asset or liability and allocates interest income over the corresponding period. The effective interest rate is the rate that discounts estimated future cash receipts over the expected life of the financial asset or liability, or where appropriate, a shorter period. Income is recognized on an effective interest basis for debt instruments other than those financial assets classified as FVTPL.
| f) | Financial Liabilities |
Financial liabilities are classified as FVTPL, or other financial liabilities, as appropriate upon initial recognition. A financial liability is derecognized when the obligation under the liability is discharged, cancelled or expired.
| Loncor Resources Inc. |
| Notes to Consolidated Financial Statements |
| As at and for the years ended December 31, 2013 and 2012 |
| (Expressed in U.S. dollars, except for per share amount) |
| i. | Financial liabilities classified as other financial liabilities are initially recognized at fair value less directly attributable transaction costs. Subsequent to the initial recognition, other financial liabilities are measured at amortized cost using the effective interest method. The Company’s other financial liabilities include accounts payables, accrued liabilities, due to related parties and the employee retention allowance. |
| ii. | Financial liabilities classified as FVTPL include financial liabilities held for trading and financial liabilities designated upon initial recognition as FVTPL. Financial liabilities are classified as held-for-trading if they are acquired for the purpose of selling in the near term. This category includes derivative financial instruments (including separated embedded derivatives) held for trading unless they are designated as effective hedging instruments. Gains or losses on liabilities held for trading are recognized in the |
| g) | Earnings (loss) Per Share |
Basic earnings (loss) per share is computed by dividing the net income (loss) applicable by the weighted average number of common shares outstanding during the reporting period. Diluted earnings (loss) per share is computed by dividing the net income (loss) by the sum of the weighted average number of common shares issued and outstanding during the reporting period and all additional common shares for the assumed exercise of options and warrants outstanding for the reporting period, if dilutive.When the Company is incurring losses, basic and diluted loss per share are the same since including the exercise of outstanding options and share purchase warrants in the diluted loss per share calculation would be anti-dilutive.
| h) | Property, Plant and Equipment (“PPE”) |
| i. | Recognition and measurement |
Items of PPE are measured at cost less accumulated depreciation and accumulated impairment losses. Cost includes expenditures that are directly attributable to the acquisition of the asset. The cost of self-constructed assets includes the cost of materials, directed labor and any other cost directly attributable to bring the asset to the location and condition necessary to be capable of operating in the manner intended by the Company. Assets in the course of construction are capitalized in the capital construction in progress category and transferred to the appropriate category of PPE upon completion. When components of an asset have different useful lives, depreciation is calculated on each separate component.
| ii. | Subsequent costs |
The cost of replacing part of an item of PPE is recognized in the carrying amount of the item if it is probable that the future economic benefits embodied within the part will flow to the Company and its cost can be measured reliably. The carrying amount of the replaced part is derecognized and included in net loss. If the carrying amount of the replaced component is not known, it is estimated based on the cost of the new component less estimated depreciation. The costs of the day-to-day servicing of property, plant and equipment are recognized in the statement of comprehensive income (loss).
| iii. | Depreciation |
Depreciation is based on the cost of an asset less its residual value. Significant components of individual assets are assessed to determine whether a component has an estimated useful life that is different from that of the remainder of that asset, in which case that component is depreciated separately. Depreciation is recognized in profit or loss over the estimated useful lives of each item or component of an item of PPE as follows:
| · | Field camps and equipment | straight line over 4 Years | |
| · | Furniture and fixtures | straight line over 4 Years | |
| · | Office and communications equipment | straight line over 4 Years |
| Notes to Consolidated Financial Statements |
| As at and for the years ended December 31, 2013 and 2012 |
| (Expressed in U.S. dollars, except for per share amount) |
| · | Vehicles | straight line over 4 Years | |
| · | Leasehold improvements | straight line over the lease term | |
| · | Geophysical equipment | straight line over 4 years |
Depreciation methods, useful lives and residual values are reviewed annually and adjusted, if appropriate. Depreciation commences when an asset is available for use. Changes in estimates are accounted for prospectively.
iv. Gains and losses
Gains and losses on disposal of an item of PPE are determined by comparing the proceeds from disposal with the carrying amount of the PPE, and are recognized net within other income/expenses in profit or loss.
v. Repairs and maintenance
Repairs and maintenance costs are charged to expense as incurred, except when these repairs significantly extend the life of an asset or result in an operating improvement. In these instances the portion of these repairs relating to the betterment is capitalized as part of PPE.
vi. De-recognition
An item of PPE is derecognized upon disposal or when no future economic benefits are expected to arise from the continued use of the asset. Any gain or loss arising on de-recognition of the assets (calculated as the difference between the net disposal proceeds and the carrying amount of the item) is included in net income (loss) in the period the item is derecognized.
| i) | Exploration and Evaluation Assets |
All direct costs related to exploration and evaluation of mineral properties, net of incidental revenues, are capitalized under exploration and evaluation assets. Exploration and evaluation expenditures include such costs as acquisition of rights to explore; sampling, trenching and surveying costs; costs related to topography, geology, geochemistry and geophysical studies; drilling costs and costs in relation to technical feasibility and commercial viability of extracting a mineral resource.
A regular review of each property is undertaken to determine the appropriateness of continuing to carry forward costs in relation to exploration and evaluation of mineral properties. Should the carrying value of the expenditure not yet amortized exceed its estimated recoverable amount in any year, the excess is written off to the consolidated statements of comprehensive (loss) income.
| j) | Impairment of Non-Financial Assets |
The Company’s PPE, exploration and evaluation assets, and intangible assets are assessed for indication of impairment at each consolidated statements of financial position date. Exploration and evaluation assets are assessed for impairment when facts and circumstances suggest that the carrying amount of an exploration and evaluation asset may exceed its recoverable amount. When facts and circumstances suggest that the carrying amount exceeds the recoverable amount, an entity shall measure, present and disclose any resulting impairment in accordance with IAS 36 Impairment of Assets. Internal factors, such as budgets and forecasts, as well as external factors, such as expected future prices, costs and other market factors are also monitored to determine if indications of impairment exist. If any indication of impairment exists, an estimate of the asset’s recoverable amount is calculated. The recoverable amount is determined as the higher of the fair value less costs to sell for the asset and the asset’s value in use. This is determined for an individual asset, unless the asset does not generate cash inflows that are largely independent of those from other assets or the Company’s assets. If this is the case, the individual assets are grouped together into cash generating units (“CGU”) for impairment purposes. Such CGUs represent the lowest level for which there are separately identifiable cash inflows that are largely independent of the cash flows from other assets.
If the carrying amount of the asset exceeds its recoverable amount, the asset is impaired and an impairment loss is charged to the consolidated statements of comprehensive (loss) income so as to reduce the carrying amount to its recoverable amount (i.e., the higher of fair value less cost to sell and value in use). Fair value less cost to sell is the amount obtainable from the sale of an asset or CGU in an arm’s length transaction between knowledgeable, willing parties, less the costs of disposal. Value in use is determined as the present value of the future cash flows expected to be derived from an asset or CGU. Estimated future cash flows are calculated using estimated future prices, any mineral reserves and resources, operating and capital costs. All assumptions used are those that an independent market participant would consider appropriate. The estimated future cash flows are discounted to their present value using a pre-tax discount rate that reflects current market assessments of the time value of money and the risks specific to the asset for which estimates of future cash flows have not been adjusted. During the year ended December 31, 2013, the Company recognized impairment of exploration and evaluation assets for $25,801,443 to adjust the carrying value of the assets to their fair value, using a level 3 value in use methodology.
| F-15 |
| Loncor Resources Inc. |
| Notes to Consolidated Financial Statements |
| As at and for the years ended December 31, 2013 and 2012 |
| (Expressed in U.S. dollars, except for per share amount) |
| k) | Income Taxes |
Income tax expense consists of current and deferred tax expense. Income tax expense is recognized in the statement of comprehensive (loss) income, except to the extent that it relates to items recognized in other comprehensive income or directly in equity. In this case, the tax is also recognized in other comprehensive income or directly in equity.
Current income tax assets and liabilities for the current and prior periods are measured at the amount expected to be recovered from or paid to the taxation authorities. The tax rates and tax laws used to compute current income tax assets and liabilities are measured at future anticipated tax rates, which have been enacted or substantively enacted at the reporting date. Current tax assets and current tax liabilities are only offset if a legally enforceable right exists to set off the amounts, and the Company intends to settle on a net basis, or to realize the asset and settle the liability simultaneously.
Deferred taxation is provided on all qualifying temporary differences at the reporting date between the tax basis of assets and liabilities and their carrying amounts for financial reporting purposes. Deferred tax assets are only recognized to the extent that it is probable that the deductible temporary differences will reverse in the foreseeable future and future taxable profit will be available against which the temporary difference can be utilized.
Deferred tax liabilities and assets are not recognized for temporary differences between the carrying amount and tax bases of investments in controlled entities where the parent entity is able to control the timing of the reversal of the temporary differences and it is probable that the differences will not reverse in the foreseeable future. Deferred tax assets and liabilities are offset when there is a legally enforceable right to offset current tax assets and liabilities and when the deferred tax balances relate to the same taxation authority.
| l) | Share-Based Payments |
Equity-settled share-based payments for directors, officers and employees are measured at fair value at the date of grant and recorded as compensation expense in the consolidated financial statements. The fair value determined at the grant date of the equity-settled share-based payments is expensed over the vesting period based on the Company’s estimate of options that will eventually vest. The number of forfeitures likely to occur is estimated on grant date and is revised as deemed necessary.
Compensation expense on stock options granted to consultants is measured at the earlier of the completion of performance and the date the options are vested using the fair value method and is recorded as an expense in the same period as if the Company had paid cash for the goods or services received.
Any consideration paid by directors, officers, employees and consultants on exercise of equity-settled share-based payments is credited to share capital. Shares are issued from treasury upon the exercise of equity-settled share-based instruments.
When the value of goods or services received in exchange for the share-based payment cannot be reliably estimated, the fair value is measured by use of a Black-Scholes valuation model. The expected life used in the model is adjusted, based on management’s best estimate, for the effects of non-transferability, exercise restrictions, and behavioural considerations.
Any consideration paid by directors, officers, employees and consultants on exercise of equity-settled share-based payments is credited to share capital. Shares are issued from treasury upon the exercise of equity-settled share-based instruments.
| m) | Provisions and Contingencies |
Provisions are recognized when a legal or constructive obligation exists, as a result of past events, and it is probable that an outflow of resources that can be reliably estimated will be required to settle the obligation. Where the effect is material, the provision is discounted using an appropriate current market-based pre-tax discount rate. The increase in the provision due to passage of time is recognized as interest expense.
| Loncor Resources Inc. |
| Notes to Consolidated Financial Statements |
| As at and for the years ended December 31, 2013 and 2012 |
| (Expressed in U.S. dollars, except for per share amount) |
When a contingency substantiated by confirming events, can be reliably measured and is likely to result in an economic outflow, a liability is recognized as the best estimate required to settle the obligation. A contingent liability is disclosed where the existence of an obligation will only be confirmed by future events, or where the amount of a present obligation cannot be measured reliably or will likely not result in an economic outflow. Contingent assets are only disclosed when the inflow of economic benefits is probable. When the economic benefit becomes virtually certain, the asset is no longer contingent and is recognized in the consolidated financial statements.
| n) | Related Party Transactions |
Parties are considered to be related if one party has the ability, directly or indirectly, to control the other party or exercise significant influence over the other party in making financial and operating decisions. Parties are also considered to be related if they are subject to common control or common significant influence. Related parties may be individuals or corporate entities. A transaction is considered to be a related party transaction when there is a transfer of resources or obligations between related parties. Related party transactions are in the normal course of business and have commercial substance.
| o) | Newly Applied Accounting Standards |
The Company has applied the following new and revised IFRSs in these consolidated financial statements: IFRS 10 Consolidated financial statements (“IFRS 10”), IFRS 12 Disclosure of interests in other entities (“IFRS 12”), IFRS 13 fair value measurements (“IFRS 13”), IAS 1 Presentation of financial statements (“IAS 1”), IAS 19 Employee benefits (“IAS 19”), and IAS 27 Separate financial statements (“IAS 27”).
The adoption of these new and revised standards and interpretations did not have a significant impact on the Company’s consolidated financial statements.
| p) | Accounting Standards Issued But Not Yet Effective |
The Company has reviewed new and revised accounting pronouncements that have been issued but are not yet effective and determined that the following may have an impact on the Company:
IFRS 7Financial Instruments:disclosures (“IFRS 7”) requires disclosure of information about the significance of financial instruments to an entity, and the nature and extent of risks arising from those financial instruments, both in qualitative and quantitative terms. An amendment to IFRS 7 was issued in December 2011 which requires an entity to disclose rights of offset and related arrangements for financial instruments under an enforceable master netting agreement or similar arrangement. IFRS 7 is effective for annual periods beginning on or after January 1, 2013. The Company does not expect the standard to have a material impact on its consolidated financial statements.
IFRS 9Financial instruments (“IFRS 9”) was issued by the IASB on November 12, 2009 and will replace IAS 39Financial Instruments: Recognition and Measurement(“ (“IAS 39”). IFRS 9 replaces the multiple rules in IAS 39 with a single approach to determine whether a financial asset is measured at amortized cost or fair value and a new mixed measurement model for debt instruments having only two categories: amortized cost and fair value. The approach in IFRS 9 is based on how an entity manages its financial instruments in the context of its business model and the contractual cash flow characteristics of the financial assets. The new standard also requires a single impairment method to be used, replacing the multiple impairment methods in IAS 39. The effective date of IFRS 9 is effective for annual periods beginning on or after January 1, 2015.has yet to be determined. The Company is currently evaluating the impact of IFRS 9 on its consolidated financial statements.
IFRS 10Consolidated Financial Statements (“IFRS 10”) establishes principles for the presentation and preparation of consolidated financial statements when an entity controls one or more other entities. IFRS 10 supersedes IAS 27 “Consolidated and Separate Financial Statements” and SIC-12 “Consolidated – Special Purpose Entities” and is effective for annual periods beginning on or after January 1, 2013. Earlier application is permitted. The Company does not expect the standard to have a material impact on its consolidated financial statements.
IFRS 11Joint Arrangements (“IFRS 11”) establishes principles for financial reporting by parties to a joint arrangement. IFRS 11 supersedes the current IAS 31 “Interests in Joint Ventures” and SIC-13 “Jointly Controlled Entities – Non-Monetary Contributions by Venturers” and is effective for annual periods beginning on or after January 1, 2013. Earlier application is permitted. The Company does not expect the standard to have a material impact on its consolidated financial statements.
IFRS 12Disclosure of Interests in Other Entities (“IFRS 12”) applies to entities that have an interest in a subsidiary, a joint arrangement, an associate or an unconsolidated structured entity. IFRS 12 is effective for annual periods beginning on or after January 1, 2013. Earlier application is permitted. The Company does not expect the standard to have a material impact on its consolidated financial statements.
IFRS 13Fair Value Measurements (“IFRS 13”) defines fair value, sets out in a single IFRS framework for measuring fair value and requires disclosures about fair value measurements. IFRS 13 applies to IFRSs that require or permit fair value measurements or disclosures about fair value measurements (and measurements, such as fair value less costs to sell, based on fair value or disclosures about those measurements), except in specified circumstances. IFRS 13 is to be applied for annual periods beginning on or after January 1, 2013. Earlier application is permitted. The Company does not expect the standard to have a material impact on its consolidated financial statements.
An amendment to IAS 19,Employee Benefits (“IAS 19”) was issued by the IASB in June 2011. The amendment requires recognition of changes in the defined benefit obligations and in fair value of plan assets when they occur, hence accelerating the recognition of past service costs. The amendment also modifies accounting for termination benefits, including distinguishing benefits provided in exchange for service and benefits provided in exchange for the termination of employment and affect the recognition and measurement of termination benefits. The amendments to IAS 19 are effective for annual periods beginning on or after January 1, 2013. The Company does not expect the standard to have a material impact its consolidated financial statements.
IAS 27,Separate financial statements (“IAS 27”) was re-issued by the IASB in May 2011 to only prescribe the accounting and disclosure requirements for investments in subsidiaries, joint ventures and associates when an entity prepares separate financial statements. The consolidation guidance will now be included in IFRS 10. The amendments to IAS 27 are effective for annual periods beginning on or after January 1, 2013. The Company does not expect the standard to have a material impact on its consolidated financial statements.
IAS 28,Investments in associates and joint ventures (“IAS 28”) was re-issued by the IASB in May 2011. IAS 28 continues to prescribe the accounting for investments in associates, but is now the only source of guidance describing the application of the equity method. The amended IAS 28 will be applied by all entities that have an ownership interest with joint control of, or significant influence over, an investee. The amendments to IAS 28 are effective for annual periods beginning on or after January 1, 2013. The Company does not expect the standard to have a material impact on its consolidated financial statements.
An amendment to IAS 32,Financial Instruments: presentation (“IAS 32”) was issued by the IASB in December 2011. The amendment clarifies the meaning of ‘currently has a legally enforceable right to set-off’. The amendments to IAS 32 are effective for annual periods beginning on or after January 1, 2014. The Company does not expect the standard to have a material impact on its consolidated financial statements.
An amendment to IAS 36, Impairment of Assets (“IAS 36”) was issued by the IASB in May 2013. The amendment reduces the circumstances in which the recoverable amount of assets or cash-generating units is required to be disclosed, clarifies the disclosures required, and introduces an explicit requirement to disclose the discount rate used in determining impairment. The amendments to IAS 36 are effective for annual periods beginning on or after January 1, 2014. The Company is currently evaluating the impact of IAS 36 on its consolidated financial statements.
| Loncor Resources Inc. |
| Notes to Consolidated Financial Statements |
| As at and for the years ended December 31, 2013 and 2012 |
| (Expressed in U.S. dollars, except for per share amount) |
In October 2011, IFRICMay 2013, IFRS Interpretation Committee (“IFRIC”) published IFRIC Interpretation 20,Stripping Costs in the Production Phase of a Surface Mine21, Levies (“IFRIC 20”21”), effective for annual periods beginning on or after January 1, 2013. The interpretation clarifies2014. IFRIC 21 provides guidance on when to recognize a liability for a levy imposed by a government. IFRIC 21 identifies the requirements for accountingobligating event for the costsrecognition of strippinga liability as the activity that triggers the payment of the levy in accordance with the production phase when two benefits accrue: (i) usable ore that can be used to produce inventory; and (ii) improved access to further quantities of material that will be mined in future periods.relevant legislation. The Company does not expect the standard to have a material impact on its consolidated financial statements.
| 4. |
The following table lists the Company’s subsidiaries:
| Name of Subsidiary | Place of Incorporation | Proportion of Ownership Interest | Principal Activity | |||||
| Loncor Resources Congo SPRL | Democratic Republic of the Congo | Mineral Exploration | ||||||
| Nevada Bob's Franchising, Inc. | Delaware, USA | Dormant | ||||||
| 5. |
Advances receivable of the Company include advances to employees.
| December 31, 2013 | December 31, 2012 | |||||||
| Advances receivable | $ | 388,763 | $ | 152,022 | ||||
| December 31, 2012 | December 31, 2011 | |||||||
| Advances receivable | $ | 152,022 | $ | 130,441 | ||||
The total balance of $388,763 for advances receviable of $152,022 (2011receivable (2012 - $130,441) relate$152,022) relates to exploration and evaluation expenditures. Included in this balance of $388,763 is an amount of $126,648 due from Banro Corporation (“Banro”), a company with common directors for the sale of IP equipment.
| 6. |
Balances and transactions between the Company and its subsidiaries, which are related parties of the Company, have been eliminated on consolidation, and are not disclosed in this note.
| a) | Key Management Remuneration |
The Company’s related parties include key management. Key management includes directors (executive and non-executive), the Chief Executive Officer (“CEO”), the Chief Financial Officer, and the senior executives reporting directly to the CEO. The remuneration of the key management of the Company as defined above, during the years ended December 31, 2013, 2012, 2011 and 20102011 was as follows:
| Year ended December 31, 2013 | Year ended December 31, 2012 | Year ended December 31, 2011 | ||||||||||
| Salaries | $ | 830,345 | $ | 946,379 | $ | 859,237 | ||||||
| Employee retention allowance | $ | 62,305 | $ | 59,014 | $ | 62,166 | ||||||
| Compensation expense-share-based payments | $ | 226,110 | $ | 317,407 | $ | 1,348,721 | ||||||
| $ | 1,118,760 | $ | 1,322,800 | $ | 2,270,124 | |||||||
| Loncor Resources Inc. |
| Notes to Consolidated Financial Statements |
| (Expressed in U.S. dollars, except for per share |
| Year ended December 31, 2012 | Year ended December 31, 2011 | Year ended December 31, 2010 | ||||||||||
| Salaries | $ | 946,379 | $ | 859,237 | $ | 745,070 | ||||||
| Employee retention allowance | $ | 59,014 | $ | 62,166 | $ | 23,141 | ||||||
| Compensation expense-share-based payments | $ | 317,407 | $ | 1,348,721 | $ | 1,130,327 | ||||||
| $ | 1,322,800 | $ | 2,270,124 | $ | 1,898,538 | |||||||
| b) | Other Related Parties |
As at December 31, 2012,2013, an amount of $nil$41,946 was due to relatedfrom Banro and Delrand Resources Limited (“Delrand”), companies with common directors, related to common expenses in the Congo (December 31, 20112012 - $152,833)$17,760). In addition, as
As at December 31, 2012,2013, an amount of $17,760$5,088 was due from a company withto Banro related to common directorsexpenses in the Congo (December 31, 20112012 - $nil).
| December 31, 2013 | December 31, 2012 | |||||||
| $ | $ | |||||||
| Due from related parties | 41,946 | 17,760 | ||||||
| Due to related party | 5,088 | - | ||||||
The amounts included in the due from/to related party are non-interest bearing and are payble within 12 months.
| 7. | Property, Plant and Equipment |
The Company’s property, plant and equipment are summarized as follows:
| Notes | Furniture & fixtures | Office & Communication equipment | Vehicles | Field camps and equipment | Leasehold improvements | Total | ||||||||||||||||||||||
| $ | $ | $ | $ | $ | $ | |||||||||||||||||||||||
| Cost | ||||||||||||||||||||||||||||
| Balance at January 1, 2011 | 96,525 | 124,708 | 275,967 | 271,854 | - | 769,054 | ||||||||||||||||||||||
| Additions | 55,101 | 87,504 | 124,274 | 231,985 | - | 498,864 | ||||||||||||||||||||||
| Balance at December 31, 2011 | 151,626 | 212,212 | 400,241 | 503,839 | - | 1,267,918 | ||||||||||||||||||||||
| Additions | 7,775 | 9,407 | 10,600 | 214,655 | 84,906 | 327,343 | ||||||||||||||||||||||
| Disposals | - | (11,769 | ) | - | (47,027 | ) | - | (58,796 | ) | |||||||||||||||||||
| Balance at December 31, 2012 | 159,401 | 209,850 | 410,841 | 671,467 | 84,906 | 1,536,465 | ||||||||||||||||||||||
| Accumulated Depreciation | ||||||||||||||||||||||||||||
| Balance at January 1, 2011 | 91,835 | 22,240 | 53,756 | 52,523 | - | 220,354 | ||||||||||||||||||||||
| Depreciation for the year | 11,091 | 50,099 | 96,118 | 111,301 | - | 268,609 | ||||||||||||||||||||||
| Balance at December 31, 2011 | 102,926 | 72,339 | 149,874 | 163,824 | - | 488,963 | ||||||||||||||||||||||
| Depreciation for the year | 10,083 | 54,267 | 102,048 | 145,296 | 18,025 | 329,719 | ||||||||||||||||||||||
| Disposals | - | (6,505 | ) | - | (24,955 | ) | - | (31,460 | ) | |||||||||||||||||||
| Balance at December 31, 2012 | 113,009 | 120,101 | 251,922 | 284,165 | 18,025 | 787,222 | ||||||||||||||||||||||
| Carrying amounts | ||||||||||||||||||||||||||||
| Balance at December 31, 2011 | 48,700 | 139,873 | 250,367 | 340,015 | - | 778,955 | ||||||||||||||||||||||
| Balance at December 31, 2012 | 46,392 | 89,749 | 158,919 | 387,302 | 66,881 | 749,243 | ||||||||||||||||||||||
| Notes | Furniture & fixtures | Office & Communication equipment | Vehicles | Field camps and equipment | Leasehold improvements | Geophysical equipment | Total | |||||||||||||||||||||||
| $ | $ | $ | $ | $ | $ | $ | ||||||||||||||||||||||||
| Cost | ||||||||||||||||||||||||||||||
| Balance at January 1, 2012 | 151,626 | 212,212 | 400,241 | 503,839 | - | - | 1,267,918 | |||||||||||||||||||||||
| Additions | 7,775 | 9,407 | 10,600 | 214,655 | 84,906 | - | 327,343 | |||||||||||||||||||||||
| Disposals | - | (11,769 | ) | - | (47,027 | ) | - | - | (58,796 | ) | ||||||||||||||||||||
| Balance at December 31, 2012 | 159,401 | 209,850 | 410,841 | 671,467 | 84,906 | - | 1,536,465 | |||||||||||||||||||||||
| Additions | 1,200 | 3,669 | - | 40,990 | - | 151,767 | 197,626 | |||||||||||||||||||||||
| Disposals | - | - | - | (12,800 | ) | - | (151,767 | ) | (164,567 | ) | ||||||||||||||||||||
| Balance at December 31, 2013 | 160,601 | 213,519 | 410,841 | 699,657 | 84,906 | - | 1,569,524 | |||||||||||||||||||||||
| Accumulated Depreciation | ||||||||||||||||||||||||||||||
| Balance at January 1, 2012 | 102,926 | 72,339 | 149,874 | 163,824 | - | - | 488,963 | |||||||||||||||||||||||
| Depreciation for the year | 10,083 | 54,267 | 102,048 | 145,296 | 18,025 | - | 329,719 | |||||||||||||||||||||||
| Disposals | - | (6,505 | ) | - | (24,955 | ) | - | - | (31,460 | ) | ||||||||||||||||||||
| Balance at December 31, 2012 | 113,009 | 120,101 | 251,922 | 284,165 | 18,025 | - | 787,222 | |||||||||||||||||||||||
| Depreciation for the year | 8,828 | 52,458 | 102,710 | 159,899 | 24,321 | 28,456 | 376,672 | |||||||||||||||||||||||
| Disposals | - | - | - | (10,400 | ) | - | (28,456 | ) | (38,856 | ) | ||||||||||||||||||||
| Balance at December 31, 2013 | 121,837 | 172,559 | 354,632 | 433,664 | 42,346 | - | 1,125,038 | |||||||||||||||||||||||
| Carrying amounts | ||||||||||||||||||||||||||||||
| Balance at December 31, 2012 | 46,392 | 89,749 | 158,919 | 387,302 | 66,881 | - | 749,243 | |||||||||||||||||||||||
| Balance at December 31, 2013 | 38,764 | 40,960 | 56,209 | 265,993 | 42,560 | - | 444,486 | |||||||||||||||||||||||
Depreciation in the amount of $299,203$341,480 (December 31, 2011- $255,099)2012- $299,203) was capitalized to exploration and evaluation for the year ended December 31, 2012.2013.
| Loncor Resources Inc. |
| Notes to Consolidated Financial Statements |
| (Expressed in U.S. dollars, except for per share |
| 8. | Exploration and Evaluation Assets |
The following table summarizes the Company’s tangible exploration and evaluation expenditures with respect to its mineral properties in the Congo:
| North Kivu | Ngayu | Total | North Kivu | Ngayu | Total | |||||||||||||||||||
| Cost | ||||||||||||||||||||||||
| Balance at January 1, 2011 | $ | 5,379,726 | $ | 7,128,067 | $ | 12,507,793 | ||||||||||||||||||
| Additions | 2,066,984 | 15,365,586 | 17,432,570 | |||||||||||||||||||||
| Balance at December 31, 2011 | 7,446,710 | 22,493,653 | 29,940,363 | |||||||||||||||||||||
| Balance at January 1, 2012 | $ | 7,446,710 | $ | 22,493,653 | $ | 29,940,363 | ||||||||||||||||||
| Additions | 1,804,112 | 16,360,726 | 18,164,838 | 1,804,112 | 16,360,726 | 18,164,838 | ||||||||||||||||||
| Balance at December 31, 2012 | $ | 9,250,822 | $ | 38,854,379 | $ | 48,105,201 | 9,250,822 | 38,854,379 | 48,105,201 | |||||||||||||||
| Additions | 535,380 | 7,904,320 | 8,439,700 | |||||||||||||||||||||
| Impairment loss | - | (25,801,443 | ) | (25,801,443 | ) | |||||||||||||||||||
| Balance at December 31, 2013 | $ | 9,786,202 | $ | 20,957,256 | $ | 30,743,458 | ||||||||||||||||||
There is $150,000 of intangible exploration and evaluation expenditures as at December 31, 2012.2013. The intangibles have not been included in the table above. There have not been any additions or disposals of intangible assets since January 1, 2011.2013.
| a. | North Kivu |
The North Kivu project is situated in the North Kivu Province in eastern Congo to the northwest of Lake Edward and consists of 5351 exploration permits totaling 14,344covering 13,251 square kilometres. Historical data has been compiled from the colonial period and outlined ten gold prospects for follow-up, the most prospective being the Manguredjipa prospect where 300,000 ounces of alluvial gold was mined during the colonial period. Other gold prospects warranting follow up include Lutunguru, Lubero, Makwasu, Lutela, Bilolo, Manzia, Mohanga and Ludjulu. Exploration estimates to date have not advanced to the stage of being able to identify the quantity of possible resources available for potential mining.
| b. | Ngayu |
The Ngayu project covers an area of 2,0872,077 square kilometres and is found within the Orientale Province in the northeast of the Congo, approximately 270 kilometers northeast of Kisangani. The Ngayu project covers most of the Ngayu Archaean greenstone belt which is one of a number of greenstone belts in the north-east Congo Archaeancraton that includes the Kilo and Moto greenstone belts. These Archaean greenstone belts are the northwestern extensions of the Lake Victoria greenstone belt terrain that hosts a number of world class gold deposits including Geita and Bulyanhulu.
Due to a decrease in gold prices coupled with the reduction of the exploration budget, the Company conducted an impairment analysis whereby the carrying value of the Ngayu exploration and evaluation asset was assessed. The asset’s recoverable amount was calculated applying a fair value of $18 per ounce of gold in the ground, which was provided by a valuation analysis of an independent report on similar African exploration companies, to the Ngayu project’s Makapela mineral resource. Since the carrying value of the asset was determined to be higher than its recoverable amount, an impairment loss of $25,801,443 was recorded during the year ended December 31, 2013.
| 9. |
The Company’s intangible assets include licenses and rights related to the Company’s previous business.rights. Based on management’s assessment, these intangible assets have been valued at $1 as their fair market value is nominal.
| Loncor Resources Inc. |
| Notes to Consolidated Financial Statements |
| As at and for the years ended December 31, 2013 and 2012 |
| (Expressed in U.S. dollars, except for per share amount) |
| 10. |
The Company has one operating segment: the acquisition, exploration and development of precious metal projects located in the Congo.The operations of the Company are located in two geographic locations, Canada and the Congo. Geographic segmentation of non-current assets is as follows:
| December 31, 2012 | ||||||||||||
| Property, plant and equipment | Intangible assets | Exploration and evaluation | ||||||||||
| Congo | $ | 636,873 | - | $ | 48,255,201 | |||||||
| Canada | $ | 112,370 | $ | 1 | - | |||||||
| $ | 749,243 | $ | 1 | $ | 48,255,201 | |||||||
December 31, 2013
| December 31, 2011 | ||||||||||||||||||||||||
| Property, plant and equipment | Intangible assets | Exploration and evaluation | Property, plant and equipment | Intangible assets | Exploration and evaluation | |||||||||||||||||||
| Congo | $ | 725,104 | - | $ | 30,090,363 | $ | 367,309 | - | $ | 30,893,458 | ||||||||||||||
| Canada | $ | 53,851 | $ | 1 | - | $ | 77,177 | $ | 1 | - | ||||||||||||||
| $ | 778,955 | $ | 1 | $ | 30,090,363 | $ | 444,486 | $ | 1 | $ | 30,893,458 | |||||||||||||
December 31, 2012
| Property, plant and equipment | Intangible assets | Exploration and evaluation | ||||||||||
| Congo | $ | 636,873 | - | $ | 48,255,201 | |||||||
| Canada | $ | 112,370 | $ | 1 | - | |||||||
| $ | 749,243 | $ | 1 | $ | 48,255,201 | |||||||
| 11. | Accounts Payable |
The following table summarizes the Company’s accounts payable:
| December 31, 2012 | December 31, 2011 | December 31, 2013 | December 31, 2012 | |||||||||||||
| Exploration and evaluation expenditures | $ | 742,291 | $ | 198,452 | $ | 259,430 | $ | 742,291 | ||||||||
| Non-exploration and evaluation expenditures | $ | 234,251 | $ | 39,875 | $ | 1,869 | $ | 234,251 | ||||||||
| Total Accounts Payable | $ | 976,542 | $ | 238,327 | $ | 261,299 | $ | 976,542 | ||||||||
| 12. |
| a) | Authorized |
The authorized share capital of the Company consists of unlimited number of common shares and unlimited number of preference shares, issuable in series, with no par value. All shares issued are fully paid.
The holders of common shares are entitled to receive notice of and to attend all meetings of the shareholders of the Company and shall have one vote for each common share held at all meetings of shareholders of the Company, except for meetings at which only holders of another specified class or series of shares are entitled to vote separately as a class or series. Subject to the prior rights of the holders of the preference shares or any other share ranking senior to the common shares, the holders of the common shares are entitled to (a) receive any dividend as and when declared by the board of directors, out of the assets of the Company properly applicable to payment of dividends, in such amount and in such form as the board of directors may from time to time determine, and (b) receive the remaining property of the Company in the event of any liquidation, dissolution or winding up of the Company.
The Company may issue preference shares at any time and from time to time in one or more series with designation,designations, rights, privileges, restrictions and conditions fixed by the board of directors. The preference shares of each series are ranked on parity with the preference shares of every series and are entitled to priority over the common shares and any other shares of the Company ranking junior to the preference shares, with respect to priority in payment of dividends and the return of capital and the distribution of assets of the Company in the event of liquidation, dissolution or winding up of the Company.
On February 1, 2011, the Company closed concurrent brokered and non-brokered private placement equity financings. The Company issued 8,500,000 common shares at a price of Cdn$2.35 per share, resulting in gross proceeds of Cdn$19,975,000 in a brokered private placement. The Company also issued by way of a non-brokered private placement 1,700,000 common shares of the Company at a price of Cdn$2.35 per share for aggregate gross proceeds of Cdn$3,995,000.
| Loncor Resources Inc. |
| Notes to Consolidated Financial Statements |
| (Expressed in U.S. dollars, except for per share |
During the year ended December 2011, a total of 343,994 compensation options (each of which entitle the holder to purchase one common share and one-half of one warrant of the Company) were exercised, resulting in gross proceeds of $475,809. As well, during the year ended December 31, 2011, a total of 210,996 warrants were exercised, resulting in gross proceeds of $305,602.
On October 9, 2012, the Company closed the issuance and sale, by way of short form prospectus, of a total of 9,245,000 common shares at a price of Cdn$1.05 per share, resulting in gross proceeds of Cdn$9,707,250.
Also on October 9, 2012, the Company closed a non-brokered private placement involving the issuance and sale of a total of 4,850,000 common shares at a price of Cdn$1.05 per share, resulting in gross proceeds of Cdn$5,092,500.
During the year ended December 31, 2012, a total of 47,998 compensation options (each of which entitled the holder to purchase one common share and one-half of one warrant of the Company) were exercised, resulting in gross proceeds of $64,571. As well, during the year ended December 31, 2012, a total of 1,123,999 warrants were exercised, resulting in gross proceeds of $1,635,343.
As of December 31, 2012,2013, the Company had issued and outstanding 73,439,732 common shares (December 31, 20112012 – 58,172,735)73,439,732) and no preference shares are issued and outstanding.
| b) | Common share purchase warrants |
AtAs at December 31, 2012,2013, the Company had outstanding nil (December 31, 2011 – 4,693,250)no common share purchase warrants. There were 1,123,999 warrants exercised (including 48,999 agent’s warrants, which had been acquired pursuant to compensation option exercises) and 3,593,250 warrants expired duringoutstanding (December 31, 2012 – nil).
During the year ended December 31, 20122013, the Company recorded a gain on derivative financial instruments of $nil (year ended December 31, 2011 – nil)2012 - $768,264). The common share purchase warrants were classified as a liability because they were a derivative financial instrument due to their currency differing from the functional currency of the Company. The common share purchase warrants were re-valued at period end, with a gain or loss reported in the consolidated statement of comprehensive (loss) income.
| Date of Grant | Opening Balance | Granted during period | Exercised | Expired | Closing Balance | Exercise Price (Cdn$) | Exercise period (months) | Expiry Date | Remaining contractual life (months) | |||||||||||||||||||||||||||||
| 18/02/2010 | 3,668,250 | - | 1,075,000 | 2,593,250 | - | $ | 1.45 | 24 | 18/02/2012 | 0.0 | ||||||||||||||||||||||||||||
| 16/12/2010 | 1,000,000 | - | - | 1,000,000 | - | $ | 2.30 | 24 | 16/12/2012 | 0.0 | ||||||||||||||||||||||||||||
| (1) | 21/04/2011 | 25,000 | 23,999 | 48,999 | - | - | $ | 1.45 | 10 | 18/02/2012 | 0.0 | |||||||||||||||||||||||||||
| 4,693,250 | 23,999 | 1,123,999 | 3,593,250 | - | ||||||||||||||||||||||||||||||||||
(1) These agents warrants were issued pursuant to the exercise of compensation options.
The following table summarizes the Company’s common share purchase warrants outstanding as at December 31, 2011:
| Date of Grant | Opening Balance | Granted during period | Exercised | Closing Balance | Exercise Price (Cdn$) | Exercise period (months) | Expiry Date | Remaining contractual life (months) | ||||||||||||||||||||||||||
| (1) | 08/11/2010 | 48,999 | 48,999 | - | $ | 1.45 | 15 | 18/02/2012 | 1.6 | |||||||||||||||||||||||||
| 18/02/2010 | 3,683,250 | 15,000 | 3,668,250 | $ | 1.45 | 24 | 18/02/2012 | 1.6 | ||||||||||||||||||||||||||
| 16/12/2010 | 1,000,000 | - | 1,000,000 | $ | 2.30 | 24 | 16/12/2012 | 11.7 | ||||||||||||||||||||||||||
| (1) | 21/04/2011 | 25,000 | - | 25,000 | $ | 1.45 | 10 | 18/02/2012 | 1.6 | |||||||||||||||||||||||||
| (1) | 02/06/2011 | 146,997 | 146,997 | - | $ | 1.45 | 8.5 | 18/02/2012 | 1.6 | |||||||||||||||||||||||||
| 4,732,249 | 171,997 | 210,996 | 4,693,250 | |||||||||||||||||||||||||||||||
(1) These agents warrants were issued pursuant to the exercise of compensation options.
The value of the warrants was calculated using the Black-Scholes model and the assumptions at grant date were as follows:
| Year ended | December 31, 2012 | December 31, 2011 | ||||||
| Risk free interest rate | 1.03 | % | 1.44% - 1.77 | % | ||||
| Expected life | 0.07 years | 0.73 - 0.84 years | ||||||
| Annualized volatility | 136.34 | % | 93.67 - 96.68 | % | ||||
| Dividend yield | 0 | % | 0 | % | ||||
| Fair value (Cdn$) | $ | 0.24 | $1.51 - $1.93 | |||||
As part of the February 1, 2011 brokered private placement, the Company issued to the underwriters 510,000 broker warrants each of which iswas exercisable to acquire a common share of the Company at a price of Cdn$2.35 until February 1, 2013. Since the fair value of the services received from the underwriters cannot be estimated reliably, the Company estimated the value using Black-Scholes. The warrants havehad a value of Cdn$1.63 using the Black-Scholes model with the following assumptions: volatility 115.38%, risk free rate 1.65%, expected life 2 years, dividend yield 0%. These broker warrants expired on February 1, 2013 unexercised.
In addition, asAs part of the October 9, 2012 prospectus offering, the Company issued to the underwriters 554,700 broker warrants each of which is exercisable to acquire a common share of the Company at a price of Cdn$1.05 until October 9, 2013. Since the fair value of the services received from the underwriters cannot be estimated reliably, the Company estimated the value using Black-Scholes. The warrants have a value of Cdn$0.28 using the Black-Scholes model with the following assumptions: volatility 63.75%, risk free rate 1.15%, expected life 1 year, dividend yield 0%.
These 554,700 broker warrants are still outstanding as at December 31, 2012.
During the year ended December 31, 2012, the Company recorded a gainexpired on derivative financial instruments of $768,264 (year ended December 31, 2011 - $5,215,060, and a loss on derivative financial instruments during the year ended December 31, 2010 - $2,405,857).October 9, 2013 unexercised.
| c) | Earnings (loss) per share |
Earnings (loss) per share was calculated on the basis of the weighted average number of common shares outstanding for the year ended December 31, 2012,2013, amounting to 73,439,732 (year ended December 31, 2012 – 62,395,579 (yearand year ended December 31, 2011 – 57,055,811, year ended December 31, 2010 – 41,557,829)57,055,811) common shares. The diluted weighted average number of common shares outstanding for the year ended December 31, 2013 is 73,439,732 (year ended December 31, 2012 is– 62,649,057 (yearand year ended December 31, 2011 – 57,816,654, year ended December 31, 2010 – 43,379,668)57,816,654) common shares. As at December 31, 2012, 2,540,0002013, 6,110,000 common shares related to options and warrants were anti-dilutive.
| 13. |
The Company has an incentive Stock Option Plan under which non-transferable options to purchase common shares of the Company may be granted to directors, officers, employees or consultants of the Company or any of its subsidiaries. No amounts are paid or payable by the recipient on receipt of the option, and the exercise of the options granted is not dependent on any performance-based criteria. In accordance with these programs, options are exercisable at a price not less than the last closing price of the shares at the grant date.
Under this Stock Option Plan, 25% of options granted vest on each of the 6 month, 12 month, 18 month and 24 month anniversaries of the grant date.
| Loncor Resources Inc. |
| Notes to Consolidated Financial Statements |
| As at and for the years ended December 31, 2013 and 2012 |
| (Expressed in U.S. dollars, except for per share amount) |
The following tables summarize information about stock options:
For the year ended December 31, 2012:2013:
| Weighted average remaining | ||||||||||||||||||||||||||||||||||||
| Exercise Price Range | During the Period | Closing | contractual | Vested & | ||||||||||||||||||||||||||||||||
| (Cdn$) | Opening Balance | Granted | Exercised | Forfeiture | Expired | Balance | life (years) | Exercisable | Unvested | |||||||||||||||||||||||||||
| 1.00 - 1.25 | 3,405,000 | 1,910,000 | - | - | - | 5,315,000 | 2.93 | 3,405,000 | 1,910,000 | |||||||||||||||||||||||||||
| 1.26 - 1.80 | - | 110,000 | - | - | - | 110,000 | 4.03 | 27,500 | 82,500 | |||||||||||||||||||||||||||
| 2.45 - 2.69 | 1,465,000 | - | - | - | - | 1,465,000 | 2.60 | 1,098,750 | 366,250 | |||||||||||||||||||||||||||
| 2.70 - 3.25 | 75,000 | - | - | - | - | 75,000 | 3.17 | 56,250 | 18,750 | |||||||||||||||||||||||||||
| 4,945,000 | 2,020,000 | - | - | - | 6,965,000 | 2.88 | 4,587,500 | 2,377,500 | ||||||||||||||||||||||||||||
| Weighted Average Exercise Price (Cdn$) | 1.65 | 1.10 | 1.49 | 1.56 | 1.35 | |||||||||||||||||||||||||||||||
| Exercise Price Range | During the Period | Closing | Weighted average remaining contractual | Vested & | ||||||||||||||||||||||||||||||||
| (Cdn$) | Opening Balance | Granted | Exercised | Forfeiture | Expired | Balance | life (years) | Exercisable | Unvested | |||||||||||||||||||||||||||
| 1.00 - 1.25 | 5,315,000 | - | - | 625,000 | - | 4,690,000 | 1.96 | 3,817,500 | 872,500 | |||||||||||||||||||||||||||
| 1.26 - 1.80 | 110,000 | - | - | 40,000 | - | 70,000 | 3.03 | 52,500 | 17,500 | |||||||||||||||||||||||||||
| 2.45 - 2.69 | 1,465,000 | - | - | 190,000 | - | 1,275,000 | 1.53 | 1,275,000 | - | |||||||||||||||||||||||||||
| 2.70 - 3.25 | 75,000 | - | - | - | - | 75,000 | 2.17 | 75,000 | - | |||||||||||||||||||||||||||
| 6,965,000 | - | - | 855,000 | - | 6,110,000 | 1.88 | 5,220,000 | 890,000 | ||||||||||||||||||||||||||||
| Weighted Average Exercise Price (Cdn$) | 1.49 | - | 1.54 | 1.48 | 1.55 | 1.08 | ||||||||||||||||||||||||||||||
For the year ended December 31, 2011:2012:
| Exercise Price Range | During the Period | Closing | Weighted average remaining contractual | Vested & | ||||||||||||||||||||||||||||||||
| (Cdn$) | Opening Balance | Granted | Exercised | Forfeiture | Expired | Balance | life (years) | Exercisable | Unvested | |||||||||||||||||||||||||||
| 1.00 - 1.25 | 3,405,000 | 1,910,000 | - | - | - | 5,315,000 | 2.93 | 3,405,000 | 1,910,000 | |||||||||||||||||||||||||||
| 1.26 - 1.80 | - | 110,000 | - | - | - | 110,000 | 4.03 | 27,500 | 82,500 | |||||||||||||||||||||||||||
| 2.45 - 2.69 | 1,465,000 | - | - | - | - | 1,465,000 | 2.60 | 1,098,750 | 366,250 | |||||||||||||||||||||||||||
| 2.70 - 3.25 | 75,000 | - | - | - | - | 75,000 | 3.17 | 56,250 | 18,750 | |||||||||||||||||||||||||||
| 4,945,000 | 2,020,000 | - | - | - | 6,965,000 | 2.88 | 4,587,500 | 2,377,500 | ||||||||||||||||||||||||||||
| Weighted Average Exercise Price (Cdn$) | 1.65 | 1.10 | 1.49 | 1.56 | 1.35 | |||||||||||||||||||||||||||||||
| Weighted average remaining | ||||||||||||||||||||||||||||||||||||
| Exercise Price Range | During the Year | Closing | contractual | Vested & | ||||||||||||||||||||||||||||||||
| (Cdn$) | Opening Balance | Granted | Exercised | Forfeiture | Expired | Balance | life (years) | Exercisable | Unvested | |||||||||||||||||||||||||||
| 1.00 - 1.25 | 3,465,000 | - | - | (60,000 | ) | - | 3,405,000 | 2.87 | 3,200,000 | 205,000 | ||||||||||||||||||||||||||
| 2.45 - 2.69 | - | 1,485,000 | - | (20,000 | ) | - | 1,465,000 | 3.60 | 366,250 | 1,098,750 | ||||||||||||||||||||||||||
| 2.70 - 3.25 | - | 75,000 | - | - | - | 75,000 | 4.17 | 18,750 | 56,250 | |||||||||||||||||||||||||||
| 3,465,000 | 1,560,000 | - | (80,000 | ) | - | 4,945,000 | 3.11 | 3,585,000 | 1,360,000 | |||||||||||||||||||||||||||
| Weighted Average Exercise Price (Cdn$) | 1.17 | 2.70 | - | 1.55 | 1.65 | 1.33 | 2.49 | |||||||||||||||||||||||||||||
TheThere were no options granted during the year ended December 31, 2013 (the assessed weighted average fair value at grant date of options granted during the year ended December 31, 2012 was a weighted average Cdn$0.37 per option (December 31, 2011 - Cdn$1.84)option). The weighted average fair value of stock options issued and outstanding as at December 31, 2013 was estimated at Cdn$0.010.98 per stock option at the grant date (December(year ended December 31, 20112012 – Cdn$1.25)1.00).
The fair value at grant date is determined using a Black-Scholes option pricing model that takes into account the exercise price, the term of the option, the impact of dilution, the share price at grant date and expected price volatility of the underlying share, the expected dividend yield and the risk free interest rate for the term of the option.
The model inputs for options granted during the year ended December 31, 2012 included:and 2011 included the following (no options were granted during the year ended December 31, 2013):
| Years ended | December 31, 2012 | December 31, 2011 | December 31, 2010 | |||||||||
| Risk Free Interest Rate | 1.00% - 1.16 | % | 1.83% - 2.18 | % | 1.65% - 1.90 | % | ||||||
| Expected life | 3 years | 3 years | 2 - 3 years | |||||||||
| Annualized volatility | 68.02% - 104.54 | % | 101.78% - 115.19 | % | 156.38% - 157.32 | % | ||||||
| Dividend yield | 0 | % | 0 | % | 0 | % | ||||||
| Forfeiture rate | 2 | % | 2 | % | 1 | % | ||||||
| Grant date fair value (Cdn$) | $0.32 - $1.14 | $1.69 - $2.06 | $0.91 - $1.01 | |||||||||
| Years ended | December 31, 2013 | December 31, 2012 | December 31, 2011 | |||
| Risk free interest rate | - | 1.00% - 1.16% | 1.83% - 2.18% | |||
| Expected life | - | 3 years | 3 years | |||
| Annualized volatility | - | 68.02% - 104.54% | 101.78% - 115.19% | |||
| Dividend yield | - | 0% | 0% | |||
| Forfeiture rate | - | 2% | 2% | |||
| Grant date fair value (Cdn$) | - | $0.32 - $1.14 | $1.69 - $2.06 |
| Loncor Resources Inc. |
| Notes to Consolidated Financial Statements |
| As at and for the years ended December 31, 2013 and 2012 |
| (Expressed in U.S. dollars, except for per share amount) |
The expected price volatility is based on the historic volatility (based on the remaining life of the options), adjusted for any expected changes to future volatility due to publicly available information.
During the year ended December 31, 2012,2013, the Company recognized in the statement of comprehensive (loss) income as an expense $484,897$259,559 (year ended December 31, 2011– $1,671,475,2012 – $484,897 and year ended December 31, 20102011 - $1,211,529)$1,671,475) representing the vesting of the fair value at the date of grant of stock options previously granted to employees, directors and officers under the Company’s Stock Option Plan. In addition, an amount of $184,084$154,962 for the year ended December 31, 20122013 (year ended December 31, 20112012 – $643,410,$184,084 and year ended December 31, 20102011 - $676,625)$643,410) related to stock options issued to employees of the Company’s subsidiary in the Congo was capitalized to exploration and evaluation asset.assets.
Since the fair value of goods or services received from consultants cannot be estimated reliably, the Company has measured their value and the corresponding increase in equity indirectly by reference to the fair value of the equity instrument granted. During the year ended December 31, 2013, $2,464 (year ended December 31, 2012 - $75,098 (yearand year ended December 31, 2011 - $567,699, year ended December 31, 2010 - $235,046)$567,699) was recorded as a consulting expense with respect to stock options granted to consultants.
These amounts were credited accordingly to contributed surplusreserves in the consolidated statement of financial position. As at December 31, 2012, the Company has outstanding nil (December 31, 2011 – 47,998) compensation options.
| 14. | Commitments |
Lease Commitments
The Company has entered into leases for buildings with renewal terms whereby the lease agreements can be extended based on market prices at the time of renewal. There are no restrictions placed upon the lessee by entering into these leases.
The Company's future minimum operating lease commitments as at December 31, 20122013 are as follows:
| 2013 | $ | 212,411 | ||
| 2014 | $ | 75,610 | ||
| 2015 | $ | 50,407 | ||
| $ | 338,428 |
Included in commitments is $136,800 which relates to a minimum purchase obligation of helicopter services in the Congo.
| 2014 | $ | 75,611 | ||
| 2015 | $ | 50,407 | ||
| $ | 126,018 |
| 15. | Financial risk management objectives and policies |
| a) | Fair value of financial assets and liabilities |
The consolidated statements of financial position carrying amounts for cash and cash equivalents, advances receivable, balances due (from)from and due to related parties, accounts payable, accrued liabilities and the employee retention allowance approximate fair value due to their short-term nature.
Fair value hierarchy
The following table provides an analysis of financial instruments that are measured subsequent to initial recognition at fair value, grouped into Levels 1 to 3 based on the degree to which the fair value is observable:
| · | Level 1 fair value measurements are those derived from quoted prices (unadjusted) in active markets for identical assets or liabilities; |
| · | Level 2 fair value measurements are those derived from inputs other than quoted prices included within Level 1 that are observable for the asset or liability, either directly (i.e. as prices) or indirectly (i.e. derived from prices); |
| · | Level 3 fair value measurements are those derived from valuation techniques that include inputs for the asset or liability that are not based on observable market data (unobservable inputs). |
There were no transfers between Level 1, 2 and 3 during the reporting period. The fair values of financial assets and liabilities carried at amortized cost are approximated by their carrying values. Cash and cash equivalents is ranked Level 1 as the market value is readily observable. The carrying value of cash and cash equivalents approximates fair value, as maturities are less than sixthree months. Warrants are ranked within Level 3 which uses a combination of observable and unobservable inputs in calculating fair value.
| Fair Value Hierarchy | December 31, 2012 | December 31, 2011 | ||||||||
| $ | $ | |||||||||
| Financial assets | ||||||||||
| Loans and receivables | ||||||||||
| Cash and cash equivalents | Level 1 | 10,741,699 | 14,667,658 | |||||||
| Total financial assets | 10,741,699 | 14,667,658 | ||||||||
| Financial liabilities | ||||||||||
| Other financial liabilities | ||||||||||
| Common share purchase warrants | Level 3 | - | 826,862 | |||||||
| Total financial liabilities | - | 826,862 | ||||||||
Fair Value Measurements of warrants at Reporting Date Using:
| ||||||||||||
Liabilities included within level 3 of the fair value hierarchy presented in the preceding table include certain warrants. The valuation methodology for these liabilities within level 3 uses a combination of observable and unobservable inputs in calculating fair value.
| Loncor Resources Inc. |
| Notes to Consolidated Financial Statements |
| (Expressed in U.S. dollars, except for per share |
| December 31, 2012 (Level 3) | Balance beginning of year | Issuance during the year | Upon exercise reclassification of liability warrants to equity | Change in fair value | Balance end of year | |||||||||||||||
| Warrants | $ | 826,862 | $ | 5,740 | $ | (64,338 | ) | $ | (768,264 | ) | $ | - | ||||||||
| b) | Risk Management Policies |
The Company is sensitive to changes in commodity prices and foreign-exchange. The Company’s Board of Directors has overall responsibility for the establishment and oversight of the Company’s risk management framework. Although the Company has the ability to address its price-related exposures through the use of options, futures and forward contacts, it does not generally enter into such arrangements.
| c) | Foreign Currency Risk |
Foreign currency risk is the risk that a variation in exchange rates between the United States dollar and Canadian dollar or other foreign currencies will affect the Company’s operations and financial results. A portion of the Company’s transactions are denominated in Canadian dollars. The Company is also exposed to the impact of currency fluctuations on its monetary assets and liabilities. Significant foreign exchange gains or losses are reflected as a separate component ofitem in the consolidated statement of comprehensive income (loss). income. The Company does not use derivative instruments to reduce its exposure to foreign currency risk.
The following table indicates the impact of foreign currency exchange risk on net working capital as at December 31, 2012.2013. The table below also provides a sensitivity analysis of a 10 percent strengthening of the US dollar against the Canadian dollar which would have increased (decreased) the Company’s net loss by the amounts shown in the table below. A 10 percent weakening of the US dollar against the Canadian dollar would have had the equal but opposite effect as at December 31, 2012.2013.
| 2013 | 2012 | |||||||
| Canadian dollar | Canadian dollar | |||||||
| Cash and cash equivalents | 159,360 | 9,817,849 | ||||||
| Accounts payable and accrued liabilities | (302,199 | ) | (329,118 | ) | ||||
| Employee retention allowance | (248,083 | ) | (169,496 | ) | ||||
| Total foreign currency financial assets and liabilities | (390,922 | ) | 9,319,235 | |||||
| Foreign exchange rate at December 31, 2013 | 0.9402 | 1.0051 | ||||||
| Total foreign currency financial assets and liabilities in US $ | (367,545 | ) | 9,366,763 | |||||
| Impact of a 10% strengthening of the US $ on net loss | (36,754 | ) | 936,676 | |||||
| d) | Credit Risk |
Financial instruments which are potentially subject to credit risk for the Company consist primarily of cash and cash equivalents.equivalents, advances receivable, and due from related parties. Cash and cash equivalents are maintained with several financial institutions of reputable credit and may be redeemed upon demand. It is therefore the Company’s opinion that such credit risk is subject to normal industry risks and is considered minimal.
The Company limits its exposure to credit risk on investments by investing only in securities rated R1 (the highest rating) by credit rating agencies such as the DBRS (Dominion Bond Rating Service). Management continuously monitors the fair value of its investments to determine potential credit exposures. Short-term excess cash is invested in R1 rated investments including money market funds and other highly rated short-term investment instruments. Any credit risk exposure on cash balances is considered negligible as the Company places deposits only with major established banks in the countries in which it carries on operations.
| Loncor Resources Inc. |
| Notes to Consolidated Financial Statements |
| As at and for the years ended December 31, 2013 and 2012 |
| (Expressed in U.S. dollars, except for per share amount) |
The carrying amount of financial assets represents the maximum credit exposure. The Company’s gross credit exposure at December 31, 20122013 and December 31, 20112012 is as follows:
| December 31, 2012 | December 31, 2011 | December 31, 2013 | December 31, 2012 | |||||||||||||
| Cash and cash equivalents | $ | 10,741,699 | $ | 14,667,658 | $ | 324,928 | $ | 10,741,699 | ||||||||
| Advances receivable | $ | 152,022 | $ | 130,441 | $ | 388,763 | $ | 152,022 | ||||||||
| Due from related parties | $ | 17,760 | - | $ | 41,946 | $ | 17,760 | |||||||||
| $ | 10,911,481 | $ | 14,798,099 | $ | 755,637 | $ | 10,911,481 | |||||||||
| e) | Liquidity Risk |
Liquidity risk is the risk that the Company will not be able to meet its financial obligations as they become due. The Company attempts to ensure that there is sufficient cash to meet its liabilities when they are due and manages this risk by regularly evaluating its liquid financial resources to fund current and long-term obligations and to meet its capital commitments in a cost-effective manner. Temporary surplus funds of the Company are invested in short-term investments. The Company arranges the portfolio so that securities mature approximately when funds are needed. The key to success in managing liquidity is the degree of certainty in the cash flow projections. If future cash flows are fairly uncertain, the liquidity risk increases. The Company’s liquidity requirements are met through a variety of sources, including cash and cash equivalents and equity capital markets. All financial obligations of the Company including accounts payable of $976,542$261,299, accrued liabilities of $208,143,$307,535 and due to related partiesretention allowance of $nil$629,554 are due within one year.
| f) | Mineral Property Risk |
The Company’s operations in the Congo are exposed to various levels of political risk and uncertainties, including political and economic instability, government regulations relating to exploration and mining, military repression and civil disorder, all or any of which may have a material adverse impact on the Company’s activities or may result in impairment in or loss of part or all of the Company's assets.
| g) |
Market risk is the potential for financial loss from adverse changes in underlying market factors, including foreign-exchange rates, commodity prices and stock based compensation costs.
| Capital Management |
The Company manages its common shares warrants and stock options as capital. The Company’s policy is to maintain a sufficient capital base in order to meet its short term obligations and at the same time preserve investors’ confidence required to sustain future development of the business.
| December 31, 2012 | December 31, 2011 | December 31, 2013 | December 31, 2012 | |||||||||||||
| Cash and cash equivalents | $ | 10,741,699 | $ | 14,667,658 | ||||||||||||
| Share capital | $ | (75,715,014 | ) | $ | (60,044,719 | ) | $ | 75,715,014 | $ | 75,715,014 | ||||||
| Reserves | $ | 8,035,188 | $ | 7,618,203 | ||||||||||||
| Deficit | $ | (25,547,085 | ) | $ | (23,465,262 | ) | $ | (52,771,536 | ) | $ | (25,547,085 | ) | ||||
| $ | (90,520,400 | ) | $ | (68,842,323 | ) | $ | 30,978,666 | $ | 57,786,132 | |||||||
| Loncor Resources Inc. |
| Notes to Consolidated Financial Statements |
| (Expressed in U.S. dollars, except for per share |
| 16. | Supplemental cash flow information |
During the yearperiods indicated the Company undertook the following significant non-cash transactions:
| Years ended | Years ended | |||||||||||||||||||||||||||||||
| Note | December 31, 2012 | December 31, 2011 | December 31, 2010 | Note | December 31, 2013 | December 31, 2012 | December 31, 2011 | |||||||||||||||||||||||||
| Depreciation included in exploration and evaluation assets | 8 | $ | 299,203 | $ | 255,101 | $ | 125,653 | 7 | $ | 341,480 | $ | 299,203 | $ | 255,101 | ||||||||||||||||||
| Stock-based compensation included in exploration and evaluation assets | 8 | $ | 184,084 | $ | 643,410 | $ | 676,625 | 13 | $ | 155,034 | $ | 184,084 | $ | 643,410 | ||||||||||||||||||
| Employee retention allowance | 17 | $ | 82,000 | $ | 68,521 | $ | 186,075 | 17 | $ | 139,274 | $ | 82,000 | $ | 68,521 | ||||||||||||||||||
| 17. | Employee retention allowance |
The Company has an incentive employee retention plan under which an amount equal to one month salary per year of service is accrued to each qualified employee up to a maximum of 10 months (or 10 years of service with the Company and/or a related company). To qualify for this retention allowance, an employee must complete two years of service with the Company and/or a related company. The full amount of retention allowance accumulated by a particular employee is paid out when the employee is no longer employed with the Company, unless there is a termination due to misconduct, in which case the retention allowance is forfeited. There is uncertainty about the timing of these outflows but with the information available and assumption that eligible employees will not be terminated due to misconduct, as at December 31, 2012,2013, the Company had accrued a total liability of $490,280$629,554 (December 31, 20112012 - $335,720)$490,280).
The following table summarizes information about changes to the Company’s employee retention allowance during year ended December 31, 2013.
| 2013 | 2012 | |||||||
| Balance at beginning of year | $ | 490,280 | $ | 335,720 | ||||
| Additions | 139,274 | 154,560 | ||||||
| Paid to employees | - | - | ||||||
| Balance at December 31, 2013 | $ | 629,554 | $ | 490,280 | ||||
Of the $139,274 accrued during the year ended December 31, 2012.
| 2012 | 2011 | |||||||
| Balance at beginning of year | $ | 335,720 | $ | 210,036 | ||||
| Additions | 154,560 | 147,742 | ||||||
| Paid to employees | - | (22,058 | ) | |||||
| Balance at December 31, 2012 | $ | 490,280 | $ | 335,720 | ||||
Of the $154,560 additions in2013, $62,958 (December 31 2012 $82,000 (2011 - $51,687)$82,000) was capitalized to exploration and evaluation expenditures.
| Loncor Resources Inc. |
| Notes to Consolidated Financial Statements |
| (Expressed in U.S. dollars, except for per share |
| 18. | Income |
The following table reconciles the income taxes calculated at statutory rates with the income tax expense in the statement of comprehensive (loss) income:
| Years Ended December 31, | ||||||||||||
| 2012 | 2011 | 2010 | ||||||||||
| $ | $ | $ | ||||||||||
| Net income (loss) for the year | (2,026,500 | ) | 726,183 | (5,871,987 | ) | |||||||
| Combined federal and provincial income tax rates | 26.51 | % | 28.25 | % | 31.00 | % | ||||||
| Income tax recovery at Canadian federal and provincial statutory rates | (537,225 | ) | 205,147 | (1,820,316 | ) | |||||||
| Non deductible expenses | 60,700 | (1,209,035 | ) | 1,367,910 | ||||||||
| Share issue costs | - | (294,900 | ) | - | ||||||||
| Difference between Canadian rates and rates applicable to subsidiary in the United States | - | 11,303 | (6,741 | ) | ||||||||
| Change in tax rate | (158,197 | ) | 121,103 | 43,643 | ||||||||
| Foreign exchange differences | - | 10,910 | (181,507 | ) | ||||||||
| Expired losses | 192,365 | - | 782,918 | |||||||||
| Other | 3,549 | (365 | ) | - | ||||||||
| Change in unrecognized deferred tax asset | 494,131 | 1,348,860 | (67,866 | ) | ||||||||
| Income tax expense | 55,323 | 193,023 | 118,041 | |||||||||
The change in the Canadian statutory rate over the prior year is the result of a reduction in the federal and provincial tax rates.
| Years Ended December 31, | ||||||||||||
| 2013 | 2012 | 2011 | ||||||||||
| $ | $ | $ | ||||||||||
| Net income (loss) for the year | (28,037,589 | ) | (2,026,500 | ) | 726,183 | |||||||
| Combined federal and provincial income tax rates | 26.50 | % | 26.51 | % | 28.25 | % | ||||||
| Income tax recovery at Canadian federal and provincial statutory rates | (7,429,961 | ) | (537,225 | ) | 205,147 | |||||||
| Non deductible expenses | 194,085 | 60,700 | (1,209,035 | ) | ||||||||
| Share issue costs | - | - | (294,900 | ) | ||||||||
| Difference between Canadian rates and rates applicable to subsidiary in the Foreign Jurisdictions | (903,234 | ) | - | 11,303 | ||||||||
| Change in tax rate | - | (158,197 | ) | 121,103 | ||||||||
| Foreign exchange differences | - | - | 10,910 | |||||||||
| Expired losses | 192,365 | - | ||||||||||
| Other | 178,738 | 3,549 | (365 | ) | ||||||||
| Change in unrecognized deferred tax asset | 7,147,235 | 494,131 | 1,348,860 | |||||||||
| Income tax expense | (813,137 | ) | 55,323 | 193,023 | ||||||||
The Company has temporary differences of $11,127,913 (December 31, 2012 - $3,800,733, (DecemberDecember 31, 2011 - $2,988,064, December 31, 2010 - $1,639,204)$2,988,064) for which no deferred tax asset is recognized. All temporary differences have been recognized in operating income.
The nature and tax effect of the temporary differences giving rise to the deferred income tax assets and liabilities at December 31, 2013, 2012 and 2011 are summarized as follows:
| Years Ended December 31, | Years Ended December 31, | |||||||||||||||||||||||
| 2012 | 2011 | 2010 | 2013 | 2012 | 2011 | |||||||||||||||||||
| $ | $ | $ | $ | $ | $ | |||||||||||||||||||
| Non-capital losses carried forward | 3,097,895 | 2,374,267 | 1,233,044 | 3,789,924 | 3,097,895 | 2,374,267 | ||||||||||||||||||
| Financing costs | 660,288 | 581,285 | 376,864 | 405,230 | 660,288 | 581,285 | ||||||||||||||||||
| Fixed assets | 42,550 | 32,512 | 29,296 | 51,876 | 42,550 | 32,512 | ||||||||||||||||||
| Mineral properties | 6,880,883 | - | - | |||||||||||||||||||||
| 3,800,733 | 2,988,064 | 1,639,204 | 11,127,913 | 3,800,733 | 2,988,064 | |||||||||||||||||||
| Unrecognized deferred tax assets | (3,800,733 | ) | (2,988,064 | ) | (1,639,204 | ) | (11,127,913 | ) | (3,800,733 | ) | (2,988,064 | ) | ||||||||||||
| Deferred tax asset | - | - | - | - | - | - | ||||||||||||||||||
| Mineral properties | 813,138 | 757,815 | 564,792 | - | 813,138 | 757,815 | ||||||||||||||||||
| Deferred tax liability | 813,138 | 757,815 | 564,792 | - | 813,138 | 757,815 | ||||||||||||||||||
| Loncor Resources Inc. |
| Notes to Consolidated Financial Statements |
| (Expressed in U.S. dollars, except for per share |
As at December 31, 2012,2013, the Company has available non-capital losses in Canada of approximately $10,262,000$12,194,000 (2012 - $10,262,000) that if not utilized will expire as follows:
| 2023 | 33,000 | |||||
| 2024 | 112,000 | |||||
| 2025 | 216,000 | |||||
| 2026 | 342,000 | |||||
| 2027 | 172,000 | |||||
| 2028 | 261,000 | |||||
| 2029 | 883,000 | |||||
| 2030 | 1,992,000 | |||||
| 2031 | 3,398,000 | |||||
| 2032 | 2,853,000 | |||||
| $ | 10,262,000 |
| 2023 | 32,000 | |||
| 2024 | 105,000 | |||
| 2025 | 203,000 | |||
| 2026 | 320,000 | |||
| 2027 | 161,000 | |||
| 2028 | 244,000 | |||
| 2029 | 826,000 | |||
| 2030 | 1,863,000 | |||
| 2031 | 3,178,000 | |||
| 2032 | 2,669,000 | |||
| 2033 | 2,593,000 | |||
| $ | 12,194,000 |
As at December 31, 2012,2013, the Company has available non-capital losses in the United States of approximately $1,076,500$1,079,000 (2012 - $1,076,500) that if not utilized will expire as follows:
| 2022 | $ | 102,000 | ||||
| 2023 | 277,000 | |||||
| 2024 | 236,000 | |||||
| 2025 | 39,000 | |||||
| 2026 | 158,000 | |||||
| 2027 | 246,000 | |||||
| 2028 | 9,000 | |||||
| 2029 | 5,000 | |||||
| 2030 | 1,000 | |||||
| 2031 | 2,000 | |||||
| 2032 | 1,500 | |||||
| $ | 1,076,500 |
| 2022 | $ | 102,000 | ||
| 2023 | 277,000 | |||
| 2024 | 236,000 | |||
| 2025 | 39,000 | |||
| 2026 | 158,000 | |||
| 2027 | 246,000 | |||
| 2028 | 9,000 | |||
| 2029 | 5,000 | |||
| 2030 | 1,000 | |||
| 2031 | 2,000 | |||
| 2032 | 2,000 | |||
| 2033 | 2,000 | |||
| $ | 1,079,000 |